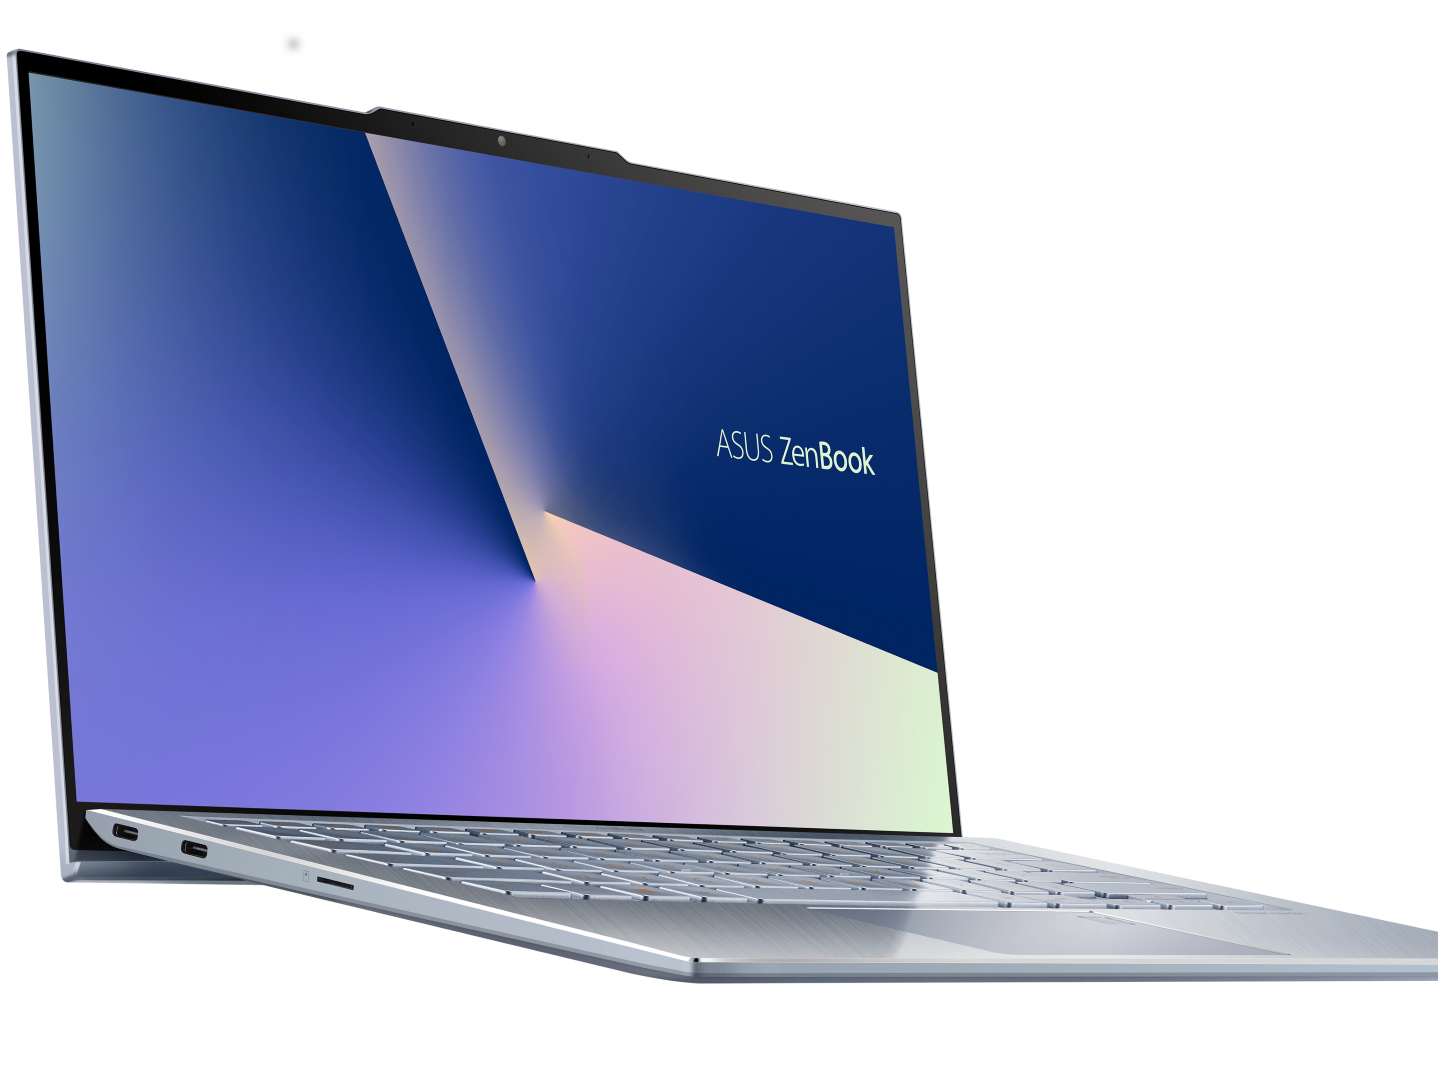
Asus ZenBook S13 UX392FN (i7-8565U, GeForce MX150) Laptop Review

Asus unveiled its ZenBook S13 UX392 series at CES 2019 as the successor to last year's UX391 series. The OEM is doubling down on even narrower bezels on all four sides of the screen while still managing to keep the dedicated GeForce MX150 GPU option.
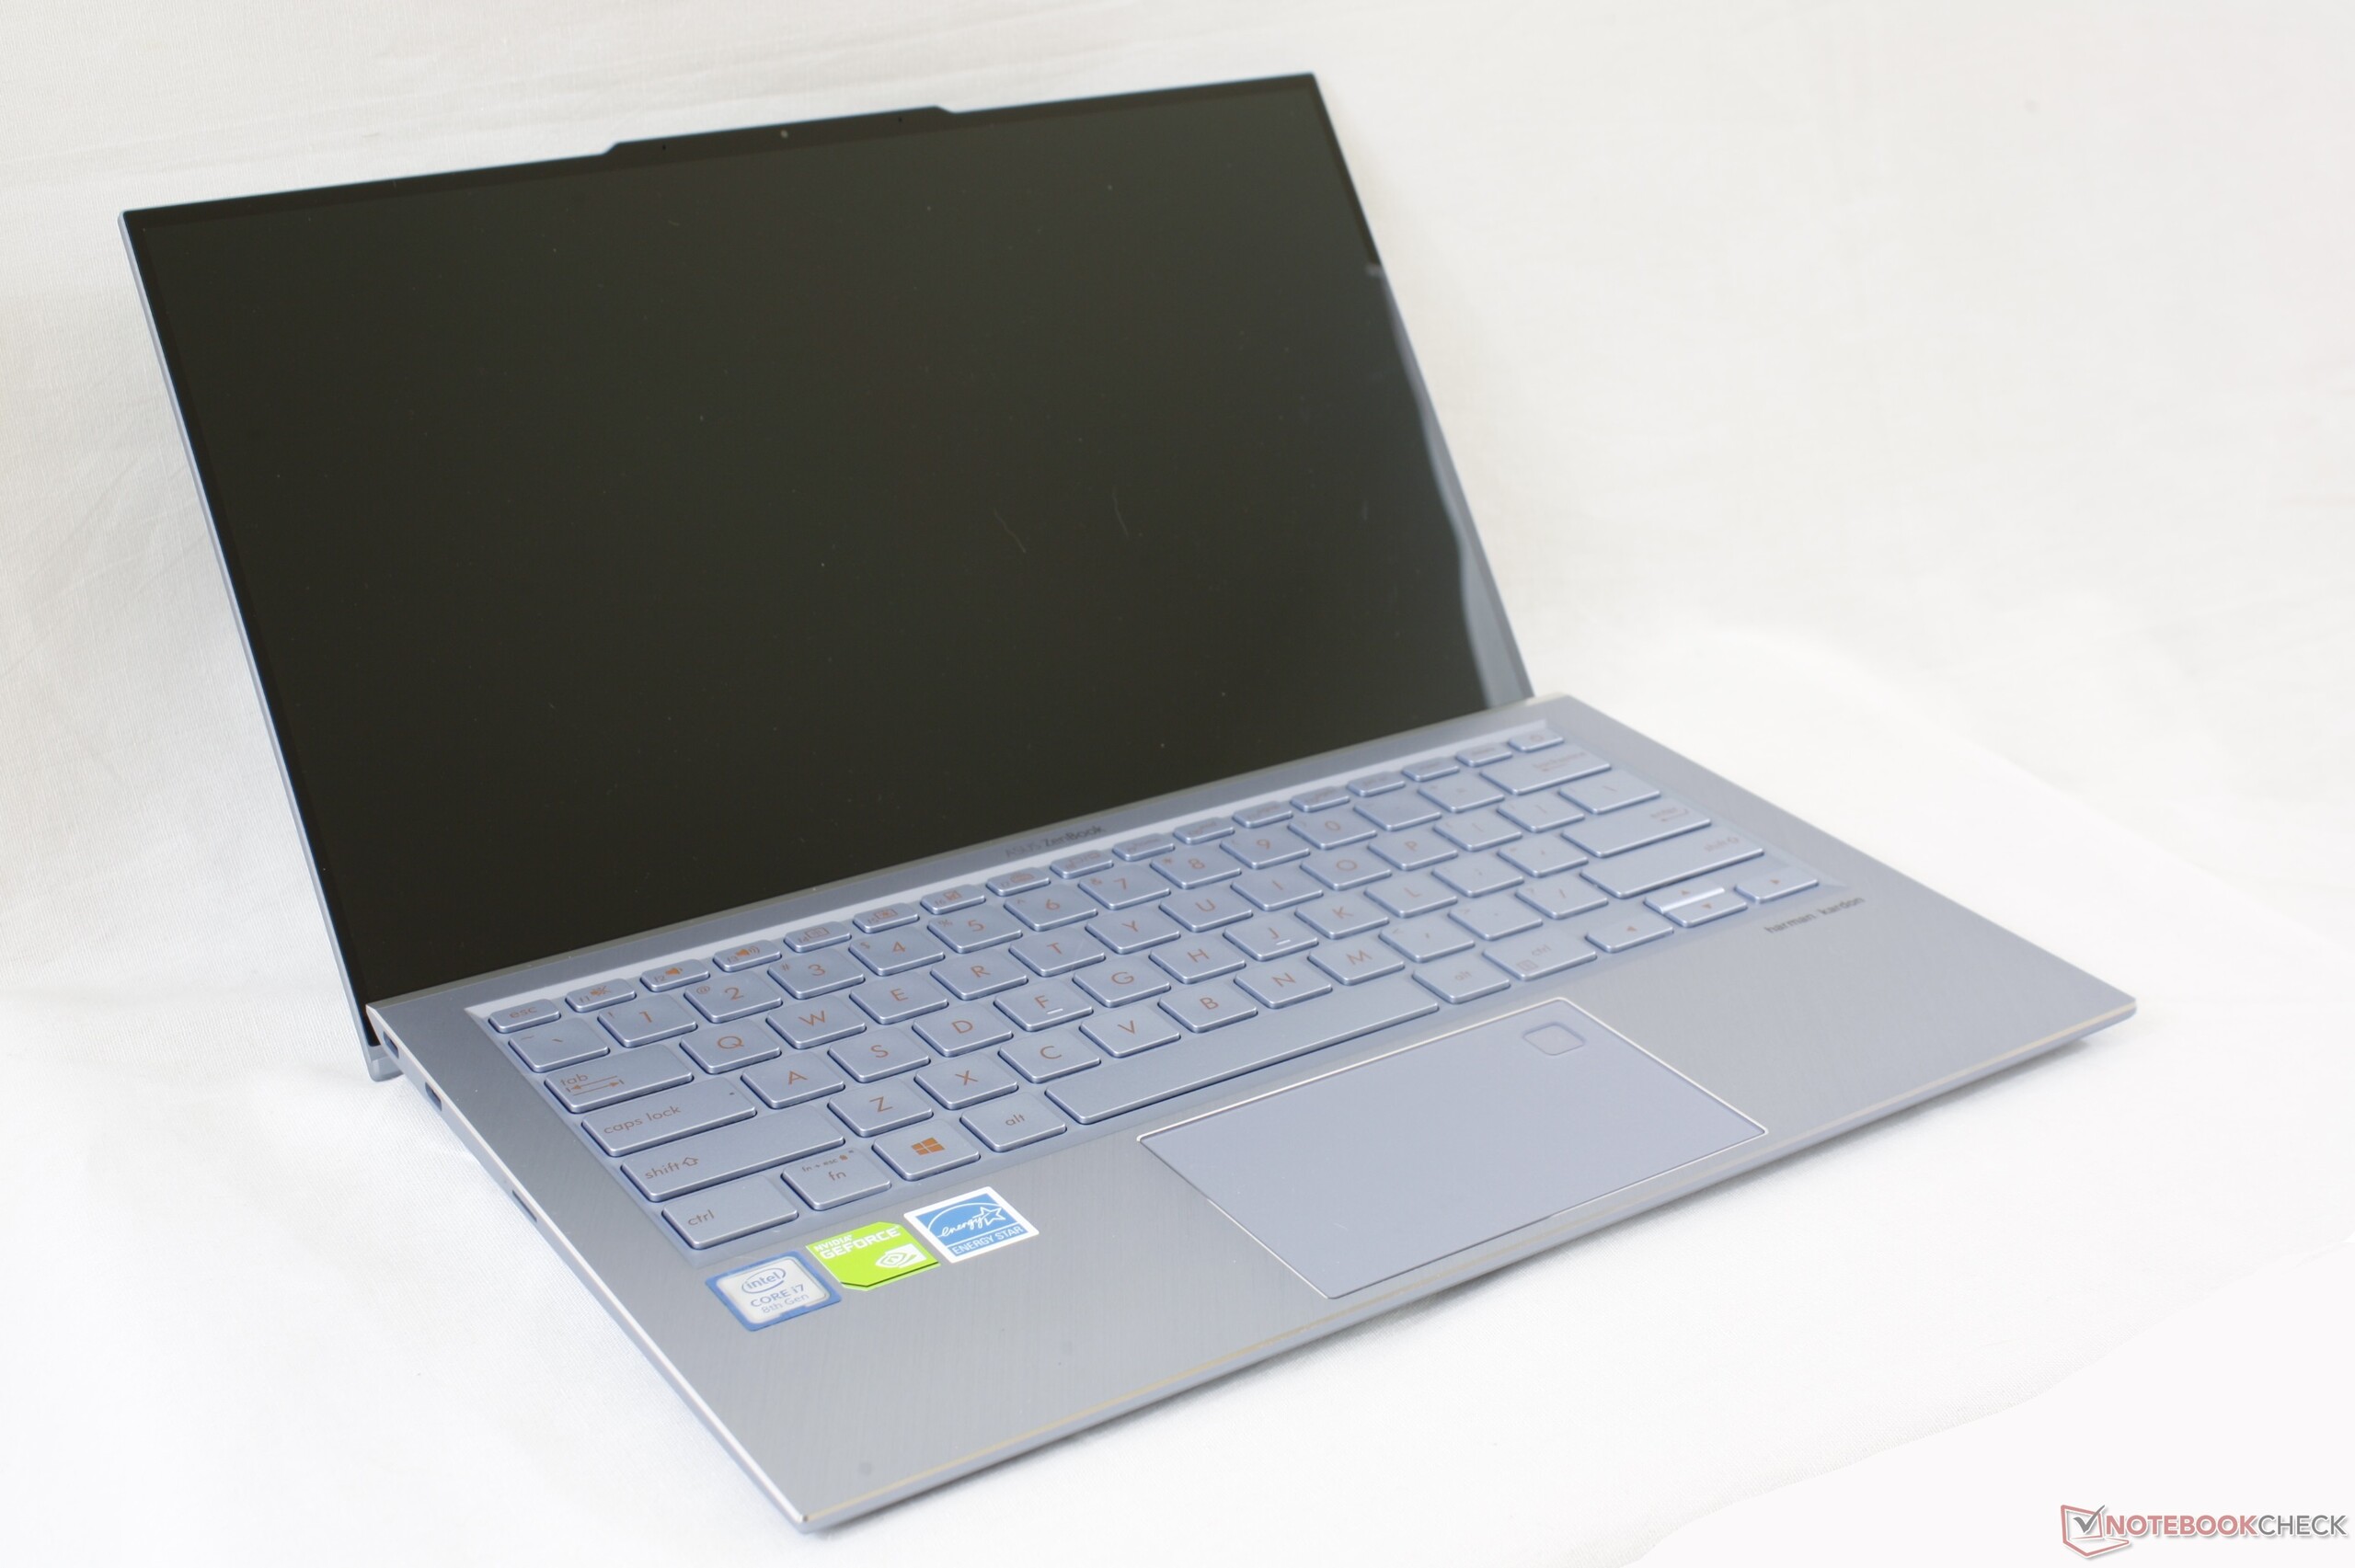
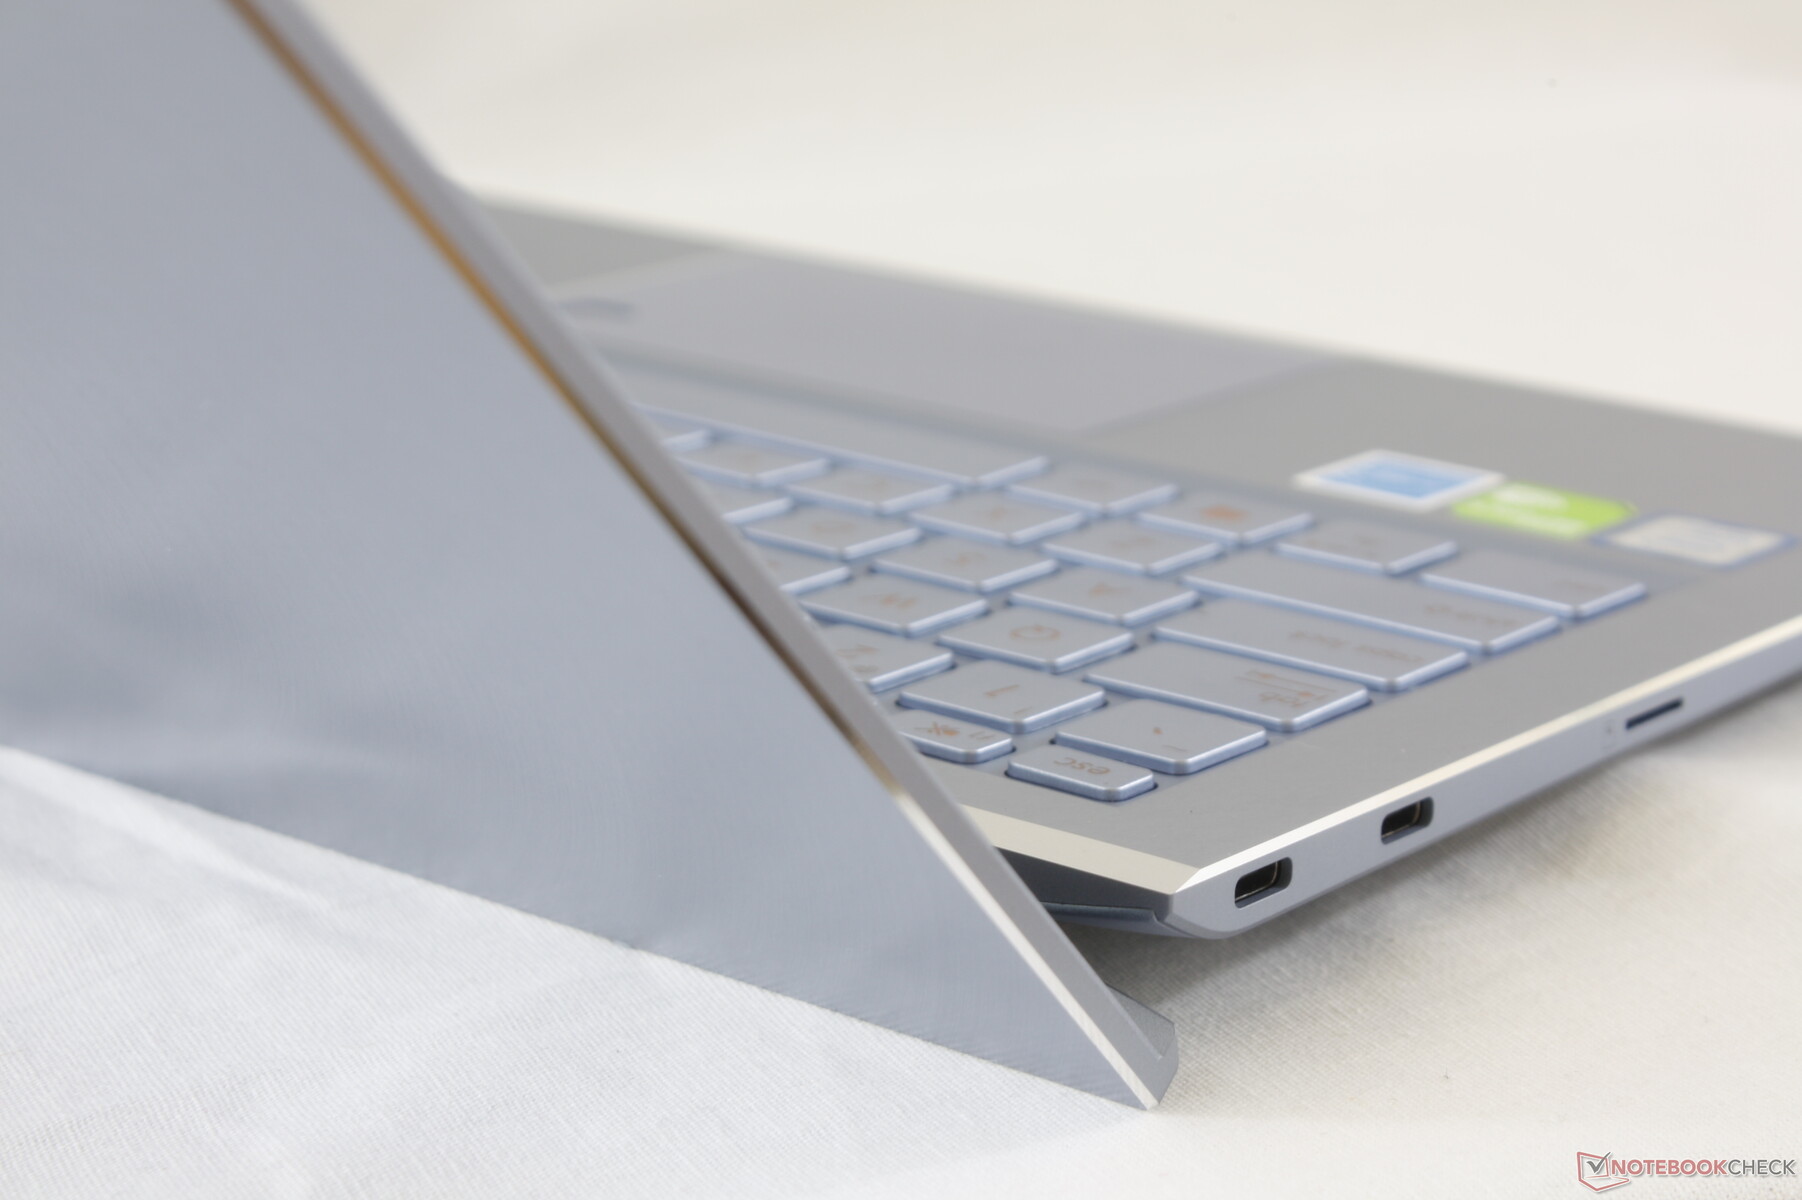
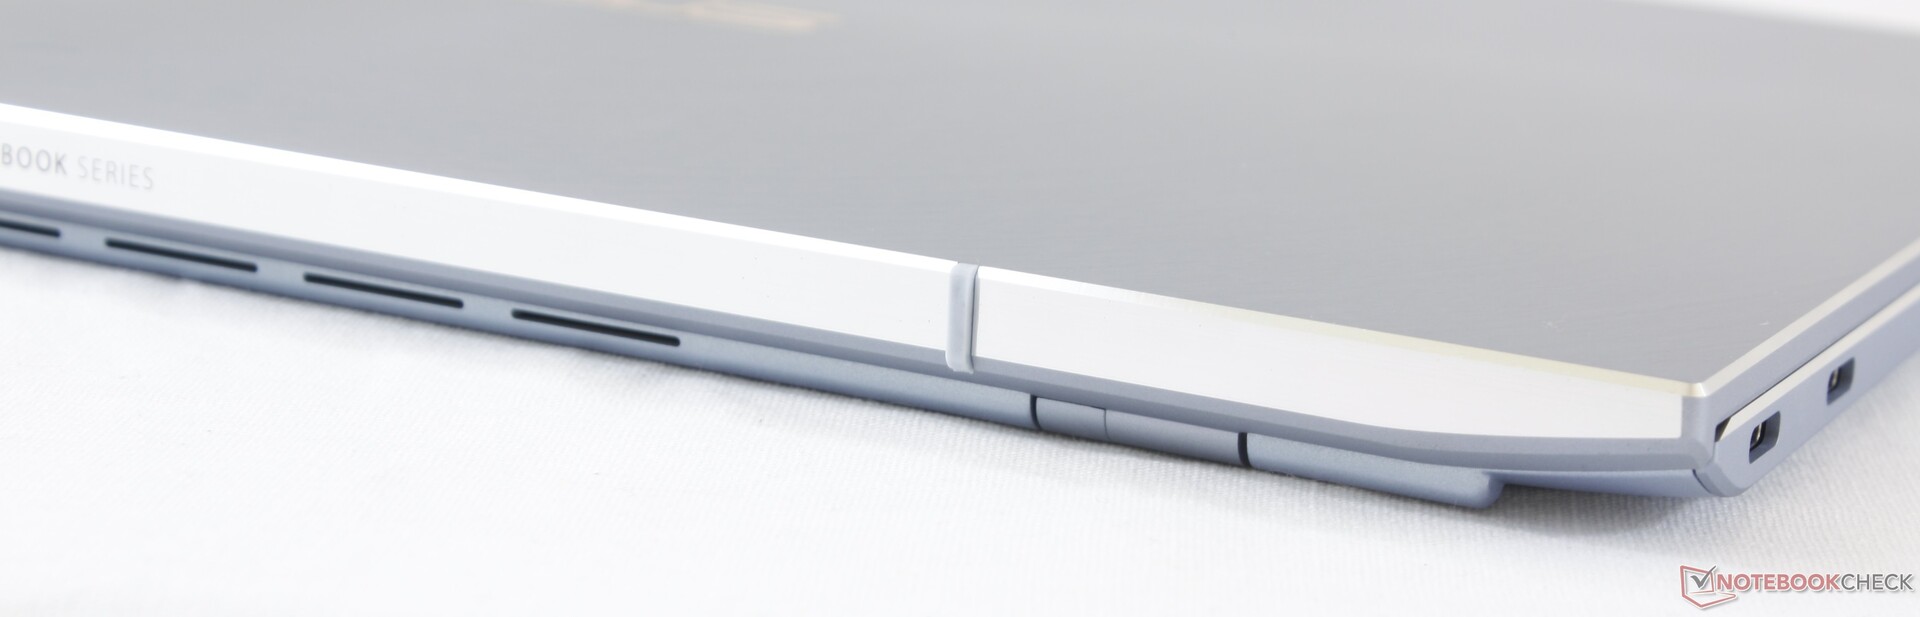
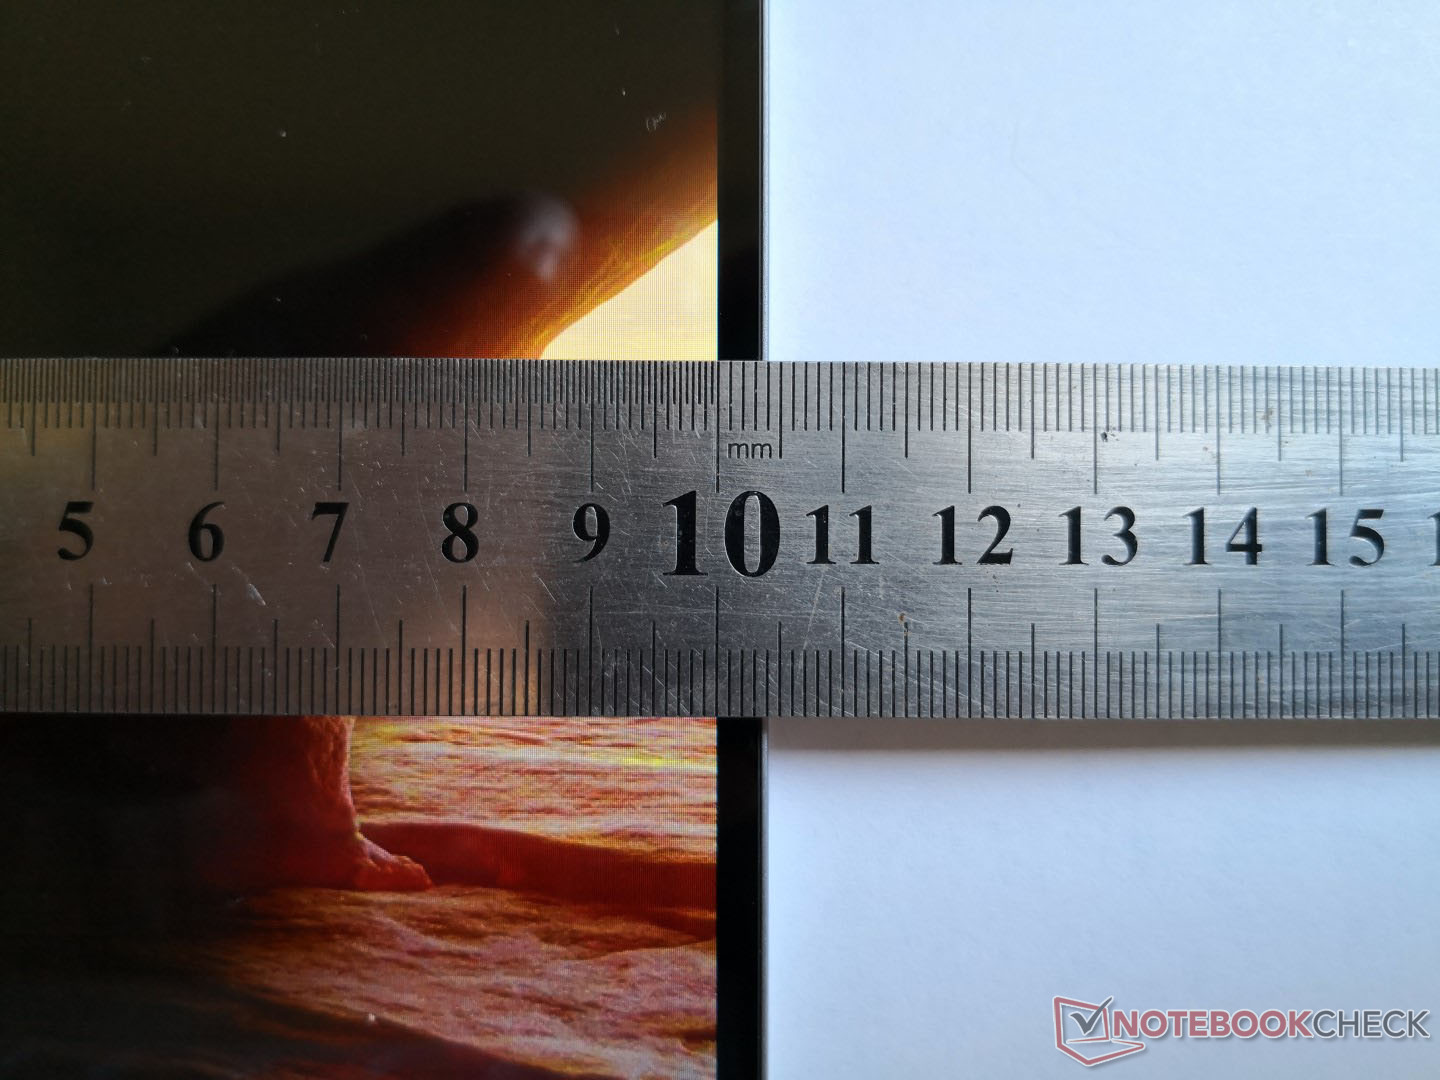
The new UX392 Ultrabook is notable for several reasons when compared to the competition. First, its webcam notch is a unique approach to narrowing the bezels without impacting the original position of the camera. Second, the system offers a larger 13.9-inch screen in a form factor that's the size of most narrow-bezel 13.3-inch Ultrabooks. Lastly, its trademark ErgoLift hinges have a distinct visual style that further differentiate the ZenBook series from other Ultrabooks.
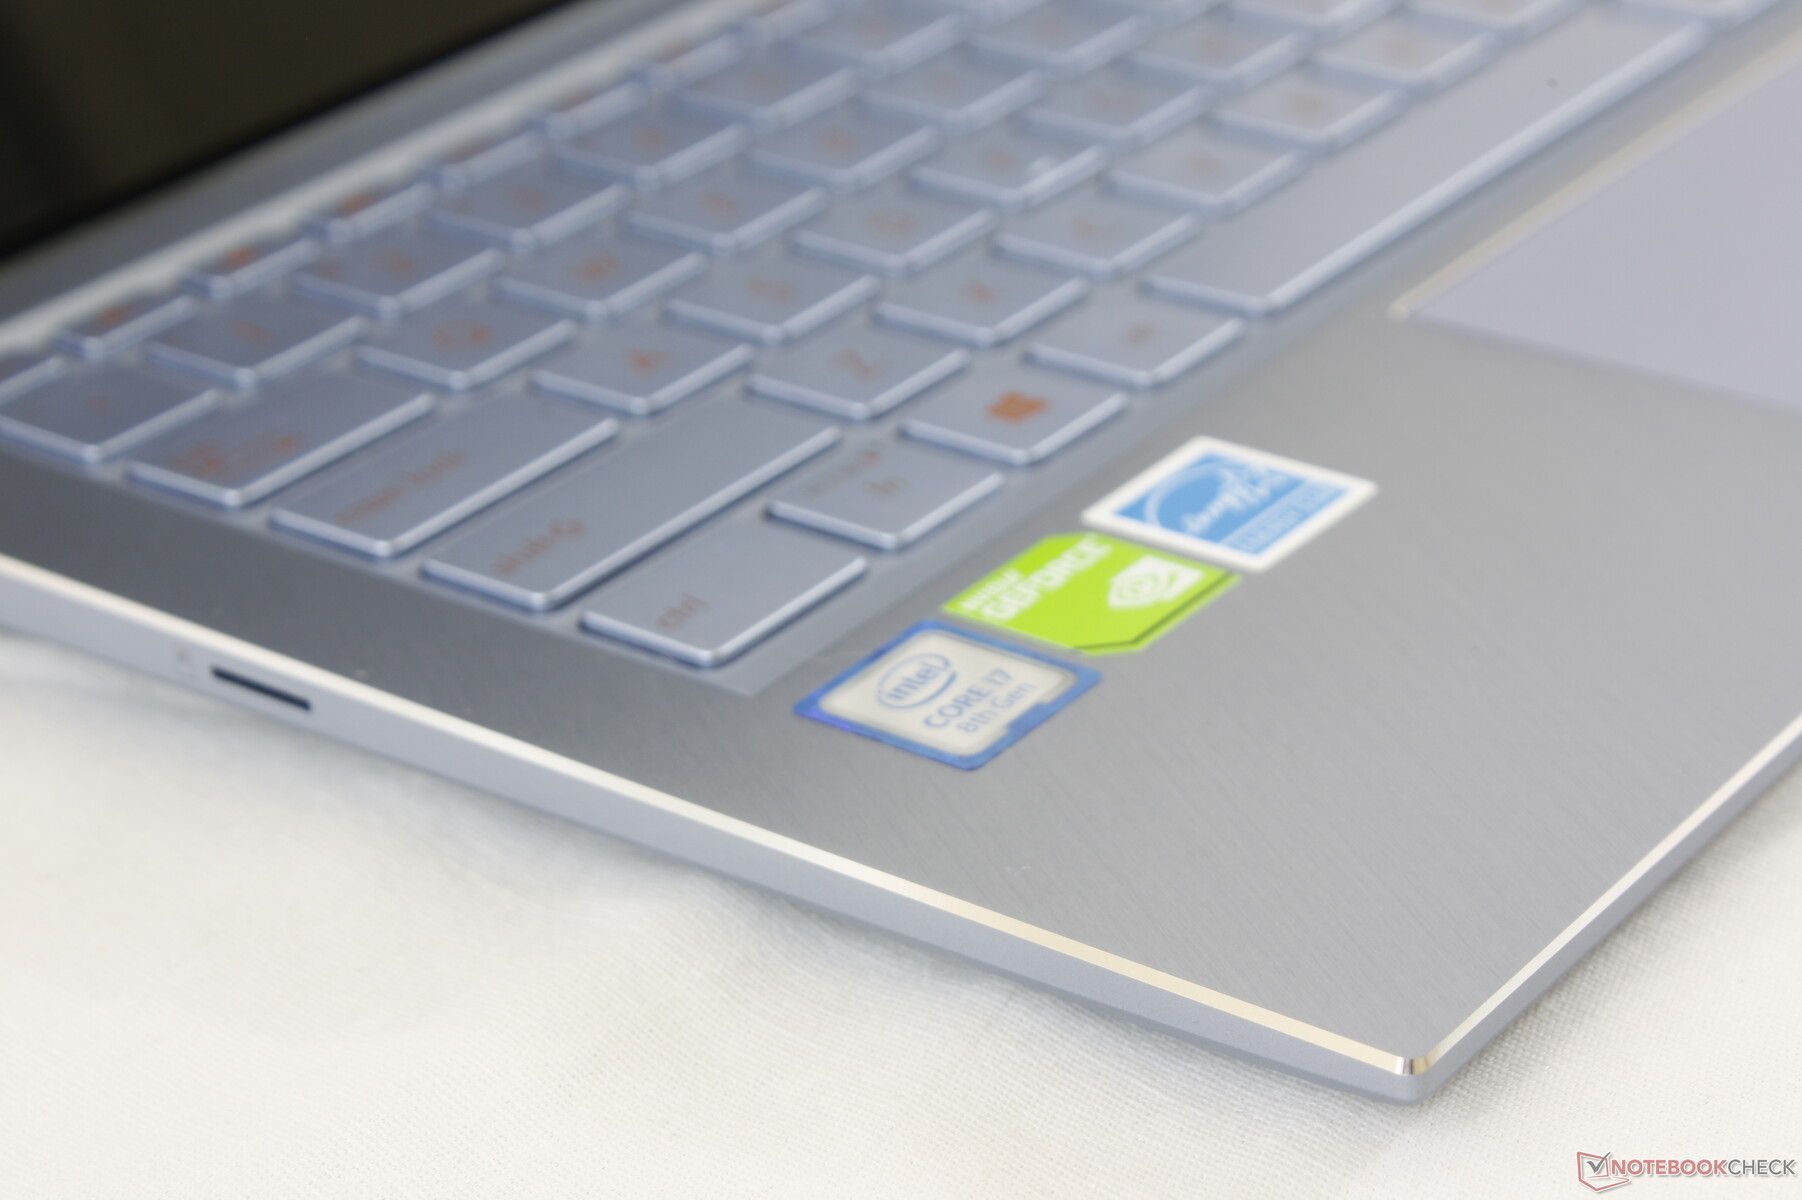
Our test unit today is the higher-end SKU equipped with the Core i7-8565U CPU, GeForce MX150 GPU, 512 GB SSD, and 8 GB of RAM for $1400 USD. Other SKUs with the i5-8265U CPU, integrated UHD Graphics 620 GPU, 16 GB of RAM, and 256 GB/1 TB SSD are also available at different price points. Direct competitors to the ZenBook S13 UX392 include flagship Ultrabooks like the Dell XPS 13, LG Gram 14, HP Spectre 13, Huawei MateBook X Pro and MateBook 14, Lenovo Yoga C930, Samsung Notebook 9, Razer Blade Stealth, and the Acer Swift 7. We'll be comparing the UX392 to these aforementioned alternatives as well as its UX391 predecessor to find how what improvements the latest model has brought to the table.
Editor's note: Our ZenBook S13 test unit is a retail unit and not a pre-production or pre-sale unit from Asus. Our findings are representative of what you will get from retailers.
More Asus ZenBook reviews:
Case
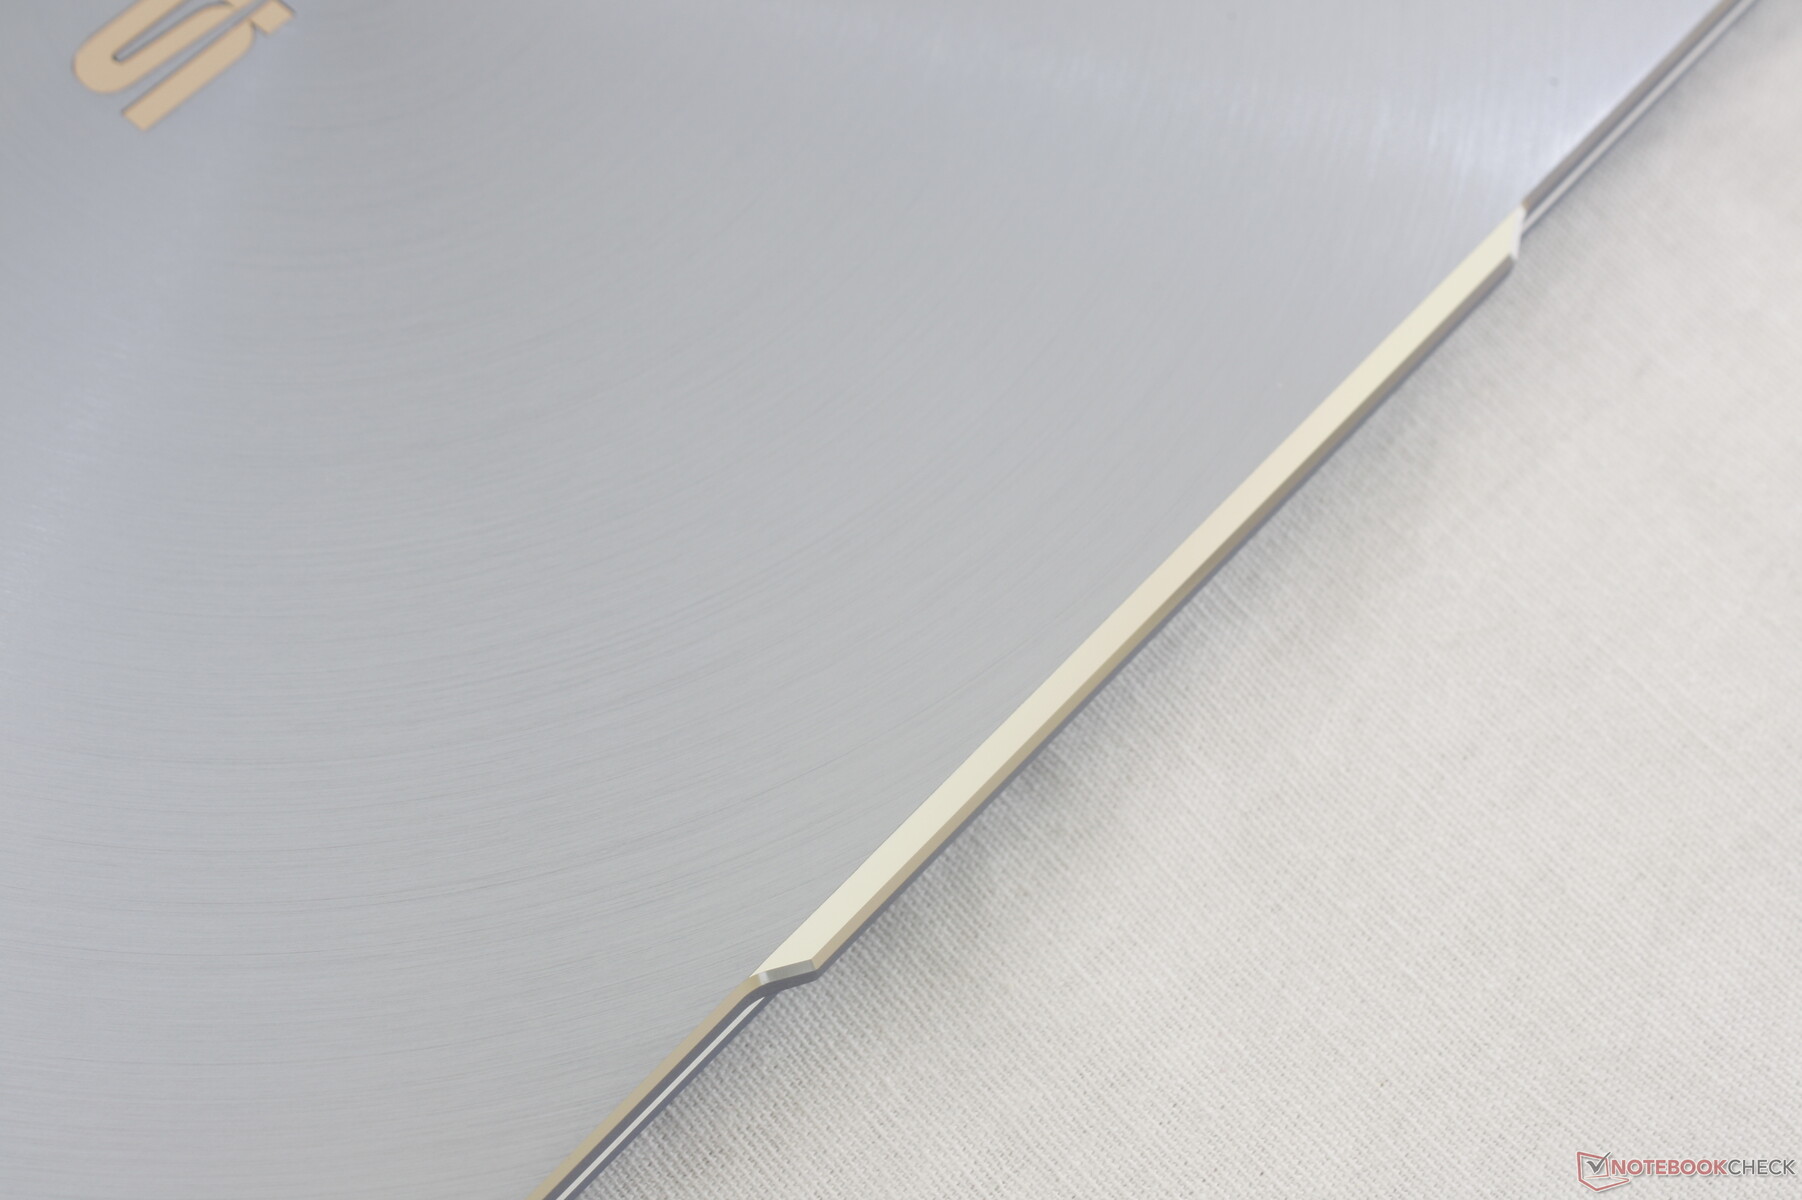
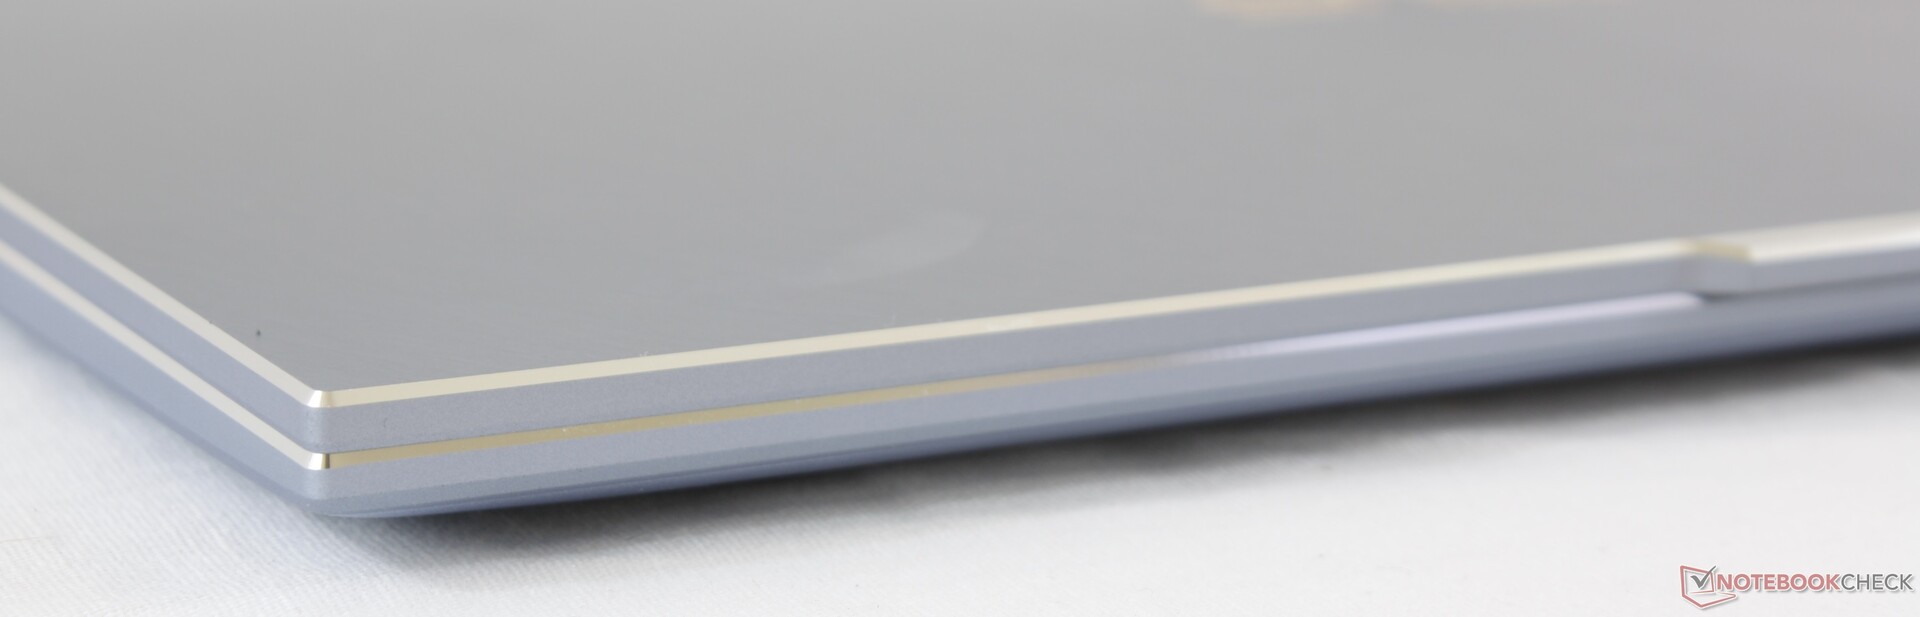
Our biggest fear of having laptops with super narrow bezels and increasingly high screen-to-body ratios is chassis rigidity. A sleek and sexy design means nothing if it's as flexible and wobbly as a laminated piece of paper. The super-light LG Gram and Samsung Notebook 9 series, for example, have narrow bezels but they are are both significantly more flexible when compared to a MacBook Air or XPS 13. Fortunately, the ZenBook UX392 is surprisingly rigid from top to bottom despite its very small form factor. Both the lid and base exhibit no creaking and almost no flexing for a high quality first impression. The hinges and keyboard center are firm with no teetering and just minimal yielding with applied pressure, respectively.
Construction quality is excellent on our test unit with no uneven gaps or noticeable manufacturing defects.
If we are to nitpick, we still find the Spectre 13, Blade Stealth, and XPS 13 slightly more substantial in the hand because the skeletons of these alternatives feel thicker for potentially better longevity.

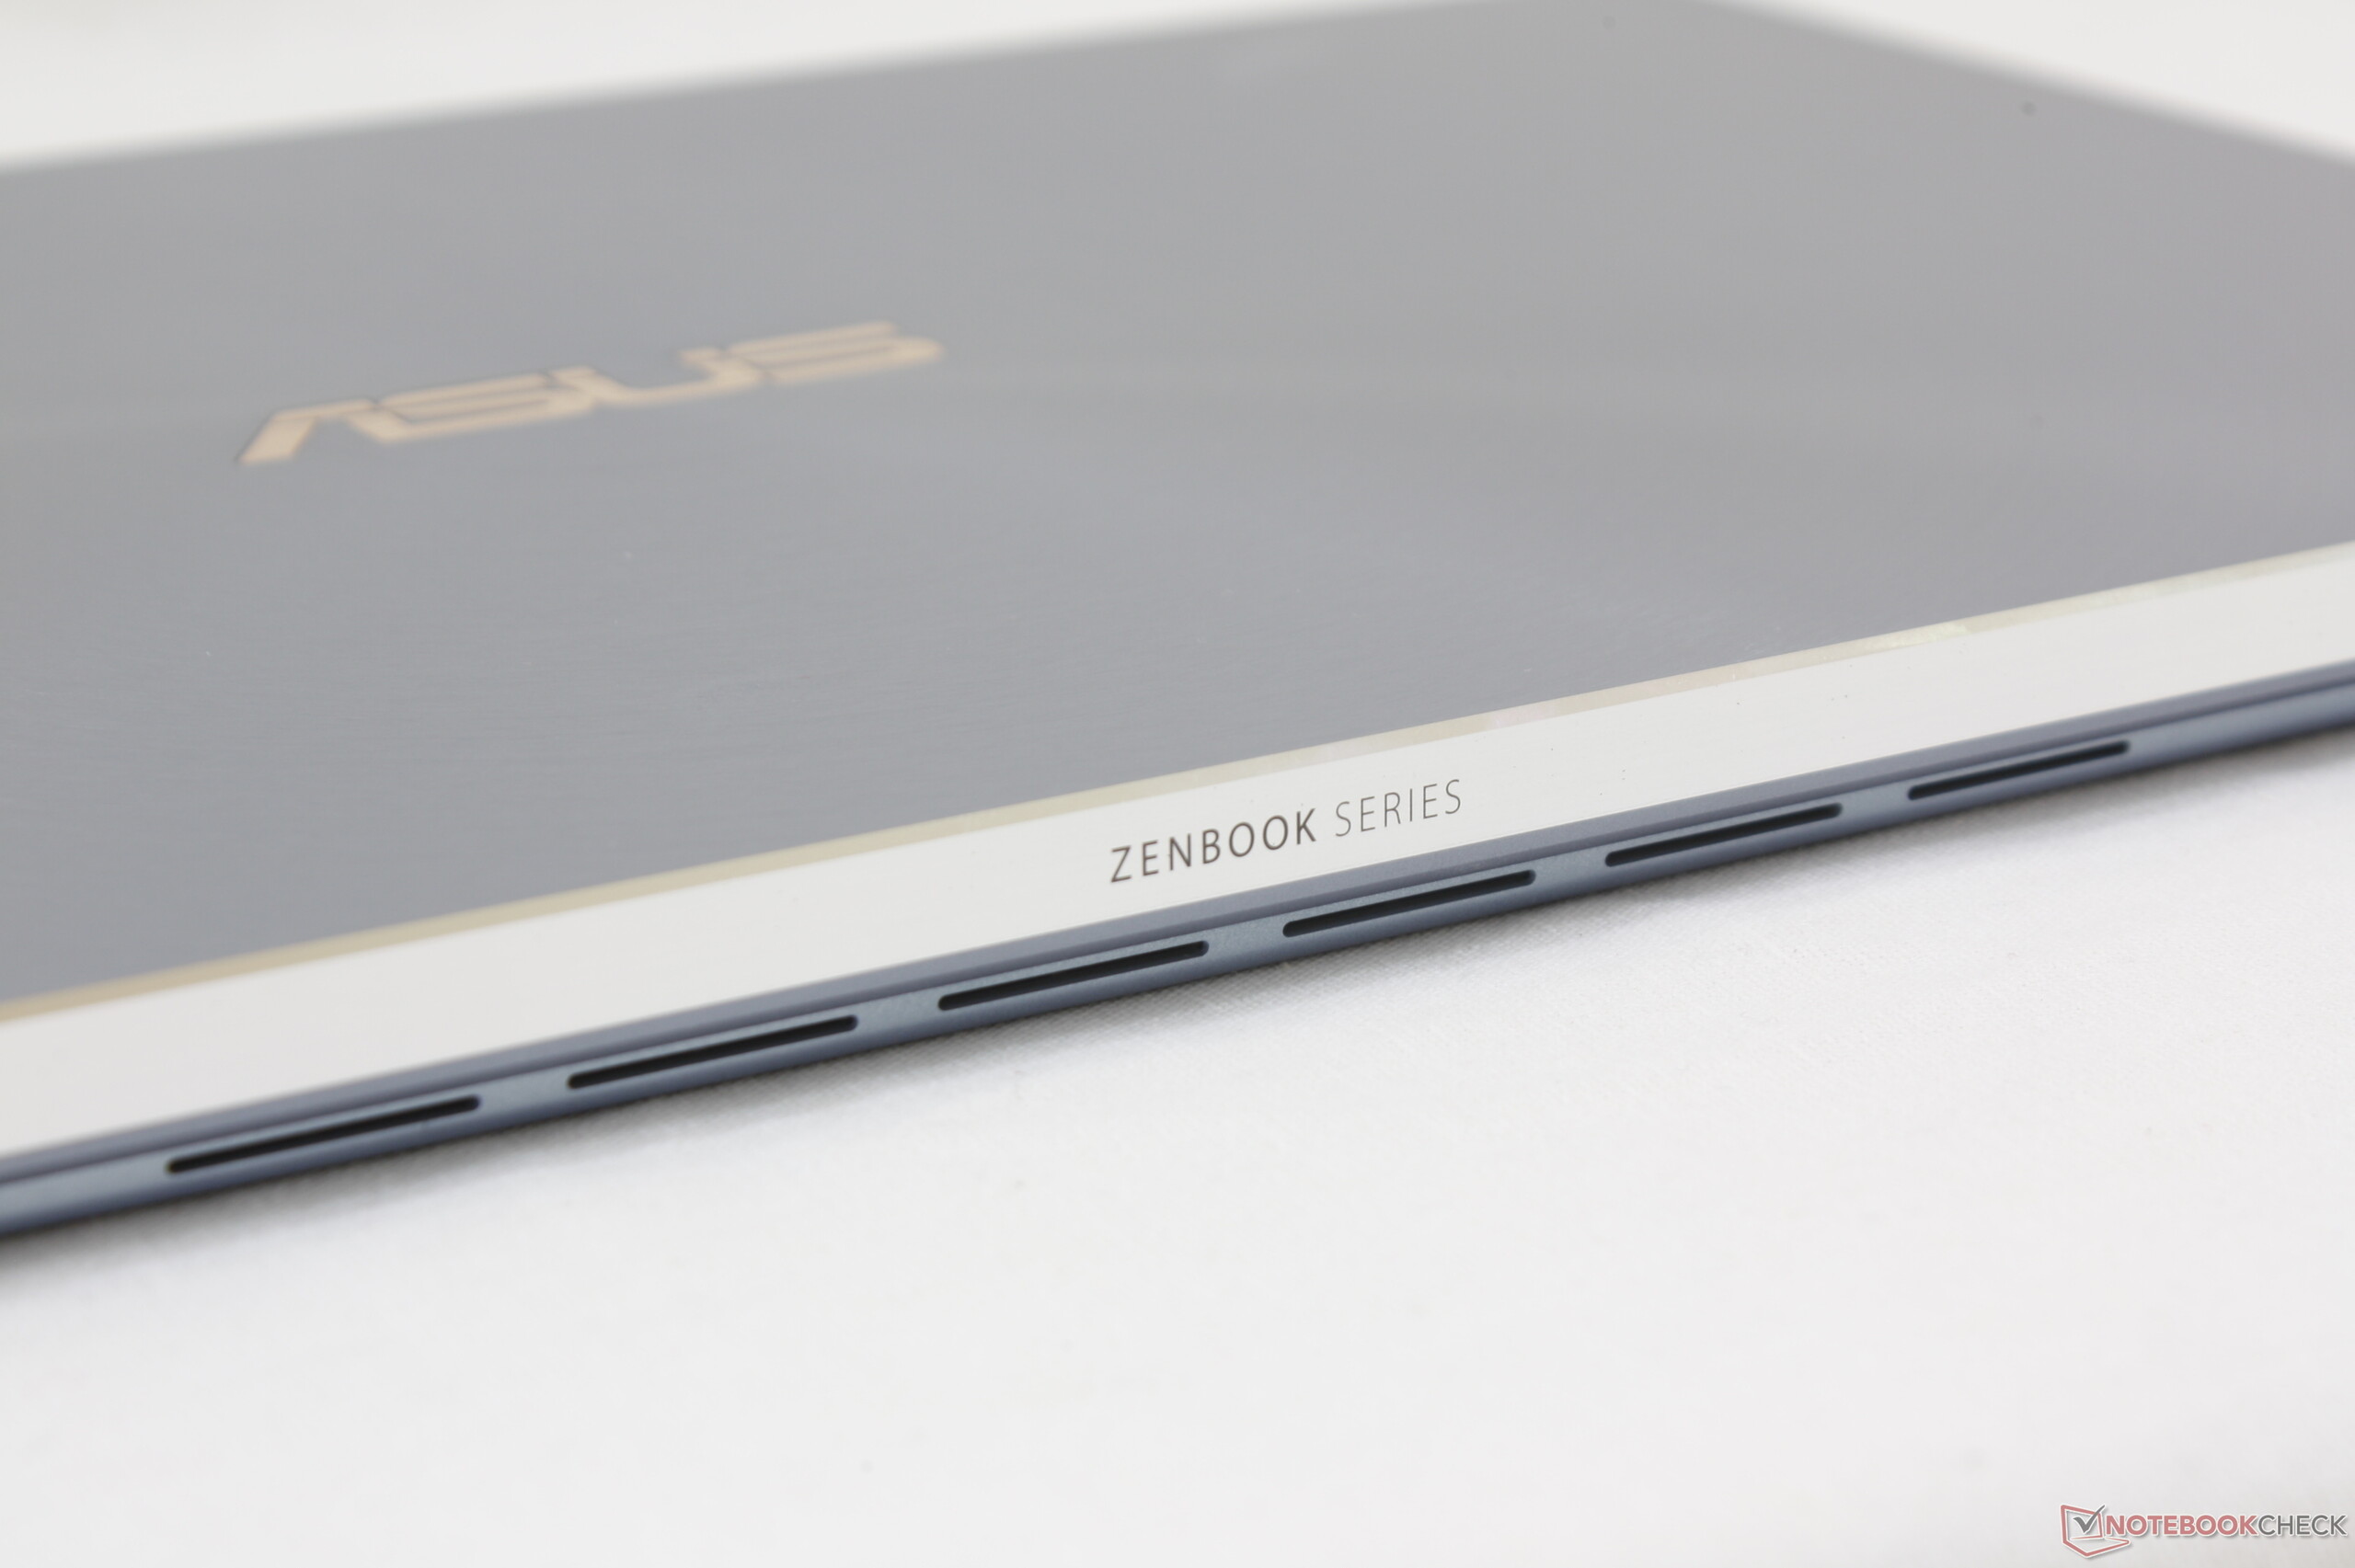
In terms of size and weight, the UX392 is slightly heavier and wider than last year's UX391 while being just as thick. In turn, the newer model is almost 20 mm shorter in length to make it feel even more compact than its predecessor. Many other 14-inch and even 13.3-inch Ultrabooks like the XPS 13 are heavier than the UX392 partly due to the ridiculously narrow bezels of the UX392 on all four sides of the display. Notable exceptions include the LG Gram 14 and Samsung Notebook 9, but these super-light alternatives lack discrete GPU options unlike on our Asus.
Connectivity
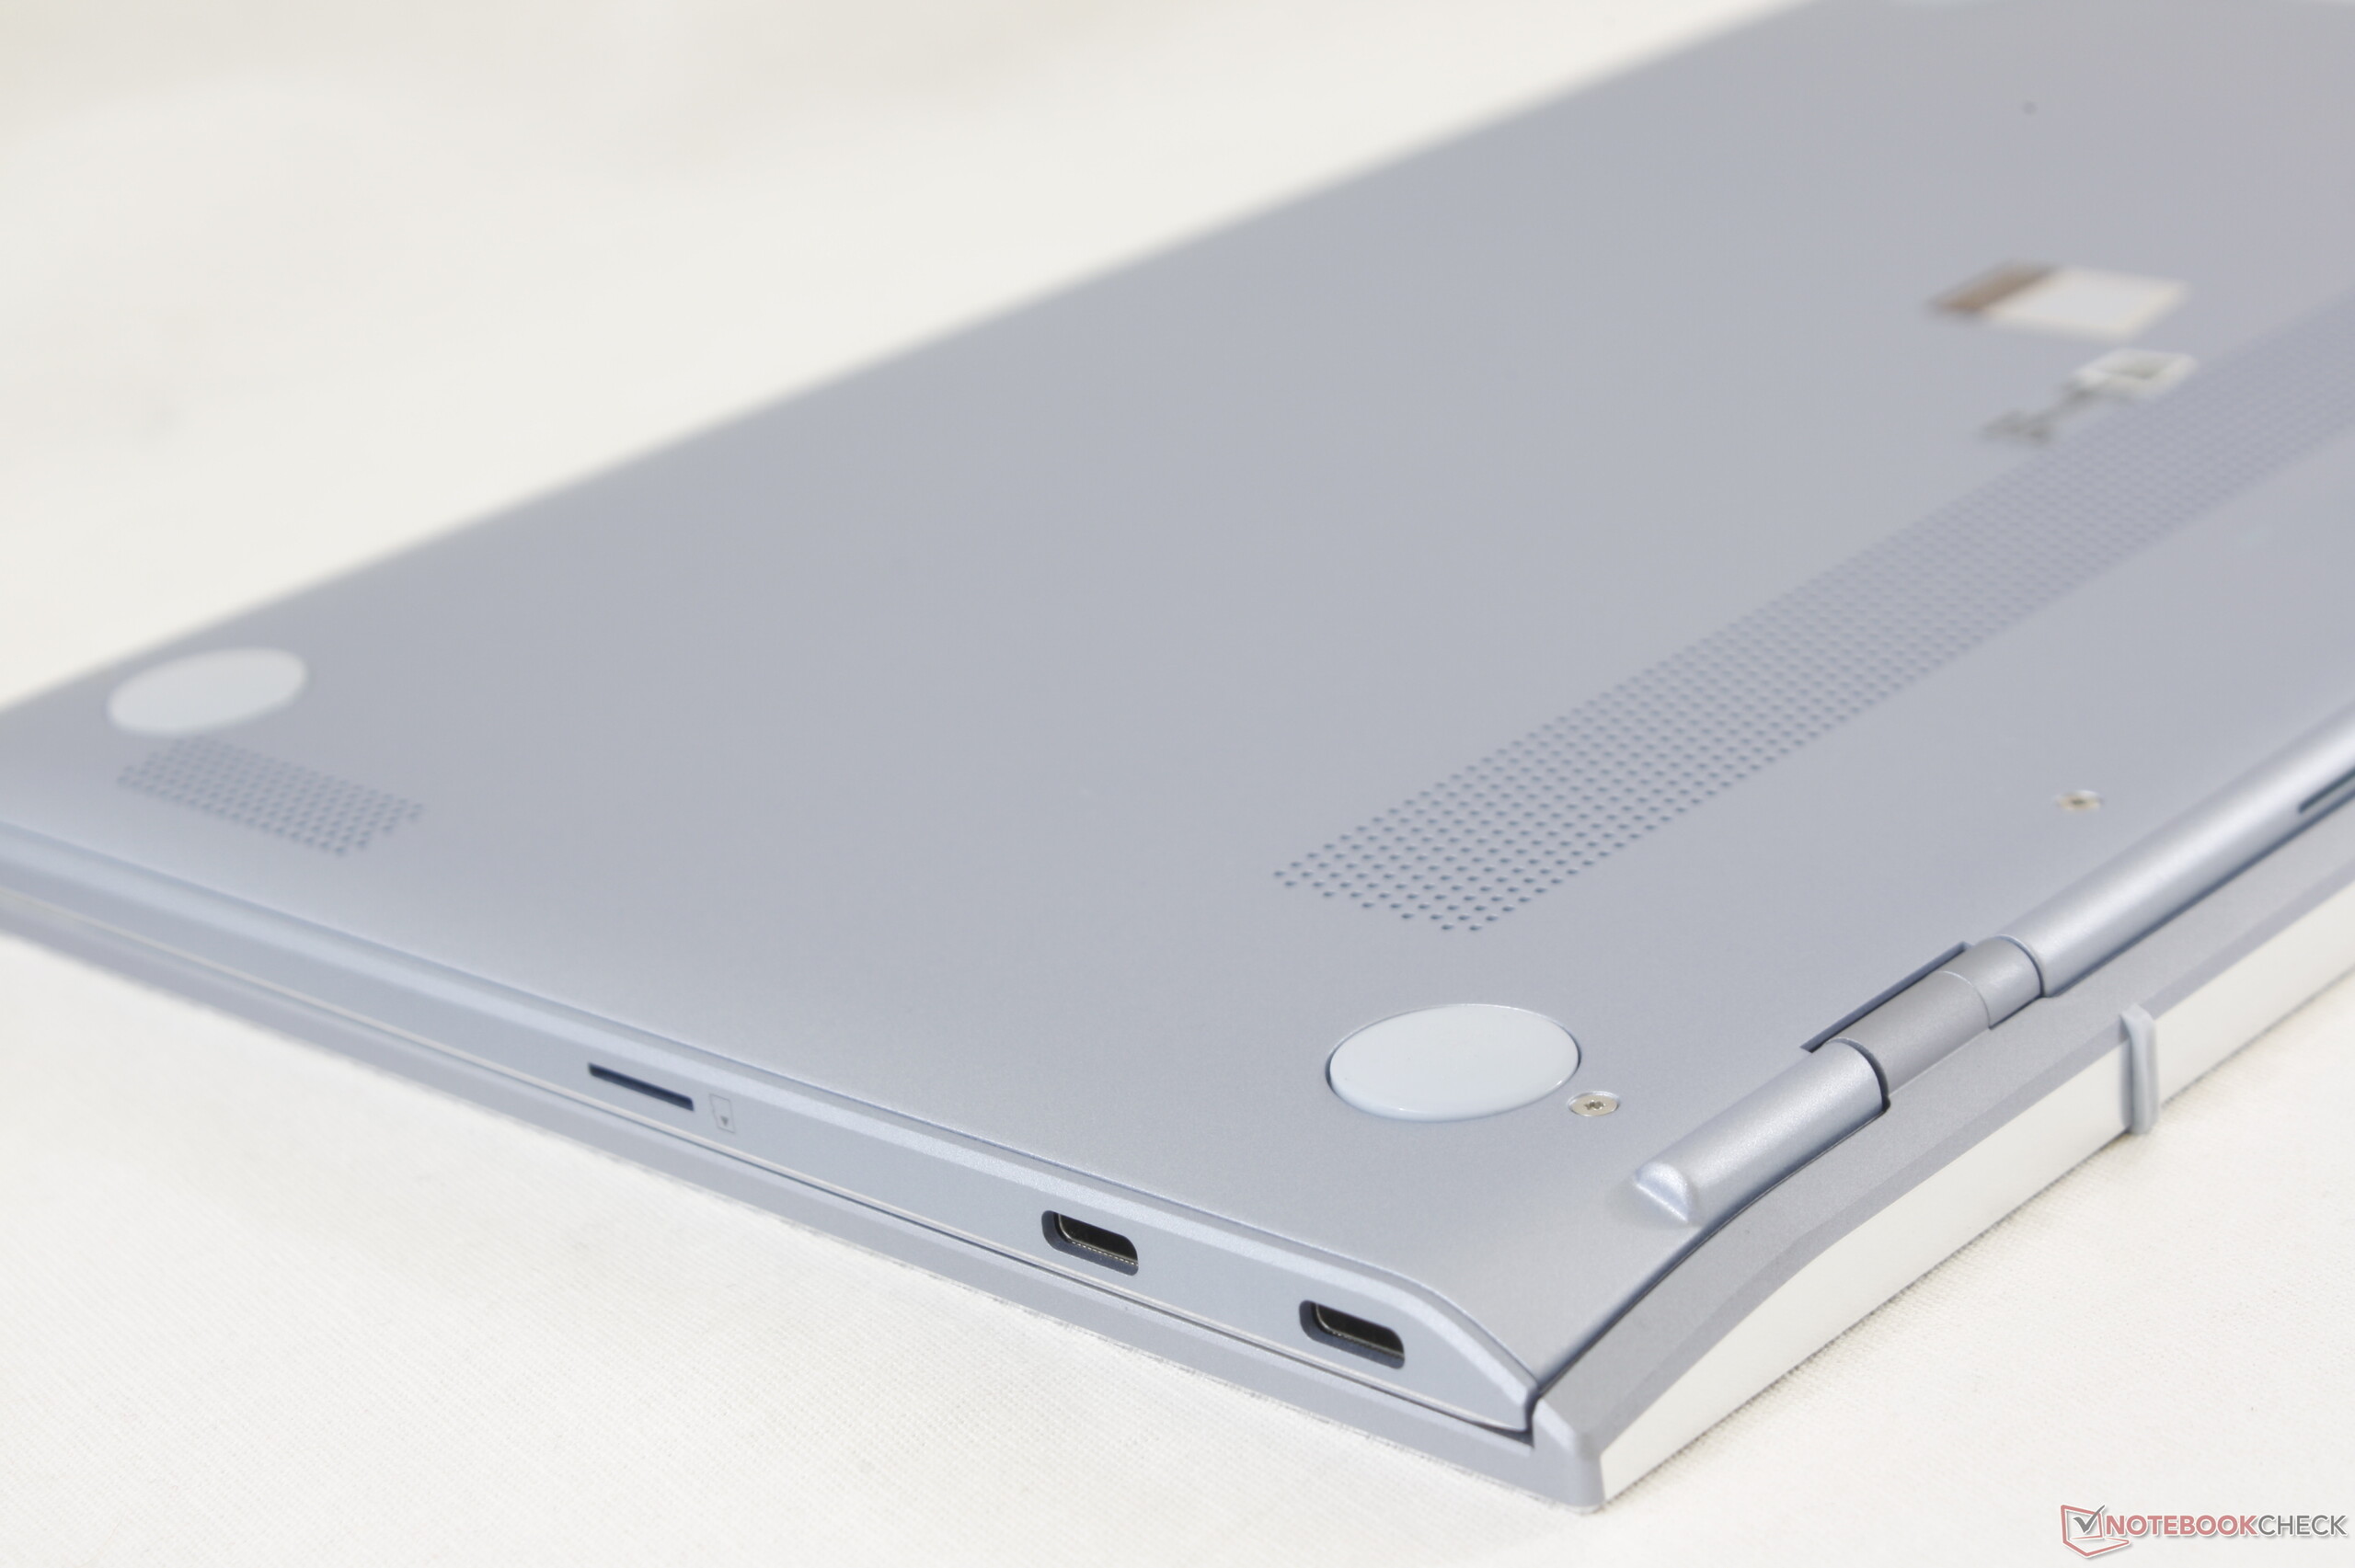
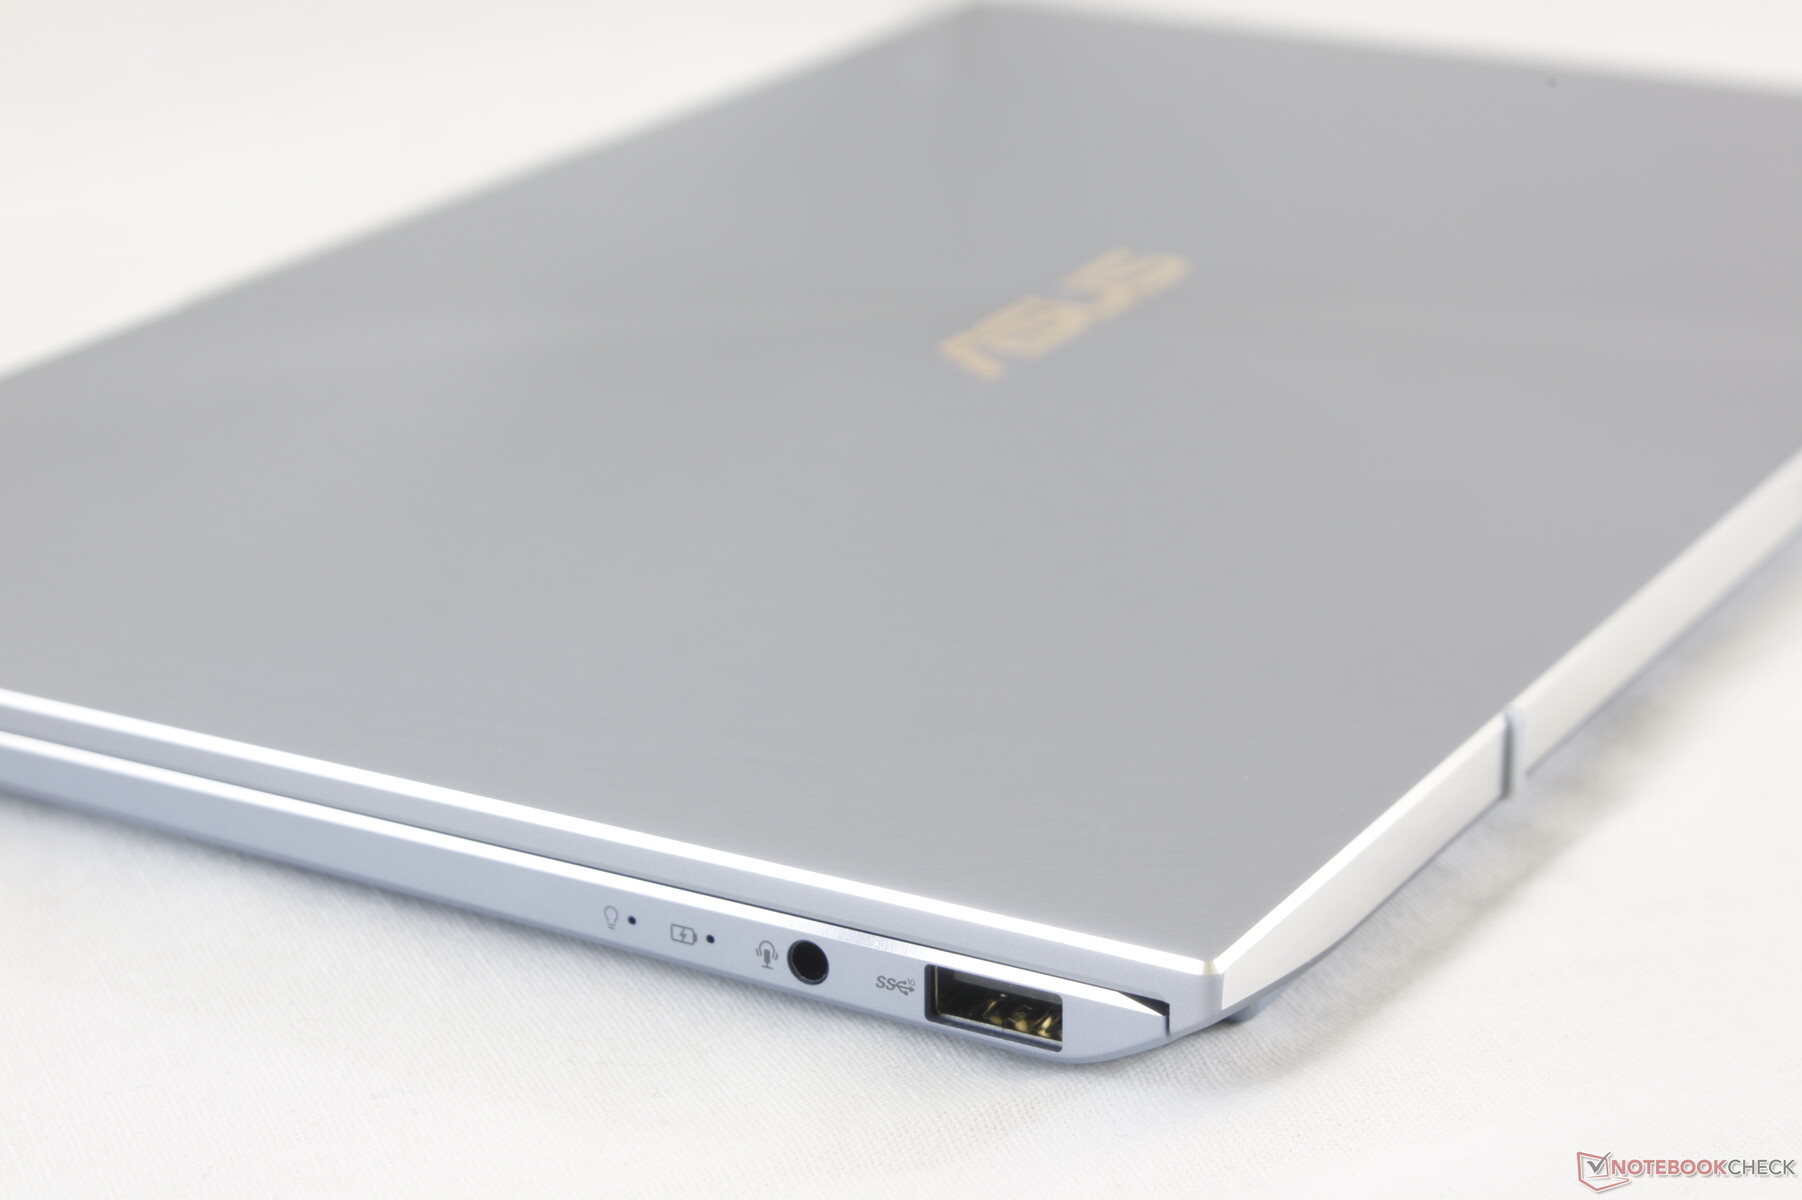
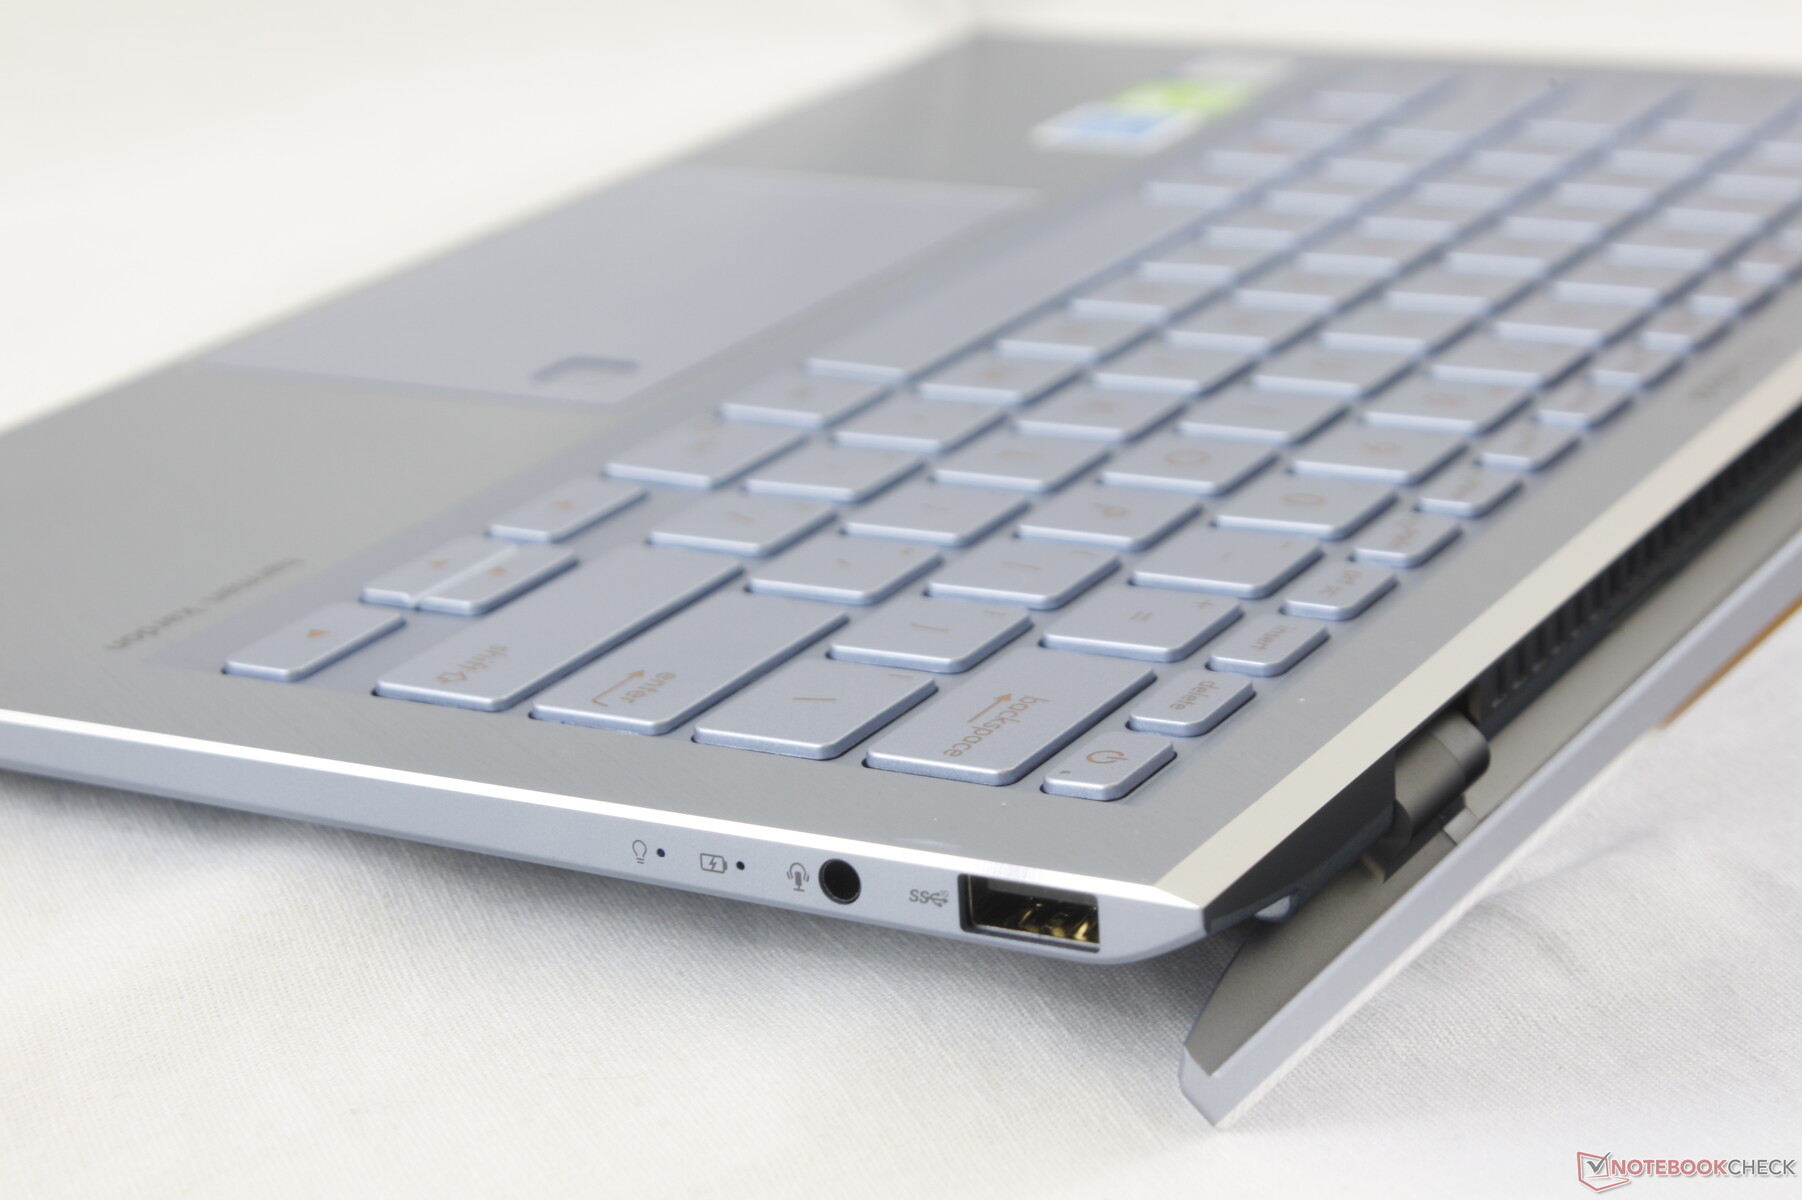
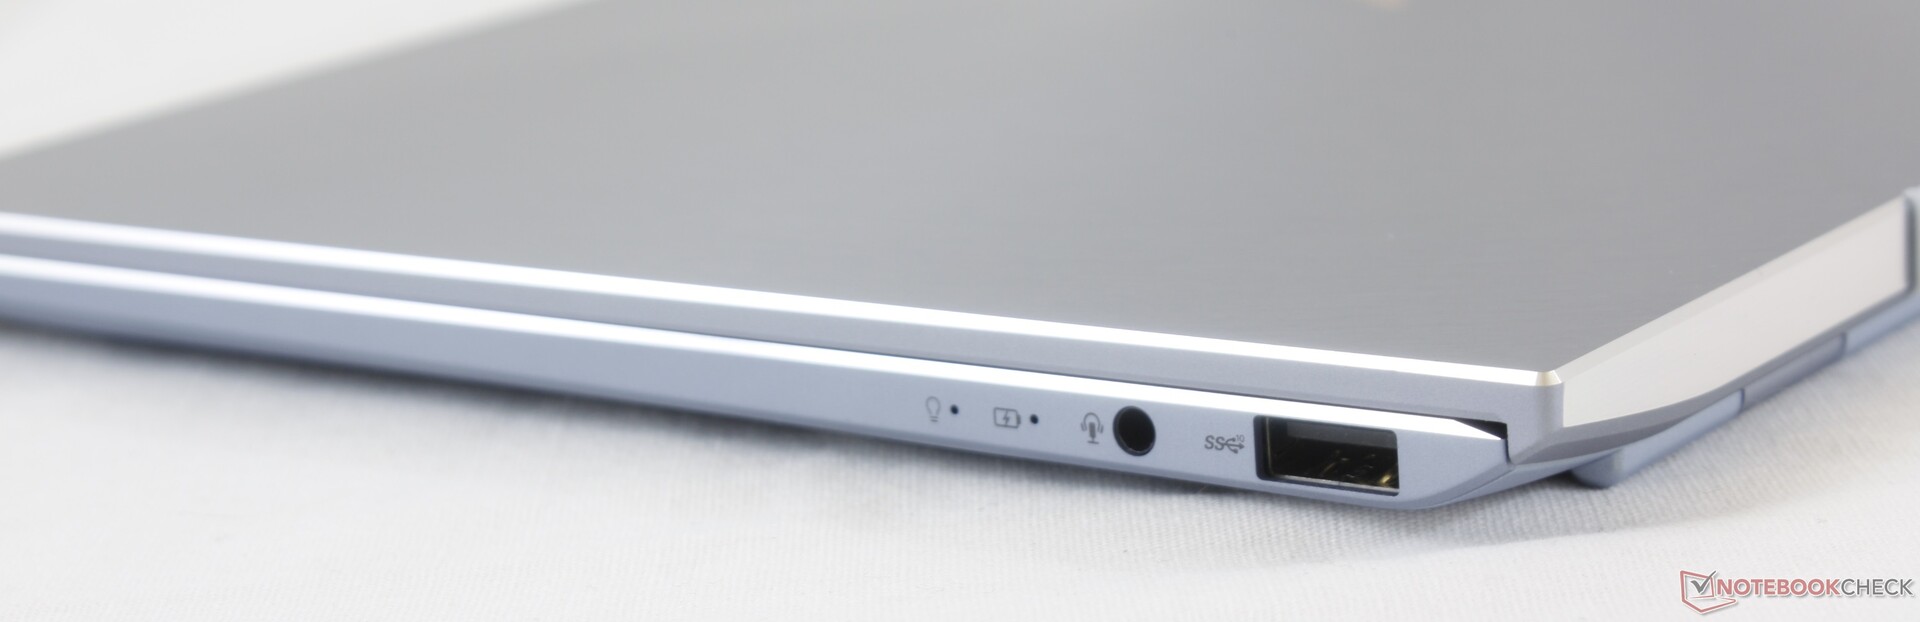
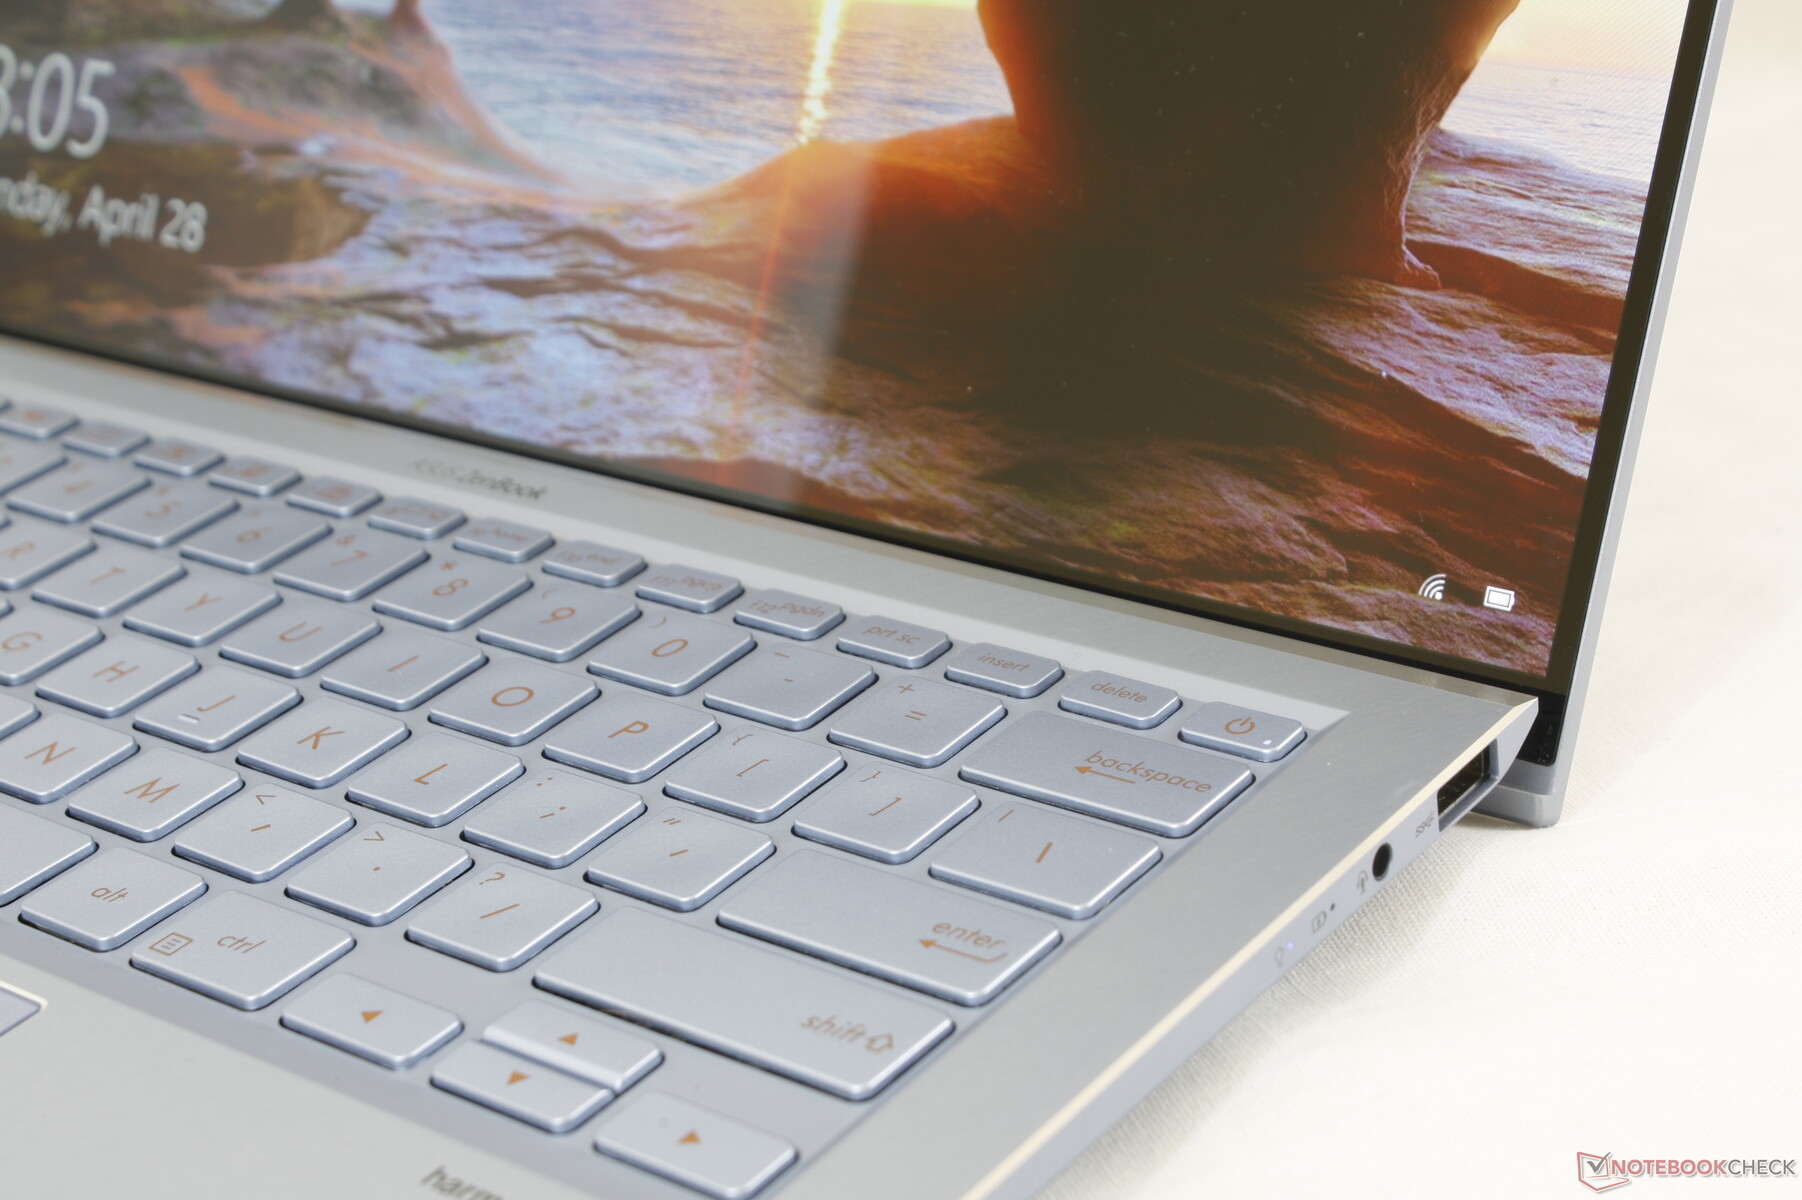
Port options have changed from the UX391 as the UX392 integrates both a MicroSD reader and a full-size USB Type-A port while dropping support for Thunderbolt 3. There is no integrated HDMI port either and so users will have to rely on the two USB Type-C gen. 2 ports for video output. Selection is limited as one would expect from a sub 14-inch Ultrabook.
Charging is accomplished via either of the two USB Type-C ports along the left edge. We would have preferred one USB Type-C port on each side of the laptop for charging convenience much like on the Huawei MateBook X Pro.
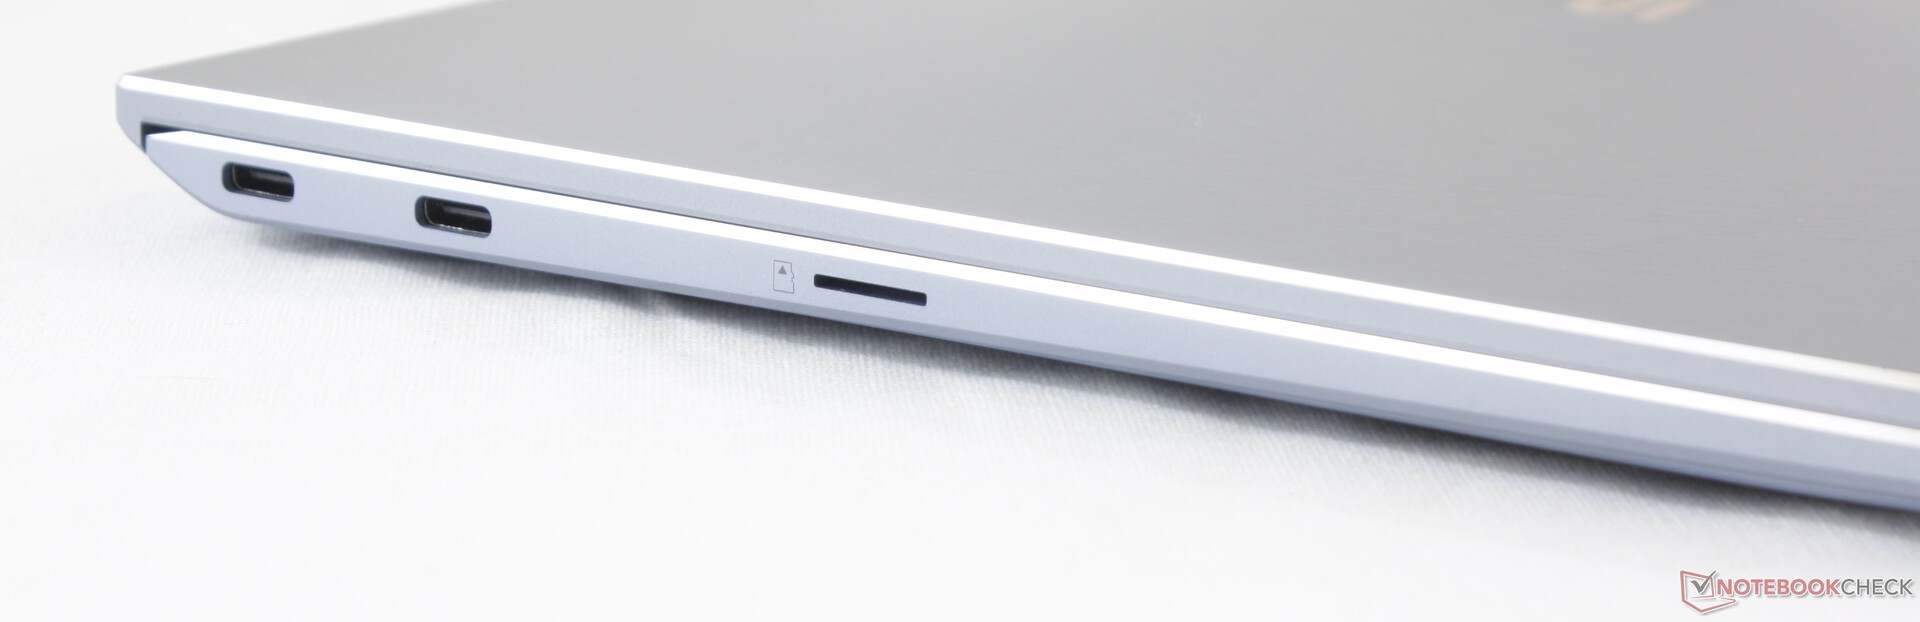
SD Card Reader
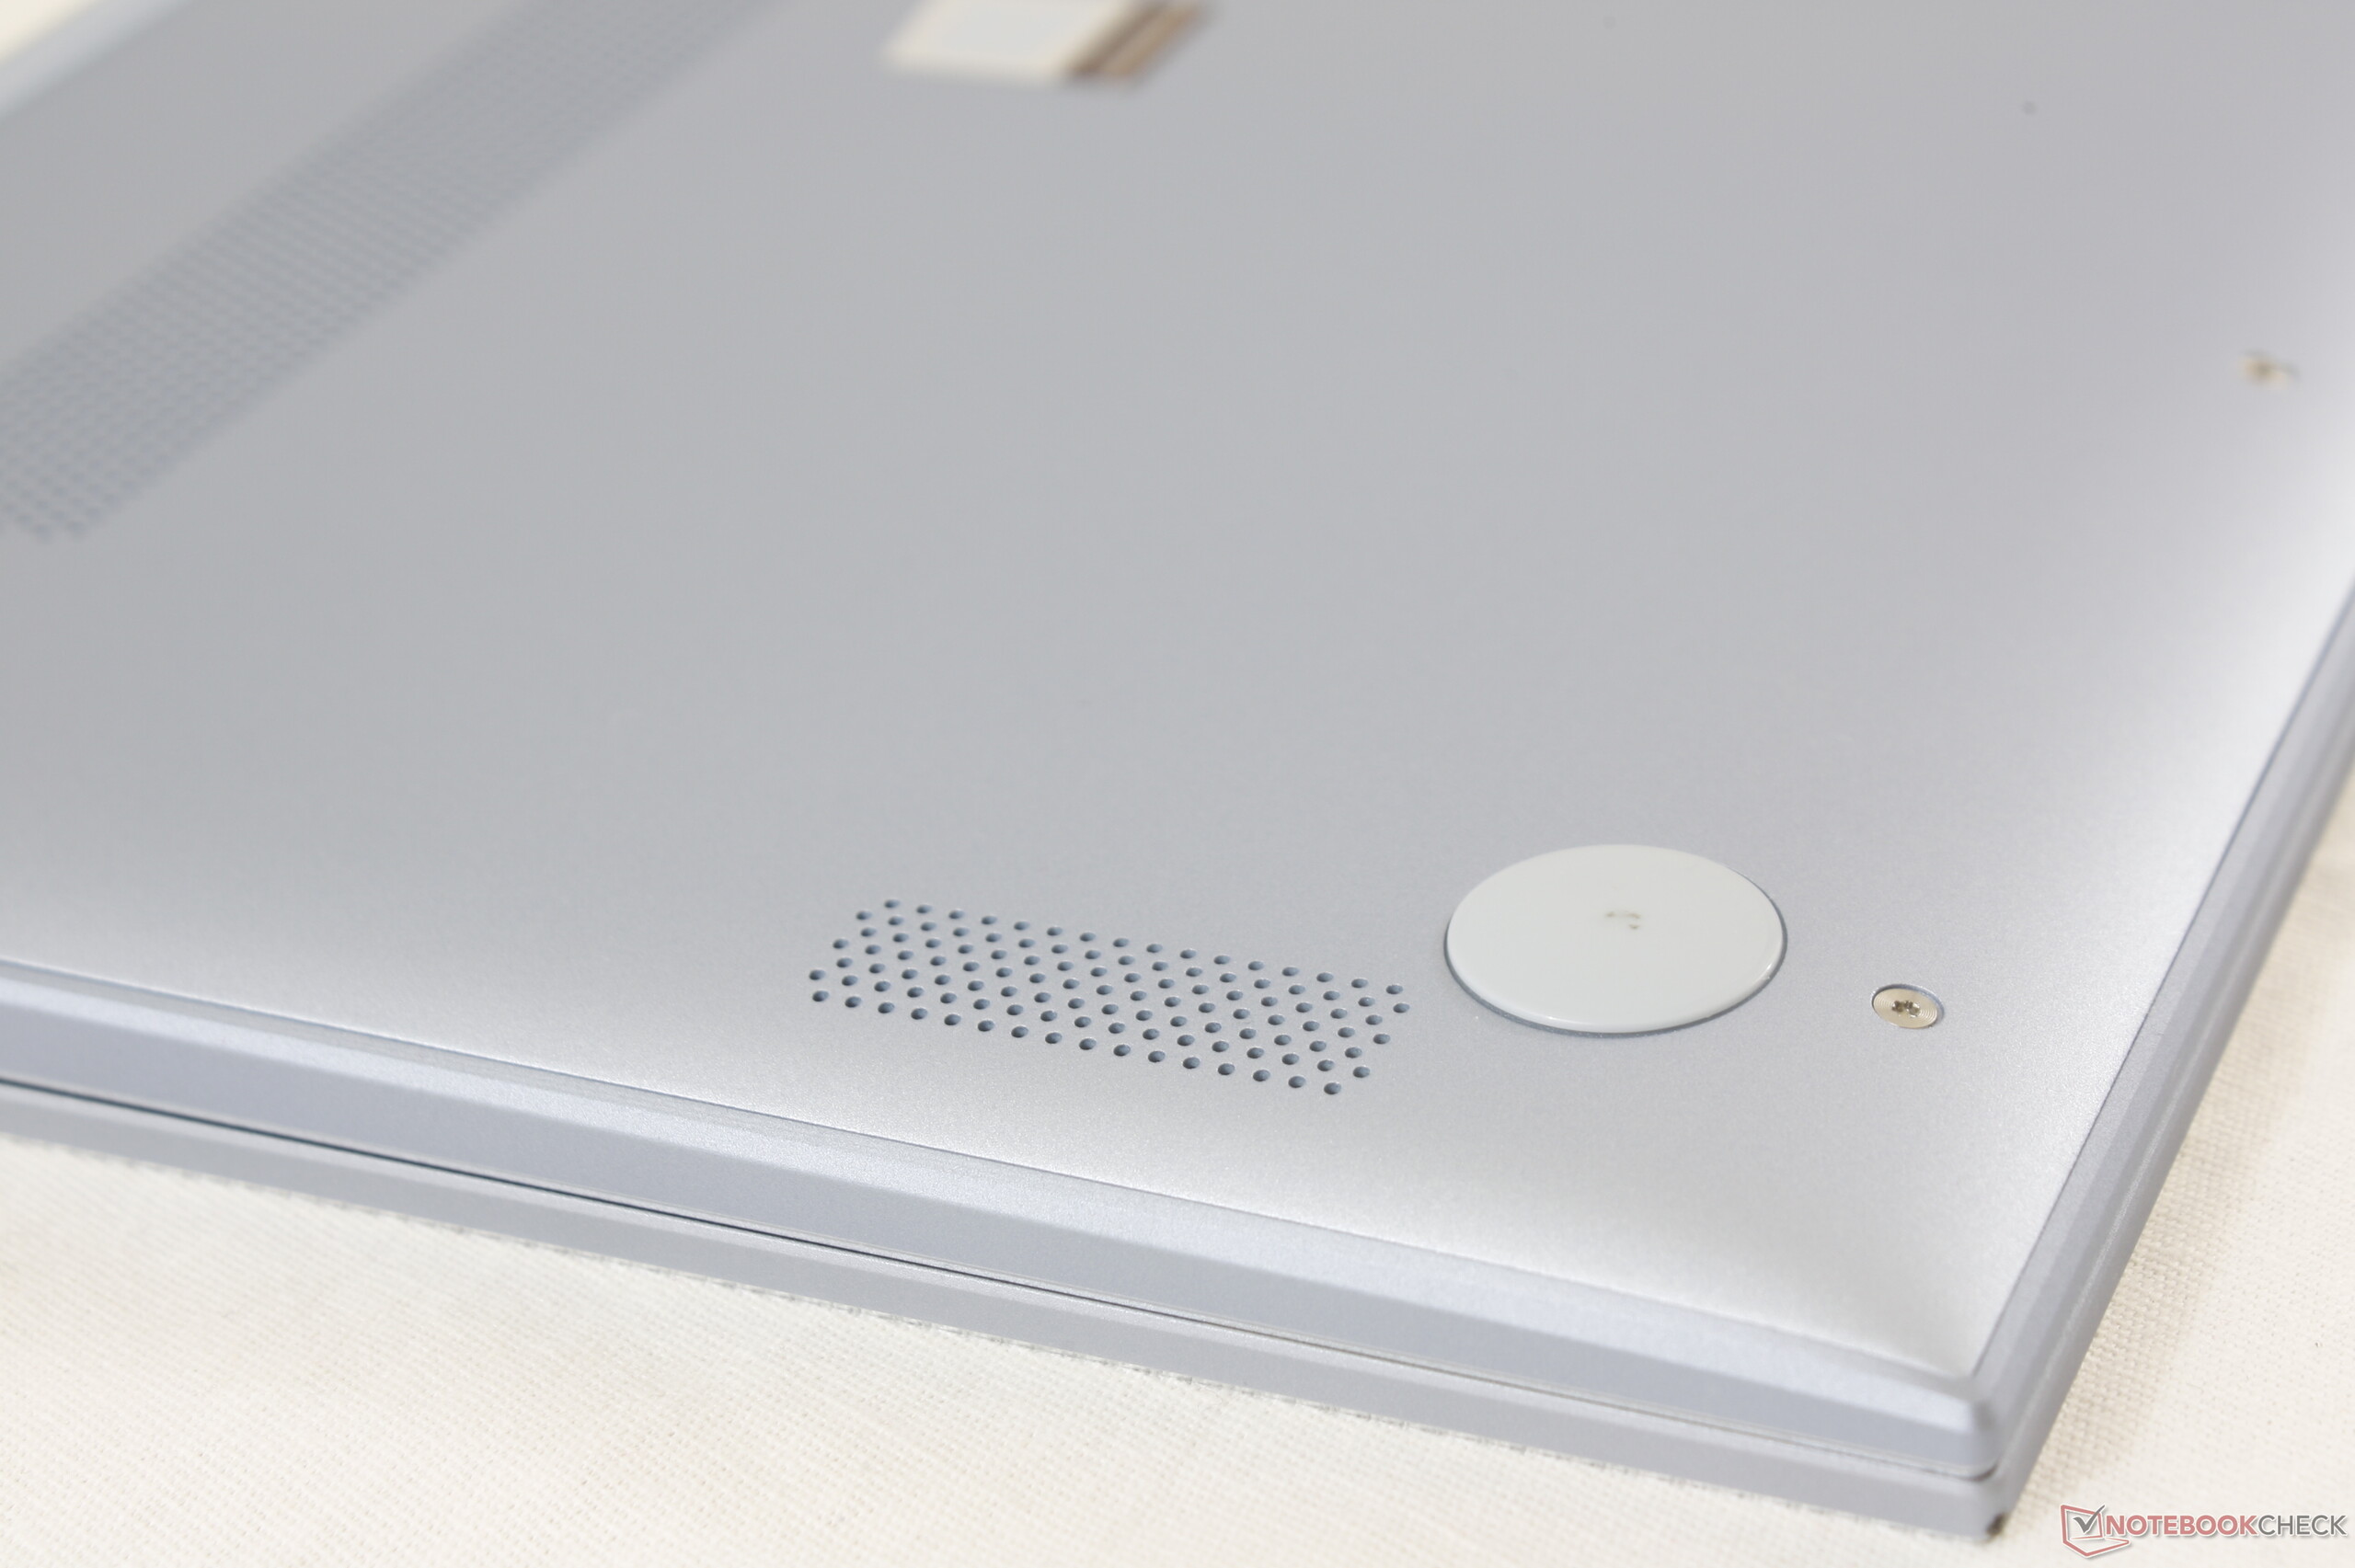
Transfer rates from the integrated MicroSD card reader are average at about 83 MB/s. Moving 1 GB of pictures from our UHS-II test card to desktop takes about 14 seconds compared to half that on the XPS 13. While some users will inevitably complain about the lack of a full-size SD reader, most competing Ultrabooks and subnotebooks lack card readers completely including the Lenovo Yoga C930, Huawei MateBook X Pro, Razer Blade Stealth, and HP Spectre 13.
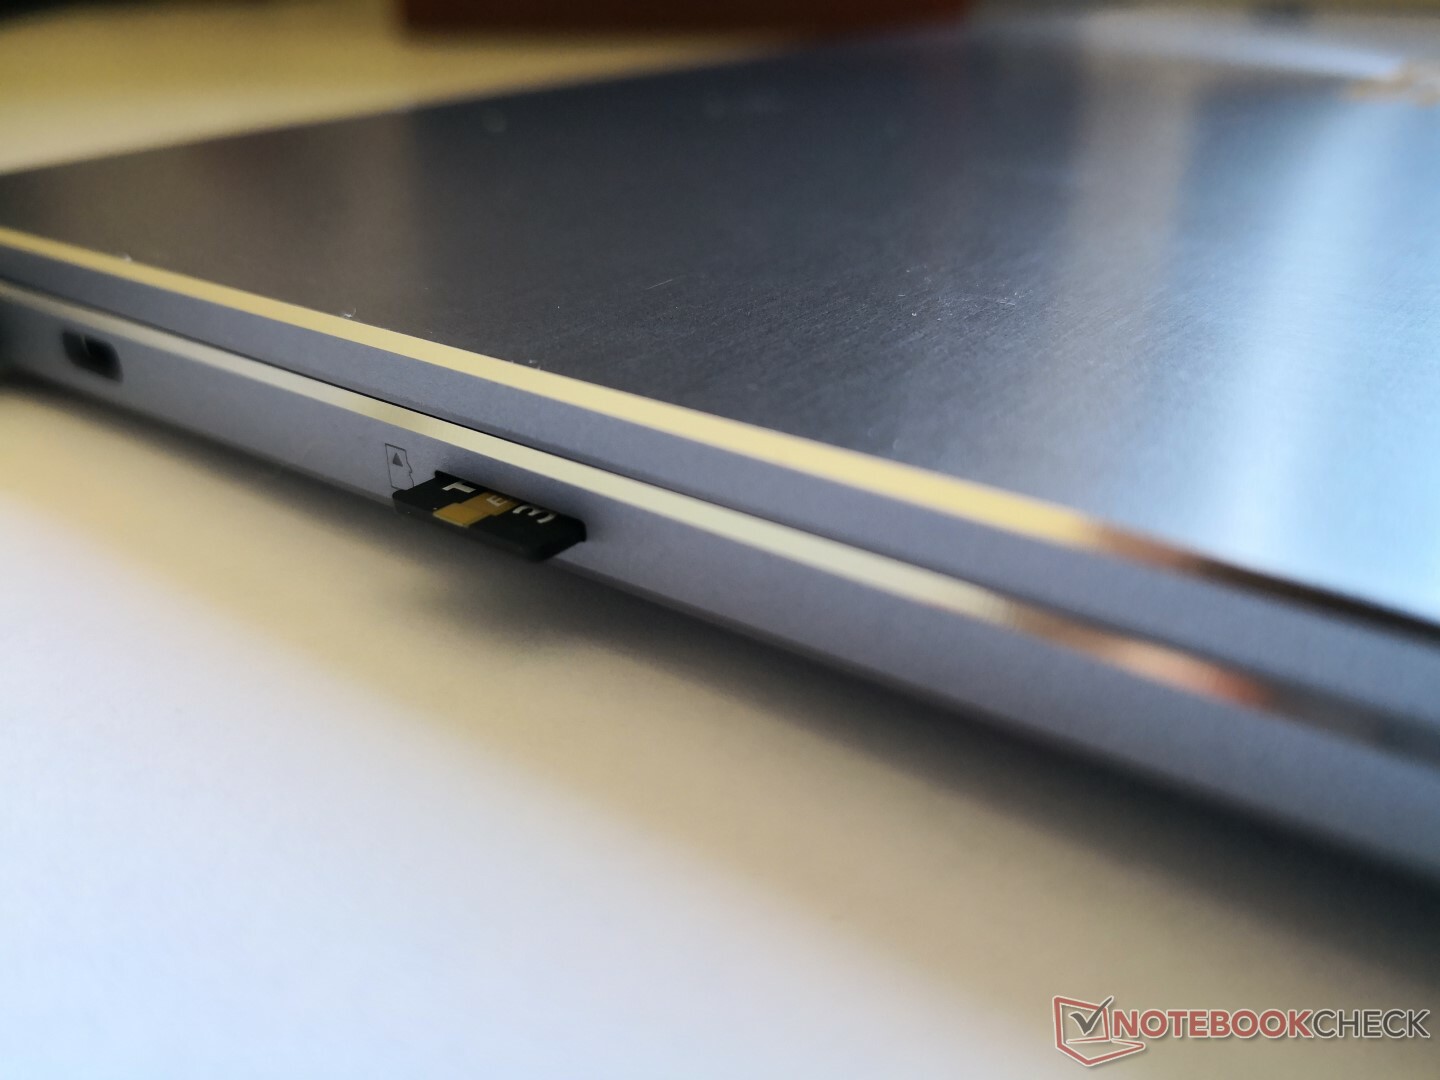
It's worth noting that the MicroSD reader is not spring-loaded and a fully inserted card still protrudes by about 2 to 3 millimeters. We recommend removing the card first before stowing or risk damaging the card during movement.
| SD Card Reader | |
| average JPG Copy Test (av. of 3 runs) | |
| Dell XPS 13 9380 2019 (Toshiba Exceria Pro SDXC 64 GB UHS-II) | |
| Asus ROG G703GX (Toshiba Exceria Pro SDXC 64 GB UHS-II) | |
| Asus ZenBook S13 UX392FN (Toshiba Exceria Pro M501 64 GB UHS-II) | |
| Chuwi HeroBook 14 (Toshiba Exceria Pro M501 64 GB UHS-II) | |
| maximum AS SSD Seq Read Test (1GB) | |
| Asus ROG G703GX (Toshiba Exceria Pro SDXC 64 GB UHS-II) | |
| Dell XPS 13 9380 2019 (Toshiba Exceria Pro SDXC 64 GB UHS-II) | |
| Asus ZenBook S13 UX392FN (Toshiba Exceria Pro M501 64 GB UHS-II) | |
| Chuwi HeroBook 14 (Toshiba Exceria Pro M501 64 GB UHS-II) | |
Communication
The Intel 9560 offers Bluetooth 5 and a theoretical WLAN transfer rate of up to 1.73 Gbps compared to half that on most last generation Ultrabooks including Asus' own ZenBook S UX391. We didn't experience any connectivity issues during our time with the test unit.
| Networking | |
| iperf3 transmit AX12 | |
| Dell XPS 13 9380 2019 | |
| Asus ZenBook S13 UX392FN | |
| Huawei Matebook X Pro i5 | |
| Asus ZenBook S UX391U | |
| iperf3 receive AX12 | |
| Asus ZenBook S13 UX392FN | |
| Huawei Matebook X Pro i5 | |
| Asus ZenBook S UX391U | |
| Dell XPS 13 9380 2019 | |
Maintenance
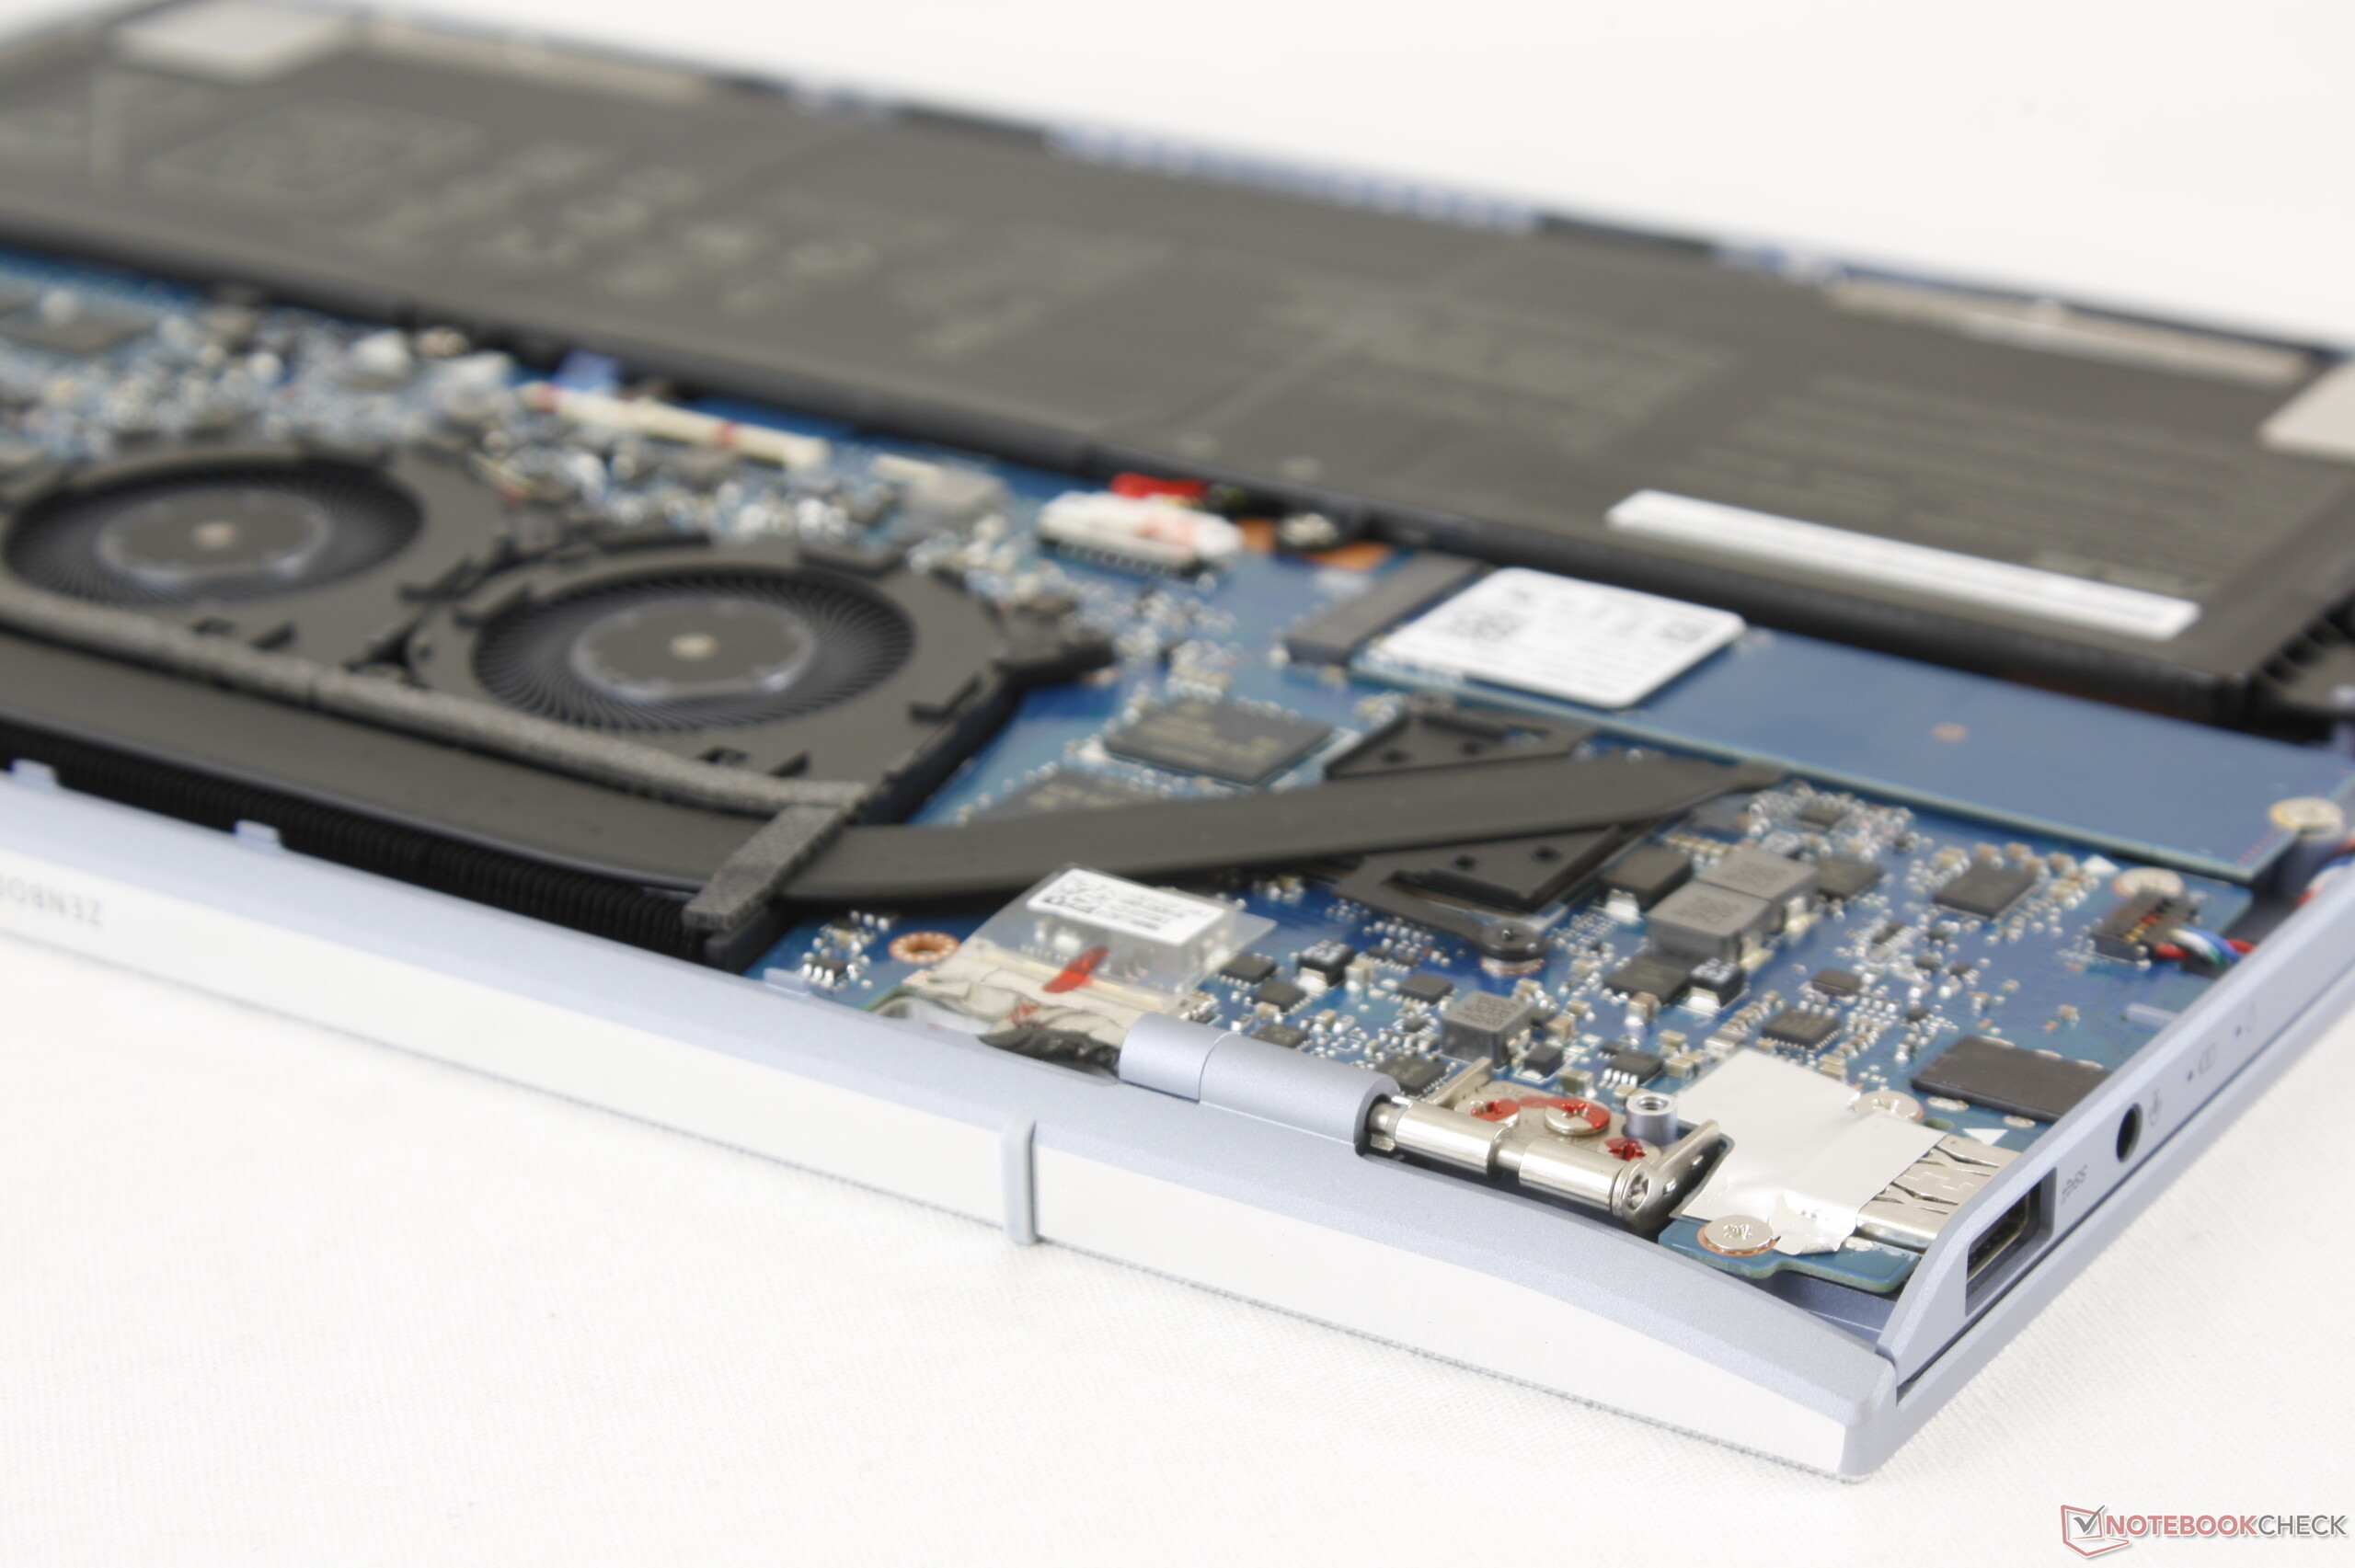
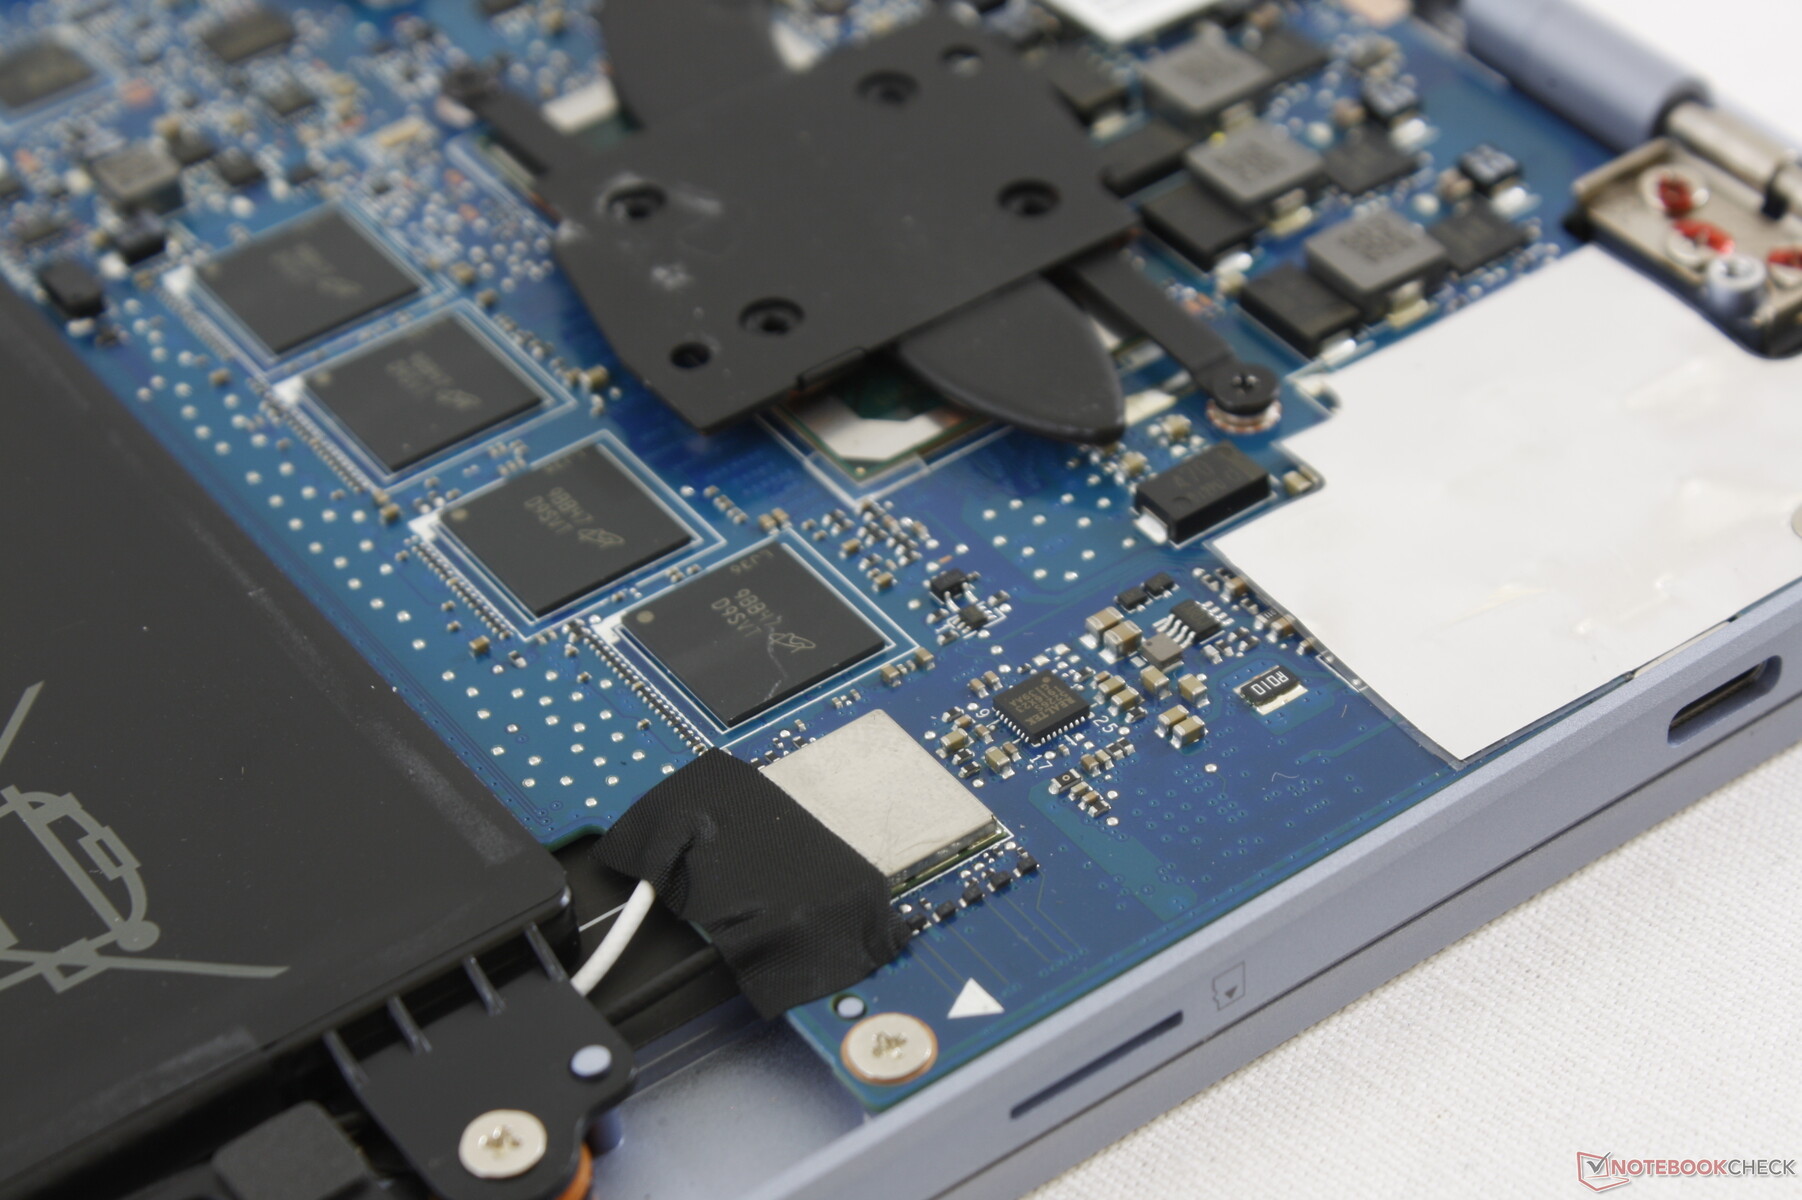
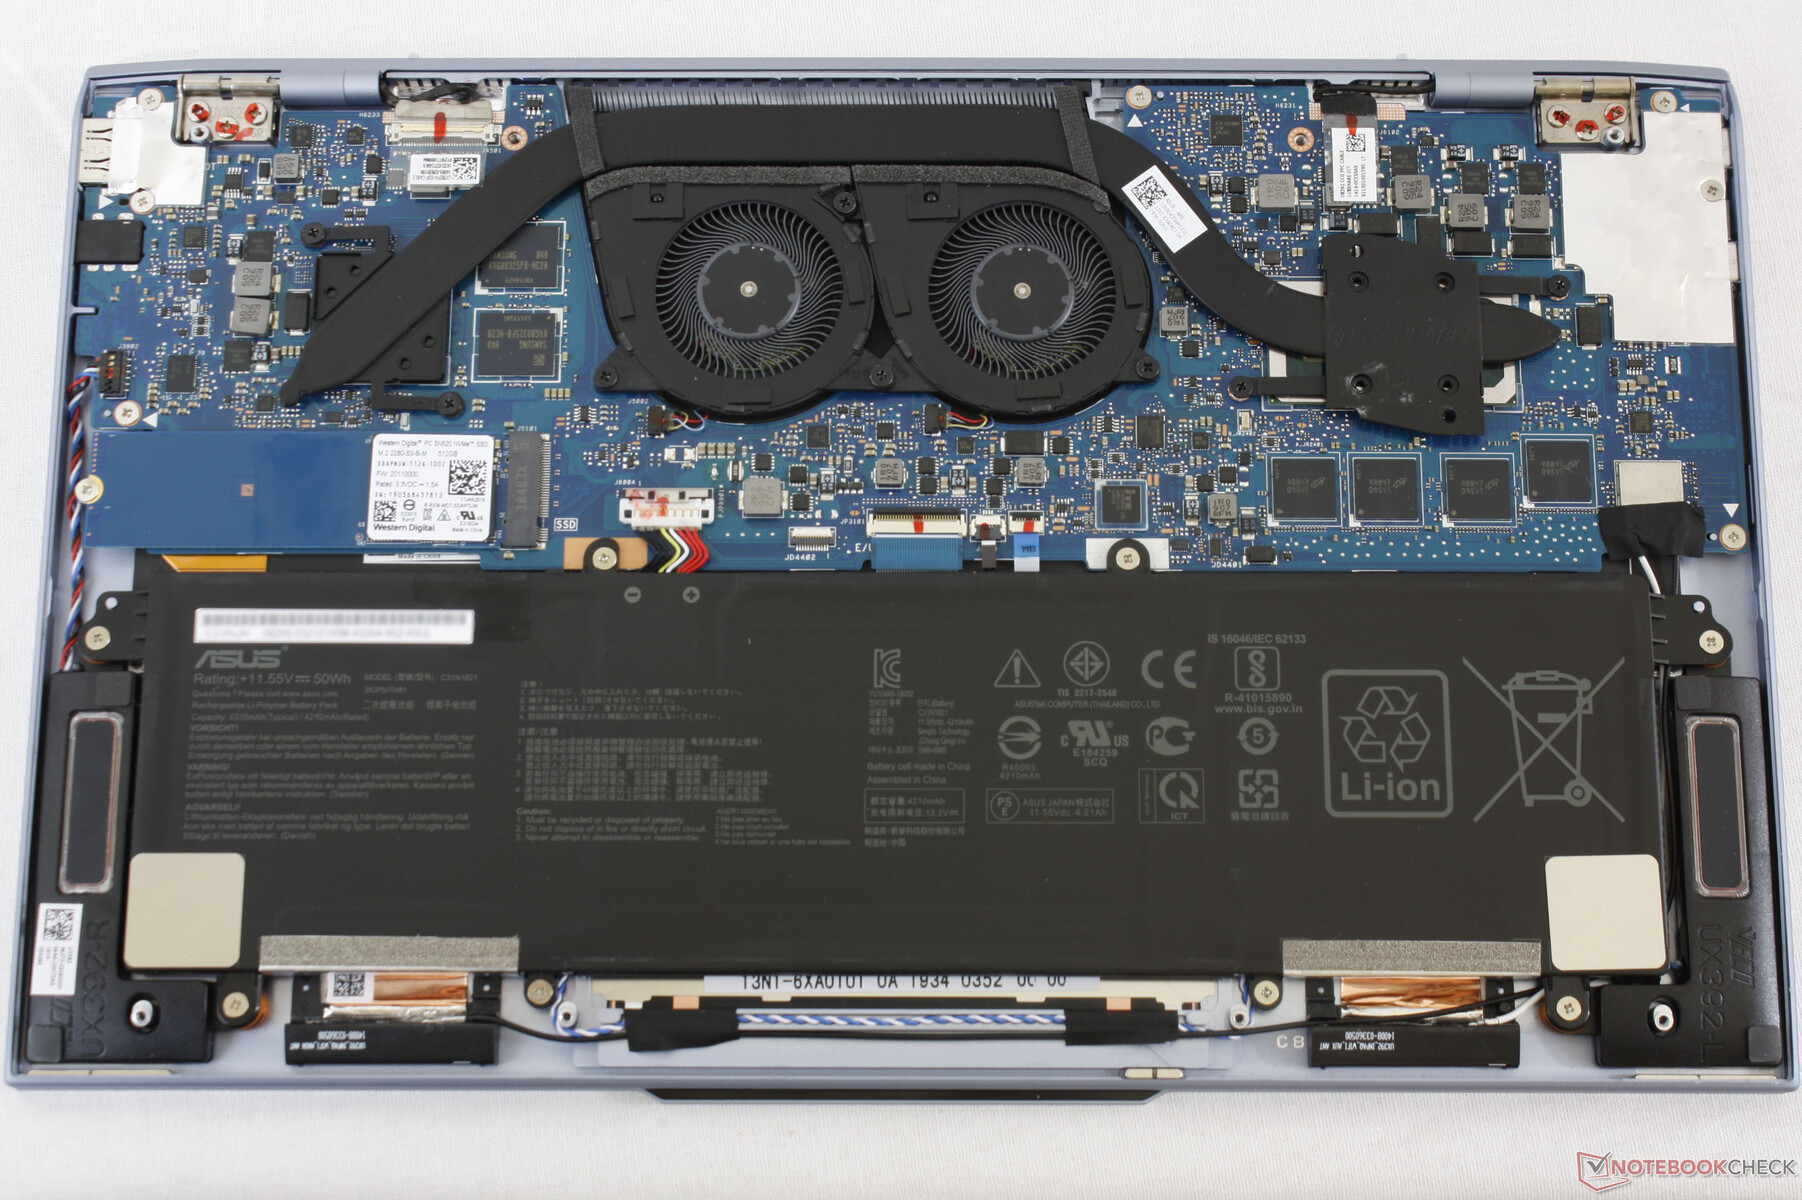
The bottom panel is secured by eight T4 Torx screws. Aside from the relatively uncommon screw type, the panel is easy to remove and not tightly latched around the edges and corners.
Upgrade options are limited to the M.2 2280 slot as RAM and WLAN are soldered much like on the last generation ZenBook UX391.
Accessories and Warranty
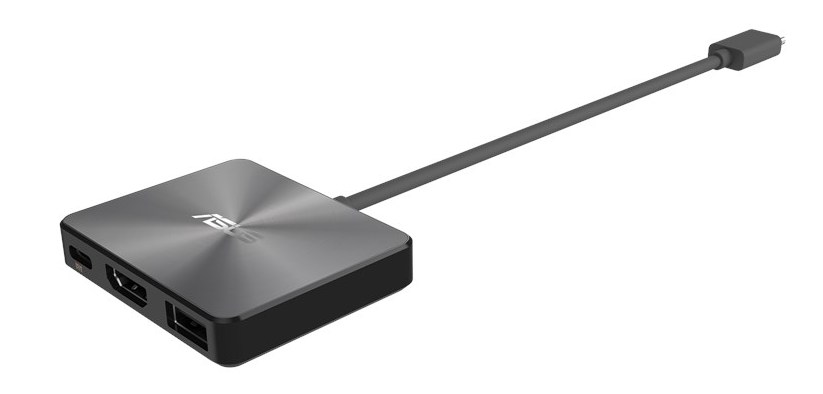
The retail box includes a USB Type-C Mini Dock with USB Type-A, full-size HDMI, and USB Type-C and a protective sleeve for carrying the notebook. We appreciate these small extras especially since most other OEMs include only paper manuals with no other accessories.
The standard one-year limited warranty applies. Additional information on the manufacturer warranty can be found here.
Input Devices
Keyboard
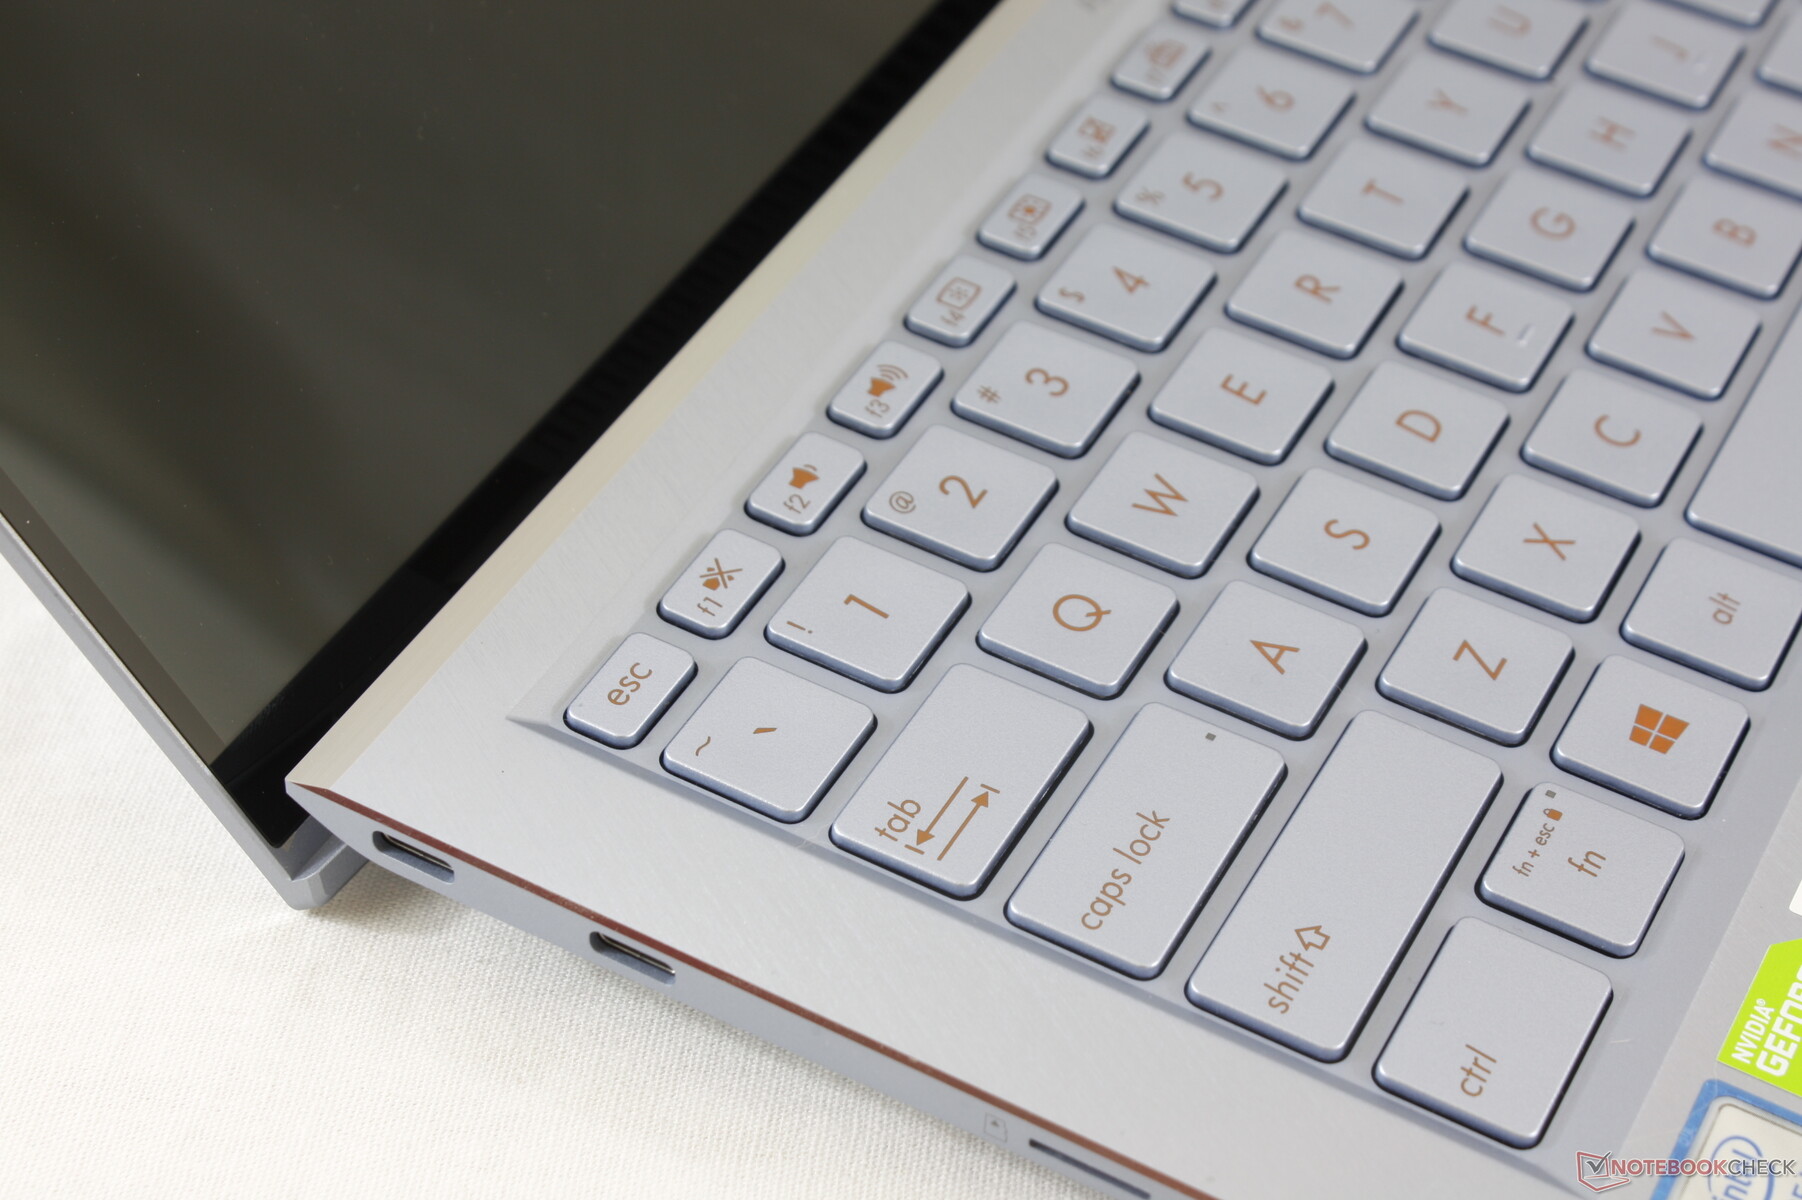
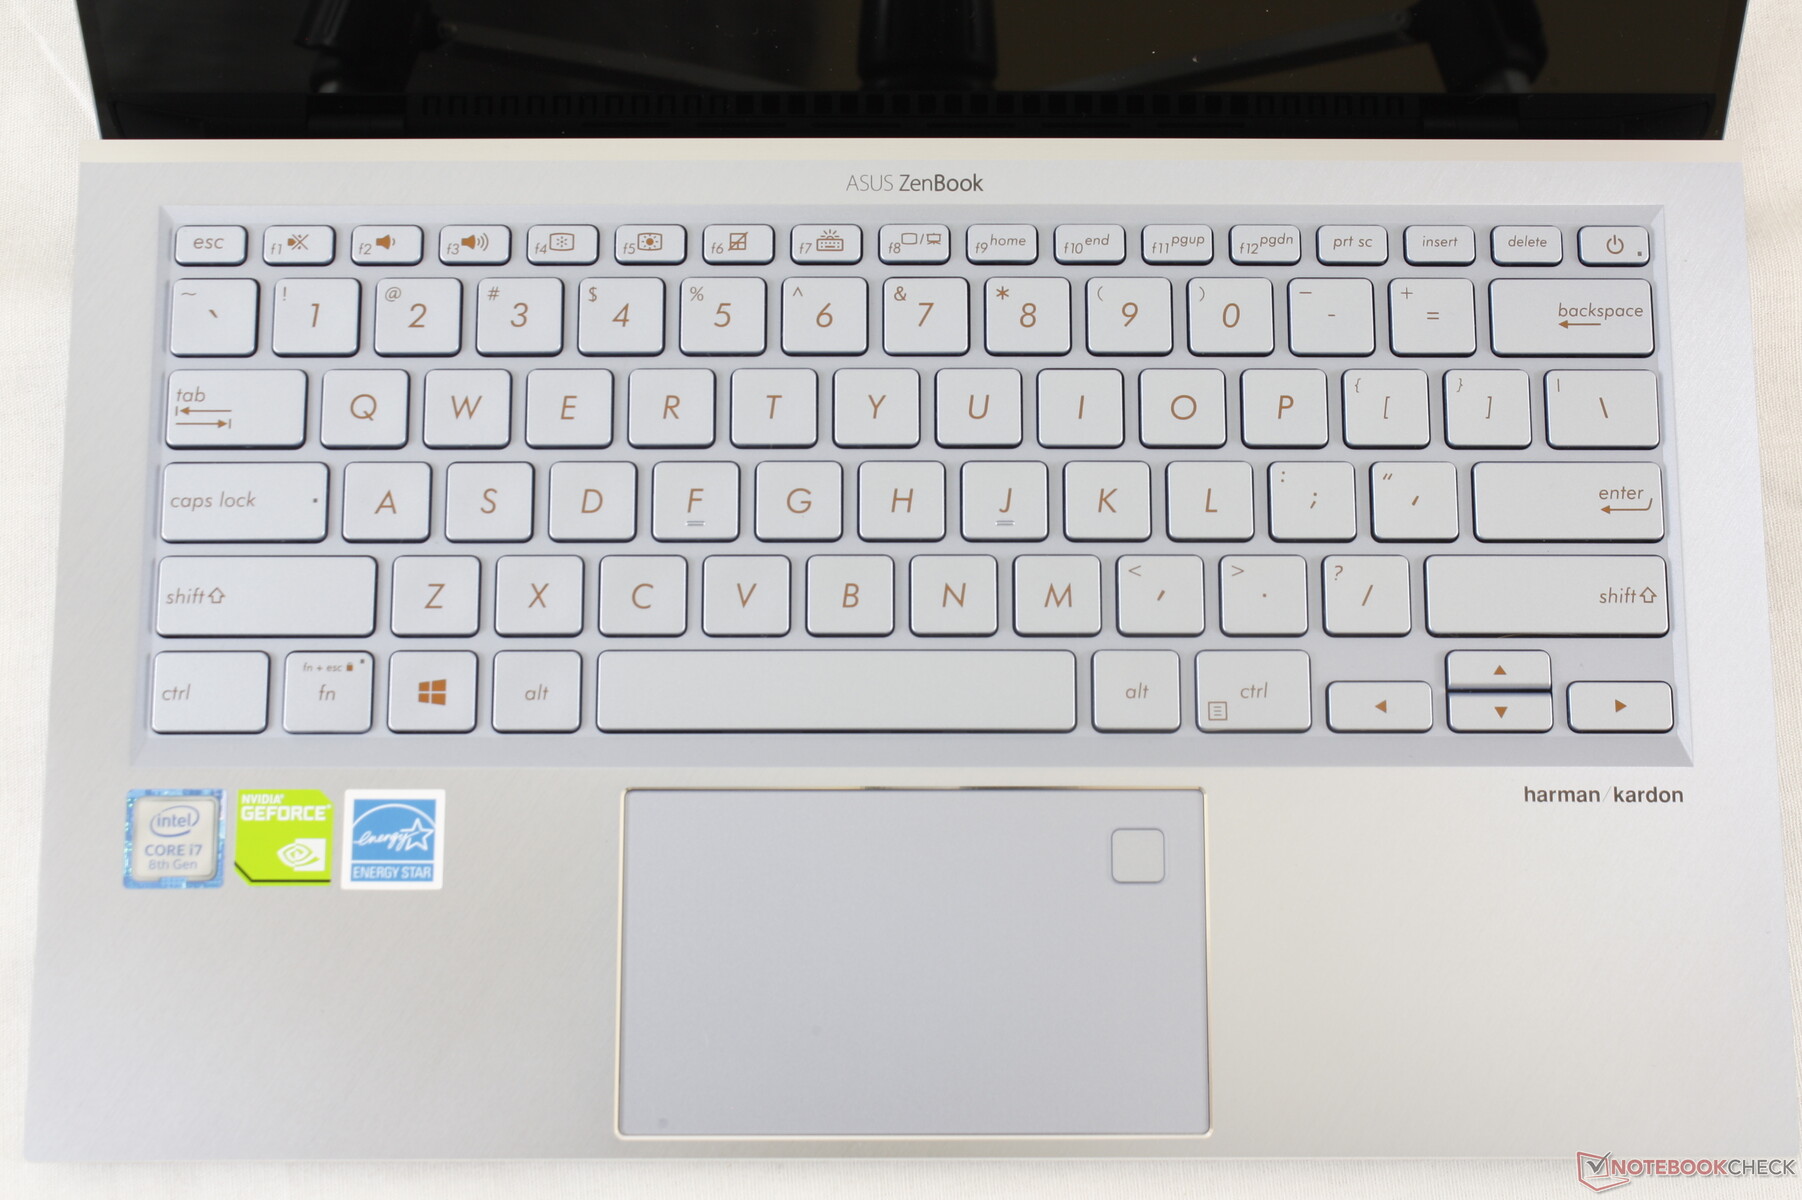
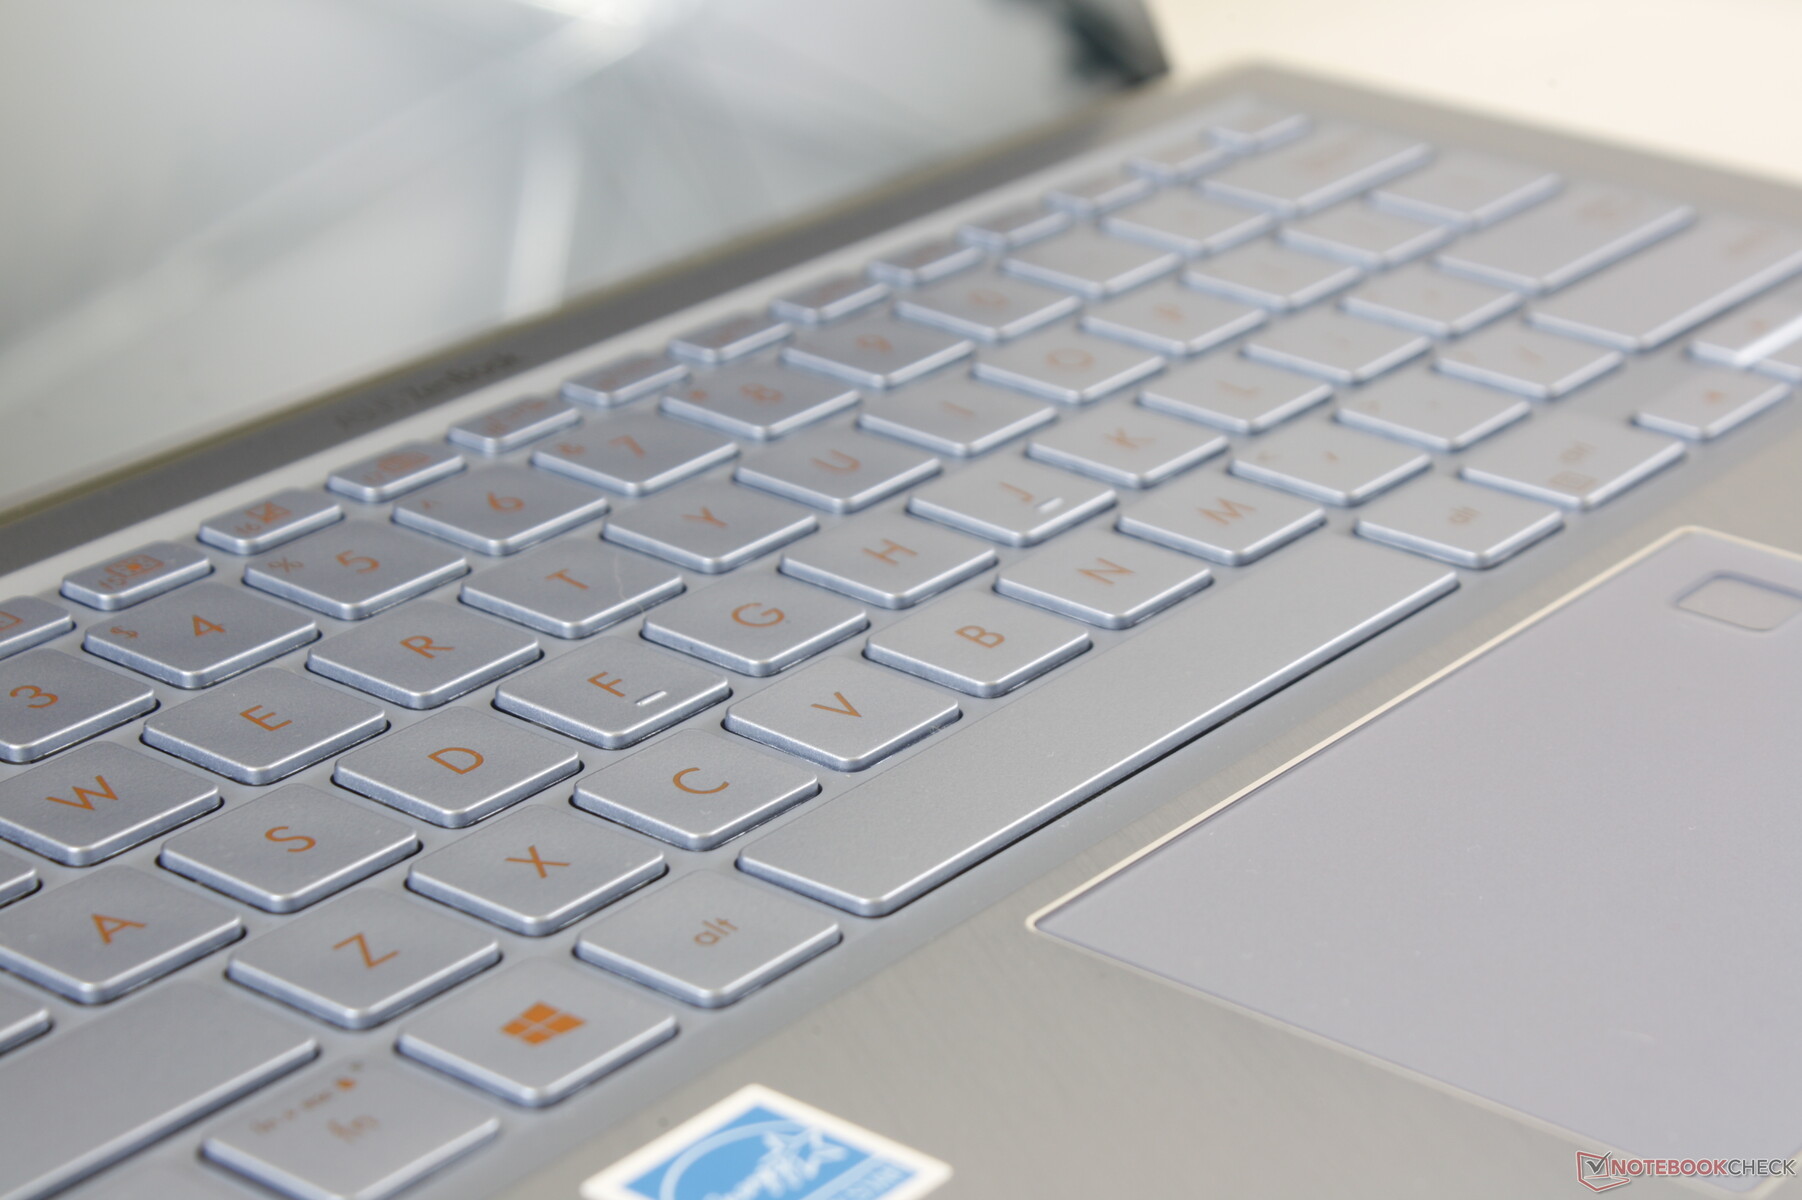
Keyboard layout and tactility have not changed from the UX391. Key feedback and travel remain satisfactory with relatively quiet clatter overall except for the louder Space key. It's too bad that the Arrow keys are still half-sized and cramped. We still find the keyboard on the HP Spectre series to offer firmer feedback and deeper travel than on both the Asus UX392 and Dell XPS 13.
A three-level white backlight is included. We appreciate the fact that the printing on the keys are tan in color for a better contrast against the white keycaps. In comparison, the gray printing on white HP Spectre models is more difficult to see especially when the white backlight is active.
Touchpad
The clickpad is one of the more disappointing aspects of the UX392. While its small size is understandable and comparable to the trackpad on the XPS 13 (10.5 x 6.2 cm vs. 10.5 x 6.0 cm), feedback from the integrated mouse keys is weak and spongy. Travel is shallow to make the clicking experience unsatisfying. Furthermore, the trackpad surface tends to stick to the finger for an uneven glide. If there's one thing Asus could improve on, then it would definitely be the trackpad.
We're also somewhat disappointed that the trackpad does not feature a virtual NumPad as found on the ZenBook UX333/433/533 series. We're hopeful that Asus won't be phasing out the feature altogether.
Display
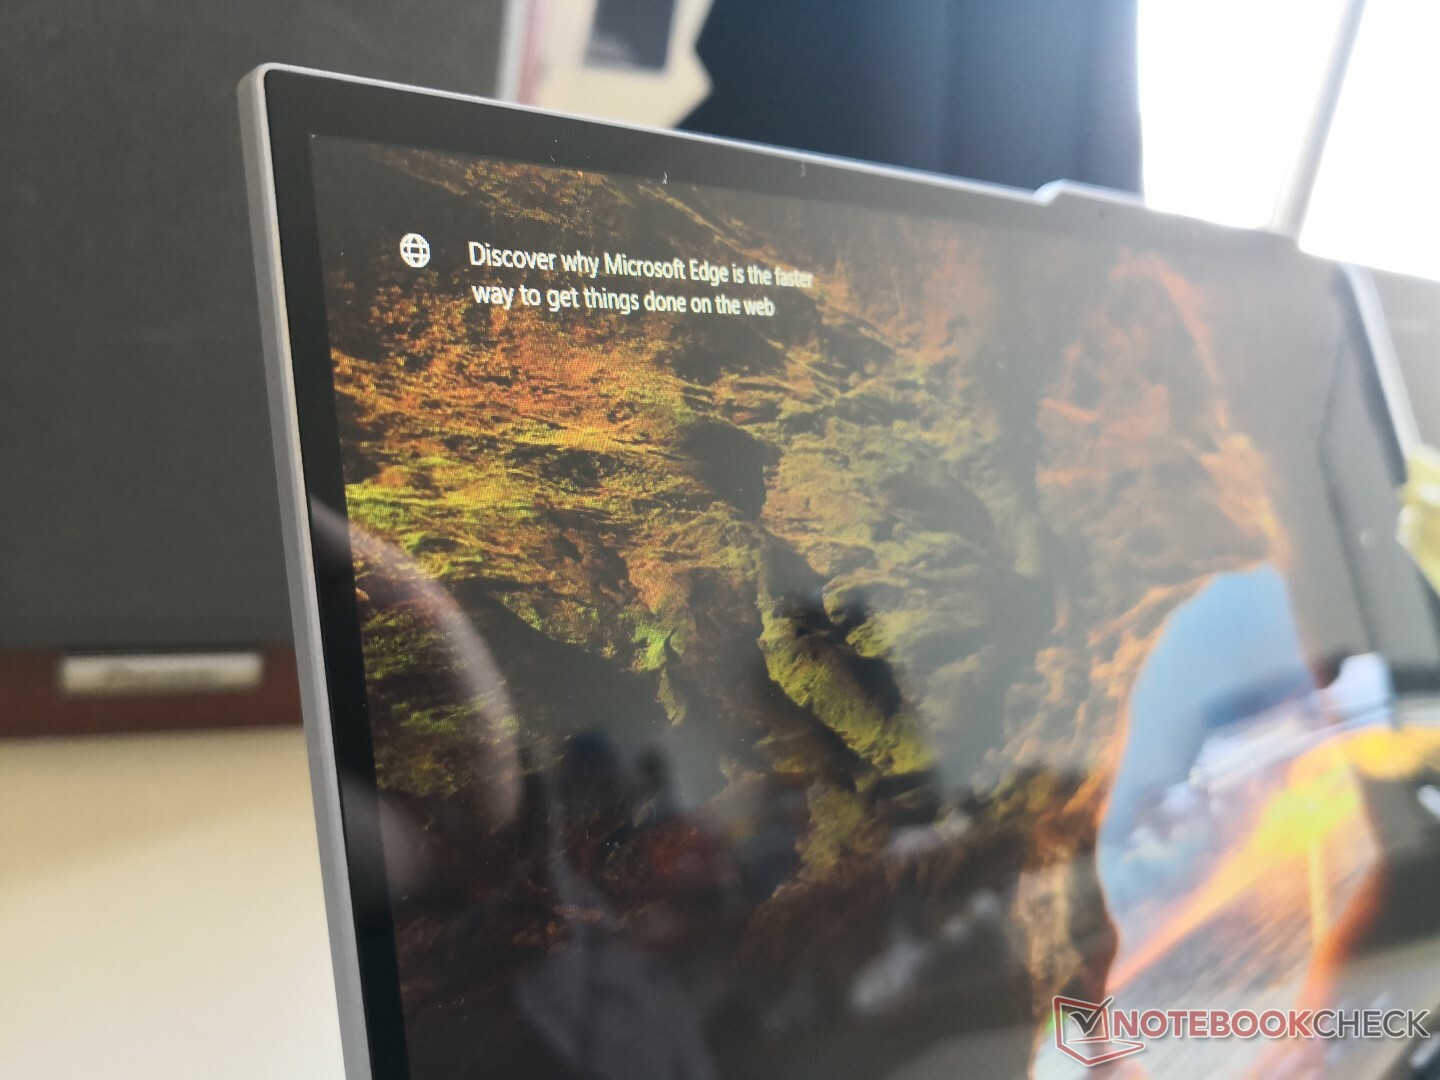
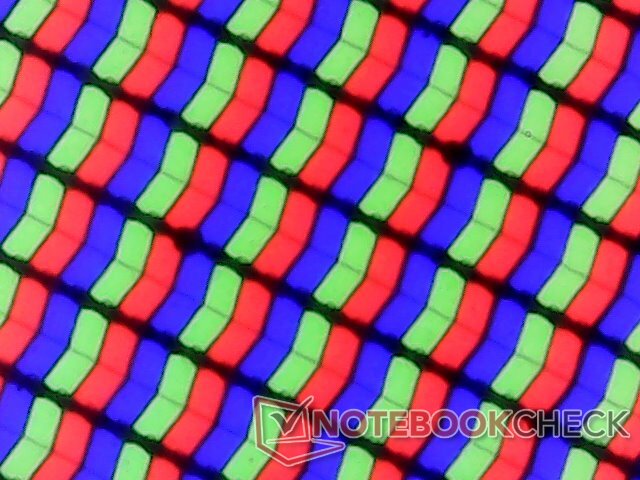
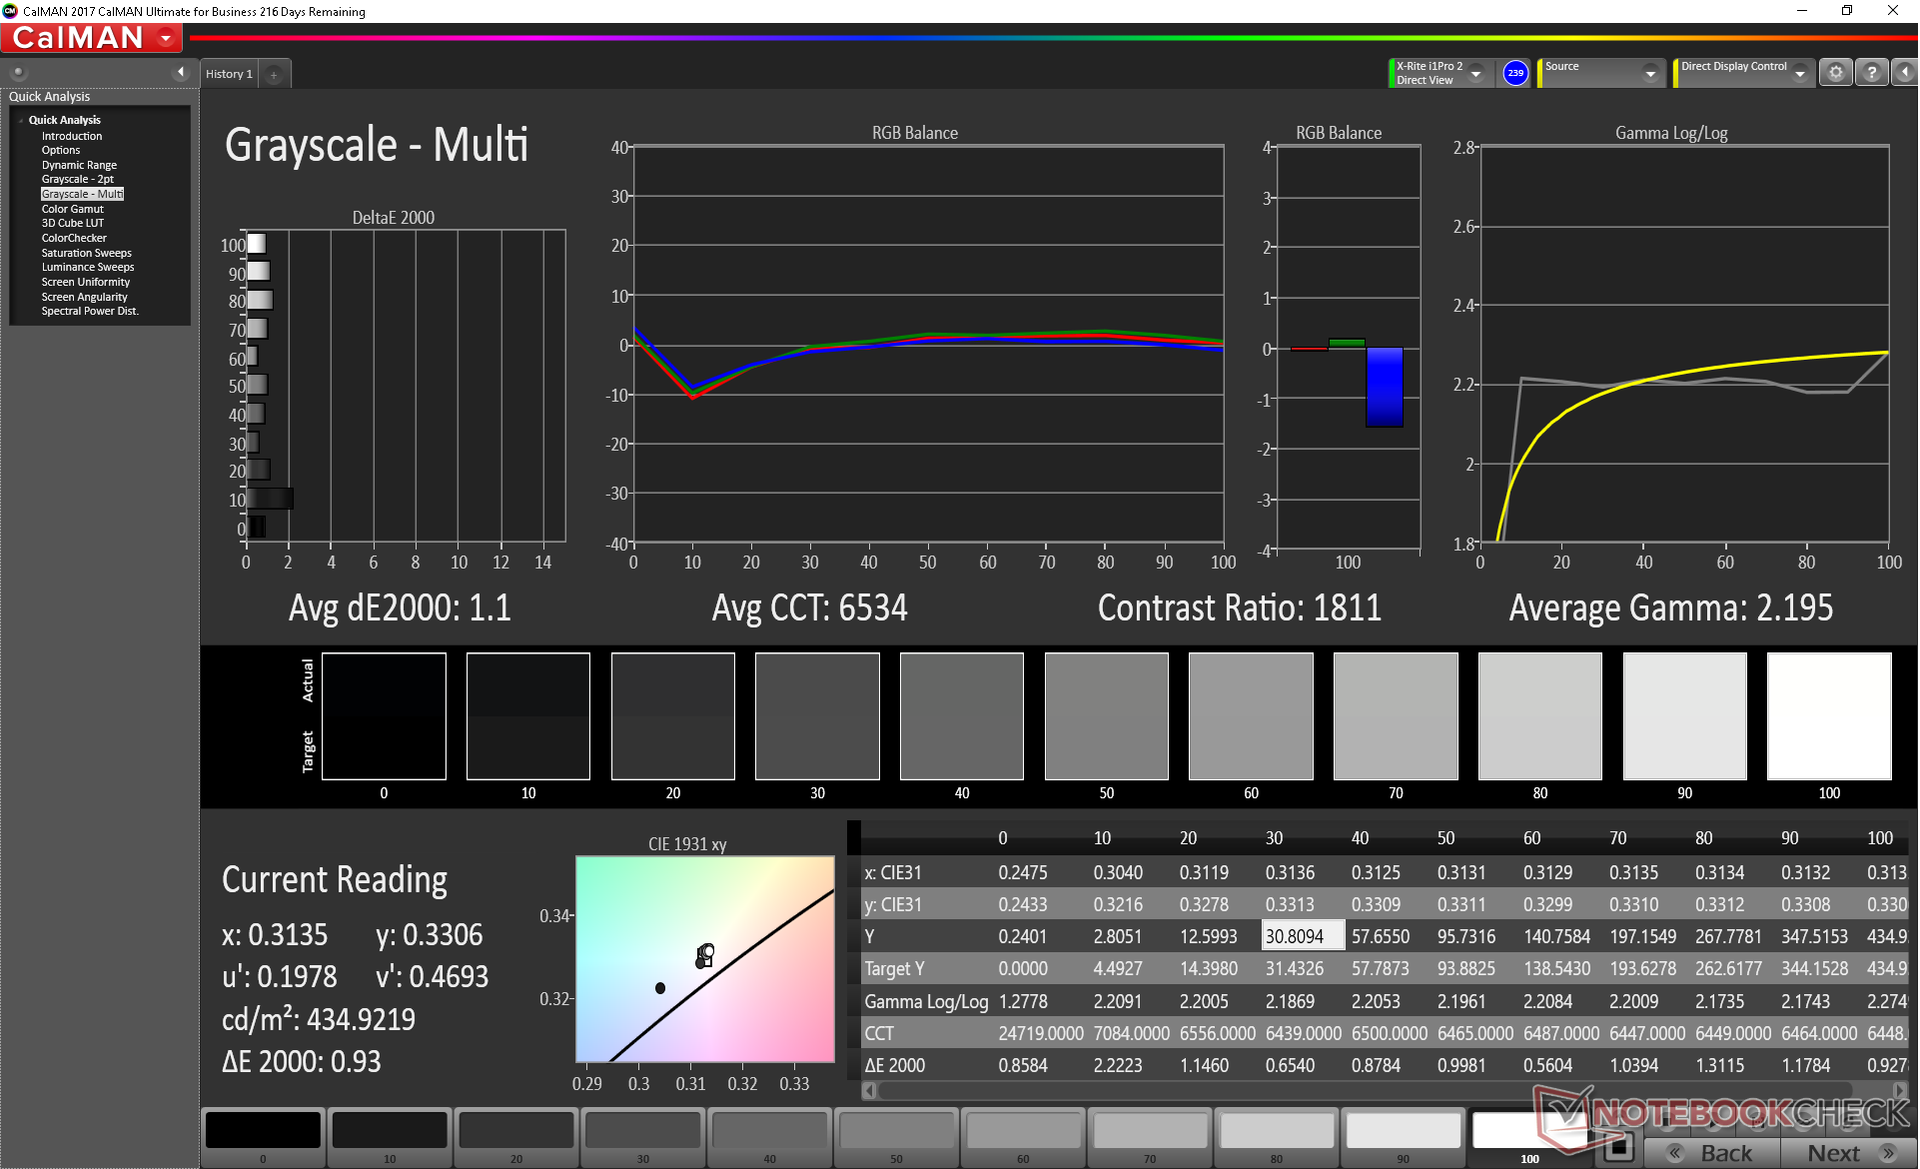
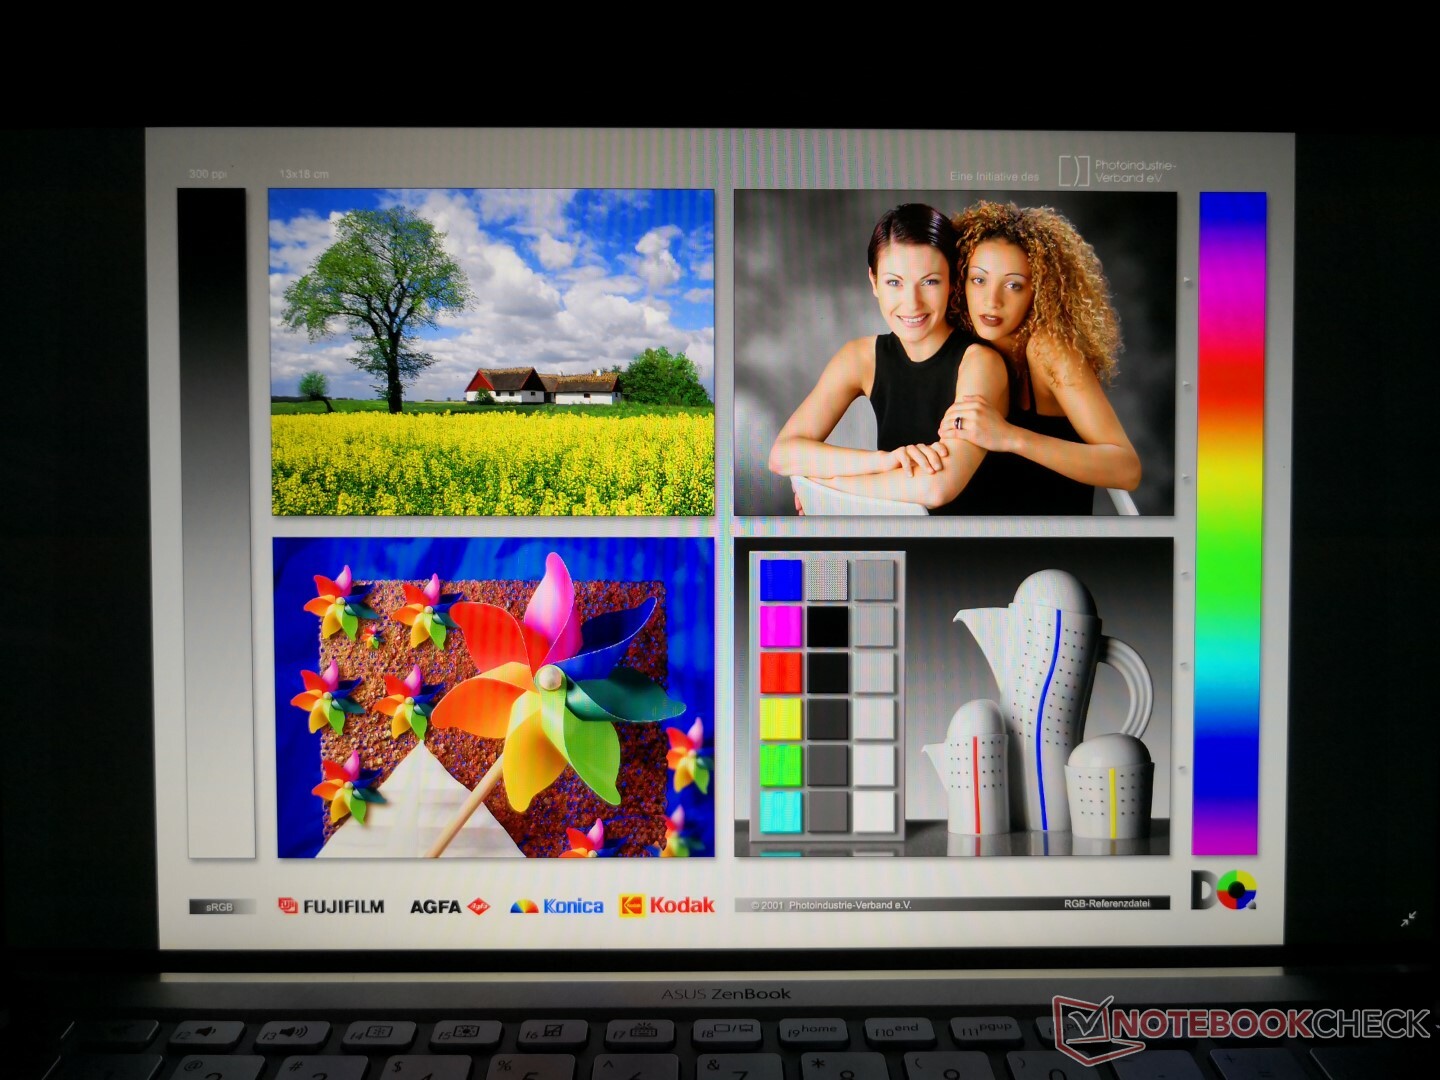
Asus offers no display options other than the default 1080p screen. Users expecting 4K UHD, touchscreen, matte, or native 120 Hz refresh rate may be disappointed. Even with this in mind, the narrow bezel display is easily the highlight of the UX392. It's bright at over 400 nits with both a high contrast ratio and wide gamut that are all indicative of a high quality panel at work. Since the screen is glossy, onscreen content appears crisp and free of any grains unlike on many matte displays. Response times are also much better than on the XPS 13 for noticeably less ghosting.
Interestingly, Asus has switched panel providers from AU Optronics on the UX391 to Tianma for the UX392. We definitely find the change worthwhile as this Tianma panel exhibits measurably better contrast, colors, response times, and color accuracy than on the UX391. The MateBook X Pro sports a Tianma XM panel as well albeit at a different resolution and aspect ratio.
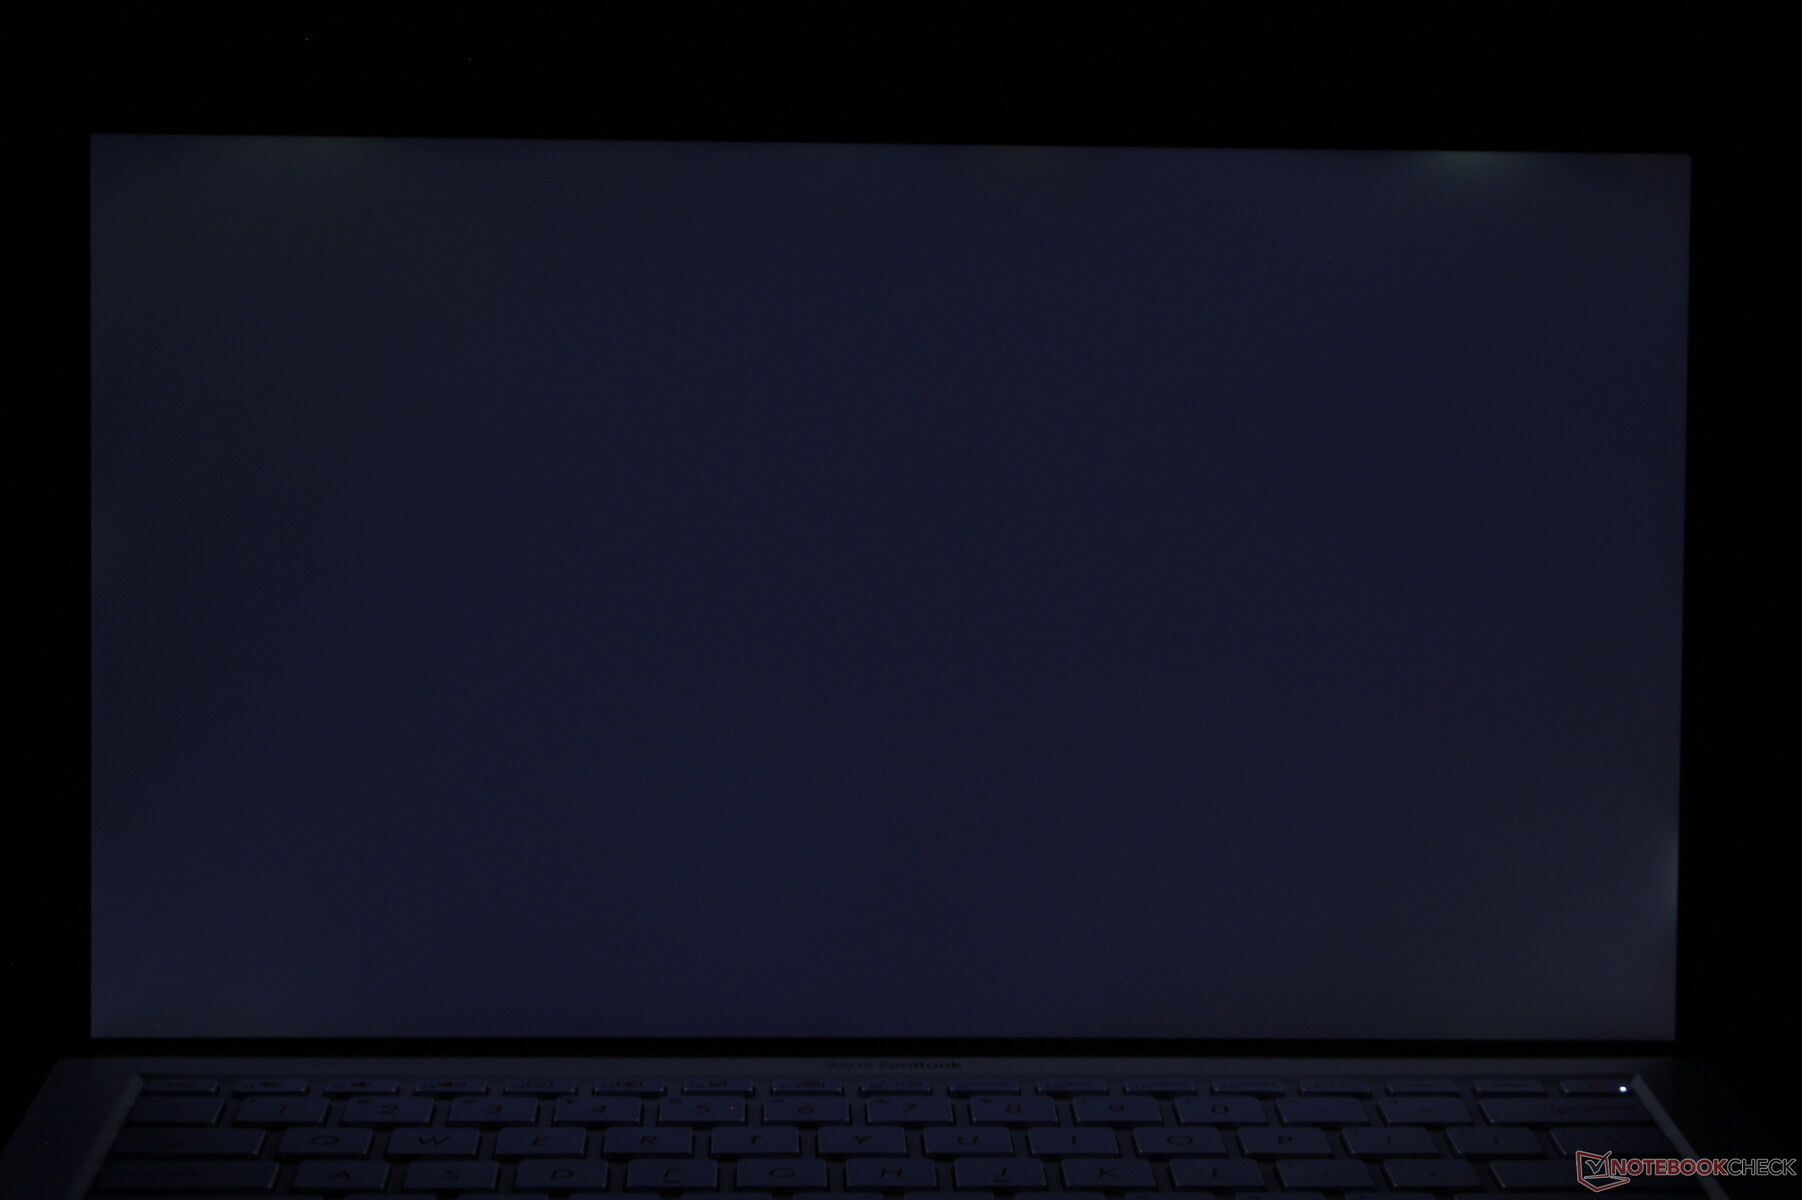
Slight uneven backlight bleeding is present on our test unit that is thankfully minor enough to be unnoticeable.
| |||||||||||||||||||||||||
Brightness Distribution: 90 %
Center on Battery: 466 cd/m²
Contrast: 1412:1 (Black: 0.33 cd/m²)
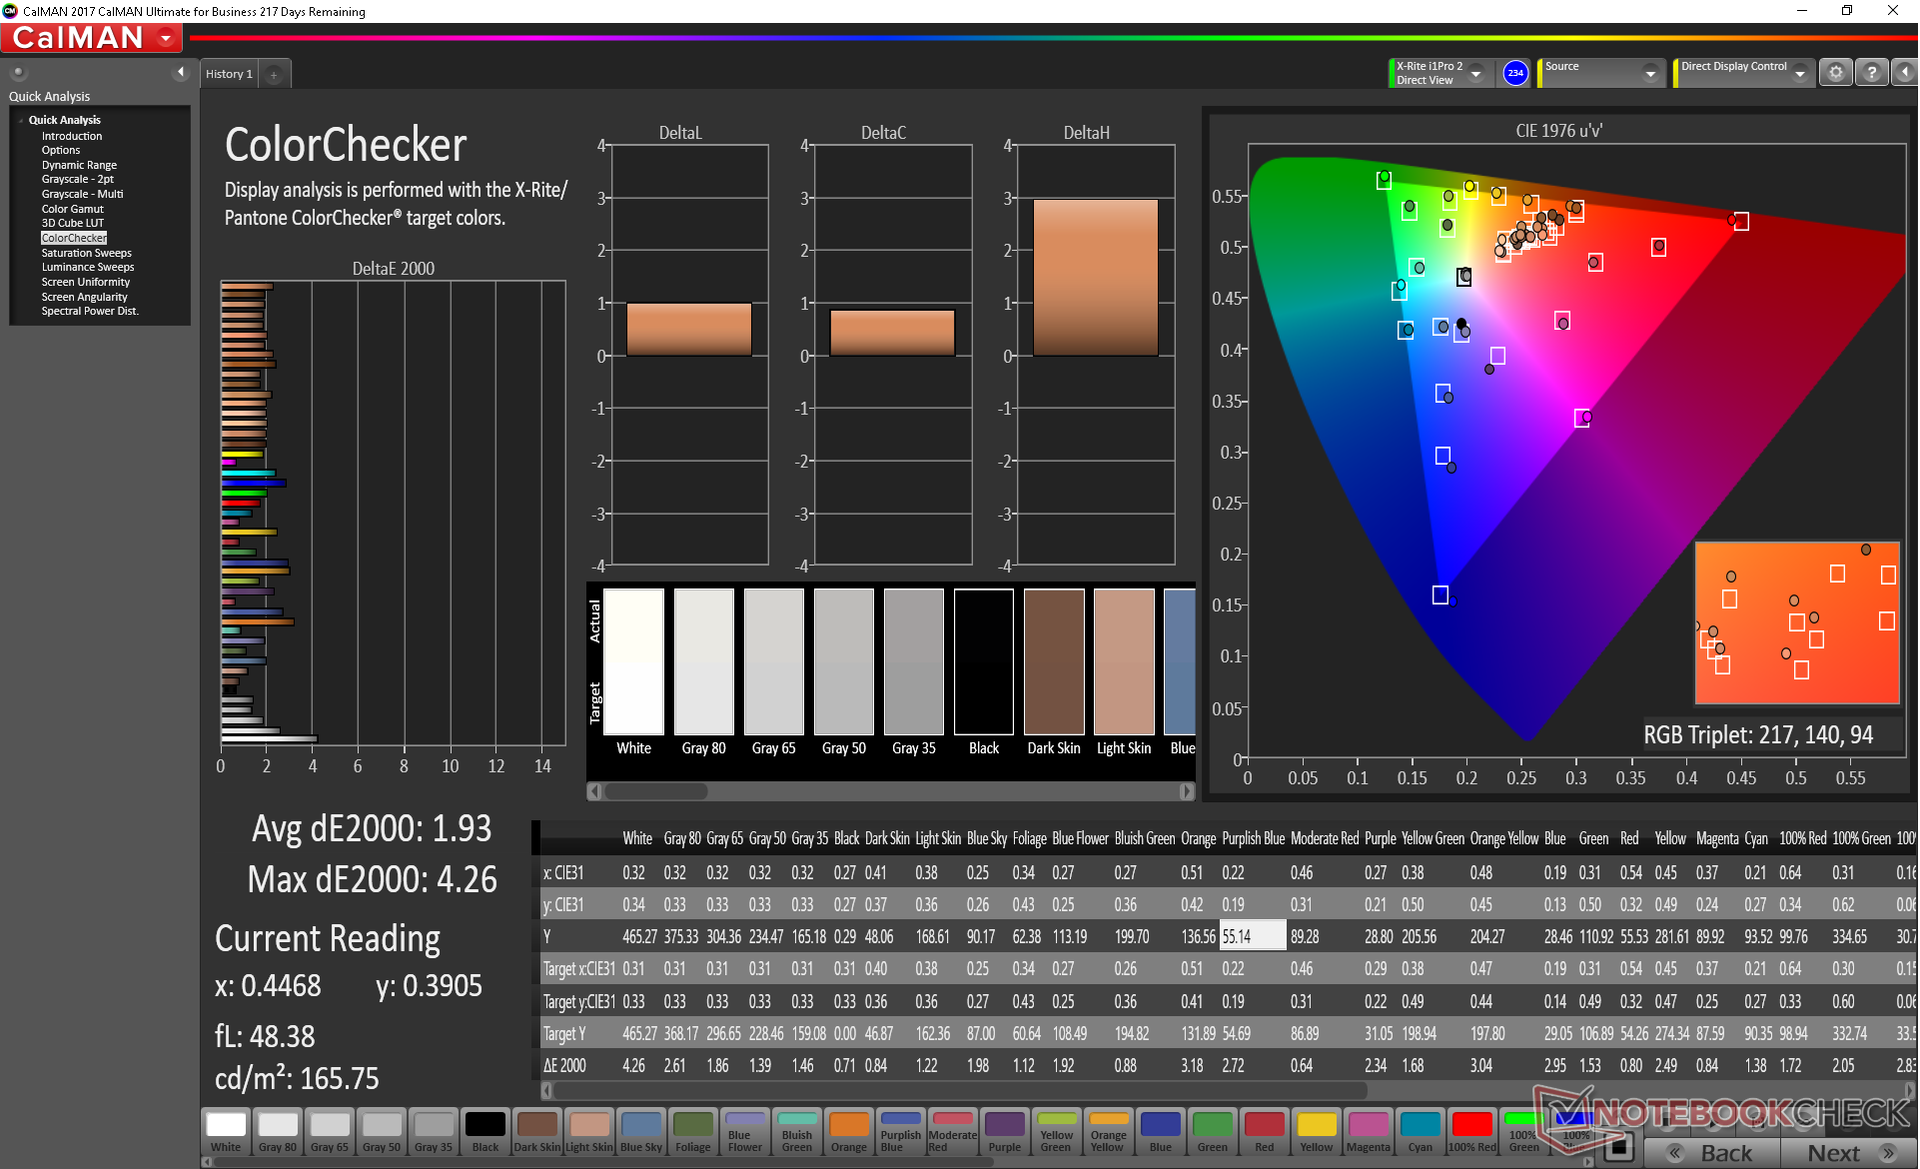
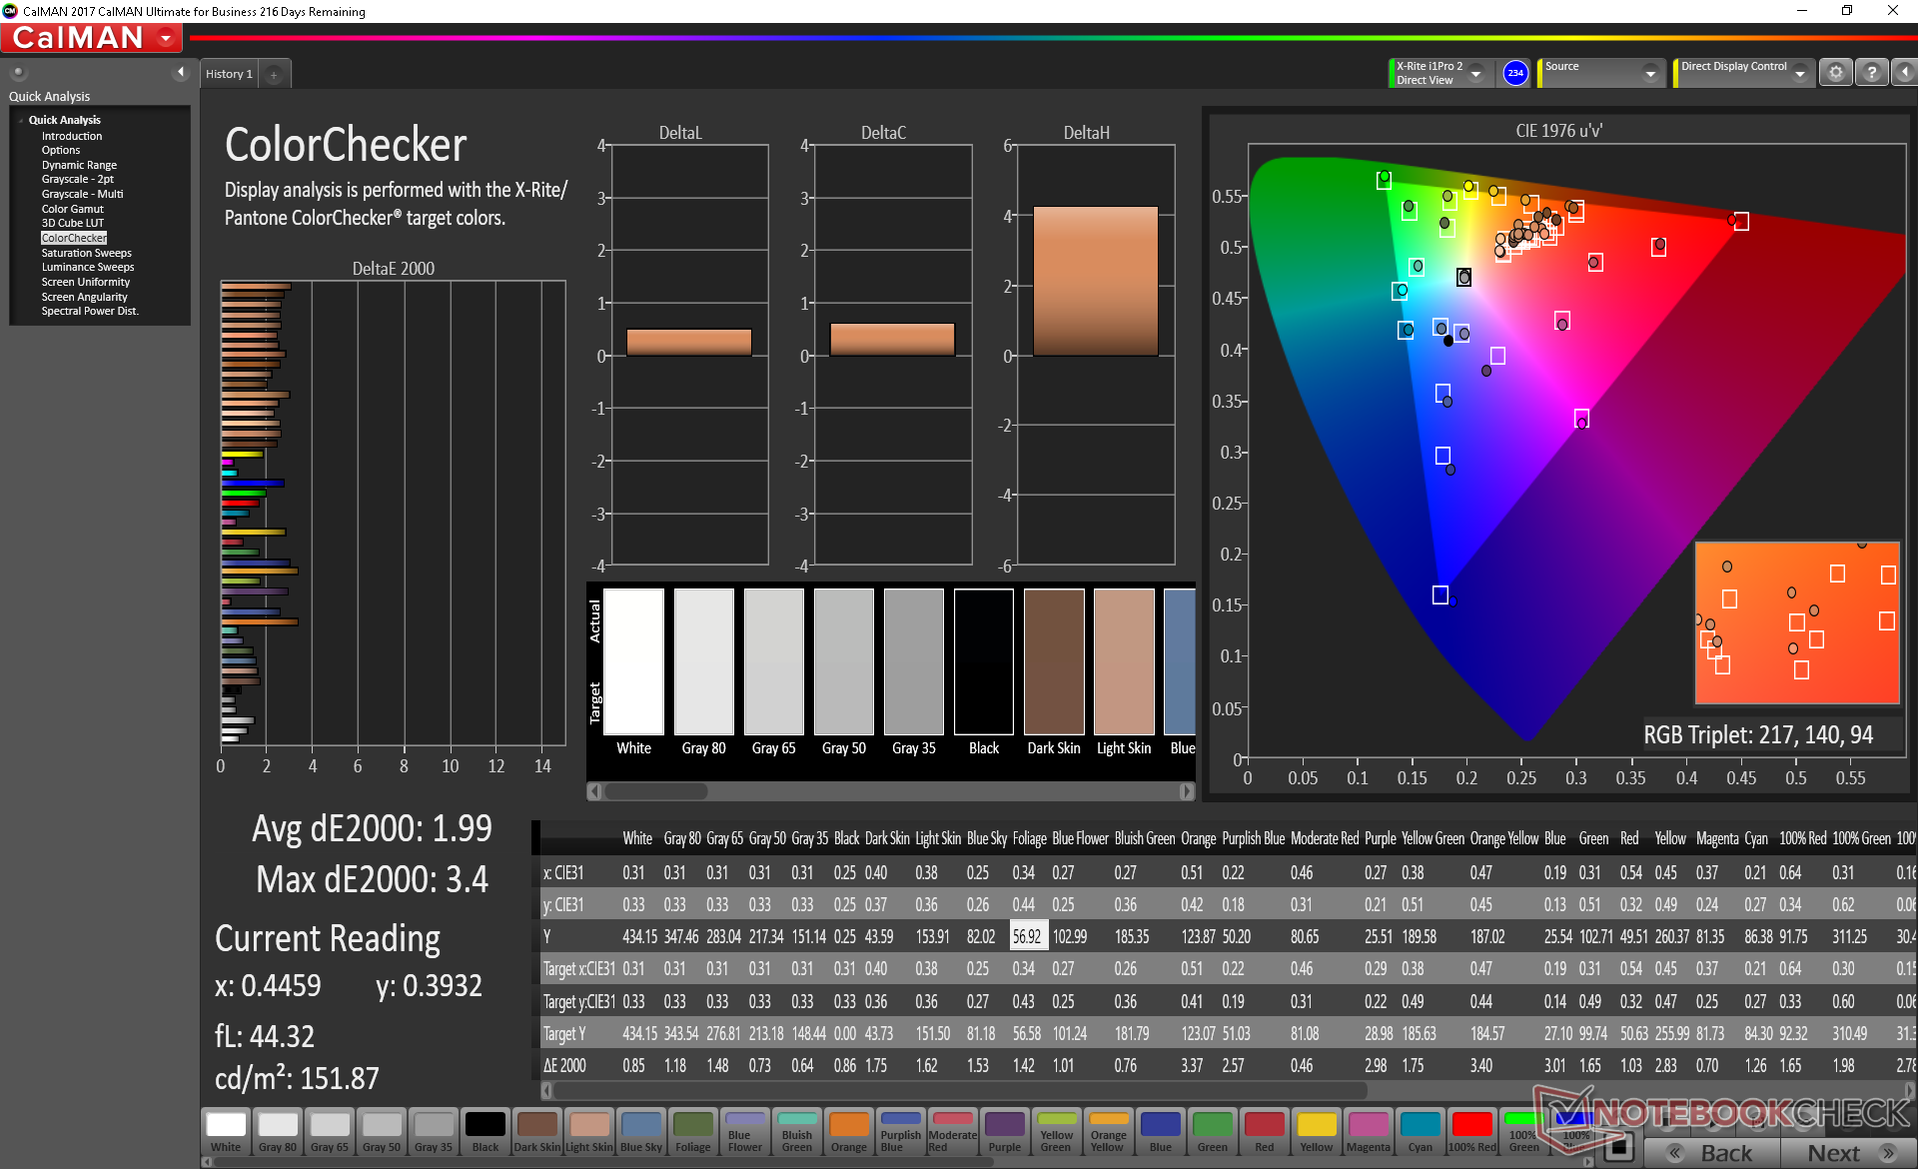
ΔE ColorChecker Calman: 1.93 | ∀{0.5-29.43 Ø4.71}
calibrated: 1.99
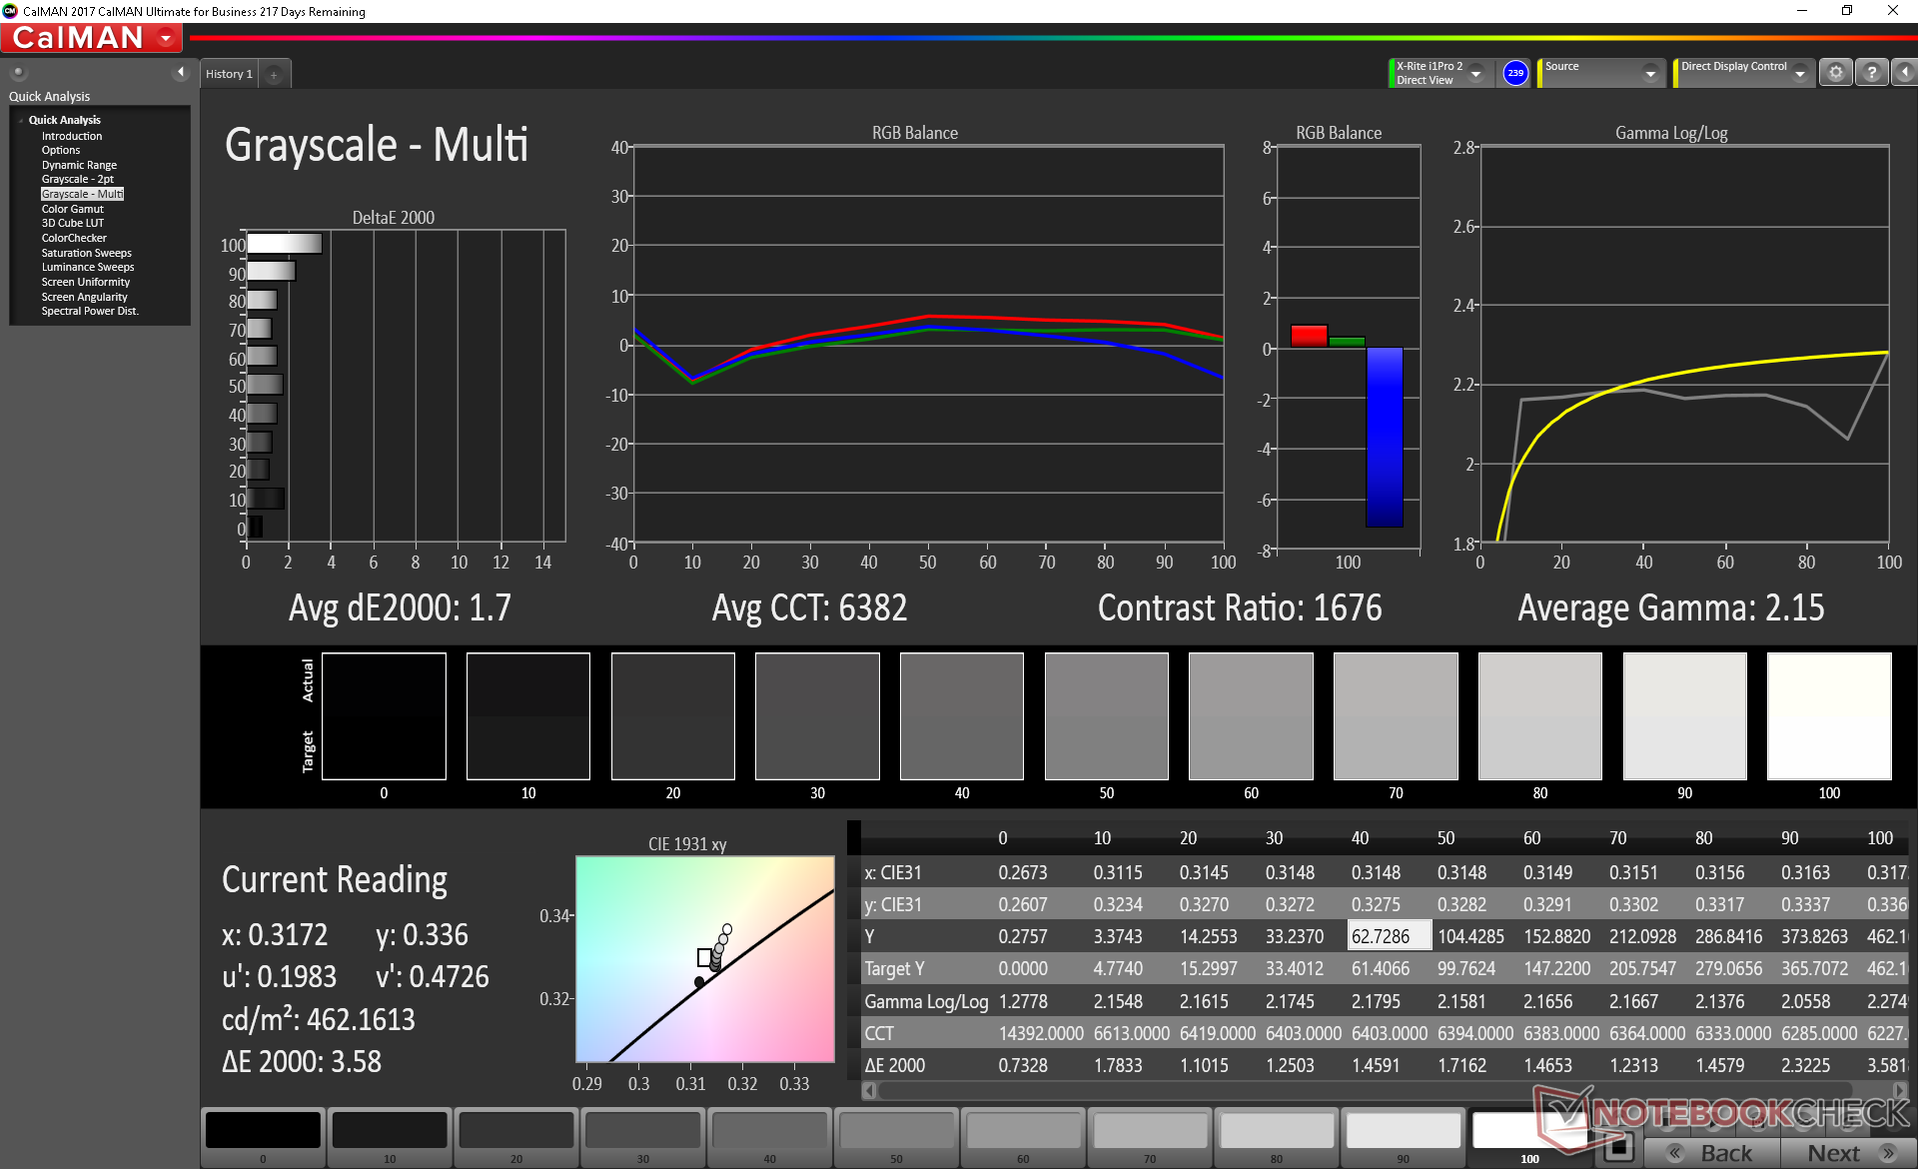
ΔE Greyscale Calman: 1.7 | ∀{0.09-98 Ø4.96}
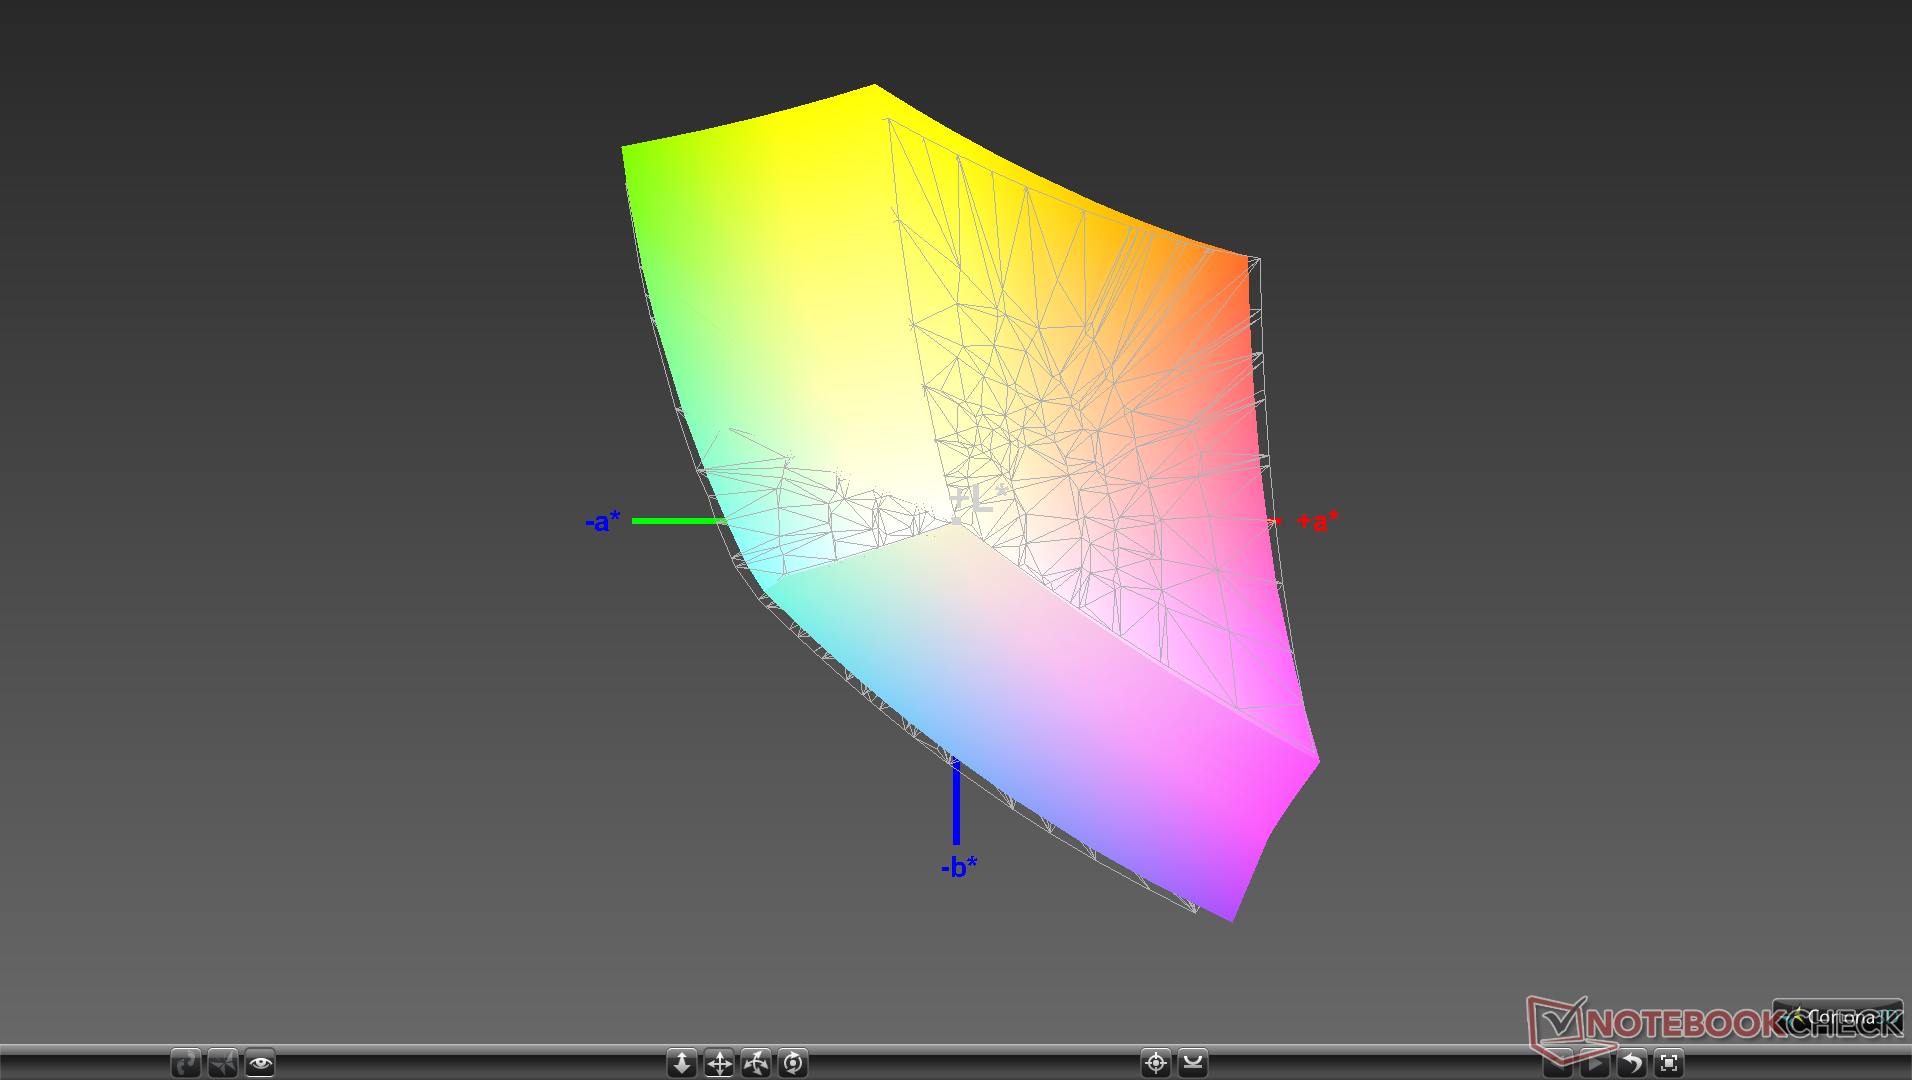
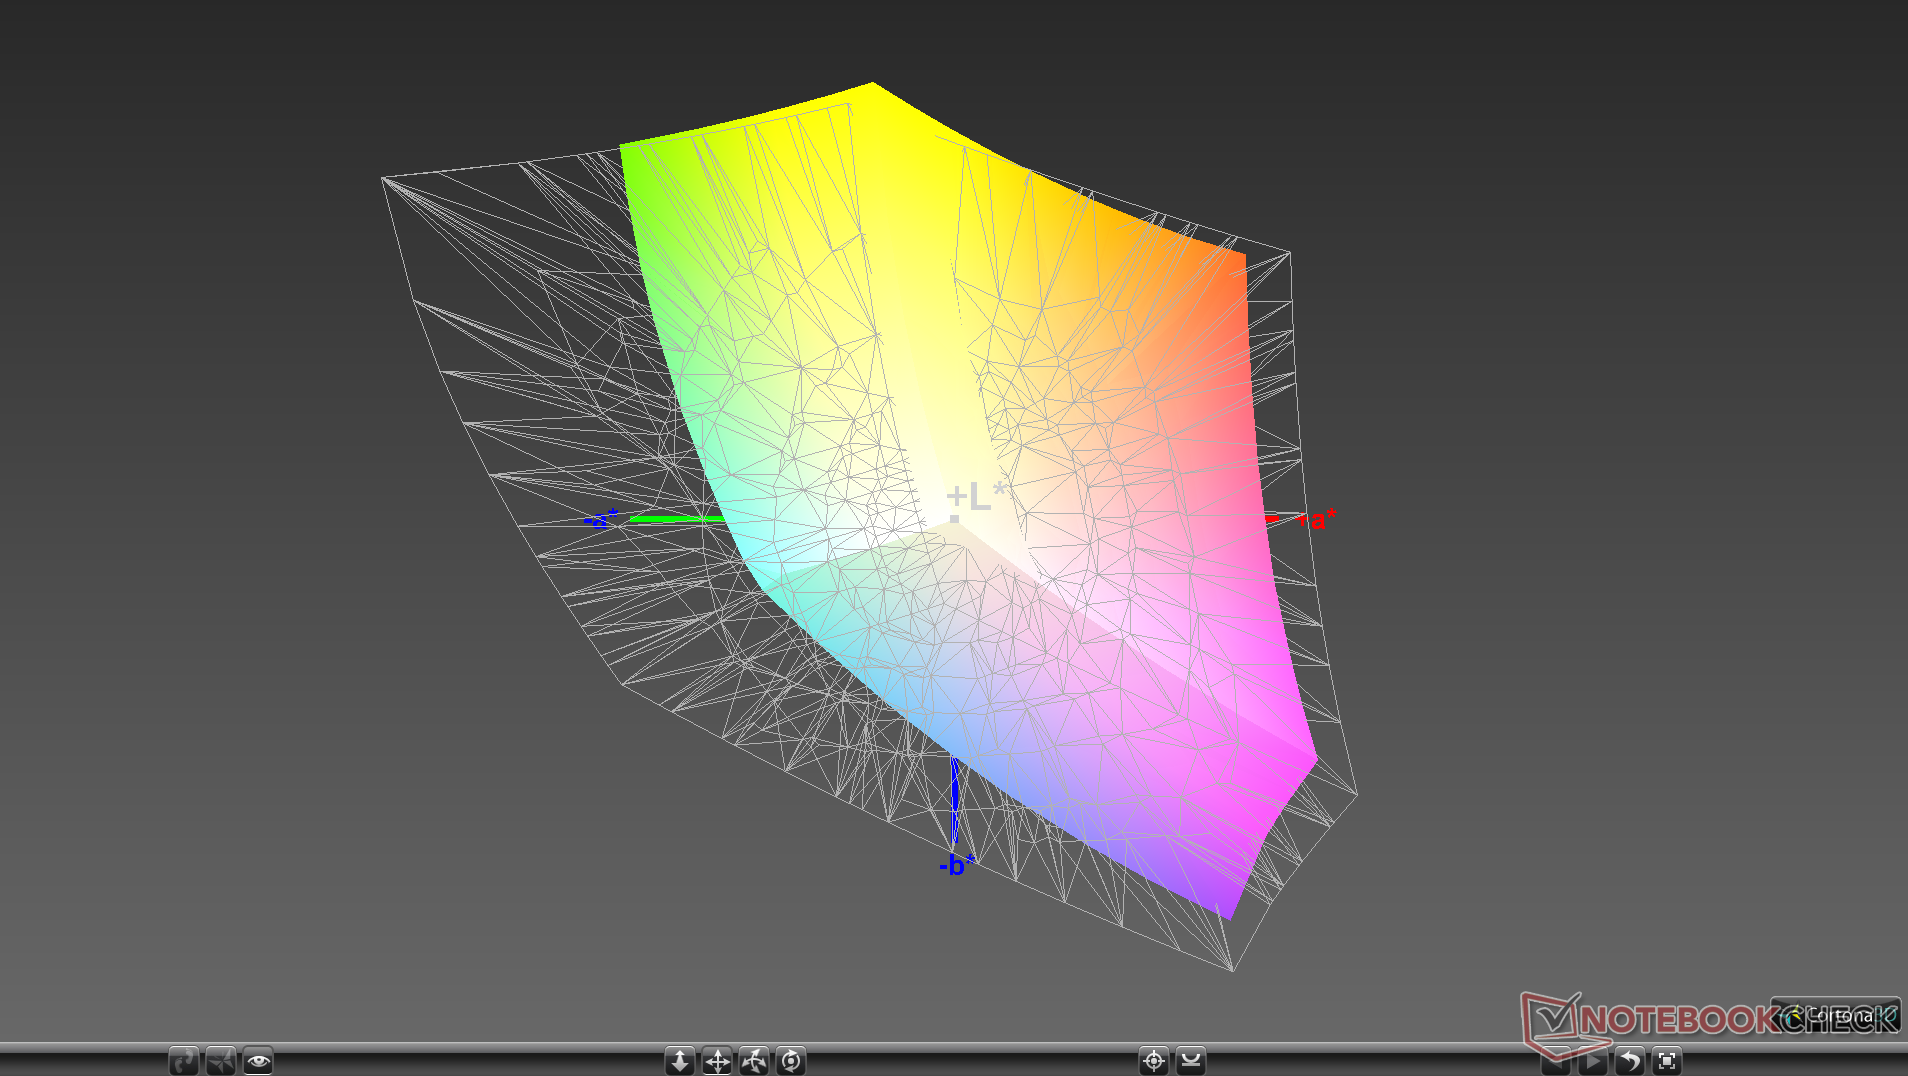
95.7% sRGB (Argyll 1.6.3 3D)
62.2% AdobeRGB 1998 (Argyll 1.6.3 3D)
69% AdobeRGB 1998 (Argyll 3D)
95.8% sRGB (Argyll 3D)
67.5% Display P3 (Argyll 3D)
Gamma: 2.15
CCT: 6382 K
| Asus ZenBook S13 UX392FN Tianma XM, IPS, 13.9", 1920x1080 | Dell XPS 13 9380 2019 ID: AUO 282B B133ZAN Dell: 90NTH, IPS, 13.3", 3840x2160 | Asus ZenBook S UX391U AUO B133HAN04.9, IPS, 13.3", 1920x1080 | Huawei Matebook X Pro i5 Tianma XM, IPS, 13.9", 3000x2000 | Lenovo Yoga C930-13IKB B139HAN03_0, IPS, 13.9", 1920x1080 | HP Spectre x360 13t-ae000 LGD0588, IPS, 13.3", 3840x2160 | Razer Blade Stealth i7-8565U Sharp LQ133M1JW41, IPS, 13.3", 1920x1080 | |
|---|---|---|---|---|---|---|---|
| Display | -4% | -6% | -2% | -3% | 5% | -2% | |
| Display P3 Coverage (%) | 67.5 | 64.7 -4% | 64.4 -5% | 65.9 -2% | 64.3 -5% | 71.9 7% | 65.5 -3% |
| sRGB Coverage (%) | 95.8 | 93.1 -3% | 90.5 -6% | 95.2 -1% | 94.6 -1% | 98.1 2% | 96.3 1% |
| AdobeRGB 1998 Coverage (%) | 69 | 65.3 -5% | 65.2 -6% | 67.6 -2% | 66.2 -4% | 73.1 6% | 66.3 -4% |
| Response Times | -34% | -7% | 6% | 2% | -20% | -30% | |
| Response Time Grey 50% / Grey 80% * (ms) | 47.2 ? | 58 ? -23% | 44.8 ? 5% | 40.4 ? 14% | 40.8 ? 14% | 51.6 ? -9% | 57.6 ? -22% |
| Response Time Black / White * (ms) | 24.8 ? | 36 ? -45% | 29.2 ? -18% | 25.6 ? -3% | 27.6 ? -11% | 32.4 ? -31% | 34 ? -37% |
| PWM Frequency (Hz) | 22730 ? | ||||||
| Screen | -37% | -58% | -48% | -82% | -14% | 8% | |
| Brightness middle (cd/m²) | 466 | 404 -13% | 299 -36% | 442.7 -5% | 316 -32% | 329.8 -29% | 429.8 -8% |
| Brightness (cd/m²) | 462 | 389 -16% | 300 -35% | 428 -7% | 291 -37% | 318 -31% | 403 -13% |
| Brightness Distribution (%) | 90 | 85 -6% | 92 2% | 84 -7% | 83 -8% | 74 -18% | 89 -1% |
| Black Level * (cd/m²) | 0.33 | 0.37 -12% | 0.26 21% | 0.31 6% | 0.36 -9% | 0.25 24% | 0.32 3% |
| Contrast (:1) | 1412 | 1092 -23% | 1150 -19% | 1428 1% | 878 -38% | 1319 -7% | 1343 -5% |
| Colorchecker dE 2000 * | 1.93 | 3.72 -93% | 5.6 -190% | 2.24 -16% | 5.9 -206% | 2.37 -23% | 1.08 44% |
| Colorchecker dE 2000 max. * | 4.26 | 7.38 -73% | 9.1 -114% | 7.19 -69% | 12.9 -203% | 4.08 4% | 3.96 7% |
| Colorchecker dE 2000 calibrated * | 1.99 | 2.06 -4% | 2.6 -31% | 1.11 44% | 1.3 35% | 1.21 39% | |
| Greyscale dE 2000 * | 1.7 | 4.44 -161% | 5.5 -224% | 9.7 -471% | 8.6 -406% | 2.8 -65% | 1.3 24% |
| Gamma | 2.15 102% | 2.34 94% | 2.47 89% | 1.42 155% | 2.1 105% | 2.145 103% | 2.23 99% |
| CCT | 6382 102% | 7095 92% | 7533 86% | 6227 104% | 6854 95% | 6441 101% | 6452 101% |
| Color Space (Percent of AdobeRGB 1998) (%) | 62.2 | 60 -4% | 58.9 -5% | 61.6 -1% | 60.7 -2% | 67 8% | 61.4 -1% |
| Color Space (Percent of sRGB) (%) | 95.7 | 93 -3% | 90.3 -6% | 95 -1% | 94.5 -1% | 98 2% | 96.3 1% |
| Total Average (Program / Settings) | -25% /
-31% | -24% /
-42% | -15% /
-33% | -28% /
-57% | -10% /
-11% | -8% /
2% |
* ... smaller is better
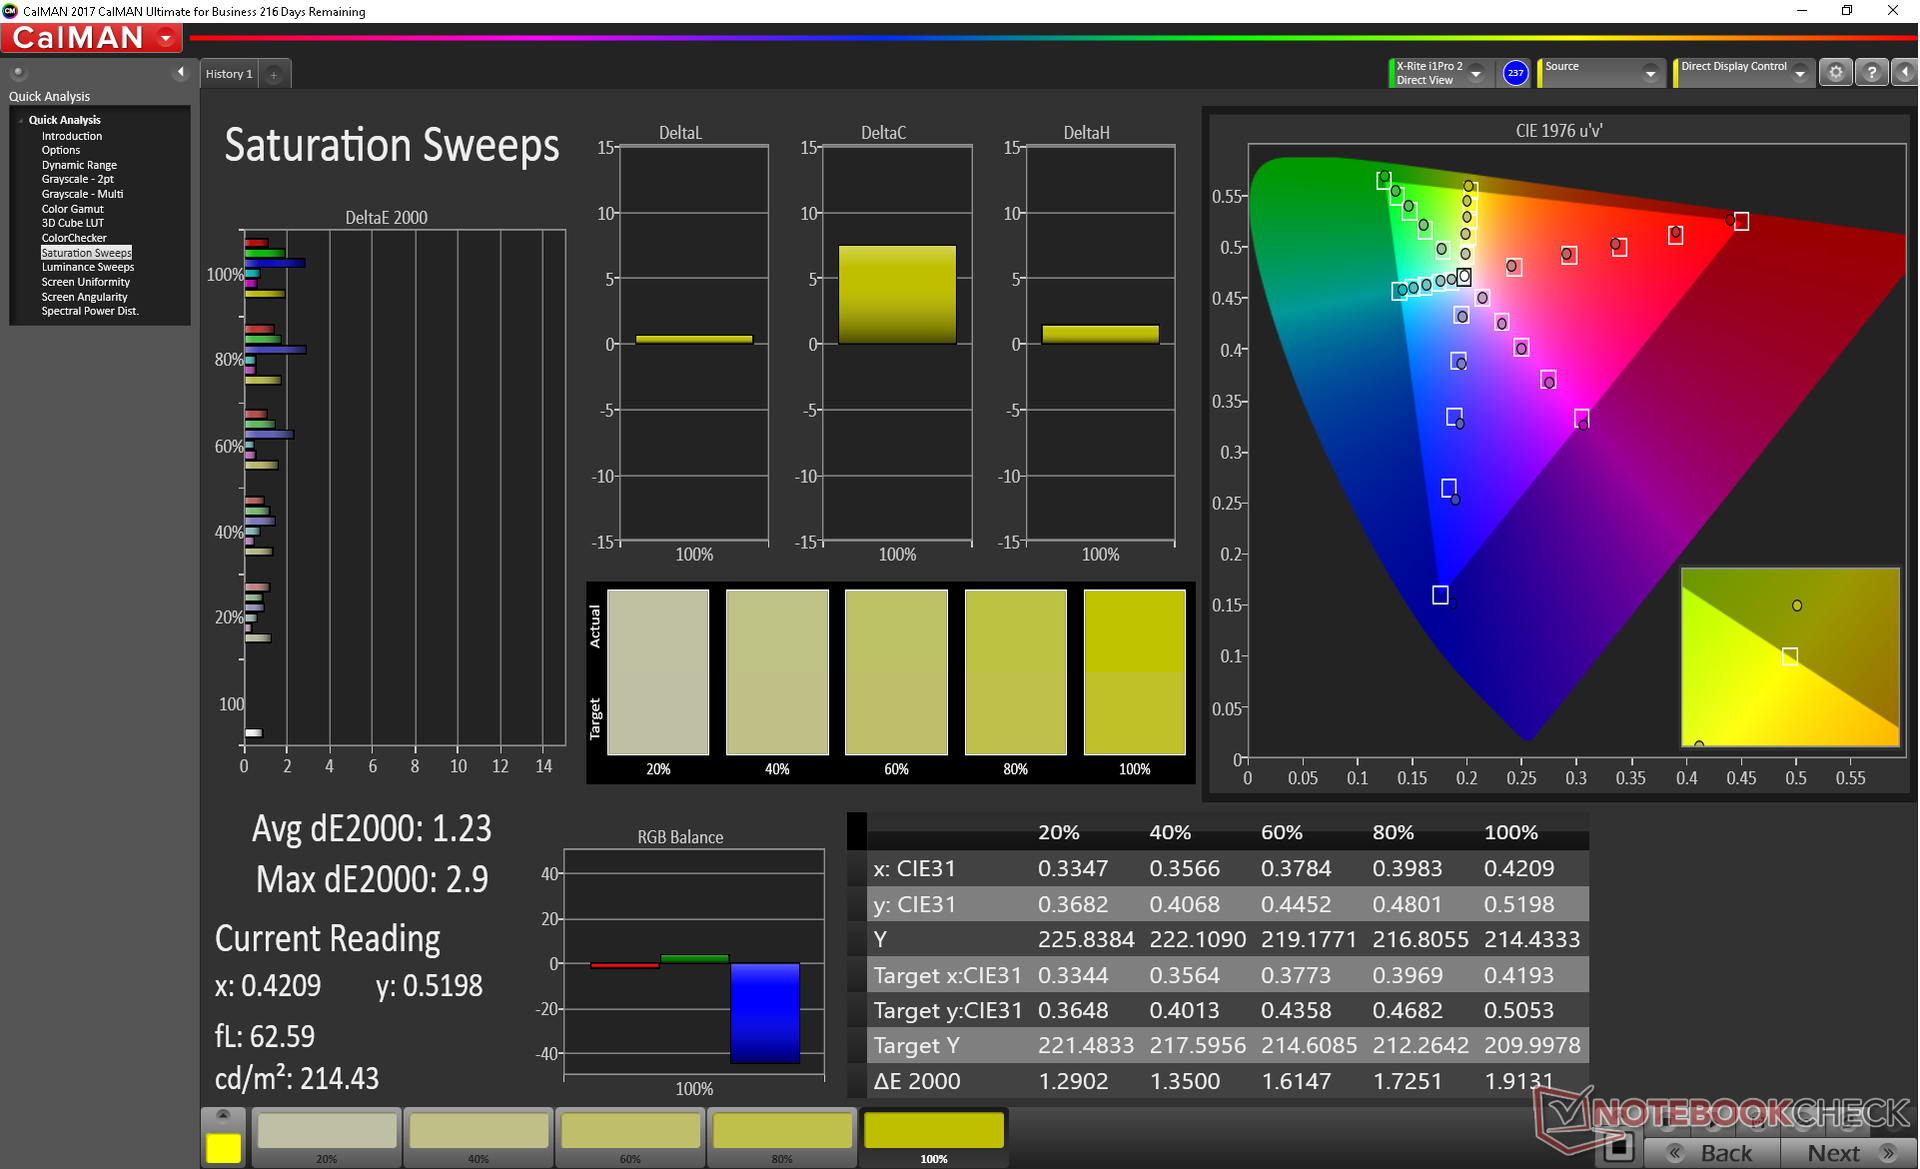
Color space covers sRGB almost entirely and 62 percent of the wider AdobeRGB standard. Results are a slight improvement over last year's UX391 and they are comparable to the displays of other flagship Ultrabooks including the HP Spectre x360 13 and Razer Blade Stealth. Graphic artists who demand an even wider color gamut may want to consider the larger ZenBook Pro UX580 series instead.
Further measurements with an X-Rite colorimeter reveal a surprisingly accurate display out of the box. Average Grayscale and color deltaE values sit at just 1.7 and 1.93, respectively, compared to over 5 on the last generation UX391. Our own attempts to calibrate the display improves both grayscale and gamma just barely. As such, an end-user calibration is not imperative since the display is already very accurate before any calibration.

Display Response Times
| ↔ Response Time Black to White | ||
|---|---|---|
| 24.8 ms ... rise ↗ and fall ↘ combined | ↗ 14 ms rise | 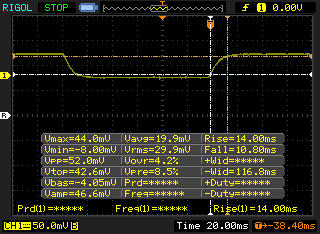 |
| ↘ 10.8 ms fall | ||
| The screen shows good response rates in our tests, but may be too slow for competitive gamers. In comparison, all tested devices range from 0.1 (minimum) to 240 (maximum) ms. » 58 % of all devices are better. This means that the measured response time is worse than the average of all tested devices (19.8 ms). | ||
| ↔ Response Time 50% Grey to 80% Grey | ||
| 47.2 ms ... rise ↗ and fall ↘ combined | ↗ 23.6 ms rise | 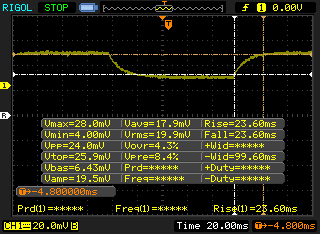 |
| ↘ 23.6 ms fall | ||
| The screen shows slow response rates in our tests and will be unsatisfactory for gamers. In comparison, all tested devices range from 0.165 (minimum) to 636 (maximum) ms. » 82 % of all devices are better. This means that the measured response time is worse than the average of all tested devices (31 ms). | ||
Screen Flickering / PWM (Pulse-Width Modulation)
| Screen flickering / PWM not detected | 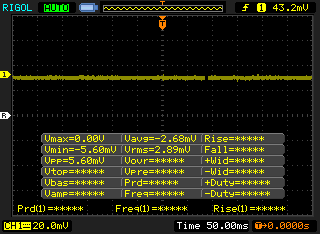 | ||
In comparison: 52 % of all tested devices do not use PWM to dim the display. If PWM was detected, an average of 7754 (minimum: 5 - maximum: 343500) Hz was measured. | |||
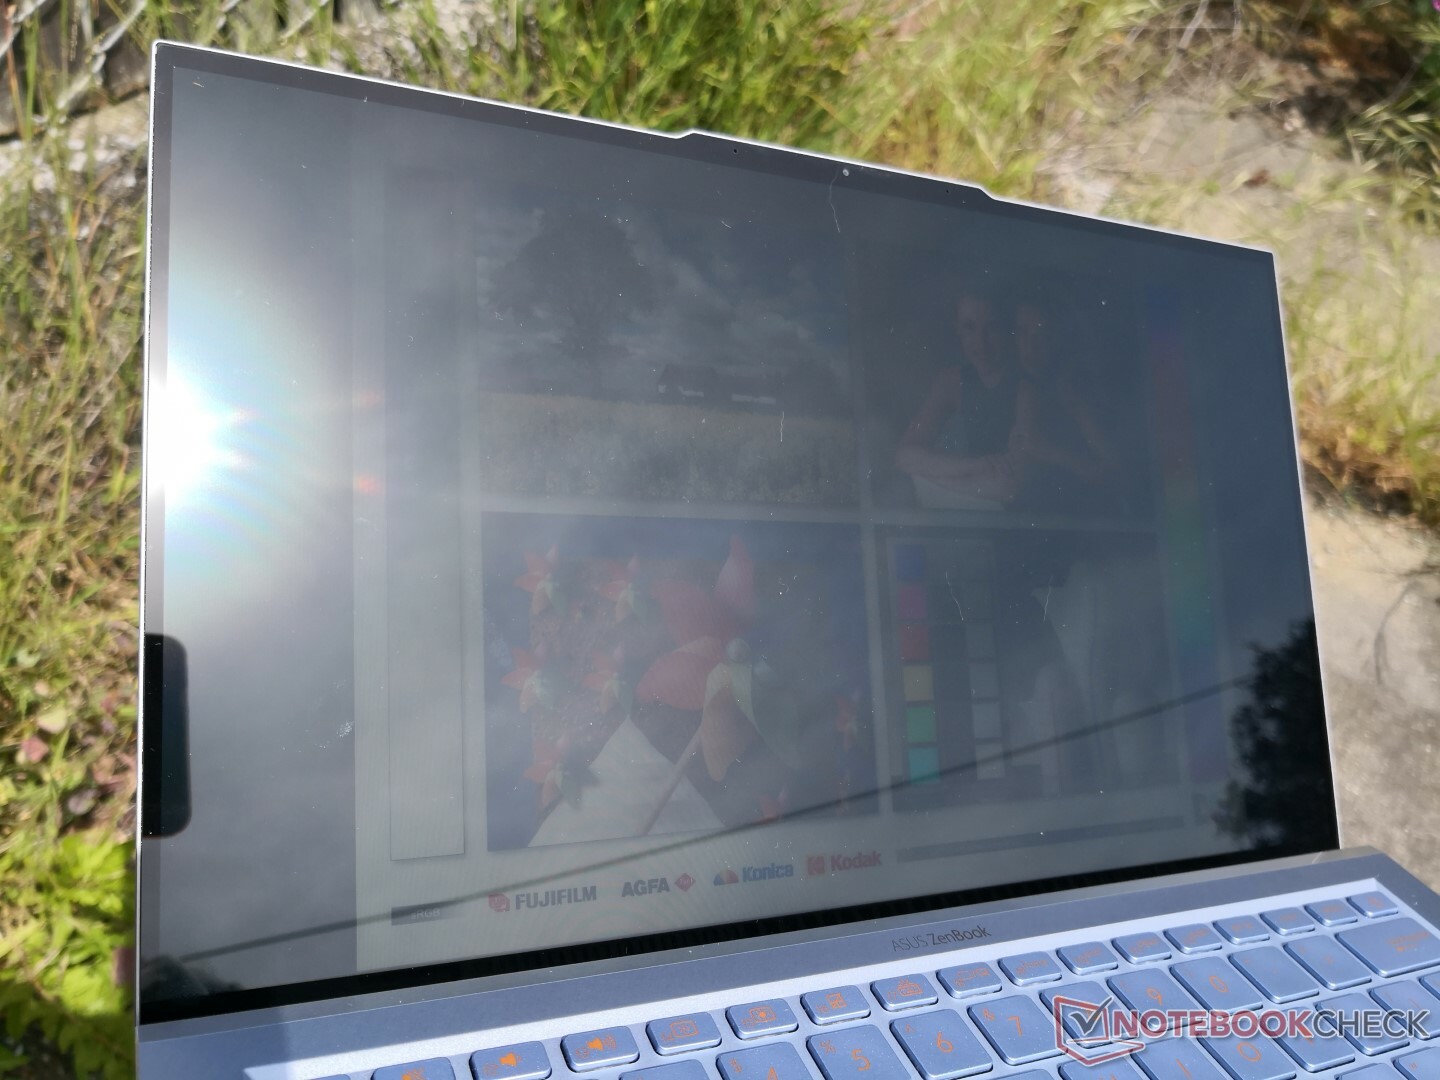
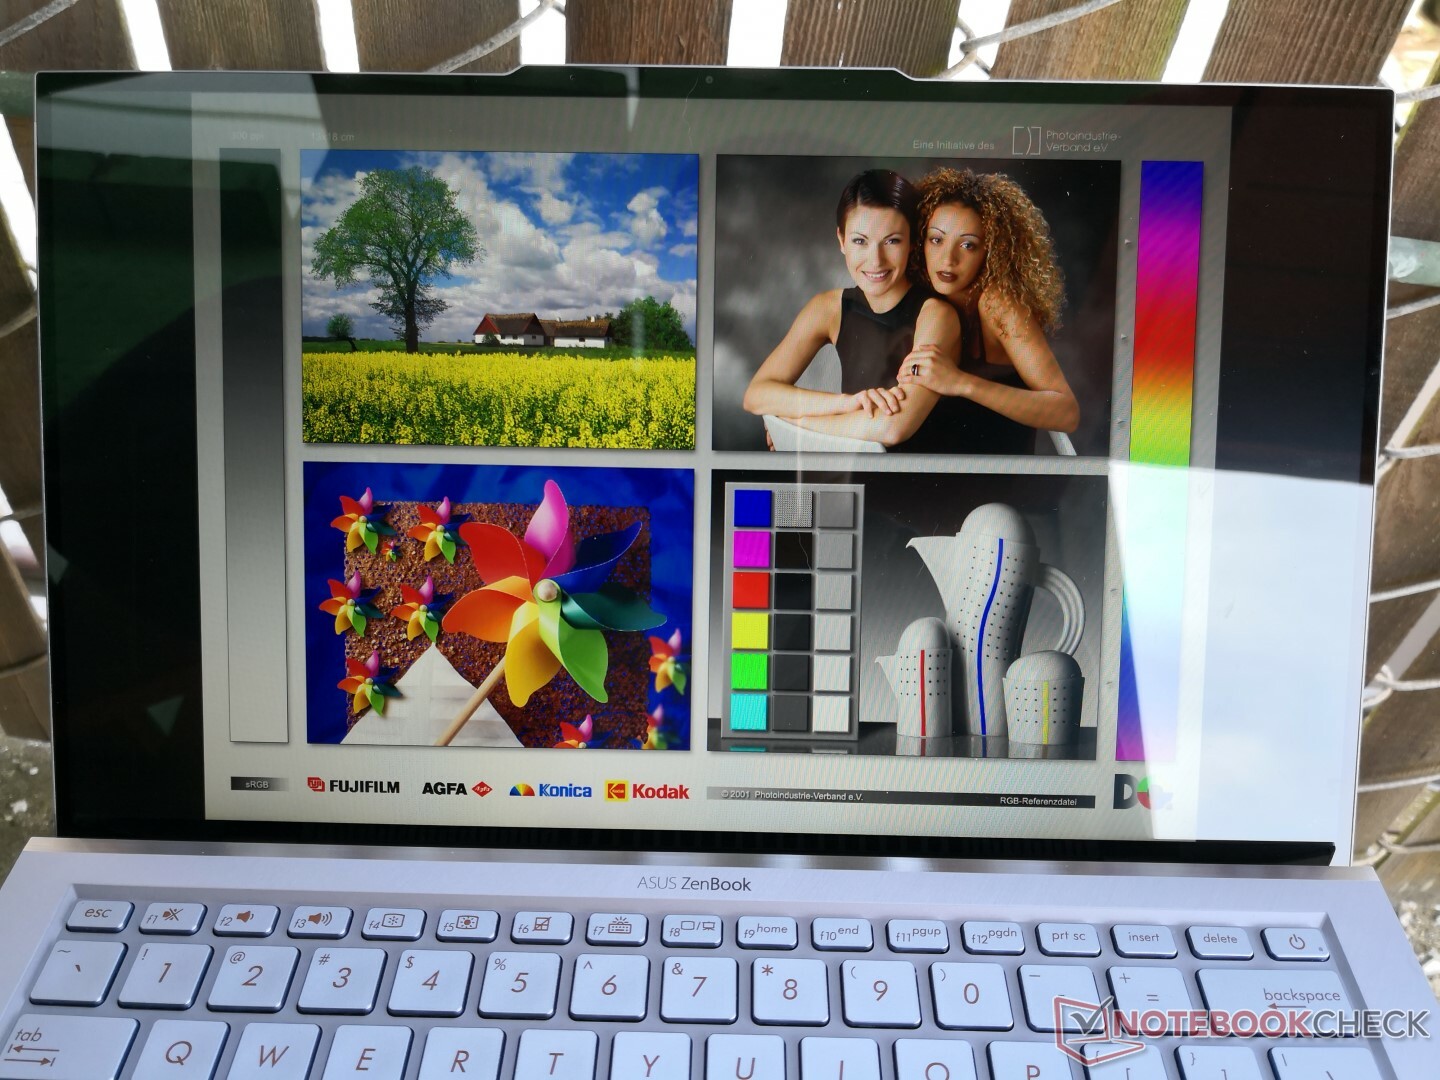
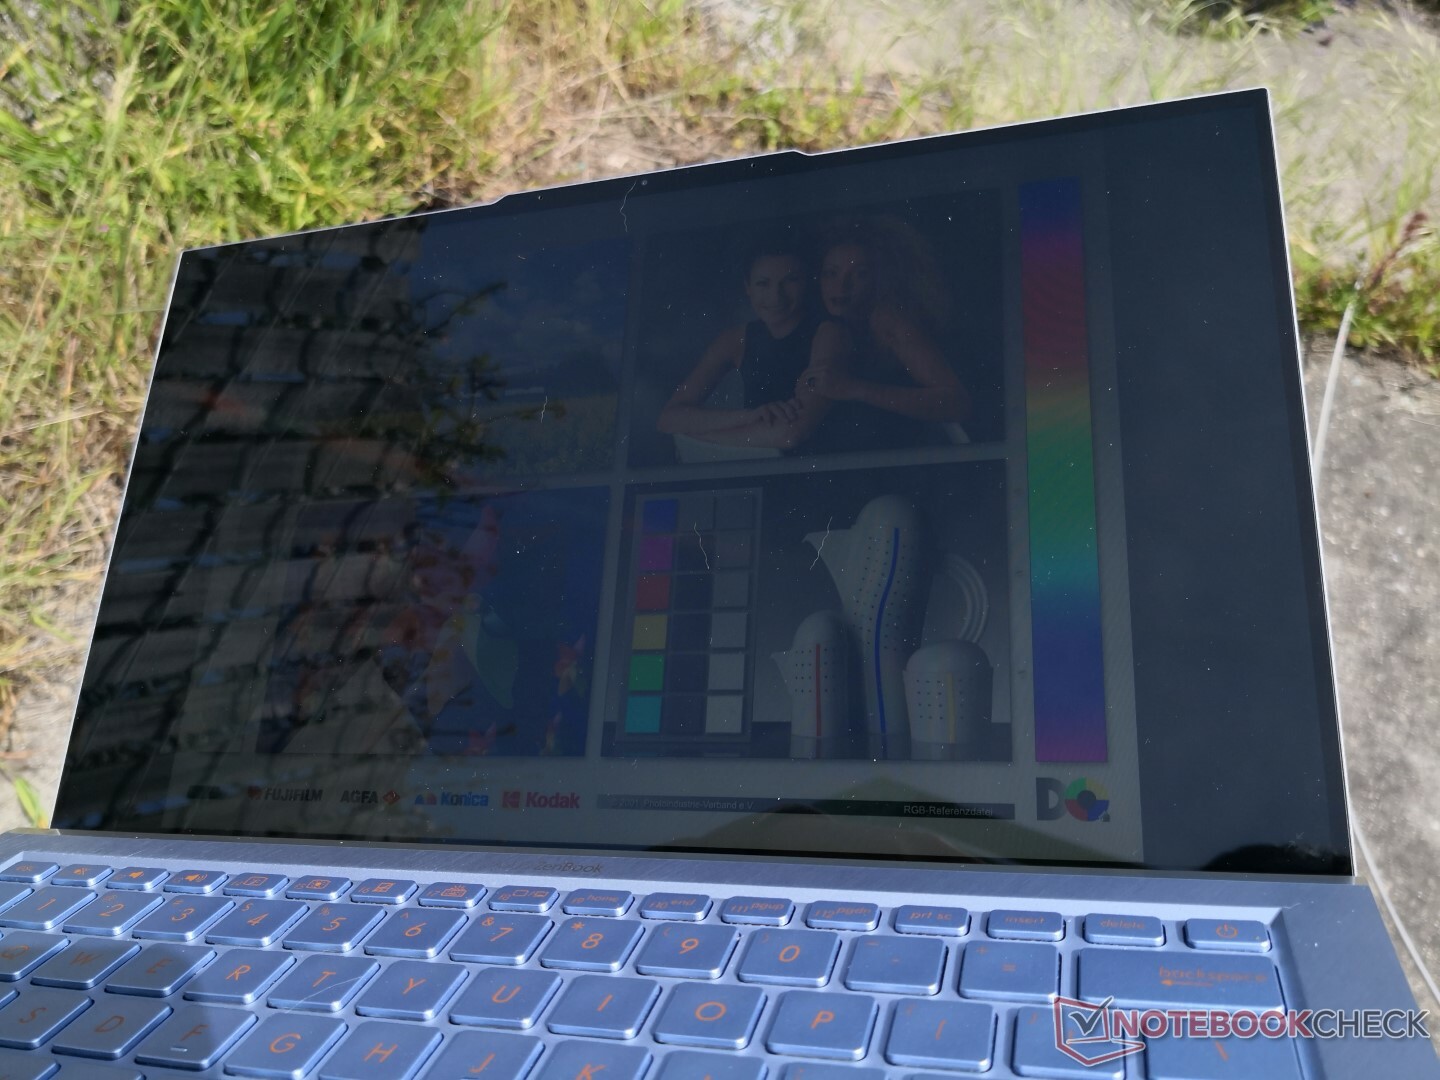
Outdoor visibility is good when under shade because of the bright backlight. Its very glossy screen, however, will become apparent. Be prepared to fight the inevitable glare and adjust the display angle frequently especially when under bright ambient conditions.
Performance
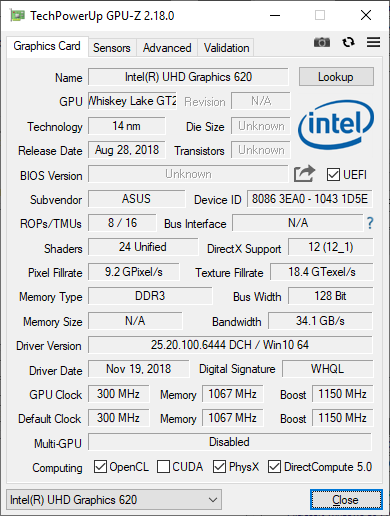
Current SKUs are limited to the Core i5-8265U or Core i7-8565U with optional GeForce MX150 graphics. While its Whiskey Lake-U CPU options are newer than the Kaby Lake-R options on last year's UX391, raw processor performance is very similar between the two generations as our benchmarks below will show.
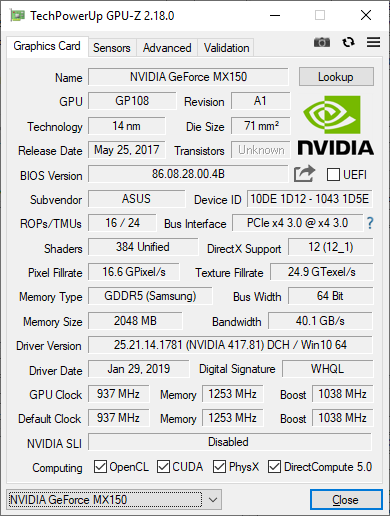
As suspected, the GeForce MX150 in the UX392 is the slower 10 W '1D12' variant compared to the faster 25 W '1D10' variant on the Razer Blade Stealth. VRAM has also been halved on the Asus from 4 GB GDDR5 on the Razer to just 2 GB. This isn't a surprise considering that previous generation ZenBooks are also equipped with the slower '1D12' GeForce MX150.
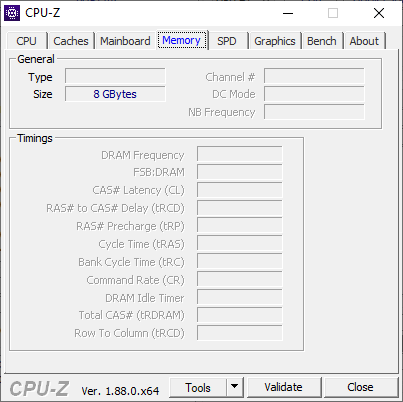
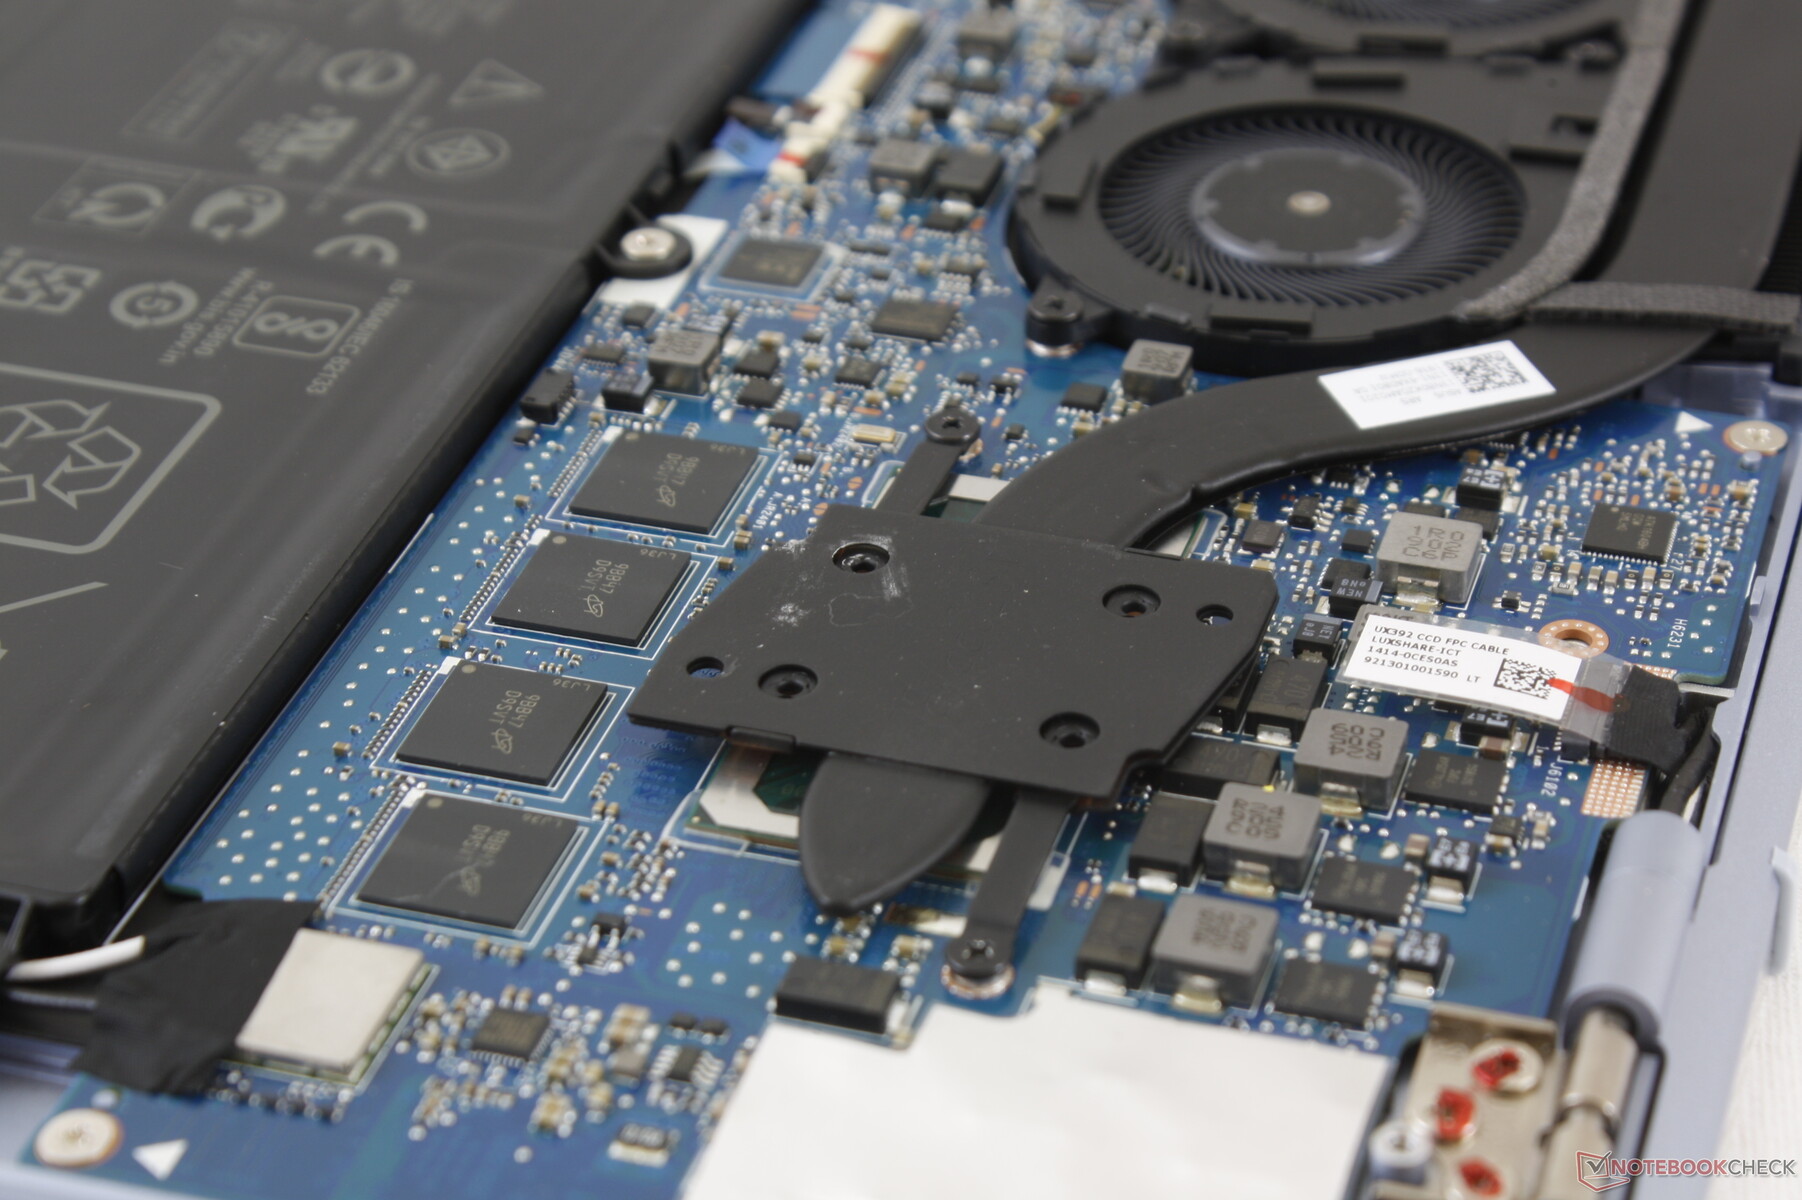
RAM is non-upgradeable and fixed at dual-channel 8 GB or 16 GB LPDDR3 2133 MHz.
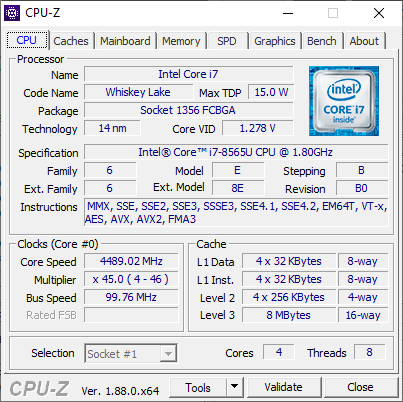
Processor
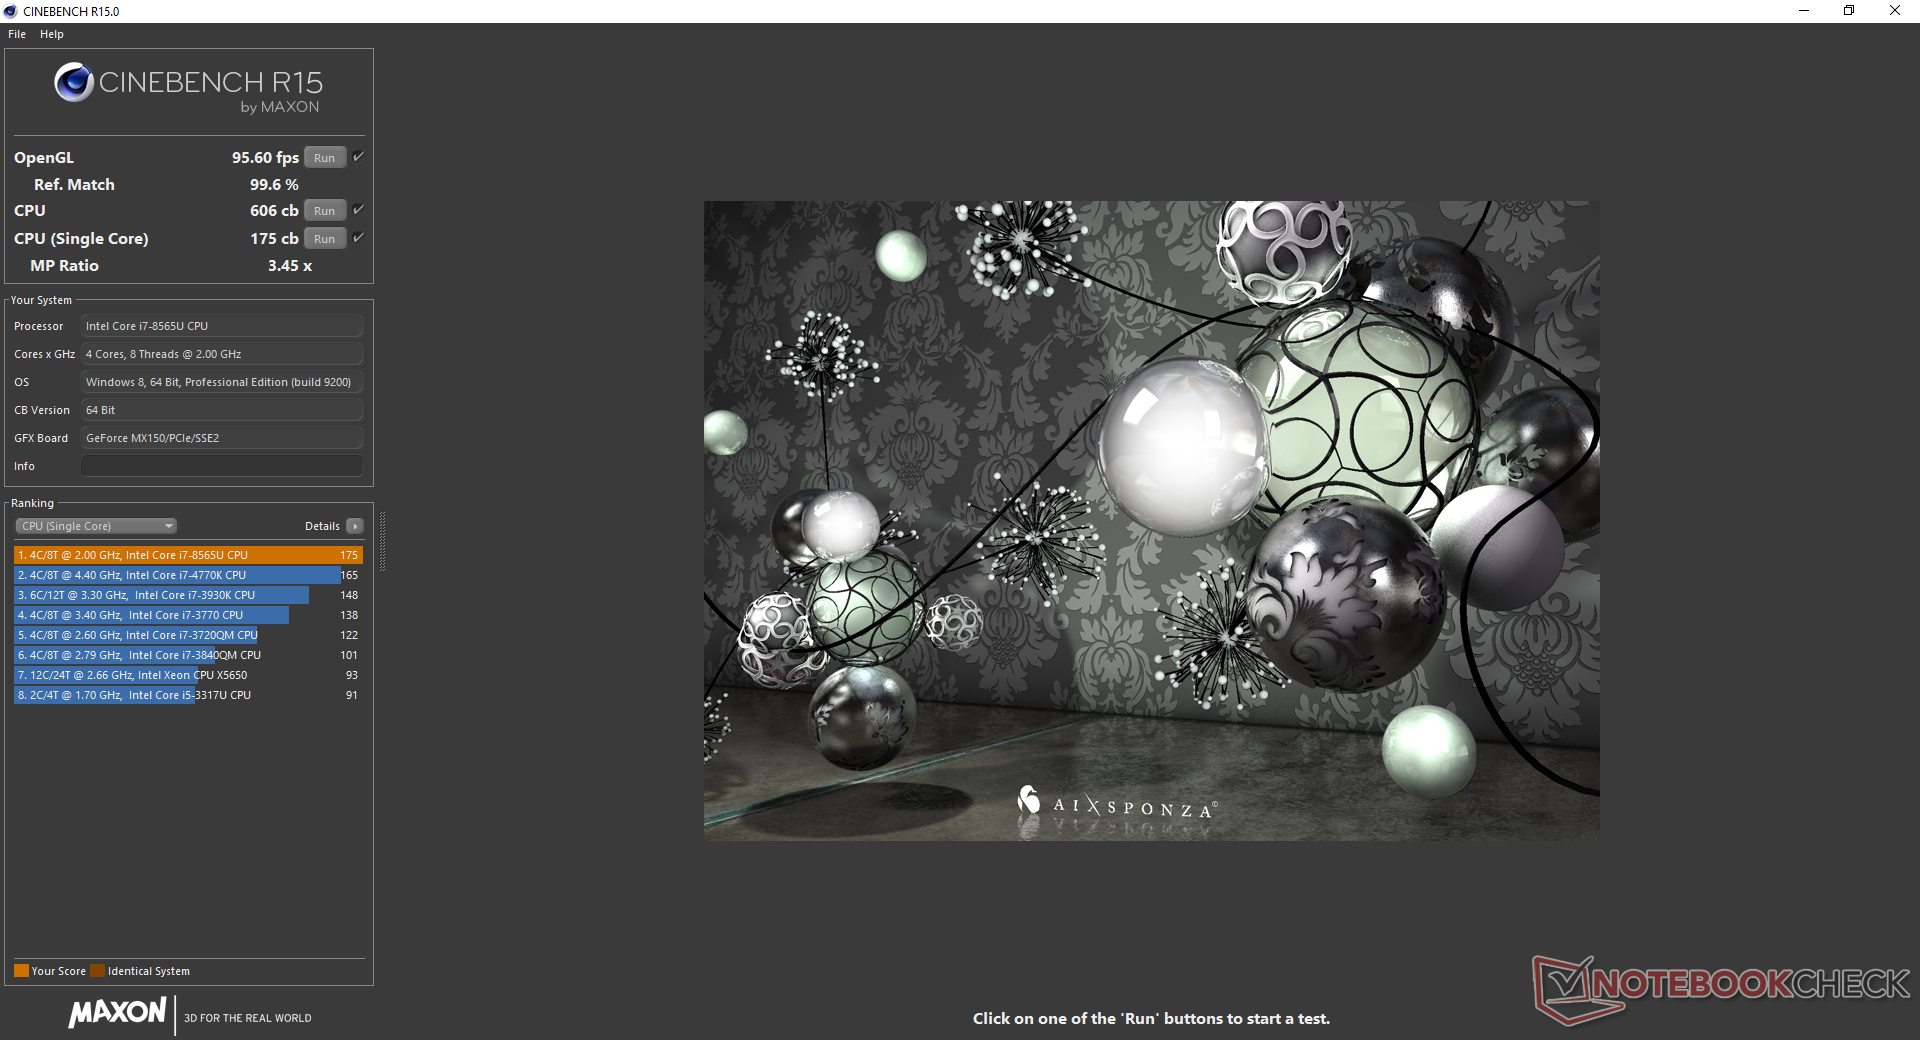
CineBench results are within 3 percent of the average Core i7-8565U in our database taken from a sample size of 23 other laptops. In truth, however, this is barely any faster than the last generation Kaby Lake-R Core i7-8550U that the i7-8565U directly replaces. The older Asus UX430 with the i7-8550U, for example, scores just 3 to 6 percent slower than our UX392 and even other laptops with the less expensive Core i5-8265U show similar results. We recommend going with the Core i5-8265U configuration if possible as the performance difference will be minuscule at best.
Performance over time is slightly below expectations. By running CineBench R15 Multi-Thread in a loop, we can observe that CPU performance dips more sharply than on other laptops equipped with a Core i7-class CPU like the Huawei MateBook 13 or Dell XPS 13. The initial score of 728 points drops to 495 points after two loops to represent a steep dip of 32 percent. In other words, Intel Turbo Boost starts out strong before it eventually fizzles after a minute or so. This is further explored in our Stress Test section below.
See our dedicated page on the Core i7-8565U for more technical information and benchmark comparisons.
| Cinebench R10 | |
| Rendering Multiple CPUs 32Bit | |
| Dell XPS 13 9370 i7 UHD | |
| Average Intel Core i7-8565U (13806 - 23118, n=16) | |
| Huawei Matebook X Pro i5 | |
| HP x2 210 G2 | |
| Rendering Single 32Bit | |
| Average Intel Core i7-8565U (2682 - 8906, n=16) | |
| Dell XPS 13 9370 i7 UHD | |
| Huawei Matebook X Pro i5 | |
| HP x2 210 G2 | |
| wPrime 2.10 - 1024m | |
| Lenovo ThinkPad 13 20J1005TPB | |
| Dell XPS 13 9370 i7 UHD | |
| Average Intel Core i7-8565U (263 - 420, n=7) | |
| Huawei Matebook X Pro i5 | |
* ... smaller is better
System Performance
PCMark benchmarks rank our UX392 consistently ahead of the last generation UX391 and even the Asus Zenbook 14 UX433FN equipped with the same CPU and GPU. In reality, however, the differences in scores are just a few percentage points on average and so users won't even notice any day-to-day performance benefits that Whiskey Lake-U can offer over Kaby Lake-R. The notable exception is the GeForce MX150 GPU which is significantly faster than the UHD Graphics 620 solution in the UX391 for digital content creation.
We experienced no software or hardware issues during our time with the UX392 test unit.
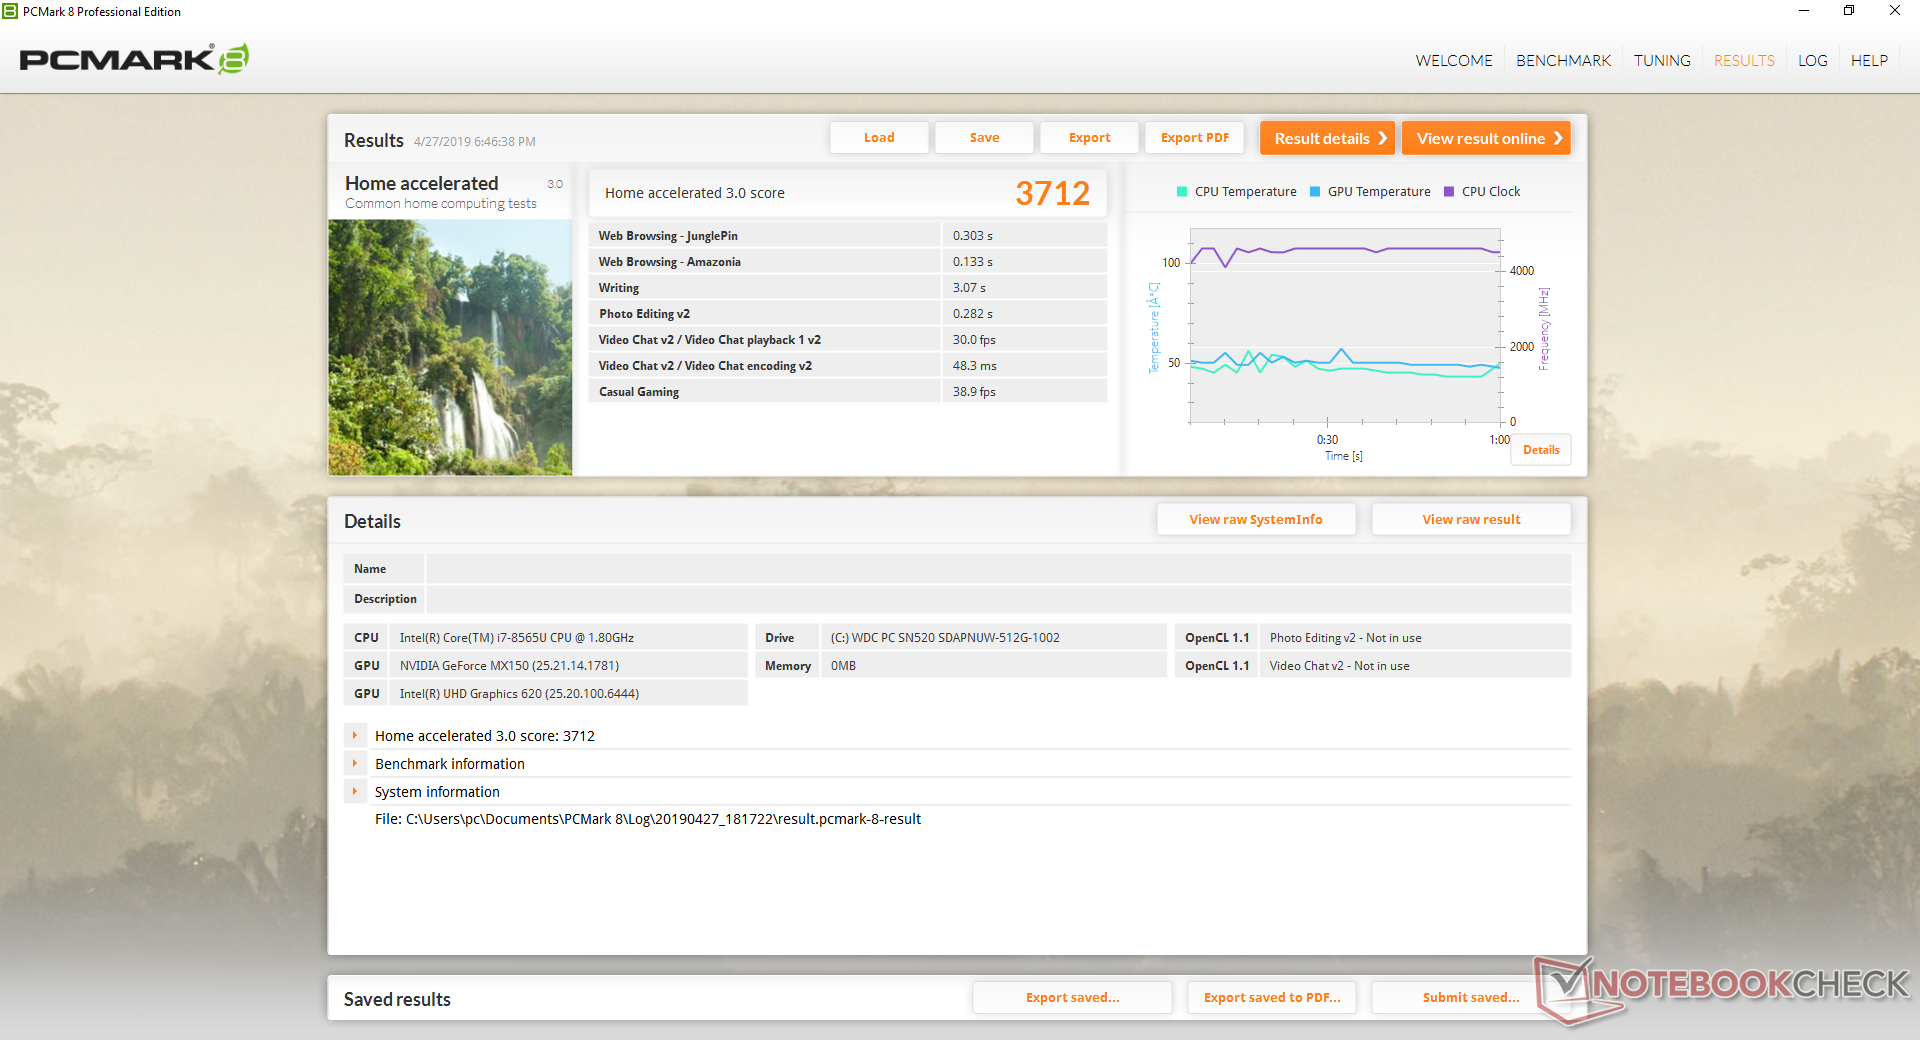
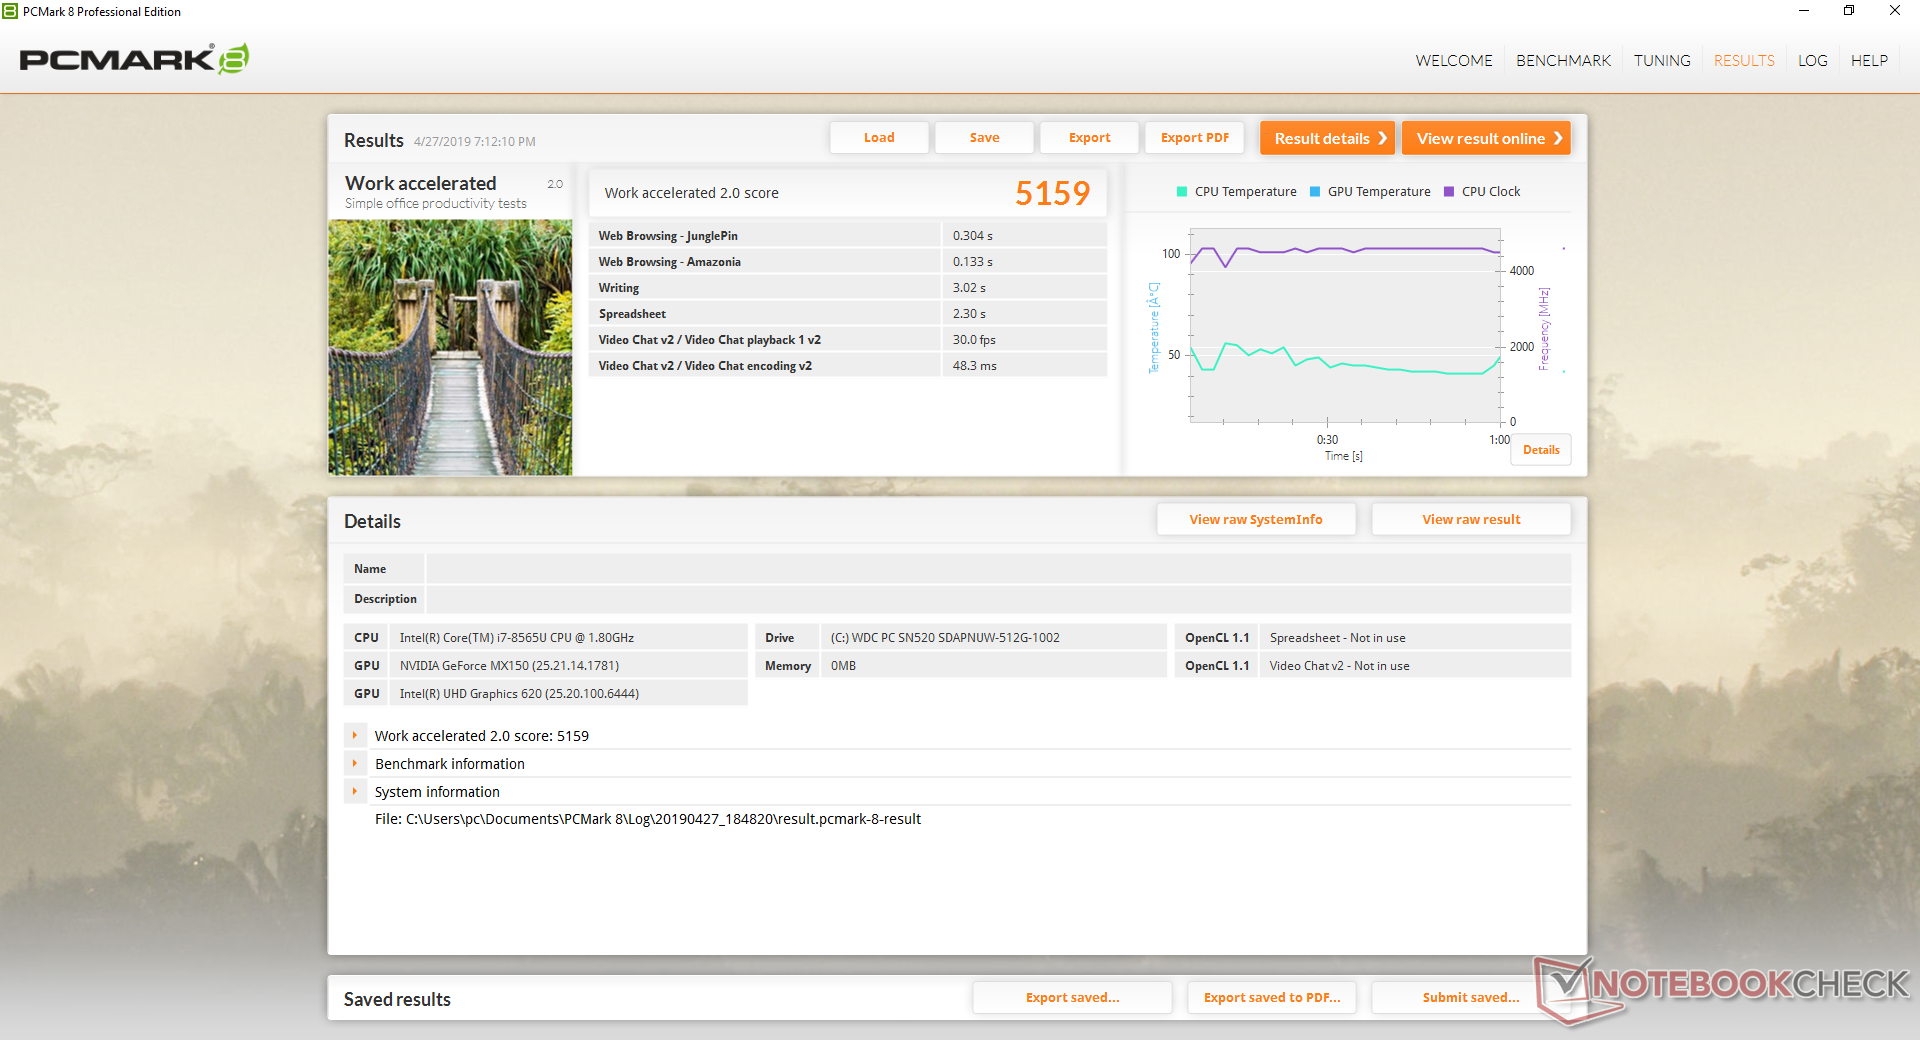
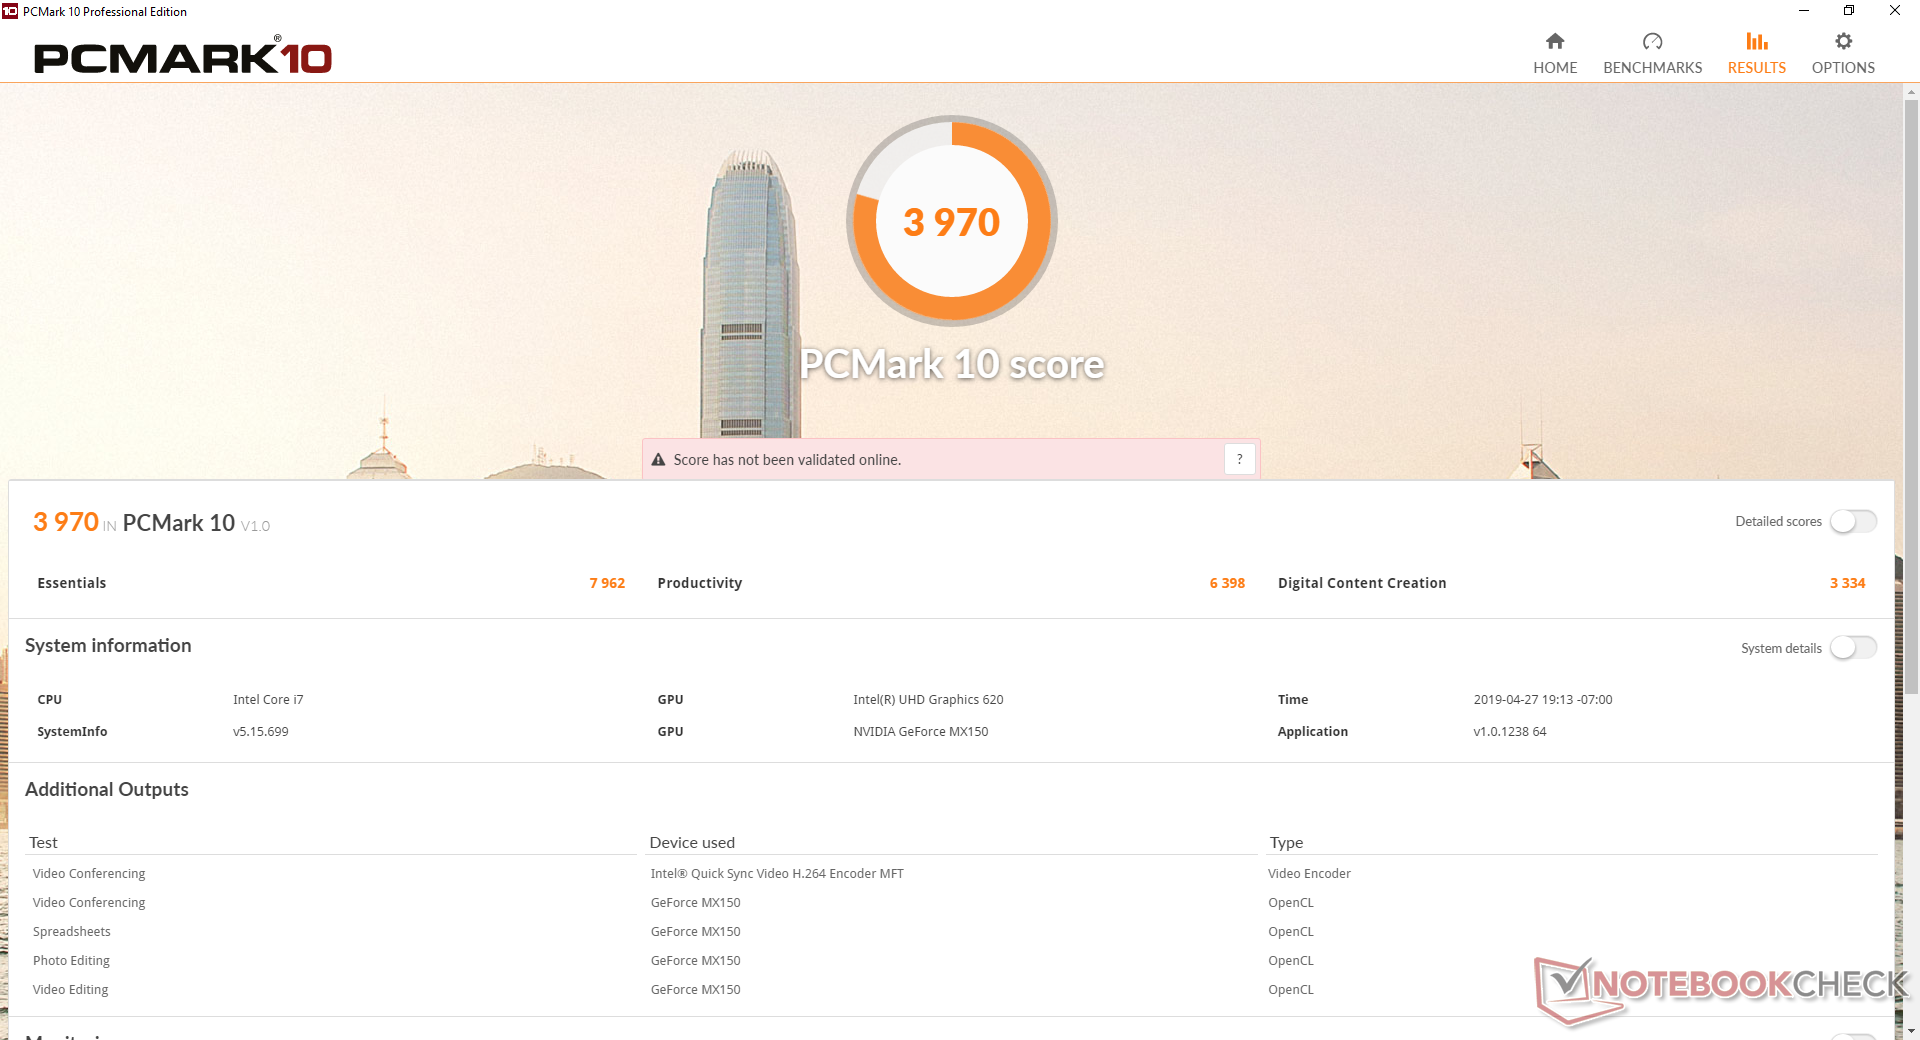
| PCMark 8 Home Score Accelerated v2 | 3712 points | |
| PCMark 8 Work Score Accelerated v2 | 5159 points | |
| PCMark 10 Score | 3970 points | |
Help | ||
Storage Devices
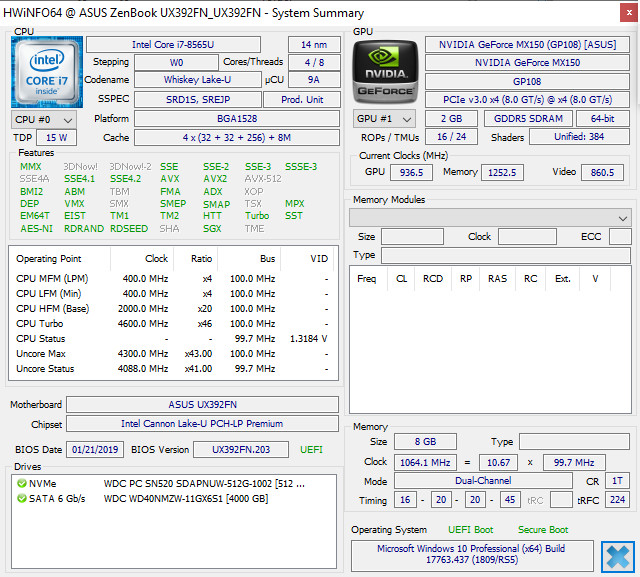
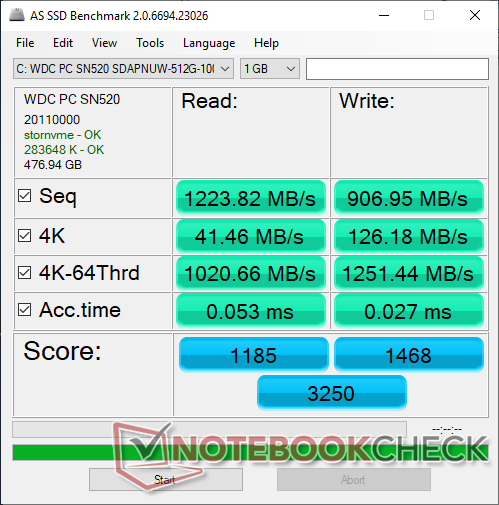
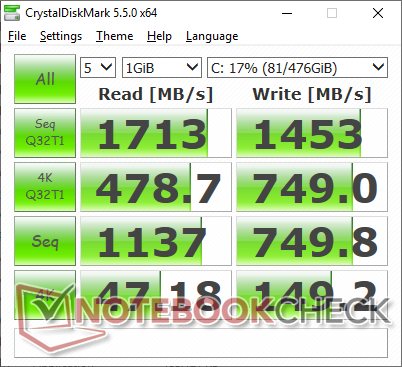
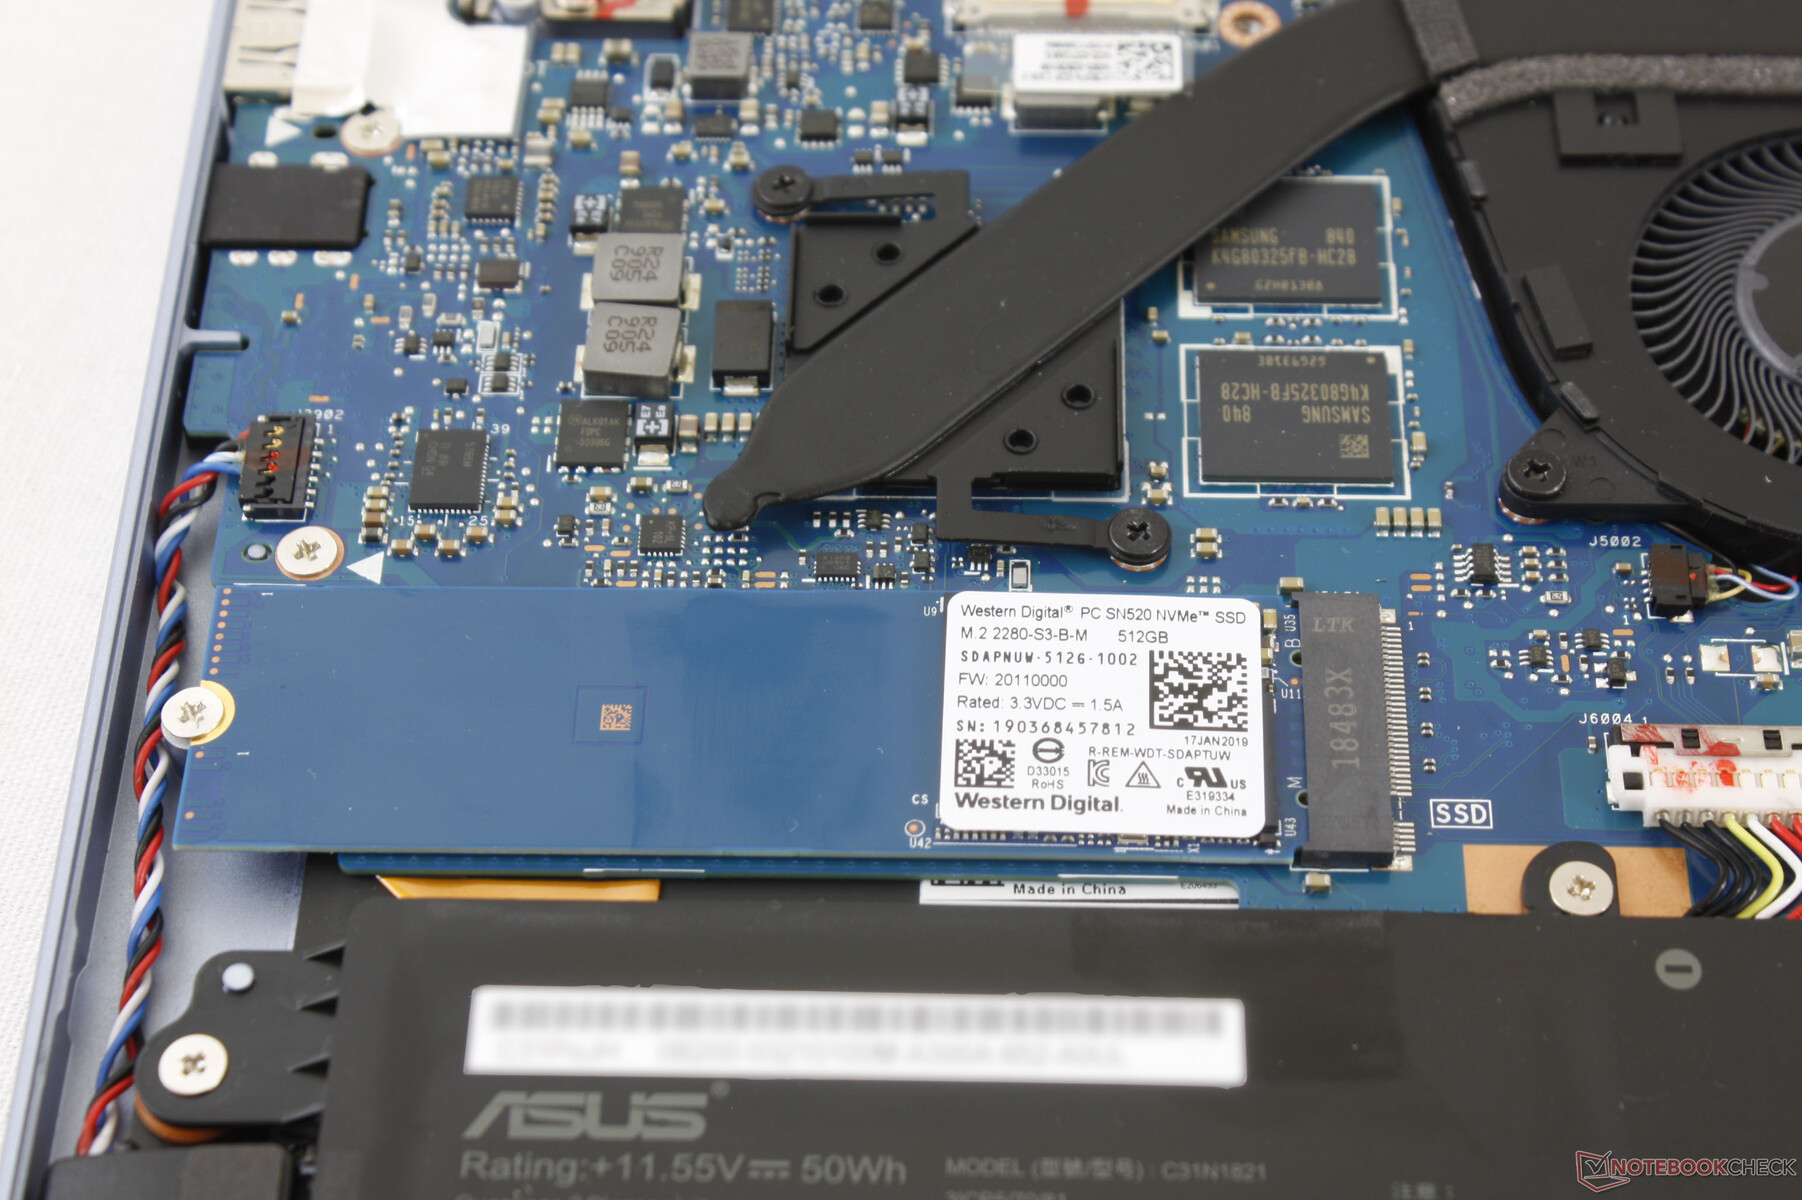
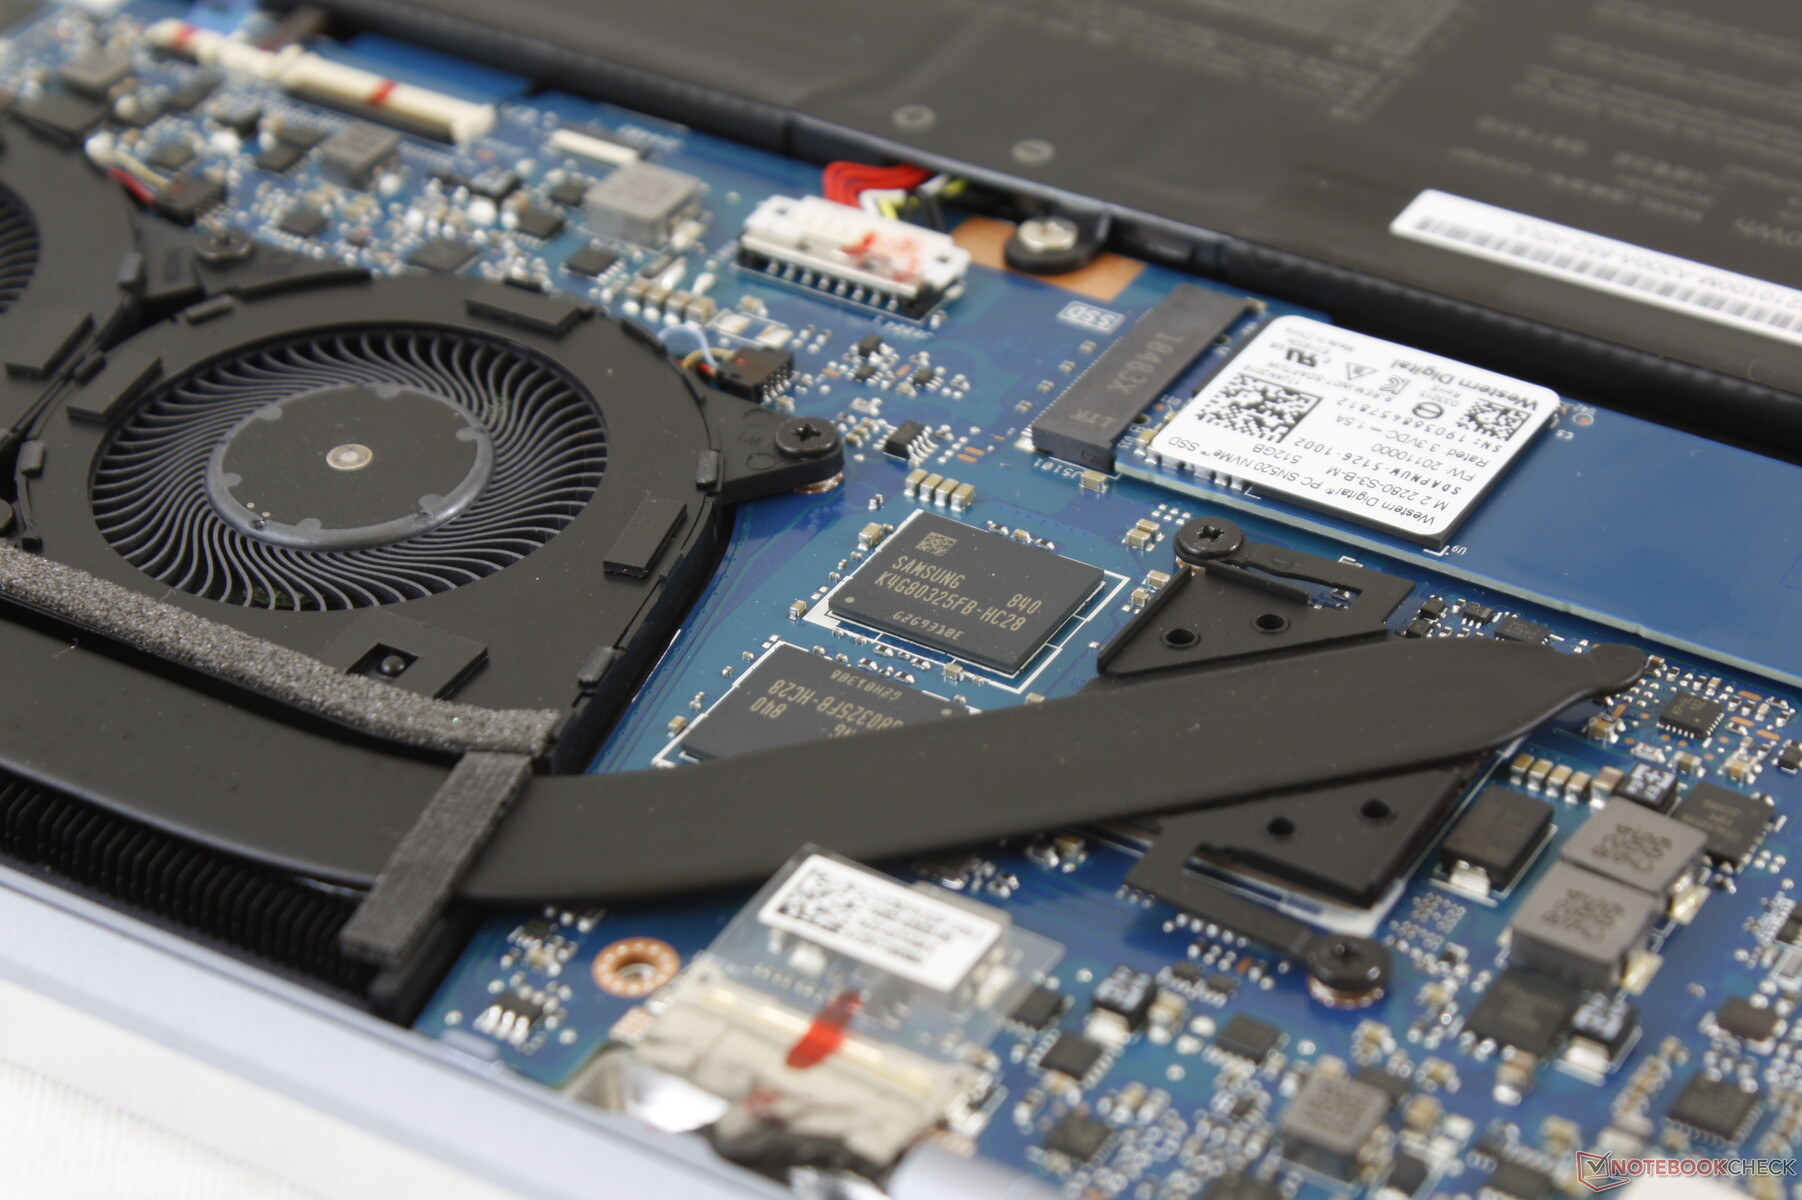
Only a single M.2 storage slot is available with no internal secondary options. Our test unit ships with a 512 GB WDC PC SN520 NVMe SSD whereas our UX391 and UX433 were equipped with drives from Samsung and Intel, respectively. It appears that Asus sources from a wider pool of SSD providers for its ZenBook family. Note that this exact same Western Digital SSD can also be found on the MSI PS63.
Sequential read and write rates are about average for an NVMe drive. The Samsung PM961 can still outperform our WD drive by almost two times in terms of sequential read and write rates. Indeed, the WDC PC SN520 is only a PCIe x2 drive which is a bit disappointing to see on this pricey ZenBook.
See our table of HDDs and SSDs for more benchmark comparisons.
| Asus ZenBook S13 UX392FN WDC PC SN520 SDAPNUW-512G | Dell XPS 13 9380 2019 SK hynix PC401 HFS256GD9TNG | Asus ZenBook S UX391U Samsung PM961 NVMe MZVLW512HMJP | Huawei Matebook X Pro i5 Samsung PM961 MZVLW256HEHP | Lenovo Yoga C930-13IKB SK hynix PC401 HFS256GD9TNG | |
|---|---|---|---|---|---|
| AS SSD | -34% | -3% | -12% | -45% | |
| Seq Read (MB/s) | 1224 | 2035 66% | 1907 56% | 2416 97% | 1850 51% |
| Seq Write (MB/s) | 907 | 658 -27% | 1031 14% | 1170 29% | 661 -27% |
| 4K Read (MB/s) | 41.46 | 39.74 -4% | 43.64 5% | 48.33 17% | 38.04 -8% |
| 4K Write (MB/s) | 126.2 | 105.7 -16% | 112.5 -11% | 103.1 -18% | 95 -25% |
| 4K-64 Read (MB/s) | 1021 | 461 -55% | 703 -31% | 1039 2% | 434.3 -57% |
| 4K-64 Write (MB/s) | 1251 | 300.1 -76% | 1037 -17% | 399.6 -68% | 266.3 -79% |
| Access Time Read * (ms) | 0.053 | 0.061 -15% | 0.036 32% | 0.058 -9% | 0.069 -30% |
| Access Time Write * (ms) | 0.027 | 0.051 -89% | 0.033 -22% | 0.036 -33% | 0.056 -107% |
| Score Read (Points) | 1185 | 704 -41% | 938 -21% | 1329 12% | 657 -45% |
| Score Write (Points) | 1468 | 471 -68% | 1252 -15% | 620 -58% | 427 -71% |
| Score Total (Points) | 3250 | 1479 -54% | 2637 -19% | 2575 -21% | 1373 -58% |
| Copy ISO MB/s (MB/s) | 1404 | 893 -36% | 739 -47% | 539 -62% | |
| Copy Program MB/s (MB/s) | 402.4 | 287.9 -28% | 312.3 -22% | 209.7 -48% | |
| Copy Game MB/s (MB/s) | 902 | 618 -31% | 486.3 -46% | 340 -62% |
* ... smaller is better

GPU Performance
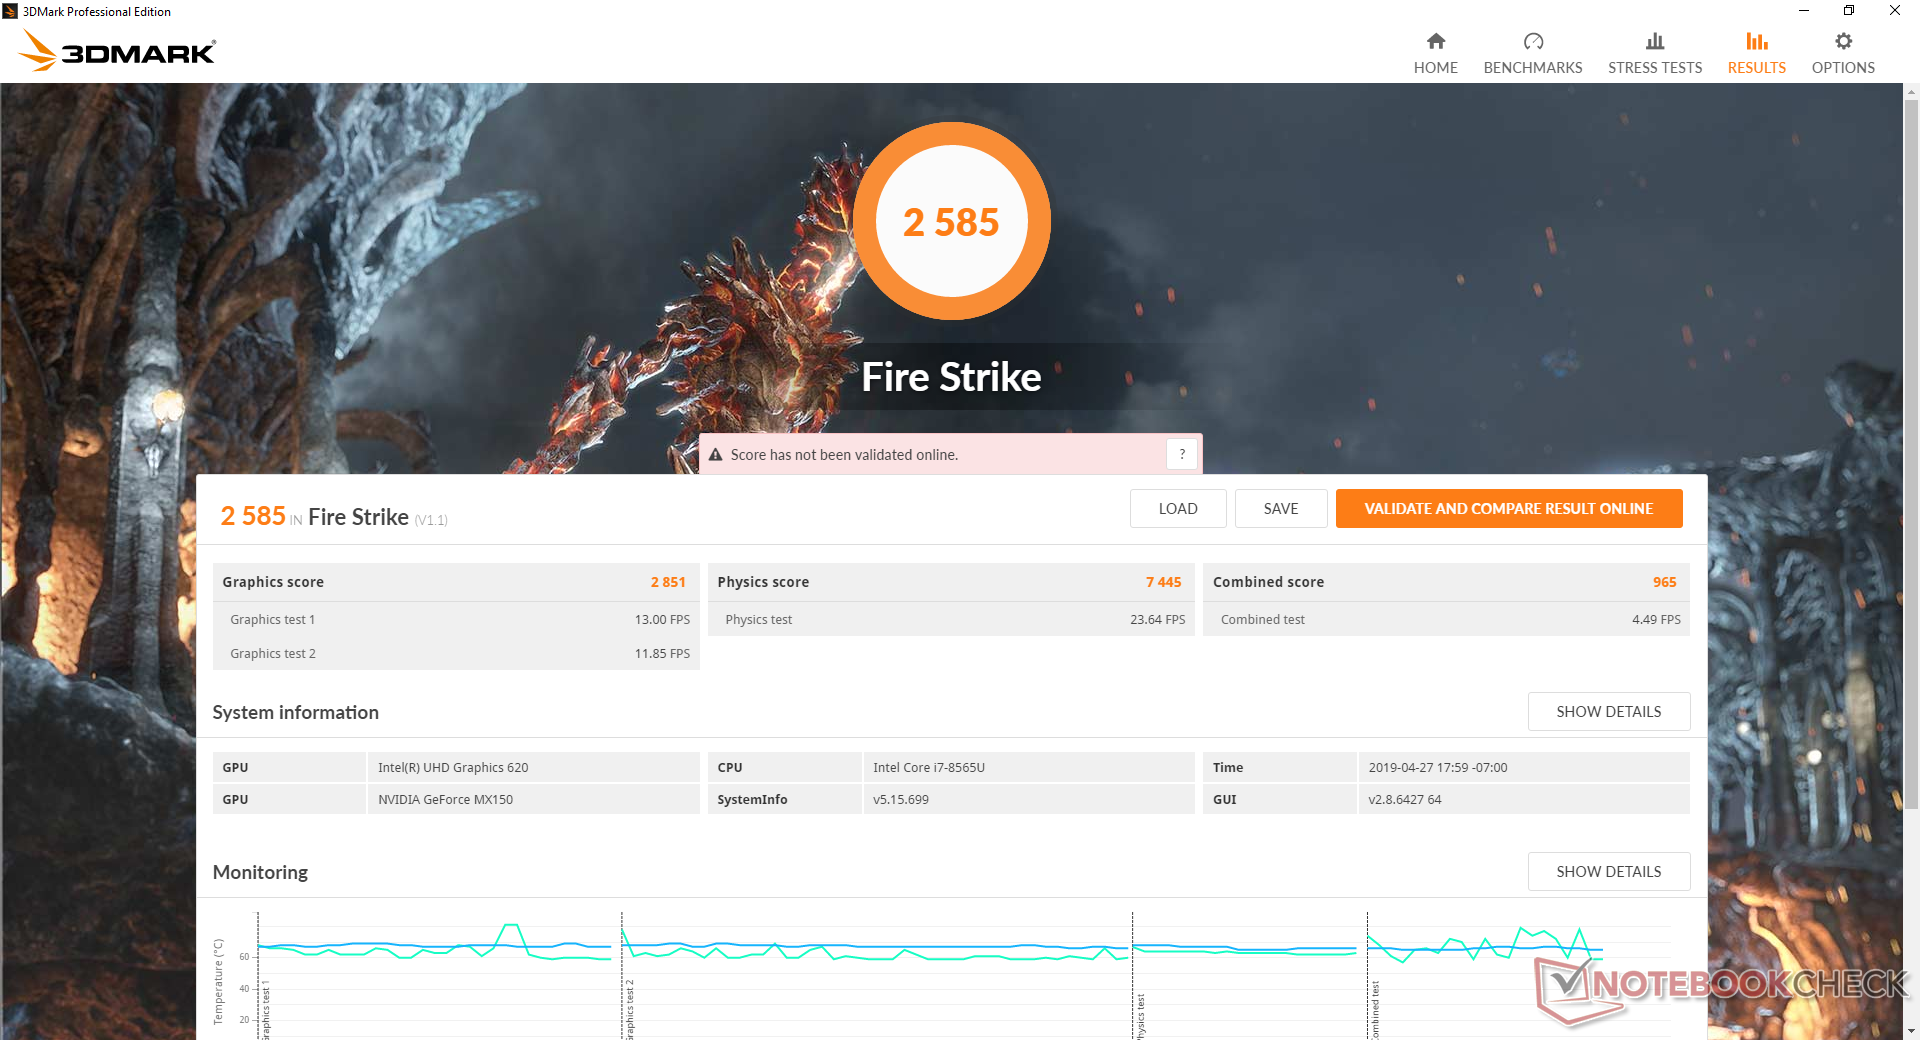
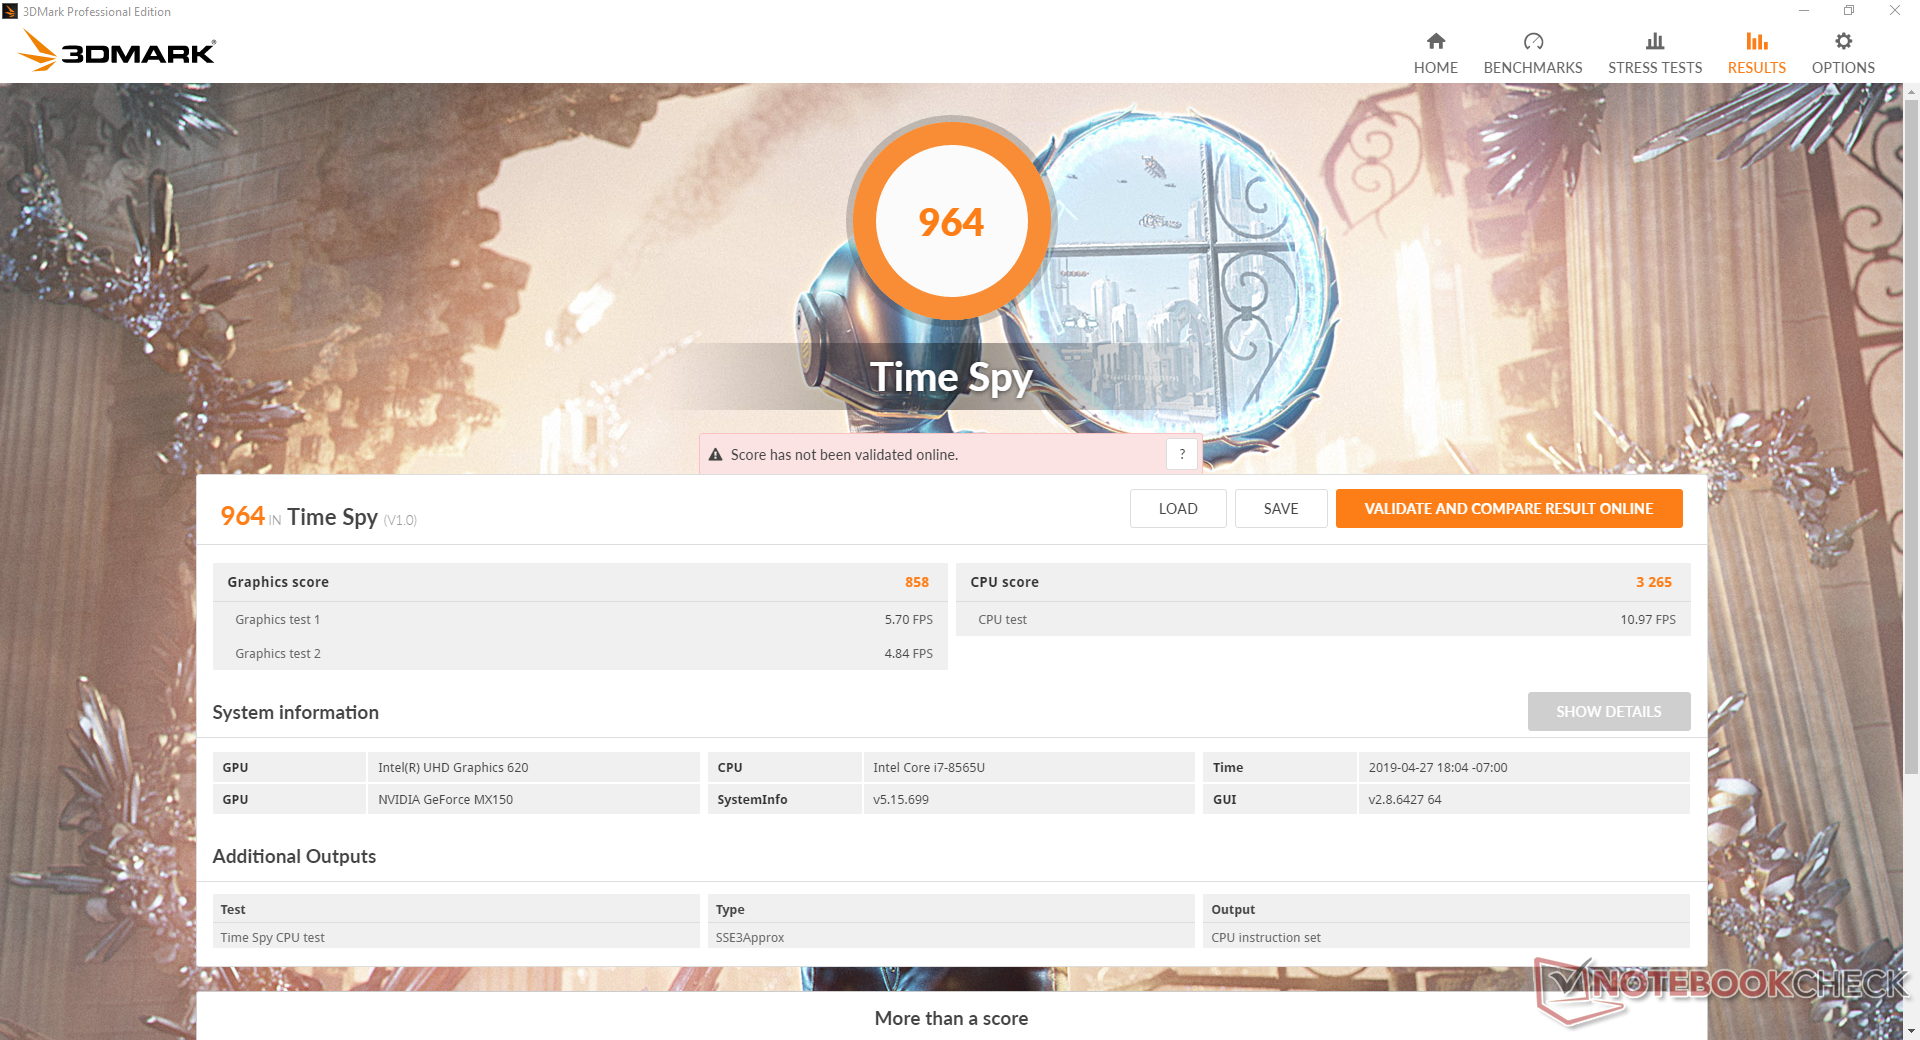
3DMark benchmarks rank our Asus 6 to 16 slower than the average GeForce MX150 GPU in our database taken from 43 other laptops. This is partly attributed to the slower 10 W GeForce MX150 in the Asus compared to the faster 25 W GeForce MX150 in laptops like the Razer Blade Stealth. The Razer, for example, is able to outscore our Asus by 18 to 40 percent. Nonetheless, users upgrading from the older GeForce 940MX or the UHD Graphics 620 will still see significant performance gains.
| 3DMark | |
| 1280x720 Cloud Gate Standard Graphics | |
| Asus FX504GD | |
| Asus Zenbook UX510UW-CN044T | |
| Razer Blade Stealth i7-8565U | |
| Acer Aspire 5 A515-52G-723L | |
| Average NVIDIA GeForce MX150 (16227 - 22183, n=43) | |
| Asus ZenBook UX530UX-FY070T | |
| Asus ZenBook S13 UX392FN | |
| Acer Swift 3 SF315-41-R6J9 | |
| Asus VivoBook S410UQ-NH74 | |
| Dell XPS 13 9380 2019 | |
| Lenovo ThinkPad 13 20J1005TPB | |
| 1920x1080 Fire Strike Graphics | |
| Asus FX504GD | |
| Asus Zenbook UX510UW-CN044T | |
| Razer Blade Stealth i7-8565U | |
| Acer Aspire 5 A515-52G-723L | |
| Average NVIDIA GeForce MX150 (2323 - 3739, n=44) | |
| Asus ZenBook UX530UX-FY070T | |
| Asus ZenBook S13 UX392FN | |
| Acer Swift 3 SF315-41-R6J9 | |
| Asus VivoBook S410UQ-NH74 | |
| Lenovo ThinkPad 13 20J1005TPB | |
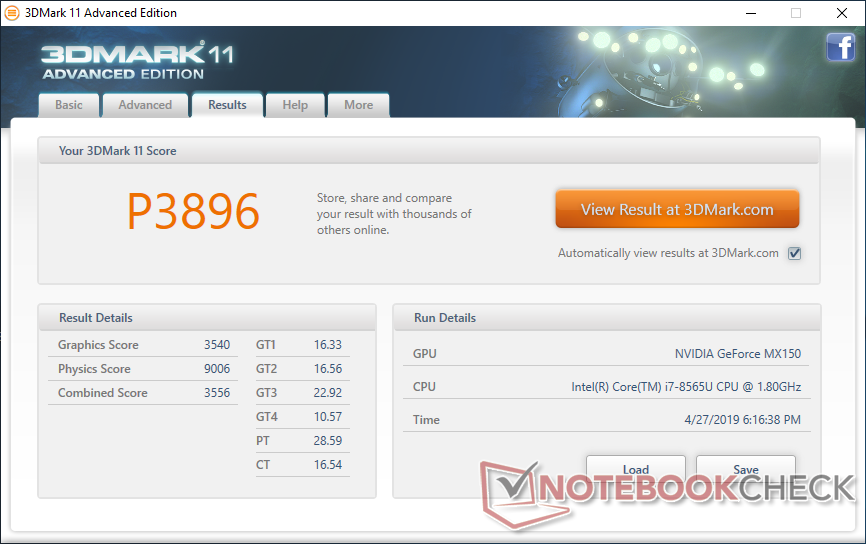
| 3DMark 11 Performance | 3896 points | |
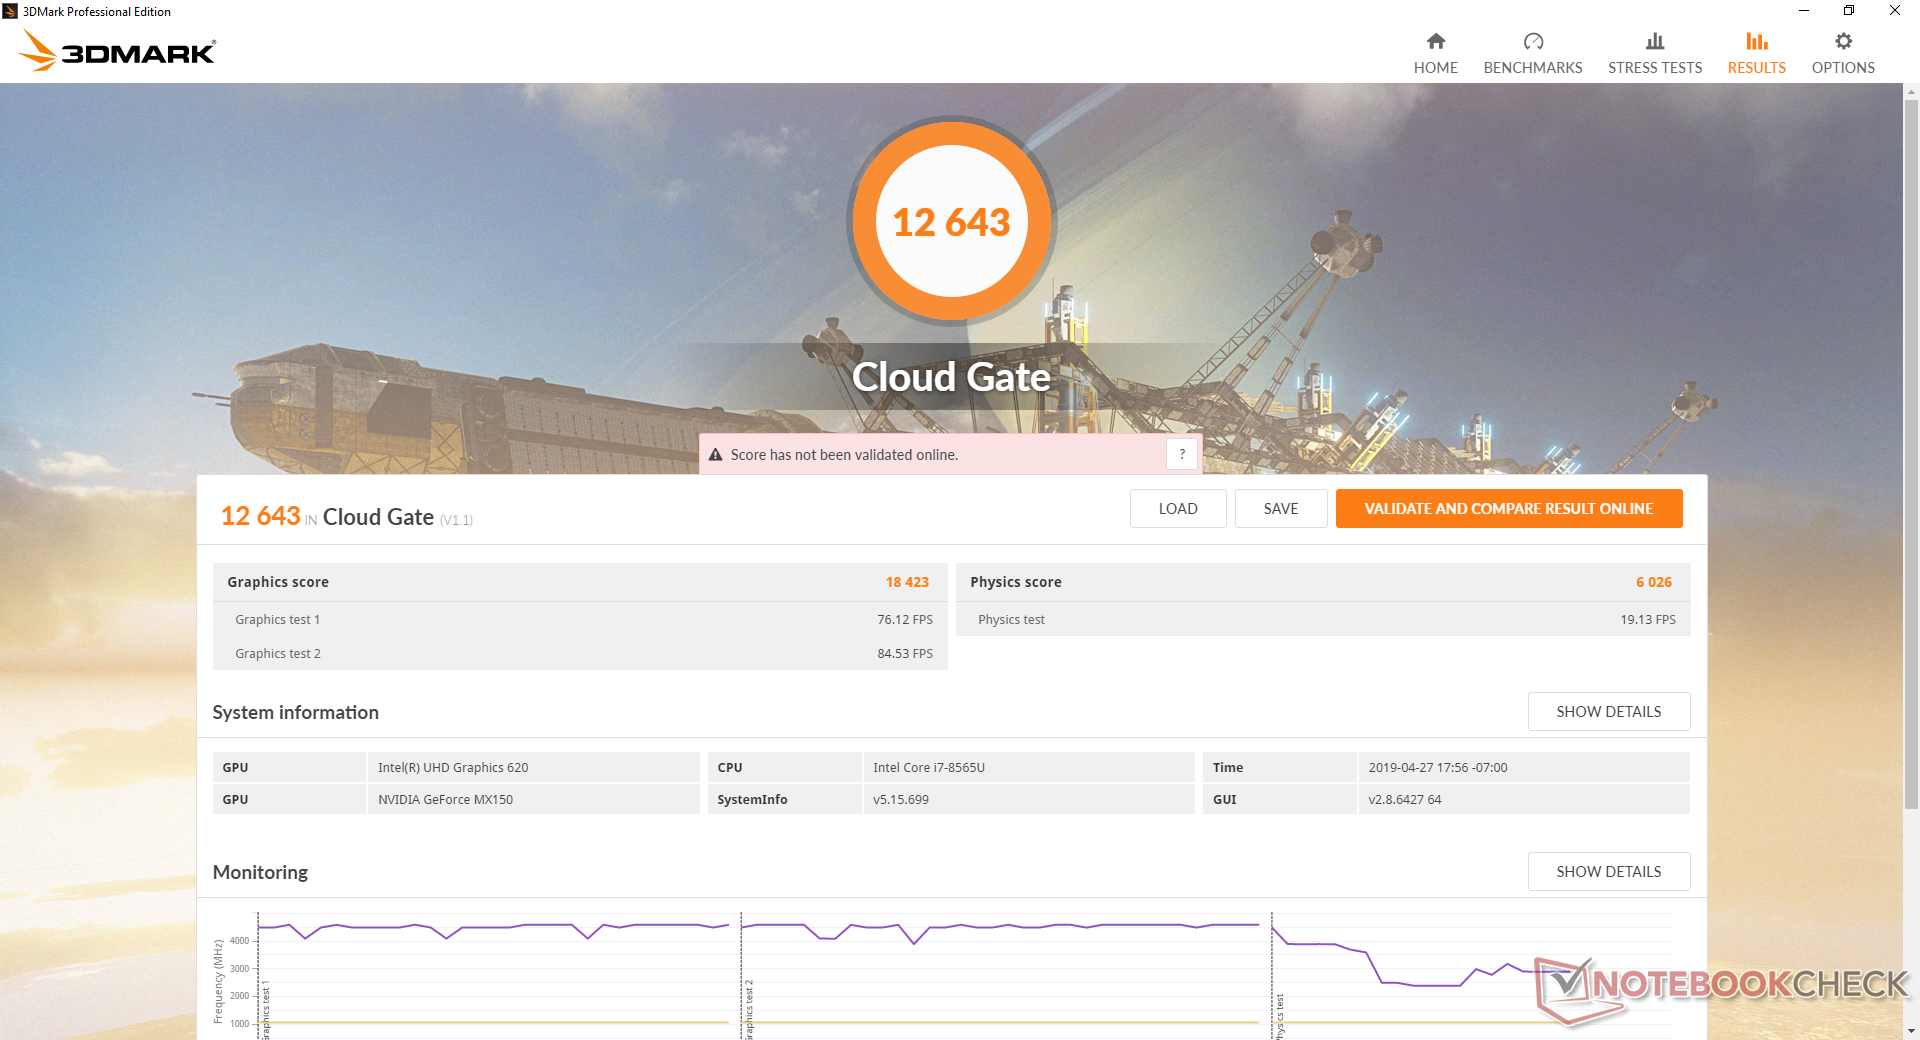
| 3DMark Cloud Gate Standard Score | 12643 points | |
| 3DMark Fire Strike Score | 2585 points | |
| 3DMark Time Spy Score | 964 points | |
Help | ||
Gaming Performance
Real-world gaming performance is about 10 percent slower than the old GTX 950M whereas the Razer Blade Stealth with the faster 25 W GeForce MX150 is much closer to the GTX 960M. Even so, the ability to play popular titles like Fortnite, DOTA 2, and Rocket League at native 1080p and Low settings is great to have on such a compact laptop. We can record no recurring frame dips or performance throttling when idling on Witcher 3 for close to an hour.
See our dedicated page on the GeForce MX150 for more technical information and benchmark comparisons.
| The Witcher 3 | |
| 1366x768 Medium Graphics & Postprocessing | |
| Asus FX504GD | |
| Acer Nitro 5 AN515-42-R6V0 | |
| Asus GL552VW-DK725T | |
| Razer Blade Stealth i7-8565U | |
| Acer Aspire 5 A515-52G-723L | |
| Asus ZenBook UX530UX-FY070T | |
| Average NVIDIA GeForce MX150 (24.4 - 43.2, n=26) | |
| Asus ZenBook S13 UX392FN | |
| Asus VivoBook S410UQ-NH74 | |
| 1920x1080 High Graphics & Postprocessing (Nvidia HairWorks Off) | |
| Asus FX504GD | |
| Acer Nitro 5 AN515-42-R6V0 | |
| Razer Blade Stealth i7-8565U | |
| Asus GL552VW-DK725T | |
| Acer Aspire 5 A515-52G-723L | |
| Asus ZenBook UX530UX-FY070T | |
| Average NVIDIA GeForce MX150 (13.3 - 23.8, n=25) | |
| Asus ZenBook S13 UX392FN | |
| Dell Latitude 14 5495 | |
analysis of witcher 3 framerate chart (gtx based laptops only, or similar performance class)
| low | med. | high | ultra | |
|---|---|---|---|---|
| BioShock Infinite (2013) | 147.1 | 95.7 | 81.6 | 30.5 |
| The Witcher 3 (2015) | 57.6 | 32.5 | 18 | 10 |
| Rise of the Tomb Raider (2016) | 63.2 | 36.9 | 19.2 | 16.7 |
Emissions
System Noise
The cooling solution consists of twin 40 mm fans and a single heat pipe shared between the CPU and GPU. The fans are positioned towards the center of the motherboard unlike on most other gaming laptops.
Fan noise is actually very similar to the Razer Blade Stealth with pitch being similar to other Ultrabooks. During low loads like browsing or video streaming, fan noise remains low at 29 dB(A) with no pulsing behavior. The system is essentially silent when sitting from a normal distance.
When running higher loads like gaming, however, fan noise will slowly pick up until it hits a constant 41.1 dB(A) to be louder than the XPS 13, Lenovo Yoga C930, and last generation UX391 all equipped with slower integrated graphics. While noticeable, it’s at least nowhere near as loud as some ultrathin gaming laptops including the Blade 15.
Our test unit exhibits very slight coil whine when placing an ear near the right half of the keyboard that we suspect may be from the M.2 SSD. Fortunately, it’s essentially unnoticeable in a typical classroom or workplace environment.
| Asus ZenBook S13 UX392FN GeForce MX150, i7-8565U, WDC PC SN520 SDAPNUW-512G | Dell XPS 13 9380 2019 UHD Graphics 620, i5-8265U, SK hynix PC401 HFS256GD9TNG | Asus ZenBook S UX391U UHD Graphics 620, i5-8550U, Samsung PM961 NVMe MZVLW512HMJP | Huawei Matebook X Pro i5 GeForce MX150, i5-8250U, Samsung PM961 MZVLW256HEHP | Lenovo Yoga C930-13IKB UHD Graphics 620, i5-8250U, SK hynix PC401 HFS256GD9TNG | Razer Blade Stealth i7-8565U GeForce MX150, i7-8565U, Lite-On CA3-8D256-Q11 | |
|---|---|---|---|---|---|---|
| Noise | 0% | -0% | 0% | 5% | -2% | |
| off / environment * (dB) | 28.1 | 30.4 -8% | 29.7 -6% | 27.9 1% | 29.3 -4% | 28.4 -1% |
| Idle Minimum * (dB) | 28.1 | 30.4 -8% | 29.7 -6% | 27.9 1% | 29.3 -4% | 28.5 -1% |
| Idle Average * (dB) | 28.1 | 30.4 -8% | 29.7 -6% | 27.9 1% | 29.3 -4% | 29 -3% |
| Idle Maximum * (dB) | 29 | 30.4 -5% | 30.1 -4% | 27.9 4% | 29.7 -2% | 29.1 -0% |
| Load Average * (dB) | 41.1 | 31.7 23% | 36.8 10% | 36.2 12% | 31.8 23% | 42.8 -4% |
| Witcher 3 ultra * (dB) | 41.1 | 45 -9% | 41.4 -1% | |||
| Load Maximum * (dB) | 41.1 | 38.1 7% | 36.8 10% | 45.2 -10% | 32.7 20% | 41.6 -1% |
* ... smaller is better
Noise level
| Idle |
| 28.1 / 28.1 / 29 dB(A) |
| Load |
| 41.1 / 41.1 dB(A) |
 | ||
30 dB silent 40 dB(A) audible 50 dB(A) loud |
||
min: | ||
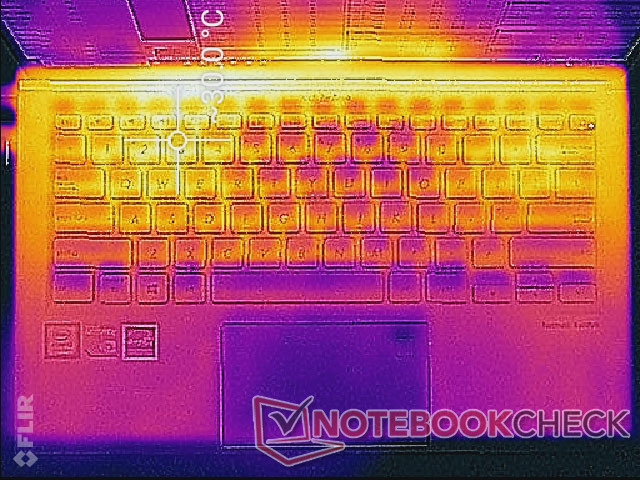
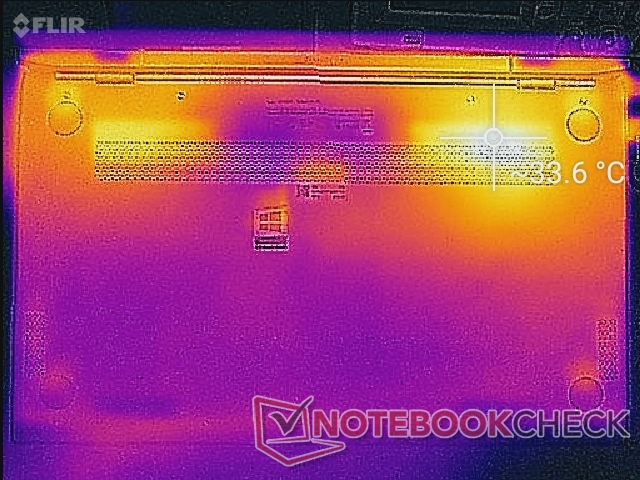
Temperature
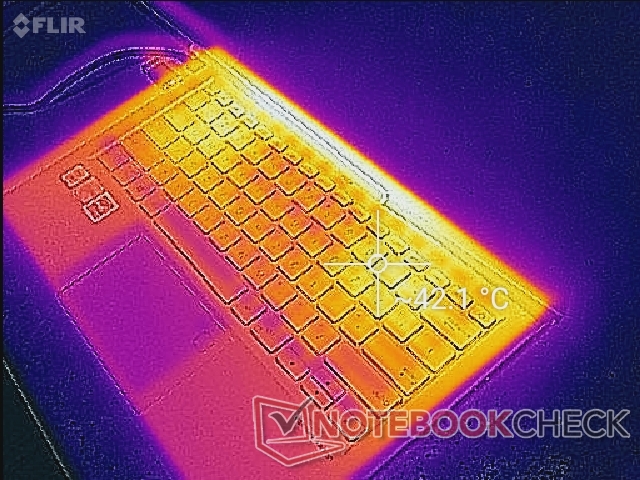
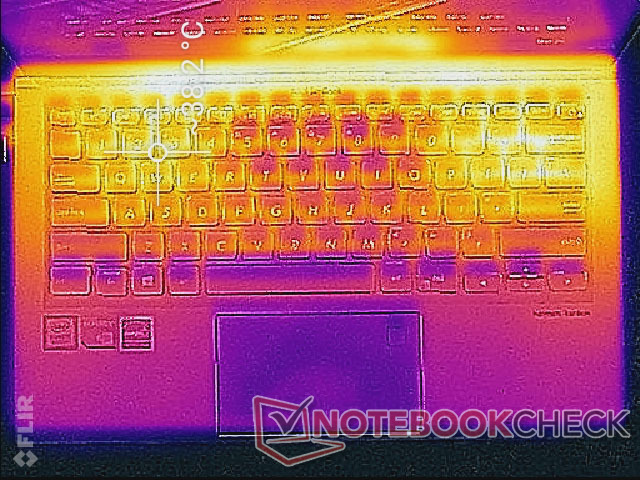
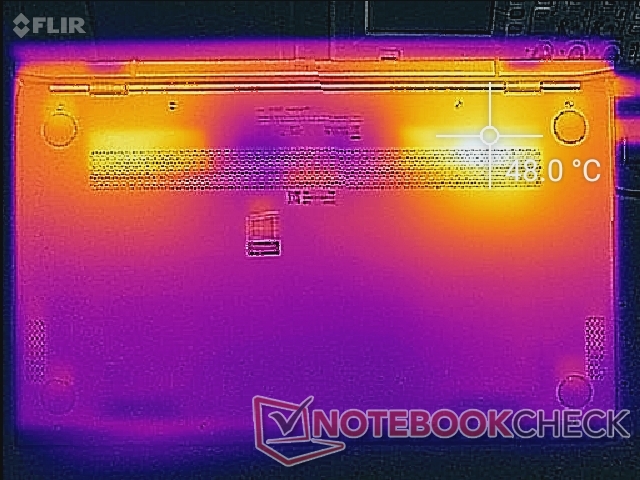
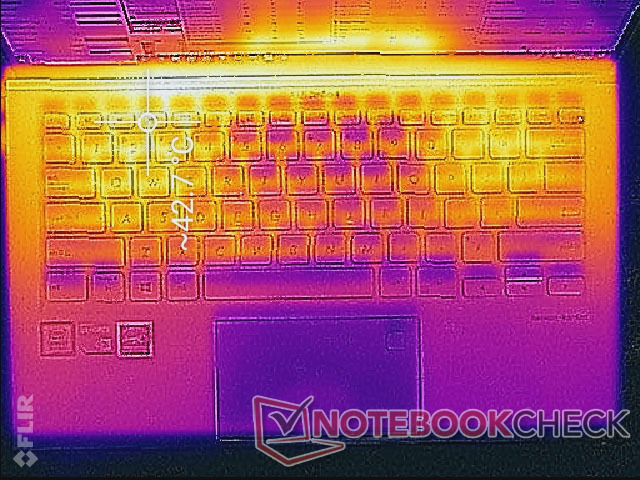
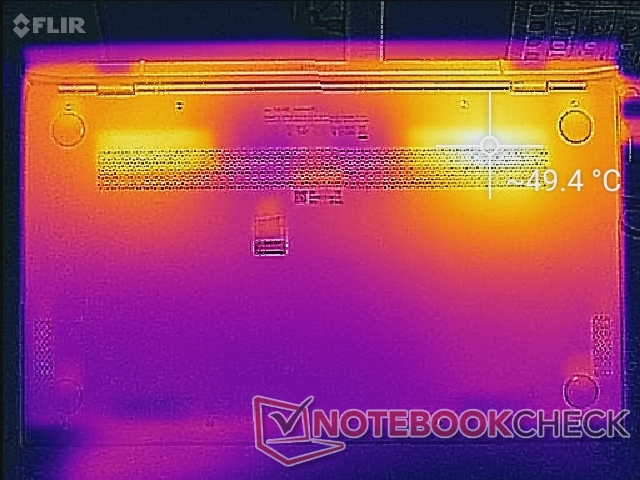
Surface temperatures are warm even when idling on desktop. We're able to record an average surface temperature of 29 C against a room temperature of 20 C. When under heavier loads like gaming, the WASD keys and palm rests can become as warm as 38 C and 30 C, respectively. While not uncomfortably warm, the heat is certainly noticeable. Results are similar to what we've recorded on the 2018 Huawei MateBook X Pro equipped with the same 10 W GeForce MX150 GPU.
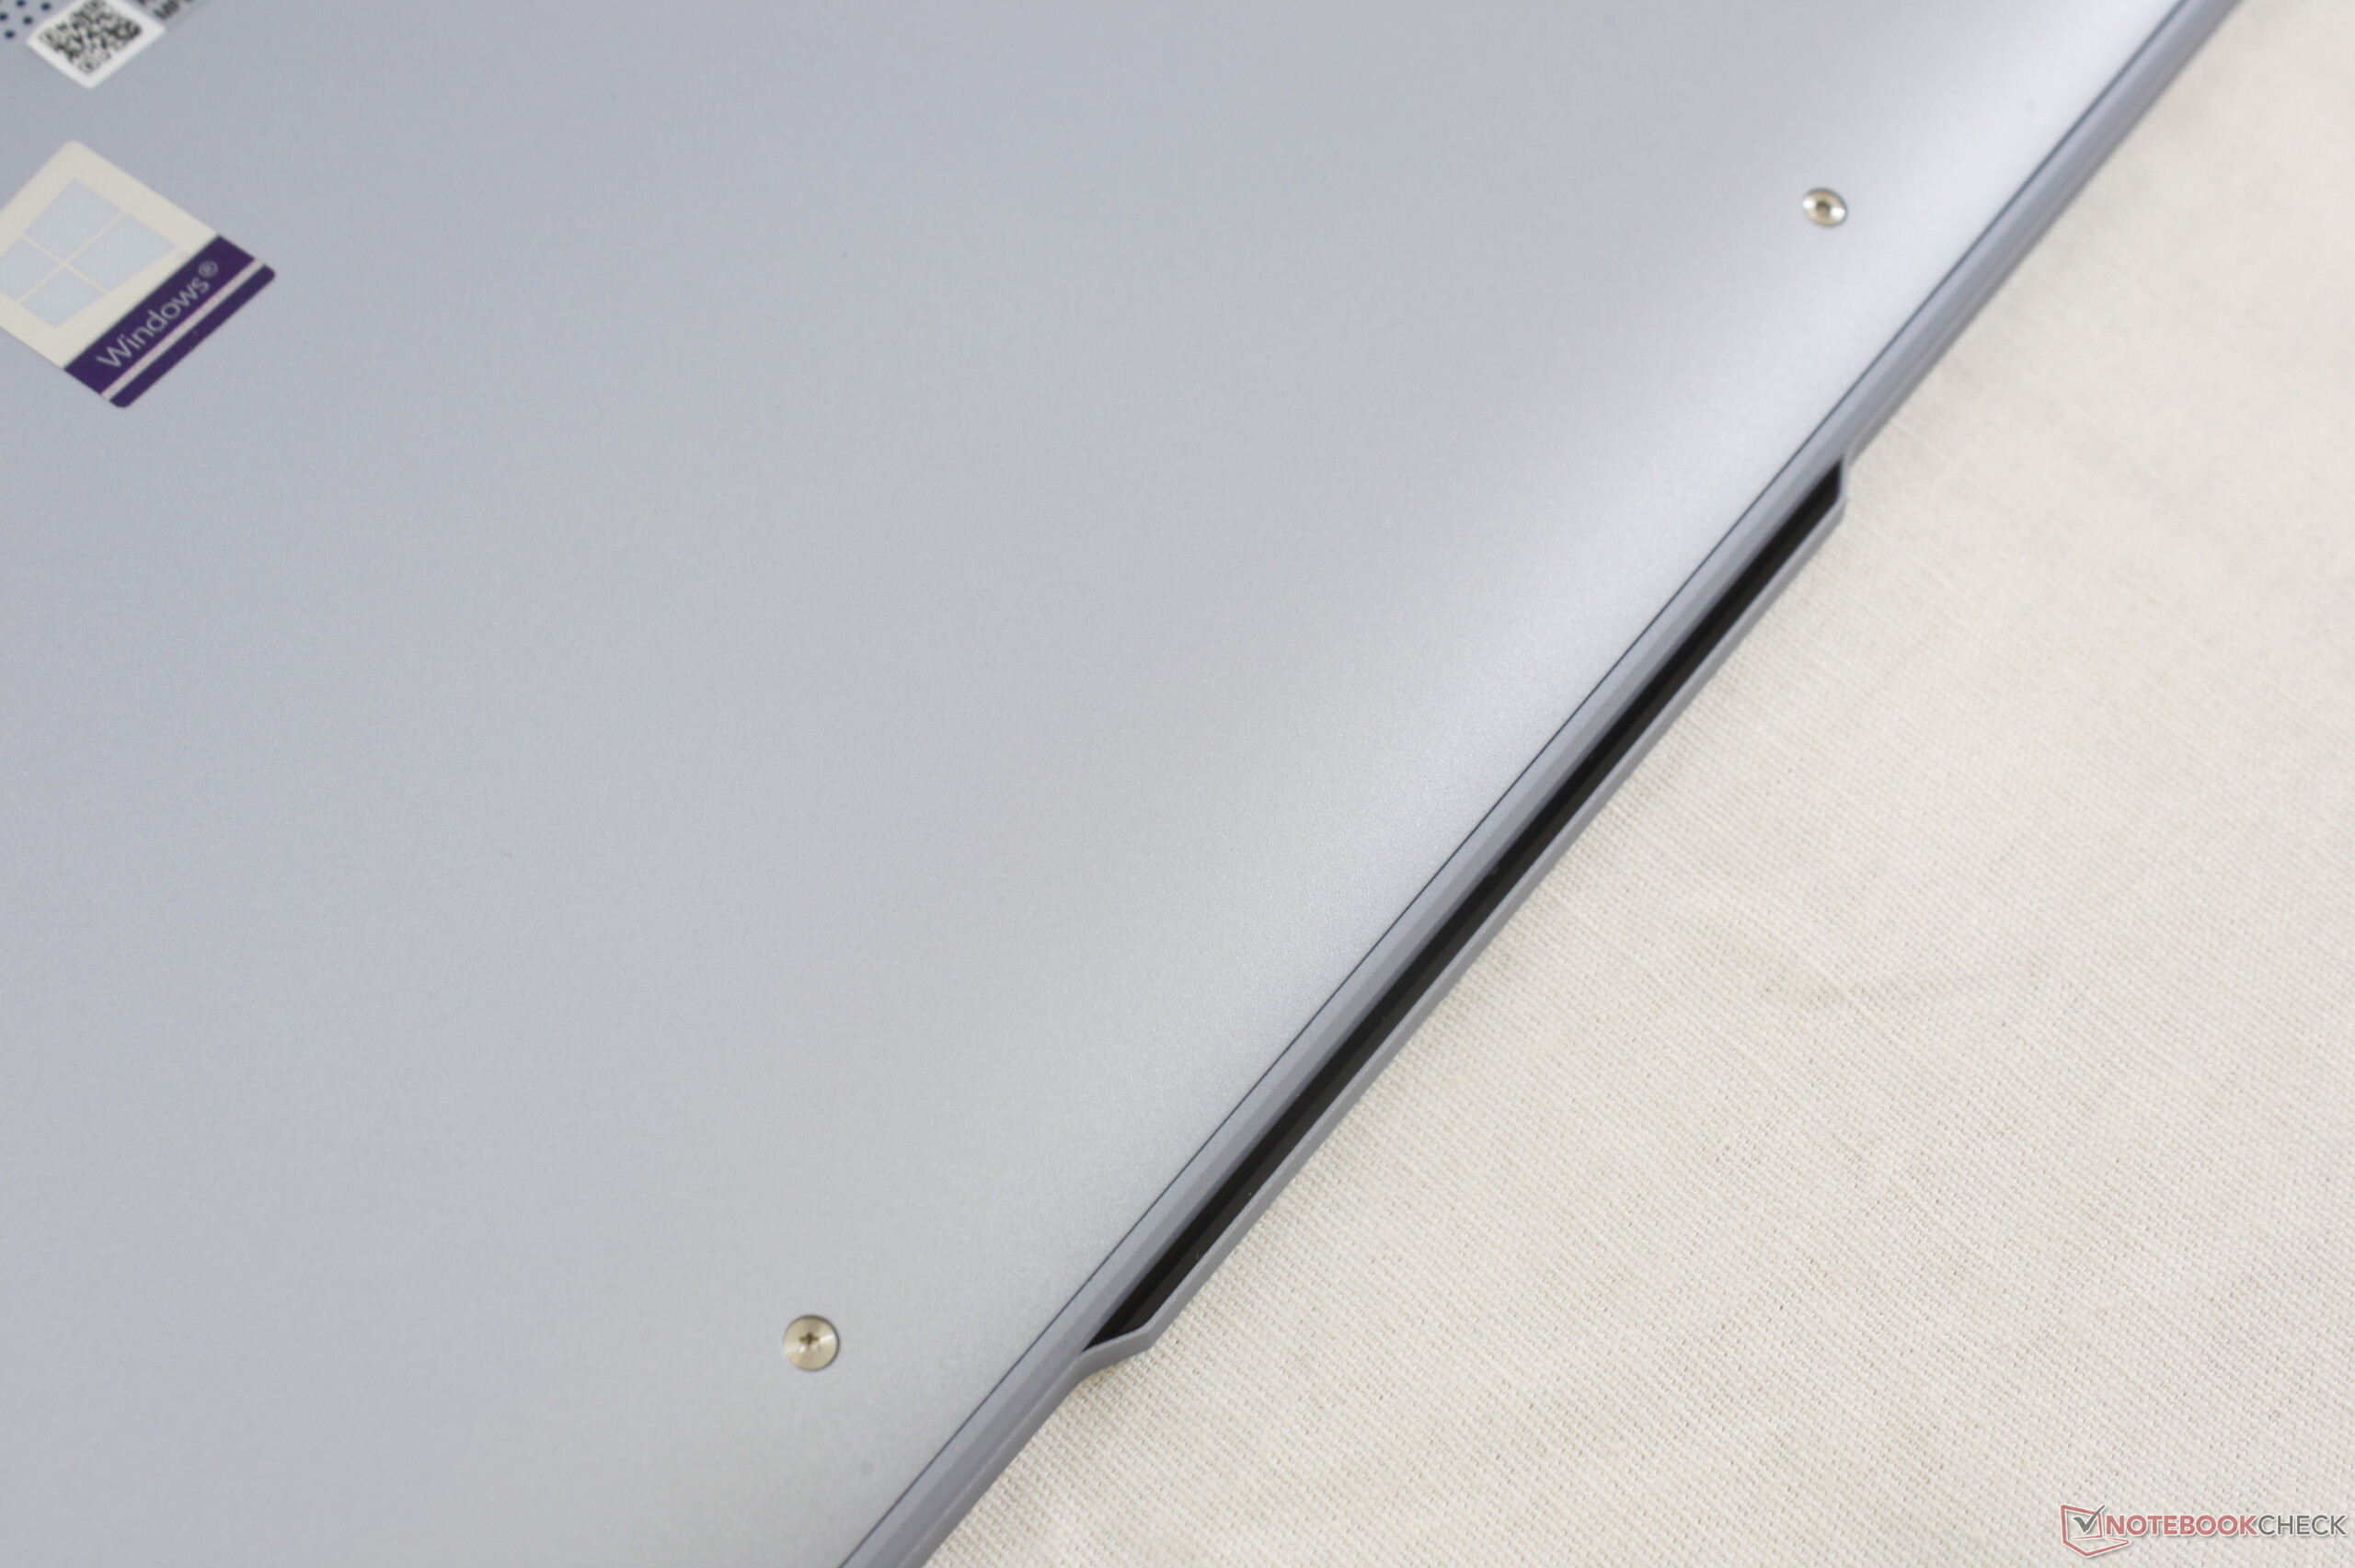
The ZenBook UX392 has no ventilation grilles along its left or right edges. Instead, the exhaust grilles are hidden along the back edge between the hinges to expel heat upwards towards the front of the screen. It's a clever approach to ensure that users can't impede the ventilation.
Stress Test
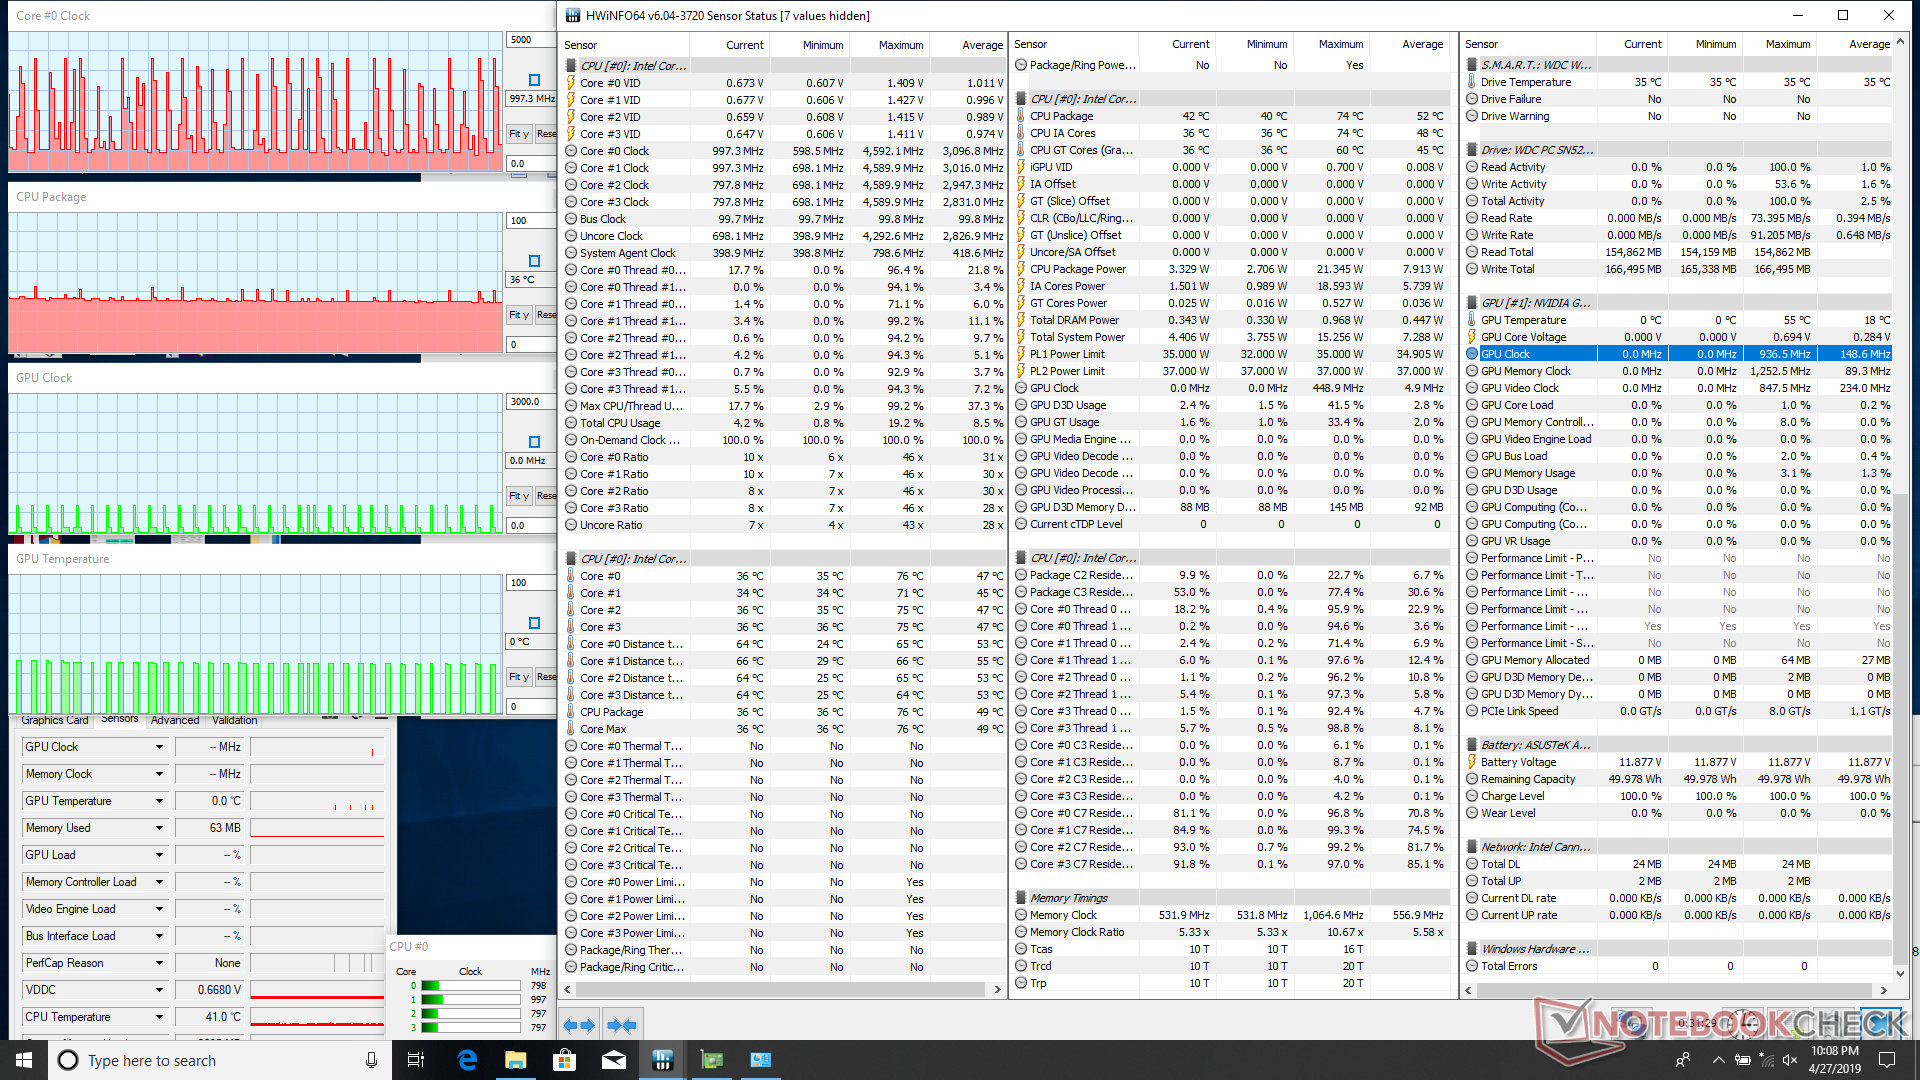
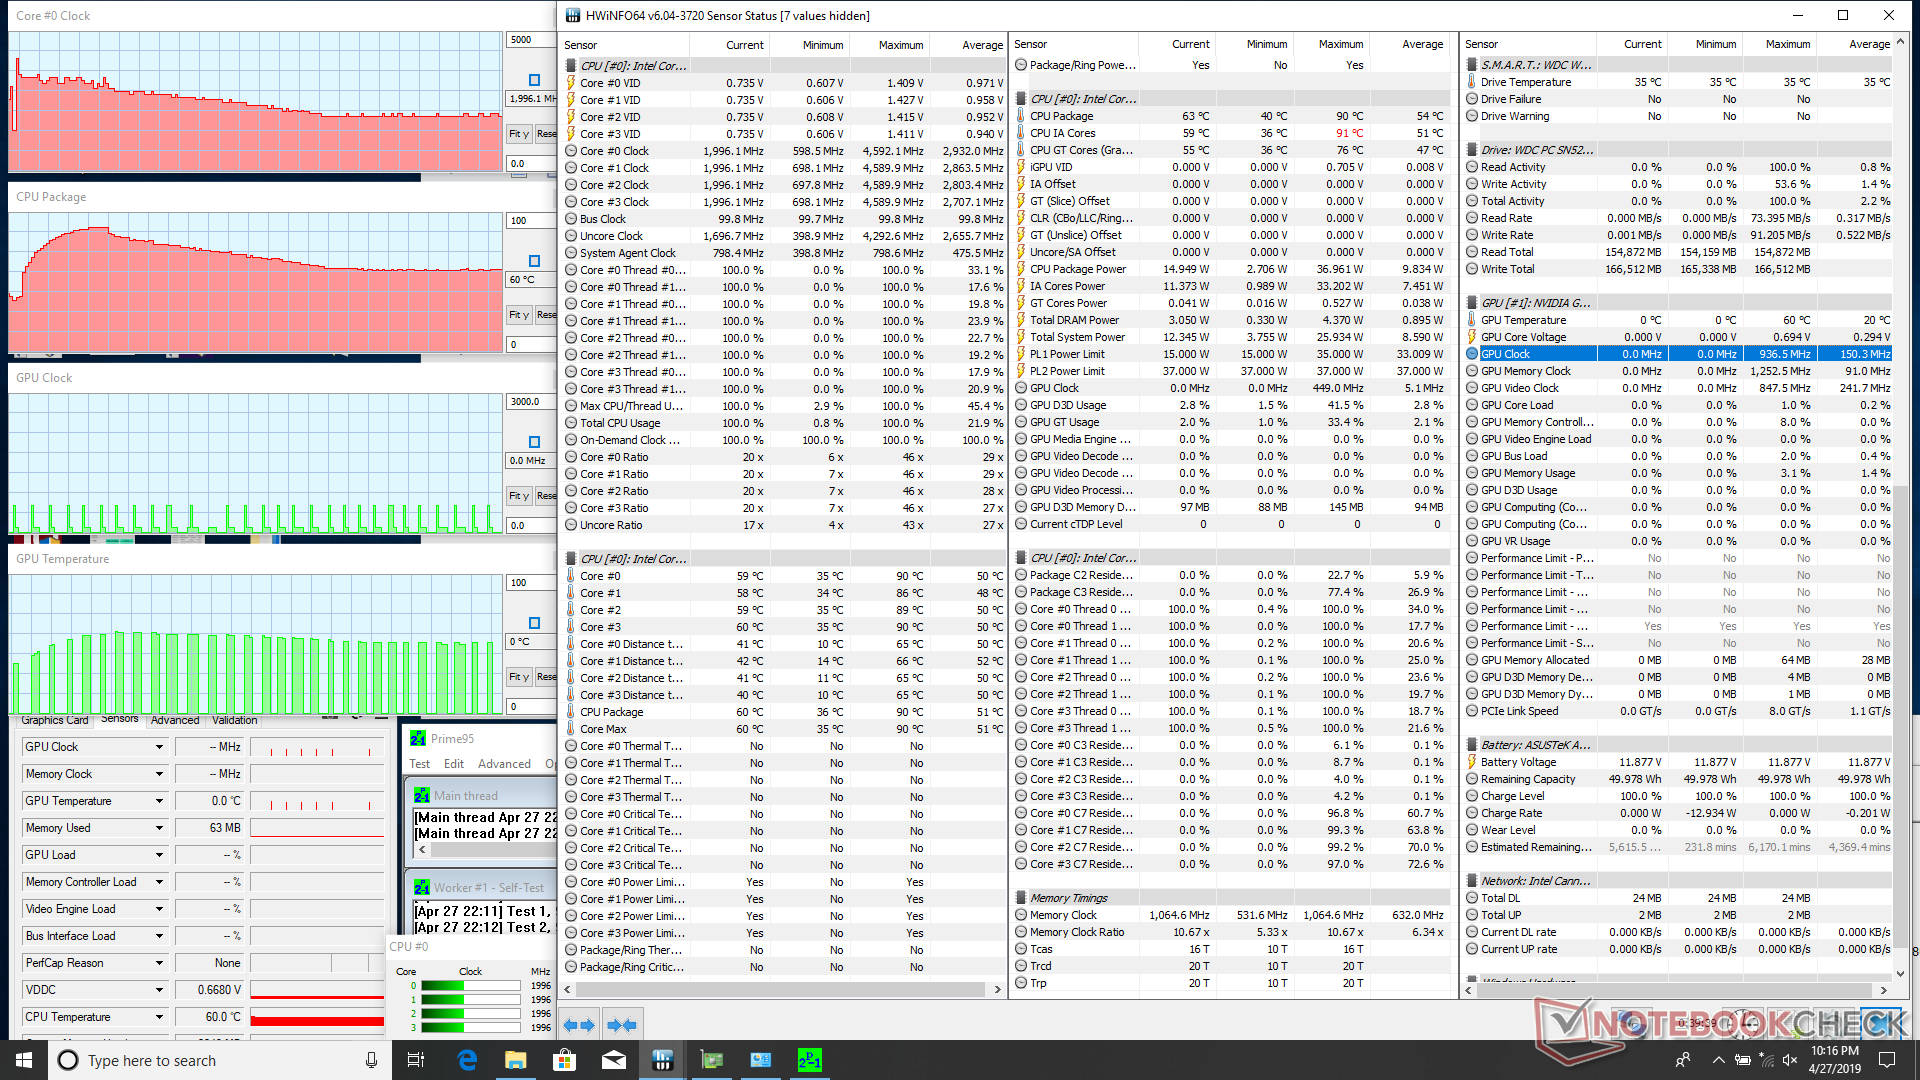
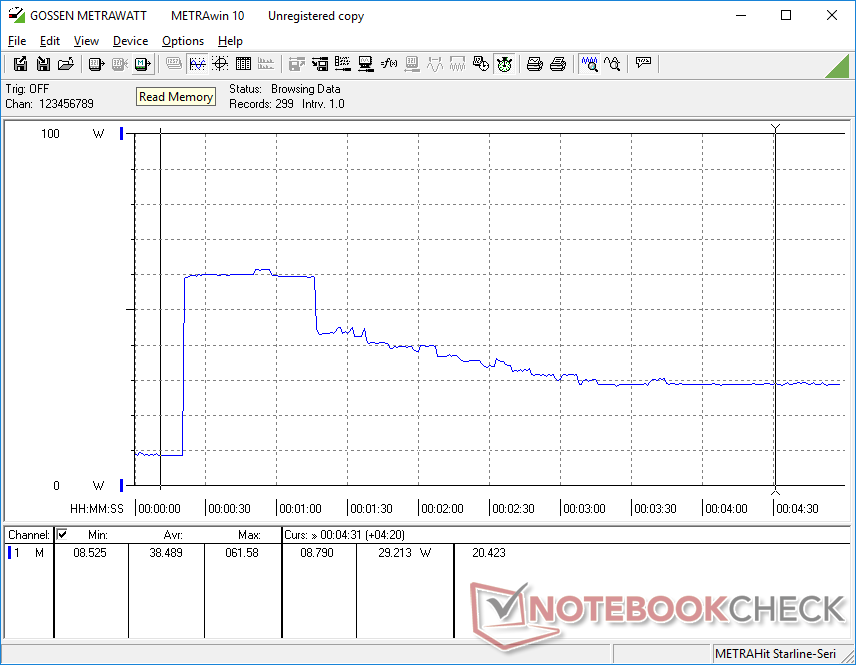
We stress the laptop with synthetic loads to identify for any potential throttling or stability issues. When subjected to Prime95 load, the CPU can be observed running as high as 3.4 GHz for the first few seconds before core temperature hits 90 C. Thereafter, clock rates steadily drop until reaching the 2.0 to 2.1 GHz range in order to maintain a cooler core temperature of 60 C. Our Prime95 screenshot below shows this steady rise in core temperature before it inevitably falls back down. When considering that the base clock rate of the Core i7-8565U is 1.8 GHz, the UX392 can only sustain a Turbo Boost of 200 to 300 MHz for extended periods.
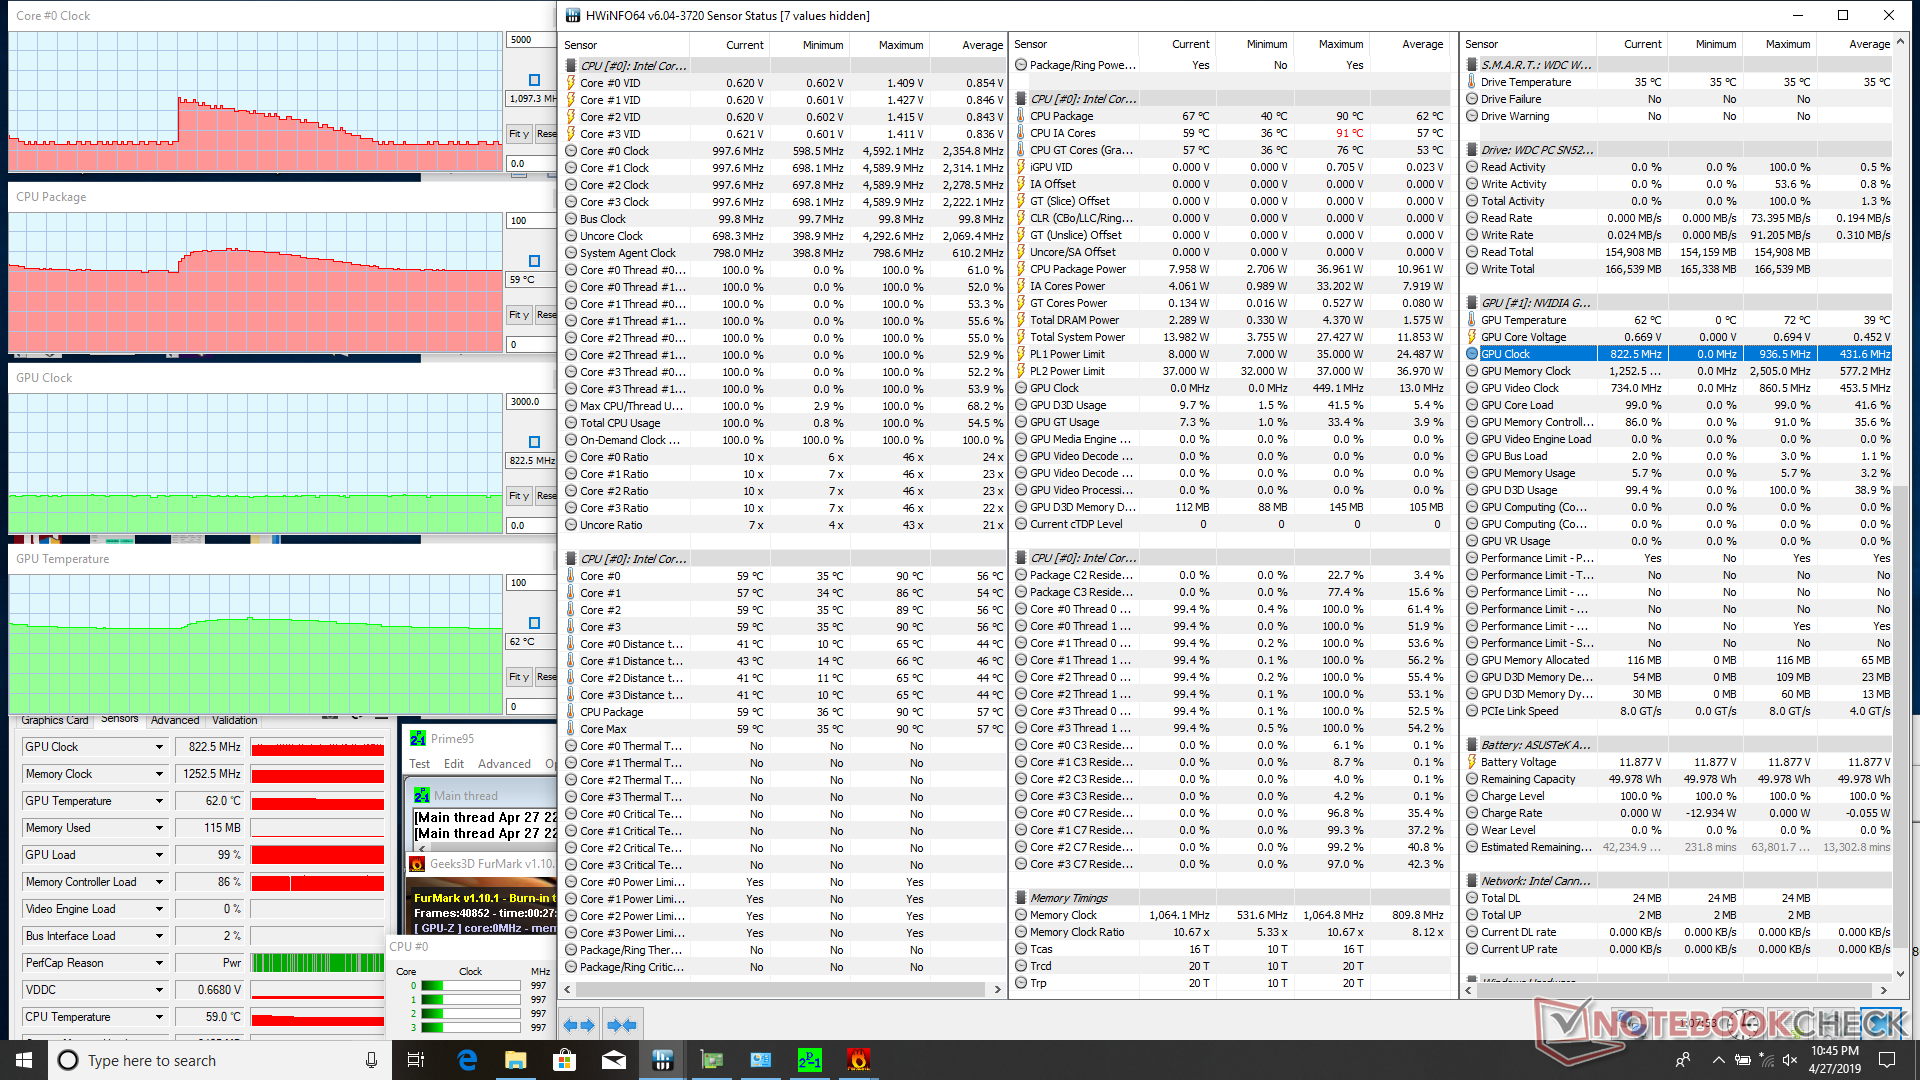
When running both Prime95 and FurMark simultaneously, core clock rate may periodically jump from 1.0 GHz to 2.5 GHz for short periods before throttling kicks in again.
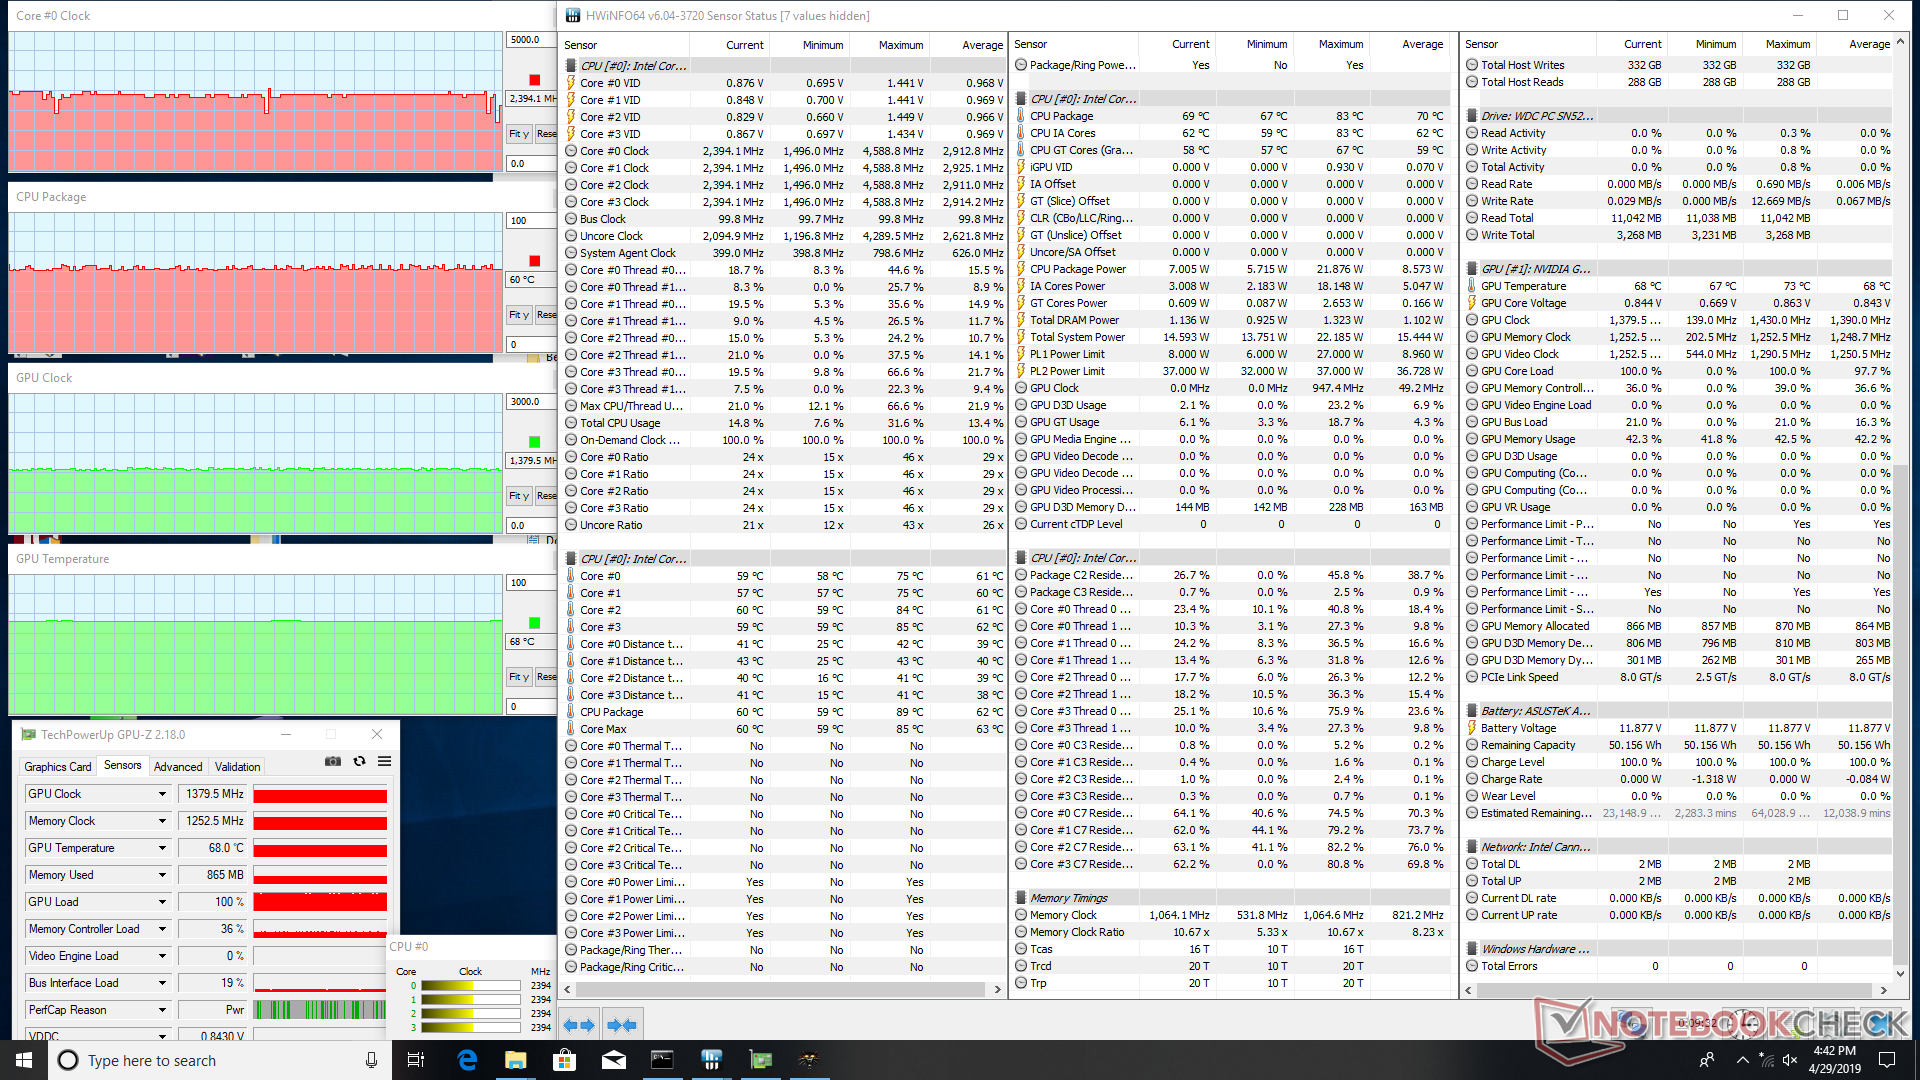
When running Witcher 3 to represent real-world gaming loads, CPU and GPU temperatures become stable at 60 C and 68 C, respectively.
Running on battery power will limit CPU performance. A 3DMark 11 test on batteries returns Physics and Graphics scores of 3349 and 3506 points, respectively, compared to 9006 and 3540 points when on mains.
| CPU Clock (GHz) | GPU Clock (MHz) | Average CPU Temperature (°C) | Average GPU Temperature (°C) | |
| System Idle | -- | -- | 36 | 34 |
| Prime95 Stress | 2.0 - 2.1 | -- | 60 | 49 |
| Prime95 + FurMark Stress | 1.0 - 1.1 | 823 | 59 | 62 |
| Witcher 3 Stress | ~2.7 | 1380 | 60 | 68 |
(±) The maximum temperature on the upper side is 42.4 °C / 108 F, compared to the average of 35.9 °C / 97 F, ranging from 21.4 to 59 °C for the class Subnotebook.
(-) The bottom heats up to a maximum of 48.6 °C / 119 F, compared to the average of 39.2 °C / 103 F
(+) In idle usage, the average temperature for the upper side is 28.4 °C / 83 F, compared to the device average of 30.8 °C / 87 F.
(±) Playing The Witcher 3, the average temperature for the upper side is 33.6 °C / 92 F, compared to the device average of 30.8 °C / 87 F.
(+) The palmrests and touchpad are cooler than skin temperature with a maximum of 30.2 °C / 86.4 F and are therefore cool to the touch.
(±) The average temperature of the palmrest area of similar devices was 28.2 °C / 82.8 F (-2 °C / -3.6 F).
Speakers
The Harman Kardon stereo speakers have poorer bass reproduction than on the HP Spectre x360 13. Our pink noise measurements show roll off at about 1.5 KHz whereas the HP has a smoother curve for a more balanced audio reproduction. The speakers are decent enough for video conferencing, but we recommend headphones for better multimedia playback.
Higher volume settings will vibrate the palm rests and base with thankfully no audible clattering.


Asus ZenBook S13 UX392FN audio analysis
(±) | speaker loudness is average but good (74.1 dB)
Bass 100 - 315 Hz
(±) | reduced bass - on average 10.9% lower than median
(±) | linearity of bass is average (12% delta to prev. frequency)
Mids 400 - 2000 Hz
(±) | higher mids - on average 6.4% higher than median
(±) | linearity of mids is average (8.4% delta to prev. frequency)
Highs 2 - 16 kHz
(+) | balanced highs - only 2.3% away from median
(±) | linearity of highs is average (7.6% delta to prev. frequency)
Overall 100 - 16.000 Hz
(±) | linearity of overall sound is average (21.9% difference to median)
Compared to same class
» 74% of all tested devices in this class were better, 6% similar, 20% worse
» The best had a delta of 5%, average was 18%, worst was 53%
Compared to all devices tested
» 63% of all tested devices were better, 7% similar, 30% worse
» The best had a delta of 4%, average was 23%, worst was 134%
Apple MacBook 12 (Early 2016) 1.1 GHz audio analysis
(+) | speakers can play relatively loud (83.6 dB)
Bass 100 - 315 Hz
(±) | reduced bass - on average 11.3% lower than median
(±) | linearity of bass is average (14.2% delta to prev. frequency)
Mids 400 - 2000 Hz
(+) | balanced mids - only 2.4% away from median
(+) | mids are linear (5.5% delta to prev. frequency)
Highs 2 - 16 kHz
(+) | balanced highs - only 2% away from median
(+) | highs are linear (4.5% delta to prev. frequency)
Overall 100 - 16.000 Hz
(+) | overall sound is linear (10.2% difference to median)
Compared to same class
» 7% of all tested devices in this class were better, 2% similar, 90% worse
» The best had a delta of 5%, average was 18%, worst was 53%
Compared to all devices tested
» 5% of all tested devices were better, 1% similar, 94% worse
» The best had a delta of 4%, average was 23%, worst was 134%
Energy Management
Power Consumption
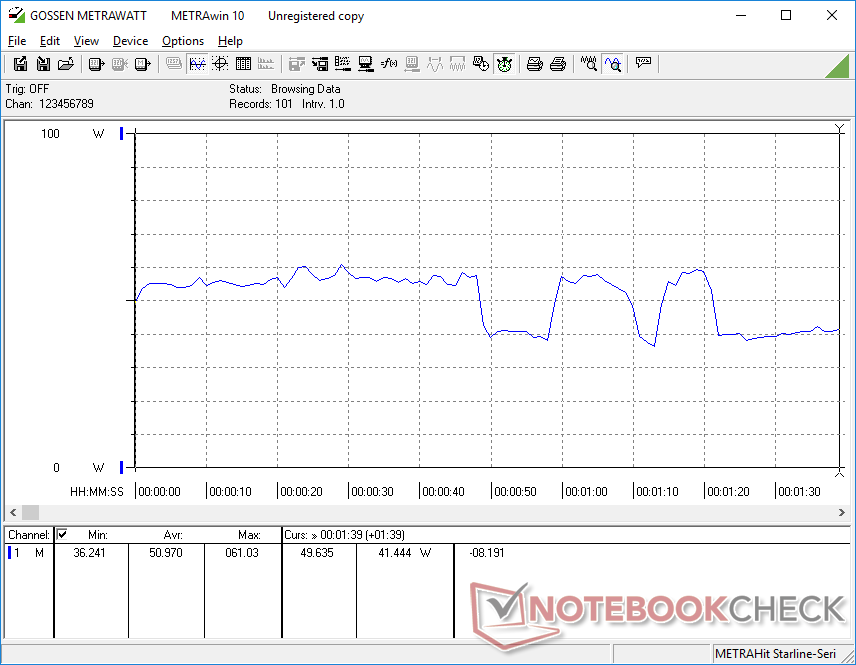
Idling on desktop demands anywhere between 3 W and 10 W depending on the brightness setting and power profile to be similar to other Ultrabooks powered by U-class Core ix CPUs. When under higher loads like gaming, consumption jumps to the 39 W to 51 W range compared to only 39 W on the ZenBook UX391 equipped with slower integrated graphics. The Razer Blade Stealth consumes about 15 W more than the UX392 when gaming which, perhaps not coincidentally, is the TDP difference between the 10 W GeForce MX150 and 25 W GeForce MX150.
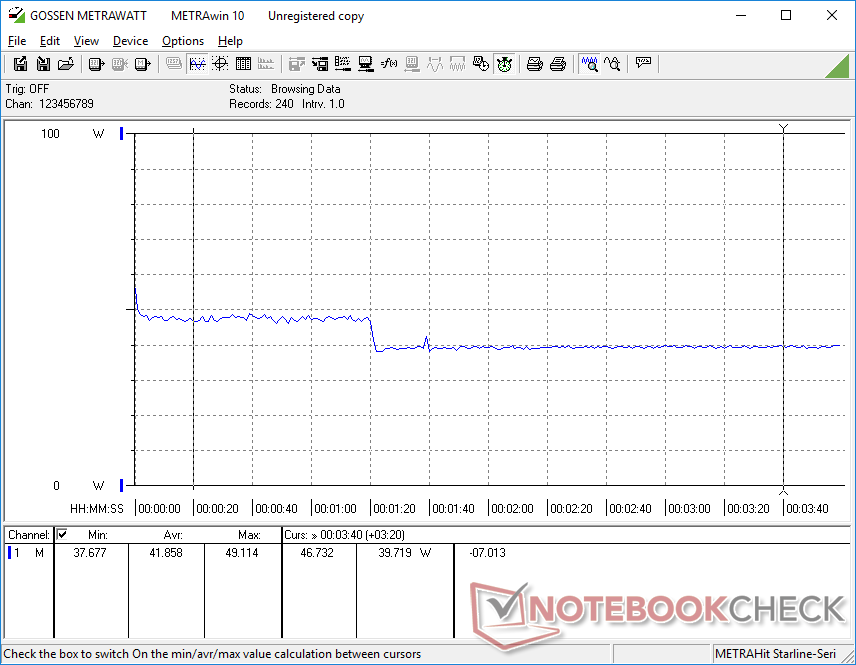
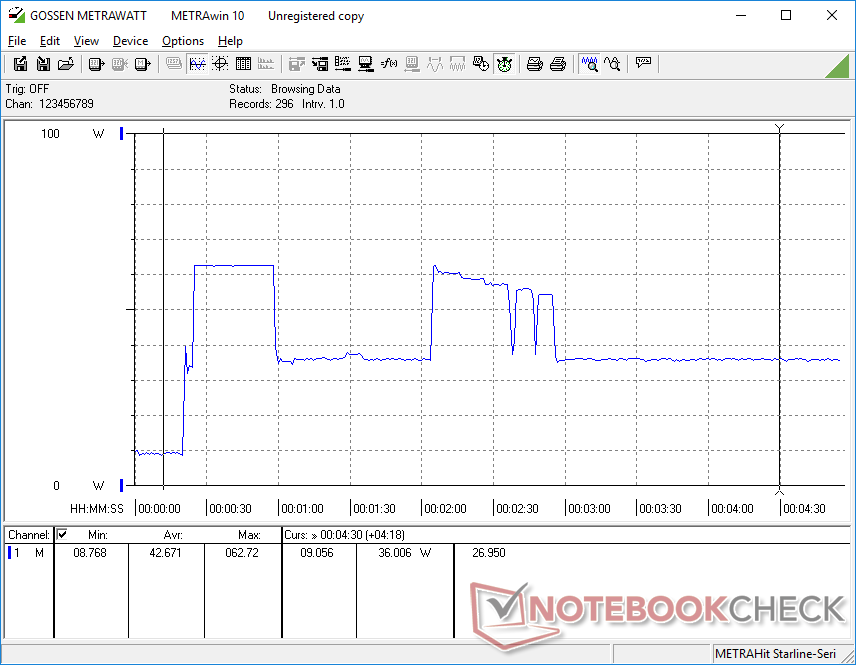
We're able to record a maximum consumption of a 62.7 W from the small (~6.4 x 6.4 x 2.8 cm) 65 W AC adapter when running both Prime95 and FurMark simultaneously. As shown by our graph below, however, consumption falls after about 30 seconds due to throttling.
| Off / Standby | |
| Idle | |
| Load |
|
Key:
min: | |
| Asus ZenBook S13 UX392FN i7-8565U, GeForce MX150, WDC PC SN520 SDAPNUW-512G, IPS, 1920x1080, 13.9" | Dell XPS 13 9380 2019 i5-8265U, UHD Graphics 620, SK hynix PC401 HFS256GD9TNG, IPS, 3840x2160, 13.3" | Asus ZenBook S UX391U i5-8550U, UHD Graphics 620, Samsung PM961 NVMe MZVLW512HMJP, IPS, 1920x1080, 13.3" | Huawei Matebook X Pro i5 i5-8250U, GeForce MX150, Samsung PM961 MZVLW256HEHP, IPS, 3000x2000, 13.9" | Lenovo Yoga C930-13IKB i5-8250U, UHD Graphics 620, SK hynix PC401 HFS256GD9TNG, IPS, 1920x1080, 13.9" | Razer Blade Stealth i7-8565U i7-8565U, GeForce MX150, Lite-On CA3-8D256-Q11, IPS, 1920x1080, 13.3" | |
|---|---|---|---|---|---|---|
| Power Consumption | -6% | 12% | -10% | 7% | -36% | |
| Idle Minimum * (Watt) | 3.4 | 4.8 -41% | 3.24 5% | 3.5 -3% | 3.3 3% | 6.7 -97% |
| Idle Average * (Watt) | 6.3 | 8.6 -37% | 6.1 3% | 8.9 -41% | 6.8 -8% | 8.6 -37% |
| Idle Maximum * (Watt) | 10.4 | 10.4 -0% | 9.2 12% | 12.3 -18% | 9.5 9% | 9.4 10% |
| Load Average * (Watt) | 51 | 37.9 26% | 38.8 24% | 54.2 -6% | 40.8 20% | 64.1 -26% |
| Witcher 3 ultra * (Watt) | 39 | 42.4 -9% | 63.7 -63% | |||
| Load Maximum * (Watt) | 62.7 | 48.5 23% | 52.6 16% | 52.1 17% | 57 9% | 64.1 -2% |
* ... smaller is better
Battery Life
Battery capacity has not changed from the UX391 and battery life is subsequently similar gen-to-gen. Users can expect about 8.5 hours of real-world WLAN use to be in the same ballpark as the XPS 13 and ZenBook UX391.
Charging from empty to full capacity takes about 2 hours. The AC adapter can also be used to charge other USB Type-C devices including smartphones.
| Asus ZenBook S13 UX392FN i7-8565U, GeForce MX150, 50 Wh | Dell XPS 13 9380 2019 i5-8265U, UHD Graphics 620, 52 Wh | Asus ZenBook S UX391U i5-8550U, UHD Graphics 620, 50 Wh | Huawei Matebook X Pro i5 i5-8250U, GeForce MX150, 57.4 Wh | Lenovo Yoga C930-13IKB i5-8250U, UHD Graphics 620, 60 Wh | HP Spectre x360 13t-ae000 i5-8550U, UHD Graphics 620, 60 Wh | Razer Blade Stealth i7-8565U i7-8565U, GeForce MX150, 53.1 Wh | |
|---|---|---|---|---|---|---|---|
| Battery runtime | 0% | -4% | 4% | 6% | 2% | 5% | |
| Reader / Idle (h) | 28.5 | 17.2 -40% | 22.3 -22% | 20.7 -27% | 23.9 -16% | 20.5 -28% | |
| WiFi v1.3 (h) | 8.4 | 8.3 -1% | 8.2 -2% | 9.3 11% | 9.2 10% | 7.1 -15% | 9.5 13% |
| Load (h) | 1.7 | 2.4 41% | 1.9 12% | 2.2 29% | 2.1 24% | 2 18% | 2.2 29% |
Pros
Cons
Verdict
The Asus ZenBook S13 UX392 holds a lot of promises. It's supposed to have the world's slimmest bezels, world's largest screen-to-body ratio, and the world's slimmest design with discrete Nvidia graphics. By aiming for these lofty goals, Asus has created a 13.9-inch that's lighter or smaller than many of the newest 13.3-inch Ultrabooks in the market including the Dell XPS 13 9380 or HP Spectre 13. The UX392 even manages to be more graphically capable as it is not limited to integrated UHD graphics unlike on most Ultrabooks. The fact that it offers a larger display with more GPU horsepower without being any bigger or heavier makes it an extremely compelling recommendation over the aforementioned alternatives.
There are a handful of drawbacks to keep in mind. The absence of Thunderbolt 3, for example, means users who wish to daisy-chain 4K UHD externals monitors or use eGPU docking stations will be out of luck. Meanwhile, the 10 W GeForce MX150 GPU is measurably slower than the 25 W version and CPU Turbo Boost sustainability is mediocre. Both the competing Huawei MateBook 13 and Razer Blade Stealth are each equipped with the same CPU and faster 25 W GPU to show that Asus can do better in the performance front. The sticky trackpad also makes cursor control less smooth than on the Dell and HP equivalents.
Finally, there are a couple of minor cut corners worth mentioning. The minimal upgrade options, average MicroSD performance, and PCIe x2 SSD instead of PCIe x4 are odd to see on a flagship Ultrabook. These fortunately don't impact day-to-day performance unless if you're a big proponent of Wi-Fi 6, touchscreen/WACOM features, WWAN, or expandable RAM. Otherwise, this is certainly a subnotebook that should be on the top of everyone's shopping list.
If you're about to buy a 13-inch Ultrabook, then stop and take a look at the Asus ZenBook S13 UX392. There is a good chance that it will offer what you are looking for but with a larger display and faster GPU while being just as small and lightweight.
Asus ZenBook S13 UX392FN
- 05/01/2019 v6 (old)
Allen Ngo
Price comparison
