Asus E203MA (N5000, UHD605) Laptop Review

In our tests, Asus repeatedly proves that the manufacturer knows how to handle both sophisticated business devices, such as the Asus Zenbook S UX391U, as well as affordable entry-level models, such as the Asus VivoBook E12 E203NA. The latter category also includes our current review unit, the Asus VivoBook E203MA.
For less than 350 Euros (~$392) the device offers the Intel Pentium Silver N5000 quad-core processor with integrated UHD Graphics 605 graphics unit, four GB of RAM and 64 GB internal eMMC flash memory. According to the manufacturer, the 11.6-inch laptop has a battery life of ten hours, which should be possible given the 38 Wh battery.
Due to its small size and modest hardware, the E203MA competes with numerous low-priced Chromebooks on the market, but as a Windows device it should also be comparable to other inexpensive laptops on the same platform. Therefore, for this test we choose the following competing models for our comparison: Lenovo V130-14IGM, NuVision Encite Book 12 Plus, Chuwi LapBook SE and Trekstor Yourbook C11B.
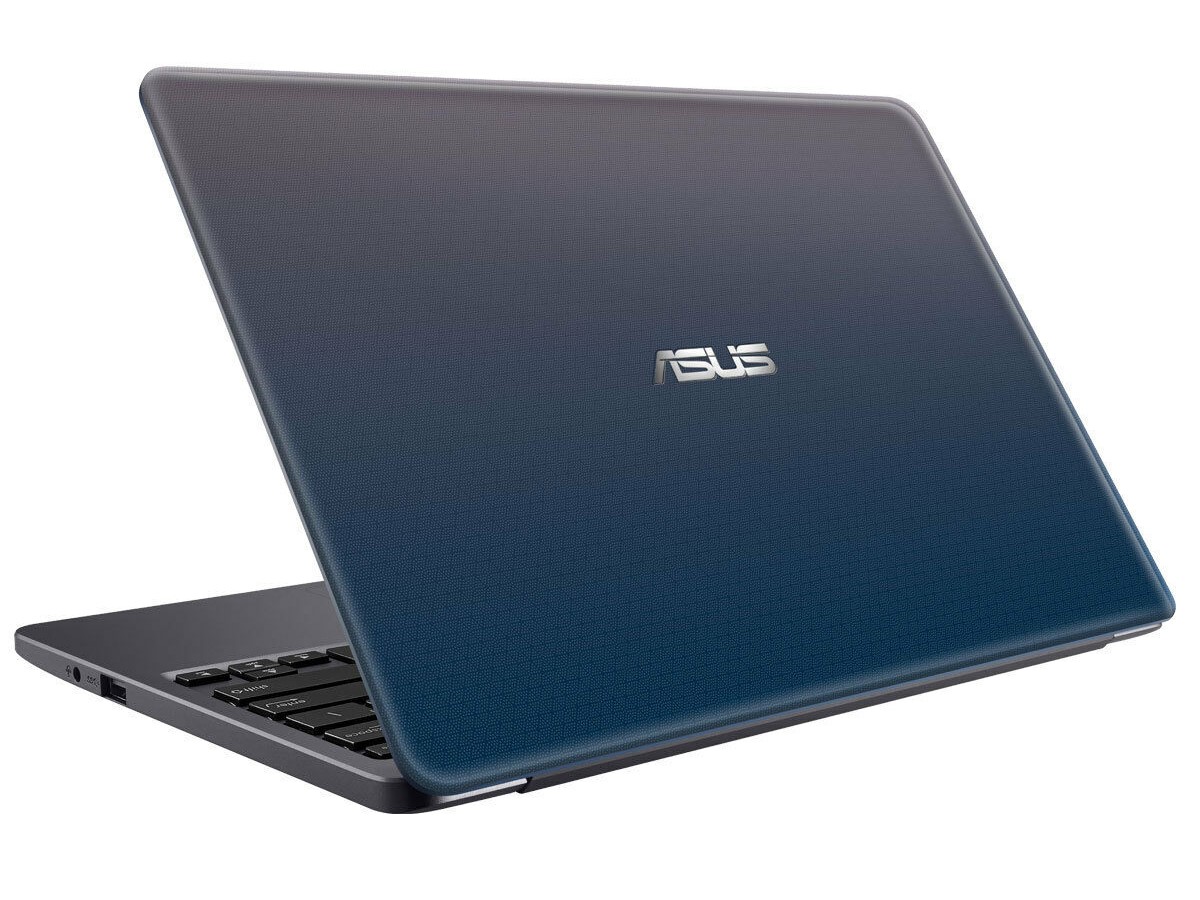
Case & Equipment - A Light Laptop with ac-WLAN
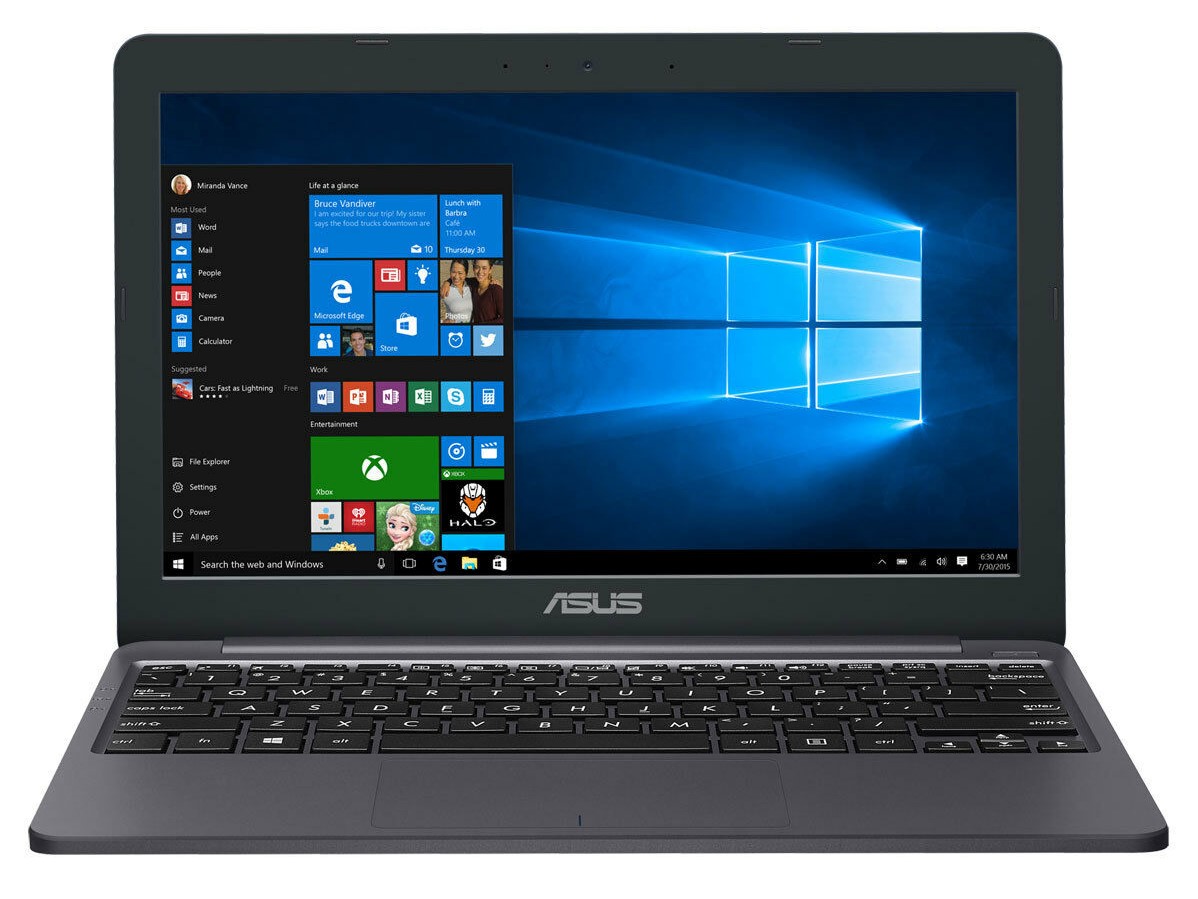
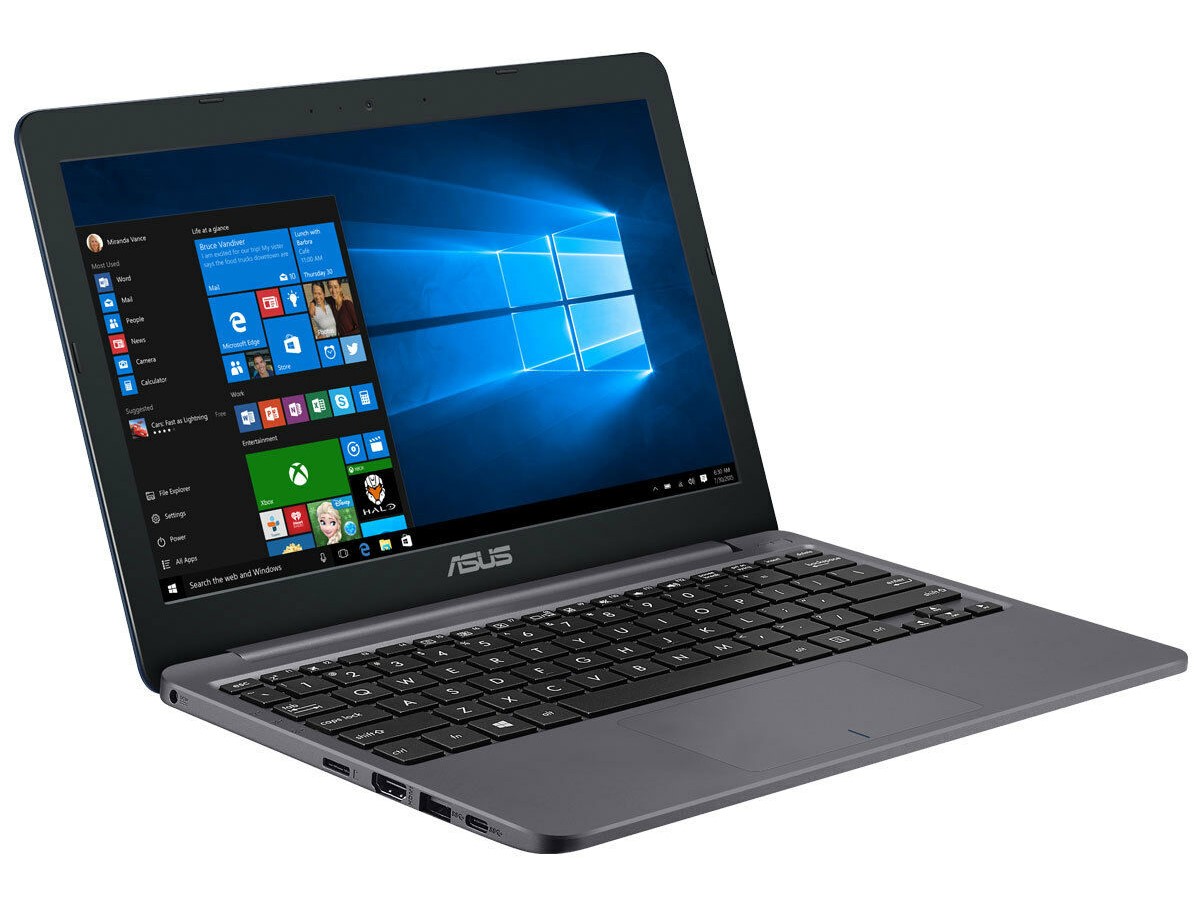
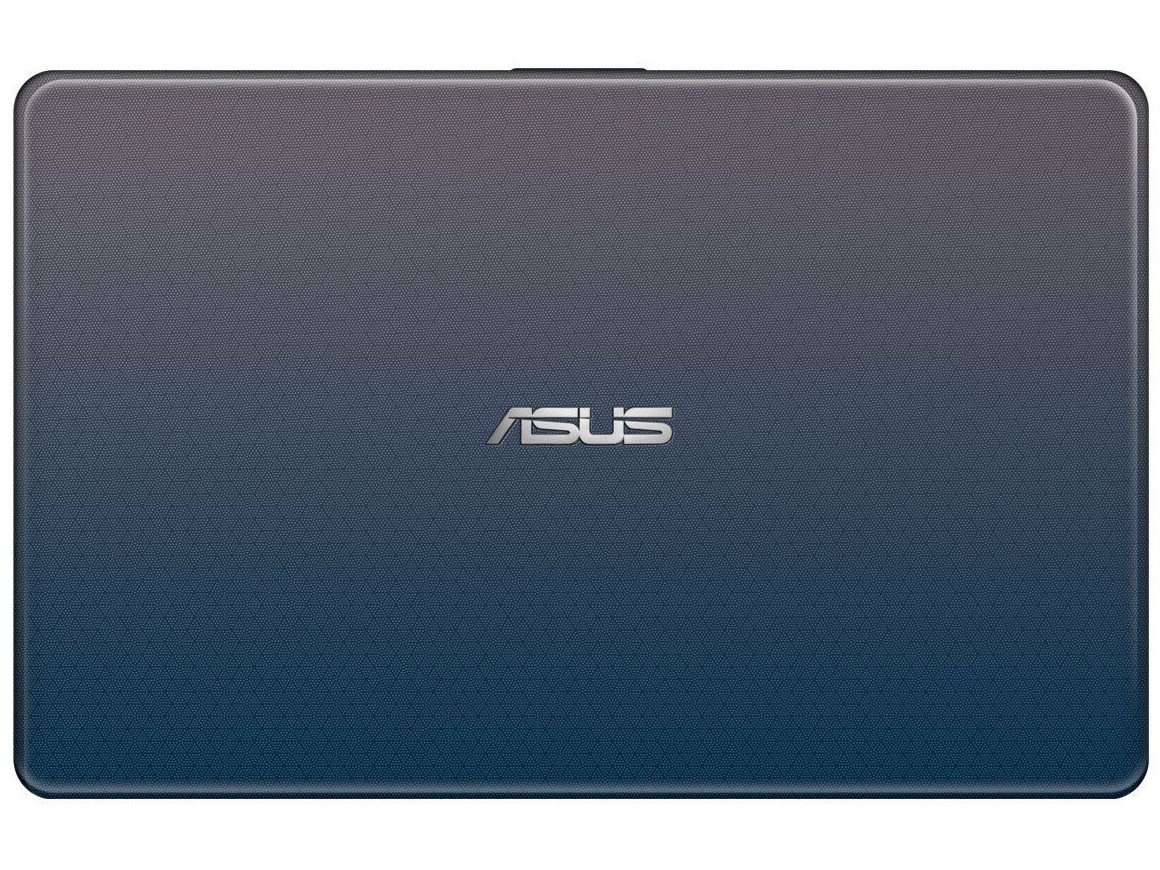
Asus uses plastic for manufacturing the case of the E203MA and decorates the top of the lid with a honeycomb pattern. The surfaces of the inner sides are in dark gray and provide a robust impression. Due to its compact dimensions, the Asus laptop looks very stable overall. However, the lid yields when a bit of pressure is applied and the bottom right corner creaks occasionally when the laptop is held against it.
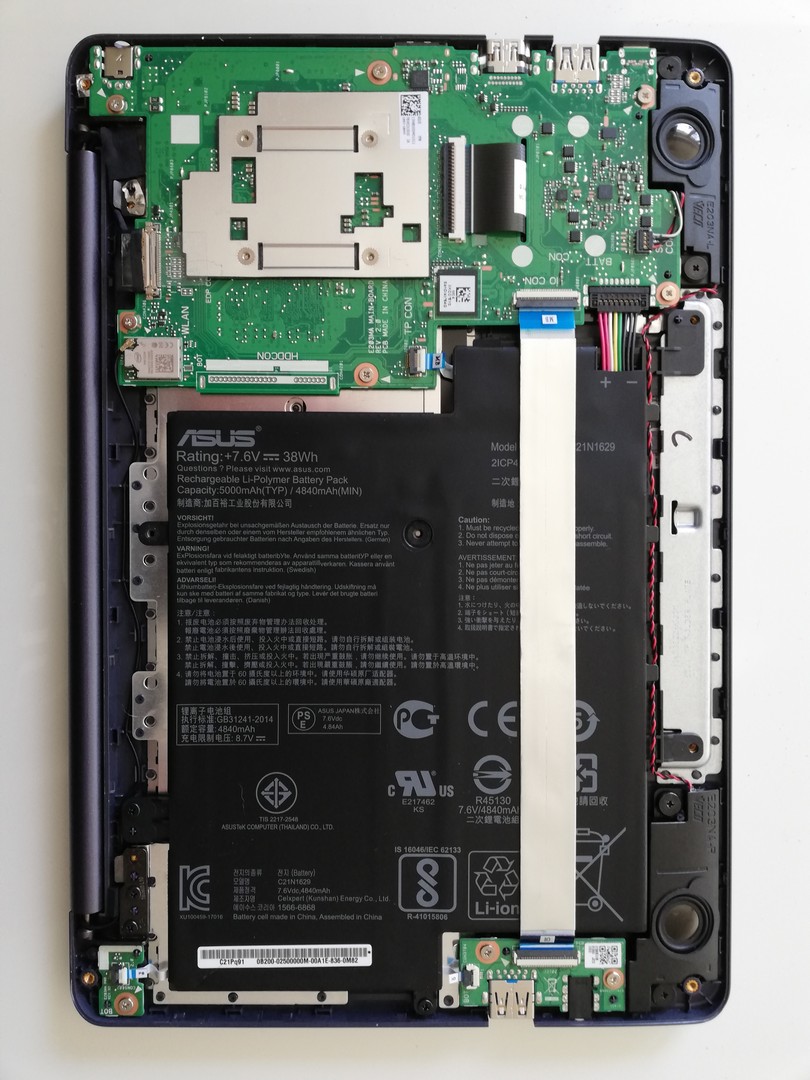
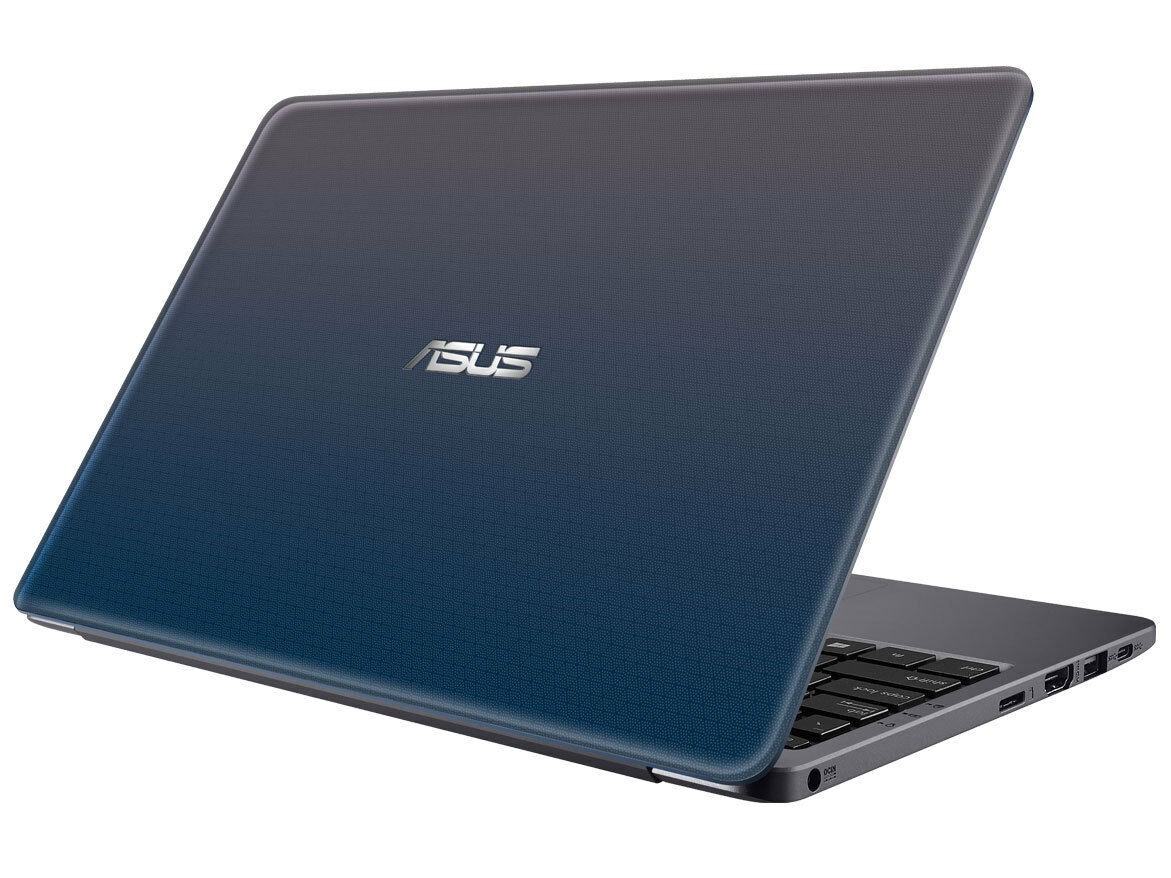
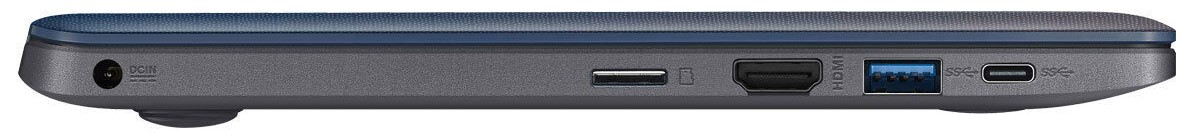
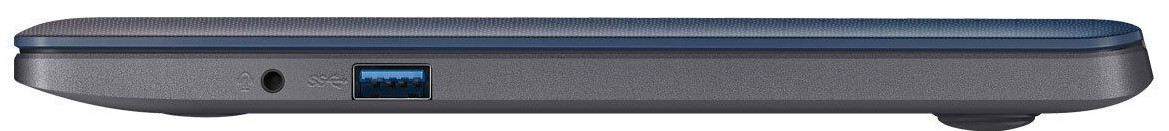
The bottom can be removed easily after loosening several screws. Inside, however, there is no opportunity for changes to be made by users. A fan for cleaning is not available and all memory components as well as the WLAN module are soldered. In terms of connectivity, Asus delivers only the basics. All USB ports are compliant with the 3.1 Gen1 standard though. Furthermore, a USB Type-C port is available.
The internal memory of the Asus E203MA can be expanded via a microSD card reader. In our test, the latter achieves a reading speed of 39.9 MB/s and thus outperforms the competition devices in our test field. Compared with the results of all notebooks tested by us however, the performance of the SD card reader is just below average.
In our WLAN test, the Asus laptop achieves average data transfer rates of 289 Mbps (reception) and 330 Mbps (transmission). This puts our test device on par with comparable laptops. The fast 802.11 ac standard is also supported which enables usage in the 5-GHz band range.
Connectivity
| SD Card Reader - maximum AS SSD Seq Read Test (1GB) | |
| Average of class Subnotebook (24.9 - 195, n=8, last 2 years) | |
| Asus E203MA-FD825TS (Toshiba Exceria Pro M501 microSDXC 64GB) | |
| Chuwi LapBook SE | |
| Trekstor Yourbook C11B (Toshiba Exceria Pro M501 microSDXC 64GB) | |
| Lenovo V130-14IGM (Toshiba Exceria Pro SDXC 64 GB UHS-II) | |
| Networking | |
| iperf3 transmit AX12 | |
| Trekstor Yourbook C11B | |
| Asus E203MA-FD825TS | |
| Lenovo V130-14IGM | |
| NuVision Encite Book 12 Plus | |
| Chuwi LapBook SE | |
| iperf3 receive AX12 | |
| NuVision Encite Book 12 Plus | |
| Chuwi LapBook SE | |
| Trekstor Yourbook C11B | |
| Lenovo V130-14IGM | |
| Asus E203MA-FD825TS | |
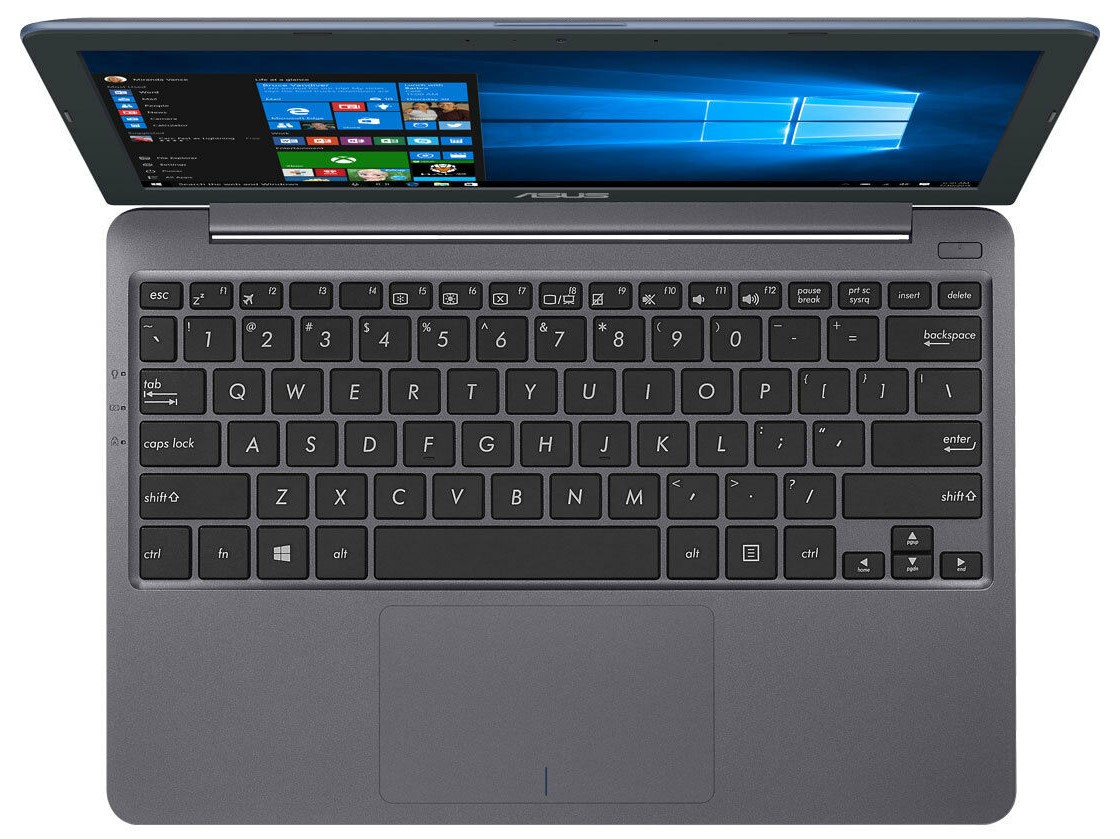
Input Devices - Asus Laptop with a Good Touchpad
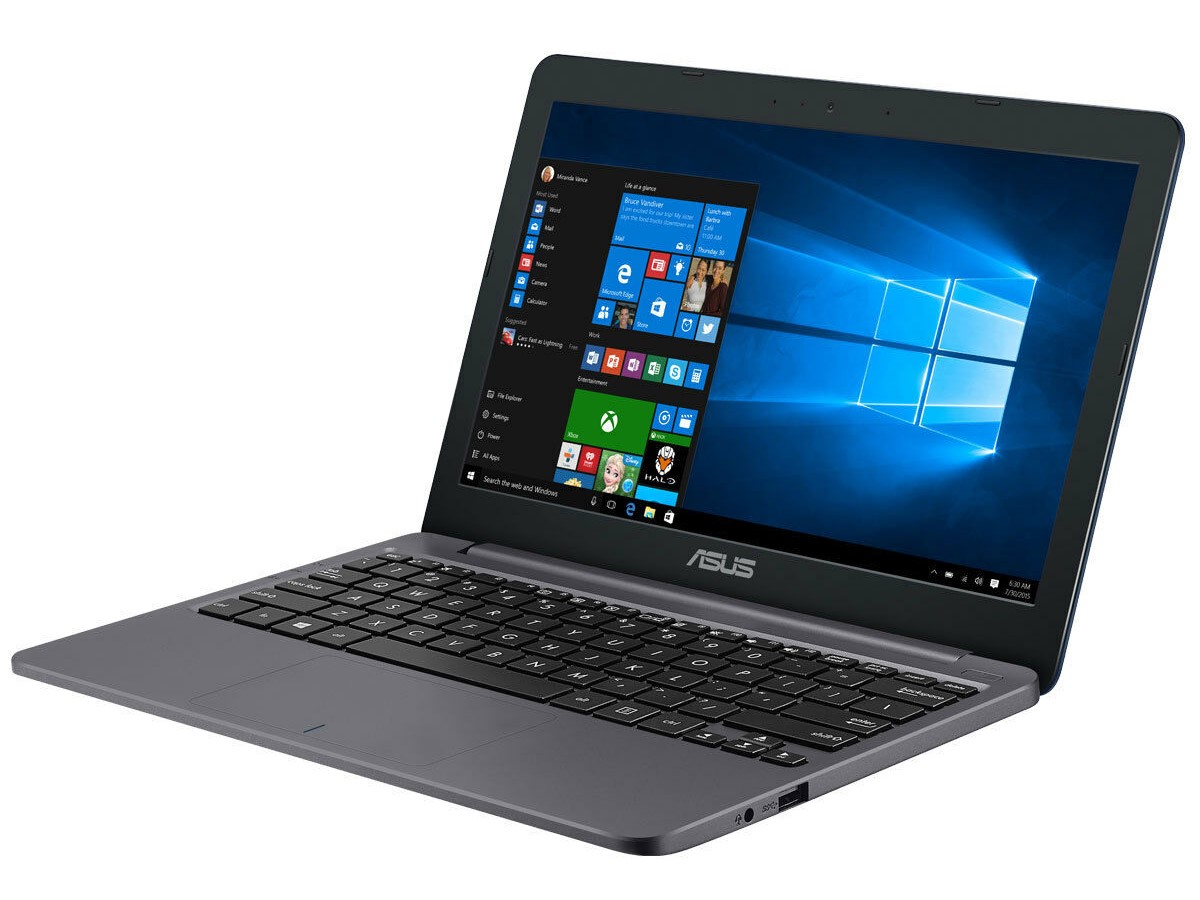
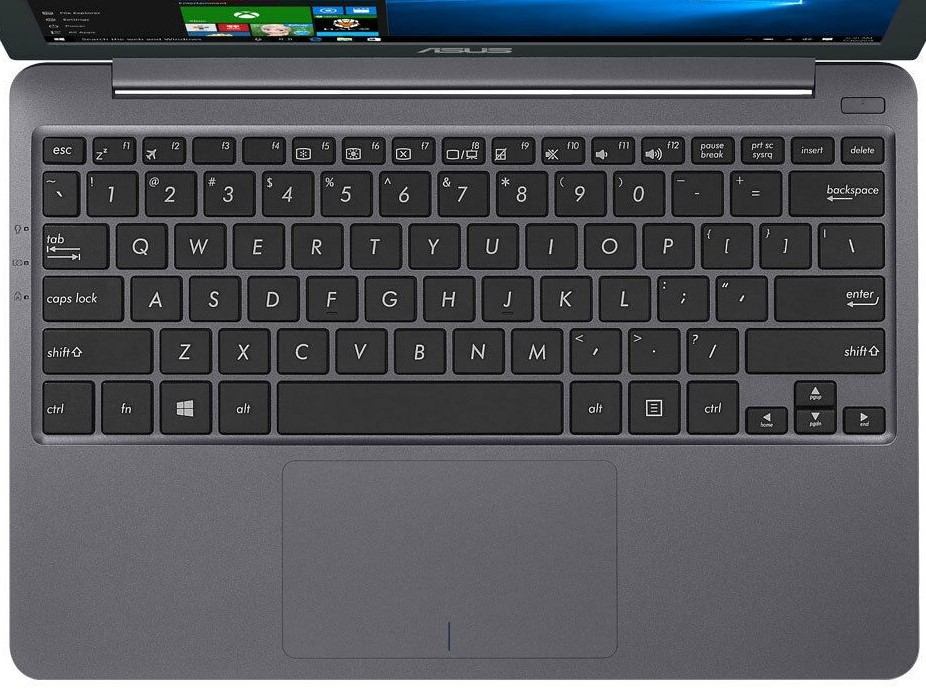
The keyboard of the Asus E203MA is not made for big hands. The keys are quite small, close together and provide a soft pressure point. However, after some time to adapt, typing works well. Only the arrow and function keys are not intuitively accessible.
As a mouse replacement, users can resort to a ClickPad which is appropriately sized for an 11-inch laptop. This provides a crisp feedback when the left and right mouse buttons are released. In addition, it reacts reliably to our input at every point.
Display - A Laptop with a TN Panel

The screen of the Asus EM203MA consists of an 11.6-inch TN LED panel and offers a maximum resolution of 1366x720 pixels. With a brightness of 235 cd/m² on average, the luminosity is just sufficient for a place in the lower middle of our comparison device selection. The illumination, however, is rated as very good with 93 percent.
Asus does not offer alternative display versions for the E203MA.
| |||||||||||||||||||||||||
Brightness Distribution: 93 %
Center on Battery: 246 cd/m²
Contrast: 534:1 (Black: 0.44 cd/m²)
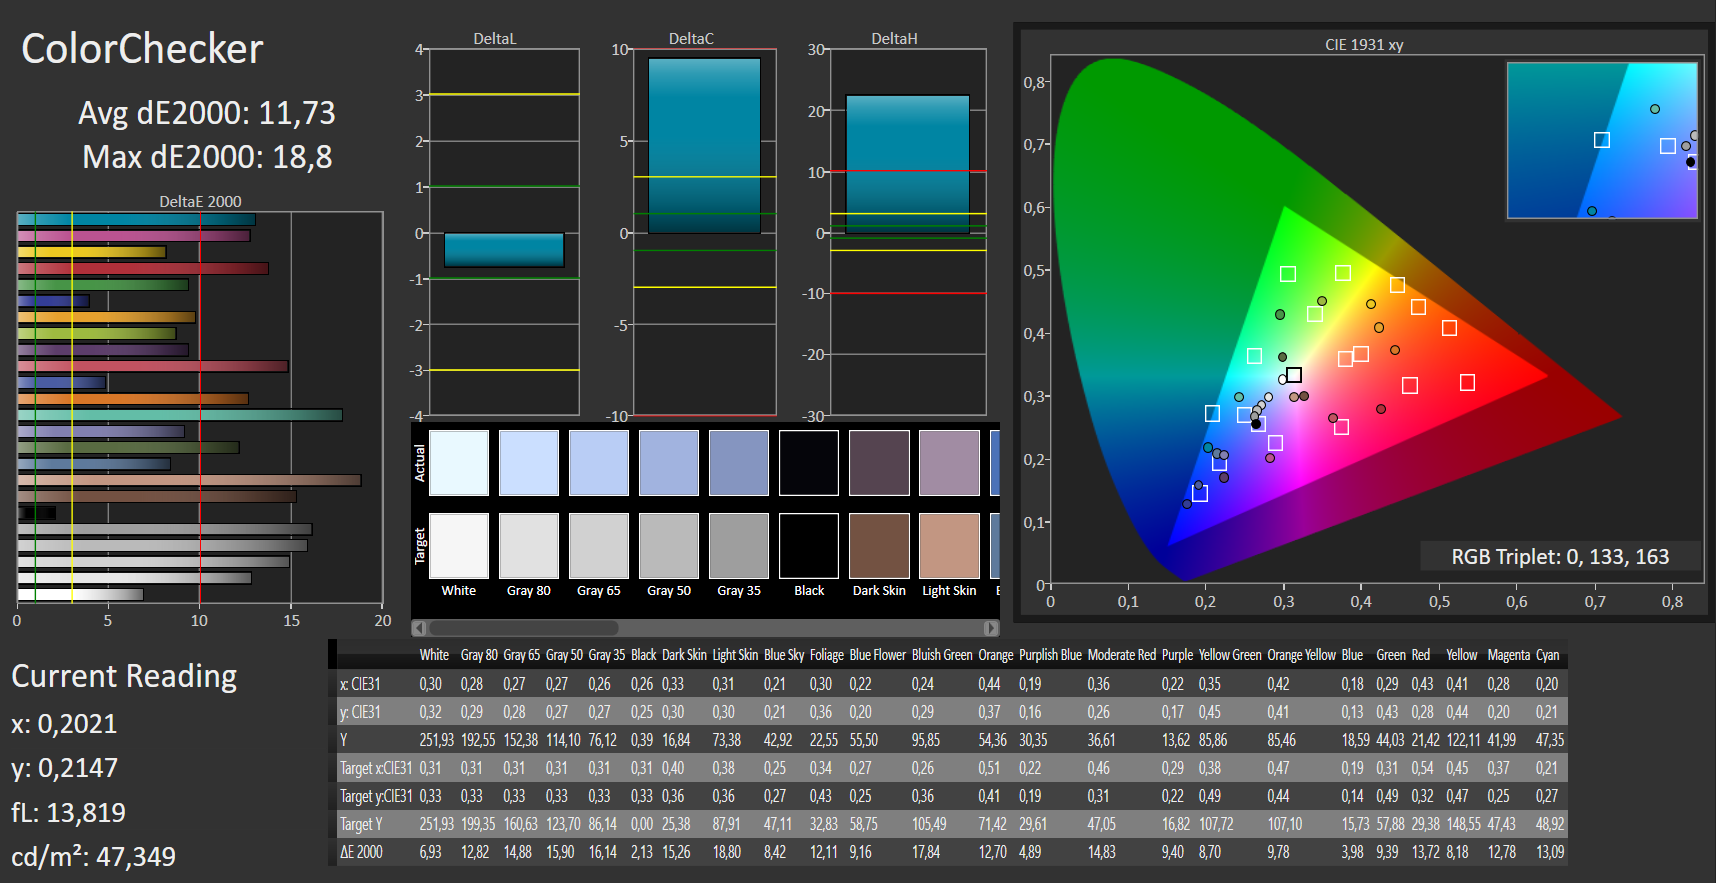
ΔE ColorChecker Calman: 11.73 | ∀{0.5-29.43 Ø4.73}
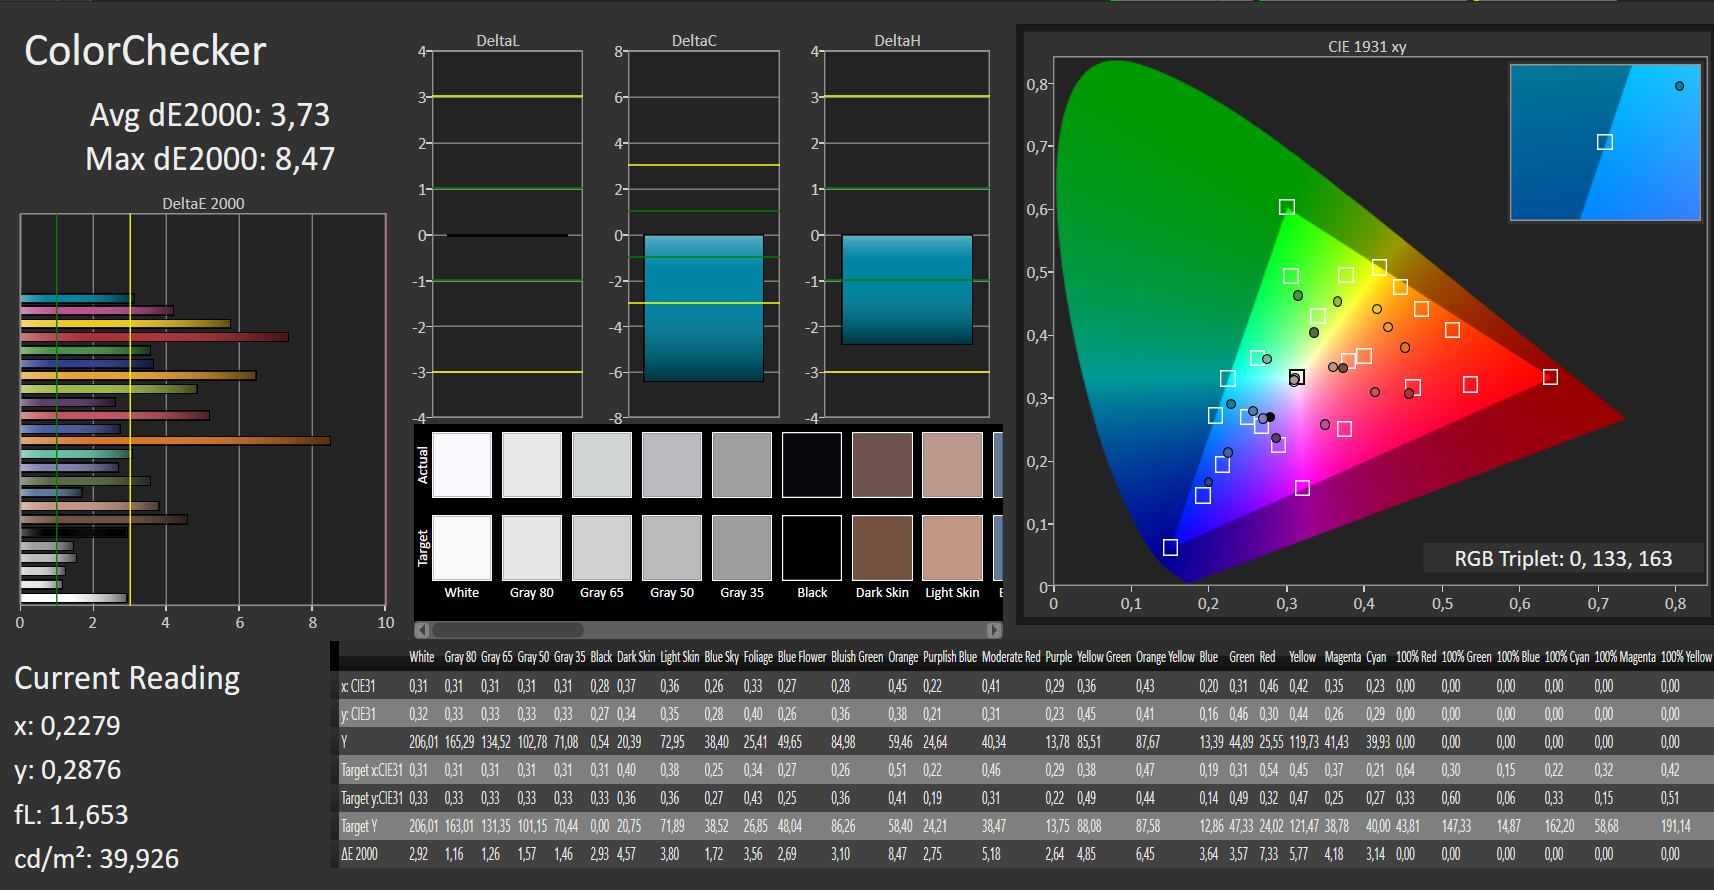
calibrated: 3.73
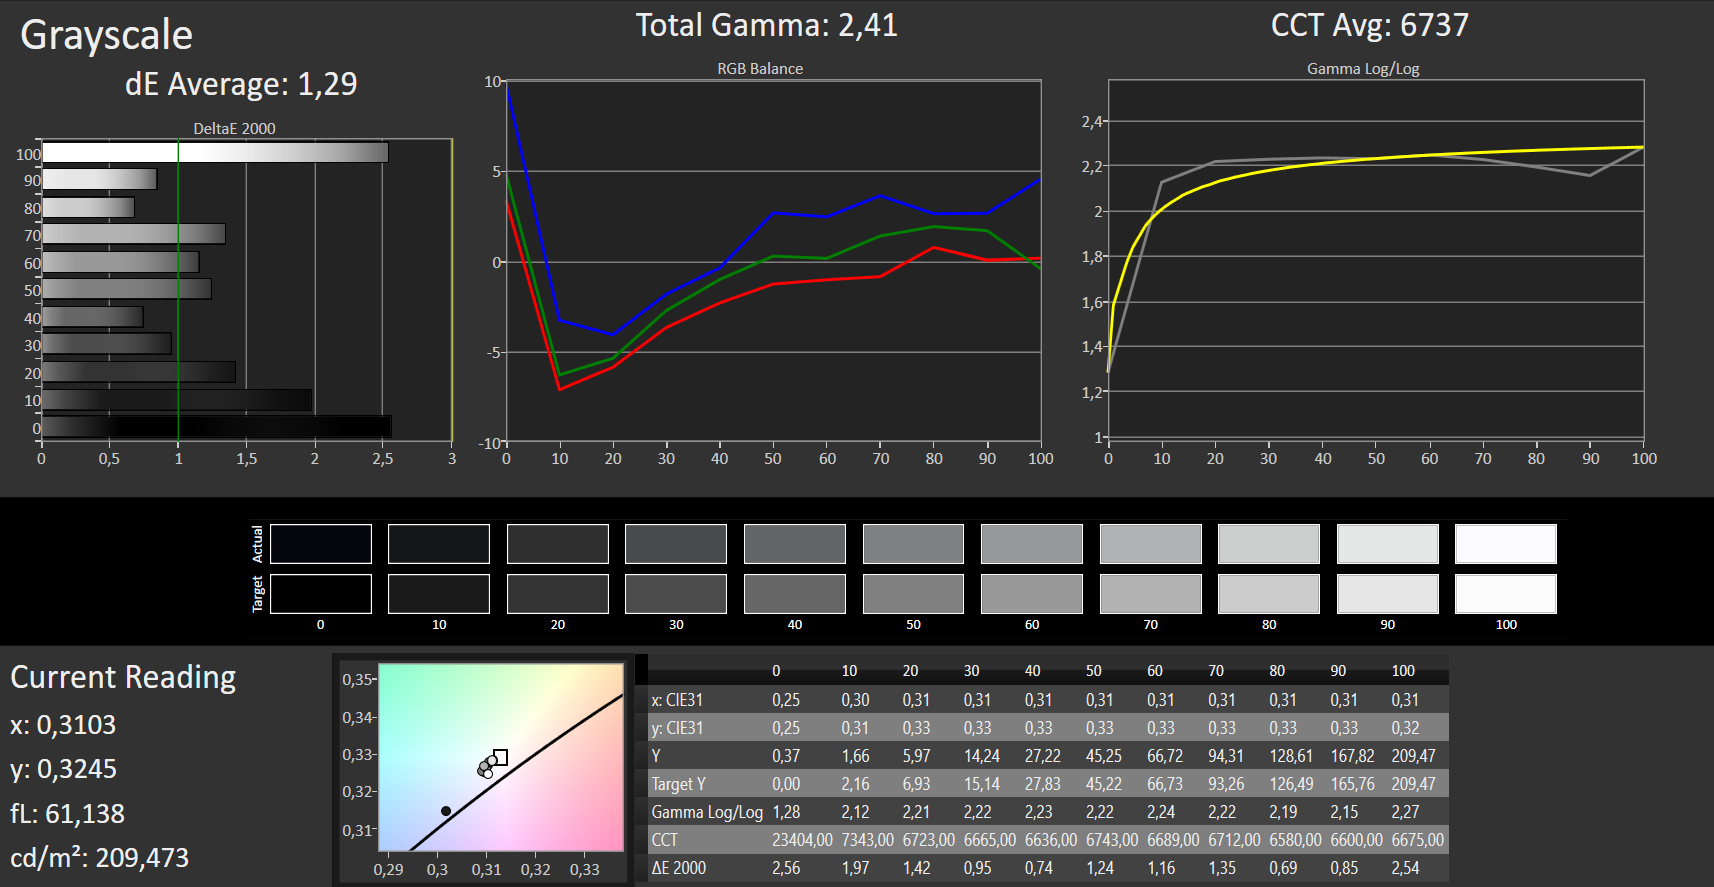
ΔE Greyscale Calman: 12.64 | ∀{0.09-98 Ø4.97}
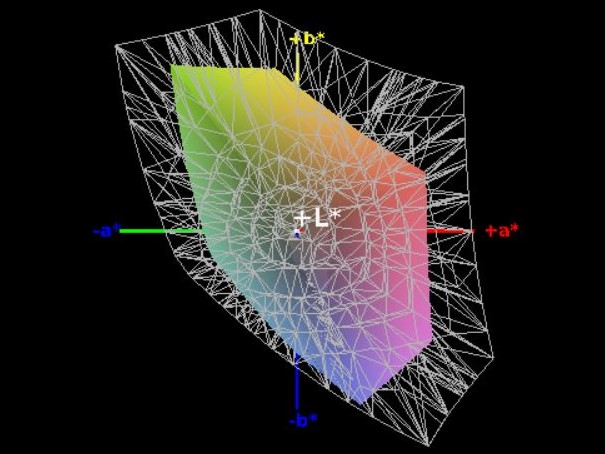
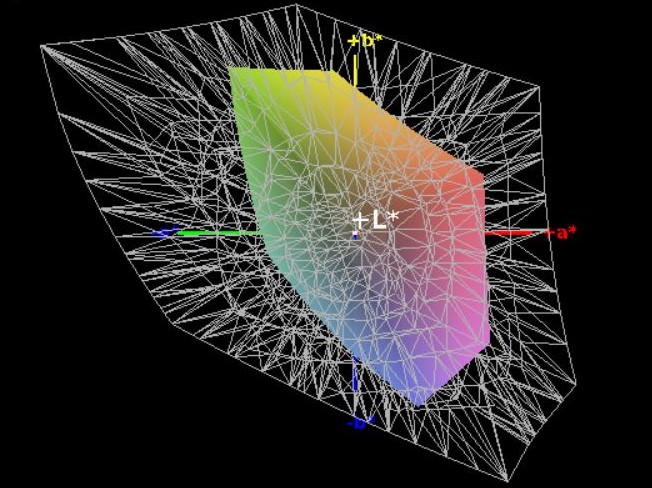
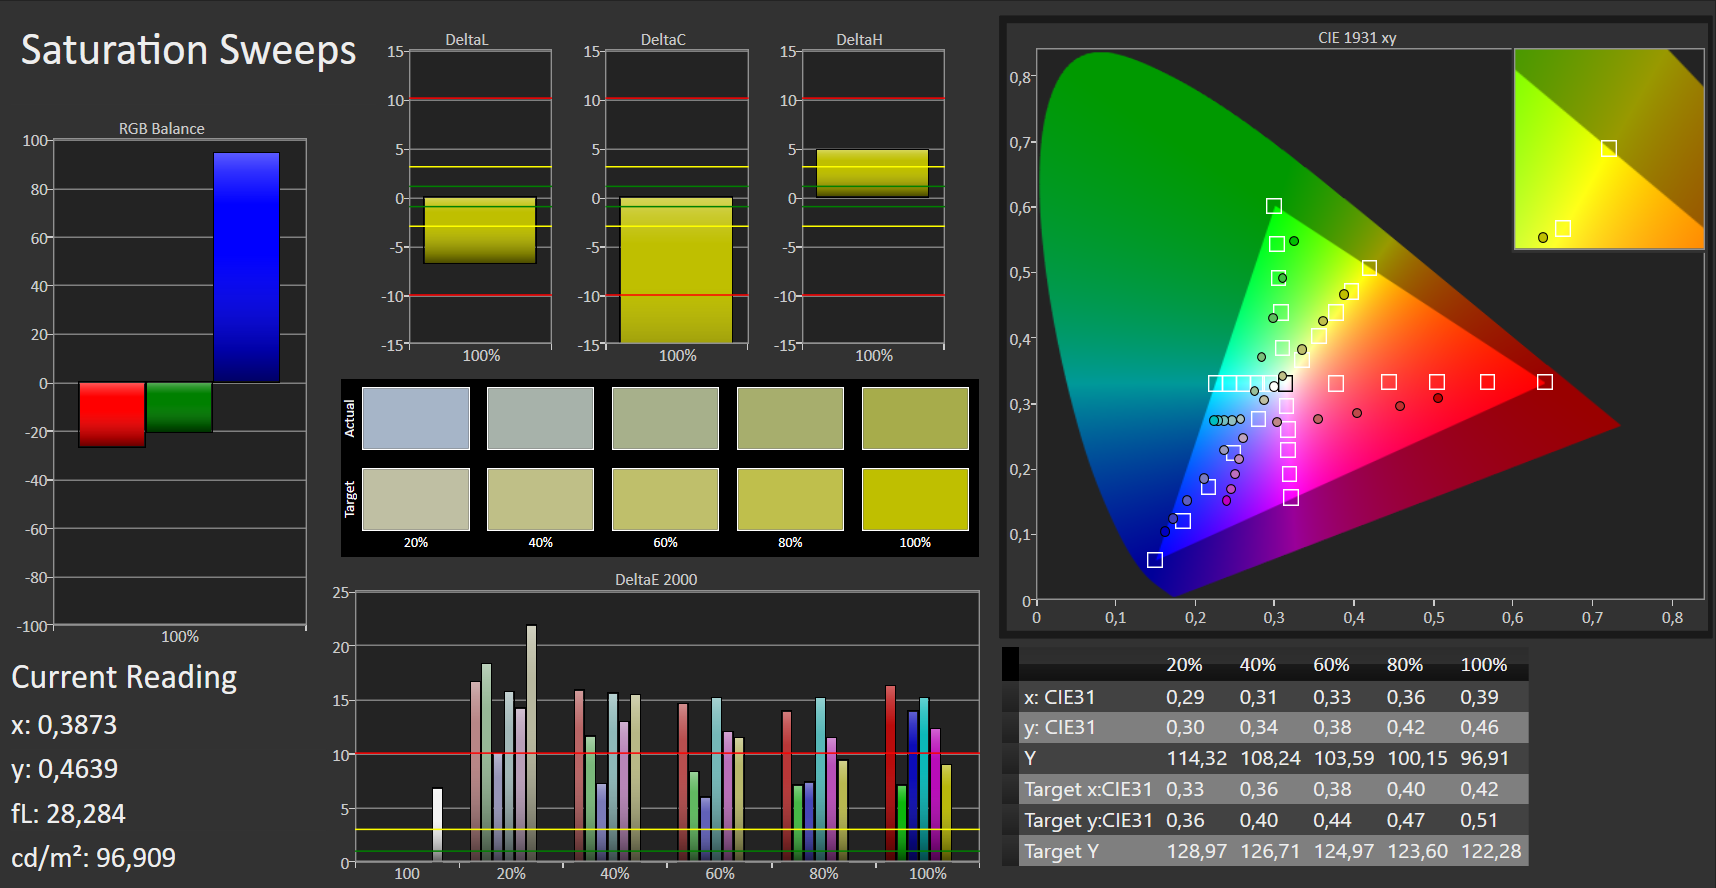
54% sRGB (Argyll 1.6.3 3D)
34% AdobeRGB 1998 (Argyll 1.6.3 3D)
36.94% AdobeRGB 1998 (Argyll 3D)
53.8% sRGB (Argyll 3D)
35.75% Display P3 (Argyll 3D)
Gamma: 2.61
CCT: 14819 K
| Asus E203MA-FD825TS AUO225C, , 1366x768, 11.6" | Lenovo V130-14IGM AU Optronics B140XTNE02.E, , 1366x768, 14" | NuVision Encite Book 12 Plus Sharp SHP142C, , 2560x1440, 12.5" | Chuwi LapBook SE 1920x1080, 13.3" | Trekstor Yourbook C11B LC116LF1L01, , 1920x1080, 11.6" | |
|---|---|---|---|---|---|
| Display | 1% | 99% | 79% | 77% | |
| Display P3 Coverage (%) | 35.75 | 36.23 1% | 74.8 109% | 65 82% | 64.4 80% |
| sRGB Coverage (%) | 53.8 | 54.5 1% | 98.9 84% | 94.8 76% | 92.5 72% |
| AdobeRGB 1998 Coverage (%) | 36.94 | 37.44 1% | 75.6 105% | 66.5 80% | 65.7 78% |
| Response Times | -29% | -104% | -87% | -111% | |
| Response Time Grey 50% / Grey 80% * (ms) | 41 ? | 52 ? -27% | 37.6 ? 8% | 39.2 ? 4% | 42 ? -2% |
| Response Time Black / White * (ms) | 10 ? | 13 ? -30% | 31.6 ? -216% | 27.7 ? -177% | 32 ? -220% |
| PWM Frequency (Hz) | 198.4 ? | 200 ? | 200 ? | ||
| Screen | -9% | 58% | 16% | 43% | |
| Brightness middle (cd/m²) | 235 | 234 0% | 431.5 84% | 227 -3% | 304 29% |
| Brightness (cd/m²) | 227 | 216 -5% | 406 79% | 210 -7% | 267 18% |
| Brightness Distribution (%) | 93 | 83 -11% | 80 -14% | 89 -4% | 77 -17% |
| Black Level * (cd/m²) | 0.44 | 0.51 -16% | 0.43 2% | 0.44 -0% | 0.28 36% |
| Contrast (:1) | 534 | 459 -14% | 1003 88% | 516 -3% | 1086 103% |
| Colorchecker dE 2000 * | 11.73 | 11.84 -1% | 3.56 70% | 6.6 44% | 7.28 38% |
| Colorchecker dE 2000 max. * | 18.8 | 25.17 -34% | 7 63% | 12.2 35% | 12.65 33% |
| Colorchecker dE 2000 calibrated * | 3.73 | 3.34 10% | 1.9 49% | 1.89 49% | |
| Greyscale dE 2000 * | 12.64 | 13.97 -11% | 2.9 77% | 7.9 37% | 8.34 34% |
| Gamma | 2.61 84% | 2.13 103% | 2.2 100% | 2.16 102% | 2.33 94% |
| CCT | 14819 44% | 18080 36% | 6572 99% | 8879 73% | 9038 72% |
| Color Space (Percent of AdobeRGB 1998) (%) | 34 | 35 3% | 66.7 96% | 60 76% | |
| Color Space (Percent of sRGB) (%) | 54 | 55 2% | 98.9 83% | 92 70% | |
| Total Average (Program / Settings) | -12% /
-9% | 18% /
46% | 3% /
15% | 3% /
30% |
* ... smaller is better
Display Response Times
| ↔ Response Time Black to White | ||
|---|---|---|
| 10 ms ... rise ↗ and fall ↘ combined | ↗ 6 ms rise | 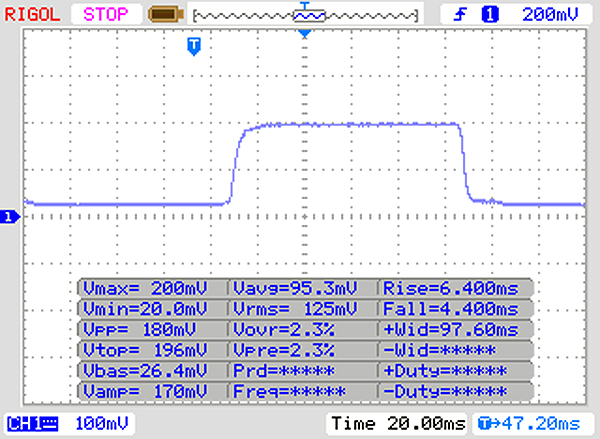 |
| ↘ 4 ms fall | ||
| The screen shows good response rates in our tests, but may be too slow for competitive gamers. In comparison, all tested devices range from 0.1 (minimum) to 240 (maximum) ms. » 27 % of all devices are better. This means that the measured response time is better than the average of all tested devices (19.9 ms). | ||
| ↔ Response Time 50% Grey to 80% Grey | ||
| 41 ms ... rise ↗ and fall ↘ combined | ↗ 22 ms rise | 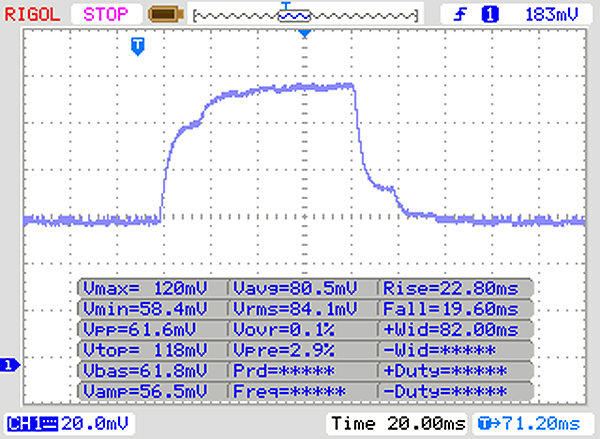 |
| ↘ 19 ms fall | ||
| The screen shows slow response rates in our tests and will be unsatisfactory for gamers. In comparison, all tested devices range from 0.165 (minimum) to 636 (maximum) ms. » 65 % of all devices are better. This means that the measured response time is worse than the average of all tested devices (31.1 ms). | ||
Screen Flickering / PWM (Pulse-Width Modulation)
| Screen flickering / PWM not detected | 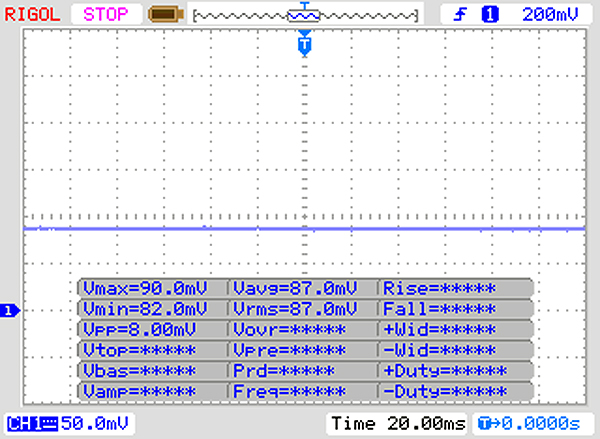 | ||
In comparison: 52 % of all tested devices do not use PWM to dim the display. If PWM was detected, an average of 7798 (minimum: 5 - maximum: 343500) Hz was measured. | |||
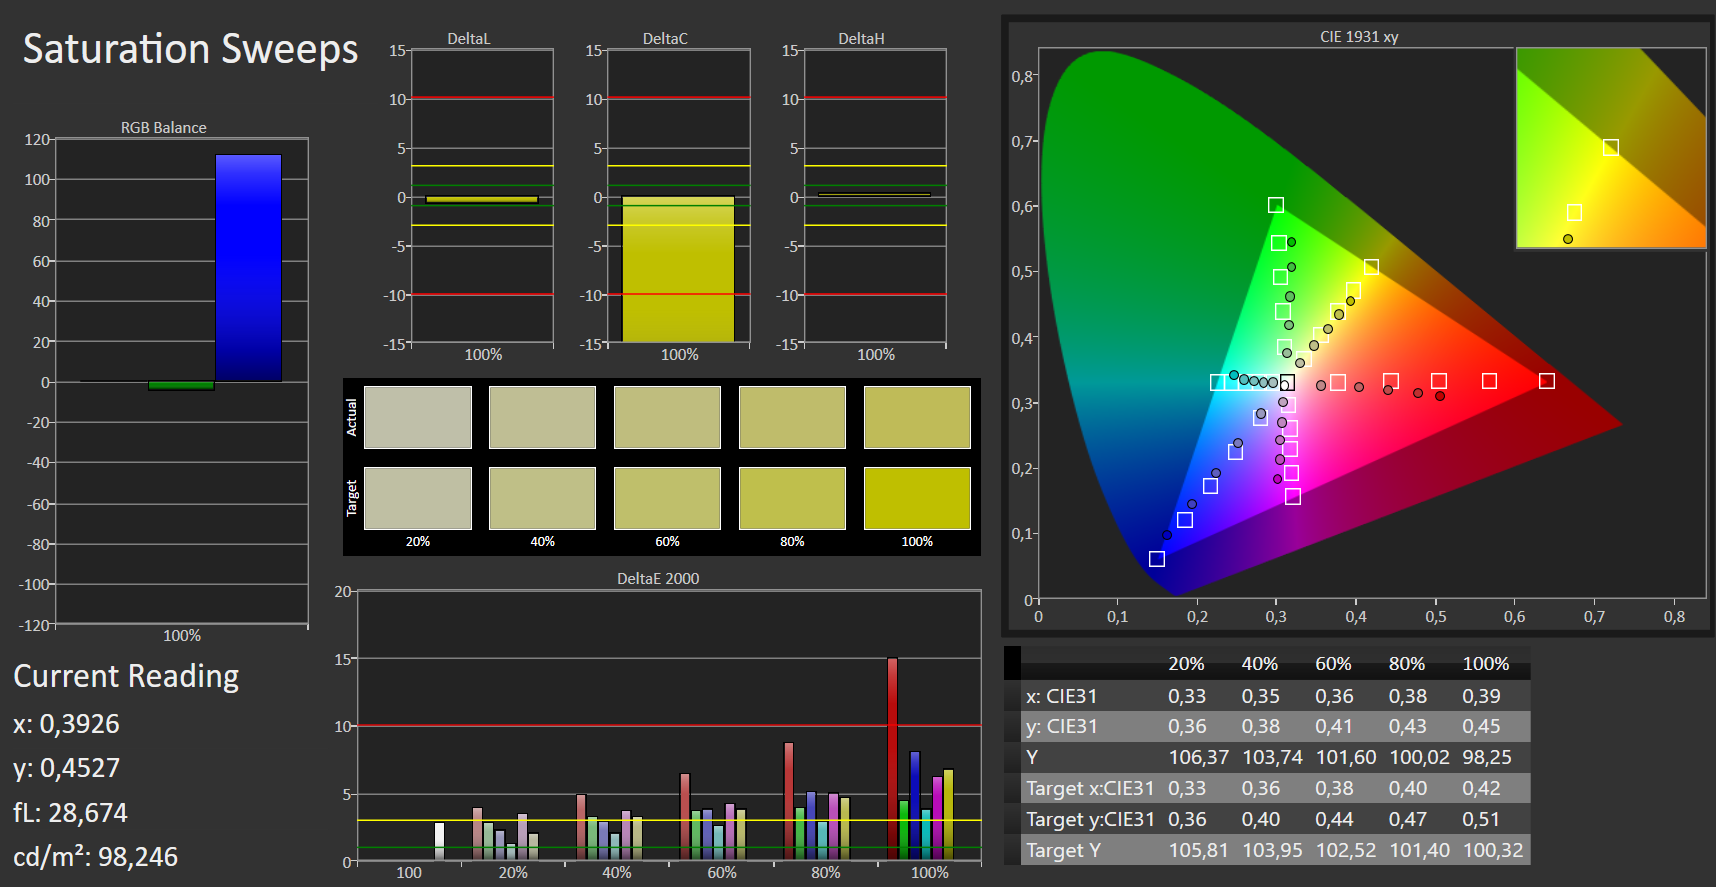
Our measurements of Asus E203MA's display characteristics show a mediocre contrast ratio of 534:1 and a black level of 0.44 cd/m² which is higher than common. In addition, the screen has a too low red level. This can be compensated by a calibration, but this results in a slightly increased blue level.
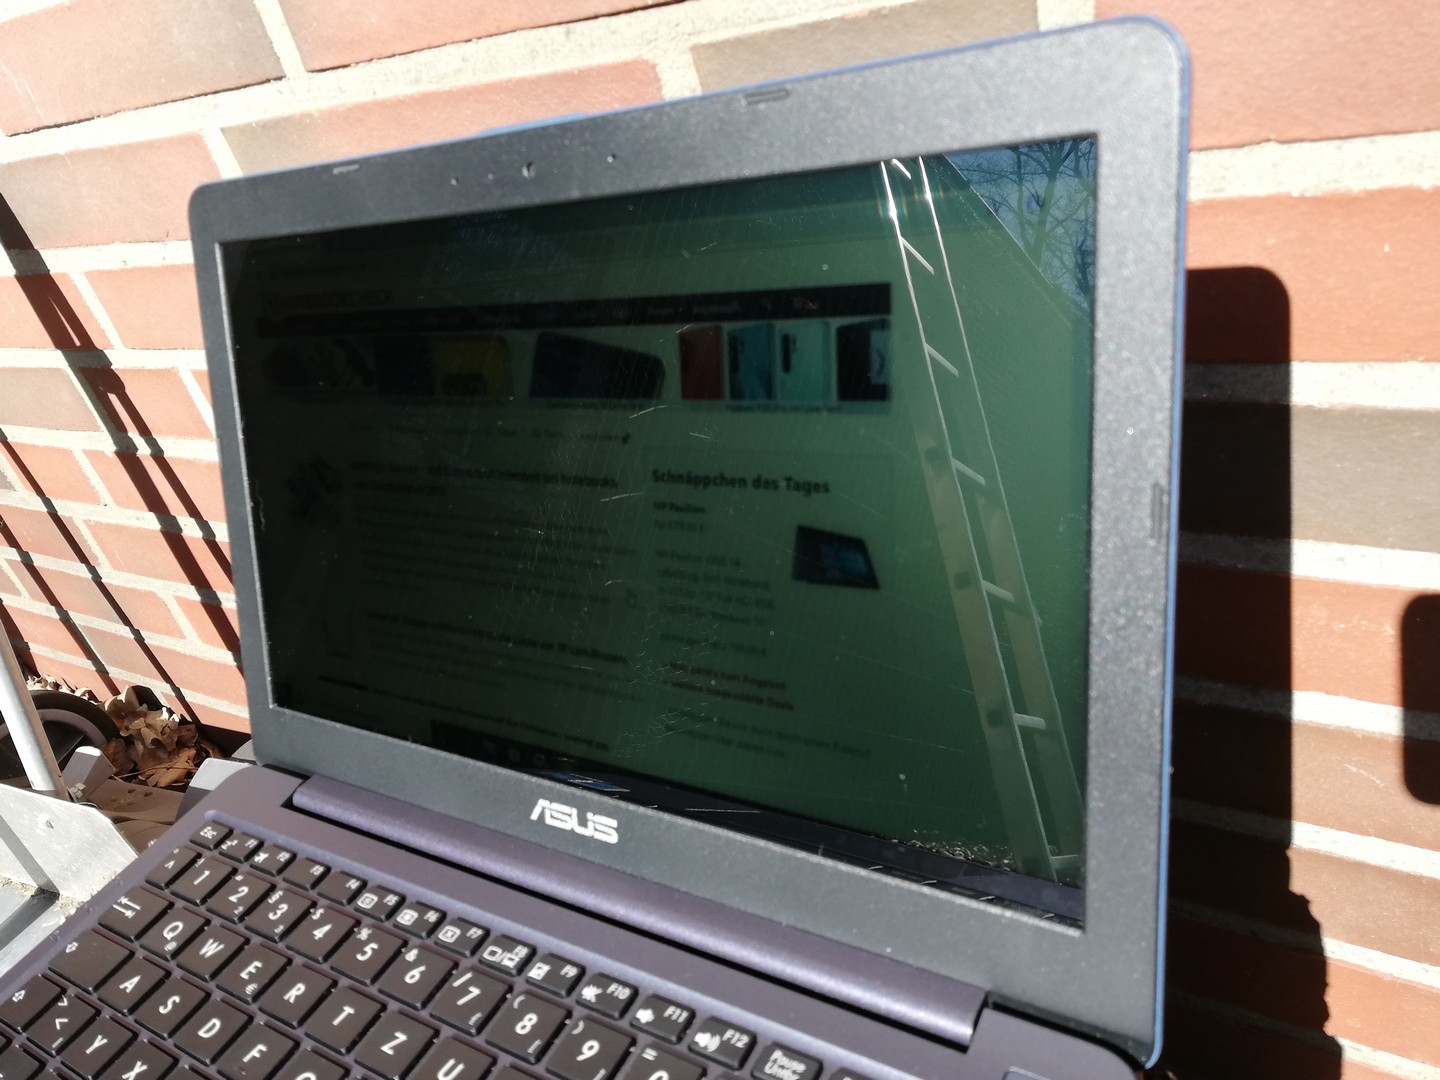
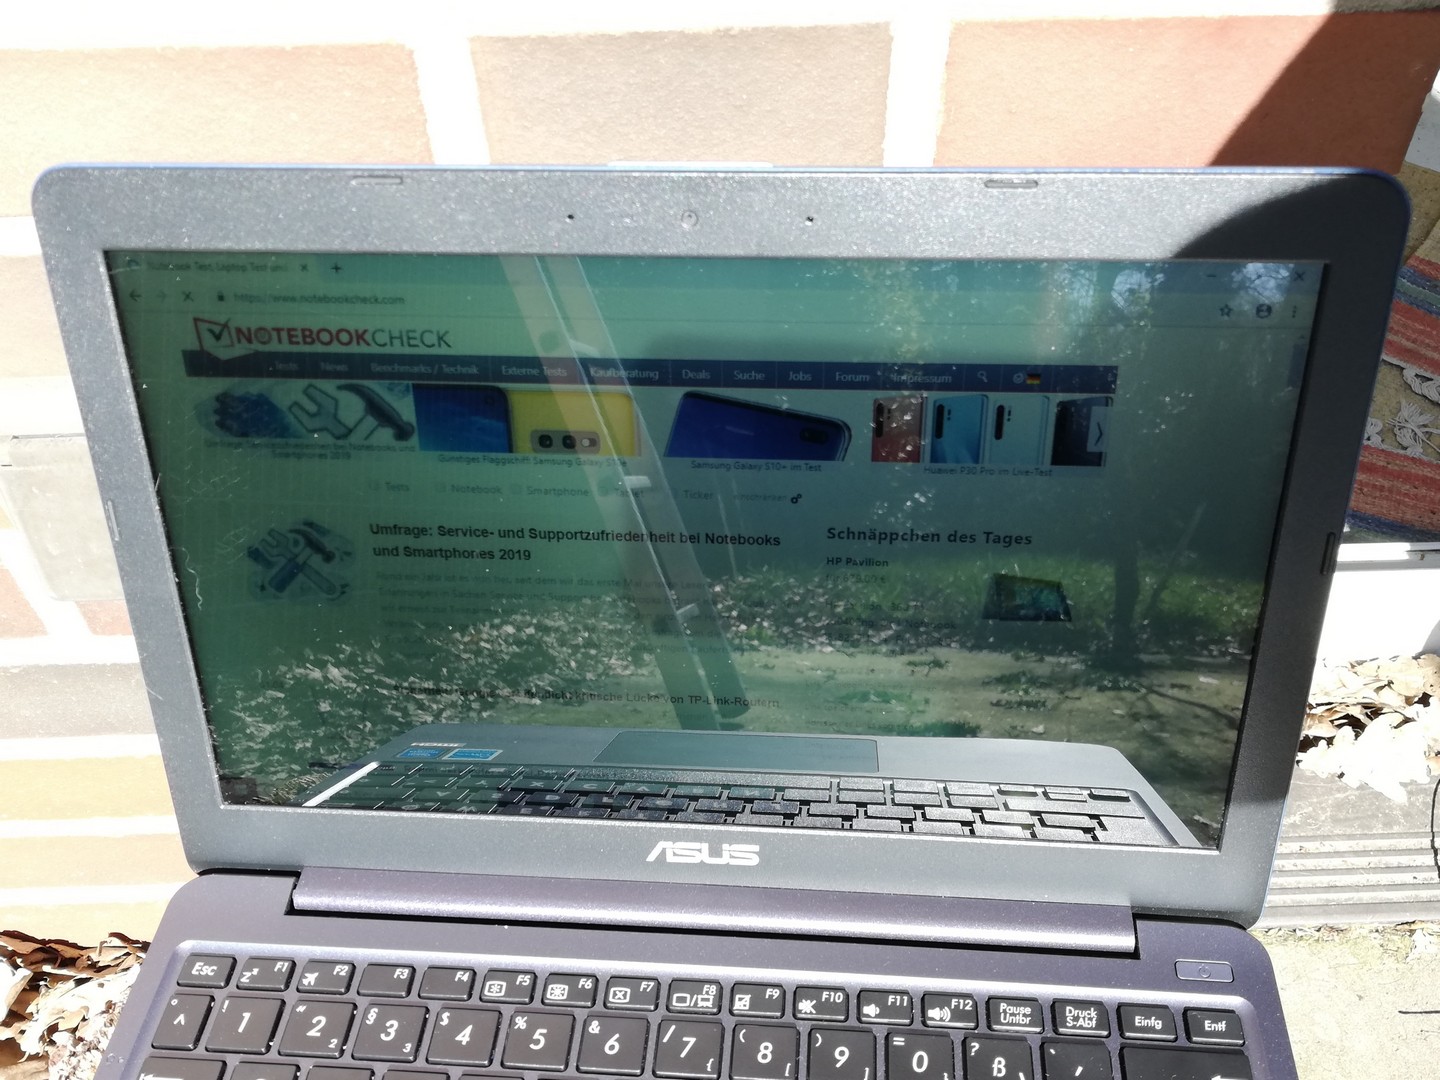
Furthermore, the color space coverage is just average at 54 percent in the sRGB color space, but is sufficient for regular users. It becomes difficult, however, if the Asus laptop is to be used outdoors. The low brightness combined with the reflective screen is not sufficient to display readable image content. In shady areas this is possible, but it is very exhausting for the eyes in the long run.

Performance - A Fanless Laptop for the Office Usage
In the Asus E203MA, an Intel Pentium Silver N5000 and 4 GB of RAM ensure fluid system operation. The image content is displayed by Intel's UHD Graphics 605 integrated graphics unit. A 64 GB eMMC flash memory is available for the operating system and data storage. With this equipment, the E203MA is suitable for office work, basic image editing and surfing the Web.
Processor
Intel's Pentium Silver N5000 is a quad-core processor with clock speeds between 1.1 and 2.7 GHz. The actual clock frequency depends significantly on the cooling system; in particular, the turbo clock rate of 2.7 GHz can be maintained only for a short period without active cooling. With its four cores, the CPU can process four threads simultaneously. Due to the low TDP of 6 watts, the N5000 is also suitable for integration in completely passively cooled laptops.
Our Cinebench R15 endurance test shows that the performance of the Asus laptop remains relatively consistent over a long period of time. Over the entire testing period, only a drop of about 5 percent could be observed.
Compared to other devices in its class, the E203MA achieves a good result in the Cinebench R15 benchmarking test. While the Asus laptop can share first place in our test field with the Lenovo V130-14IGM in single-core performance, the difference of 10 percent in multi-core performance is just enough for second place.
System Performance
In the PCMark (versions 8 and 10) benchmarks, the Asus E203MA reached second place on our comparison list. The Lenovo V130-14IGM is again ahead of the competition due to the active fans, slightly higher CPU performance and the faster SSD.
The performance of other systems compared to Intel's Pentium Silver N5000 can be found on our CPU benchmark page.
| PCMark 8 Home Score Accelerated v2 | 2070 points | |
| PCMark 10 Score | 1930 points | |
Help | ||
Storage
The internal memory of the Asus E203MA is a clear leader in our test field compared to other eMMC flash memory solutions. However, the speed is not comparable to the one of a fast SSD, which is why it deserves the second place after the Lenovo V130-14IGM.
The performance comparison of the built-in eMMC flash memory to other mass storage devices can be found on our HDD/SSD benchmark page.
| Asus E203MA-FD825TS SanDisk DA4064 | Lenovo V130-14IGM SK Hynix HFS128G32TND | NuVision Encite Book 12 Plus SanDisk DF4064 | Chuwi LapBook SE SanDisk DF4032 | Trekstor Yourbook C11B 64 GB eMMC Flash | Average SanDisk DA4064 | Average of class Subnotebook | |
|---|---|---|---|---|---|---|---|
| CrystalDiskMark 5.2 / 6 | 100% | -50% | -47% | -45% | 5% | 1242% | |
| Write 4K (MB/s) | 38.28 | 68.6 79% | 7.837 -80% | 11.17 -71% | 9.498 -75% | 38.1 ? 0% | 153.3 ? 300% |
| Read 4K (MB/s) | 12.14 | 28.73 137% | 7.689 -37% | 7.2 -41% | 4.941 -59% | 18.1 ? 49% | 64 ? 427% |
| Write Seq (MB/s) | 220.2 | 252.3 15% | 104.9 -52% | 87.7 -60% | 114.3 -48% | 222 ? 1% | 2860 ? 1199% |
| Read Seq (MB/s) | 262 | 444 69% | 167.8 -36% | 247 -6% | 262.8 0% | 277 ? 6% | 3311 ? 1164% |
| Write 4K Q32T1 (MB/s) | 45.72 | 123.2 169% | 13.64 -70% | 12.29 -73% | 15.3 -67% | 45.7 ? 0% | 429 ? 838% |
| Read 4K Q32T1 (MB/s) | 61 | 135.1 121% | 32.95 -46% | 32.46 -47% | 31.59 -48% | 56 ? -8% | 493 ? 708% |
| Write Seq Q32T1 (MB/s) | 167.1 | 246.1 47% | 99.5 -40% | 92 -45% | 111.8 -33% | 153.7 ? -8% | 4606 ? 2656% |
| Read Seq Q32T1 (MB/s) | 211.5 | 557 163% | 128.8 -39% | 150.1 -29% | 151.5 -28% | 204 ? -4% | 5795 ? 2640% |
| Write 4K Q8T8 (MB/s) | 12.36 | 887 ? | |||||
| Read 4K Q8T8 (MB/s) | 31.66 | 1272 ? | |||||
| AS SSD | 263% | -39% | -29% | 3% | 2078% | ||
| Seq Read (MB/s) | 297.8 | 501 68% | 154 -48% | 264.1 -11% | 300 ? 1% | 4466 ? 1400% | |
| Seq Write (MB/s) | 234.1 | 260.8 11% | 102.4 -56% | 131.8 -44% | 239 ? 2% | 2929 ? 1151% | |
| 4K Read (MB/s) | 7.33 | 22.08 201% | 5.07 -31% | 6.3 -14% | 7.67 ? 5% | 59.2 ? 708% | |
| 4K Write (MB/s) | 22.37 | 56 150% | 8.42 -62% | 13.6 -39% | 26.2 ? 17% | 169.4 ? 657% | |
| 4K-64 Read (MB/s) | 15.86 | 186.8 1078% | 27.74 75% | 25.65 62% | 16.7 ? 5% | 844 ? 5222% | |
| 4K-64 Write (MB/s) | 29 | 133.3 360% | 12.15 -58% | 9.11 -69% | 30 ? 3% | 1697 ? 5752% | |
| Access Time Read * (ms) | 0.338 | 0.109 68% | 0.747 -121% | 0.671 -99% | 0.4007 ? -19% | 0.06516 ? 81% | |
| Access Time Write * (ms) | 0.874 | 0.065 93% | 1.136 -30% | 1.233 -41% | 0.866 ? 1% | 0.05493 ? 94% | |
| Score Read (Points) | 53 | 259 389% | 48 -9% | 58 9% | 54.3 ? 2% | 1348 ? 2443% | |
| Score Write (Points) | 75 | 215 187% | 31 -59% | 36 -52% | 80.3 ? 7% | 2159 ? 2779% | |
| Score Total (Points) | 155 | 603 289% | 103 -34% | 120 -23% | 162.7 ? 5% | 4135 ? 2568% | |
| Copy ISO MB/s (MB/s) | 127.3 | 119.7 | 56.5 ? | 2574 ? | |||
| Copy Program MB/s (MB/s) | 72.3 | 72.8 | 27.6 ? | 827 ? | |||
| Copy Game MB/s (MB/s) | 112.6 | 116.5 | 37.6 ? | 1744 ? | |||
| Total Average (Program / Settings) | 182% /
194% | -45% /
-44% | -38% /
-36% | -45% /
-45% | 4% /
3% | 1660% /
1726% |
* ... smaller is better

Graphics Card
Responsible for displaying image contents in the Asus E203MA is Intel's UHD Graphics 605 integrated graphics unit. This GPU is only suitable for applications that do not demand high graphics performance. Basic image editing is possible but more complex projects or 3D graphics exceed its available possibilities.
In the 3DMark 11 benchmarking test, the UHD Graphics 605 meets our expectations and reaches second place on our comparison list. A comparison of other graphics cards' performance to Intel's UHD Graphics 605 can be found on our GPU benchmark page.
| 3DMark | |
| 1920x1080 Fire Strike Graphics | |
| Average of class Subnotebook (832 - 16347, n=58, last 2 years) | |
| Lenovo V130-14IGM | |
| Average Intel UHD Graphics 605 (411 - 576, n=10) | |
| Trekstor Yourbook C11B | |
| 1280x720 Cloud Gate Standard Graphics | |
| Average of class Subnotebook (5577 - 61591, n=30, last 2 years) | |
| Trekstor Yourbook C11B | |
| Average Intel UHD Graphics 605 (2874 - 4485, n=10) | |
| Lenovo V130-14IGM | |
| Chuwi LapBook SE | |
| NuVision Encite Book 12 Plus | |
| 2560x1440 Time Spy Graphics | |
| Average of class Subnotebook (804 - 6288, n=57, last 2 years) | |
| Average Intel UHD Graphics 605 (113 - 183, n=2) | |
| Chuwi LapBook SE | |
| 3DMark 11 Performance | 711 points | |
Help | ||
Gaming Performance
The Asus E203MA is not suitable for games, as even very old ones run smoothly only at low setting levels. Basic casual games are represented without glitches by the integrated graphics unit though, which is why users should narrow down their choice to such games.
Which games run smoothly with Intel's UHD Graphics 605, can be read in our GPU game list.
| BioShock Infinite | |
| 1280x720 Very Low Preset | |
| Lenovo V130-14IGM | |
| Average Intel UHD Graphics 605 (14.8 - 33.2, n=9) | |
| Asus E203MA-FD825TS | |
| Trekstor Yourbook C11B | |
| 1366x768 Medium Preset | |
| Average Intel UHD Graphics 605 (10.8 - 17.2, n=8) | |
| Asus E203MA-FD825TS | |
| Lenovo V130-14IGM | |
| Trekstor Yourbook C11B | |
| 1366x768 High Preset | |
| Asus E203MA-FD825TS | |
| Average Intel UHD Graphics 605 (9.4 - 15.2, n=8) | |
| Lenovo V130-14IGM | |
| Trekstor Yourbook C11B | |
| low | med. | high | ultra | |
|---|---|---|---|---|
| BioShock Infinite (2013) | 24.36 | 13.53 | 11.62 |
Emissions & Energy - Asus E203MA Shows a Good Battery Life
Noise Emissions
The Asus E203MA has no fans and is therefore suitable for use in very quiet environments. We could not observe other noise emissions such as coil whining or the like.
Temperature
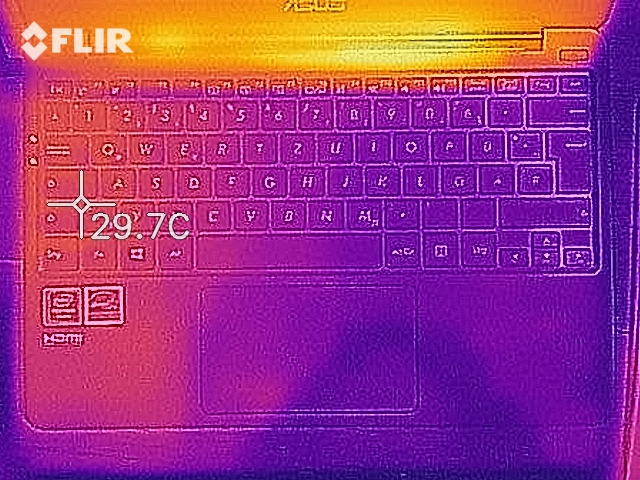
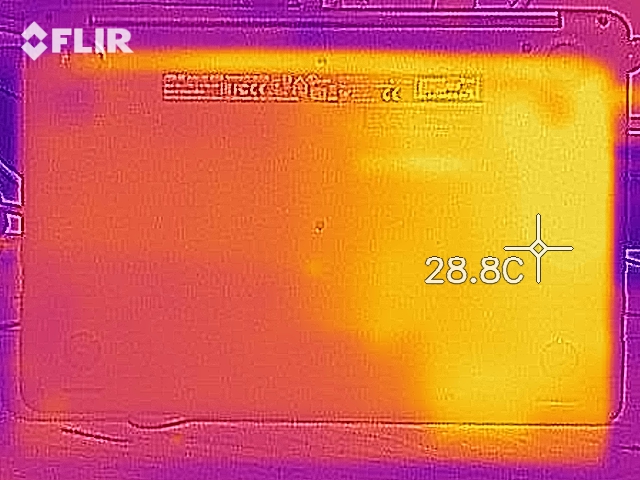
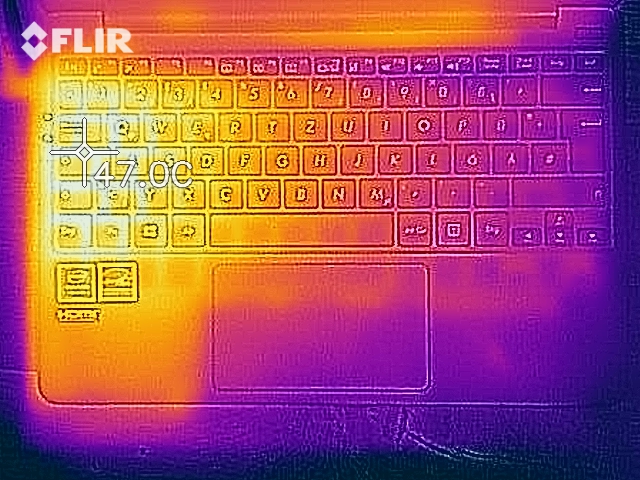
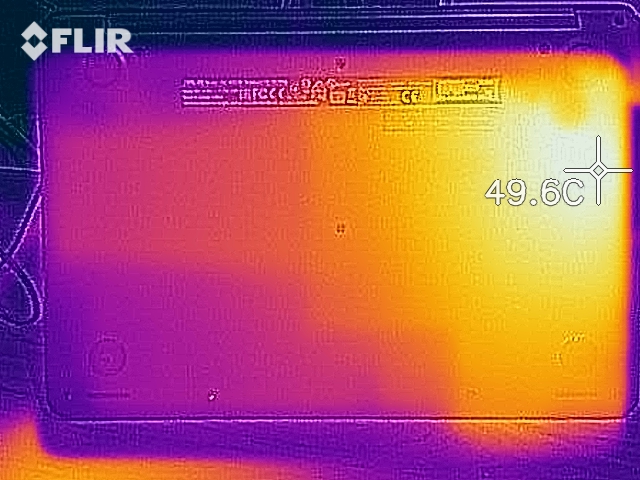
In our test, the surfaces of the Asus E203MA reach temperatures of about 24 °C (75.2 °F) at idle and a maximum of 42 °C (107.6 °F) under load. The small laptop feels just warm and can easily be used on the lap / thighs.
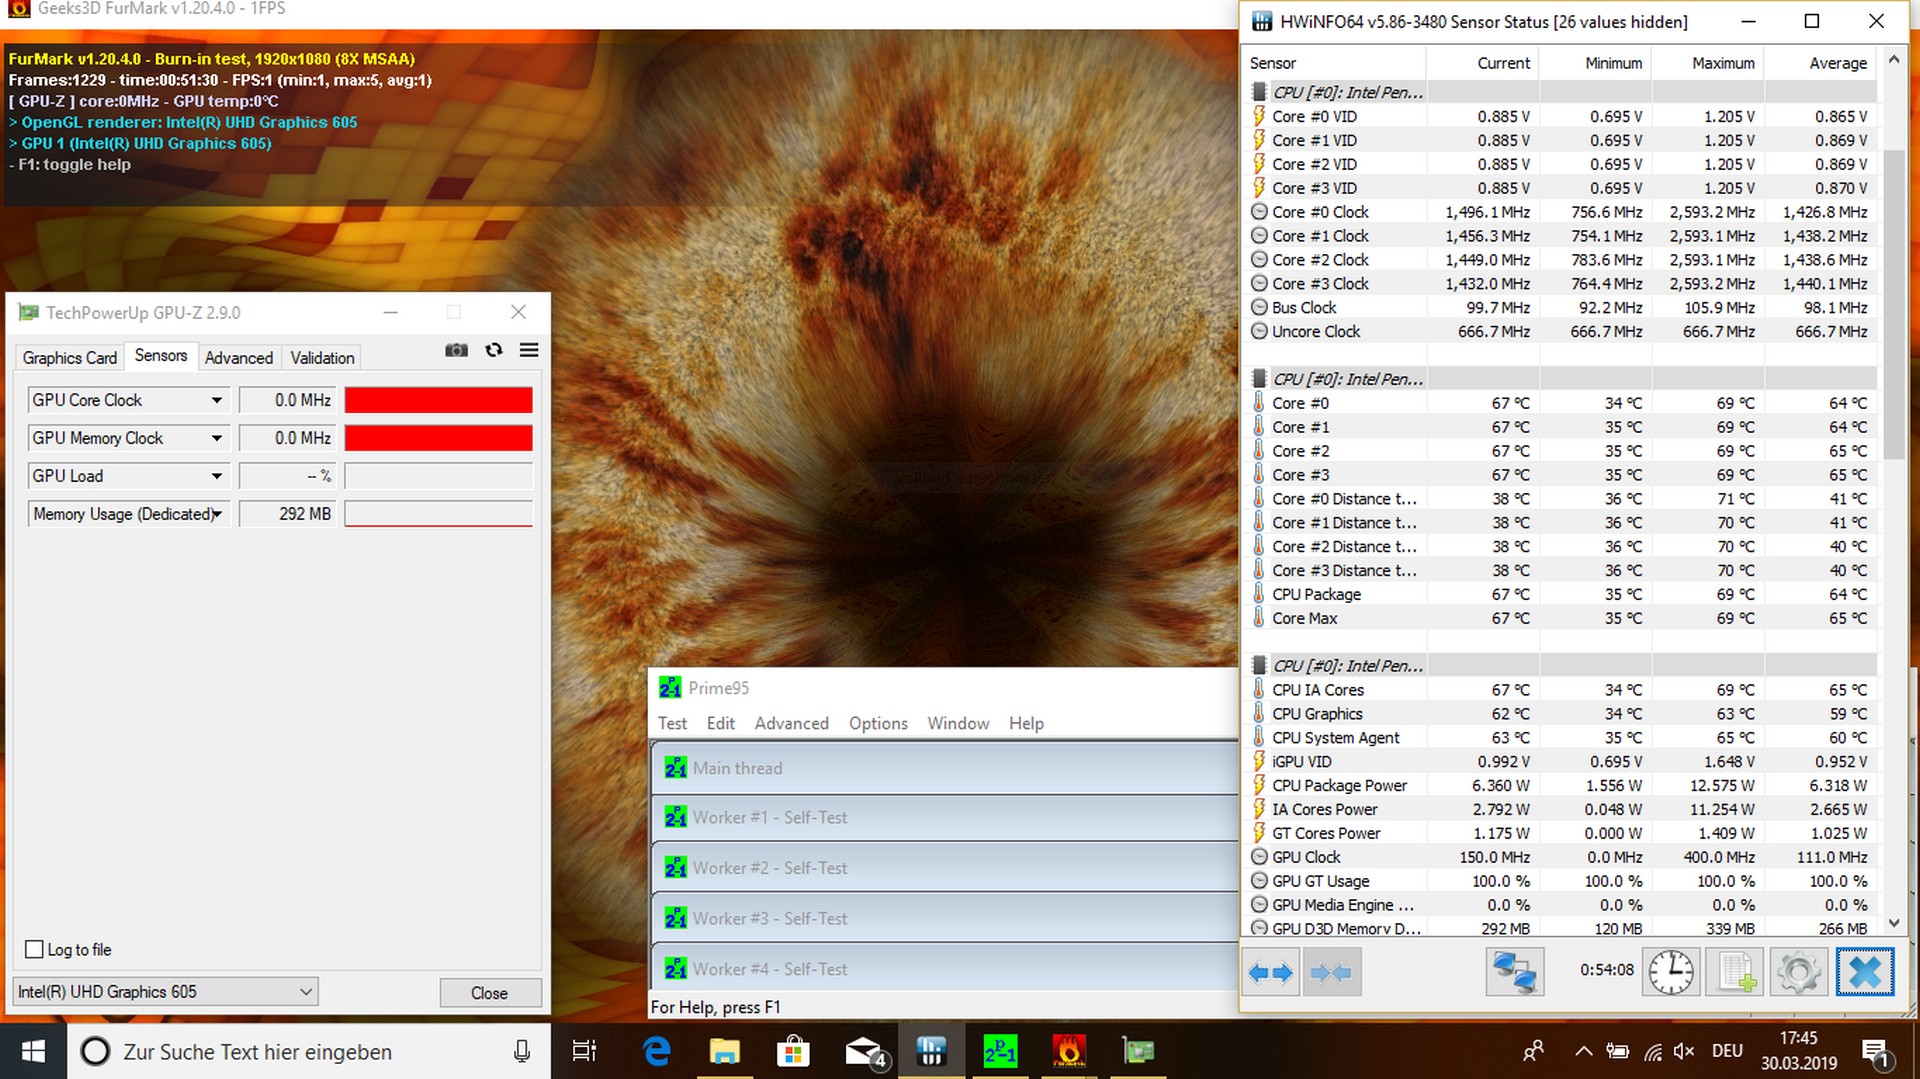
During our one-hour stress test, the internal core temperatures rise up to 70 °C (158 °F) and the clock speed drops below 800 MHz. This is well below the base frequency of 1.2 GHz. However, the system stabilizes again until the end of the test and can at least run the Windows interface smoothly. Since such a load scenario is virtually impossible in practice, users do not have to expect any limitations due to excessively high temperatures.
(±) The maximum temperature on the upper side is 41.1 °C / 106 F, compared to the average of 35.9 °C / 97 F, ranging from 21.4 to 59 °C for the class Subnotebook.
(±) The bottom heats up to a maximum of 42.2 °C / 108 F, compared to the average of 39.2 °C / 103 F
(+) In idle usage, the average temperature for the upper side is 22.6 °C / 73 F, compared to the device average of 30.8 °C / 87 F.
(+) The palmrests and touchpad are reaching skin temperature as a maximum (32 °C / 89.6 F) and are therefore not hot.
(-) The average temperature of the palmrest area of similar devices was 28.2 °C / 82.8 F (-3.8 °C / -6.8 F).
Speakers
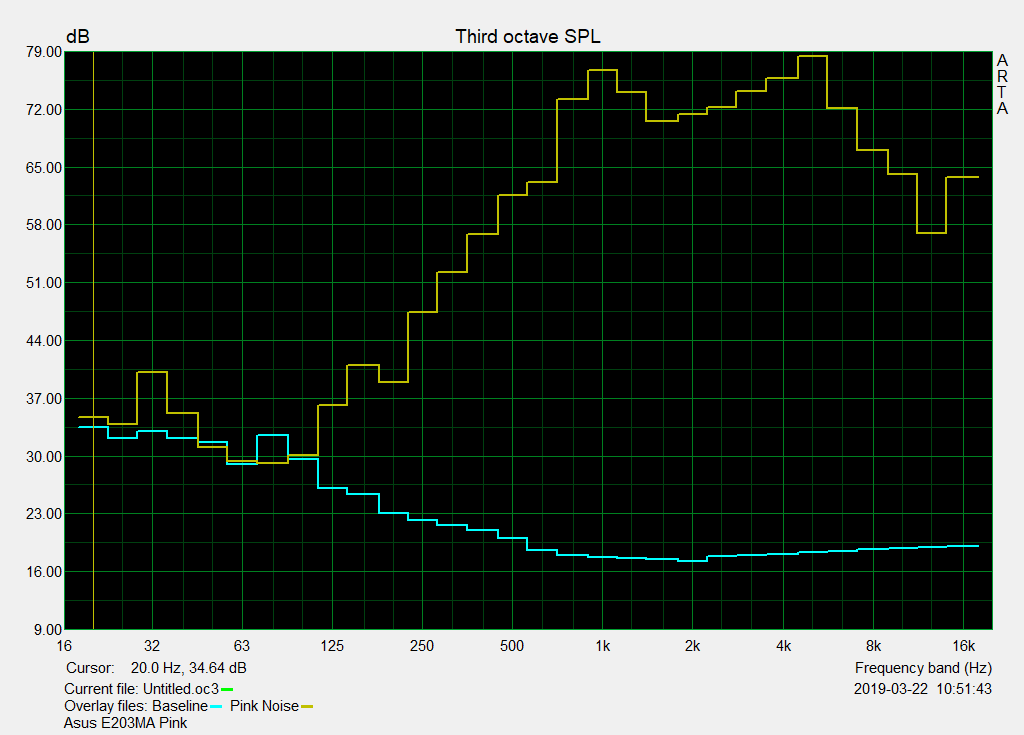
The speakers of the Asus E203MA offer a mediocre volume and deliver a sound spectrum, which lies in the upper mids. The small speakers are well suited for the occasional playback of media content, whereas their loudness is not enough especially in noisy environments. A 3.5 mm jack is available for connecting external speakers or headphones.
Asus E203MA-FD825TS audio analysis
(±) | speaker loudness is average but good (78.4 dB)
Bass 100 - 315 Hz
(-) | nearly no bass - on average 23.2% lower than median
(±) | linearity of bass is average (10% delta to prev. frequency)
Mids 400 - 2000 Hz
(±) | higher mids - on average 7% higher than median
(±) | linearity of mids is average (8.7% delta to prev. frequency)
Highs 2 - 16 kHz
(±) | higher highs - on average 7.8% higher than median
(+) | highs are linear (6.7% delta to prev. frequency)
Overall 100 - 16.000 Hz
(±) | linearity of overall sound is average (25.1% difference to median)
Compared to same class
» 84% of all tested devices in this class were better, 4% similar, 12% worse
» The best had a delta of 5%, average was 18%, worst was 53%
Compared to all devices tested
» 77% of all tested devices were better, 5% similar, 18% worse
» The best had a delta of 4%, average was 24%, worst was 134%
Lenovo V130-14IGM audio analysis
(-) | not very loud speakers (65.5 dB)
Bass 100 - 315 Hz
(±) | reduced bass - on average 9.9% lower than median
(±) | linearity of bass is average (8% delta to prev. frequency)
Mids 400 - 2000 Hz
(+) | balanced mids - only 3.5% away from median
(+) | mids are linear (5.5% delta to prev. frequency)
Highs 2 - 16 kHz
(+) | balanced highs - only 2.5% away from median
(+) | highs are linear (6.8% delta to prev. frequency)
Overall 100 - 16.000 Hz
(±) | linearity of overall sound is average (15.8% difference to median)
Compared to same class
» 37% of all tested devices in this class were better, 6% similar, 57% worse
» The best had a delta of 5%, average was 18%, worst was 53%
Compared to all devices tested
» 24% of all tested devices were better, 5% similar, 71% worse
» The best had a delta of 4%, average was 24%, worst was 134%
Energy Consumption
According to our measurements, the Asus E203MA has a power consumption of at least 1.9 watts at idle and a maximum of 19 watts under load. This makes the 11-inch laptop a relatively energy-saving device. The provided 34-watt power supply is designed well enough to supply the E203MA with sufficient energy.
| Off / Standby | |
| Idle | |
| Load |
|
Key:
min: | |
Battery Life
In our practical Wi-Fi test, the Asus laptop runs for 8 hours and 15 minutes. This does not reach the battery life promised by the manufacturer. Nevertheless, the E203MA achieves the second best score in our test.
Pros
Cons
Verdict - A Small and Portable Laptop with Weaknesses
In our review, the Asus E203MA shows performance that is sufficient for most everyday usage scenarios. With the small notebook, Office applications, Internet activities as well as basic image editing can be carried out easily and the scarce internal memory can be extended via the available microSD card reader. The built-in ac-WLAN provides usable data transfer rates and the battery life is decent.
The Asus E203MA is a good and affordable subnotebook whose weaknesses would have been avoidable without the price skyrocketing.
Users looking for a small and portable laptop could be served well by the E203MA. However, we find the reflective screen really problematic, which combined with the low brightness, is hardly suitable for outdoor work. The meager eMMC flash memory does not offer much space for storing data either and maintenance possibilities are practically nonexistent.
Asus E203MA-FD825TS
- 09/26/2019 v7 (old)
Mike Wobker
Price comparison
