Reviews for the Intel Pentium Silver N5000 processor
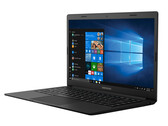
Medion Akoya E4253 Laptop Review: Long Runtime for a Small Amount of Money
Just 250 Euros (~$278) is the price set by Medion for the 14-inch Akoya E4253. The laptop comes with a matte IPS Full HD display, Pentium Silver N5000 processor, silent operation and a good battery life.
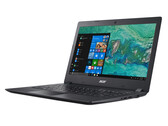
Intel Pentium Silver N5000, UHD Graphics 605, 14", 1.4 kgAcer Aspire 1 A114-32 (Pentium Silver N5000, eMMC, FHD) Laptop Review
Acer's 14-incher offers a matte Full HD display, a Pentium Silver N5000 processor and silent operation. Battery life is average at best. A device like the Aspire should offer more in this regard.
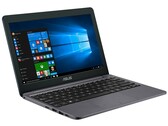
Intel Pentium Silver N5000, UHD Graphics 605, 14", 1.7 kgAsus E203MA (N5000, UHD605) Laptop Review
Asus packs the energy-saving Intel Pentium Silver N500 quad-core processor into a small 11.6-inch laptop. In addition, there are four GB of RAM and a usable battery, which make the device a small and affordable companion for everyday life. In our review we clarify what users may expect from the small laptop with a price tag of less than 350 Euros (~$392).
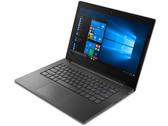
Intel Pentium Silver N5000, UHD Graphics 605, 11.6", 980 gLenovo V130-14IGM (Pentium Silver N5000, SSD, HD) Laptop Review
Lenovo has equipped its V130-14IGM with an Intel Pentium Silver N5000 quad-core processor, which is on par with a Broadwell Core i3. Add to that a fast SSD and good battery life, and the sub-250 Euro (~$285) 14-inch laptop looks like an enticing package. The device has its drawbacks though, particularly as it has an unconvincing display and does not come with an OS installed.
Intel Pentium Silver N5000, UHD Graphics 605, 14", 1.6 kgTopjoy Falcon Convertible Review (Preproduction Model)
The Topjoy Falcon currently listed on Kickstarter is a mini convertible with Windows 10 and an actively cooled Gemini-Lake quad-core processor. We used a preproduction model from Topjoy for our review, running it through most of our test series. Find out about the advantages and disadvantages of the minicomputer in our review.
Intel Pentium Silver N5000, UHD Graphics 605, 8", 680 gLenovo Ideapad D330-10IGM: Intel UHD Graphics 605, 10.10", 1.1 kg
Review » Lenovo IdeaPad D330-10IGM (Pentium Silver N5000, eMMC, LTE, WUXGA) Convertible Review
Lenovo Yoga 330-11IGM: Intel UHD Graphics 605, 11.60", 1.3 kg
Review » Lenovo Yoga 330-11IGM (Pentium N5000) Laptop Review
Acer Swift 1 SF114-32-P8GG: Intel UHD Graphics 605, 14.00", 1.4 kg
Review » Acer Swift 1 SF114-32 (N5000, SSD, FHD) Laptop Review
HP Chromebook x360 14a-ca0022nr: Intel UHD Graphics 605, 14.00", 1.5 kg
External Review » HP Chromebook x360 14a-ca0022nr
Acer Chromebook 15 CB315-3HT-P297: Intel UHD Graphics 605, 15.60", 1.6 kg
External Review » Acer Chromebook 15 CB315-3HT-P297
HP Chromebook 14a-na0070nd: Intel UHD Graphics 605, 14.00", 1.5 kg
External Review » HP Chromebook 14a-na0070nd
Dell Inspiron 15 3582-6T58P: Intel UHD Graphics 605, 15.60", 2 kg
External Review » Dell Inspiron 15 3582-6T58P
Acer TravelMate B118-M-P385: Intel UHD Graphics 605, 11.60", 1.5 kg
External Review » Acer TravelMate B118-M-P385
Asus X543MA-GQ645T: Intel UHD Graphics 605, 15.60", 1.9 kg
External Review » Asus X543MA-GQ645T
Lenovo V130-15IGM-81HL004HGE: Intel UHD Graphics 605, 15.60", 1.9 kg
External Review » Lenovo V130-15IGM-81HL004HGE
Acer Aspire 1 A114-32-P0K1: Intel UHD Graphics 605, 14.00", 1.7 kg
External Review » Acer Aspire 1 A114-32-P0K1
HP Chromebook x360 12b-ca0350nd: Intel UHD Graphics 605, 12.00", 1.4 kg
External Review » HP Chromebook x360 12b-ca0350nd
Acer Aspire A315-34-P3LC: Intel UHD Graphics 605, 15.60", 1.9 kg
External Review » Acer Aspire A315-34-P3LC
Asus Vivobook X507MA-BR316T: Intel UHD Graphics 605, 15.60", 1.7 kg
External Review » Asus Vivobook X507MA-BR316T
Acer Swift 1 SF114-32-P7FA: Intel UHD Graphics 605, 14.00", 1.3 kg
External Review » Acer Swift 1 SF114-32-P7FA
Lenovo Ideapad D330-10IGM-81H3001PSP: Intel UHD Graphics 605, 10.10", 1.1 kg
External Review » Lenovo Ideapad D330-10IGM-81H3001PSP
HP 15-da0000: Intel UHD Graphics 605, 15.60", 2.1 kg
External Review » HP 15-da0000
Acer TravelMate B1 TMB118-M-P385: Intel UHD Graphics 605, 11.60", 1.5 kg
External Review » Acer TravelMate B1 TMB118-M-P385
Asus VivoBook 17 F705MA-BX029T: Intel UHD Graphics 605, 17.30", 2.1 kg
External Review » Asus VivoBook 17 F705MA-BX029T
Medion Akoya E4271: Intel UHD Graphics 605, 14.00", 1.7 kg
External Review » Medion Akoya E4271
Asus E203MA-FD825TS: Intel UHD Graphics 605, 11.60", 1 kg
External Review » Asus E203MA-FD825TS
Asus X540MA-DM278T: Intel UHD Graphics 605, 15.60", 1.9 kg
External Review » Asus X540MA-DM278T
Medion Akoya E4253-30024991: Intel UHD Graphics 605, 14.00", 1.4 kg
External Review » Medion Akoya E4253-30024991
Medion Akoya E6246-MD63200: Intel UHD Graphics 605, 15.60", 1.7 kg
External Review » Medion Akoya E6246-MD63200
Trekstor Primebook U13B-PO: Intel UHD Graphics 605, 13.30", 1.3 kg
External Review » Trekstor Primebook U13B-PO
Acer Swift 1 SF114-32-P60X: Intel UHD Graphics 605, 14.00", 1.4 kg
External Review » Acer Swift 1 SF114-32-P60X
Lenovo Ideapad D330-10IGM: Intel UHD Graphics 605, 10.10", 1.1 kg
External Review » Lenovo Ideapad D330-10IGM
Lenovo Yoga 330-11IGM: Intel UHD Graphics 605, 11.60", 1.3 kg
External Review » Lenovo Yoga 330-11IGM
Acer Swift 1 SF114-32-P8GG: Intel UHD Graphics 605, 14.00", 1.4 kg
External Review » Acer Swift 1 SF114-32-P8GG
Acer Swift 1 SF114-32-P57N: Intel UHD Graphics 605, 14.00", 1.4 kg
External Review » Acer Swift 1 SF114-32-P57N