Reviews for the Intel Core i5-4210U processor
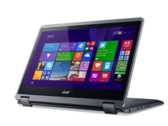
Acer Aspire R14 Convertible Review
Small and simple. Acer presents a 14-inch convertible dubbed Aspire R14 R3-471TG-552E that is to convince us with its elegant design, a 360-degree display, and decent system performance. Unfortunately, the screen does not quite meet our expectations.
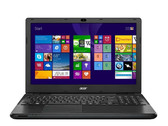
Intel Core i5-4210U, NVIDIA GeForce 820M, 14", 2 kgAcer TravelMate P246-M-598B Notebook Review
Simple. Are 15.6-inch devices too big, and do you need a portable machine for outings? If you are not a perfectionist, Acer's 14-inch laptop with eight hours of battery life could be the ideal TravelMate for you.
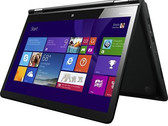
Intel Core i5-4210U, HD Graphics 4400, 14", 2.1 kgLenovo ThinkPad Yoga 14 Convertible Review
For work and play. The successful 12.5-inch ThinkPad Yoga has now spawned a 14-inch model with dedicated GeForce graphics. Lenovo has engineered this convertible to adapt to any situation both at the office and at home. Can this versatile solution replace that old ThinkPad or aging family computer?
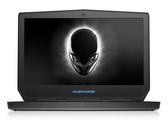
Intel Core i5-4210U, NVIDIA GeForce 840M, 14", 1.9 kgDell Alienware 13 Notebook Review
Small chassis, big performance? After products with 11 and 14-inches, the gaming experts from Alienware now offer a 13-inch product. Our article tries to focus on the question of whether a dual-core is sufficient for the GeForce GTX 860M and the external amplifier.
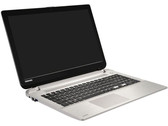
Intel Core i5-4210U, NVIDIA GeForce GTX 860M, 13.3", 2 kgToshiba Satellite S50-B-12U Notebook Review
Beauty isn't everything. Toshiba's Satellite S50-B-12U features a classy aluminum design. The thin, lightweight notebook is available for 700 Euros (~$846), including a dedicated AMD graphics card. But appearance doesn't make the man -- or the notebook -- so is there more hidden within that beautiful exterior? Our review reveals the answer.
Intel Core i5-4210U, AMD Radeon R7 M260, 15.6", 2 kgHP Probook 430 G2: Intel HD Graphics 4400, 13.30", 1.5 kg
Review » HP ProBook 430 G2 Notebook Review Update
HP ProBook 470 G2 (G6W68EA): AMD Radeon R5 M255, 17.30", 2.9 kg
Review » HP ProBook 470 G2 (G6W68EA) Notebook Review Update
Acer Travelmate P276-MG-56FU: NVIDIA GeForce 840M, 17.30", 3 kg
Review » Acer TravelMate P276-MG-56FU Notebook Review
Lenovo Edge 15-80H10004US: Intel HD Graphics 4400, 15.60", 2.4 kg
Review » Lenovo Edge 15-80H10004US Notebook Review
Asus ASUSPRO Advanced BU201LA-DT036G: Intel HD Graphics 4400, 12.50", 1.4 kg
Review » Asus ASUSPRO Advanced BU201LA-DT036G Ultrabook Review
Lenovo Horizon 2s-F0AT0003US: Intel HD Graphics 4400, 19.50", 2.5 kg
Review » Lenovo Horizon 2s-F0AT0003US AIO Review
HP 350 G1: AMD Radeon HD 8670M, 15.60", 2.3 kg
Review » HP 350 G1 Notebook Review
Asus F751LDV-TY178H: NVIDIA GeForce 820M, 17.30", 2.6 kg
Review » Asus F751LDV-TY178H Notebook Review
Toshiba Satellite Radius P50W-BST2N01: Intel HD Graphics 4400, 15.60", 2.2 kg
Review » Toshiba Satellite Radius P50W-BST2N01 Convertible Review
Lenovo B50-70: AMD Radeon R5 M230, 15.60", 2.3 kg
Review » Lenovo B50-70 Notebook Review Update
Dell Inspiron 15 3542-2293: NVIDIA GeForce 820M, 15.60", 2.3 kg
Review » Dell Inspiron 15 3542-2293 Notebook Review
Dell Inspiron 13 7347: Intel HD Graphics 4400, 13.30", 1.7 kg
Review » Dell Inspiron 13 7347 Convertible Review
Acer Aspire V3-371-55GS: Intel HD Graphics 4400, 13.30", 1.5 kg
Review » Acer Aspire V3-371-55GS Subnotebook Review
Toshiba Satellite P30W-B-104: Intel HD Graphics 4400, 13.30", 2 kg
Review » Toshiba Satellite Click 2 Pro P30W-B-104 Convertible Review
Asus Transformer Book Flip TP550LA-CJ070P: Intel HD Graphics 4400, 15.60", 2.3 kg
Review » Asus Transformer Book Flip TP550LA-CJ070P Convertible Review
Toshiba Satellite Pro R50-B-112: Intel HD Graphics 4400, 15.60", 2.3 kg
Review » Toshiba Satellite Pro R50-B-112 Notebook Review
Asus Transformer Book Flip TP500LN: NVIDIA GeForce 840M, 15.60", 2.3 kg
Review » Asus Transformer Book Flip TP500LN Convertible Review
Asus X555LN-XO112H: NVIDIA GeForce 840M, 15.60", 2.3 kg
Review » Asus X555LN-XO112H Notebook Review
HP Pavilion 15-p008ng: NVIDIA GeForce 840M, 15.60", 2.4 kg
Review » HP Pavilion 15-p008ng Notebook Review
HP Envy 15-u001ng x360: Intel HD Graphics 4400, 15.60", 2.4 kg
Review » HP Envy x360-15t Touch Convertible Review
Acer Aspire E5-571G-536E: NVIDIA GeForce 840M, 15.60", 2.4 kg
Review » Acer Aspire E5-571G-536E Notebook Review
Acer Aspire E5-771G-553Q: NVIDIA GeForce 840M, 17.30", 2.9 kg
Review » Acer Aspire E5-771G-553Q (i5, 840M) Notebook Review
Lenovo IdeaPad Flex 2 15: Intel HD Graphics 4400, 15.60", 2.6 kg
Review » Lenovo IdeaPad Flex 2 15 Notebook Review
Acer Aspire V5-573G-54218G1Taii: NVIDIA GeForce GTX 850M, 15.60", 2 kg
Review » Acer Aspire V5-573G-54218G1Taii Notebook Review Update
Dell Inspiron 15-5547: AMD Radeon R7 M265, 15.60", 2.2 kg
Review » Dell Inspiron 15-5547 Notebook Review
Acer TravelMate P246-M-598B: Intel HD Graphics 4400, 14.00", 2.1 kg
External Review » Acer TravelMate P246-M-598B
Acer Aspire F5-571G-59XP: NVIDIA GeForce 940M, 15.60", 2.4 kg
External Review » Acer Aspire F5-571G-59XP
Asus ASUSPRO Advanced BU401LA-CZ180G: Intel HD Graphics 4400, 14.00", 1.7 kg
External Review » Asus ASUSPRO Advanced BU401LA-CZ180G
Acer TravelMate P256-M-55EG: Intel HD Graphics 4400, 15.60", 2.5 kg
External Review » Acer TravelMate P256-M-55EG
HP Pavilion 15-p159nr: NVIDIA GeForce 840M, 15.60", 2.3 kg
External Review » HP Pavilion 15-p159nr
Medion Akoya S6413T-MD98842: Intel HD Graphics 4400, 15.60", 1.4 kg
External Review » Medion Akoya S6413T-MD98842
HP Envy 15-u050sr x360: Intel HD Graphics 4400, 15.60", 2.4 kg
External Review » HP Envy 15-u050sr x360
Lenovo Z50-70-59427408: NVIDIA GeForce 840M, 15.60", 2.5 kg
External Review » Lenovo Z50-70-59427408
Asus X555MA: Intel HD Graphics 4400, 15.60", 2.3 kg
External Review » Asus X555MA
Acer Aspire E5-571-5552: Intel HD Graphics 4400, 15.60", 2.5 kg
External Review » Acer Aspire E5-571-5552
HP Probook 430 G2: Intel HD Graphics 4400, 13.30", 1.5 kg
External Review » HP Probook 430 G2
Acer Aspire R14 R3-471TG-552E: NVIDIA GeForce 820M, 14.00", 2 kg
External Review » Acer Aspire R14 R3-471TG-552E
Toshiba Satellite S50-B-133: AMD Radeon R7 M260, 15.60", 2.1 kg
External Review » Toshiba Satellite S50-B-133
Asus ASUSPRO Advanced B551LA-CN169G: Intel HD Graphics 4400, 15.60", 2.5 kg
External Review » Asus ASUSPRO Advanced B551LA-CN169G
Asus ASUSPRO Advanced BU201LA-DT036G: Intel HD Graphics 4400, 12.50", 1.4 kg
External Review » Asus ASUSPRO Advanced BU201LA-DT036G
Acer Aspire VN7-571G-52DB: NVIDIA GeForce GTX 850M, 15.60", 2.3 kg
External Review » Acer Aspire VN7-571G-52DB
Toshiba Satellite S50-B-14P: AMD Radeon R7 M260, 15.60", 2.1 kg
External Review » Toshiba Satellite S50-B-14P
Toshiba Portege Z30-A-189: Intel HD Graphics 4400, 13.30", 1.2 kg
External Review » Toshiba Portege Z30-A-189
Acer Aspire V 15 Nitro VN7-571G-56NX: NVIDIA GeForce 840M, 15.60", 2.2 kg
External Review » Acer Aspire V 15 Nitro VN7-571G-56NX
Acer Aspire R7-371T-55DQ: Intel HD Graphics 4400, 13.30", 1.5 kg
External Review » Acer Aspire R7-371T-55DQ
Acer Aspire VN7-791G-57RE: NVIDIA GeForce GTX 860M, 17.30", 3 kg
External Review » Acer Aspire VN7-791G-57RE
Toshiba Satellite Click 2 Pro P30W-B-104: Intel HD Graphics 4400, 13.30", 1 kg
External Review » Toshiba Satellite Click 2 Pro P30W-B-104
Toshiba Tecra C50-B1503: Intel HD Graphics 4400, 15.60", 2.3 kg
External Review » Toshiba Tecra C50-B1503
Asus Transformer Book Flip TP500LN-DN051H: NVIDIA GeForce 840M, 15.60", 2.2 kg
External Review » Asus Transformer Book Flip TP500LN-DN051H
Lenovo Edge 15-80H10004US: Intel HD Graphics 4400, 15.60", 2.4 kg
External Review » Lenovo Edge 15-80H10004US
Acer Aspire R7-371T-55DJ: Intel HD Graphics 4400, 13.30", 1.5 kg
External Review » Acer Aspire R7-371T-55DJ
Asus Transformer Book Flip TP300LA-C4034H: Intel HD Graphics 4400, 13.30", 1.8 kg
External Review » Asus Transformer Book Flip TP300LA-C4034H
Asus Transformer Book Flip TP500LN: NVIDIA GeForce 840M, 15.60", 2.3 kg
External Review » Asus Transformer Book Flip TP500LN
Asus Transformer Book Flip TP300LD-C4030H: NVIDIA GeForce 820M, 13.30", 1.7 kg
External Review » Asus Transformer Book Flip TP300LD-C4030H
Asus X555LN-XO112H: NVIDIA GeForce 840M, 15.60", 2.3 kg
External Review » Asus X555LN-XO112H
HP Pavilion 13-a051sr: Intel HD Graphics 4400, 13.30", 2 kg
External Review » HP Pavilion 13-a051sr
Asus Zenbook UX303LA-R5094H: Intel HD Graphics 4400, 13.30", 1.5 kg
External Review » Asus Zenbook UX303LA-R5094H
HP Envy 15-u000na x360: Intel HD Graphics 4400, 15.60", 2.4 kg
External Review » HP Envy 15-u000na x360
Toshiba Satellite Pro R50-B-12U: Intel HD Graphics 4400, 15.60", 2.3 kg
External Review » Toshiba Satellite Pro R50-B-12U
Acer Aspire VN7-571G-55ZA: NVIDIA GeForce 840M, 15.00", 2.4 kg
External Review » Acer Aspire VN7-571G-55ZA
Asus ZenBook UX303LN-R4215H: NVIDIA GeForce 840M, 13.30", 1.5 kg
External Review » Asus ZenBook UX303LN-R4215H
Acer Aspire V3-371-52VR: Intel HD Graphics 4400, 13.30", 1.5 kg
External Review » Acer Aspire V3-371-52VR
Lenovo ThinkPad Yoga 14: NVIDIA GeForce 840M, 14.00", 1.9 kg
External Review » Lenovo ThinkPad Yoga 14
Asus ASUSPRO BU201: Intel HD Graphics 4400, 12.50", 1.3 kg
External Review » Asus ASUSPRO BU201
Alienware 13: NVIDIA GeForce GTX 860M, 13.30", 2 kg
External Review » Alienware 13
HP Envy 15-u100ng x360: Intel HD Graphics 4400, 15.60", 2.4 kg
External Review » HP Envy 15-u100ng x360
HP Envy 15-k050sr: NVIDIA GeForce 840M, 15.60", 2.8 kg
External Review » HP Envy 15-k050sr
Acer Aspire E5-571PG-624L: NVIDIA GeForce 840M, 15.60", 2.6 kg
External Review » Acer Aspire E5-571PG-624L
Dell Inspiron 13 7347: Intel HD Graphics 4400, 13.30", 1.7 kg
External Review » Dell Inspiron 13 7347
Acer Aspire R13: Intel HD Graphics 4400, 13.30", 1.8 kg
External Review » Acer Aspire R13
Acer Aspire E5-571G-536E: NVIDIA GeForce 840M, 15.60", 2.4 kg
External Review » Acer Aspire E5-571G-536E
Toshiba Satellite Pro R50-B-112: Intel HD Graphics 4400, 15.60", 2.3 kg
External Review » Toshiba Satellite Pro R50-B-112
Lenovo IdeaPad U430p-59428492: Intel HD Graphics 4400, 14.00", 1.7 kg
External Review » Lenovo IdeaPad U430p-59428492
Dell Inspiron 15 3542-2293: NVIDIA GeForce 820M, 15.60", 2.3 kg
External Review » Dell Inspiron 15-3542
Lenovo IdeaPad Z50-70: NVIDIA GeForce 840M, 15.60", 2.5 kg
External Review » Lenovo IdeaPad Z50-70
Asus Transformer Book Flip TP300LA-C4032H: Intel HD Graphics 4400, 13.30", 1.8 kg
External Review » Asus Transformer Book Flip TP300LA-C4032H
Toshiba Satellite Radius P50W-BST2N22: Intel HD Graphics 4400, 15.60", 2.2 kg
External Review » Toshiba Satellite Radius P50W-BST2N22
Acer Aspire E5-471G-53XG: NVIDIA GeForce 820M, 14.00", 2.1 kg
External Review » Acer Aspire E5-471G-53XG
Lenovo B50-70: AMD Radeon R5 M230, 15.60", 2.3 kg
External Review » Lenovo B50-70
Acer Aspire V5-573G-54218G1Taii: NVIDIA GeForce GTX 850M, 15.60", 2 kg
External Review » Acer Aspire V5-573G-54218G1Taii
Acer Aspire E5-471-59RT: Intel HD Graphics 4400, 14.00", 2.3 kg
External Review » Acer Aspire E5-471-59RT
HP Envy 15-U002NF: Intel HD Graphics 4400, 15.60", 2.4 kg
External Review » HP Envy 15-U002NF
Lenovo IdeaPad Flex 2 15: Intel HD Graphics 4400, 15.60", 2.6 kg
External Review » Lenovo IdeaPad Flex 2 15
Acer Aspire S7-392-5410: Intel HD Graphics 4400, 13.30", 1.3 kg
External Review » Acer Aspire S7-392-5410
Acer Aspire E5-471G-527B: NVIDIA GeForce 820M, 14.00", 2.1 kg
External Review » Acer Aspire E5-471G-527B
Acer Aspire V5-573G-74518G25aii: NVIDIA GeForce GTX 850M, 15.60", 2.1 kg
External Review » Acer Aspire V5-573G-74518G25aii
Lenovo Ideapad Flex 2 14-59420166: NVIDIA GeForce 820M, 14.00", 1.9 kg
External Review » Lenovo Ideapad Flex 2 14-59420166
Asus X550LDV-XO610H: NVIDIA GeForce 820M, 15.60", 2.3 kg
External Review » Asus X550LDV-XO610H
Dell Inspiron 14-5447: Intel HD Graphics 4400, 14.00", 2.2 kg
External Review » Dell Inspiron 14-544
Dell Inspiron 3542: NVIDIA GeForce 820M, 15.60", 2.3 kg
External Review » Dell Inspiron 3542
HP Envy 15-u001ng x360: Intel HD Graphics 4400, 15.60", 2.4 kg
External Review » HP Envy 15-u001ng x360
Dell Inspiron 15-5547: AMD Radeon R7 M265, 15.60", 2.2 kg
External Review » Dell Inspiron 15-5547
HP 350 G1: AMD Radeon HD 8670M, 15.60", 2.3 kg
External Review » HP 350 G1