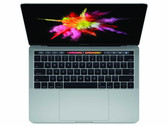
Intel Core i5-6267U

The Intel Core i5-6267U is a dual-core SoC based on the Skylake architecture and has been launched in September 2015. The CPU can be found in medium-sized ultrabooks as well as normal notebooks. In addition to two CPU cores with Hyper-Threading clocked at 2.9 - 3.3 GHz (2 cores: max. 3.1 GHz), the chip also integrates an Iris Graphics 550 GPU with 64 MB of eDRAM memory as well as a dual-channel DDR4-2133/DDR3L-1600 memory controller. The SoC is manufactured using a 14 nm process with FinFET transistors.
Architecture
Skylake replaces both Haswell and Broadwell and brings the same microarchitecture in every TDP class from 4.5 to 45 W. The extensive improvements of the Skylake design include increased out-of-order buffers, optimized prefetching and branch prediction as well as additional performance gains through Hyper-Threading. Overall, however, performance per clock has been increased by only 5 to 10 percent (compared to Haswell) respectively under 5 percent (compard to Broadwell), which is quite modest for a new architecture ("Tock").
Furthermore, the organisation of the eDRAM cache has been modified. Instead of acting like a victim cache, which has to be adressed via the L3/LLC, the eDRAM can now be adressed directly by programms just like the main memory. The size is still 128 MB for the quad-core models (4C + GT4e), while the dual-core chips (2C + GT3e) only offer 64 MB.
Performance
According to the specified clock rates and the improved architecture, the Core i5-6267U should perform similar to the former Core i5-4200H and i5-4310M (Haswell). Even demanding applications and multitasking are handled easily.
Graphics
The integrated graphics unit called Iris Graphics 550 represents the "GT3e" version of the Skylake GPU (Intel Gen. 9). The 48 Execution Units, also called EUs, are clocked at 350 - 1050 MHz and offer (thanks to the fast eDRAM cache) a performance similar to a dedicated GeForce 930M. Games of 2015 can thus be played smoothly in low or medium settings. For more information about performance and features, check our page for the Iris Graphics 550.
Power Consumption
Specified at a TDP of 28 W (including CPU, GPU and memory controller), the CPU is best suited for medium-sized notebooks (13-inches and above). Optionally, the TDP can be lowered to 23 watts (cTDP down), reducing both heat dissipation and performance.
Series | Intel Core i5 |
Codename | Skylake |
Series: Core i5 Skylake | |
Clock Rate | 2900 - 3300 MHz |
Level 1 Cache | 128 KB |
Level 2 Cache | 512 KB |
Level 3 Cache | 4 MB |
Number of Cores / Threads | 2 / 4 |
Power Consumption (TDP = Thermal Design Power) | 28 Watt |
Manufacturing Technology | 14 nm |
Max. Temperature | 100 °C |
Socket | BGA |
Features | Dual-Channel DDR3L-1600/DDR4-2133 Memory Controller, HyperThreading, AVX, AVX2, Quick Sync, Virtualization, AES-NI |
GPU | Intel Iris Graphics 550 (300 - 1050 MHz) |
64 Bit | 64 Bit support |
Architecture | x86 |
Announcement Date | 09/01/2015 |
| |
Product Link (external) | Intel Core i5 6267U |
Benchmarks
Cinebench R15 - Cinebench R15 CPU Multi 64 Bit
min: 314 avg: 328 median: 330 (7%) max: 339 Points
...
...
Cinebench R15 - Cinebench R15 CPU Single 64 Bit
min: 123 avg: 131 median: 131 (48%) max: 138 Points
...
...
Cinebench R11.5 - Cinebench R11.5 CPU Multi 64 Bit
min: 3.44 avg: 3.6 median: 3.6 (7%) max: 3.71 Points
...
...
Cinebench R11.5 - Cinebench R11.5 CPU Single 64 Bit
min: 1.35 avg: 1.5 median: 1.5 (48%) max: 1.58 Points
...
...
Cinebench R10 - Cinebench R10 Rend. Single (32bit)
min: 4903 avg: 5034 median: 4984 (45%) max: 5216 points
...
...
Cinebench R10 - Cinebench R10 Rend. Multi (32bit)
min: 10595 avg: 10981 median: 10902 (18%) max: 11447 points
...
Intel Core 2 Quad (Desktop) Q9550 -1%
Intel Core 2 Extreme (Desktop) QX6850 0%
...
Cinebench R10 - Cinebench R10 Rend. Multi (64bit)
13975 Points (13%)
...
...
Cinebench R10 - Cinebench R10 Rend. Single (64bit)
5789 Points (41%)
...
...
wPrime 2.10 - wPrime 2.0 1024m *
486 s (6%)
...
AMD Phenom II X4 905e -1%
...
VIA C3-M C3-M-1200 1641%
wPrime 2.10 - wPrime 2.0 32m *
15.4 s (3%)
...
AMD Phenom II X4 905e -2%
...
3047 points (20%)
...
Intel Core i5-2400 5%
...
X264 HD Benchmark 4.0 - x264 Pass 2
min: 22.04 avg: 22.2 median: 22.2 (10%) max: 22.3 fps
Intel Pentium 4 2.4 GHz -92%
...
...
X264 HD Benchmark 4.0 - x264 Pass 1
min: 116.89 avg: 119 median: 118.5 (35%) max: 120.2 fps
...
...
TrueCrypt - TrueCrypt Serpent
0.2 GB/s (8%)
...
AMD Phenom II X4 905e -6%
...
TrueCrypt - TrueCrypt Twofish
0.3 GB/s (9%)
...
...
TrueCrypt - TrueCrypt AES
1.9 GB/s (7%)
...
...
3DMark 06 - CPU - 3DMark 06 - CPU
min: 4406 avg: 4425 median: 4424.5 (24%) max: 4443 Points
...
Intel Core 2 Extreme (Desktop) QX6850 1%
...
Super Pi mod 1.5 XS 1M - Super Pi mod 1.5 XS 1M *
min: 11.295 avg: 13.5 median: 13.5 (3%) max: 15.7 s
...
Intel Core i7-940 -2%
...
VIA C3-M C3-M-1200 3330%
Super Pi mod 1.5 XS 2M - Super Pi mod 1.5 XS 2M *
min: 25.862 avg: 29.9 median: 29.9 (1%) max: 33.9 s
...
...
Super Pi Mod 1.5 XS 32M - Super Pi mod 1.5 XS 32M *
min: 588.355 avg: 649 median: 649.1 (3%) max: 709.8 s
...
Intel Core i7-980X EE -1%
...
VIA C3-M C3-M-1200 3369%
3DMark Vantage - 3DM Vant. Perf. CPU no Physx
12540 Points (14%)
...
Intel Core 2 Quad (Desktop) Q9550 -9%
Intel Core i5-2500K 30%
Intel Core i5-2400 32%
...
3DMark 11 - 3DM11 Performance Physics
min: 4402 avg: 4674 median: 4678.5 (17%) max: 4937 Points
...
...
3DMark - 3DMark Ice Storm Physics
min: 28254 avg: 34490 median: 33934 (22%) max: 41283 Points
...
...
3DMark - 3DMark Ice Storm Extreme Physics
min: 30983 avg: 36076 median: 36076 (38%) max: 41169 Points
...
...
3DMark - 3DMark Ice Storm Unlimited Physics
min: 38224 avg: 41146 median: 41145.5 (43%) max: 44067 Points
...
...
3DMark - 3DMark Cloud Gate Physics
min: 3051 avg: 3295 median: 3262.5 (8%) max: 3603 Points
...
...
3DMark - 3DMark Fire Strike Standard Physics
min: 4460 avg: 4821 median: 4764.5 (12%) max: 5293 Points
...
...
3DMark - 3DMark Time Spy CPU
1952 Points (13%)
...
...
Geekbench 3 - Geekbench 3 32 Bit Multi-Core
6805 points (12%)
...
...
Geekbench 3 - Geekbench 3 32 Bit Single-Core
3290 points (68%)
...
...
Geekbench 3 - Geekbench 3 64 Bit Multi-Core
min: 7163 avg: 7387 median: 7386.5 (12%) max: 7610 points
...
...
Geekbench 3 - Geekbench 3 64 Bit Single-Core
min: 3461 avg: 3583 median: 3582.5 (73%) max: 3704 points
...
...
Geekbench 4.0 - Geekbench 4.0 64 Bit Single-Core
3874 points (60%)
...
...
Geekbench 4.0 - Geekbench 4.0 64 Bit Multi-Core
7532 points (18%)
...
...
Mozilla Kraken 1.1 - Kraken 1.1 Total Score *
min: 963 avg: 1336 median: 1210.2 (2%) max: 1961.2 ms
...
...
Sunspider - Sunspider 1.0 Total Score *
min: 75.6 avg: 90.6 median: 80.5 (1%) max: 126 ms
...
...
Octane V2 - Octane V2 Total Score
min: 30059 avg: 31545 median: 31545 (47%) max: 33031 Points
...
...
- Range of benchmark values for this graphics card

- Average benchmark values for this graphics card
* Smaller numbers mean a higher performance
v1.16
log 13. 06:02:29
#0 no ids found in url (should be separated by "_") +0s ... 0s
#1 not redirecting to Ajax server +0s ... 0s
#2 did not recreate cache, as it is less than 5 days old! Created at Sat, 10 Apr 2021 10:58:17 +0200 +0s ... 0s
#3 composed specs +0.01s ... 0.011s
#4 did output specs +0s ... 0.011s
#5 getting avg benchmarks for device 7038 +0.001s ... 0.011s
#6 got single benchmarks 7038 +0.011s ... 0.022s
#7 got avg benchmarks for devices +0s ... 0.022s
#8 min, max, avg, median took s +0.3s ... 0.323s
#9 return log +0.004s ... 0.326s
Other CPUs of the series Core i5