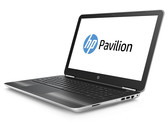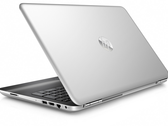

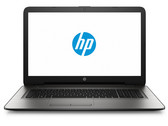
HP 17-y044ng Notebook Review
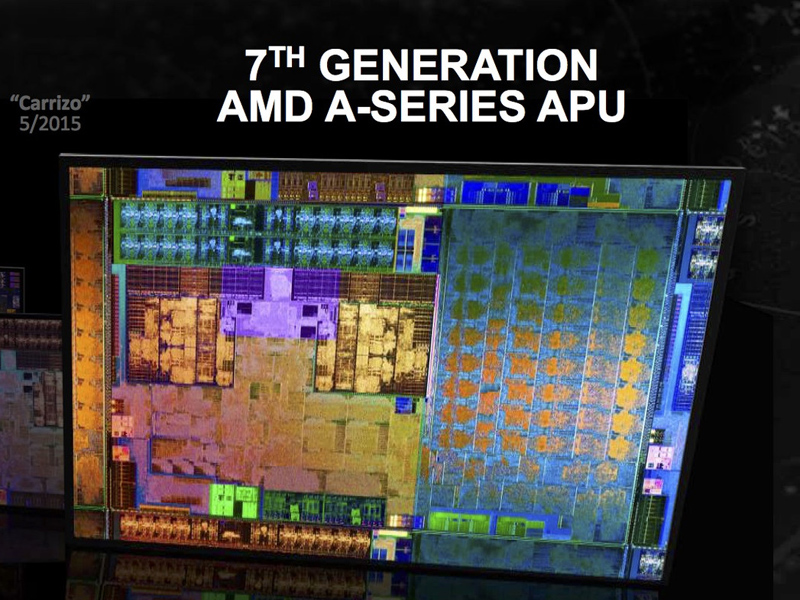
AMD office. HP's 17.3-inch device is made for users who are looking for a simple 17.3-inch notebook for home use. Accordingly, the computer comes with plenty of storage space (1 TB) and a more than sufficient amount of RAM (8 GB; dual-channel mode). However, these are all of the laptop's highlights. The list of shortcomings is more extensive.
AMD A10-9600P, Radeon R5 (Bristol Ridge), 17.3", 2.7 kg