Reviews for the Intel Core i3-7130U processor
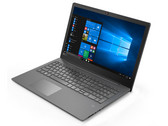
Lenovo V330-15IKB (i3-7130U, SSD, FHD) Laptop Review
Ultrabay reloaded. The 15.6-incher from Lenovo features a Kaby Lake processor, an SSD, and 8 GB of (dual-channel) RAM. Windows 10 Pro serves as the OS. The battery life fails to impress. However, you can put a secondary battery inside the device.
Intel Core i3-7130U, UHD Graphics 620, 15.6", 1.8 kgLenovo Ideapad 330-15IKB-81DC00UEGE: Intel HD Graphics 620, 15.60", 2.2 kg
External Review » Lenovo Ideapad 330-15IKB-81DC00UEGE
Dell Latitude 5420 Rugged, i3-7130U: Intel HD Graphics 620, 14.00", 2.2 kg
External Review » Dell Latitude 5420 Rugged, i3-7130U
Lenovo Ideapad 520s-14IKB-80X200G3SP: Intel HD Graphics 620, 14.00", 1.7 kg
External Review » Lenovo Ideapad 520s-14IKB-80X200G3SP
Dell Inspiron 13 5370-0576: Intel HD Graphics 620, 13.30", 1.4 kg
External Review » Dell Inspiron 13 5370-0576
Lenovo Yoga 520-14IKB-80X800WMMH: Intel UHD Graphics 620, 14.00", 1.7 kg
External Review » Lenovo Yoga 520-14IKB-80X800WMMH
Dell Inspiron 13 5730 CN537001: Intel HD Graphics 620, 13.30", 1.4 kg
External Review » Dell Inspiron 13 5730 CN537001
Lenovo Ideapad 320-15IKB-80XL03L4SP: NVIDIA GeForce 940MX, 15.60", 2.2 kg
External Review » Lenovo Ideapad 320-15IKB-80XL03L4SP
Dell Latitude 13 3390-T1VHM: Intel HD Graphics 620, 13.30", 1.6 kg
External Review » Dell Latitude 3390-T1VHM
Acer Aspire E5-576G-36WC: NVIDIA GeForce 940MX, 15.60", 2.1 kg
External Review » Acer Aspire E5-576G-36WC
Acer Spin 3 SP314-51-34CD: Intel HD Graphics 620, 14.10", 1.7 kg
External Review » Acer Spin 3 SP314-51-34CD
Lenovo IdeaPad 320-15IKBN-80XL03CLSP: Intel HD Graphics 620, 15.60", 2.2 kg
External Review » Lenovo IdeaPad 320-15IKBN-80XL03CLSP
Acer Aspire 3 A315-51-31FY: Intel HD Graphics 620, 15.60", 2.4 kg
External Review » Acer Aspire 3 A315-51-31FY