Reviews for the AMD Ryzen 5 3550H processor
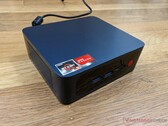
Trigkey S3 mini PC review: Core i3-like performance for the price of a Celeron or Atom
The Trigkey is inexpensive at just under US$300, but it thankfully sidesteps the terribly slow Celeron or Atom solutions for an older but faster AMD Zen+ processor instead. Even light HTPC multi-tasking can benefit from the aging AMD processor.
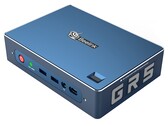
AMD Ryzen 5 3550H, Vega 8, 419 gBeelink GT-R Mini Desktop Review
The Beelink GT-R is a pluck Ryzen-powered mini desktop that has a lot to offer. Its build quality is excellent, and its performance is fairly good for a small-form-factor PC, but some small quirks and a high price tag may keep it off some people's desks.
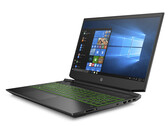
AMD Ryzen 5 3550H, Vega 8, 843 gHP Pavilion Gaming 15 in Review: Cheap gaming laptop with good battery life
The Pavilion Gaming 15's combination of CPU and GPU is able to display all current PC games smoothly on the 15.6-inch screen. On top of that, it comes with an NVMe SSD, 8 GB of RAM (dual-channel mode) and very good battery life. However, the display is disappointing.
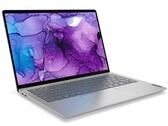
AMD Ryzen 5 3550H, NVIDIA GeForce GTX 1050 Mobile, 15.6", 2.3 kgLenovo IdeaPad S540-13API Laptop in Review: Slim Ryzen Companion with Long Battery Life
While the Lenovo IdeaPad S540 does not take any new steps when it comes to the design, it is equipped with the AMD Ryzen 5 3550H, which is supposed to offer better long-term performance. Combined with a big battery, the 13.3-inch laptop looks like a promising companion for longer work days. In this review, we will determine what else the small bundle of energy is capable of.
AMD Ryzen 5 3550H, Vega 8, 13.3", 1.3 kgAsus TUF Gaming FX705DT (Ryzen 5 3550H, GTX 1650, SSD, FHD) Laptop Review
The hardware spec, comprised of a Ryzen 5 3550H APU and GeForce GTX 1650 GPU, is able to fluidly play all modern and current games on its 17.3-inch, full HD IPS display. The laptop has comparatively low energy consumption and only gets moderately warm. In its favour are also an NVMe SSD, an additional HDD and very good battery life. Not so good is the somewhat miserly connectivity included.
AMD Ryzen 5 3550H, NVIDIA GeForce GTX 1650 Mobile, 17.3", 2.7 kgAsus TUF FX705DY-AU072 : AMD Radeon RX 560X (Laptop), 17.30", 2.7 kg
Review » ASUS TUF Gaming FX705DY (Ryzen 5 3550H, Radeon RX 560X, SSD, FHD) Laptop Review
Asus TUF FX505DY: AMD Radeon RX 560X (Laptop), 15.60", 2.2 kg
Review » Asus TUF FX505DY (Ryzen 5 3550H, Radeon RX 560X) Laptop Review
Acer Nitro 5 AN515-43-R6BW: NVIDIA GeForce GTX 1650 Mobile, 15.60", 2.3 kg
External Review » Acer Nitro 5 AN515-43-R6BW
MSI Alpha 15 A3DC-250XES: AMD Radeon RX 5300M, 15.60"
External Review » MSI Alpha 15 A3DC-250XES
Acer Aspire 7 A715-41G-R8MJ: NVIDIA GeForce GTX 1650 Mobile, 15.60", 2.2 kg
External Review » Acer Aspire 7 A715-41G-R8MJ
Acer Aspire 7 A715-41G-R5LR: NVIDIA GeForce GTX 1650 Mobile, 15.60", 2.4 kg
External Review » Acer Aspire 7 A715-41G-R5LR
Lenovo IdeaPad S540-13API: AMD Radeon RX Vega 8 (Ryzen 2000/3000), 13.30", 1.3 kg
External Review » Lenovo IdeaPad S540-13API
Honor MagicBook Pro HLY-19R: AMD Radeon RX Vega 8 (Ryzen 2000/3000), 16.10", 1.7 kg
External Review » Honor MagicBook Pro HLY-19R
Asus TUF FX505DT-BQ051: NVIDIA GeForce GTX 1650 Mobile, 15.60", 2.2 kg
External Review » Asus TUF FX505DT-BQ051
HP Pavilion Gaming 15-ec0005ns: NVIDIA GeForce GTX 1050 Mobile, 15.60", 2.3 kg
External Review » HP Pavilion Gaming 15-ec0005ns
Acer Nitro 5 AN515-43-R84P: NVIDIA GeForce GTX 1650 Mobile, 15.60"
External Review » Acer Nitro 5 AN515-43-R84P
HP Pavilion Gaming 15-ec0006ns: NVIDIA GeForce GTX 1050 Mobile, 15.60", 2.3 kg
External Review » HP Pavilion Gaming 15-ec0006ns
HP Pavilion Gaming 15-ec0009ns: NVIDIA GeForce GTX 1050 Mobile, 15.60", 2 kg
External Review » HP Pavilion Gaming 15-ec0009ns
Acer Aspire Nitro 5 AN515-43-R4N0: AMD Radeon RX 560X (Laptop), 15.60", 2.3 kg
External Review » Acer Aspire Nitro 5 AN515-43-R4N0
Acer Nitro 5 AN515-43-R1BL: AMD Radeon RX 560X (Laptop), 15.60", 2.7 kg
External Review » Acer Nitro 5 AN515-43-R1BL
Asus TUF FX505DY-BQ024: AMD Radeon RX 560X (Laptop), 15.60", 2.2 kg
External Review » Asus TUF FX505DY-BQ024
HP Pavilion Gaming 15-ec0010nr: NVIDIA GeForce GTX 1050 Mobile, 15.60", 2.3 kg
External Review » HP Pavilion Gaming 15-ec0010nr
Asus TUF FX505DD-BQ114: NVIDIA GeForce GTX 1050 Max-Q, 15.60", 2.2 kg
External Review » Asus TUF FX505DD-BQ114
Asus TUF FX705DY-AU017T: AMD Radeon RX 560X (Laptop), 17.30", 2.7 kg
External Review » Asus TUF FX705DY-AU017T
Asus TUF FX505DY-AL007T: AMD Radeon RX 560X (Laptop), 15.60", 2.2 kg
External Review » Asus TUF FX505DY-AL007T
Asus TUF FX705DY-AU072 : AMD Radeon RX 560X (Laptop), 17.30", 2.7 kg
External Review » Asus TUF FX705DY-AU072
Asus TUF FX505DY-AL016T: AMD Radeon RX 560X (Laptop), 15.60", 2.2 kg
External Review » Asus TUF FX505DY-AL016T
Asus TUF FX505DY: AMD Radeon RX 560X (Laptop), 15.60", 2.2 kg
External Review » Asus TUF FX505DY
HP Pavilion Gaming 15-ec0002ng: NVIDIA GeForce GTX 1050 Mobile, 15.60", 2.3 kg
» Disappointing display - The HP Pavilion Gaming 15 in Review