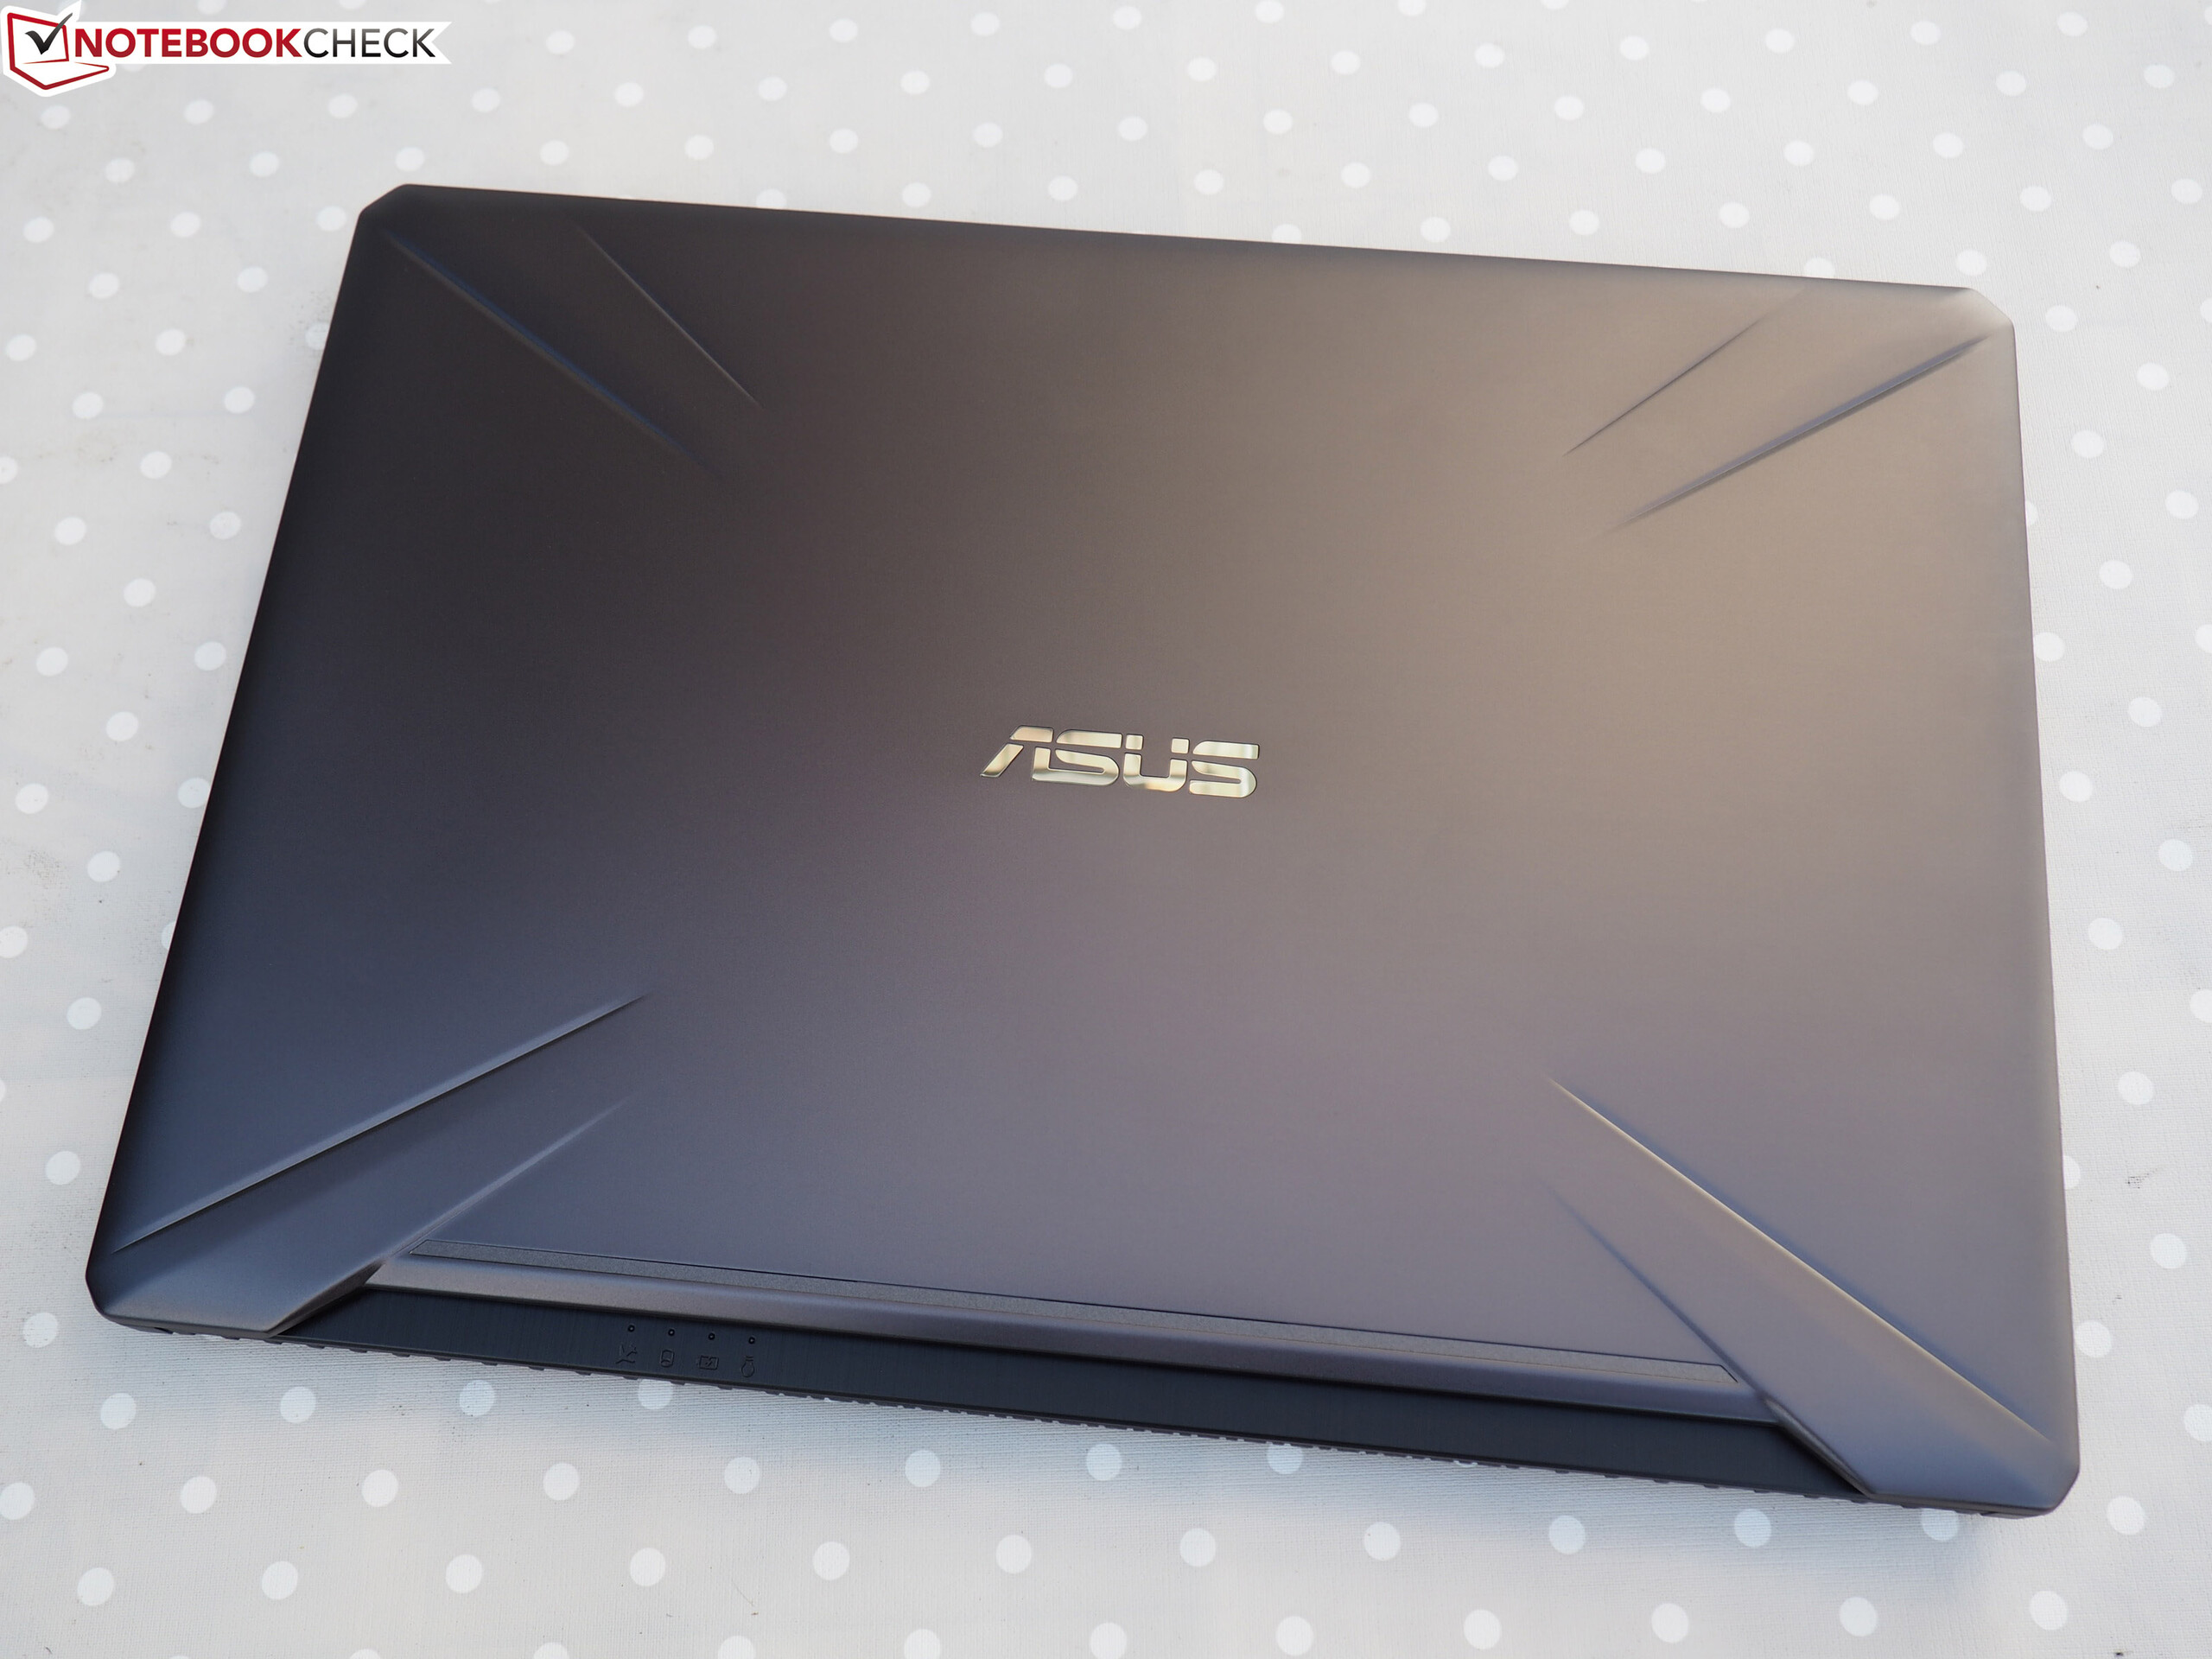
Asus TUF Gaming FX705DT (Ryzen 5 3550H, GTX 1650, SSD, FHD) Laptop Review

The TUF range from Asus is comprised of comparatively affordable gaming laptops, and we have already reviewed several models from this range. The model on the test bench today, the FX705DT, is already the fourth 17.3-inch device to come through our review labs. The hardware configuration of this unit makes it interesting - Asus has paired a Ryzen APU with a GeForce GPU, and our review will demonstrate whether this pairing works well. As competition we will be comparing it against the Acer Predator Helios 300 PH317-52, the Lenovo Legion Y730-17ICH, the MSI GF75 8RD and the Dell G3 17 3779.

Display - IPS-Equipped

The matte 17.3-inch display of the FX705DT has a native resolution of 1,920x1,080 pixels. Brightness (293.8 cd/m²) and contrast (988:1) are fine. Generally we consider values on or above 300 cd/m² and 1000:1 respectively to be good. Positive: The display shows no signs of PWM flickering.
The display is also of the IPS variety, with good viewing angles - the same as in two of its sibling models previously reviewed by us. The values do vary a little, however this is normal - apparently, identical display panels will differ from one another ever so slightly.
| |||||||||||||||||||||||||
Brightness Distribution: 84 %
Center on Battery: 316 cd/m²
Contrast: 988:1 (Black: 0.32 cd/m²)
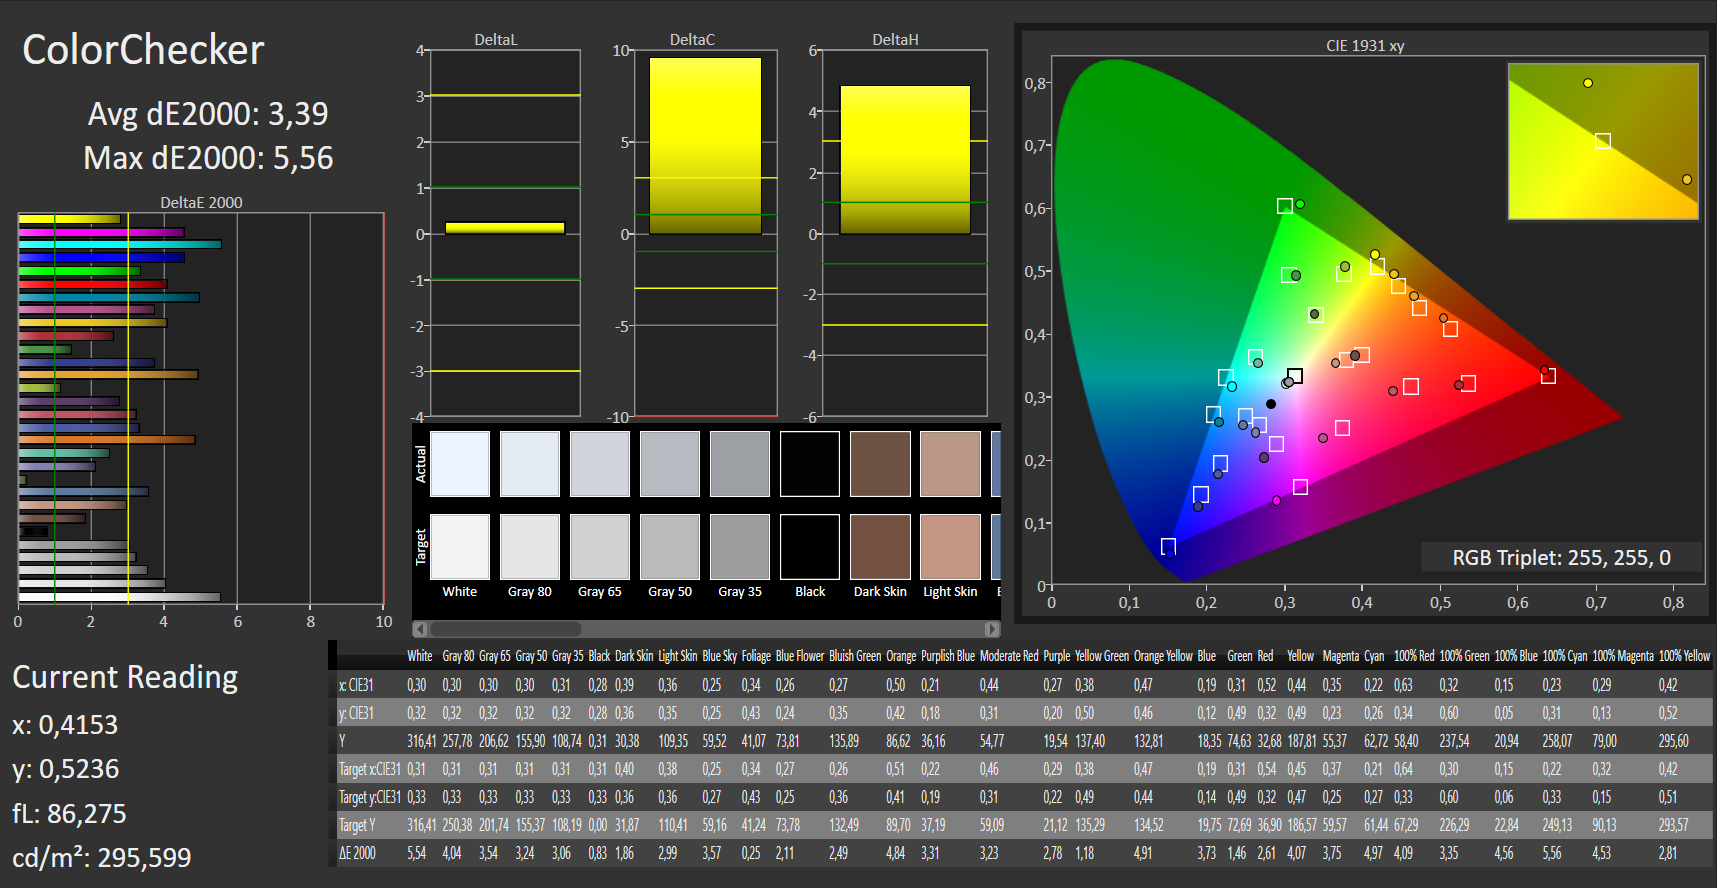
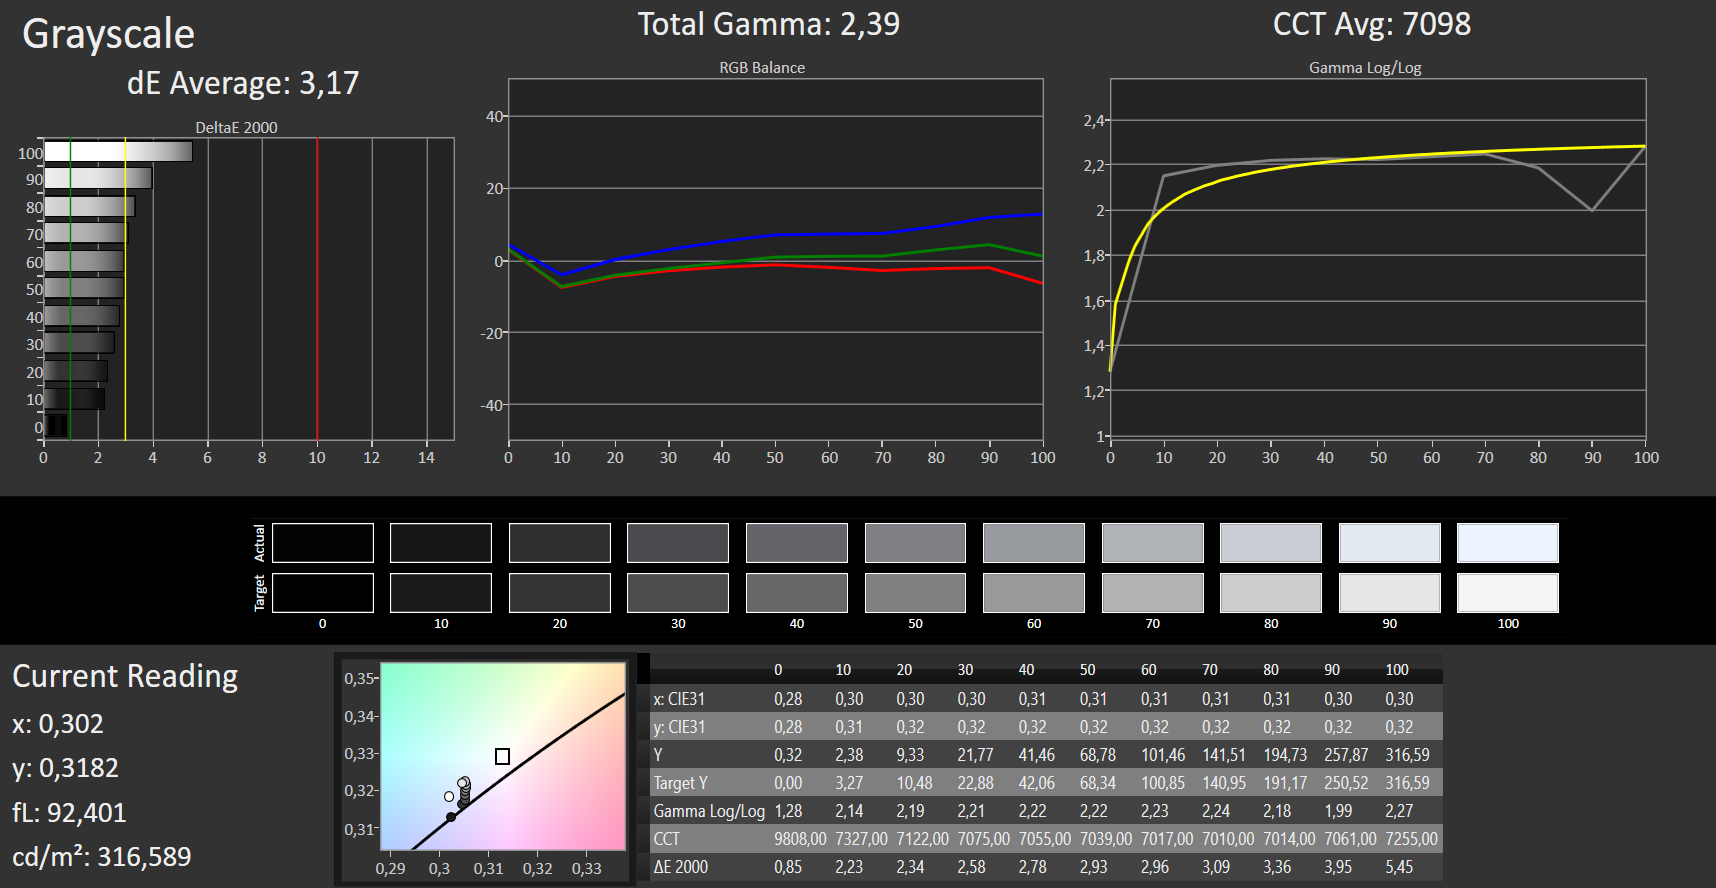
ΔE ColorChecker Calman: 3.39 | ∀{0.5-29.43 Ø4.73}
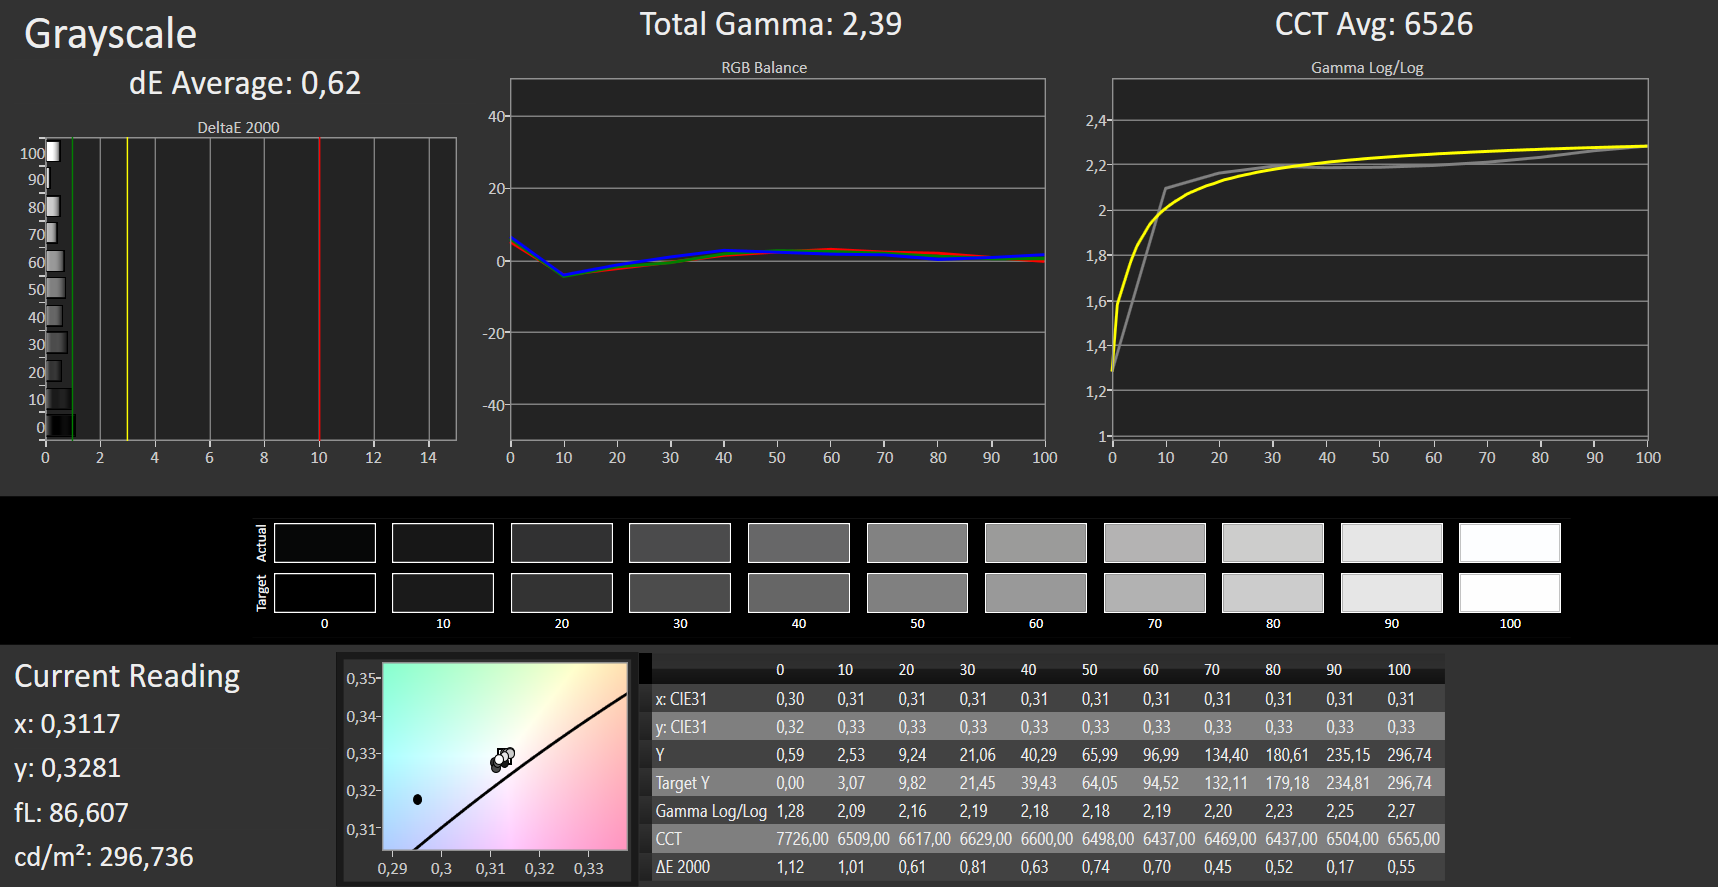
calibrated: 2.14
ΔE Greyscale Calman: 3.17 | ∀{0.09-98 Ø4.97}
89% sRGB (Argyll 1.6.3 3D)
51% AdobeRGB 1998 (Argyll 1.6.3 3D)
63.7% AdobeRGB 1998 (Argyll 3D)
89.1% sRGB (Argyll 3D)
62.3% Display P3 (Argyll 3D)
Gamma: 2.39
CCT: 7098 K
| Asus TUF FX705DT-AU068T IPS, 1920x1080, 17.3" | Asus TUF FX705DY-AU072 IPS, 1920x1080, 17.3" | MSI GF75 8RD-001 IPS, 1920x1080, 17.3" | Lenovo Legion Y730-17ICH, i7-8750H IPS, 1920x1080, 17.3" | Acer Predator Helios 300 PH317-52-51M6 IPS, 1920x1080, 17.3" | Asus TUF FX705GE-EW096T IPS, 1920x1080, 17.3" | Asus TUF FX705GM IPS, 1920x1080, 17.3" | Dell G3 17 3779 IPS, 1920x1080, 17.3" | |
|---|---|---|---|---|---|---|---|---|
| Display | 2% | -0% | 1% | -1% | 0% | 2% | ||
| Display P3 Coverage (%) | 62.3 | 64 3% | 66.4 7% | 67.1 8% | 63.1 1% | 62.4 0% | 63.9 3% | |
| sRGB Coverage (%) | 89.1 | 90.1 1% | 84.9 -5% | 86.1 -3% | 86.8 -3% | 88.8 0% | 89.8 1% | |
| AdobeRGB 1998 Coverage (%) | 63.7 | 65.2 2% | 62.1 -3% | 63 -1% | 63.5 0% | 63.8 0% | 64.9 2% | |
| Response Times | 6% | 7% | 15% | 20% | 6% | 75% | 10% | |
| Response Time Grey 50% / Grey 80% * (ms) | 41 ? | 40 ? 2% | 38 ? 7% | 36.8 ? 10% | 36 ? 12% | 39 ? 5% | 7.4 ? 82% | 38 ? 7% |
| Response Time Black / White * (ms) | 30 ? | 27 ? 10% | 28 ? 7% | 24 ? 20% | 22 ? 27% | 28 ? 7% | 10 ? 67% | 26 ? 13% |
| PWM Frequency (Hz) | 122000 ? | |||||||
| Screen | 5% | 14% | -29% | -30% | 4% | 13% | -14% | |
| Brightness middle (cd/m²) | 316 | 322 2% | 356 13% | 328.7 4% | 365 16% | 299 -5% | 234 -26% | 323 2% |
| Brightness (cd/m²) | 294 | 303 3% | 332 13% | 318 8% | 341 16% | 291 -1% | 228 -22% | 306 4% |
| Brightness Distribution (%) | 84 | 84 0% | 89 6% | 91 8% | 89 6% | 90 7% | 85 1% | 89 6% |
| Black Level * (cd/m²) | 0.32 | 0.32 -0% | 0.27 16% | 0.51 -59% | 0.32 -0% | 0.28 12% | 0.2 37% | 0.31 3% |
| Contrast (:1) | 988 | 1006 2% | 1319 34% | 645 -35% | 1141 15% | 1068 8% | 1170 18% | 1042 5% |
| Colorchecker dE 2000 * | 3.39 | 2.97 12% | 2.73 19% | 4.91 -45% | 6.51 -92% | 3.02 11% | 2.16 36% | 4.96 -46% |
| Colorchecker dE 2000 max. * | 5.56 | 5.08 9% | 4.7 15% | 10.15 -83% | 12.32 -122% | 5.27 5% | 3.39 39% | 8.25 -48% |
| Colorchecker dE 2000 calibrated * | 2.14 | 2.29 -7% | 2.14 -0% | 4.27 -100% | 2.9 -36% | 2.76 -29% | 2.02 6% | |
| Greyscale dE 2000 * | 3.17 | 2.26 29% | 2.38 25% | 3.9 -23% | 7.65 -141% | 2.18 31% | 2 37% | 5.65 -78% |
| Gamma | 2.39 92% | 2.45 90% | 2.48 89% | 2.13 103% | 2.64 83% | 2.48 89% | 2.46 89% | 2.24 98% |
| CCT | 7098 92% | 6892 94% | 6643 98% | 6911 94% | 8066 81% | 6392 102% | 6394 102% | 7441 87% |
| Color Space (Percent of AdobeRGB 1998) (%) | 51 | 57 12% | 59 16% | 55.6 9% | 56 10% | 57 12% | 58 14% | 58 14% |
| Color Space (Percent of sRGB) (%) | 89 | 87 -2% | 90 1% | 84.7 -5% | 86 -3% | 87 -2% | 89 0% | 90 1% |
| Total Average (Program / Settings) | 6% /
6% | 8% /
11% | -5% /
-18% | -3% /
-18% | 3% /
4% | 29% /
18% | -1% /
-7% |
* ... smaller is better

Display Response Times
| ↔ Response Time Black to White | ||
|---|---|---|
| 30 ms ... rise ↗ and fall ↘ combined | ↗ 16 ms rise |  |
| ↘ 14 ms fall | ||
| The screen shows slow response rates in our tests and will be unsatisfactory for gamers. In comparison, all tested devices range from 0.1 (minimum) to 240 (maximum) ms. » 80 % of all devices are better. This means that the measured response time is worse than the average of all tested devices (19.9 ms). | ||
| ↔ Response Time 50% Grey to 80% Grey | ||
| 41 ms ... rise ↗ and fall ↘ combined | ↗ 20 ms rise |  |
| ↘ 21 ms fall | ||
| The screen shows slow response rates in our tests and will be unsatisfactory for gamers. In comparison, all tested devices range from 0.165 (minimum) to 636 (maximum) ms. » 65 % of all devices are better. This means that the measured response time is worse than the average of all tested devices (31.1 ms). | ||
Screen Flickering / PWM (Pulse-Width Modulation)
| Screen flickering / PWM not detected |  | ||
In comparison: 52 % of all tested devices do not use PWM to dim the display. If PWM was detected, an average of 7816 (minimum: 5 - maximum: 343500) Hz was measured. | |||
Performance - AMD/Nvidia Power
With the TUF Gaming FX705DT, Asus presents a 17.3-inch gaming laptop able to competently and fluidly play all modern games. Our reviewed model is available for around 1,050 Euros (~$1,182), and other configurations are available.

Test Conditions
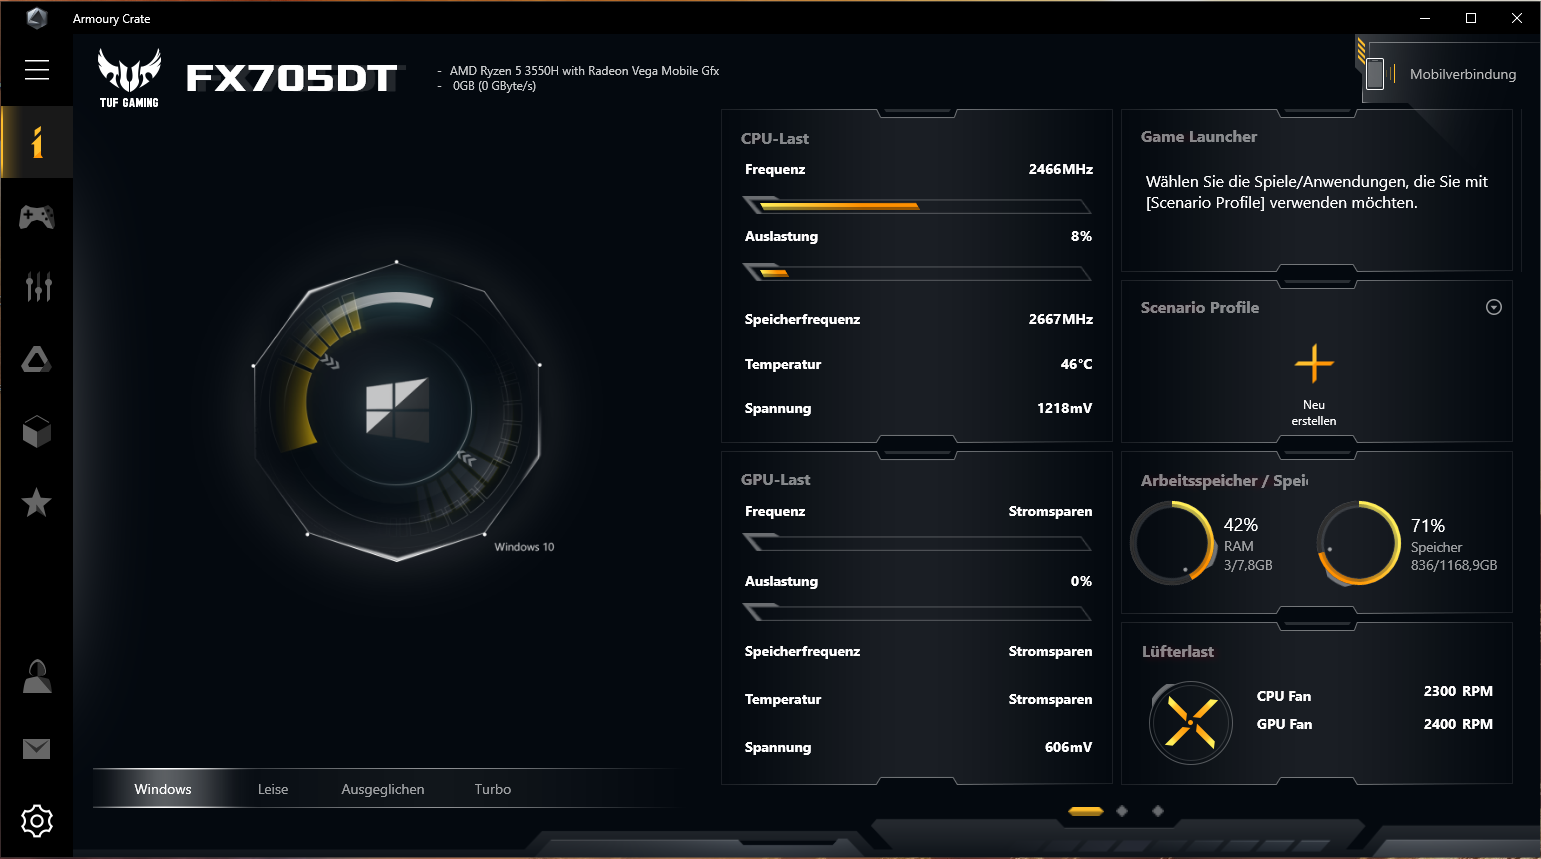
The pre-installed Armory Crate Control Center provides options for performance and power consumption. Available modes are 'Quiet', 'Balanced', 'Turbo' and 'Windows'. If the latter mode is enabled, Windows takes over power management. This option was chosen for our benchmarking.
Processor
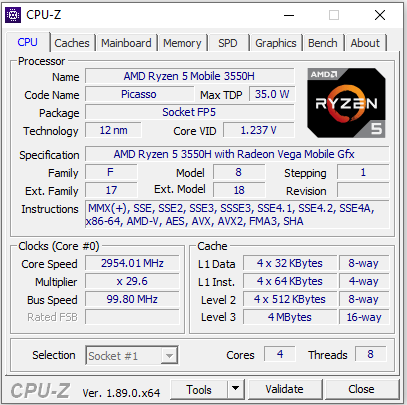
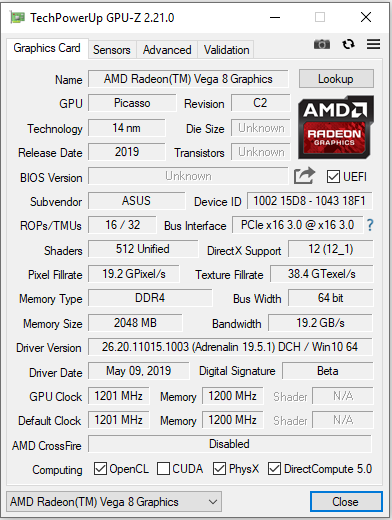
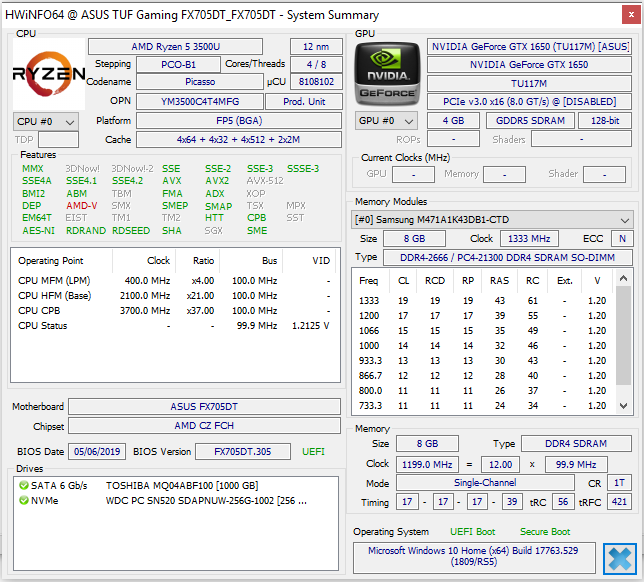
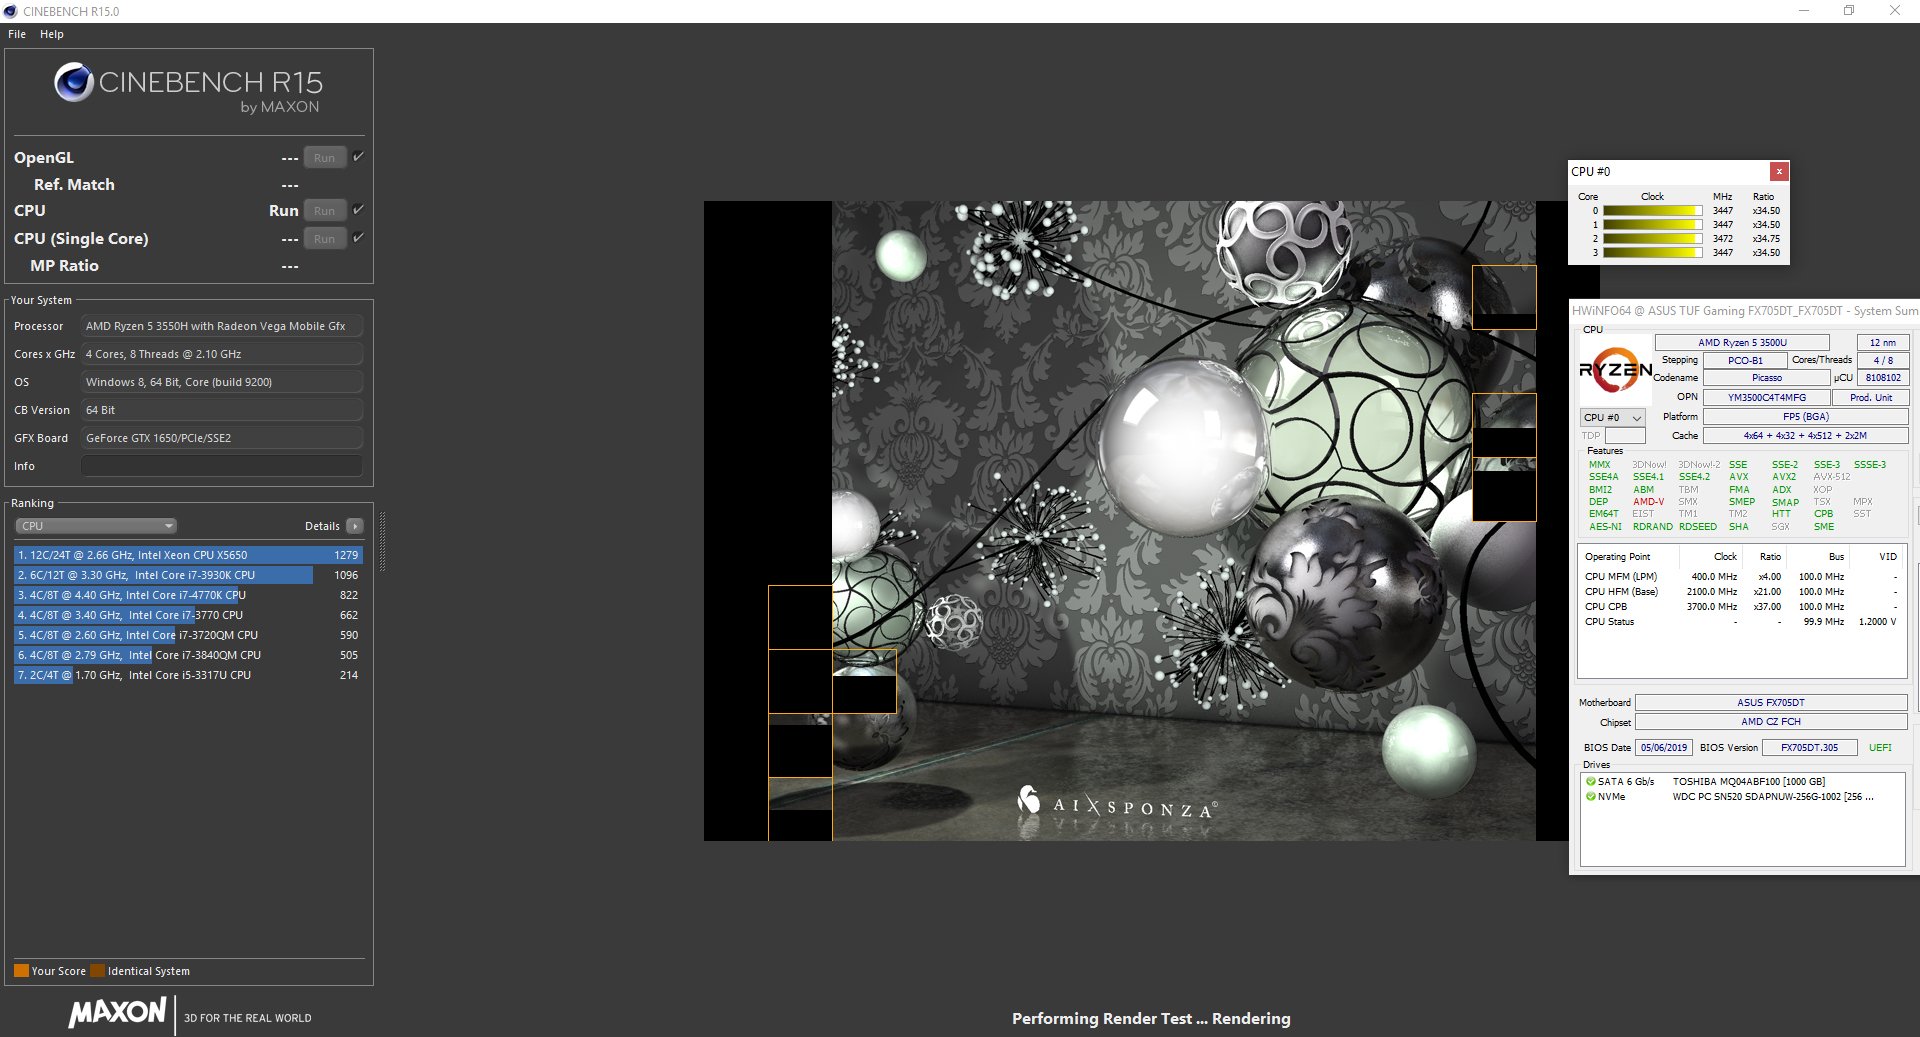
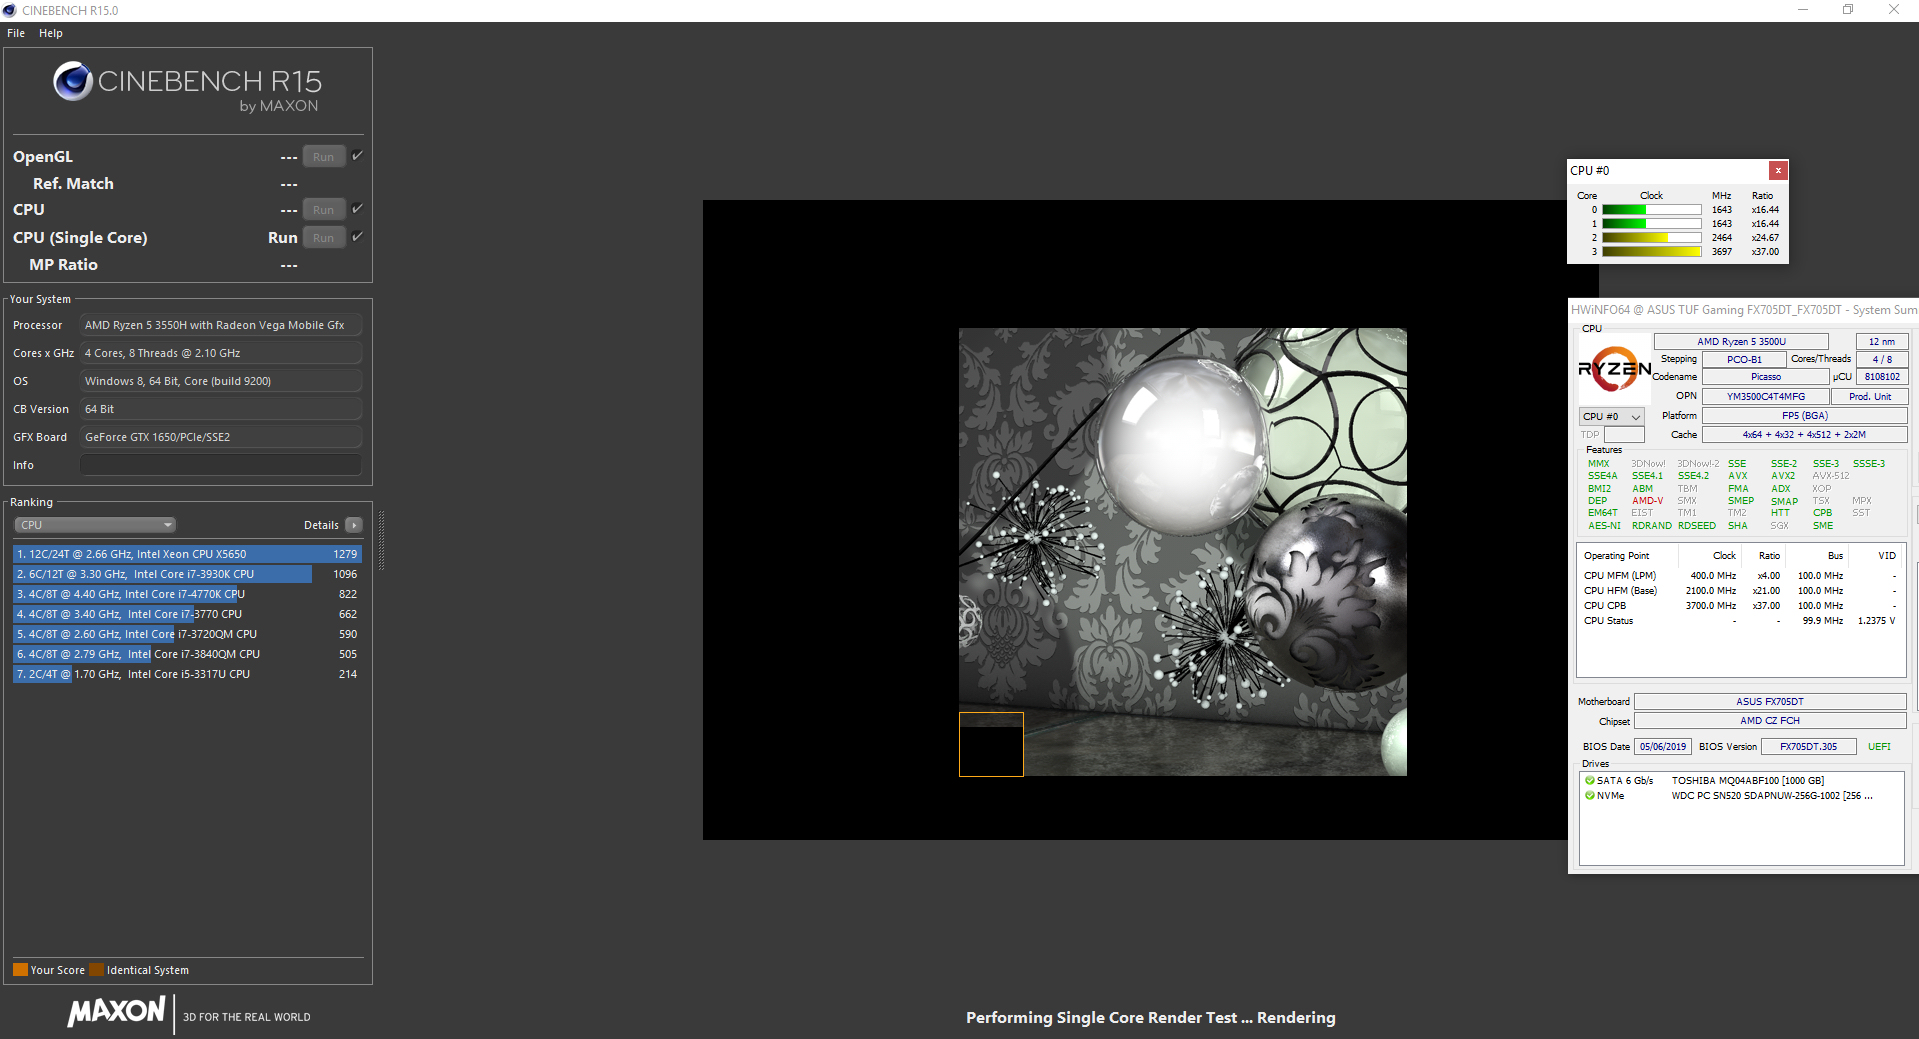
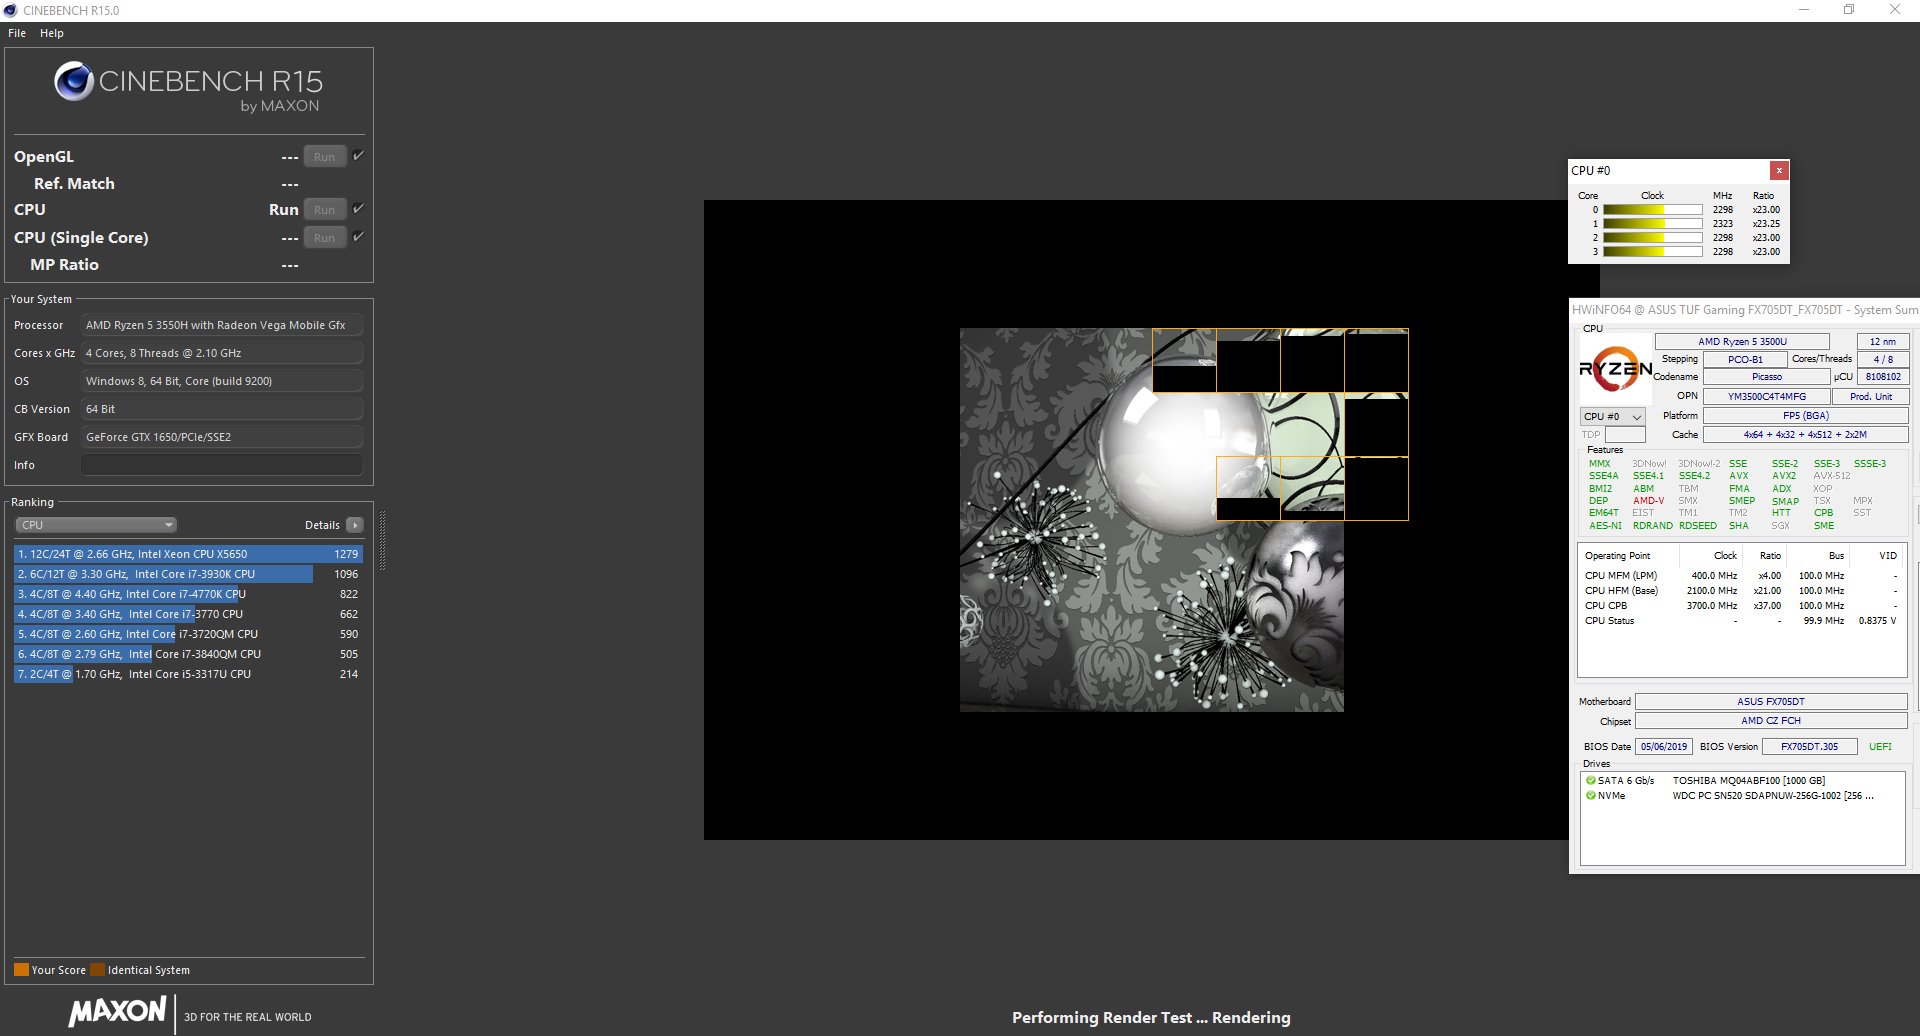
Asus has equipped the FX705DT with a Ryzen 5 3550H (Picasso) APU from AMD, which has a TDP value of 35 watts. The CPU portion of the APU features four cores running at a base clock of 2.1 GHz, which is able to turbo boost up to 3.7 GHz. The CPU also features simultaneous multi-threading, which allows for two threads per CPU core.
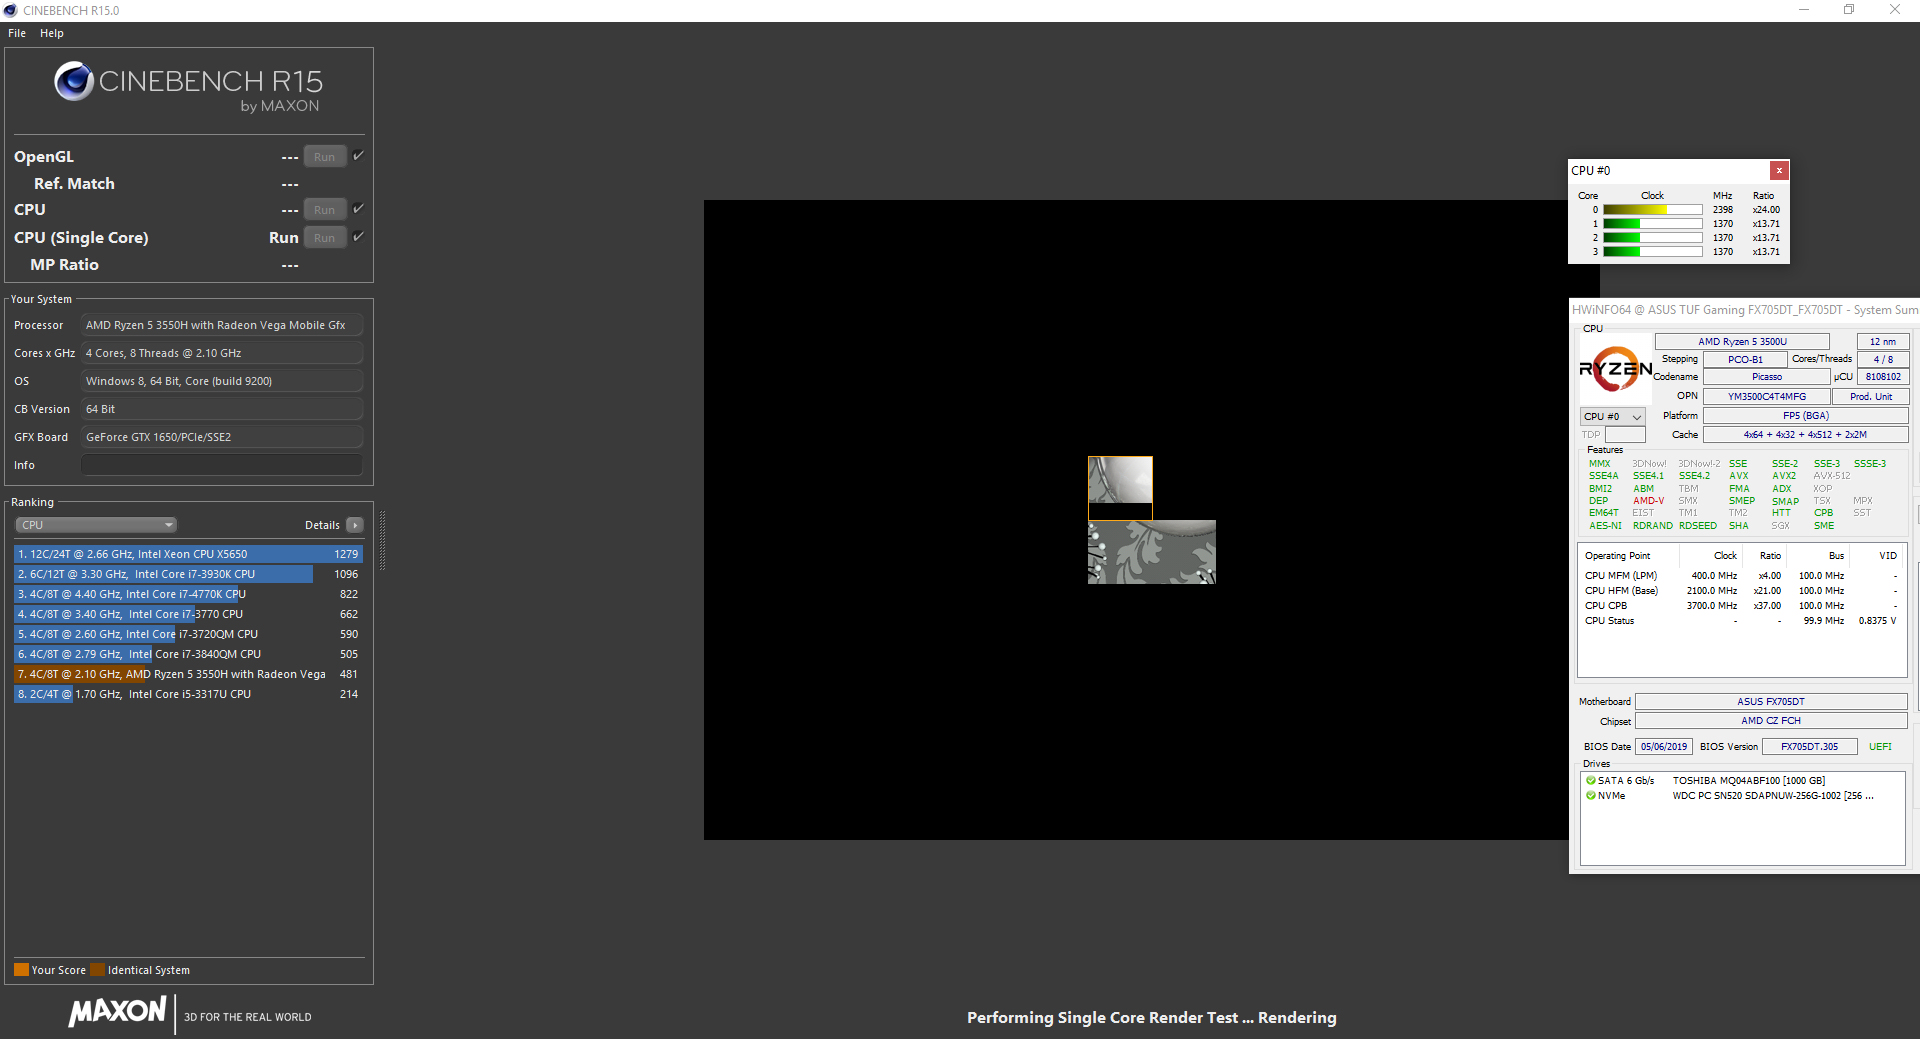
The multi-threaded benchmark Cinebench initially ran for a short period at 3.6 to 3.7 GHz, and then dropped down to 3.2 to 3.3 GHz. The single-threaded tests ran at between 1.7 to 3.7 GHz. This was on mains power - in battery mode, the CPU ran at 2.3 to 2.4 GHz (multi-threaded) and 1.4 to 2.4 GHz (single-threaded).
AMDs 3550H APU is a direct competitor to Intel's Core i5 8300H and Core i5 9300H CPUs. In terms of pure CPU performance however, the APU is not quite able to match Intel. The performance difference is more noticeable in the single-threaded benchmarks compared to multi-threaded. The Intel CPUs here benefit from their 10-watt higher TDP.
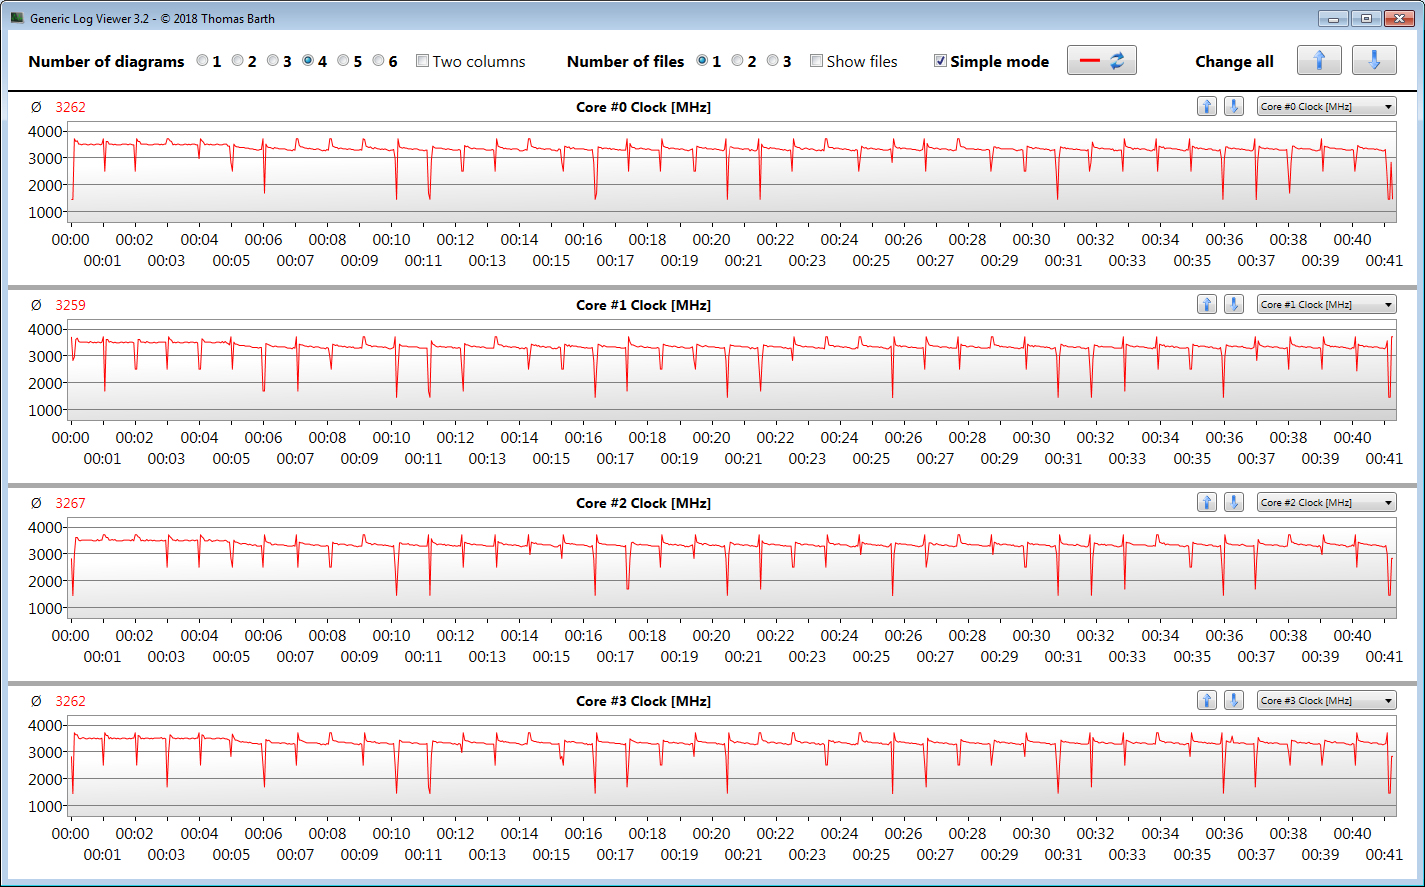
By using a looped run of Cinebench R15's multi-threaded benchmark for at least 30 minutes, we test whether or not the CPU is able to sustain longer periods of time with turbo boost. The results dropped somewhat between the 5th and 6th runs and then stayed at a constant level - CPU turbo boost was in operation.
If 'Turbo' mode is selected in the Armory Create Center, the APU deliveres slightly better results due to the fact that it runs at somewhat increased clock rates. The opposite is true if 'Quiet' mode is activated, but with the positive side effect that noise is significantly reduced.
| Geekbench 3 | |
| 32 Bit Multi-Core Score | |
| Asus TUF FX705GE-EW096T | |
| Asus TUF FX705DY-AU072 | |
| Average AMD Ryzen 5 3550H (13474 - 15114, n=3) | |
| Asus TUF FX705DT-AU068T | |
| 32 Bit Single-Core Score | |
| Asus TUF FX705GE-EW096T | |
| Average AMD Ryzen 5 3550H (3348 - 3558, n=3) | |
| Asus TUF FX705DY-AU072 | |
| Asus TUF FX705DT-AU068T | |
| Mozilla Kraken 1.1 - Total | |
| Asus TUF FX705DY-AU072 (Edge 44) | |
| Asus TUF FX705DT-AU068T (Edge 44) | |
| Dell G3 17 3779 (Edge 42.17134.1.0) | |
| Average AMD Ryzen 5 3550H (1042 - 1229, n=8) | |
| MSI GF75 8RD-001 | |
| Average of class Gaming (391 - 590, n=105, last 2 years) | |
| Octane V2 - Total Score | |
| Average of class Gaming (87588 - 139447, n=30, last 2 years) | |
| Dell G3 17 3779 (Edge 42.17134.1.0) | |
| Asus TUF FX705DY-AU072 (Edge 44) | |
| Average AMD Ryzen 5 3550H (28324 - 29361, n=4) | |
| Asus TUF FX705DT-AU068T (Edge 44) | |
| Speedometer 2.0 - Result 2.0 | |
| Average of class Gaming (29 - 686, n=29, last 2 years) | |
| Asus TUF FX705DY-AU072 (Edge 44) | |
| Average AMD Ryzen 5 3550H (42.1 - 43.5, n=2) | |
| Asus TUF FX705DT-AU068T (Edge 44) | |
| JetStream 1.1 - 1.1 Total | |
| Average of class Gaming (518 - 647, n=6, last 2 years) | |
| Asus TUF FX705GE-EW096T (Edge 44) | |
| Dell G3 17 3779 (Edge 42.17134.1.0) | |
| Average AMD Ryzen 5 3550H (190.9 - 210, n=4) | |
| Asus TUF FX705DT-AU068T (Edge 44) | |
* ... smaller is better
System Performance
The FX705DT offers plenty of performance for all daily usage scenarios and the dedicated GPU enables gaming potential. The system runs smoothly and without issue, and no problems were noted by us. This was borne out by the good results in PC Mark - checking the comparison chart, we see that most of the competition do beat out the Asus laptop, which can be attributed to their significantly more powerful Intel CPUs.
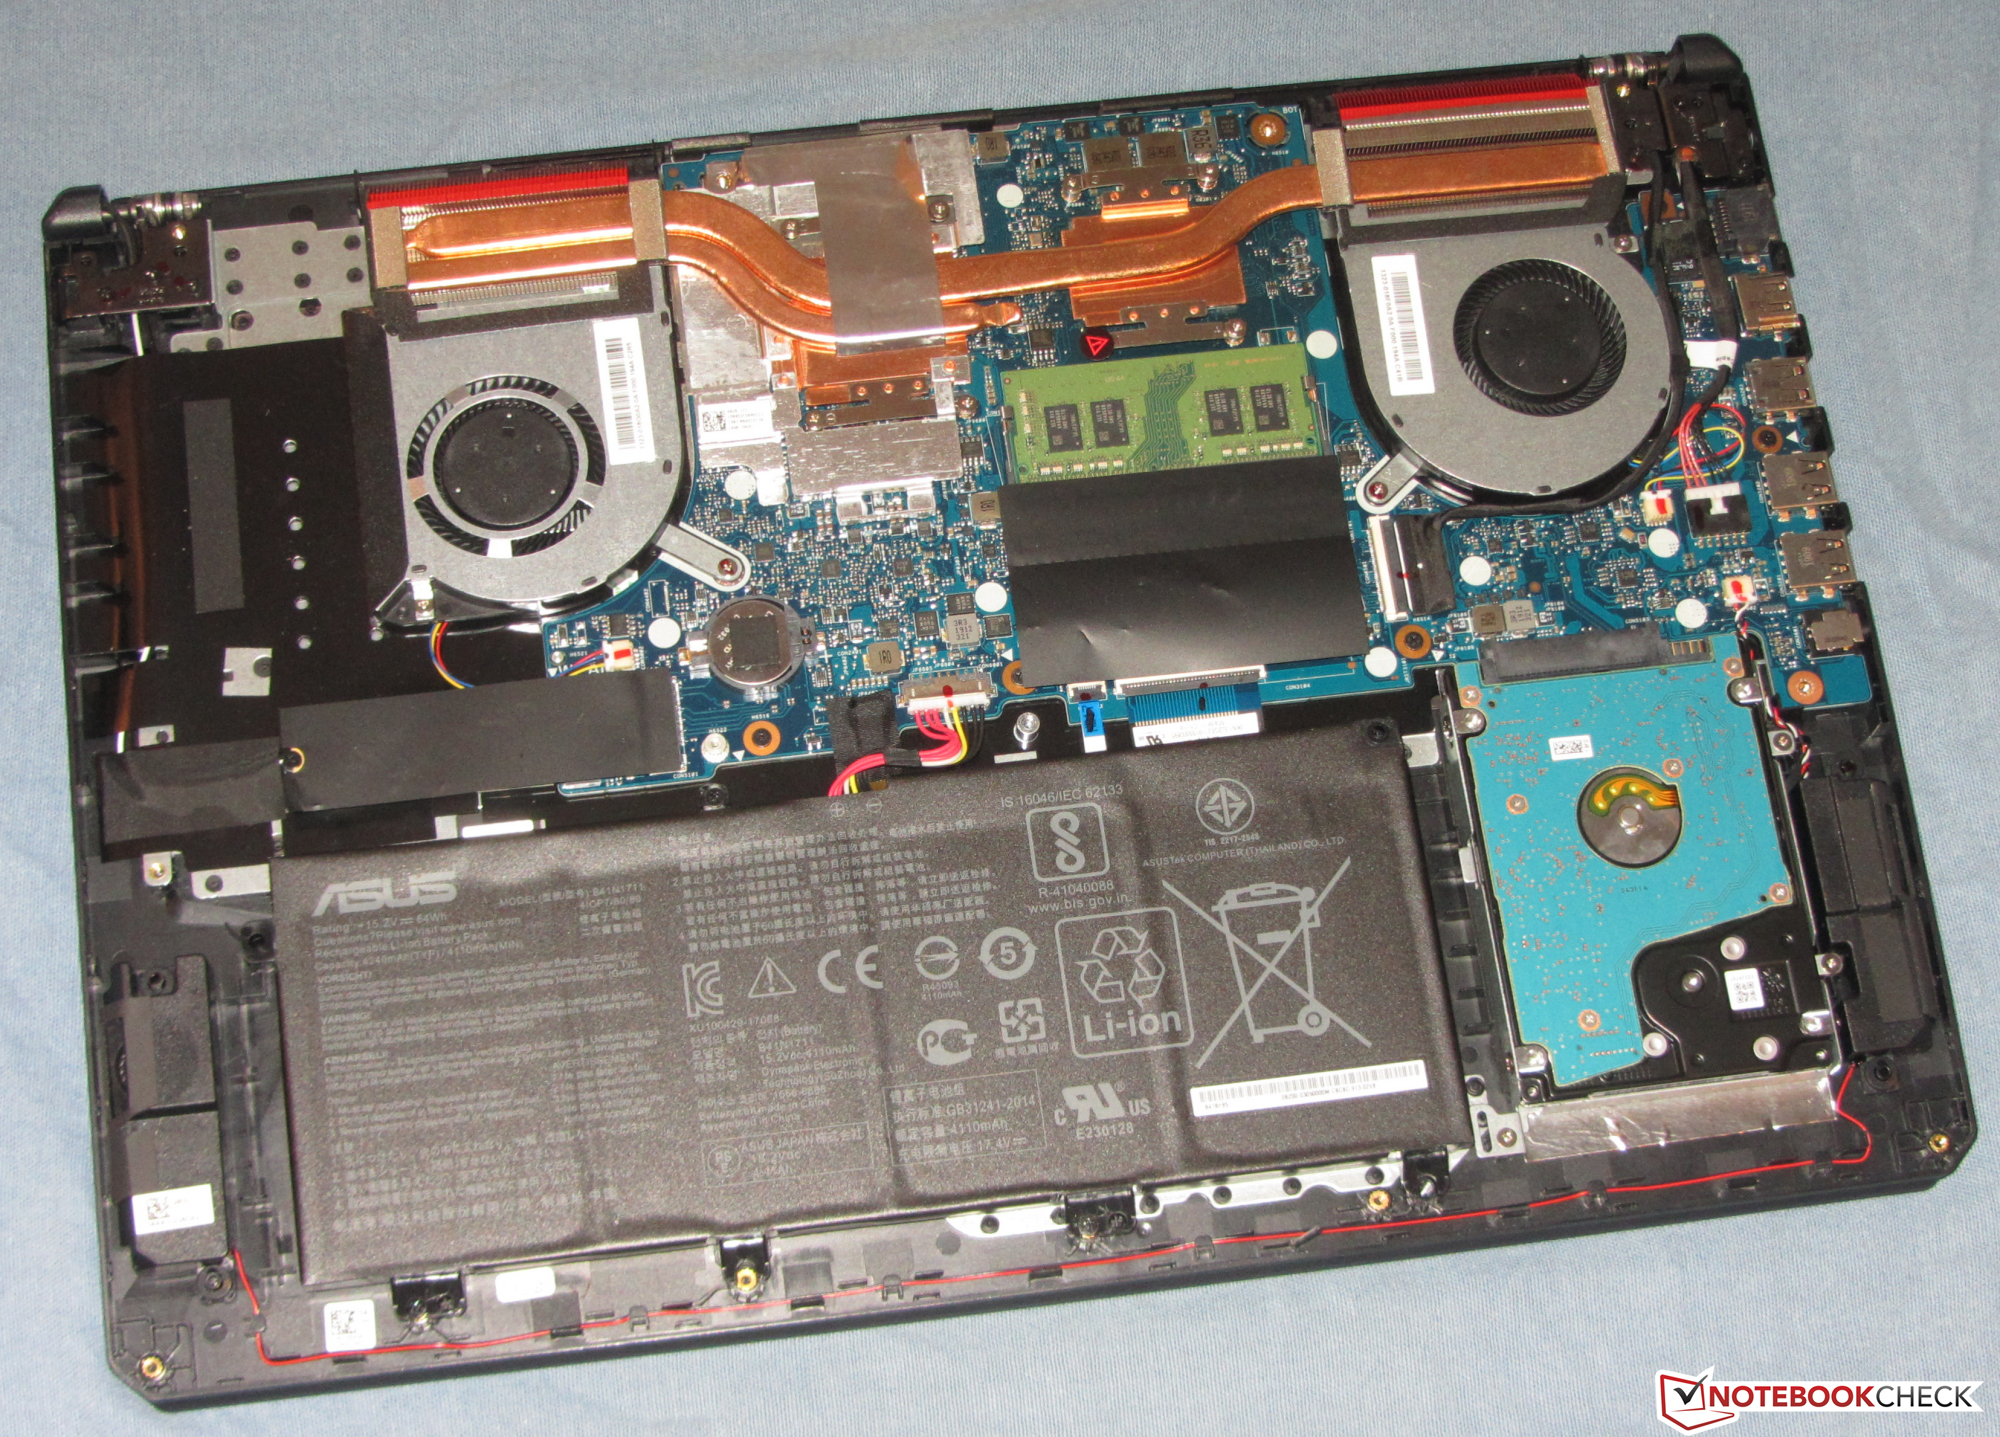
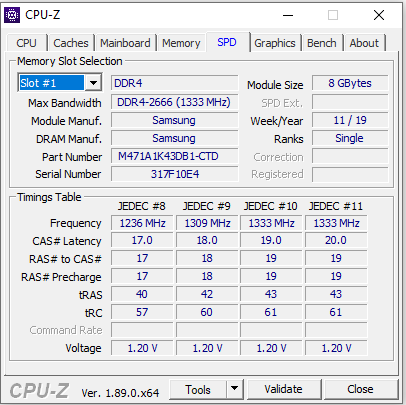
Increasing overall performance is possible however by installing a second RAM module. This would enable dual-channel RAM mode. Asus has installed only one module and thus the laptop runs in single-channel mode.
| PCMark 7 Score | 6405 points | |
| PCMark 8 Home Score Accelerated v2 | 4593 points | |
| PCMark 8 Creative Score Accelerated v2 | 3628 points | |
| PCMark 8 Work Score Accelerated v2 | 4898 points | |
| PCMark 10 Score | 4339 points | |
Help | ||
Storage
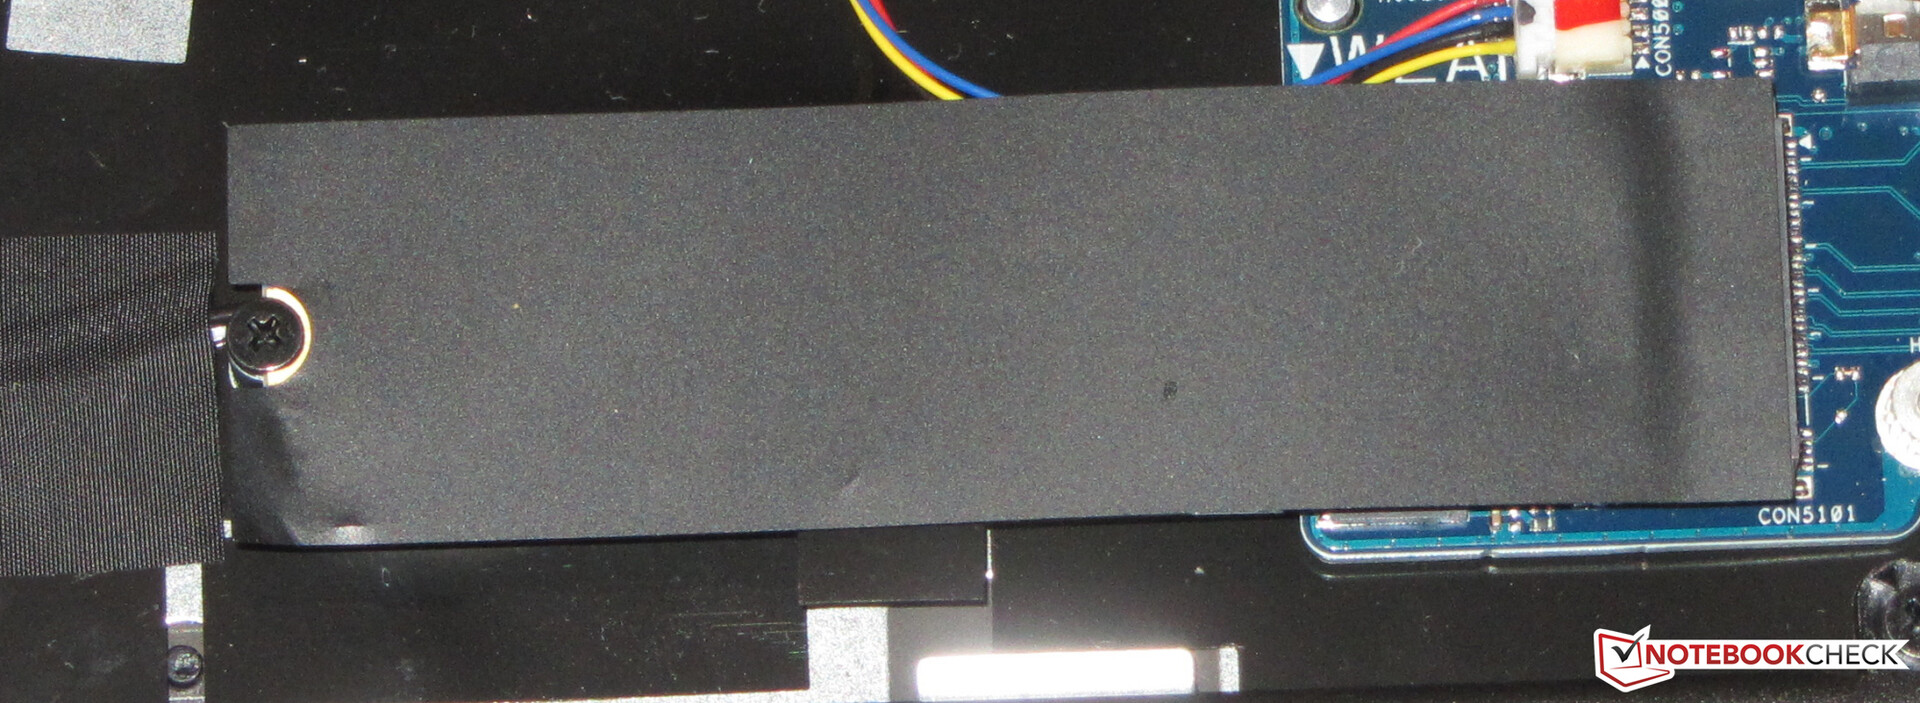
For its system drive the laptop features an NVMe SSD from Western Digital in M.2 2280 format and with 256 GB capacity. With default config and installation, approximately 208 GB is available as the rest is used by the OS installation and recovery partition. Due to its PCI Express connection, the NVMe SSD achieves significantly higher transfer rates than SATA 3 models (which are limited to 600 MB/s).
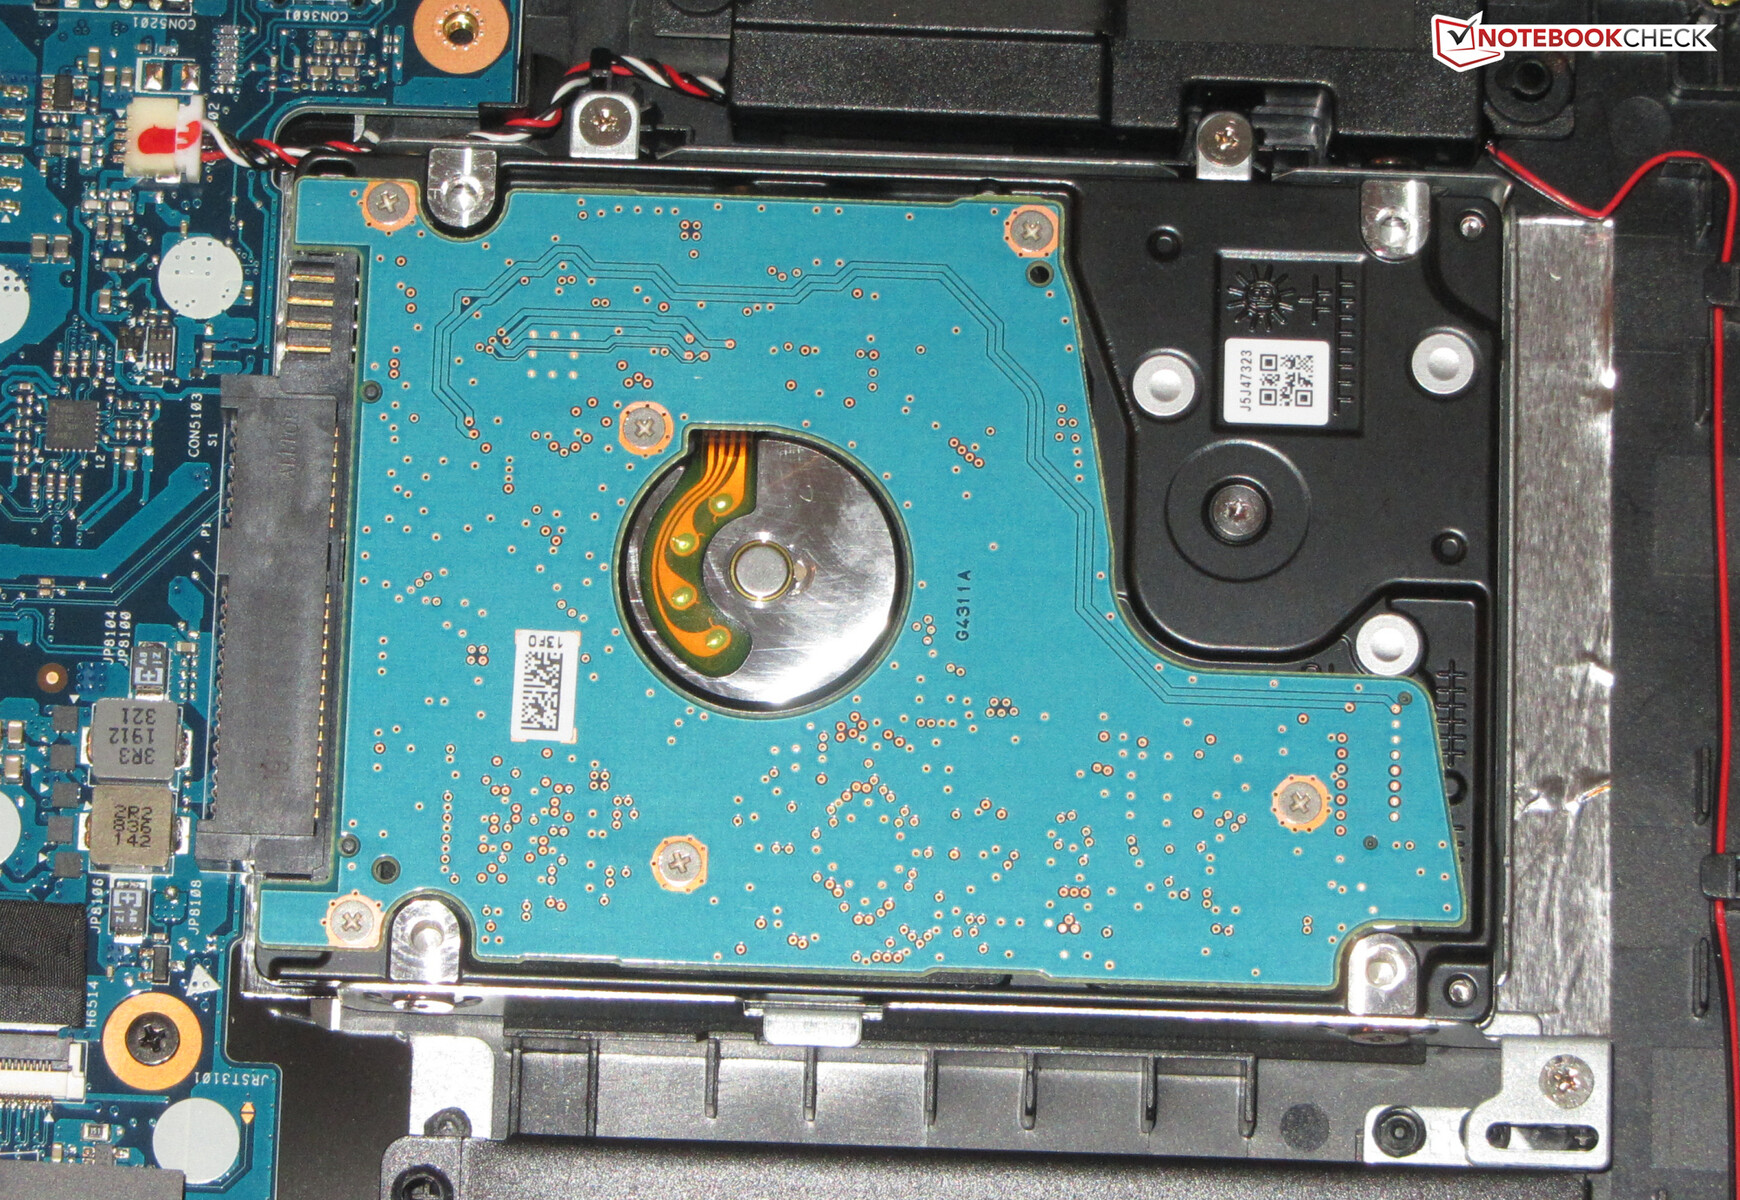
In terms of overall capacity, this 17.3-incher has you covered - also to be found in the laptop next to the SSD is a 2.5-inch HDD (1TB, 5400 RPM).

| Asus TUF FX705DT-AU068T WDC PC SN520 SDAPNUW-256G | MSI GF75 8RD-001 Kingston RBUSNS8154P3256GJ1 | Lenovo Legion Y730-17ICH, i7-8750H Toshiba KBG30ZMT128G | Acer Predator Helios 300 PH317-52-51M6 Hynix HFS128G39TND | Asus TUF FX705DY-AU072 Kingston RBUSNS8154P3512GJ | Asus TUF FX705GE-EW096T SK hynix BC501 HFM128GDJTNG-831 | Asus TUF FX705GM WDC PC SN520 SDAPNUW-256G | Dell G3 17 3779 SK hynix SC311 SATA | Average WDC PC SN520 SDAPNUW-256G | |
|---|---|---|---|---|---|---|---|---|---|
| CrystalDiskMark 5.2 / 6 | -23% | -56% | -63% | -10% | -36% | -4% | -60% | -5% | |
| Write 4K (MB/s) | 145 | 72.1 -50% | 71.4 -51% | 61.9 -57% | 107.7 -26% | 90.3 -38% | 104.2 -28% | 62.8 -57% | 118.5 ? -18% |
| Read 4K (MB/s) | 45.28 | 28.12 -38% | 29.98 -34% | 22.78 -50% | 36.5 -19% | 37.03 -18% | 41.46 -8% | 24.63 -46% | 42 ? -7% |
| Write Seq (MB/s) | 1301 | 746 -43% | 129.6 -90% | 136.1 -90% | 988 -24% | 320.3 -75% | 1295 0% | 203.9 -84% | 1123 ? -14% |
| Read Seq (MB/s) | 1362 | 834 -39% | 843 -38% | 490.1 -64% | 1115 -18% | 1012 -26% | 1325 -3% | 550 -60% | 1208 ? -11% |
| Write 4K Q32T1 (MB/s) | 249.1 | 313.7 26% | 88.9 -64% | 136.2 -45% | 334.9 34% | 196.8 -21% | 282.8 14% | 160.1 -36% | 324 ? 30% |
| Read 4K Q32T1 (MB/s) | 342.1 | 348.7 2% | 196.4 -43% | 208.4 -39% | 360.8 5% | 271.5 -21% | 321.3 -6% | 184.3 -46% | 322 ? -6% |
| Write Seq Q32T1 (MB/s) | 1301 | 854 -34% | 130.5 -90% | 136 -90% | 1008 -23% | 268.8 -79% | 1301 0% | 235 -82% | 1091 ? -16% |
| Read Seq Q32T1 (MB/s) | 1732 | 1587 -8% | 1037 -40% | 553 -68% | 1609 -7% | 1595 -8% | 1704 -2% | 554 -68% | 1729 ? 0% |
GPU
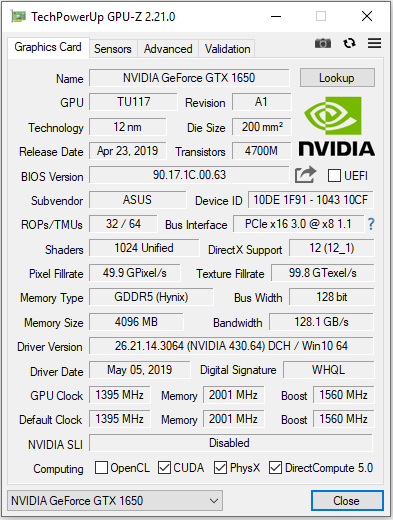
The TUF Gaming FX705DT is equipped with a GeForce GTX 1650 GPU From NVidia. This GPU belongs to the upper-midrange and is based on the Turing architecture. Compared to other GPUs from the Turing lineup such as the RTX 2000 series, the GTX 1650 does not feature any raytracing support or Tensor cores.
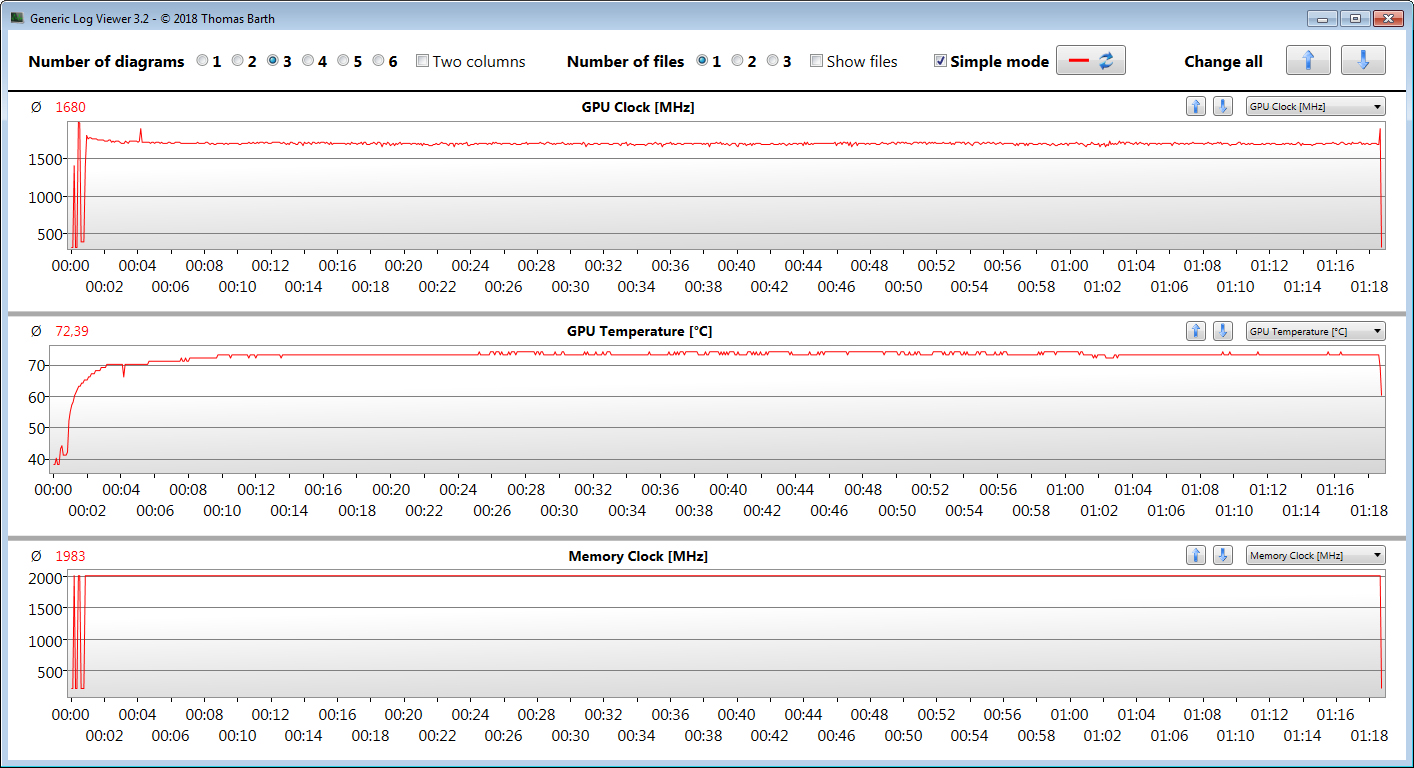
The GTX 1650 supports DirectX 12 and has a base clock rate of 1,395 MHz. This is able to boost up to 1,560 MHz. This value is however able to be exceeded if power and temperature conditions allow and do not exceed set parameters. We registered a maximum of 1,980 MHz, although this was only achieved for a short time. Our Witcher 3 benchmarking resulted in the GPU running at a constant 1,700 MHz. The GTX 1650 is paired with 4 GB of GDDR 5 RAM.
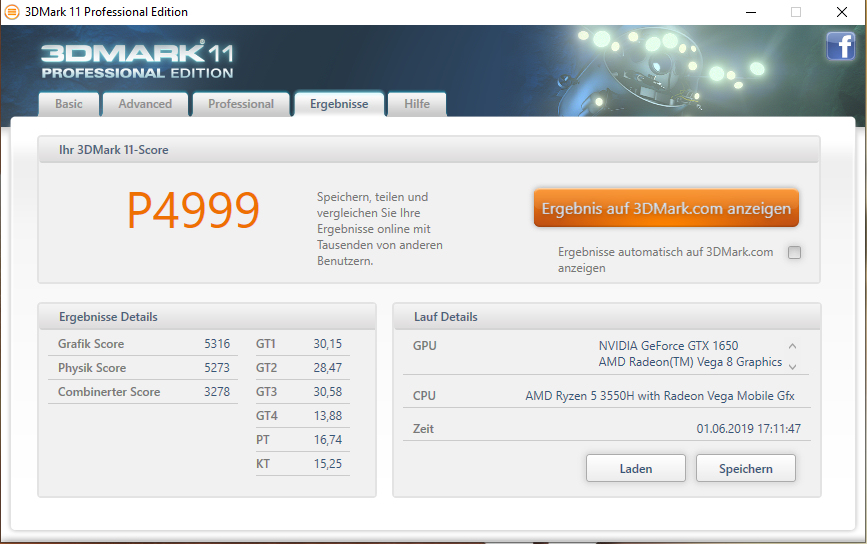
The 3D Mark benchmarks showed performance in line with expectations for this GPU. As the successor to the GTX 1050, it exceeds that model's performance significantly. The more powerful GTX 1050 Ti is able in less demanding benchmarks such as Sky Diver and Cloud Gate, to keep up with the GTX 1650, but in more intensive benchmarks such as Fire Strike and Time Spy, it falls behind. In terms of where the GTX 1650 falls in the charts, it can be considered to be in-between the GTX 1050 Ti and GeForce GTX 1060.

| 3DMark 05 Standard | 24001 points | |
| 3DMark 06 Standard Score | 23061 points | |
| 3DMark Vantage P Result | 27719 points | |
| 3DMark 11 Performance | 10635 points | |
| 3DMark Ice Storm Standard Score | 58789 points | |
| 3DMark Cloud Gate Standard Score | 16079 points | |
| 3DMark Fire Strike Score | 7942 points | |
| 3DMark Time Spy Score | 3437 points | |
Help | ||
| 3DMark 11 - 1280x720 Performance GPU | |
| Average of class Gaming (21841 - 80022, n=108, last 2 years) | |
| Asus GL704GM-DH74 | |
| Lenovo Legion Y530-15ICH | |
| Asus TUF FX705GM | |
| Asus TUF FX705DT-AU068T (Dual-Channel) | |
| Asus TUF FX705DT-AU068T | |
| Acer Aspire Nitro 5 AN515-54-53Z2 | |
| Acer Nitro 5 | |
| Average NVIDIA GeForce GTX 1650 Mobile (10885 - 13575, n=30) | |
| Asus TUF FX705GE-EW096T | |
| Acer Predator Helios 300 PH317-52-51M6 | |
| MSI GF75 8RD-001 | |
| Asus TUF FX705DY-AU072 | |
| Dell G3 17 3779 | |
| 3DMark | |
| 1280x720 Sky Diver Graphics | |
| Average of class Gaming (109202 - 176489, n=4, last 2 years) | |
| Acer Nitro 5 | |
| Average NVIDIA GeForce GTX 1650 Mobile (26305 - 33601, n=12) | |
| Asus TUF FX705DT-AU068T (Dual-Channel) | |
| Asus TUF FX705DT-AU068T | |
| Asus TUF FX705GE-EW096T | |
| Dell G3 17 3779 | |
| Asus TUF FX705DY-AU072 | |
| 1920x1080 Fire Strike Graphics | |
| Average of class Gaming (12242 - 62849, n=120, last 2 years) | |
| Asus GL704GM-DH74 | |
| Lenovo Legion Y530-15ICH | |
| Asus TUF FX705DT-AU068T (Dual-Channel) | |
| Acer Aspire Nitro 5 AN515-54-53Z2 | |
| Asus TUF FX705DT-AU068T | |
| Acer Nitro 5 | |
| Average NVIDIA GeForce GTX 1650 Mobile (7741 - 9810, n=32) | |
| Lenovo Legion Y730-17ICH, i7-8750H | |
| Asus TUF FX705GE-EW096T | |
| Acer Predator Helios 300 PH317-52-51M6 | |
| MSI GF75 8RD-001 | |
| Asus TUF FX705DY-AU072 | |
| Dell G3 17 3779 | |
| 2560x1440 Time Spy Graphics | |
| Average of class Gaming (5012 - 26212, n=119, last 2 years) | |
| Asus TUF FX705DT-AU068T | |
| Asus TUF FX705DT-AU068T (Dual-Channel) | |
| Acer Nitro 5 | |
| Average NVIDIA GeForce GTX 1650 Mobile (2900 - 3700, n=31) | |
| Asus TUF FX705GE-EW096T | |
| Asus TUF FX705DY-AU072 | |
Gaming Performance
The hardware configuration of the Asus TUF is able to play all games in our database fluidly - generally full HD and middle-to-high quality settings can be selected, and in some cases this can also be raised a notch. For resolutions above full HD (for which an external monitor is required) the GPU is not suitable. Only games with very low hardware requirements are able to be played at these resolutions.
Through activation of dual-channel memory mode (by installing another RAM module) further performance gains are possible. An overall estimation of the possible performance gain cannot be made however, as the increase differs from game to game, which resolution is used and the quality settings. The comparison chart shows how much performance gain was realised in the games that we tested. For frequent gamers, investing in a second memory module definitely makes sense.
Our database indicates that the FX705DT produces significantly lower frame rates than the Acer Nitro 5 that is equipped with the same GPU. There are two reasons for this - firstly, the Nitro has two memory modules and runs in dual-channel mode and secondly, it has a stronger CPU. By activating dual-channel mode the gap between the two models narrows noticeably. The higher performance of the CPU in the Nitro 5 is most noticeable at lower resolutions and quality settings.
| low | med. | high | ultra | |
|---|---|---|---|---|
| StarCraft 2 (2010) | 267.9 | 125 | 123.7 | 102.2 |
| Diablo III (2012) | 139.5 | 123.7 | 122.9 | 103.3 |
| Counter-Strike: GO (2012) | 200.8 | 182.6 | 162.1 | 130 |
| BioShock Infinite (2013) | 184.2 | 160 | 149 | 77 |
| Middle-earth: Shadow of Mordor (2014) | 136 | 123.1 | 84.2 | 69.3 |
| GTA V (2015) | 99.1 | 93.6 | 67.7 | 38.2 |
| The Witcher 3 (2015) | 134.9 | 97.9 | 59.1 | 33.3 |
| Batman: Arkham Knight (2015) | 90 | 86 | 68 | 45 |
| Dota 2 Reborn (2015) | 75.8 | 69.1 | 63.3 | 58.5 |
| World of Warships (2015) | 124.7 | 105.9 | 84.6 | 84.2 |
| Ashes of the Singularity (2016) | 46.4 | 40.6 | 36.5 | |
| Civilization 6 (2016) | 111.4 | 83 | 59.4 | 53.7 |
| Team Fortress 2 (2017) | 92 | 85 | 77 | 75 |
| Destiny 2 (2017) | 85.4 | 75.1 | 72.7 | 62.4 |
| Final Fantasy XV Benchmark (2018) | 67 | 47.7 | 33.6 | |
| X-Plane 11.11 (2018) | 56.9 | 50.5 | 44.5 | |
| World of Tanks enCore (2018) | 256.5 | 131.6 | 69.5 | |
| Far Cry 5 (2018) | 64 | 48 | 49 | 44 |
| Forza Horizon 4 (2018) | 84 | 64 | 65 | 48 |
| Assassin´s Creed Odyssey (2018) | 45 | 38 | 35 | 22 |
| Darksiders III (2018) | 96.8 | 64.8 | 57.4 | 52.3 |
| Far Cry New Dawn (2019) | 59 | 47 | 44 | 40 |
| Metro Exodus (2019) | 67.7 | 40.5 | 30.4 | 24.9 |
| Dirt Rally 2.0 (2019) | 145.7 | 81.4 | 68.9 | 42.1 |
| The Division 2 (2019) | 81 | 54 | 46 | 35 |
| Anno 1800 (2019) | 49.2 | 45.2 | 38 | 21.7 |
| The Witcher 3 - 1920x1080 Ultra Graphics & Postprocessing (HBAO+) | |
| Average of class Gaming (95 - 240, n=8, last 2 years) | |
| MSI GF75 8RD-001 | |
| Asus TUF FX705GM | |
| Average NVIDIA GeForce GTX 1650 Mobile (29.9 - 40.3, n=31) | |
| Acer Nitro 5 | |
| Acer Aspire Nitro 5 AN515-54-53Z2 | |
| Asus TUF FX705DT-AU068T (Dual-Channel) | |
| Asus TUF FX705DT-AU068T | |
| Acer Predator Helios 300 PH317-52-51M6 | |
| Lenovo Legion Y730-17ICH, i7-8750H | |
| Asus TUF FX705GE-EW096T | |
| Asus TUF FX705DY-AU072 | |
| Dell G3 17 3779 | |
| BioShock Infinite - 1920x1080 Ultra Preset, DX11 (DDOF) | |
| Average NVIDIA GeForce GTX 1650 Mobile (68.5 - 99.4, n=18) | |
| Asus TUF FX705DT-AU068T (Dual-Channel) | |
| Asus TUF FX705DT-AU068T | |
| Lenovo Legion Y730-17ICH, i7-8750H | |
| Asus TUF FX705GE-EW096T | |
| Dell G3 17 3779 | |
| Asus TUF FX705DY-AU072 | |
| Far Cry 5 - 1920x1080 Ultra Preset AA:T | |
| Average of class Gaming (70 - 151, n=10, last 2 years) | |
| Asus TUF FX705DT-AU068T (Dual-Channel) | |
| Average NVIDIA GeForce GTX 1650 Mobile (44 - 57, n=9) | |
| Asus TUF FX705DT-AU068T | |
| Asus TUF FX705GE-EW096T | |
| Dell G3 17 3779 | |
| Asus TUF FX705DY-AU072 | |
| Dota 2 Reborn - 1920x1080 ultra (3/3) best looking | |
| Average of class Gaming (84.8 - 248, n=112, last 2 years) | |
| Average NVIDIA GeForce GTX 1650 Mobile (58.5 - 119, n=20) | |
| Asus TUF FX705DT-AU068T (Dual-Channel) | |
| Asus TUF FX705DY-AU072 | |
| Asus TUF FX705DT-AU068T | |
| Anno 1800 - 1920x1080 Medium Graphics Quality (DX11) | |
| Average of class Gaming (n=1last 2 years) | |
| Acer Nitro 5 | |
| Asus TUF FX705DT-AU068T (Dual-Channel) | |
| Average NVIDIA GeForce GTX 1650 Mobile (43.3 - 69.8, n=5) | |
| Asus TUF FX705DT-AU068T | |
| Assassin´s Creed Odyssey - 1920x1080 High Preset | |
| Acer Nitro 5 | |
| Asus TUF FX705GM | |
| Asus TUF FX705DT-AU068T (Dual-Channel) | |
| Average NVIDIA GeForce GTX 1650 Mobile (35 - 53, n=4) | |
| Asus TUF FX705GE-EW096T | |
| Asus TUF FX705DT-AU068T | |
| Far Cry New Dawn - 1920x1080 Ultra Preset | |
| Acer Nitro 5 | |
| Acer Aspire Nitro 5 AN515-54-53Z2 | |
| Average NVIDIA GeForce GTX 1650 Mobile (40 - 56, n=6) | |
| Asus TUF FX705DT-AU068T (Dual-Channel) | |
| MSI GF75 8RD-001 | |
| Asus TUF FX705DT-AU068T | |
| Asus TUF FX705DY-AU072 | |
In order to test whether or not the laptop is capable of keeping frame rates in games at a constant level, we run the game "The Witcher 3" for around 60 minutes in full HD and at maximum quality settings. During the entire test, the player character is not moved. We did not notice any drop in performance over this time.
Emissions - Moderate Heat Buildup Only
Noise Levels
At idle, the fans are often switched off and the laptop is silent unless the 2.5-inch HDD is in use. Under load the fans spin up and during our stress testing we measured a maximum volume level of 44.8 dB(A). Under moderate load, this value was measured at 38.6 dB(A). If 'Turbo' mode is selected in the Armory Crate Center software, the fans run at considerably higher speeds. For low noise levels, the 'Quiet' mode is recommended - however as this mode lowers CPU performance, it is only suitable for office application use.
Noise level
| Idle |
| 30.8 / 30.8 / 32.2 dB(A) |
| Load |
| 38.6 / 44.8 dB(A) |
 | ||
30 dB silent 40 dB(A) audible 50 dB(A) loud |
||
min: | ||
| Asus TUF FX705DT-AU068T R5 3550H, GeForce GTX 1650 Mobile | MSI GF75 8RD-001 i7-8750H, GeForce GTX 1050 Ti Max-Q | Lenovo Legion Y730-17ICH, i7-8750H i7-8750H, GeForce GTX 1050 Ti Mobile | Acer Predator Helios 300 PH317-52-51M6 i5-8300H, GeForce GTX 1050 Ti Mobile | Asus TUF FX705DY-AU072 R5 3550H, Radeon RX 560X (Laptop) | Asus TUF FX705GE-EW096T i7-8750H, GeForce GTX 1050 Ti Mobile | Asus TUF FX705GM i7-8750H, GeForce GTX 1060 Mobile | Acer Aspire Nitro 5 AN515-54-53Z2 i5-9300H, GeForce GTX 1650 Mobile | Dell G3 17 3779 i5-8300H, GeForce GTX 1050 Mobile | Average NVIDIA GeForce GTX 1650 Mobile | Average of class Gaming | |
|---|---|---|---|---|---|---|---|---|---|---|---|
| Noise | 2% | 7% | -4% | -3% | -4% | -12% | -4% | 0% | 3% | 4% | |
| off / environment * (dB) | 30.8 | 30.7 -0% | 28 9% | 29 6% | 30.7 -0% | 30.5 1% | 29 6% | 30 3% | 30.5 1% | 27.6 ? 10% | 24.1 ? 22% |
| Idle Minimum * (dB) | 30.8 | 32 -4% | 28 9% | 29 6% | 32.5 -6% | 31.2 -1% | 32 -4% | 30 3% | 30.5 1% | 28.1 ? 9% | 25.8 ? 16% |
| Idle Average * (dB) | 30.8 | 32 -4% | 28 9% | 31 -1% | 32.6 -6% | 32.4 -5% | 33 -7% | 31 -1% | 31.1 -1% | 28.8 ? 6% | 27.4 ? 11% |
| Idle Maximum * (dB) | 32.2 | 32.1 -0% | 31.3 3% | 33 -2% | 33.3 -3% | 32.8 -2% | 44 -37% | 33 -2% | 32.1 -0% | 31 ? 4% | 30 ? 7% |
| Load Average * (dB) | 38.6 | 33.6 13% | 33.4 13% | 45 -17% | 38.7 -0% | 43 -11% | 46 -19% | 46 -19% | 43.4 -12% | 41.7 ? -8% | 43.2 ? -12% |
| Load Maximum * (dB) | 44.8 | 40.6 9% | 46.2 -3% | 51 -14% | 45 -0% | 48.1 -7% | 50 -12% | 49 -9% | 39.2 12% | 46.4 ? -4% | 54 ? -21% |
| Witcher 3 ultra * (dB) | 42.8 | 45 | 48 | 46 |
* ... smaller is better
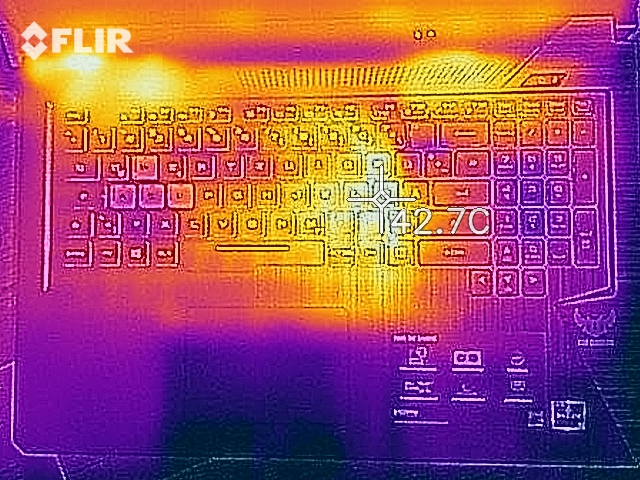
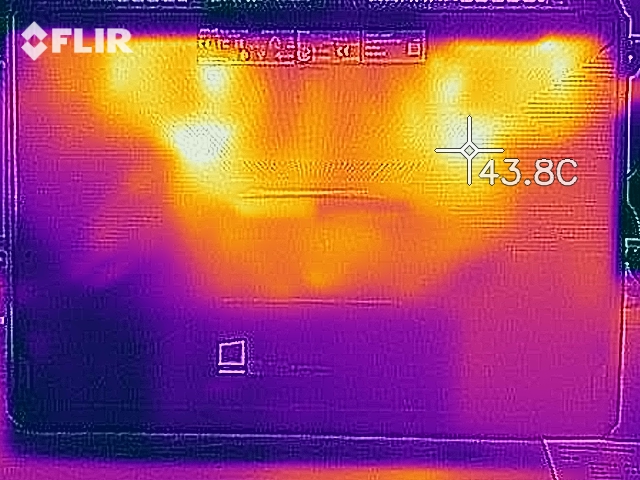
Temperatures
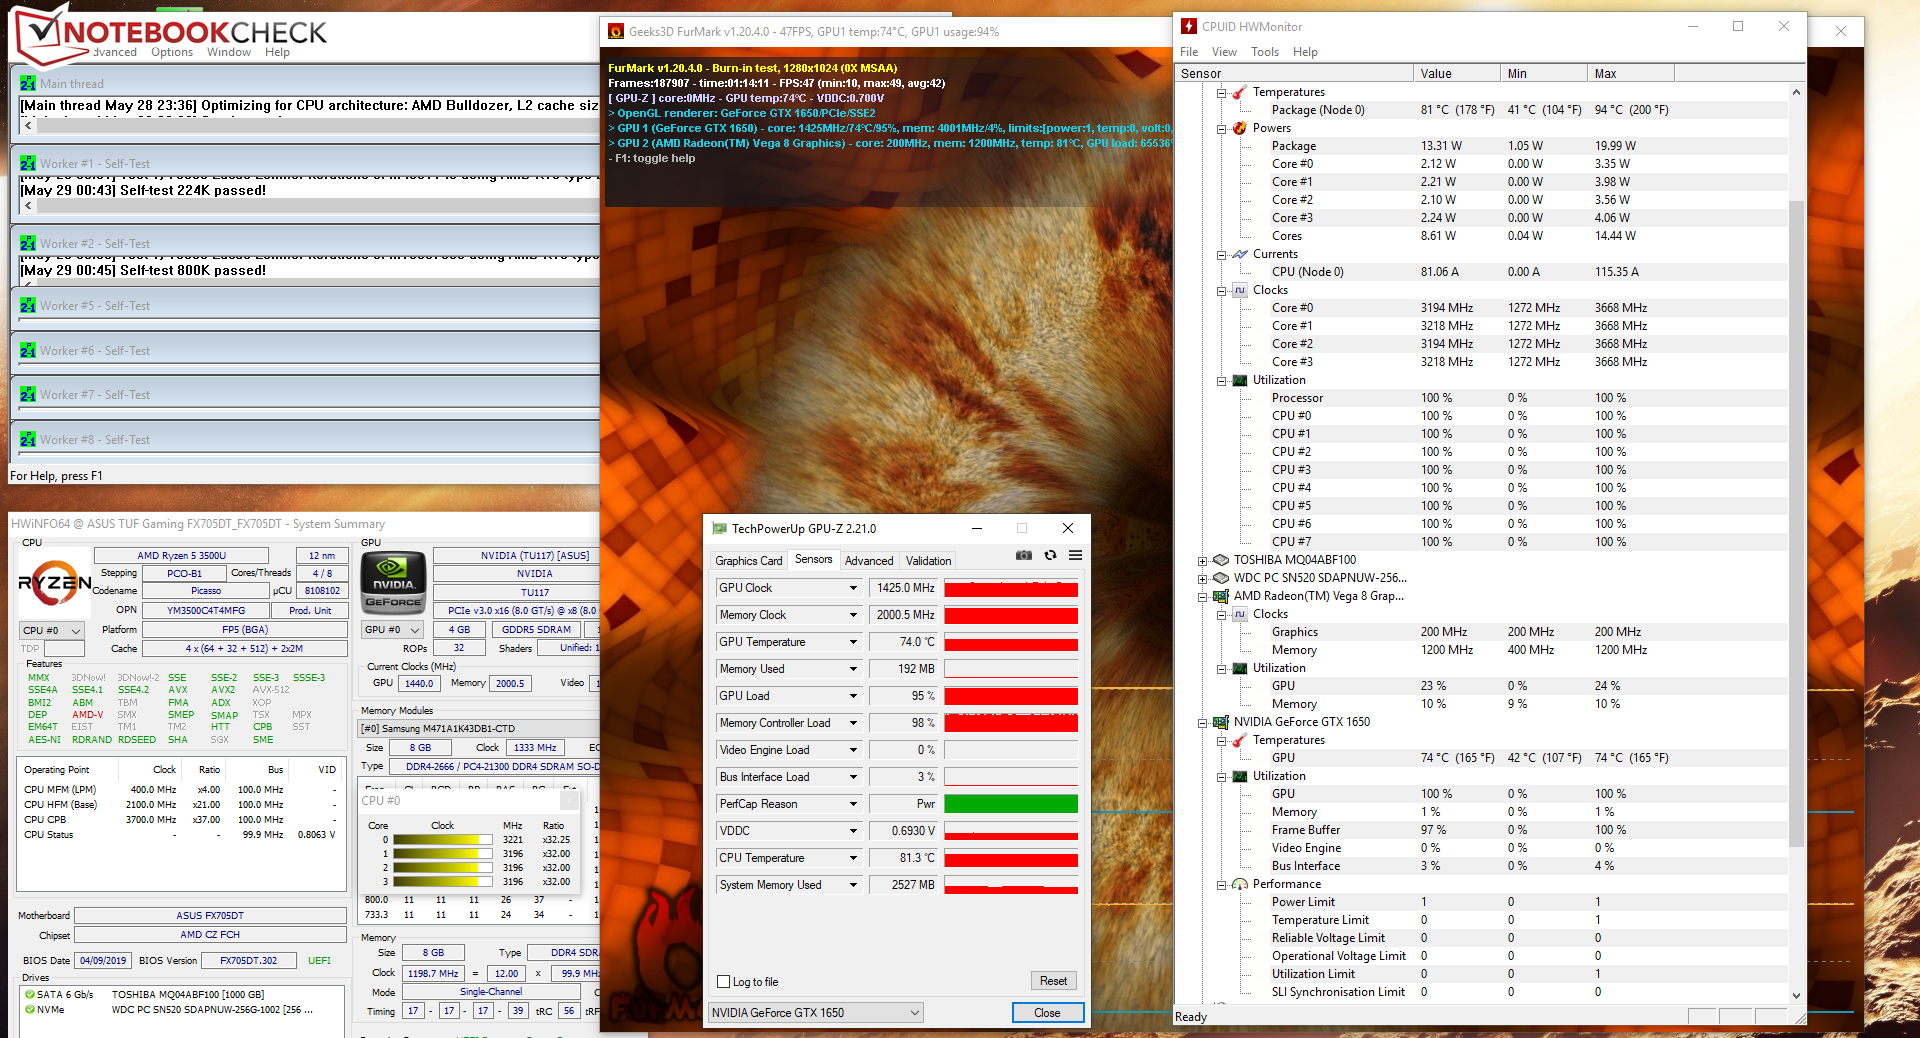
Our stress test (Prime95 and FurMark are run for at least one hour) produced mixed results for the FX705DT in both mains and battery power modes. On mains power, the CPU was able to run for a short time at 3.5 to 3.6 GHz, then sank to between 3 and 3.2 GHz and remained at this level. Using battery power, the CPU ran at between 2.1 and 2.8 GHz. The CPU ran constantly at around 1,500 MHz (typically from 1,450 to 1,600 MHz). However, the stress test is an extreme use case example and not a picture of normal use - we only run this test to demonstrate whether or not the laptop is able to remain stable under maximum load.
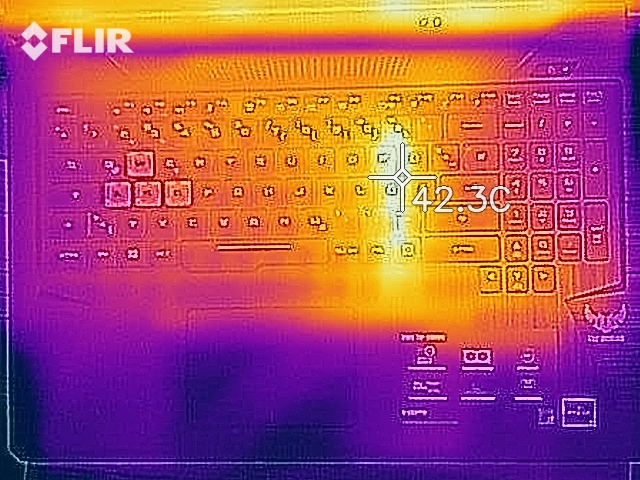
Despite having performance-oriented hardware, the laptop only heats up moderately. During our stress testing the highest recorded temperature was slightly above 40 degrees Celsius (~104 degrees Fahrenheit), and only at one physical area of the device. During general use, temperatures are absolutely fine.
(±) The maximum temperature on the upper side is 41.6 °C / 107 F, compared to the average of 40.4 °C / 105 F, ranging from 21.2 to 68.8 °C for the class Gaming.
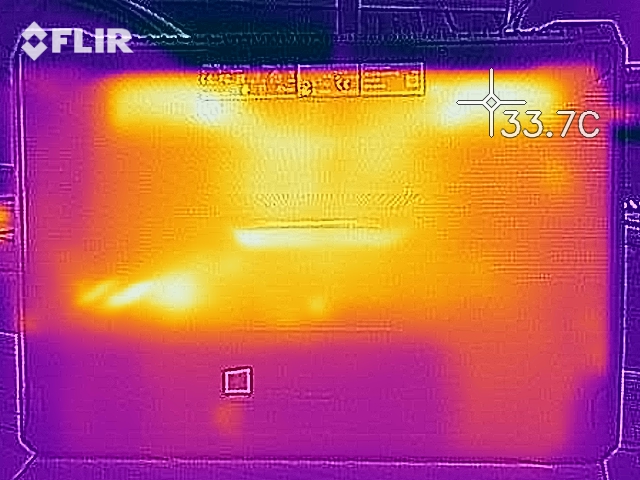
(+) The bottom heats up to a maximum of 38 °C / 100 F, compared to the average of 43.2 °C / 110 F
(+) In idle usage, the average temperature for the upper side is 27.2 °C / 81 F, compared to the device average of 33.9 °C / 93 F.
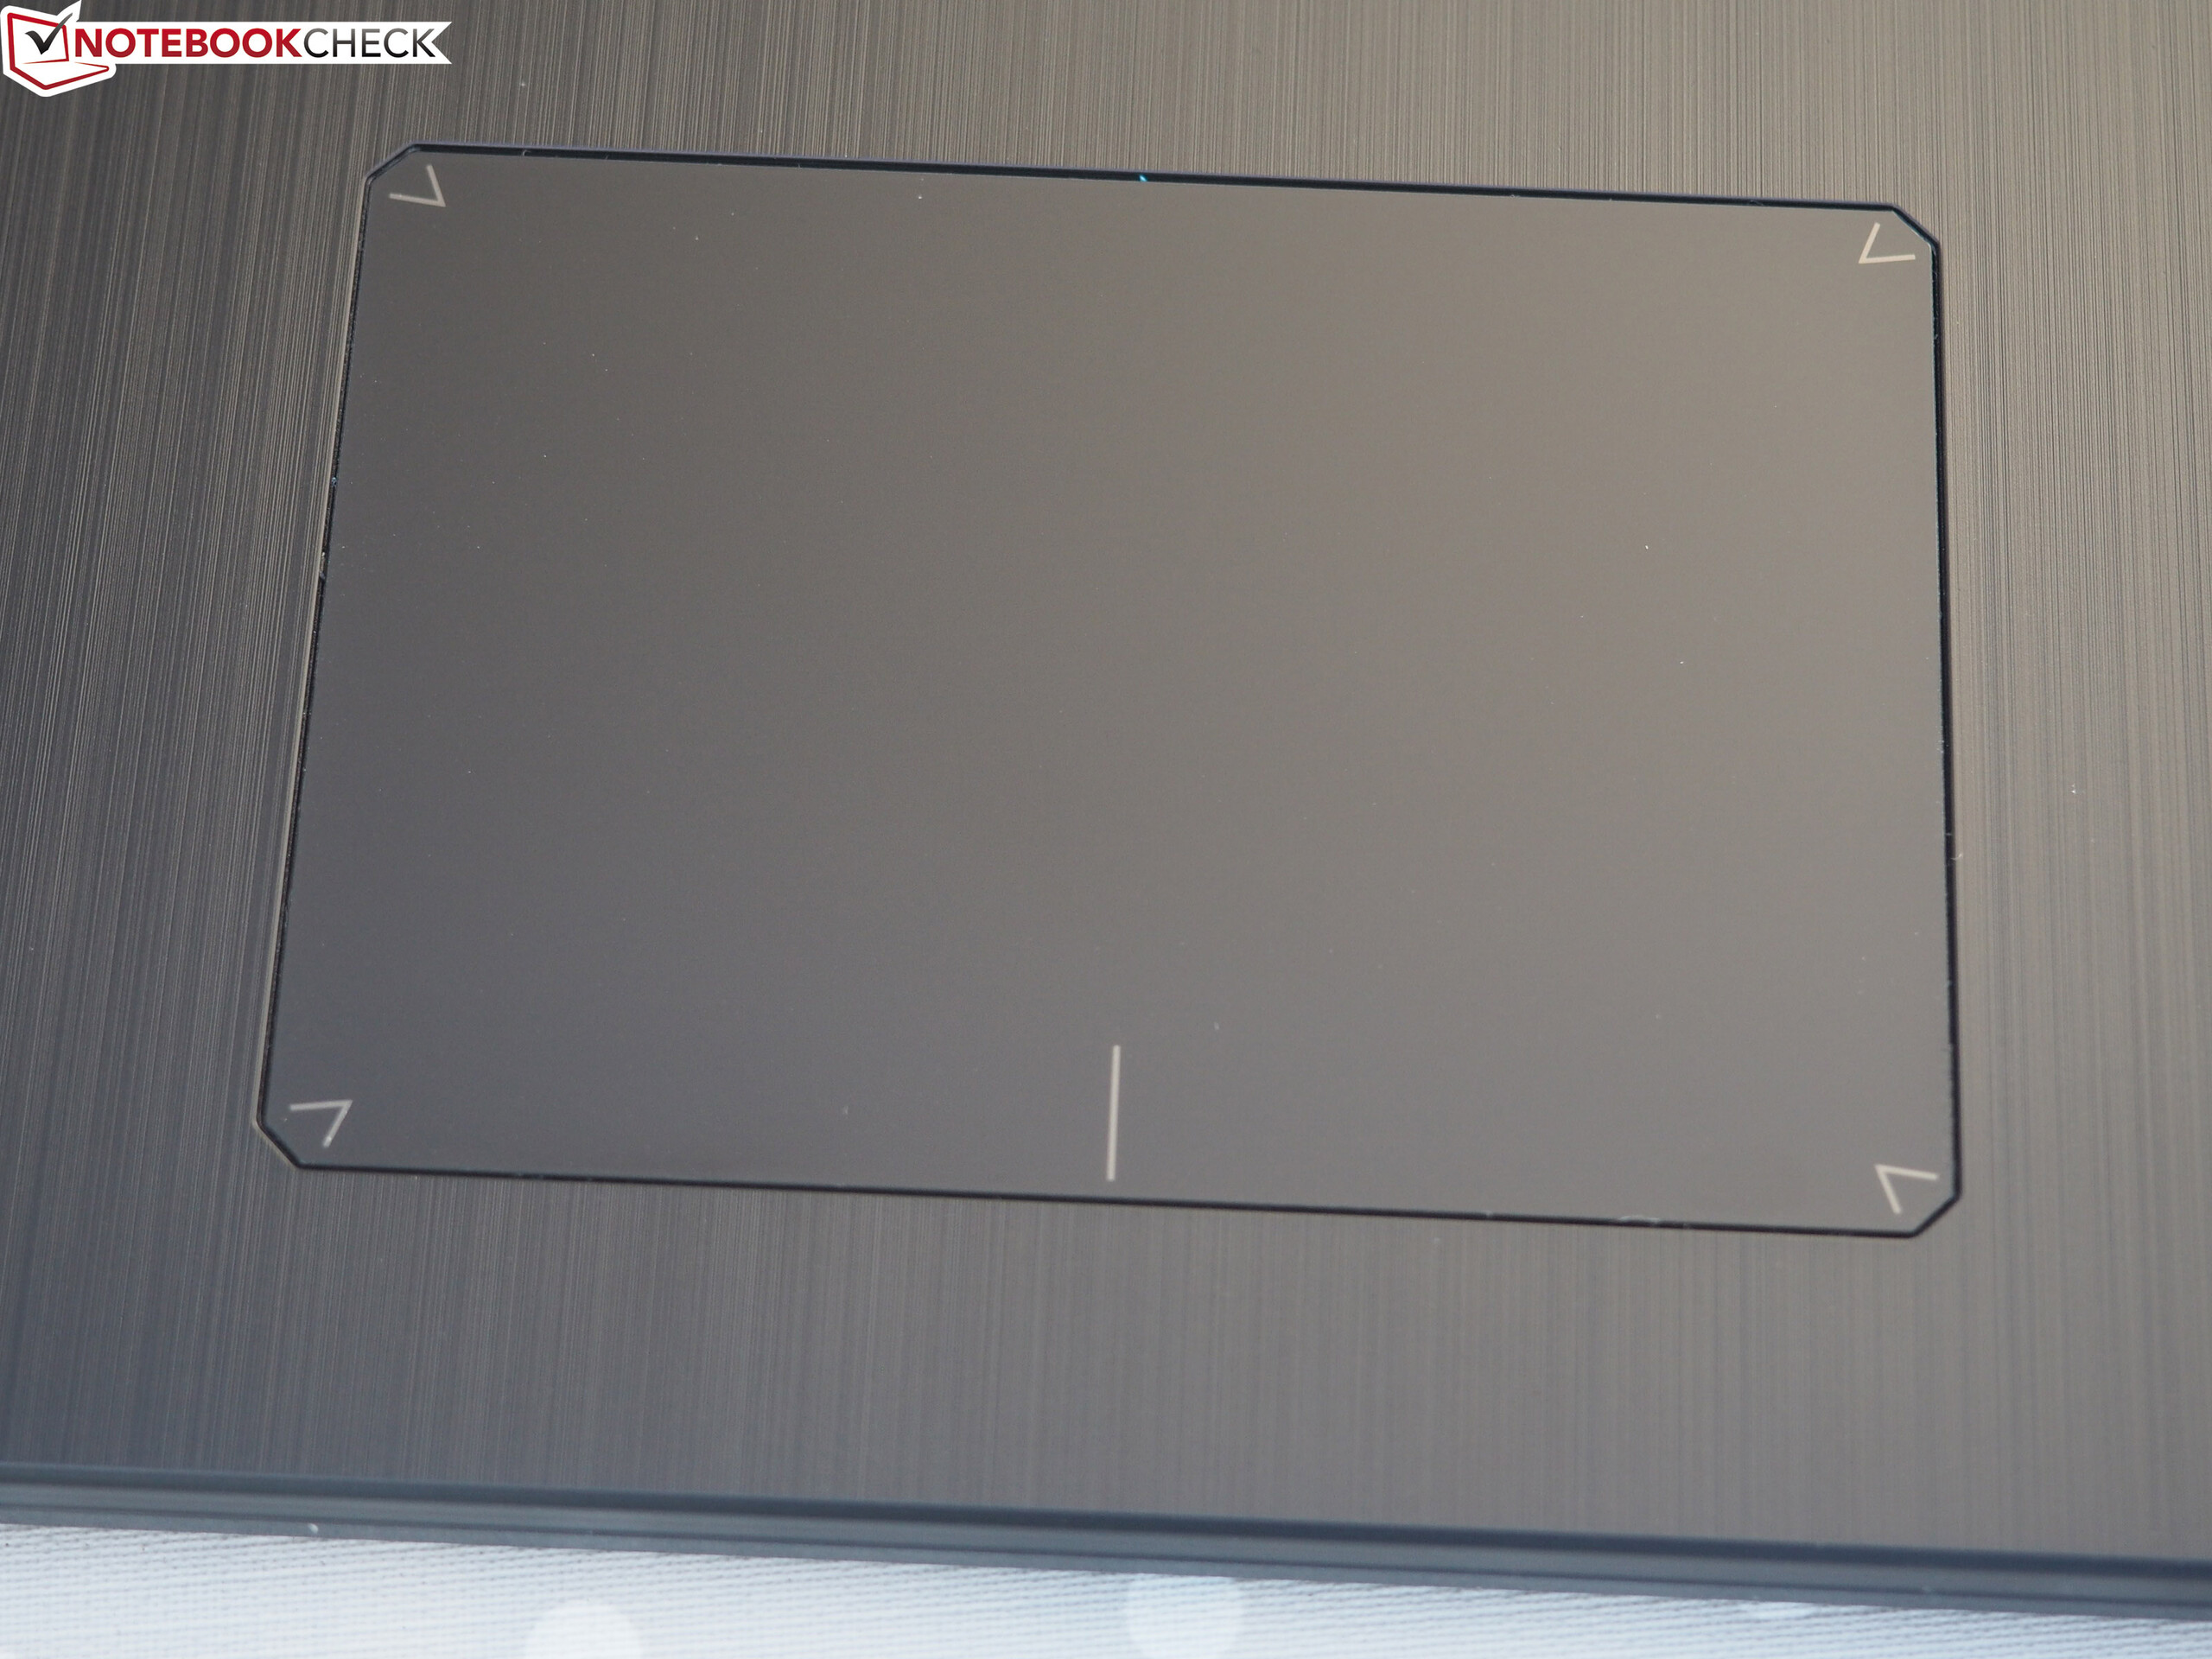
(+) The palmrests and touchpad are cooler than skin temperature with a maximum of 24.4 °C / 75.9 F and are therefore cool to the touch.
(+) The average temperature of the palmrest area of similar devices was 28.8 °C / 83.8 F (+4.4 °C / 7.9 F).
| Asus TUF FX705DT-AU068T R5 3550H, GeForce GTX 1650 Mobile | MSI GF75 8RD-001 i7-8750H, GeForce GTX 1050 Ti Max-Q | Lenovo Legion Y730-17ICH, i7-8750H i7-8750H, GeForce GTX 1050 Ti Mobile | Acer Predator Helios 300 PH317-52-51M6 i5-8300H, GeForce GTX 1050 Ti Mobile | Asus TUF FX705DY-AU072 R5 3550H, Radeon RX 560X (Laptop) | Asus TUF FX705GE-EW096T i7-8750H, GeForce GTX 1050 Ti Mobile | Asus TUF FX705GM i7-8750H, GeForce GTX 1060 Mobile | Acer Aspire Nitro 5 AN515-54-53Z2 i5-9300H, GeForce GTX 1650 Mobile | Dell G3 17 3779 i5-8300H, GeForce GTX 1050 Mobile | Average NVIDIA GeForce GTX 1650 Mobile | Average of class Gaming | |
|---|---|---|---|---|---|---|---|---|---|---|---|
| Heat | 7% | -14% | -16% | 8% | -8% | -17% | -2% | -23% | -7% | -13% | |
| Maximum Upper Side * (°C) | 41.6 | 44.2 -6% | 42 -1% | 50 -20% | 41.5 -0% | 53.3 -28% | 54 -30% | 47 -13% | 53 -27% | 46 ? -11% | 45.3 ? -9% |
| Maximum Bottom * (°C) | 38 | 39.1 -3% | 51.2 -35% | 52 -37% | 39.6 -4% | 44.7 -18% | 53 -39% | 50 -32% | 60.5 -59% | 49.2 ? -29% | 48.2 ? -27% |
| Idle Upper Side * (°C) | 31.7 | 24.5 23% | 31.8 -0% | 33 -4% | 25.7 19% | 29.5 7% | 30 5% | 24 24% | 30.3 4% | 28.3 ? 11% | 31.2 ? 2% |
| Idle Bottom * (°C) | 29.5 | 25.5 14% | 35.4 -20% | 30 -2% | 24.2 18% | 27 8% | 30 -2% | 25 15% | 32 -8% | 28.9 ? 2% | 34.4 ? -17% |
* ... smaller is better
Speakers
Asus TUF FX705DT-AU068T audio analysis
(-) | not very loud speakers (65.9 dB)
Bass 100 - 315 Hz
(-) | nearly no bass - on average 18.9% lower than median
(±) | linearity of bass is average (12.2% delta to prev. frequency)
Mids 400 - 2000 Hz
(+) | balanced mids - only 4.2% away from median
(±) | linearity of mids is average (10.7% delta to prev. frequency)
Highs 2 - 16 kHz
(±) | higher highs - on average 7.3% higher than median
(±) | linearity of highs is average (7.1% delta to prev. frequency)
Overall 100 - 16.000 Hz
(±) | linearity of overall sound is average (28.9% difference to median)
Compared to same class
» 94% of all tested devices in this class were better, 2% similar, 4% worse
» The best had a delta of 6%, average was 18%, worst was 132%
Compared to all devices tested
» 87% of all tested devices were better, 2% similar, 11% worse
» The best had a delta of 4%, average was 24%, worst was 134%
Lenovo Legion Y730-17ICH, i7-8750H audio analysis
(-) | not very loud speakers (69.1 dB)
Bass 100 - 315 Hz
(±) | reduced bass - on average 5.7% lower than median
(±) | linearity of bass is average (12.8% delta to prev. frequency)
Mids 400 - 2000 Hz
(+) | balanced mids - only 3.3% away from median
(+) | mids are linear (5.3% delta to prev. frequency)
Highs 2 - 16 kHz
(+) | balanced highs - only 1.2% away from median
(+) | highs are linear (4.5% delta to prev. frequency)
Overall 100 - 16.000 Hz
(+) | overall sound is linear (13.8% difference to median)
Compared to same class
» 21% of all tested devices in this class were better, 7% similar, 72% worse
» The best had a delta of 6%, average was 18%, worst was 132%
Compared to all devices tested
» 15% of all tested devices were better, 4% similar, 81% worse
» The best had a delta of 4%, average was 24%, worst was 134%
Power Management - Efficient and Long-Lasting
Energy Consumption
The FX705DT surprises with comparatively low power consumption under load. A look at the comparison table shows that during the stress test the FX705DT consumed a good 40-50 watts less power than GTX 1050 Ti laptops. Under moderate load the advantage is still between 20 and 30 watts.
A large part of this energy saving is due to the GTX 1650. Despite having higher performance compared to the GeForce GTX 1050 Ti GPU, it consumes significantly less power. Adding to this, the APU also seems to be less power-hungry. According to HW Monitor, it does not step outside of its specifications and generally consumes 20 watts or less. By way of comparison, the Core i5 9300H in the Acer Nitro 5 can consume up to 25 watts more.
| Off / Standby | |
| Idle | |
| Load |
|
Key:
min: | |
| Asus TUF FX705DT-AU068T R5 3550H, GeForce GTX 1650 Mobile | MSI GF75 8RD-001 i7-8750H, GeForce GTX 1050 Ti Max-Q | Lenovo Legion Y730-17ICH, i7-8750H i7-8750H, GeForce GTX 1050 Ti Mobile | Acer Predator Helios 300 PH317-52-51M6 i5-8300H, GeForce GTX 1050 Ti Mobile | Asus TUF FX705DY-AU072 R5 3550H, Radeon RX 560X (Laptop) | Asus TUF FX705GE-EW096T i7-8750H, GeForce GTX 1050 Ti Mobile | Asus TUF FX705GM i7-8750H, GeForce GTX 1060 Mobile | Acer Aspire Nitro 5 AN515-54-53Z2 i5-9300H, GeForce GTX 1650 Mobile | Dell G3 17 3779 i5-8300H, GeForce GTX 1050 Mobile | Average NVIDIA GeForce GTX 1650 Mobile | Average of class Gaming | |
|---|---|---|---|---|---|---|---|---|---|---|---|
| Power Consumption | -42% | -37% | -37% | -28% | -21% | -122% | -21% | -53% | -28% | -149% | |
| Idle Minimum * (Watt) | 3.9 | 6.5 -67% | 6.3 -62% | 6 -54% | 5.5 -41% | 3.8 3% | 13 -233% | 5 -28% | 7.7 -97% | 4.96 ? -27% | 13.4 ? -244% |
| Idle Average * (Watt) | 9.6 | 11.9 -24% | 11 -15% | 9 6% | 10.9 -14% | 9 6% | 17 -77% | 7 27% | 14 -46% | 8.61 ? 10% | 19.1 ? -99% |
| Idle Maximum * (Watt) | 12.2 | 13.1 -7% | 11.5 6% | 13 -7% | 12.2 -0% | 11.2 8% | 24 -97% | 11 10% | 15.5 -27% | 14.8 ? -21% | 24.7 ? -102% |
| Load Average * (Watt) | 59 | 86 -46% | 89.8 -52% | 95 -61% | 77 -31% | 101 -71% | 106 -80% | 89 -51% | 95 -61% | 81.7 ? -38% | 108.4 ? -84% |
| Load Maximum * (Watt) | 80 | 131 -64% | 130.7 -63% | 134 -68% | 123 -54% | 119.7 -50% | 179 -124% | 132 -65% | 106 -33% | 131.9 ? -65% | 254 ? -218% |
| Witcher 3 ultra * (Watt) | 102 | 102 | 151 | 90 |
* ... smaller is better
Battery Life
In our real-life WLAN test, the Asus laptop achieved a result of 7h 49m. In this test we use a script to simulate load by opening websites. The power profile 'Balanced' is selected, energy saving options are deactivated and the display is set to a brightness level of around 150 cd/m².
The 17.3-incher gave up on our video test after 8h 05m. This test consists of looped playback of the short film Big Buck Bunny (H.264 encoding, 1,920 x 1,080 resolution). The 'Energy Saving' power profile is selected and WLAN module as well as energy saving options are deactivated. Display brightness is set to around 150 cd/m²
| Asus TUF FX705DT-AU068T R5 3550H, GeForce GTX 1650 Mobile, 64 Wh | Asus TUF FX705DY-AU072 R5 3550H, Radeon RX 560X (Laptop), 64 Wh | Asus TUF FX705GE-EW096T i7-8750H, GeForce GTX 1050 Ti Mobile, 64 Wh | Asus TUF FX705GM i7-8750H, GeForce GTX 1060 Mobile, 64 Wh | MSI GF75 8RD-001 i7-8750H, GeForce GTX 1050 Ti Max-Q, 51 Wh | Lenovo Legion Y730-17ICH, i7-8750H i7-8750H, GeForce GTX 1050 Ti Mobile, 76 Wh | Acer Predator Helios 300 PH317-52-51M6 i5-8300H, GeForce GTX 1050 Ti Mobile, 48 Wh | Dell G3 17 3779 i5-8300H, GeForce GTX 1050 Mobile, 56 Wh | Average of class Gaming | |
|---|---|---|---|---|---|---|---|---|---|
| Battery runtime | -9% | 10% | -42% | -50% | -25% | -19% | -18% | -19% | |
| Reader / Idle (h) | 13.6 | 12.6 -7% | 6.3 -54% | 6.3 -54% | 13.2 -3% | 11.8 -13% | 12.2 -10% | 8.71 ? -36% | |
| H.264 (h) | 8.1 | 6.7 -17% | 4.3 -47% | 3.4 -58% | 5.3 -35% | 8.26 ? 2% | |||
| WiFi v1.3 (h) | 7.8 | 7.2 -8% | 8.6 10% | 4.5 -42% | 4.7 -40% | 6.7 -14% | 5.9 -24% | 5.8 -26% | 6.94 ? -11% |
| Load (h) | 2.1 | 2 -5% | 1.6 -24% | 1.1 -48% | 0.9 -57% | 1.7 -19% | 2.1 0% | 1.47 ? -30% |
Pros
Cons
Verdict
The hardware configuration of the Asus TUF Gaming FX705DT is something you do not see every day - the pairing of an AMD Ryzen 5 3550H APU and an Nvidia GeForce GTX 1650 GPU. Put together, they are able to competently manage all current and modern games using the display's full HD resolution with middle to high quality settings, with some games able to use top quality settings. In order to fully maximise the hardware potential, it is recommended that a second RAM module be installed.
The CPU-GPU combination proves to also have an exceptional energy efficiency - comparable laptops under load consume considerably more power. In the Armory Create ControL Center there are also options available such as 'Quiet Mode' which reduces the fan speed and noise, and is possible due to a reduction in CPU clocks. For office and internet usage the performance is more than sufficient.
The Asus TUF Gaming FX705DT proves to be a well-rounded gaming laptop with no glaring weak points - only the meagre selection of ports counts against it.
An NVMe SSD pulls duty for a fluid and snappy system and the storage requirements of a gaming system are fulfilled by a 1 TB 2.5-inch HDD. Both drives can, if required, be swapped out, which requires opening up the chassis.
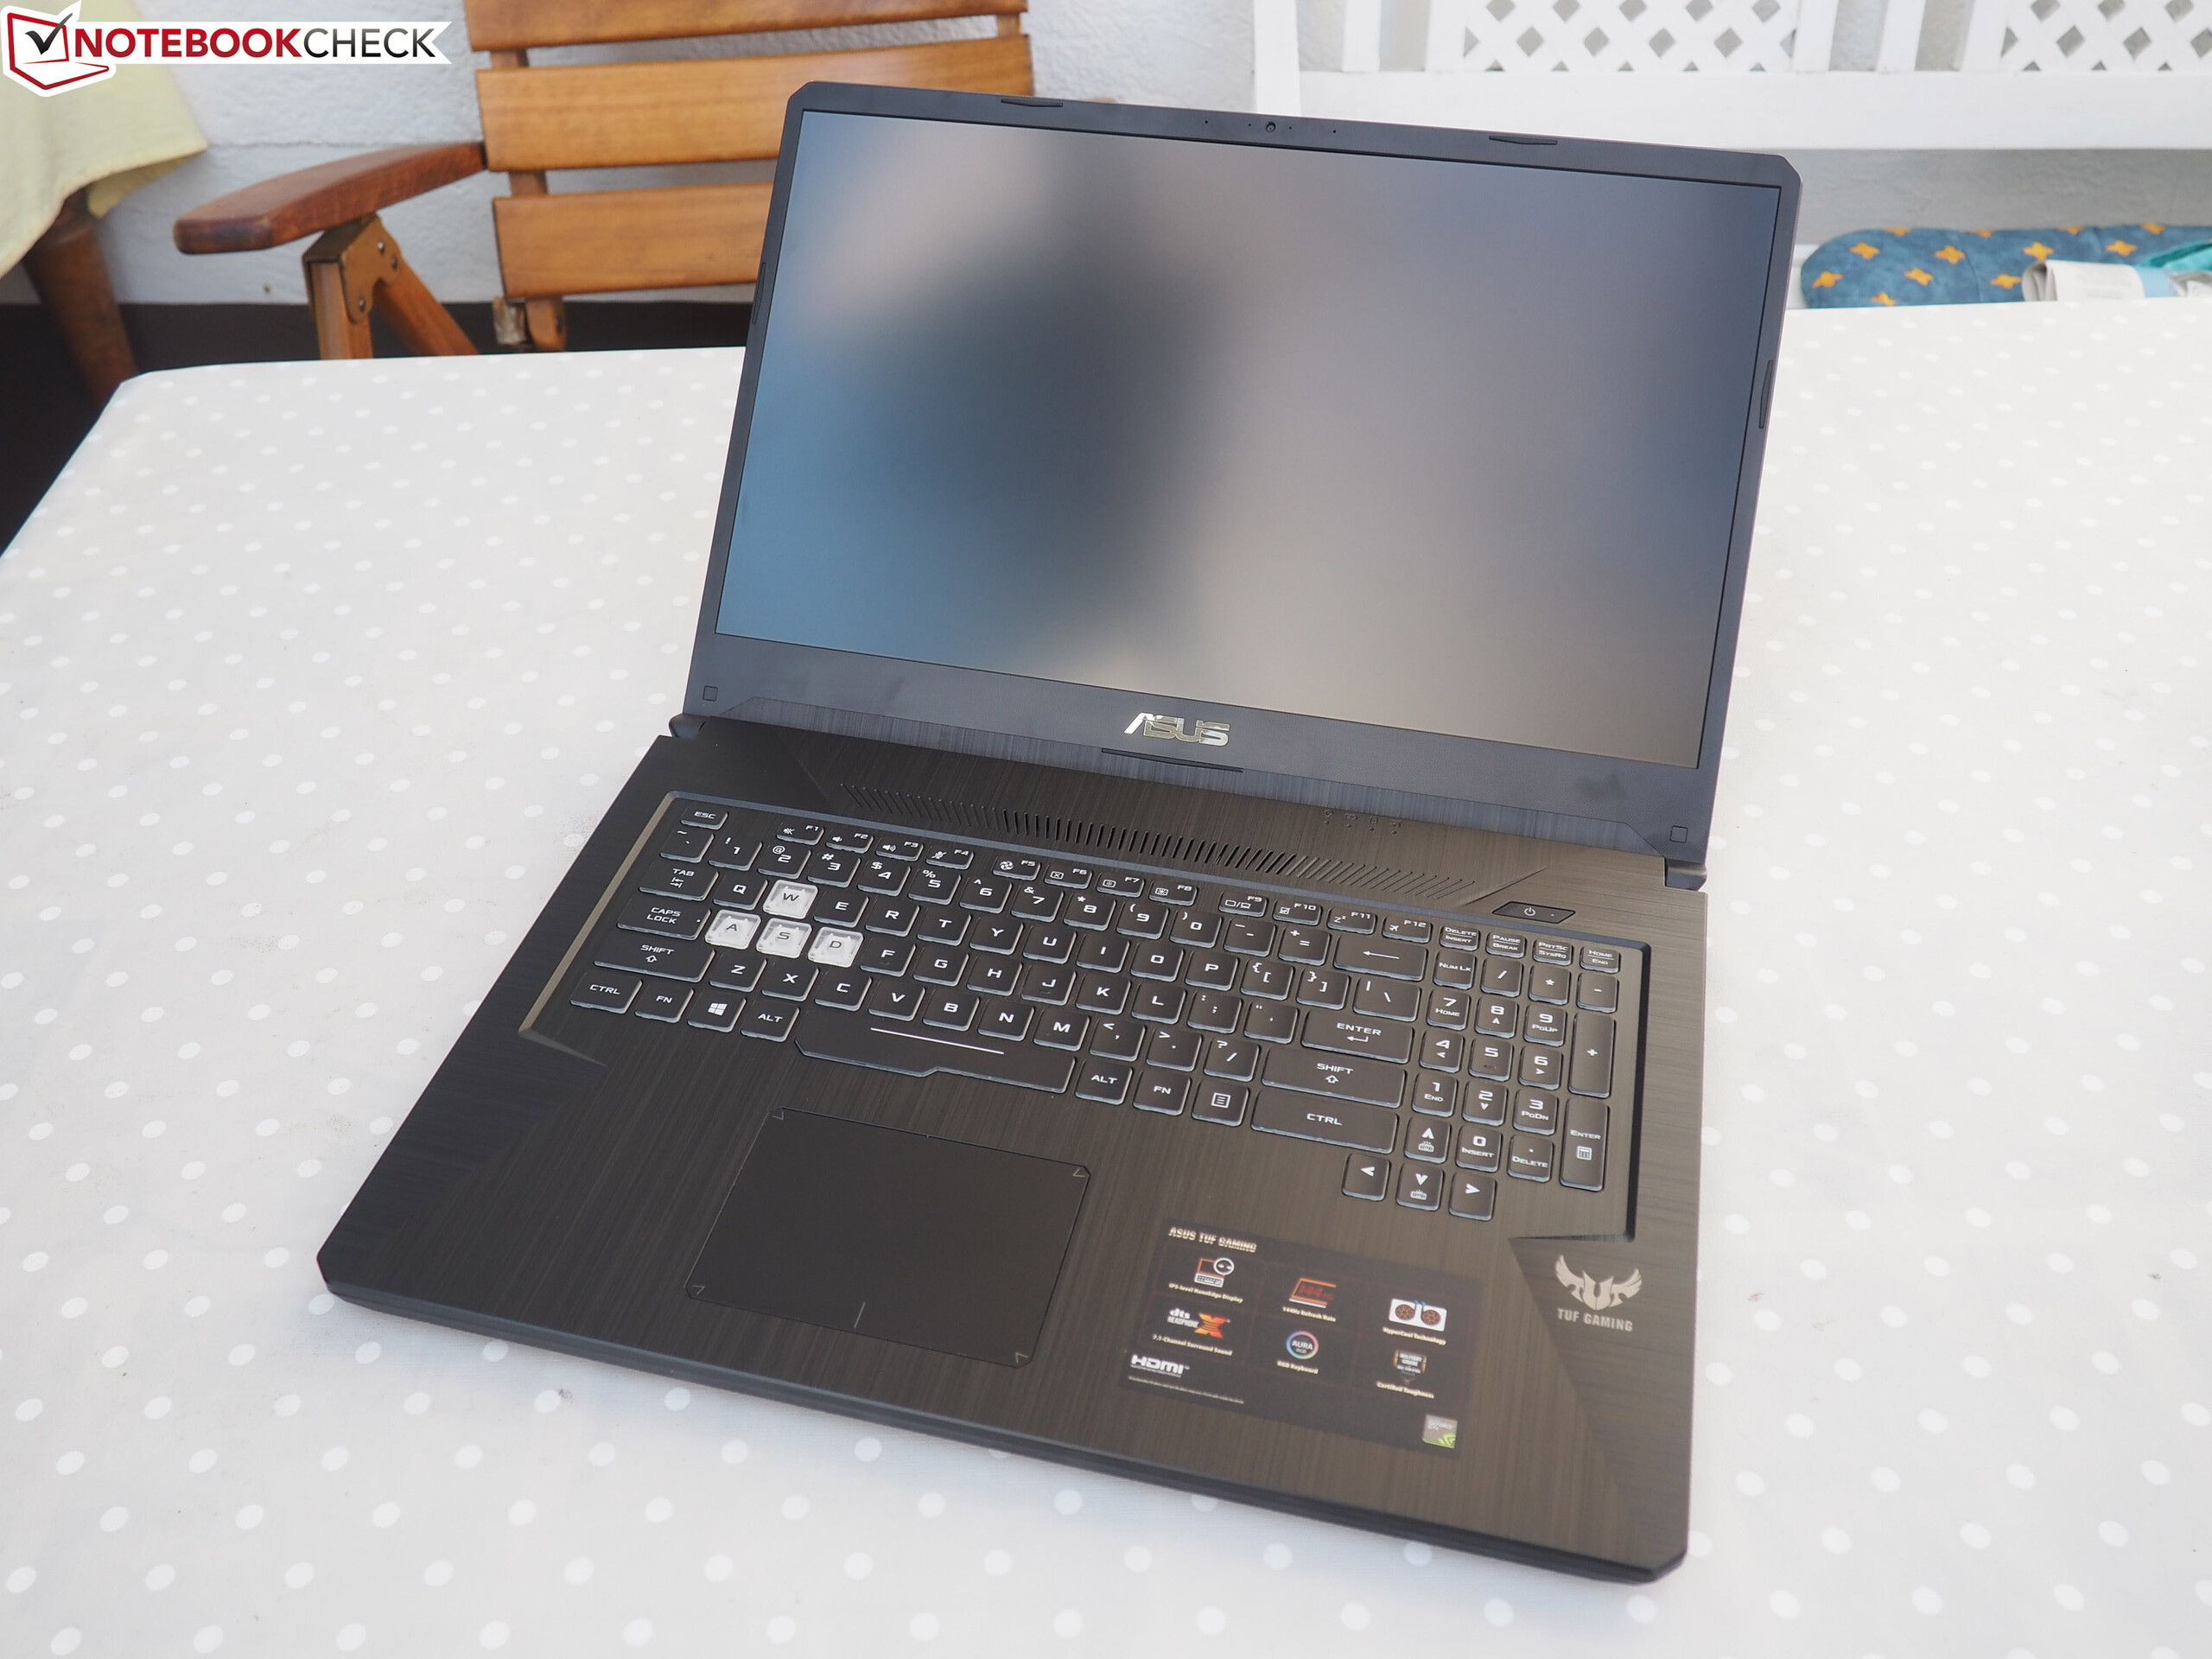
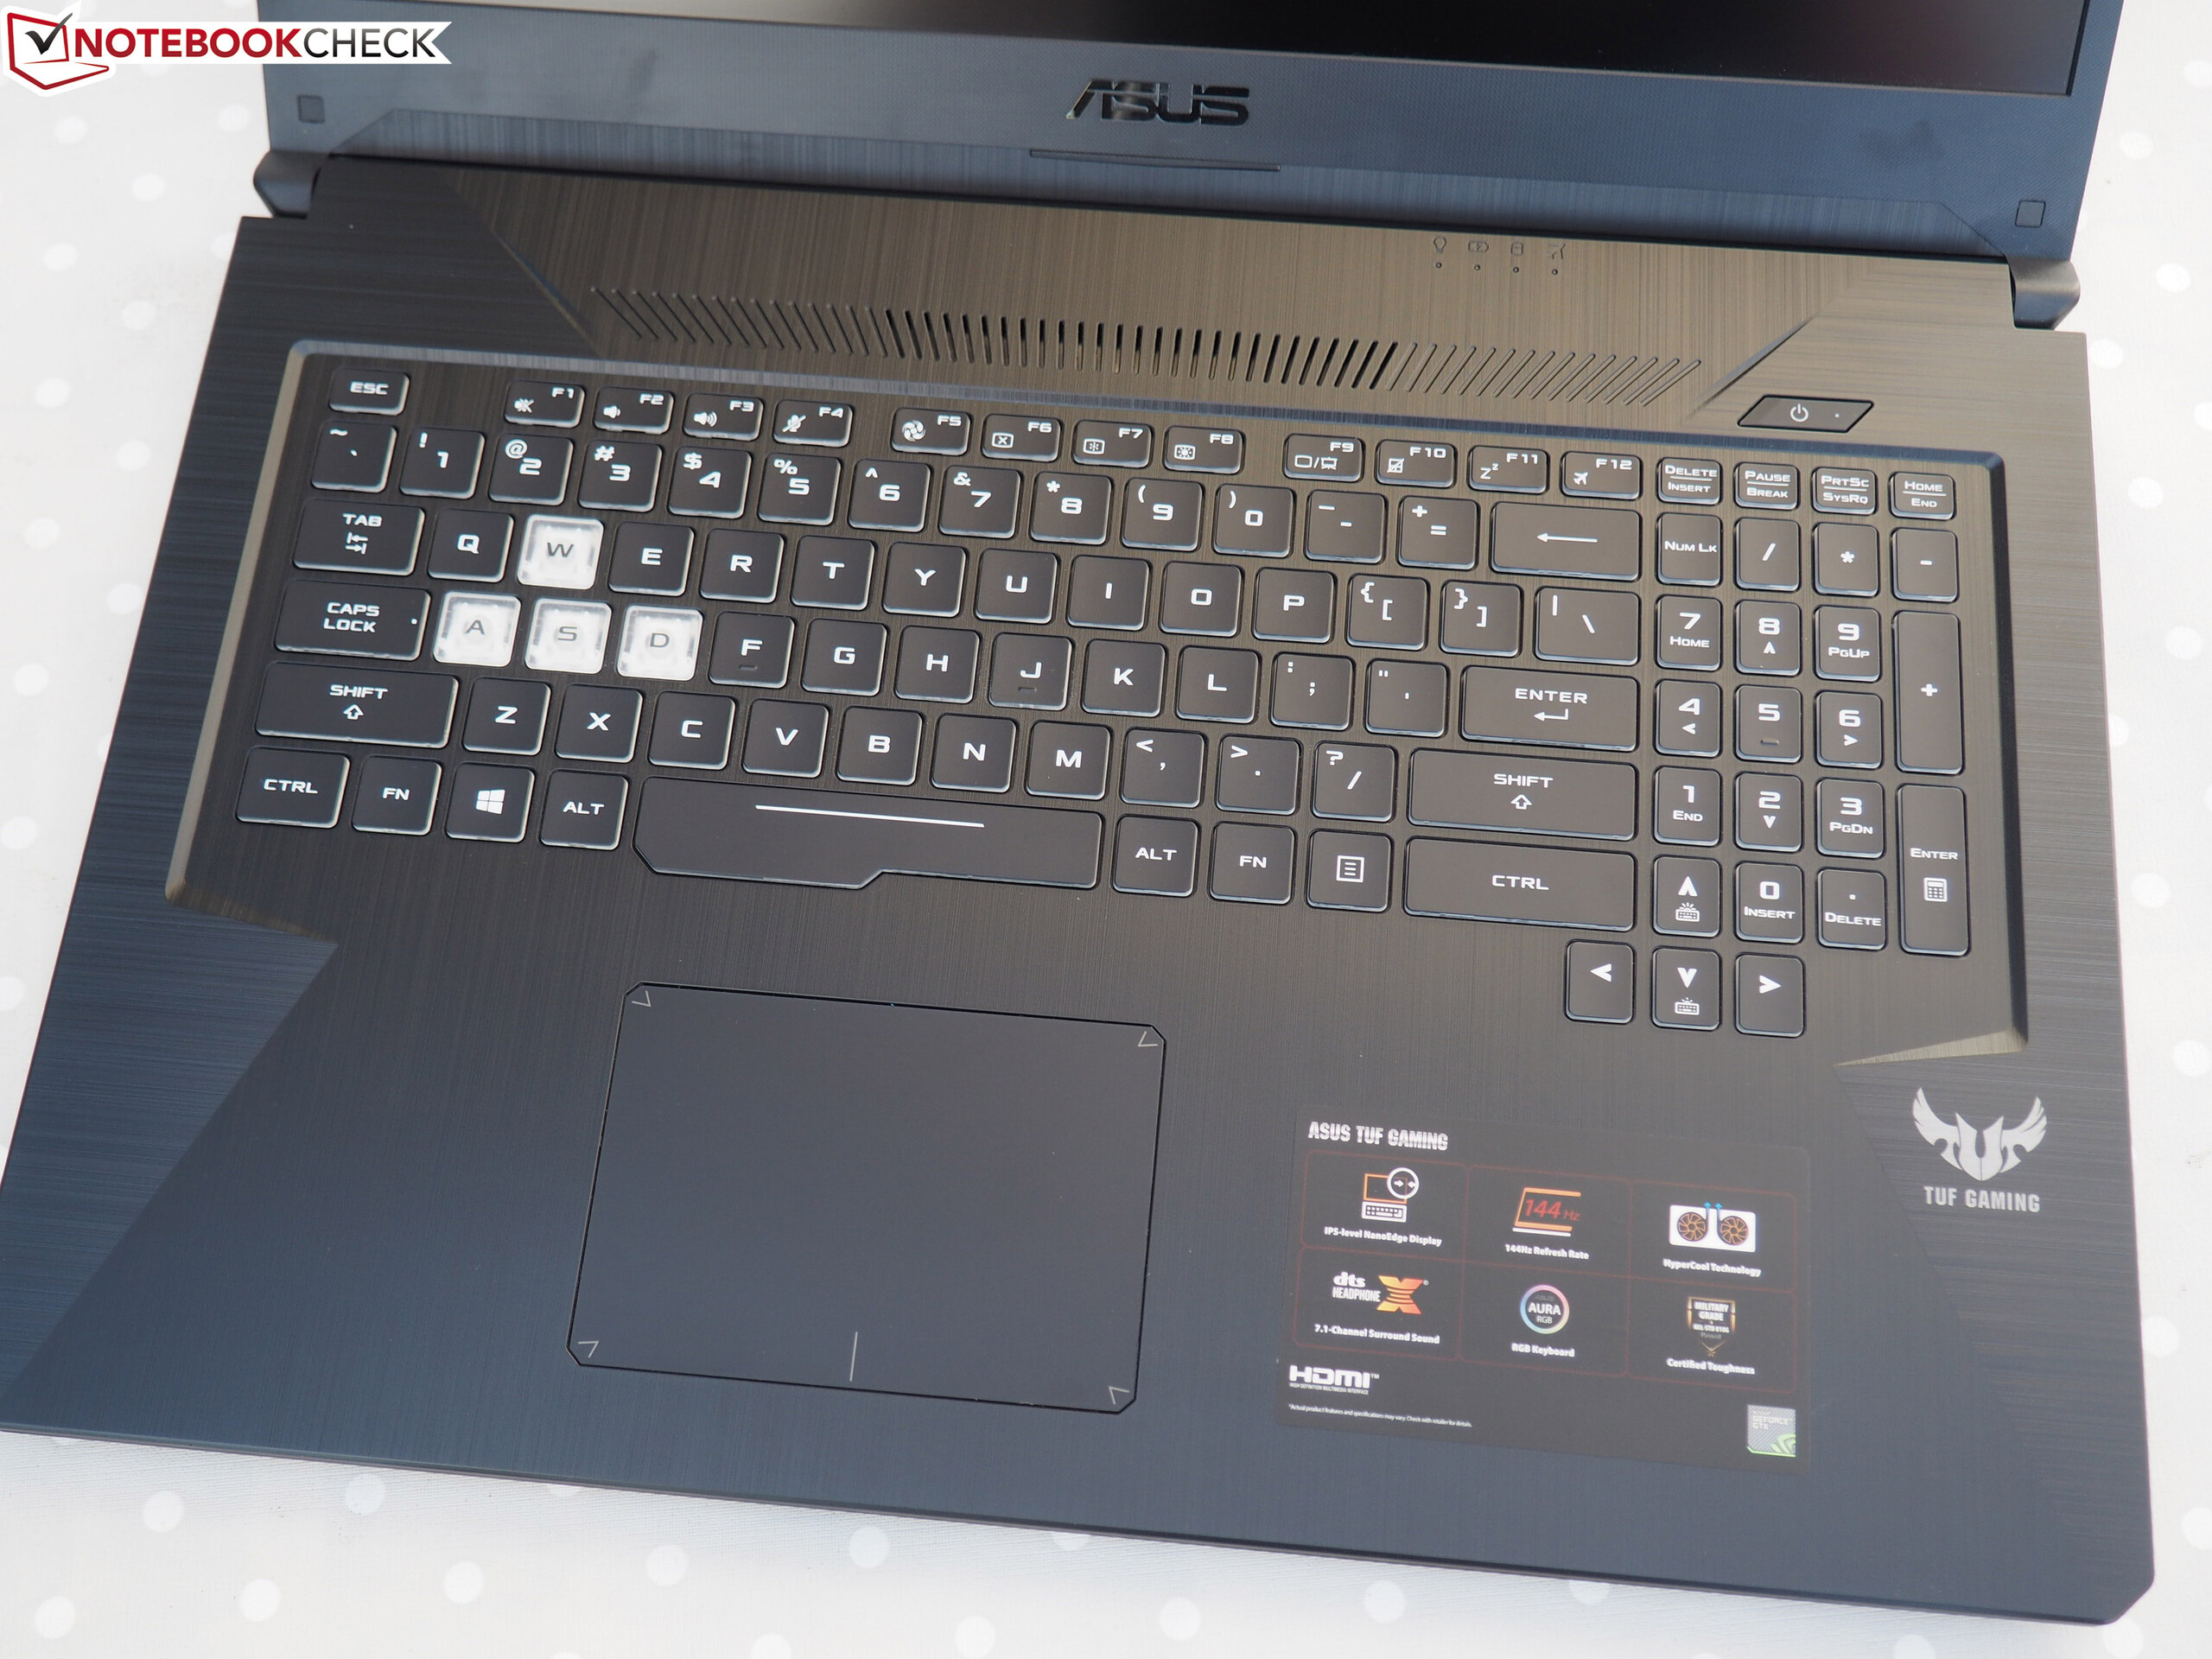
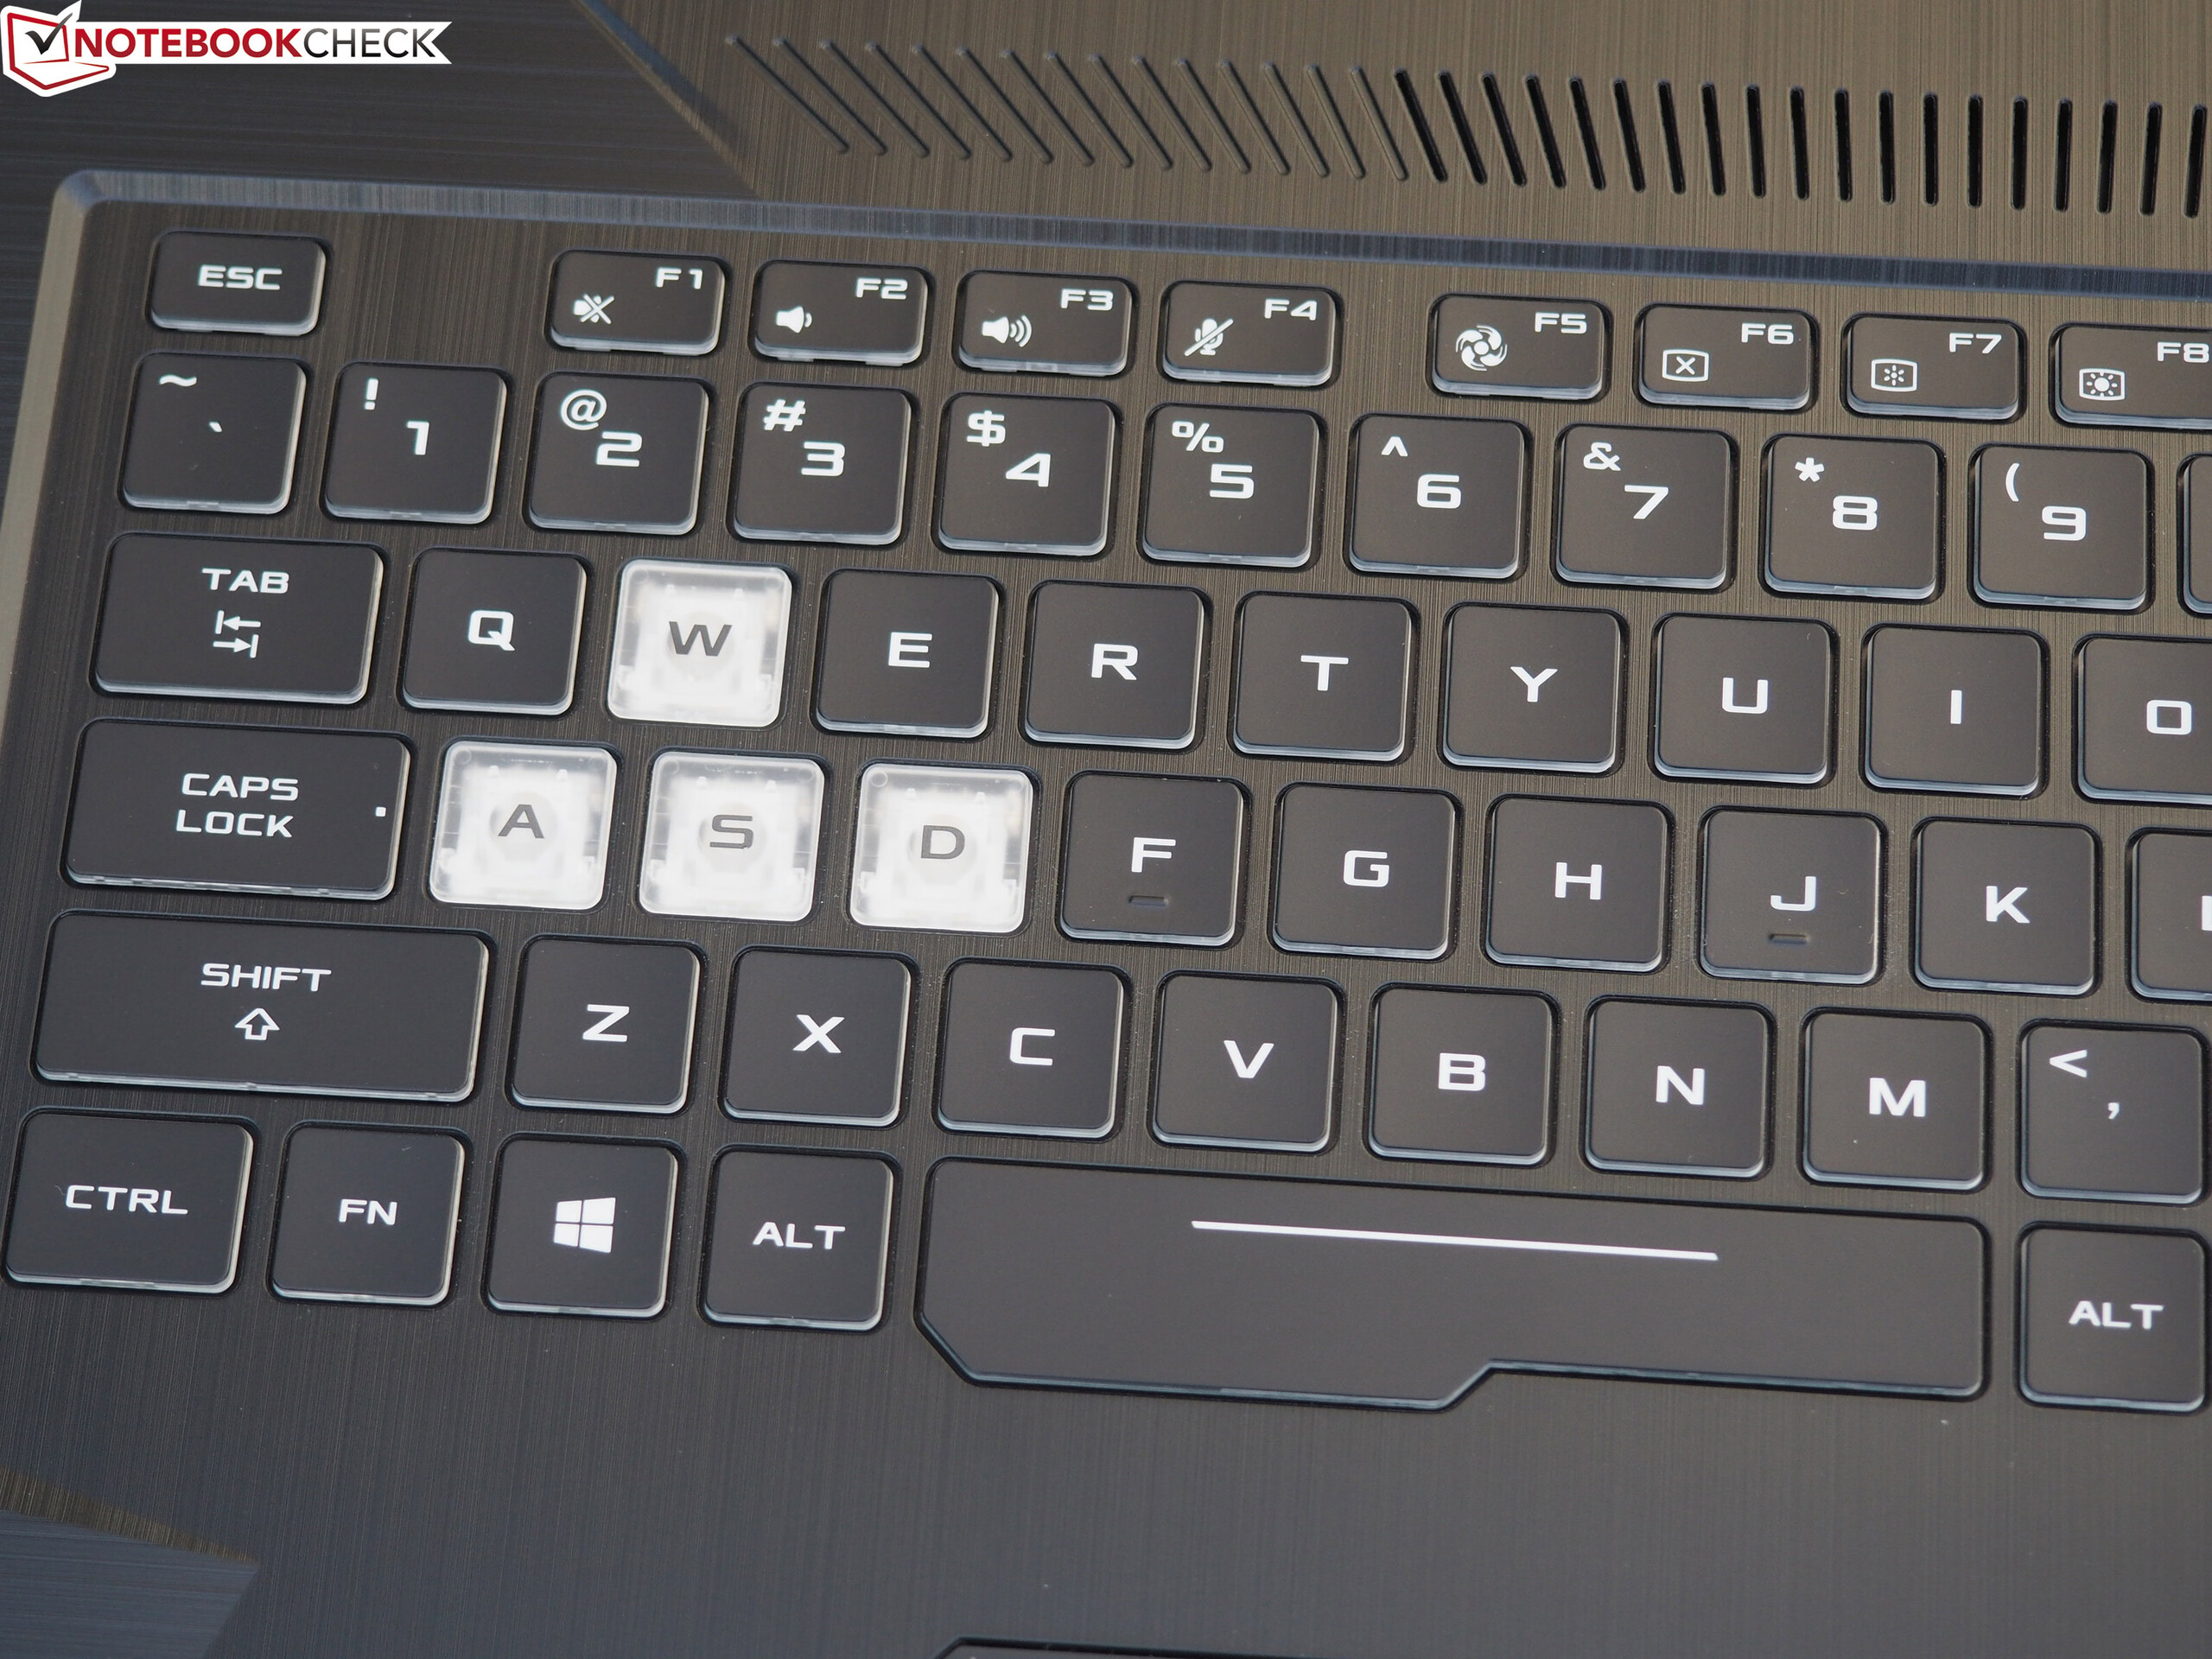
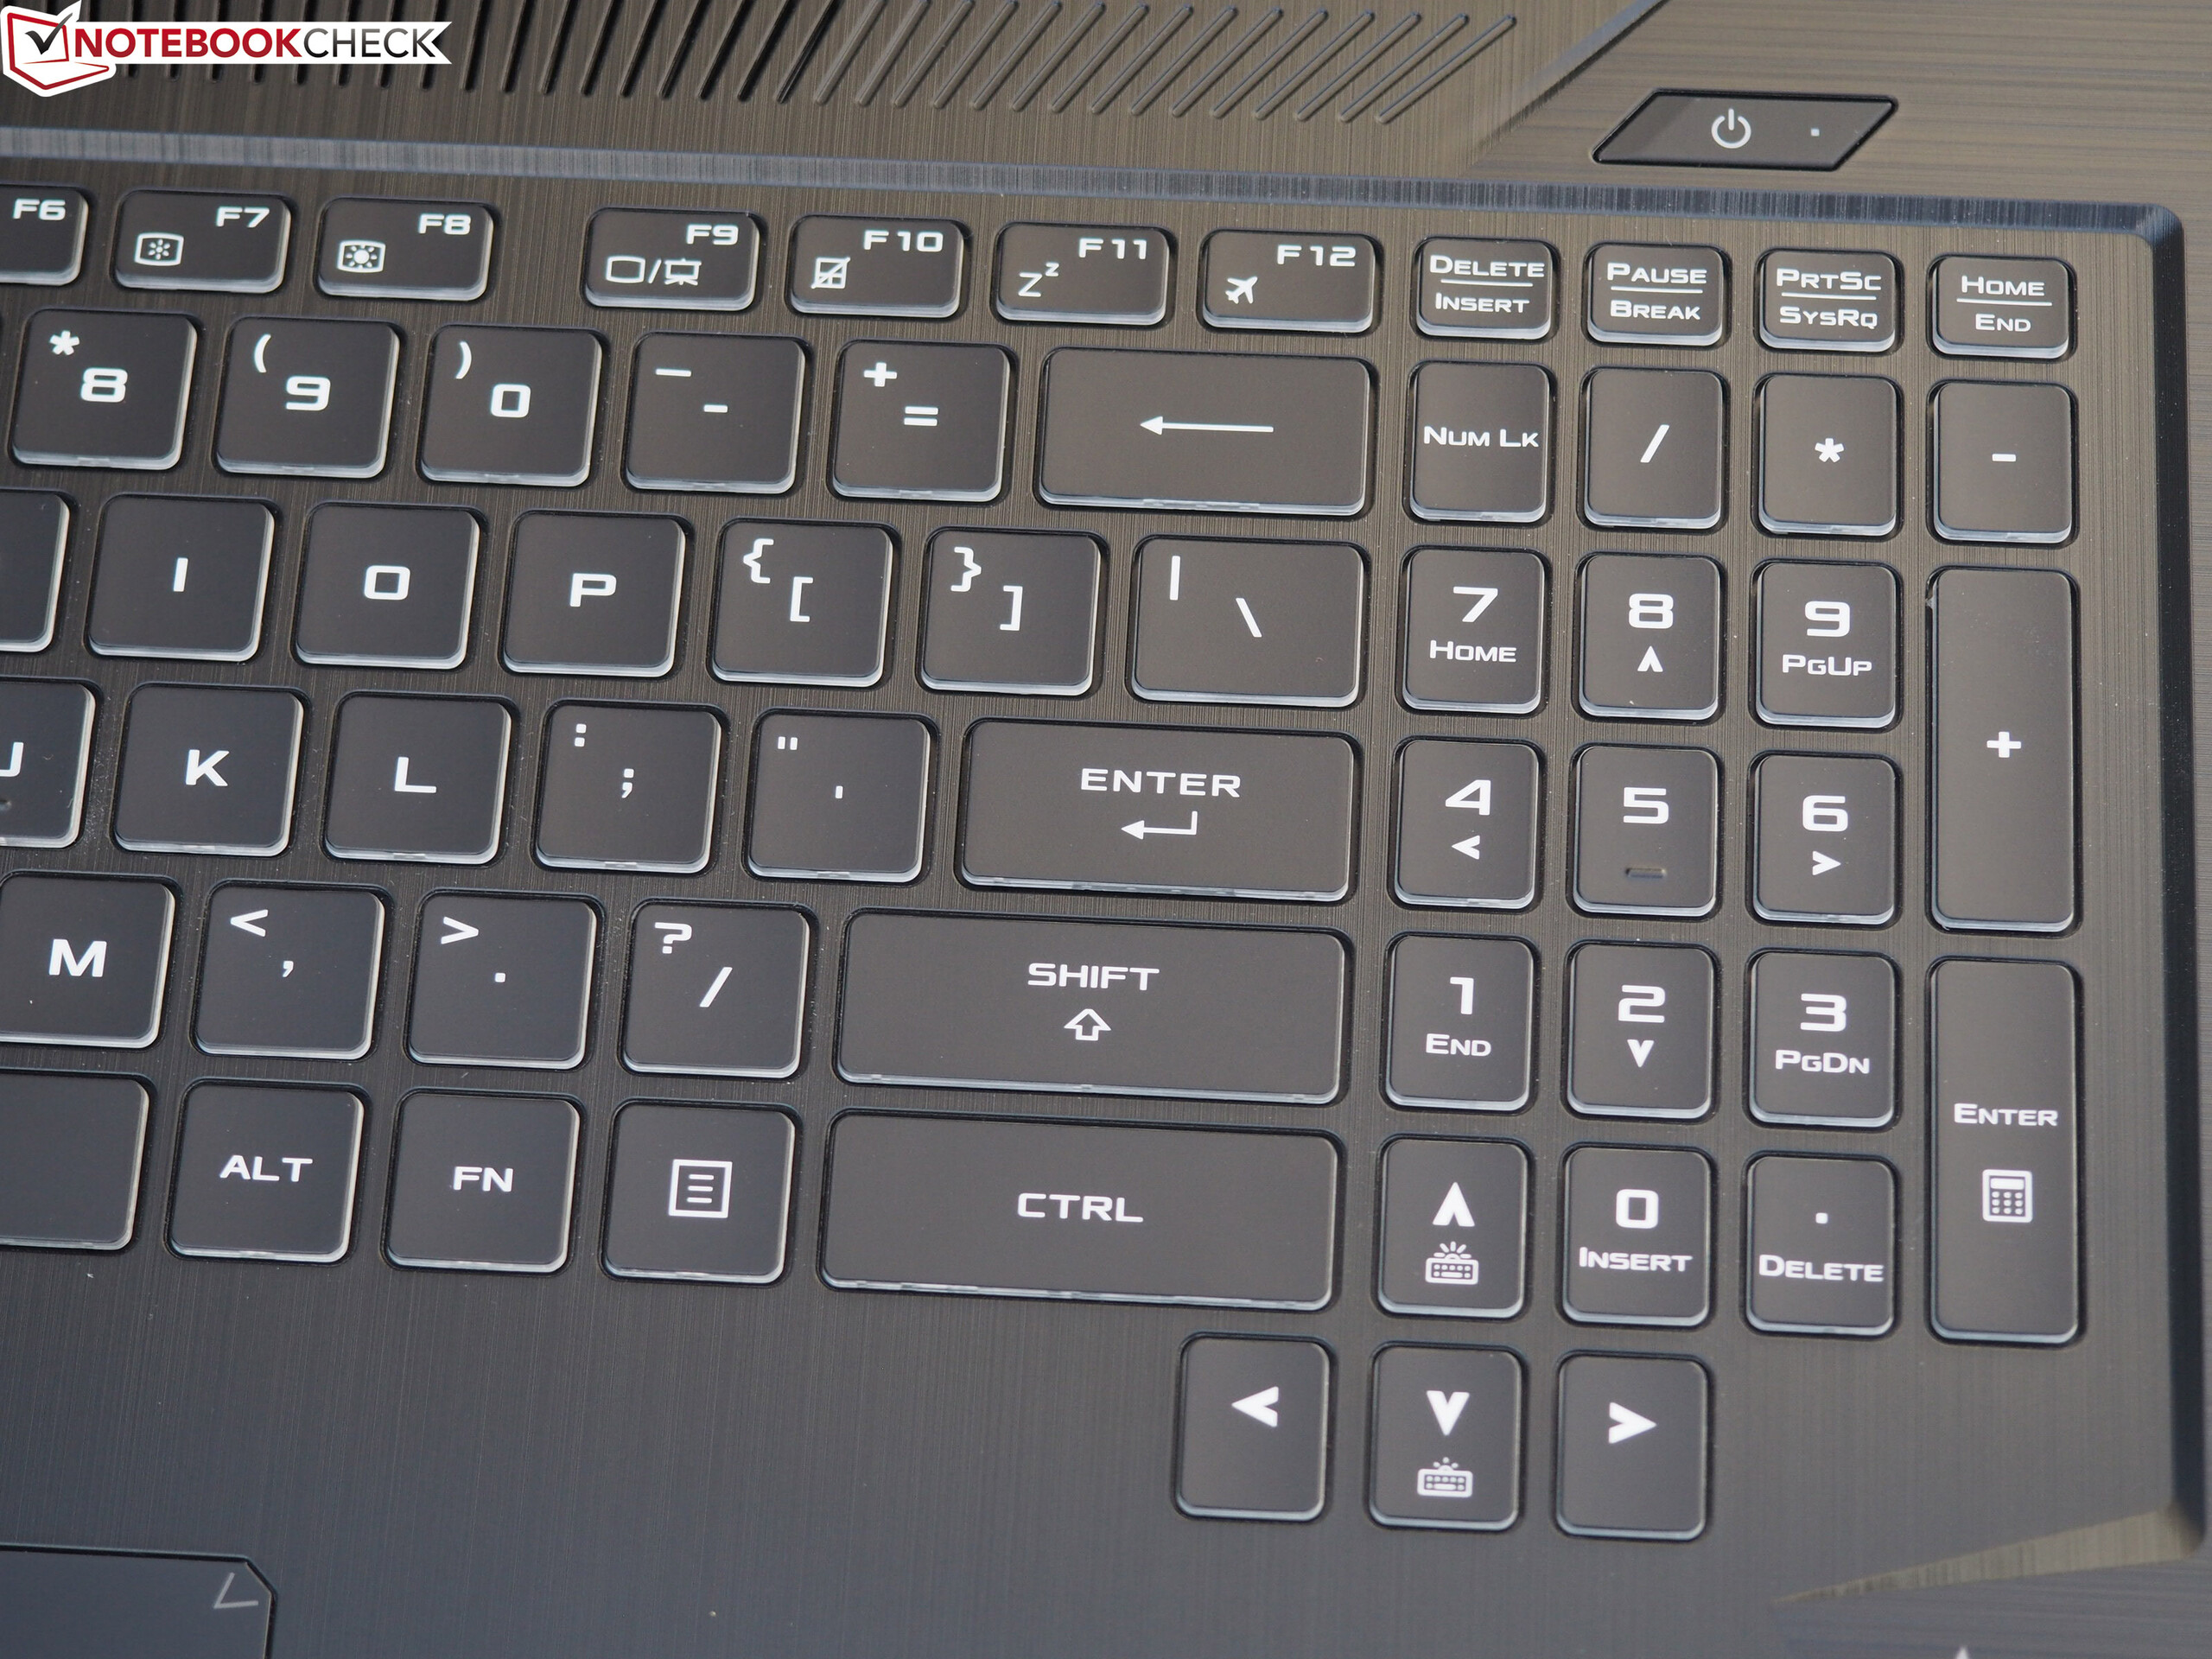
The matte IPS full HD display scores points with its good viewing angles and more than acceptable colour accuracy. Brightness and contrast are also absolutely fine. Furthermore, it features a keyboard suitable for daily typing that is equipped with RGB backlighting. Rounding off the overall package, the laptop has exceptionally good battery life.
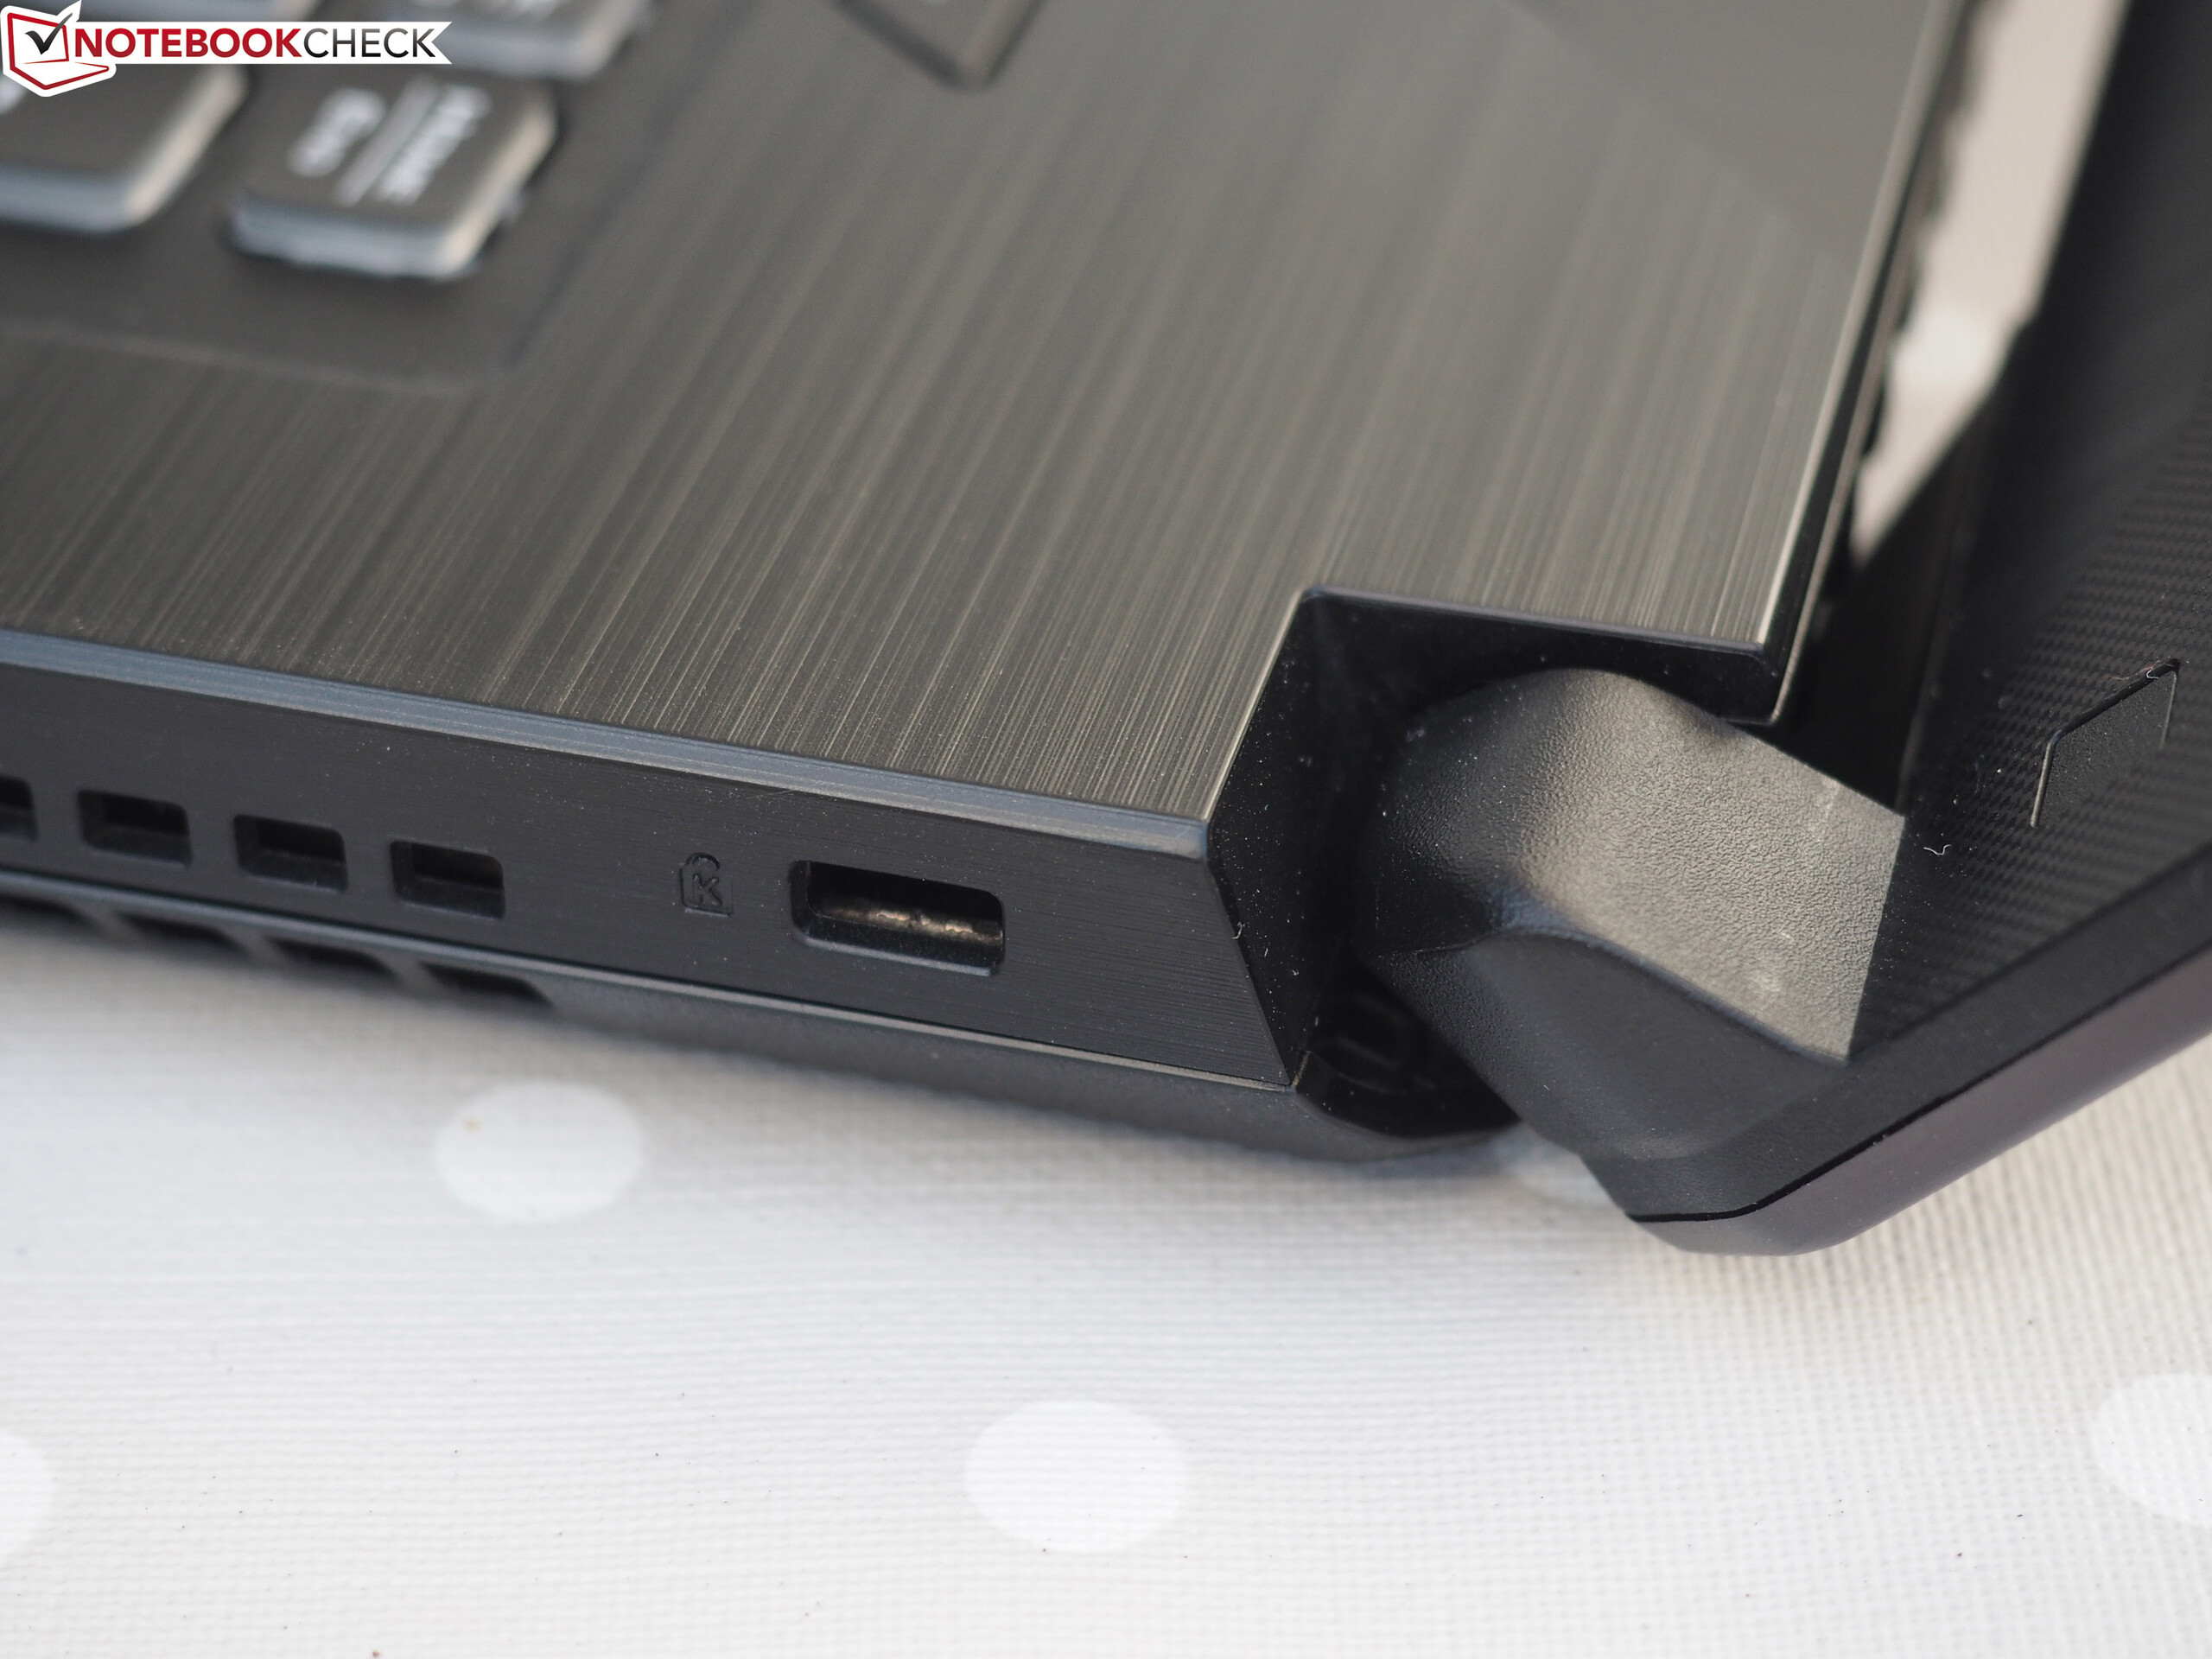
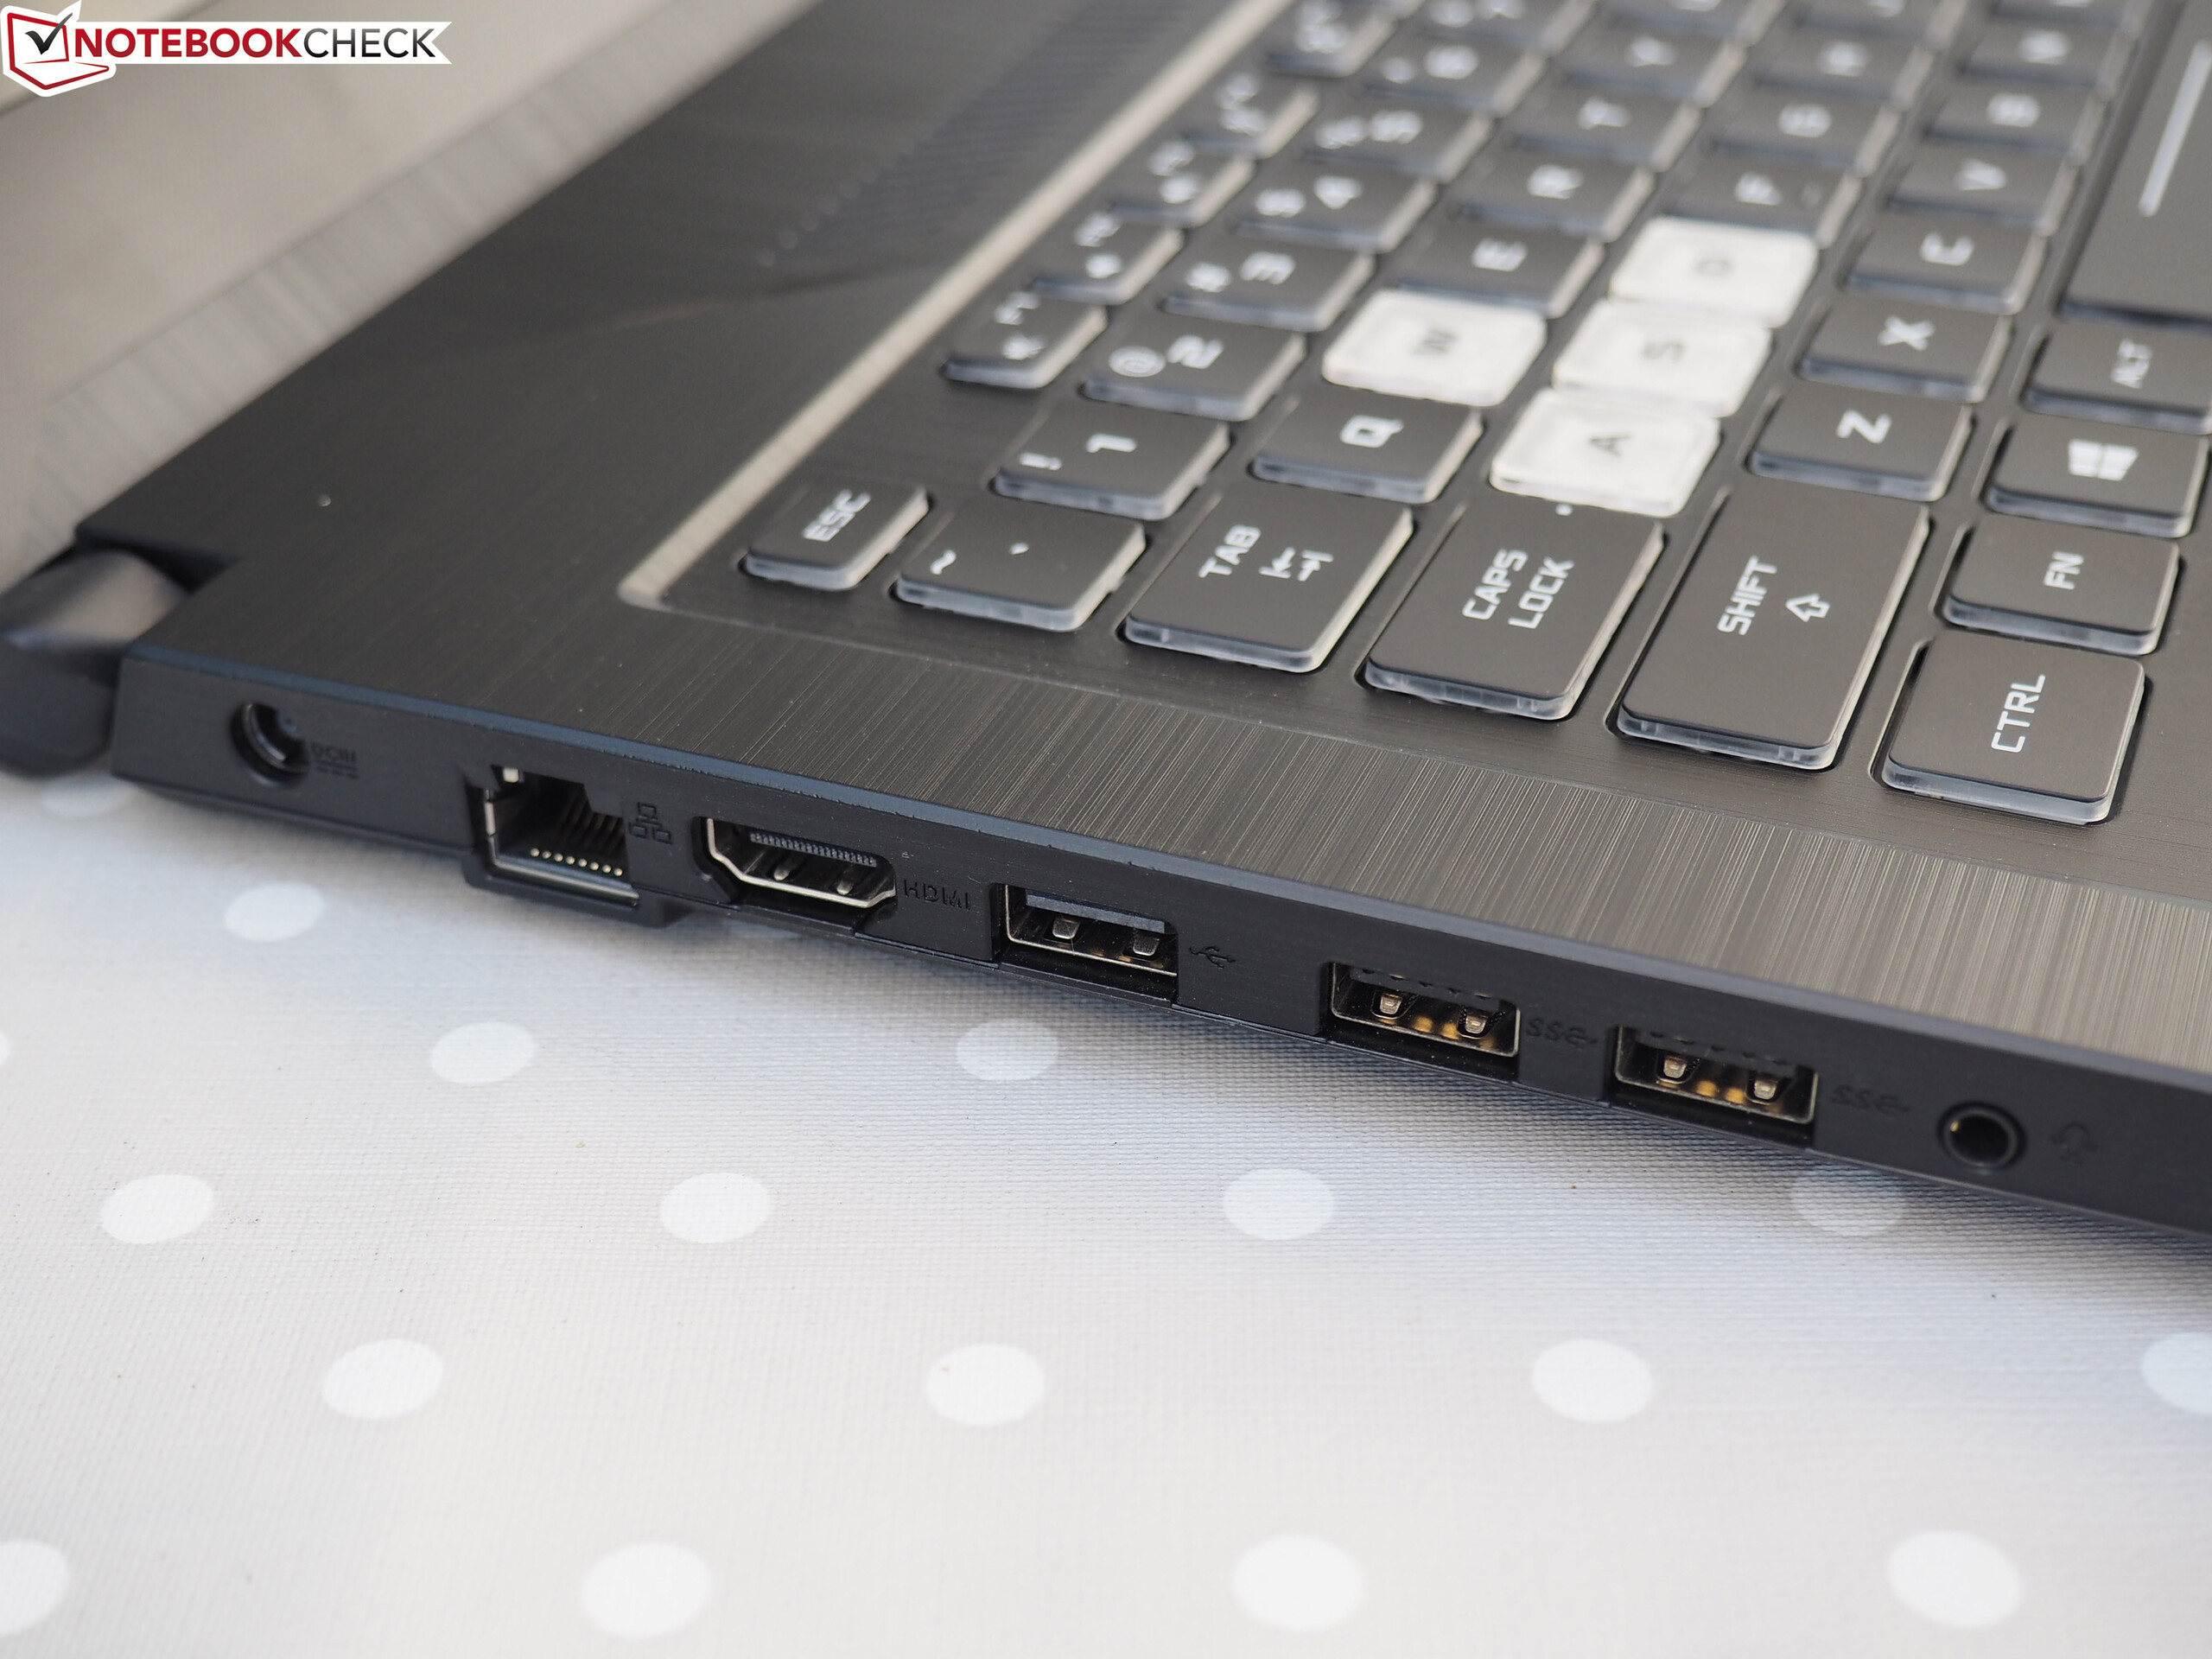
However points must be taken away for the available selection of ports. As with all of its sibling devices that we have reviewed, it does not feature a card reader or a USB type-C port. It also features only a single video output. If a wide variety of ports is an important consideration for you in a laptop, then you would be best off looking elsewhere. The Lenovo Legion Y730-17ICH for example has two video outputs and Thunderbolt 3 on board.
Asus TUF FX705DT-AU068T
- 09/20/2019 v7 (old)
Sascha Mölck
Price comparison
