MSI GF75 Thin 8RD (i7-8750H, GTX 1050Ti Max-Q) Laptop Review

It is about 8% smaller, 16% thinner and 15% lighter than the average 17-inch gamer. This is how the GF75 Thin is presented on the MSI website. And the gaming laptop really does feel small in our hands. Quite a change in comparison to other MSI devices we have seen that looked more like a briefcase with large ventilation grilles. Naturally, we are most interested in how MSI has accomplished this impressive feat. After all, it is equipped with an Intel Core i7-8750H and a GTX 1050 Ti Max-Q - components that are definitely still fit for gaming. We are curious to take a look at the laptop's throttling behavior in our Cinebench tests.
The GF75 Thin is available in two configurations. The GF75 Thin 8RD and the GF75 Thin 8RC. The difference is in the dedicated GPU: The 8RD version is equipped with the slightly stronger, optimized GTX 1050 Ti Max-Q while the 8RC model makes do with a normal GTX 1050. According to MSI the performance of the Ti Max-Q chip is about 20% higher, but more on that later. Our device comes from notebooksbilliger.de and is equipped with 16 GB of RAM (2x DDR4-2666). This can be expanded to up to 32 GB.
We have chosen to include models with a similar build that also feature an Intel Core i7-8750H and a GTX 1050 Ti Max-Q into our list of comparison devices. The choice is not large, but these are the devices that are suitable for direct comparison (both 15-inch and 17-inch notebooks):
Case - the thin flyweight
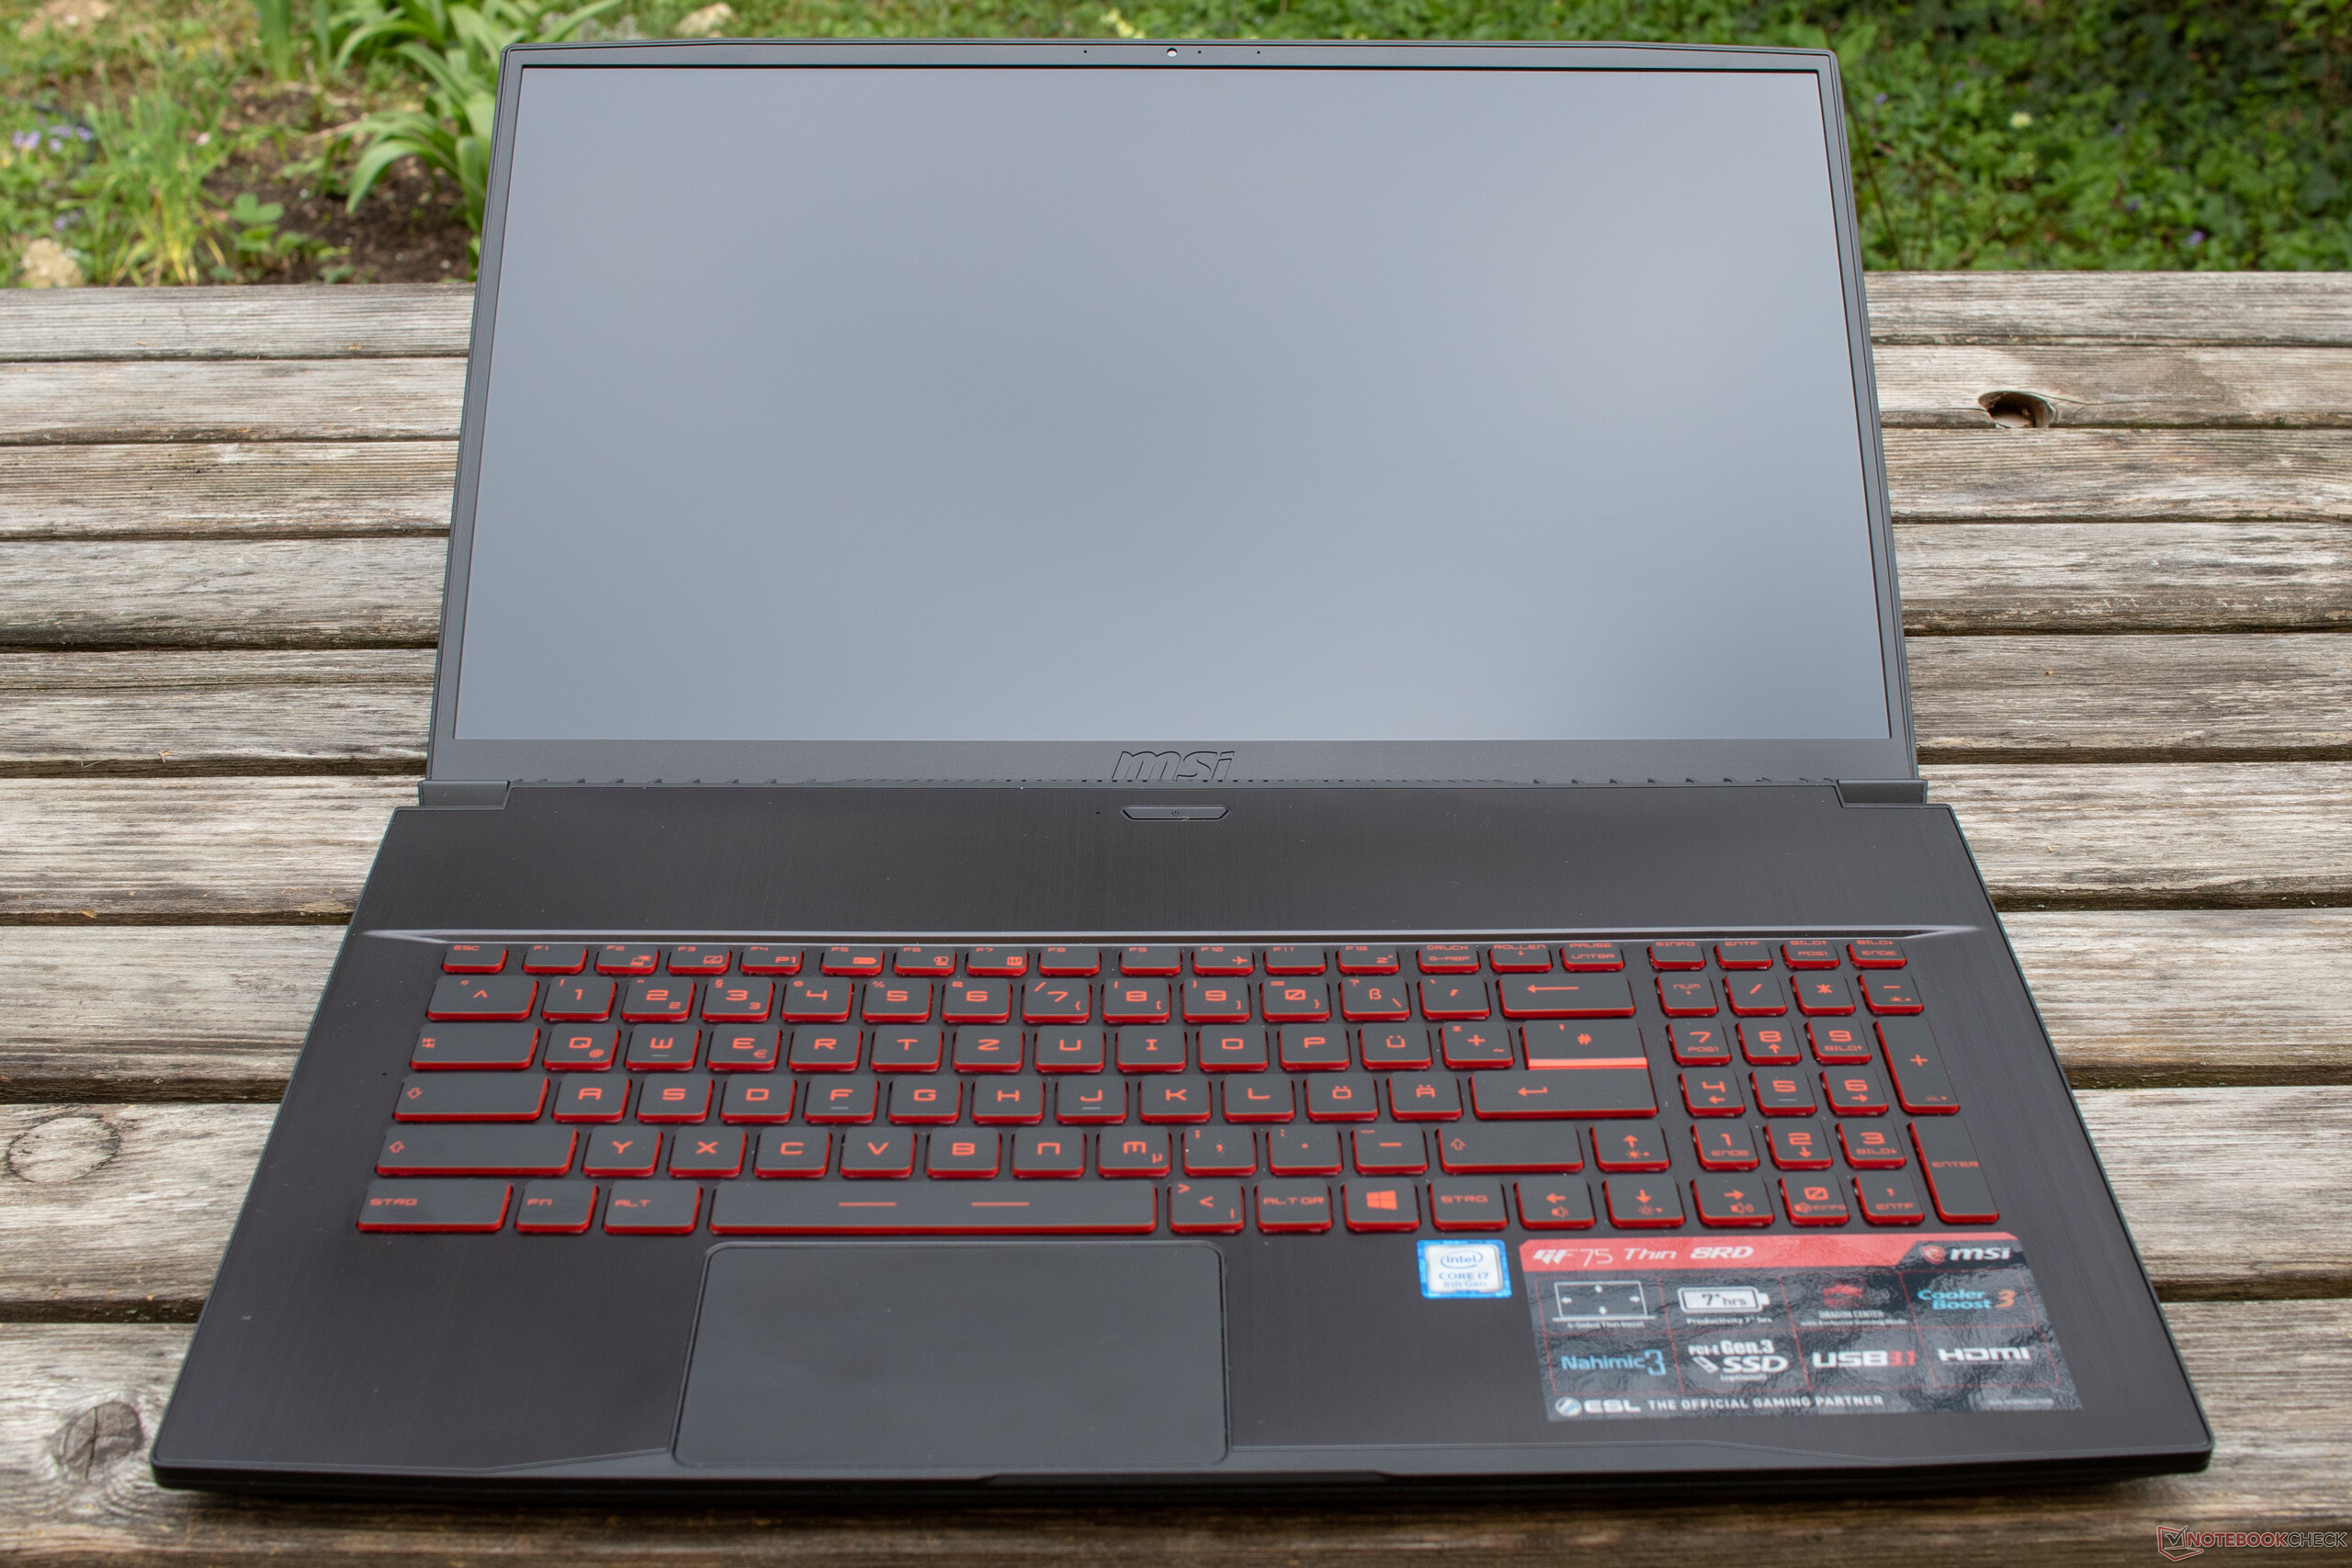
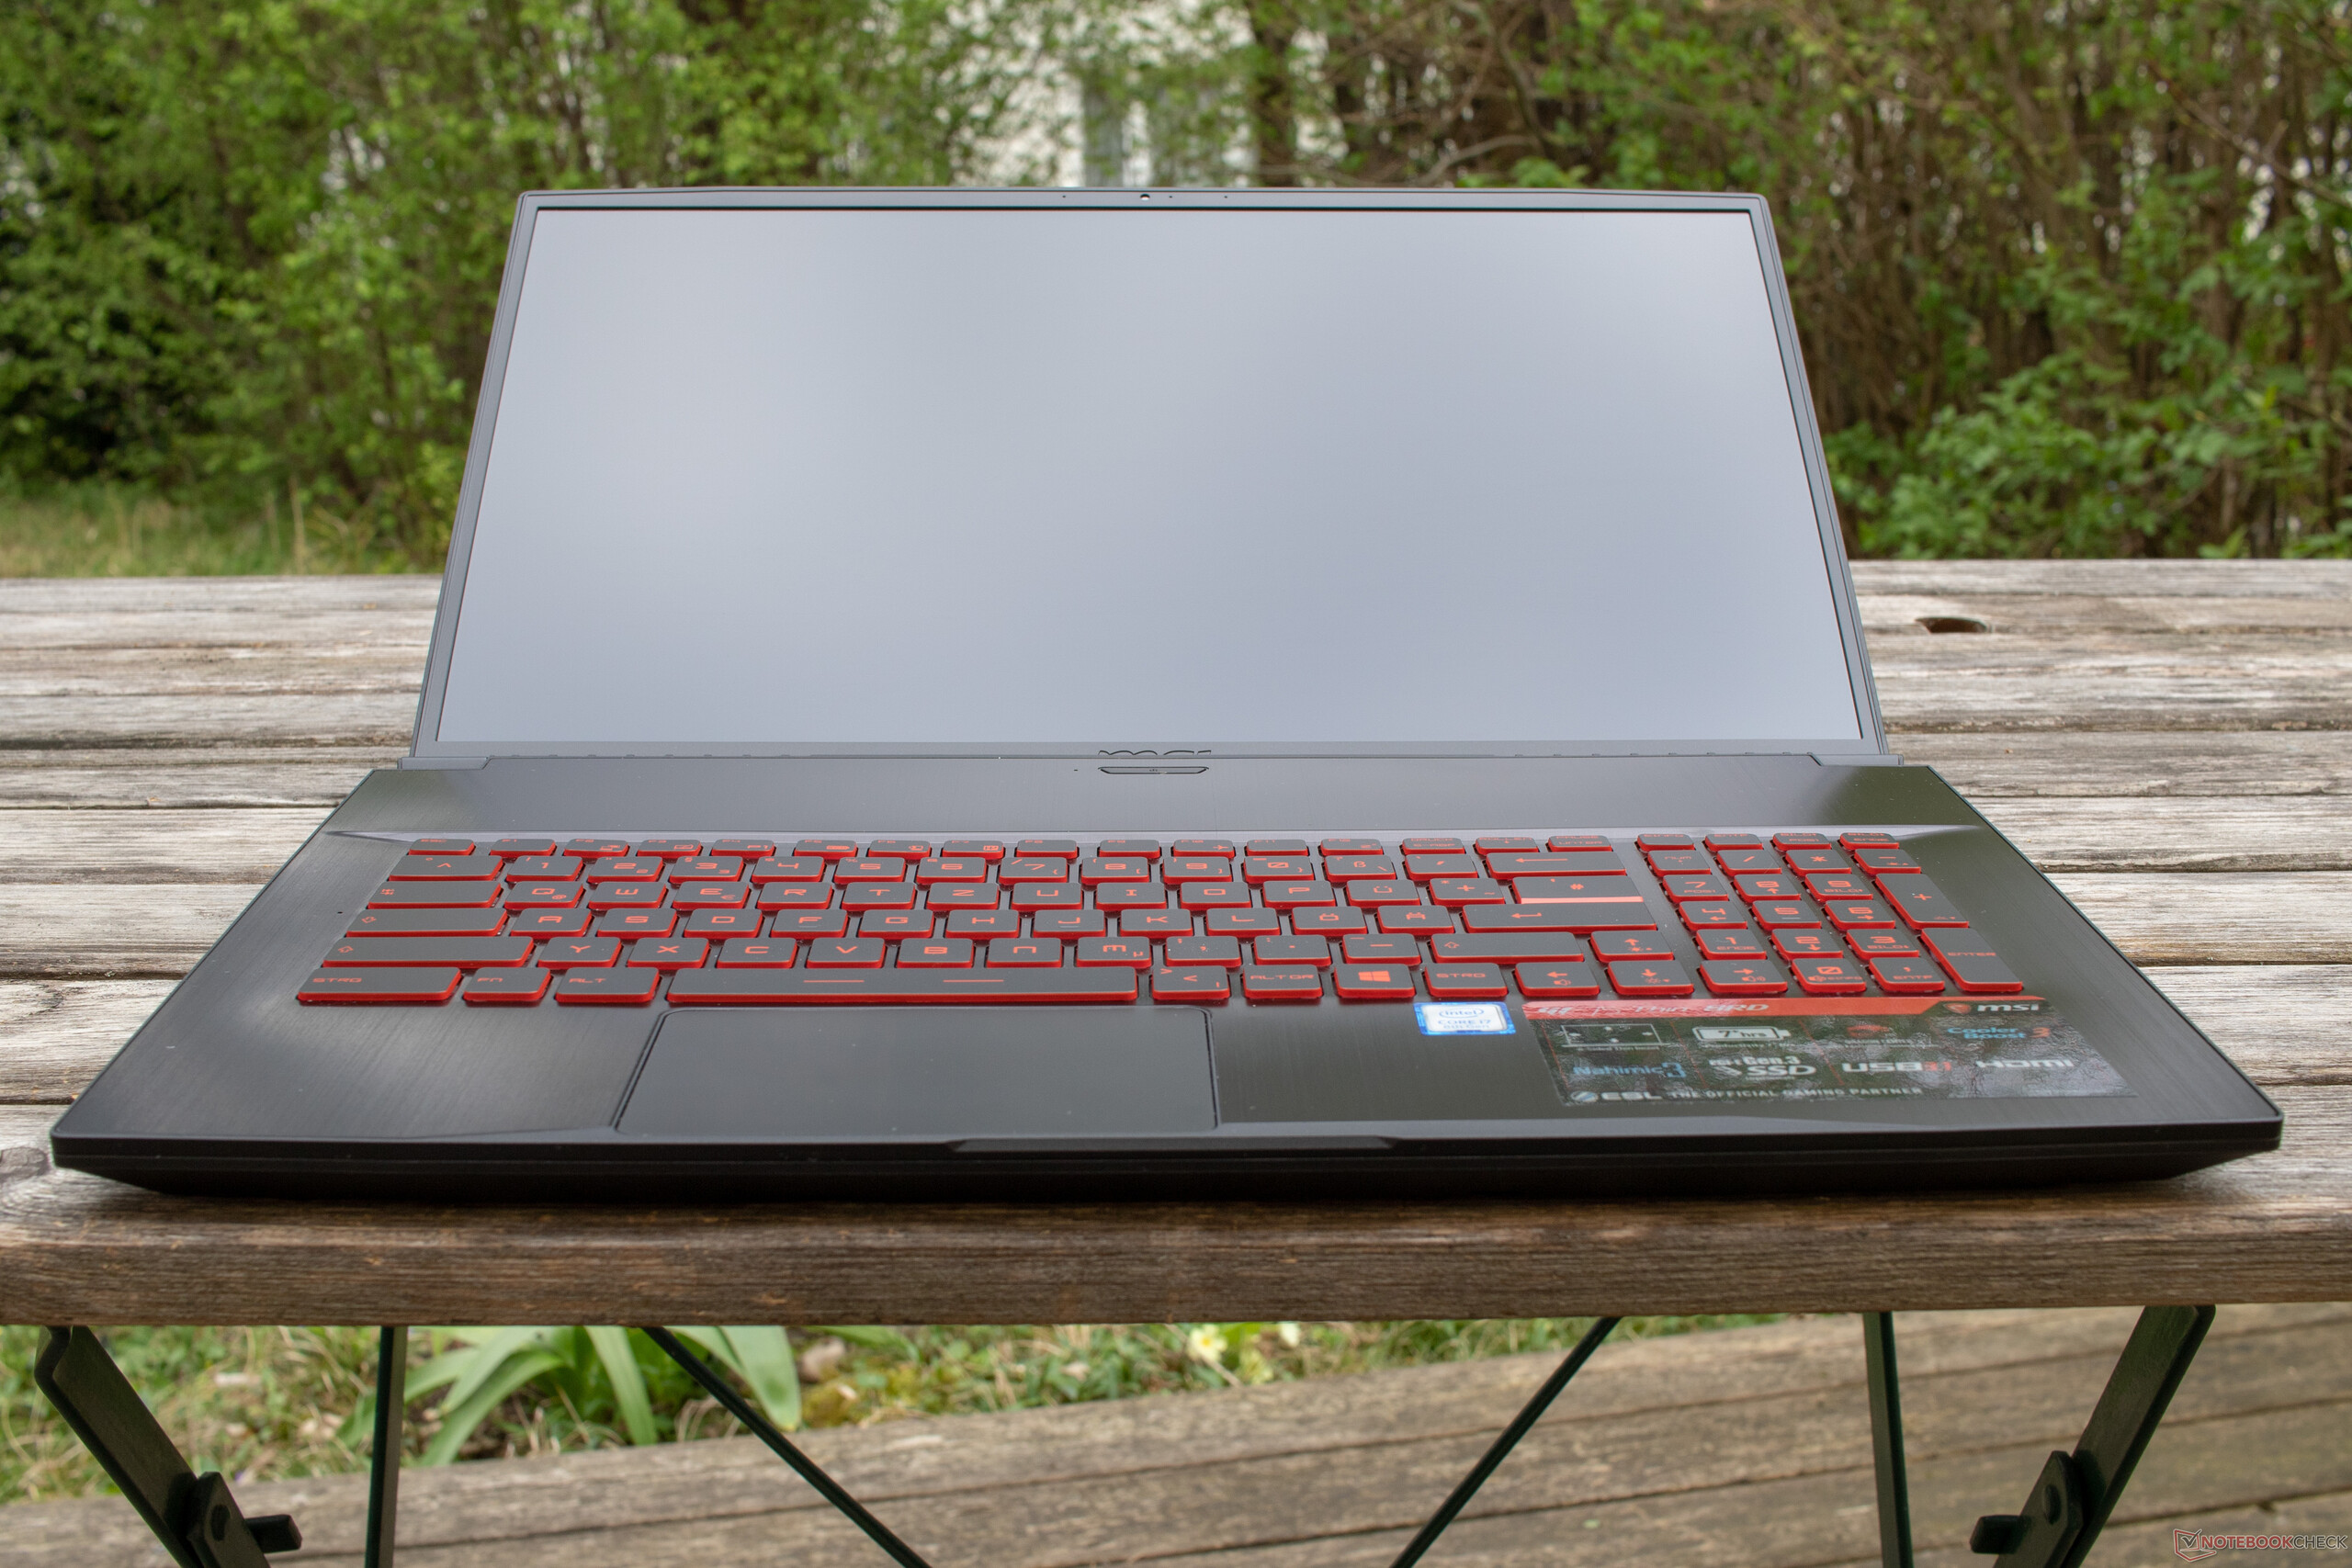
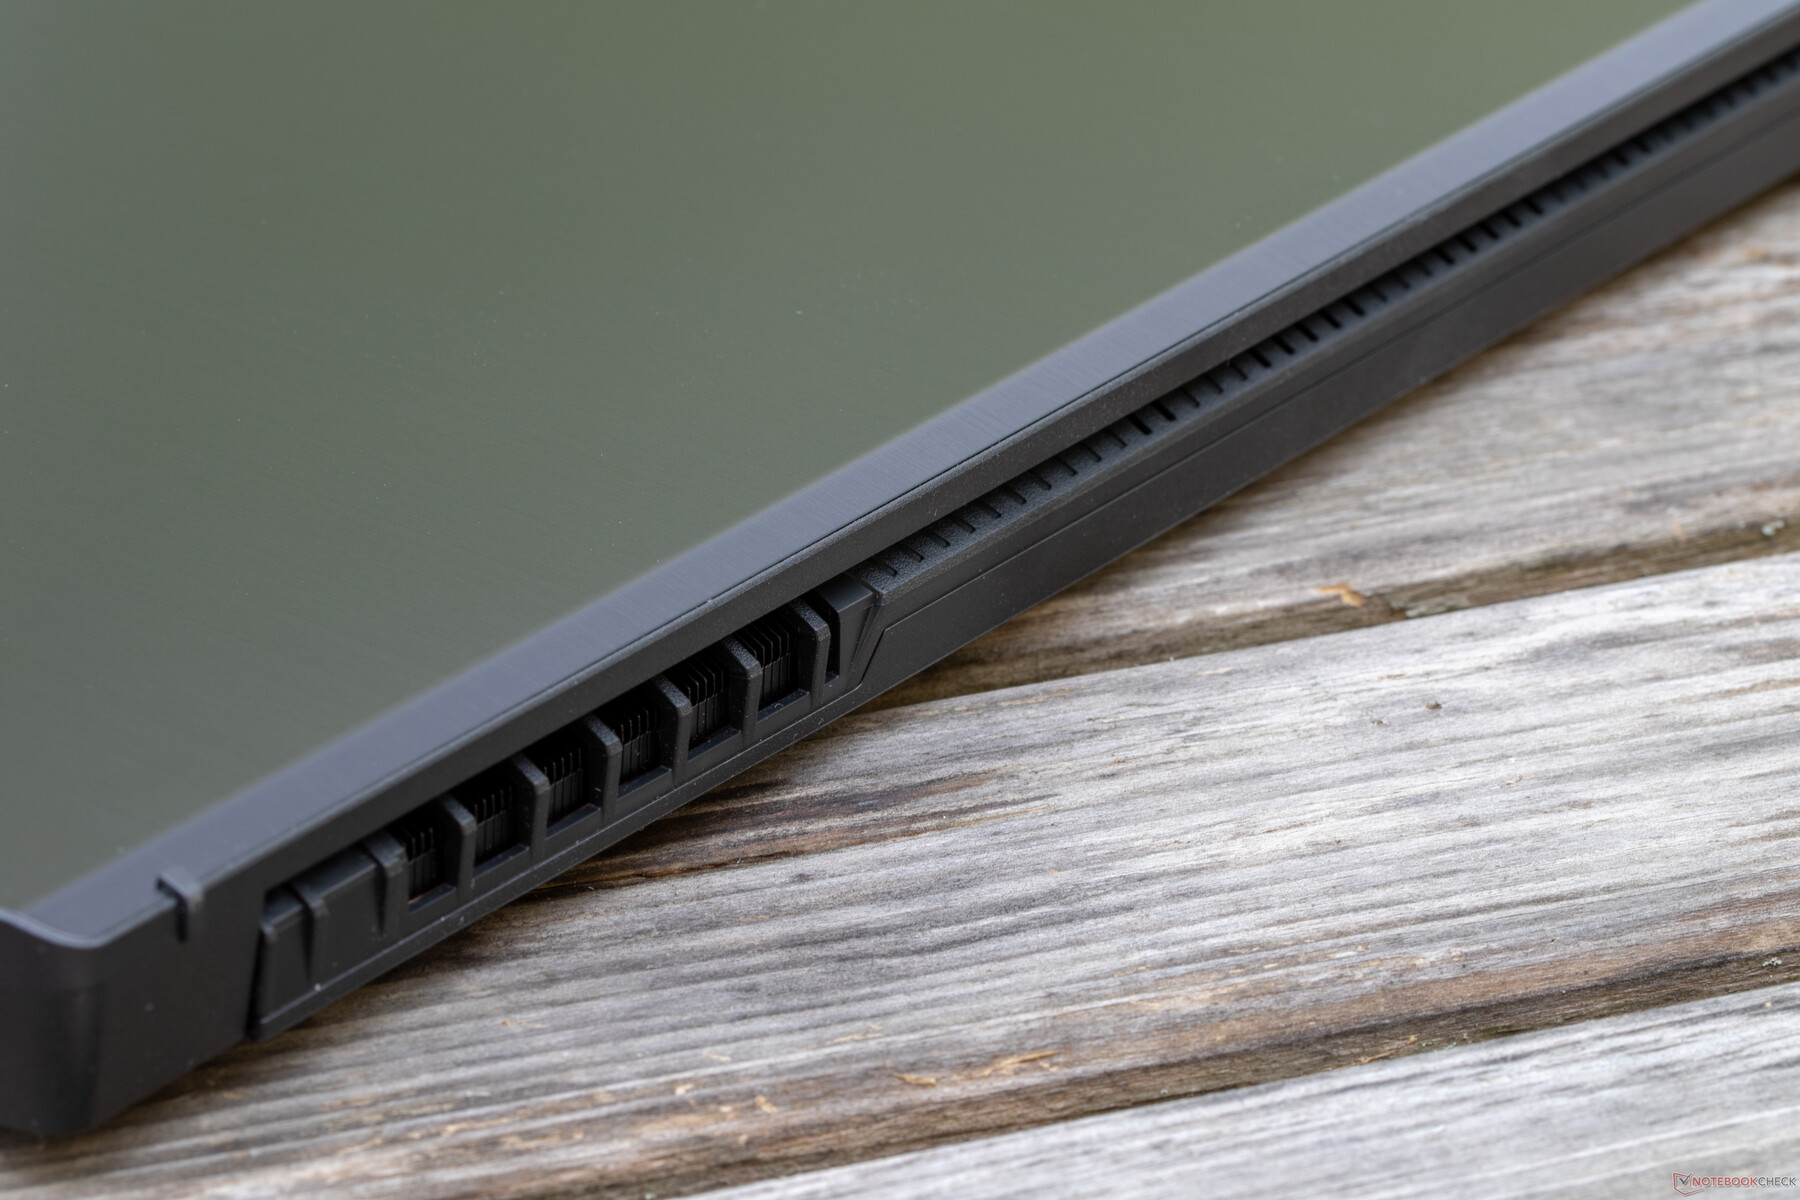
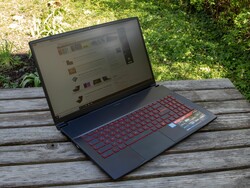
We will leave it up to you to decide whether the design fits into an office space or not, but the GF75 Thin is clearly directed at the gamer community. Keys with red lettering, the typical gamer's ventilation slots and the brushed metal surface all state one thing: it is a gaming laptop. There is an equal amount of space above and below the keyboard, which might be a little uncomfortable for users with large hands if their wrists have to rest on the edge of the case for hours.
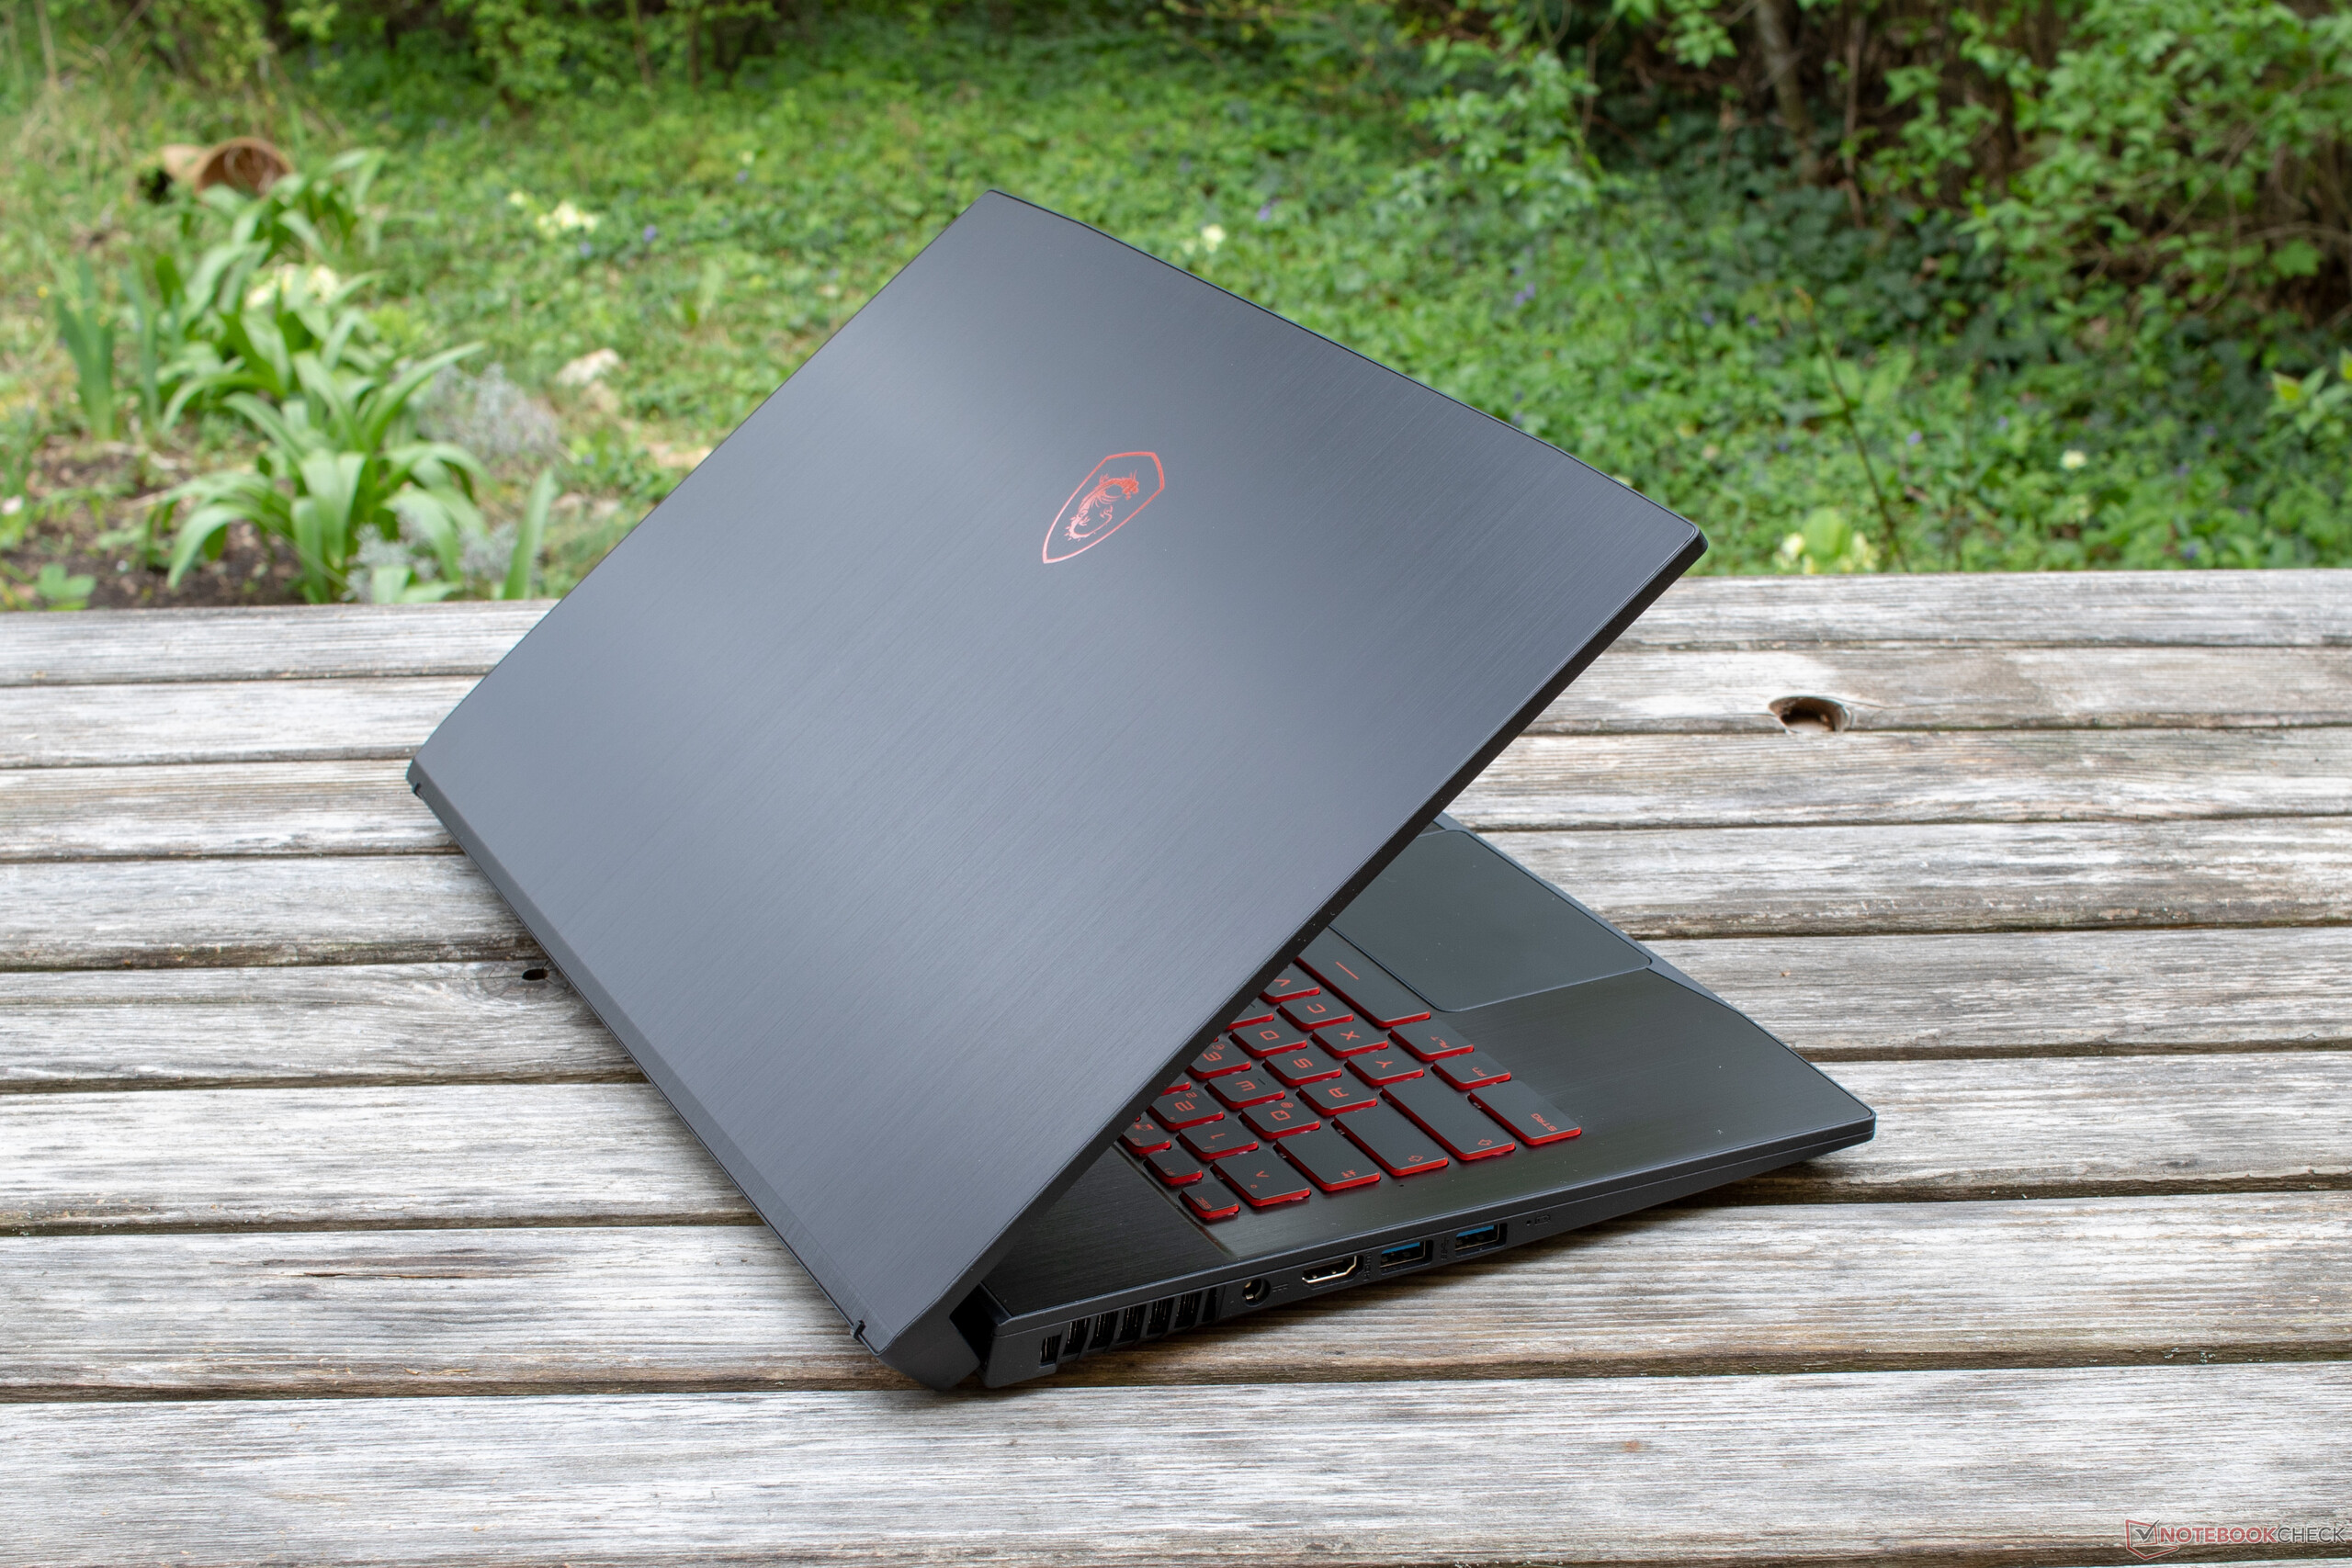
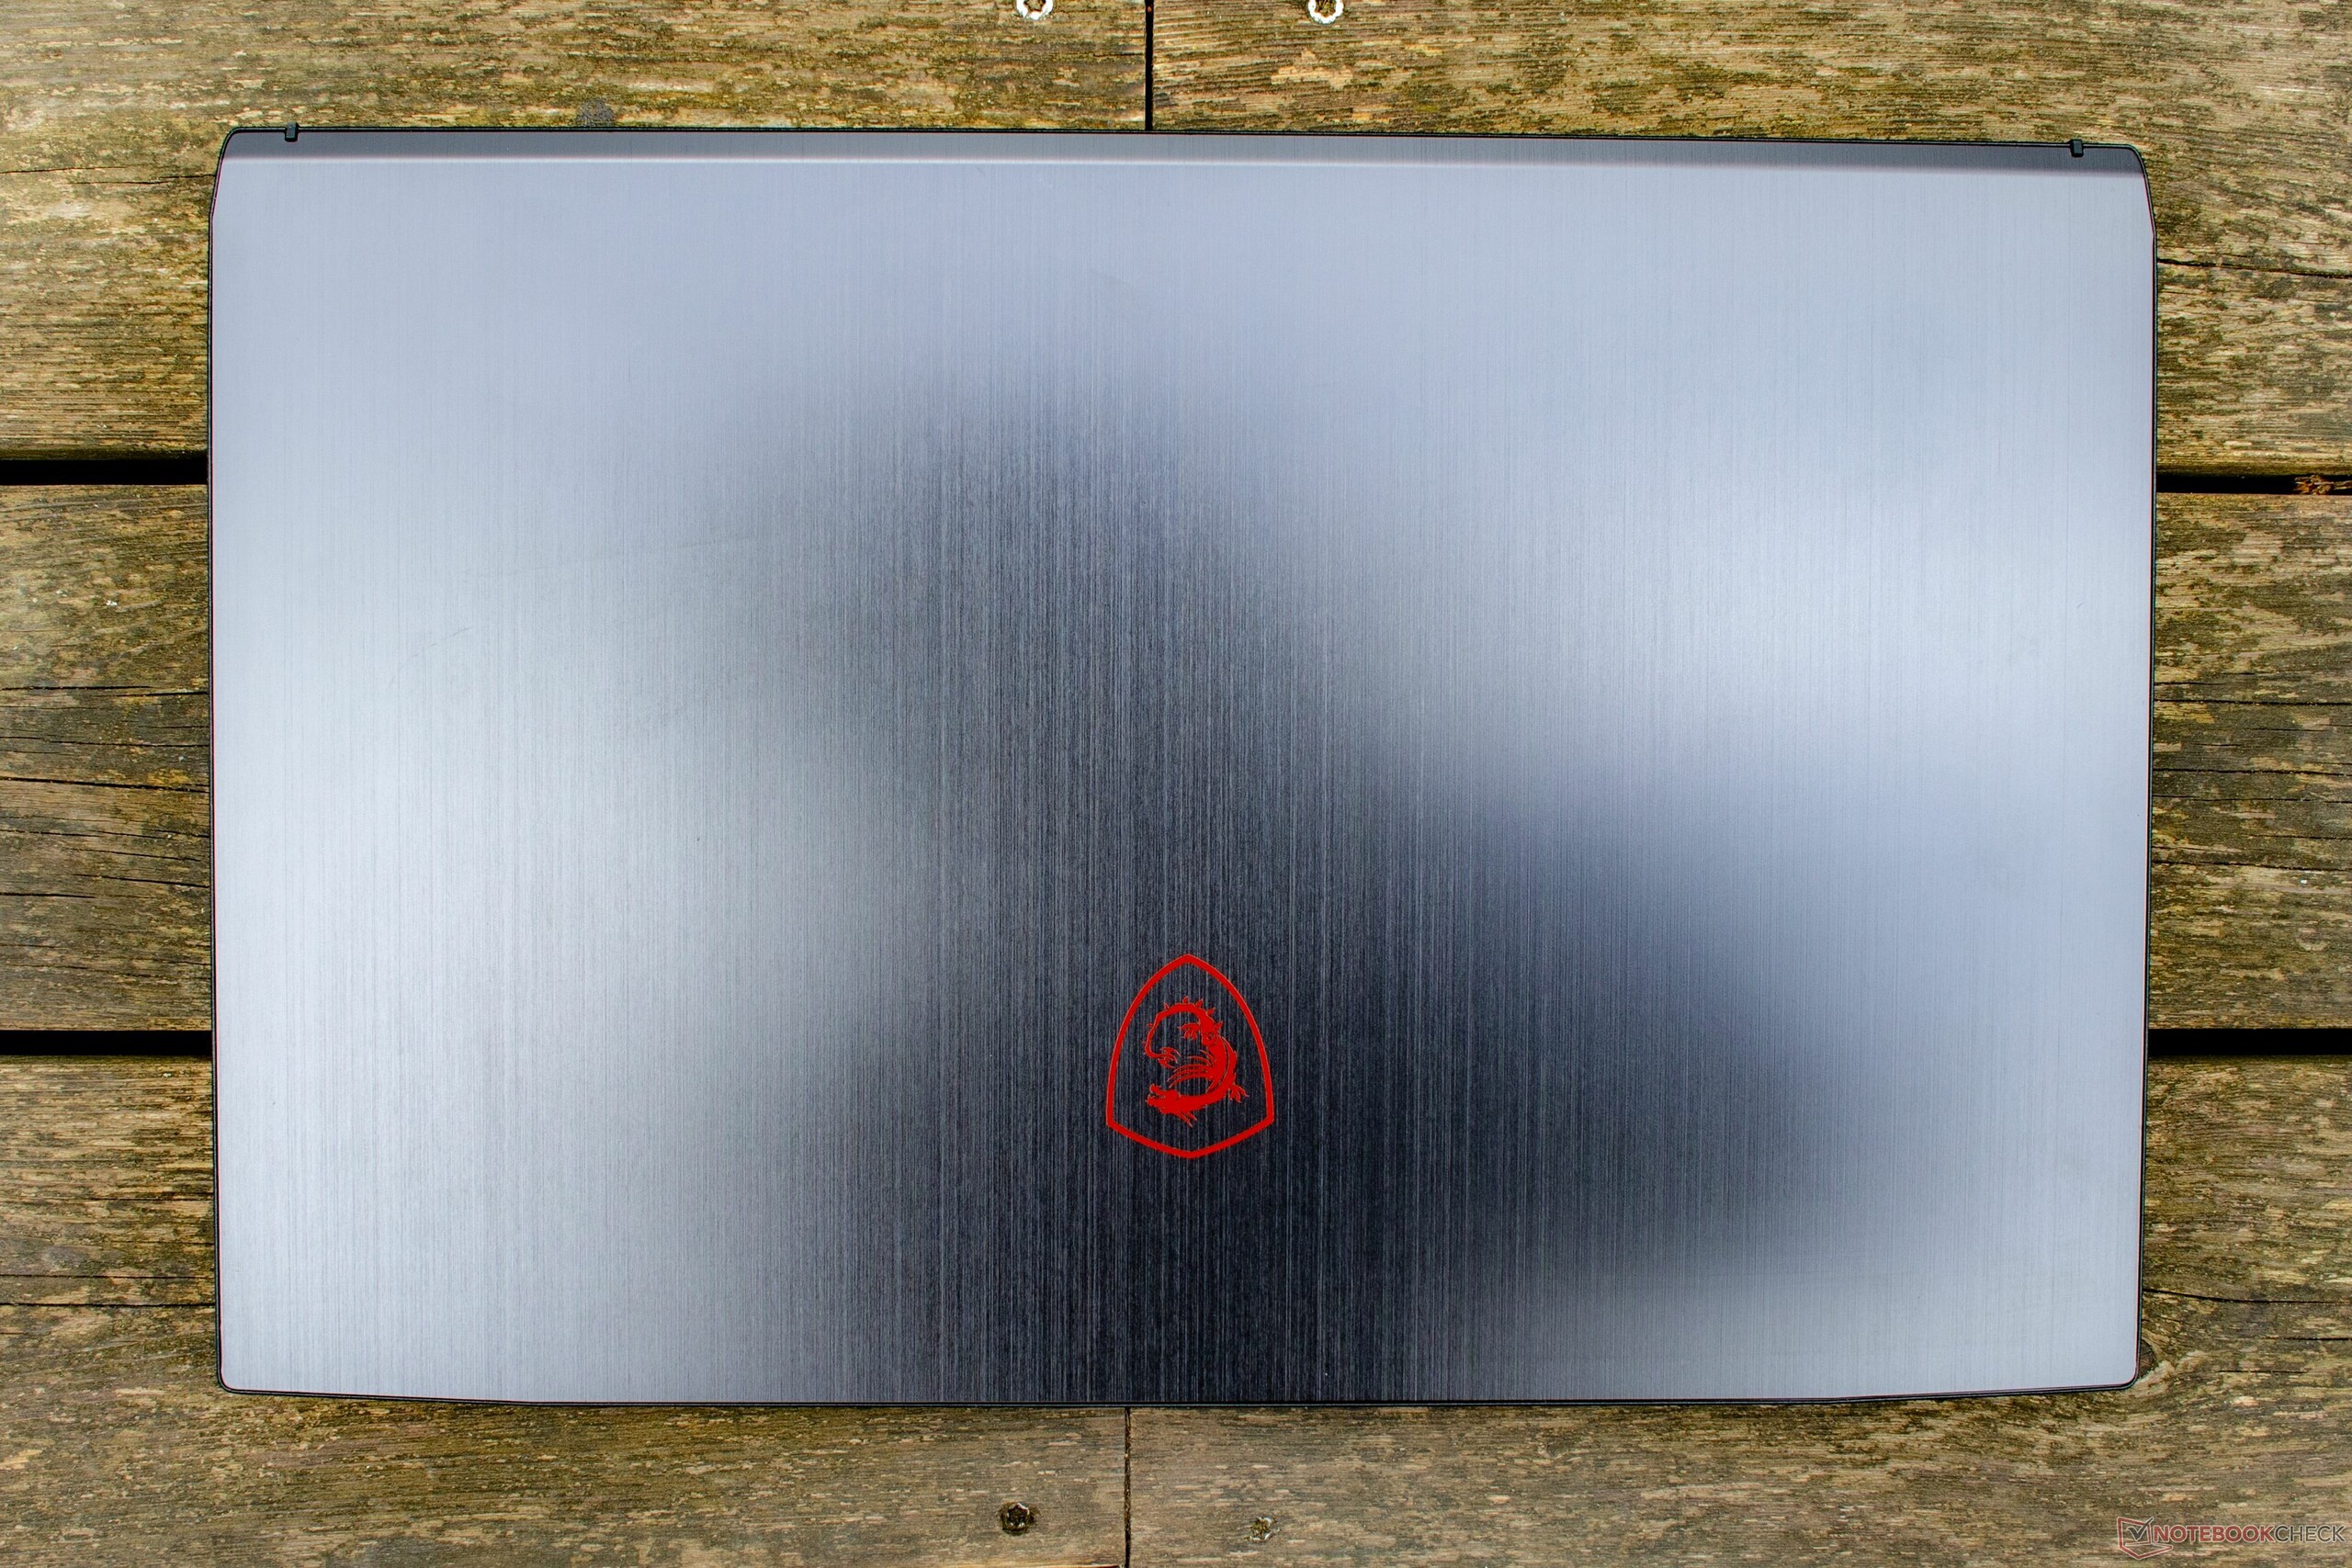
Unfortunately, the device looks better than it feels. As we have often noted on thin gaming notebooks in this price range, there is a lot of plastic involved. While the top of the base unit and the back of the display are made of cool metal, the sides and bottom of the base unit are made of thin, cheap-looking plastic. In return, the gaming laptop only weighs about 2.2 kg (~4.85 lb), which is not much for a gaming notebook. Our other models that are equipped with an Intel Core i7-8750H and a dedicated GeForce 1050 Ti all weigh at least another 200 grams (~7 oz) more. MSI has clearly made sure they keep the weight down.
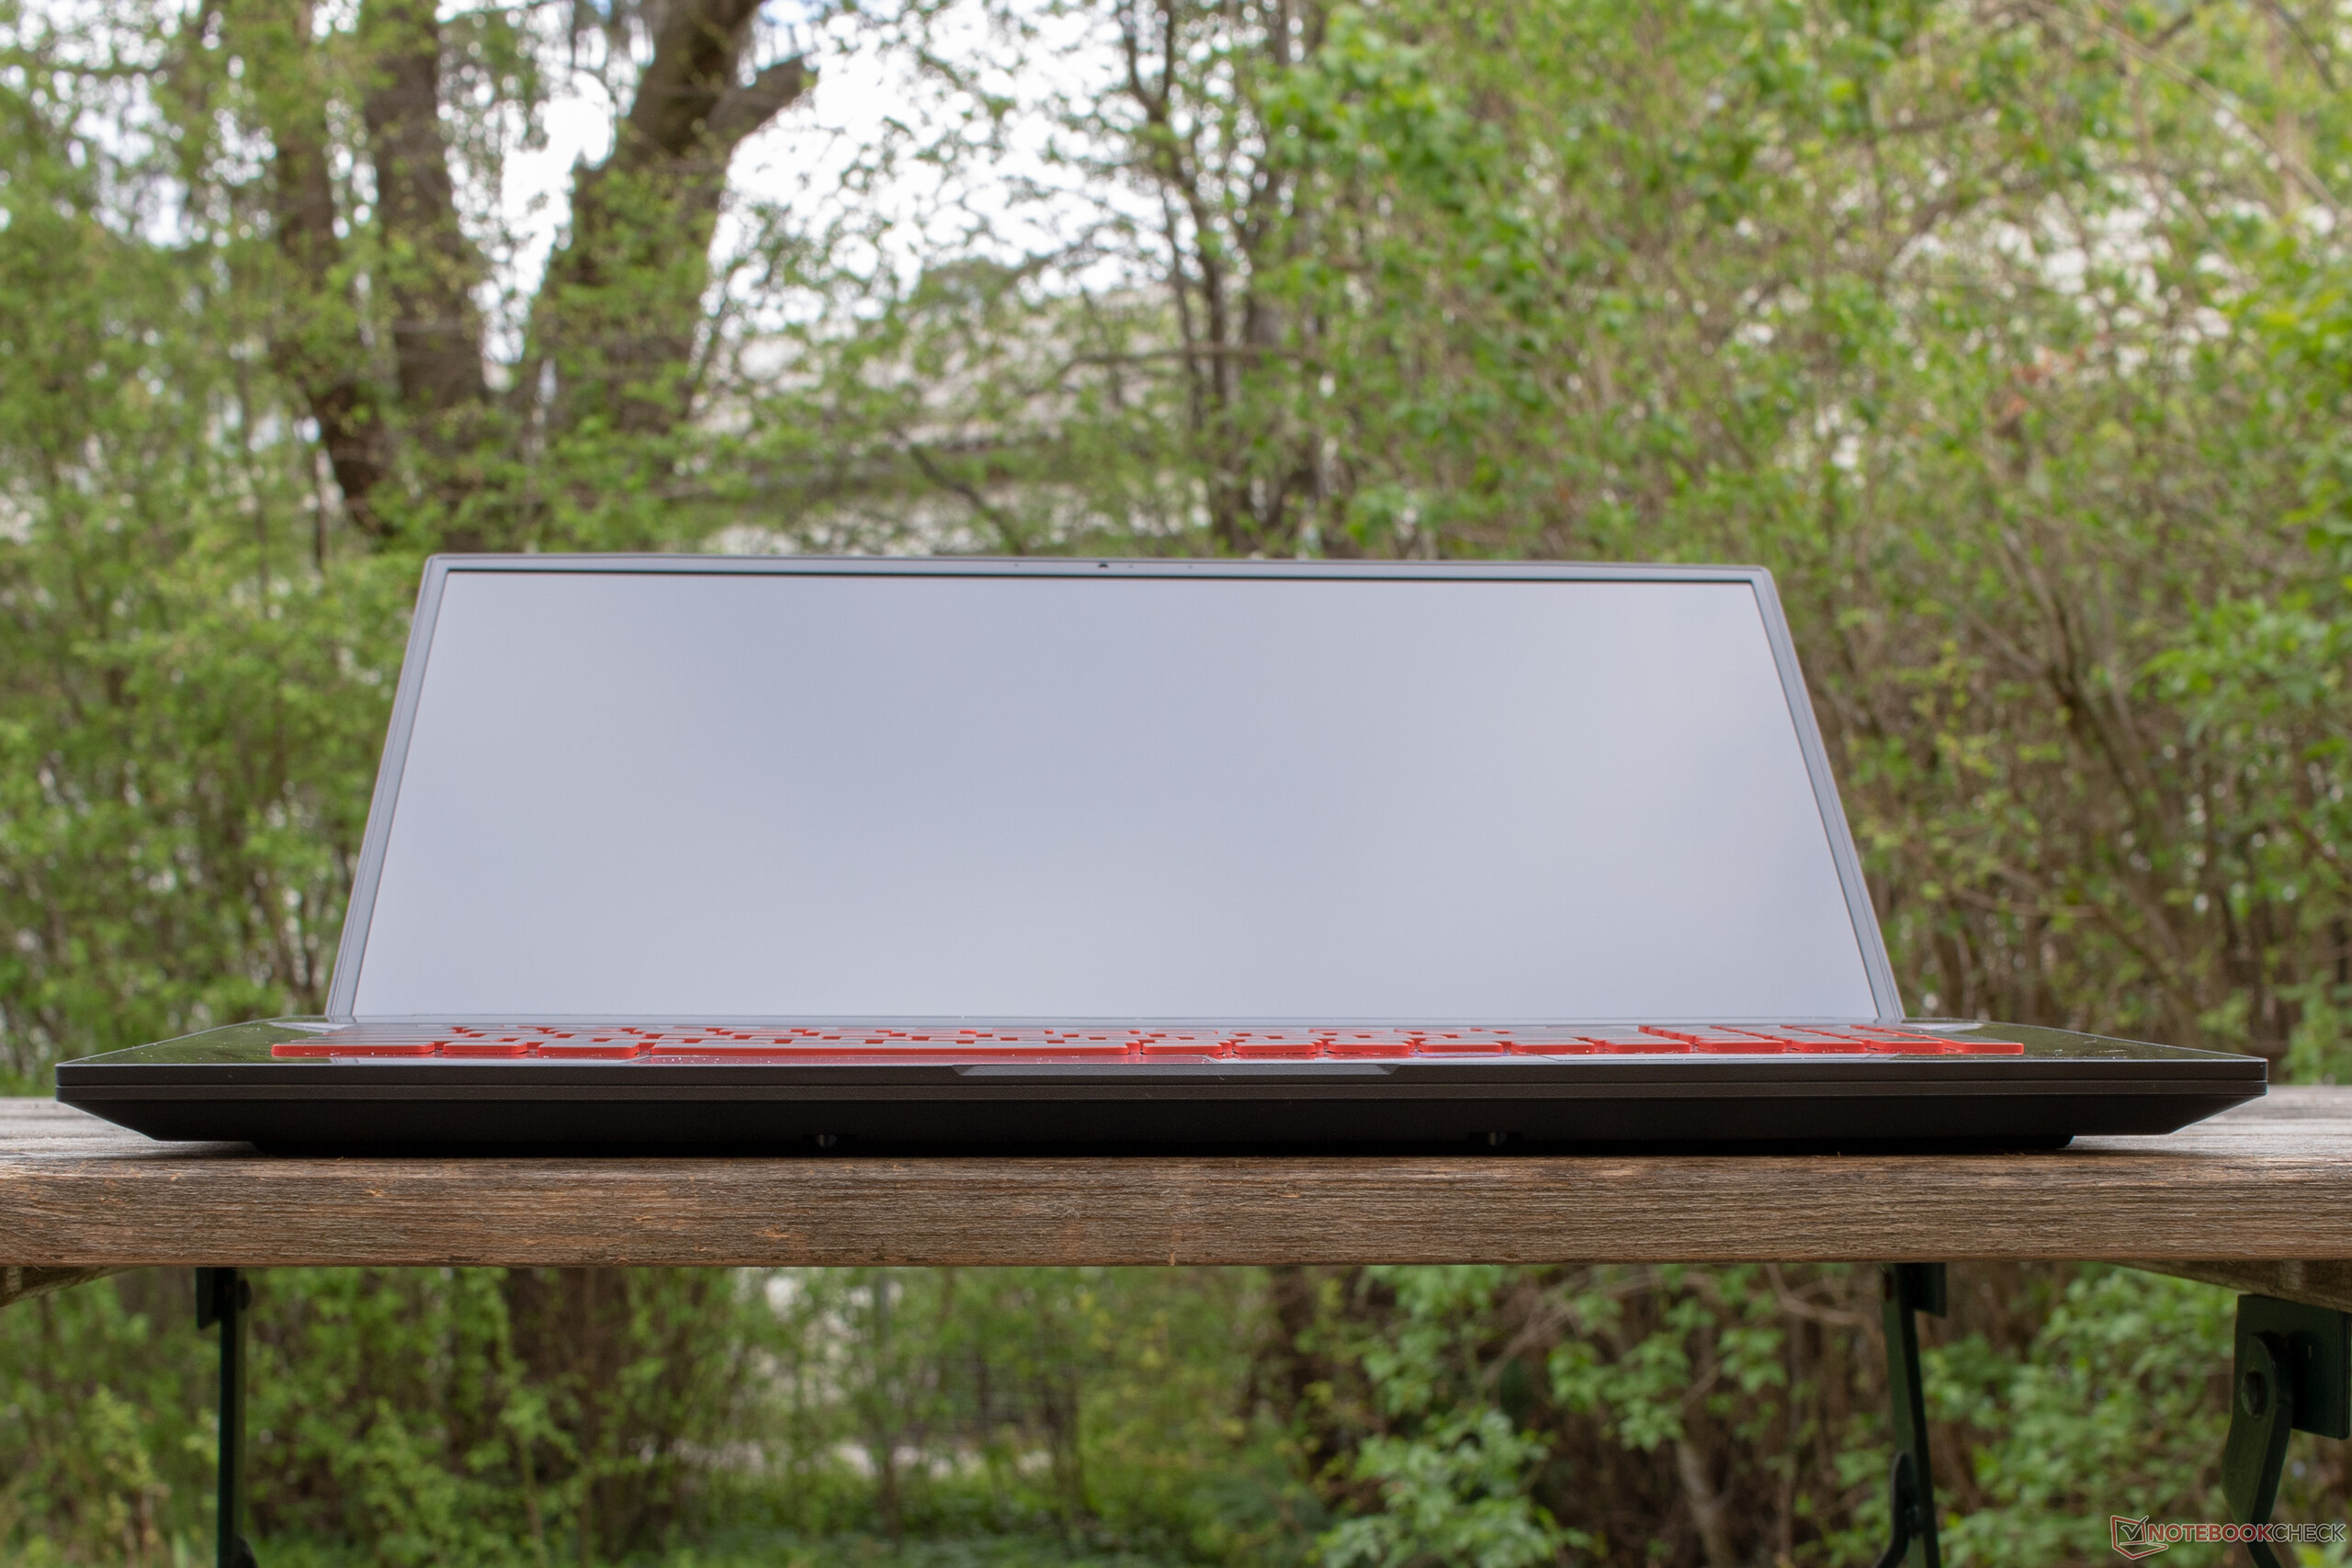
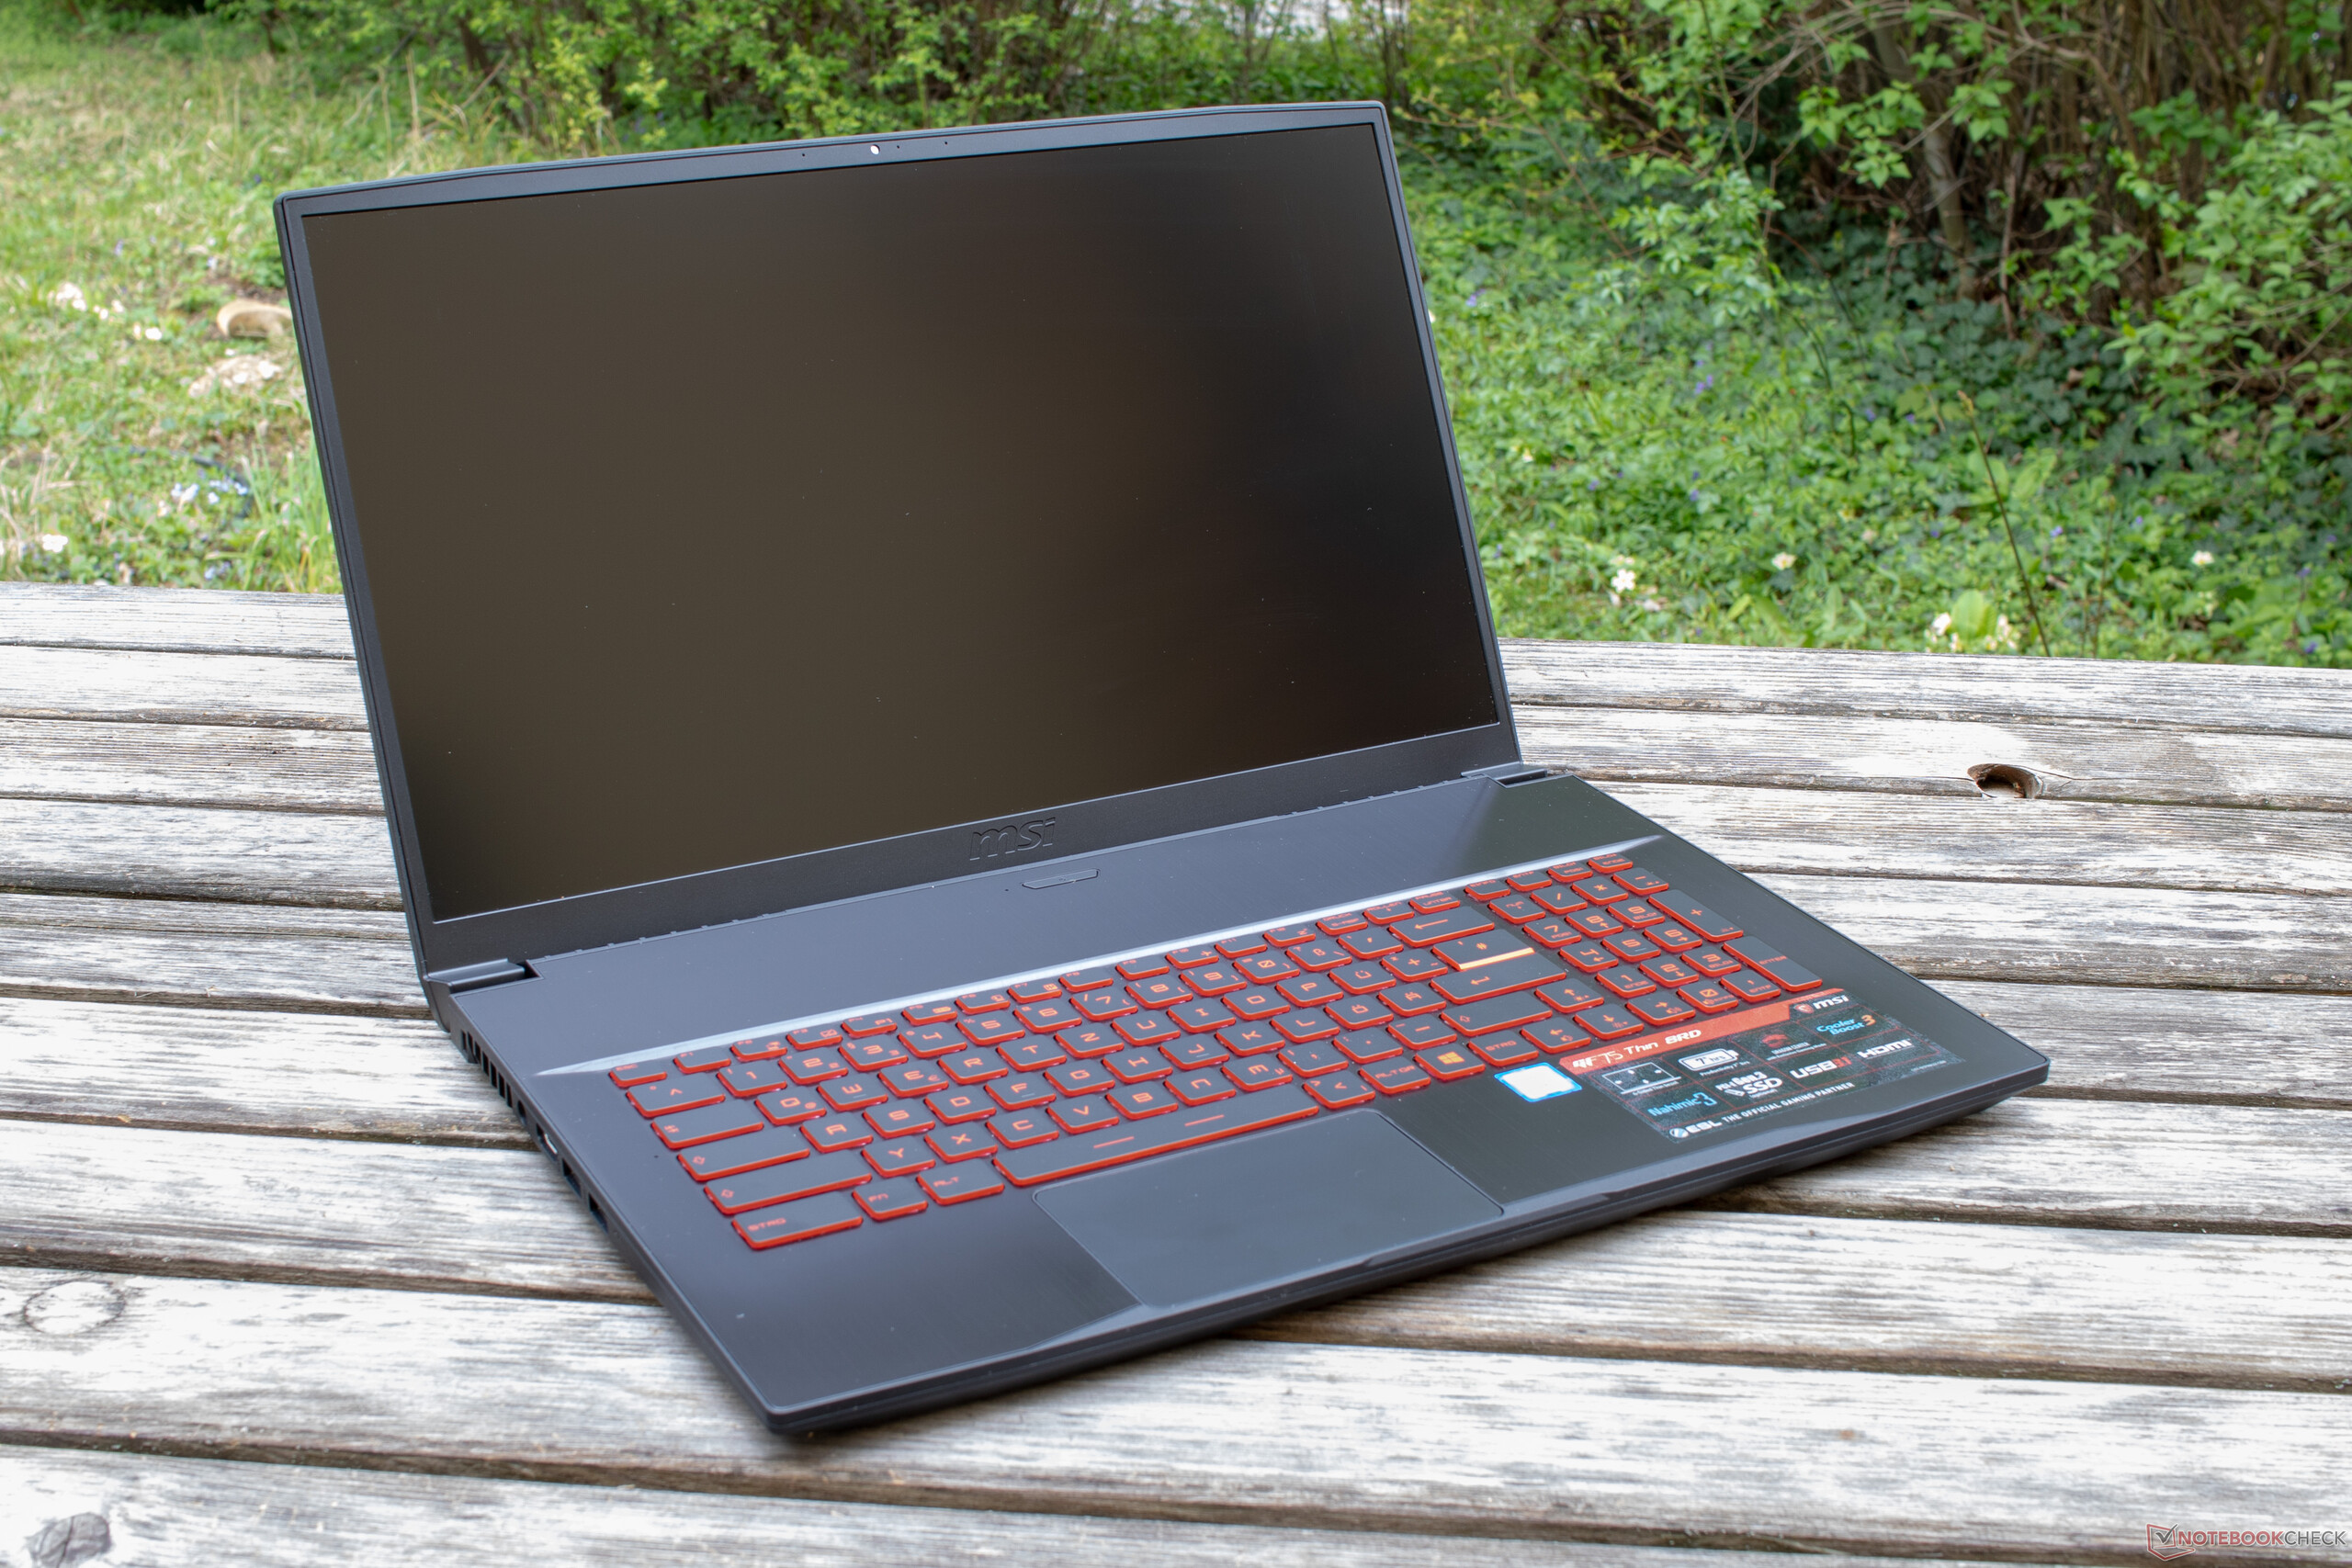
But not only its weight is worth mentioning. The MSI GF75 Thin also really lives up to its name with a height of 23.2 mm (~0.9 in). Only the Lenovo Legion at 21.95 millimeters (~0.86 in) is slightly thinner than our test unit. However, the Lenovo is significantly more solid and stable and appears to be of higher quality than the MSI. This is where the reduced weight has its drawbacks. The GF75 gives way easily around the ventilation slots above the keyboard and generally does not give the impression of being very solid. We also noted some creaking in several areas.
Connectivity - MSI makes cuts
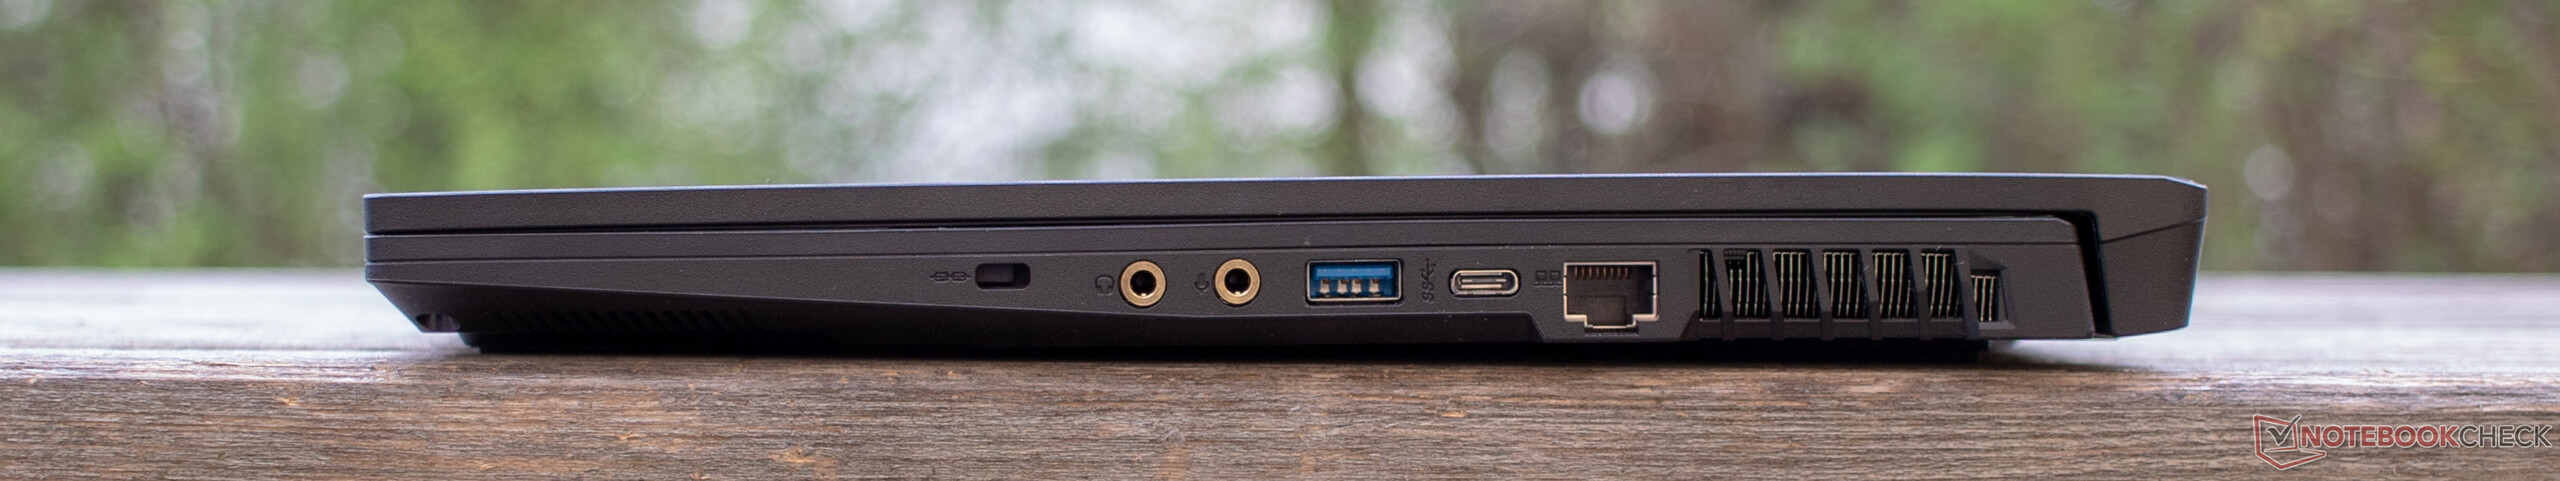
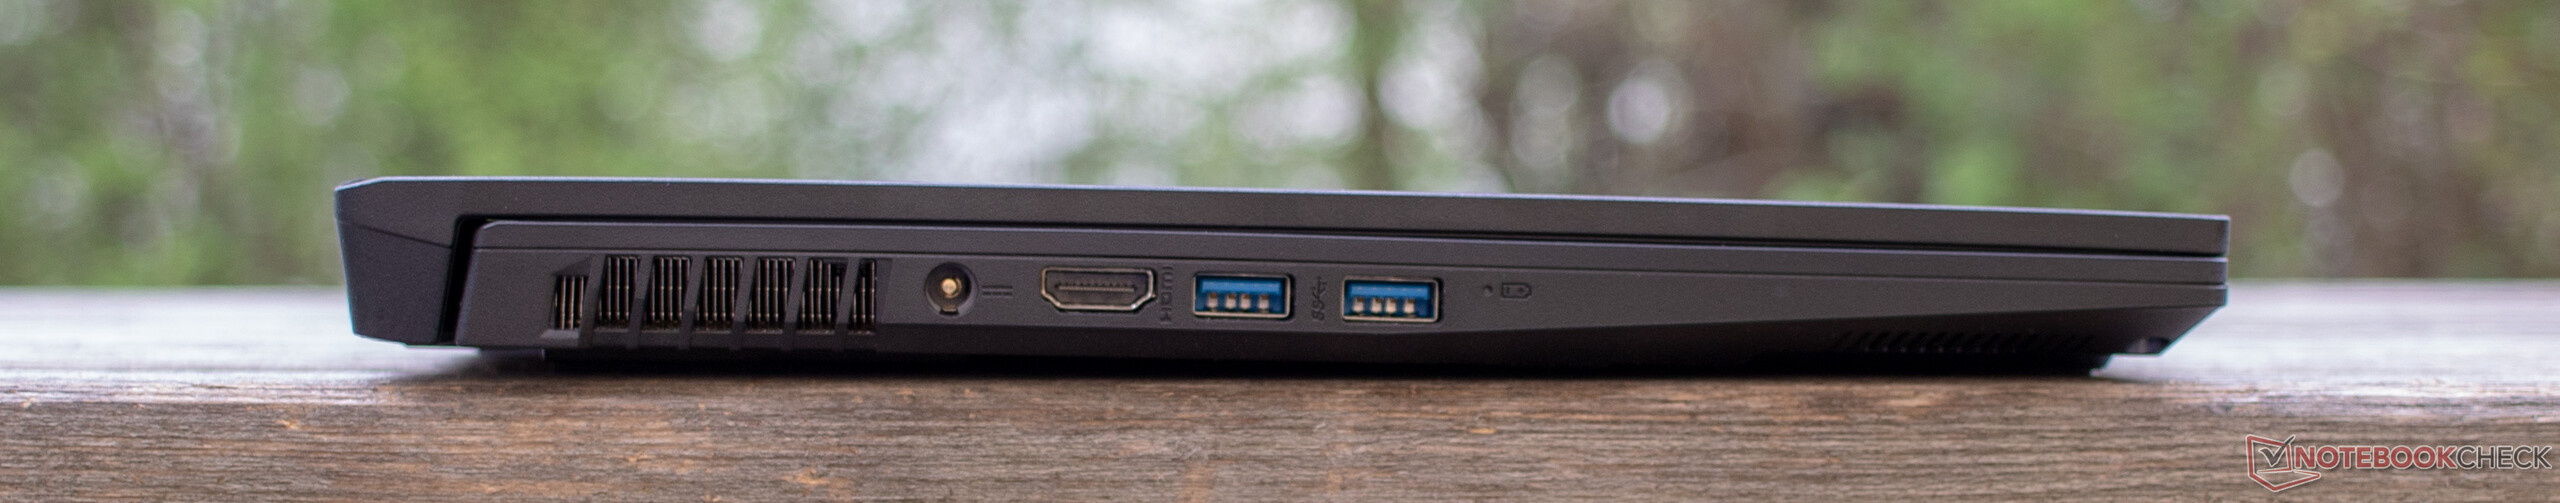
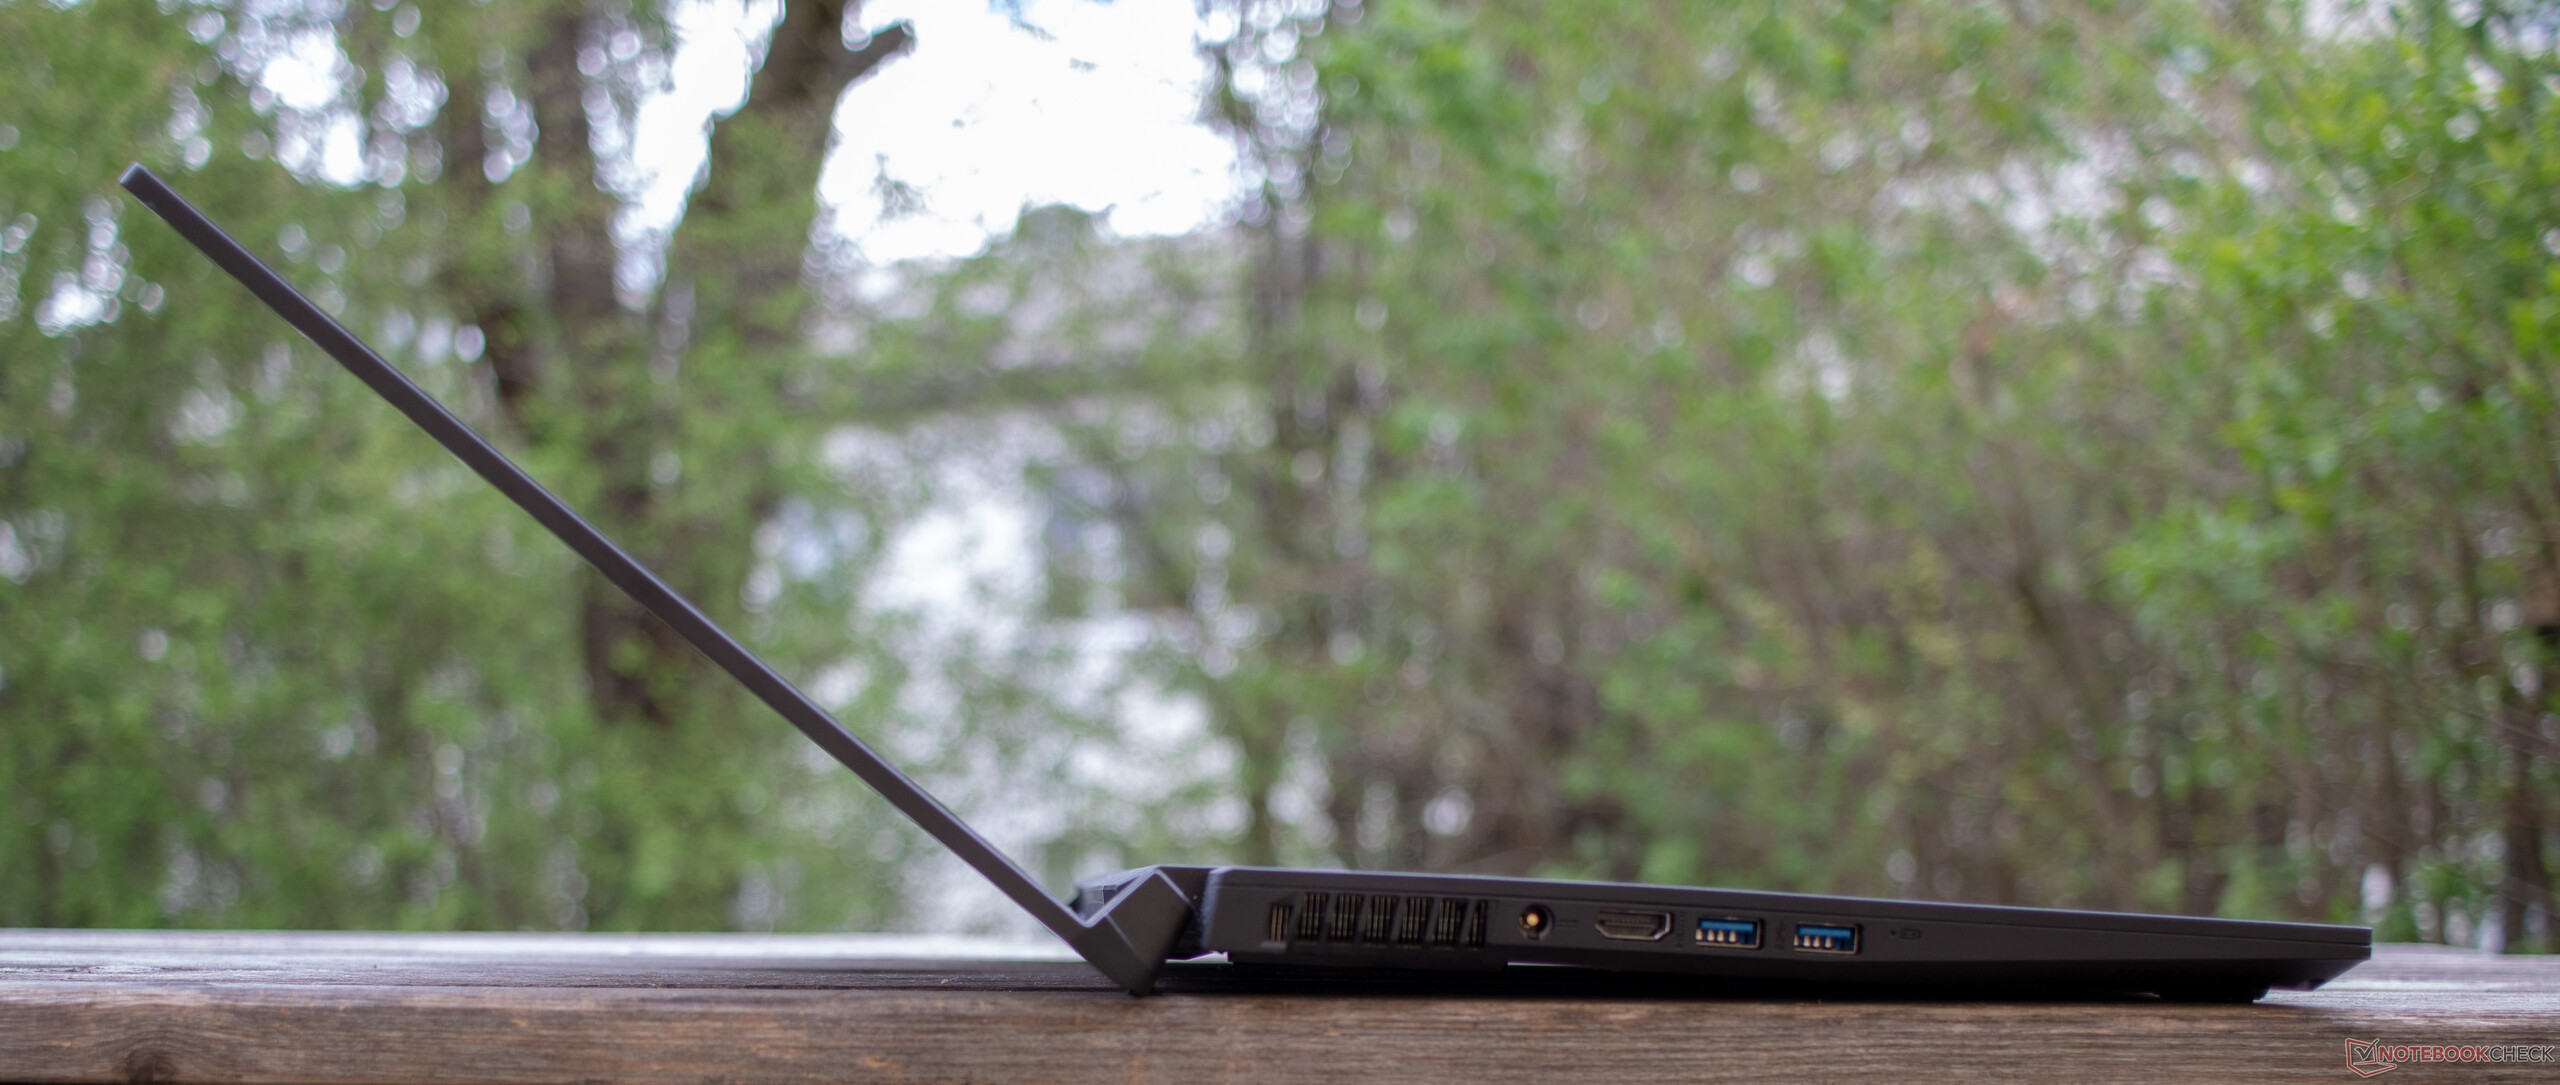
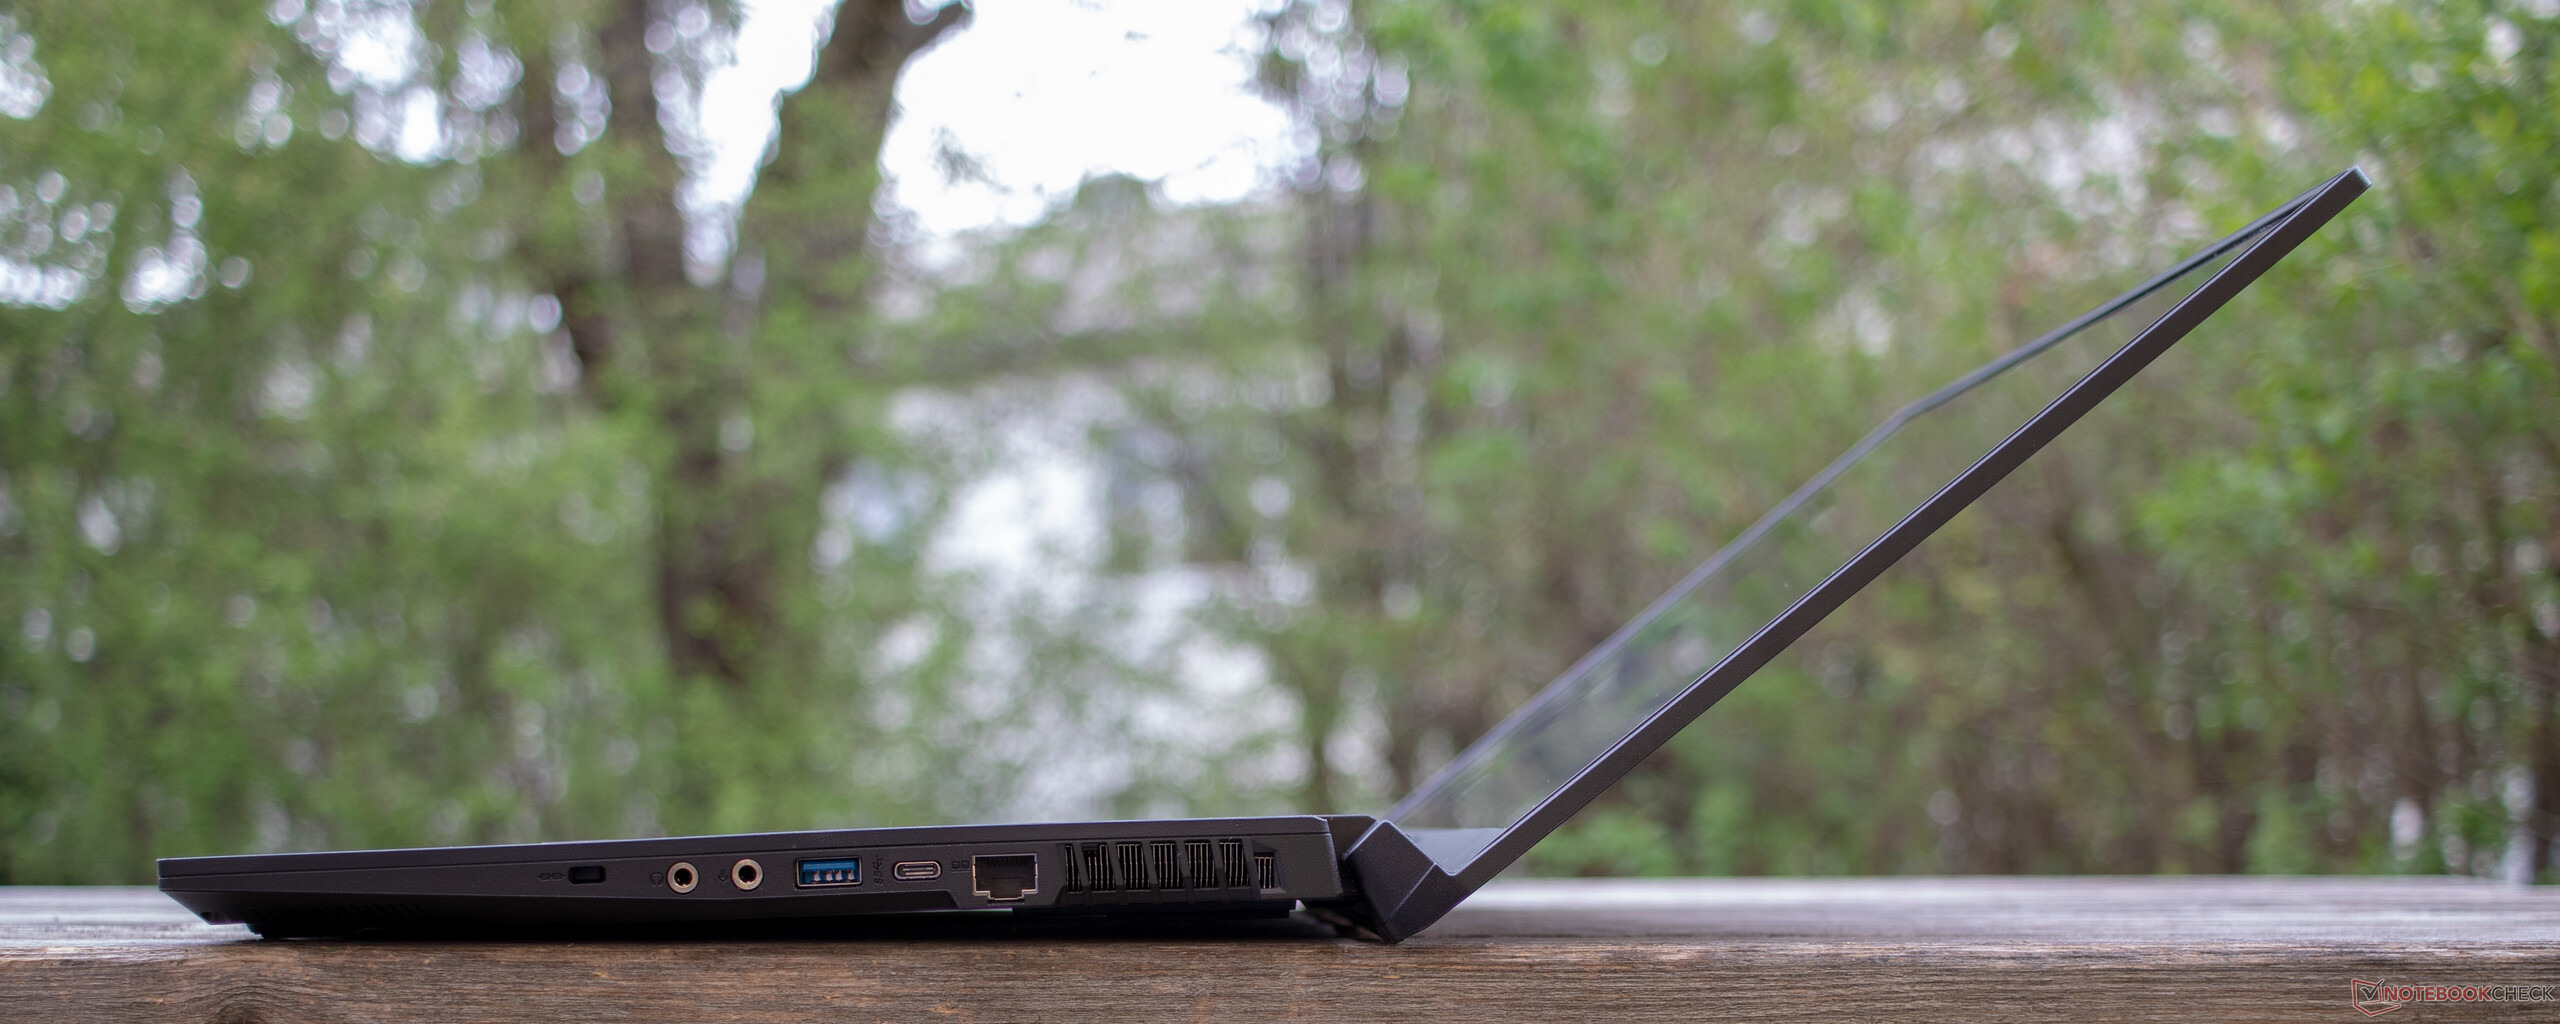
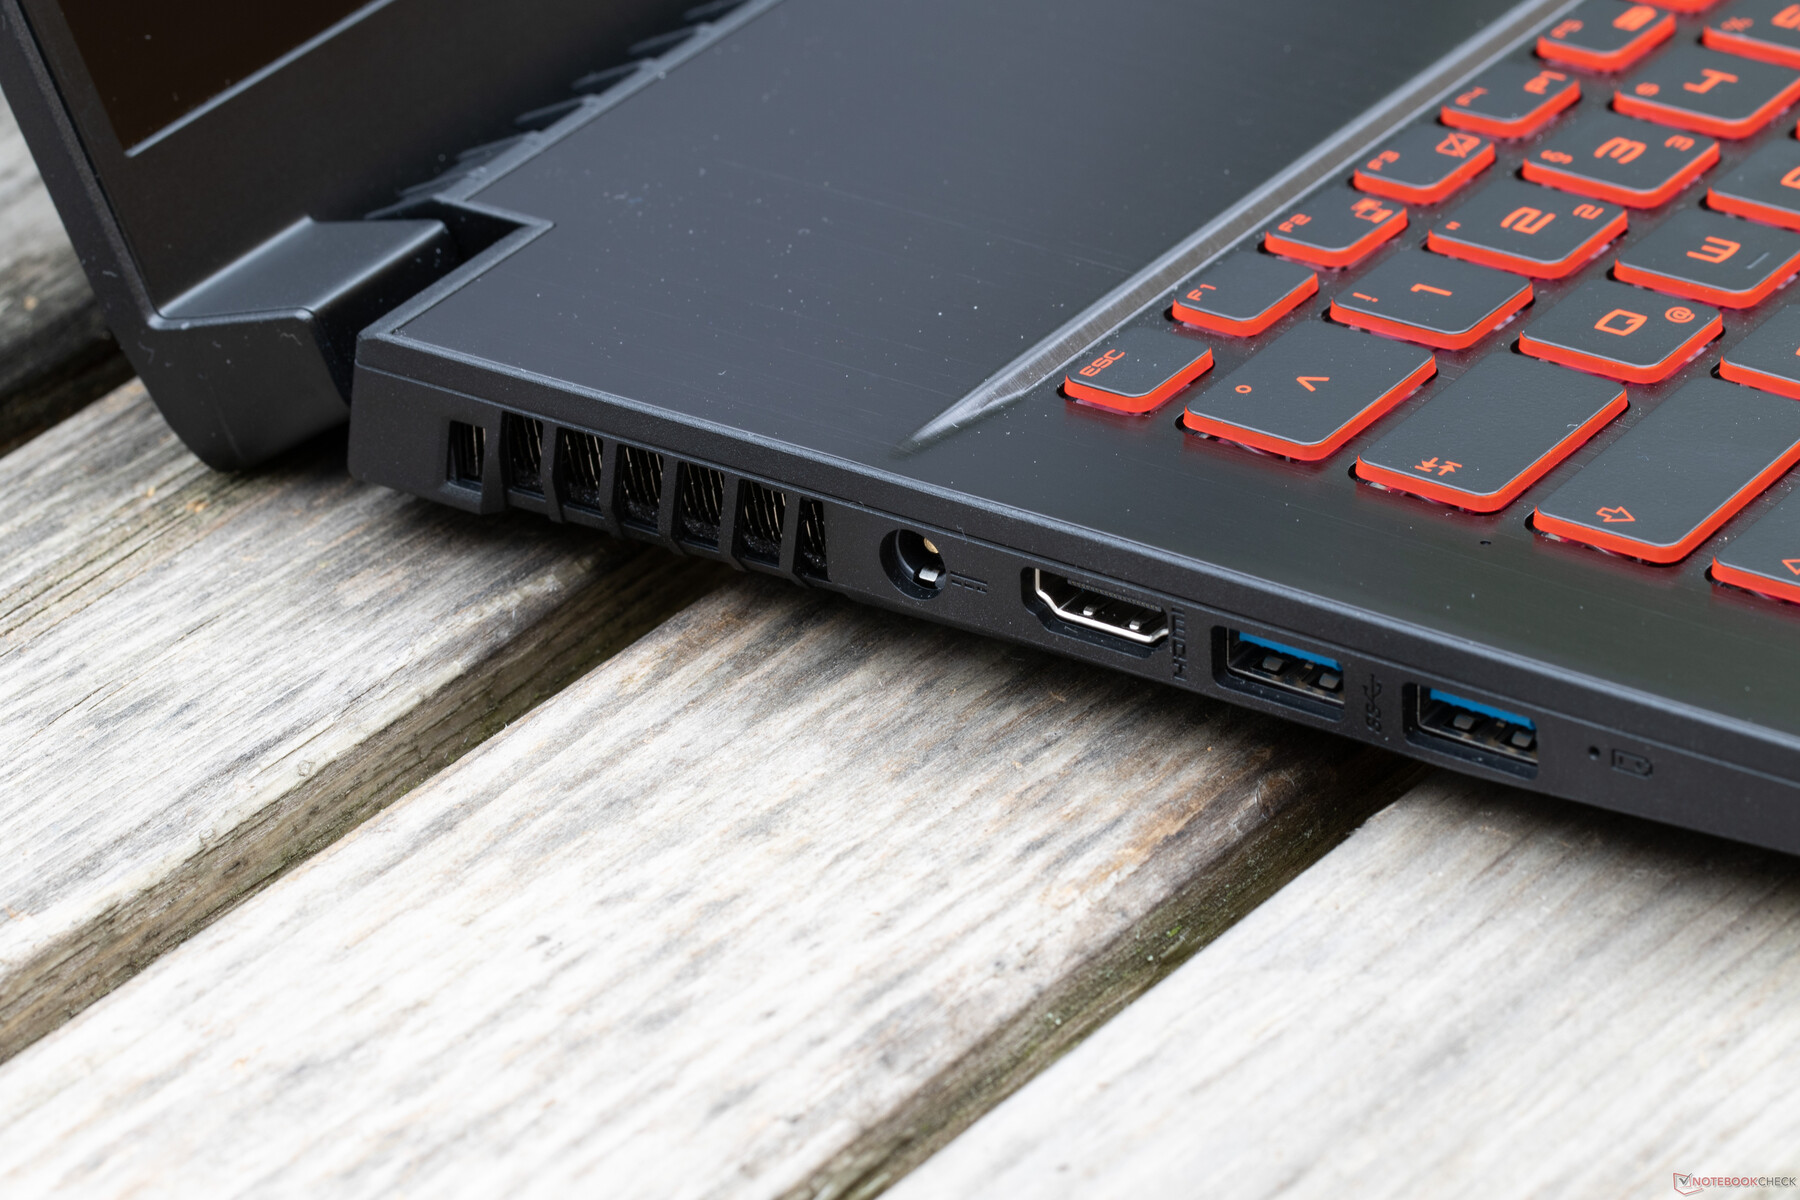
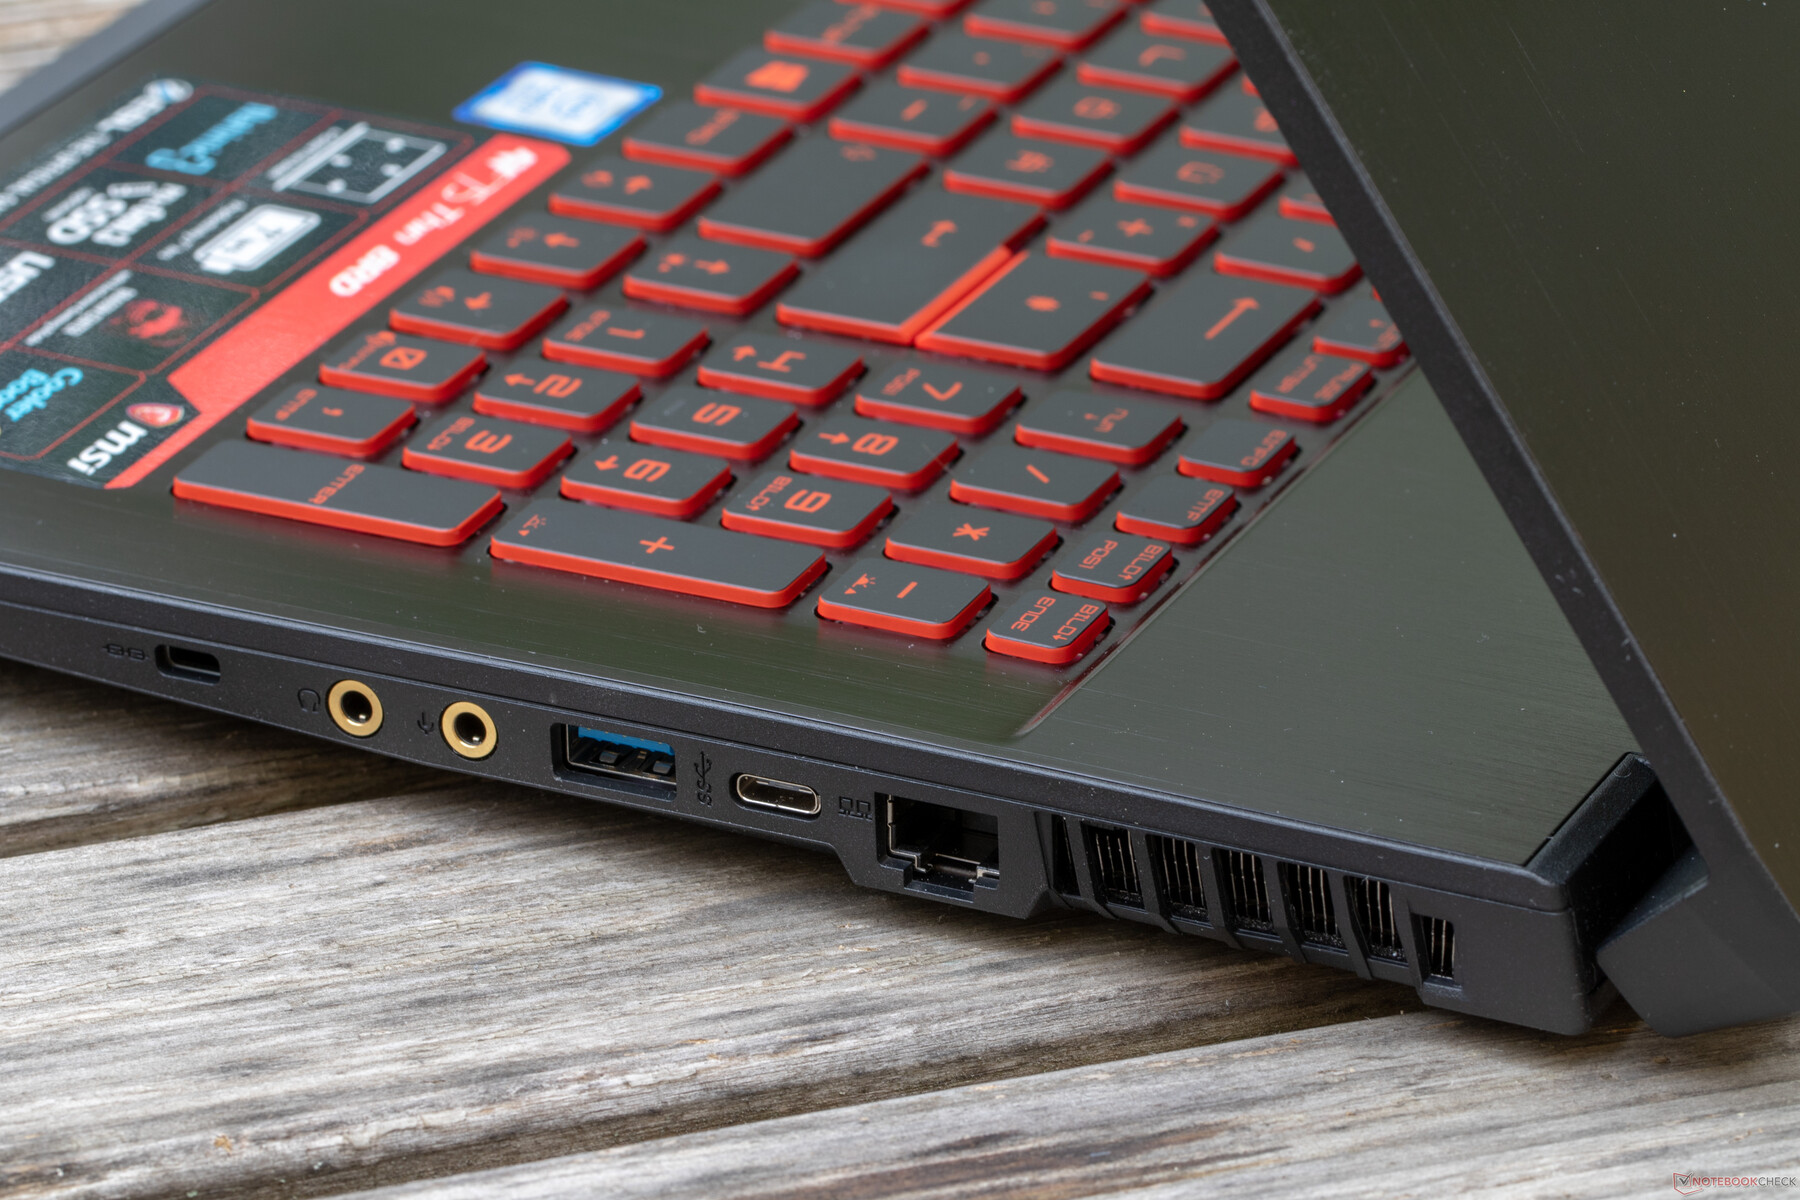
Our test unit offers the absolute minimum of necessary ports. The left side harbors the connector for the 135-watt AC adapter, an HDMI port and two Type-A USB 3.1 Gen 1 ports. The right side has another USB port with the same specifications, a Type-C USB 3.1 Gen 1 port, an ethernet connector, a Kensington Lock and individual connectors for microphone and speakers. The USB Type-C port can be used to recharge other devices with 3A when connected to an external power supply and with 1.5A when running on battery. MSI did not include a thunderbolt port nor is there an SD card reader.
Communication
The MSI GF75 offers a Wi-Fi module and an ethernet port, which suits its intended use as a gaming device. Based on the results of our Wi-Fi speed test, we would recommend gamers to use the RJ-45 port - not just because of the better ping, but also because of the slow Wi-Fi speeds. The GF75 only reaches about 40-50% of the speed other gamers can offer both when receiving data (average of 292 Mbit/s) and when sending (317 Mbit/s).
| Networking | |
| iperf3 transmit AX12 | |
| HP Pavilion Gaming 15-cx0003ng | |
| Asus TUF FX705GE-EW096T | |
| Medion Erazer P6705-MD61131 | |
| Acer Aspire 7 A715-72G-704Q | |
| Lenovo Legion Y730-17ICH, i7-8750H | |
| MSI GF75 8RD-001 | |
| iperf3 receive AX12 | |
| Medion Erazer P6705-MD61131 | |
| Asus TUF FX705GE-EW096T | |
| Lenovo Legion Y730-17ICH, i7-8750H | |
| HP Pavilion Gaming 15-cx0003ng | |
| Acer Aspire 7 A715-72G-704Q | |
| MSI GF75 8RD-001 | |
Accessories
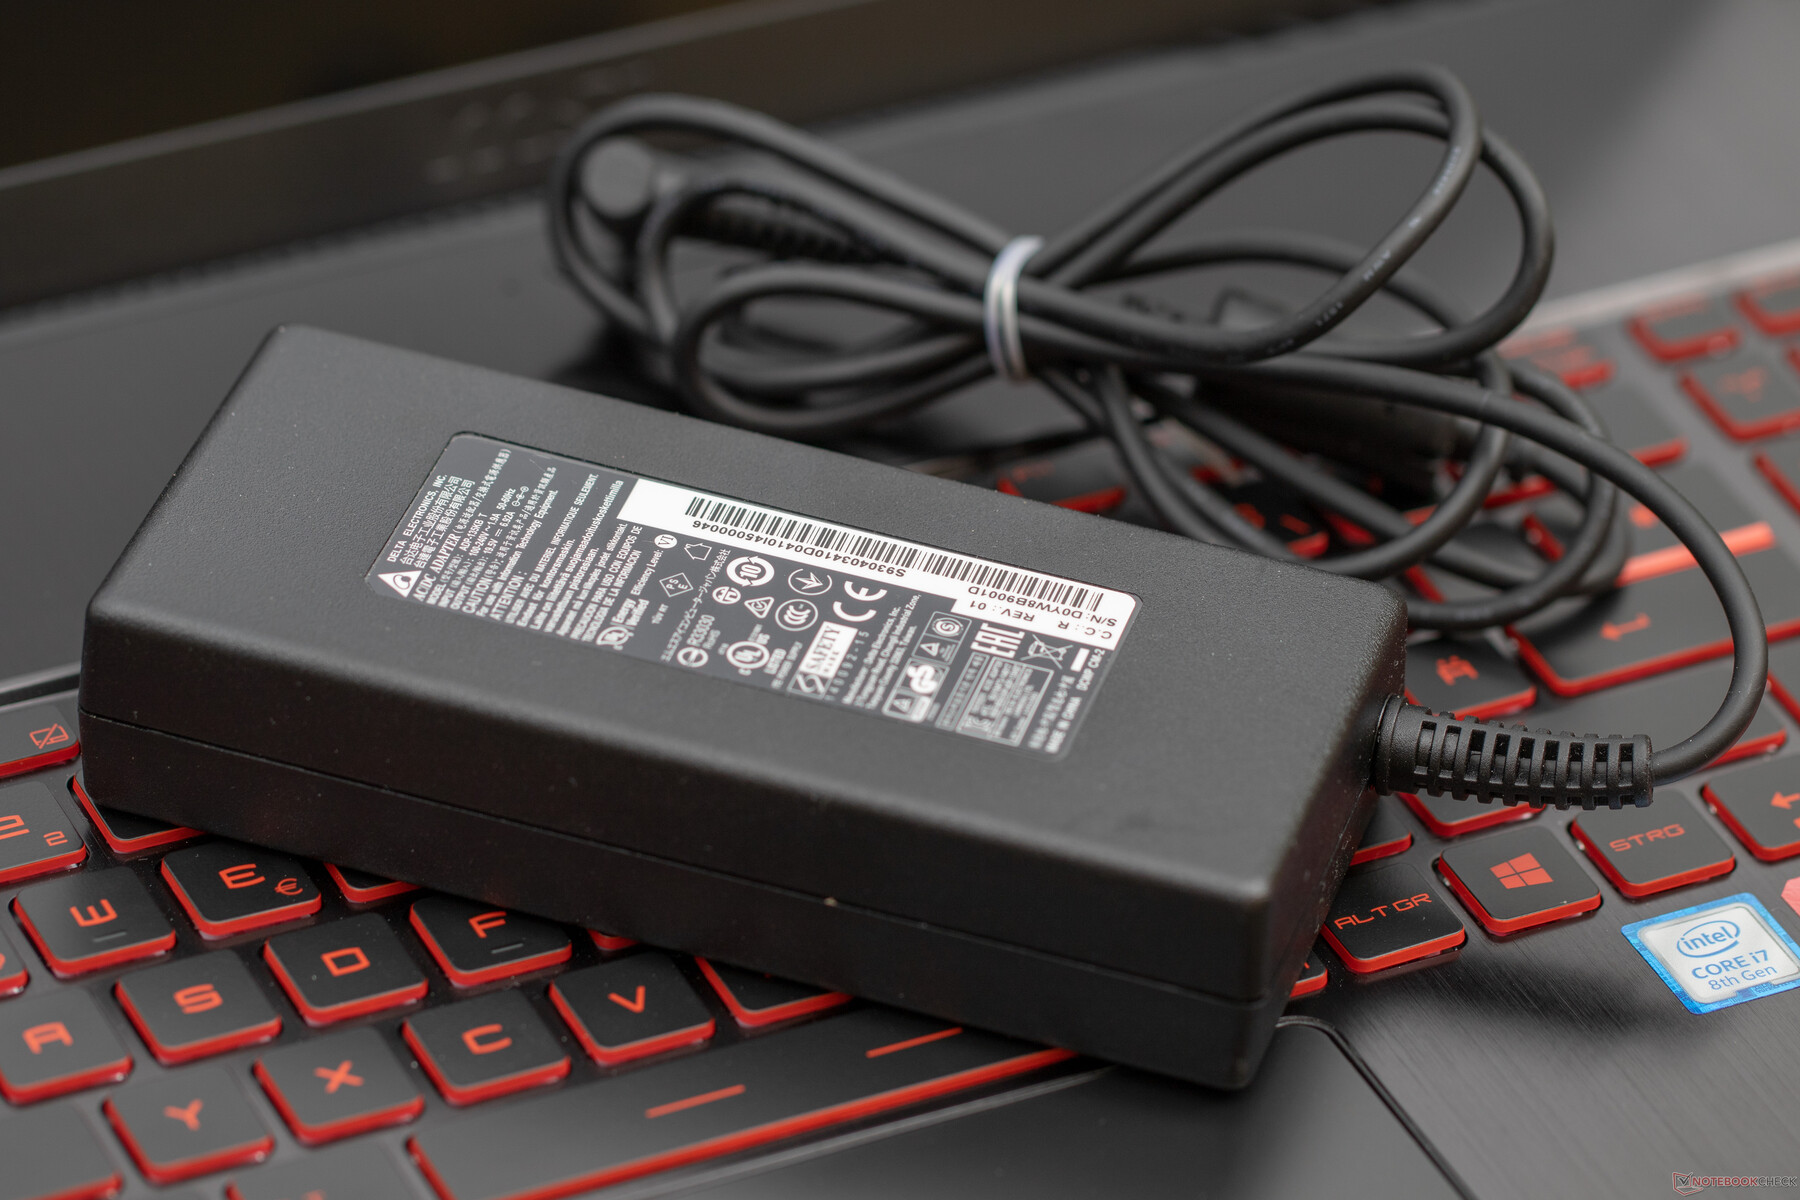
There are no accessories included with the GF75 apart from the 135-watt AC adapter, which weighs 445 grams (~15.7 oz).
Maintenance
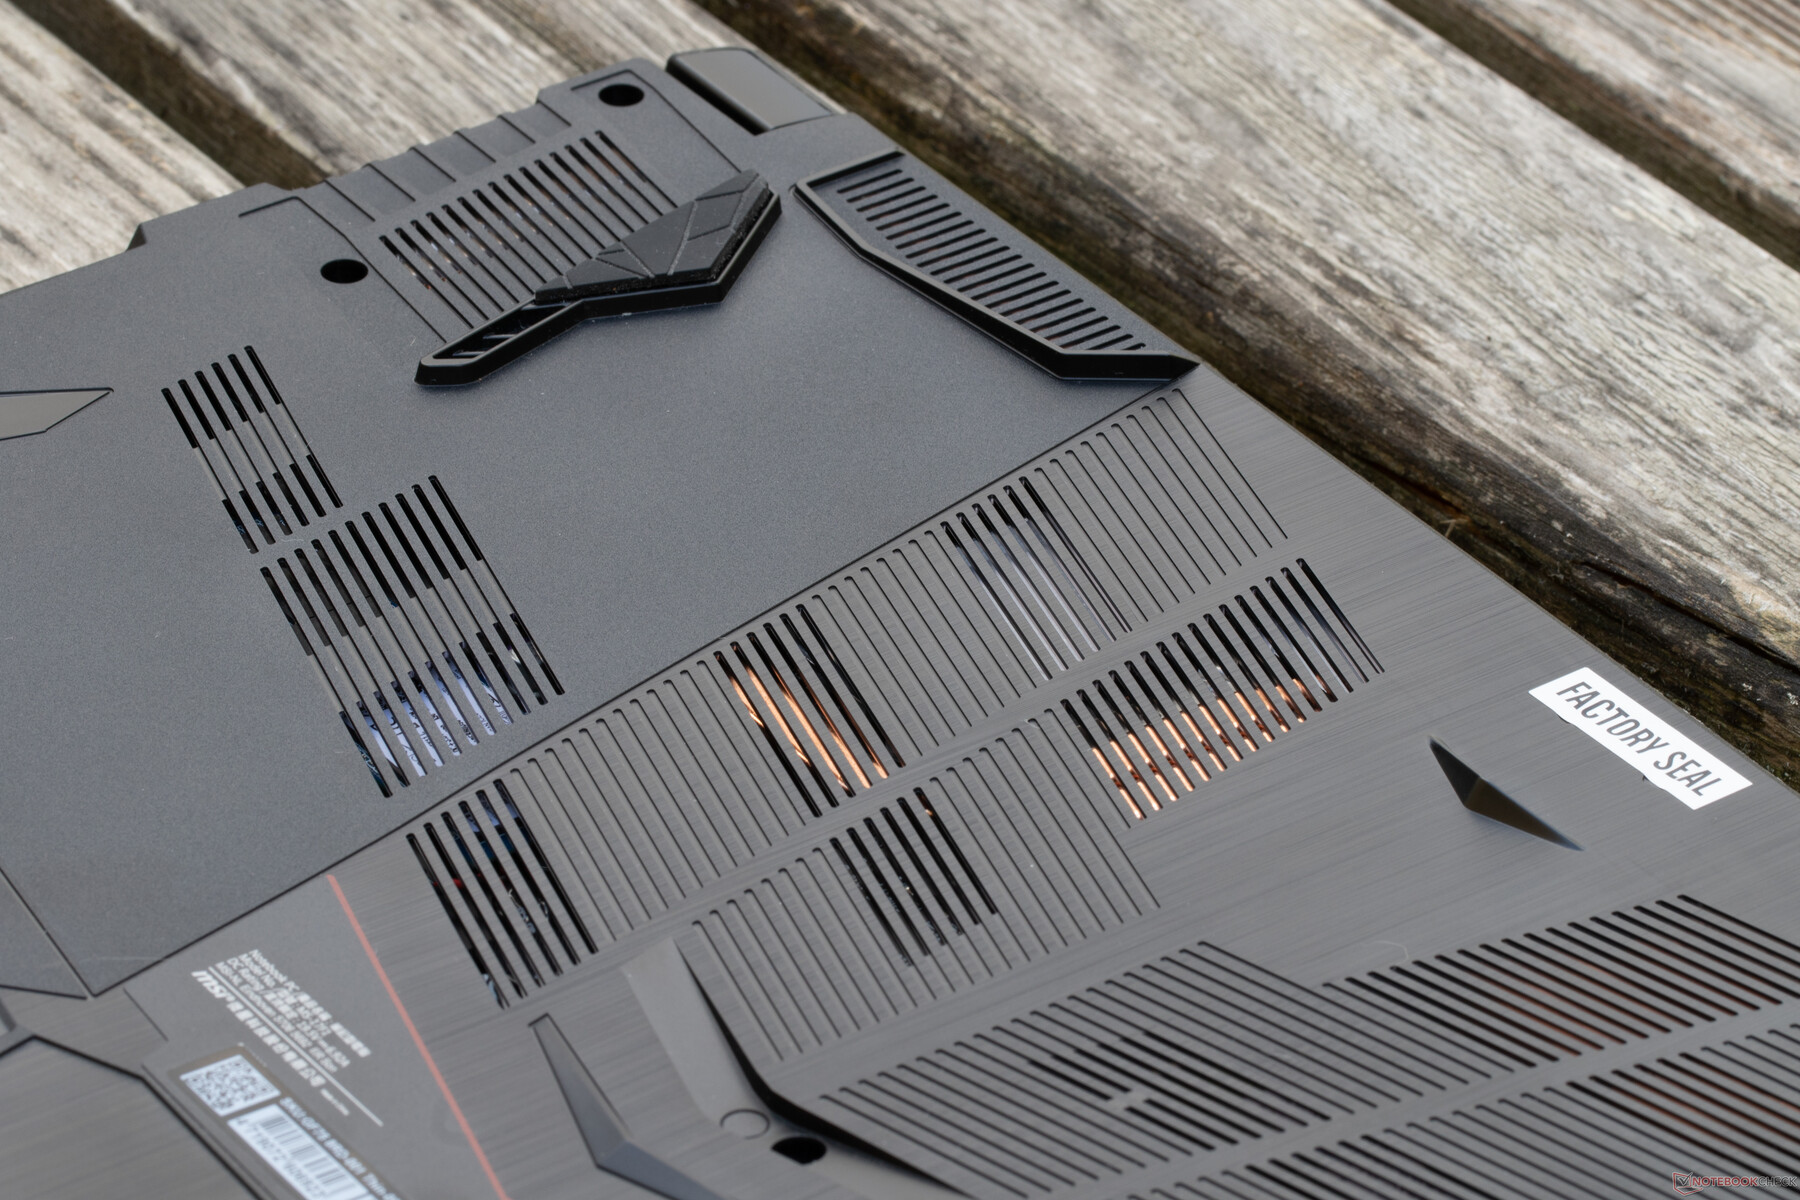
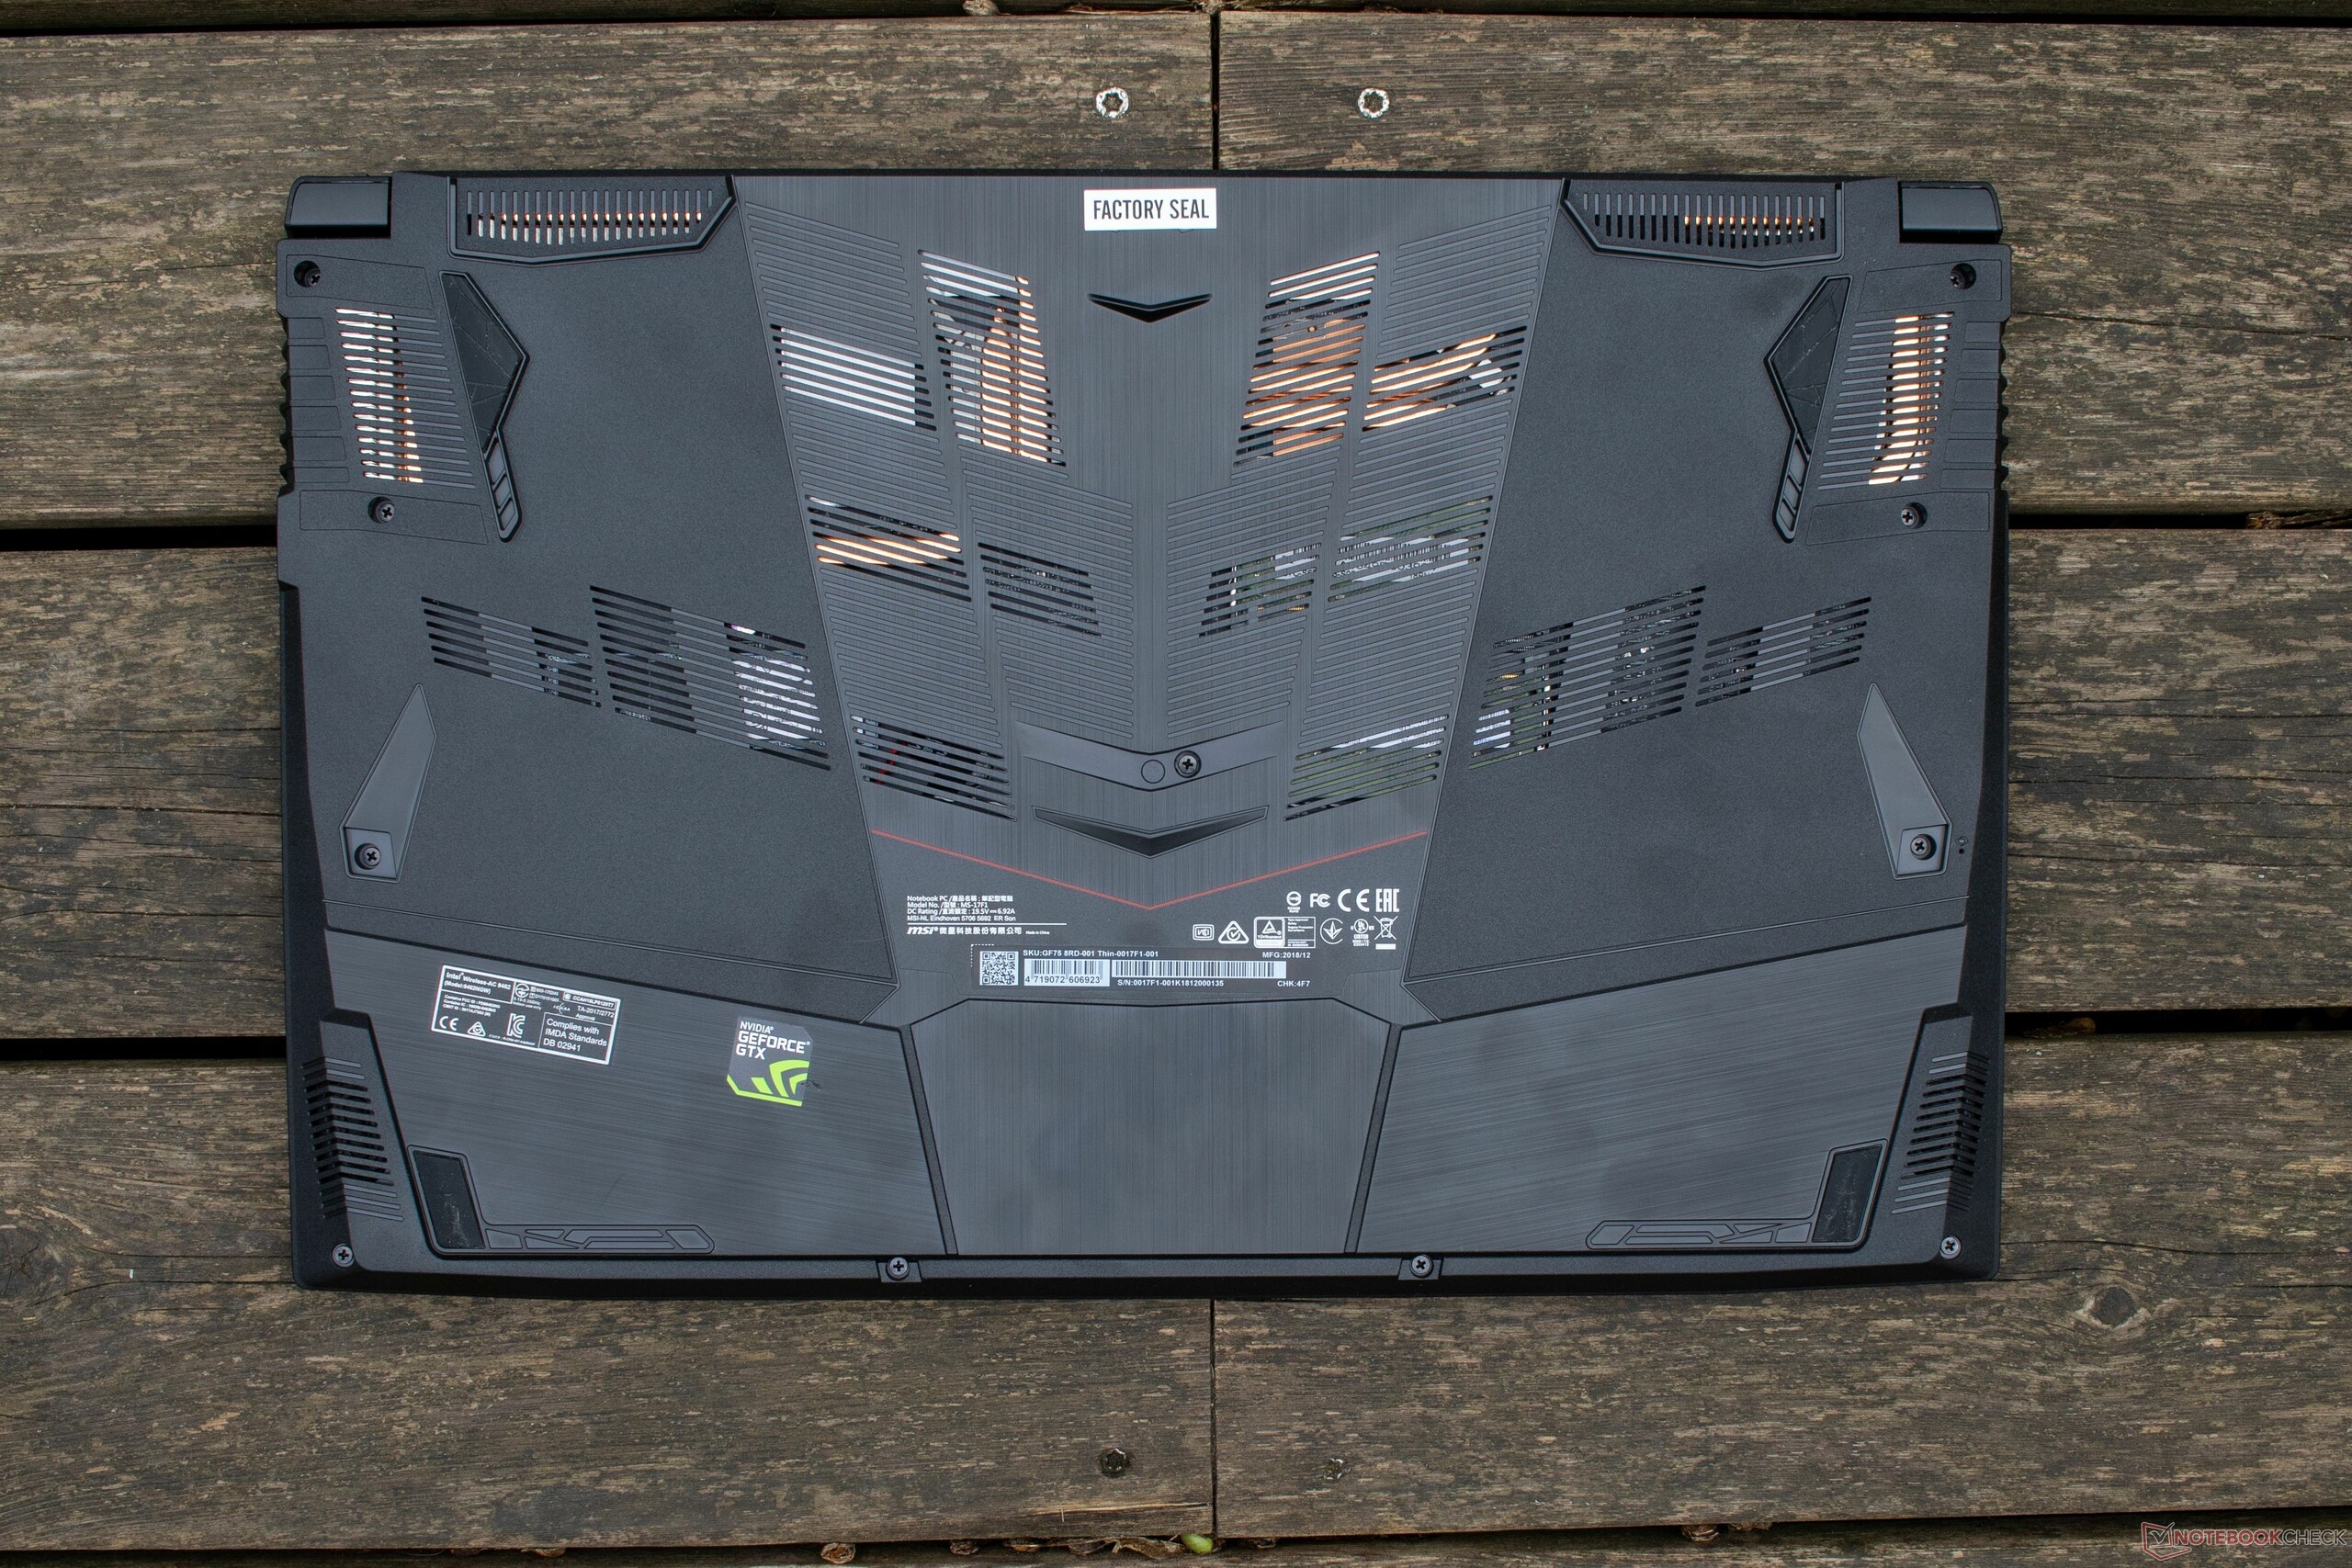
If users want to access the insides of the GF75, they will have to make do without dedicated maintenance hatches for components such as the SSD or RAM. Instead, the entire bottom plate has to be removed. This is secured to the base unit by screws. Once the bottom cover is removed, users can easily exchange both the M.2 SSD and the RAM.
Warranty
MSI offers a twelve-month warranty for the GR75. This can be extended by three months by registering the device on the MSI website.
Input Devices - red is the color for gamers
Keyboard
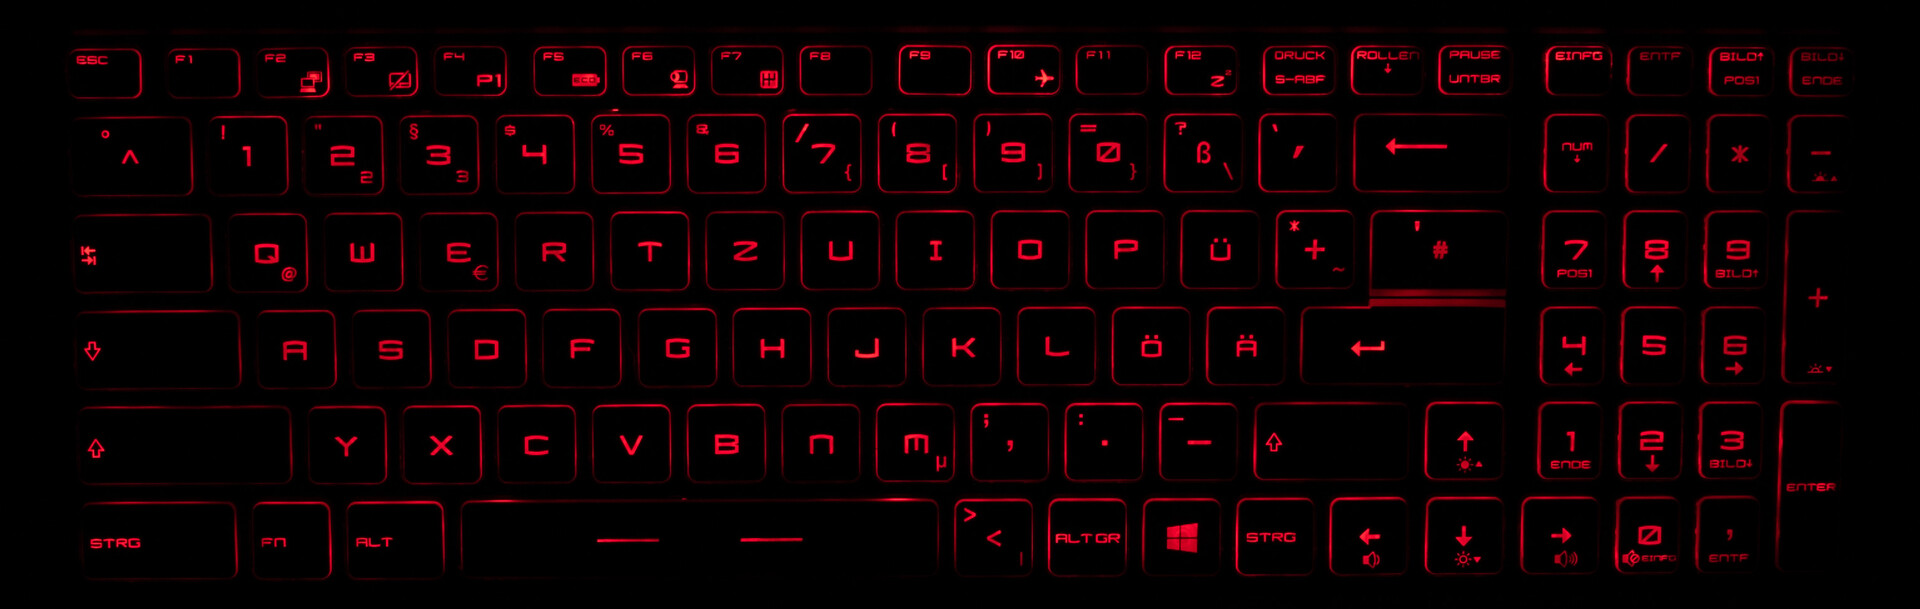
The keys are 15x15 mm (~0.6 x 0.6 in) large and have red backlighting. This offers three levels of brightness and can also be turned off entirely. The keyboard layout is typical for MSI with a single-row enter key and the Windows key on the right side. The shift keys are also smaller than usual. Typing is quite comfortable nonetheless, and only produces a minimal clatter. The black keys with red lettering are easily readable even with the backlighting turned off.
Touchpad
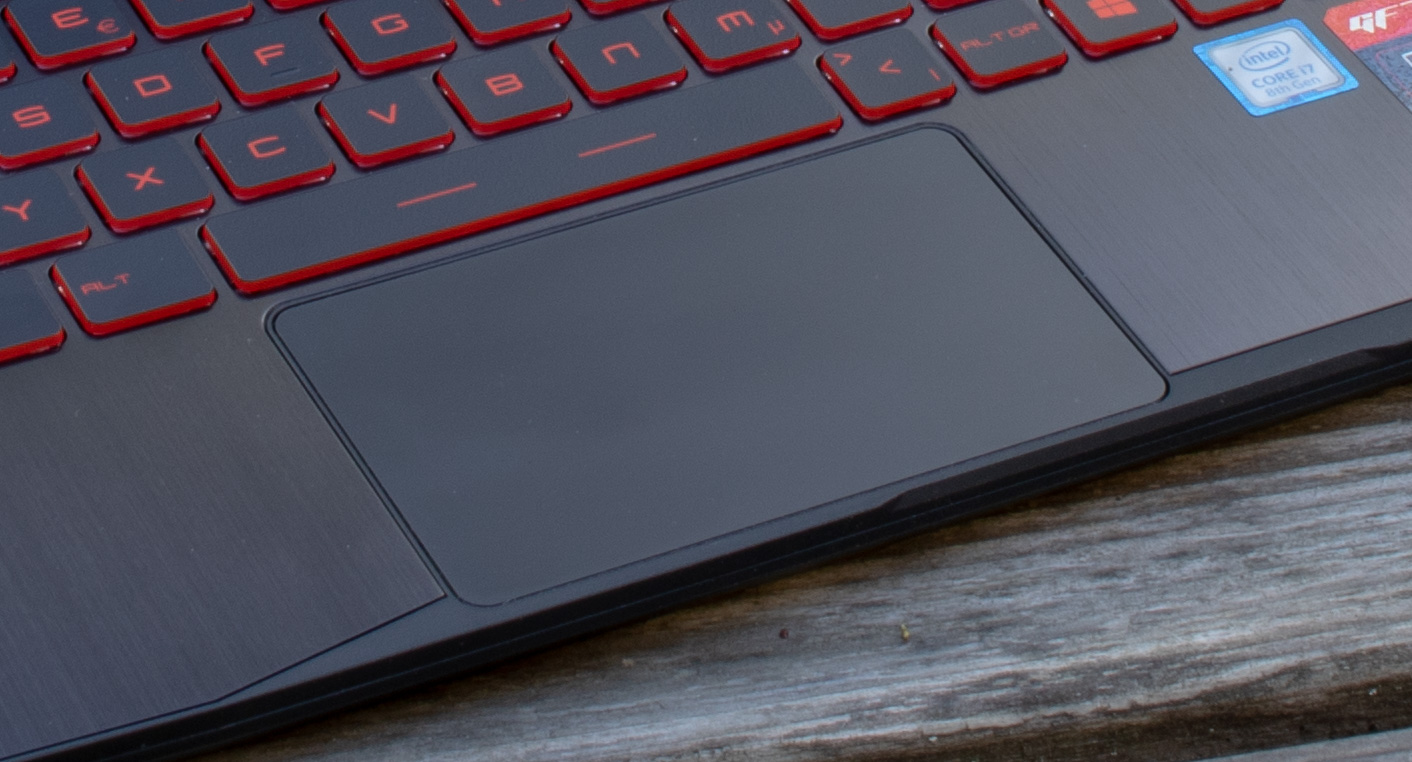
The matte black ClickPad feels very good and offers satisfactory gliding properties. It is about 10.5 x 6.5 cm (~4.1 x 2.56 in) large. We would like to mention that there is no free space above or below the ClickPad due to the keyboard being positioned further down than usual. The touch surface goes right up to the space bar and ends with the edge of the device at the bottom. This is not particularly bothersome, but is not ideal for making clicks. We had no issues with gesture control and scrolling.
Display - the GF75 does not miss a trick
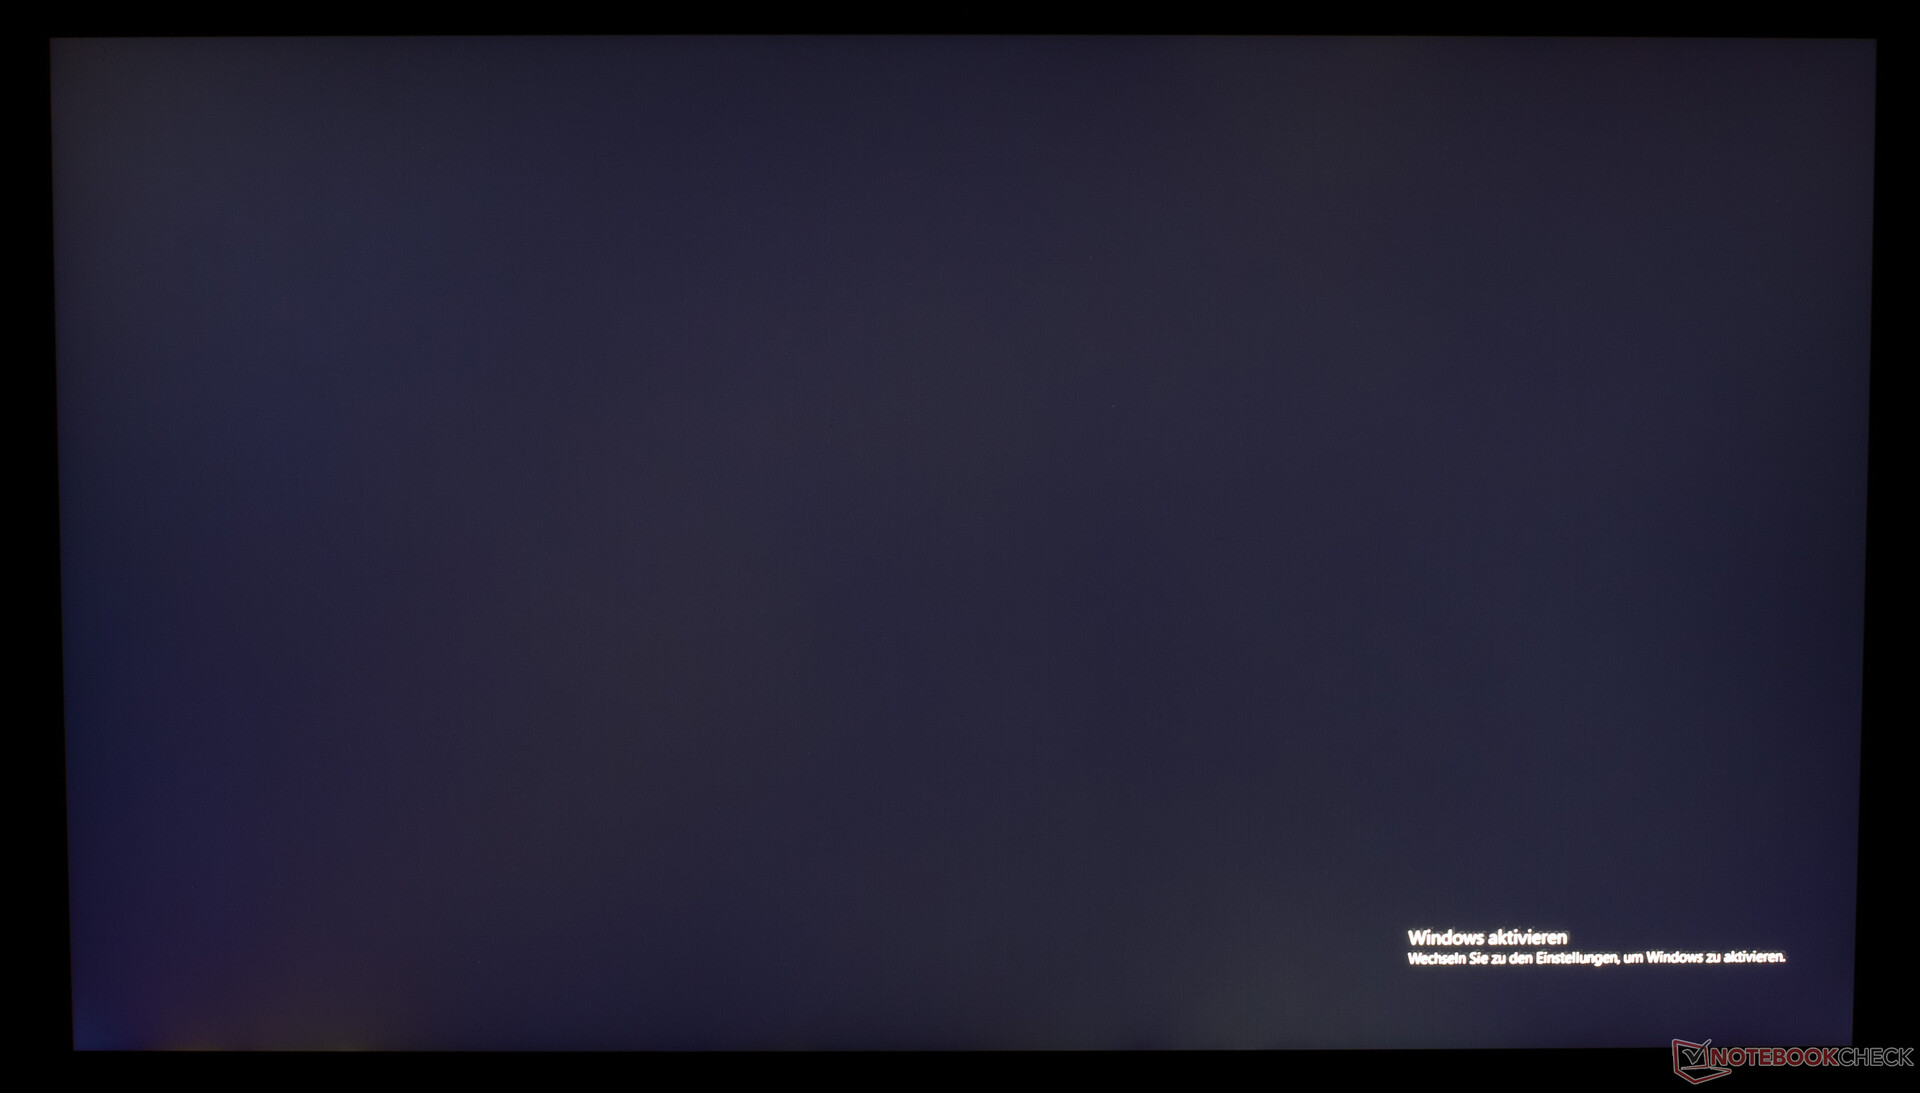
The display of the MSI GF75 is a matte 17.3-inch FHD from AU Optronics with the model number B173HAN04.2. The IPS panel is identical to the one in the Asus TUF FX705GE, although it is significantly brighter. The brightness at the center of the screen is great at 356 cd/m², the average brightness is 332 cd/m² with a brightness distribution of 89%. The black value is above average at 0.27 with a contrast ratio of 1319:1. Only the HP Pavilion Gaming 15 can offer a better black value (0.15) and contrast ratio (1607:1), but this device's screen lacks brightness, which cannot be said of our MSI.
| |||||||||||||||||||||||||
Brightness Distribution: 89 %
Center on Battery: 356 cd/m²
Contrast: 1319:1 (Black: 0.27 cd/m²)
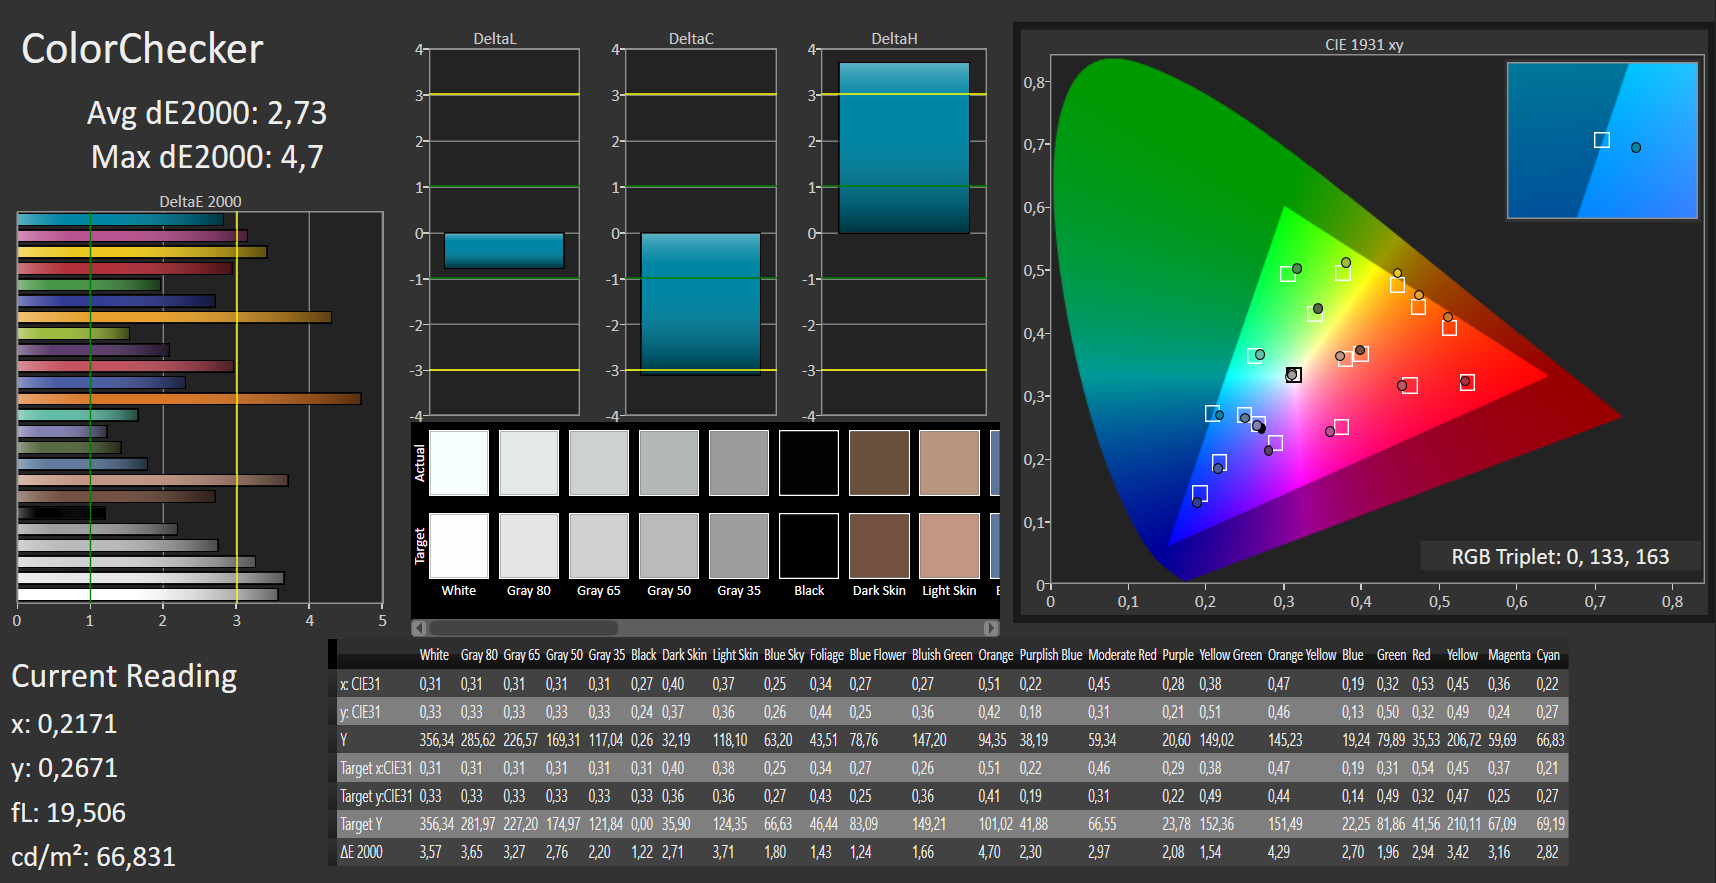
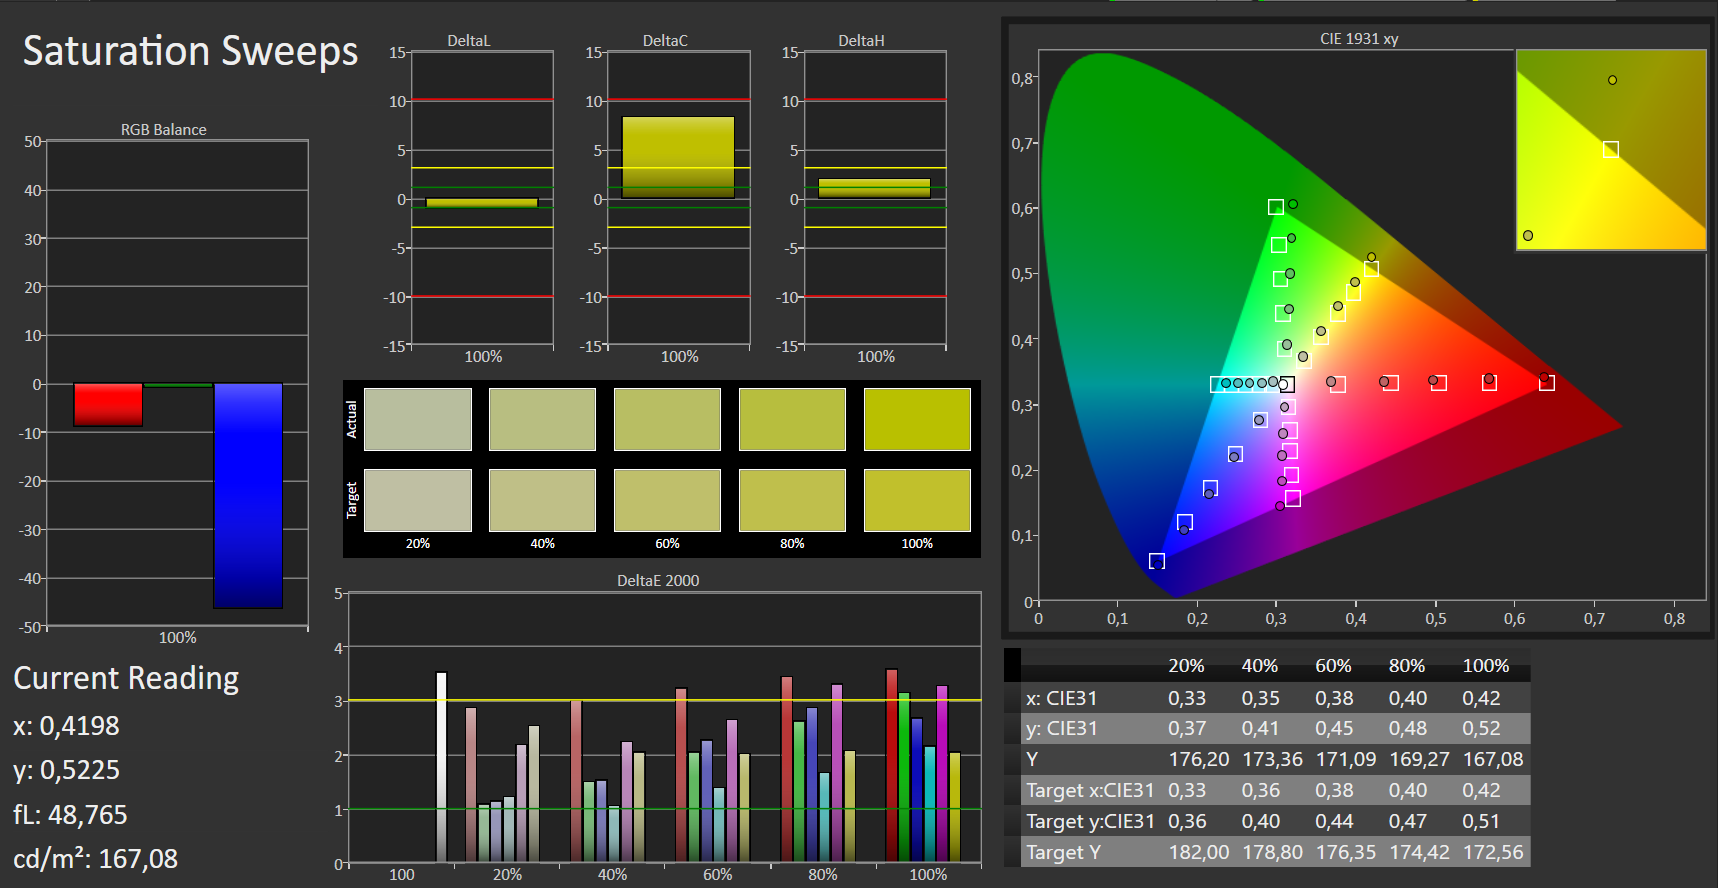
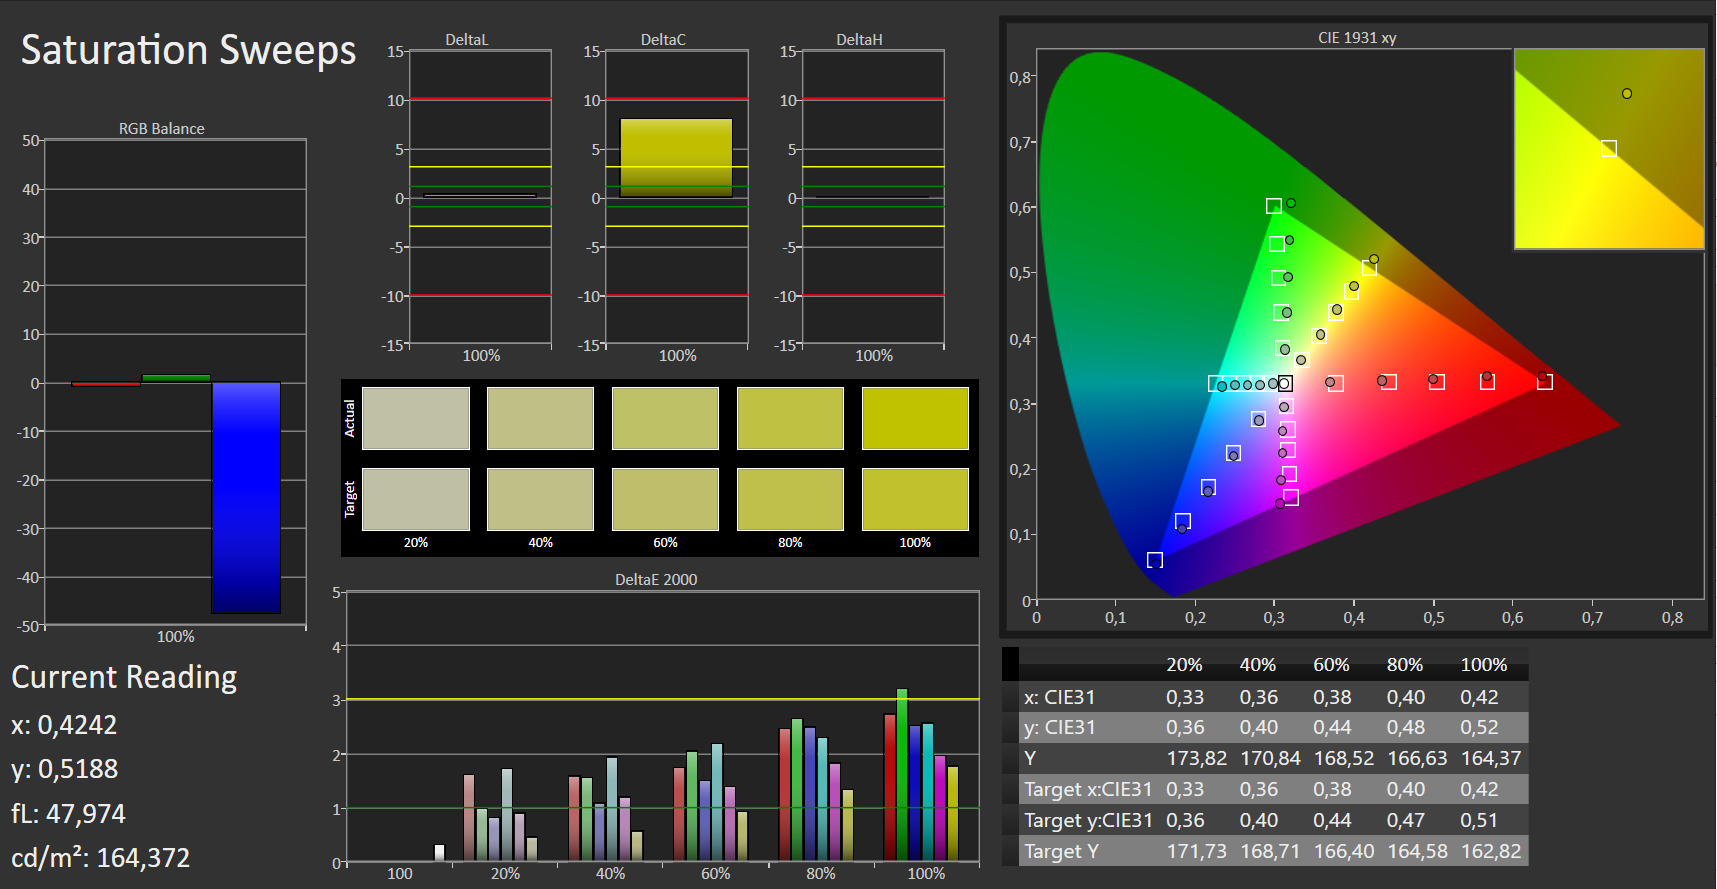
ΔE ColorChecker Calman: 2.73 | ∀{0.5-29.43 Ø4.73}
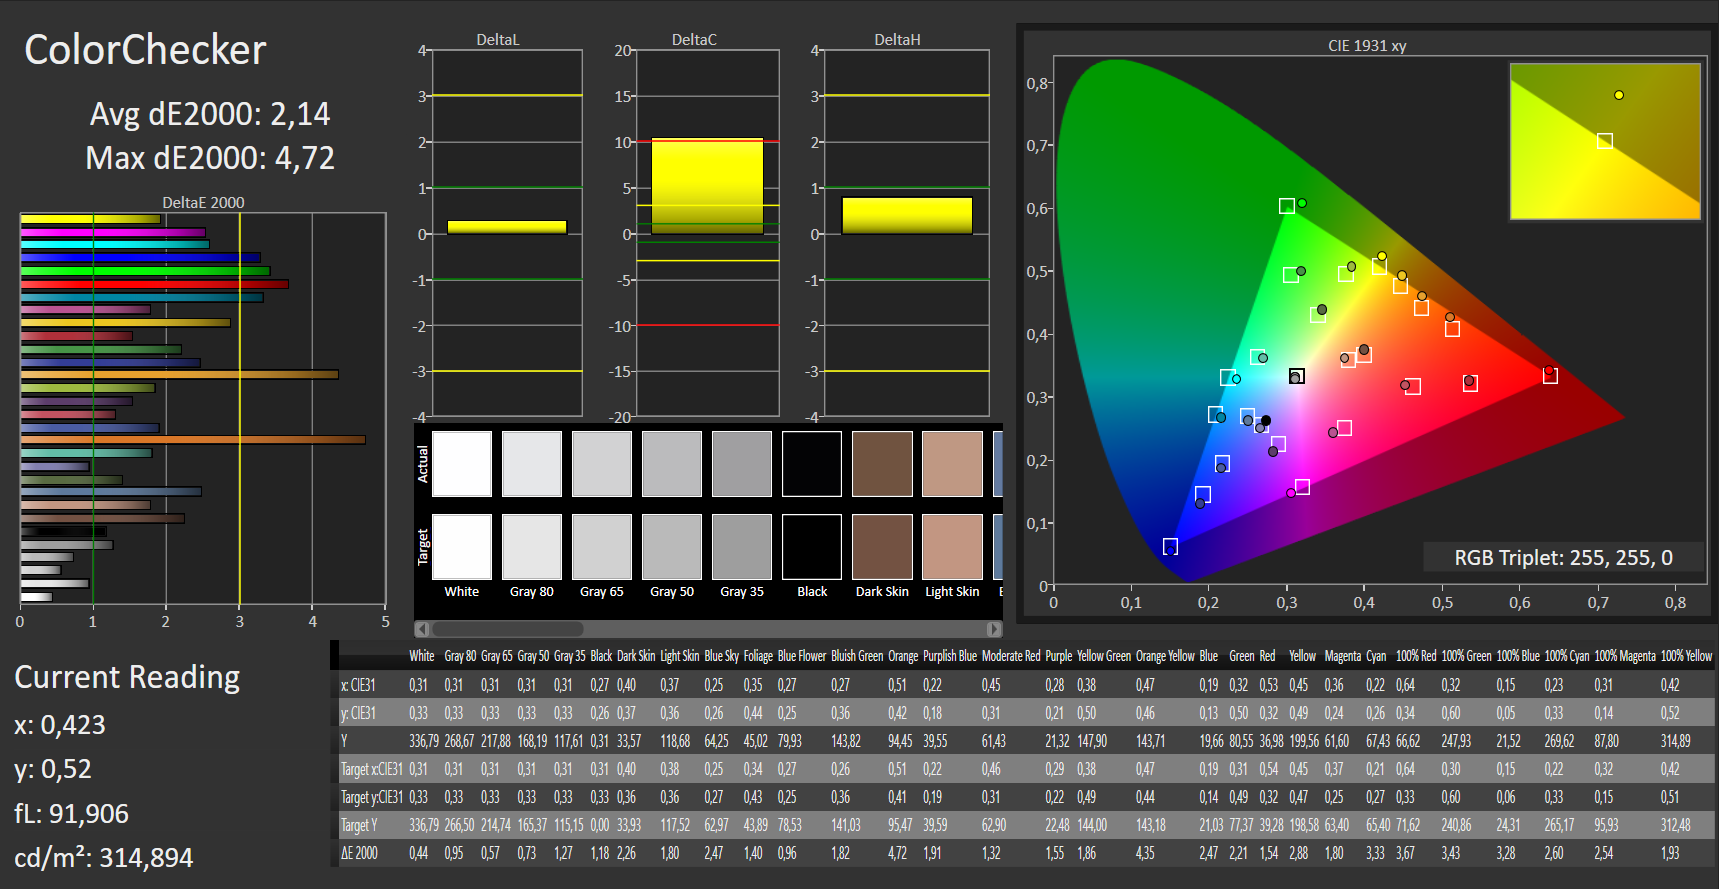
calibrated: 2.14
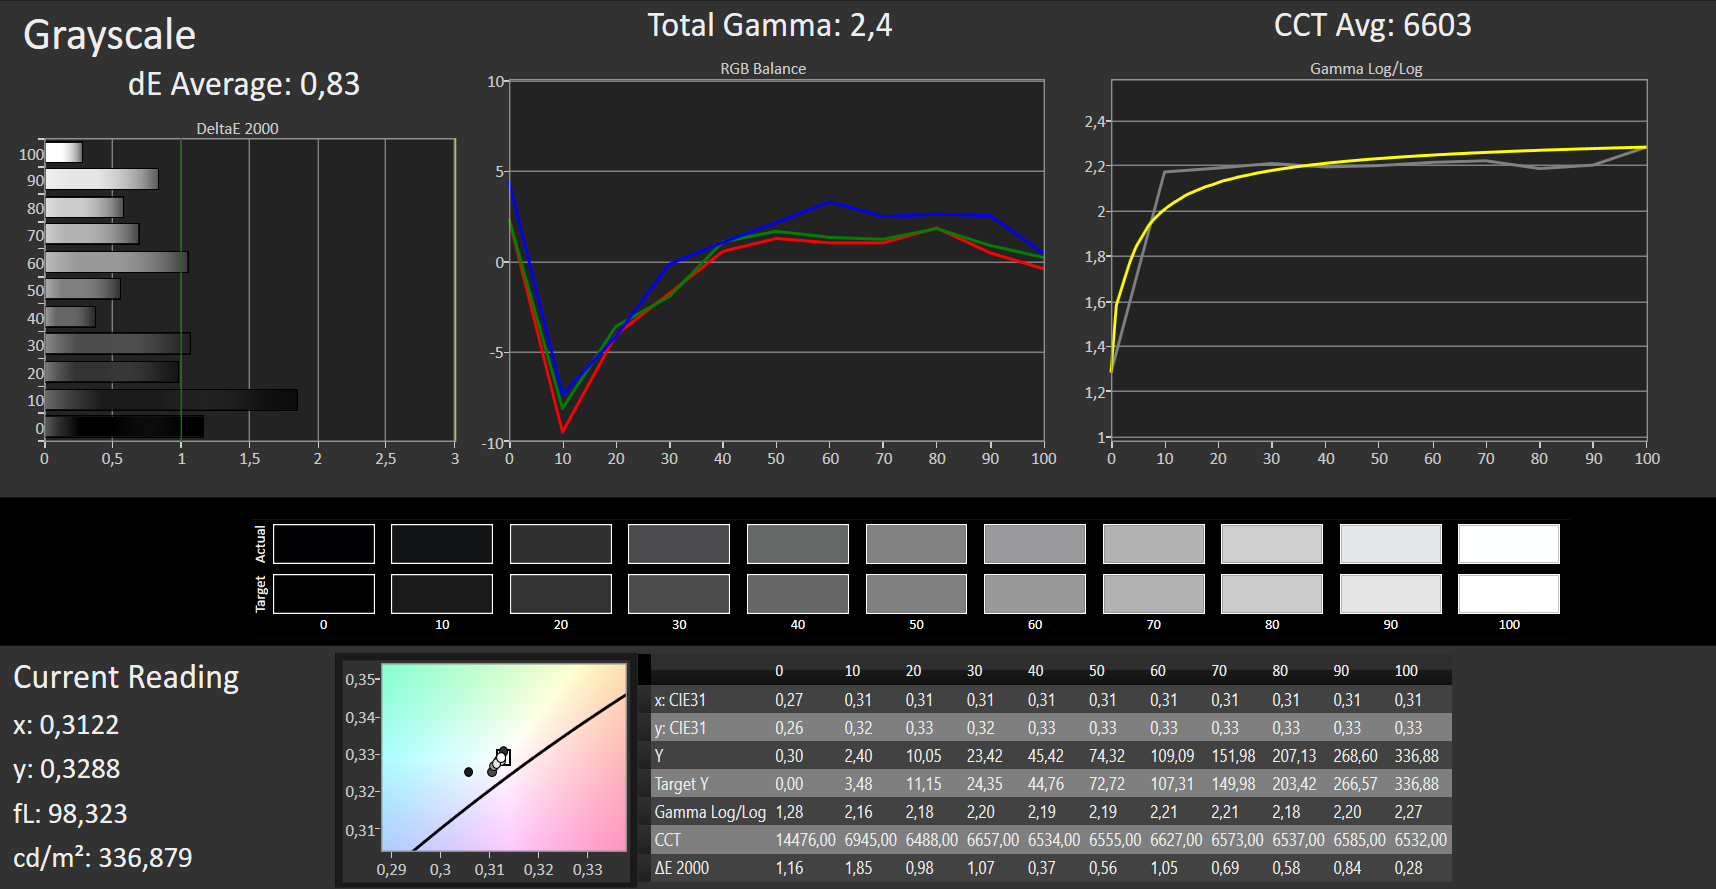
ΔE Greyscale Calman: 2.38 | ∀{0.09-98 Ø4.97}
90% sRGB (Argyll 1.6.3 3D)
59% AdobeRGB 1998 (Argyll 1.6.3 3D)
65.2% AdobeRGB 1998 (Argyll 3D)
90.1% sRGB (Argyll 3D)
64% Display P3 (Argyll 3D)
Gamma: 2.48
CCT: 6643 K
| MSI GF75 8RD-001 B173HAN04.2, , 1920x1080, 17.3" | Asus TUF FX705GE-EW096T AU Optronics B173HAN04.2, , 1920x1080, 17.3" | Lenovo Legion Y730-17ICH, i7-8750H LP173WF4-SPF6, , 1920x1080, 17.3" | Medion Erazer P6705-MD61131 AU Optronics B156HTN03.8 (AUO38ED), , 1920x1080, 15.6" | HP Pavilion Gaming 15-cx0003ng BOE07A1, , 1920x1080, 15.6" | Acer Aspire 7 A715-72G-704Q LG Philips LP156WFC-SPP1, , 1920x1080, 15.6" | |
|---|---|---|---|---|---|---|
| Display | -3% | -2% | -41% | -36% | -38% | |
| Display P3 Coverage (%) | 64 | 63.1 -1% | 66.4 4% | 36.4 -43% | 39.72 -38% | 38.34 -40% |
| sRGB Coverage (%) | 90.1 | 86.8 -4% | 84.9 -6% | 54.8 -39% | 59.3 -34% | 57.5 -36% |
| AdobeRGB 1998 Coverage (%) | 65.2 | 63.5 -3% | 62.1 -5% | 37.61 -42% | 41.04 -37% | 39.65 -39% |
| Response Times | -2% | 9% | 13% | -18% | 11% | |
| Response Time Grey 50% / Grey 80% * (ms) | 38 ? | 39 ? -3% | 36.8 ? 3% | 44.8 ? -18% | 47 ? -24% | 35 ? 8% |
| Response Time Black / White * (ms) | 28 ? | 28 ? -0% | 24 ? 14% | 16 ? 43% | 31 ? -11% | 24 ? 14% |
| PWM Frequency (Hz) | 208 ? | |||||
| Screen | -9% | -47% | -124% | -36% | -55% | |
| Brightness middle (cd/m²) | 356 | 299 -16% | 328.7 -8% | 200 -44% | 241 -32% | 280 -21% |
| Brightness (cd/m²) | 332 | 291 -12% | 318 -4% | 186 -44% | 236 -29% | 248 -25% |
| Brightness Distribution (%) | 89 | 90 1% | 91 2% | 85 -4% | 75 -16% | 81 -9% |
| Black Level * (cd/m²) | 0.27 | 0.28 -4% | 0.51 -89% | 0.43 -59% | 0.15 44% | 0.56 -107% |
| Contrast (:1) | 1319 | 1068 -19% | 645 -51% | 465 -65% | 1607 22% | 500 -62% |
| Colorchecker dE 2000 * | 2.73 | 3.02 -11% | 4.91 -80% | 11.39 -317% | 4.85 -78% | 4.75 -74% |
| Colorchecker dE 2000 max. * | 4.7 | 5.27 -12% | 10.15 -116% | 19.36 -312% | 8.82 -88% | 8.04 -71% |
| Colorchecker dE 2000 calibrated * | 2.14 | 2.76 -29% | 4.27 -100% | 3.05 -43% | 4.93 -130% | |
| Greyscale dE 2000 * | 2.38 | 2.18 8% | 3.9 -64% | 11.73 -393% | 5.15 -116% | 3.21 -35% |
| Gamma | 2.48 89% | 2.48 89% | 2.13 103% | 1.97 112% | 2.49 88% | 2.59 85% |
| CCT | 6643 98% | 6392 102% | 6911 94% | 12614 52% | 7042 92% | 6601 98% |
| Color Space (Percent of AdobeRGB 1998) (%) | 59 | 57 -3% | 55.6 -6% | 35 -41% | 38 -36% | 36 -39% |
| Color Space (Percent of sRGB) (%) | 90 | 87 -3% | 84.7 -6% | 55 -39% | 59 -34% | 57 -37% |
| Total Average (Program / Settings) | -5% /
-7% | -13% /
-32% | -51% /
-91% | -30% /
-34% | -27% /
-44% |
* ... smaller is better
Our subjective impression confirms the good results. Blacks appear deep and the DeltaE ColorChecker shows excellent results significantly below 3 at 2.73. We even reached 2.14 after calibration, which positions this device way above all its comparison devices. The HP Pavilion Gaming 15, praised for its good black value and contrast, only reaches 4.85 (without calibration) while the Medion Erazer brings up the rear with 11.39.

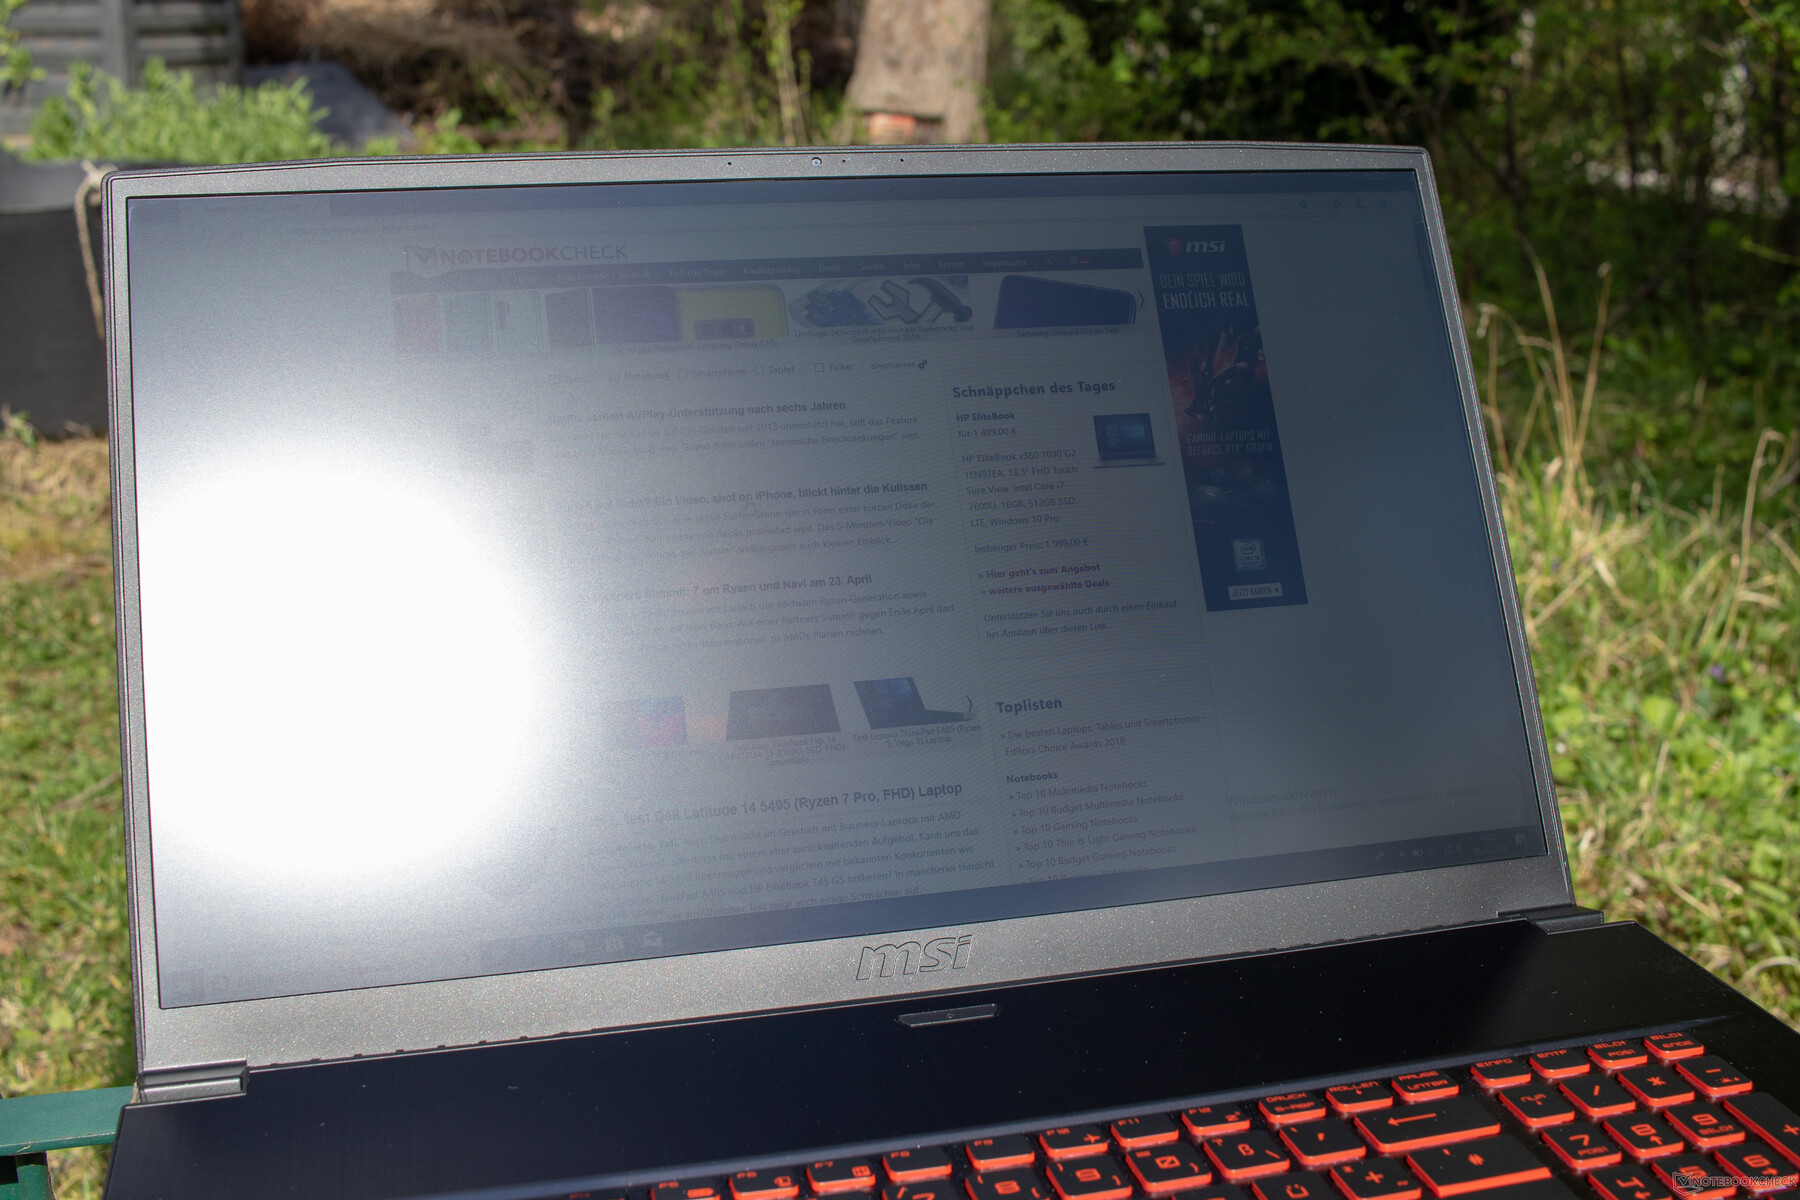
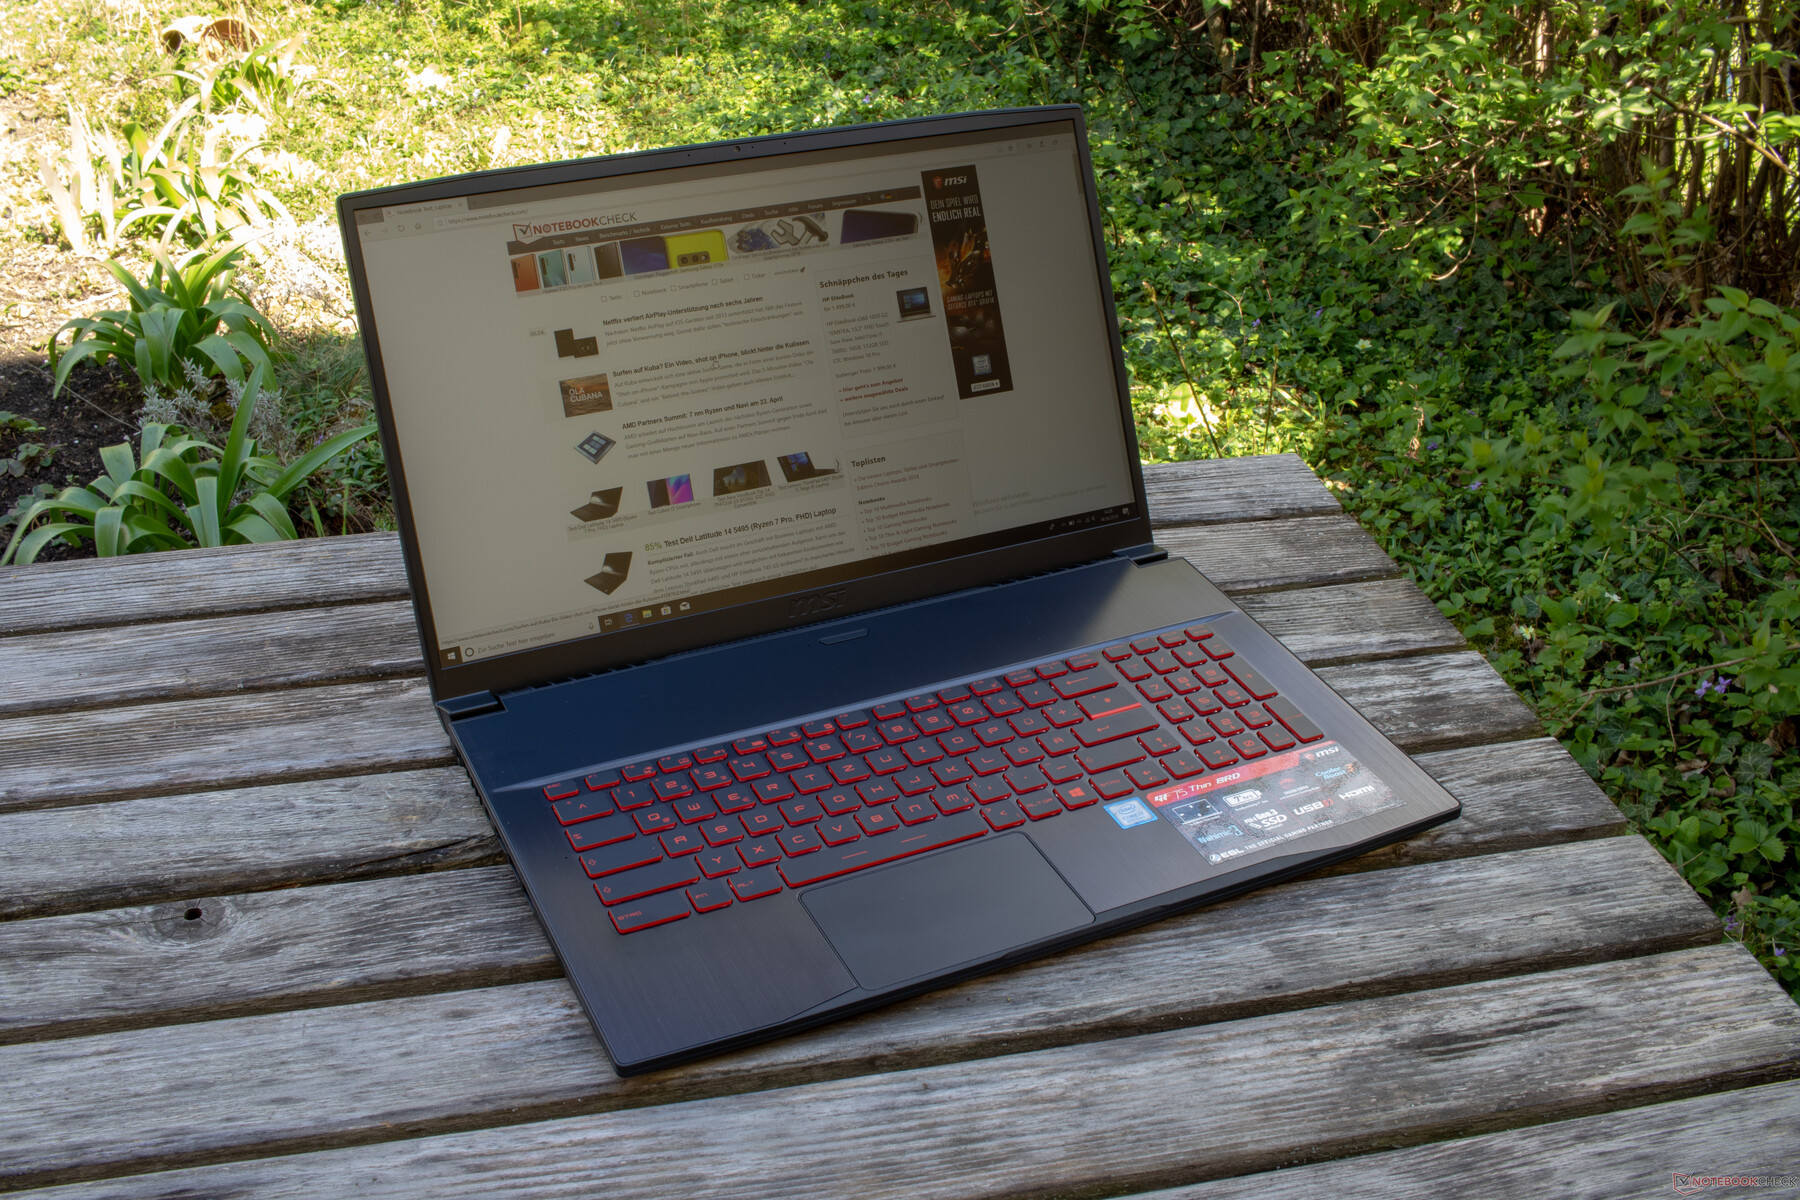
Like almost every other notebook, the MSI screen is difficult to read in direct sunlight despite its matte display and decent brightness. However, we expect most gamers will not want to go into battle outdoors in direct sunlight - particularly considering the limiting Wi-Fi speeds. The display is bright enough to be used in shade or semi shade.
Display Response Times
| ↔ Response Time Black to White | ||
|---|---|---|
| 28 ms ... rise ↗ and fall ↘ combined | ↗ 16 ms rise | 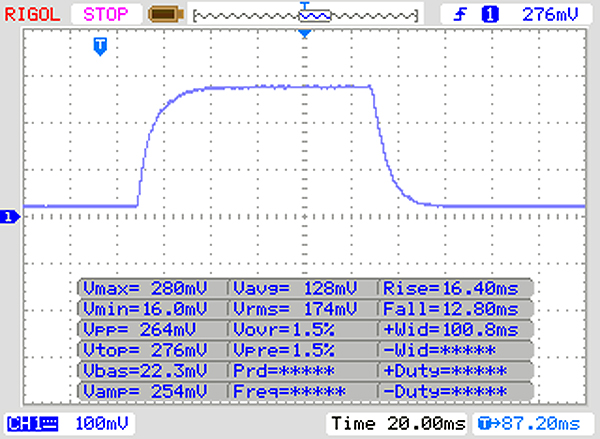 |
| ↘ 12 ms fall | ||
| The screen shows relatively slow response rates in our tests and may be too slow for gamers. In comparison, all tested devices range from 0.1 (minimum) to 240 (maximum) ms. » 71 % of all devices are better. This means that the measured response time is worse than the average of all tested devices (19.9 ms). | ||
| ↔ Response Time 50% Grey to 80% Grey | ||
| 38 ms ... rise ↗ and fall ↘ combined | ↗ 18 ms rise | 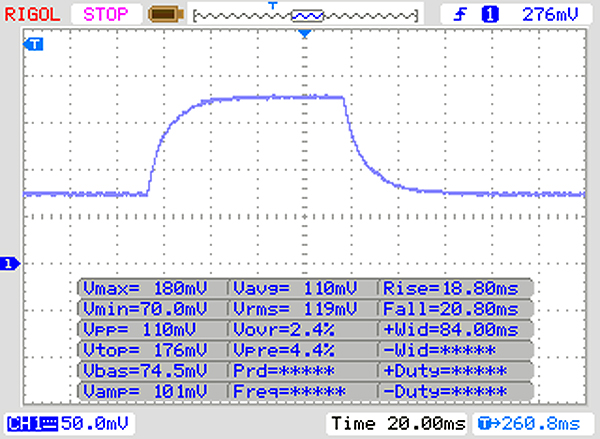 |
| ↘ 20 ms fall | ||
| The screen shows slow response rates in our tests and will be unsatisfactory for gamers. In comparison, all tested devices range from 0.165 (minimum) to 636 (maximum) ms. » 55 % of all devices are better. This means that the measured response time is worse than the average of all tested devices (31.1 ms). | ||
Screen Flickering / PWM (Pulse-Width Modulation)
| Screen flickering / PWM not detected | 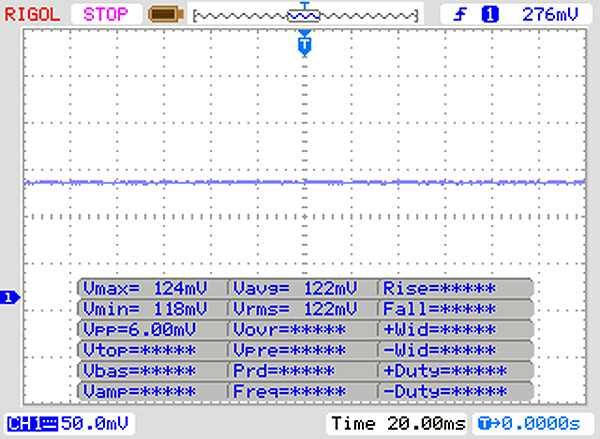 | ||
In comparison: 52 % of all tested devices do not use PWM to dim the display. If PWM was detected, an average of 7784 (minimum: 5 - maximum: 343500) Hz was measured. | |||
Subjectively, we are definitely impressed by the display's quality. The maximum opening angle is 145 degrees, which is wide enough to use the device on your lap. There are no limitations in terms of viewing angle stability with this very good IPS panel.

Performance - MSI GF75 can keep up
The MSI GF75 Thin is marketed explicitly to gamers with its striking red-and-black design. The combination of an Intel Core i7-8750H and the Max-Q version of the GeForce 1050 Ti is also made for gaming. The 16 GB of RAM and Kingston SSD further support the GF75's ideal conditions and sufficient performance reserves. What makes things more difficult is the fact that MSI has tried to squeeze all these components into a thin case. On the other hand, we have a 17.3-inch device that should offer sufficient volume for decent cooling. We shall find out how this device fares under full load with our Cinebench tests.
Processor
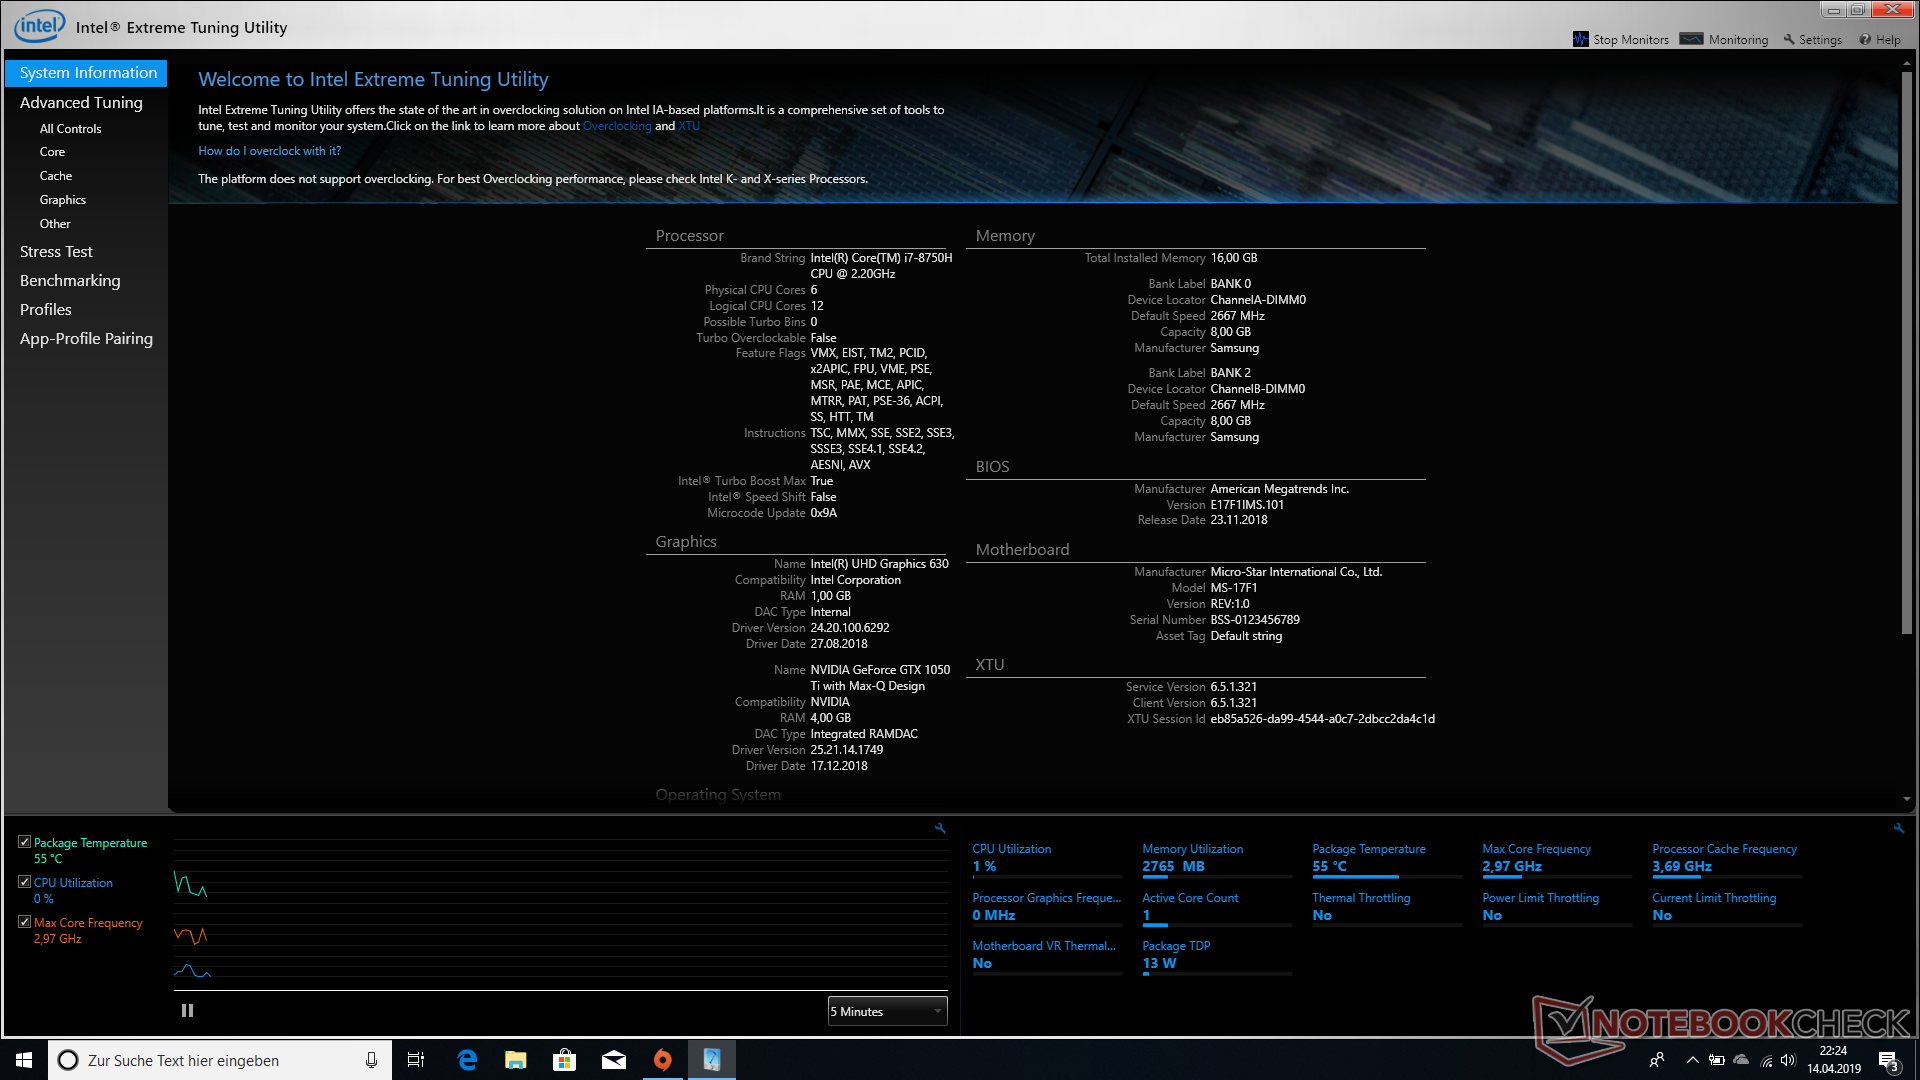
MSI has chosen the six-core Intel Core i7-8750H for its thin gamer. This processor can process up to twelve threads simultaneously thanks to hyper threading. The Coffee Lake model has a standard clock rate of 2.2 GHz and can reach 4.1 GHz in turbo mode - although this speed is limited to single-core use like in many other models. When all cores work simultaneously, the i7-8750H can reach a maximum clock rate of 3.9 GHz. The standard TDP is set to 45 watts.
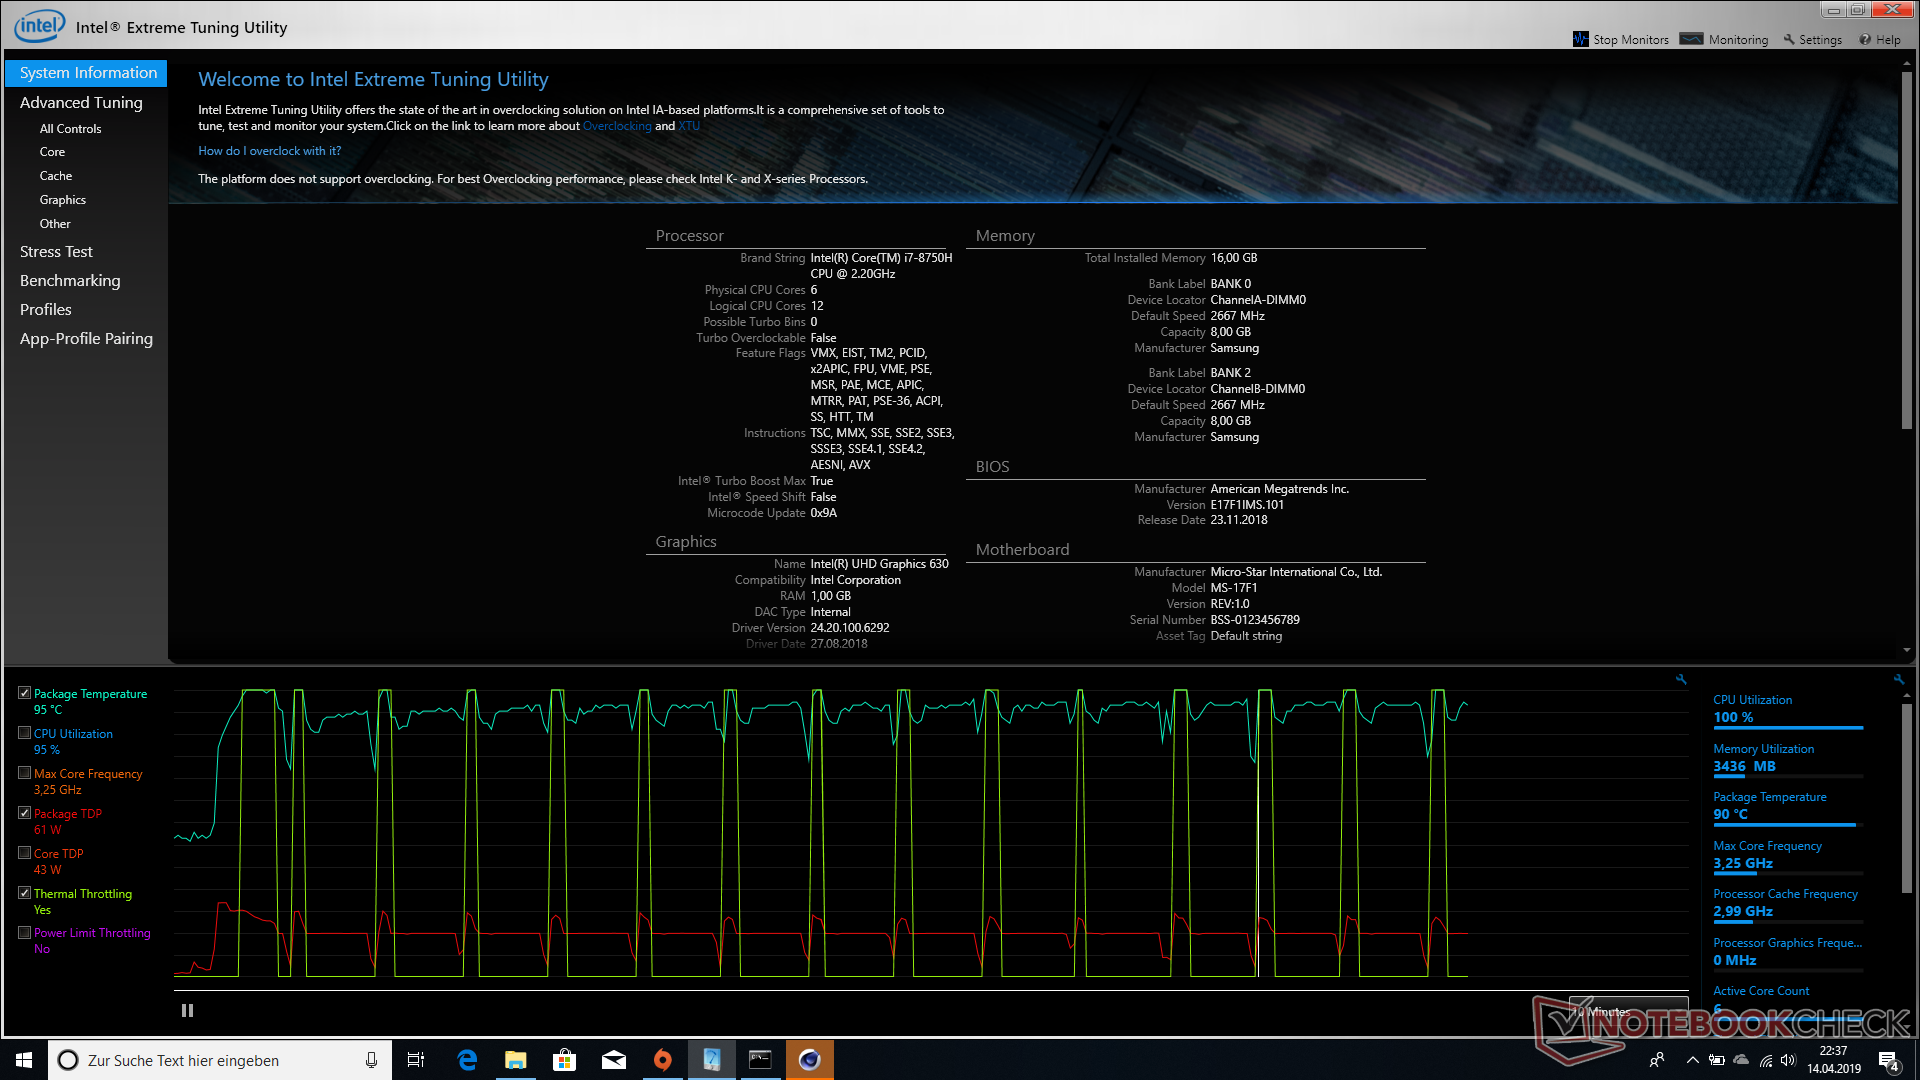
The MSI GF75 is right on par with the average single core test result. It continues to offer mid-range speeds in the first round of our CPU Multi 64Bit loop. However, thermal throttling causes the results to drop by 12.4% from 1089 to 953 points in the next round. The processor continues to be throttled significantly for the remaining 20 minutes of the test and only offers around 83% of its original performance.
System Performance
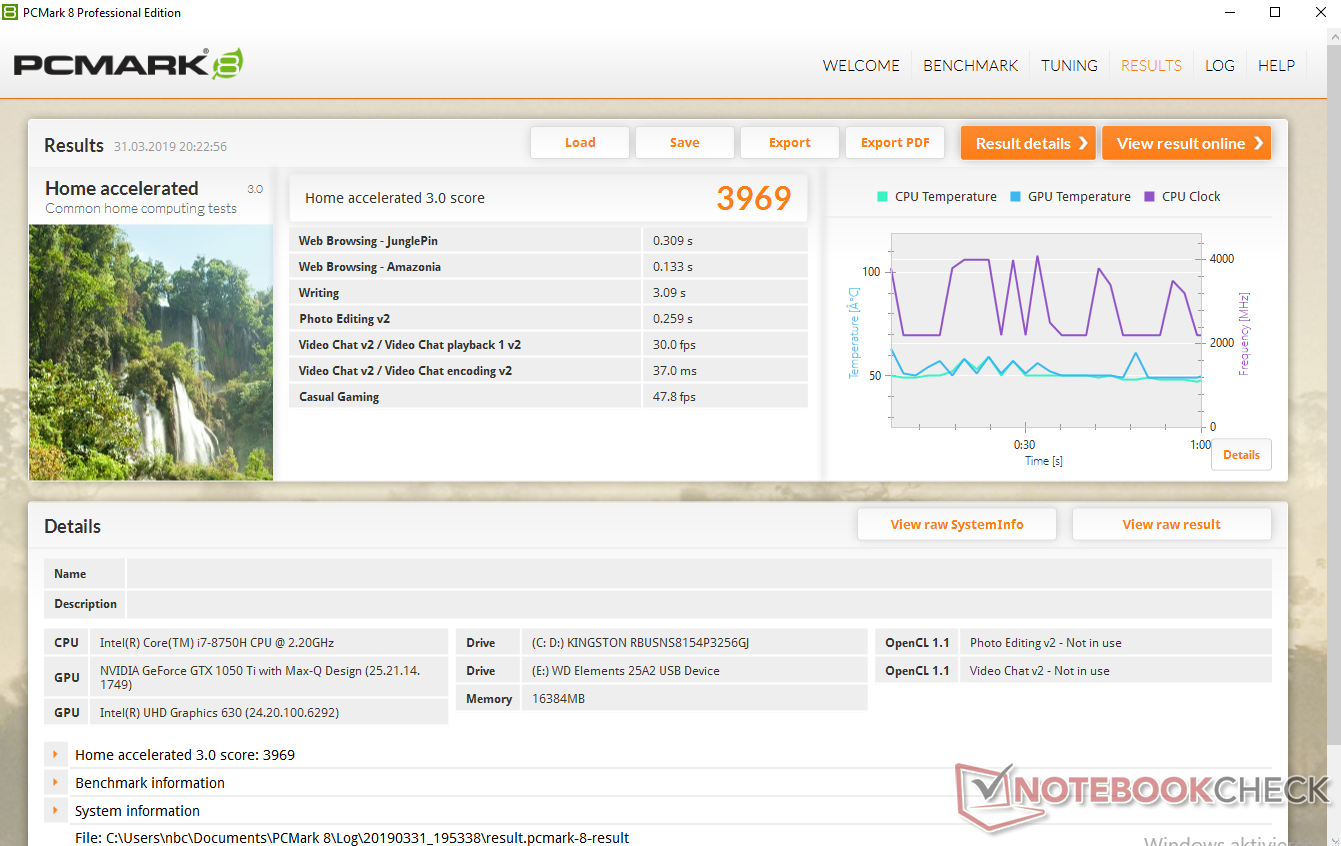
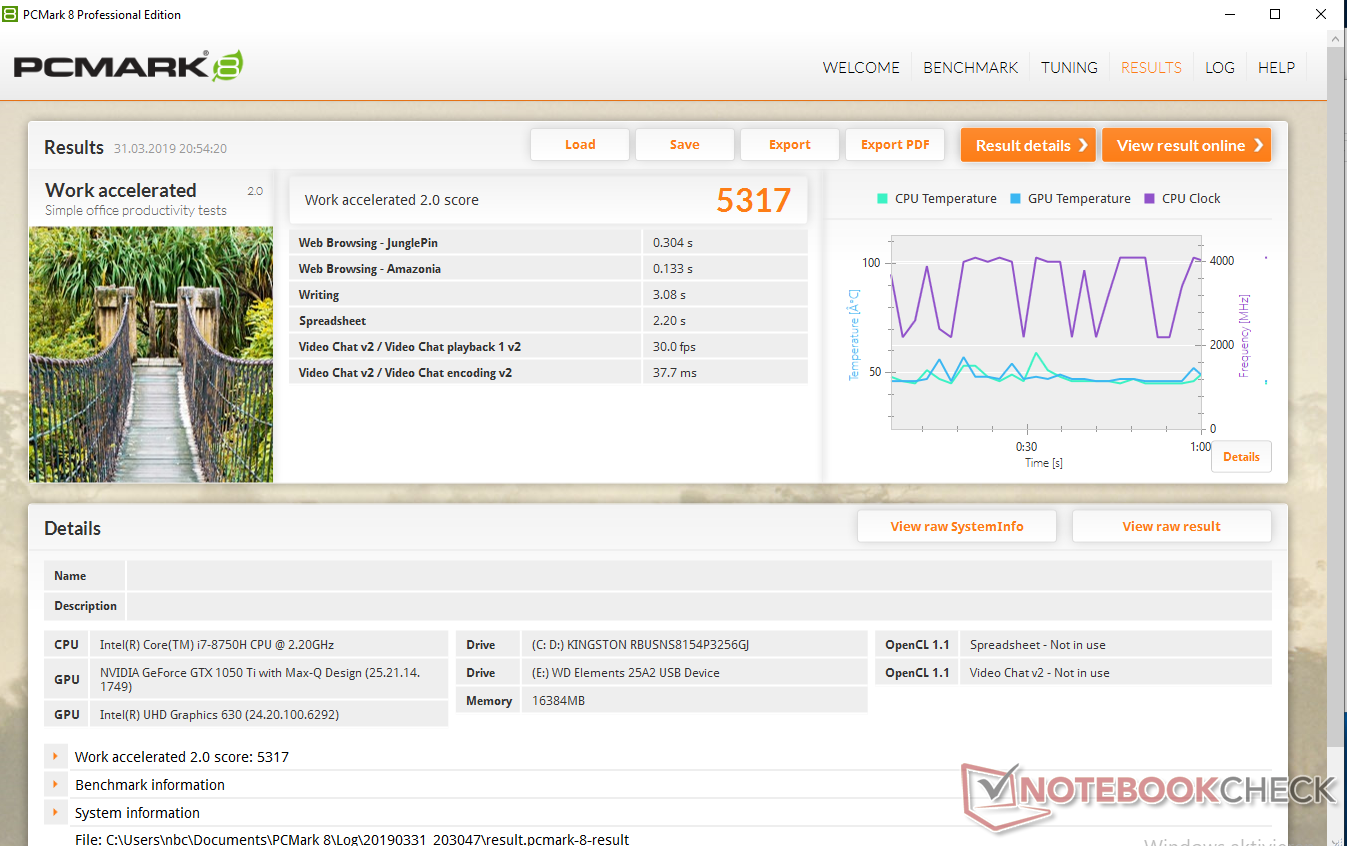
Although the MSI GF75 is equipped with a fast SSD from Kingston and 16 GB of DDR4-2666 RAM, it is one of the slowest devices in our comparison field in the synthetic benchmark PCMark 10. The overall score of the GF75 is 13% below the average for gaming laptops. The PCMark 8 results are slightly better with our test unit being positioned in the middle of our comparison field in the Work Score. The Home Score results, however, place it at the end of the list again. Subjectively, the test unit performs faster in everyday use than one would assume based on the benchmark results.

| PCMark 8 | |
| Home Score Accelerated v2 | |
| Average of class Gaming (n=1last 2 years) | |
| HP Pavilion Gaming 15-cx0003ng | |
| MSI GL73 8RD-418US | |
| Asus TUF FX705GE-EW096T | |
| Lenovo Legion Y730-17ICH, i7-8750H | |
| Acer Aspire 7 A715-72G-704Q | |
| Medion Erazer P6705-MD61131 | |
| MSI GF75 8RD-001 | |
| MSI GF63 8RC | |
| Average Intel Core i7-8750H, NVIDIA GeForce GTX 1050 Ti Max-Q (3494 - 3969, n=4) | |
| Work Score Accelerated v2 | |
| Asus TUF FX705GE-EW096T | |
| MSI GL73 8RD-418US | |
| Medion Erazer P6705-MD61131 | |
| Lenovo Legion Y730-17ICH, i7-8750H | |
| MSI GF75 8RD-001 | |
| Acer Aspire 7 A715-72G-704Q | |
| HP Pavilion Gaming 15-cx0003ng | |
| MSI GF63 8RC | |
| Average Intel Core i7-8750H, NVIDIA GeForce GTX 1050 Ti Max-Q (4316 - 5317, n=4) | |
| Average of class Gaming (n=1last 2 years) | |
| PCMark 8 Home Score Accelerated v2 | 3969 points | |
| PCMark 8 Work Score Accelerated v2 | 5317 points | |
| PCMark 10 Score | 4437 points | |
Help | ||
Storage Devices
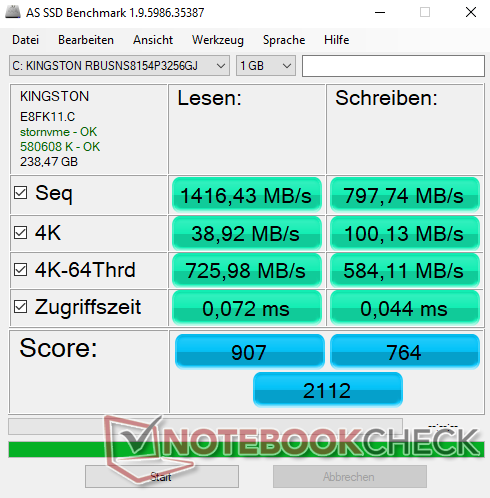
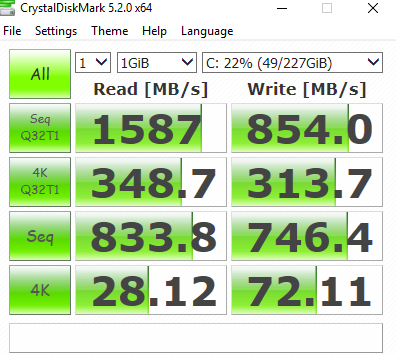
MSI has chosen to go with a 256-GB M.2 SSD from Kingston for its entire GF series - and we think this is a good decision. It reaches very satisfactory results in our CrystalDiskMark benchmark and even narrowly beats the Samsung PM 981 and Intel 760 in the Write 4K QD32 and Read 4K QD32 tests, which are most relevant for everyday use.
| MSI GF75 8RD-001 Kingston RBUSNS8154P3256GJ1 | Asus TUF FX705GE-EW096T SK hynix BC501 HFM128GDJTNG-831 | Lenovo Legion Y730-17ICH, i7-8750H Toshiba KBG30ZMT128G | Medion Erazer P6705-MD61131 Samsung SSD PM981 MZVLB256HAHQ | HP Pavilion Gaming 15-cx0003ng Intel Optane 16 GB MEMPEK1J016GAH + HGST HTS721010A9E630 1 TB HDD | Acer Aspire 7 A715-72G-704Q Intel SSD 760p SSDPEKKW256G8 | Average Kingston RBUSNS8154P3256GJ1 | |
|---|---|---|---|---|---|---|---|
| CrystalDiskMark 5.2 / 6 | -13% | -39% | 62% | -7% | 37% | 47% | |
| Write 4K (MB/s) | 72.1 | 90.3 25% | 71.4 -1% | 107 48% | 59.2 -18% | 103.4 43% | 141.1 ? 96% |
| Read 4K (MB/s) | 28.12 | 37.03 32% | 29.98 7% | 39.91 42% | 91.3 225% | 56 99% | 82.4 ? 193% |
| Write Seq (MB/s) | 746 | 320.3 -57% | 129.6 -83% | 1439 93% | 158.3 -79% | 808 8% | 722 ? -3% |
| Read Seq (MB/s) | 834 | 1012 21% | 843 1% | 2011 141% | 880 6% | 1939 132% | 974 ? 17% |
| Write 4K Q32T1 (MB/s) | 313.7 | 196.8 -37% | 88.9 -72% | 282.1 -10% | 161.8 -48% | 281.3 -10% | 418 ? 33% |
| Read 4K Q32T1 (MB/s) | 348.7 | 271.5 -22% | 196.4 -44% | 326.6 -6% | 286.5 -18% | 326.5 -6% | 571 ? 64% |
| Write Seq Q32T1 (MB/s) | 854 | 268.8 -69% | 130.5 -85% | 1441 69% | 159.8 -81% | 474.1 -44% | 717 ? -16% |
| Read Seq Q32T1 (MB/s) | 1587 | 1595 1% | 1037 -35% | 3516 122% | 929 -41% | 2735 72% | 1413 ? -11% |
| AS SSD | -56% | -147% | 12% | -1524% | 4% | -11% | |
| Seq Read (MB/s) | 1416 | 878 -38% | 979 -31% | 2724 92% | 854 -40% | 2493 76% | 1195 ? -16% |
| Seq Write (MB/s) | 798 | 336.8 -58% | 125.4 -84% | 1365 71% | 147 -82% | 1241 56% | 668 ? -16% |
| 4K Read (MB/s) | 38.92 | 23.76 -39% | 19.73 -49% | 46.14 19% | 105.1 170% | 41.22 6% | 33.6 ? -14% |
| 4K Write (MB/s) | 100.1 | 92 -8% | 38.73 -61% | 102.6 2% | 59.5 -41% | 112.4 12% | 82.6 ? -17% |
| 4K-64 Read (MB/s) | 726 | 248.9 -66% | 168.6 -77% | 567 -22% | 42.09 -94% | 522 -28% | 667 ? -8% |
| 4K-64 Write (MB/s) | 584 | 112.5 -81% | 31.38 -95% | 459.8 -21% | 137.3 -76% | 470.7 -19% | 561 ? -4% |
| Access Time Read * (ms) | 0.072 | 0.141 -96% | 0.519 -621% | 0.08 -11% | 14.99 -20719% | 0.058 19% | 0.117 ? -63% |
| Access Time Write * (ms) | 0.044 | 0.054 -23% | 0.324 -636% | 0.037 16% | 0.043 2% | 0.099 -125% | 0.05571 ? -27% |
| Score Read (Points) | 907 | 360 -60% | 286 -68% | 886 -2% | 233 -74% | 812 -10% | 820 ? -10% |
| Score Write (Points) | 764 | 238 -69% | 86 -89% | 699 -9% | 211 -72% | 707 -7% | 710 ? -7% |
| Score Total (Points) | 2112 | 764 -64% | 479 -77% | 1983 -6% | 577 -73% | 1883 -11% | 1931 ? -9% |
| Copy ISO MB/s (MB/s) | 608 | 224.1 -63% | 272.7 -55% | 110.1 -82% | 968 59% | 773 ? 27% | |
| Copy Program MB/s (MB/s) | 350.7 | 111.9 -68% | 182.9 -48% | 94.1 -73% | 319.4 -9% | 375 ? 7% | |
| Copy Game MB/s (MB/s) | 478.7 | 229.2 -52% | 134.6 -72% | 81.7 -83% | 648 35% | 509 ? 6% | |
| Total Average (Program / Settings) | -35% /
-41% | -93% /
-108% | 37% /
33% | -766% /
-972% | 21% /
16% | 18% /
10% |
* ... smaller is better

GPU Performance
MSI has made a good decision when choosing the Nvidia GeForce GTX 1050 Ti Max-Q for the GF75 Thin, particularly considering its narrow case. The "Max-Q" does not represent an overclocked version of the GTX 1050 Ti but instead stands for energy-efficiency. It offers optimized voltage transformers, improved cooling and a top limit of 40 dB(A) for cooling noise. The clock rates are also below the normal GeForce GTX 1050 Ti, which is why the TDP is 40-46 watts rather than 64 watts like for the normal GTX 1050 Ti. These changes are also reflected in its performance, which is around 10-15% lower than that of a GeForce GTX 1050 Ti, depending on the device's cooling system. This is still faster than the simple GeForce GTX 1050, however.
| 3DMark 11 Performance | 9171 points | |
| 3DMark Cloud Gate Standard Score | 28253 points | |
| 3DMark Fire Strike Score | 6714 points | |
Help | ||
Gaming Performance
The MSI GF75 offers decent gaming performance. It can display a smooth frame rate at medium details for most games and is faster than the HP x360 Spectre. Only "Metro Exodus" seems to be too much for the MSI. The GF75 is positioned behind all the Nvidia GeForce GTX 1050 Ti Max-Q models in our comparison list for this game. Users should not expect to be playing at high details with the GTX 1050 Ti Max-Q. This would require at least a GeForce GTX 1060.
| The Witcher 3 | |
| 1920x1080 High Graphics & Postprocessing (Nvidia HairWorks Off) | |
| Average of class Gaming (181 - 341, n=3, last 2 years) | |
| Schenker XMG Neo 17 | |
| Gigabyte Aero 15-Y9 | |
| MSI GF75 8RD-001 | |
| Lenovo Legion Y730-17ICH, i7-8750H | |
| Acer Aspire 7 A715-72G-704Q | |
| Average NVIDIA GeForce GTX 1050 Ti Max-Q (42.6 - 60, n=6) | |
| Asus TUF FX705GE-EW096T | |
| HP Spectre x360 15-df0126ng | |
| Medion Erazer P6705-MD61131 | |
| HP Pavilion Gaming 15-cx0003ng | |
| Acer Aspire 5 A515-52G-723L | |
| 1920x1080 Ultra Graphics & Postprocessing (HBAO+) | |
| Average of class Gaming (95 - 240, n=8, last 2 years) | |
| MSI GS75 8SG Stealth | |
| Schenker XMG Neo 17 | |
| Gigabyte Aero 15-Y9 | |
| MSI GF75 8RD-001 | |
| Acer Aspire 7 A715-72G-704Q | |
| Average NVIDIA GeForce GTX 1050 Ti Max-Q (23.5 - 43, n=7) | |
| Lenovo Legion Y730-17ICH, i7-8750H | |
| Asus TUF FX705GE-EW096T | |
| HP Spectre x360 15-df0126ng | |
| Medion Erazer P6705-MD61131 | |
| HP Pavilion Gaming 15-cx0003ng | |
| Acer Aspire 5 A515-52G-723L | |
| Far Cry New Dawn | |
| 1920x1080 High Preset | |
| MSI GS75 8SG Stealth | |
| Schenker XMG Neo 17 | |
| Gigabyte Aero 15-Y9 | |
| MSI GF75 8RD-001 | |
| Average NVIDIA GeForce GTX 1050 Ti Max-Q (43 - 46, n=2) | |
| HP Spectre x360 15-df0126ng | |
| MSI GE72 7RE | |
| Acer Aspire 5 A515-52G-723L | |
| 1920x1080 Ultra Preset | |
| MSI GS75 8SG Stealth | |
| Schenker XMG Neo 17 | |
| Gigabyte Aero 15-Y9 | |
| MSI GF75 8RD-001 | |
| Average NVIDIA GeForce GTX 1050 Ti Max-Q (40 - 43, n=2) | |
| HP Spectre x360 15-df0126ng | |
| MSI GE72 7RE | |
| Acer Aspire 5 A515-52G-723L | |
| 2560x1440 Ultra Preset | |
| Schenker XMG Neo 17 | |
| MSI GF75 8RD-001 | |
| Average NVIDIA GeForce GTX 1050 Ti Max-Q (n=1) | |
| MSI GE72 7RE | |
| 3840x2160 Ultra Preset | |
| Schenker XMG Neo 17 | |
| Gigabyte Aero 15-Y9 | |
| MSI GF75 8RD-001 | |
| Average NVIDIA GeForce GTX 1050 Ti Max-Q (14 - 15, n=2) | |
| HP Spectre x360 15-df0126ng | |
| MSI GE72 7RE | |
| Metro Exodus | |
| 1920x1080 Medium Quality AF:4x | |
| Schenker XMG Neo 17 | |
| Gigabyte Aero 15-Y9 | |
| HP Spectre x360 15-df0126ng | |
| Average NVIDIA GeForce GTX 1050 Ti Max-Q (31.4 - 49.8, n=2) | |
| MSI GF75 8RD-001 | |
| MSI GE72 7RE | |
| Acer Aspire 5 A515-52G-723L | |
| Lenovo V145-15AST | |
| 1920x1080 High Quality AF:16x | |
| MSI GS75 8SG Stealth | |
| Schenker XMG Neo 17 | |
| Gigabyte Aero 15-Y9 | |
| HP Spectre x360 15-df0126ng | |
| Average NVIDIA GeForce GTX 1050 Ti Max-Q (23.5 - 36.5, n=2) | |
| MSI GF75 8RD-001 | |
| MSI GE72 7RE | |
| Acer Aspire 5 A515-52G-723L | |
| 1920x1080 Ultra Quality AF:16x | |
| Schenker XMG Neo 17 | |
| MSI GS75 8SG Stealth | |
| Gigabyte Aero 15-Y9 | |
| HP Spectre x360 15-df0126ng | |
| Average NVIDIA GeForce GTX 1050 Ti Max-Q (19.3 - 28.3, n=2) | |
| MSI GF75 8RD-001 | |
| MSI GE72 7RE | |
| Acer Aspire 5 A515-52G-723L | |
| low | med. | high | ultra | QHD | 4K | |
|---|---|---|---|---|---|---|
| The Witcher 3 (2015) | 145 | 99 | 60 | 43 | ||
| Final Fantasy XV Benchmark (2018) | 75.1 | 37.7 | 25 | |||
| Far Cry New Dawn (2019) | 89 | 50 | 46 | 43 | 29 | 15 |
| Metro Exodus (2019) | 60.4 | 31.4 | 23.5 | 19.3 |
Emissions - a quiet gamer
System Noise
A device like the GF75 with its thin design needs a particularly decent cooling system. The laptop needs to be able to efficiently transport hot air out of the case. MSI manages to do this while still offering excellent system noise. 40.6 dB(A) under maximum load can definitely be considered quiet. However, we would have preferred to have slightly more cooling capacity, for example by increasing the RPM of the fan. The competition's system noise is closer to the 50 dB(A) mark. The fact that the sound pulses slightly at high RPM is a little annoying, however. On the other hand, the frequency is not too high, which makes it more comfortable to hear. We did not note any other noise such as coil whine on the GF75.
Noise level
| Idle |
| 32 / 32 / 32.1 dB(A) |
| Load |
| 33.6 / 40.6 dB(A) |
 | ||
30 dB silent 40 dB(A) audible 50 dB(A) loud |
||
min: | ||
Temperature
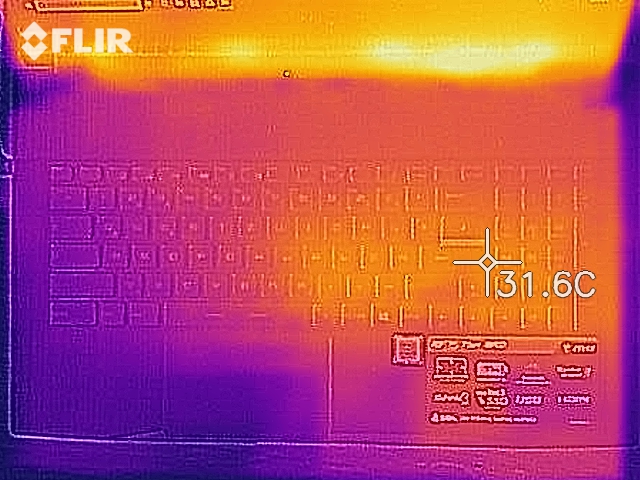
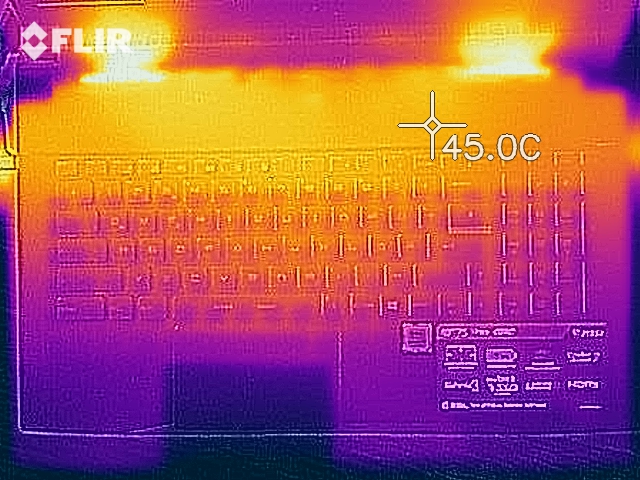
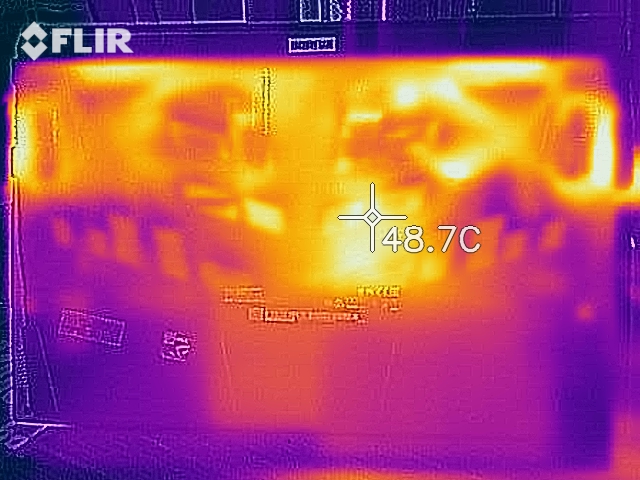
As it turns out, the fact that the keyboard is positioned further down on the base unit is an advantage when the device is under load, as it avoids the hot spots. As you can see from the image below, these are positioned in the top area, above the keyboard. The entire heat distribution with peaks of around 44 °C (~111 °F) is centered around the back ventilation slots towards the top of the base. The center of the keyboard only reaches a maximum of 38.1 °C (~100 °F). The wrist rest hardly heats up under load and remains comfortably cool.
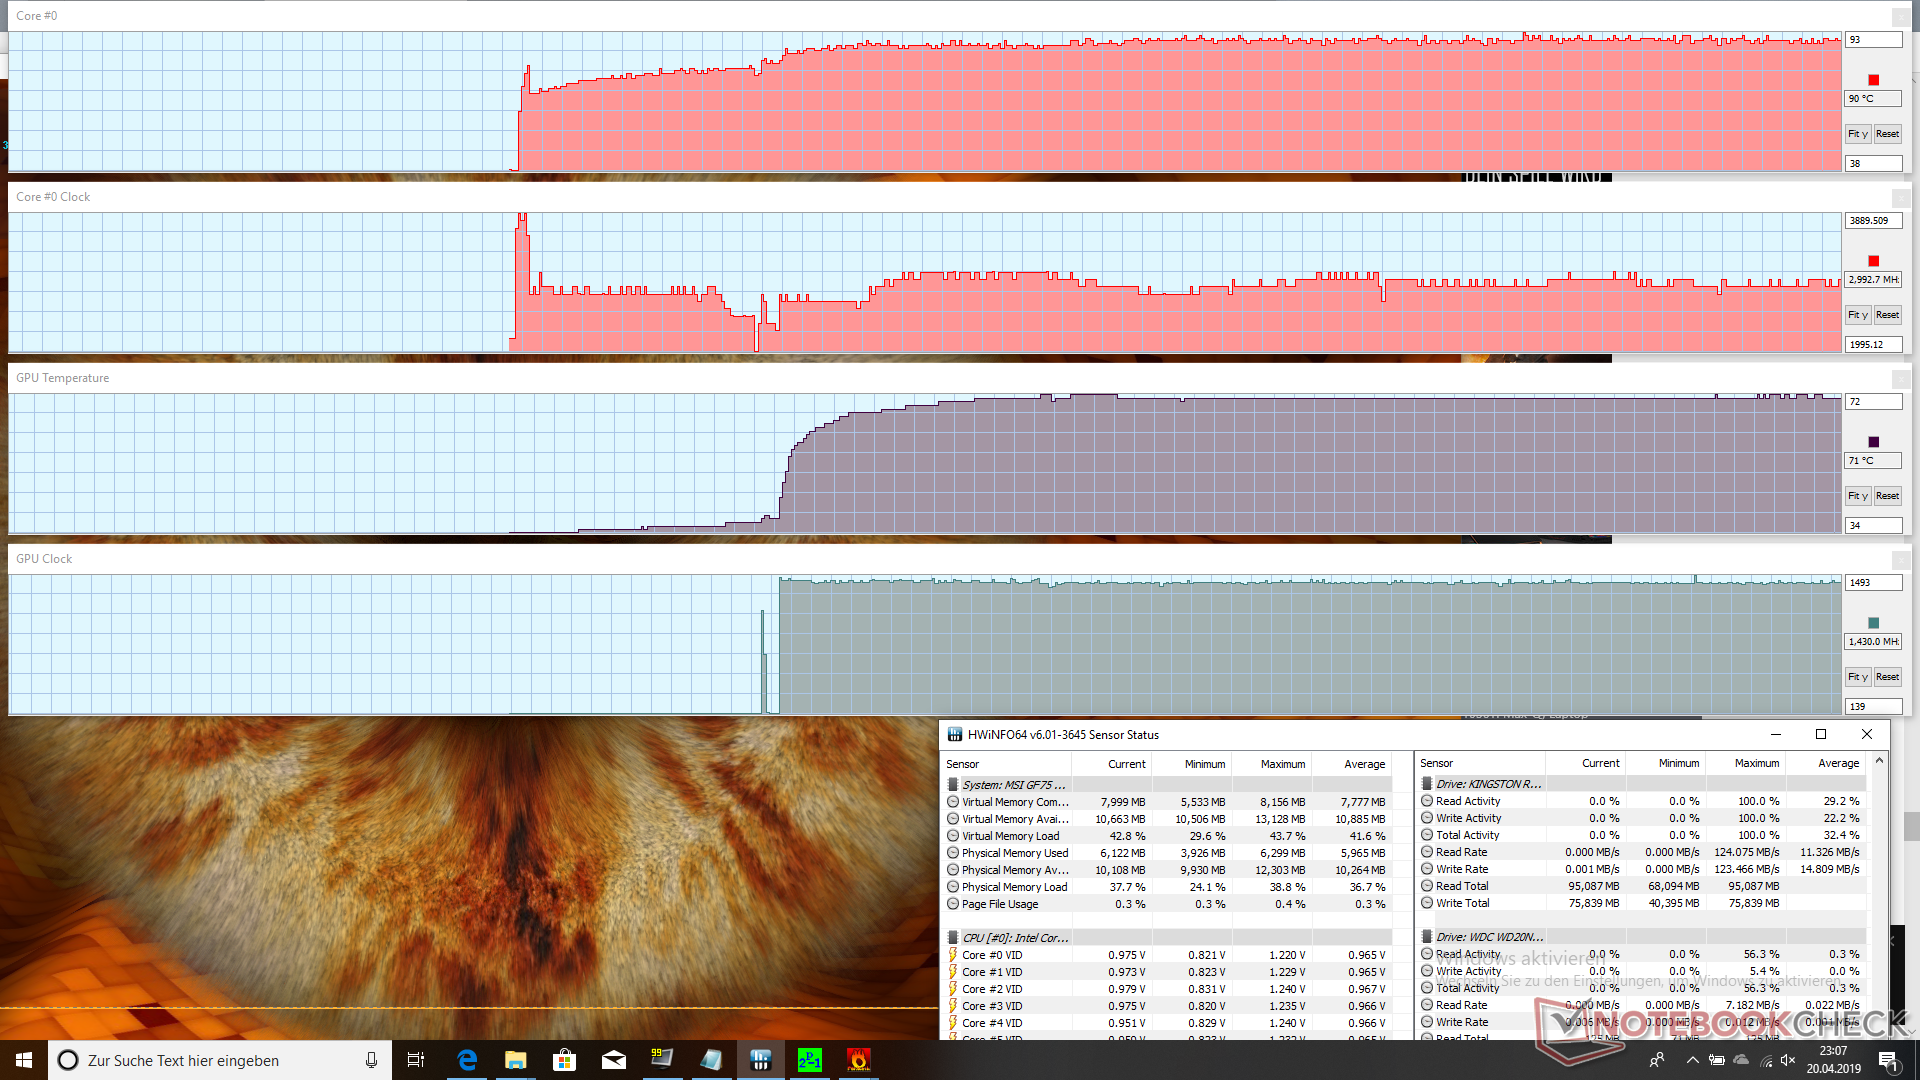
The FurMark stress test heats the CPU to 93 °C (~162 °F) and the clock rates settle down to around 3 GHz after initially reaching 3.9 GHz. The GPU on the other hand keeps a constant clock rate of 1.49 GHz and reaches 72 °C. As we have already noted during the Cinebench loop, the processor experiences heat-related throttling.
(±) The maximum temperature on the upper side is 44.2 °C / 112 F, compared to the average of 40.4 °C / 105 F, ranging from 21.2 to 68.8 °C for the class Gaming.
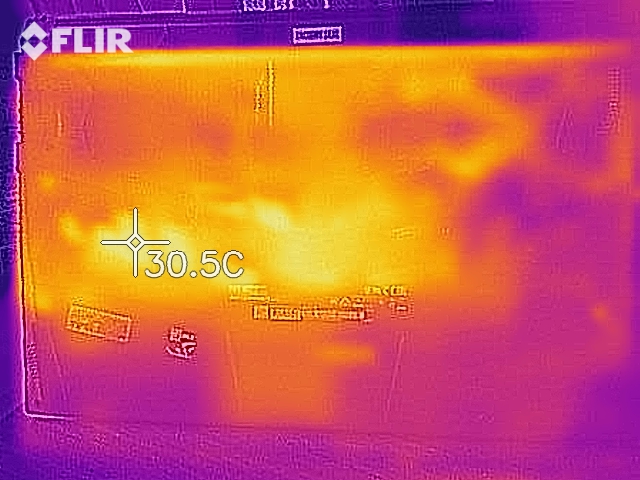
(+) The bottom heats up to a maximum of 39.1 °C / 102 F, compared to the average of 43.2 °C / 110 F
(+) In idle usage, the average temperature for the upper side is 23.3 °C / 74 F, compared to the device average of 33.9 °C / 93 F.
(+) The palmrests and touchpad are cooler than skin temperature with a maximum of 26.8 °C / 80.2 F and are therefore cool to the touch.
(±) The average temperature of the palmrest area of similar devices was 28.8 °C / 83.8 F (+2 °C / 3.6 F).
Speakers
The speakers are only average, unfortunately. The maximum volume is disappointingly low and most mids and some highs sound very distorted and overmodulated. The fact that the 2x2-watt speakers fire downward is very noticeable and means the sound changes depending on the surface the device is placed on.
MSI GF75 8RD-001 audio analysis
(-) | not very loud speakers (66.8 dB)
Bass 100 - 315 Hz
(-) | nearly no bass - on average 17.3% lower than median
(±) | linearity of bass is average (13.5% delta to prev. frequency)
Mids 400 - 2000 Hz
(±) | higher mids - on average 6.9% higher than median
(-) | mids are not linear (16.5% delta to prev. frequency)
Highs 2 - 16 kHz
(+) | balanced highs - only 3.8% away from median
(±) | linearity of highs is average (9.8% delta to prev. frequency)
Overall 100 - 16.000 Hz
(-) | overall sound is not linear (31.4% difference to median)
Compared to same class
» 97% of all tested devices in this class were better, 1% similar, 2% worse
» The best had a delta of 6%, average was 18%, worst was 132%
Compared to all devices tested
» 90% of all tested devices were better, 2% similar, 8% worse
» The best had a delta of 4%, average was 24%, worst was 134%
Apple MacBook 12 (Early 2016) 1.1 GHz audio analysis
(+) | speakers can play relatively loud (83.6 dB)
Bass 100 - 315 Hz
(±) | reduced bass - on average 11.3% lower than median
(±) | linearity of bass is average (14.2% delta to prev. frequency)
Mids 400 - 2000 Hz
(+) | balanced mids - only 2.4% away from median
(+) | mids are linear (5.5% delta to prev. frequency)
Highs 2 - 16 kHz
(+) | balanced highs - only 2% away from median
(+) | highs are linear (4.5% delta to prev. frequency)
Overall 100 - 16.000 Hz
(+) | overall sound is linear (10.2% difference to median)
Compared to same class
» 7% of all tested devices in this class were better, 2% similar, 91% worse
» The best had a delta of 5%, average was 18%, worst was 53%
Compared to all devices tested
» 5% of all tested devices were better, 1% similar, 94% worse
» The best had a delta of 4%, average was 24%, worst was 134%
Energy Management - battery too small
Power Consumption
The MSI GF75 has very average consumption rates. It requires around 11.9 watts while idling and 86 watts under load. We measured a maximum consumption of 131 watts. The included power supply has a rated output of 135 watts - just enough to cover the device's peak consumption. These values position the MSI in the middle of all the devices we have tested that were equipped with a GTX 1050 Ti Max-Q.
| Off / Standby | |
| Idle | |
| Load |
|
Key:
min: | |
| MSI GF75 8RD-001 i7-8750H, GeForce GTX 1050 Ti Max-Q, Kingston RBUSNS8154P3256GJ1, IPS, 1920x1080, 17.3" | Asus TUF FX705GE-EW096T i7-8750H, GeForce GTX 1050 Ti Mobile, SK hynix BC501 HFM128GDJTNG-831, IPS, 1920x1080, 17.3" | Lenovo Legion Y730-17ICH, i7-8750H i7-8750H, GeForce GTX 1050 Ti Mobile, Toshiba KBG30ZMT128G, IPS, 1920x1080, 17.3" | Medion Erazer P6705-MD61131 i7-8750H, GeForce GTX 1050 Ti Mobile, Samsung SSD PM981 MZVLB256HAHQ, TN, 1920x1080, 15.6" | HP Pavilion Gaming 15-cx0003ng i7-8750H, GeForce GTX 1050 Ti Mobile, Intel Optane 16 GB MEMPEK1J016GAH + HGST HTS721010A9E630 1 TB HDD, IPS, 1920x1080, 15.6" | Acer Aspire 7 A715-72G-704Q i7-8750H, GeForce GTX 1050 Ti Mobile, Intel SSD 760p SSDPEKKW256G8, IPS, 1920x1080, 15.6" | Average NVIDIA GeForce GTX 1050 Ti Max-Q | Average of class Gaming | |
|---|---|---|---|---|---|---|---|---|
| Power Consumption | 15% | 4% | 18% | 7% | 23% | 4% | -73% | |
| Idle Minimum * (Watt) | 6.5 | 3.8 42% | 6.3 3% | 4 38% | 5.5 15% | 3.9 40% | 5.8 ? 11% | 13.2 ? -103% |
| Idle Average * (Watt) | 11.9 | 9 24% | 11 8% | 7 41% | 8.5 29% | 6.6 45% | 11.2 ? 6% | 18.9 ? -59% |
| Idle Maximum * (Watt) | 13.1 | 11.2 15% | 11.5 12% | 11 16% | 11.9 9% | 8.5 35% | 13.5 ? -3% | 24.3 ? -85% |
| Load Average * (Watt) | 86 | 101 -17% | 89.8 -4% | 72 16% | 94 -9% | 89 -3% | 86.9 ? -1% | 108.3 ? -26% |
| Load Maximum * (Watt) | 131 | 119.7 9% | 130.7 -0% | 158 -21% | 144 -10% | 134 -2% | 122.4 ? 7% | 254 ? -94% |
| Witcher 3 ultra * (Watt) | 102 | 79 | 86 |
* ... smaller is better
Battery Runtimes
MSI could have fit a larger battery into the 17.3-inch case, but we must make do with a 51-Wh li-polymer battery. Even the 15.6-inch comparison devices such as the Lenovo Thinkpad X1 Extreme or the HP Spectre X360 are equipped with 80 Wh. This makes the runtime rather disappointing. The MSI manages around six hours on battery while idling and can play our Big Buck Bunny video in a loop for around 3.5 hours. The Wi-Fi test goes on for 4.5 hours while the device turns off after around one hour of full load (Battery Eater test). These results are average for our comparison field, but we would have expected slightly longer runtimes from this device, particularly due to the use of the Max-Q version.
| MSI GF75 8RD-001 i7-8750H, GeForce GTX 1050 Ti Max-Q, 51 Wh | Lenovo ThinkPad X1 Extreme-20MF000XGE i7-8750H, GeForce GTX 1050 Ti Max-Q, 80 Wh | HP Spectre x360 15-df0126ng i7-8750H, GeForce GTX 1050 Ti Max-Q, 84 Wh | Acer Aspire 7 A715-72G-704Q i7-8750H, GeForce GTX 1050 Ti Mobile, 48.9 Wh | Asus Zephyrus S GX531GX i7-8750H, GeForce RTX 2080 Max-Q, 50 Wh | Medion Erazer P6705-MD61131 i7-8750H, GeForce GTX 1050 Ti Mobile, 62 Wh | Average of class Gaming | |
|---|---|---|---|---|---|---|---|
| Battery runtime | 71% | 130% | 54% | -36% | 70% | 66% | |
| Reader / Idle (h) | 6.3 | 11.5 83% | 18.8 198% | 12.3 95% | 8.9 41% | 8.71 ? 38% | |
| H.264 (h) | 3.4 | 6.2 82% | 7.7 126% | 6 76% | 8.26 ? 143% | ||
| WiFi v1.3 (h) | 4.7 | 6.4 36% | 8.8 87% | 6.4 36% | 3 -36% | 6.7 43% | 7.04 ? 50% |
| Load (h) | 1.1 | 2 82% | 2.3 109% | 1.2 9% | 2.5 127% | 1.47 ? 34% | |
| Witcher 3 ultra (h) | 1.1 |
Pros
Cons
Verdict
MSI has tried to focus on the essential for the GF75 and has managed to create a decent device. It has sufficient performance to be considered a gaming laptop while offering a thin case and light-weight build. Although the energy-efficient GeForce 1050 Ti Max-Q with a slightly limited clock rate will not manage to display current games at high details, it should display most titles smoothly at medium settings.
Instead, MSI has chosen to keep the port selection to an absolute minimum. This is probably due to the thin build as well as in order to keep the price of the device under a certain limit.
If you can live without thunderbolt and a DisplayPort connector and do not need an SD card reader or special security features such as a fingerprint reader, then you could be very happy with this affordable device that includes a GTX 1050 Ti Max-Q.
The IPS display is very good and can easily keep up with the GF75's competition. The Cinebench results are not quite as rosy with the GF75 bringing up the rear. We got the impression that the manufacturer was slightly too careful to keep system noise down. The fan is very quiet and could have reached a higher RPM. The battery could also do with a power increase. While the runtimes are sufficient for a 17-inch gamer that is always connected to power supply at home, things might get tight when using the device on the go.
Overall, we would say that mid-range gamers playing current games should be very happy with the price-to-performance ratio the MSI GF75 Thin offers. And its exterior is very attractive. Potential buyers will have to decide for themselves whether they can accept the downsides such as the cheap-looking plastic bottom. Should this be the case, they will be rewarded with a reasonably fast device that offers a solid performance.
MSI GF75 8RD-001
- 04/30/2019 v7 (old)
Daniel Puschina
Price comparison

