Schenker XMG Neo 17 (Core i7-8750H, GeForce RTX 2070) Tongfang GK7CP7S Laptop Review

NVIDIA unveiled its GeForce RTX 20 series late last year, which has triggered a slew of manufacturers to update their laptops to the new set of GPUs. Schenker Technologies has done just that and wants to shake up the market with the XMG Neo 17, a 17.3-inch high-end machine that has the ASUS ROG Strix Scar II GL704, ASUS ROG Zephyrus S GX701GX, Lenovo Legion Y740-17ICH, and the MSI GE75 Raider 8SF in its sights.
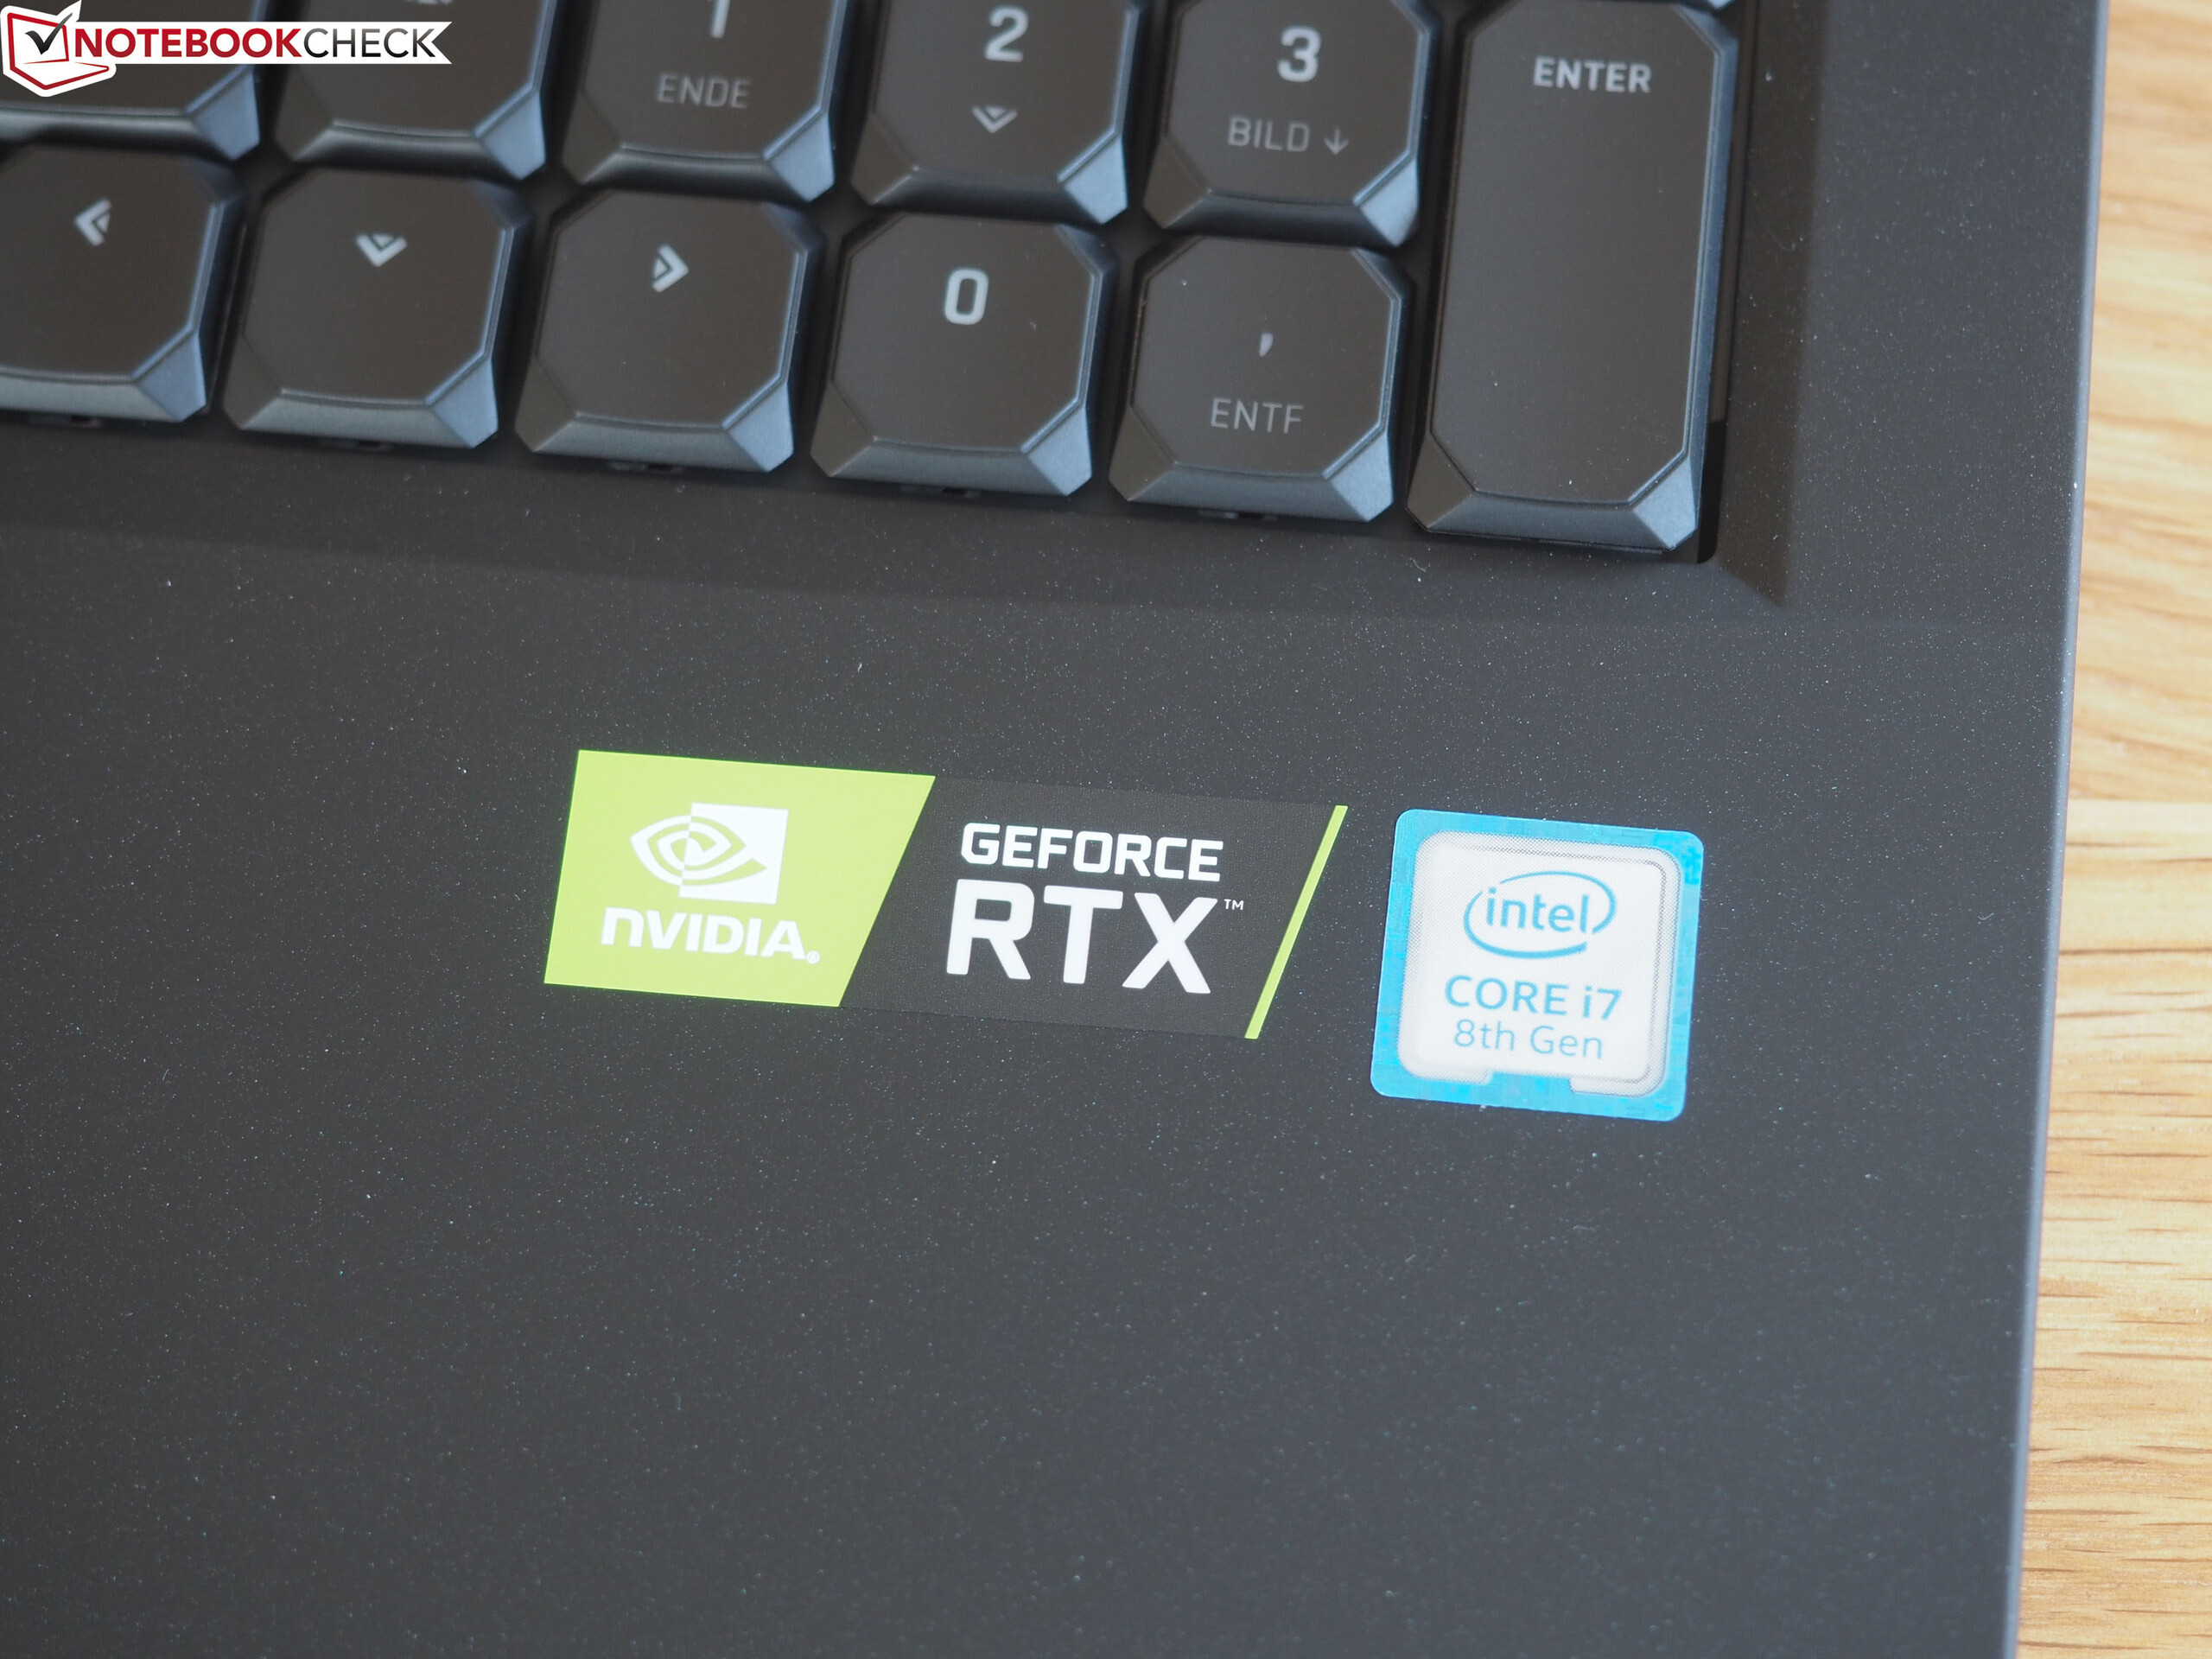
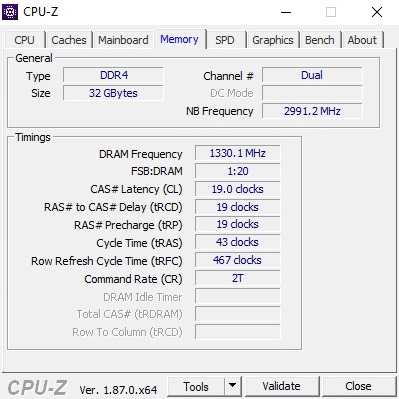
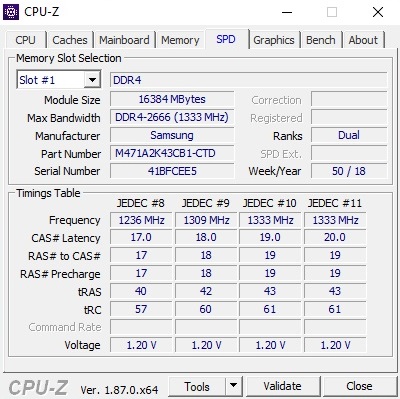
As is typical for Schenker, the XMG Neo 17 can be individually configured on the company’s website. You can configure up to 64 GB of DDR4 RAM and a maximum of three hard drives along with a choice between the GeForce RTX 2060 or GeForce RTX 2070. All devices come with an Intel Core i7-8750H hexa-core processor and a 17.3-inch, 1080p display that has a matte finish and a 144 Hz refresh rate. XMG also has gone with NVIDIA Optimus, which allows for the XMG Neo 17 to switch between its dedicated and integrated GPUs, rather than NVIDIA G-Sync.
Case
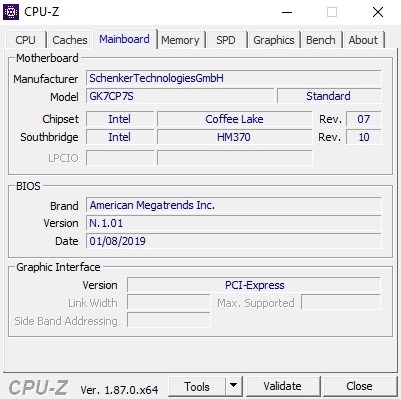
Schenker has built the XMG Neo 17 around a Tongfang Barebones case just as it has with the XMG Neo 15. Specifically, the company has used the Tongfang GK7CP7S as the base for the XMG Neo 17, which is a mix of brushed aluminium and soft touch plastic. The display lid is made of the former, while the palm rest and keyboard deck are made of the latter. The soft-touch plastic feels comfortable and gives the XMG Neo 17 a certain value that most other plastic would not. Tongfang has used a cheaper feeling plastic for the bottom case, but this is less of an issue that it would be for a 13-inch or 15-inch laptop as we suspect that most people will keep their XMG Neo 17 largely on a desk and will infrequently carry it around.
Most of the case is sturdy too. We struggled to bend our review unit, although the areas around the trackpad and air intakes on the bottom case give way slightly when we apply pressure with our hands. It is also worth noting that the display lid feels a lot weaker than those in most laptops while flexing it causes the lid to creak and groan.
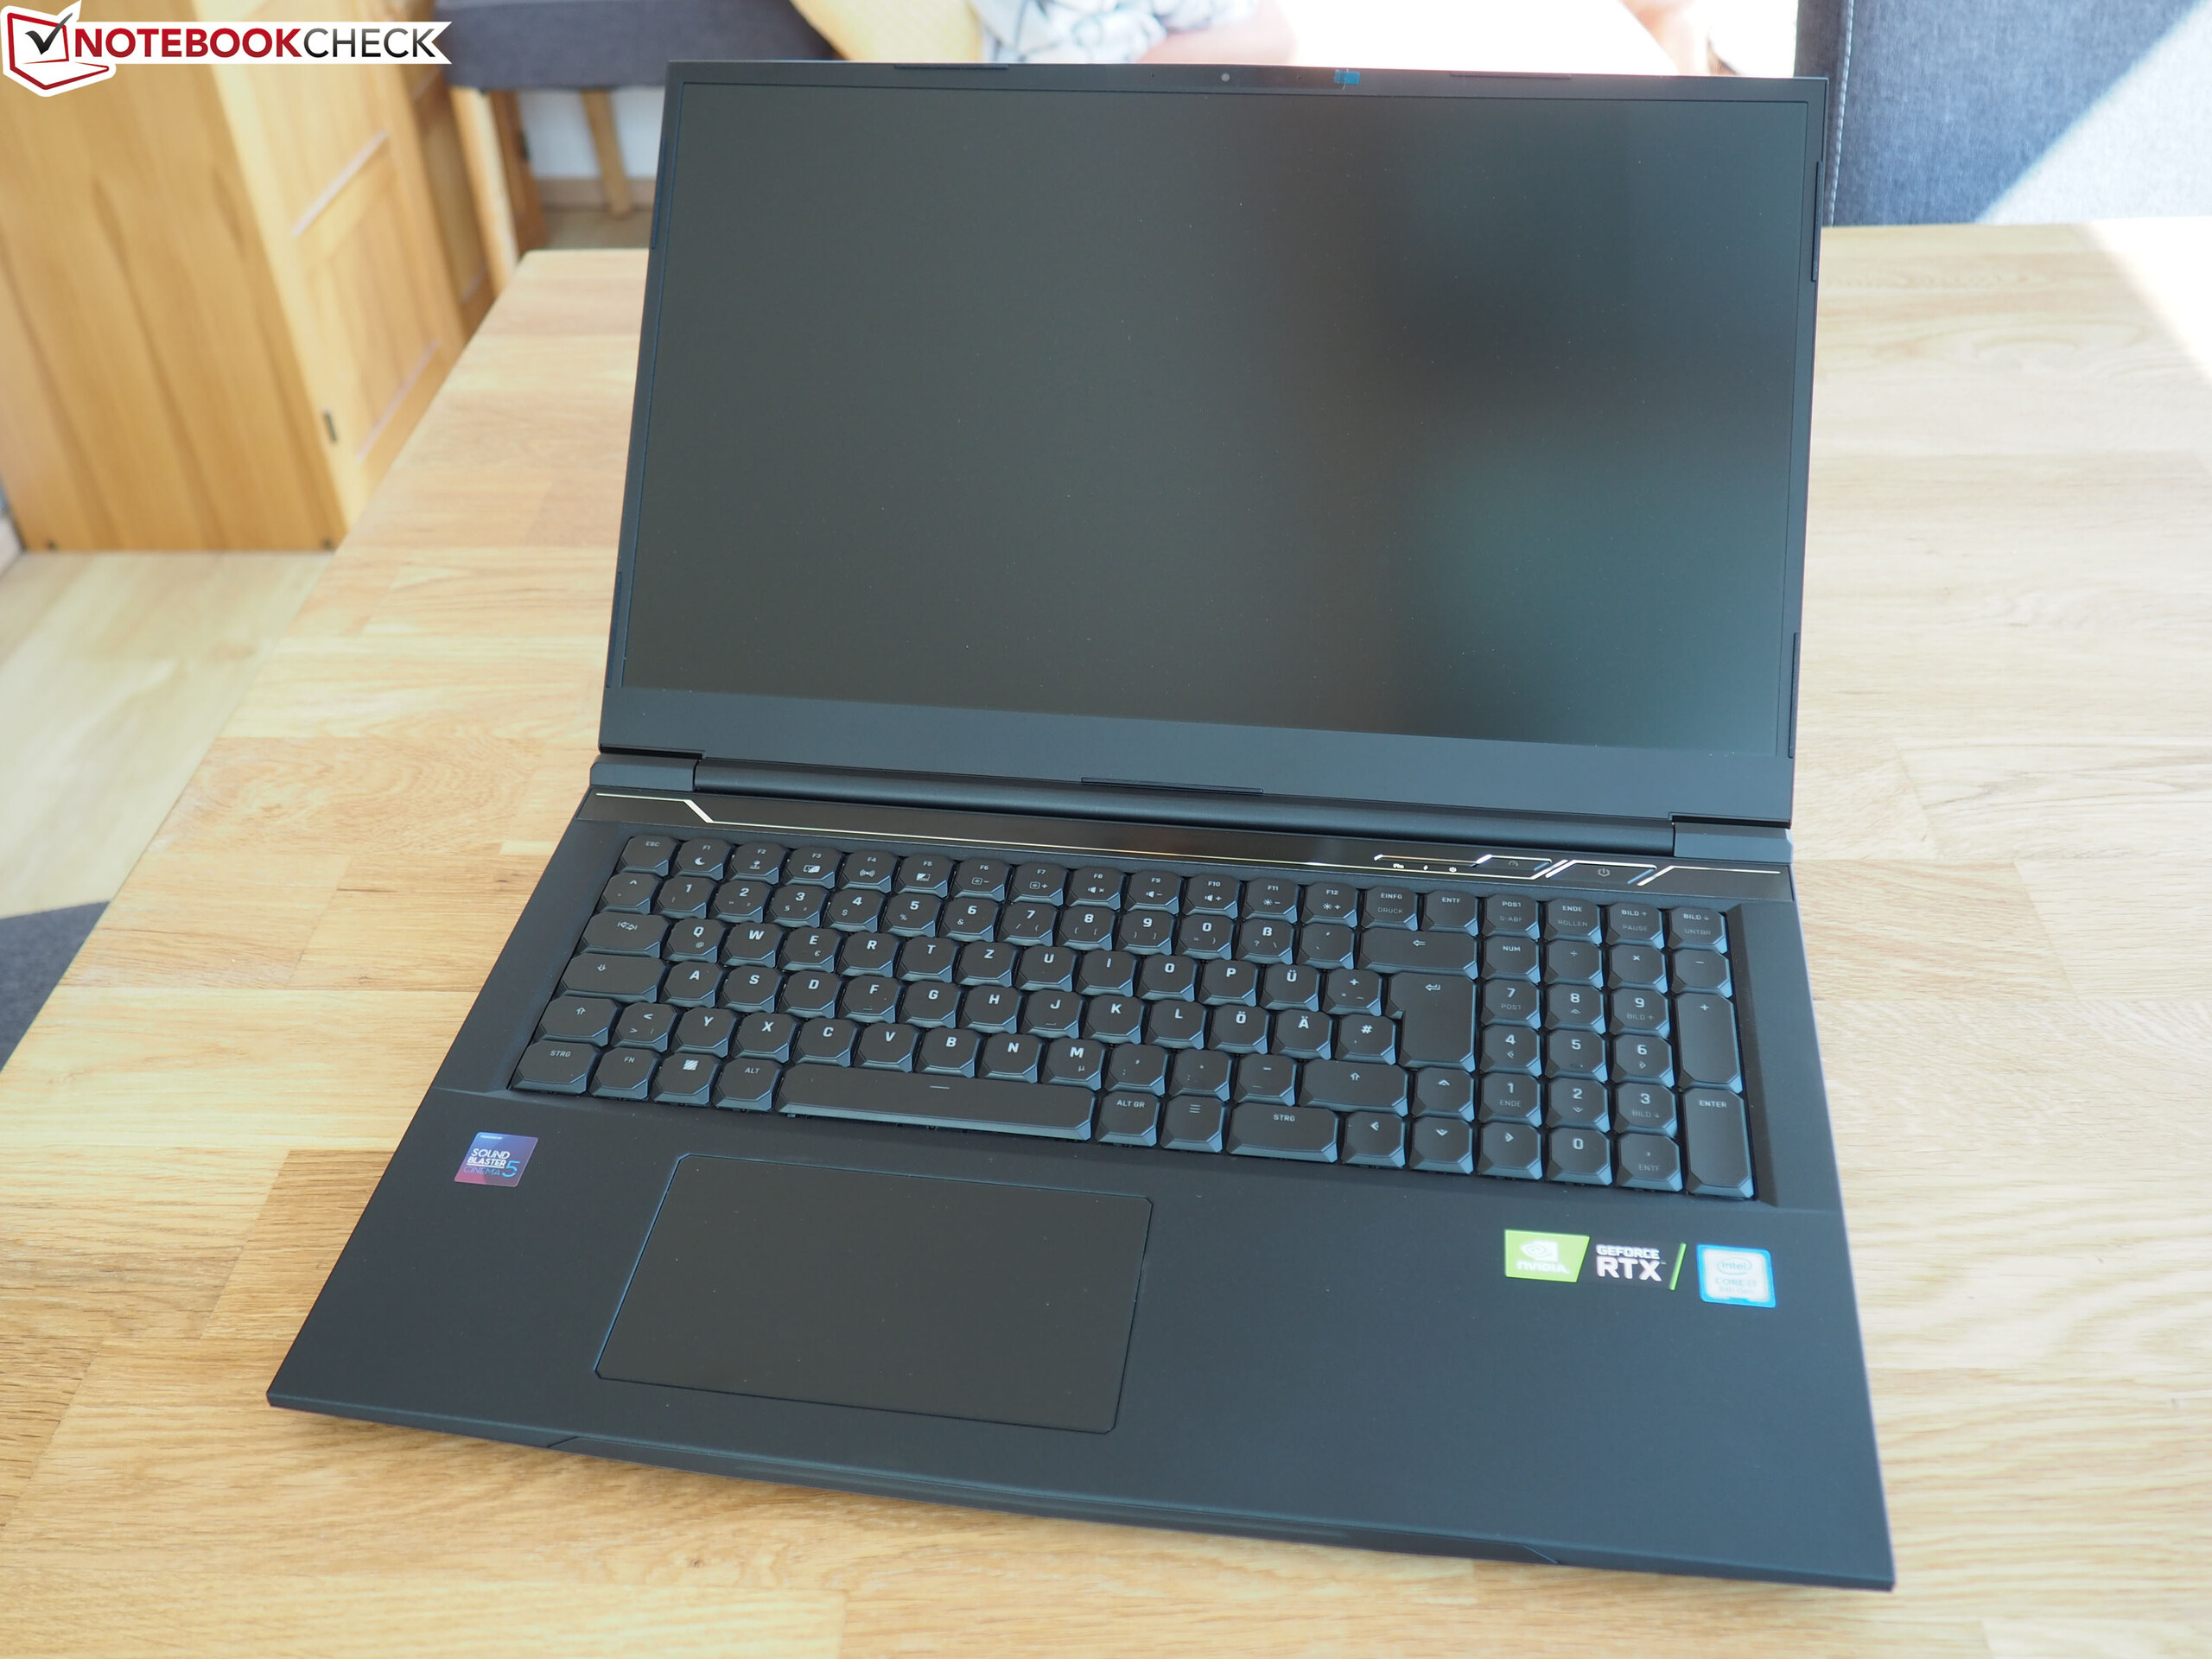
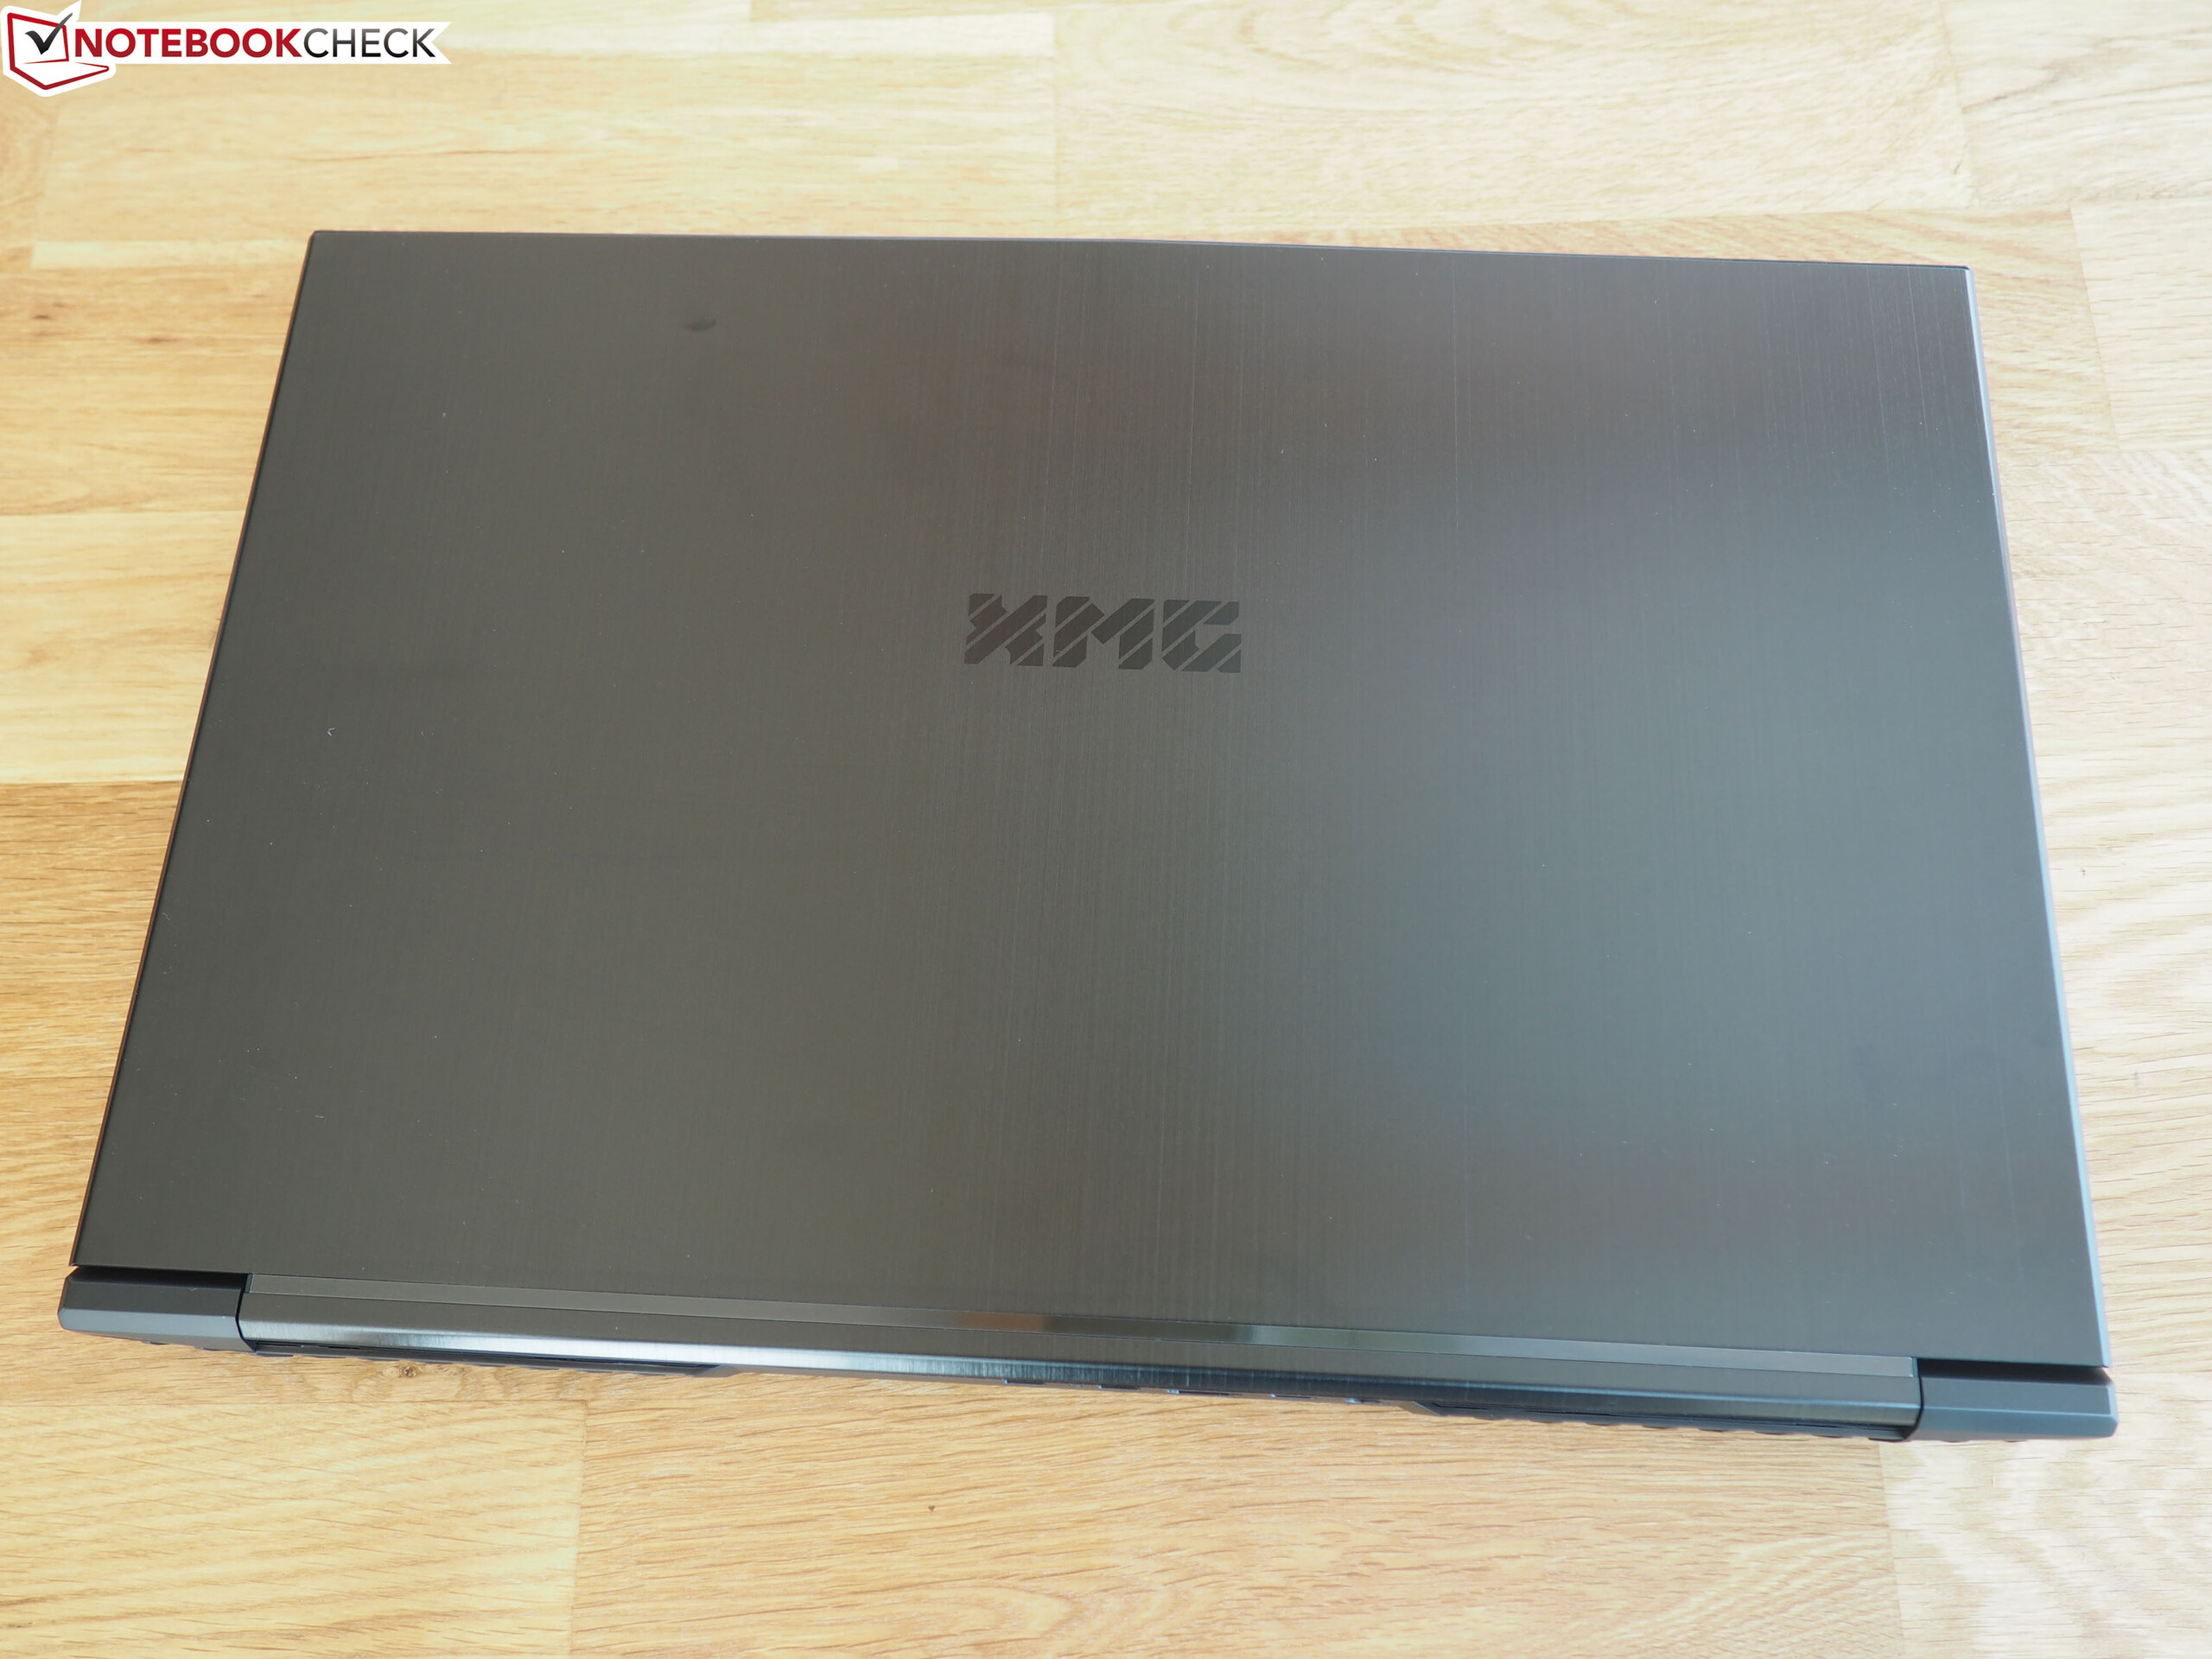
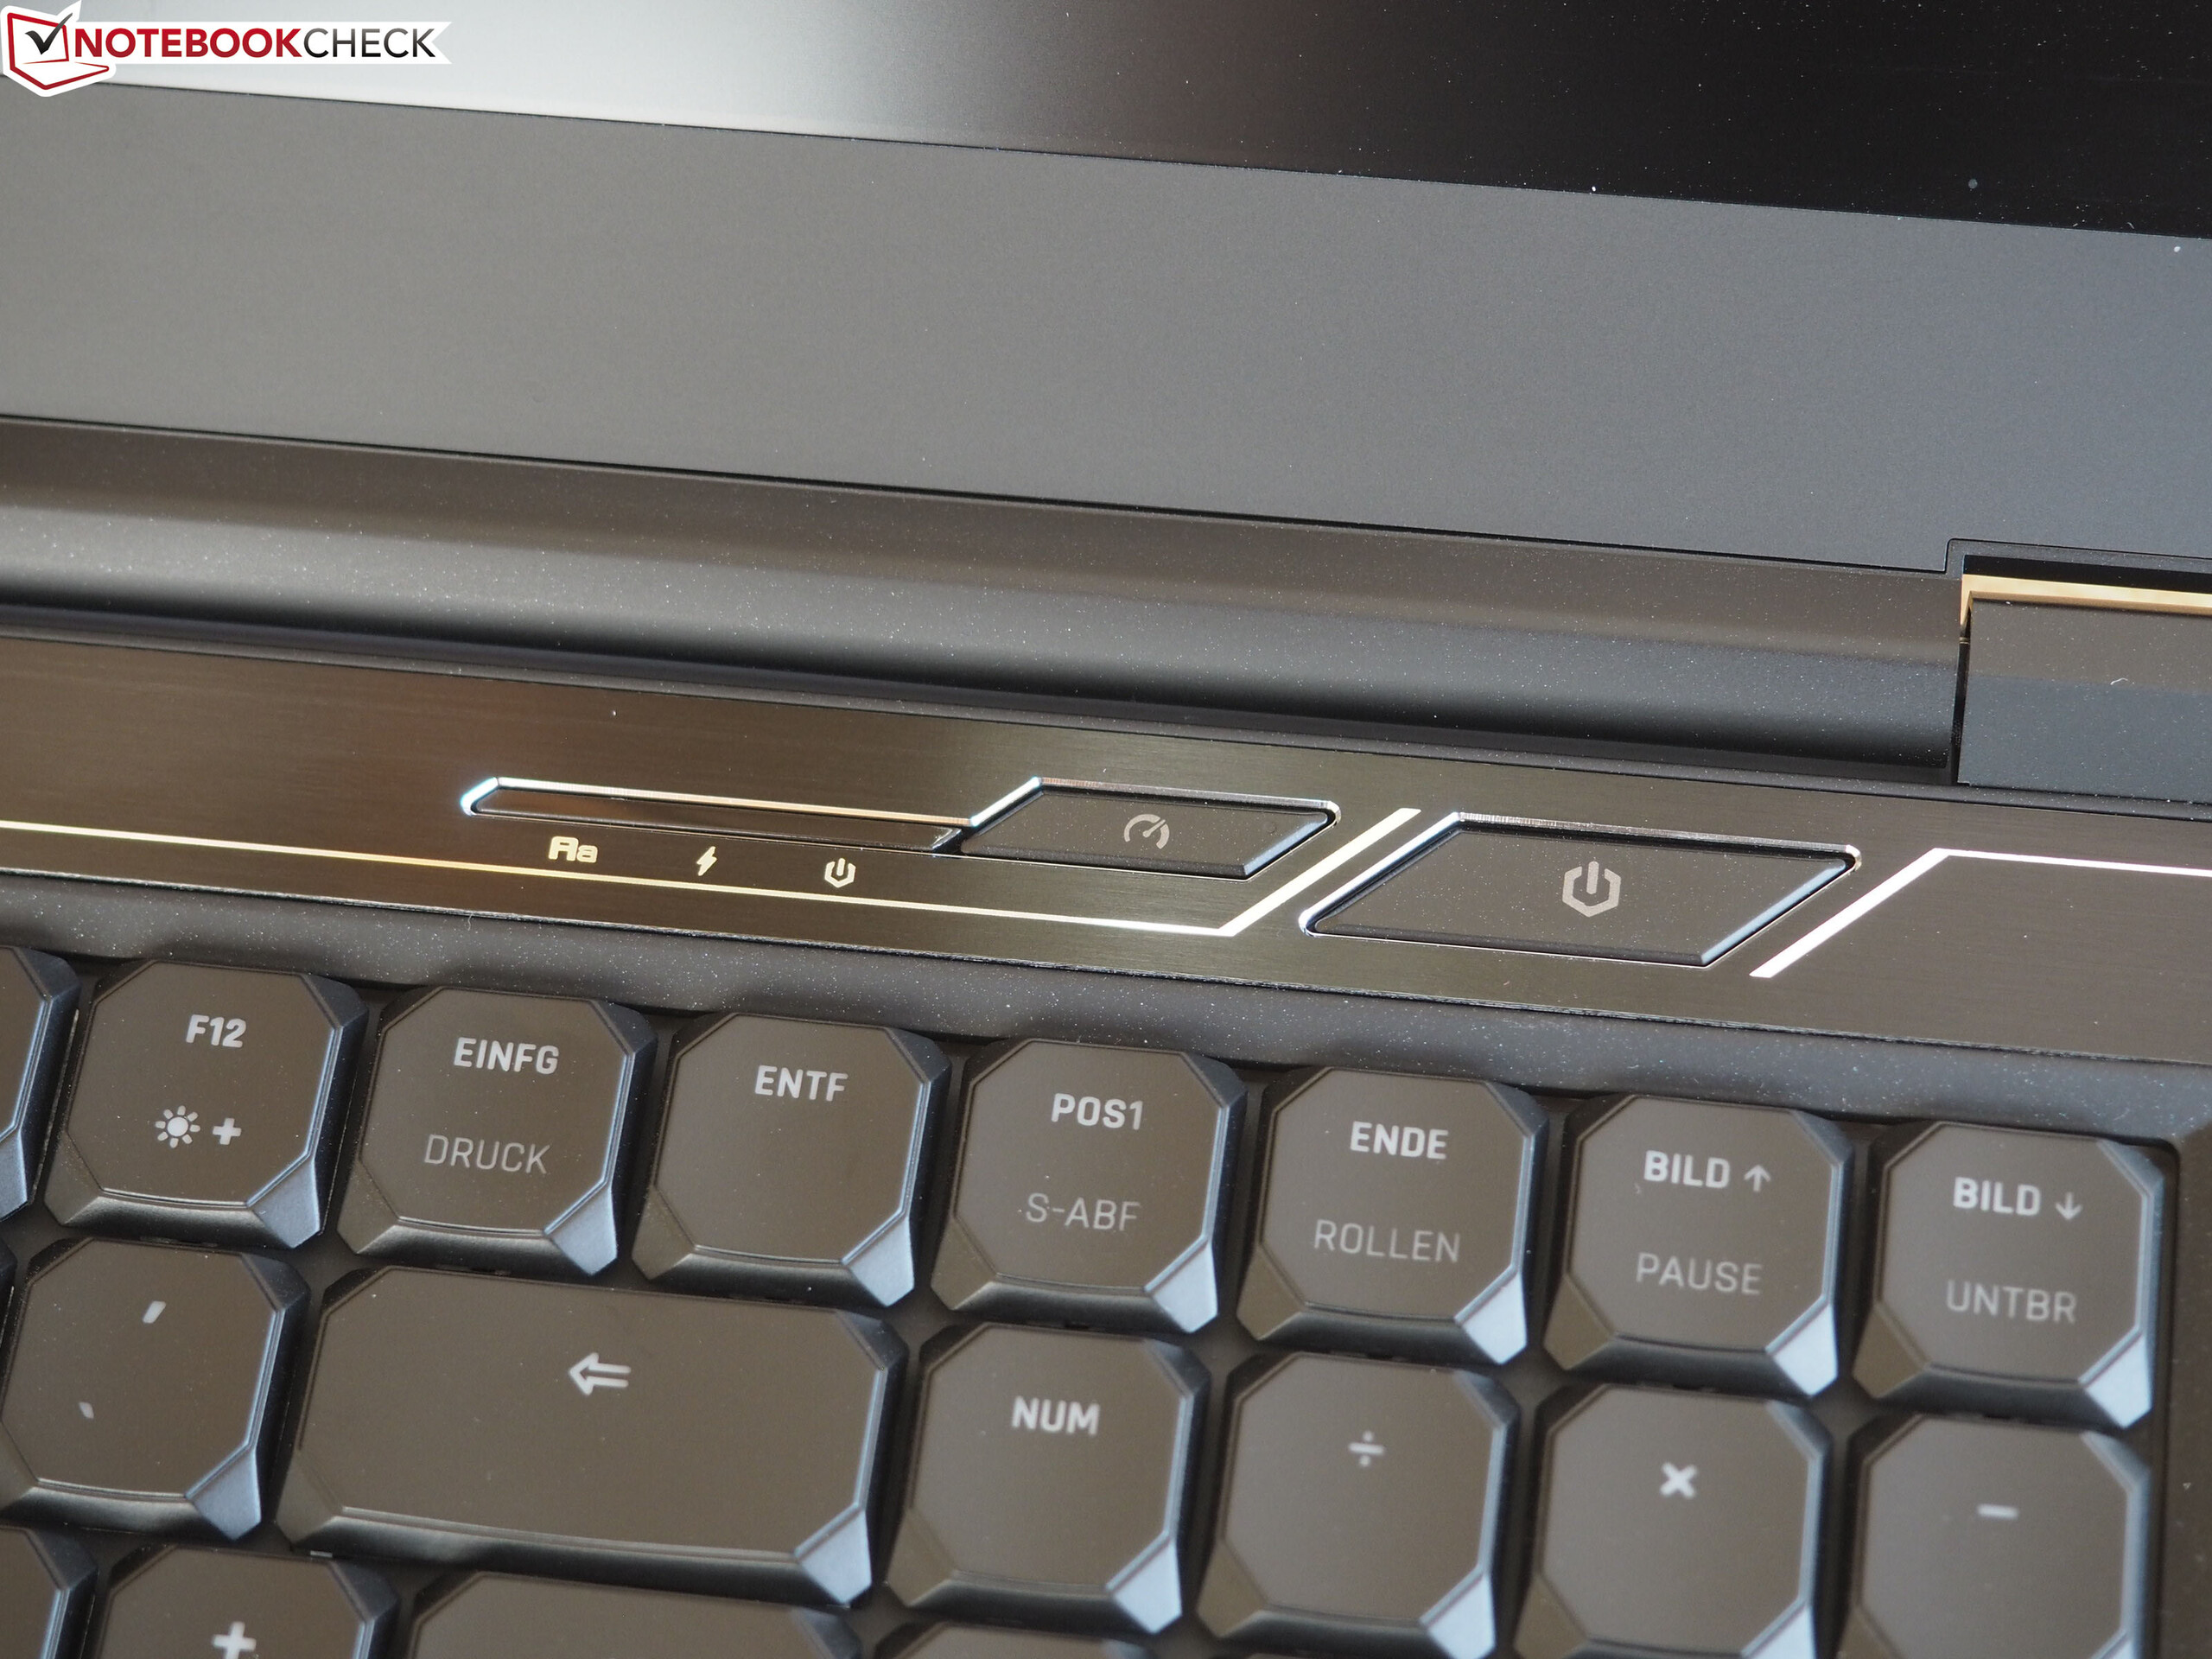
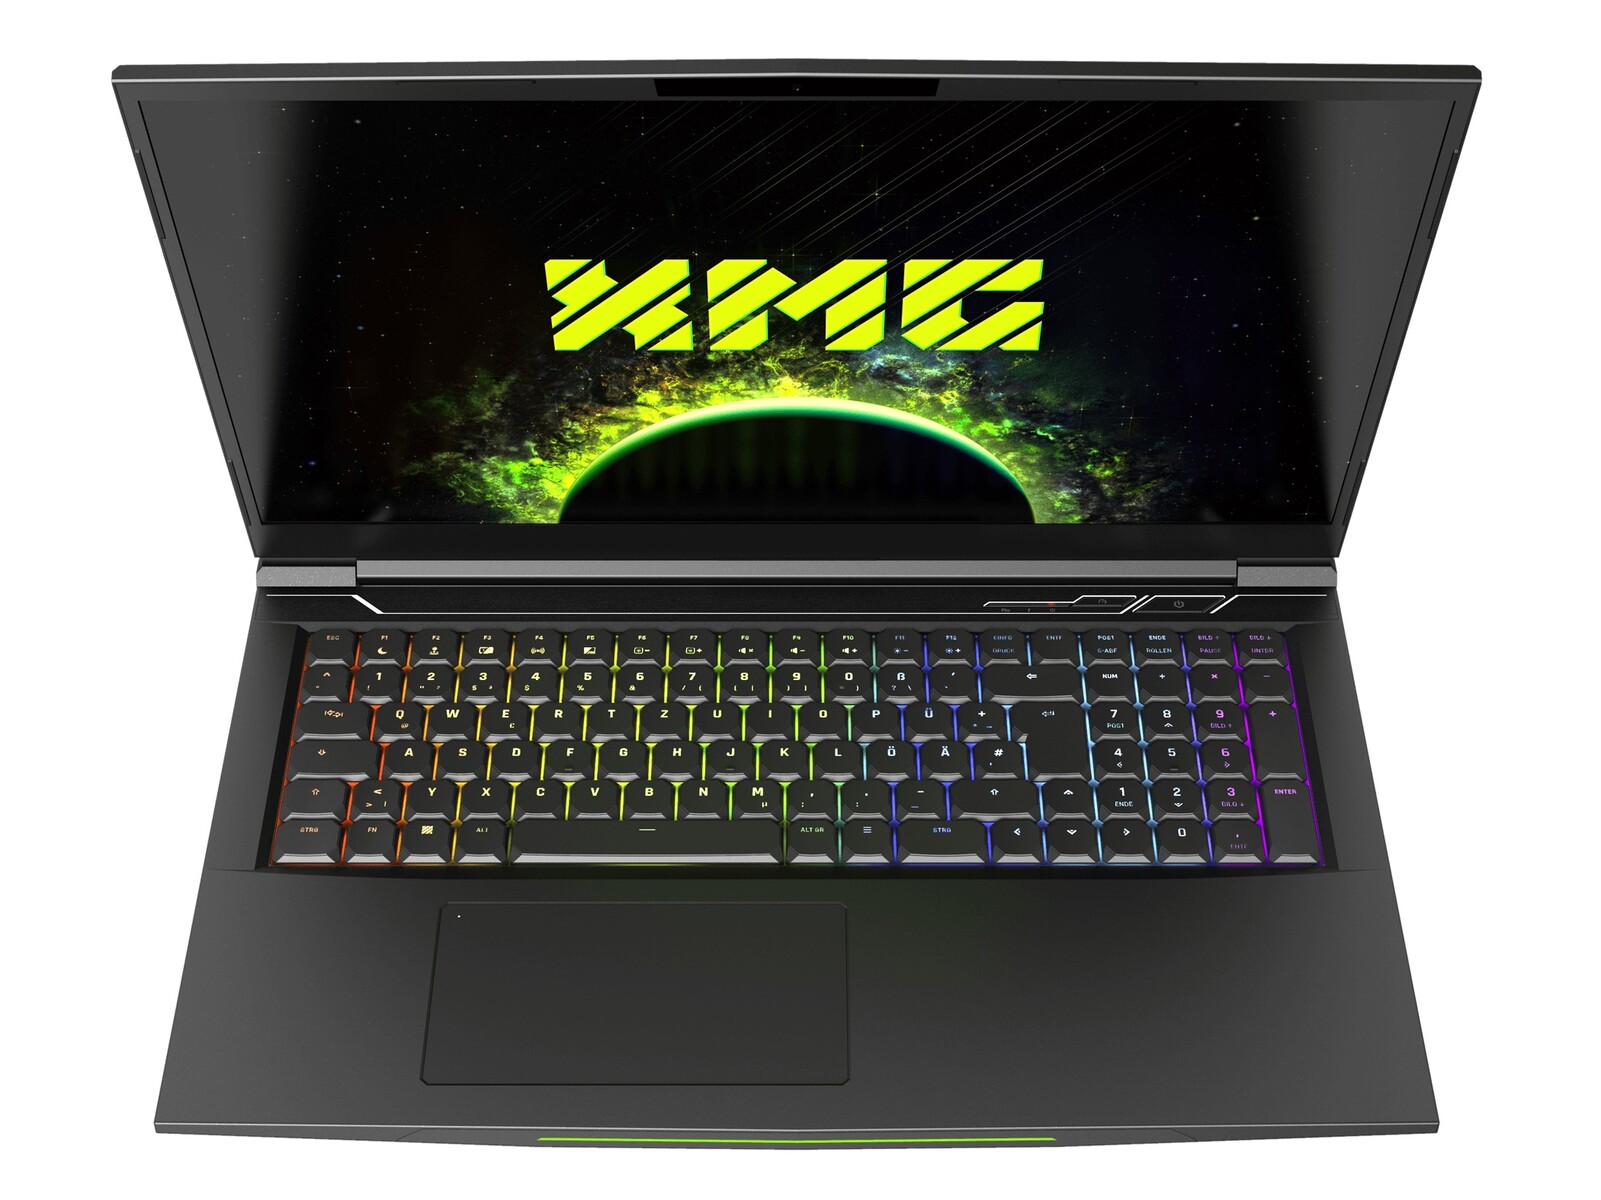
The Neo 17 has a rather simple design for a gaming laptop. The laptop is plan black save for the RGB keyboard backlighting and the status LED strip above the keyboard. There are no RGB strips or aggressive styling like many other gaming laptops have. The Neo 17 is comparatively light too, with our review unit weighing just 2.5 kg (~5.5 lb), which is between 100 g (~3.5 oz) and 400 g (~14 oz) lighter than our comparison devices. It is worth noting that your Neo 17 will weigh more if you factory configure it with an additional SSD or 2.5-inch drive. The Neo 17 is 27.5 mm (~1.1 in) thick though, which is much bulkier than all but the MSI GE75 Raider 8SF of our comparison devices. By contrast, the ASUS ROG Zephyrus S GX701GX is just 19 mm (~0.75 in) thick, while the Lenovo Legion Y740-17ICH is slightly thicker at 23 mm (0.9 in).
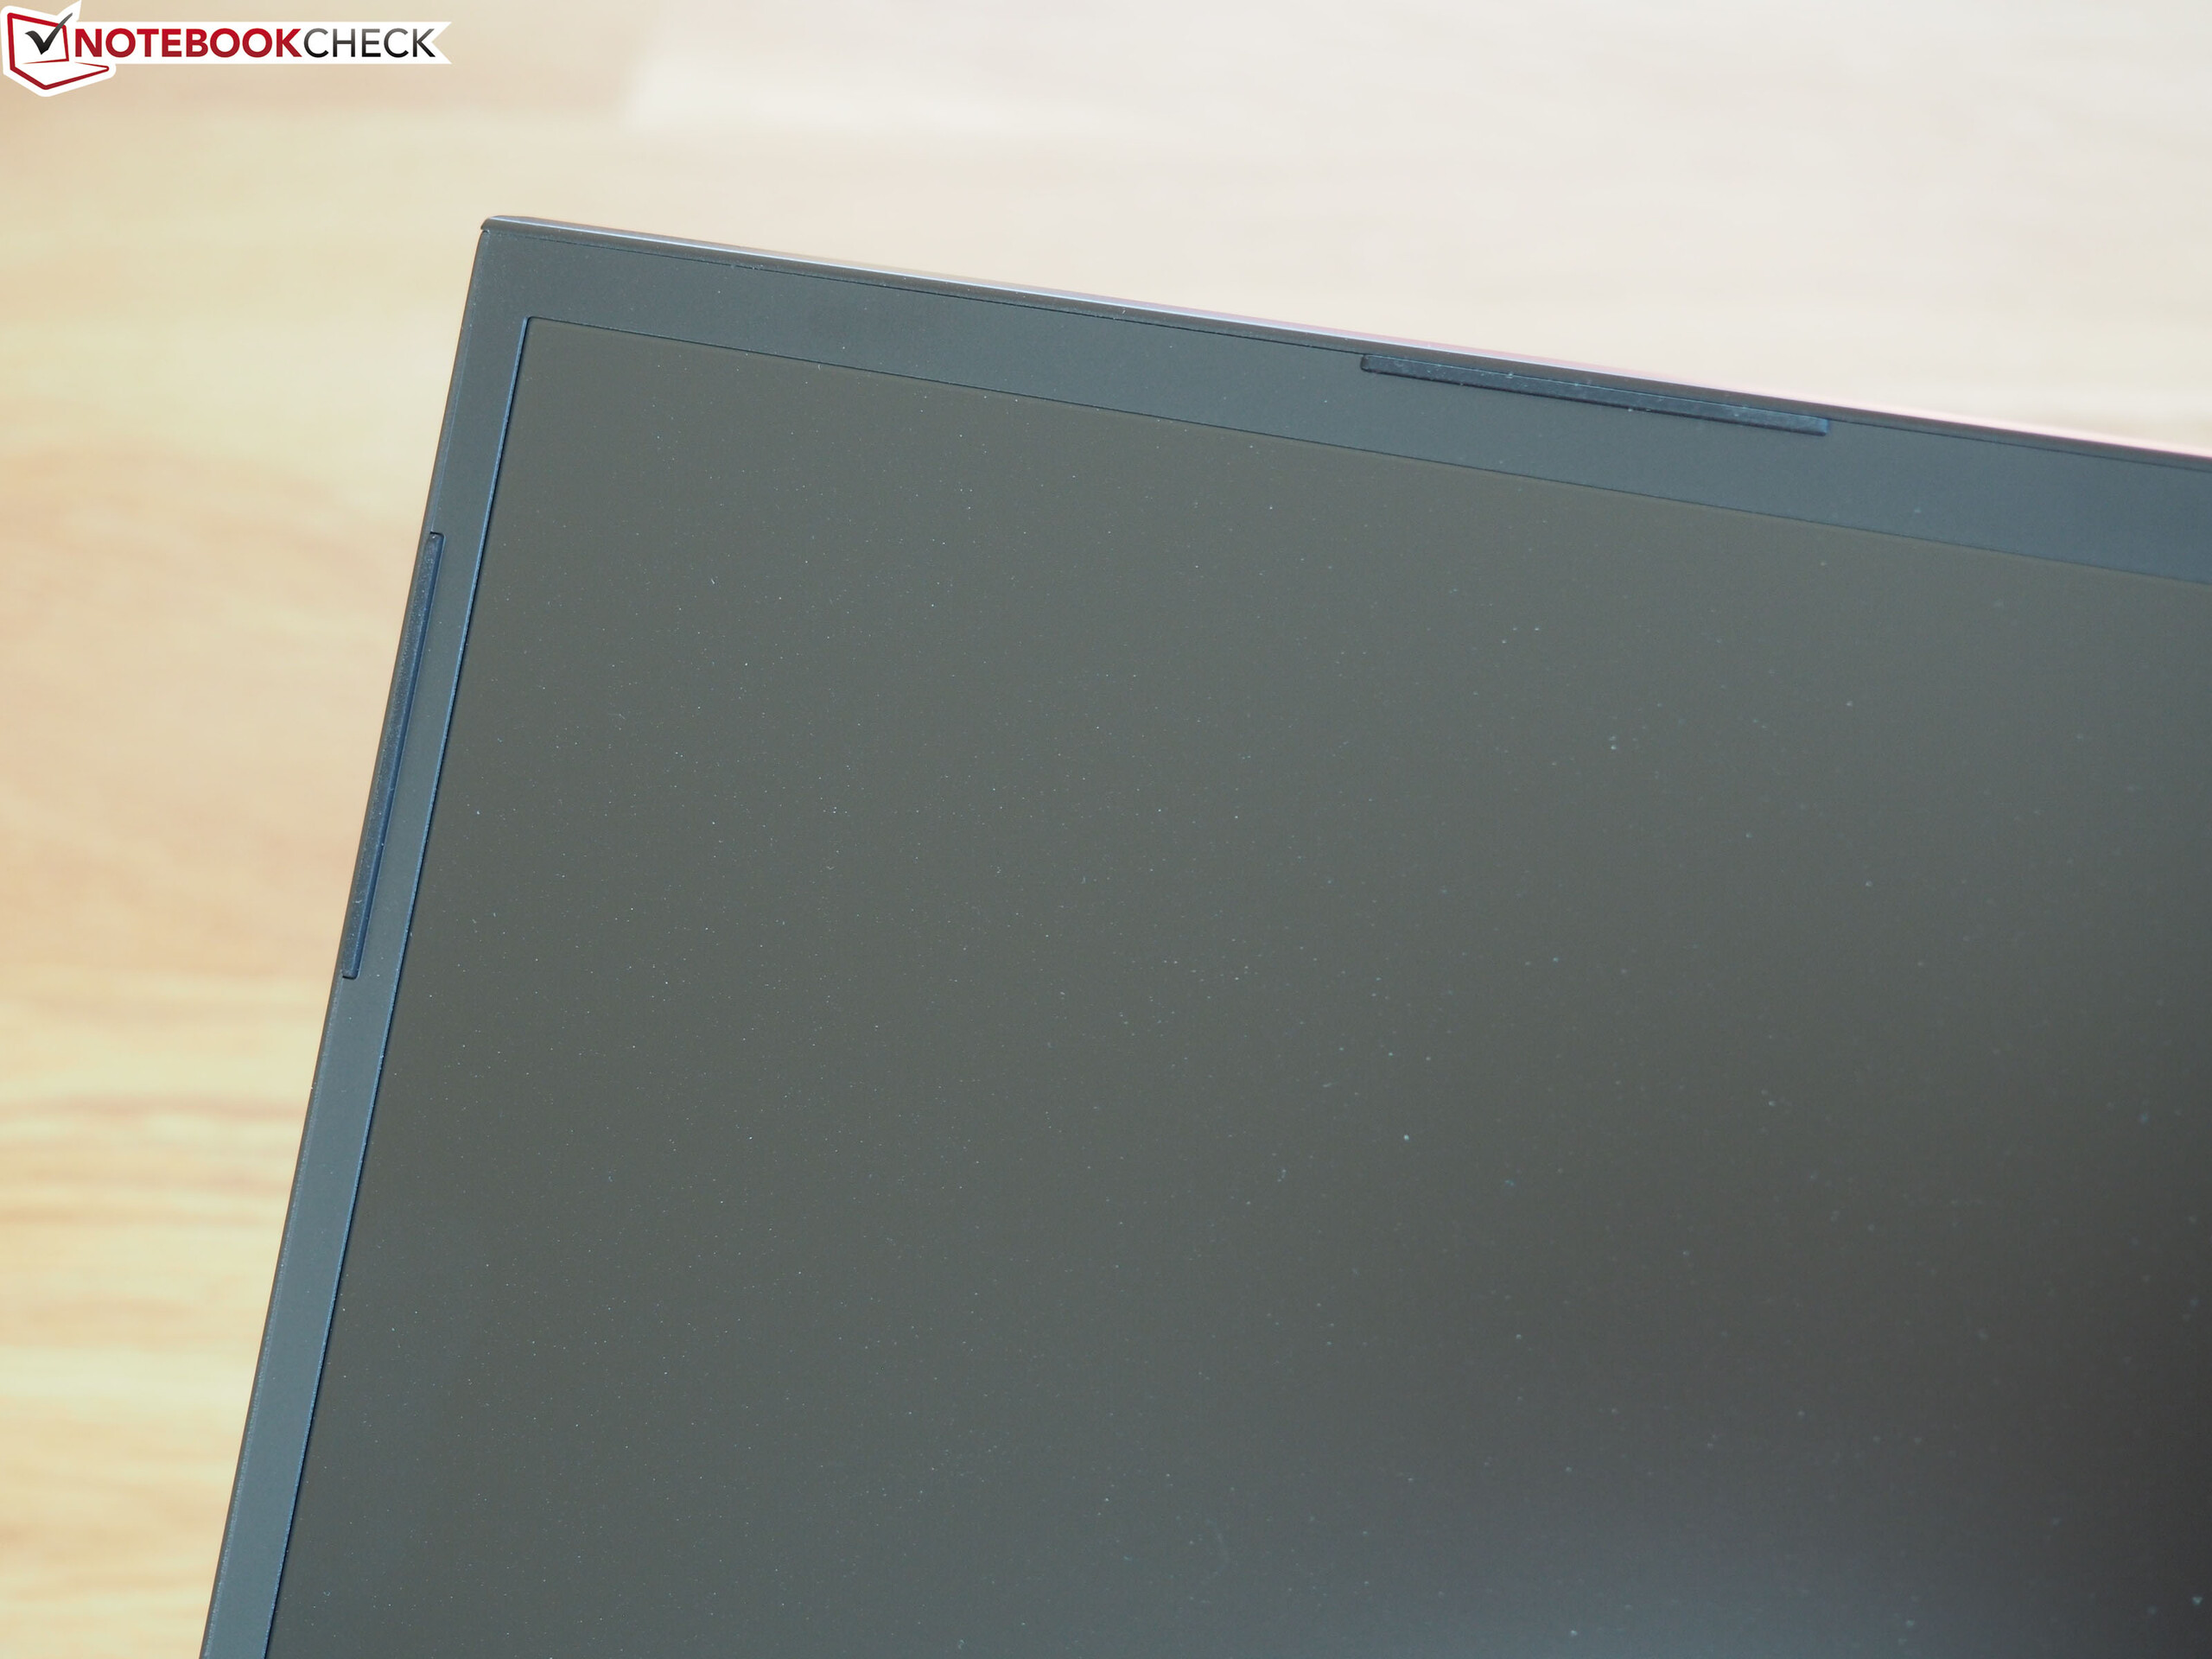
The Neo 17’s added bulk will hopefully allow it to run cooler than most of its contemporaries though. Moreover, our review unit has much smaller display bezels than our comparison devices, which allows it to resemble more of a 15-inch laptop than a 17-inch one.
Our review unit is well built too, and has no processing issues. The hinge is sufficiently balanced to allow the display lid to be opened with one hand, although it resonates slightly when it is open, which we found disconcerting at first.
Connectivity
I/O
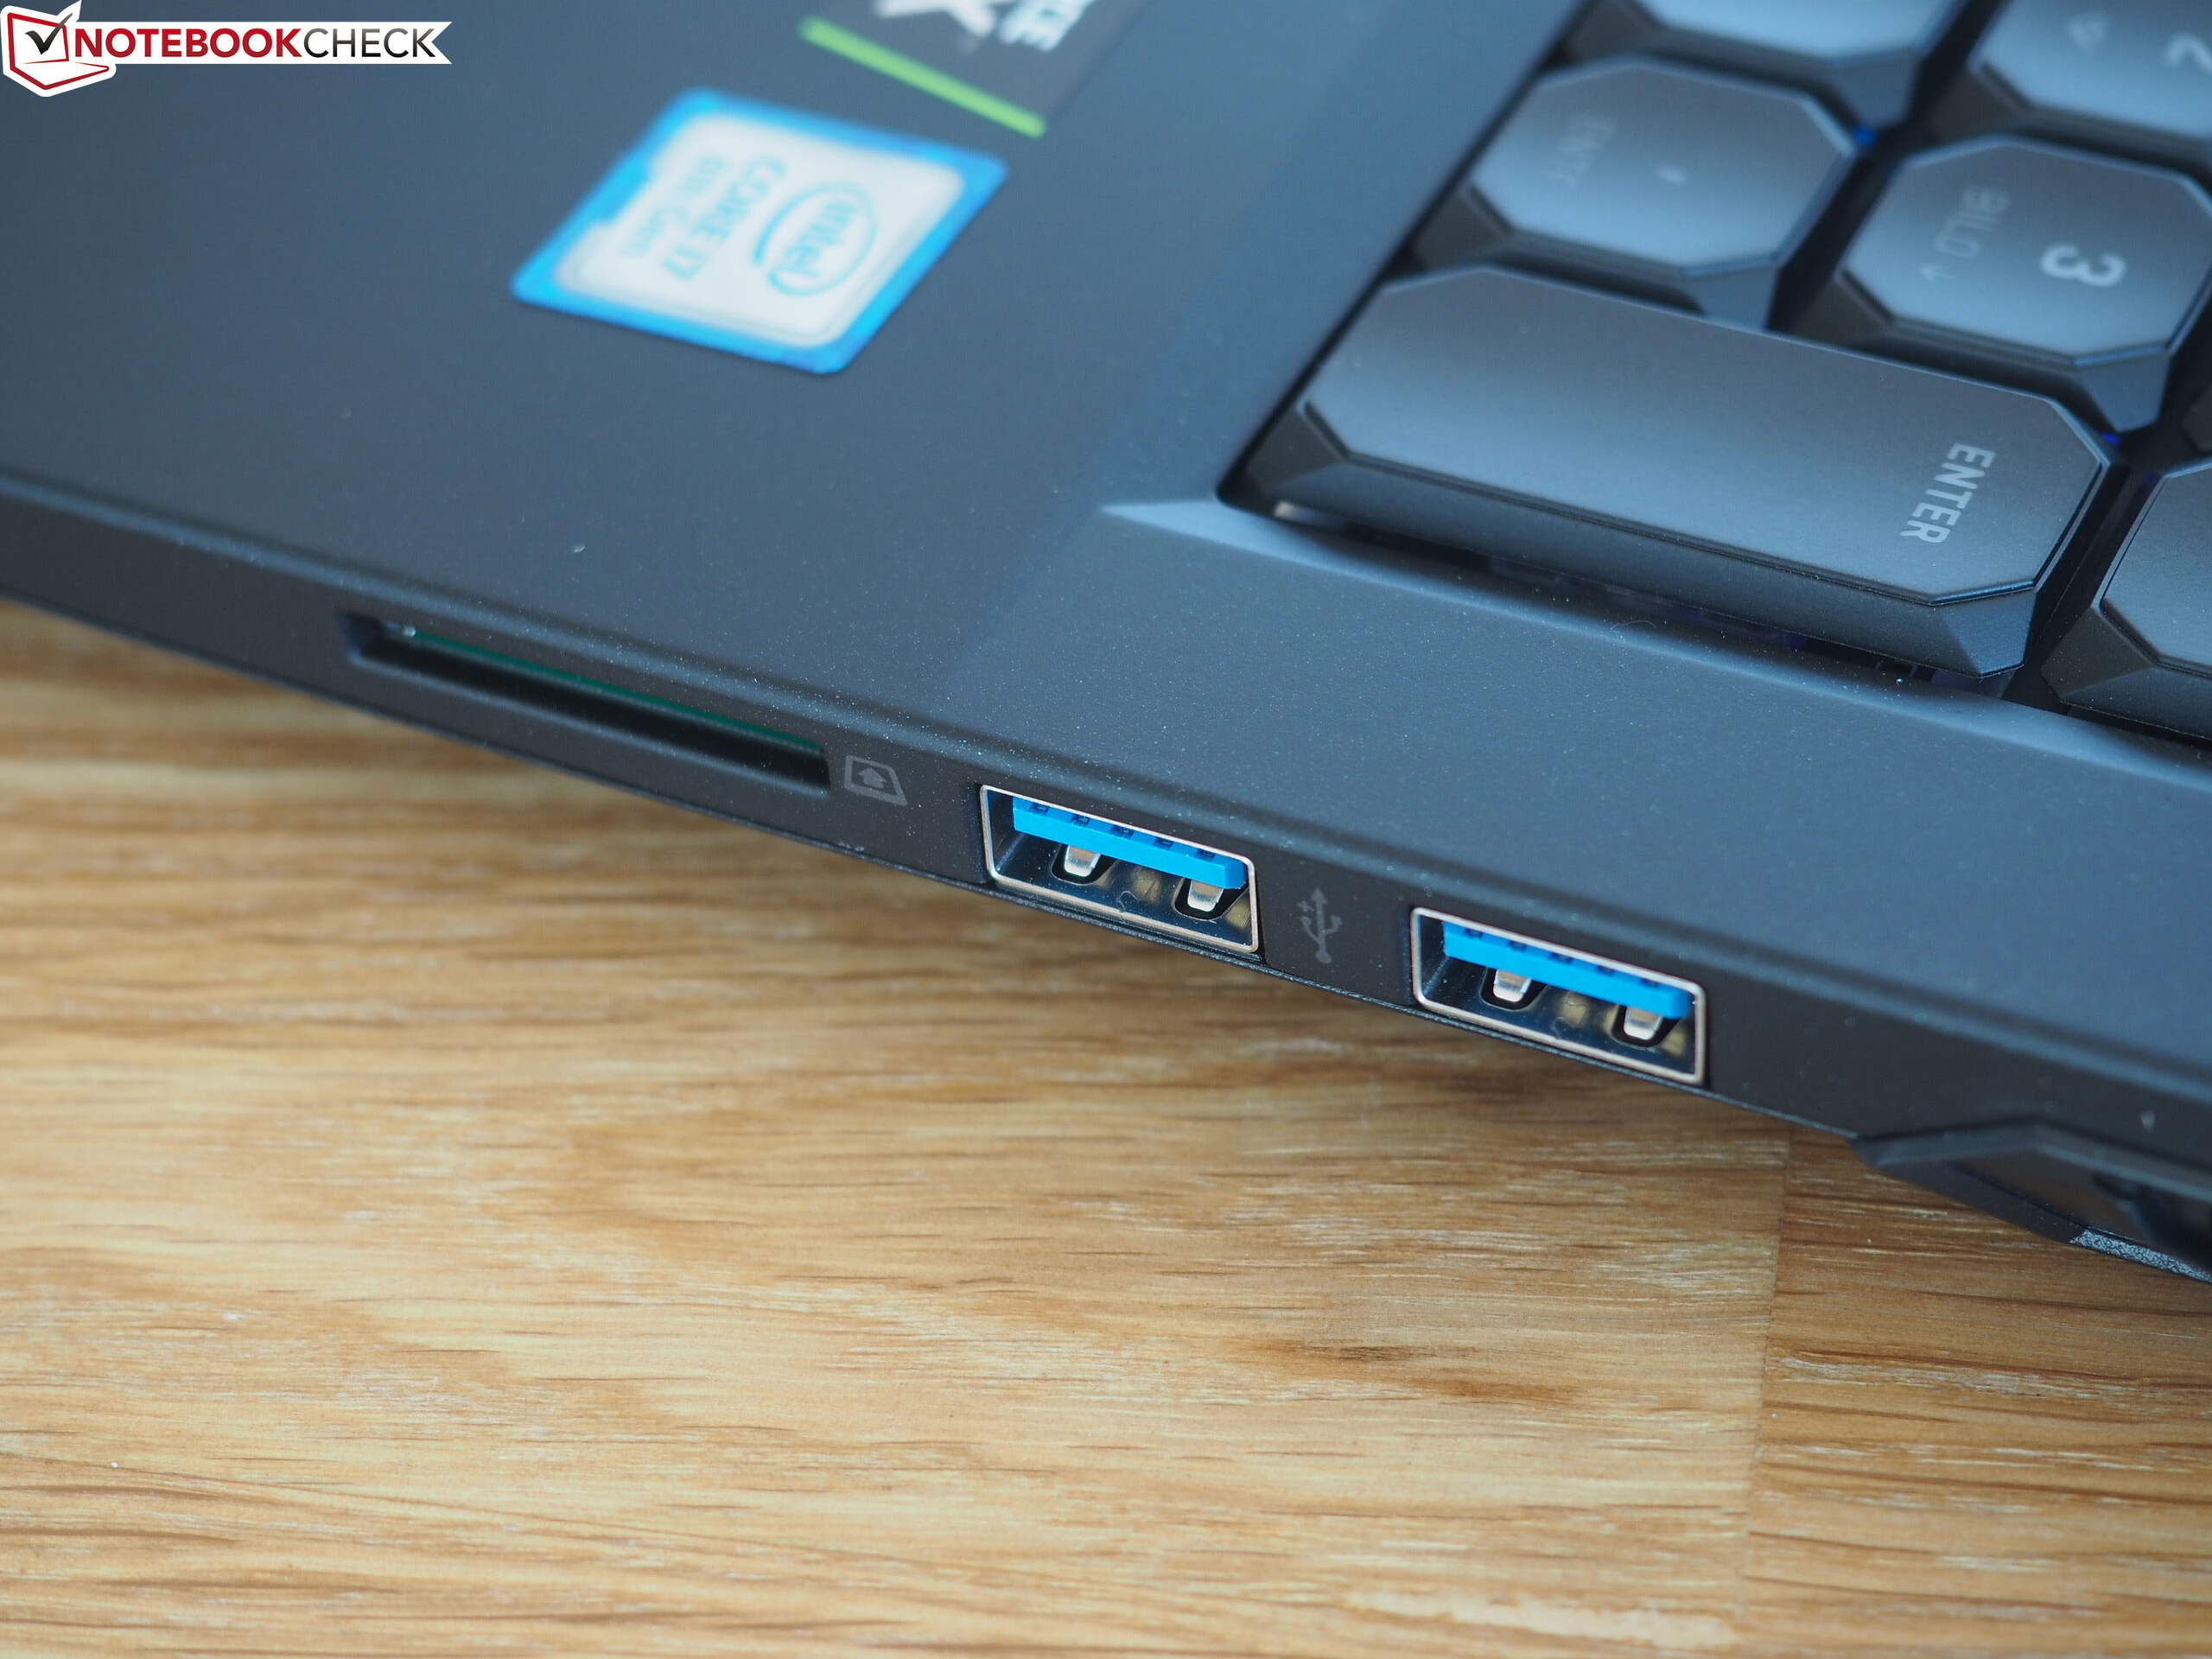
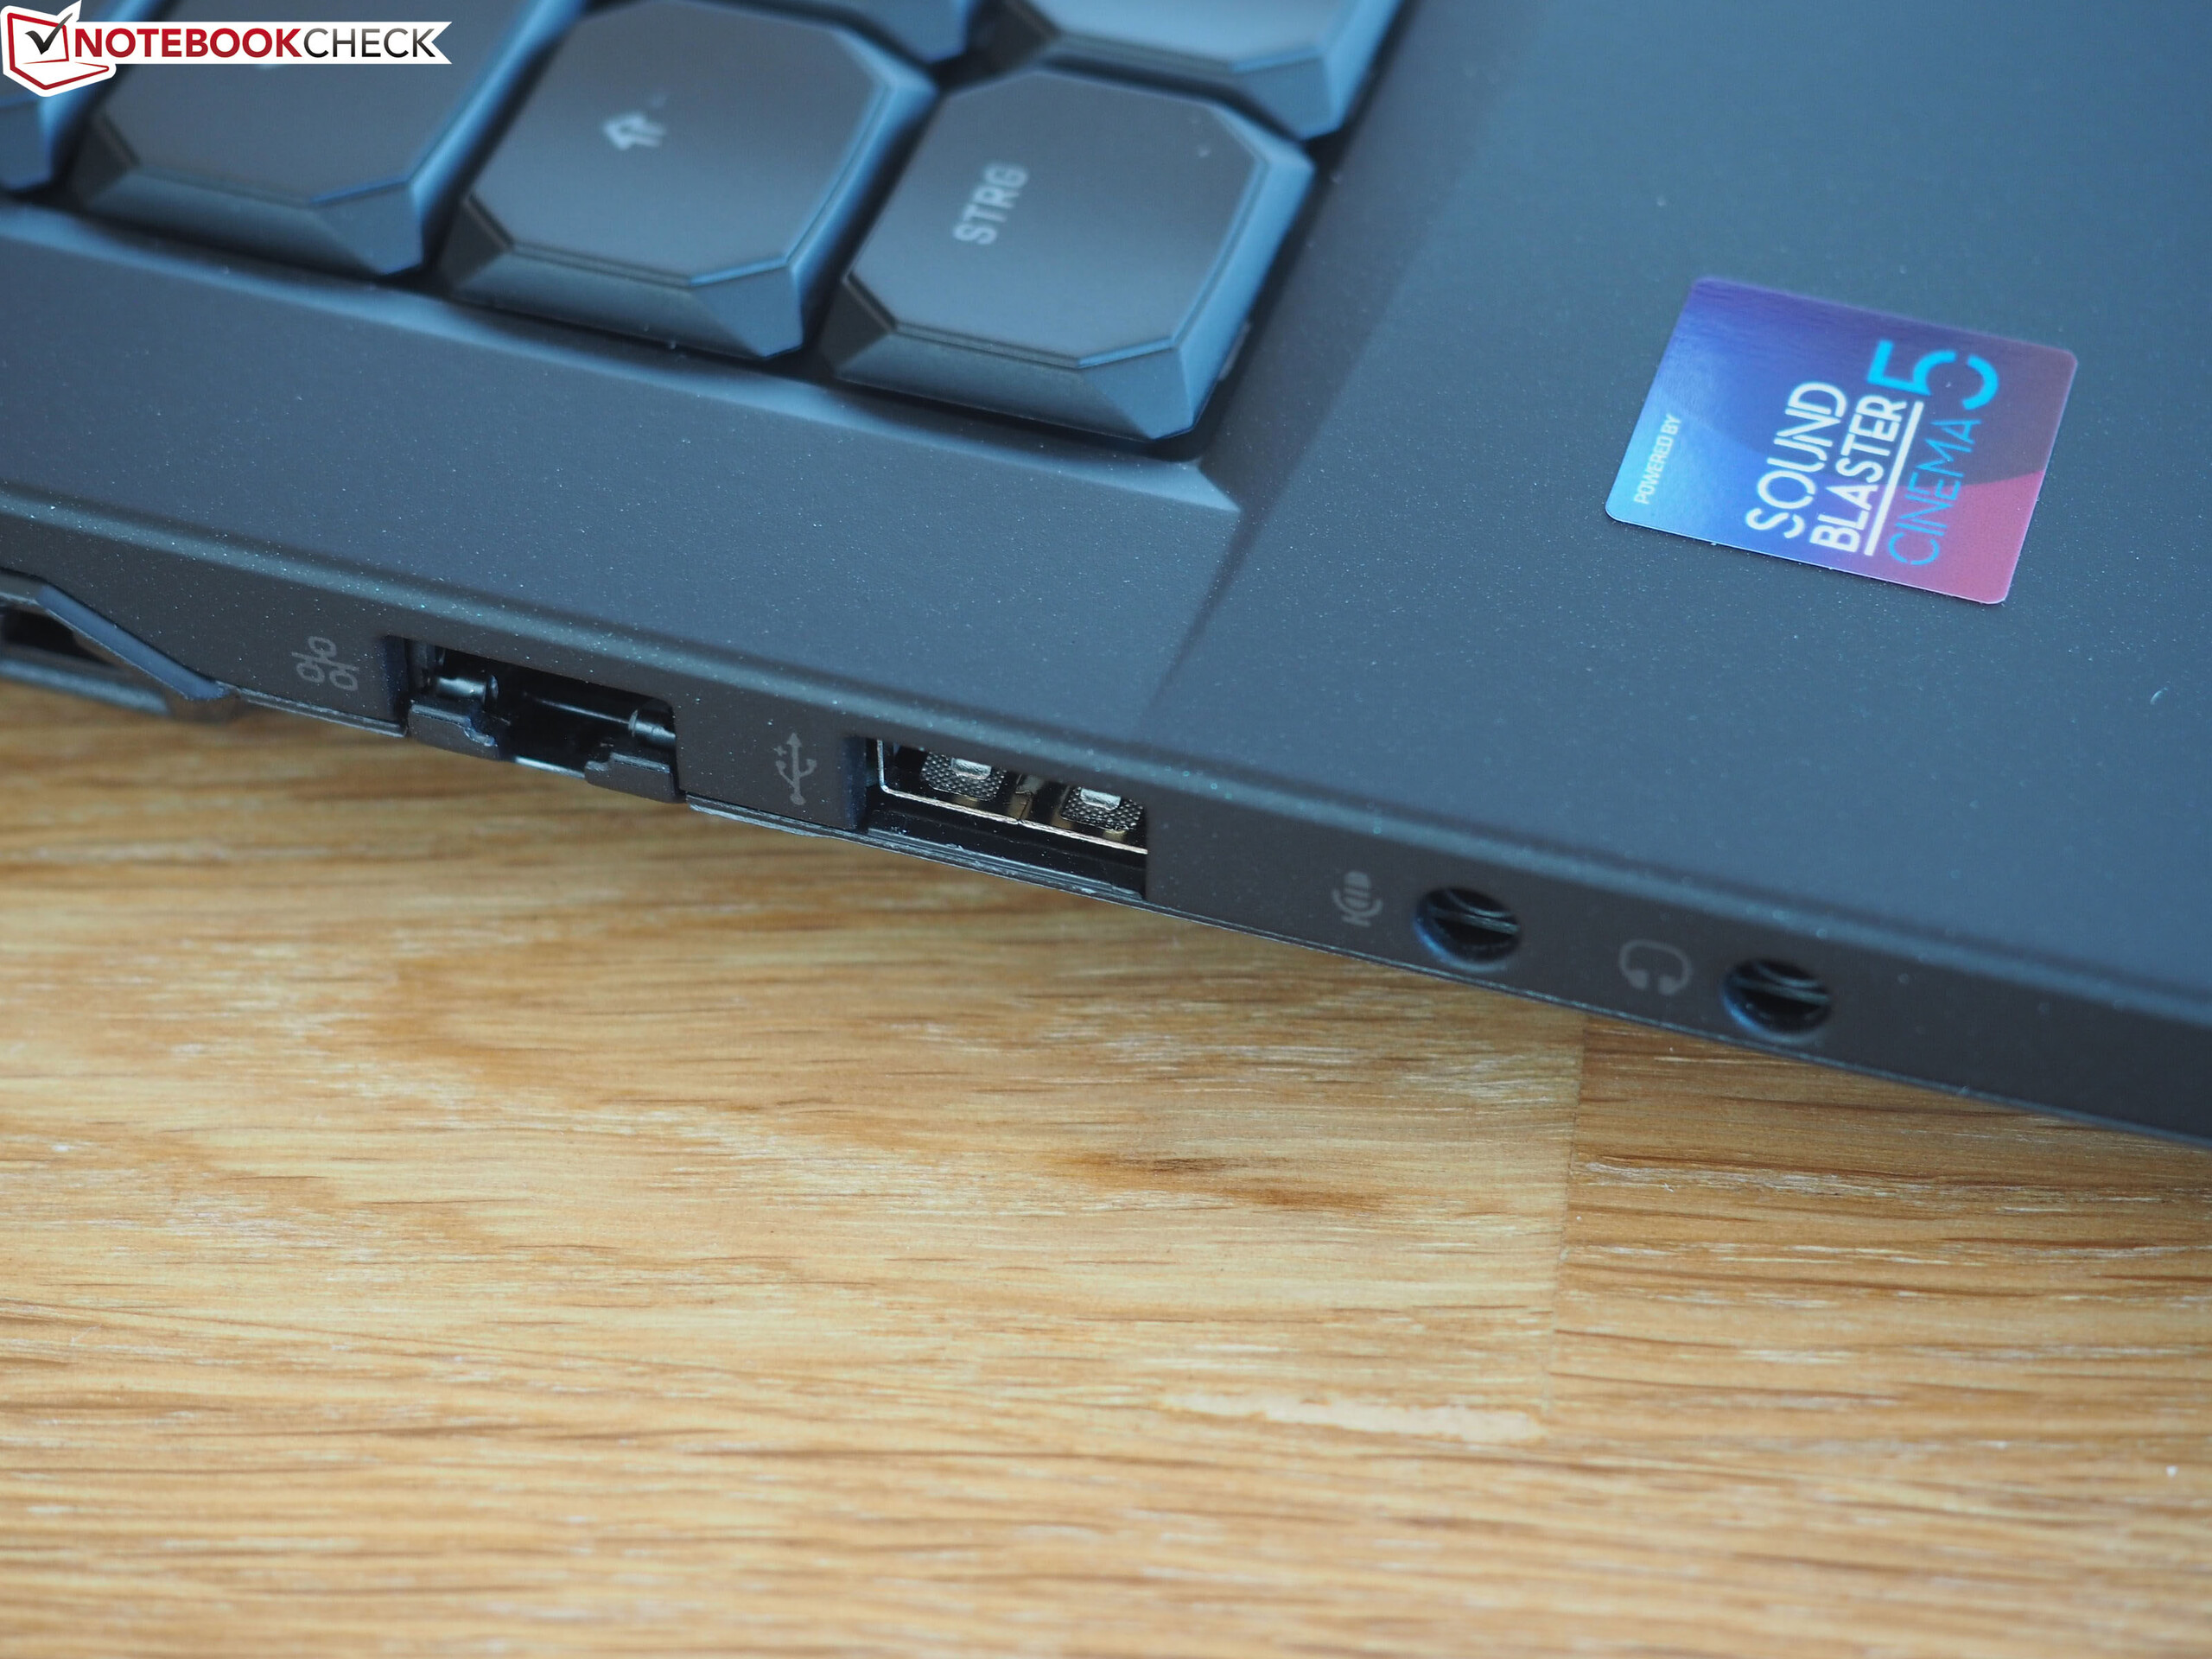
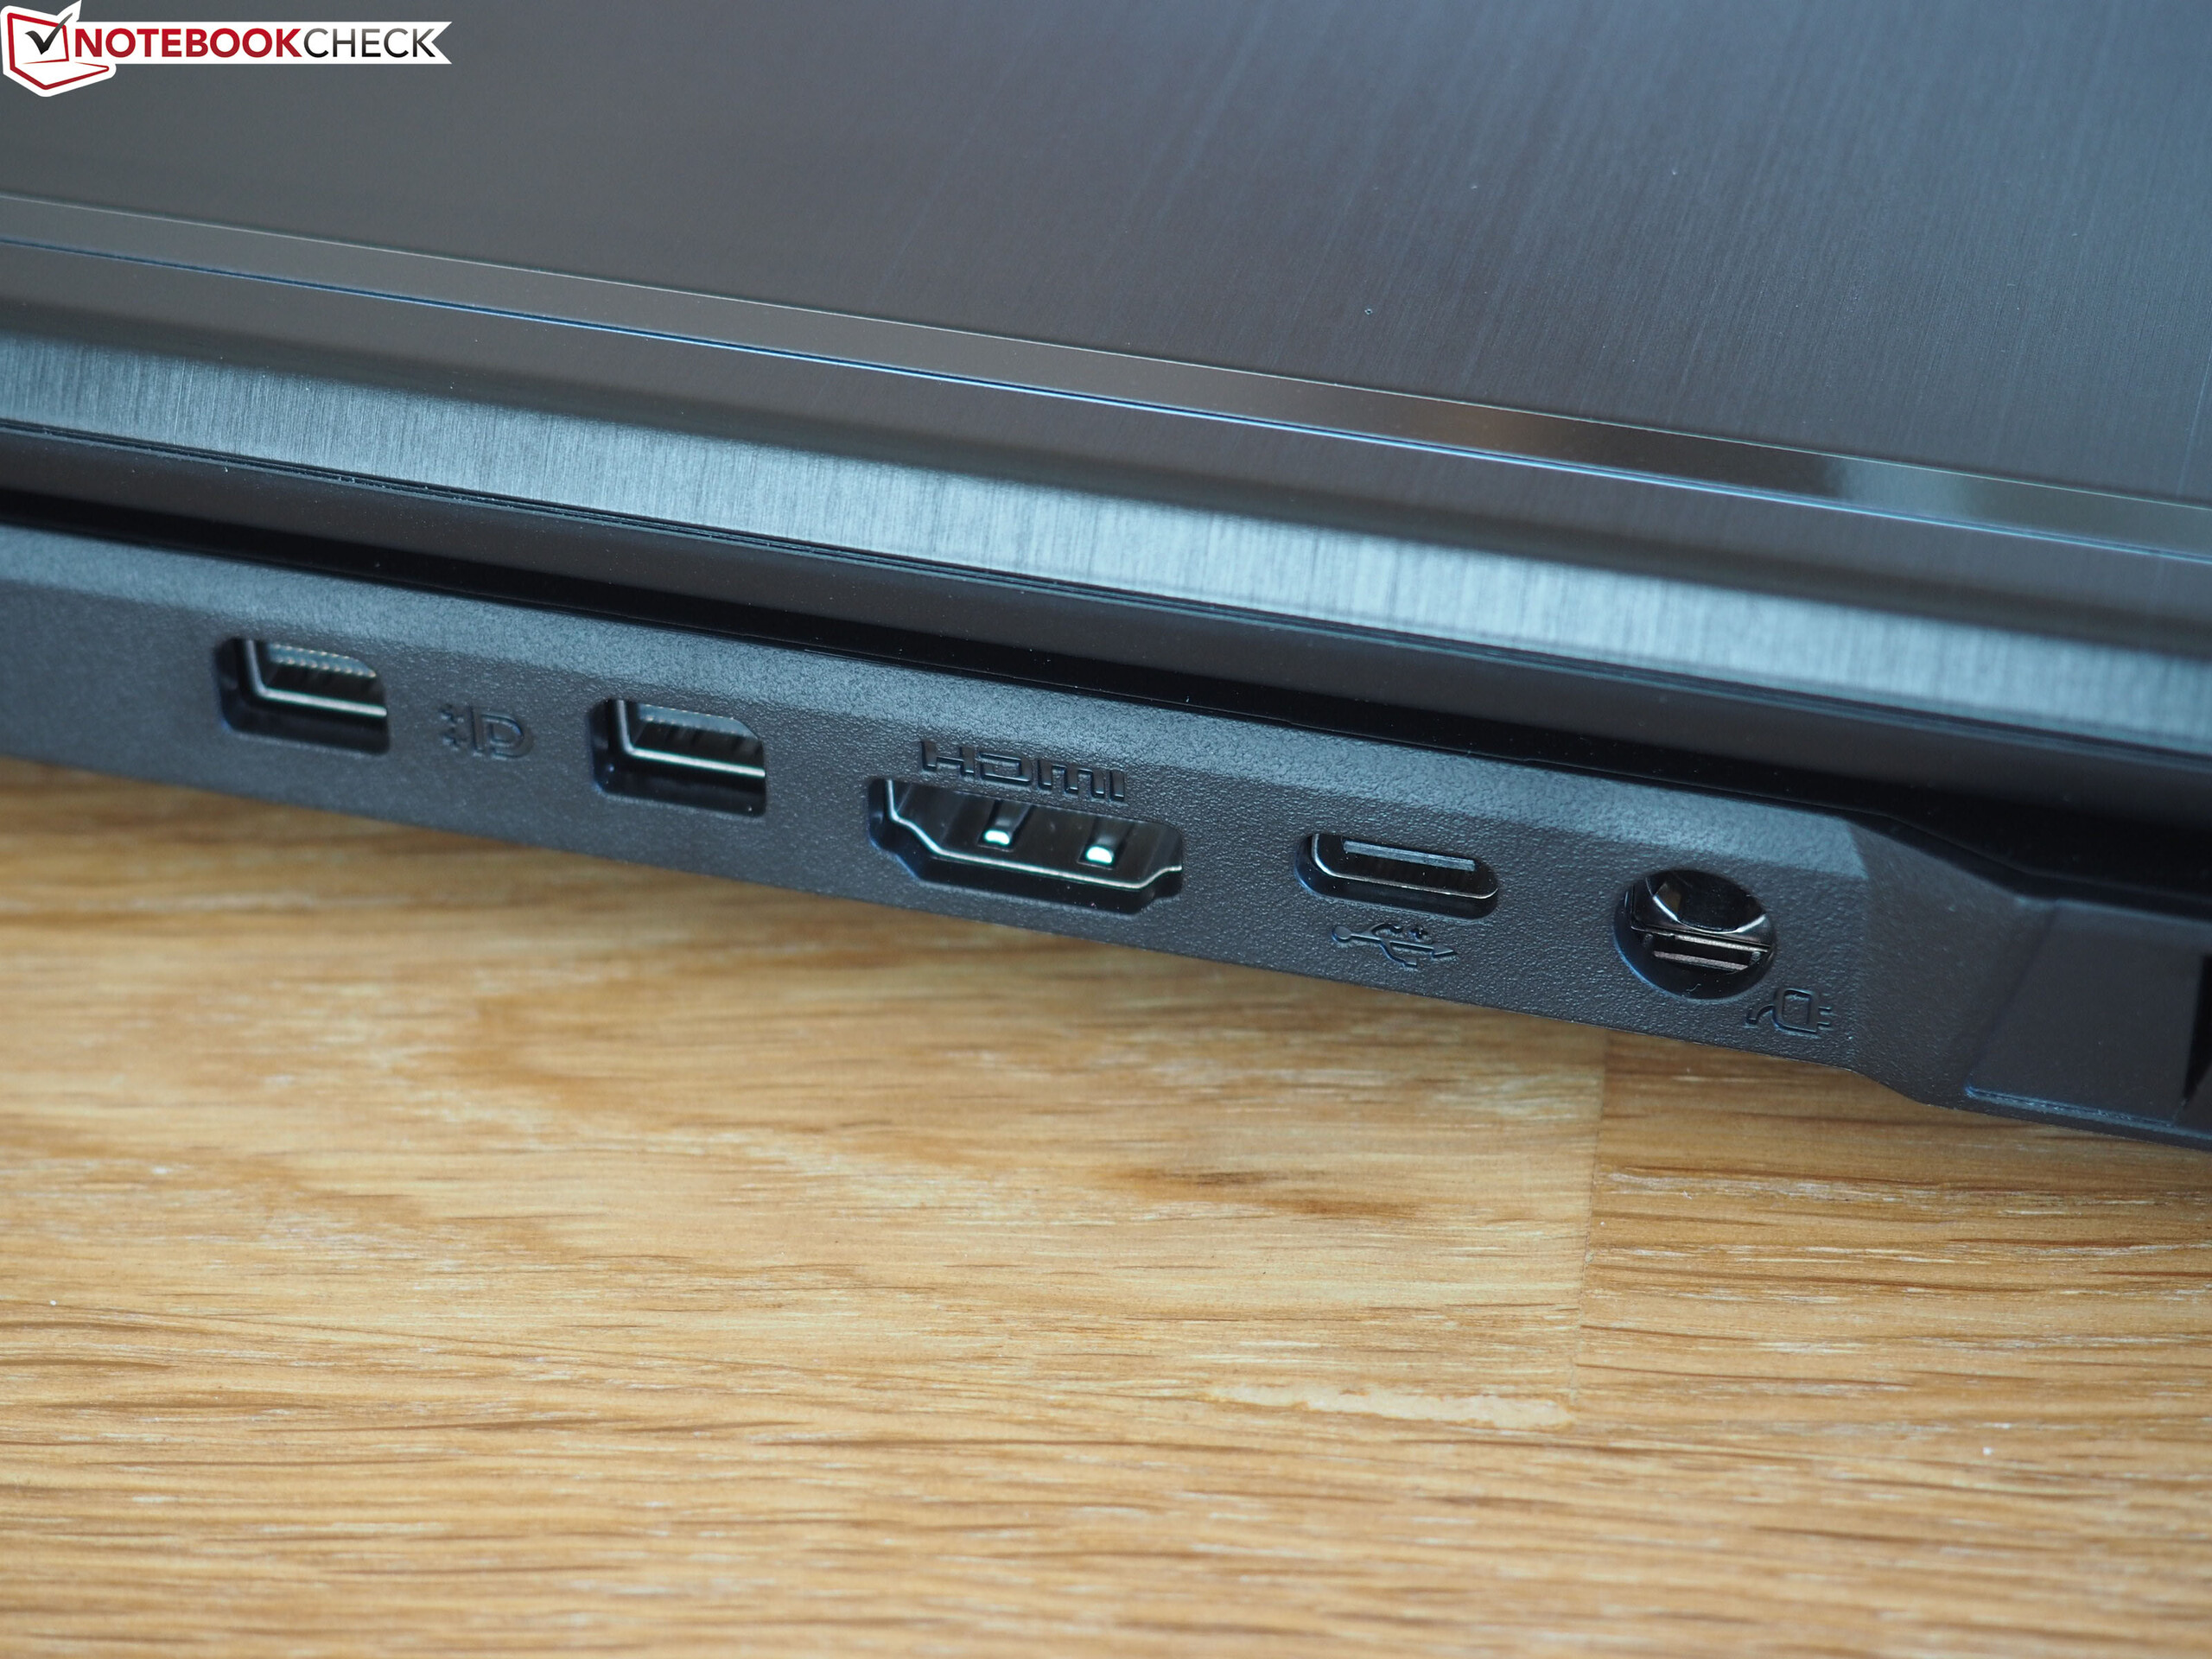
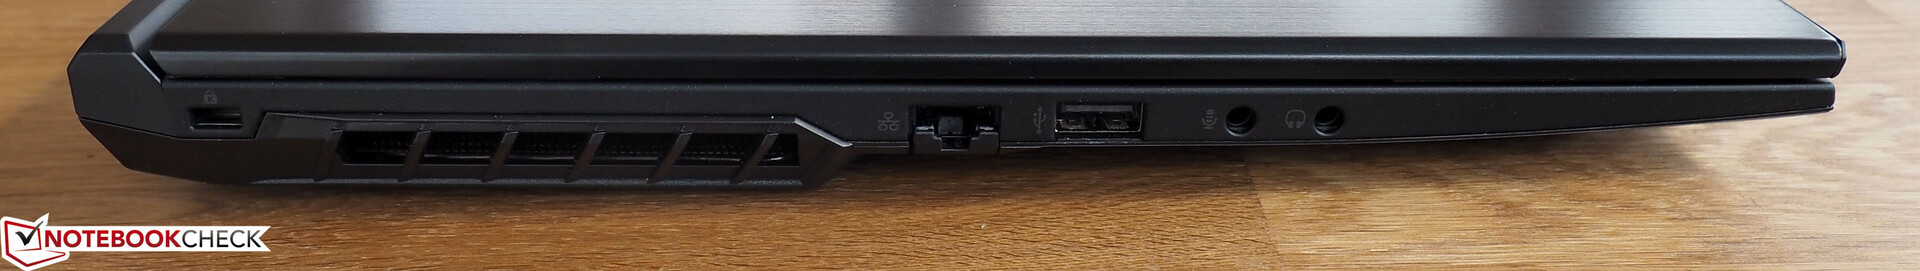
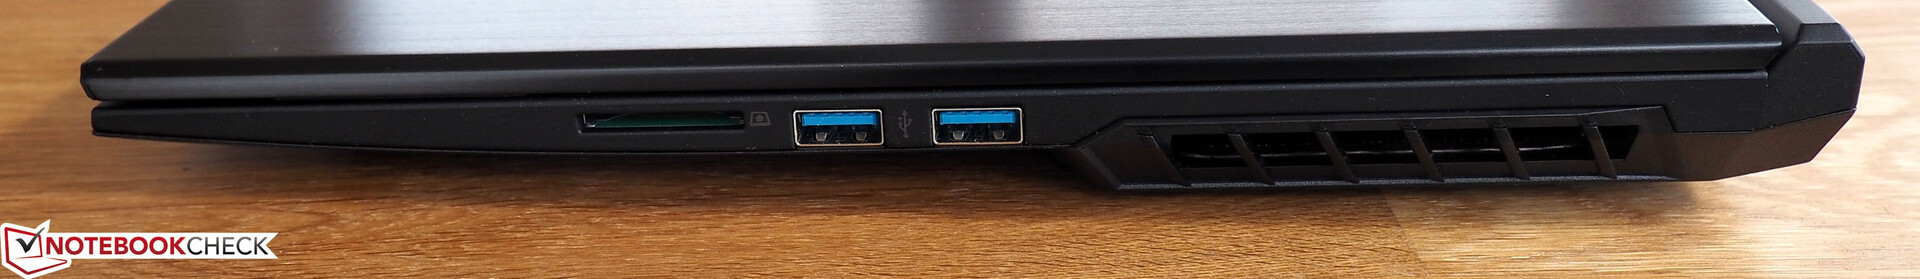
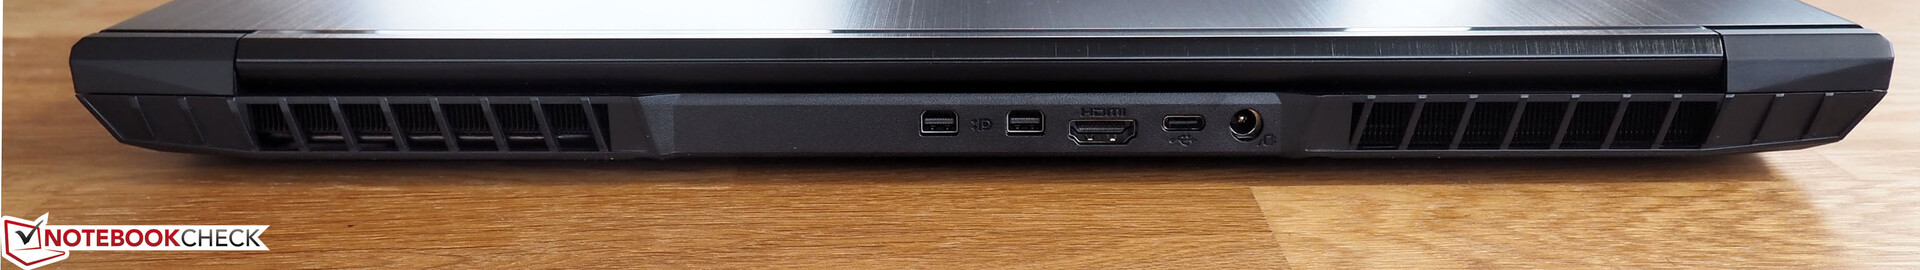
Unfortunately, the Neo 17 has an outdated selection of ports by today’s standards. We looked for a USB 3.1 Gen2 port in vain, as we did with a Thunderbolt 3 port. Schenker has equipped the Neo 17 with three USB 3.0 ports, of which one is Type-C, and a USB 2.0 Type-A port. The device has a host of video outputs though, which are all at the back of the case. You can connect the Neo 17 to an external monitor with its HDMI 2.0 port, its two Mini DisplayPort connections or the Type-C port. The I/O is rounded off with dedicated 3.5 mm headphone and microphone jacks along with an SD card reader, an RJ45 Ethernet port and a Kensington Lock slot.
However, while there are plenty of ports, we have mixed feelings about their placement. Tongfang has distributed air intakes across the front, left and rear of the case, which pushes some ports closer to the front edge of the laptop than we would have liked. This will not be an issue if you plan on connecting the Neo 17 to an external display, but you could find that wired mice may catch their cables because of the positioning of the USB Type-A ports. It is a minor gripe and one which Schenker could only rectify by using a different barebones case, but it may irritate some people, nonetheless.
SD Card Reader
The Neo 17 has a reasonably fast SD card reader that is on par with the one in the ROG Strix Scar II GL704GW, although it achieved between 14% and 20% slower transfer speeds in our tests than the class average. We tested our review unit with our reference Toshiba Exceria Pro SDXC UHS-II card, for reference. The Neo 17 also supports MMC, SD, SDHC and SDXC formats.
| SD Card Reader | |
| average JPG Copy Test (av. of 3 runs) | |
| Average of class Gaming (20.9 - 210, n=54, last 2 years) | |
| Asus ROG Strix Scar II GL704GW (Toshiba Exceria Pro SDXC 64 GB UHS-II) | |
| Schenker XMG Neo 17 (Toshiba Exceria Pro SDXC 64 GB UHS-II) | |
| MSI GE75 8SF (Toshiba Exceria Pro SDXC 64 GB UHS-II) | |
| maximum AS SSD Seq Read Test (1GB) | |
| Average of class Gaming (25.5 - 261, n=51, last 2 years) | |
| Schenker XMG Neo 17 (Toshiba Exceria Pro SDXC 64 GB UHS-II) | |
| Asus ROG Strix Scar II GL704GW (Toshiba Exceria Pro SDXC 64 GB UHS-II) | |
| MSI GE75 8SF (Toshiba Exceria Pro SDXC 64 GB UHS-II) | |
Communication
Schenker has equipped the Neo 17 with an Intel Dual Band Wireless-AC 9462 by default, but you can upgrade to an Intel Dual Band Wireless-AC 9560 or a Killer Wireless AC 1550 for €15 (~$17) and €25 (~$28) respectively. Our review unit has the Wireless-AC 9560, which should deliver excellent Wi-Fi transfer speeds. Unfortunately, the Neo 17 achieved significantly slower transfer speeds than the Zephyrus S GX701GX, which is also equipped with a Wireless-AC 9560, in iperf3 Client Wi-Fi tests. We conducted our Wi-Fi tests by placing our test devices about 1 m (~3 ft) from our Linksys EA8500 router, for reference. The results suggest that Schenker has placed the Wi-Fi card in a suboptimal position that compromises its transfer speeds, which we doubt can be corrected with software updates.
Software
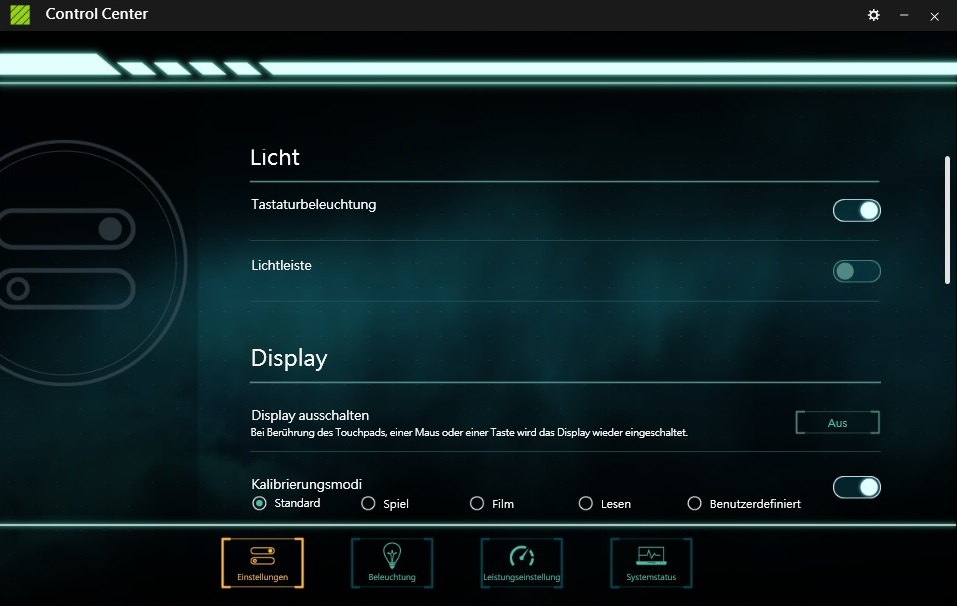
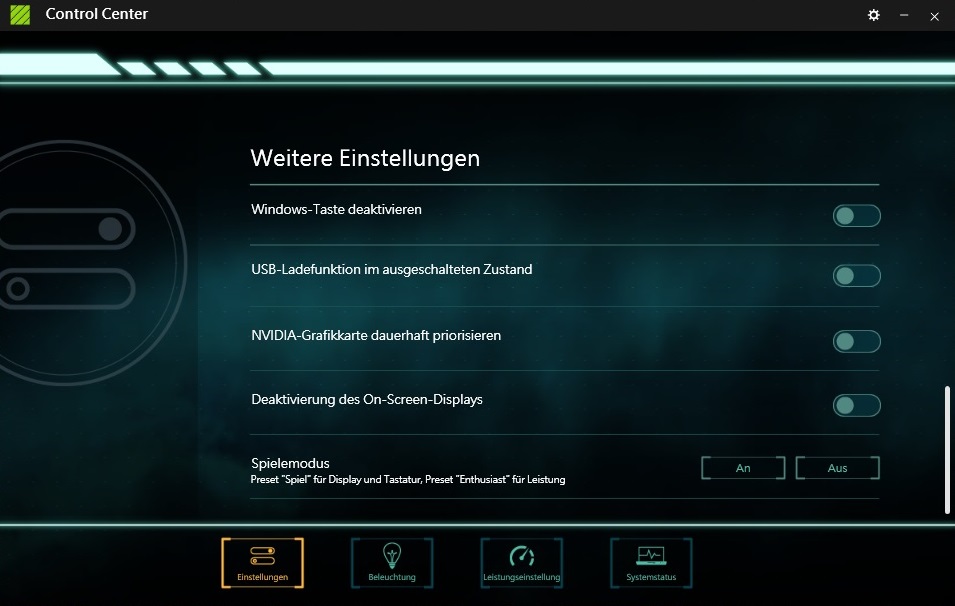
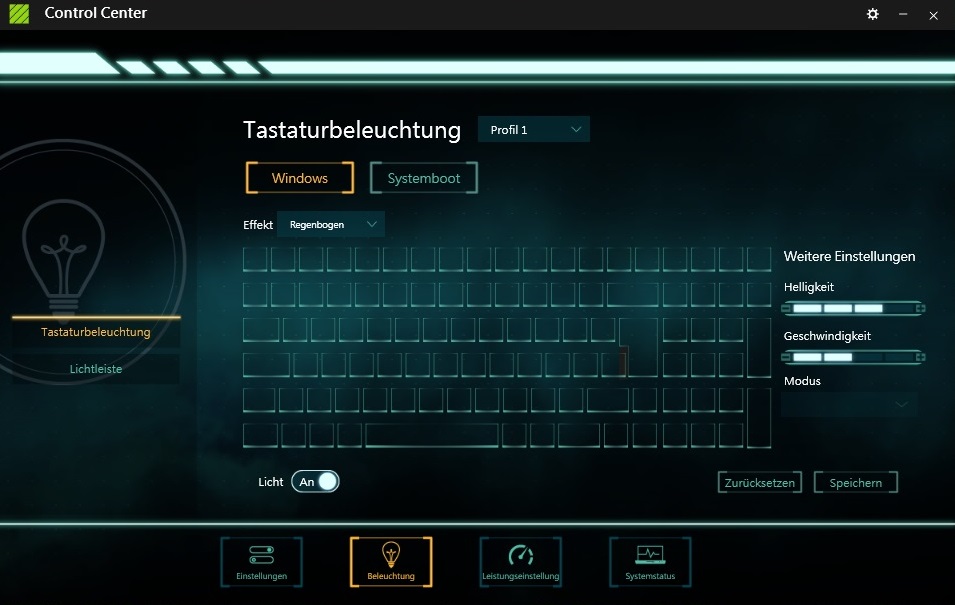
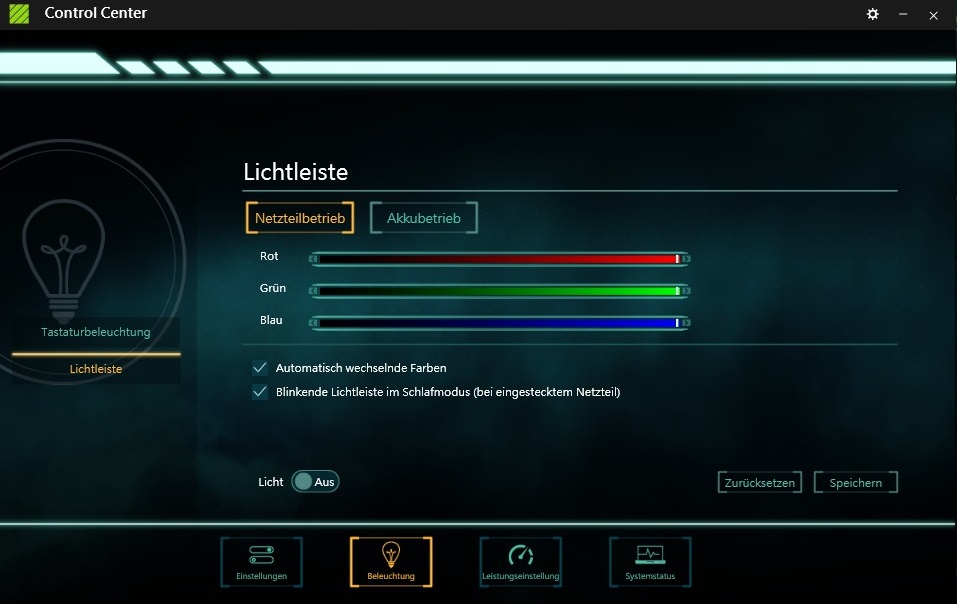
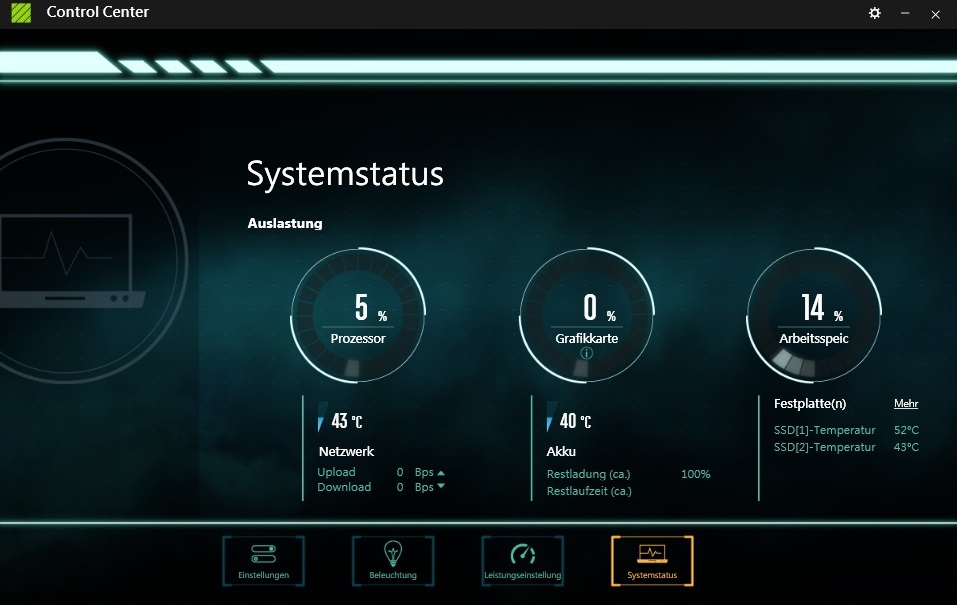
The company has pre-installed useful software though. The Control Center has numerous settings for adjusting the keyboard backlighting and fan control along with a system overview that shows internal temperatures, network speeds and GPU load among other things. Please note that we performed all our tests with the fans set to balanced and the display running in its standard mode.

Accessories
Schenker includes a rich set of accessories in the box including a huge mouse pad, a cleaning cloth, a key fob, an XMG sticker, a 1-year BullGuard Internet Security licence and a recovery DVD. There should have been a USB flash drive pre-loaded with drivers, but this did not come with our review unit for some reason. Schenker also includes screws and mounts for adding a 2.5-inch drive should you wish to do so.
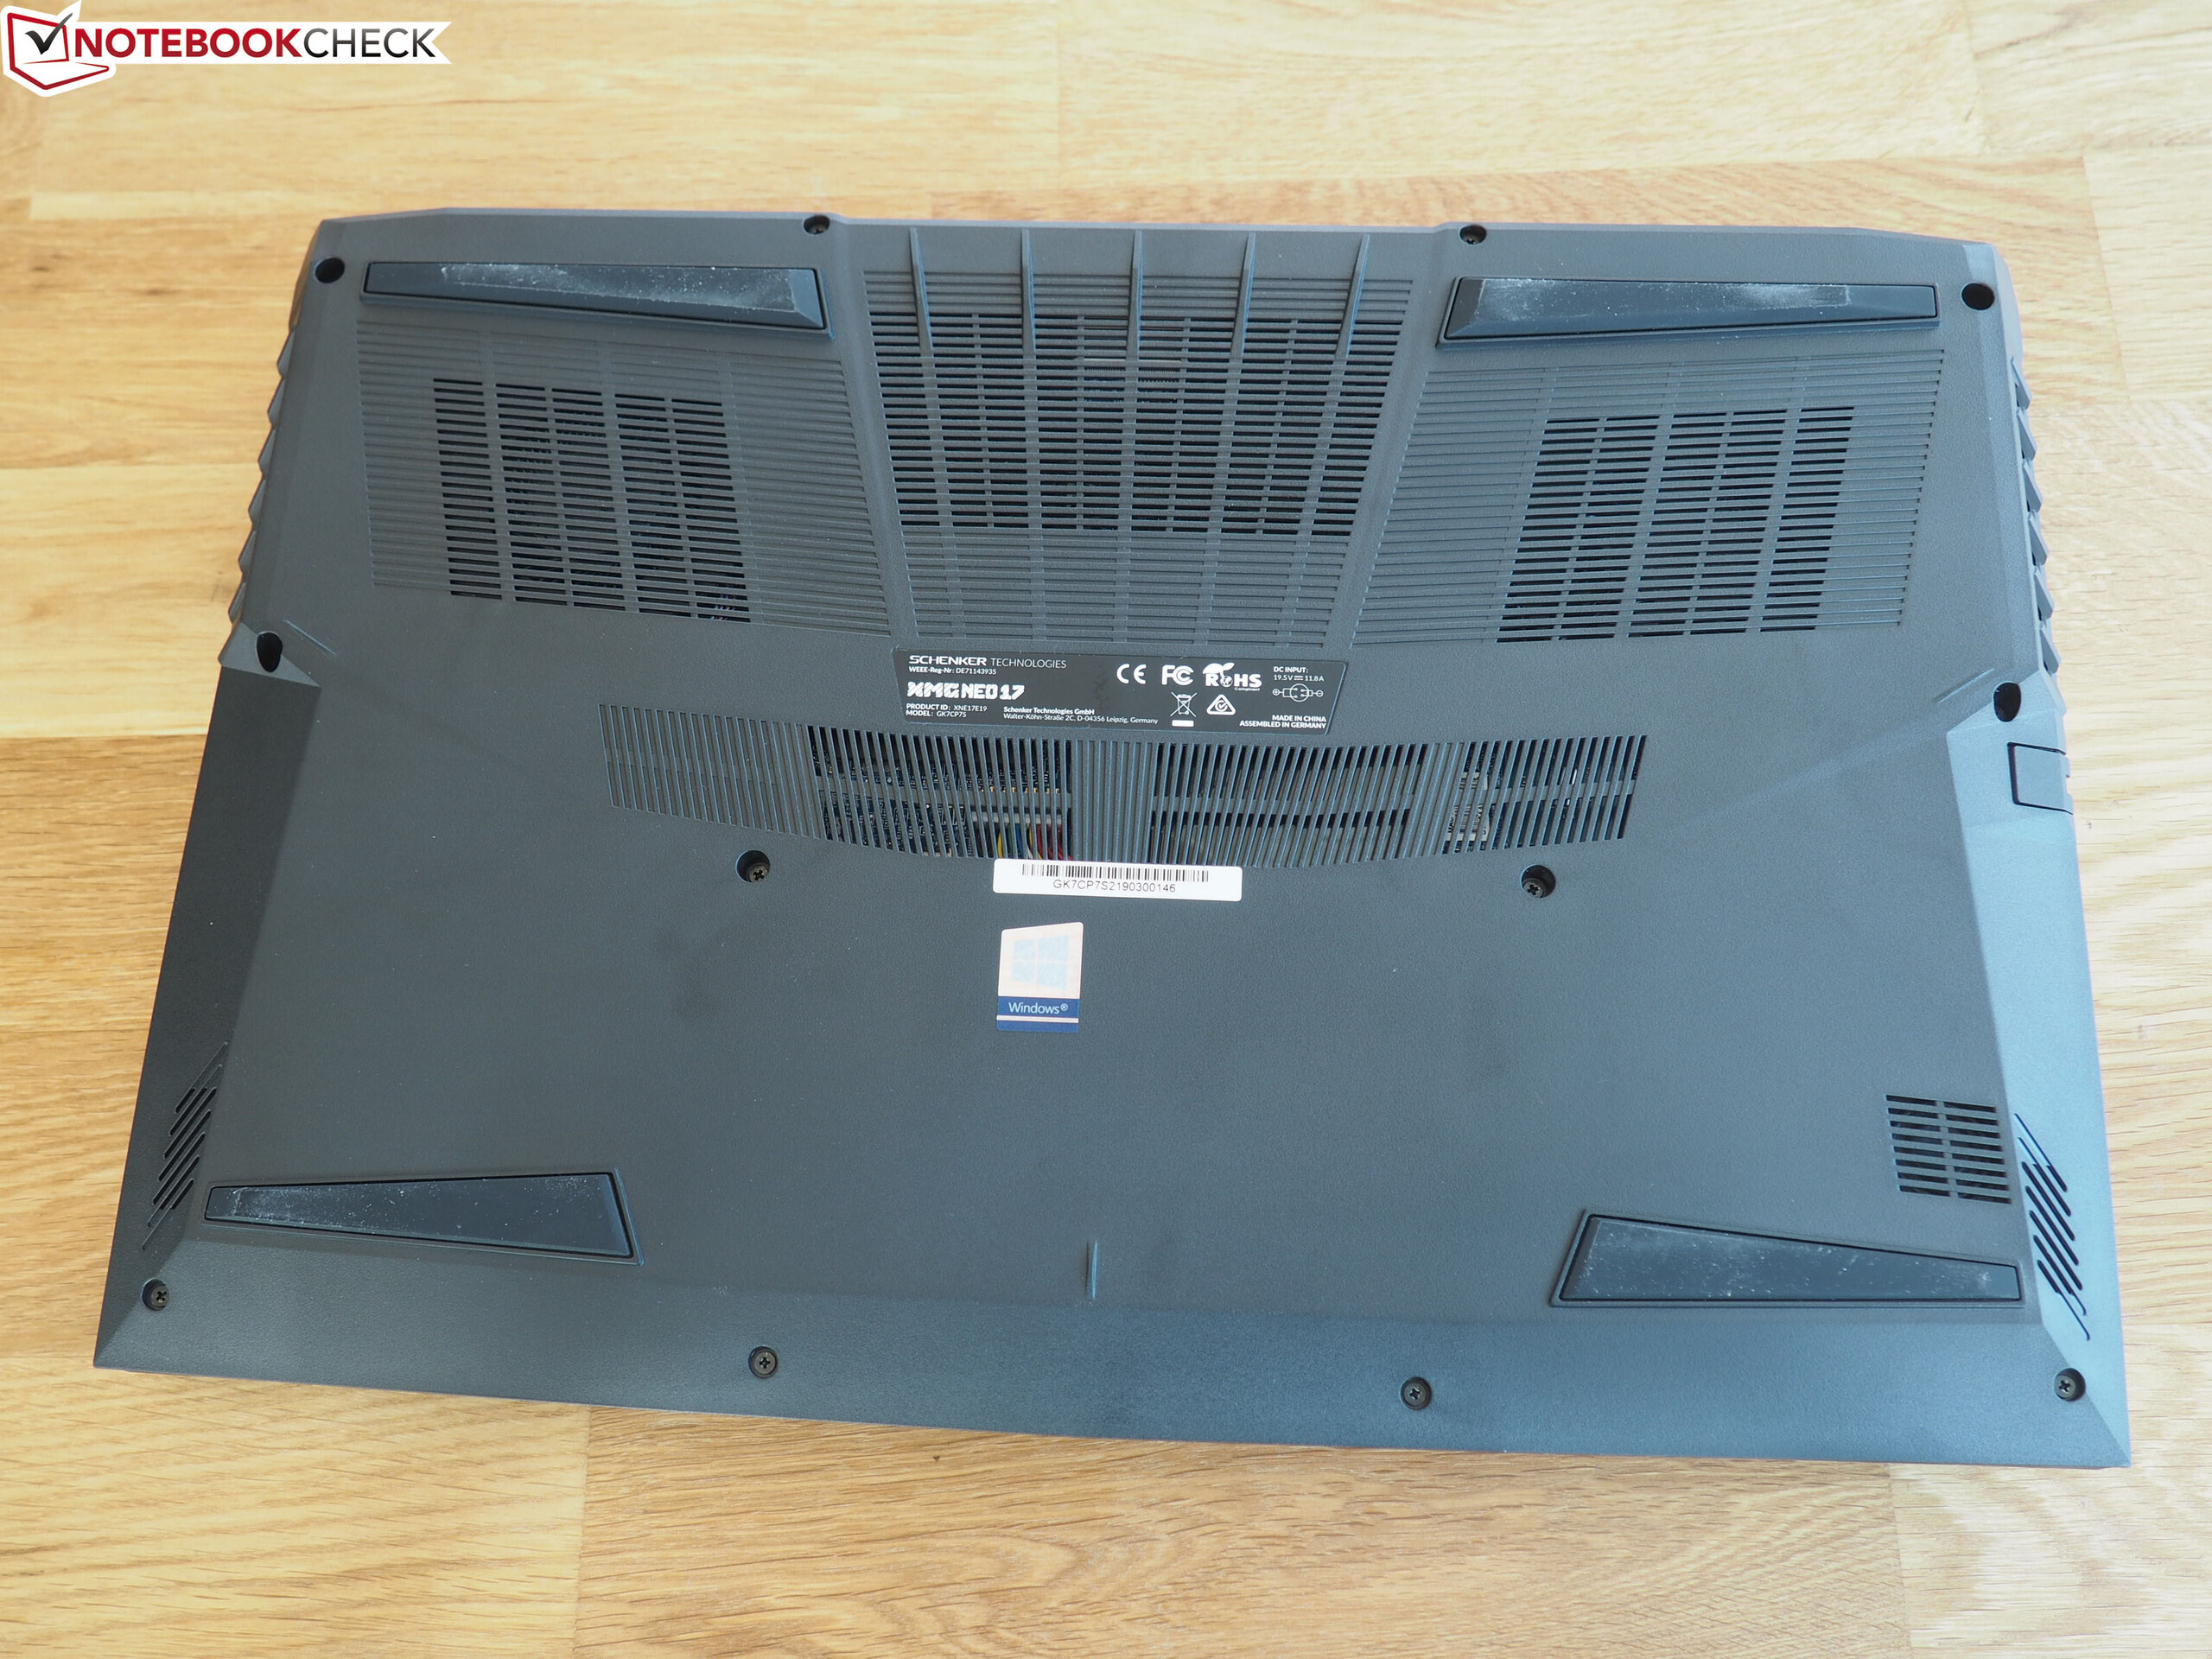
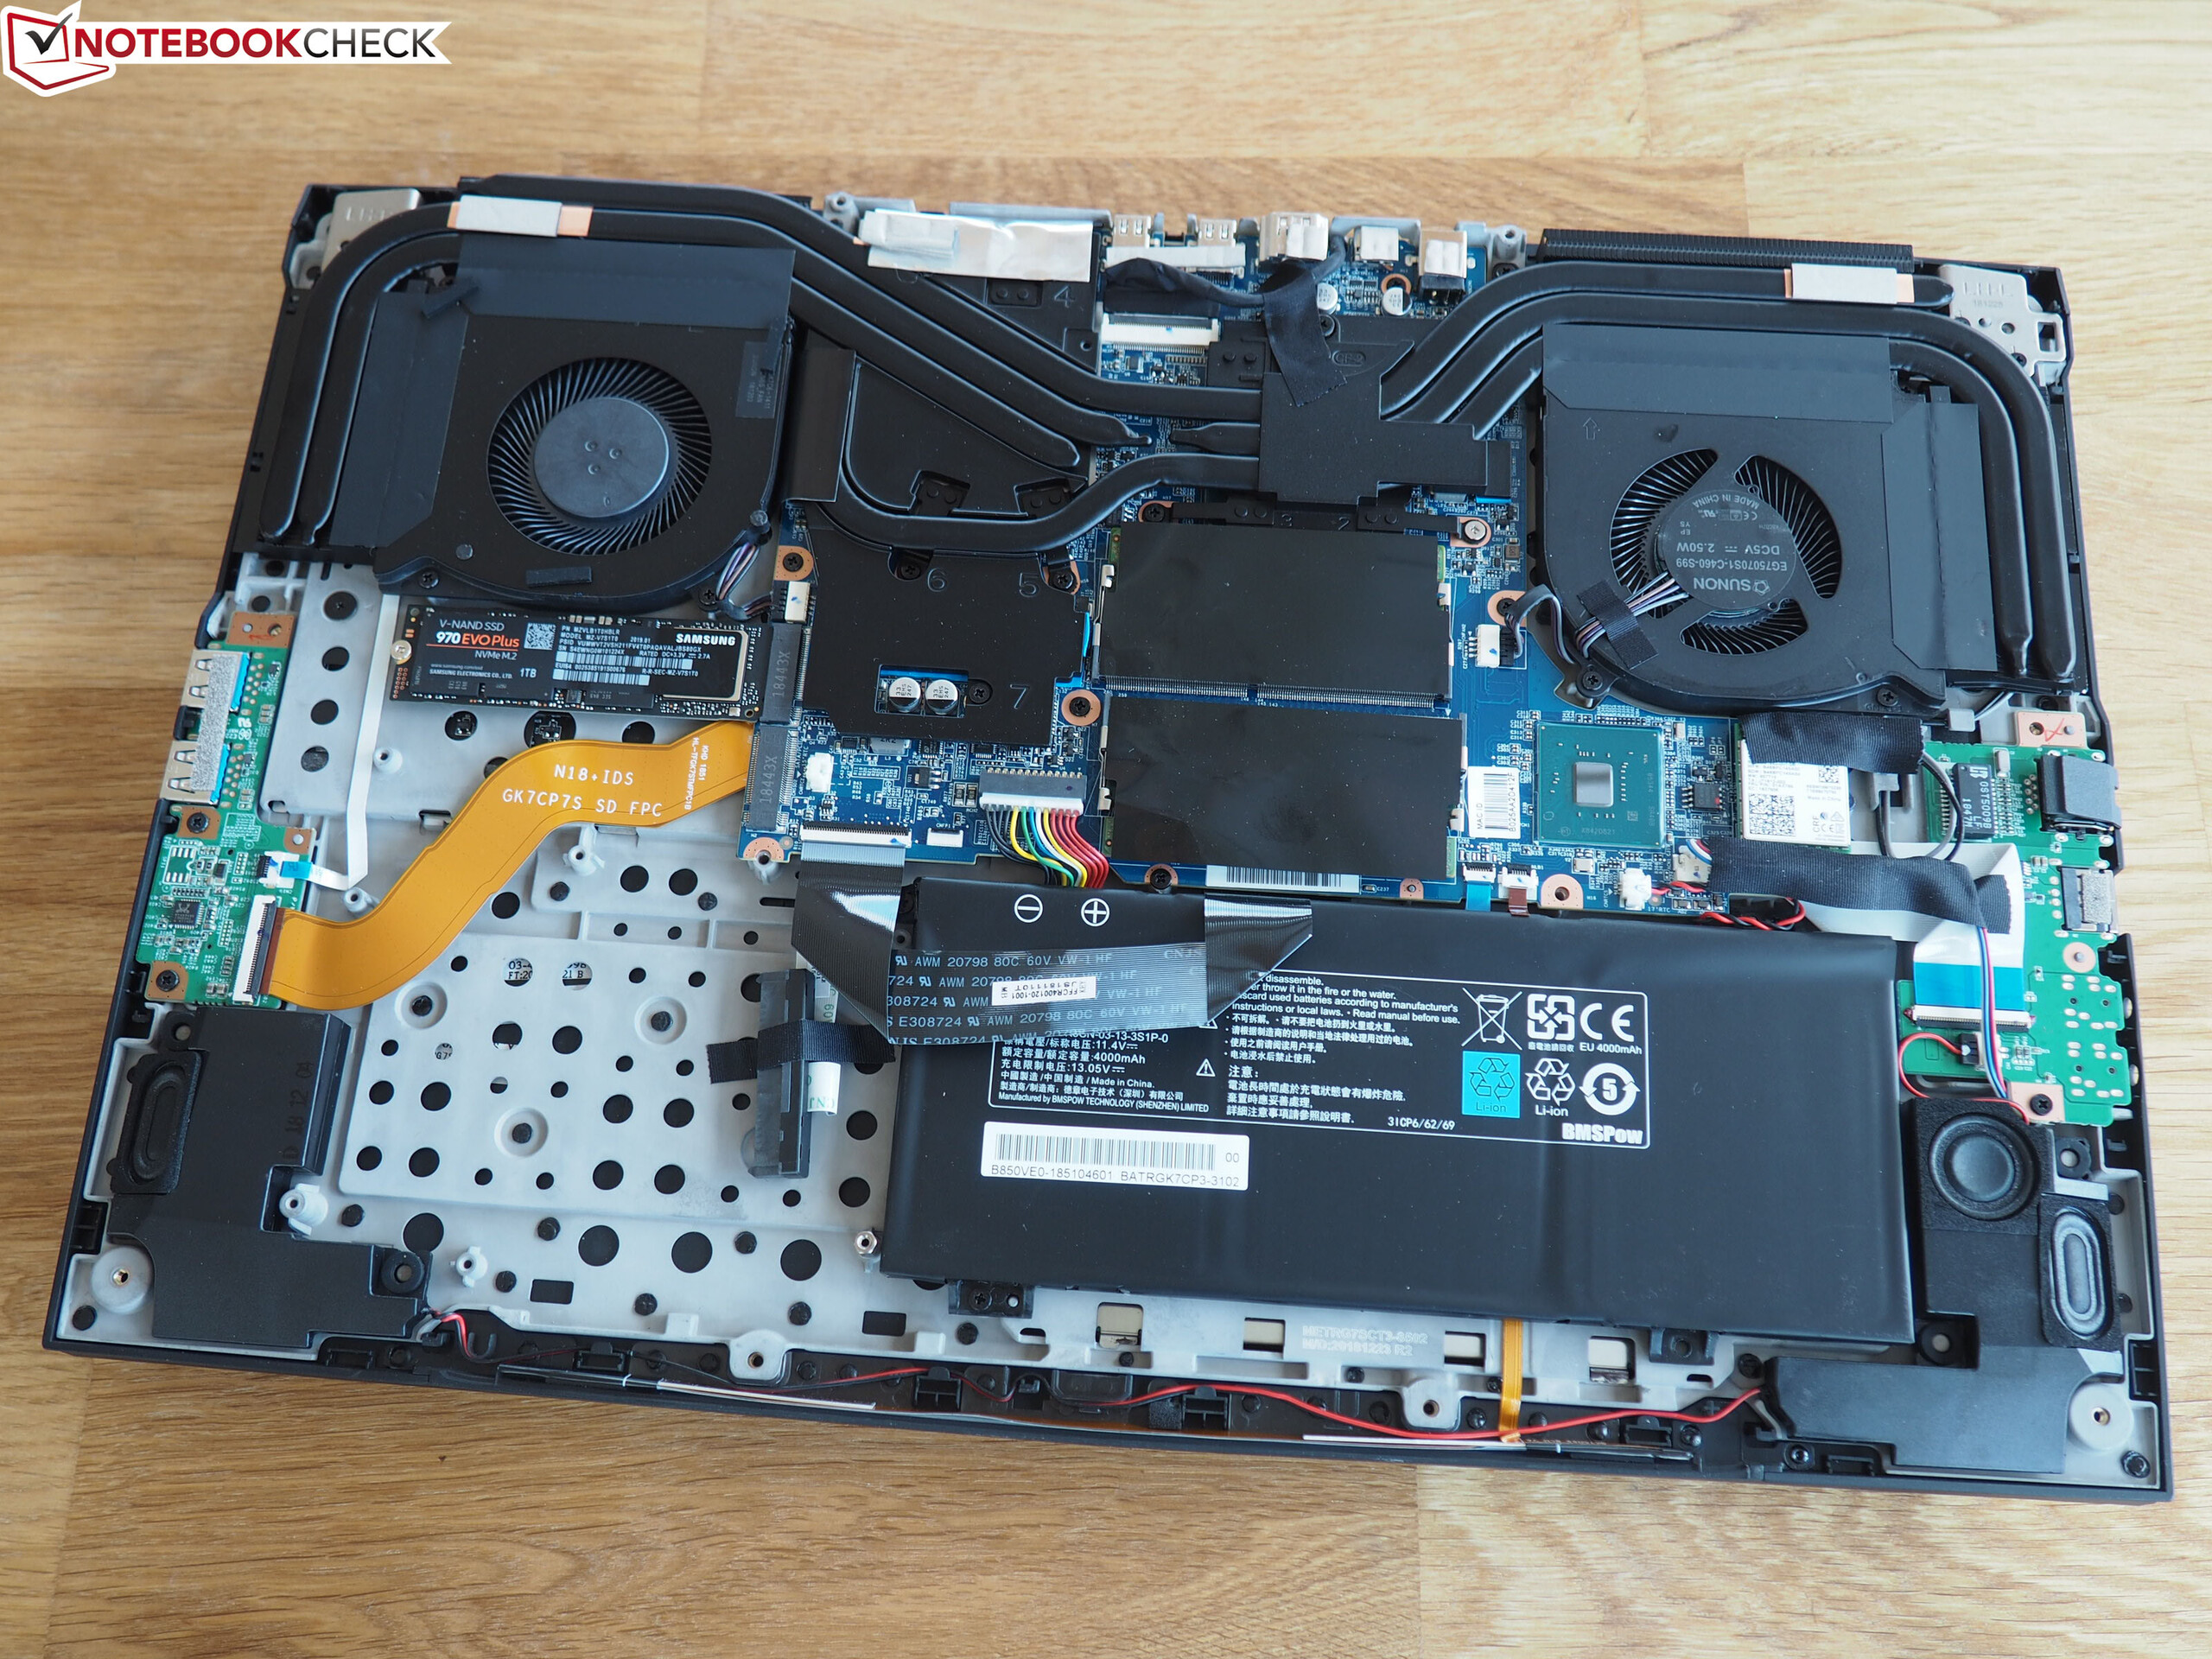
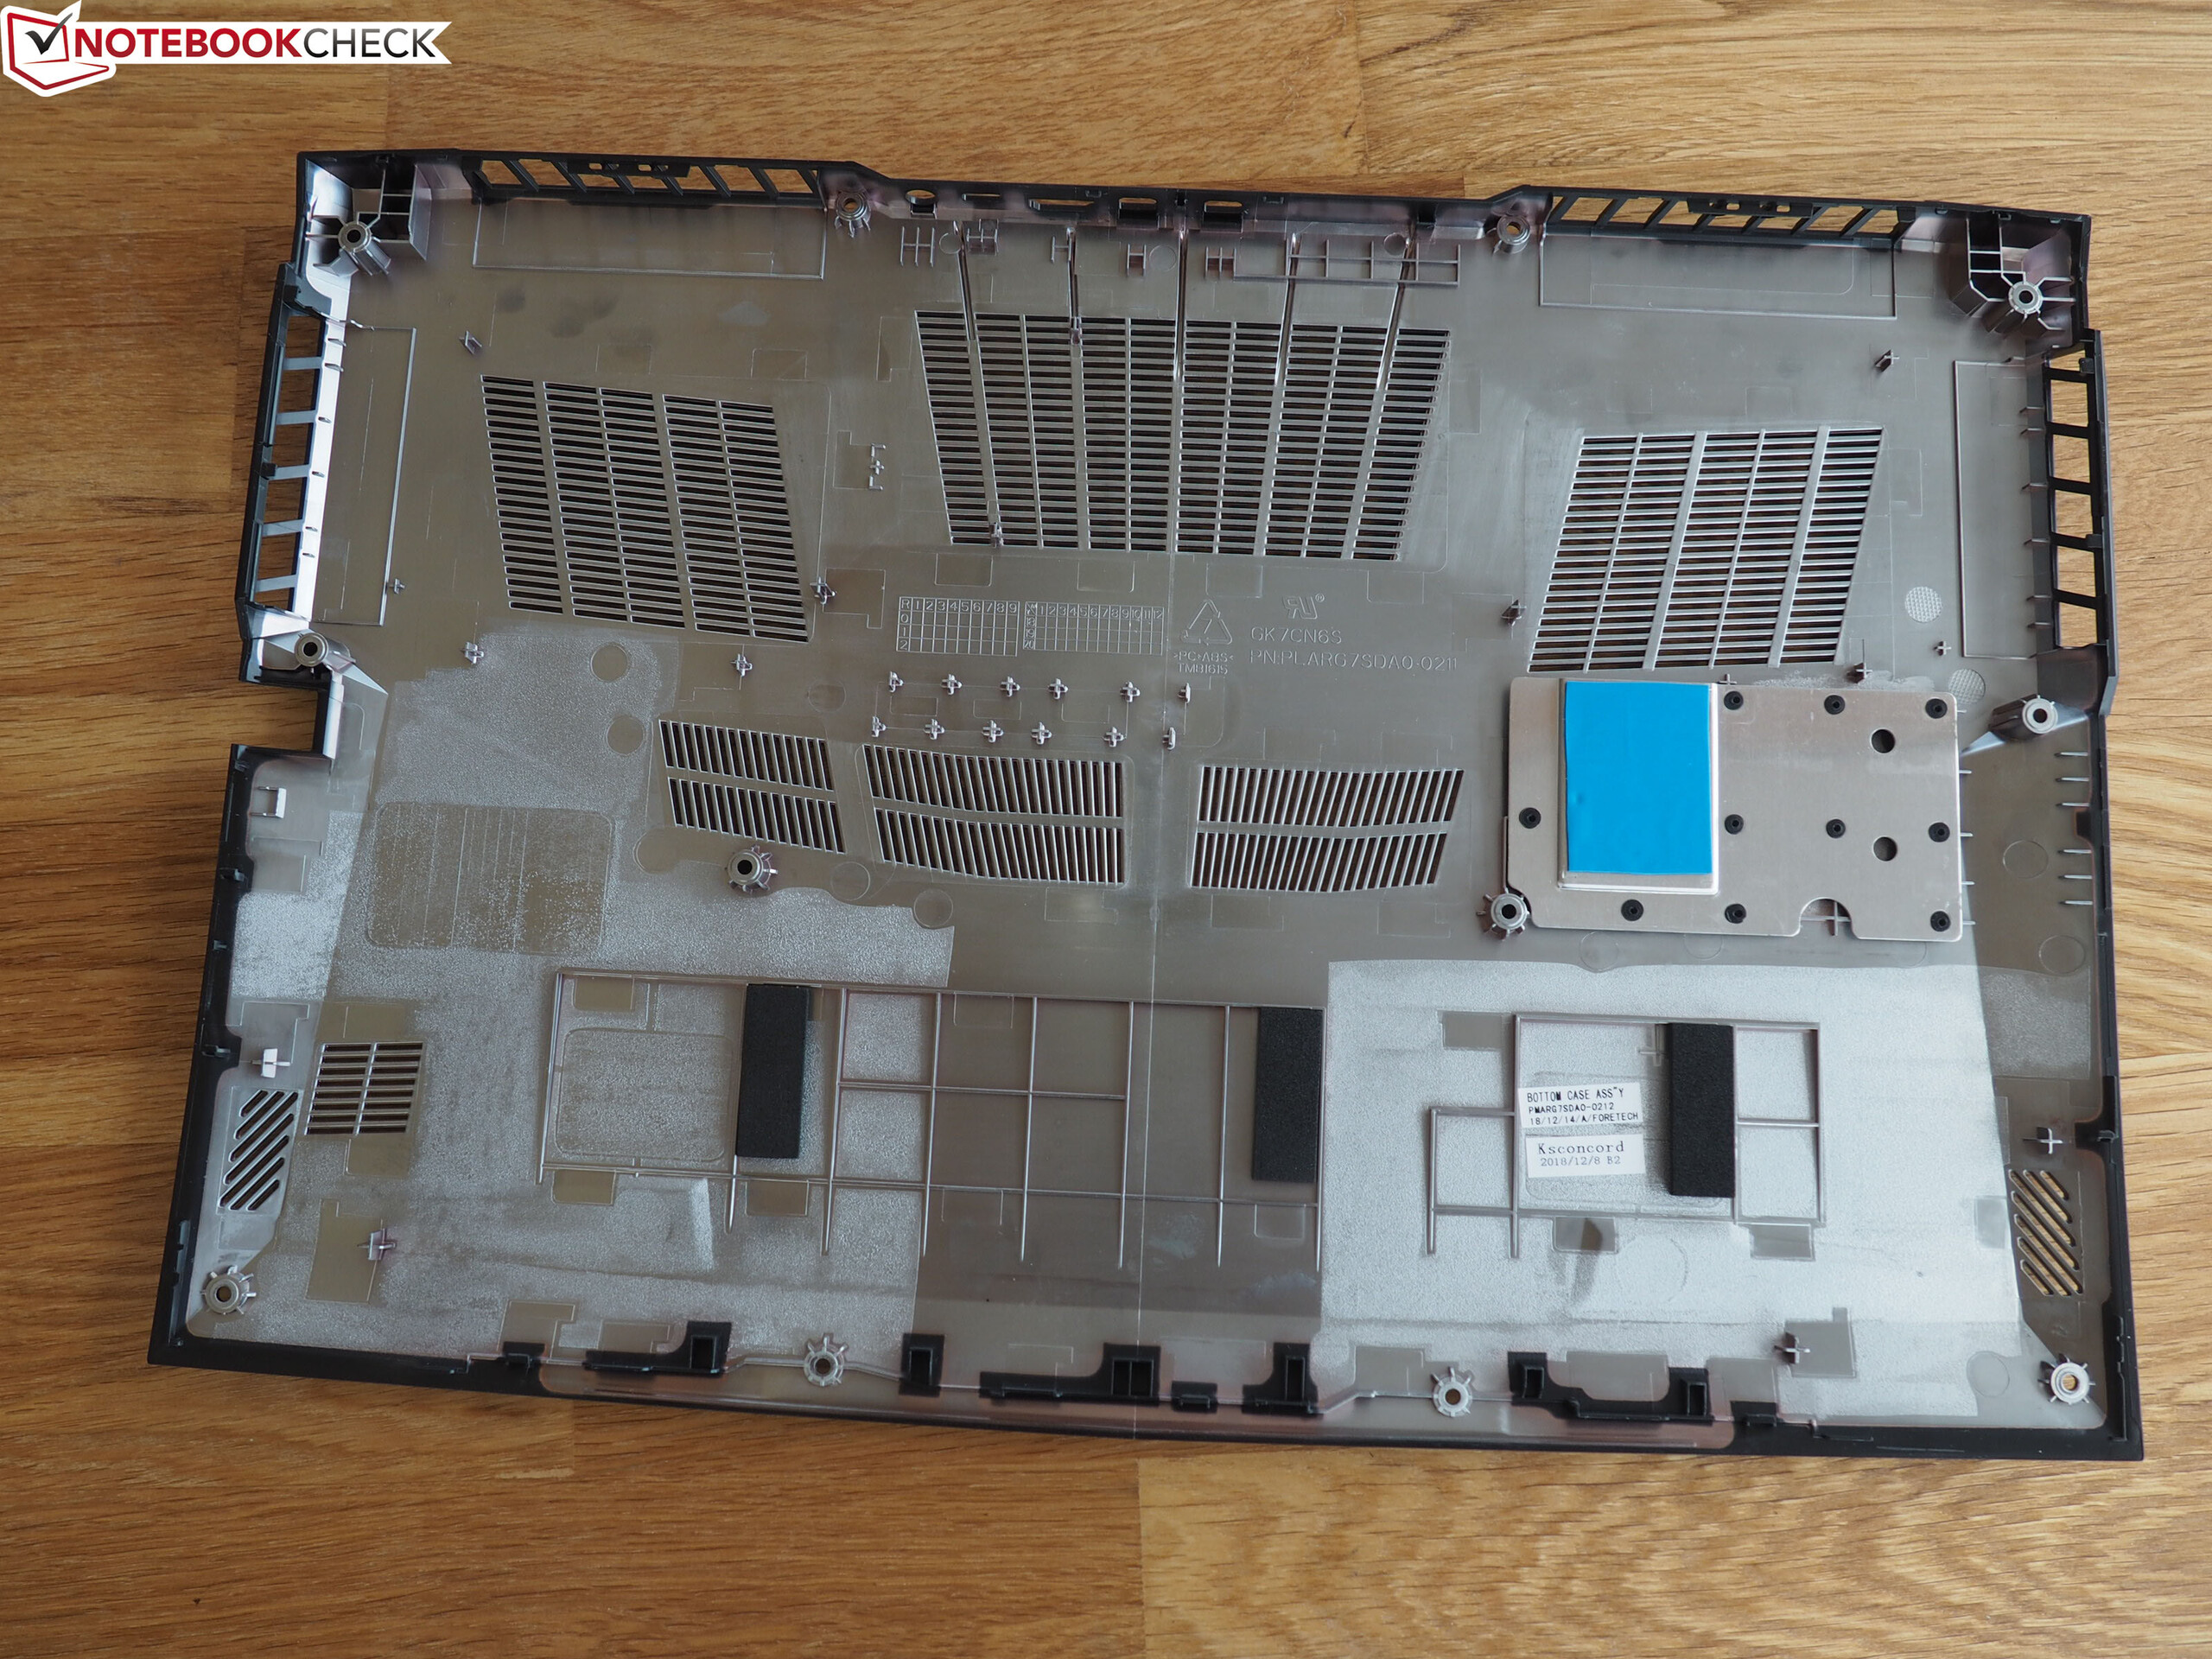
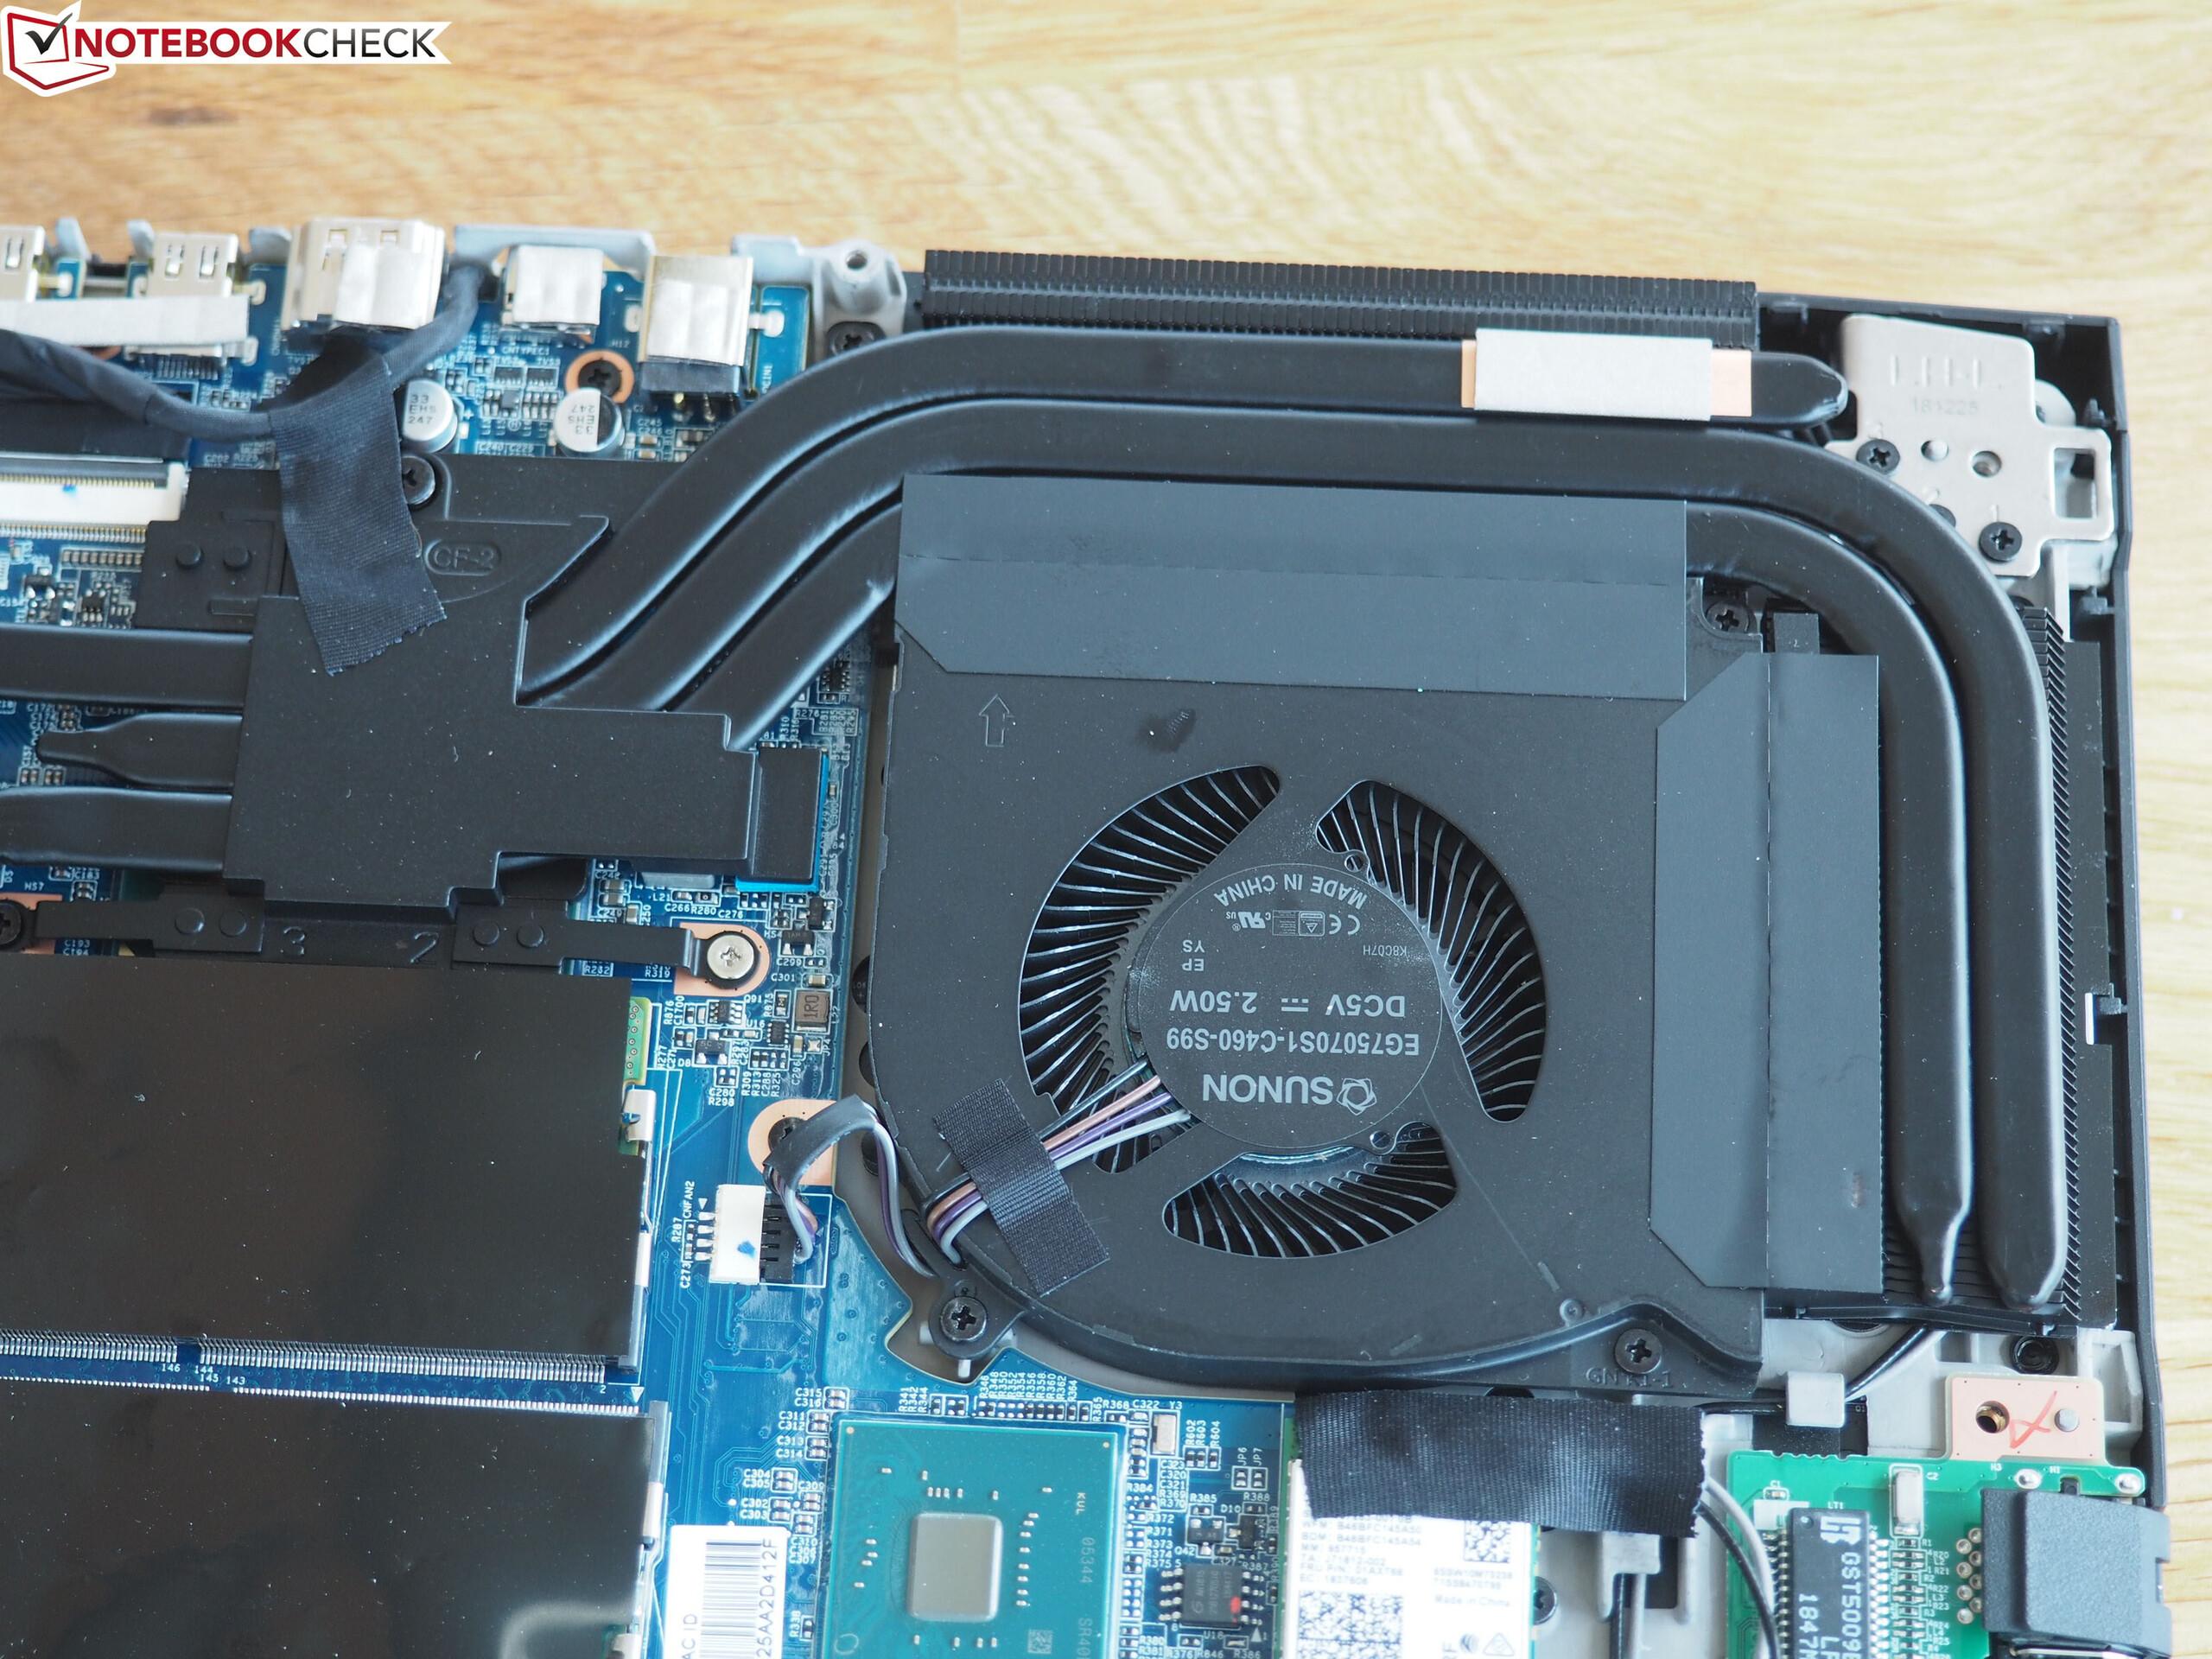
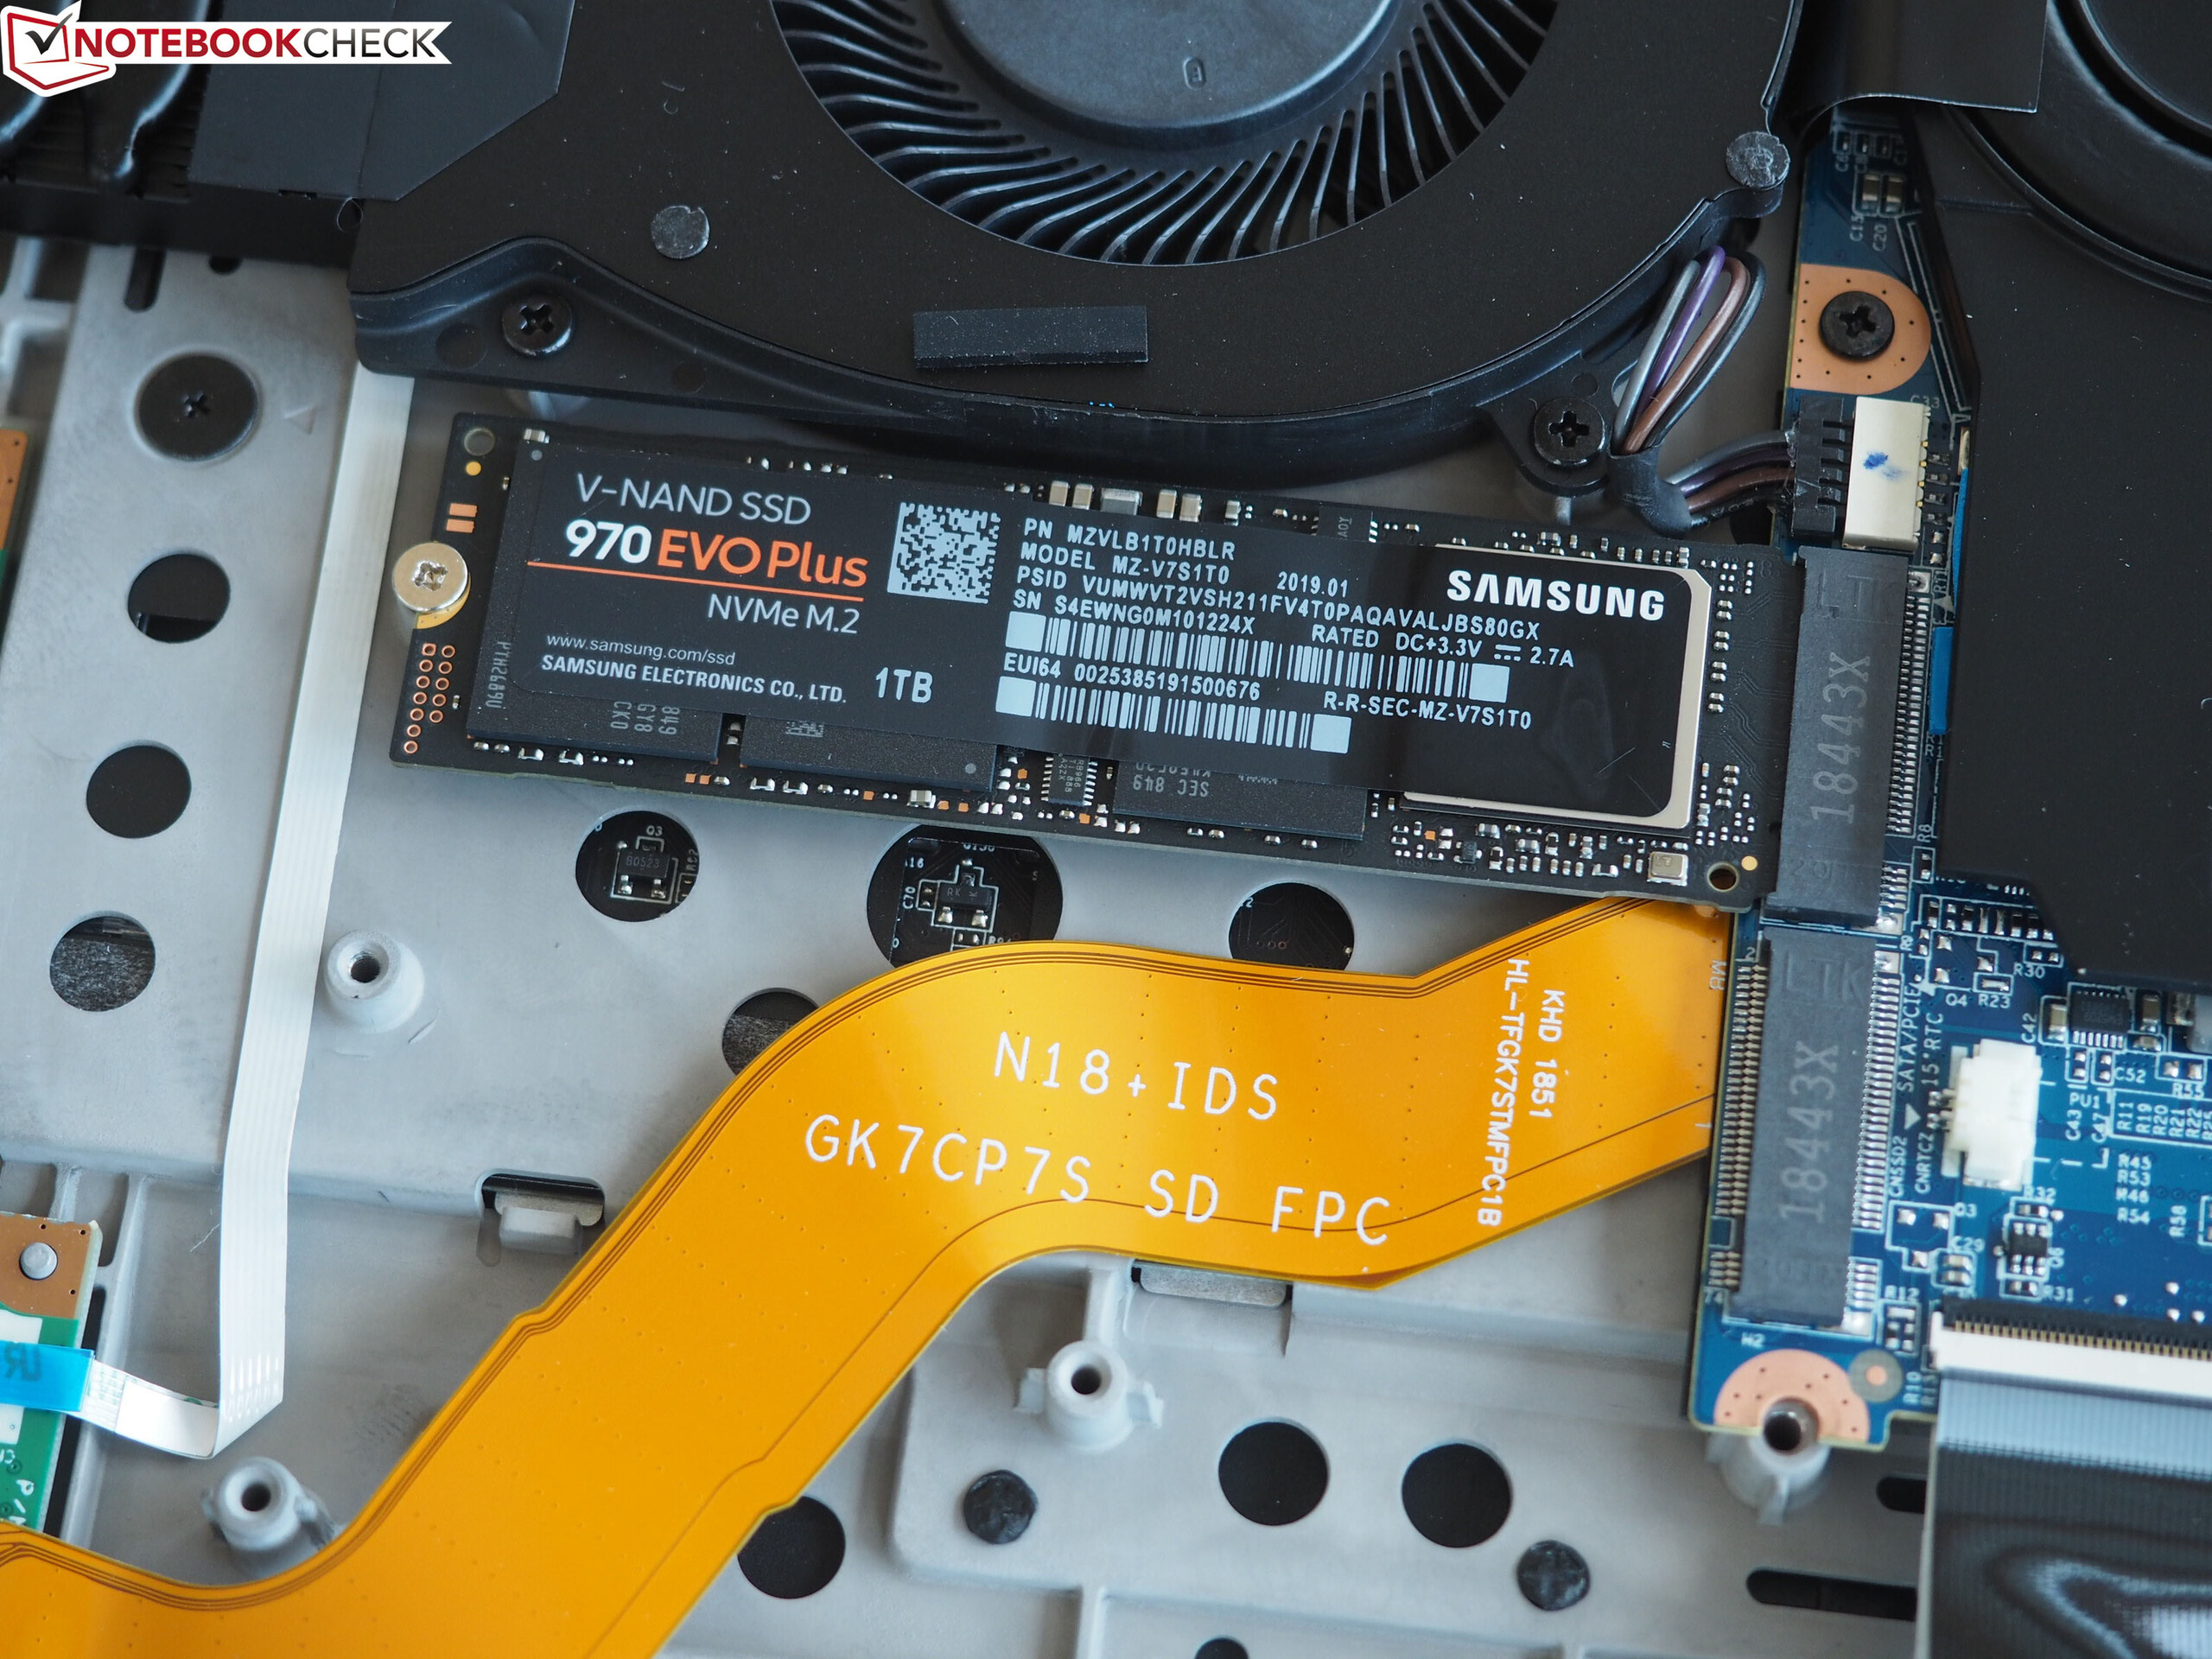
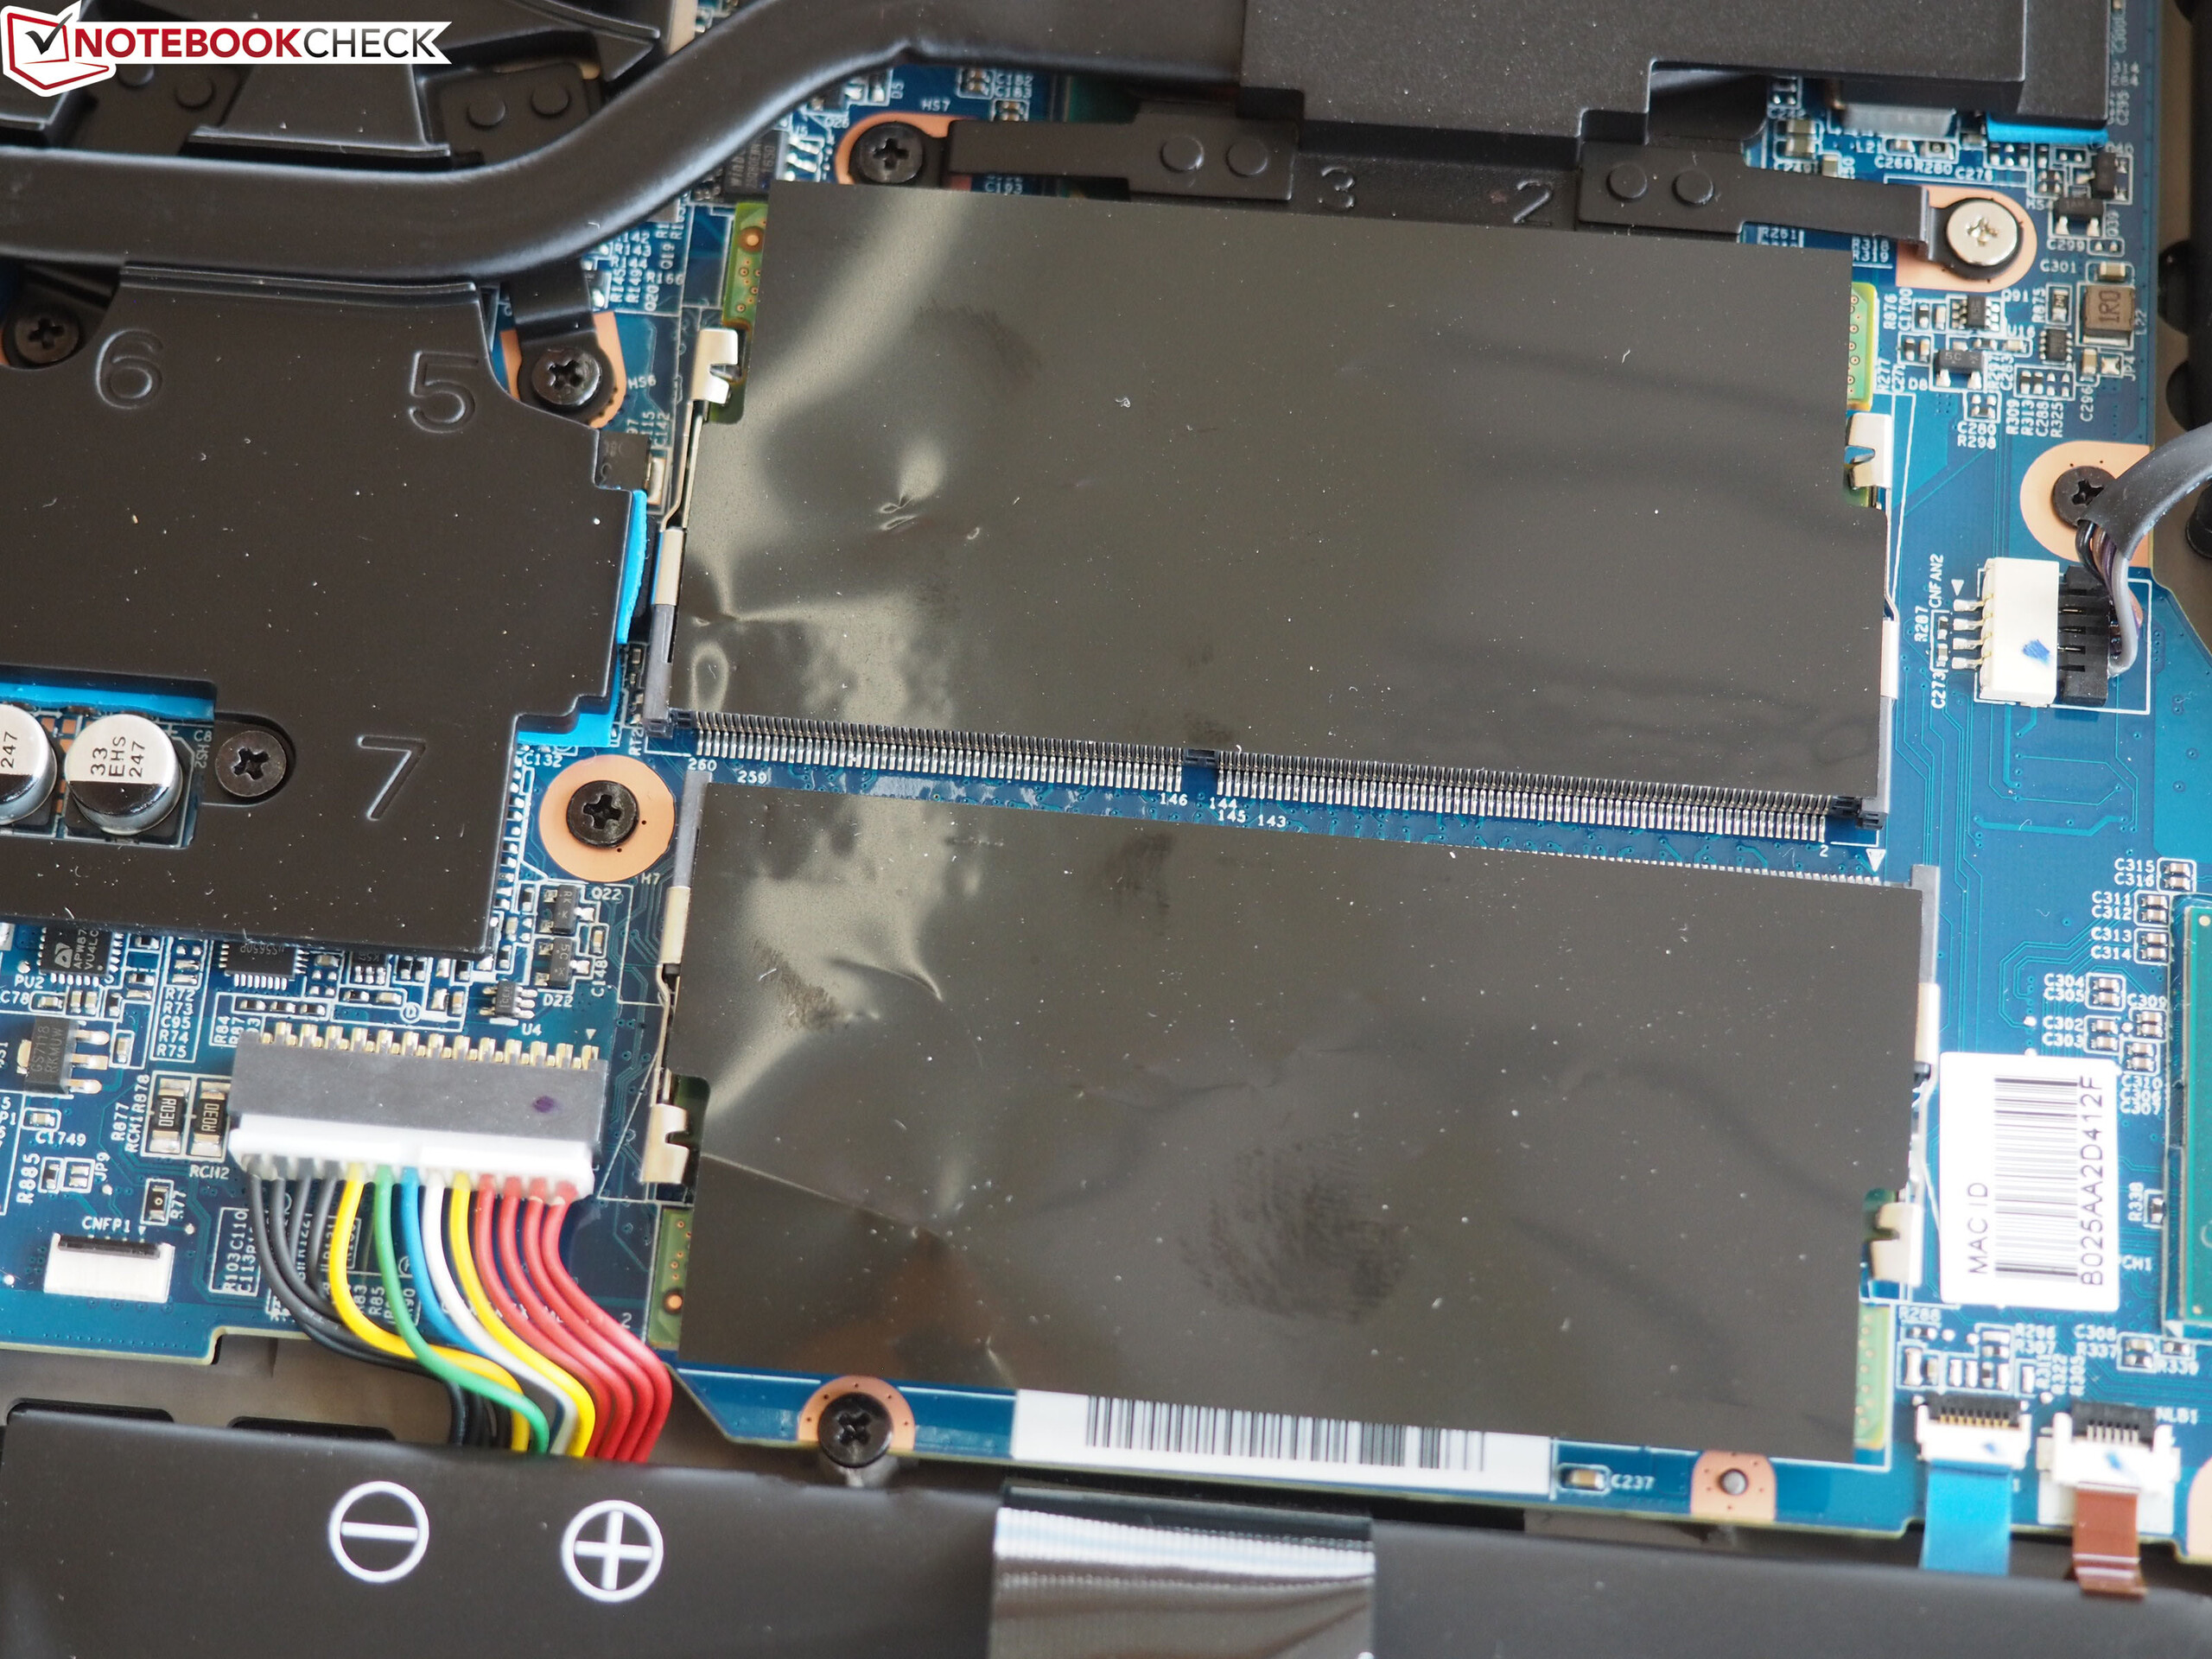
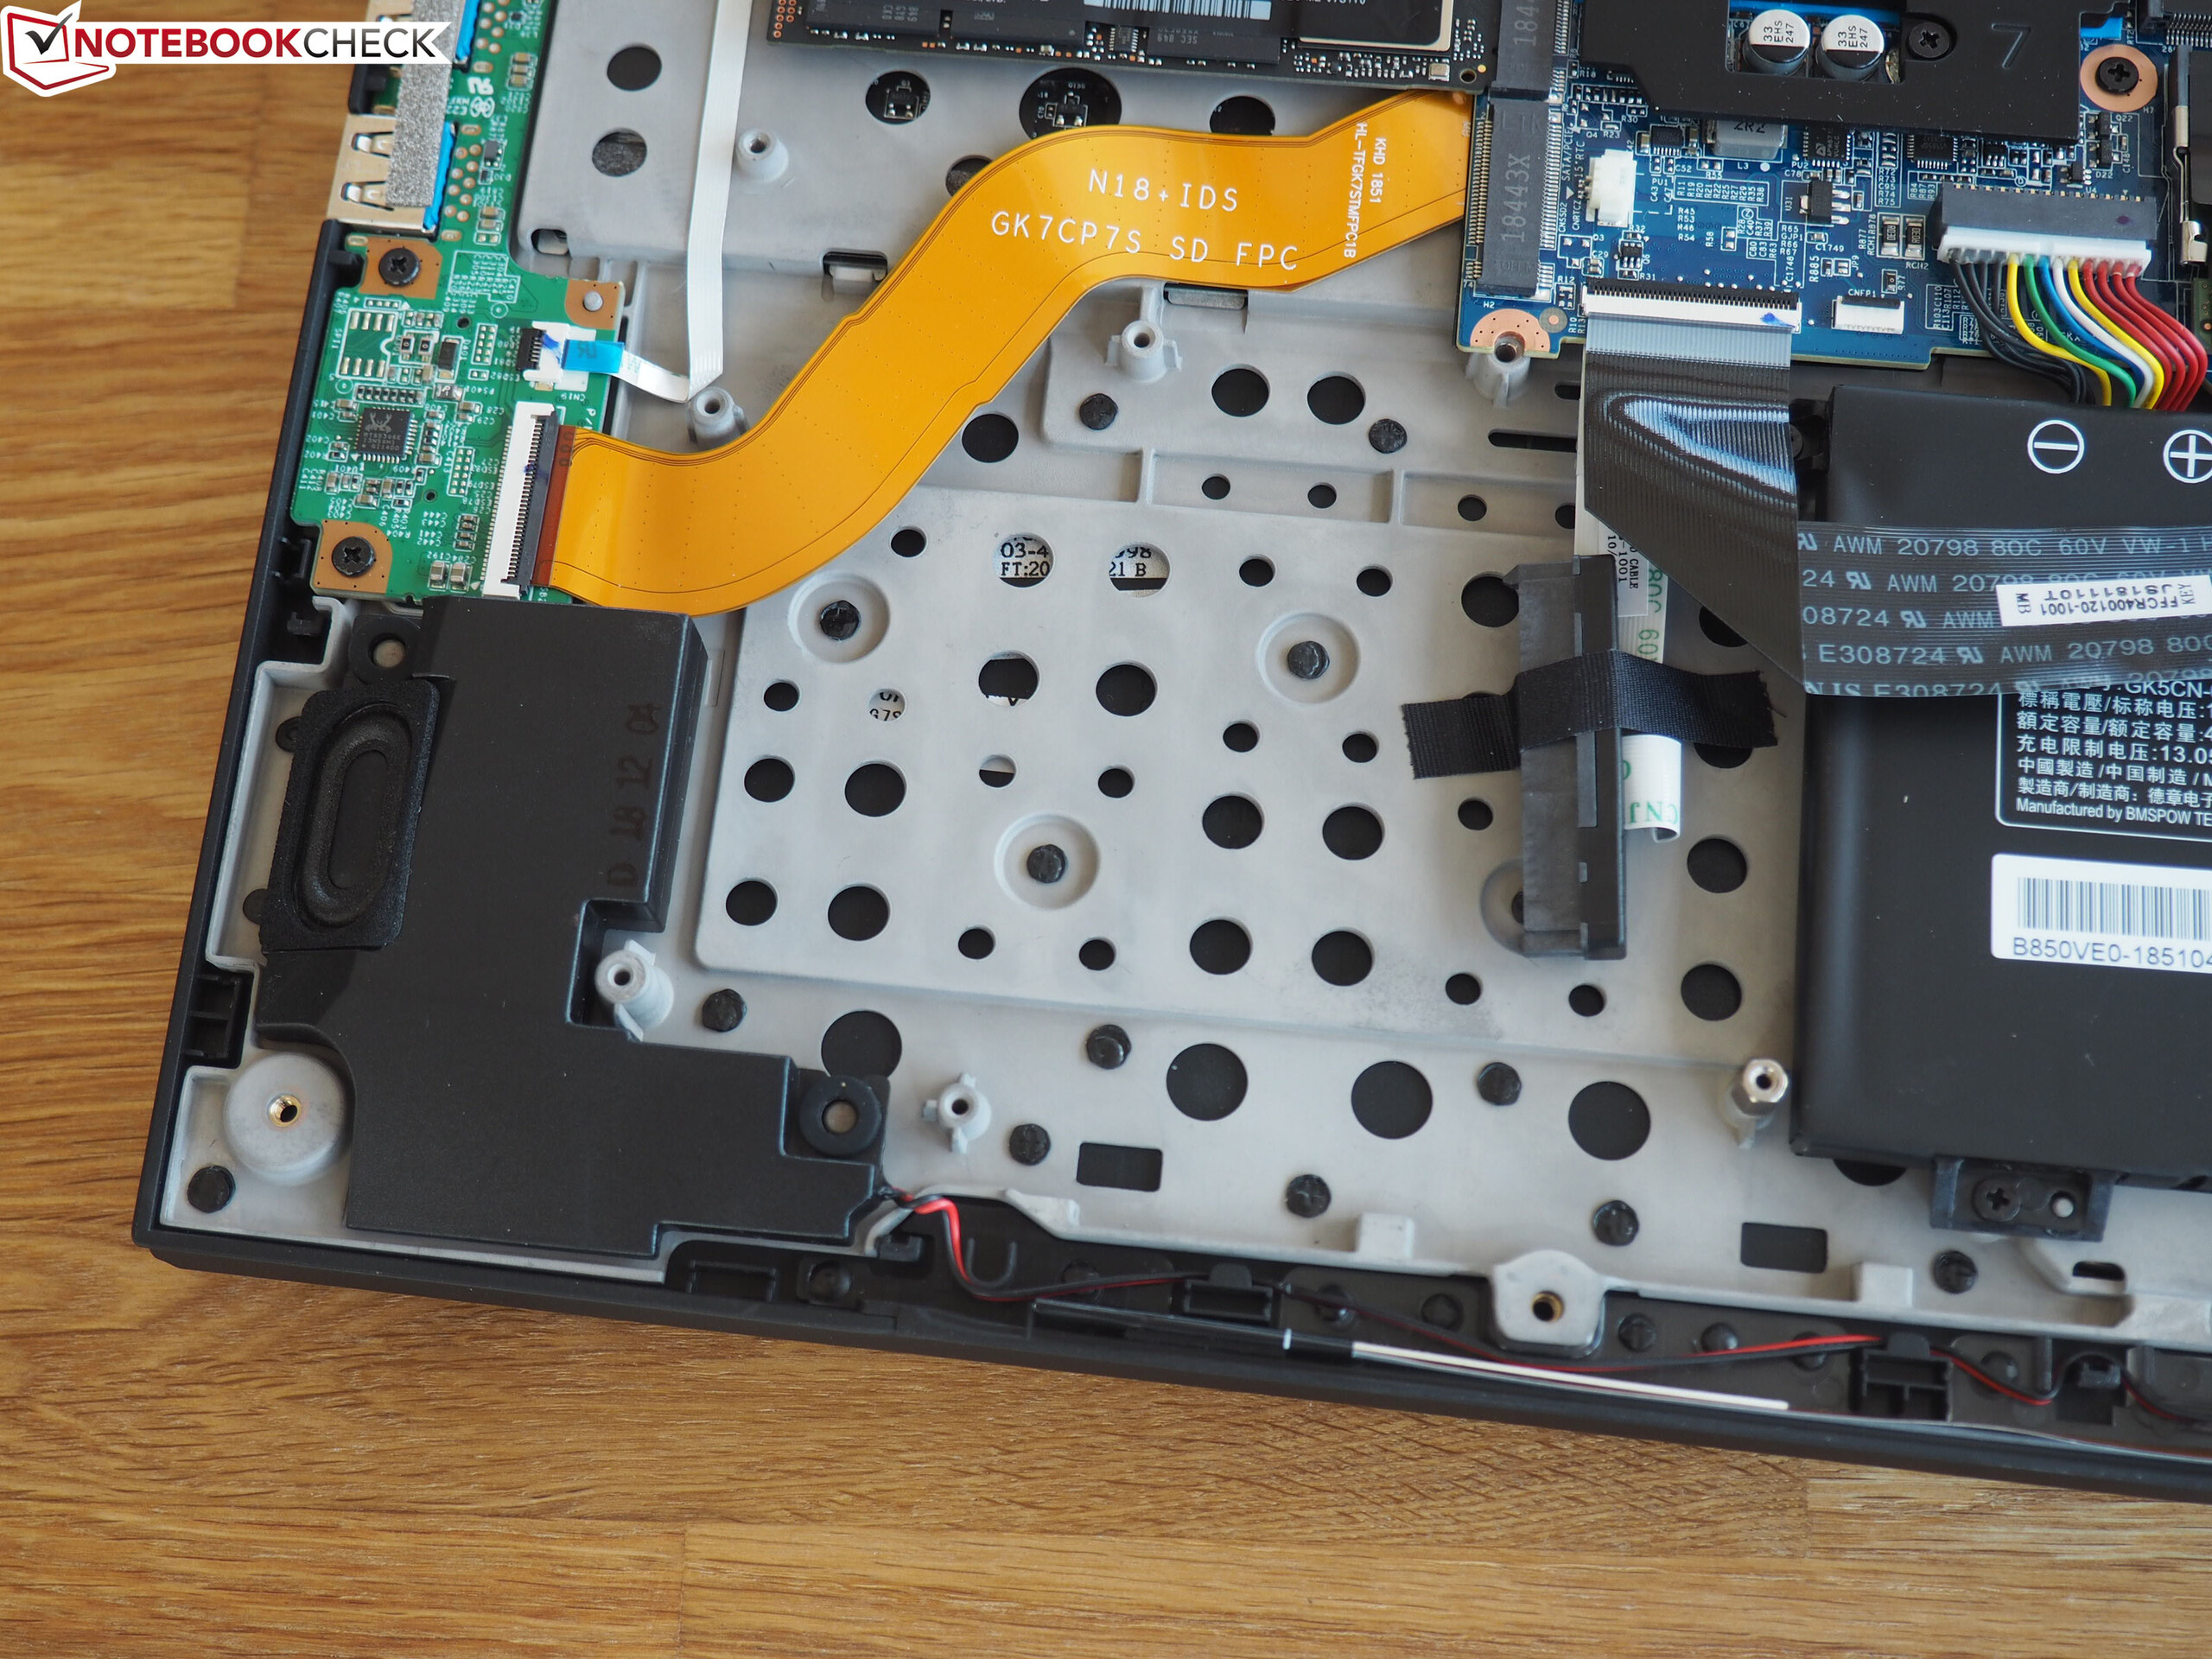
Maintenance
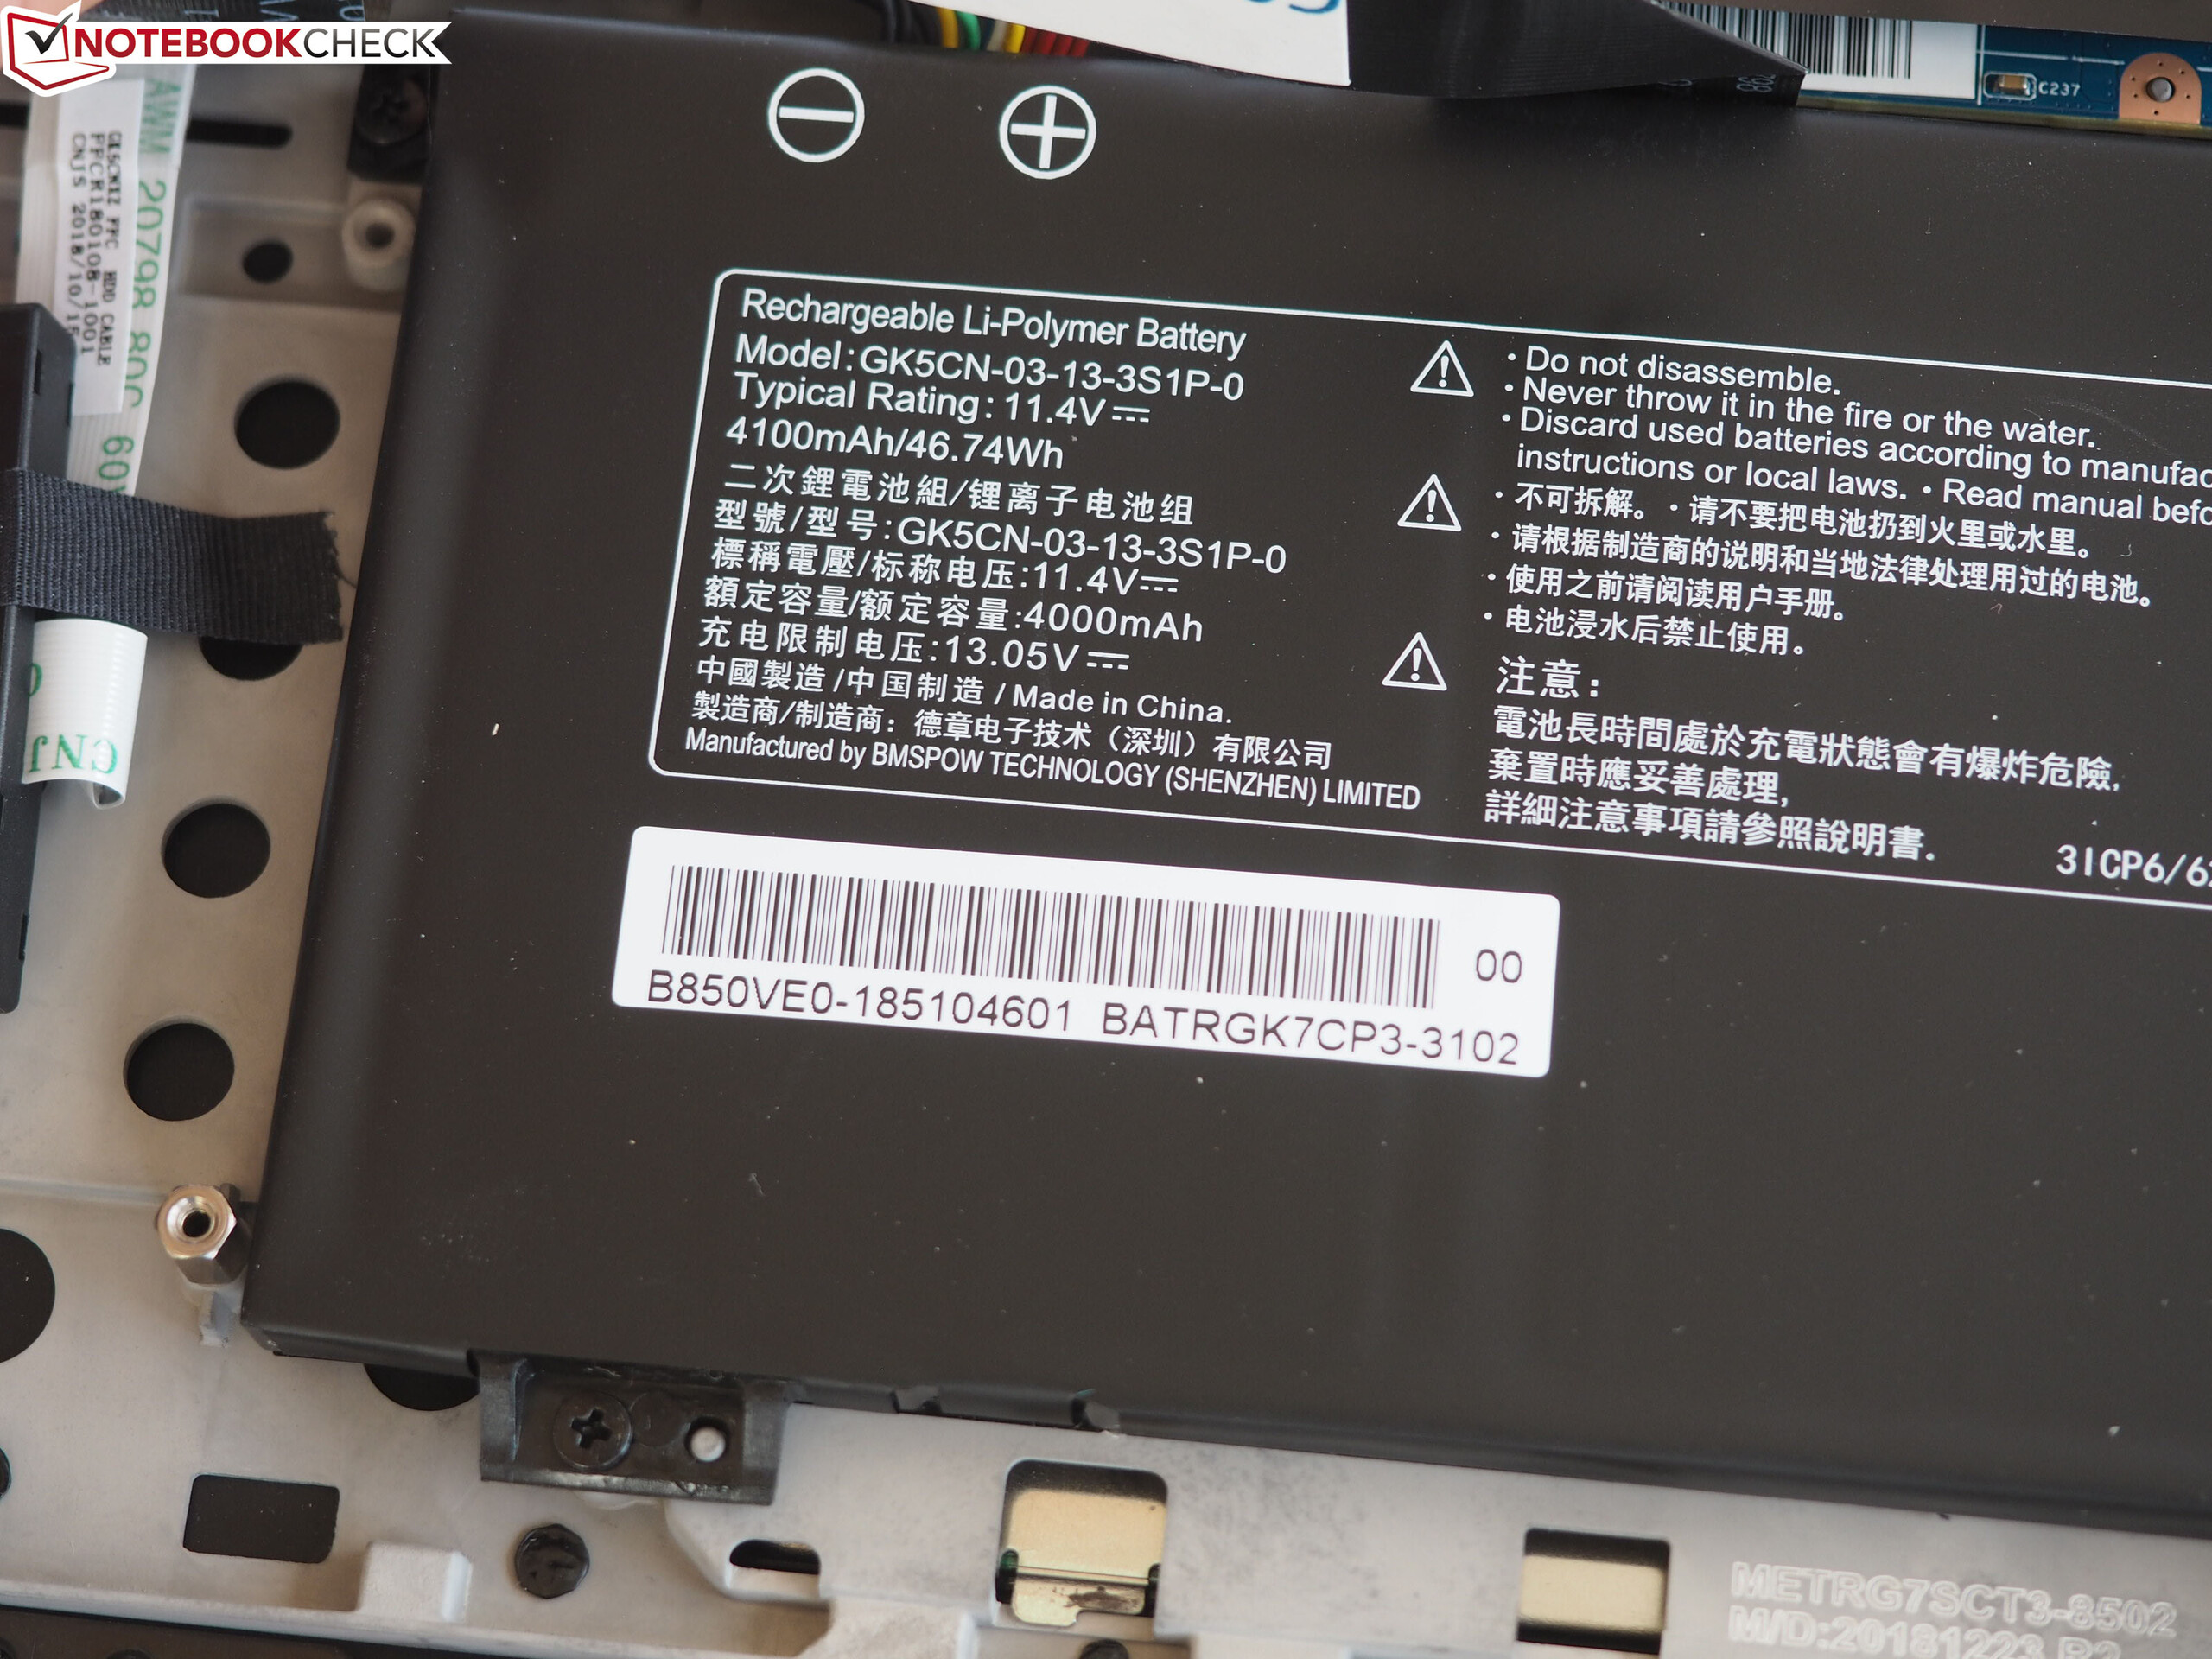
The Neo 17 has no maintenance covers, so you must remove the bottom case to access the internal components. The bottom case is held in place with 12 screws and must be pushed away from the case rather than pulled upwards as with most modern laptops. Removing the case reveals two DDR4 SODIMM slots, two M.2 2280 connectors and a 2.5-inch bay among other components. Schenker has equipped the Neo 17 with two fans and several heatpipes running the length of the machine. The CPU and GPU are soldered to the motherboard, which makes them irreplaceable, but you can change the battery if necessary.
Warranty
The Neo 17 comes with a 3 years manufacturer’s warranty, at least if you buy it directly from Schenker. The warranty includes 6 months pickup and returns service, which can be extended to 18 months or 36 months at the time of purchase for €40 (~$45) and €50 (~$56) respectively.
Please see our Guarantees, Return Policies and Warranties FAQ for country-specific information.
Input Devices
Keyboard
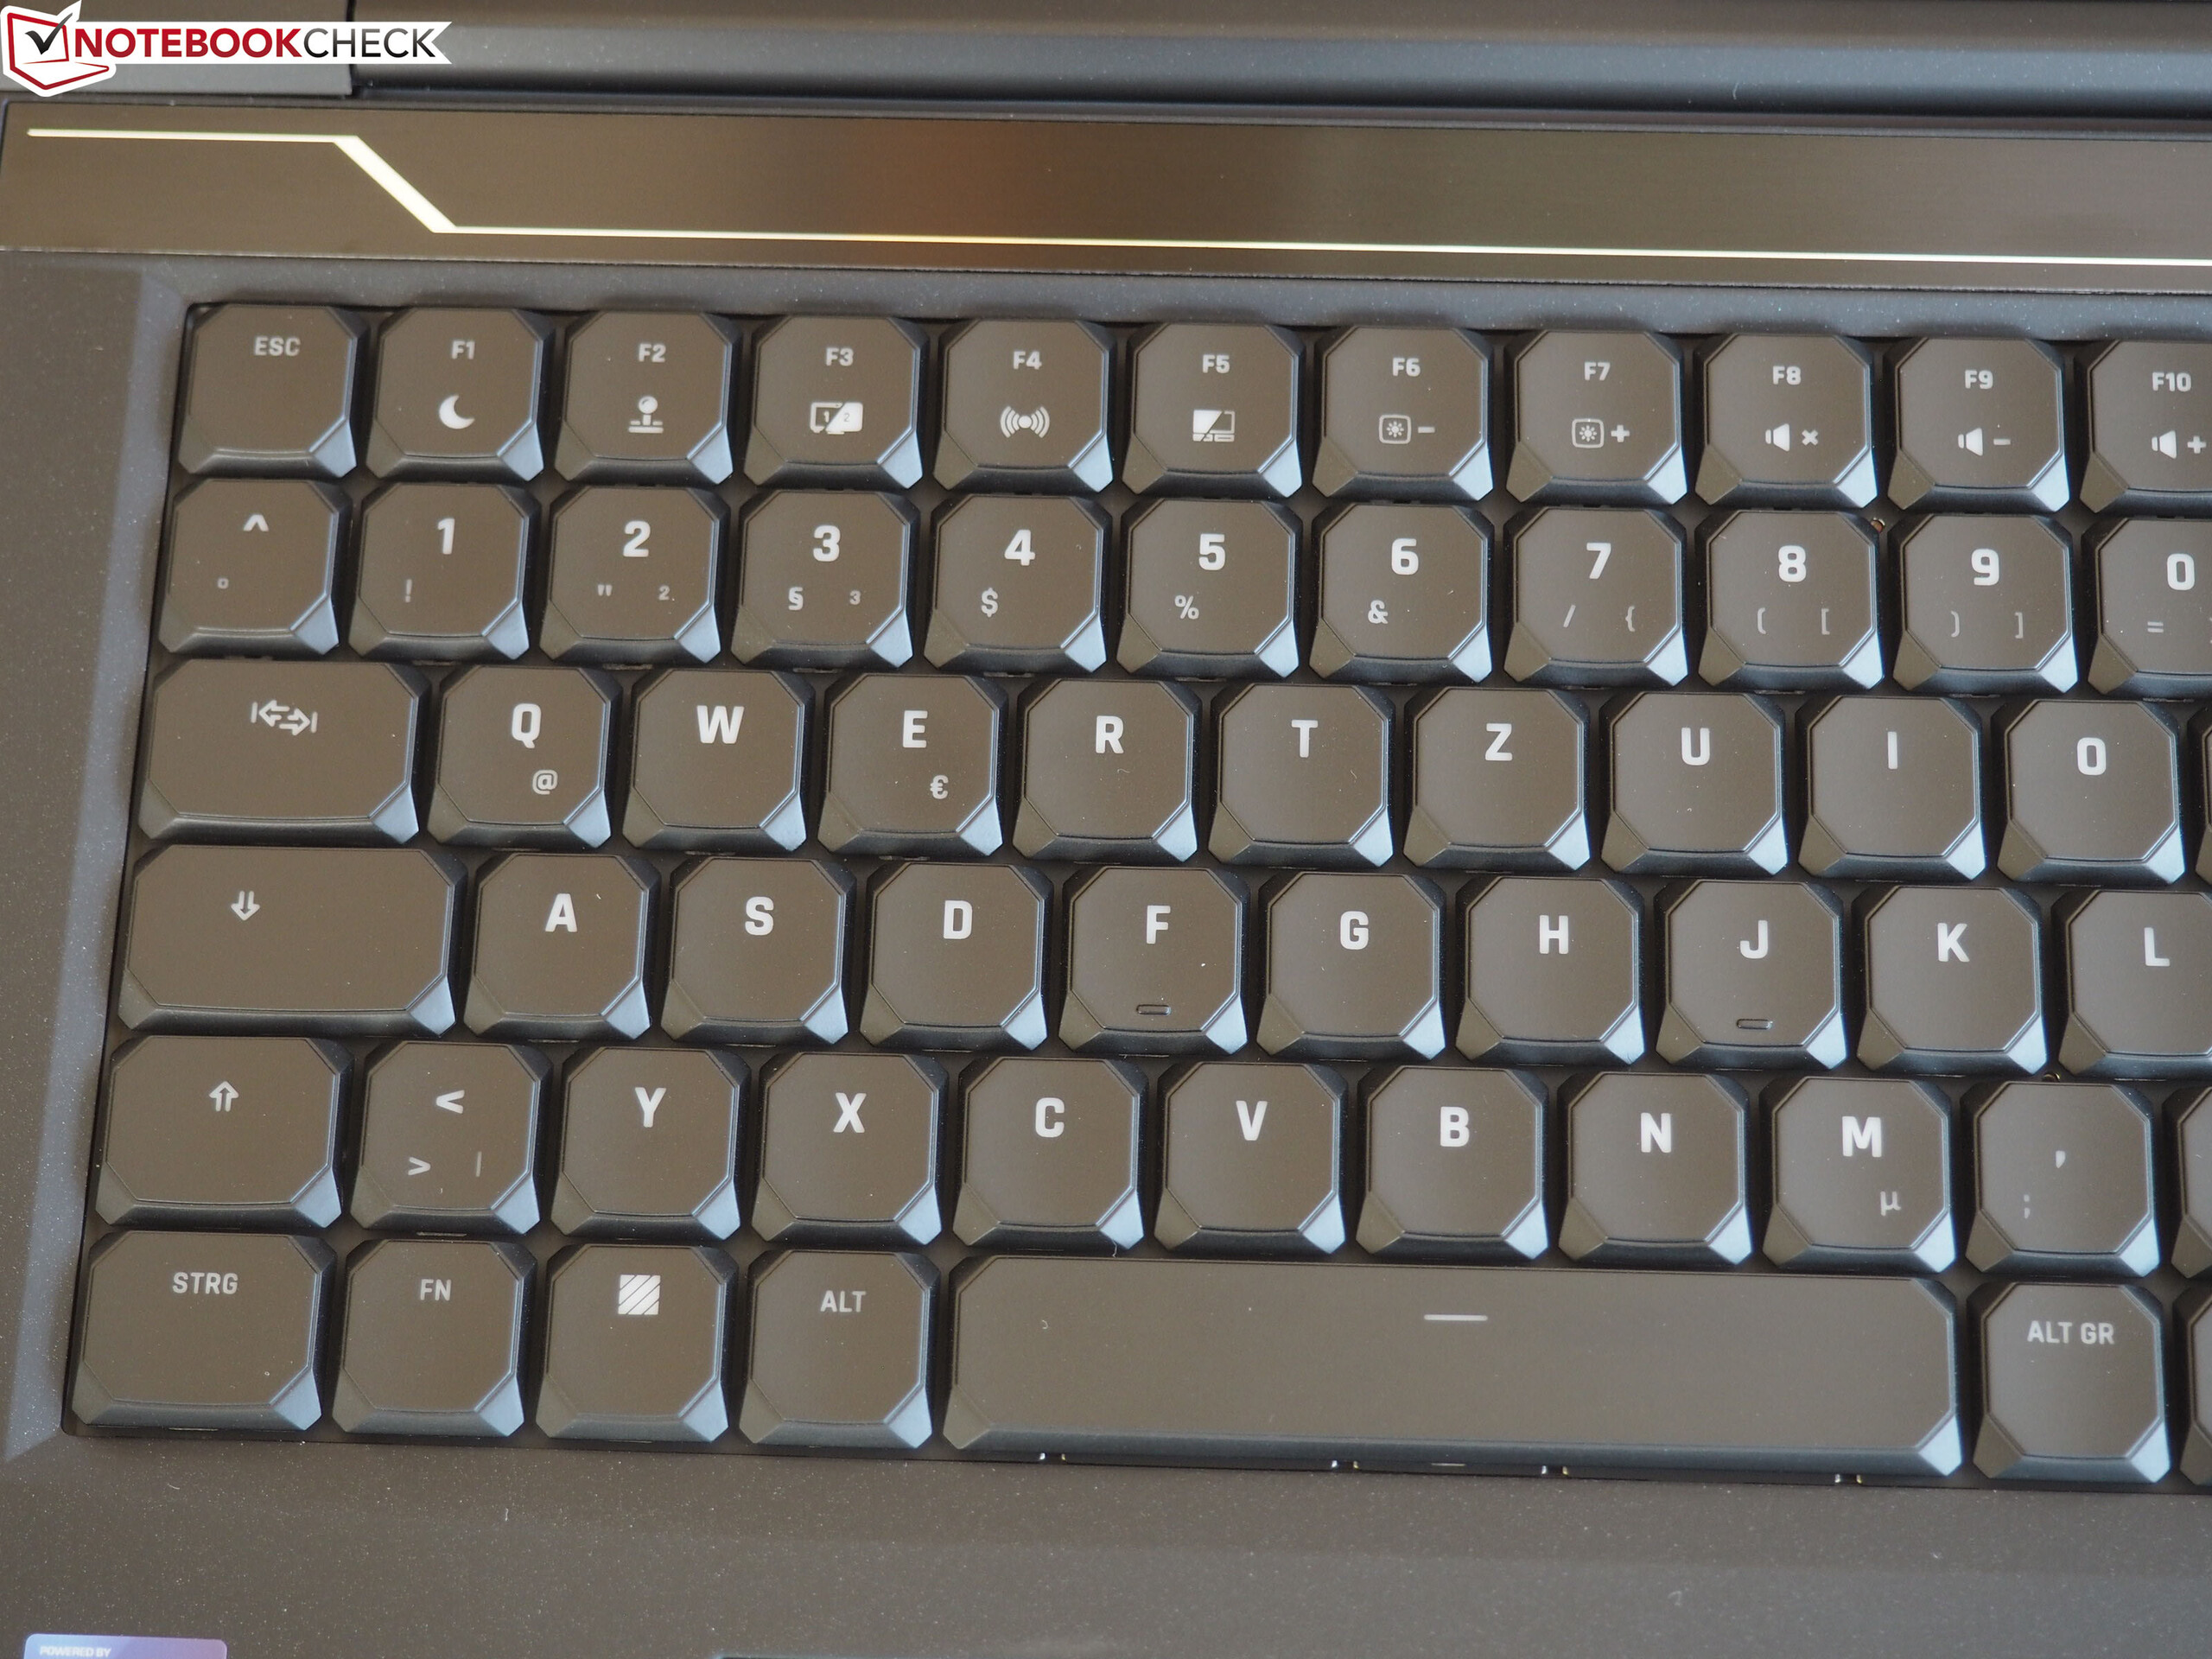
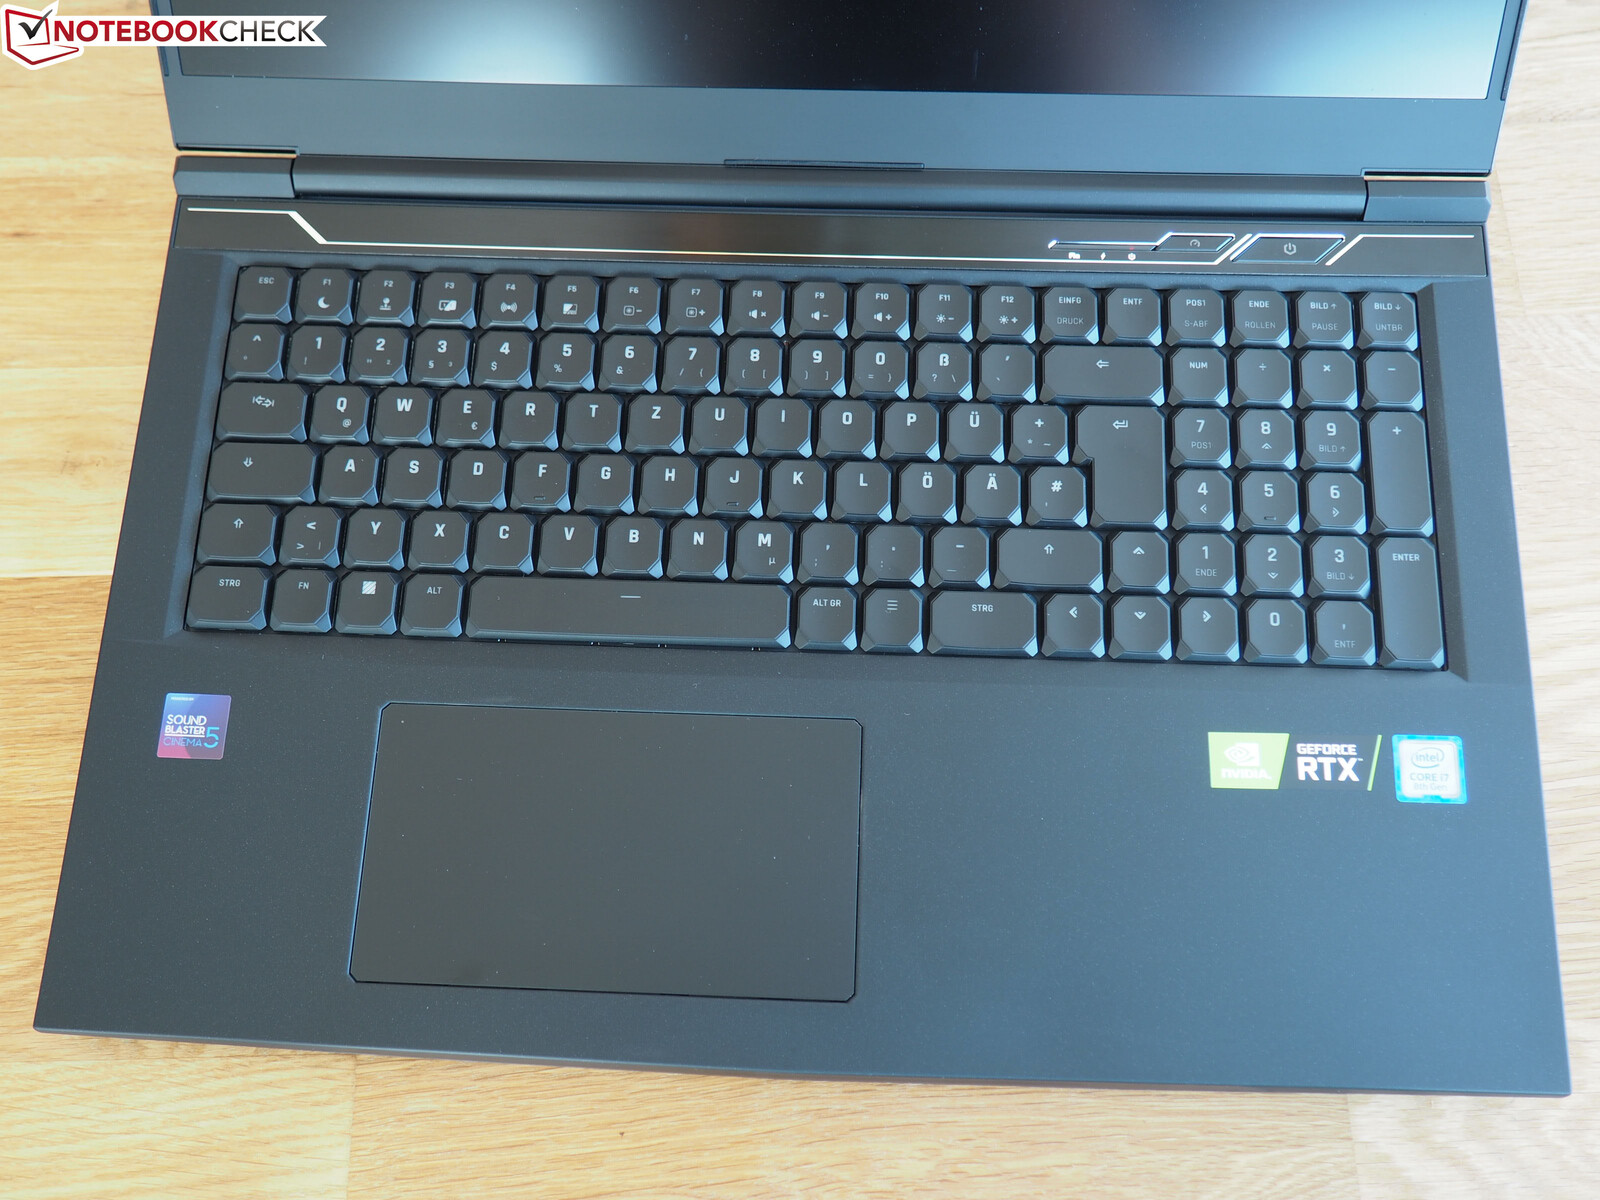
One of the biggest highlights of the Neo 17 is its mechanical keyboard. While it sounds louder than most conventional keyboards despite its silent switches, it offers a first-class typing experience in our opinion. The pressure points and strokes of each key impressively precise, which makes the Neo 17 an excellent choice for by prolific typists. The keys look rather unusual with their bevelled corners, but we had no issue with this while typing. Most keys measure 16 x 16 mm (~0.63 x 0.63 in), although some keys such as the left shift and caps lock are slightly wider, as demonstrated by the photo below.
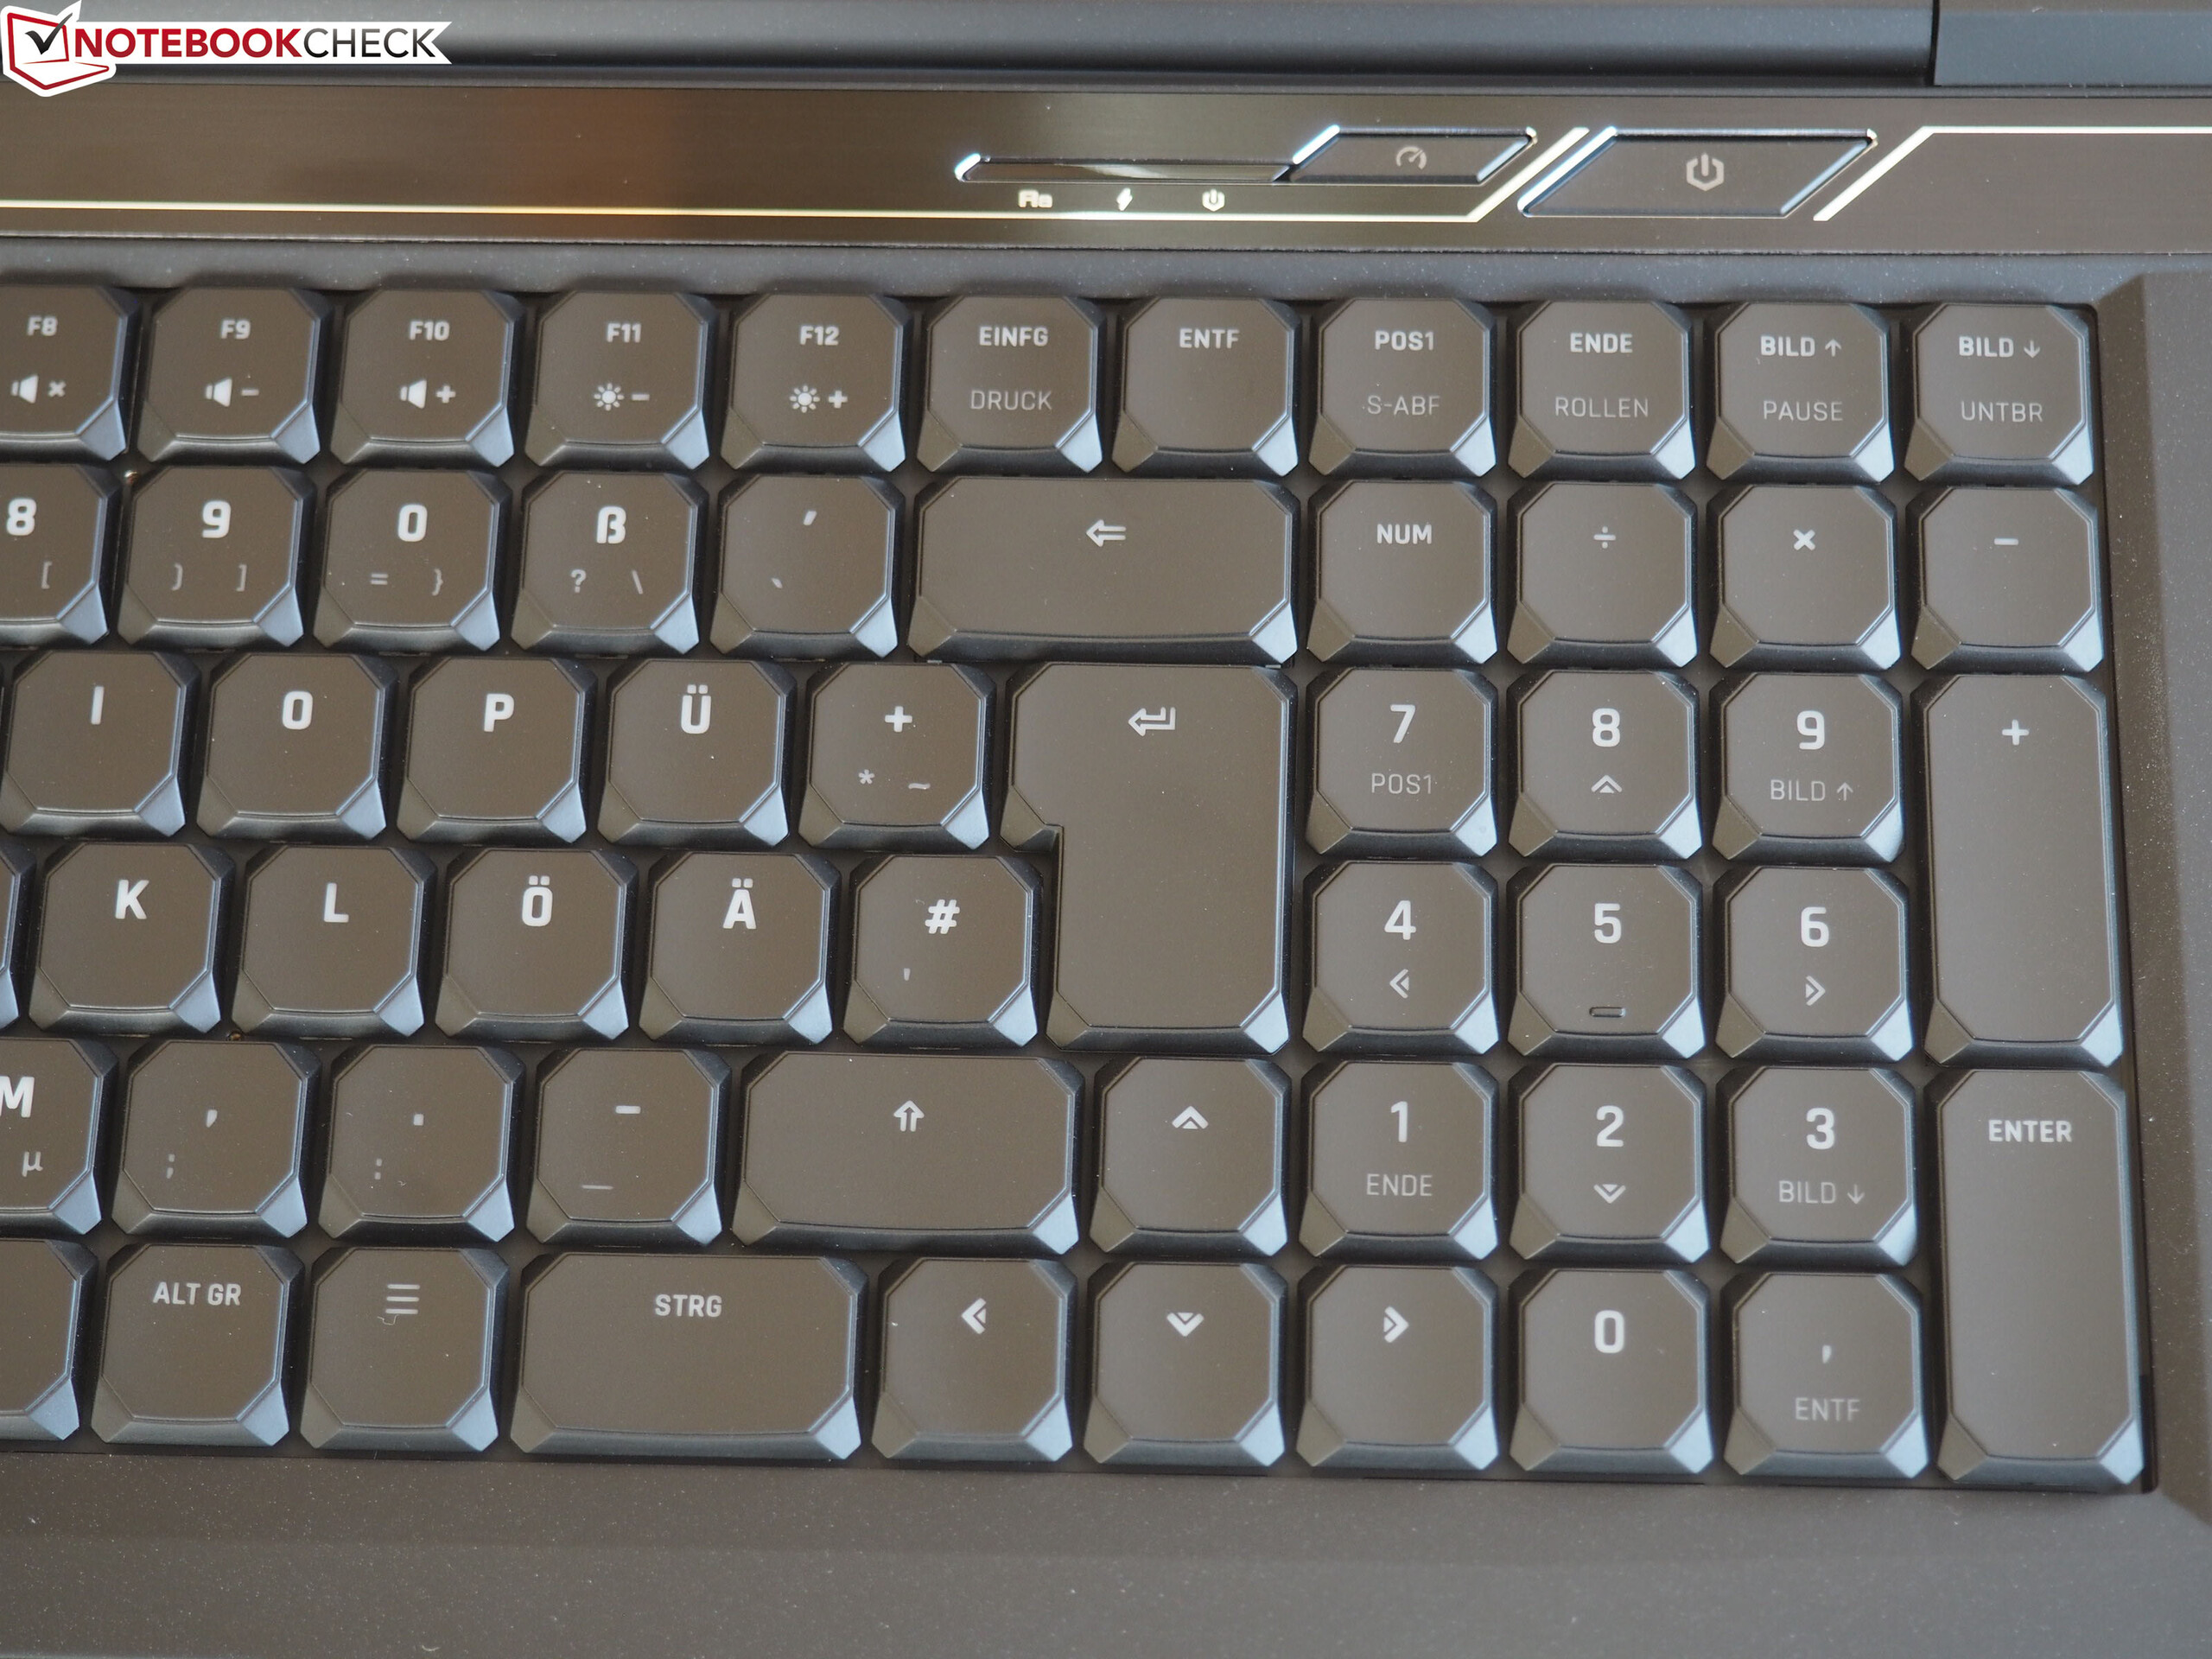
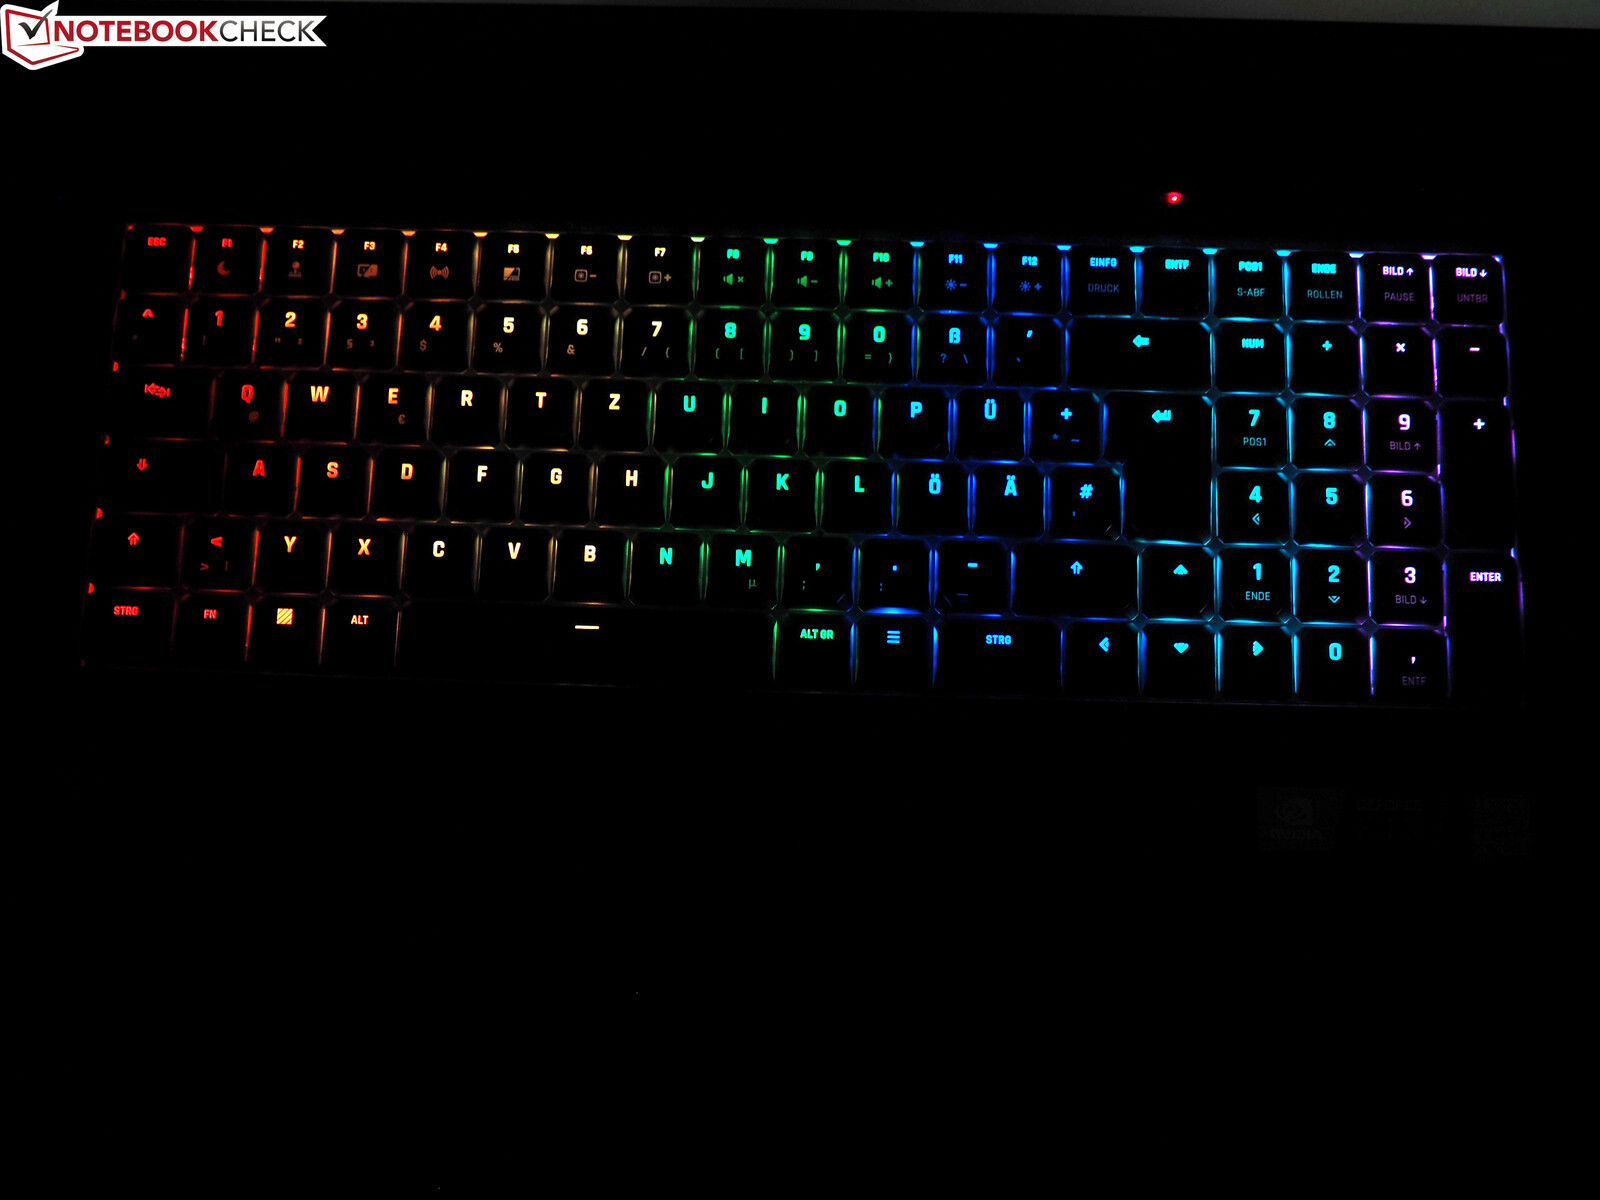
We are not huge fans of the layout though. The right arrow strays into the numpad, to which it may take some time to acclimatise. The Neo 17 still has a very good keyboard irrespective of its suboptimal layout, not least of which because of its RGB backlighting, which has several modes and multiple stages of brightness.
Trackpad
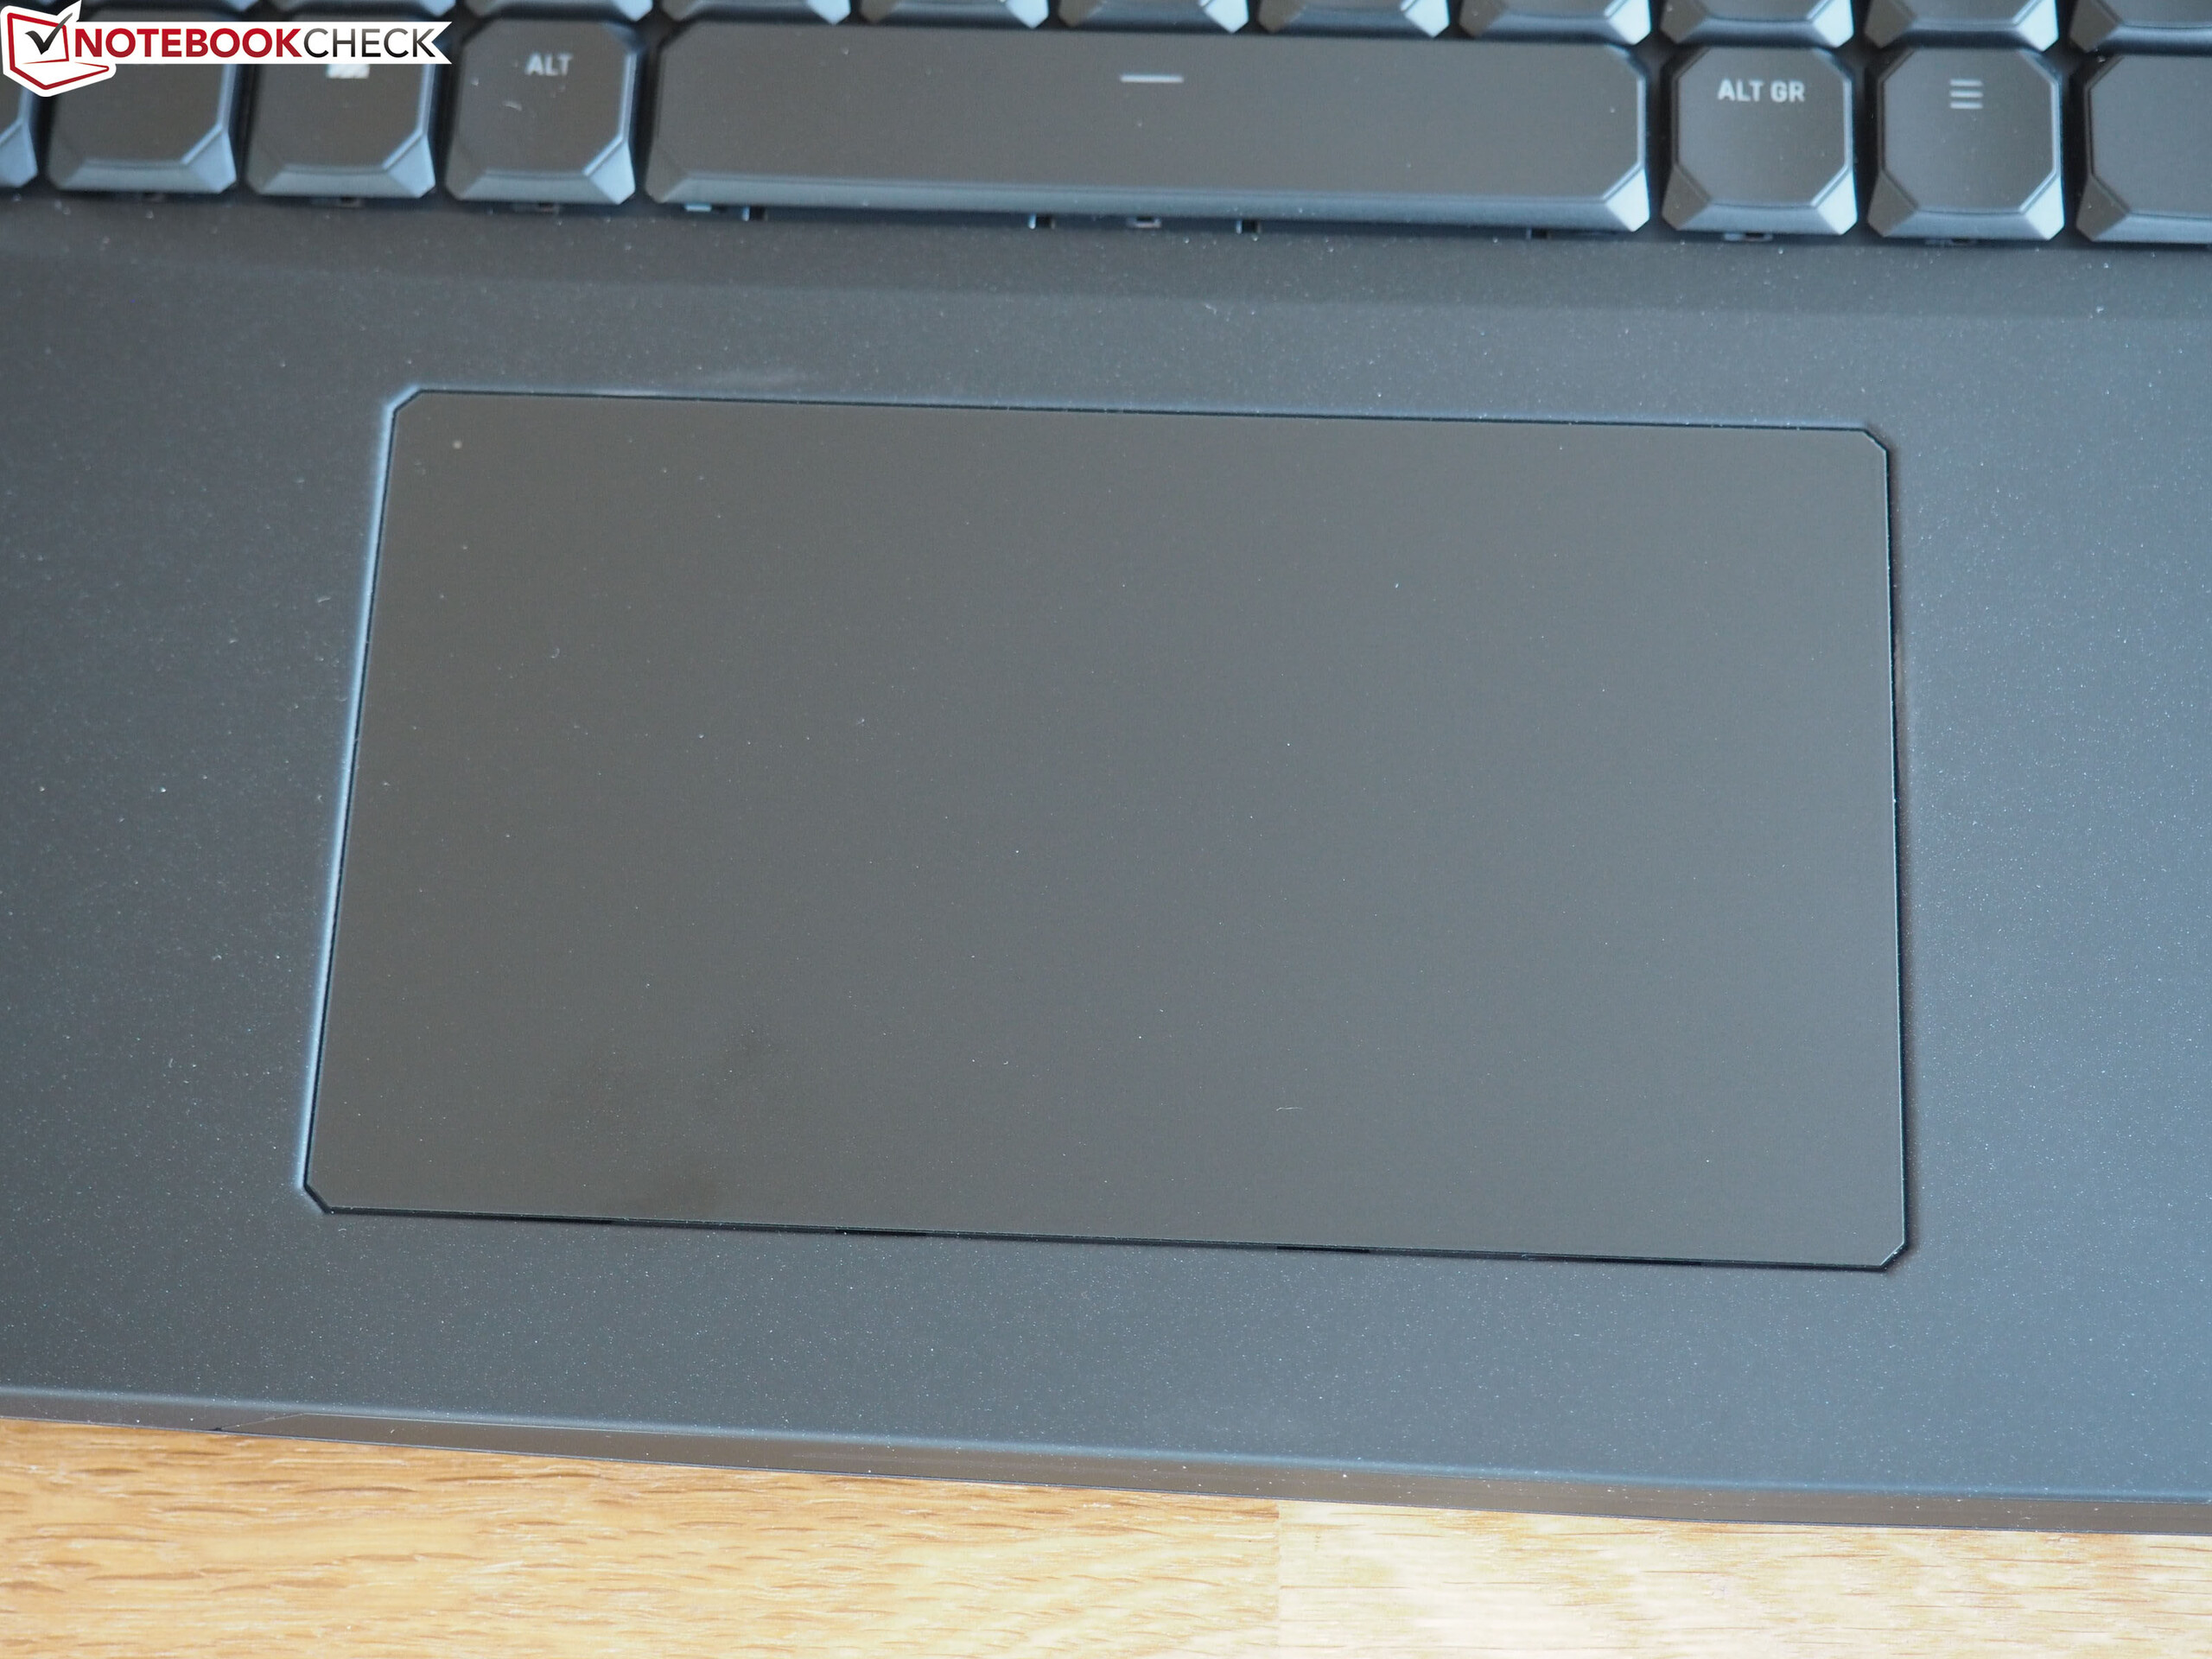
Unfortunately, the trackpad is much less impressive than its sibling. On the one hand, it is pleasingly large at 13 x 7.5 cm (~5.1 x 3 in), but it is so close to the keyboard that you may accidentally touch it when gaming with an external mouse and the Neo 17’s keyboard. Hence, we would recommend deactivating the trackpad in such conditions. Moreover, the trackpad has an incredibly high activation force, especially in its bottom left and right-hand corners.
The latter issue is a pity because it ruins what is otherwise a good trackpad. Its smooth surface and size make it easy to perform swiping or multi-finger gestures on but activating the integrated mouse buttons is too difficult for our liking.
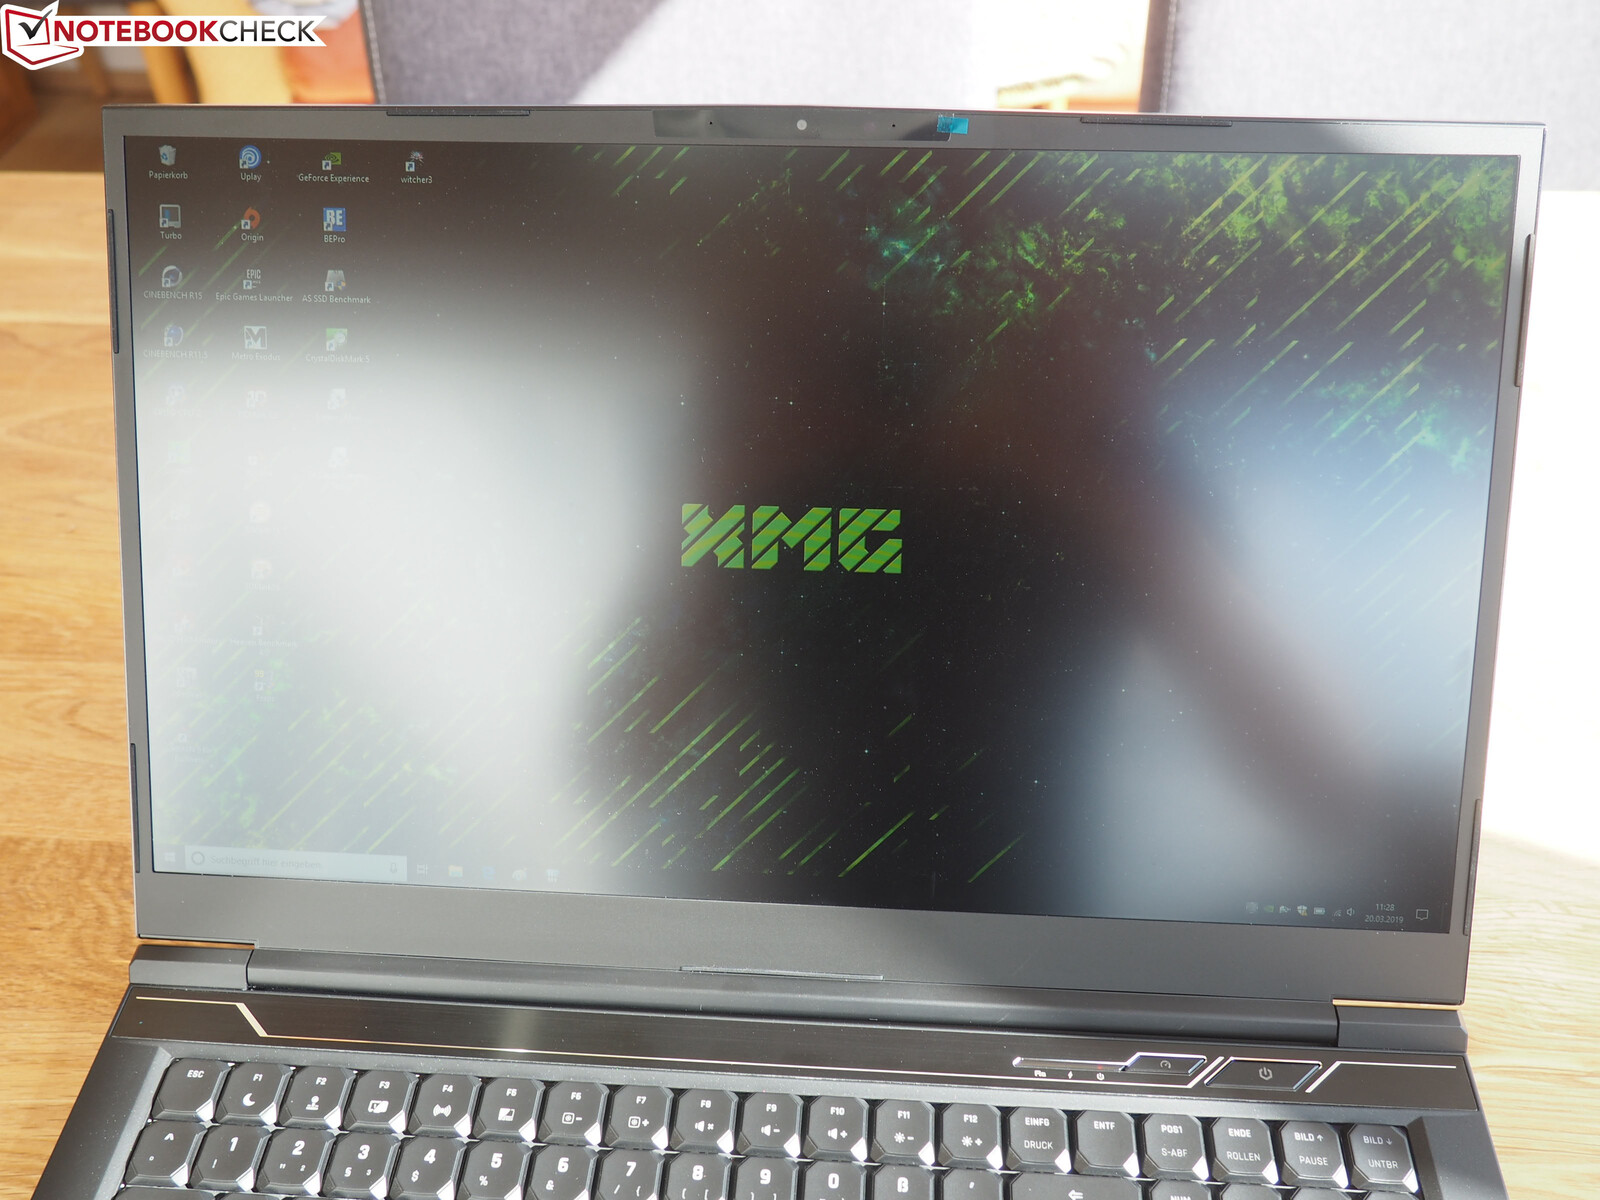
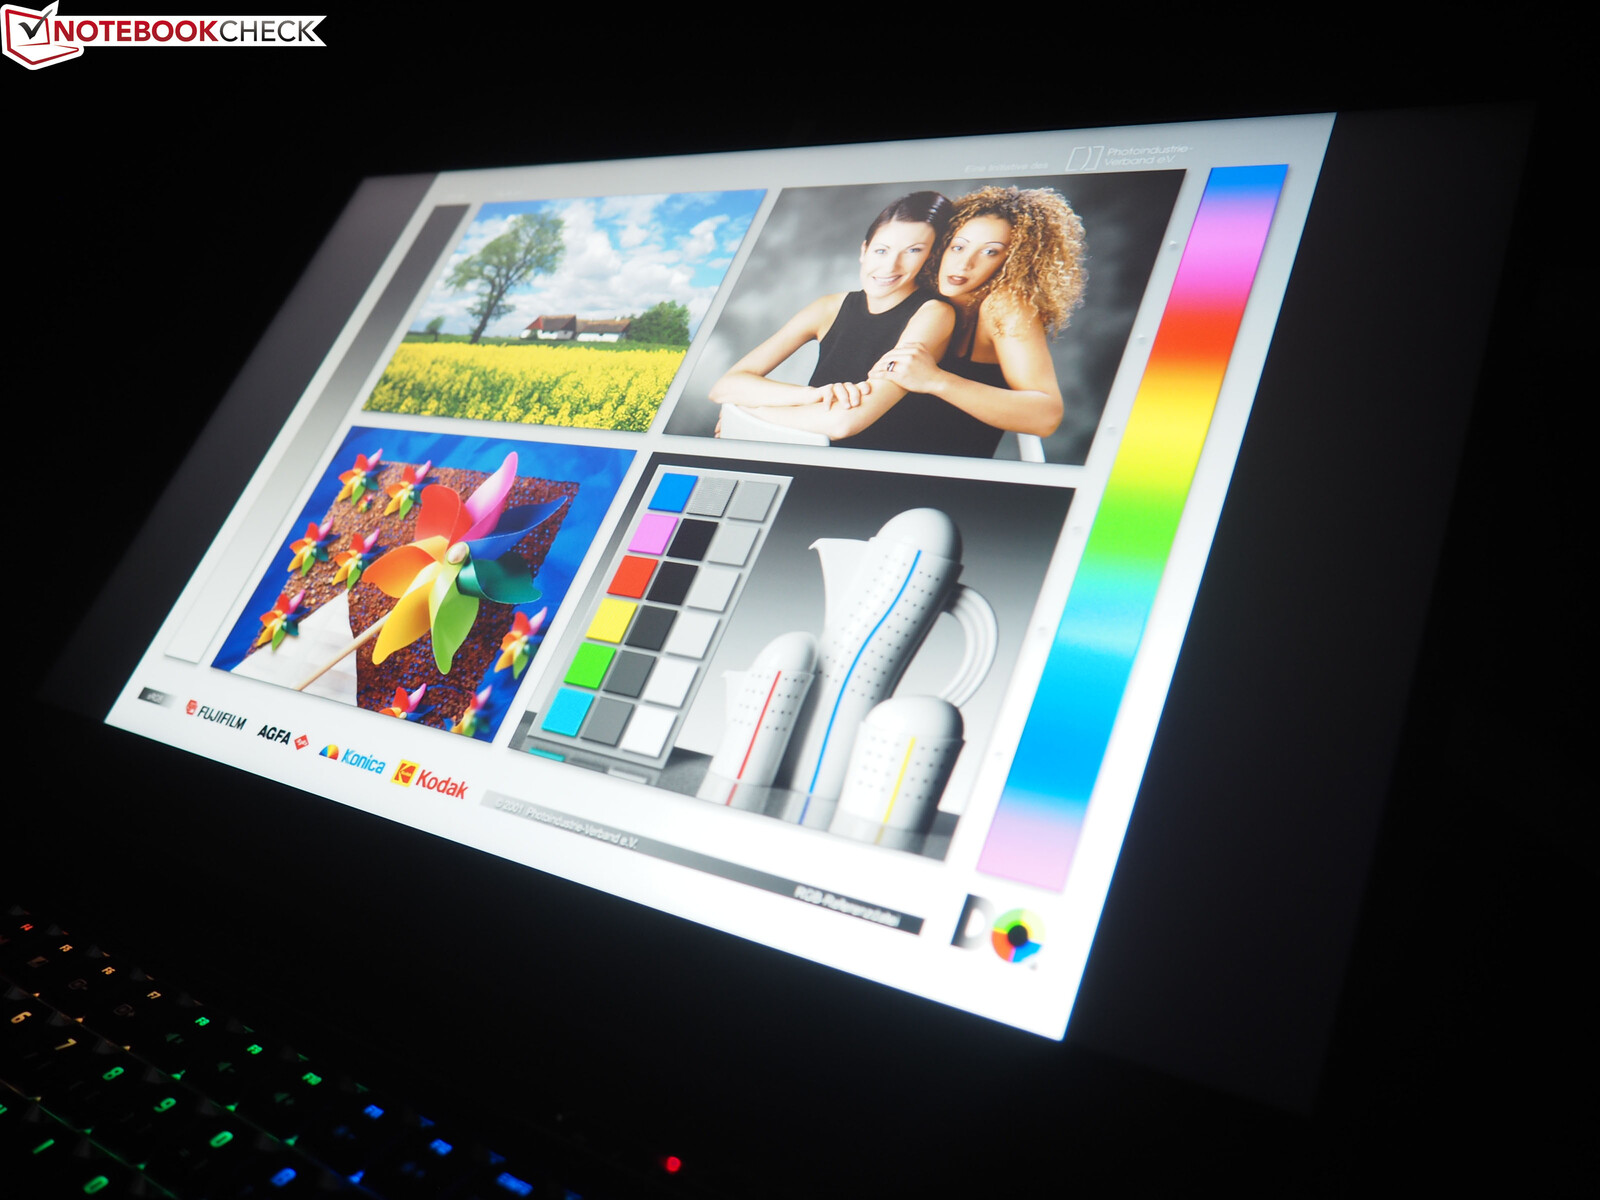
Display
Schenker has equipped the Neo 17 with a 144 Hz display as is the trend with current gaming laptops. Our review unit has a BOEhydis NV173FHM-N44 panel that performed impressively well in almost all our tests.
| |||||||||||||||||||||||||
Brightness Distribution: 90 %
Center on Battery: 304 cd/m²
Contrast: 1169:1 (Black: 0.26 cd/m²)
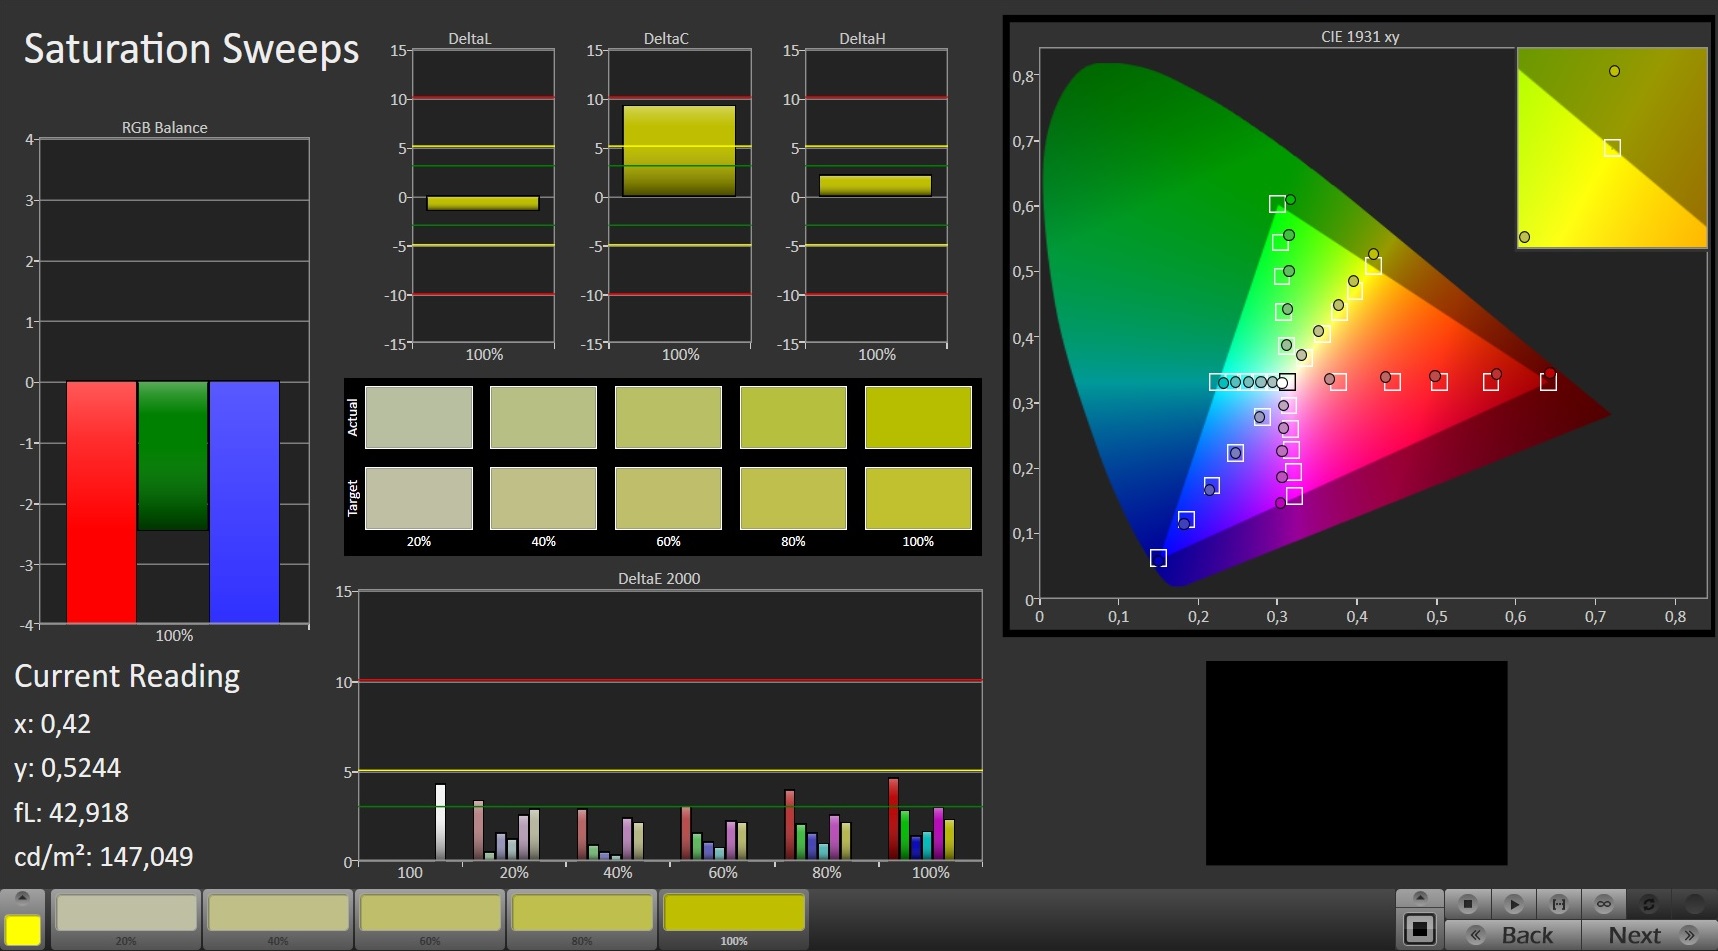
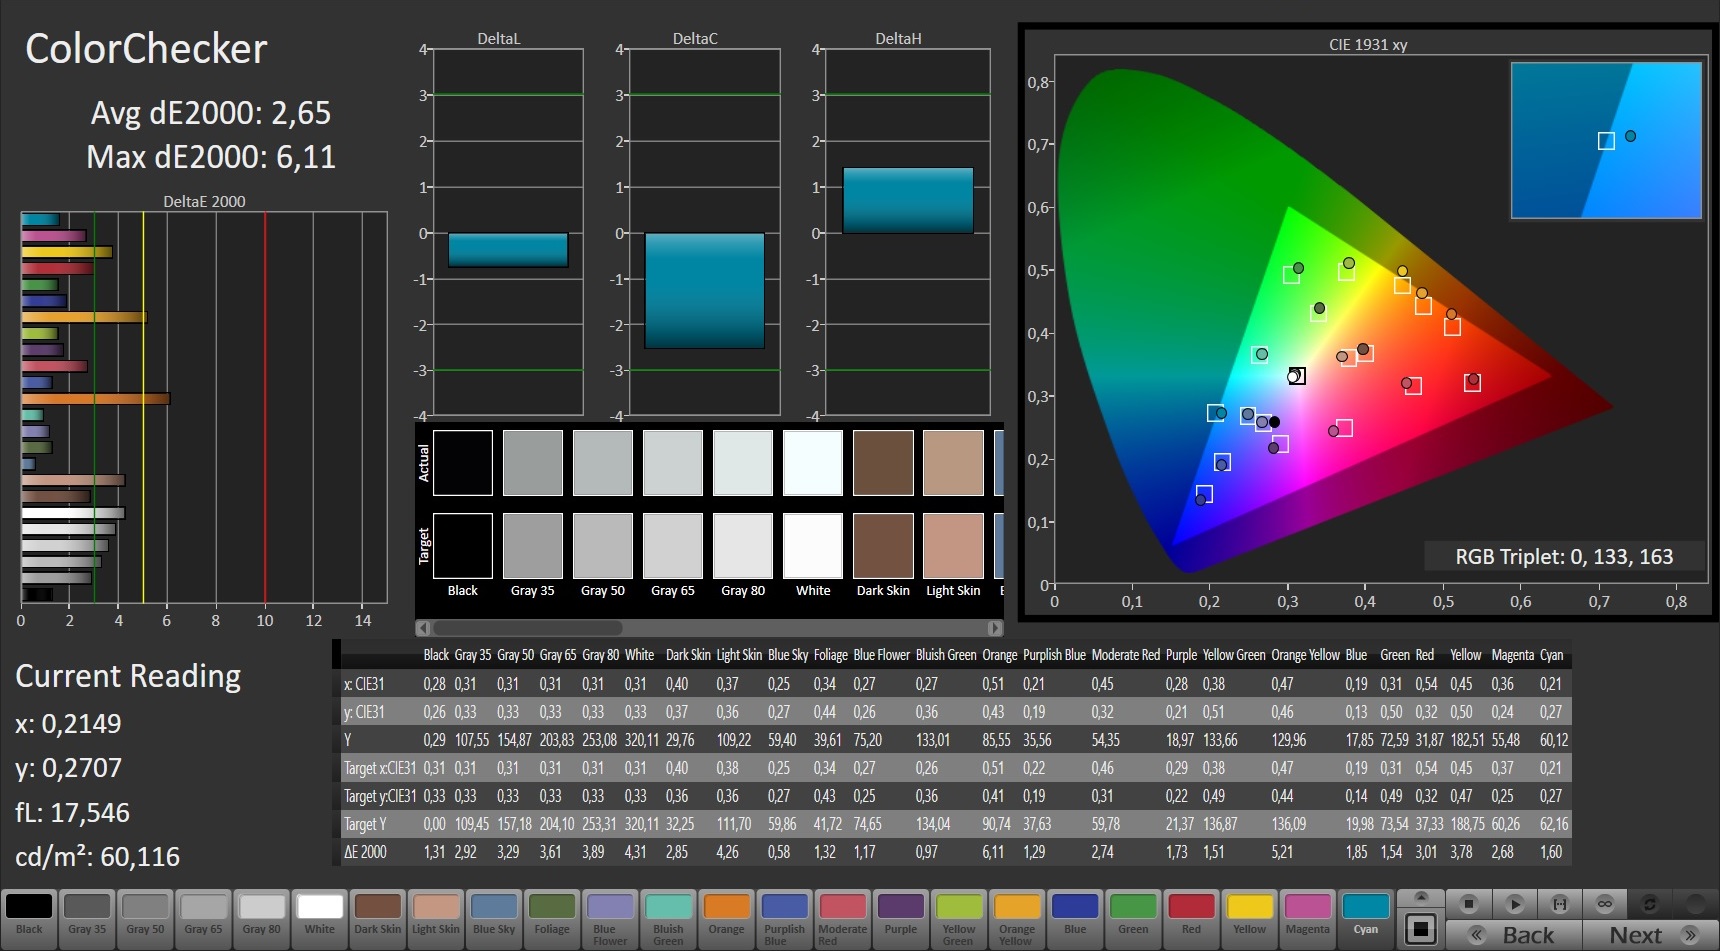
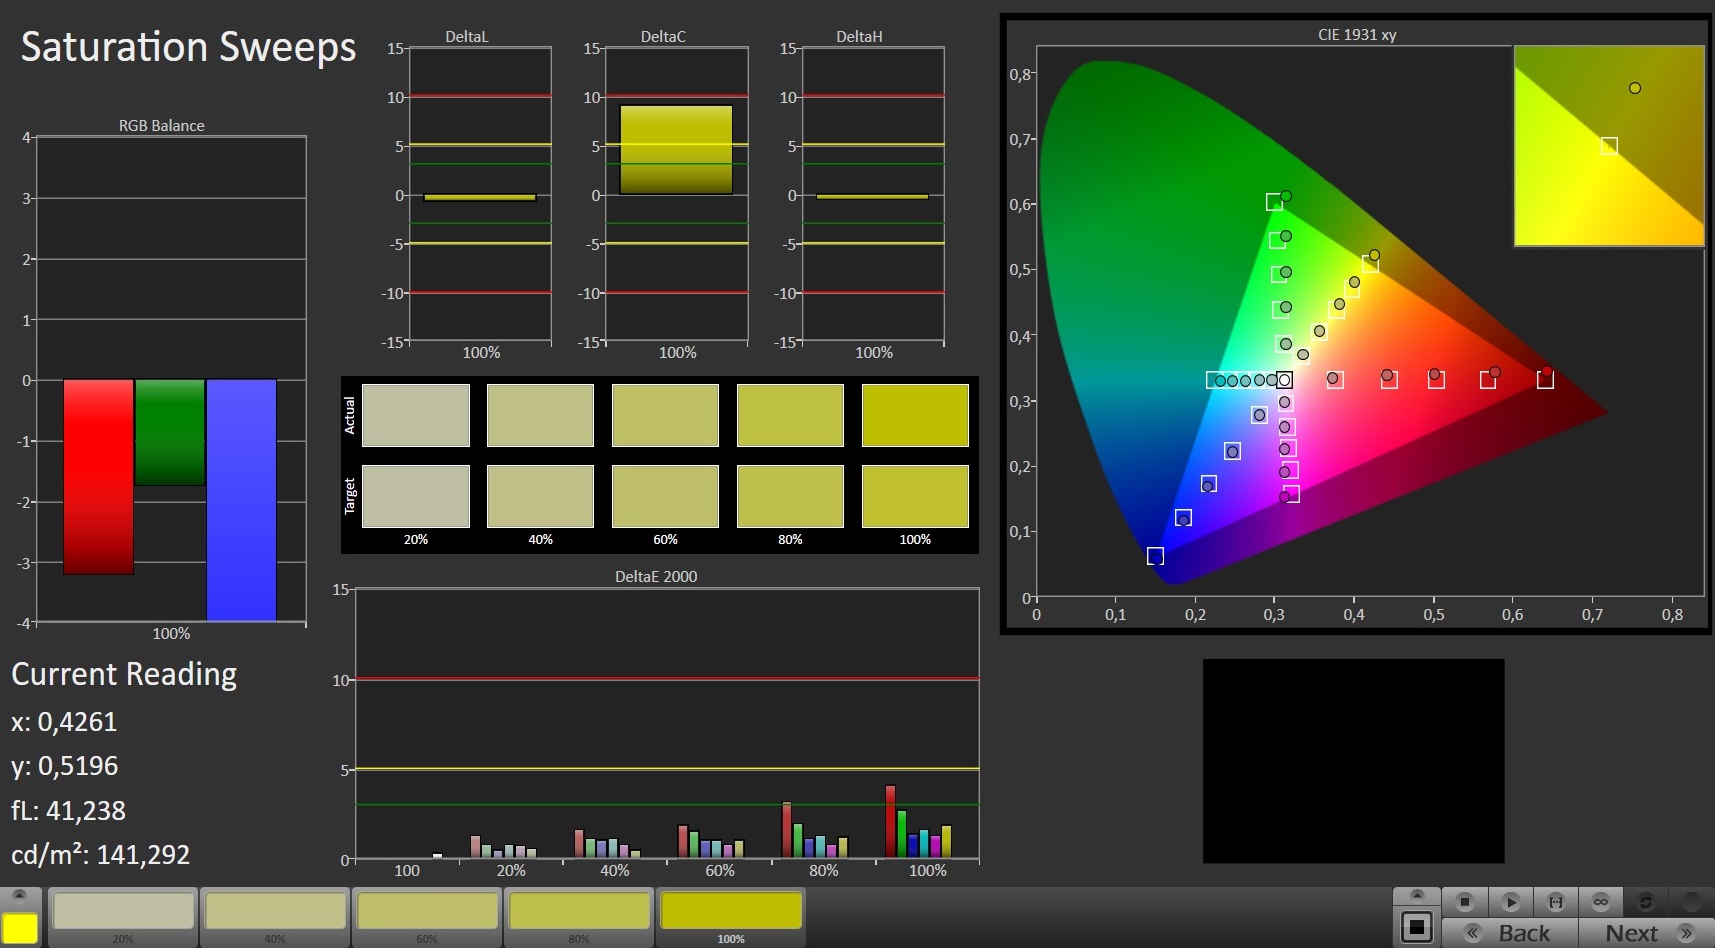
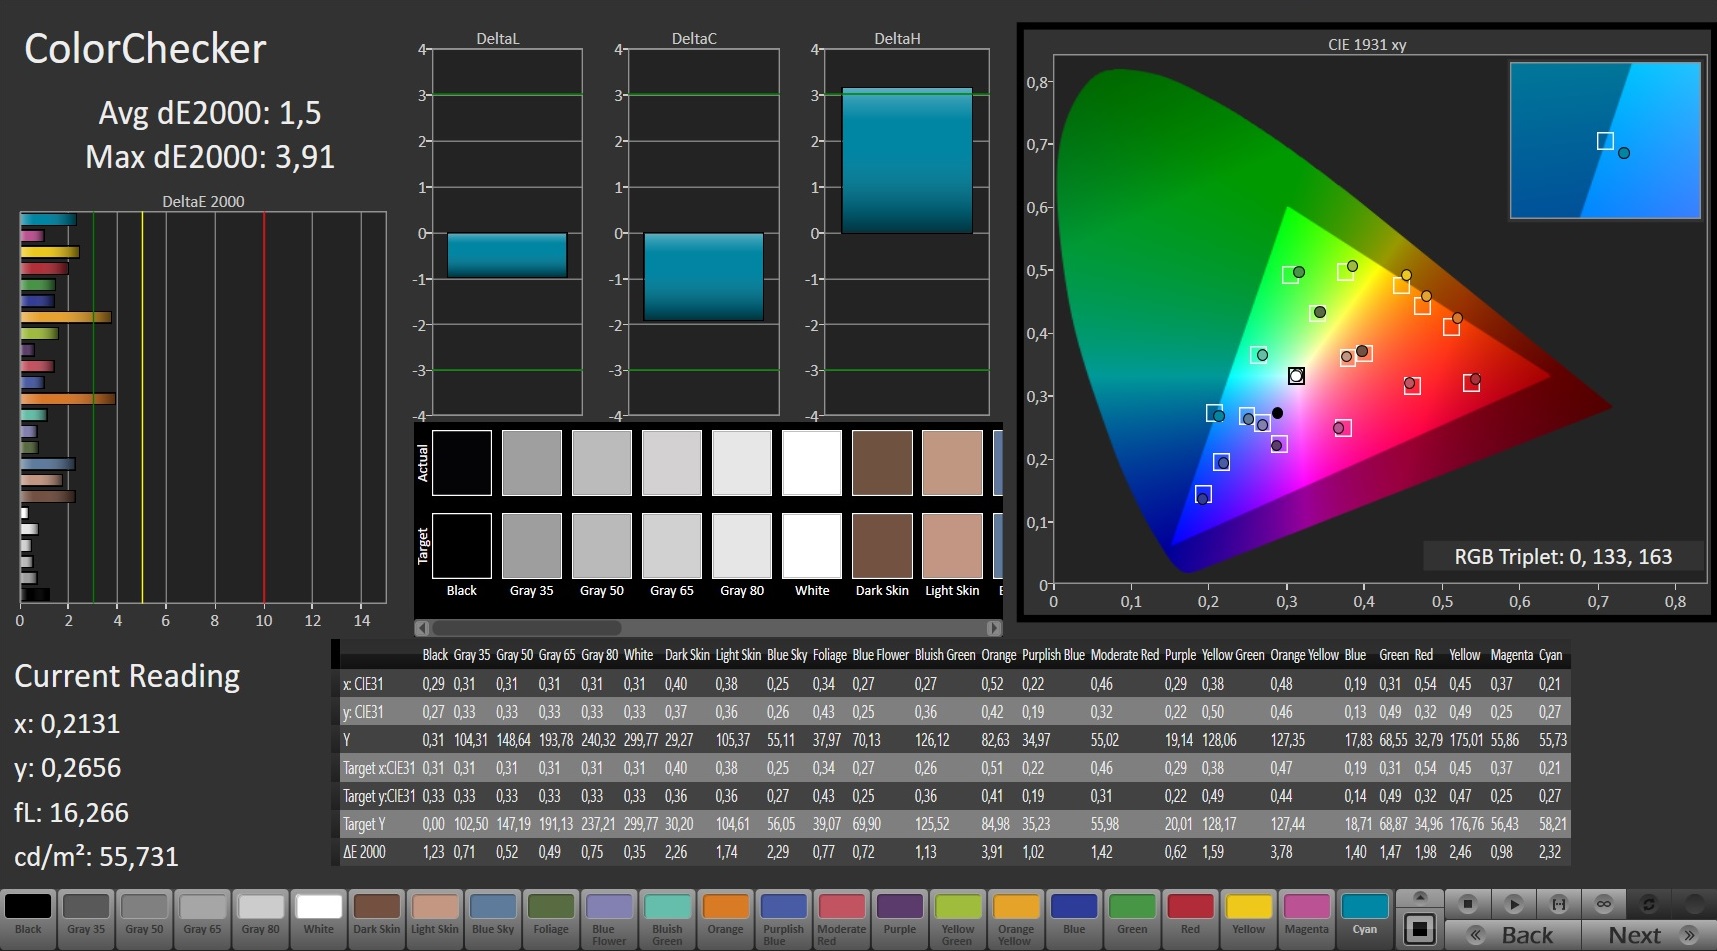
ΔE ColorChecker Calman: 2.65 | ∀{0.5-29.43 Ø4.71}
calibrated: 1.5
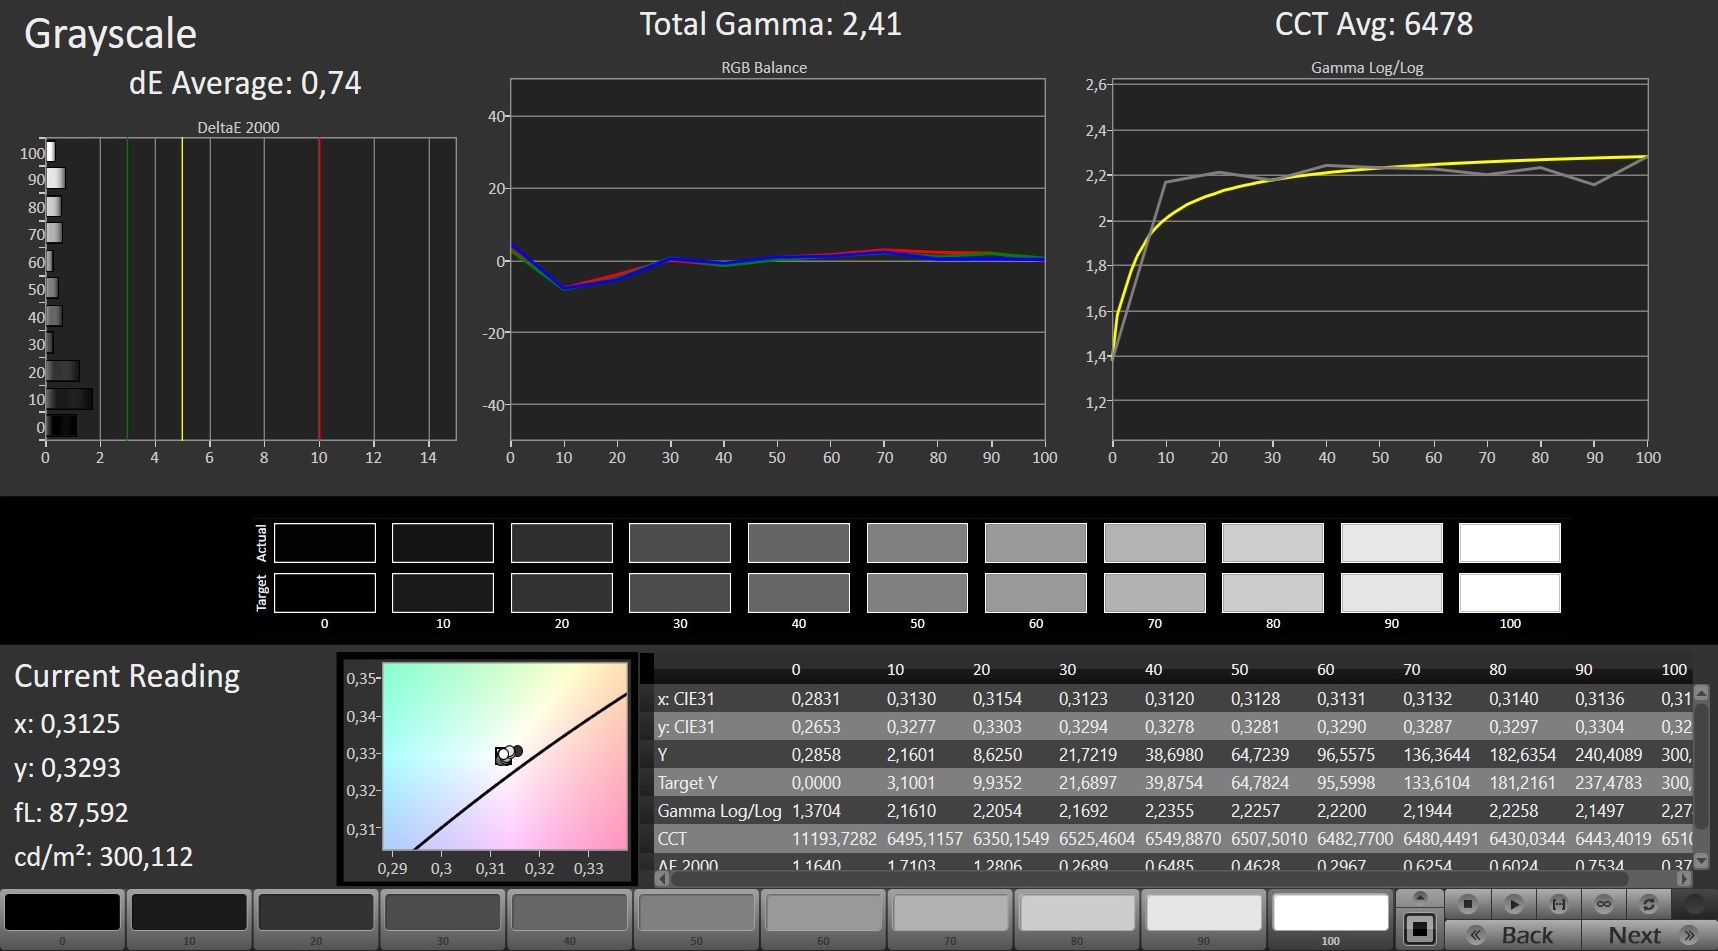
ΔE Greyscale Calman: 2.75 | ∀{0.09-98 Ø4.96}
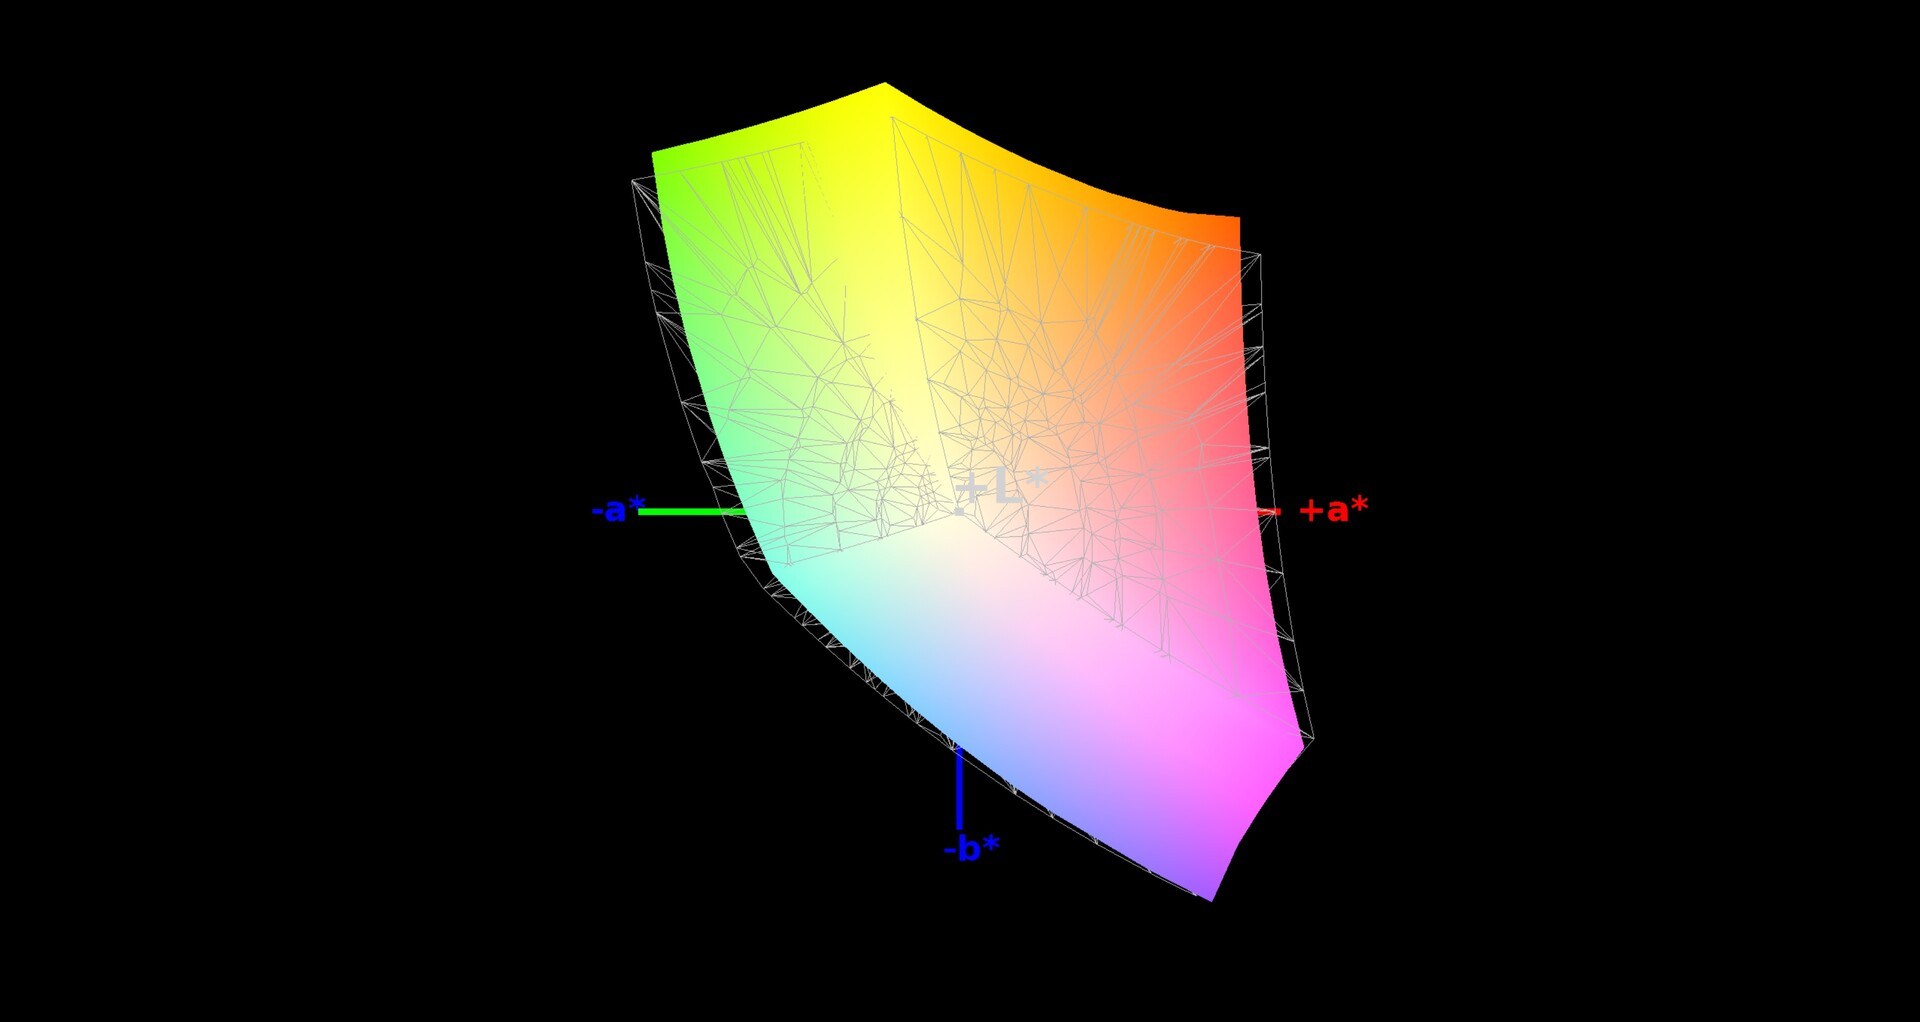
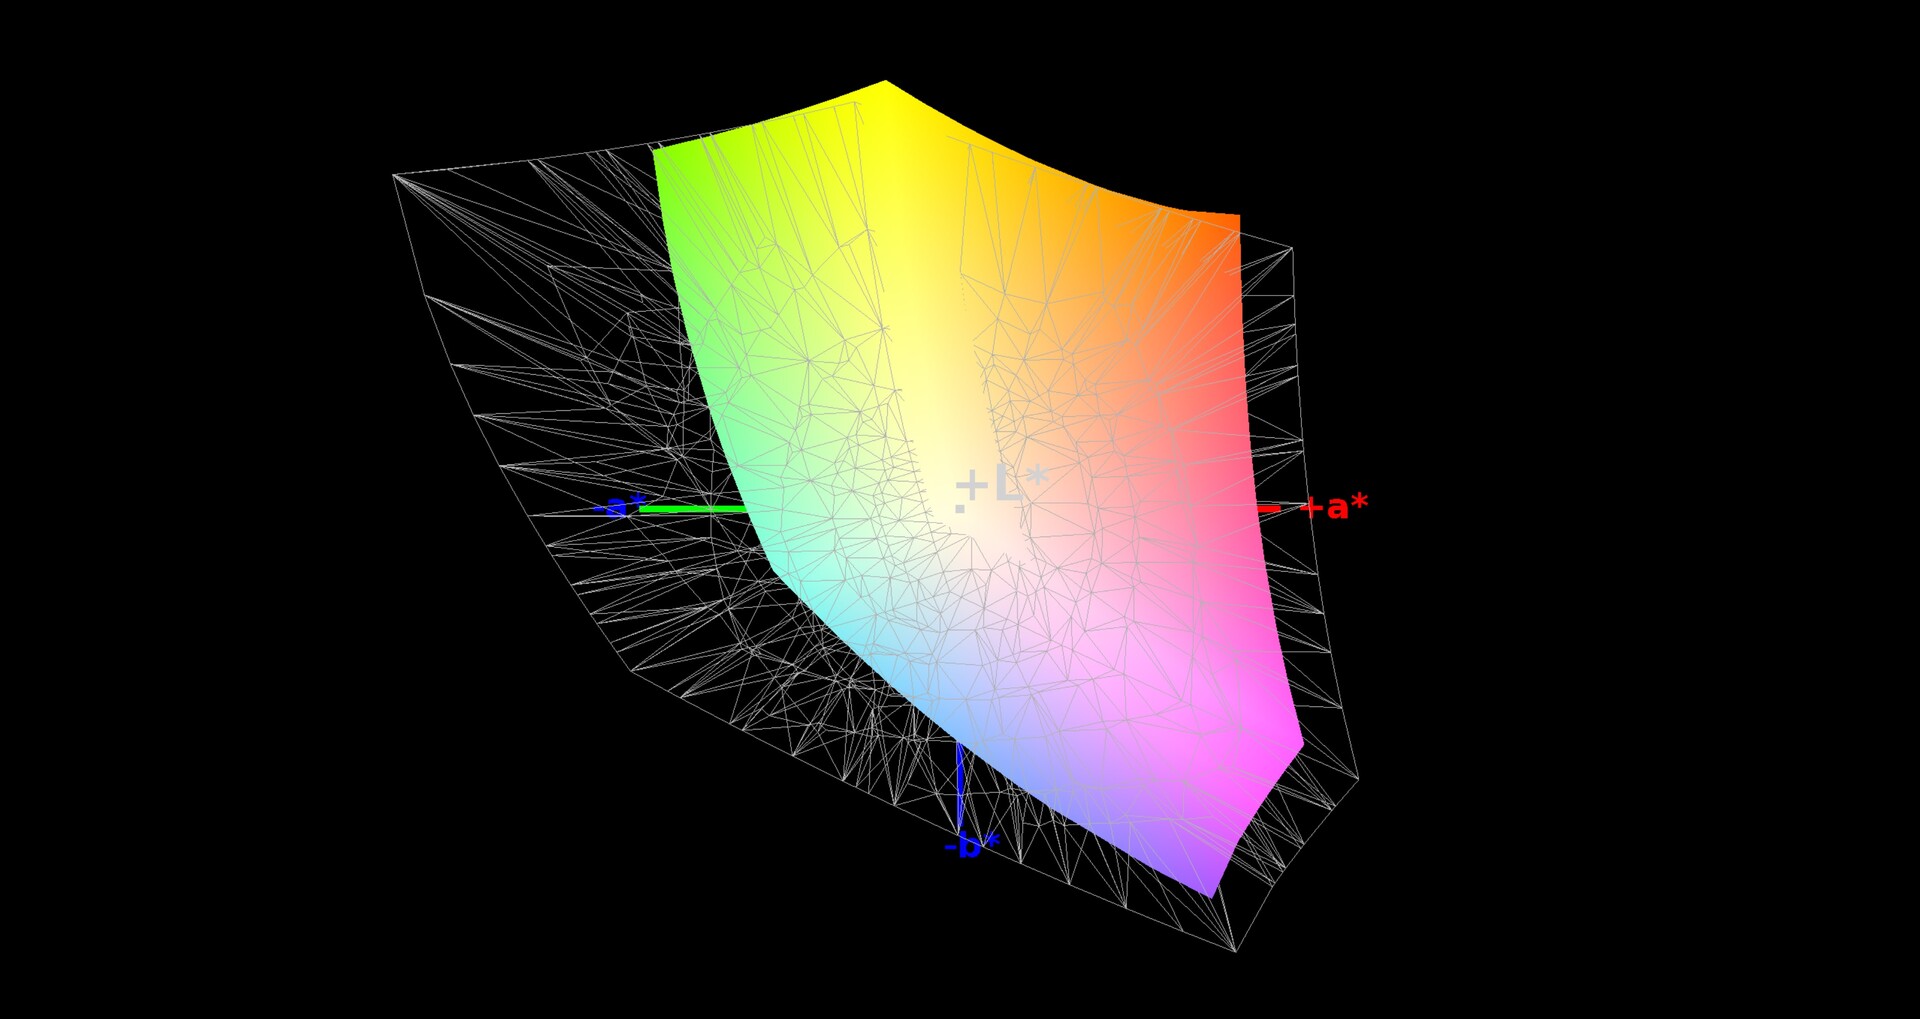
92% sRGB (Argyll 1.6.3 3D)
60% AdobeRGB 1998 (Argyll 1.6.3 3D)
66.5% AdobeRGB 1998 (Argyll 3D)
92.2% sRGB (Argyll 3D)
65.2% Display P3 (Argyll 3D)
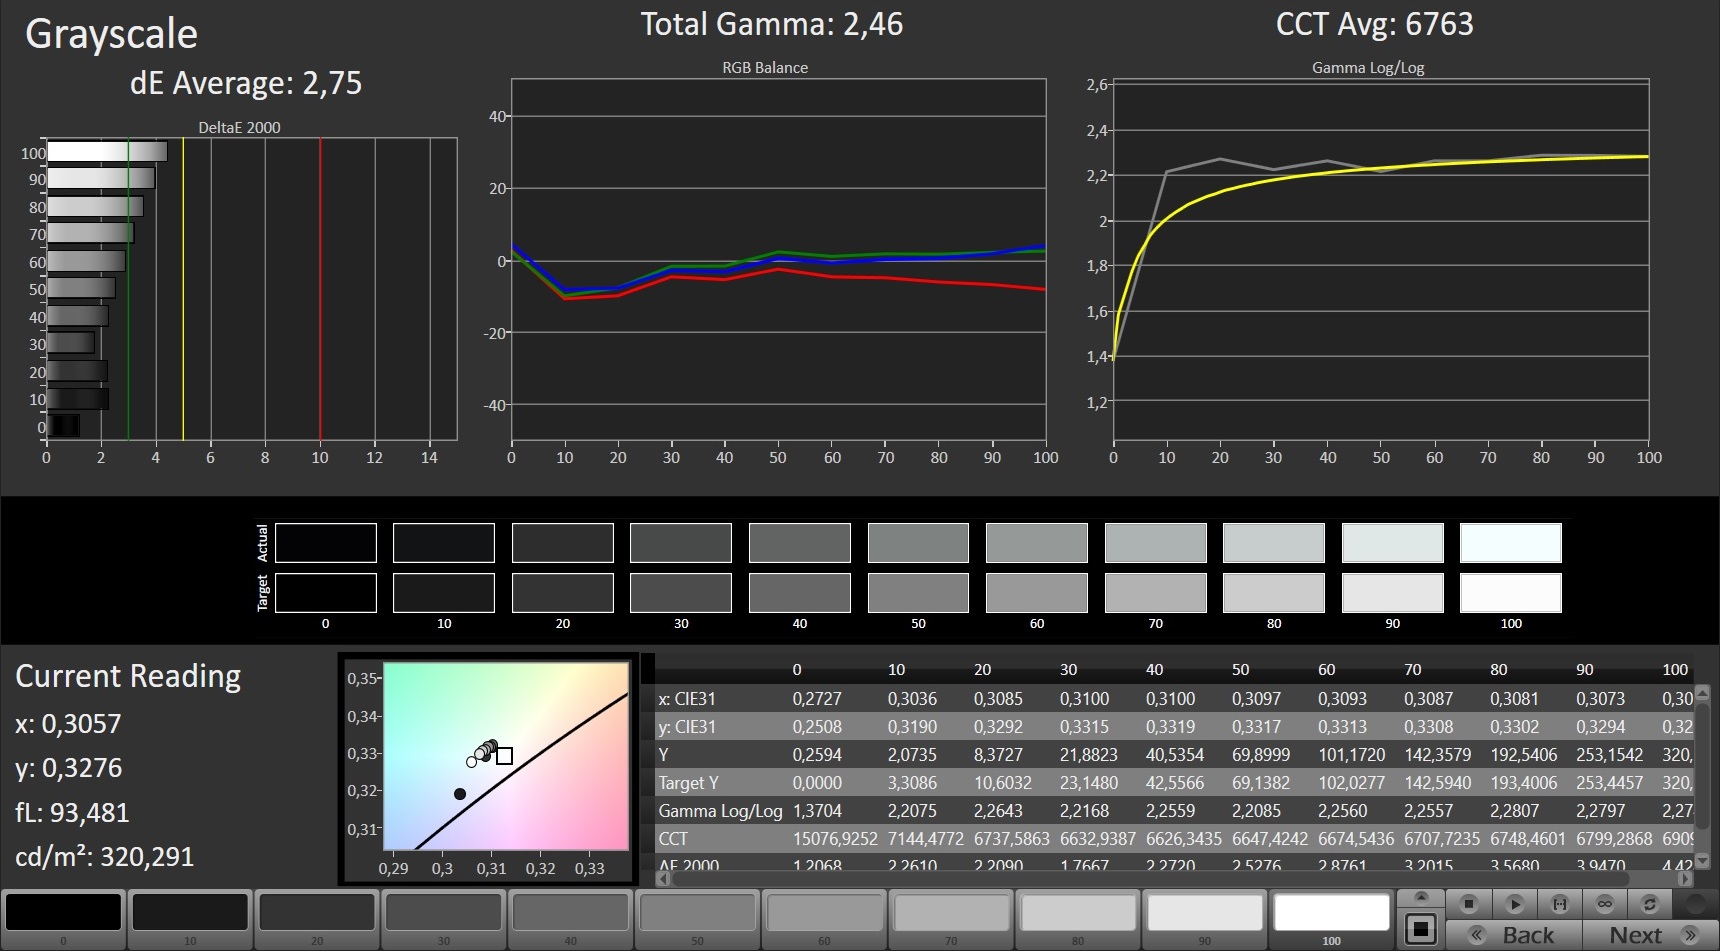
Gamma: 2.46
CCT: 6763 K
| Schenker XMG Neo 17 BOEhydis NV173FHM-N44 (BOE07B6), IPS, 1920x1080 | Asus ROG Strix Scar II GL704GW B173HAN04.0 (AUO409D), AHVA, 1920x1080 | MSI GE75 8SF Chi Mei N173HCE-G33, IPS, 1920x1080 | Lenovo Legion Y740-17ICH AU Optronics B173HAN03.2, IPS, 1920x1080 | Asus Zephyrus S GX701GX B173HAN04.0 (AUO409D), IPS, 1920x1080 | |
|---|---|---|---|---|---|
| Display | -5% | -1% | -2% | -4% | |
| Display P3 Coverage (%) | 65.2 | 62.9 -4% | 63.1 -3% | 64 -2% | 62.9 -4% |
| sRGB Coverage (%) | 92.2 | 87.1 -6% | 94.4 2% | 90.4 -2% | 87.8 -5% |
| AdobeRGB 1998 Coverage (%) | 66.5 | 63.7 -4% | 65.2 -2% | 64.8 -3% | 63.9 -4% |
| Response Times | 7% | 31% | 5% | 41% | |
| Response Time Grey 50% / Grey 80% * (ms) | 18.8 ? | 17.6 ? 6% | 9.6 ? 49% | 15.6 ? 17% | 7.2 ? 62% |
| Response Time Black / White * (ms) | 12 ? | 11.2 ? 7% | 10.4 ? 13% | 12.8 ? -7% | 9.6 ? 20% |
| PWM Frequency (Hz) | 971 ? | 25770 ? | |||
| Screen | -6% | 19% | -42% | 4% | |
| Brightness middle (cd/m²) | 304 | 295 -3% | 370.4 22% | 299.1 -2% | 288 -5% |
| Brightness (cd/m²) | 289 | 291 1% | 348 20% | 273 -6% | 287 -1% |
| Brightness Distribution (%) | 90 | 96 7% | 89 -1% | 81 -10% | 91 1% |
| Black Level * (cd/m²) | 0.26 | 0.24 8% | 0.29 -12% | 0.27 -4% | 0.2 23% |
| Contrast (:1) | 1169 | 1229 5% | 1277 9% | 1108 -5% | 1440 23% |
| Colorchecker dE 2000 * | 2.65 | 3.2 -21% | 1.26 52% | 5.07 -91% | 2.33 12% |
| Colorchecker dE 2000 max. * | 6.11 | 6.64 -9% | 3.02 51% | 10.55 -73% | 5.34 13% |
| Colorchecker dE 2000 calibrated * | 1.5 | 2.52 -68% | 1.21 19% | 3.31 -121% | 2.47 -65% |
| Greyscale dE 2000 * | 2.75 | 2.16 21% | 1.4 49% | 6.8 -147% | 1.19 57% |
| Gamma | 2.46 89% | 2.46 89% | 2.2 100% | 2.46 89% | 2.41 91% |
| CCT | 6763 96% | 6872 95% | 6747 96% | 7805 83% | 6710 97% |
| Color Space (Percent of AdobeRGB 1998) (%) | 60 | 57 -5% | 59.7 0% | 58.5 -2% | 57 -5% |
| Color Space (Percent of sRGB) (%) | 92 | 87 -5% | 94.4 3% | 89.9 -2% | 88 -4% |
| Total Average (Program / Settings) | -1% /
-4% | 16% /
17% | -13% /
-29% | 14% /
7% |
* ... smaller is better
X-Rite i1Pro 2 records a 1,169:1 contrast ratio, which will make colours look vibrant even if it is slightly lower than most of our comparison devices. The panel also has a 0.26 cd/m² black value, which makes blacks look rich. Our review unit has decent colour space coverage too, although its maximum brightness could be better. We recorded an average maximum luminosity of 289 cd/m², which is bright enough for using the Neo 17 indoors, but we would have liked to see at least a 350 cd/m² bright display to allow us to use the device outside or in front of a window without having to squint at the display.
Our review unit suffers from backlight bleeding too, especially towards the edges of the display. While you may not notice this in daily use, it may bother some gamers who like to play late into the night.
There is hardly anything to complain about with viewing angles and reaction times either. Our review unit achieved 12 ms black-to-white and 18.8 ms grey-to-grey reaction times, which are pretty good for an IPS panel. The device does use pulse-width modulation (PWM) to regulate display brightness, which we measured at 971 Hz at 99% brightness and below. While PWM flickering can cause eye strain and headaches for some people, the frequency is so high that it should not bother even those who are PWM sensitive.
Display Response Times
| ↔ Response Time Black to White | ||
|---|---|---|
| 12 ms ... rise ↗ and fall ↘ combined | ↗ 6.8 ms rise | 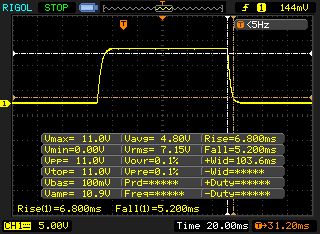 |
| ↘ 5.2 ms fall | ||
| The screen shows good response rates in our tests, but may be too slow for competitive gamers. In comparison, all tested devices range from 0.1 (minimum) to 240 (maximum) ms. » 32 % of all devices are better. This means that the measured response time is better than the average of all tested devices (19.8 ms). | ||
| ↔ Response Time 50% Grey to 80% Grey | ||
| 18.8 ms ... rise ↗ and fall ↘ combined | ↗ 9.6 ms rise | 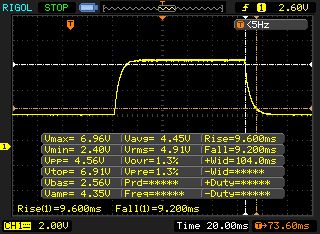 |
| ↘ 9.2 ms fall | ||
| The screen shows good response rates in our tests, but may be too slow for competitive gamers. In comparison, all tested devices range from 0.165 (minimum) to 636 (maximum) ms. » 32 % of all devices are better. This means that the measured response time is better than the average of all tested devices (31 ms). | ||
Screen Flickering / PWM (Pulse-Width Modulation)
| Screen flickering / PWM detected | 971 Hz | ≤ 99 % brightness setting | 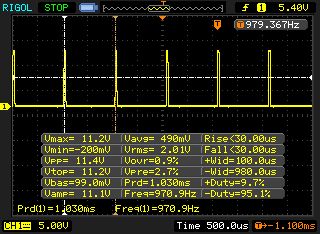 |
The display backlight flickers at 971 Hz (worst case, e.g., utilizing PWM) Flickering detected at a brightness setting of 99 % and below. There should be no flickering or PWM above this brightness setting. The frequency of 971 Hz is quite high, so most users sensitive to PWM should not notice any flickering. In comparison: 52 % of all tested devices do not use PWM to dim the display. If PWM was detected, an average of 7754 (minimum: 5 - maximum: 343500) Hz was measured. | |||
Performance
The XMG Neo 17 starts at €1,799 (~$2,030), but the price can spike if you play around with the configurator. Our test device currently costs more than €2,600 (~$2,930)with its GeForce RTX 2070 GPU, 32 GB of RAM, 1 TB SSD, and Windows 10 Home 64-bit. Other online shops sell cheaper versions though if you want to save some money. Notebooksbilliger.de, for example, currently sells a model that has 16 GB of RAM and 500 GB SSD, which is around €400 (~$450) cheaper than our review unit.

Processor
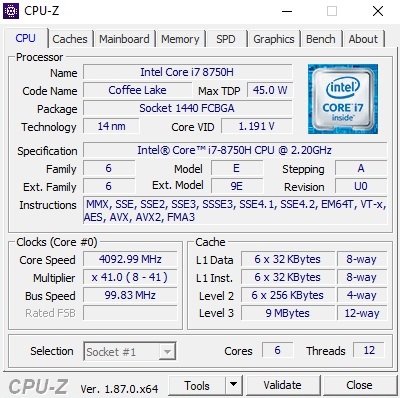
After years of quad-core processors being the standard for gaming laptops, Intel has now introduced hexa-core CPUs as part of its Coffee Lake generation. Schenker equips all Neo 17 models with the Core i7-8750H, which is currently one of the most successful and widely used CPUs in gaming and multimedia laptops. The 14 nm chip has a 45-W thermal design power (TDP) and a 2.2 GHz base clock speed. The processor can temporarily boost its TDP though and supports Intel Turbo Boost, which allows it to reach 4.1 GHz on a single core and 3.9 GHz across all cores when needed.
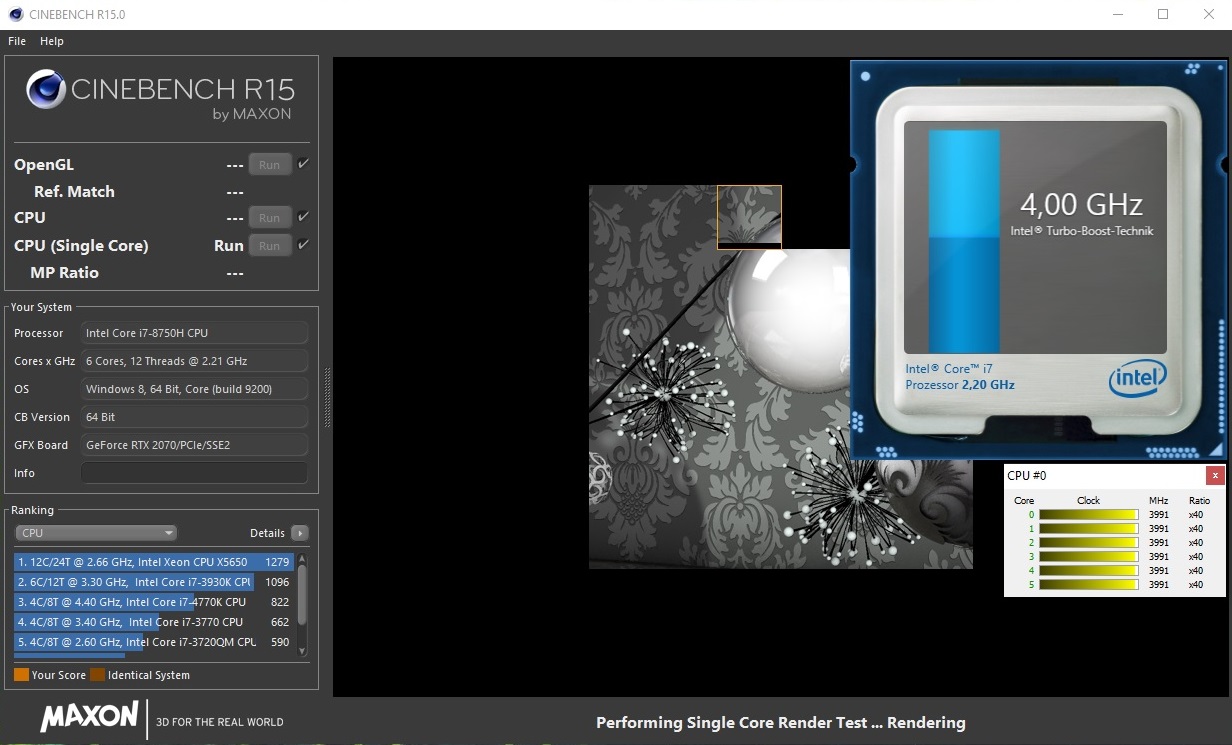
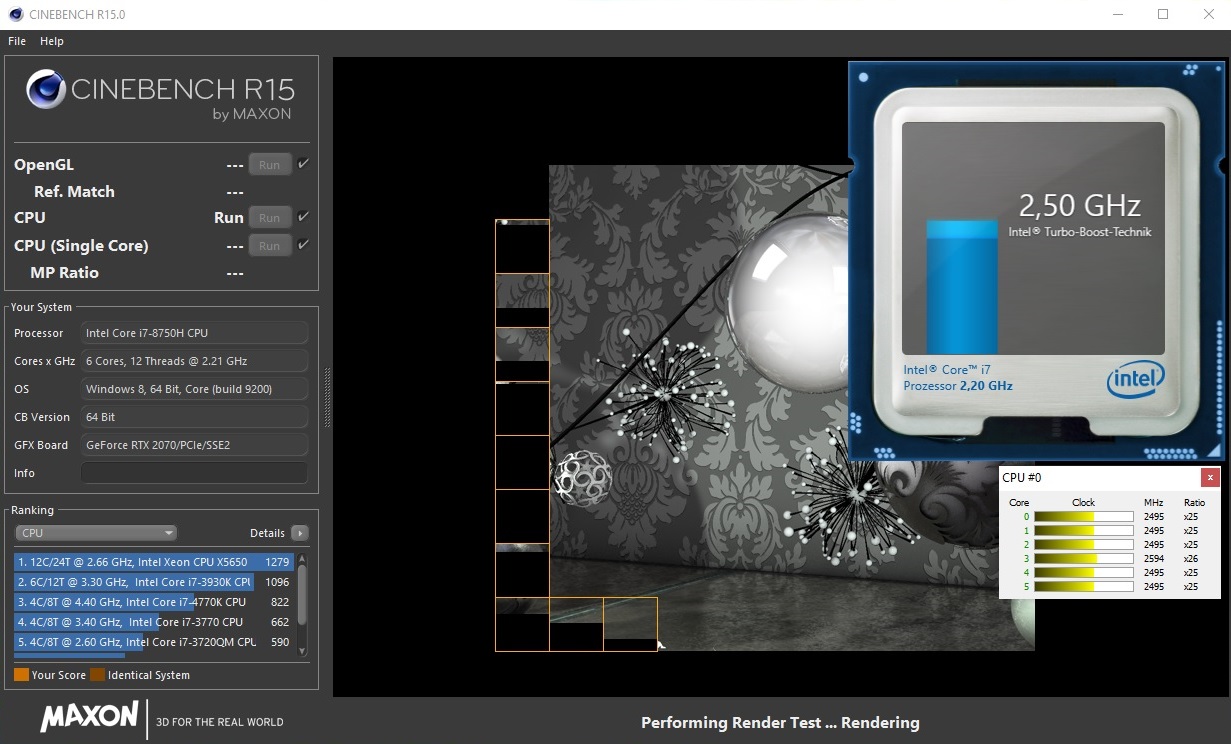
Unfortunately, the XMG Neo 17 exploits hardly any of its CPU’s potential, at least in the balanced fan mode anyway. While the CPU operated at between 3.9 and 4.1 GHz in single core benchmarks, which is what we have come to expect from the Core i7-8750H, it could only muster 2.4 to 2.6 GHz in multi-core benchmarks, or around 1 GHz slower than it should be performing.
We subjected our review unit to a looped Cinebench R15 Multi 64Bit benchmark to test how well it performed under sustained load. We ran the loop for approximately 30 minutes and recorded the scores of each benchmark run through to determine if and to what extent the system throttles. Most Core i7-8750H laptops score significantly less in the second CB R15 run through because by then they have exhausted their CPU’s temporarily boosted TDP.
However, our review unit did not behave like this and consistently scored between 820 and 810 points. While this consistency may seem like a good thing, one look at the graph below will demonstrate otherwise. All our comparison devices are also equipped with Core i7-8750H processors, but they score anywhere between 30 and 51% more than our review unit. You should not notice this gulf in 3D applications such as games because they largely rely heavily on GPU power, but it is disturbing to see the Neo 17 perform so poorly, nonetheless. Perhaps altering the fan mode would improve performance, although our review unit should be achieving better scores in what should be a balance between performance and power efficiency.
| Cinebench R11.5 | |
| CPU Single 64Bit | |
| Average of class Gaming (3.3 - 4.16, n=9, last 2 years) | |
| Schenker XMG Neo 17 | |
| Asus Zephyrus S GX701GX | |
| CPU Multi 64Bit | |
| Average of class Gaming (29.8 - 76.7, n=9, last 2 years) | |
| Asus Zephyrus S GX701GX | |
| Schenker XMG Neo 17 | |
System Performance
However, PCMark 10 results suggest that the limited CPU clock speed has little impact on system performance. Our review unit scored 5,411 points in the overall benchmark, which places the Neo 17 comfortably between its GeForce RTX 2070 powered competitors and only a few percent behind the RTX 2080 Max-Q powered Zephyrus S GX701GX.
With that said, our review unit boots slower than it should do considering the excellent SSD with which it is equipped. Hopefully, this is just a BIOS or driver issue that Schenker can resolve with an update.
Storage Devices
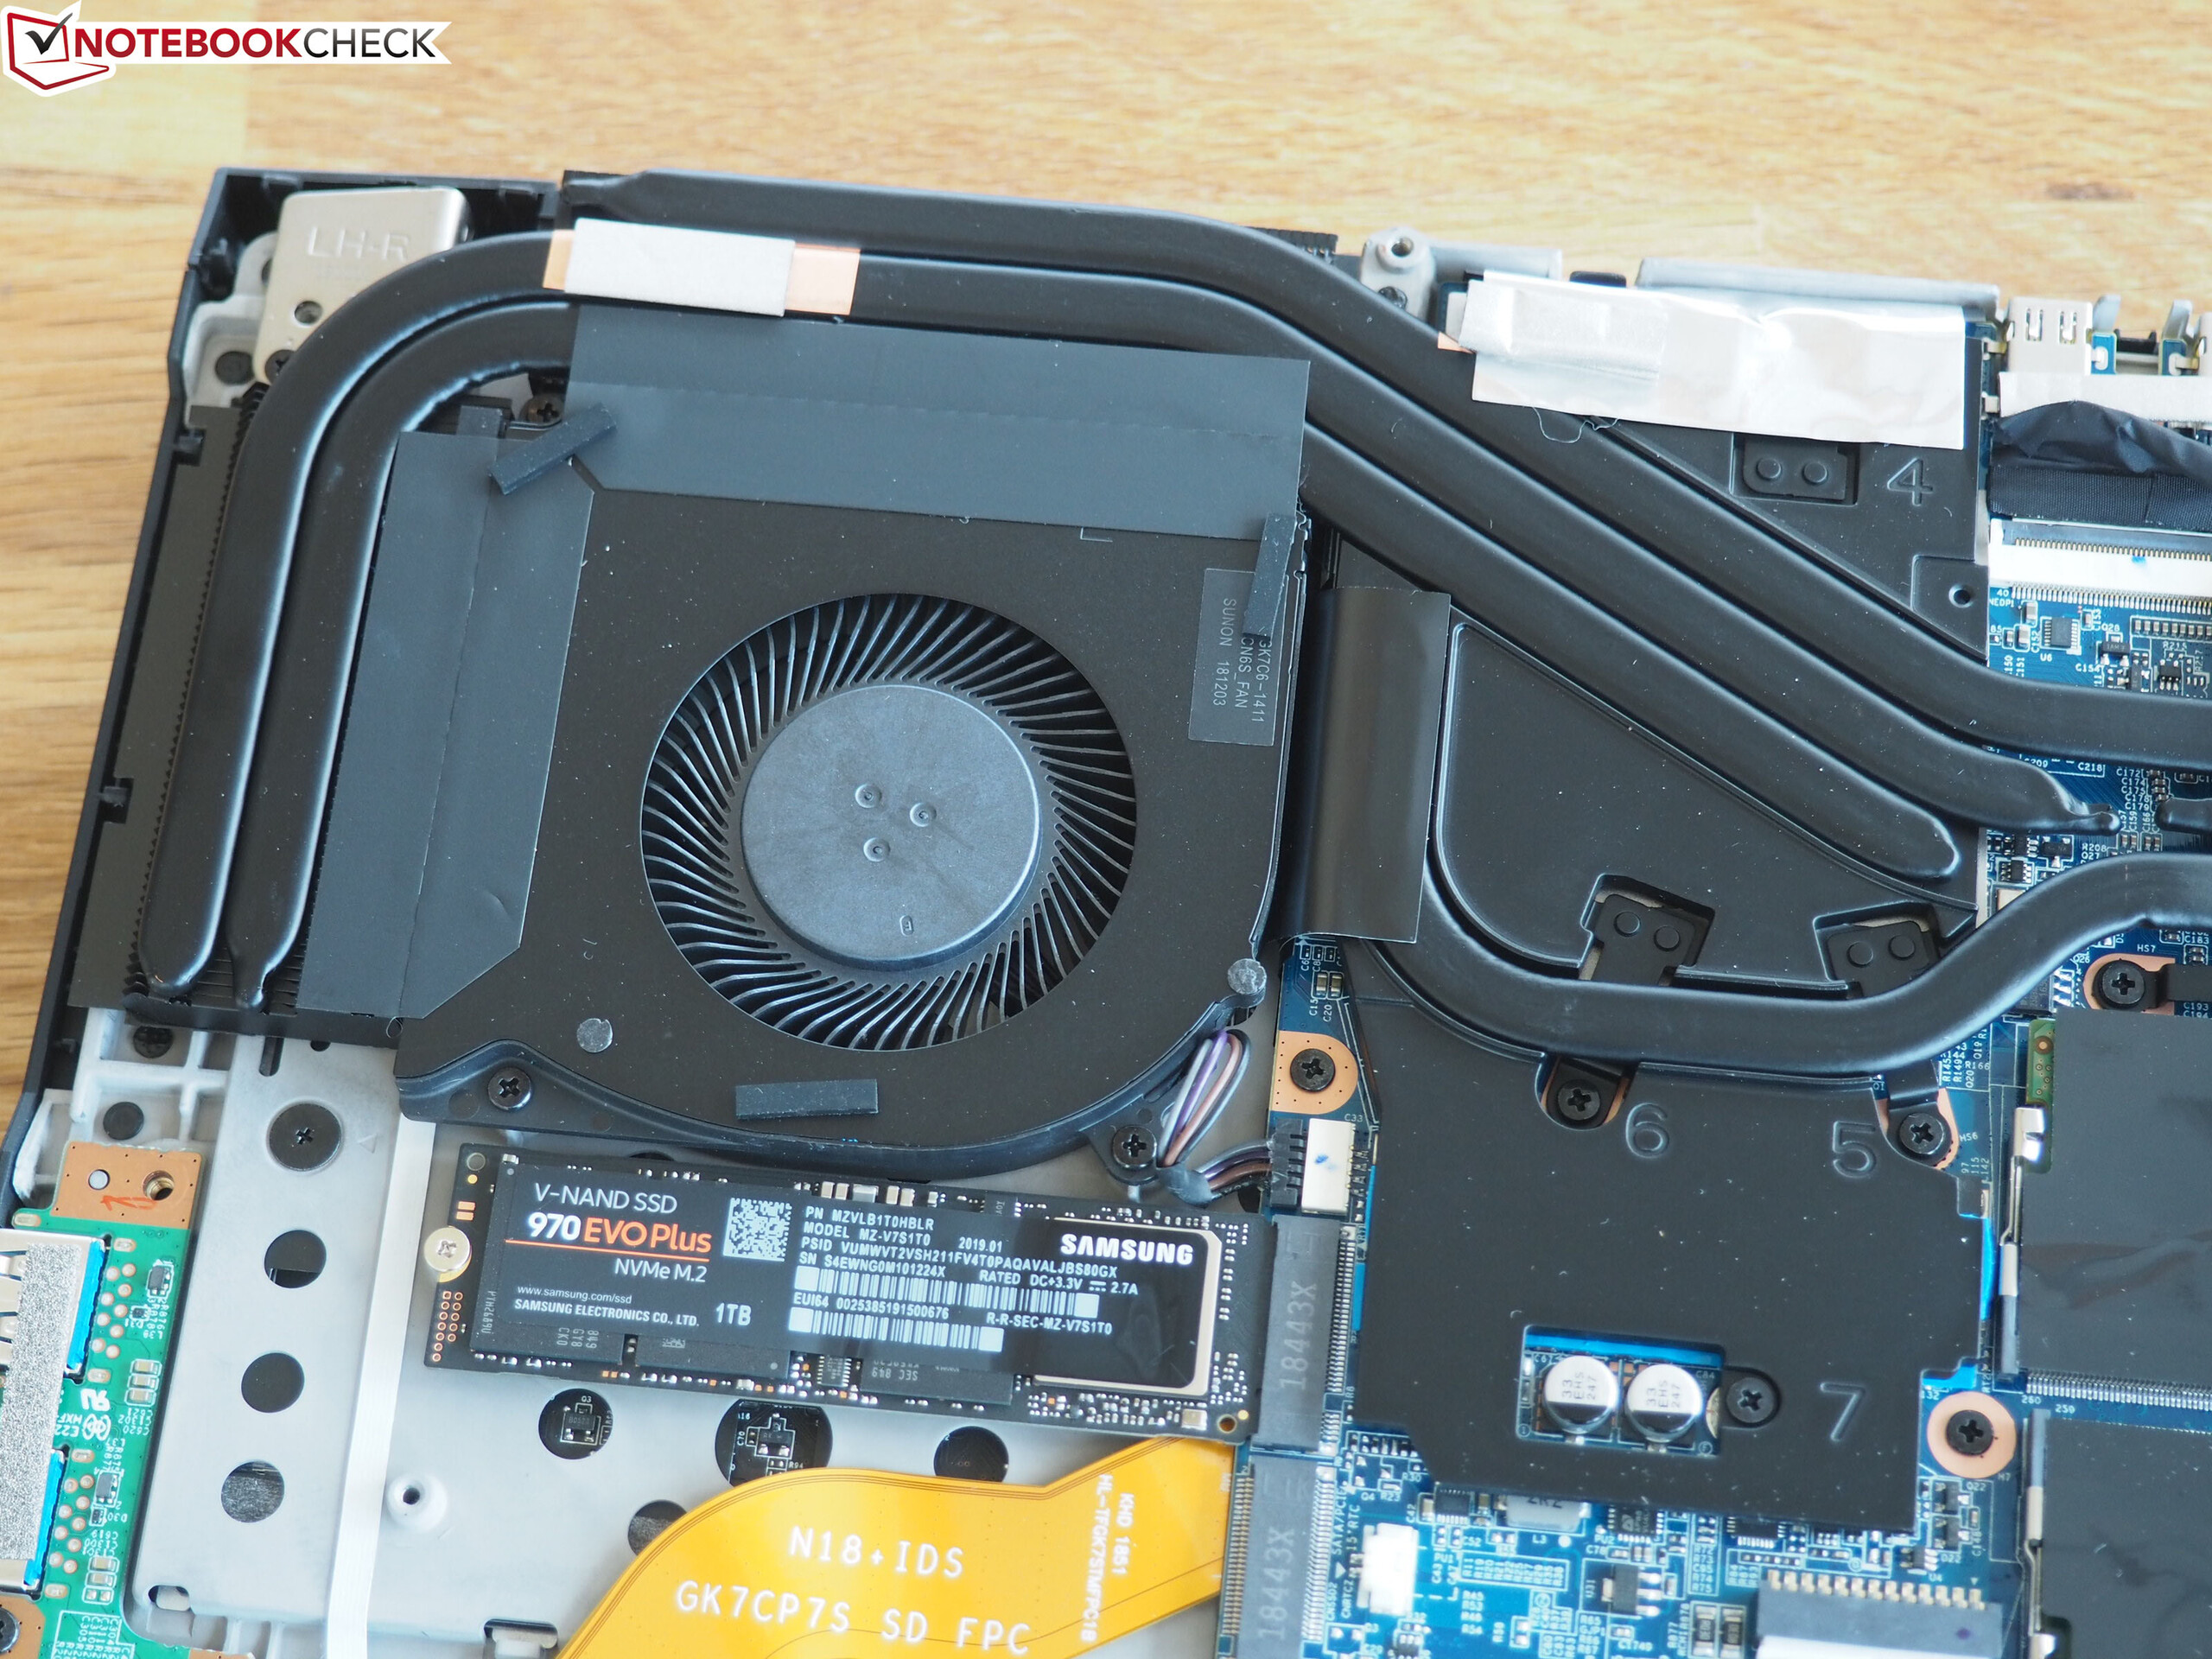
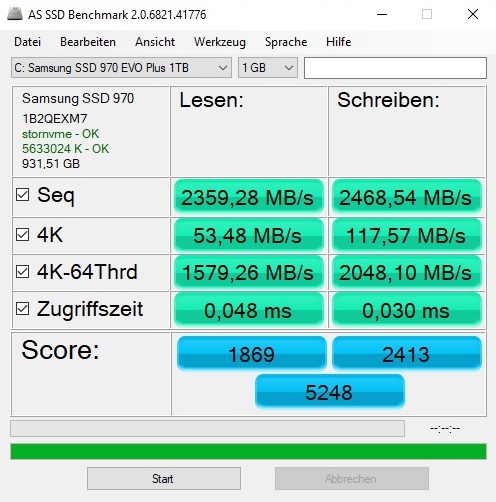
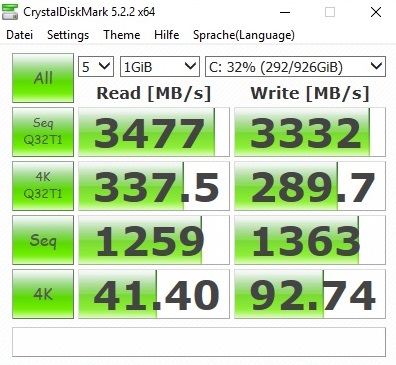
As we have already mentioned, the Neo 17 has two M.2 2280 slots and a 2.5-inch drive bay. Thanks to the steadily falling prices, even 1 or 2 TB SSDs are now becoming affordable and are making their way into laptops. Schenker has equipped our review unit with a 1 TB Samsung 970 Evo Plus, which we have also reviewed, but you could configure the Neo 17 with up to 8 TB of HDDs and SSDs should you need that much storage.
The 970 Evo Plus wipes the floor with practically all SSDs, as demonstrated in our comparison table below. The 1 TB Samsung PM981 in the Zephyrus S GX701GX averaged around 16% slower transfer speeds in AS SSD, but smaller drives such as the 256 GB Kingston SSD in the GE75 Raider 8SF are more like 80% slower.
| Schenker XMG Neo 17 Samsung SSD 970 EVO Plus 1TB | Asus ROG Strix Scar II GL704GW Intel SSD 660p SSDPEKNW512G8 | MSI GE75 8SF Kingston RBUSNS8154P3256GJ1 | Lenovo Legion Y740-17ICH Samsung SSD PM981 MZVLB256HAHQ | Asus Zephyrus S GX701GX Samsung SSD PM981 MZVLB1T0HALR | |
|---|---|---|---|---|---|
| AS SSD | -57% | -80% | -41% | -16% | |
| Seq Read (MB/s) | 2359 | 1315 -44% | 949 -60% | 1153 -51% | 911 -61% |
| Seq Write (MB/s) | 2469 | 927 -62% | 823 -67% | 1328 -46% | 2347 -5% |
| 4K Read (MB/s) | 53.5 | 52.4 -2% | 25.36 -53% | 35.05 -34% | 53 -1% |
| 4K Write (MB/s) | 117.6 | 122.8 4% | 67.1 -43% | 96 -18% | 122.5 4% |
| 4K-64 Read (MB/s) | 1579 | 326.5 -79% | 748 -53% | 727 -54% | 1577 0% |
| 4K-64 Write (MB/s) | 2048 | 727 -65% | 650 -68% | 1212 -41% | 1734 -15% |
| Access Time Read * (ms) | 0.048 | 0.11 -129% | 0.173 -260% | 0.063 -31% | 0.08 -67% |
| Access Time Write * (ms) | 0.03 | 0.045 -50% | 0.059 -97% | 0.04 -33% | 0.031 -3% |
| Score Read (Points) | 1869 | 510 -73% | 869 -54% | 878 -53% | 1721 -8% |
| Score Write (Points) | 2413 | 942 -61% | 799 -67% | 1441 -40% | 2091 -13% |
| Score Total (Points) | 5248 | 1715 -67% | 2109 -60% | 2784 -47% | 4771 -9% |
* ... smaller is better

Graphics Card
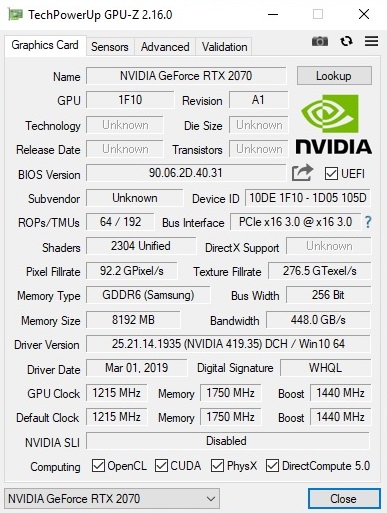
One of the toughest decisions that many people will have to make is between graphics cards. The GeForce RTX 2070 in our review unit carries a €253 (~$285) surcharge over the GeForce RTX 2060 that comes with the Neo 17 base model. It is worth noting that Schenker equips the Neo 17 with the full-fat RTX 2070 and not the RTX 2070 Max-Q as it does with the Neo 15.
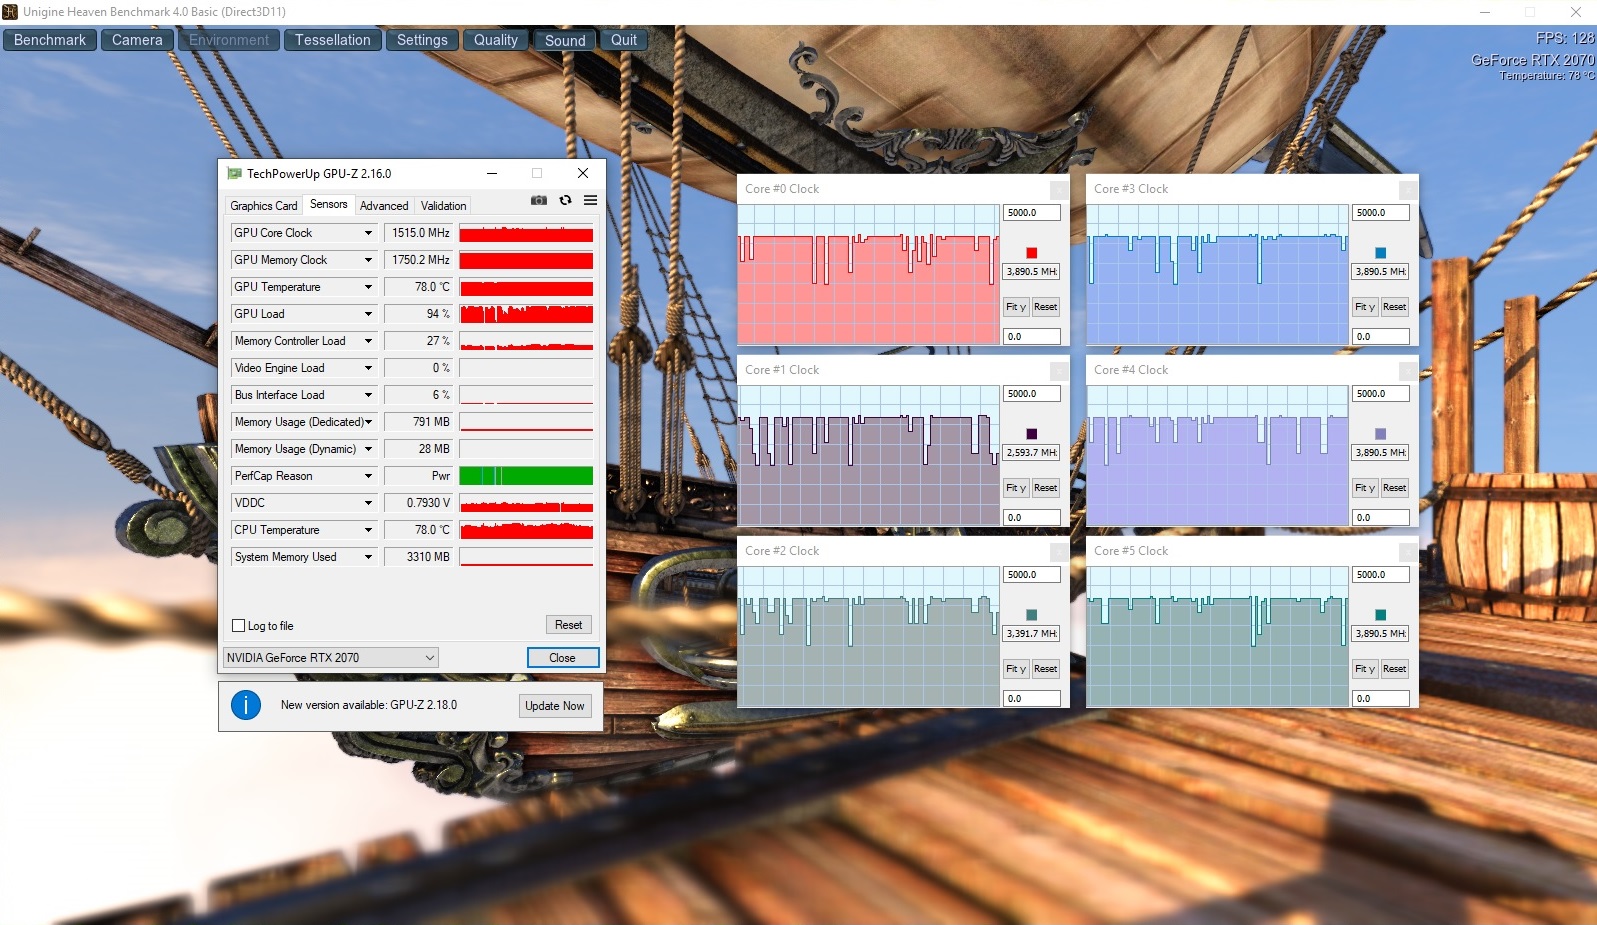
The RTX 2070 clocks between 1,215 and 1,440 MHz, but it can boost up to 1,920 MHz, according to GPU-Z. The GPU in our review unit averaged around 1,500 MHz in games, which is a higher equivalent boost clock than the CPU could manage and better than most RTX 2070 equipped laptops that we have tested.
| 3DMark 11 Performance | 18150 points | |
| 3DMark Cloud Gate Standard Score | 29348 points | |
| 3DMark Fire Strike Score | 15686 points | |
Help | ||
We also subjected our review unit to an hour-long run through of "The Witcher 3", which we set to 1080p and Ultra graphics. We have included the framerates that our system achieved in the graph below, which you can also judge against our comparison devices. Framerates remained largely stable throughout our tests and higher than what the GE75 Raider 8SF managed.
Gaming Performance
The Neo 17 can handle all modern triple-A games with ease. In short, the RTX 2070 is the perfect companion for a 1080p 144 Hz panel, as demonstrated by the table below. All the games that we tested on our review unit averaged above 60 FPS at maximum graphics except for "Metro Exodus". The latter is a particularly demanding game, but our review still averaged 54.1 FPS though, which will look and feel smooth to most people’s eyes.
| The Witcher 3 | |
| 1920x1080 High Graphics & Postprocessing (Nvidia HairWorks Off) | |
| Average of class Gaming (341 - 404, n=2, last 2 years) | |
| Asus Zephyrus S GX701GX | |
| Lenovo Legion Y740-17ICH | |
| Schenker XMG Neo 17 | |
| Asus ROG Strix Scar II GL704GW | |
| MSI GE75 8SF | |
| 1920x1080 Ultra Graphics & Postprocessing (HBAO+) | |
| Average of class Gaming (104.7 - 240, n=7, last 2 years) | |
| Asus Zephyrus S GX701GX | |
| Lenovo Legion Y740-17ICH | |
| Schenker XMG Neo 17 | |
| Asus ROG Strix Scar II GL704GW | |
| MSI GE75 8SF | |
Gaming at 2,560x1,440 generally does not bring the RTX 2070 to its limits either. Things start to get choppier at 4K though, so we would recommend dropping the graphics to high or medium if you want to game on a 4K external monitor.
| low | med. | high | ultra | QHD | 4K | |
|---|---|---|---|---|---|---|
| The Witcher 3 (2015) | 137 | 73 | 49.5 | |||
| Apex Legends (2019) | 143 | 134 | 132 | 88.2 | 45.4 | |
| Far Cry New Dawn (2019) | 94 | 92 | 82 | 74 | 42 | |
| Metro Exodus (2019) | 87.9 | 66.4 | 54.1 | 42 | 26.1 | |
| Anthem (2019) | 88.8 | 85.4 | 79.8 | 62 | 35.5 | |
| Dirt Rally 2.0 (2019) | 143 | 117 | 75.2 | 62.1 | ||
| The Division 2 (2019) | 113 | 95 | 78 | 60 | 33 |
Emissions
Fan Noise
We were positively surprised by how quietly our review unit operated with the fan mode set to balanced. While many Clevo-based Schenker laptops such as the Key 15 run unnecessarily loud at idle, the Neo 17 whirred away at between 29 to 33 dB(A). Ideally, the fans would turn off completely, but this did not happen in balanced mode.
The Neo 17 gets disappointingly loud under sustained load though, with its fans reaching a maximum of 49 dB(A) during our tests. The ROG Strix Scar II GL704GW and GE75 Raider 8SF get even louder when gaming, which is worth keeping in mind. We would recommend gaming with headphones on with all three laptops though, as they all have intrusively loud fans.
Noise level
| Idle |
| 29 / 32 / 33 dB(A) |
| Load |
| 42 / 49 dB(A) |
 | ||
30 dB silent 40 dB(A) audible 50 dB(A) loud |
||
min: | ||
| Schenker XMG Neo 17 GeForce RTX 2070 Mobile, i7-8750H | Asus ROG Strix Scar II GL704GW GeForce RTX 2070 Mobile, i7-8750H | MSI GE75 8SF GeForce RTX 2070 Mobile, i7-8750H | Lenovo Legion Y740-17ICH GeForce RTX 2080 Max-Q, i7-8750H | Asus Zephyrus S GX701GX GeForce RTX 2080 Max-Q, i7-8750H | Average of class Gaming | |
|---|---|---|---|---|---|---|
| Noise | -6% | -5% | 6% | -2% | 6% | |
| off / environment * (dB) | 29 | 29 -0% | 28.3 2% | 28.3 2% | 29 -0% | 24.1 ? 17% |
| Idle Minimum * (dB) | 29 | 29 -0% | 33.5 -16% | 31.5 -9% | 29 -0% | 26 ? 10% |
| Idle Average * (dB) | 32 | 32 -0% | 33.6 -5% | 31.6 1% | 32 -0% | 27.4 ? 14% |
| Idle Maximum * (dB) | 33 | 40 -21% | 35 -6% | 31.6 4% | 33 -0% | 30.1 ? 9% |
| Load Average * (dB) | 42 | 46 -10% | 38 10% | 32.3 23% | 47 -12% | 43.6 ? -4% |
| Witcher 3 ultra * (dB) | 49 | 51 -4% | 50 -2% | 43 12% | 49 -0% | |
| Load Maximum * (dB) | 49 | 52 -6% | 56.9 -16% | 45.5 7% | 51 -4% | 54.2 ? -11% |
* ... smaller is better
Temperature
The Neo 17 neither manages its temperatures well or particularly badly. Surface temperatures reach a maximum of 56 °C (~133 °F) under sustained load, which will feel uncomfortably hot to the touch. However, our review unit evenly distributes excess heat across its chassis at idle, during which it reached a maximum of 30 °C (~86 °F). In short, the Neo 17 will never feel that cool, but it does not get hotter than its competitors.

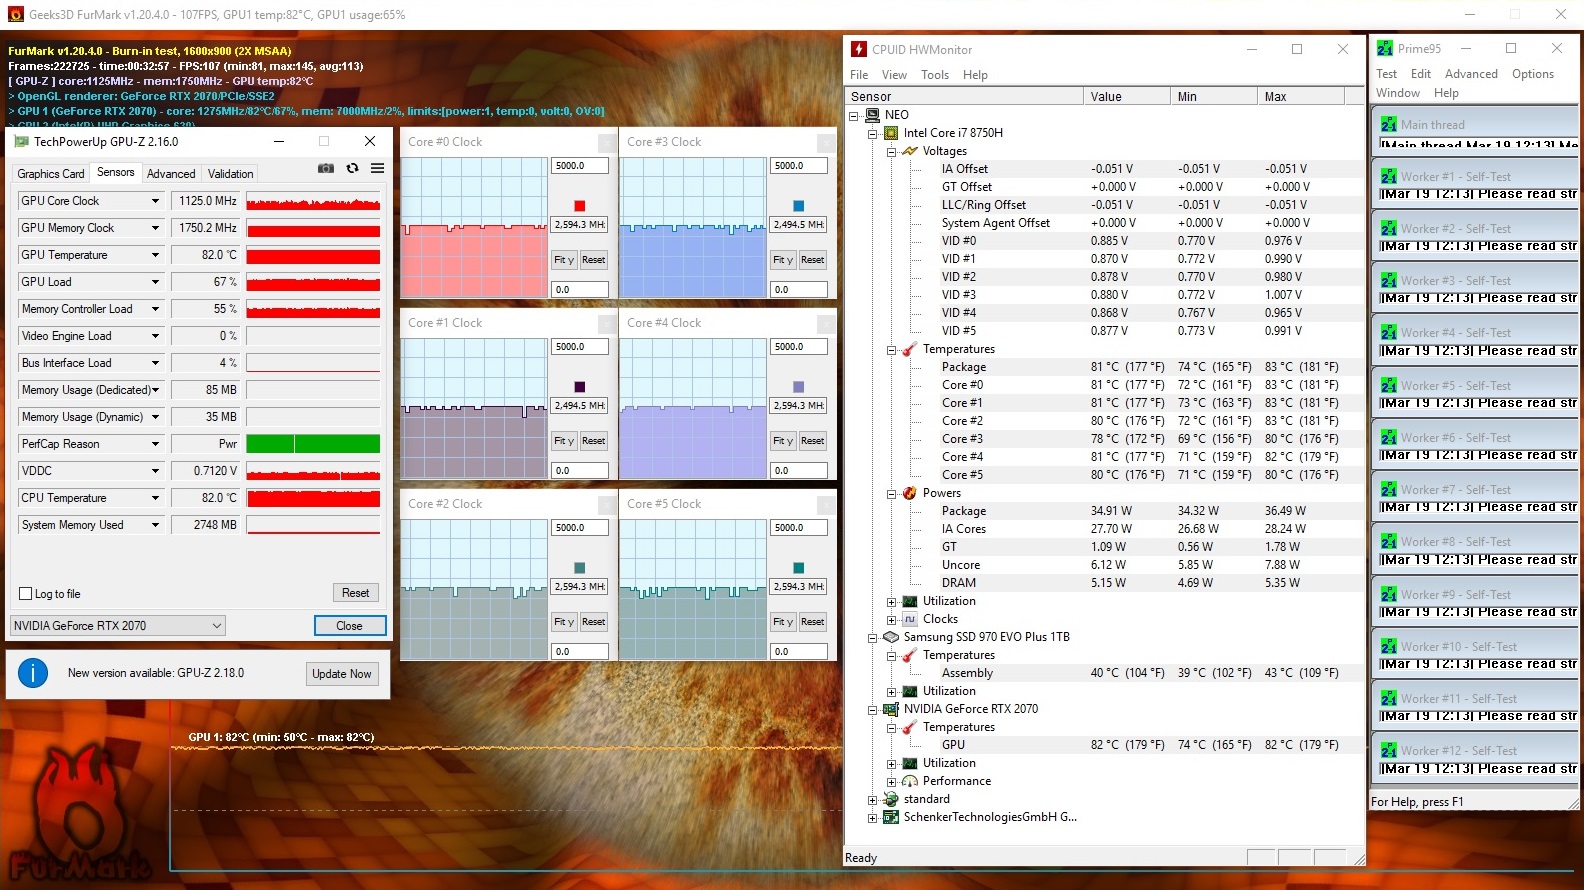
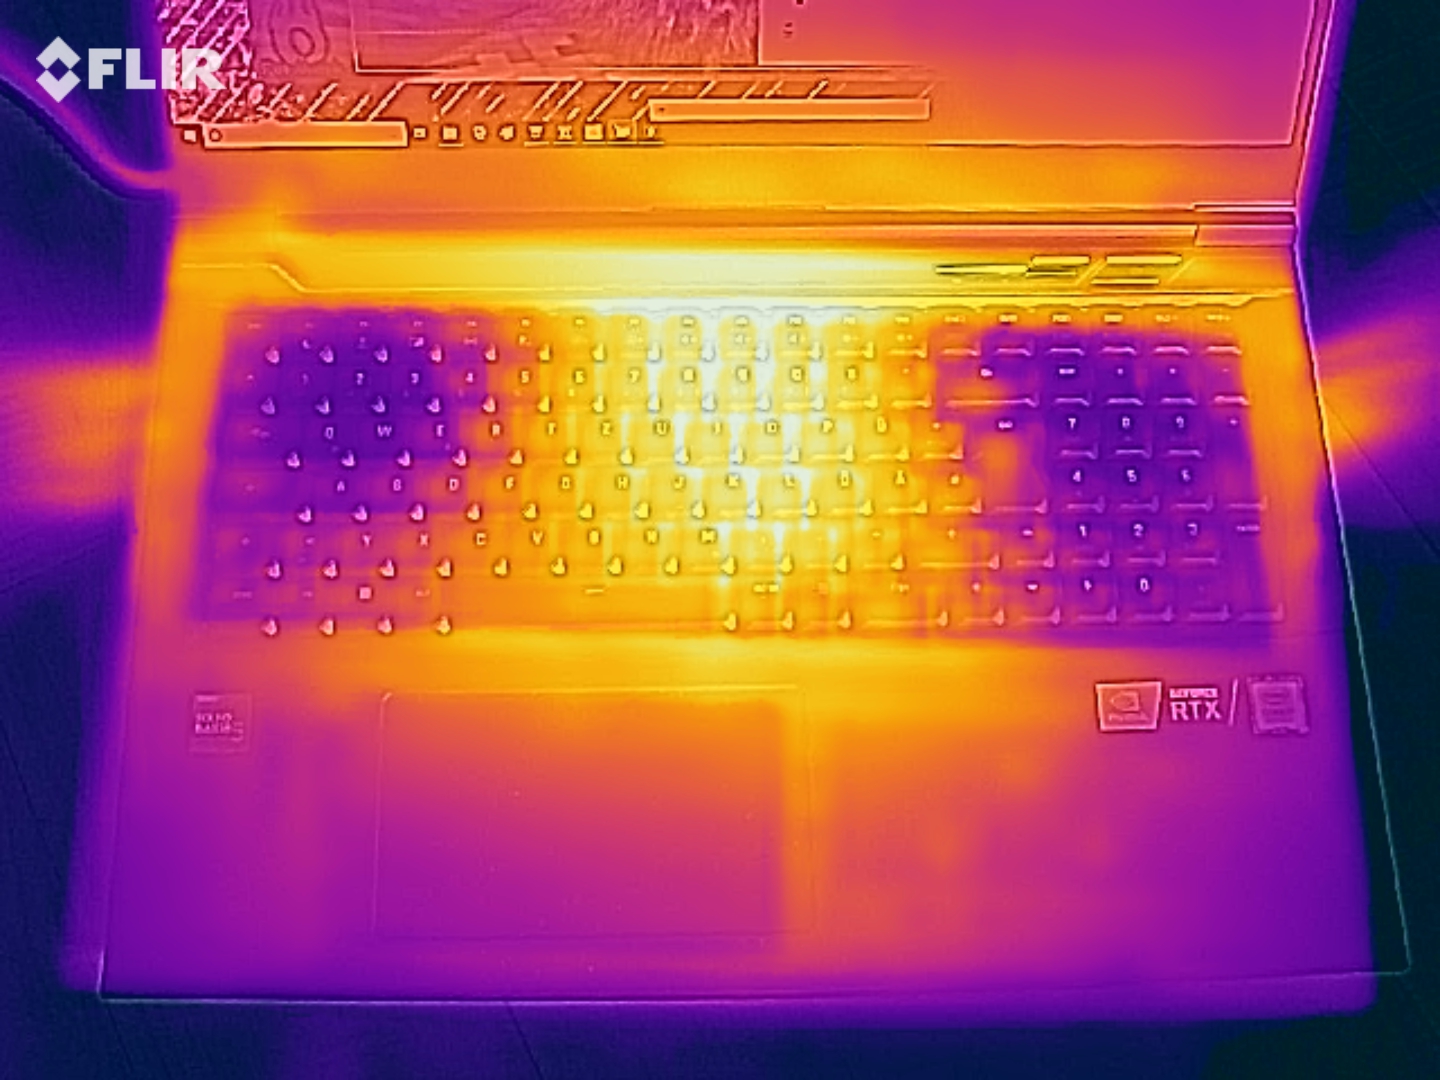
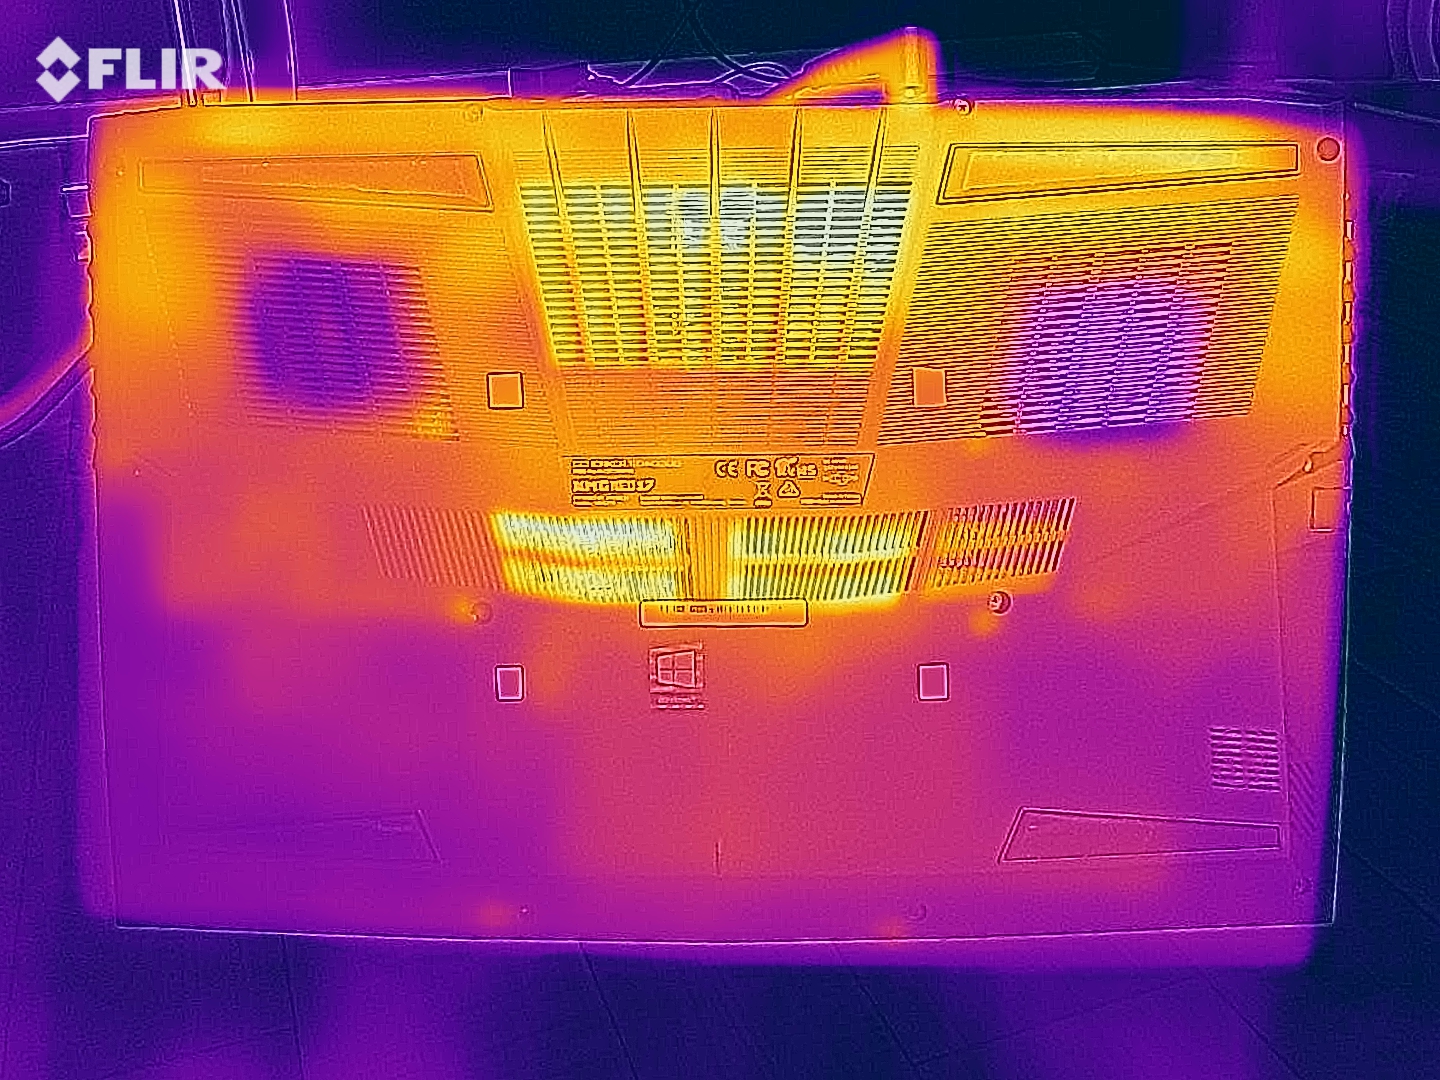
We also subjected our review unit to a combined FurMark and Prime95 stress test. We ran the stress test for an hour to determine if and to what extent the system thermal throttles. CPU and GPU core temperatures settled at around 80 °C (~176 °F), which is well short of their critical operating temperatures. Core temperatures remained roughly the same during our less demanding "The Witcher 3" test, but clock speeds improved.
(-) The maximum temperature on the upper side is 47 °C / 117 F, compared to the average of 40.4 °C / 105 F, ranging from 21.2 to 68.8 °C for the class Gaming.
(-) The bottom heats up to a maximum of 56 °C / 133 F, compared to the average of 43.2 °C / 110 F
(+) In idle usage, the average temperature for the upper side is 26.6 °C / 80 F, compared to the device average of 33.9 °C / 93 F.
(-) Playing The Witcher 3, the average temperature for the upper side is 39.2 °C / 103 F, compared to the device average of 33.9 °C / 93 F.
(+) The palmrests and touchpad are reaching skin temperature as a maximum (35 °C / 95 F) and are therefore not hot.
(-) The average temperature of the palmrest area of similar devices was 28.8 °C / 83.8 F (-6.2 °C / -11.2 F).
| Schenker XMG Neo 17 GeForce RTX 2070 Mobile, i7-8750H | Asus ROG Strix Scar II GL704GW GeForce RTX 2070 Mobile, i7-8750H | MSI GE75 8SF GeForce RTX 2070 Mobile, i7-8750H | Lenovo Legion Y740-17ICH GeForce RTX 2080 Max-Q, i7-8750H | Asus Zephyrus S GX701GX GeForce RTX 2080 Max-Q, i7-8750H | Average of class Gaming | |
|---|---|---|---|---|---|---|
| Heat | -14% | 9% | 4% | 1% | -2% | |
| Maximum Upper Side * (°C) | 47 | 59 -26% | 41.2 12% | 38.6 18% | 53 -13% | 45.2 ? 4% |
| Maximum Bottom * (°C) | 56 | 54 4% | 46 18% | 43.6 22% | 50 11% | 48.1 ? 14% |
| Idle Upper Side * (°C) | 28 | 33 -18% | 26.2 6% | 30.2 -8% | 27 4% | 31 ? -11% |
| Idle Bottom * (°C) | 30 | 35 -17% | 30.2 -1% | 35 -17% | 30 -0% | 34.2 ? -14% |
* ... smaller is better
Speakers
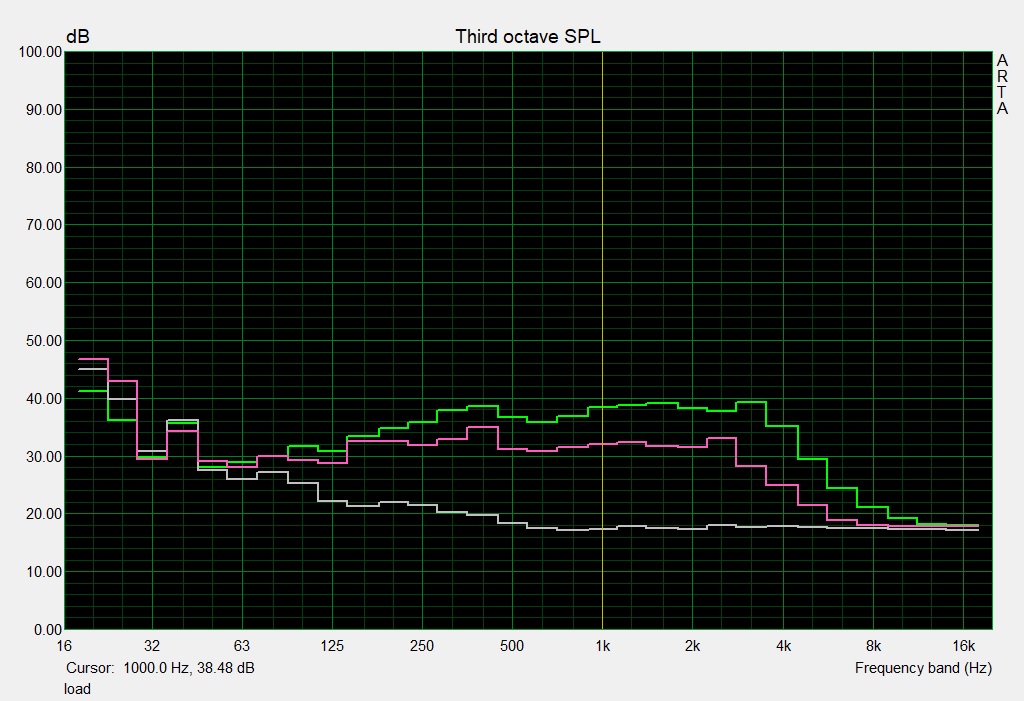
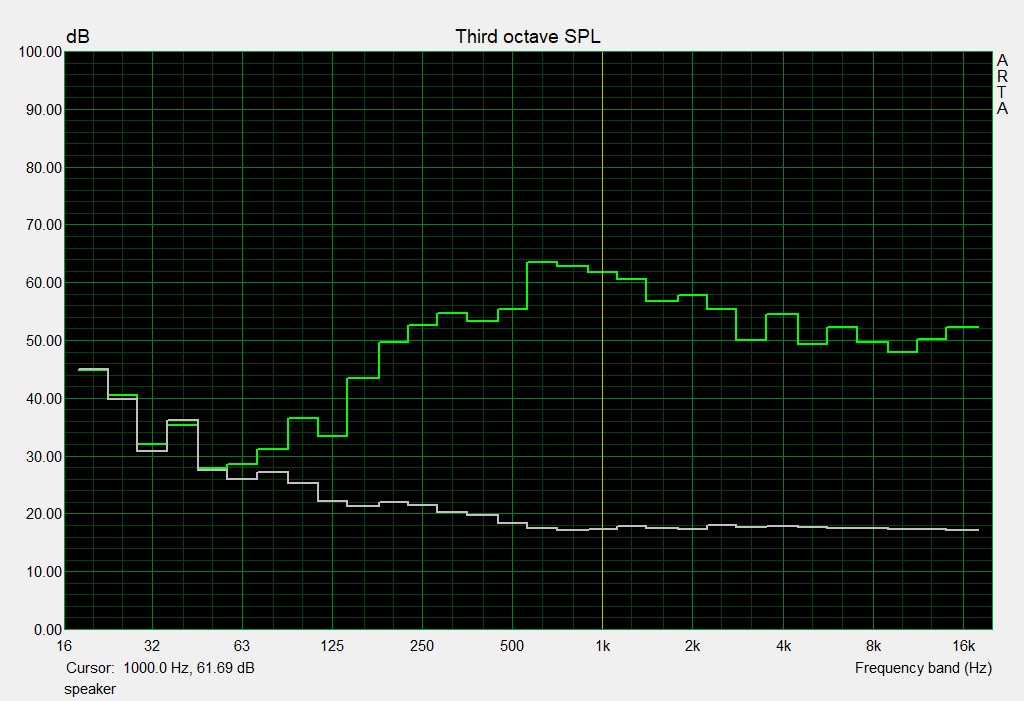
You should not expect a great sound from the Neo 17’s speakers. They only reached a maximum volume of 70 dB(A) in our tests, which is significantly quieter than the speakers in laptops such as the ROG Strix Scar II GL704GW. Moreover, the speakers produce hardly any bass, which is disappointing for such a large laptop. In our opinion, the sound could be clearer, better balanced and more precise.
According to our audio analysis, which you can see in the table below, the ROG Strix Scar II GL704GW delivers a much more balanced sound than the Neo 17 can. Hence, we would recommend using the 2.1 speakers as a stopgap until you can connect some external speakers or headphones.
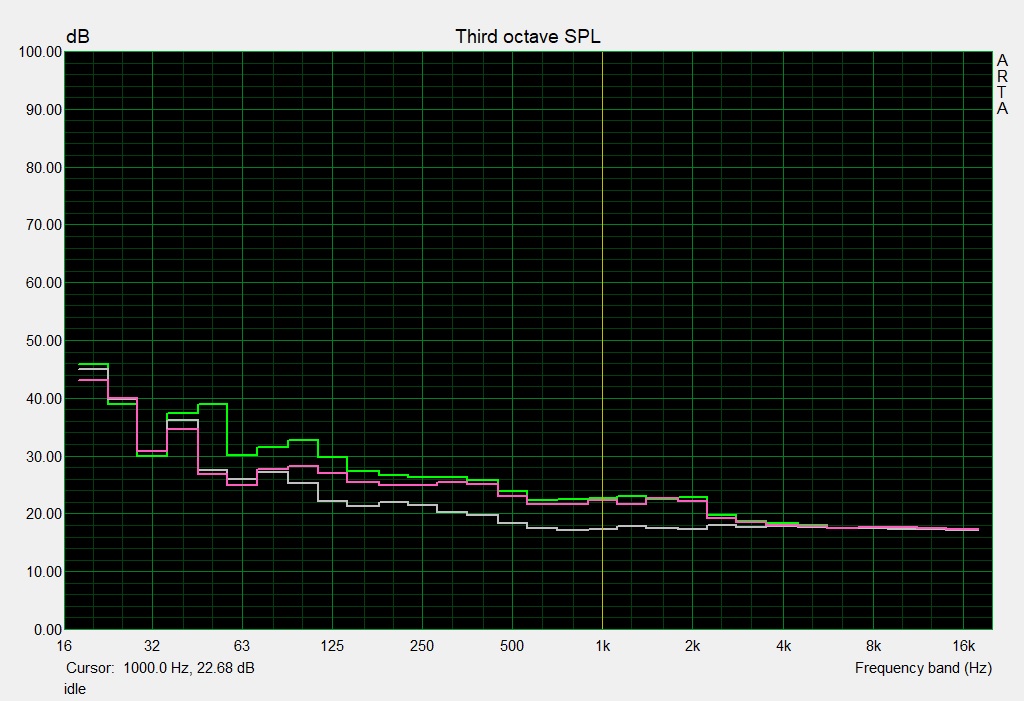
Schenker XMG Neo 17 audio analysis
(-) | not very loud speakers (70 dB)
Bass 100 - 315 Hz
(±) | reduced bass - on average 8.2% lower than median
(±) | linearity of bass is average (14.3% delta to prev. frequency)
Mids 400 - 2000 Hz
(±) | higher mids - on average 6.4% higher than median
(+) | mids are linear (6.9% delta to prev. frequency)
Highs 2 - 16 kHz
(+) | balanced highs - only 2.6% away from median
(±) | linearity of highs is average (10.1% delta to prev. frequency)
Overall 100 - 16.000 Hz
(±) | linearity of overall sound is average (19.1% difference to median)
Compared to same class
» 64% of all tested devices in this class were better, 7% similar, 28% worse
» The best had a delta of 6%, average was 18%, worst was 132%
Compared to all devices tested
» 46% of all tested devices were better, 7% similar, 47% worse
» The best had a delta of 4%, average was 23%, worst was 134%
Asus ROG Strix Scar II GL704GW audio analysis
(±) | speaker loudness is average but good (77 dB)
Bass 100 - 315 Hz
(±) | reduced bass - on average 6.1% lower than median
(±) | linearity of bass is average (10.4% delta to prev. frequency)
Mids 400 - 2000 Hz
(+) | balanced mids - only 2.2% away from median
(+) | mids are linear (2.4% delta to prev. frequency)
Highs 2 - 16 kHz
(+) | balanced highs - only 3.1% away from median
(+) | highs are linear (4% delta to prev. frequency)
Overall 100 - 16.000 Hz
(+) | overall sound is linear (12.3% difference to median)
Compared to same class
» 13% of all tested devices in this class were better, 5% similar, 82% worse
» The best had a delta of 6%, average was 18%, worst was 132%
Compared to all devices tested
» 10% of all tested devices were better, 3% similar, 87% worse
» The best had a delta of 4%, average was 23%, worst was 134%
Power Management
Power Consumption
The Neo 17 supports NVIDIA Optimus, which allows it to switch between GPUs to reduce power consumption. This worked effectively during our tests, in which our review unit consumed a minimum of 13 W at idle, and averaging 16 W. These are significantly lower values than what our comparison devices achieved and is a testament to how frugally the Neo 17 runs.
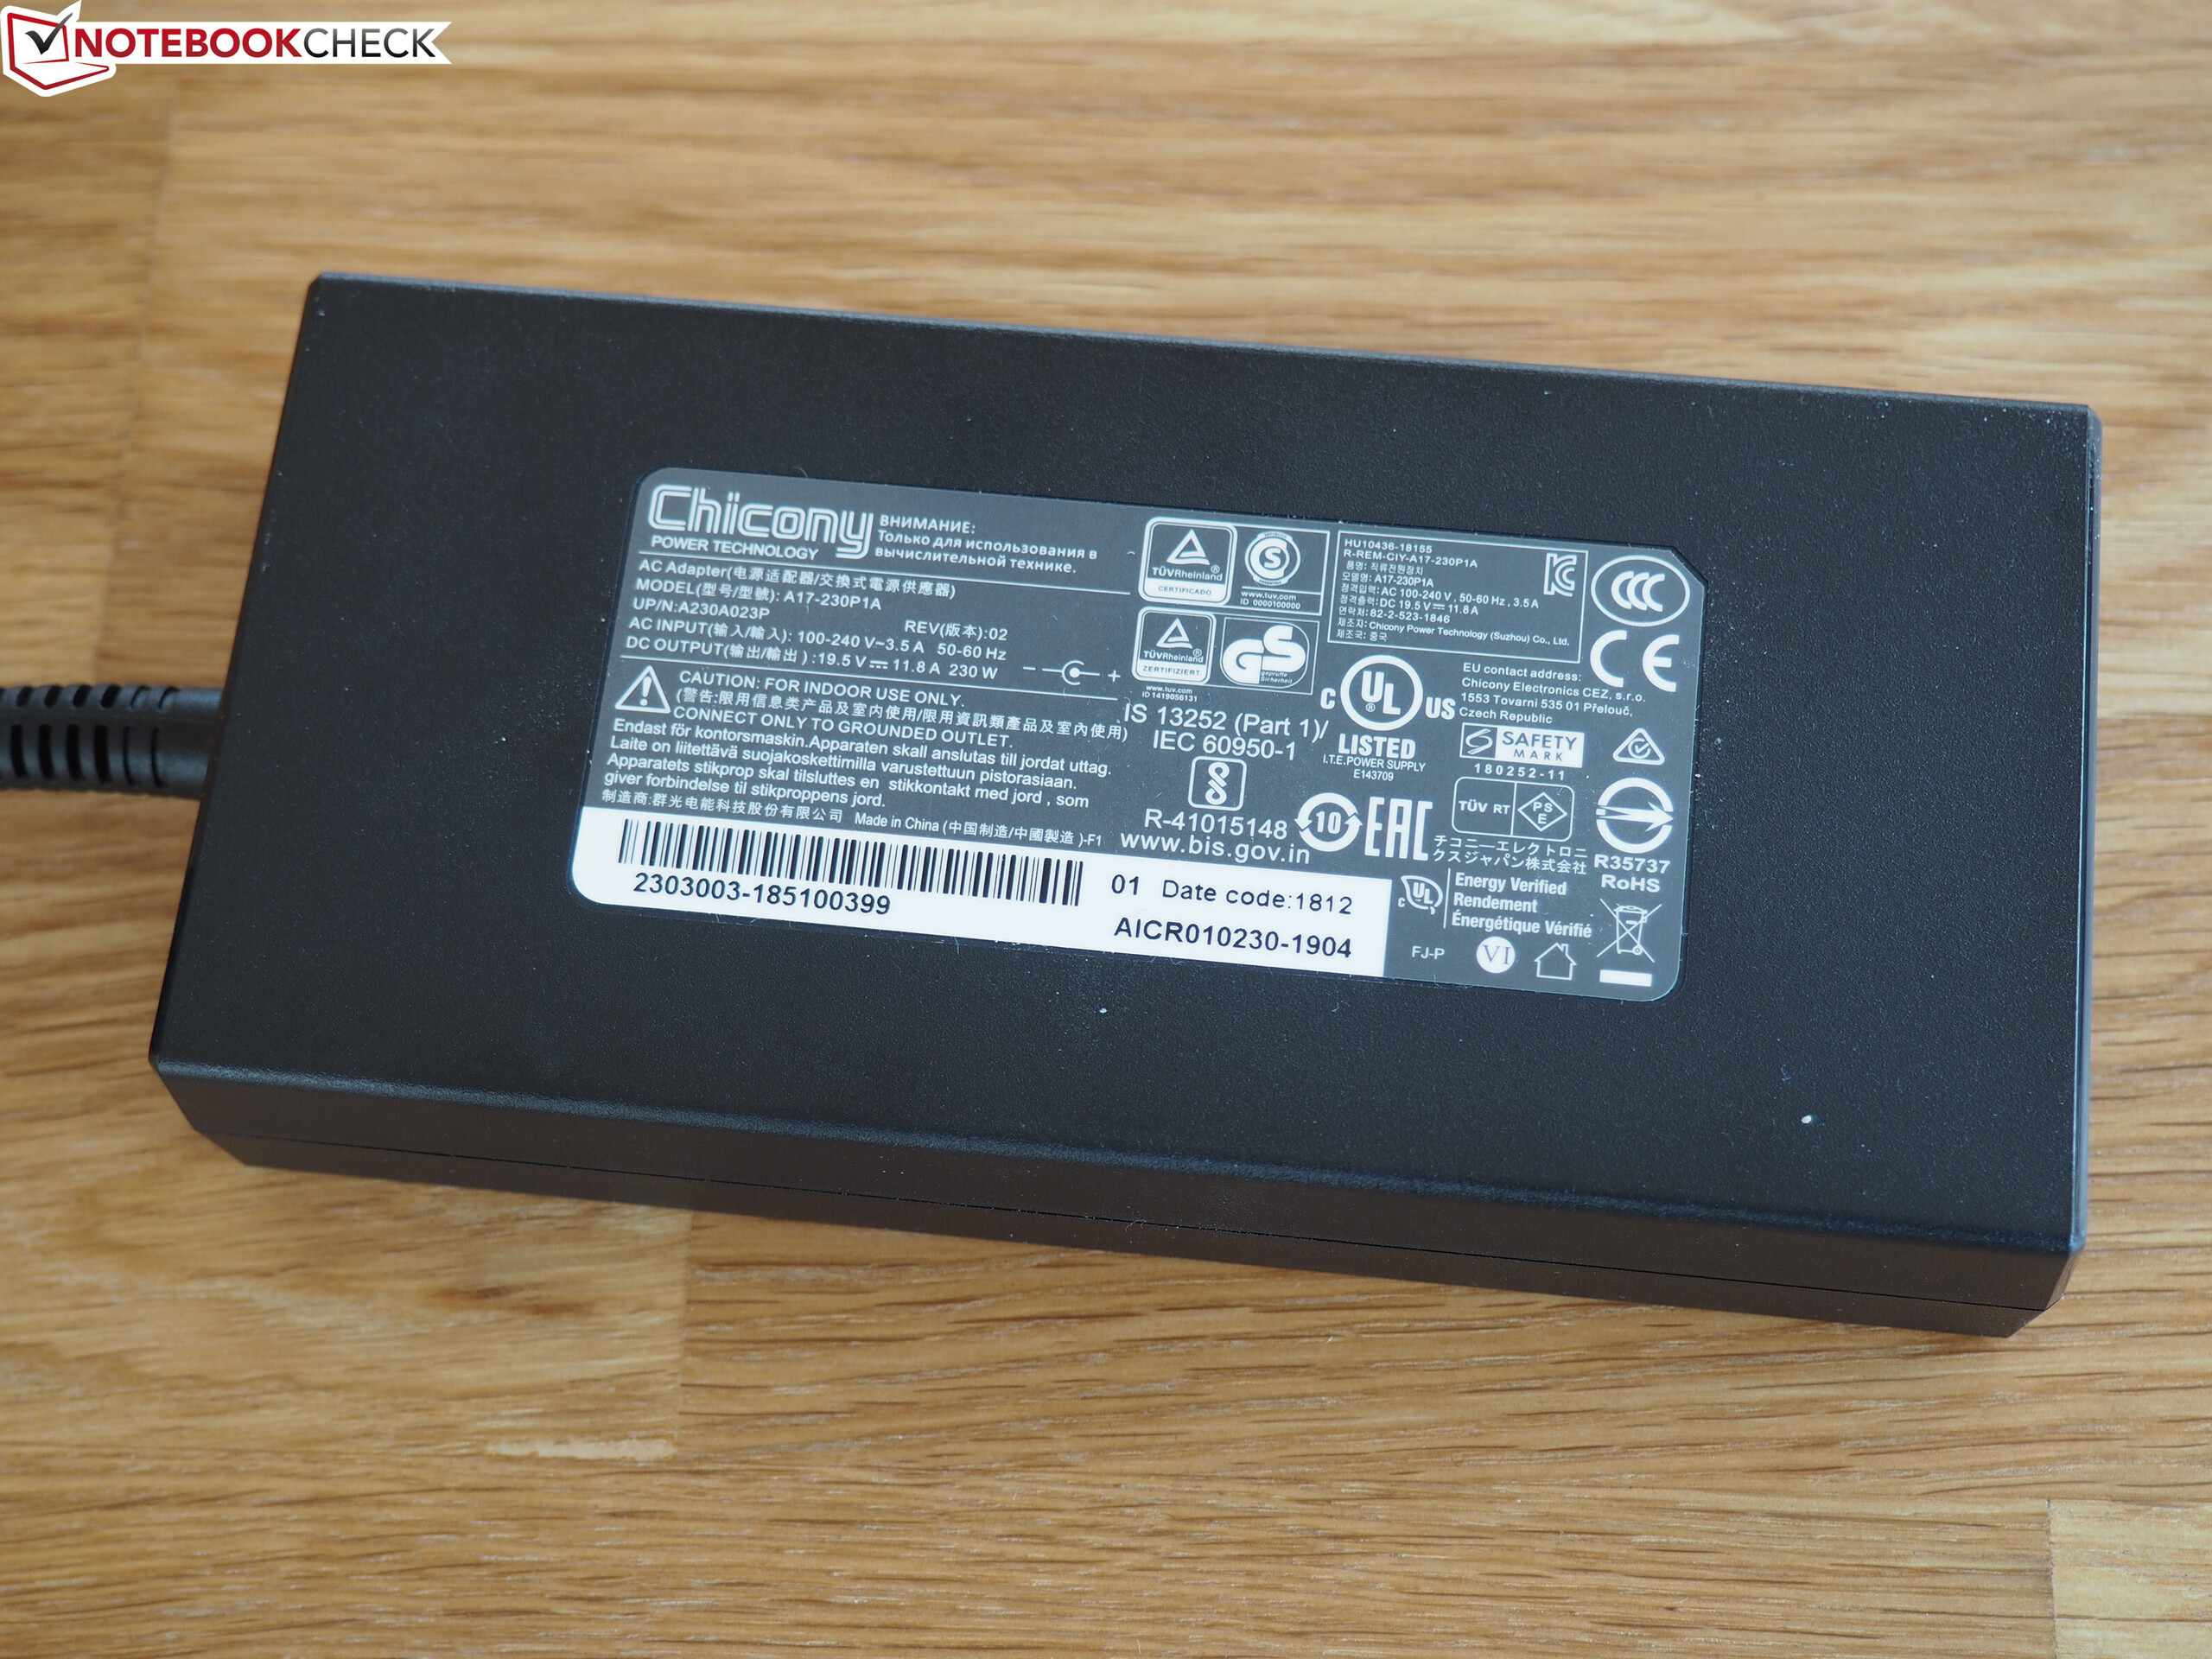
Our review unit consumed just 191 W under sustained load and 172 W while playing "The Witcher 3", which is well within the limits of its 230-W power supply. It is worth noting that GeForce GTX 1080 powered laptops usually come with a huge 330-W power supply, so NVIDIA has done a great job at optimising its new GPUs. The power supply is also comparatively compact at 15 x 7 x 3 cm (~6 x 2.8 x 1.2 in), but the RTX 2060 model comes with an even smaller 180-W model.
| Off / Standby | |
| Idle | |
| Load |
|
Key:
min: | |
| Schenker XMG Neo 17 GeForce RTX 2070 Mobile, i7-8750H | Asus ROG Strix Scar II GL704GW GeForce RTX 2070 Mobile, i7-8750H | MSI GE75 8SF GeForce RTX 2070 Mobile, i7-8750H | Lenovo Legion Y740-17ICH GeForce RTX 2080 Max-Q, i7-8750H | Asus Zephyrus S GX701GX GeForce RTX 2080 Max-Q, i7-8750H | Average of class Gaming | |
|---|---|---|---|---|---|---|
| Power Consumption | -27% | -19% | -22% | -23% | -17% | |
| Idle Minimum * (Watt) | 13 | 19 -46% | 16.4 -26% | 20.2 -55% | 19 -46% | 13 ? -0% |
| Idle Average * (Watt) | 16 | 22 -38% | 21.9 -37% | 27.2 -70% | 22 -38% | 19 ? -19% |
| Idle Maximum * (Watt) | 21 | 29 -38% | 25.4 -21% | 28.7 -37% | 30 -43% | 24.6 ? -17% |
| Load Average * (Watt) | 96 | 102 -6% | 90.7 6% | 90.8 5% | 104 -8% | 110.7 ? -15% |
| Witcher 3 ultra * (Watt) | 172 | 190 -10% | 203.3 -18% | 152.1 12% | 167 3% | |
| Load Maximum * (Watt) | 191 | 231 -21% | 222.9 -17% | 165.4 13% | 203 -6% | 259 ? -36% |
* ... smaller is better
Battery Life
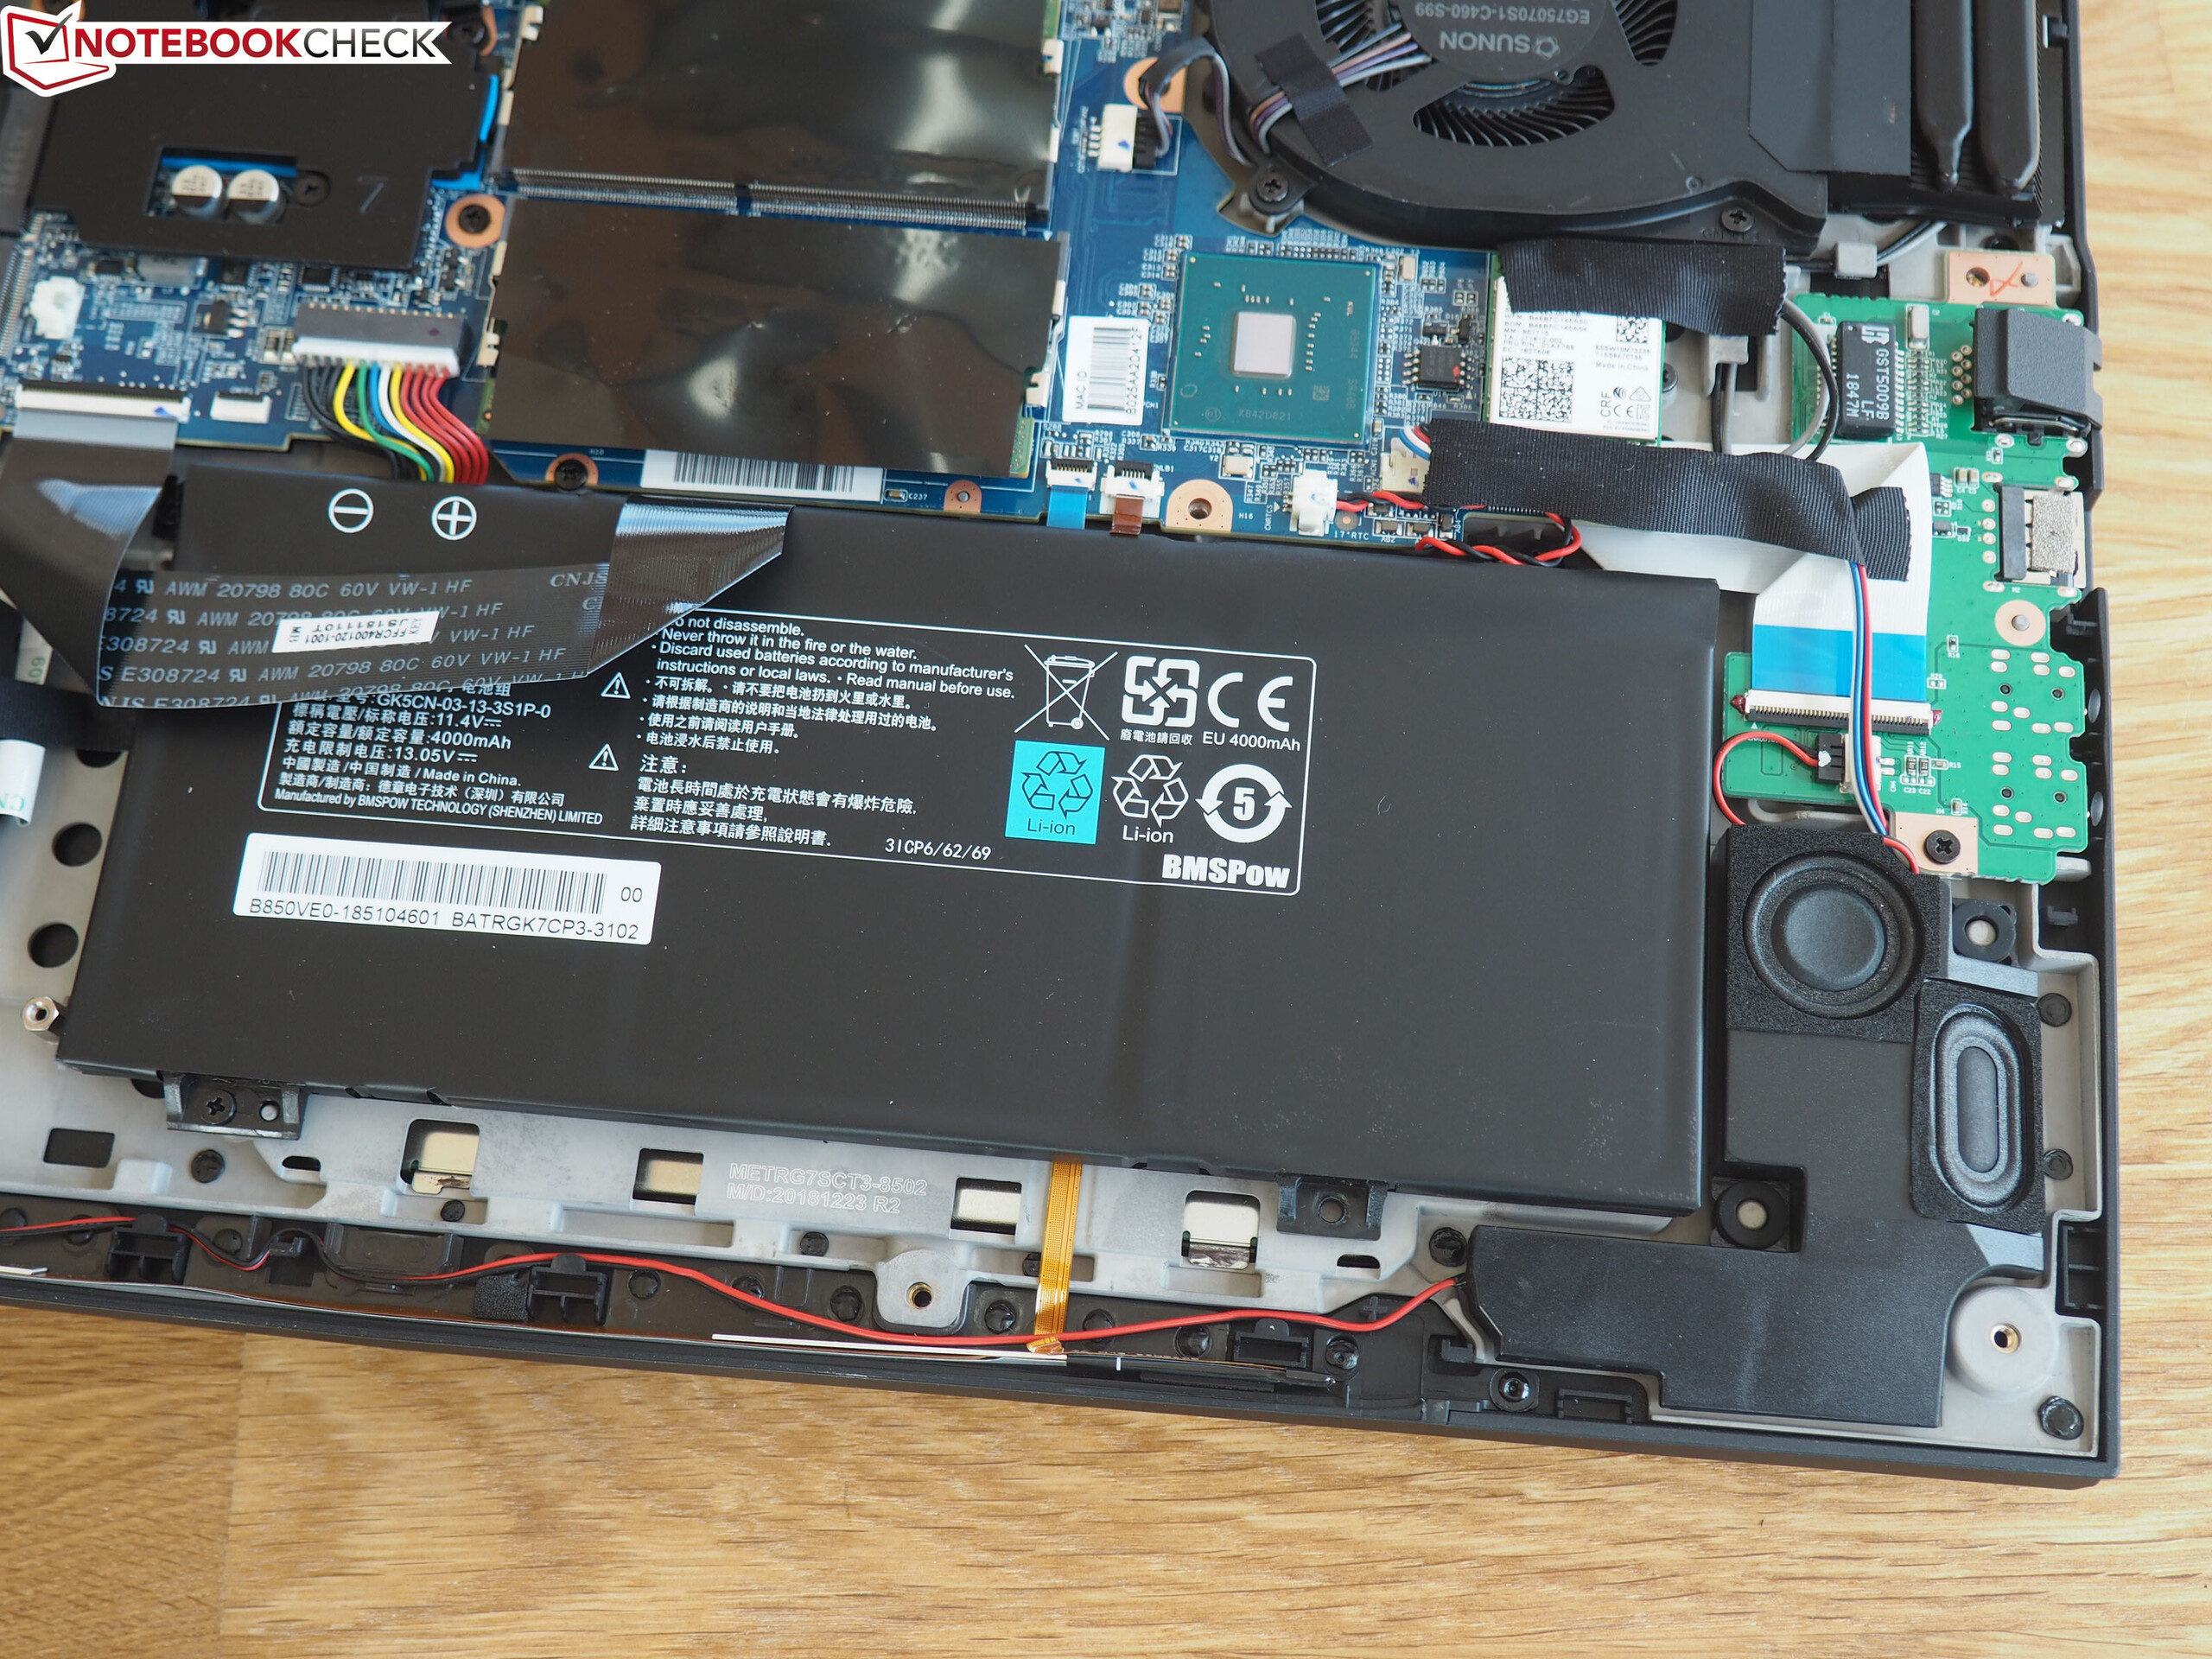
Unfortunately, that comparatively low power consumption does not result in decent battery life. Schenker has inexplicably equipped the Neo 17 with a 46.7 Wh battery, which is comparatively small by 17-inch gaming laptop standards. By contrast, all our comparison devices have between 65 and 76 Wh batteries, while some 15-inch laptops such as the Aero 15-X9 have almost 100 Wh batteries in much smaller chassis. In our opinion, Tonfang should have sacrificed the 2.5-inch drive bay for a larger battery, but our review unit still achieved surprisingly good runtimes despite its significantly smaller battery. The Neo 17 lasted for 3:44 hours in our practical Wi-Fi battery life test, which is a passable but uninspiring runtime.
Please note that 3D performance drops by around 90% when the Neo 17 is running on battery. Hence, we would only recommend gaming with the device connected to the mains.
| Schenker XMG Neo 17 GeForce RTX 2070 Mobile, i7-8750H, 46.74 Wh | Asus ROG Strix Scar II GL704GW GeForce RTX 2070 Mobile, i7-8750H, 66 Wh | MSI GE75 8SF GeForce RTX 2070 Mobile, i7-8750H, 65 Wh | Lenovo Legion Y740-17ICH GeForce RTX 2080 Max-Q, i7-8750H, 76 Wh | Asus Zephyrus S GX701GX GeForce RTX 2080 Max-Q, i7-8750H, 76 Wh | Average of class Gaming | |
|---|---|---|---|---|---|---|
| Battery runtime | 15% | -5% | -14% | -1% | 72% | |
| Reader / Idle (h) | 5.3 | 6.2 17% | 5 -6% | 8.27 ? 56% | ||
| WiFi v1.3 (h) | 3.7 | 3.9 5% | 3.5 -5% | 3.2 -14% | 3.8 3% | 7.11 ? 92% |
| Load (h) | 0.9 | 1.1 22% | 0.9 0% | 1.502 ? 67% | ||
| Witcher 3 ultra (h) | 0.9 |
Pros
Cons
Verdict
The Schenker XMG Neo 17 is largely an excellent 17-inch gaming laptop. The display is a delight with its high contrast ratio and 144 Hz refresh rate along with its slim bezels. Moreover, it impressed in our gaming tests thanks to its RTX 2070 GPU, while its mechanical RGB keyboard is a pleasure to type on.
Furthermore, the Neo 17 is almost freely configurable and comes with a ton of accessories, which is always welcome. The Tongfang Barebones case is comparatively compact and light too, although it is rather thick.
However, Schenker would need to address several areas to achieve top marks. Firstly, the Neo 17’s successor would need at least the option for a larger battery along with a better trackpad and speakers. Additionally, the company would need to reposition the Wi-Fi card to make the most of its potential and tweak the fan control to utilise the CPU turbo on the balanced fan mode. Overall, these shortcomings do not prevent the XMG Neo 17 from receiving a decent average score, but they do stop it from being the 17-inch gaming laptop to beat this year.
Schenker XMG Neo 17
- 05/14/2020 v7 (old)
Florian Glaser
Price comparison

