Intel Core i9-12900H debut: Uniwill Technology GM7AG8P laptop review
Intel has finally responded to AMD's impressive mobile Zen 3 H-series with its 12th gen Alder Lake-H platform. Schenker and Uniwill Technology have provided for us one of the first laptops to carry the 12th gen Core i9-12900H based on the GM7AG8P chassis. Schenker have yet to publicly offer this exact configuration as of this writing, but retail options may come at a later date.
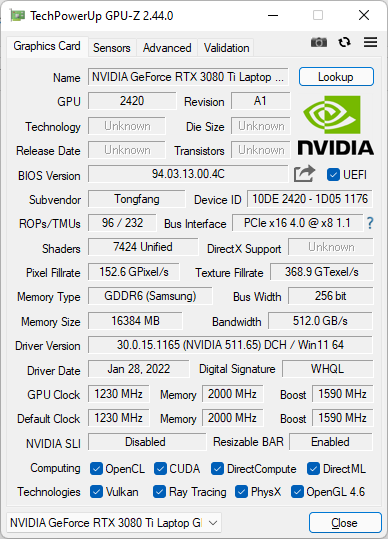
Our test unit comes with the aforementioned Core i9 CPU, new GeForce RTX 3080 Ti GPU, DDR5-4800 RAM, and 1440p (QHD) IPS 165 Hz display. This review will focus on performance to show what users can expect out of the new Intel CPU and Nvidia GPU when compared to their respective last generation counterparts.
Please note that the Uniwill Technology GM7AG8P chassis is not the XMG Neo 17 or XMG Pro 17. It may, however, be considered for a future XMG model.
More Schenker reviews:
Potential Competitors in Comparison
Rating | Date | Model | Weight | Height | Size | Resolution | Price |
|---|---|---|---|---|---|---|---|
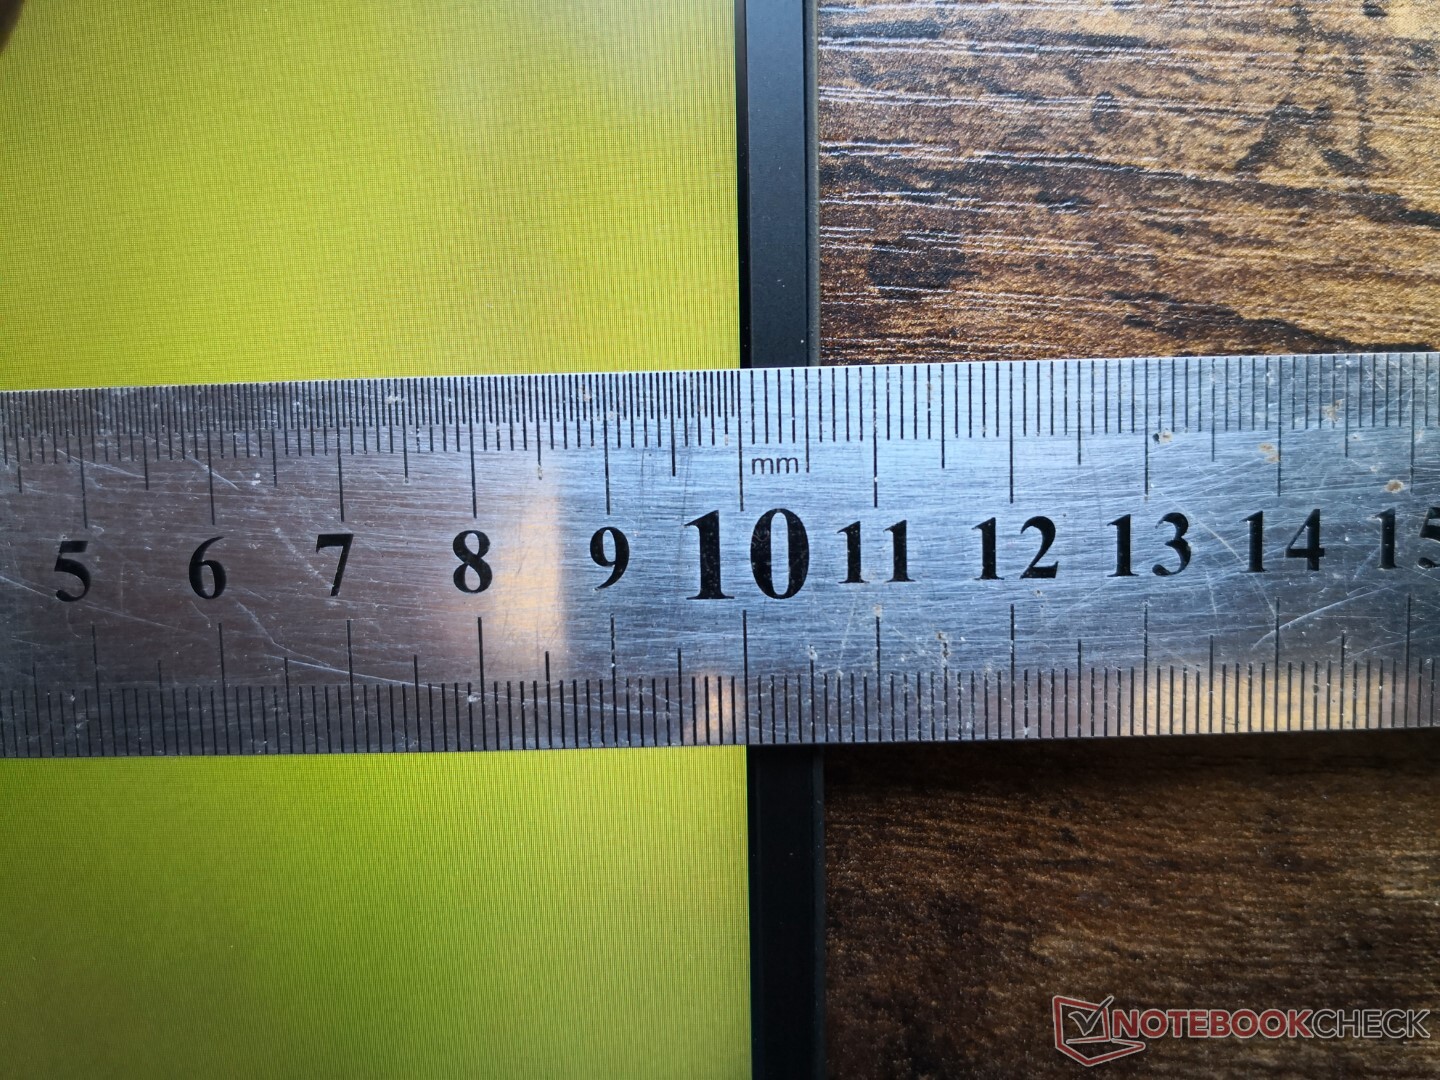
| 86.9 % v7 (old) | 02 / 2022 | Schenker Uniwill Technology GM7AG8P i9-12900H, GeForce RTX 3080 Ti Laptop GPU | 2.3 kg | 20 mm | 17.30" | 2560x1440 | |
| 87.4 % v7 (old) | 09 / 2021 | Schenker XMG NEO 17 GM7TG8S i7-11800H, GeForce RTX 3080 Laptop GPU | 2.6 kg | 27.45 mm | 17.30" | 2560x1440 | |
| 89 % v7 (old) | 09 / 2021 | Alienware x17 RTX 3080 P48E i7-11800H, GeForce RTX 3080 Laptop GPU | 3.2 kg | 21.4 mm | 17.30" | 3840x2160 | |
| 89.4 % v7 (old) | 09 / 2021 | Razer Blade 17 RTX 3070 i7-11800H, GeForce RTX 3070 Laptop GPU | 2.8 kg | 19.9 mm | 17.30" | 1920x1080 | |
| 86.2 % v7 (old) | 09 / 2021 | MSI GS76 Stealth 11UH i9-11900H, GeForce RTX 3080 Laptop GPU | 2.4 kg | 20 mm | 17.30" | 3840x2160 | |
| 87.8 % v7 (old) | 09 / 2021 | Maingear Vector Pro MG-VCP17 i7-11800H, GeForce RTX 3080 Laptop GPU | 2.3 kg | 19.81 mm | 17.30" | 2560x1440 |
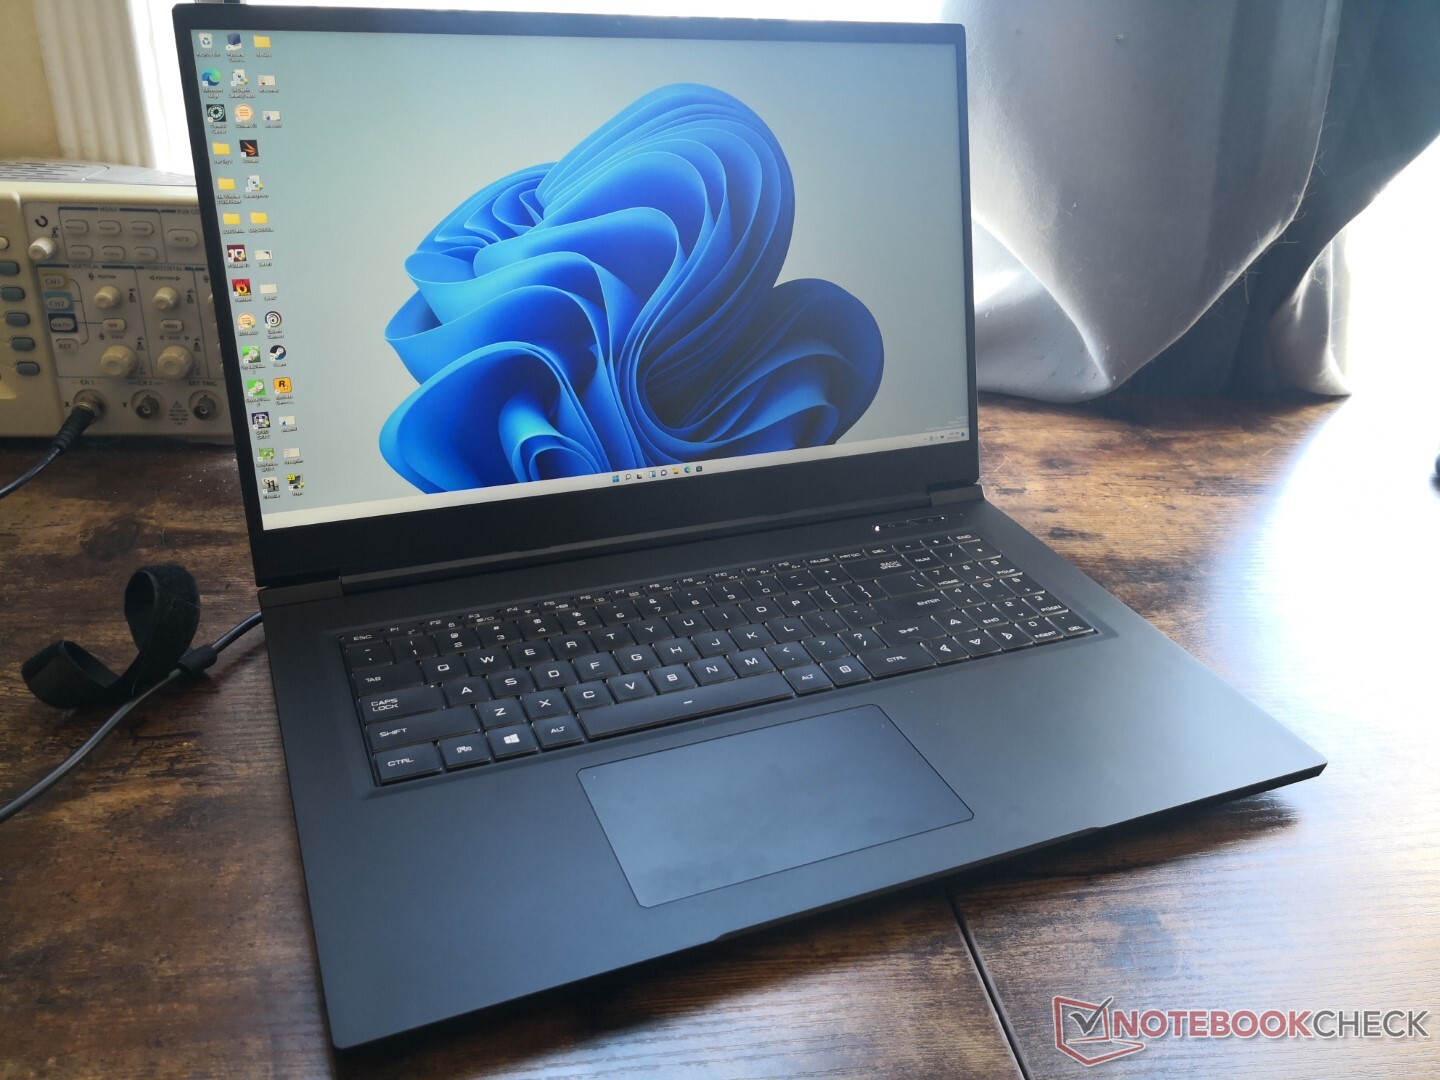
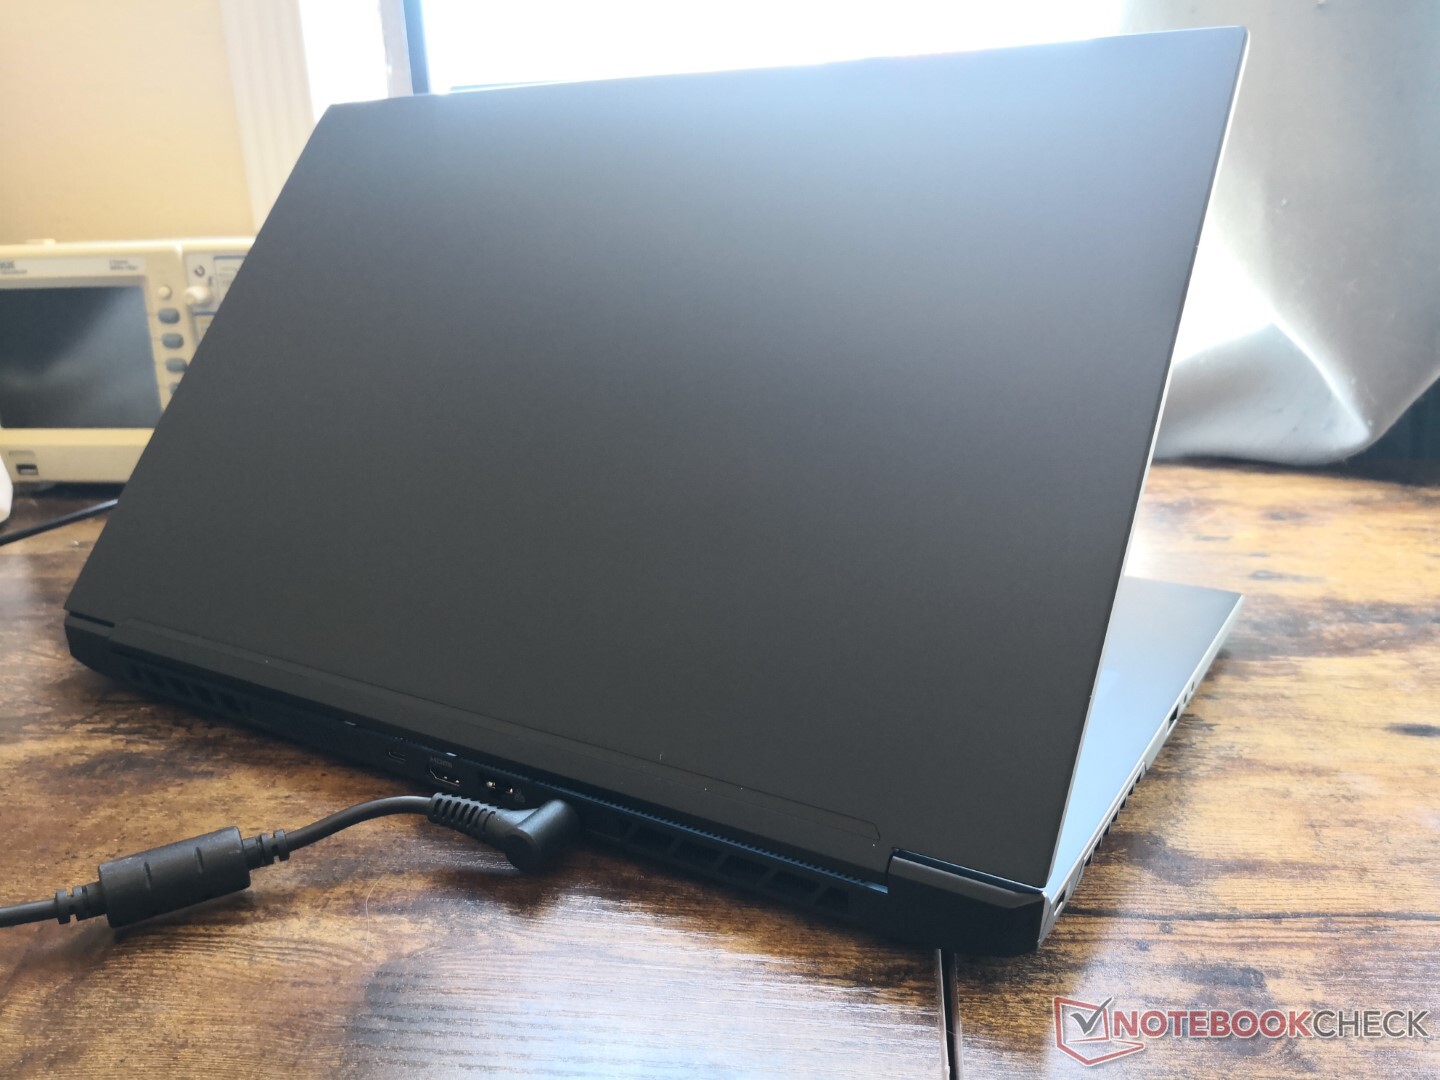
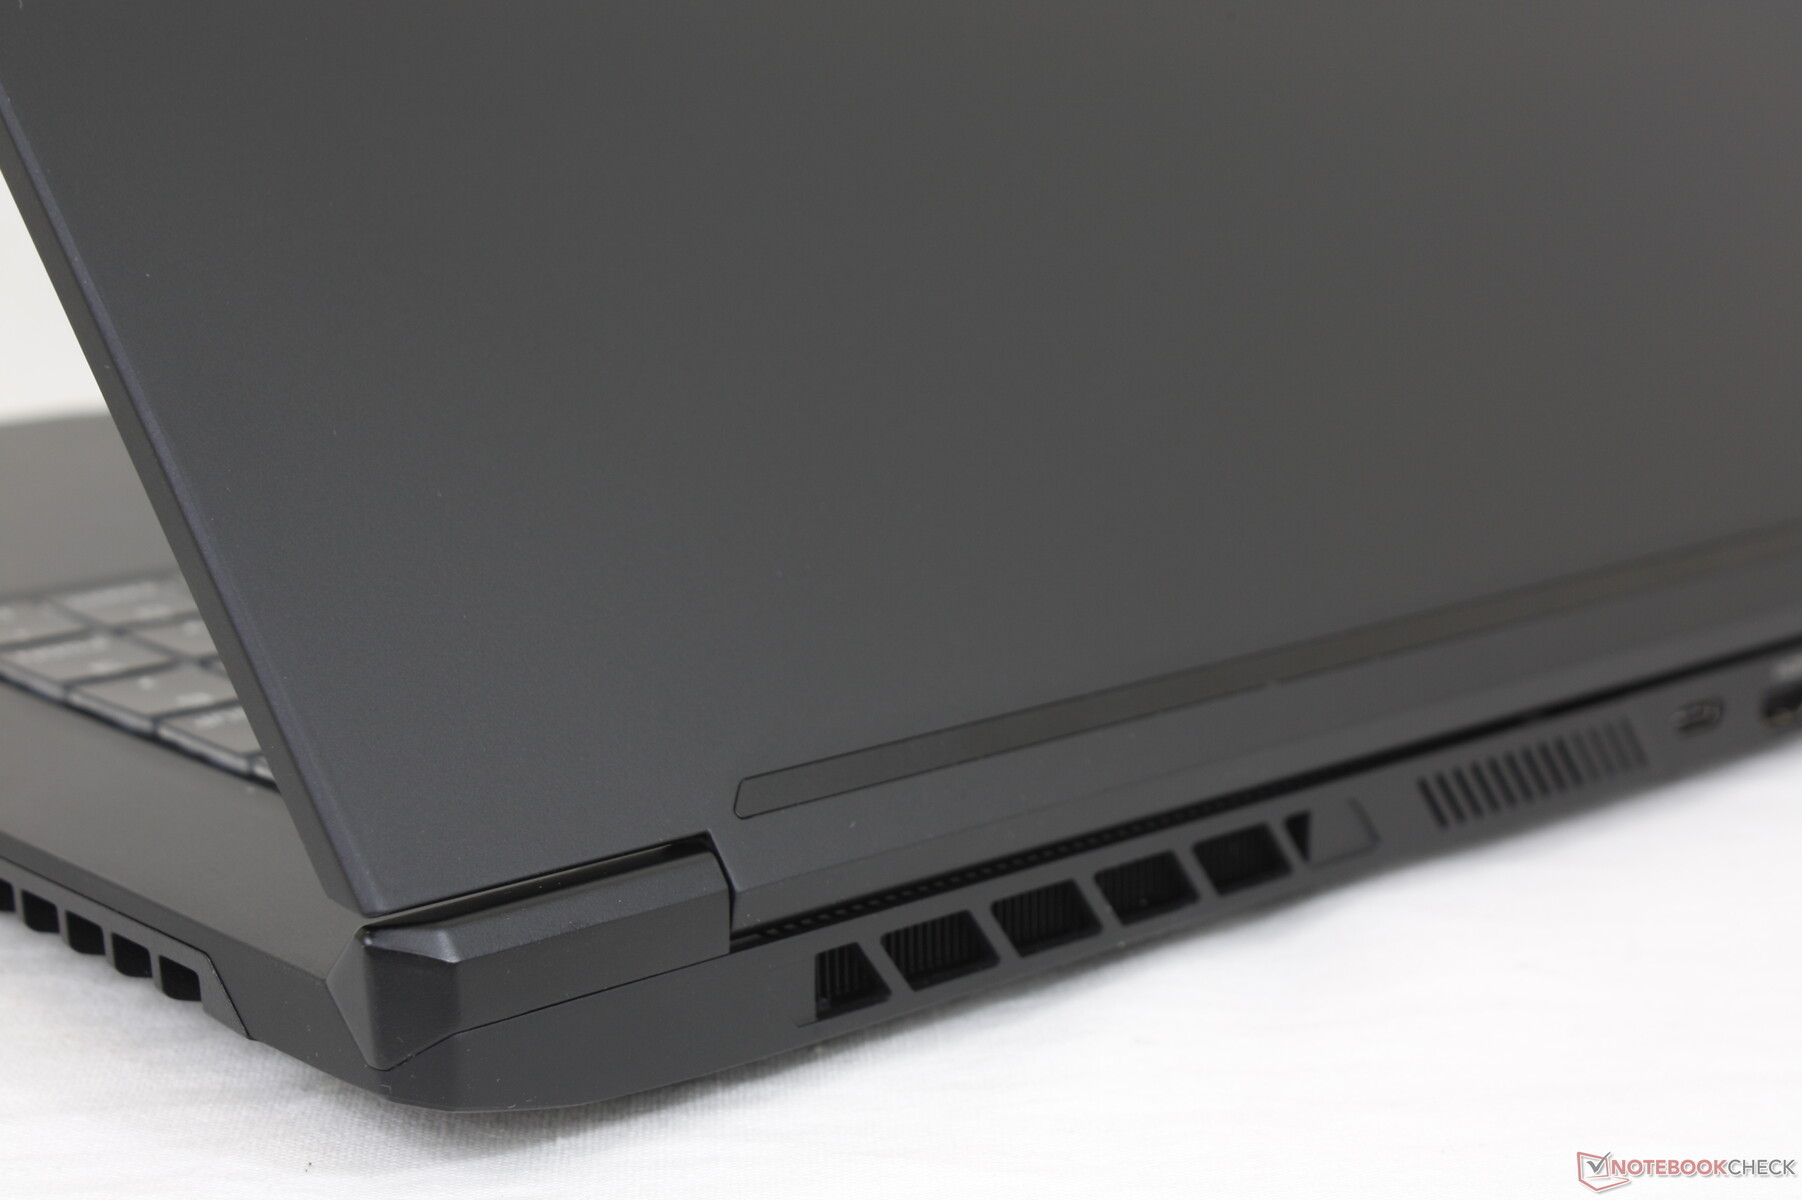
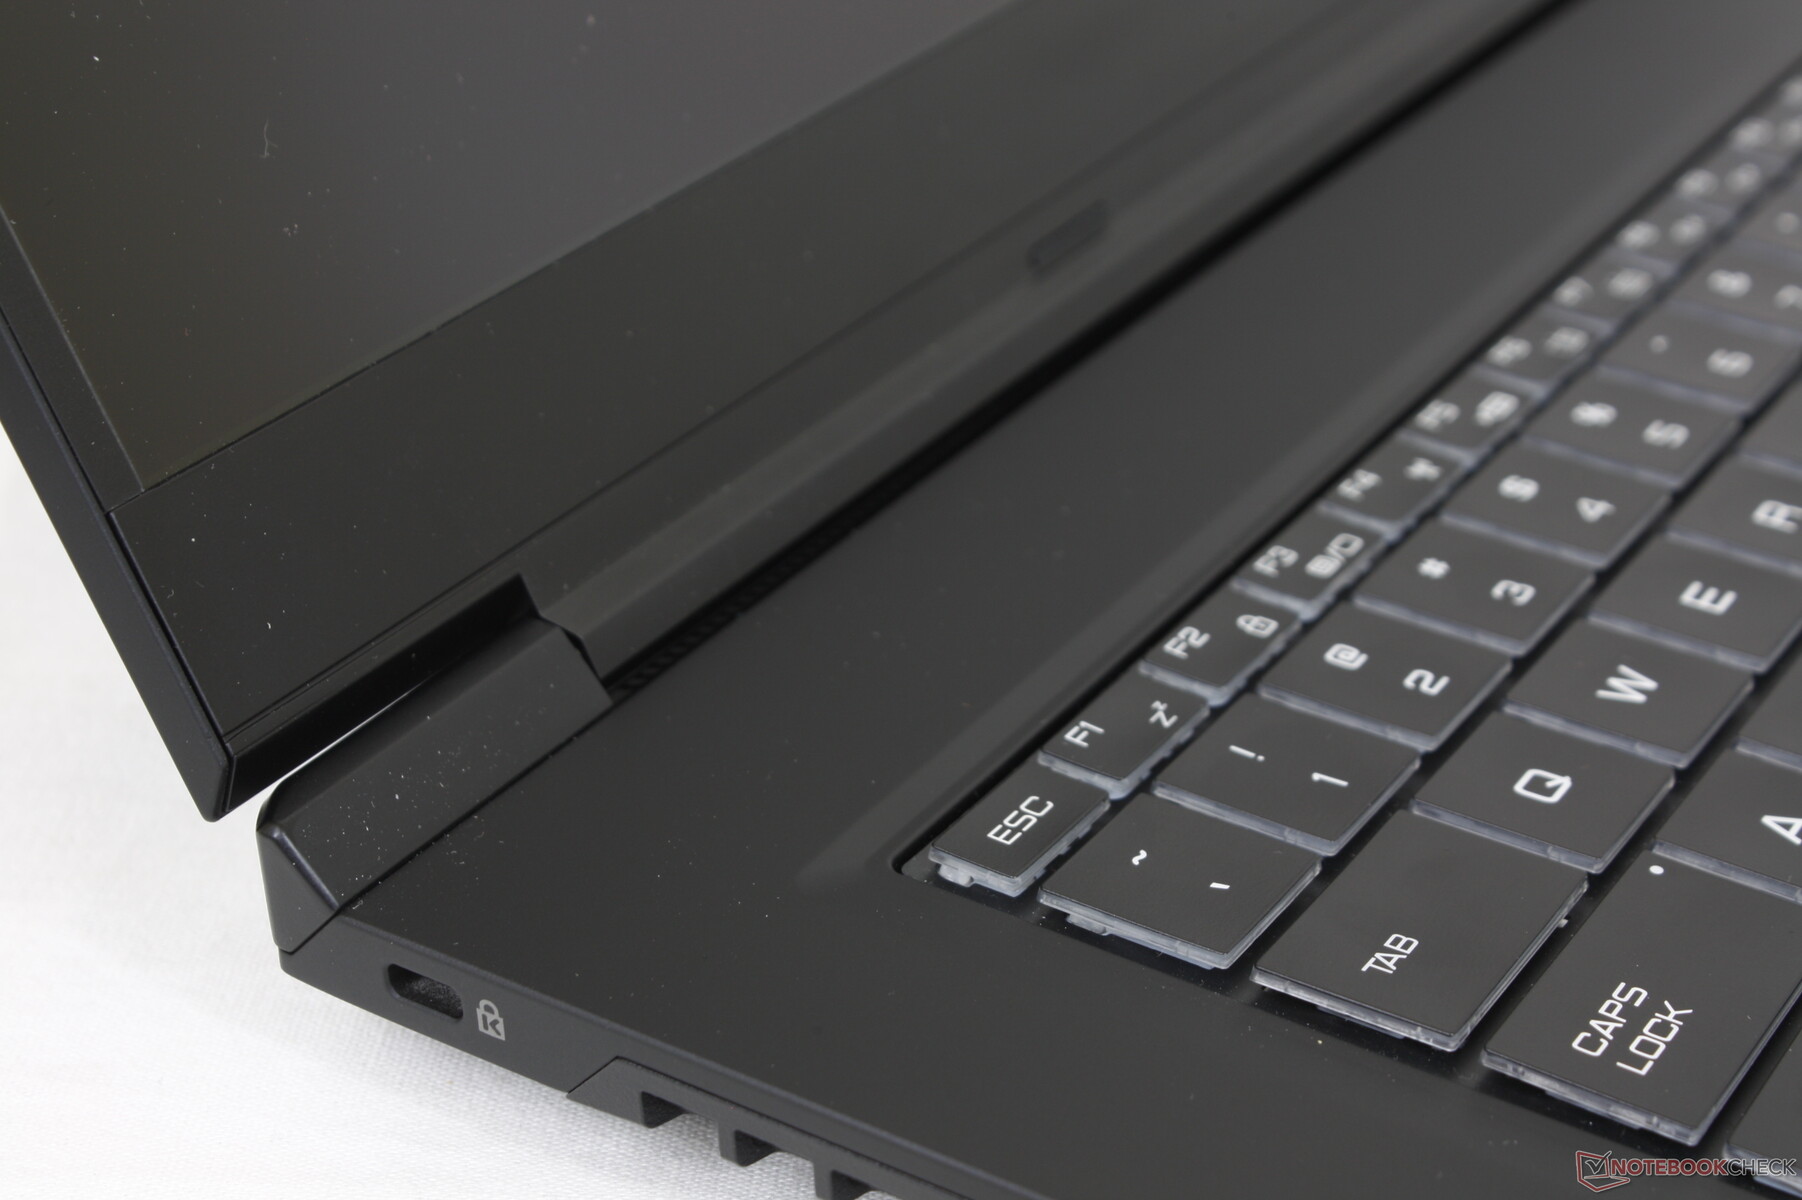
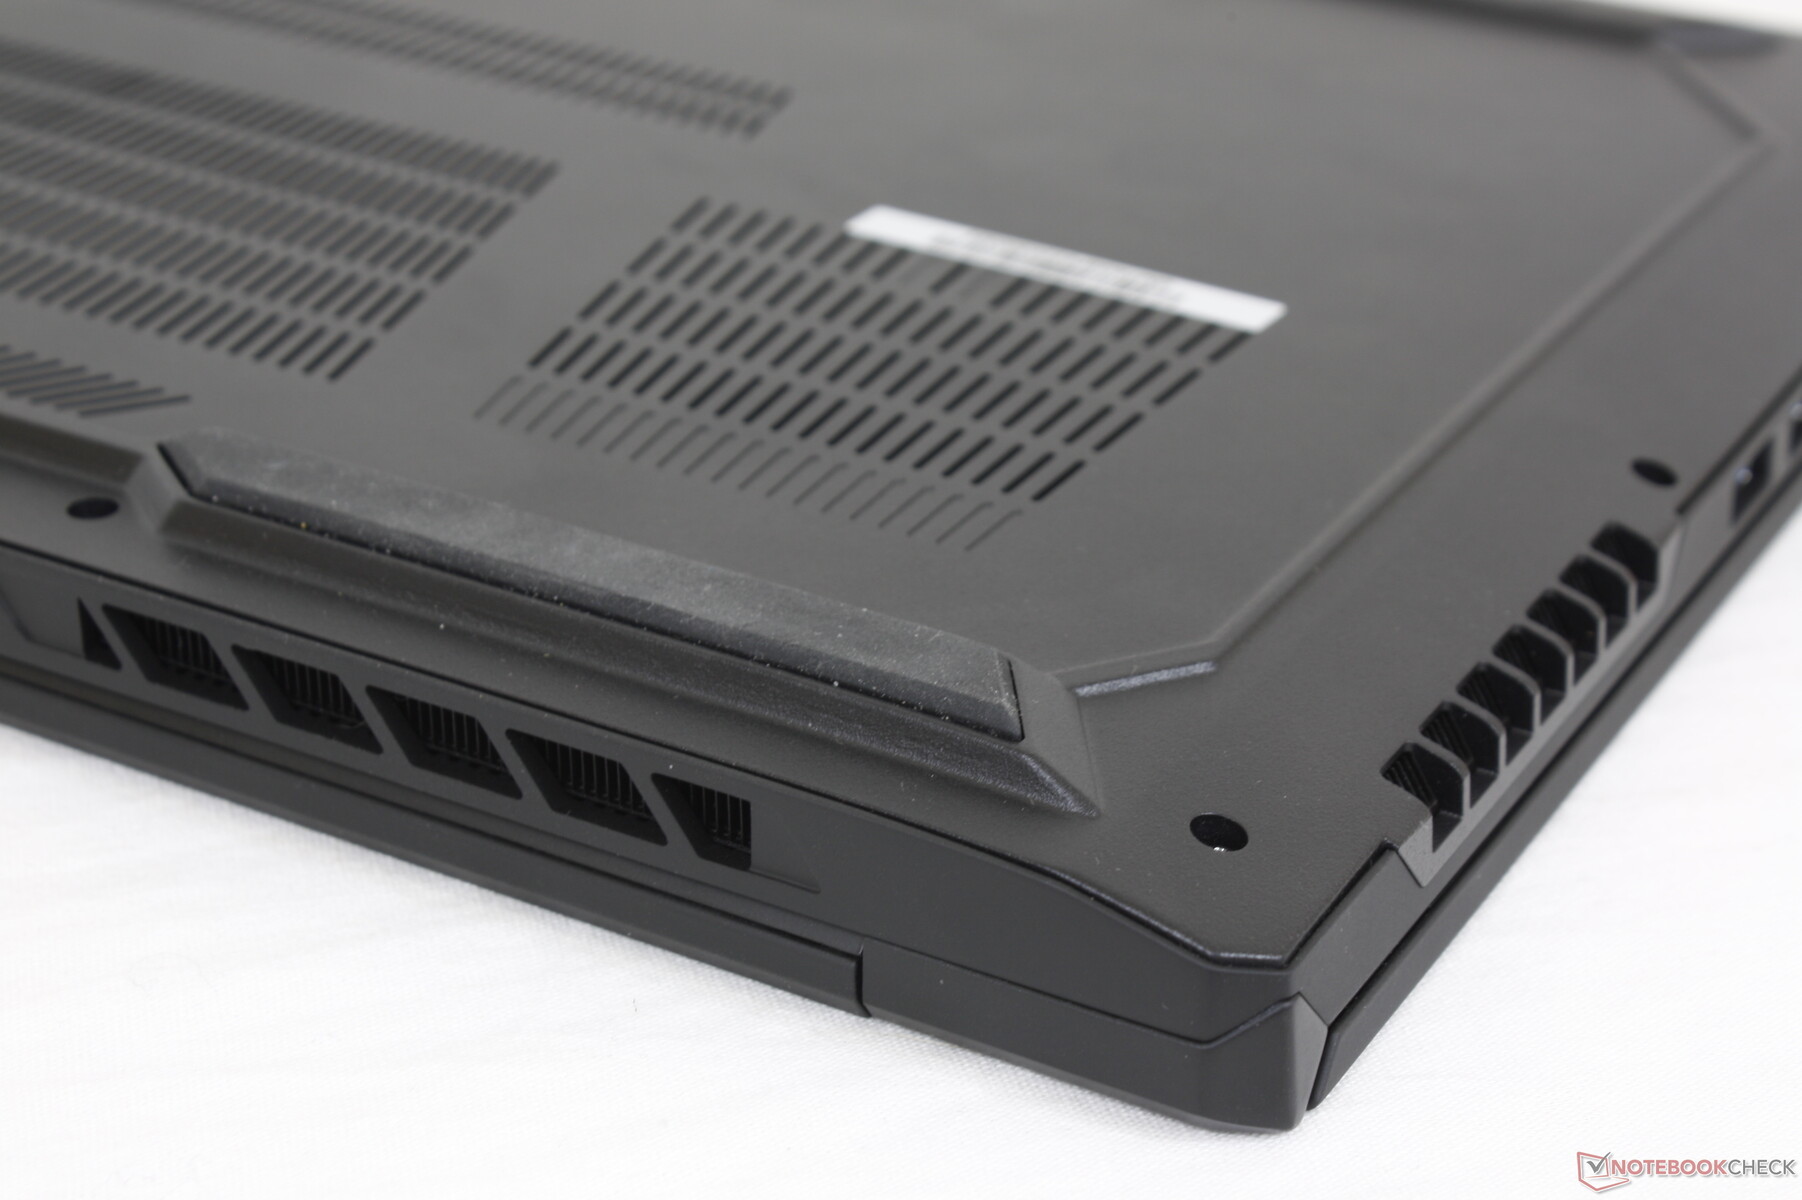
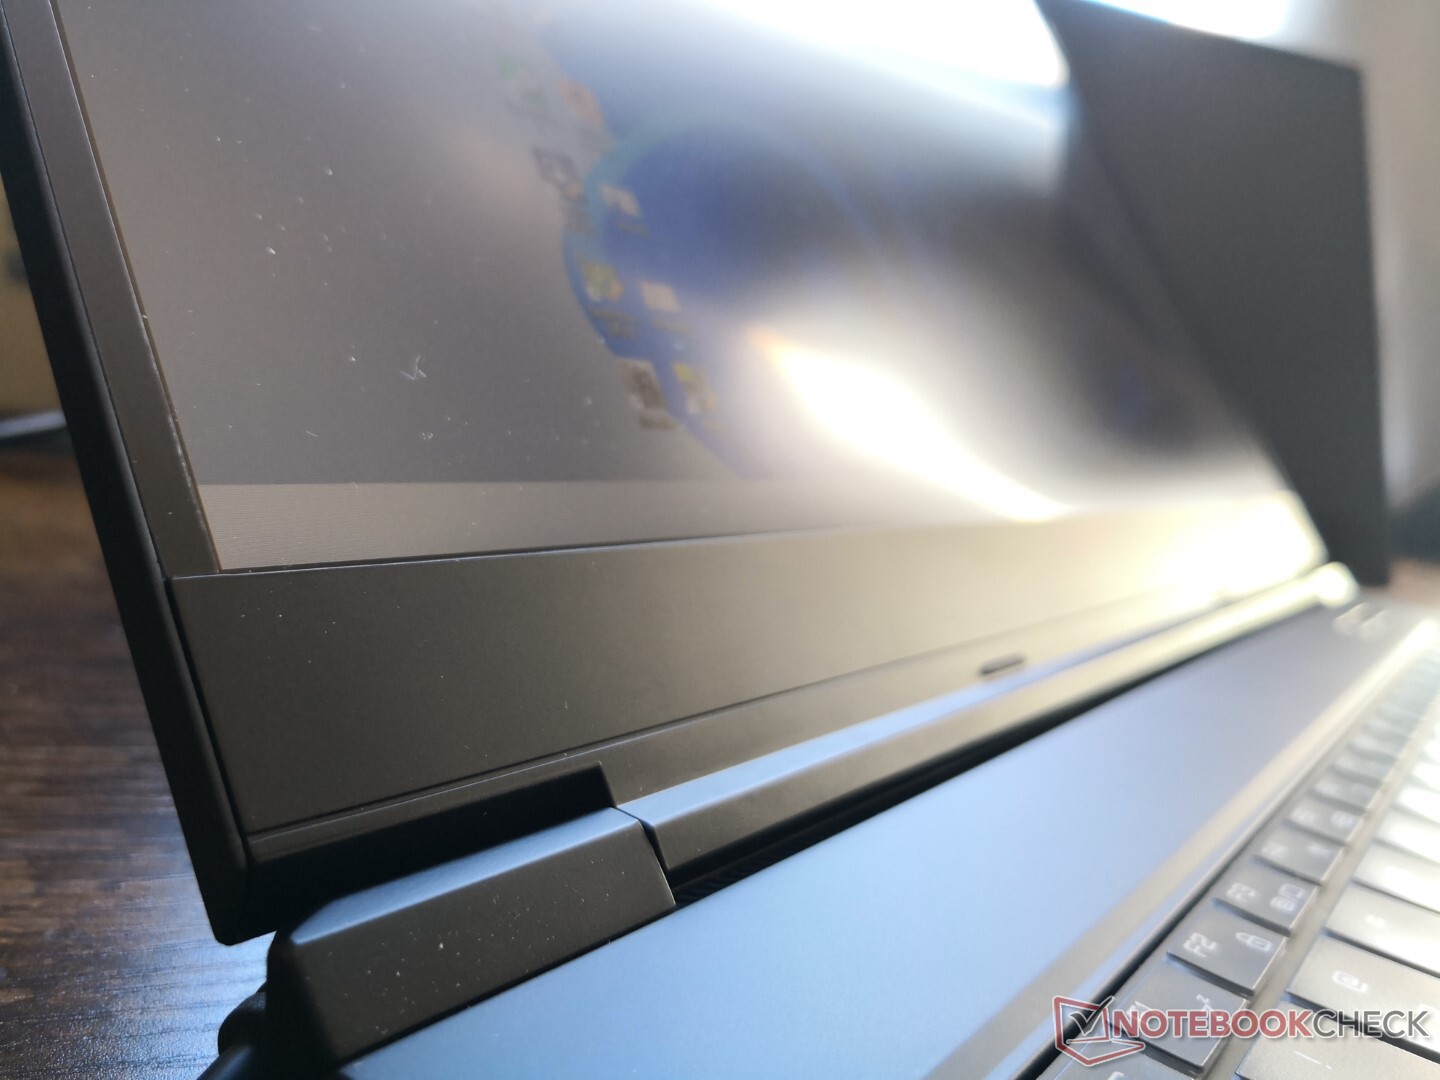
Case — Typical Tongfang
Formerly known as Tongfang, Uniwill Technology utilizes similar materials and designs across many of its gaming laptops and mobile workstations. In this case, the GM7AG8P has a lot in common with the XMG Neo 17 and XMG Pro 17 in terms of features, rigidity, and texture even if their dimensions, appearances, and sizes are slightly different. Overall dimensions are nearly identical to the Razer Blade Pro 17 while weighing 500 grams less mostly due to the lack of a vapor chamber cooler for the GM7AG8P.
(March 1, 2022 update: We incorrectly stated that the chassis was mostly ABS plastic and have revised our caption to read magnesium alloy.)
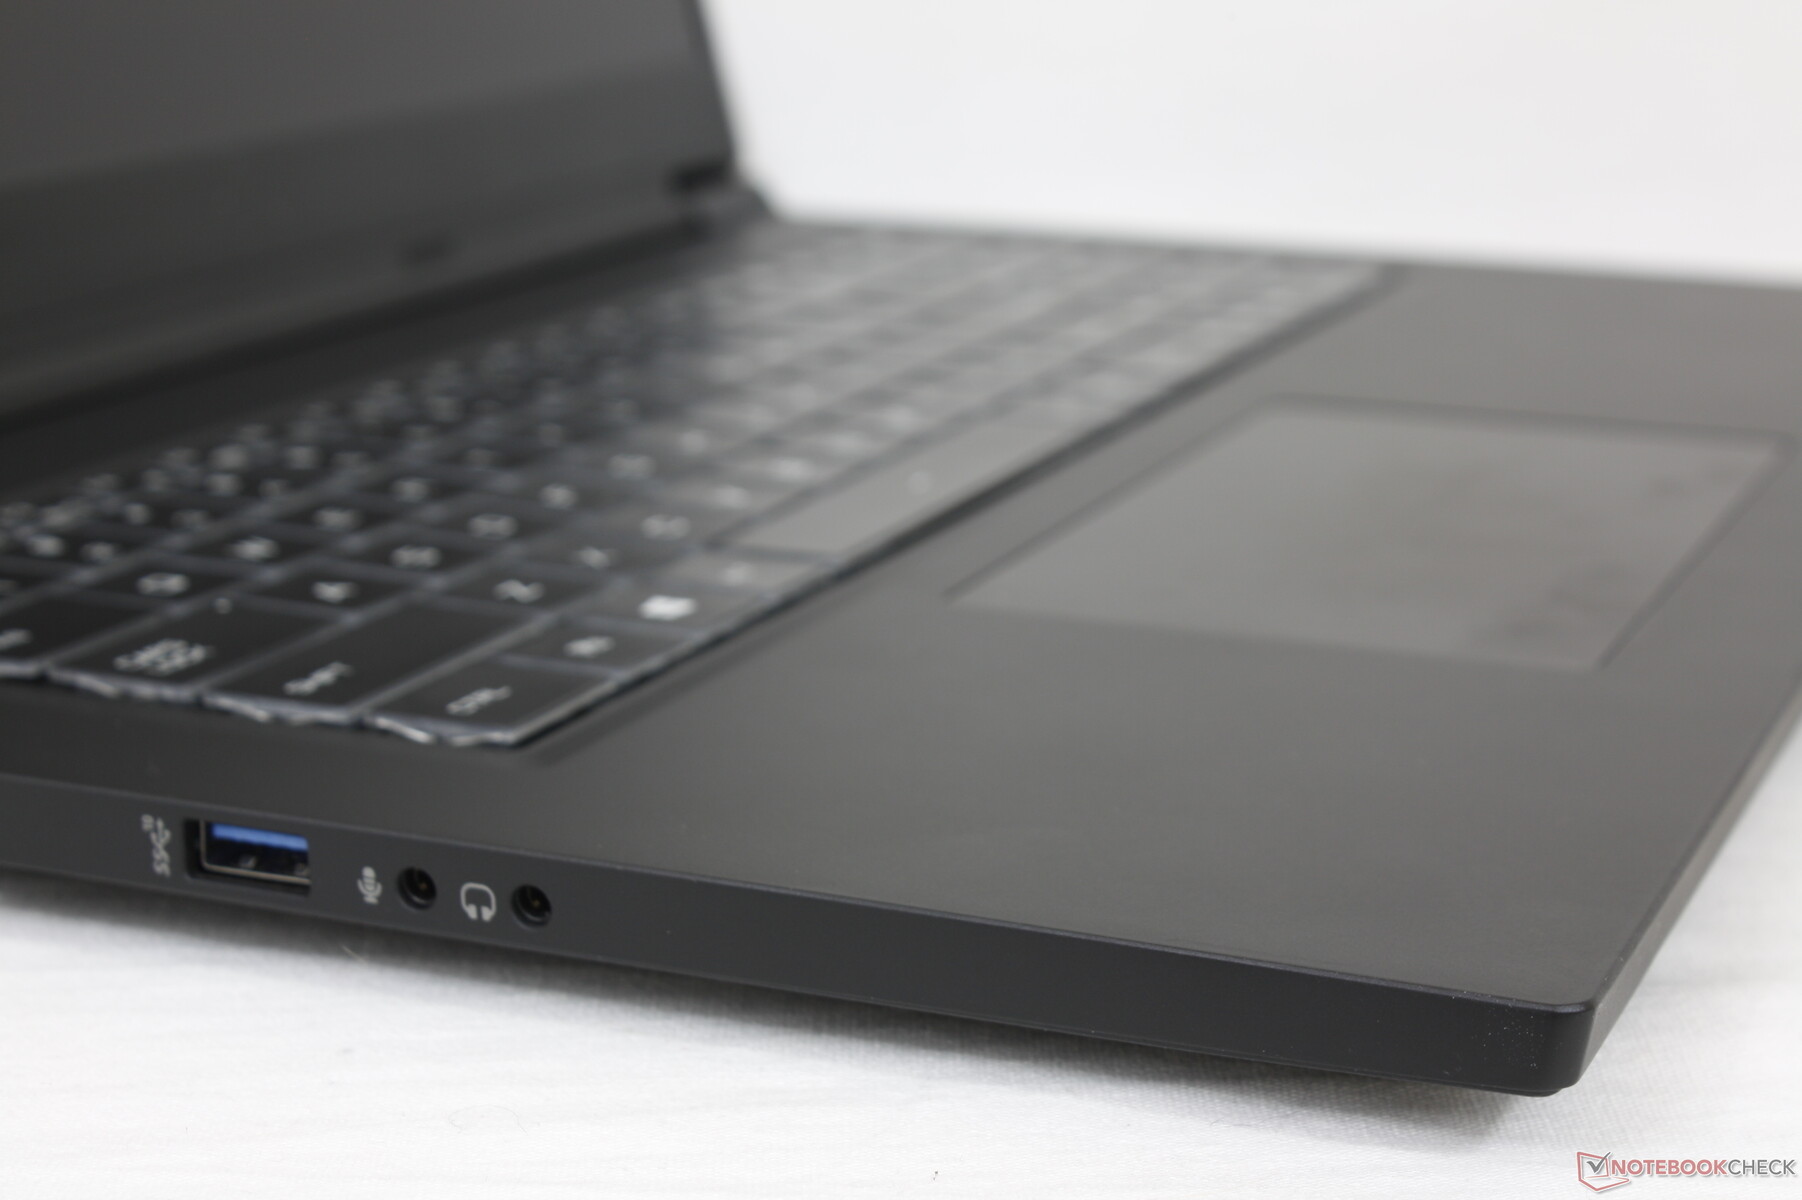
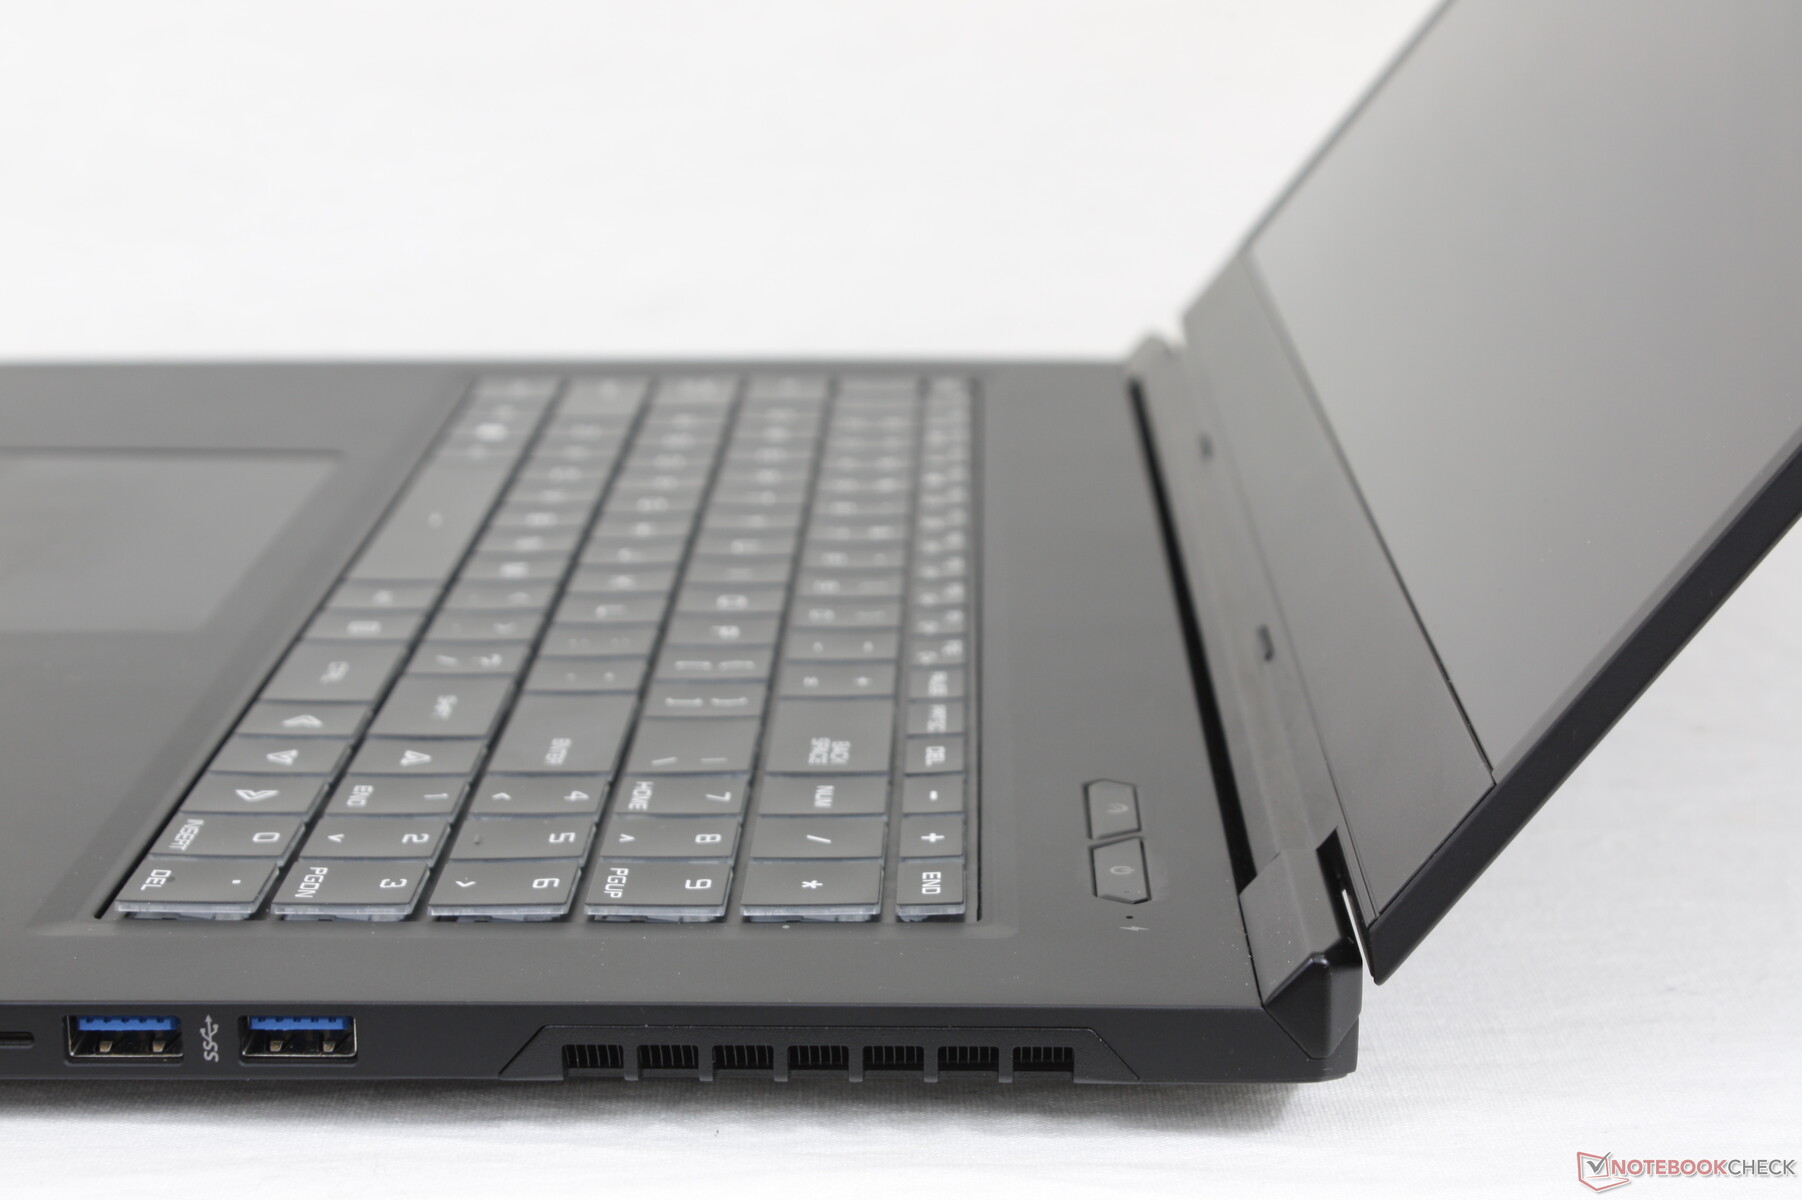
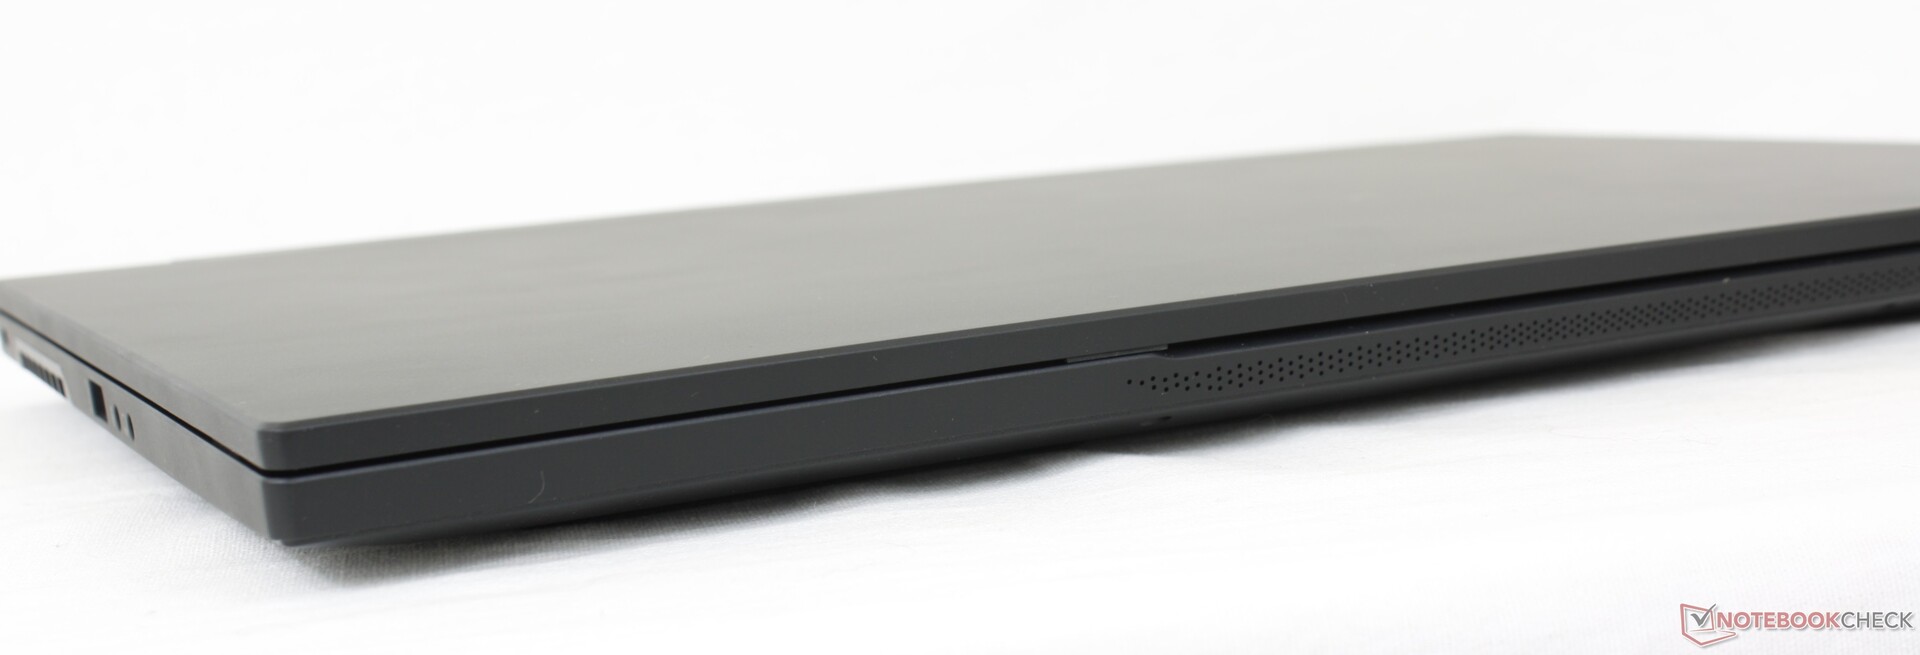
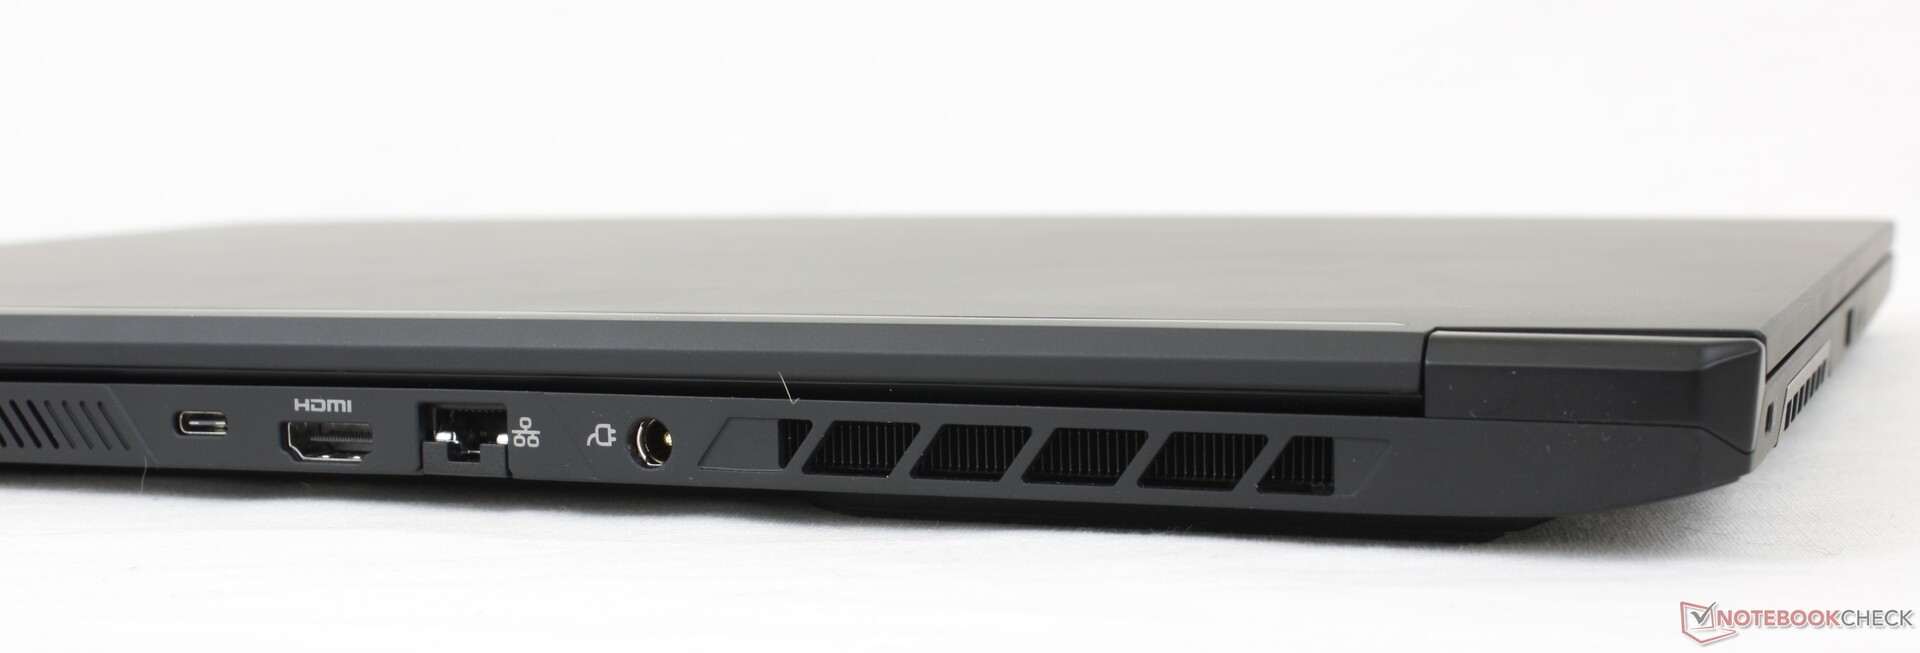
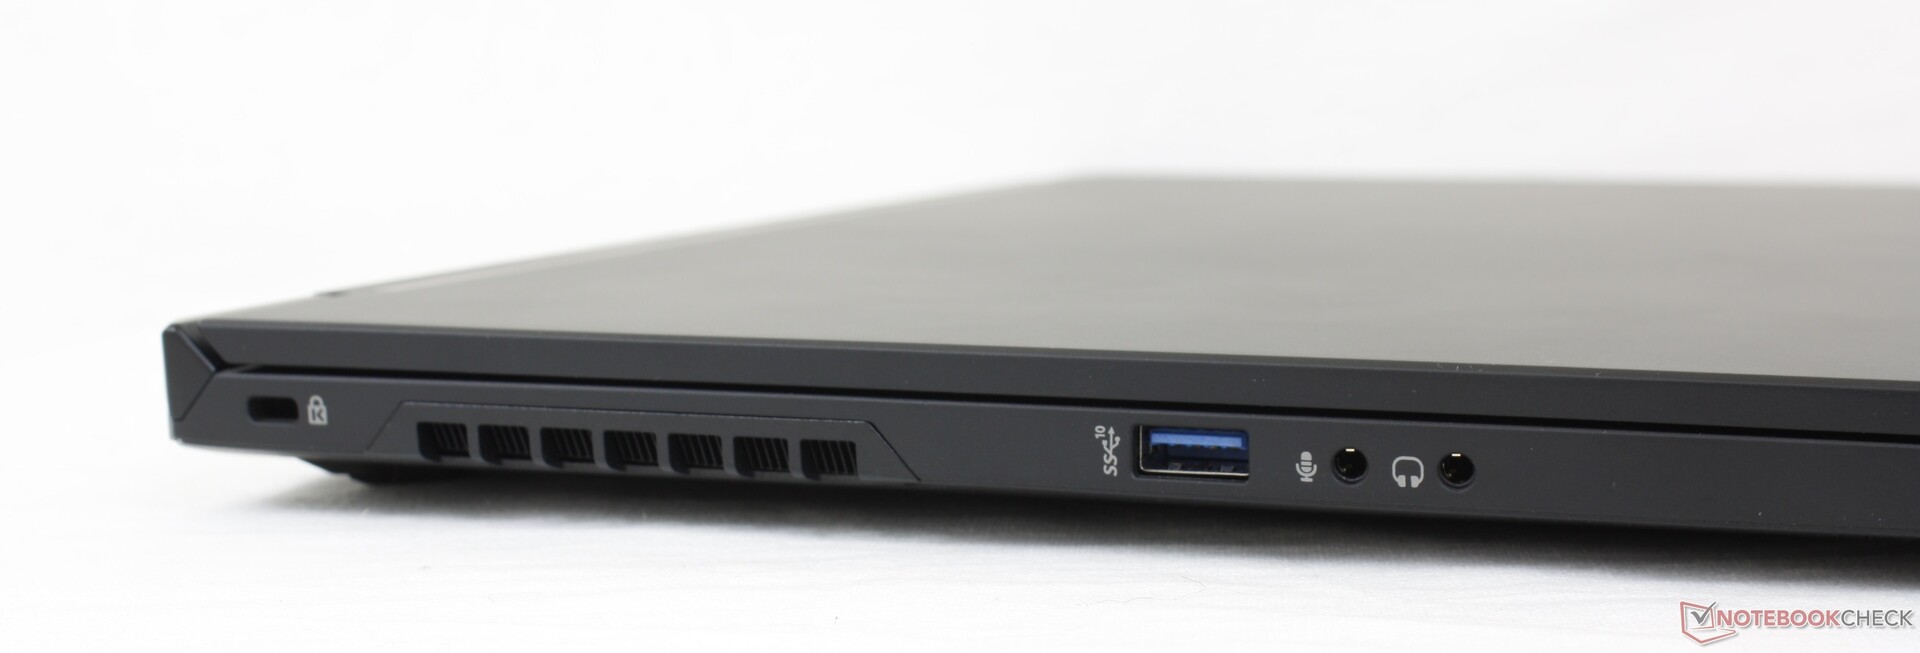
Connectivity — Thunderbolt 4... Sometimes
Port options are essentially identical to the Schenker XMG Neo 17 but with a couple of important differences. The GM7AG8P uses a smaller MicroSD card reader, for example, while Thunderbolt 4 and external G-Sync/Adaptive Sync compatibility will only be enabled when running in MSHybrid mode.
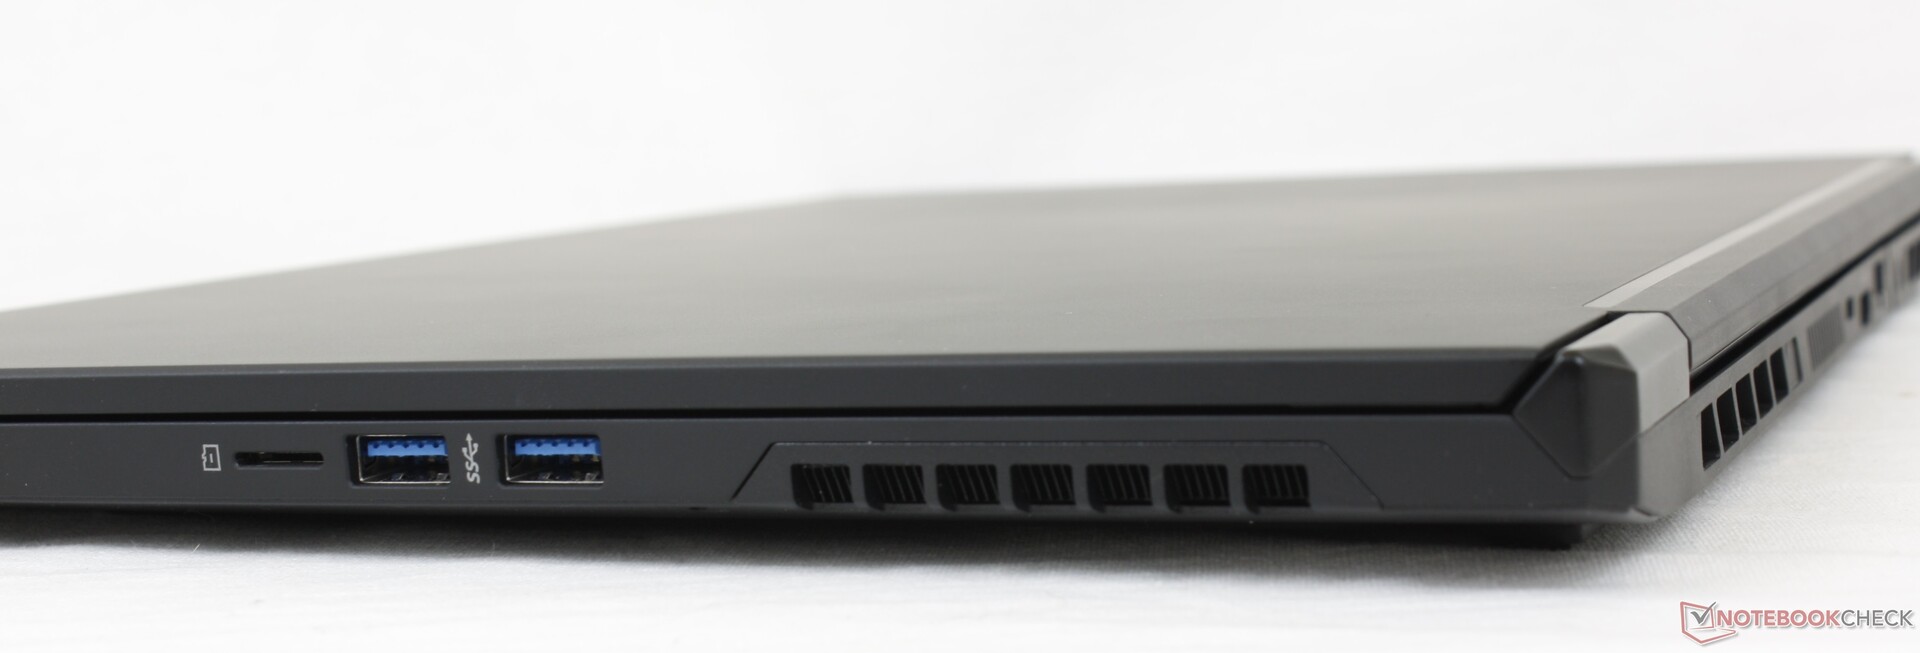
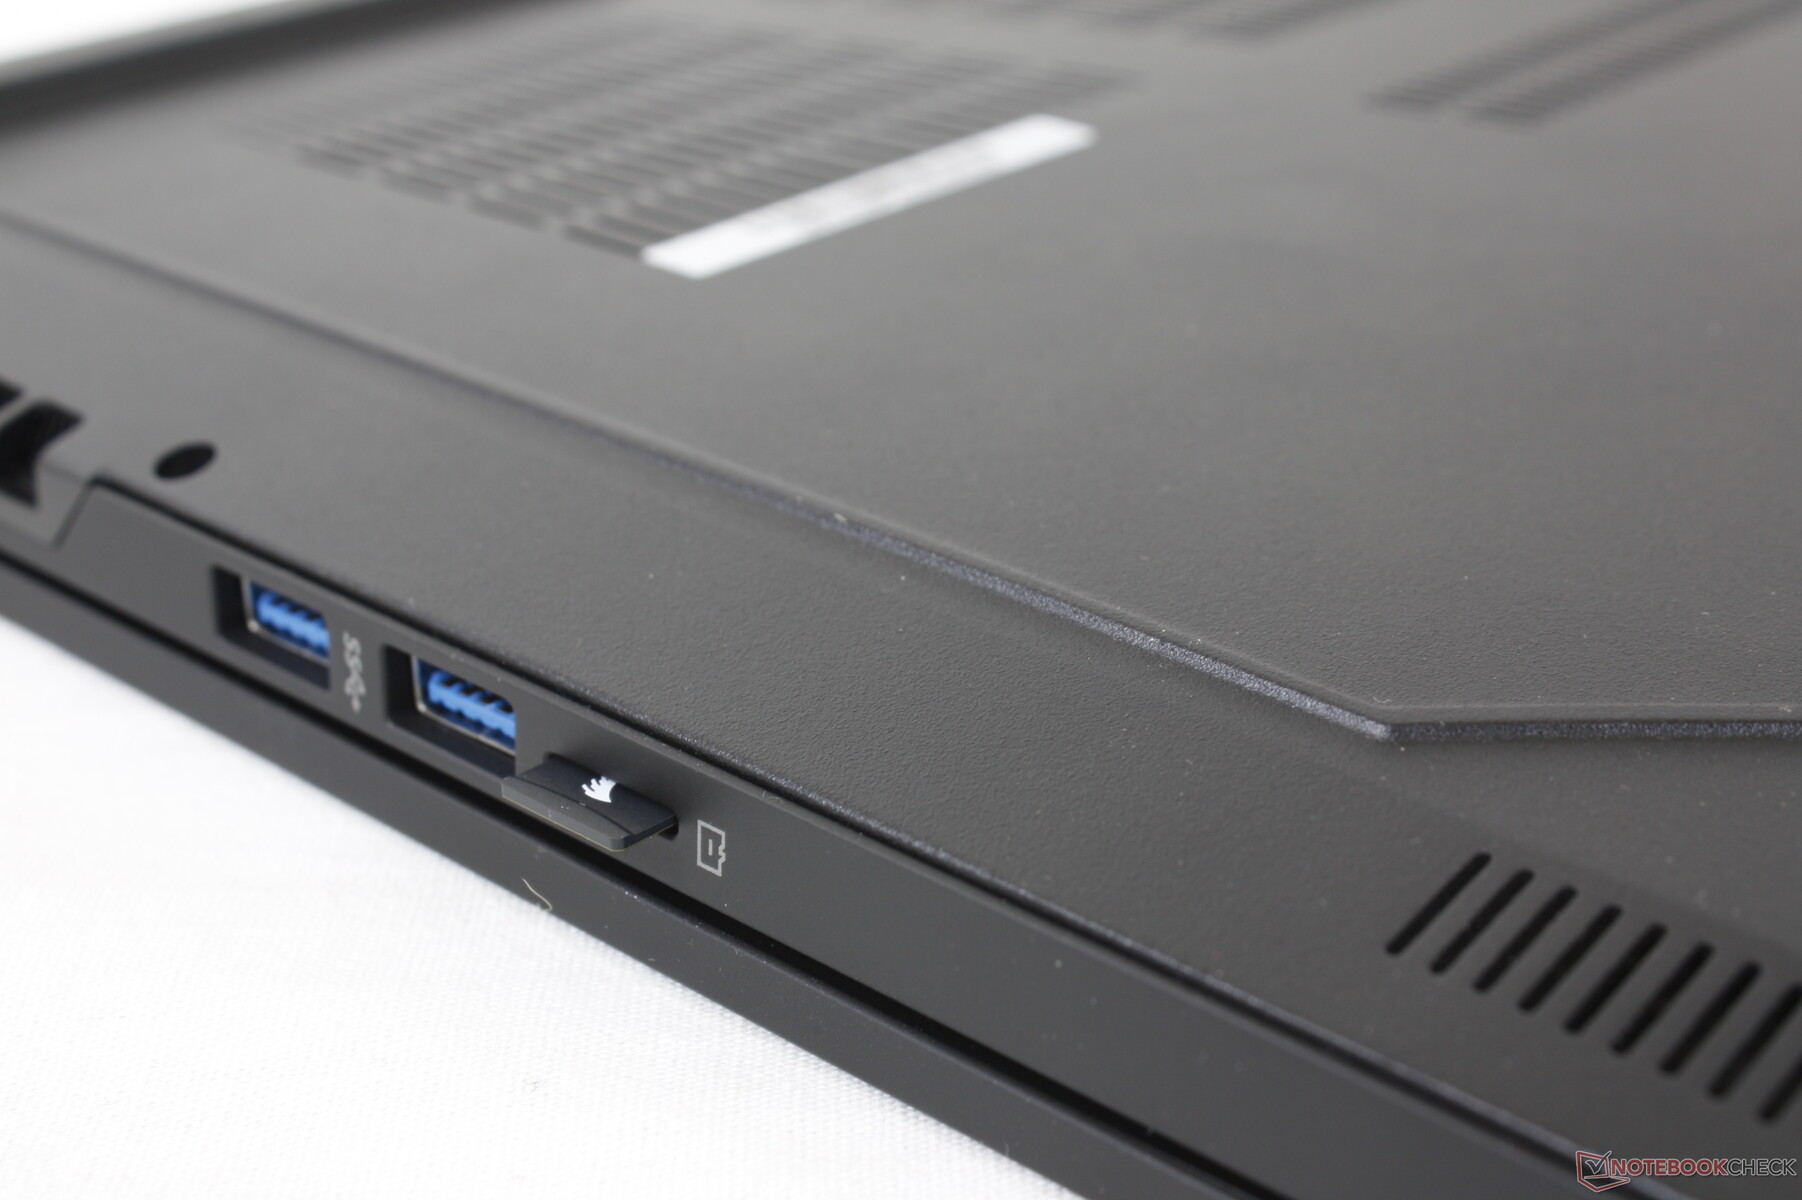
SD Card Reader — MicroSD Only
The system integrates a MicroSD reader despite the large 17.3-inch form factor. Additionally, unlike most other MicroSD readers, the one on the GM7AG8P is not spring-loaded and a fully inserted card must also be inserted upside-down. Transfer rates are average as it takes around 15 seconds to move 1 GB of images from our UHS-II test card compared to half that on the latest Razer Blade 17.
| SD Card Reader | |
| average JPG Copy Test (av. of 3 runs) | |
| Razer Blade 17 RTX 3070 (AV Pro V60) | |
| MSI GS76 Stealth 11UH (AV PRO microSD 128 GB V60) | |
| Alienware x17 RTX 3080 P48E (AV Pro V60) | |
| Maingear Vector Pro MG-VCP17 (AV Pro V60) | |
| Schenker XMG NEO 17 GM7TG8S | |
| Schenker Uniwill Technology GM7AG8P (AV Pro V60) | |
| maximum AS SSD Seq Read Test (1GB) | |
| Alienware x17 RTX 3080 P48E (AV Pro V60) | |
| MSI GS76 Stealth 11UH (AV PRO microSD 128 GB V60) | |
| Razer Blade 17 RTX 3070 (AV Pro V60) | |
| Schenker XMG NEO 17 GM7TG8S | |
| Maingear Vector Pro MG-VCP17 (AV Pro V60) | |
| Schenker Uniwill Technology GM7AG8P (AV Pro V60) | |
Communication
Webcam
Camera quality is poor despite the 2 MP sensor. Images are grainier than expected even by the already low laptop webcam standards.
IR is built-in for Windows Hello support.


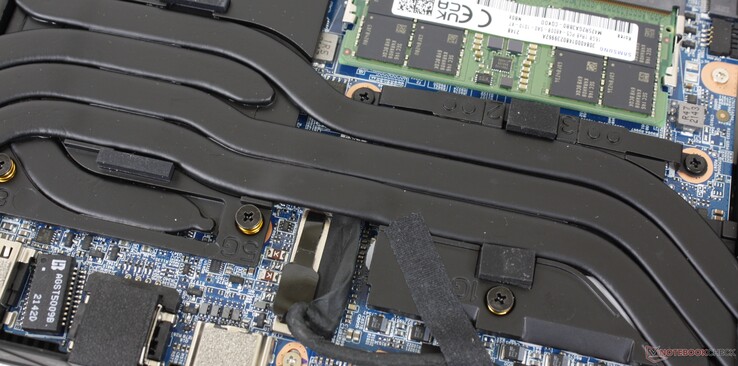
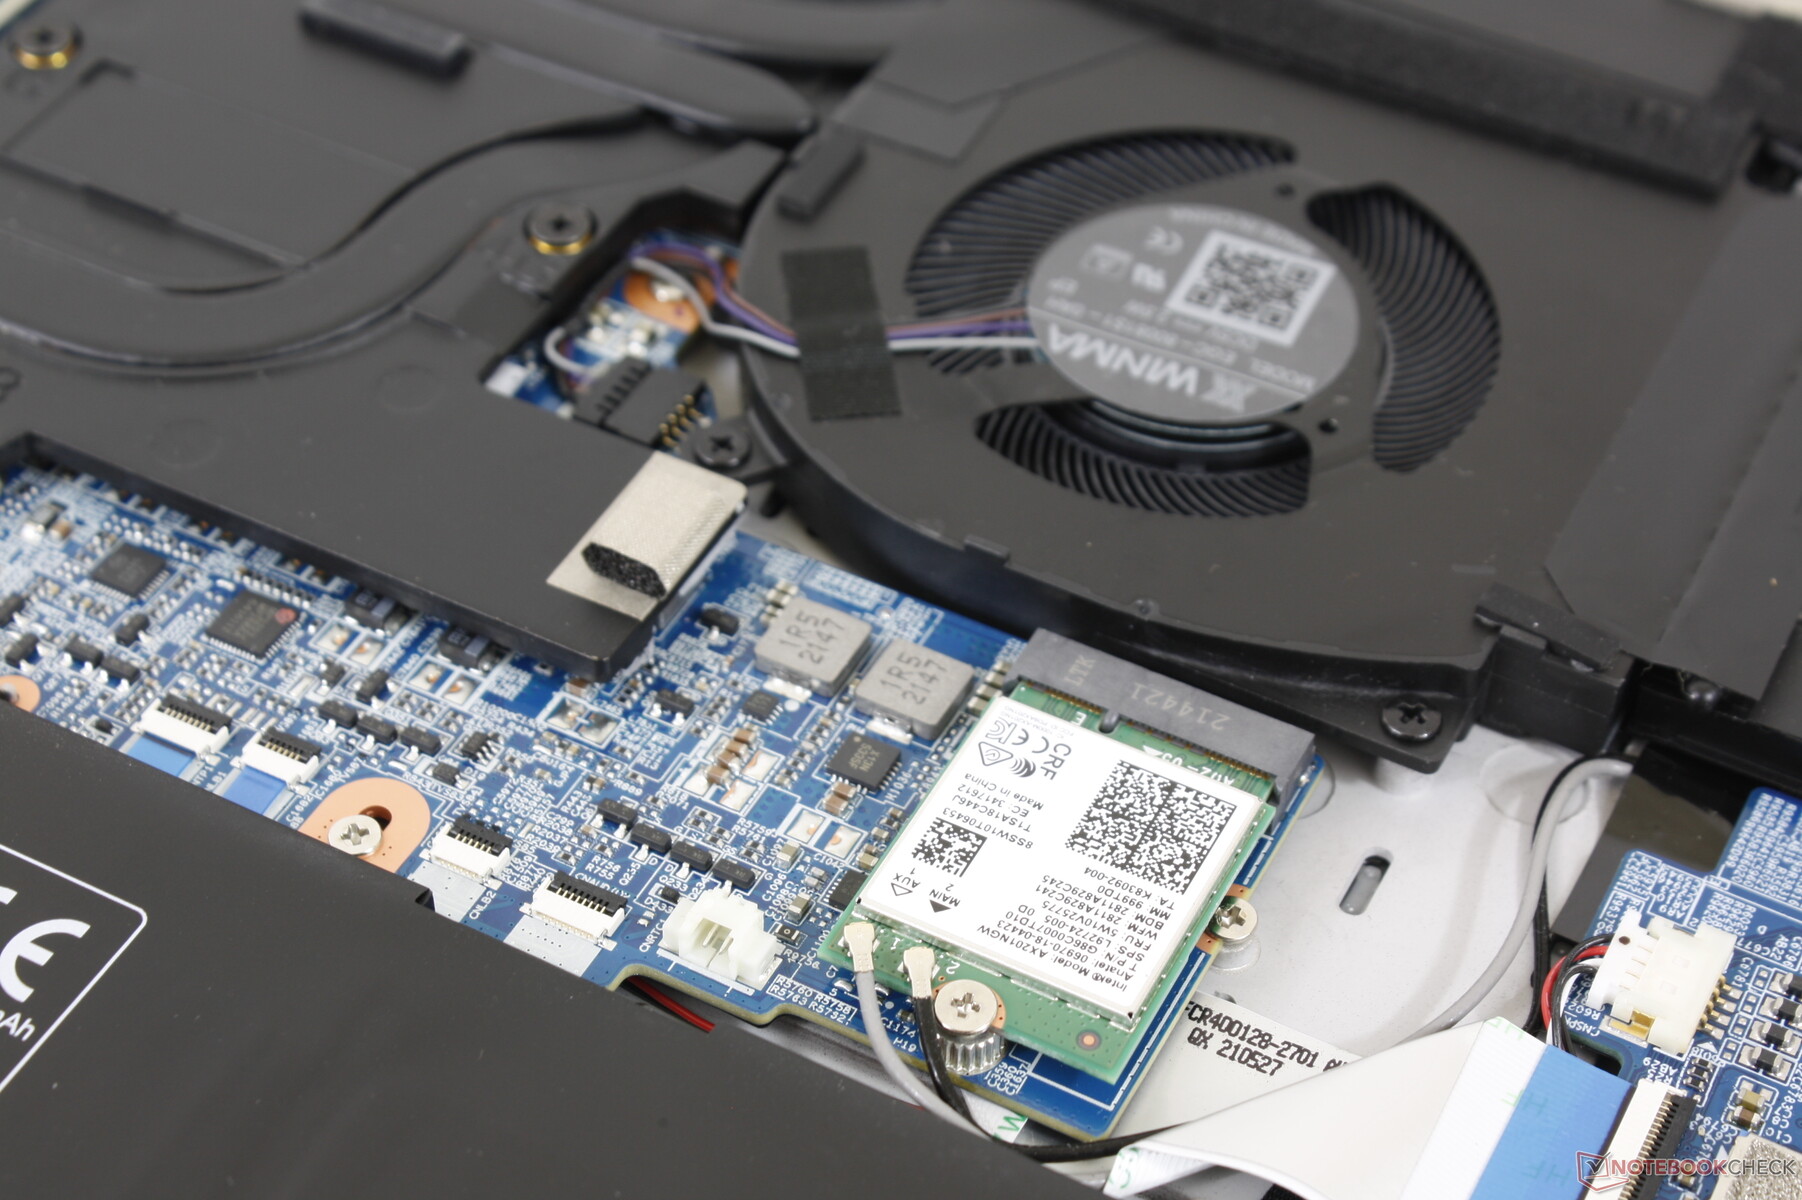
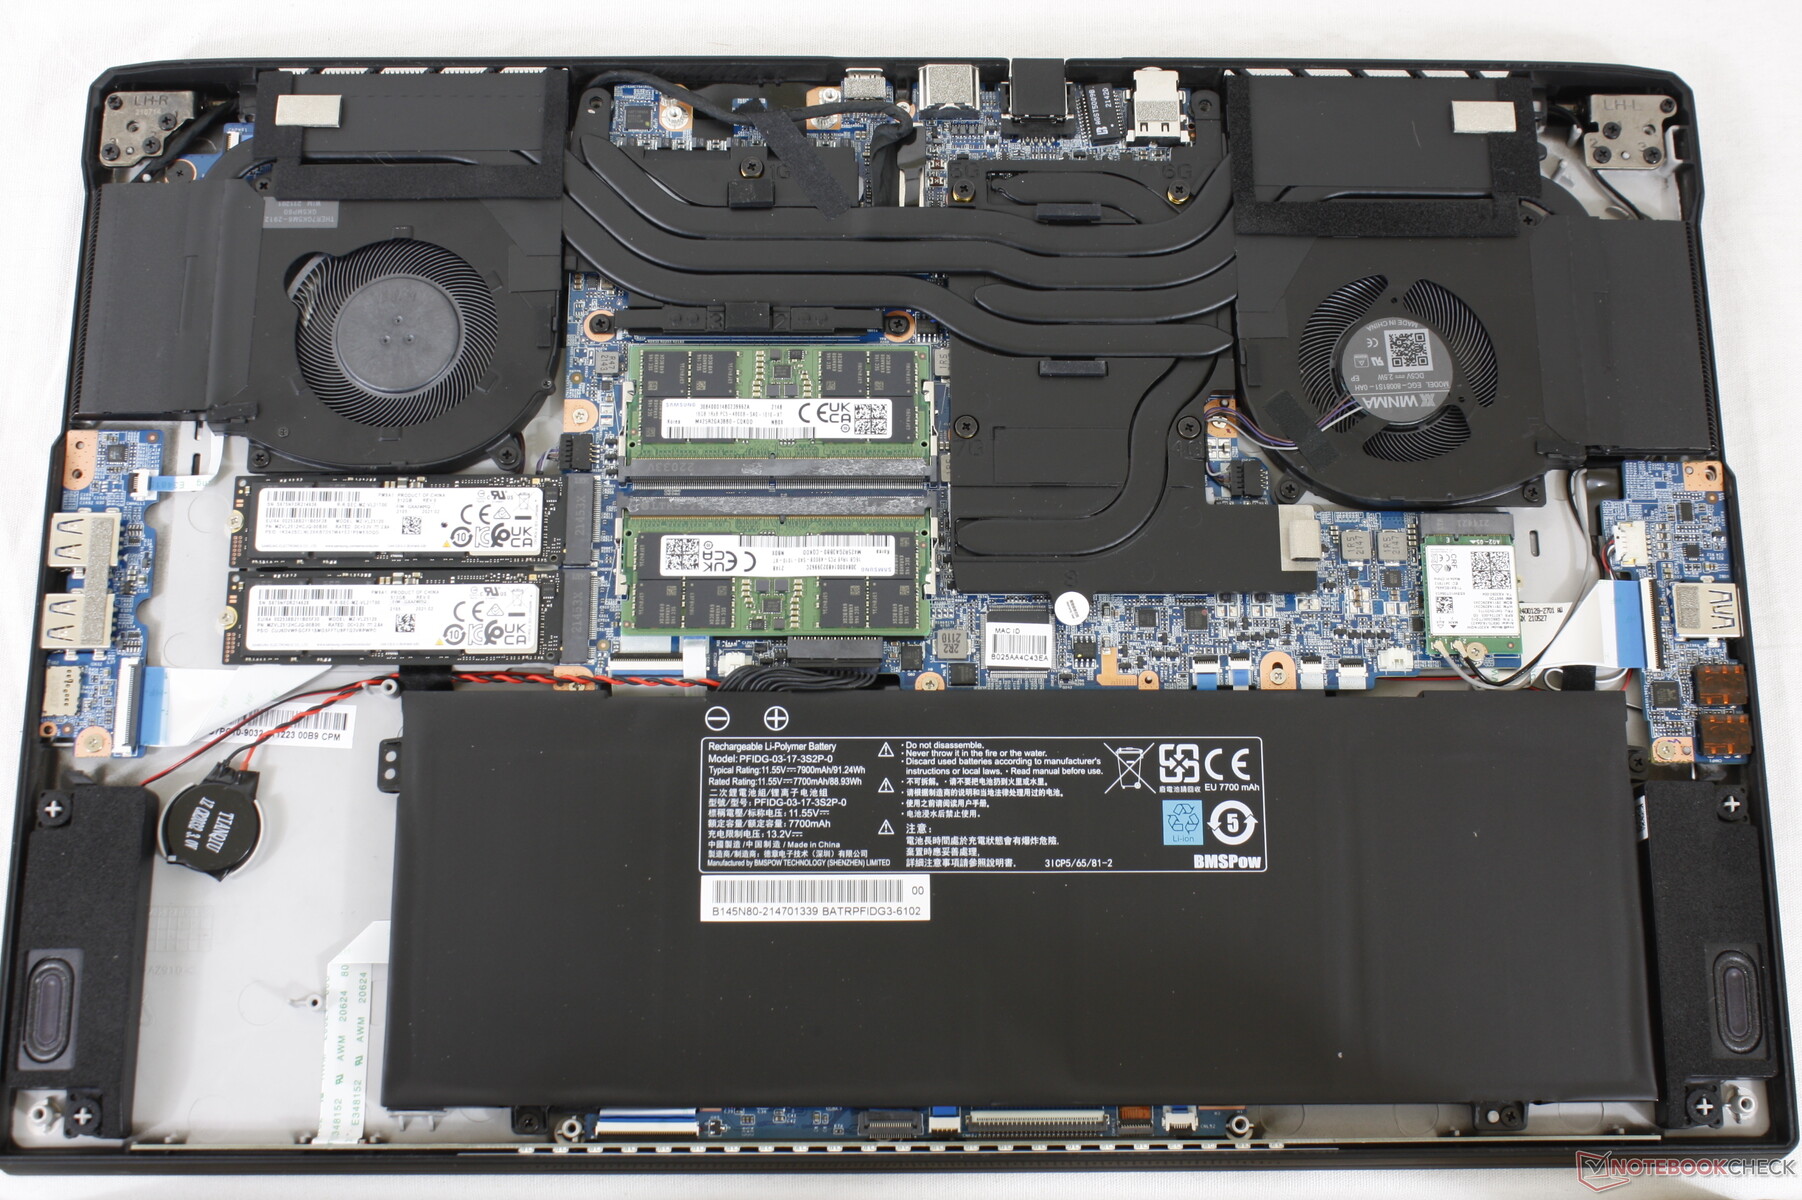
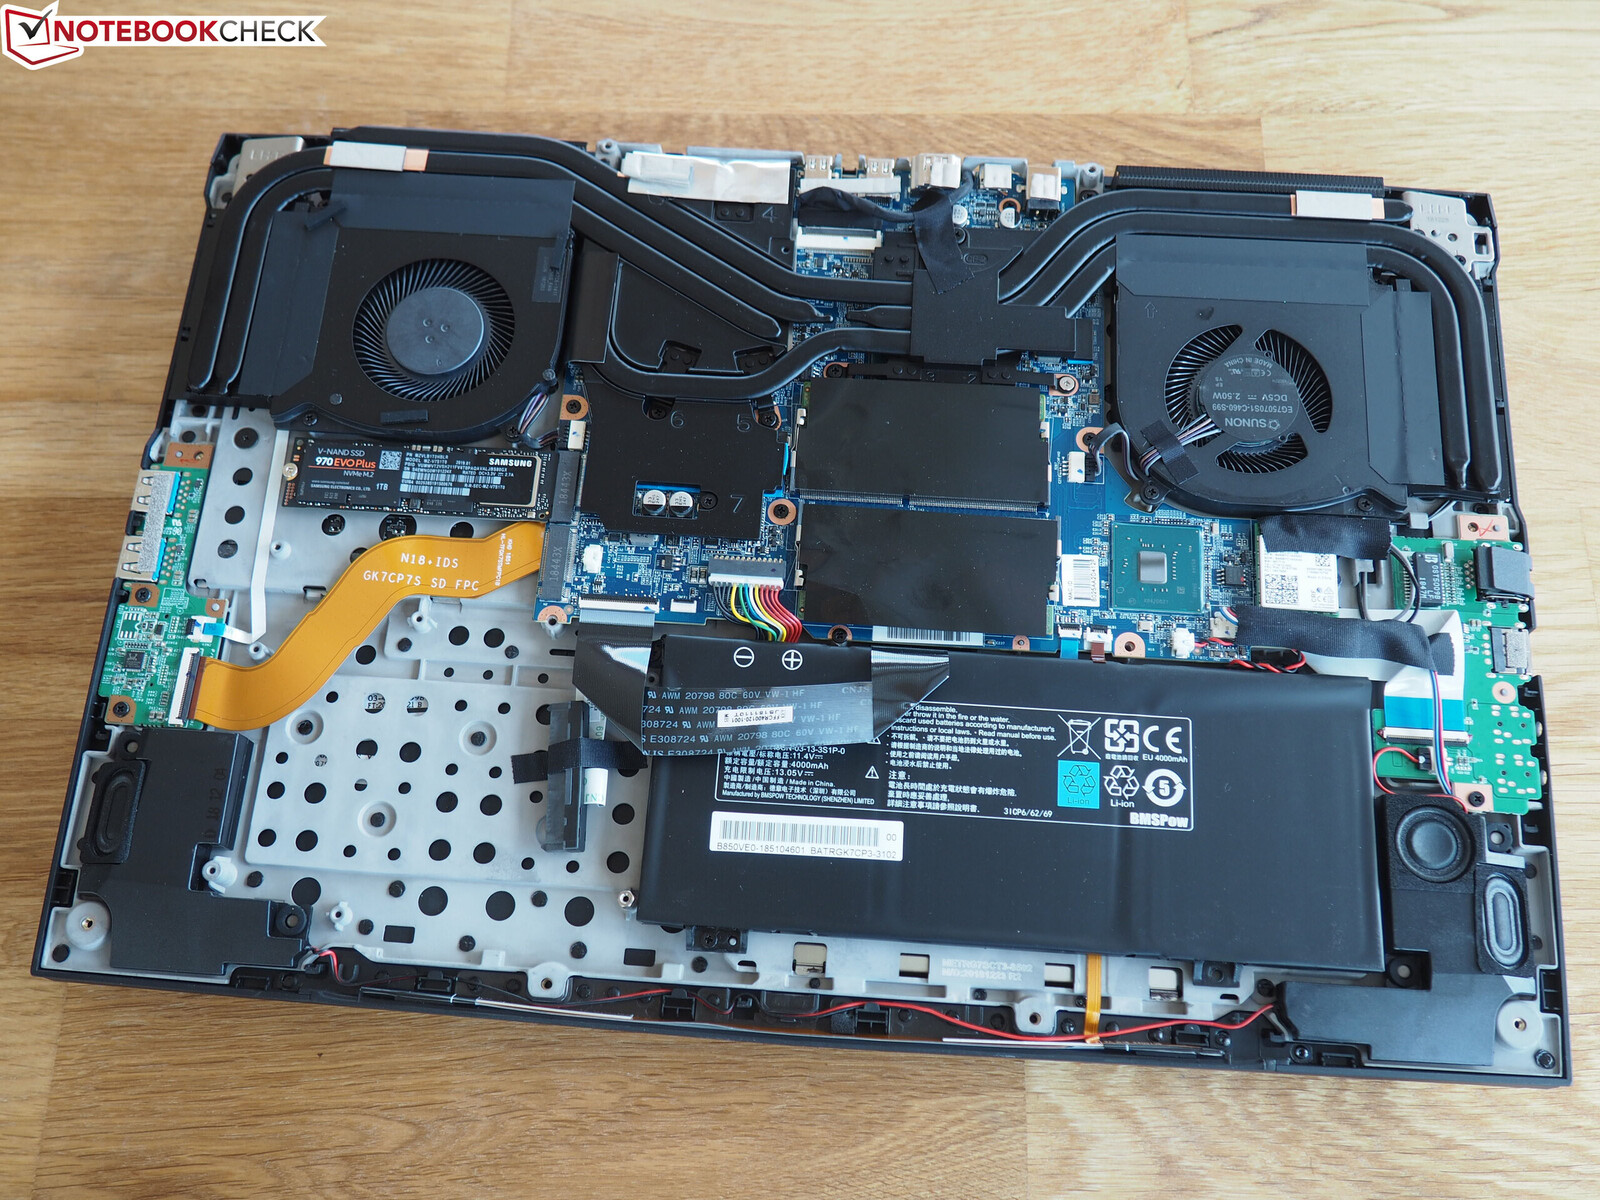
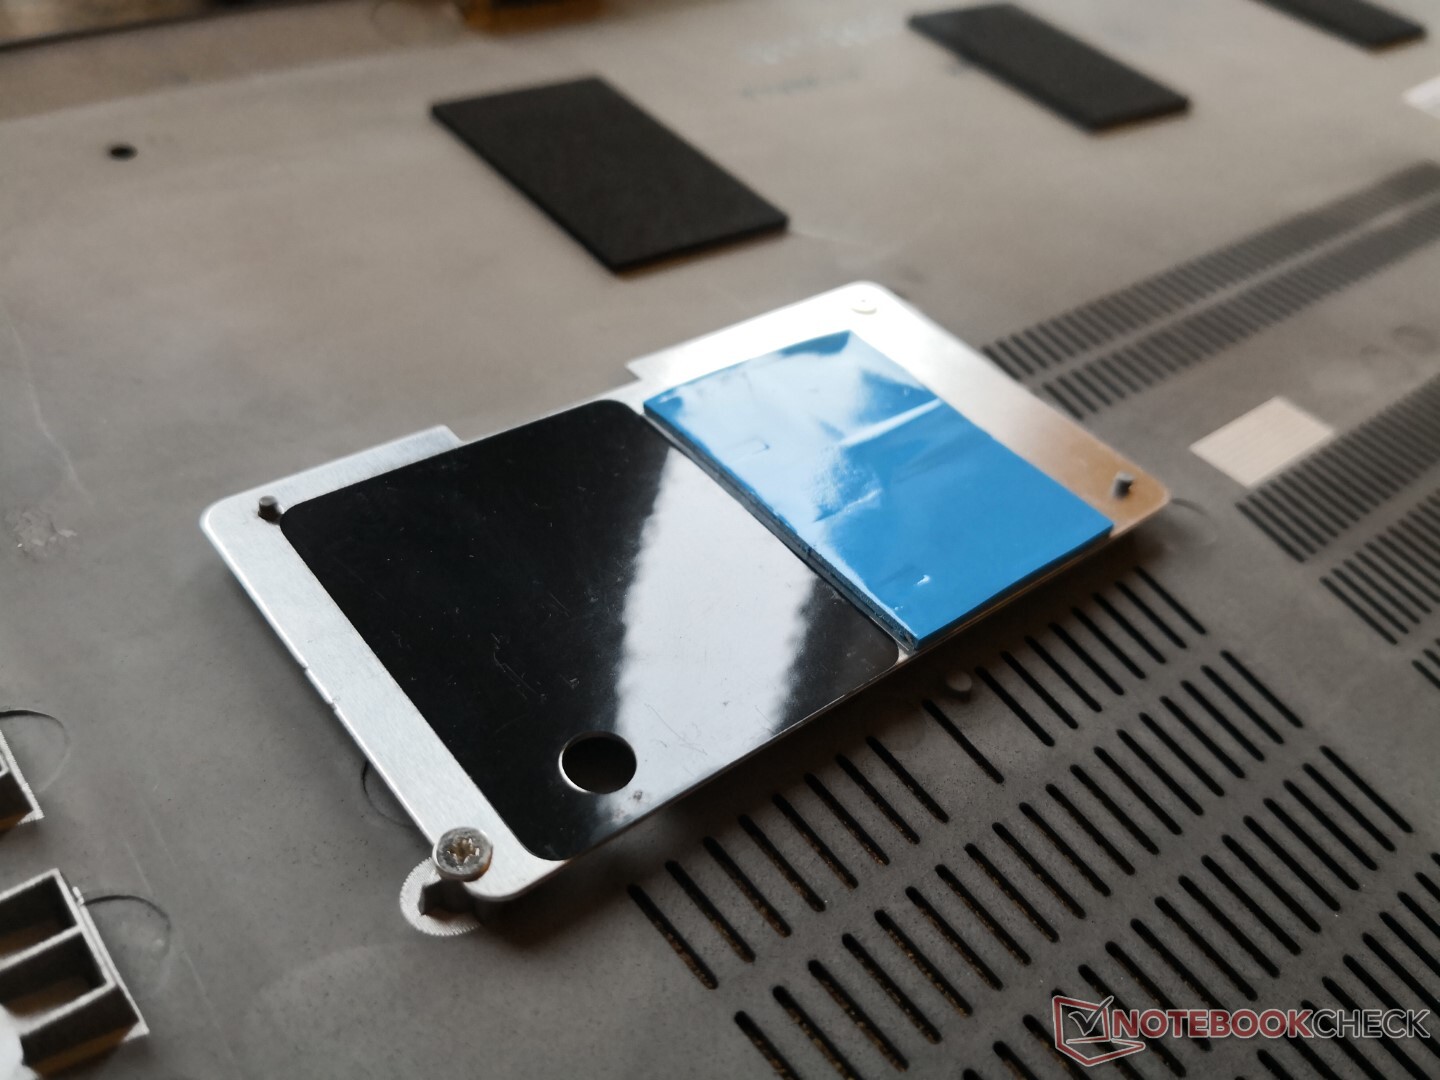
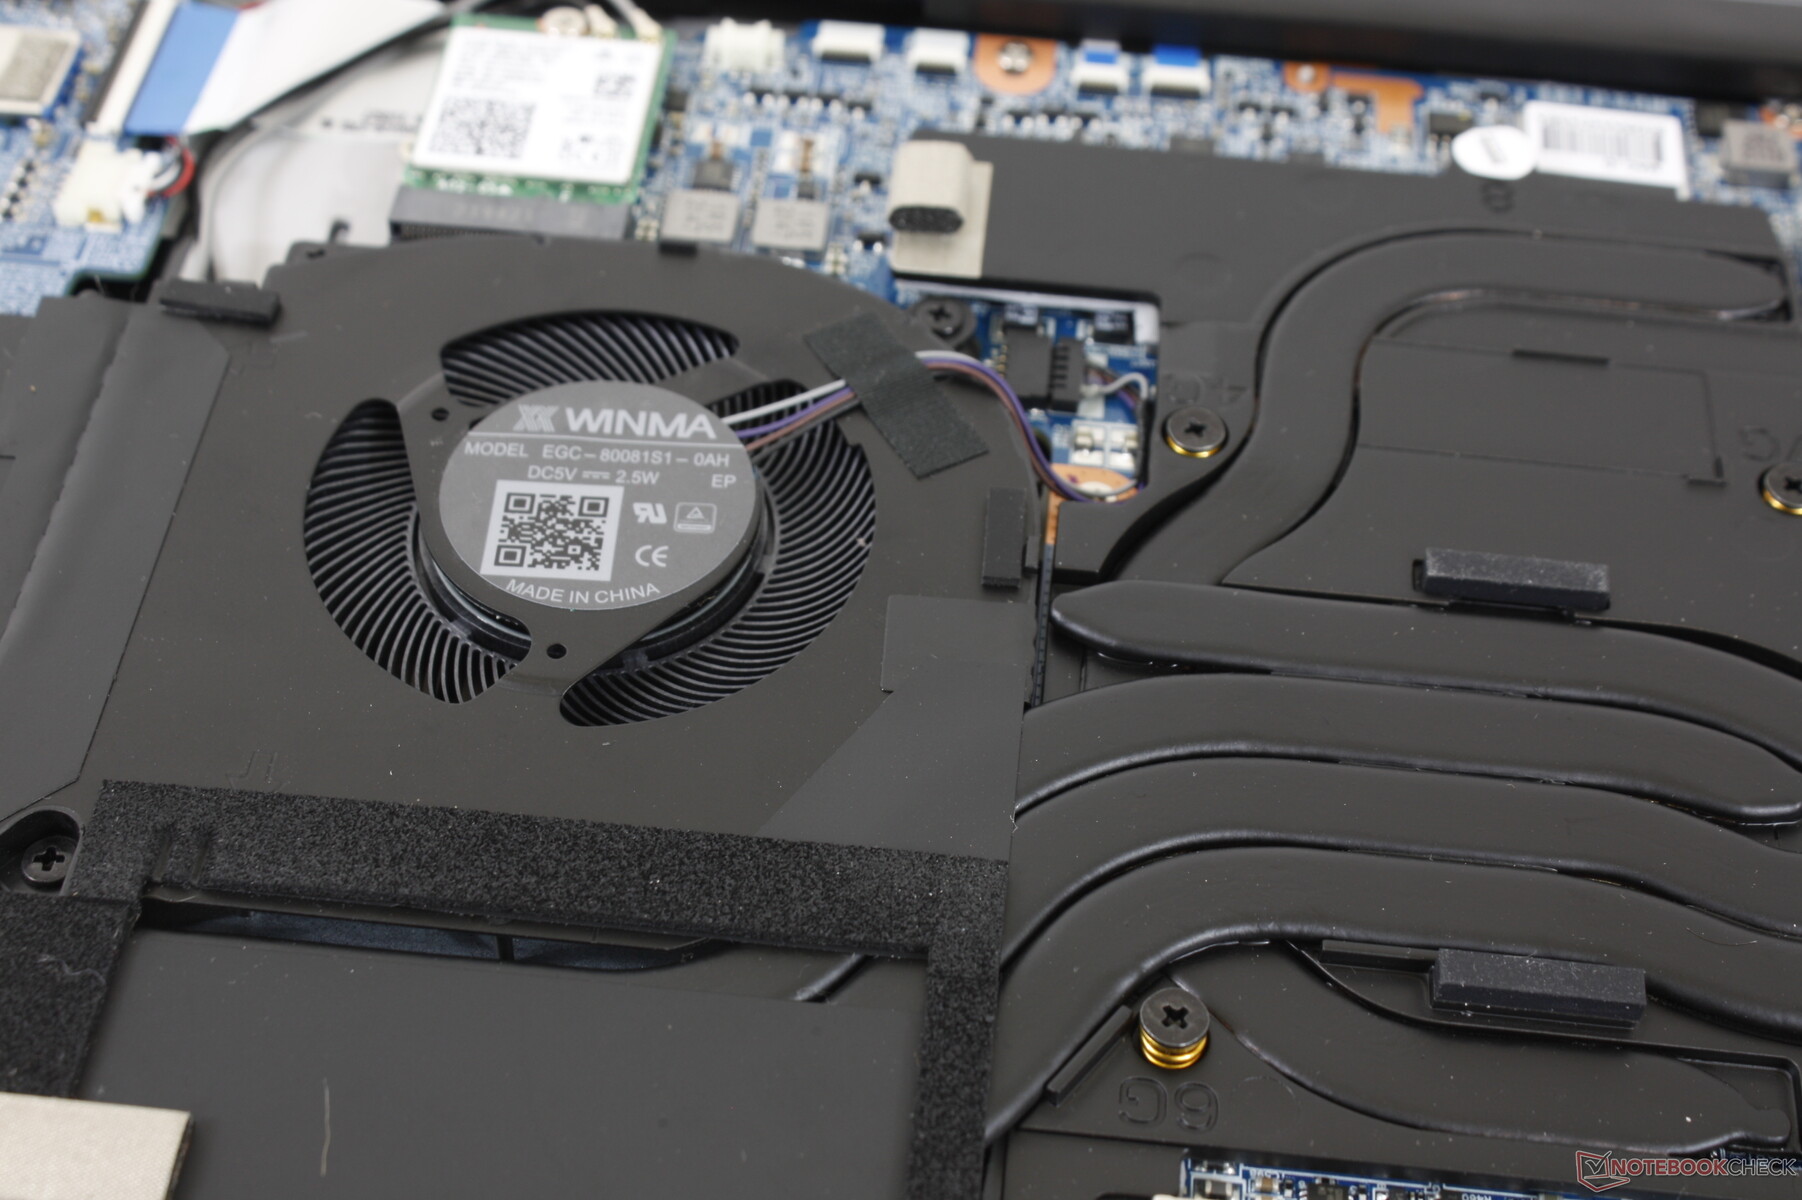
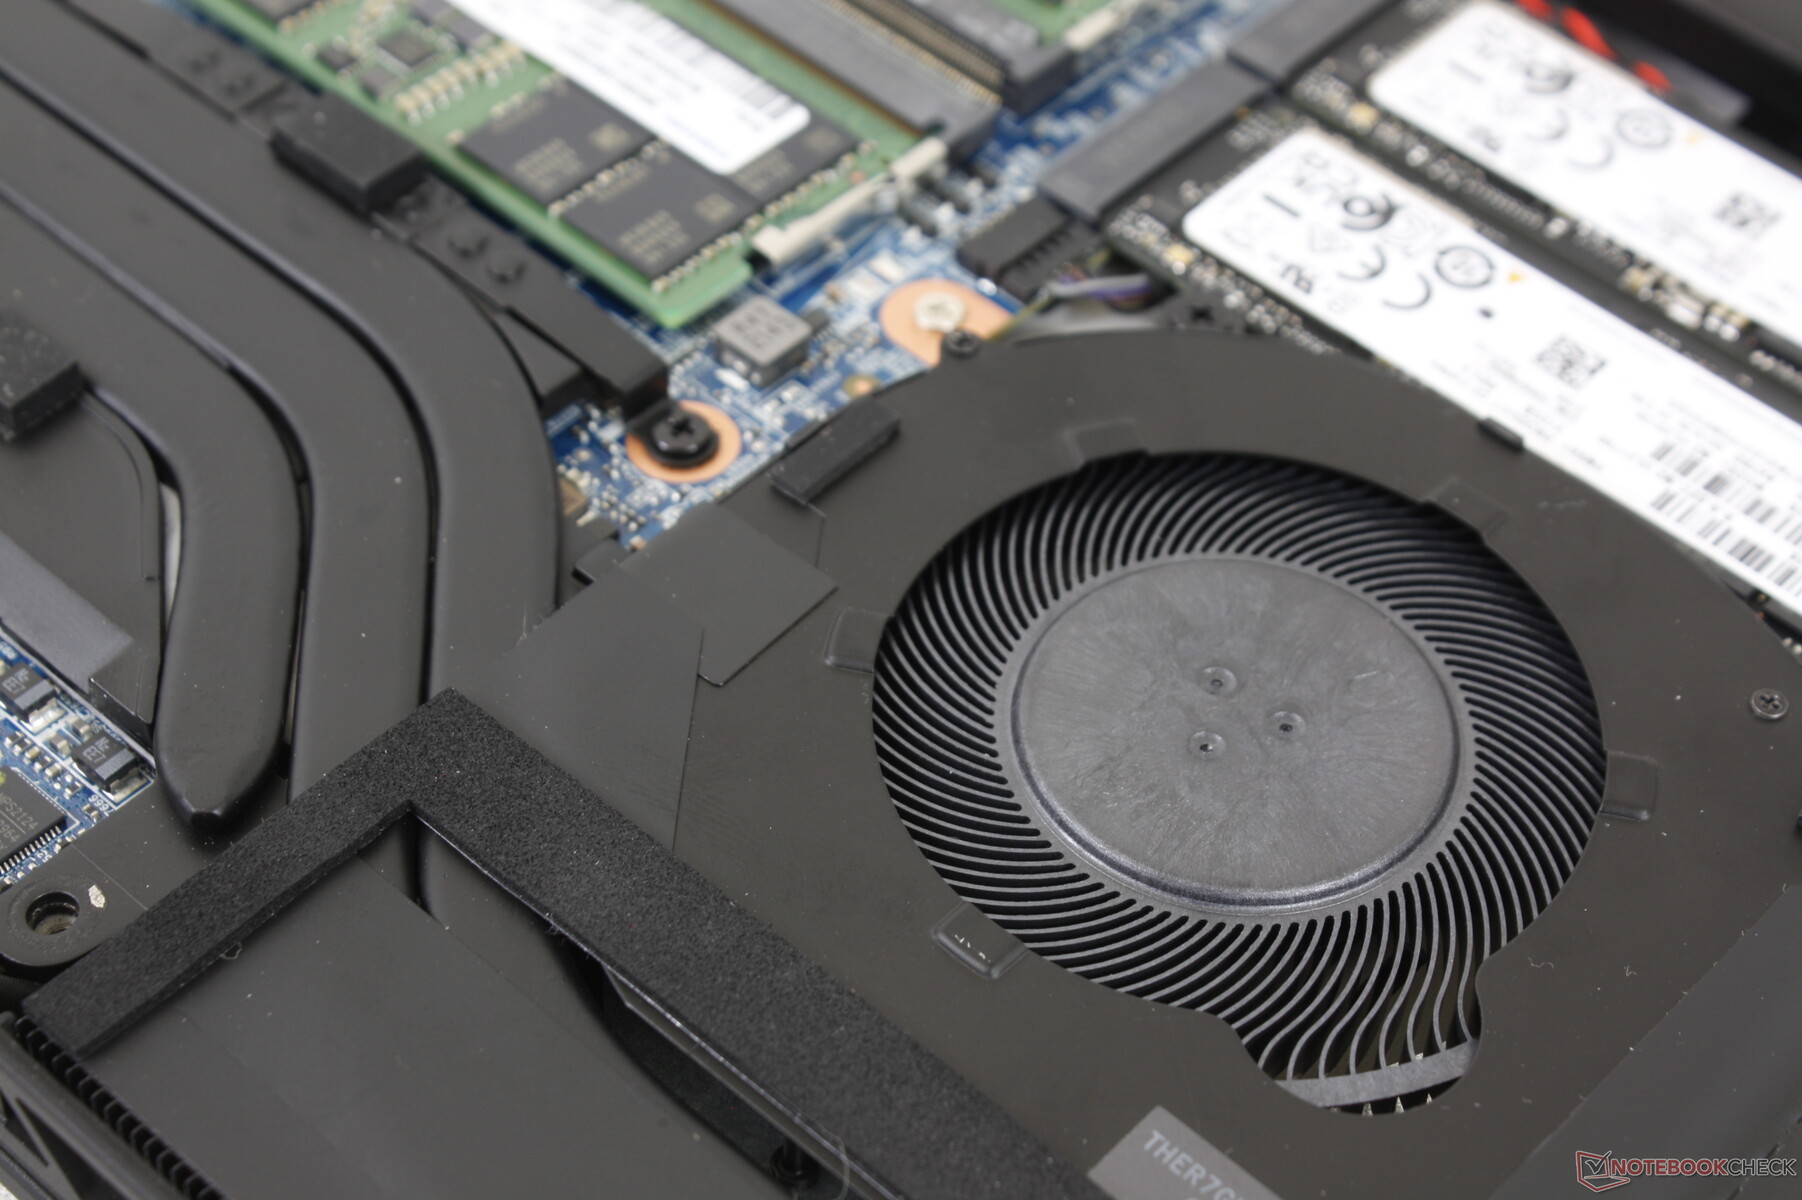
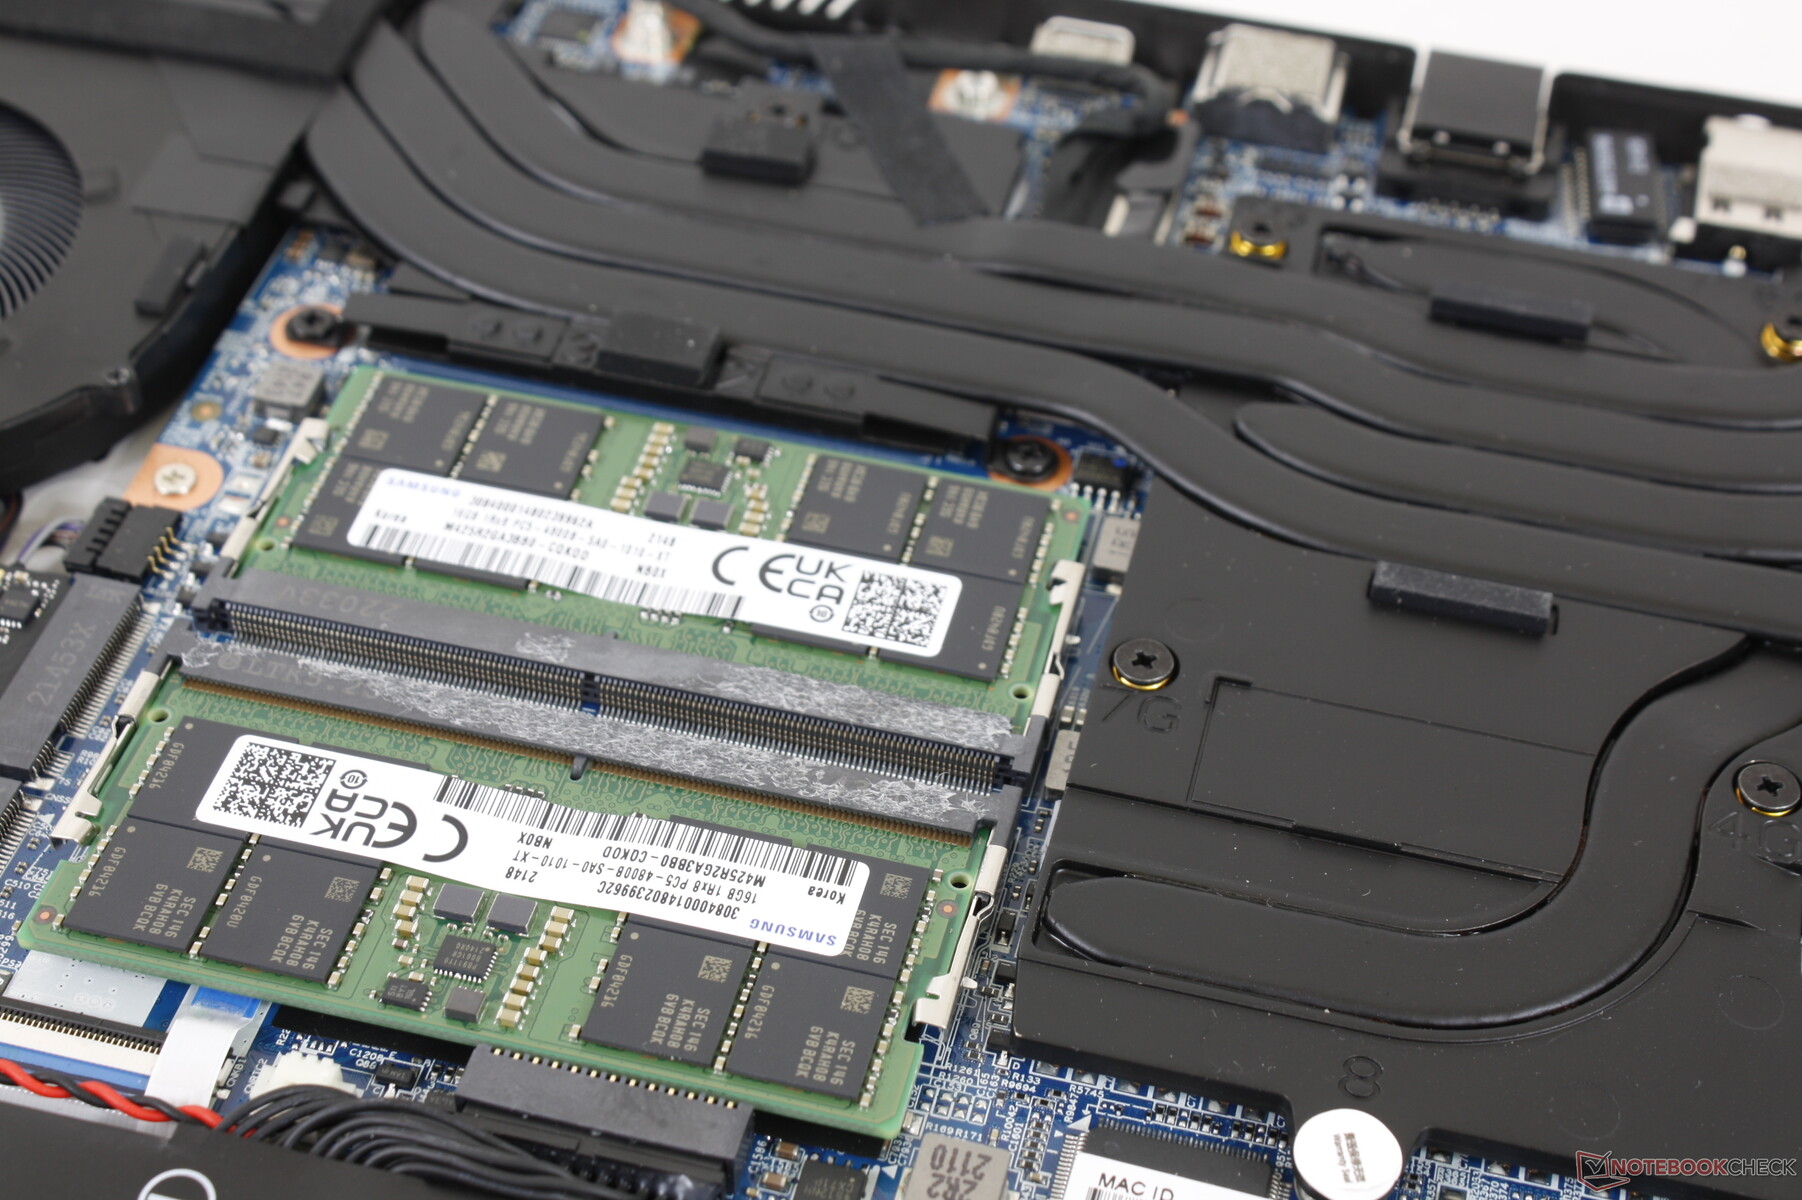
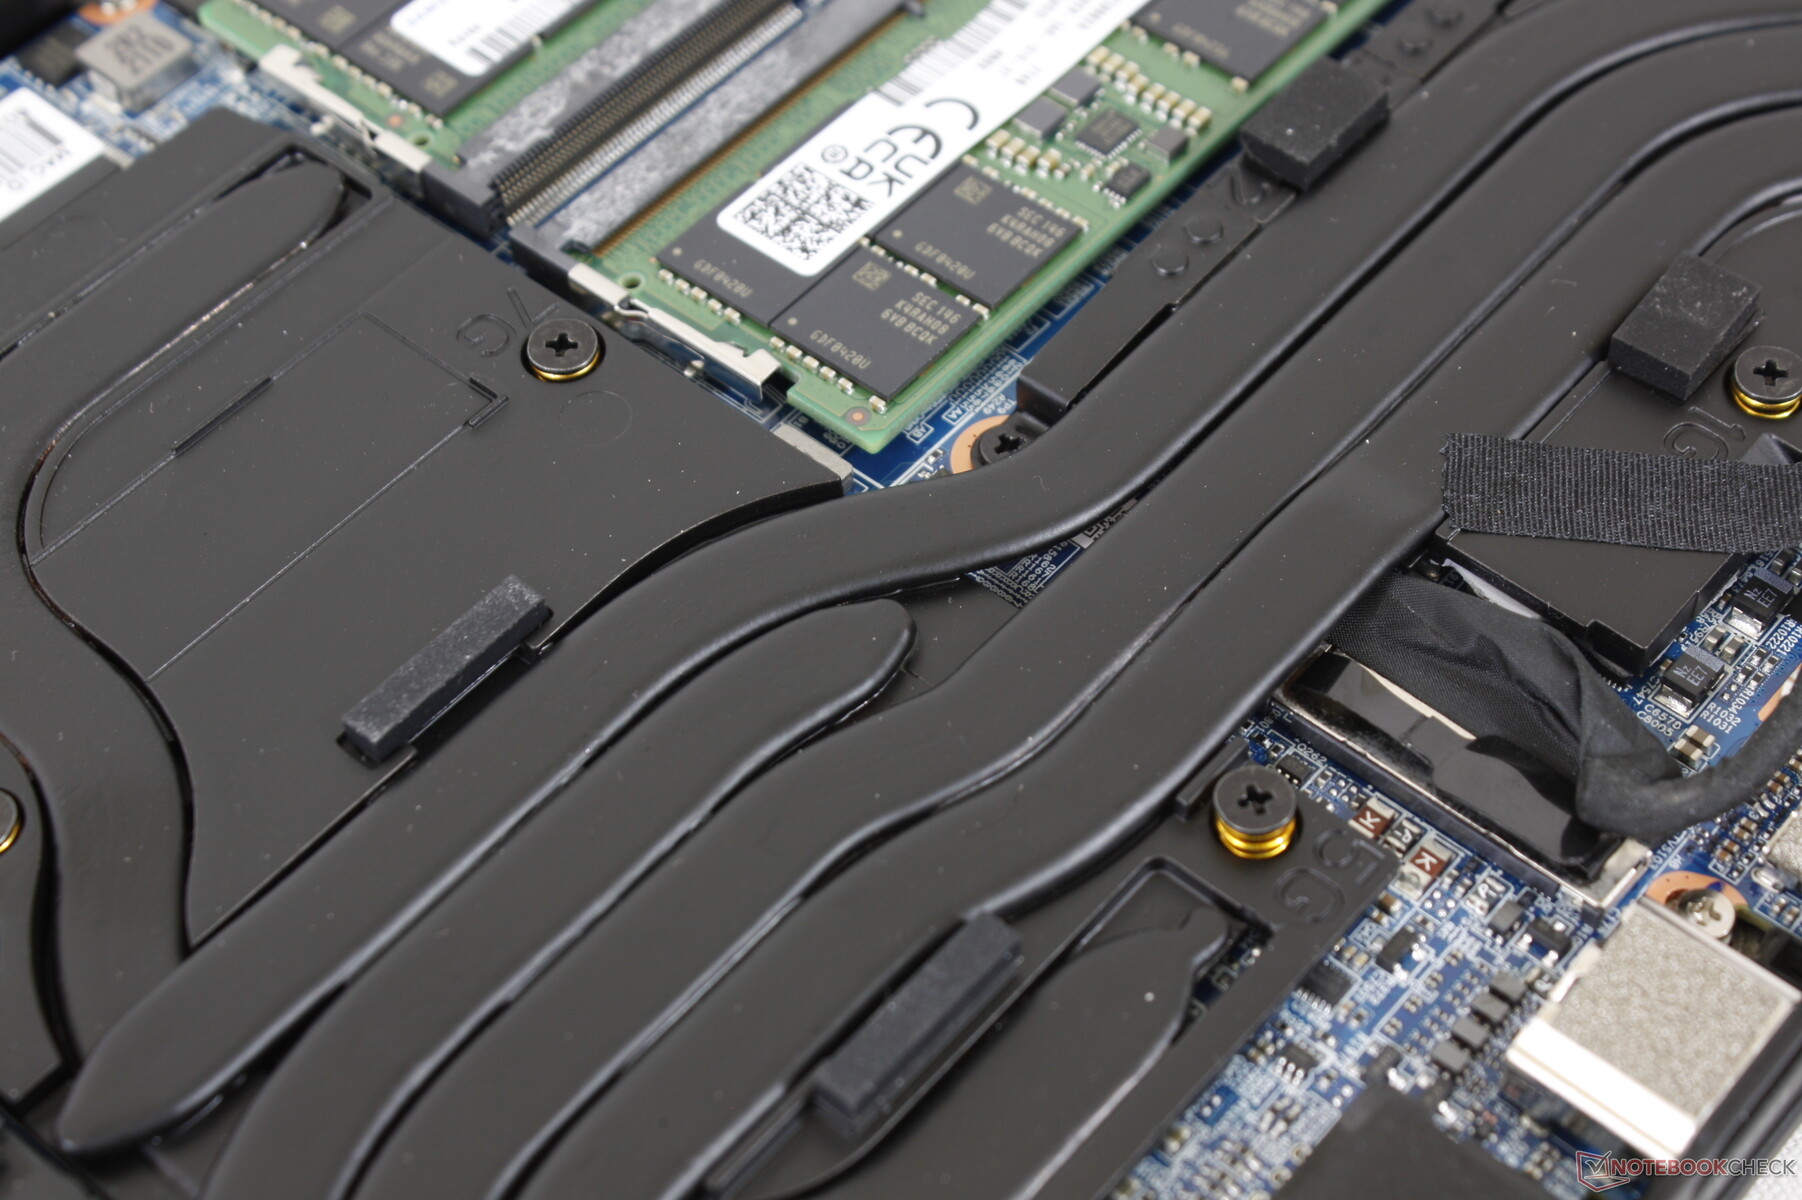
Maintenance
The bottom panel is secured by 10 Philips screws for easy servicing. Users have direct access to both M.2 2280 storage bays, both SODIMM slots, the main batteries, and the WLAN module.
Accessories and Warranty
There are no extras in the box other than the AC adapter and paperwork. XMG offers two-year warranty as standard.
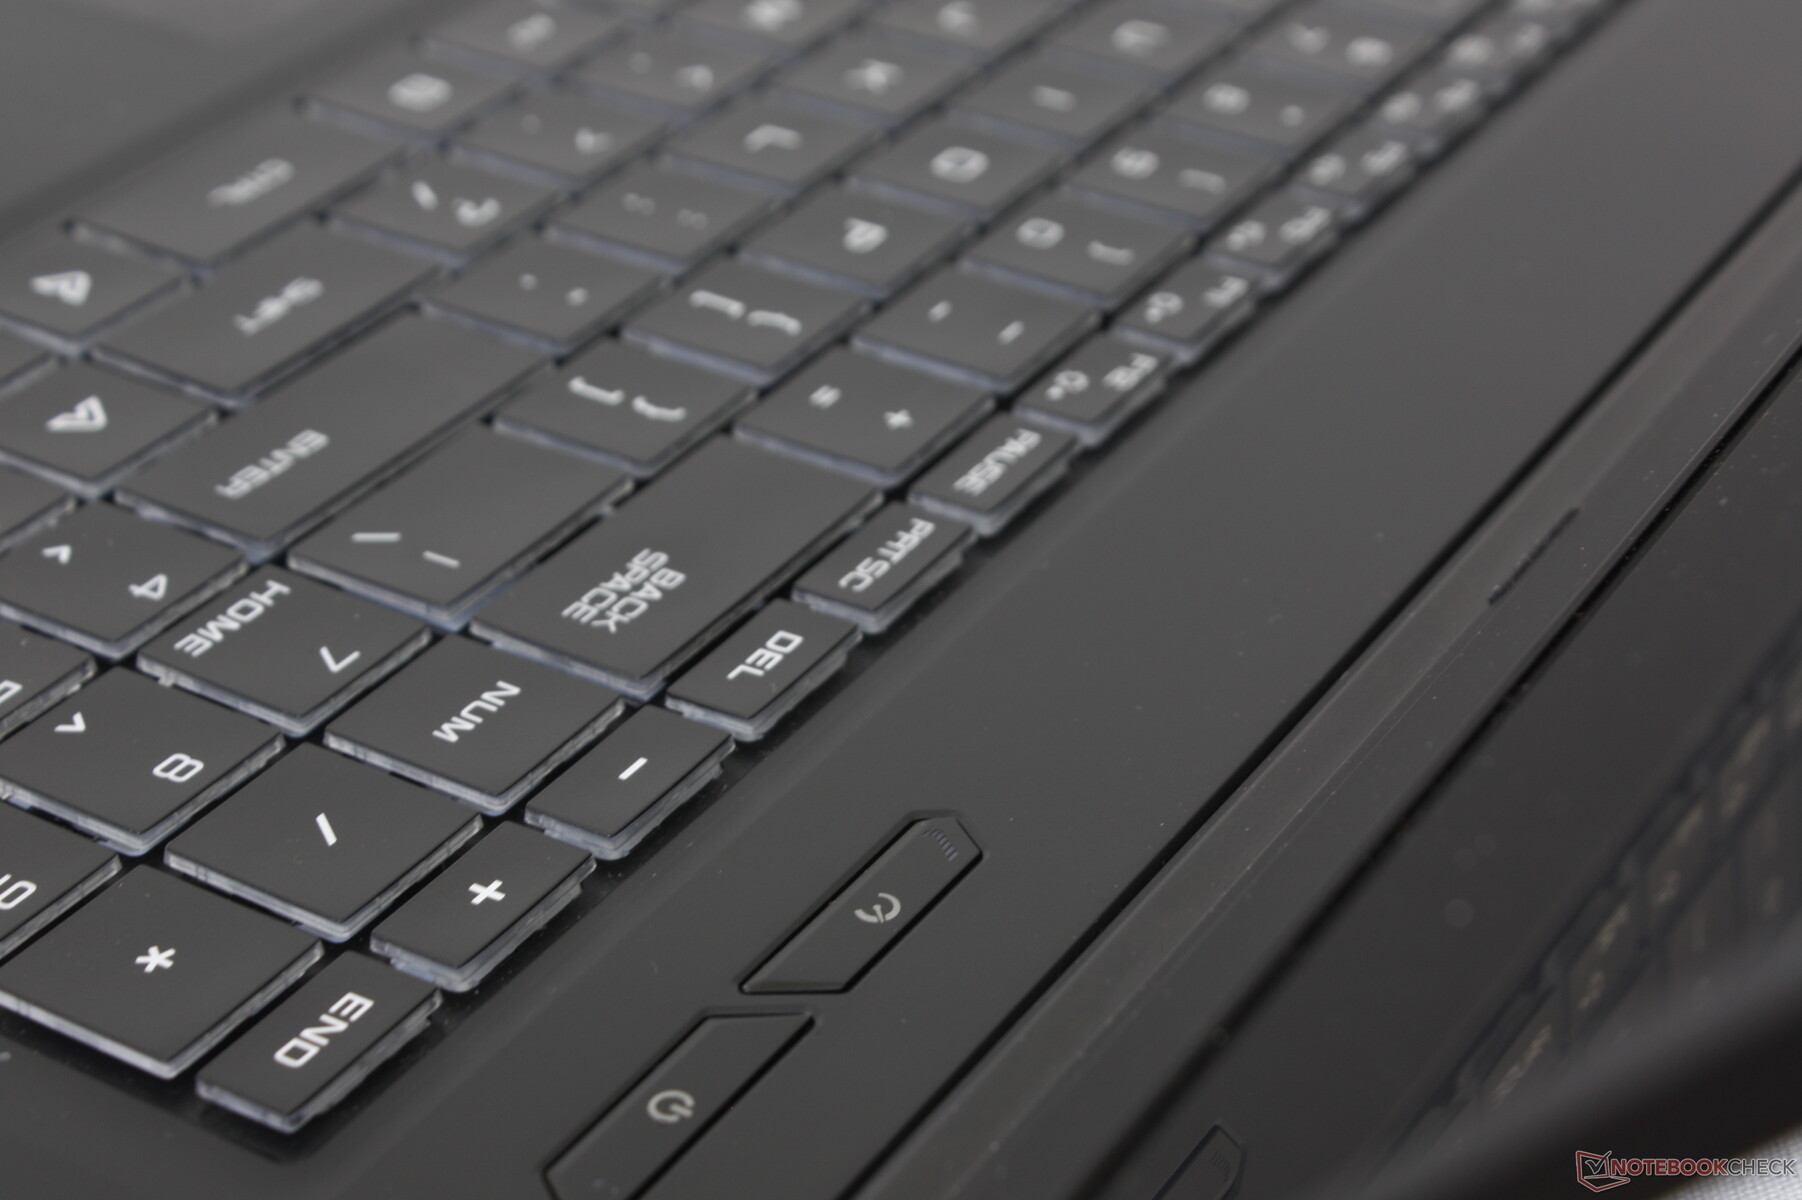
Input Devices
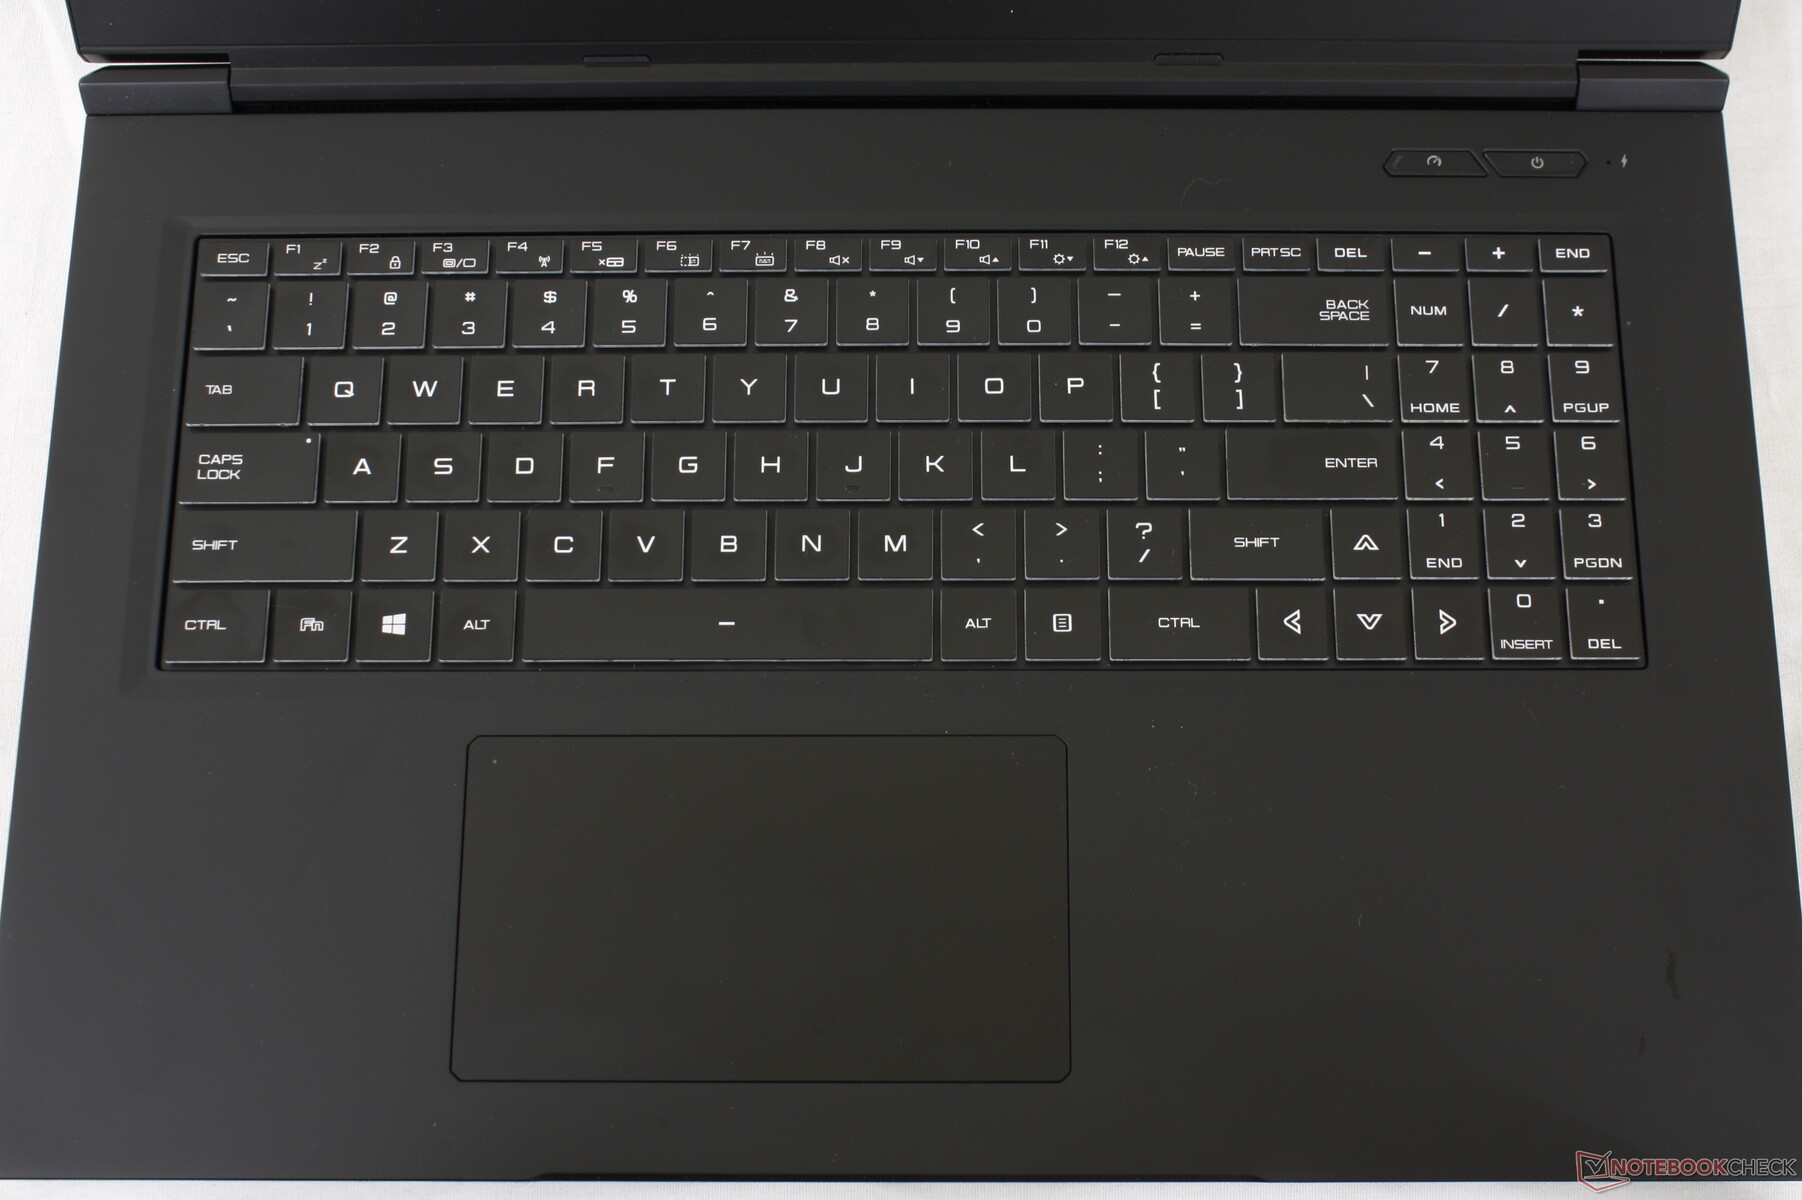
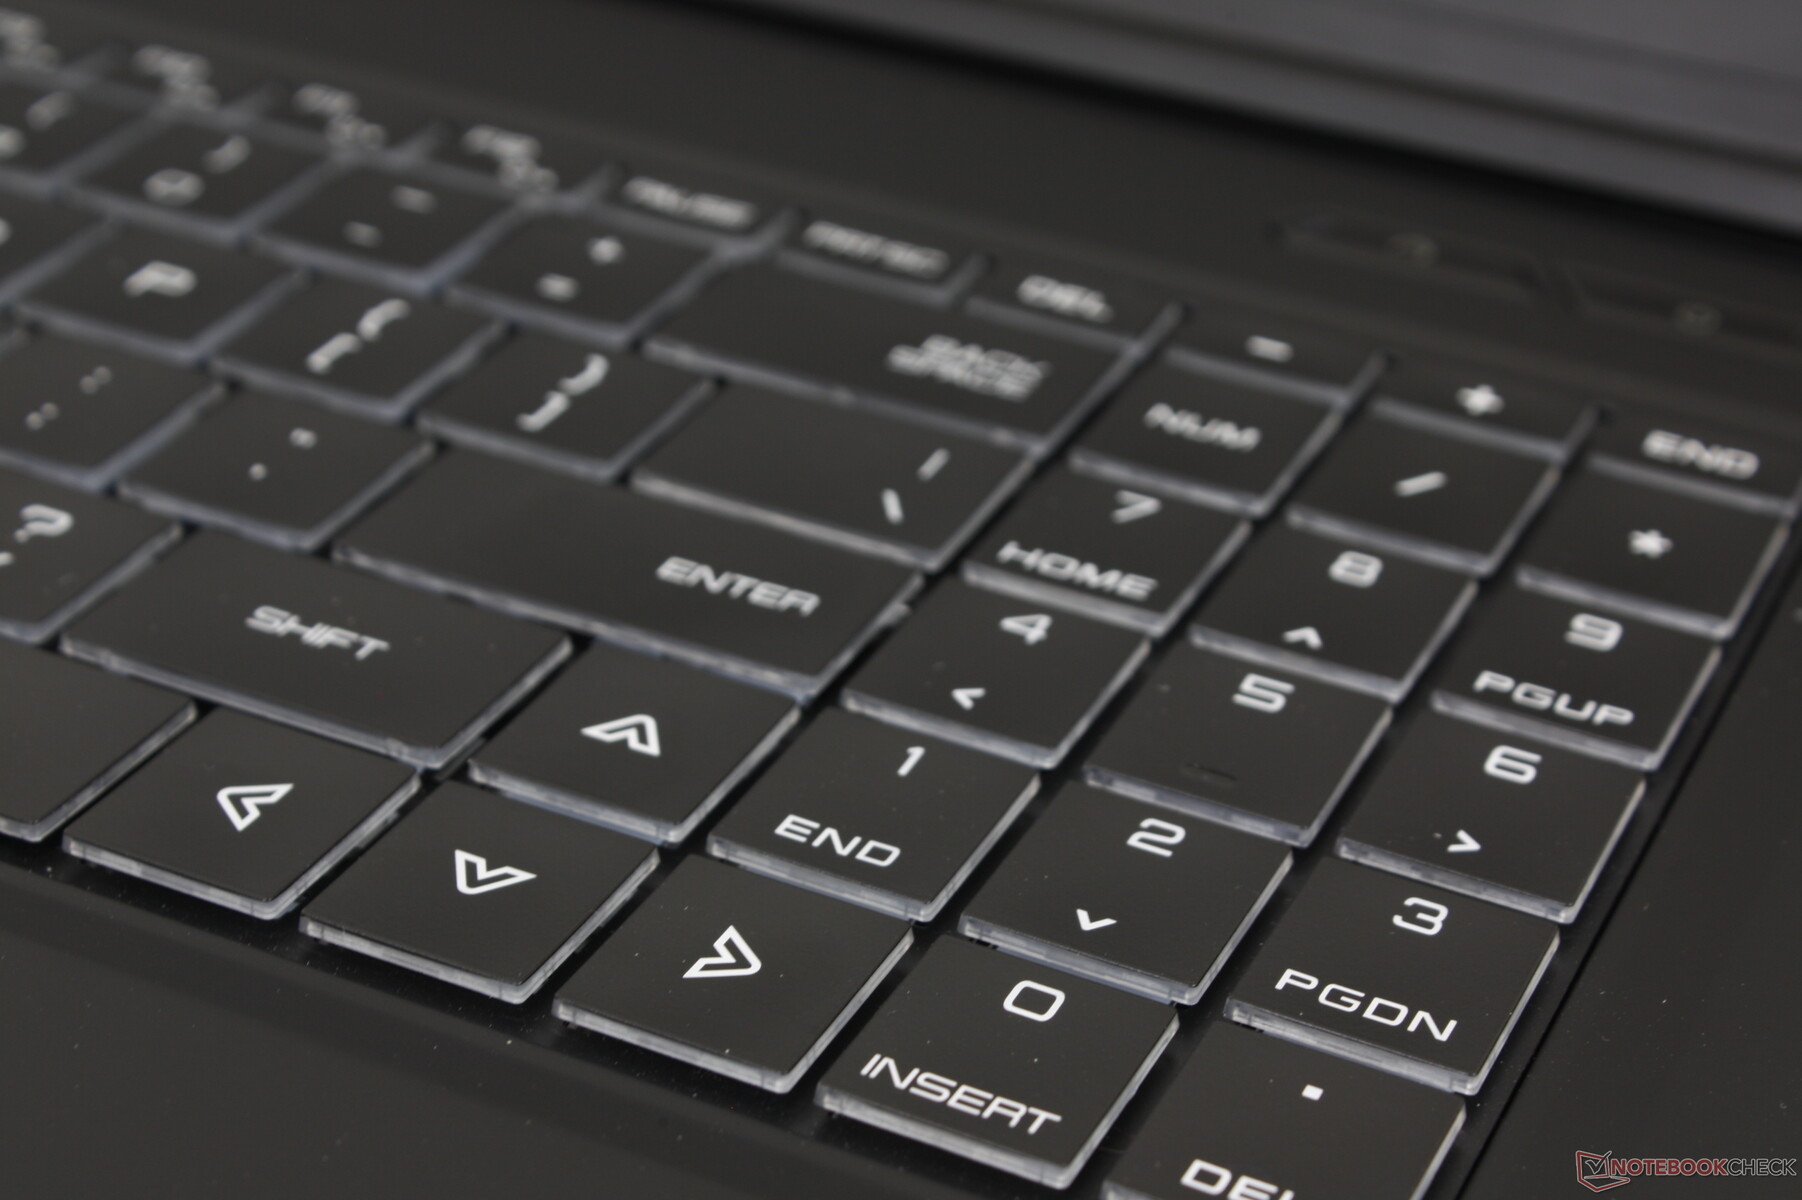
Keyboard
The GM7AG8P uses traditional membrane-based keys more akin to the XMG Core 17 or XMG Pro 17 rather than the mechanical keys of the XMG Neo 17. Unlike the traditional keys on the XMG Core 17 or XMG Pro 17, however, the keys here are physically larger to be easier to type on. Key feedback is uniform with relatively quiet clatter between all keys, but we do wish that travel and feedback could have been firmer overall.
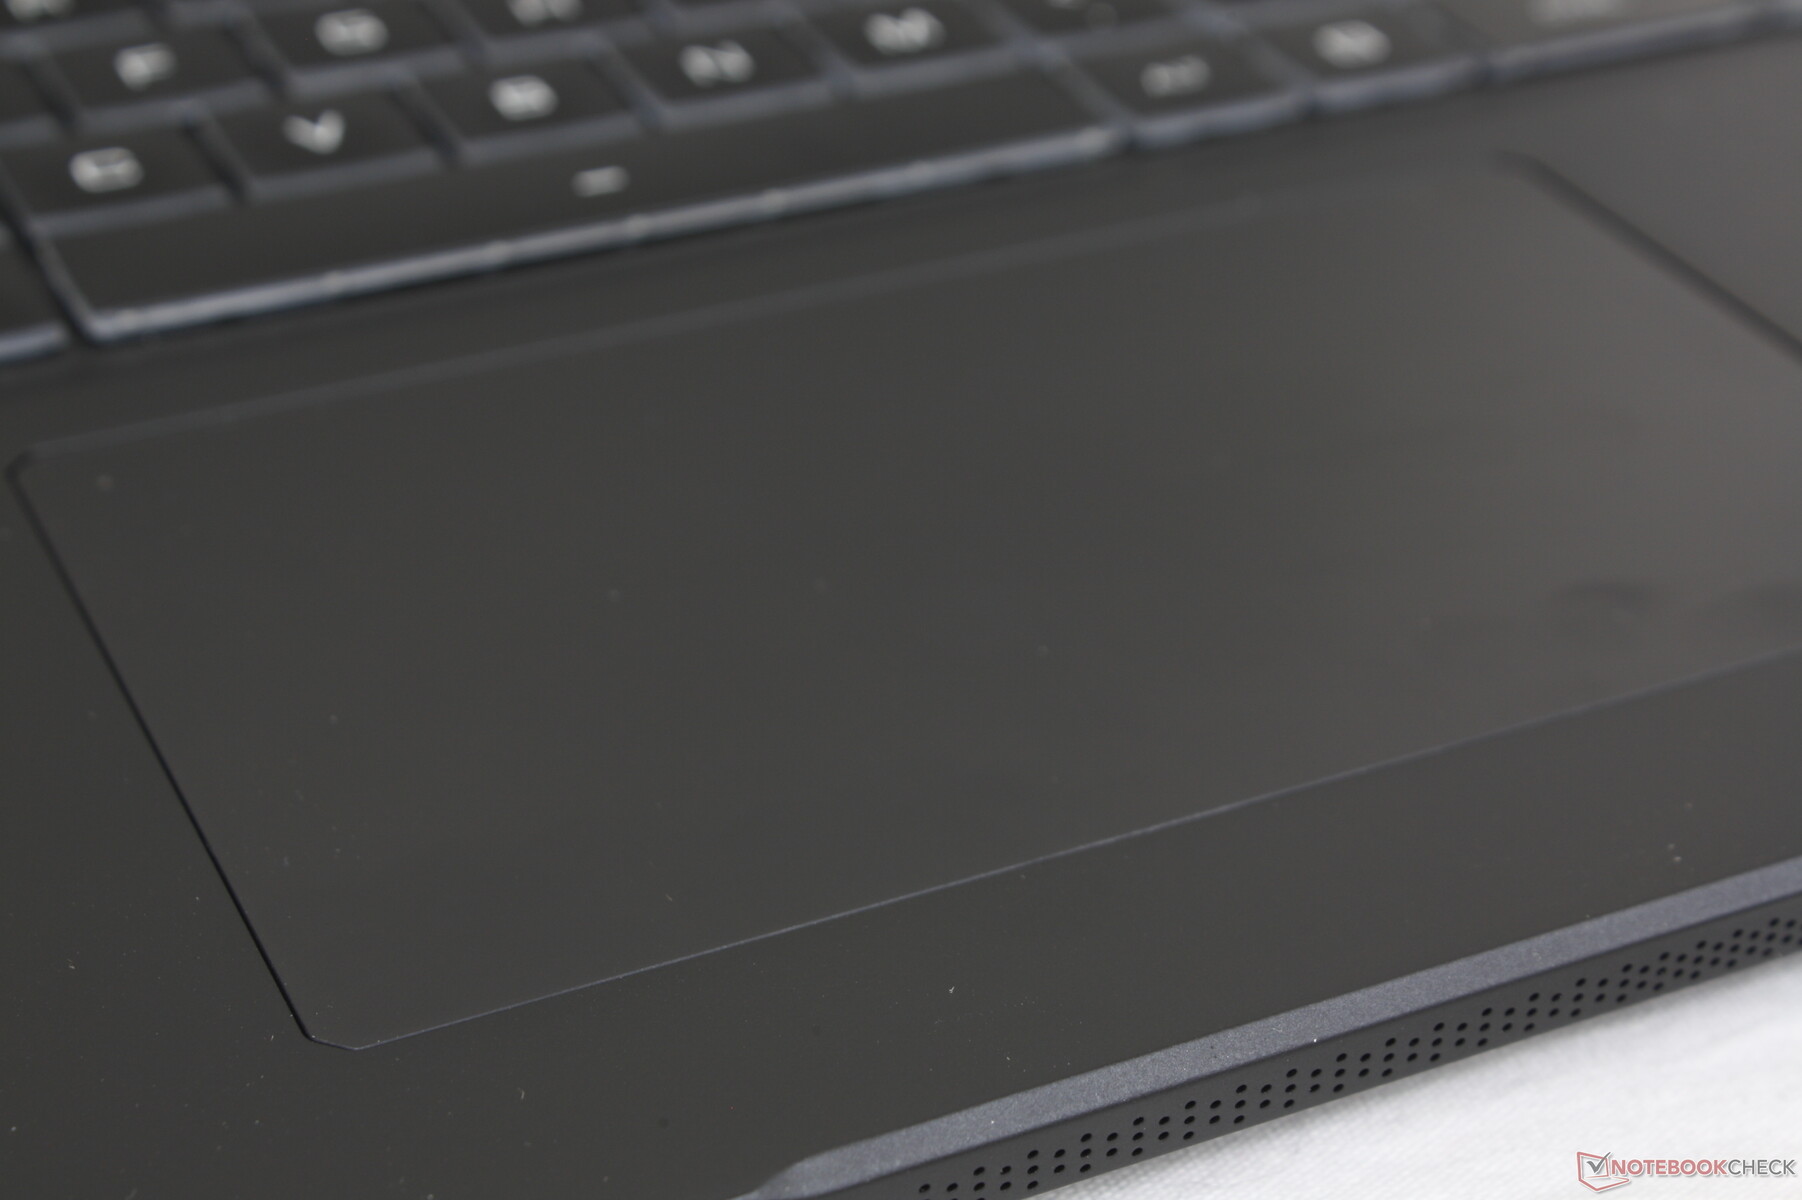
Touchpad
The clickpad is nearly the same size as the one on the Blade Pro 17 (13.3 x 7.6 cm vs. 13 x 8 cm) but with a firmer and louder click when pressed. Gliding properties are smooth with little to no sticking even when moving the cursor at slower speeds.

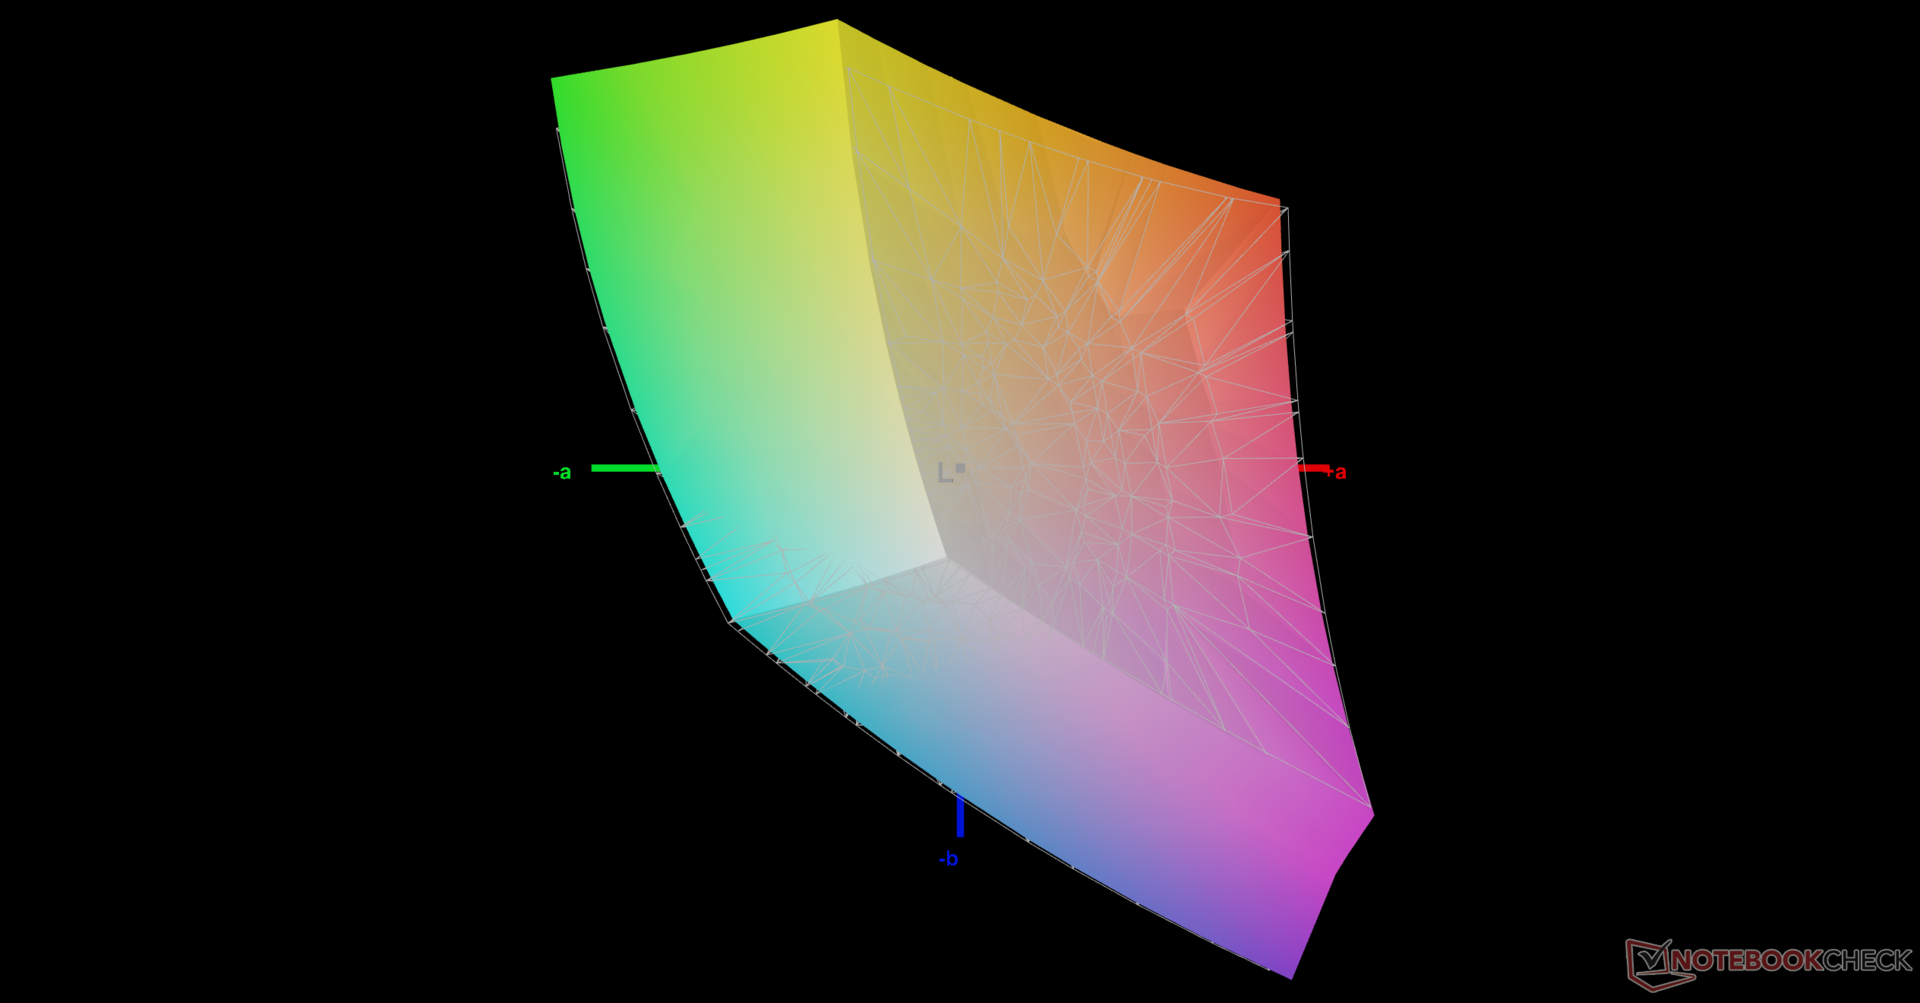
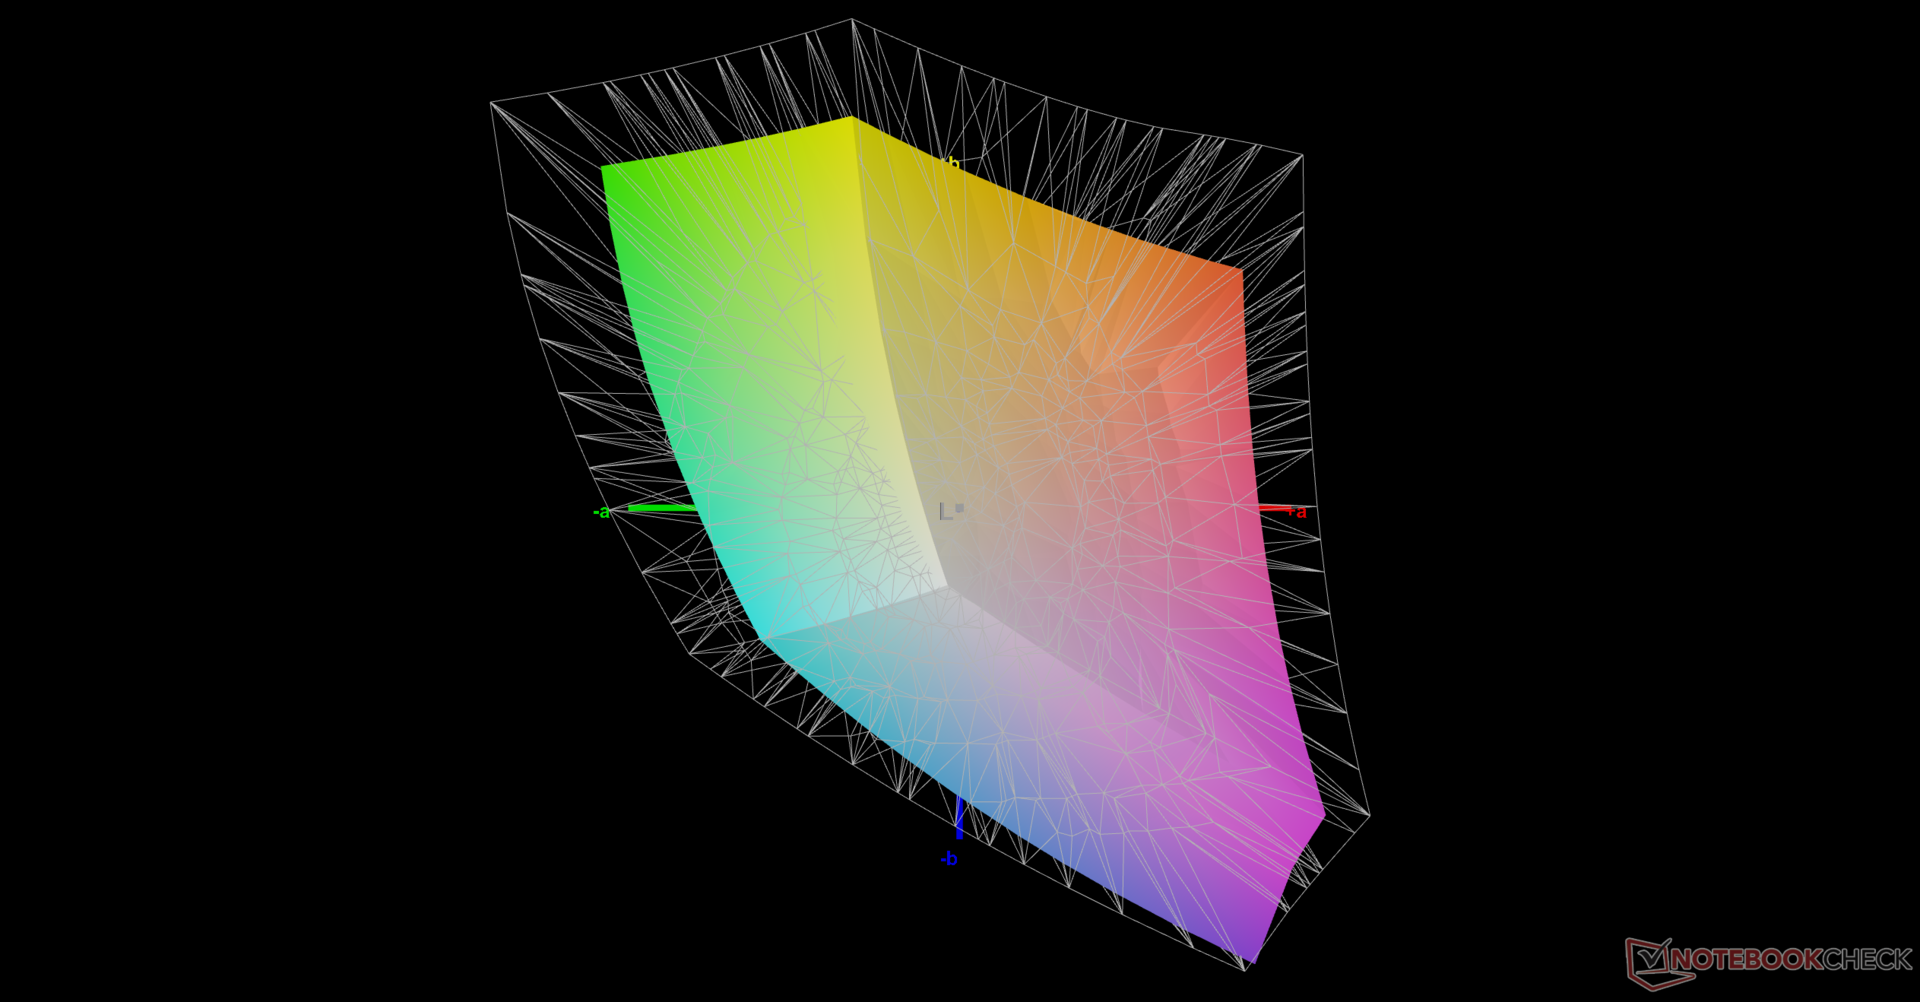
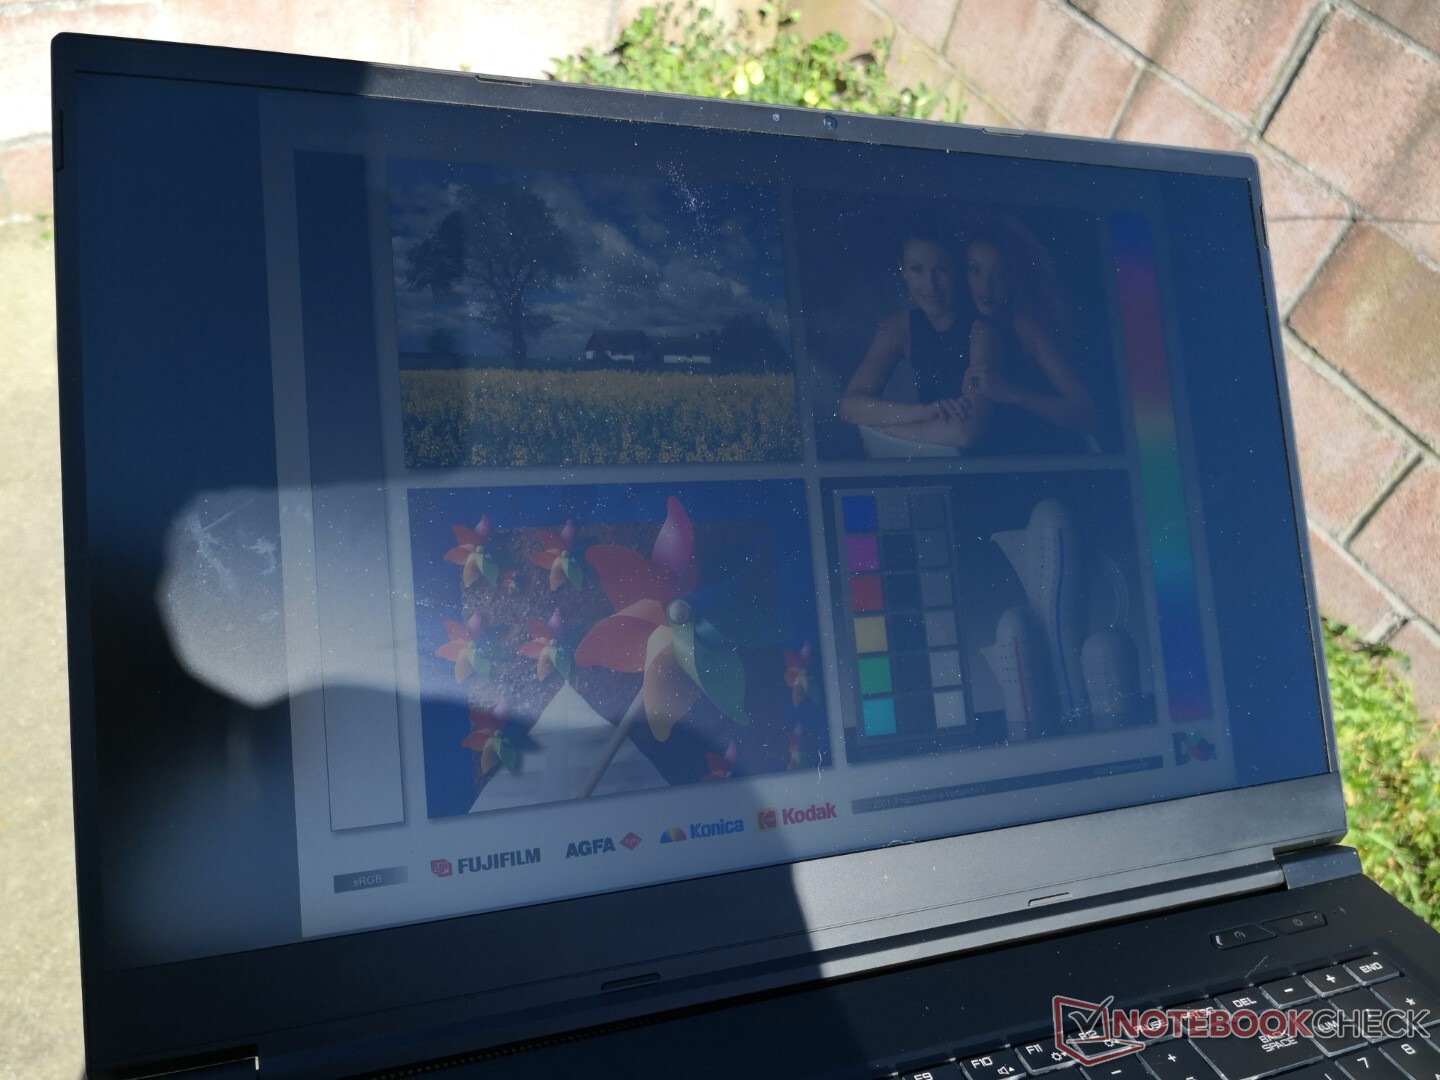
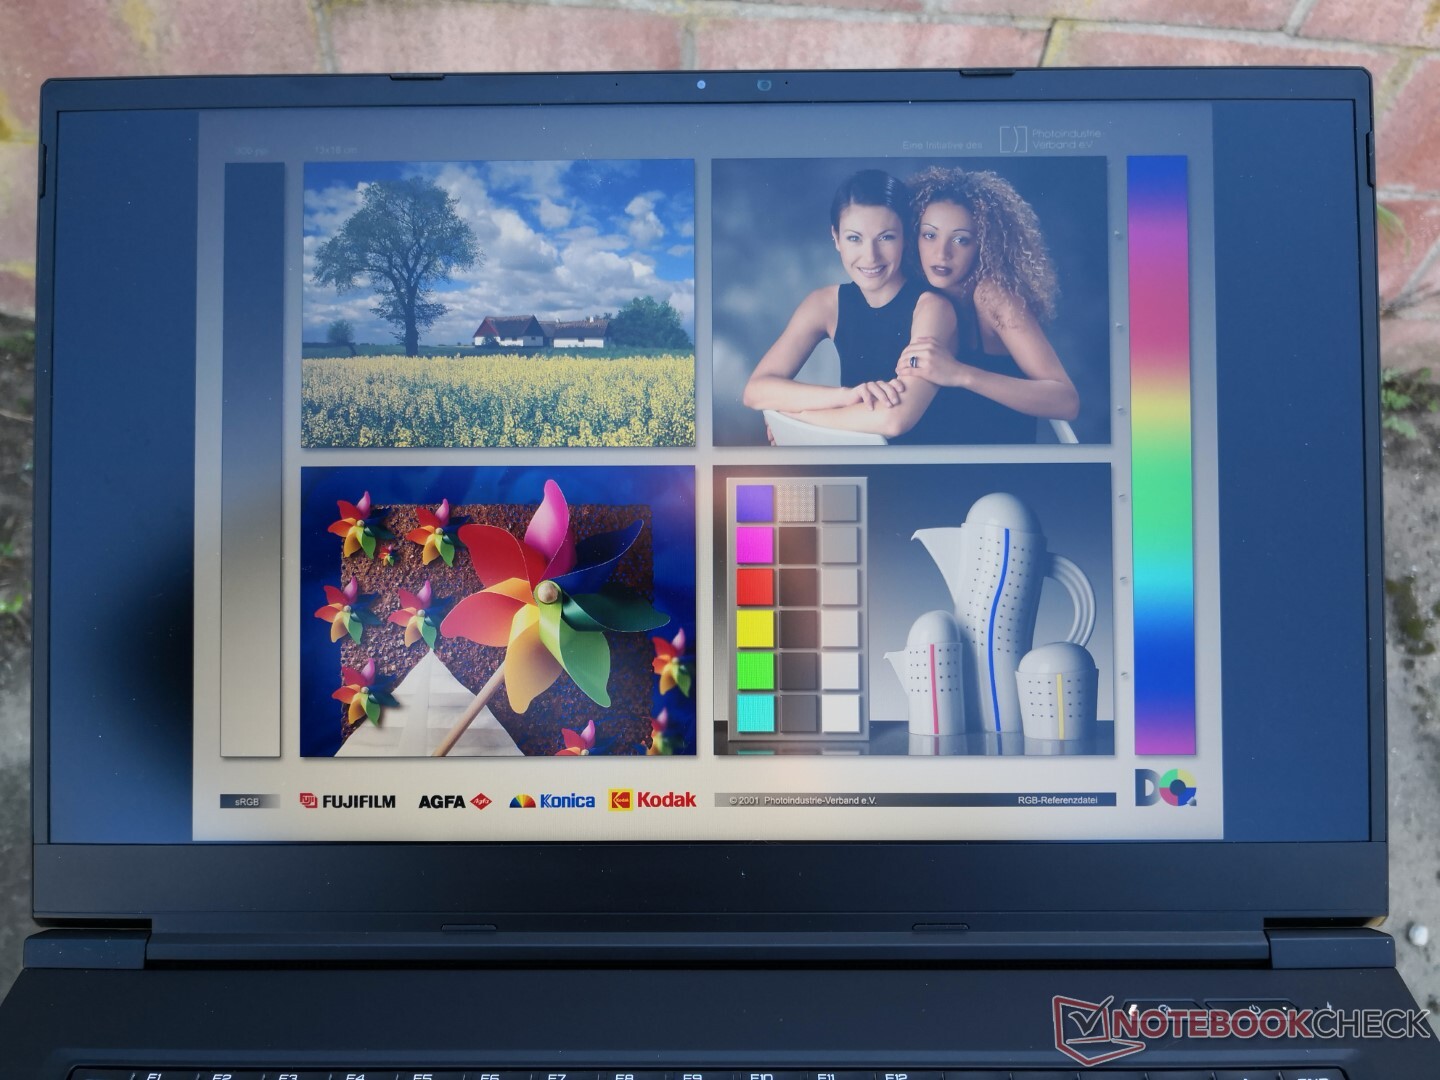
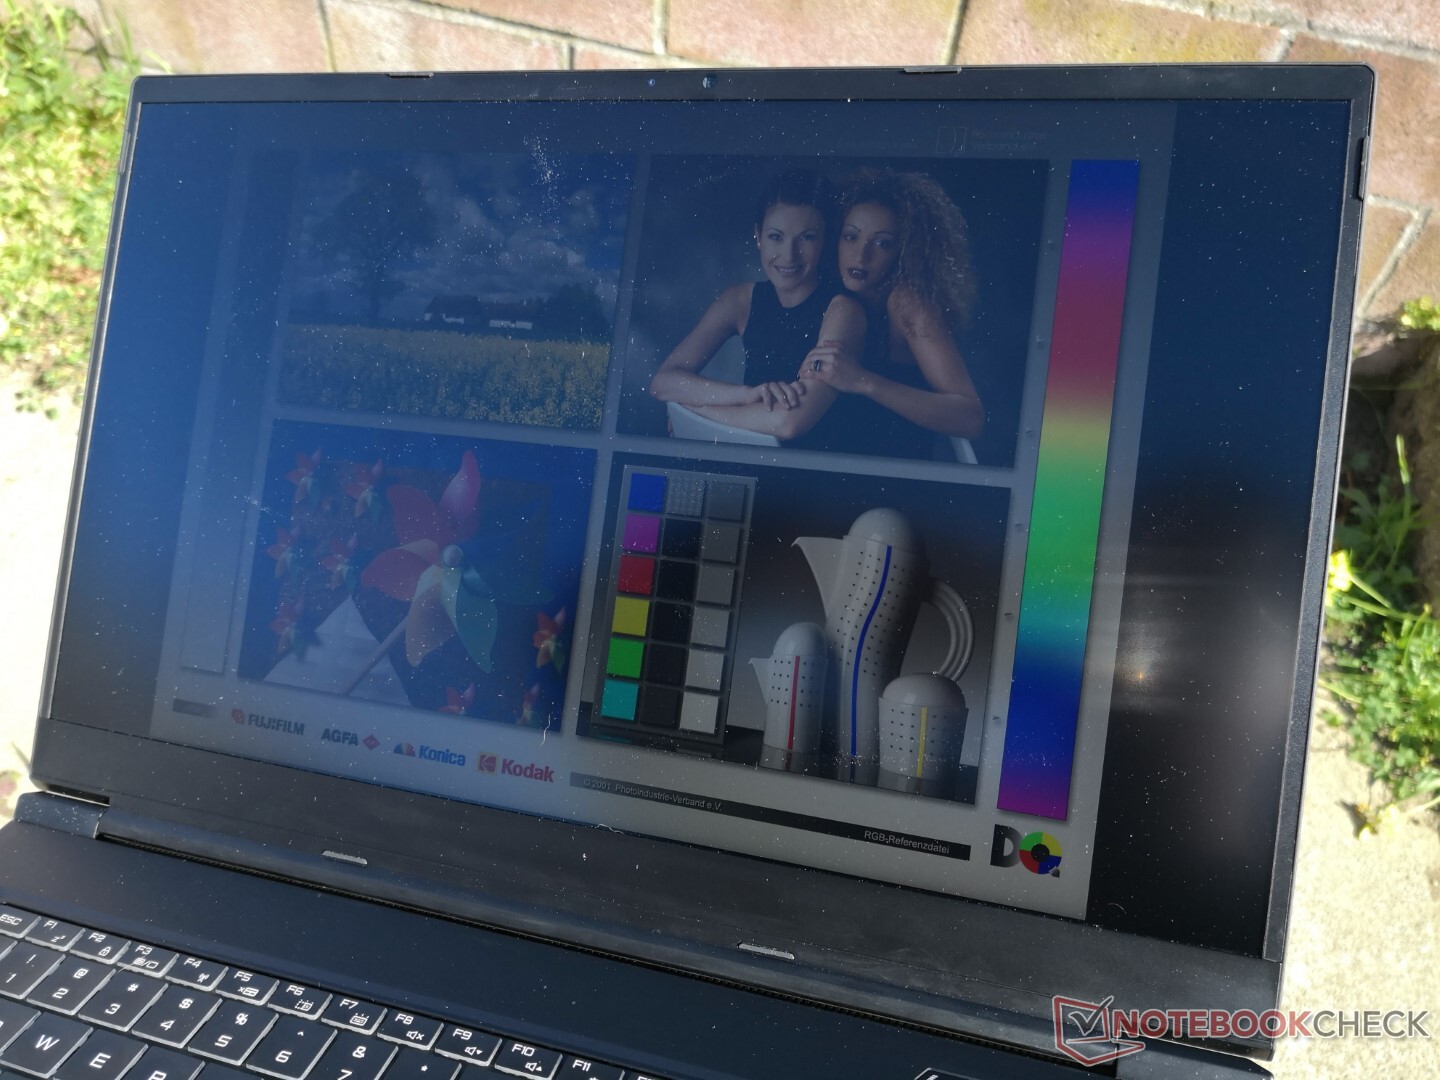
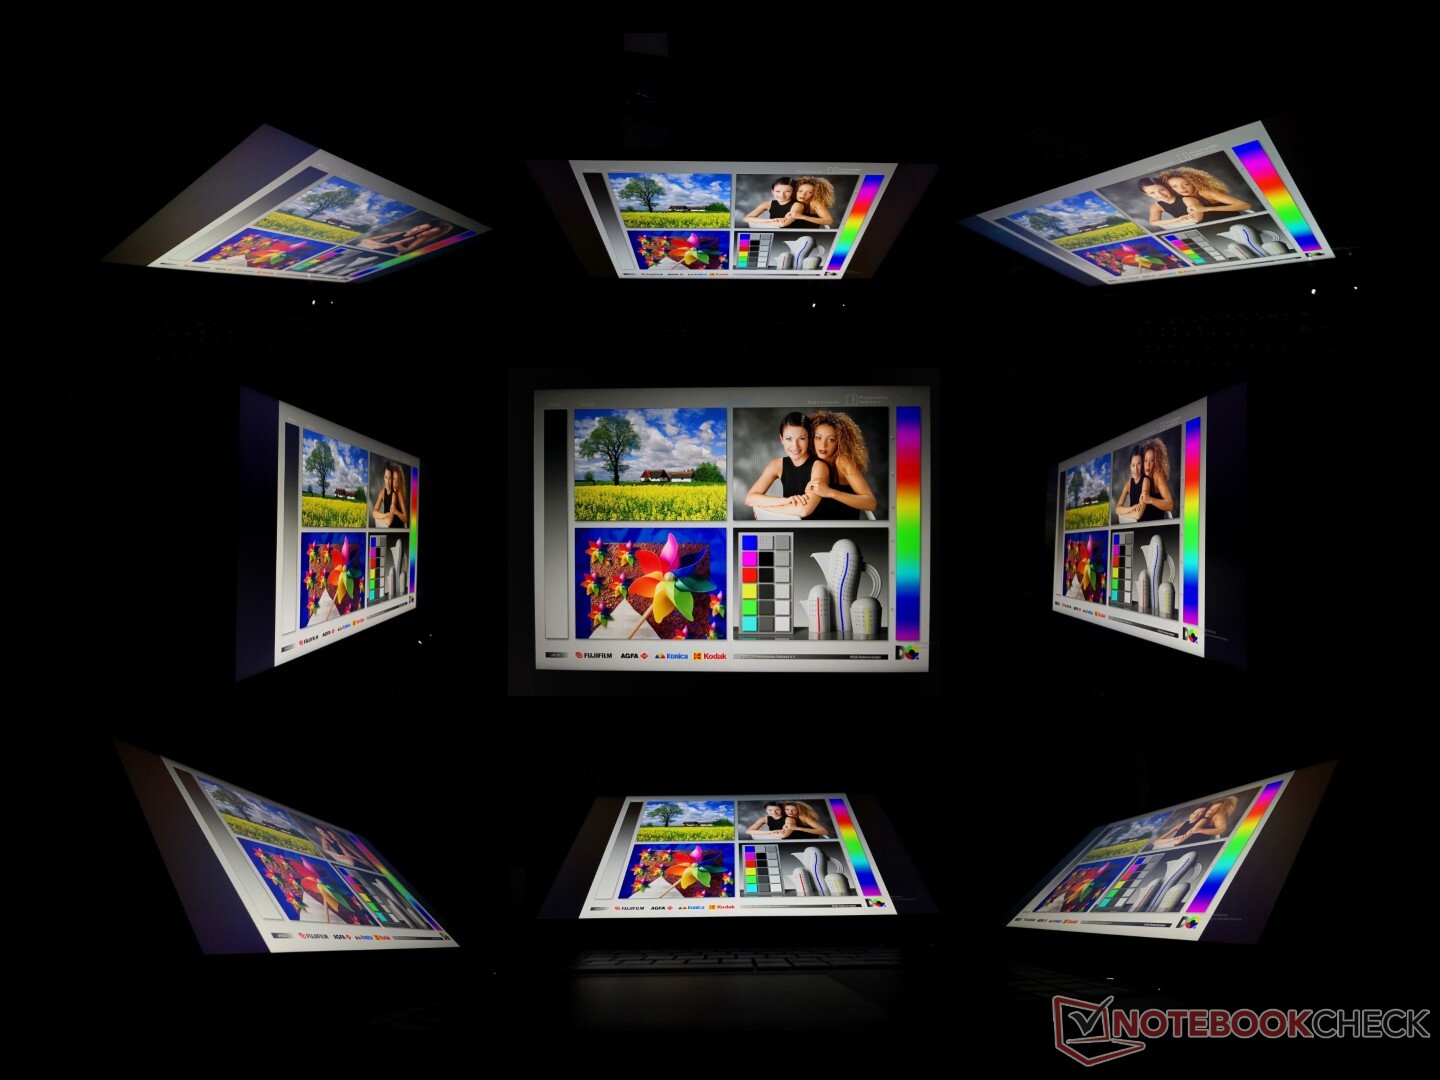
Display — Fast and Colorful
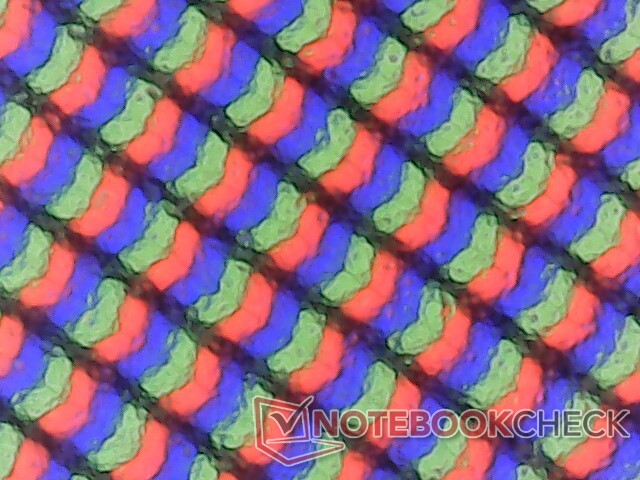
Our GM7AG8P test unit is using the exact same BOE0977 display controller and NE173QHM-NY2 IPS panel as found on last year's Schenker XMG Neo 17 GM7TG8S. Thus, the viewing experience and display attributes between these two laptops are very similar including the 1440p native resolution, fast response times, ~1000:1 contrast ratio, 165 Hz refresh rate, and full sRGB coverage. Maximum brightness continues to be just under 400 nits as well.
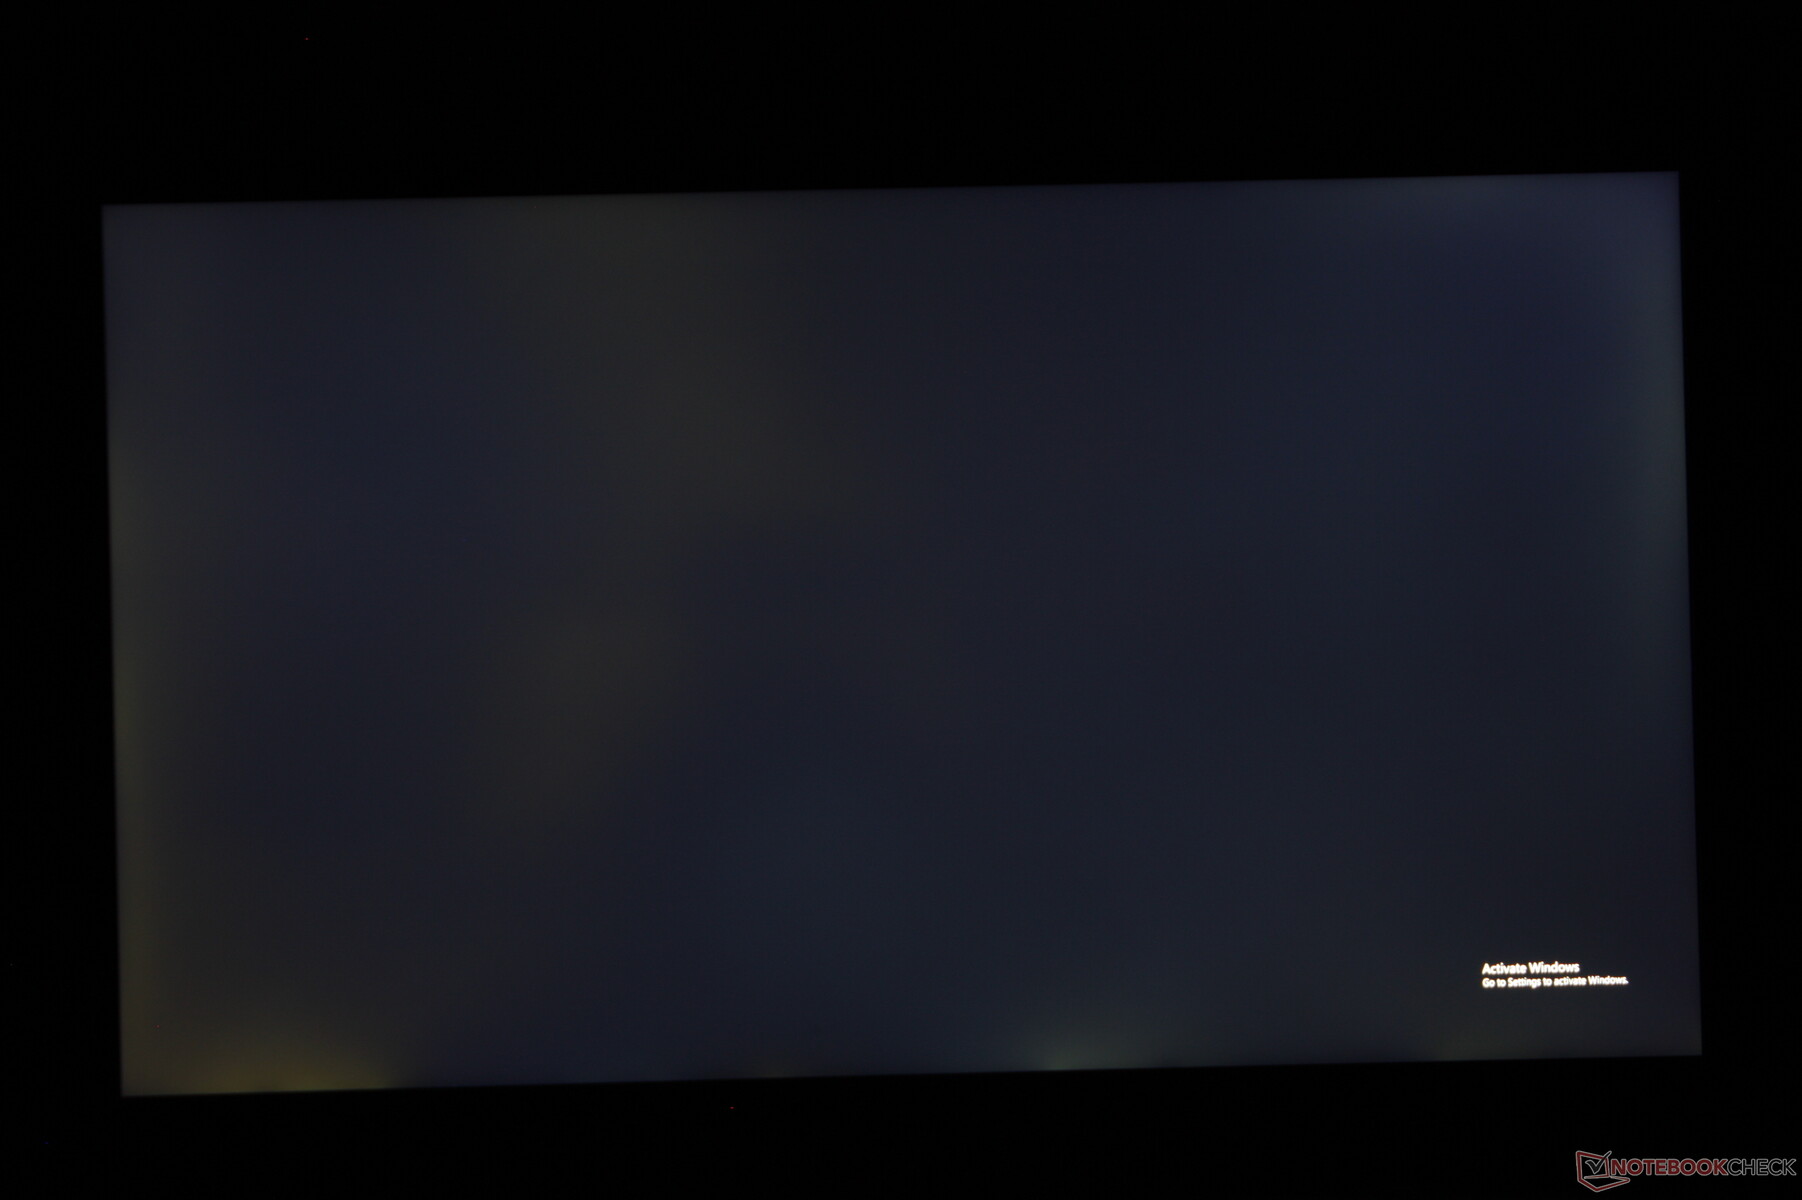
Backlight bleeding on our particular test unit could be improved upon as shown by our image below. Though some bleeding is to be expected from IPS, our unit would exhibit more than we would like.
| |||||||||||||||||||||||||
Brightness Distribution: 86 %
Center on Battery: 387.1 cd/m²
Contrast: 1210:1 (Black: 0.32 cd/m²)
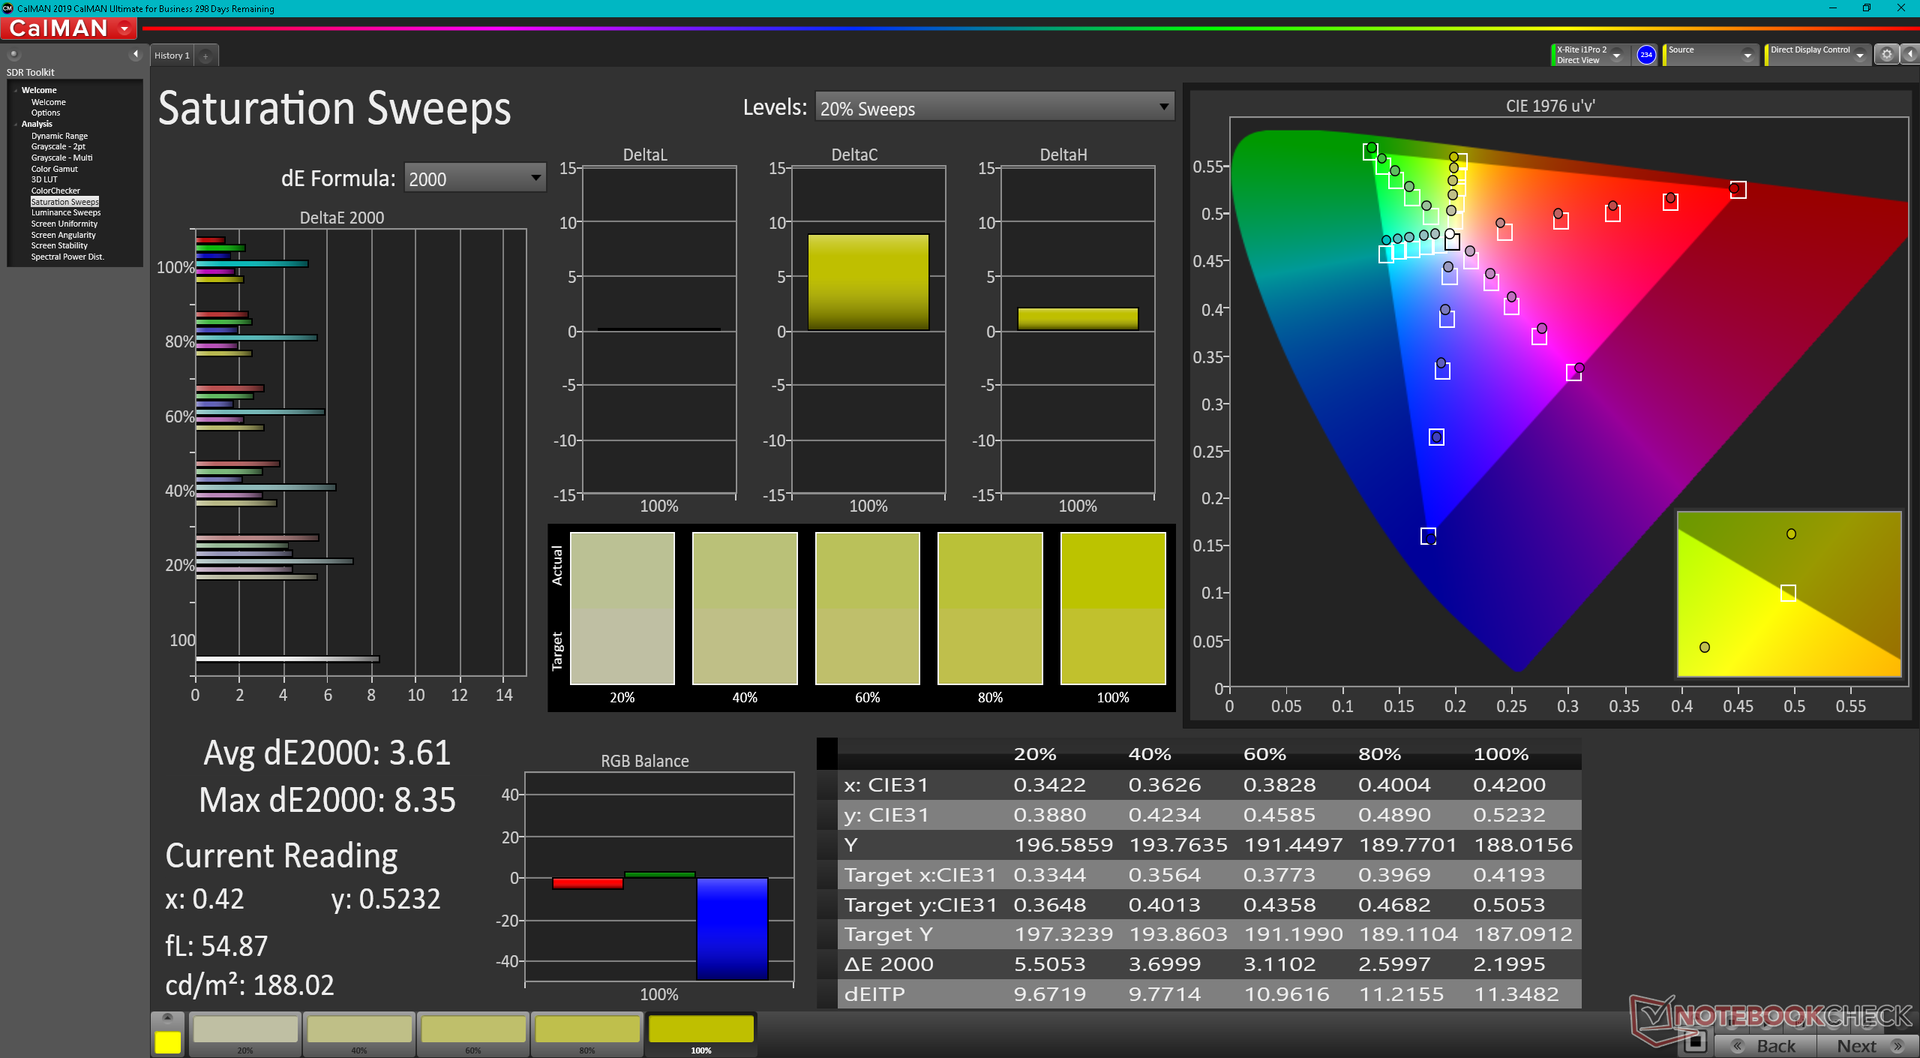
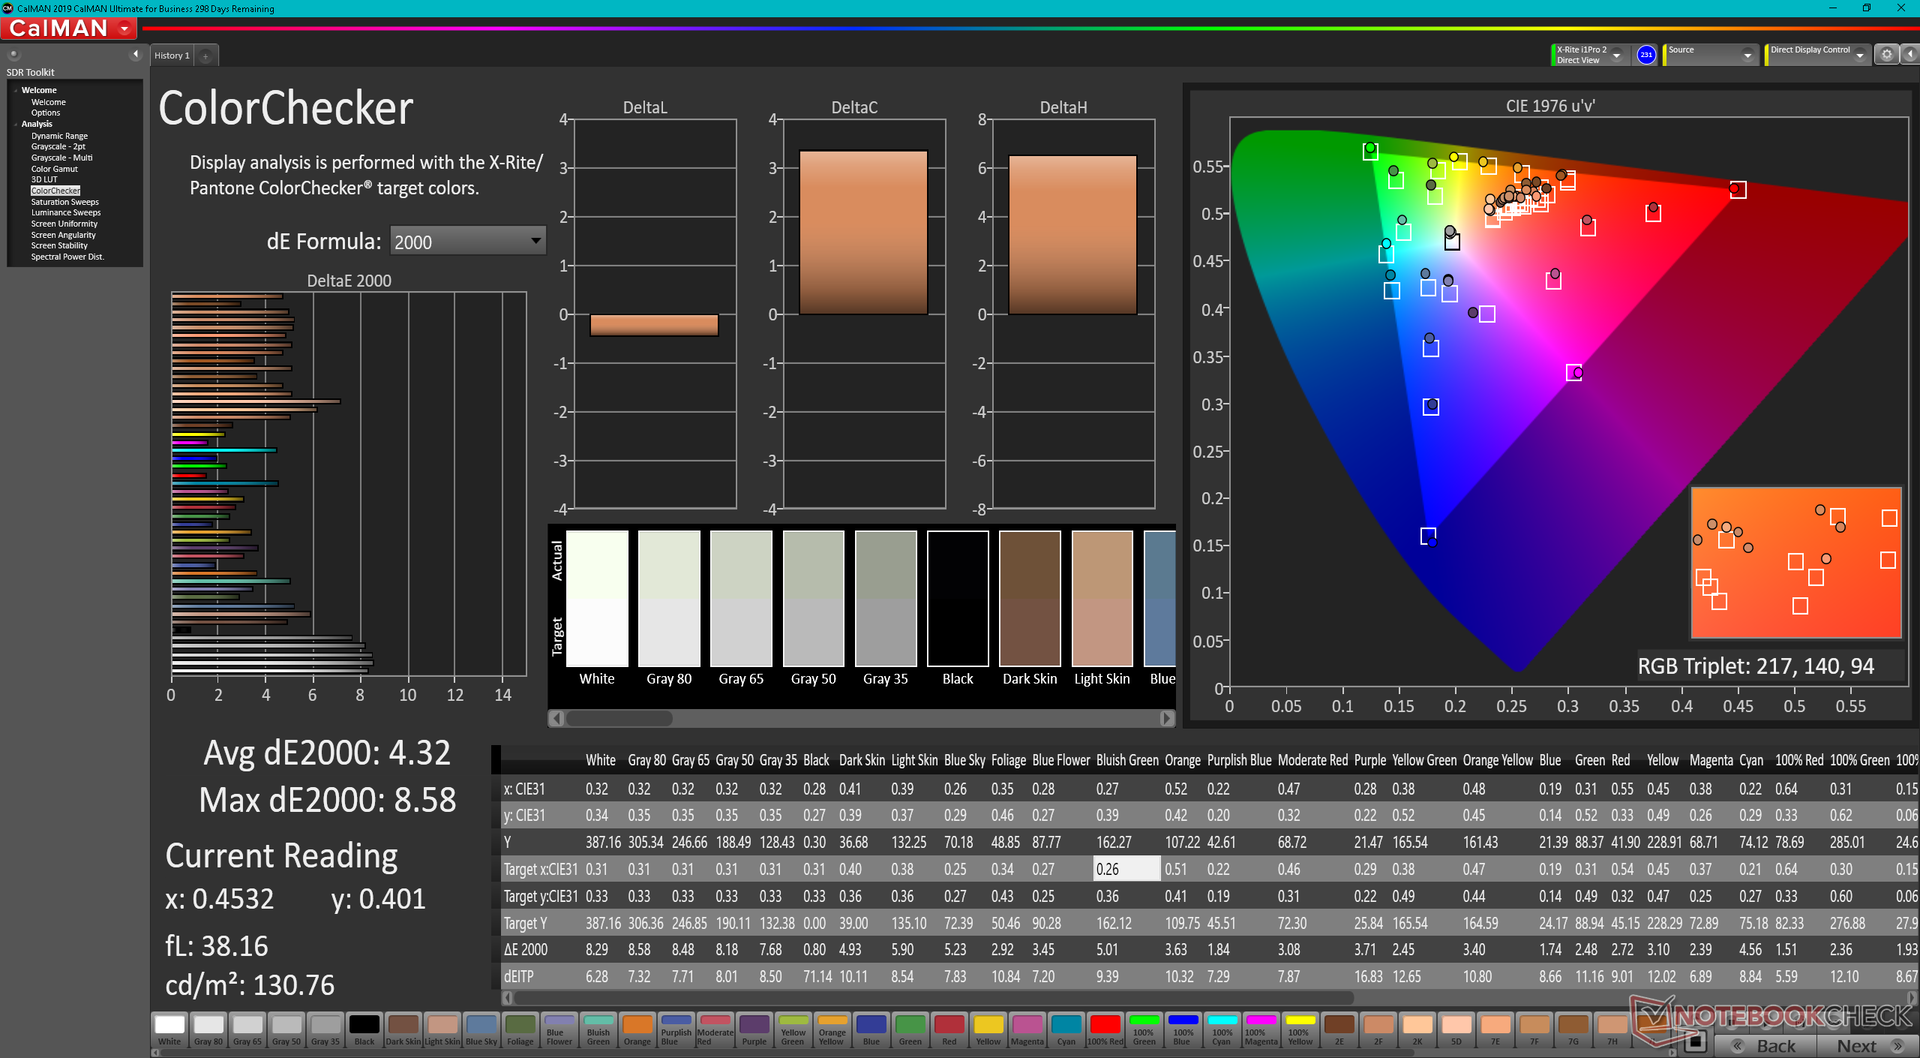
ΔE ColorChecker Calman: 4.32 | ∀{0.5-29.43 Ø4.73}
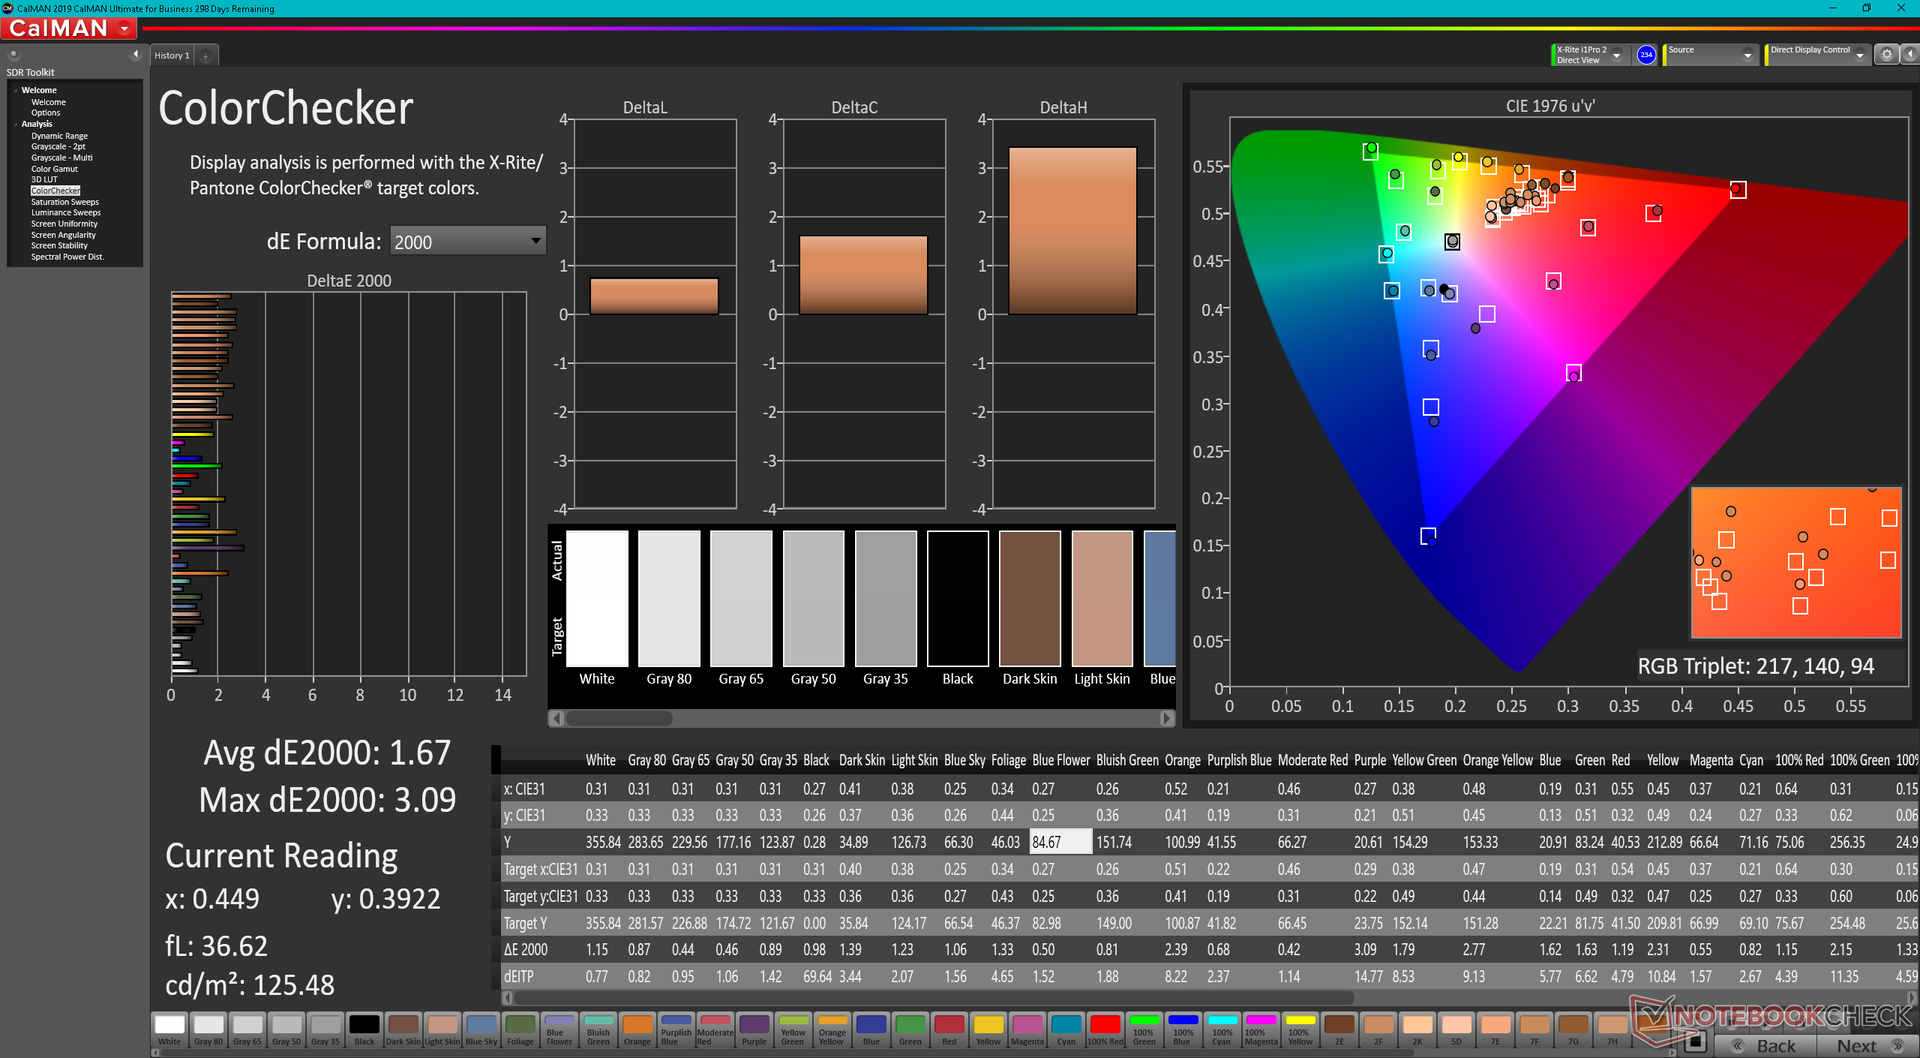
calibrated: 1.67
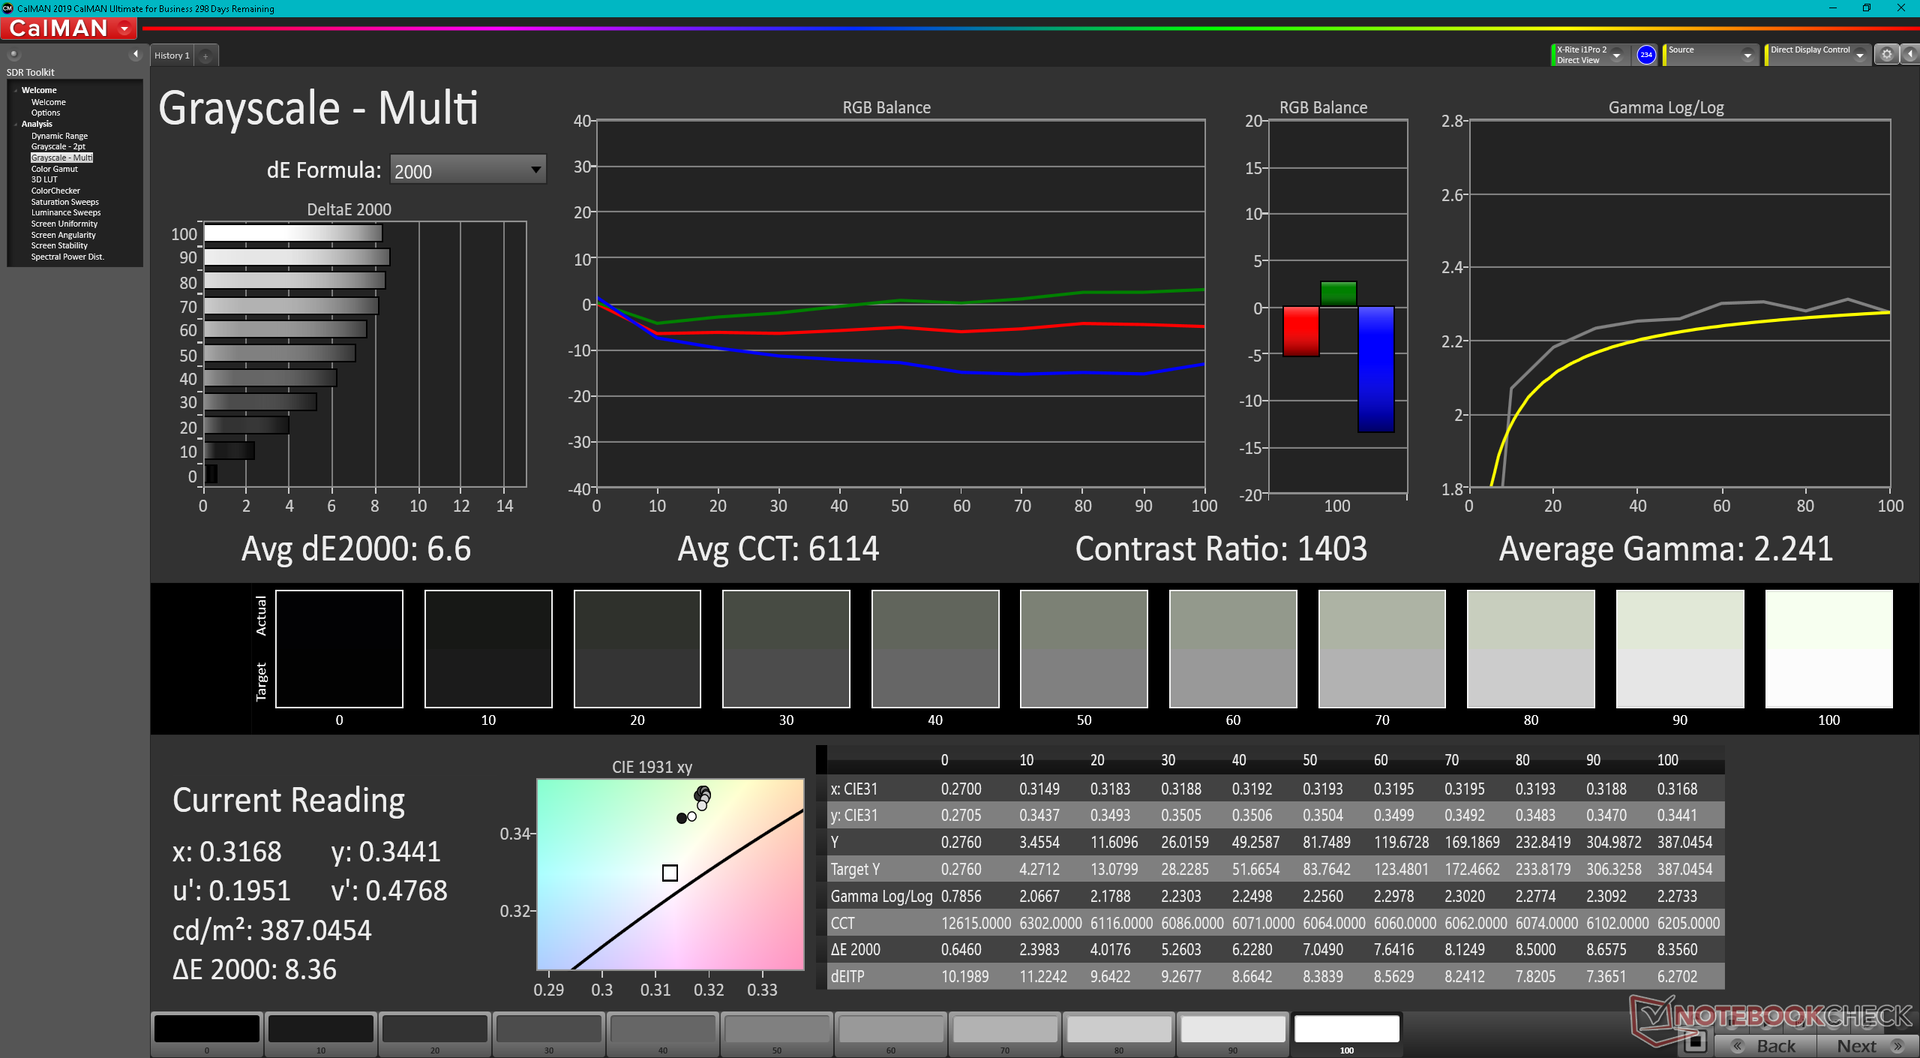
ΔE Greyscale Calman: 6.6 | ∀{0.09-98 Ø4.97}
70.7% AdobeRGB 1998 (Argyll 3D)
97.8% sRGB (Argyll 3D)
68.9% Display P3 (Argyll 3D)
Gamma: 2.24
CCT: 6114 K
| Schenker Uniwill Technology GM7AG8P BOE NE173QHM-NY2, IPS, 2560x1440, 17.3" | Schenker XMG NEO 17 GM7TG8S BOE0977 (NE173QHM-NY2), IPS, 2560x1440, 17.3" | Alienware x17 RTX 3080 P48E AU Optronics B173ZAN, IPS, 3840x2160, 17.3" | Razer Blade 17 RTX 3070 AU Optronics B173HAN05.4, IPS, 1920x1080, 17.3" | MSI GS76 Stealth 11UH AUO B173ZAN06.1 (AUODE95), IPS, 3840x2160, 17.3" | Maingear Vector Pro MG-VCP17 BOE NE173QHM-NY2, IPS, 2560x1440, 17.3" | |
|---|---|---|---|---|---|---|
| Display | -3% | 24% | 3% | -7% | 2% | |
| Display P3 Coverage (%) | 68.9 | 67.1 -3% | 88.3 28% | 71.7 4% | 63 -9% | 70.7 3% |
| sRGB Coverage (%) | 97.8 | 96.3 -2% | 100 2% | 98.8 1% | 94.8 -3% | 99.4 2% |
| AdobeRGB 1998 Coverage (%) | 70.7 | 68.6 -3% | 100 41% | 73.6 4% | 65 -8% | 71.7 1% |
| Response Times | 16% | 14% | 54% | 47% | 4% | |
| Response Time Grey 50% / Grey 80% * (ms) | 14.8 ? | 15.2 -3% | 14.4 ? 3% | 4.2 ? 72% | 8.8 ? 41% | 15.6 ? -5% |
| Response Time Black / White * (ms) | 13.6 ? | 8.8 35% | 10.4 ? 24% | 8.8 ? 35% | 6.4 ? 53% | 12 ? 12% |
| PWM Frequency (Hz) | ||||||
| Screen | 18% | 11% | -9% | 22% | 9% | |
| Brightness middle (cd/m²) | 387.1 | 396 2% | 438.7 13% | 323.3 -16% | 474 22% | 389.7 1% |
| Brightness (cd/m²) | 361 | 366 1% | 435 20% | 315 -13% | 454 26% | 363 1% |
| Brightness Distribution (%) | 86 | 82 -5% | 91 6% | 91 6% | 88 2% | 84 -2% |
| Black Level * (cd/m²) | 0.32 | 0.45 -41% | 0.48 -50% | 0.33 -3% | 0.46 -44% | 0.47 -47% |
| Contrast (:1) | 1210 | 880 -27% | 914 -24% | 980 -19% | 1030 -15% | 829 -31% |
| Colorchecker dE 2000 * | 4.32 | 1.43 67% | 4.34 -0% | 4.59 -6% | 1.5 65% | 1.93 55% |
| Colorchecker dE 2000 max. * | 8.58 | 2.2 74% | 7.3 15% | 10.82 -26% | 5.59 35% | 6.84 20% |
| Colorchecker dE 2000 calibrated * | 1.67 | 1.34 20% | 0.72 57% | 1.4 16% | 0.86 49% | 1.31 22% |
| Greyscale dE 2000 * | 6.6 | 1.8 73% | 2.4 64% | 7.9 -20% | 2.8 58% | 2.4 64% |
| Gamma | 2.24 98% | 2.4 92% | 2.09 105% | 2.28 96% | 2.158 102% | 2.12 104% |
| CCT | 6114 106% | 6489 100% | 6413 101% | 5941 109% | 6597 99% | 6658 98% |
| Total Average (Program / Settings) | 10% /
13% | 16% /
14% | 16% /
3% | 21% /
19% | 5% /
7% |
* ... smaller is better
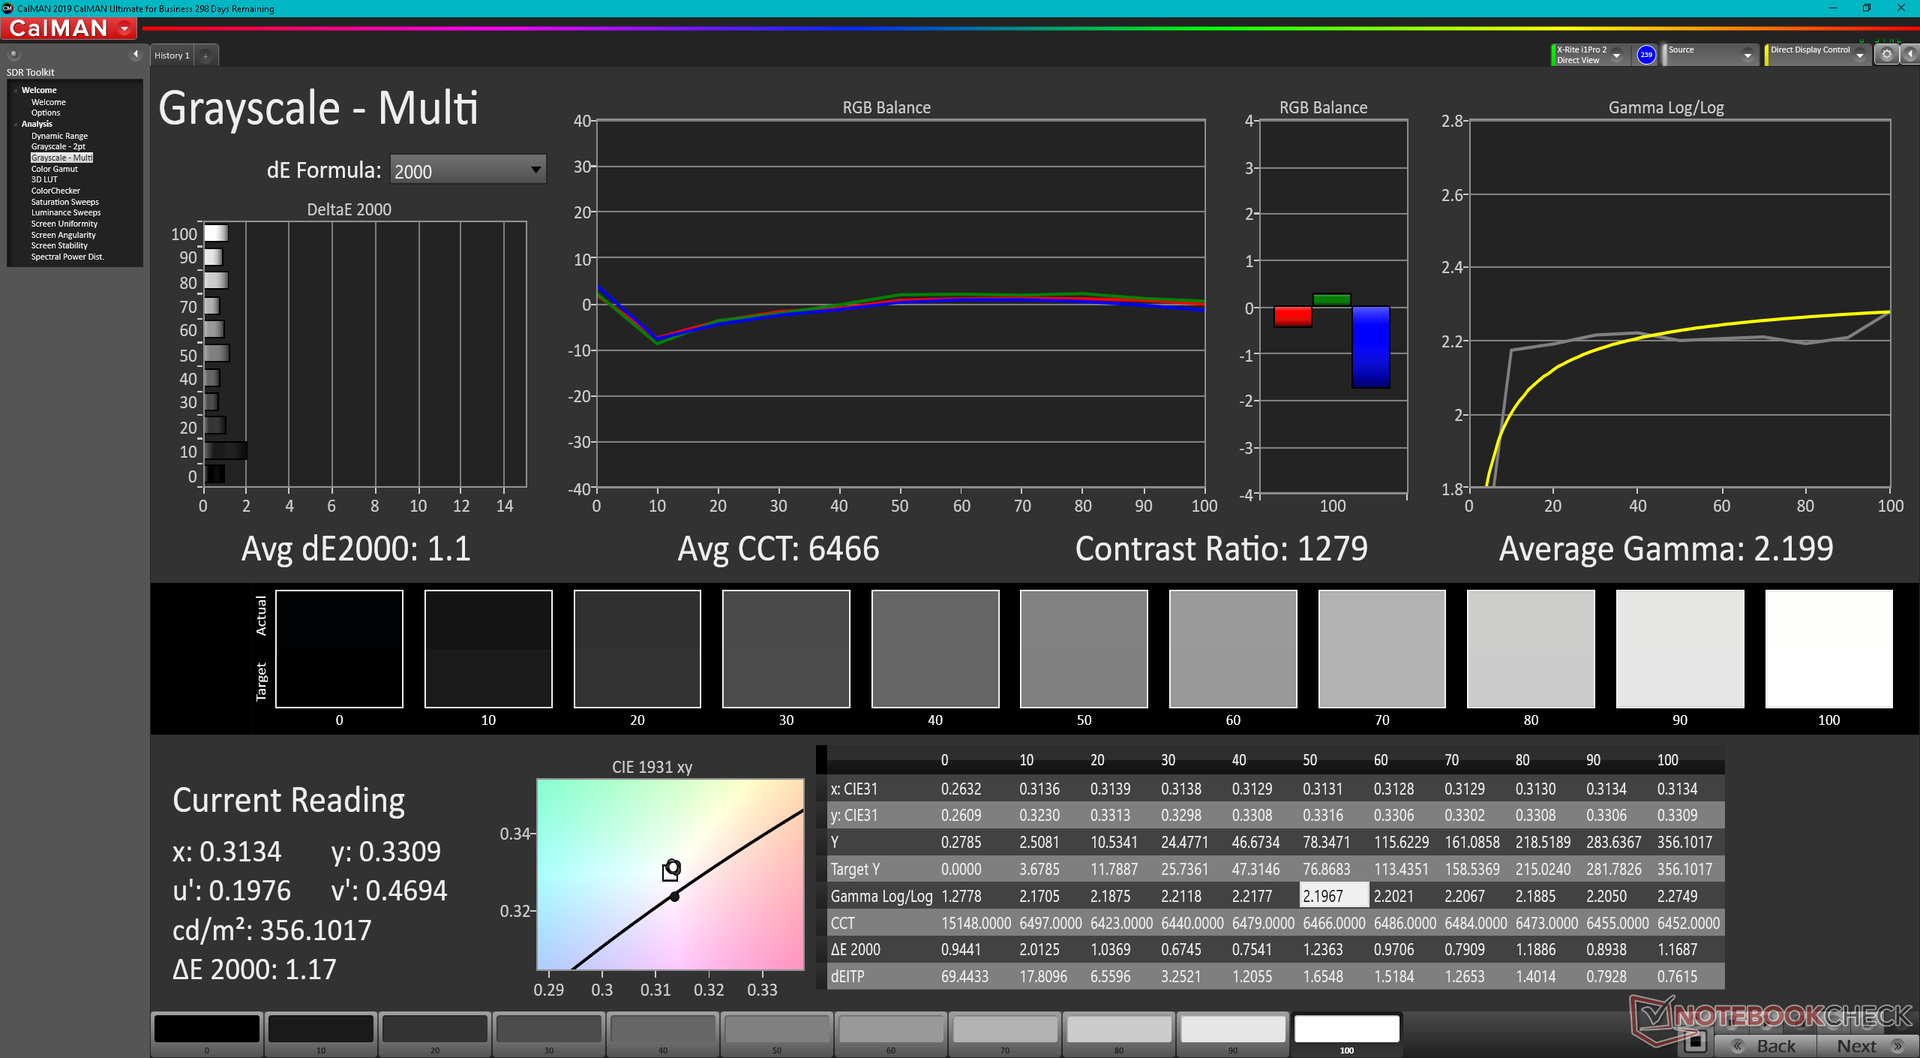
Grayscale is not well calibrated out of the box with its relatively high average deltaE value of 6.6 due to the warm color temperature of around 6100K. Once calibrated with our X-Rite colorimeter, both grayscale and ColorChecker would improve with final average deltaE values of only 1.1 and 1.67, respectively.
Display Response Times
| ↔ Response Time Black to White | ||
|---|---|---|
| 13.6 ms ... rise ↗ and fall ↘ combined | ↗ 7.6 ms rise | 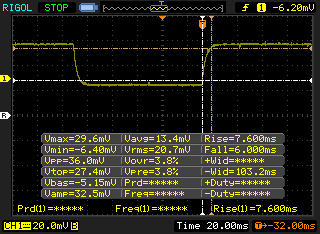 |
| ↘ 6 ms fall | ||
| The screen shows good response rates in our tests, but may be too slow for competitive gamers. In comparison, all tested devices range from 0.1 (minimum) to 240 (maximum) ms. » 34 % of all devices are better. This means that the measured response time is better than the average of all tested devices (19.9 ms). | ||
| ↔ Response Time 50% Grey to 80% Grey | ||
| 14.8 ms ... rise ↗ and fall ↘ combined | ↗ 8 ms rise | 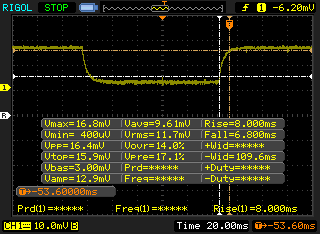 |
| ↘ 6.8 ms fall | ||
| The screen shows good response rates in our tests, but may be too slow for competitive gamers. In comparison, all tested devices range from 0.165 (minimum) to 636 (maximum) ms. » 29 % of all devices are better. This means that the measured response time is better than the average of all tested devices (31.1 ms). | ||
Screen Flickering / PWM (Pulse-Width Modulation)
| Screen flickering / PWM not detected | 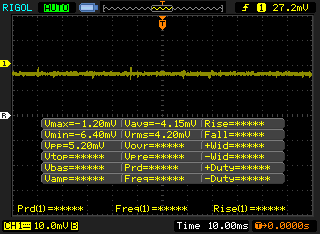 | ||
In comparison: 52 % of all tested devices do not use PWM to dim the display. If PWM was detected, an average of 7798 (minimum: 5 - maximum: 343500) Hz was measured. | |||
Performance — Extreme for the Size
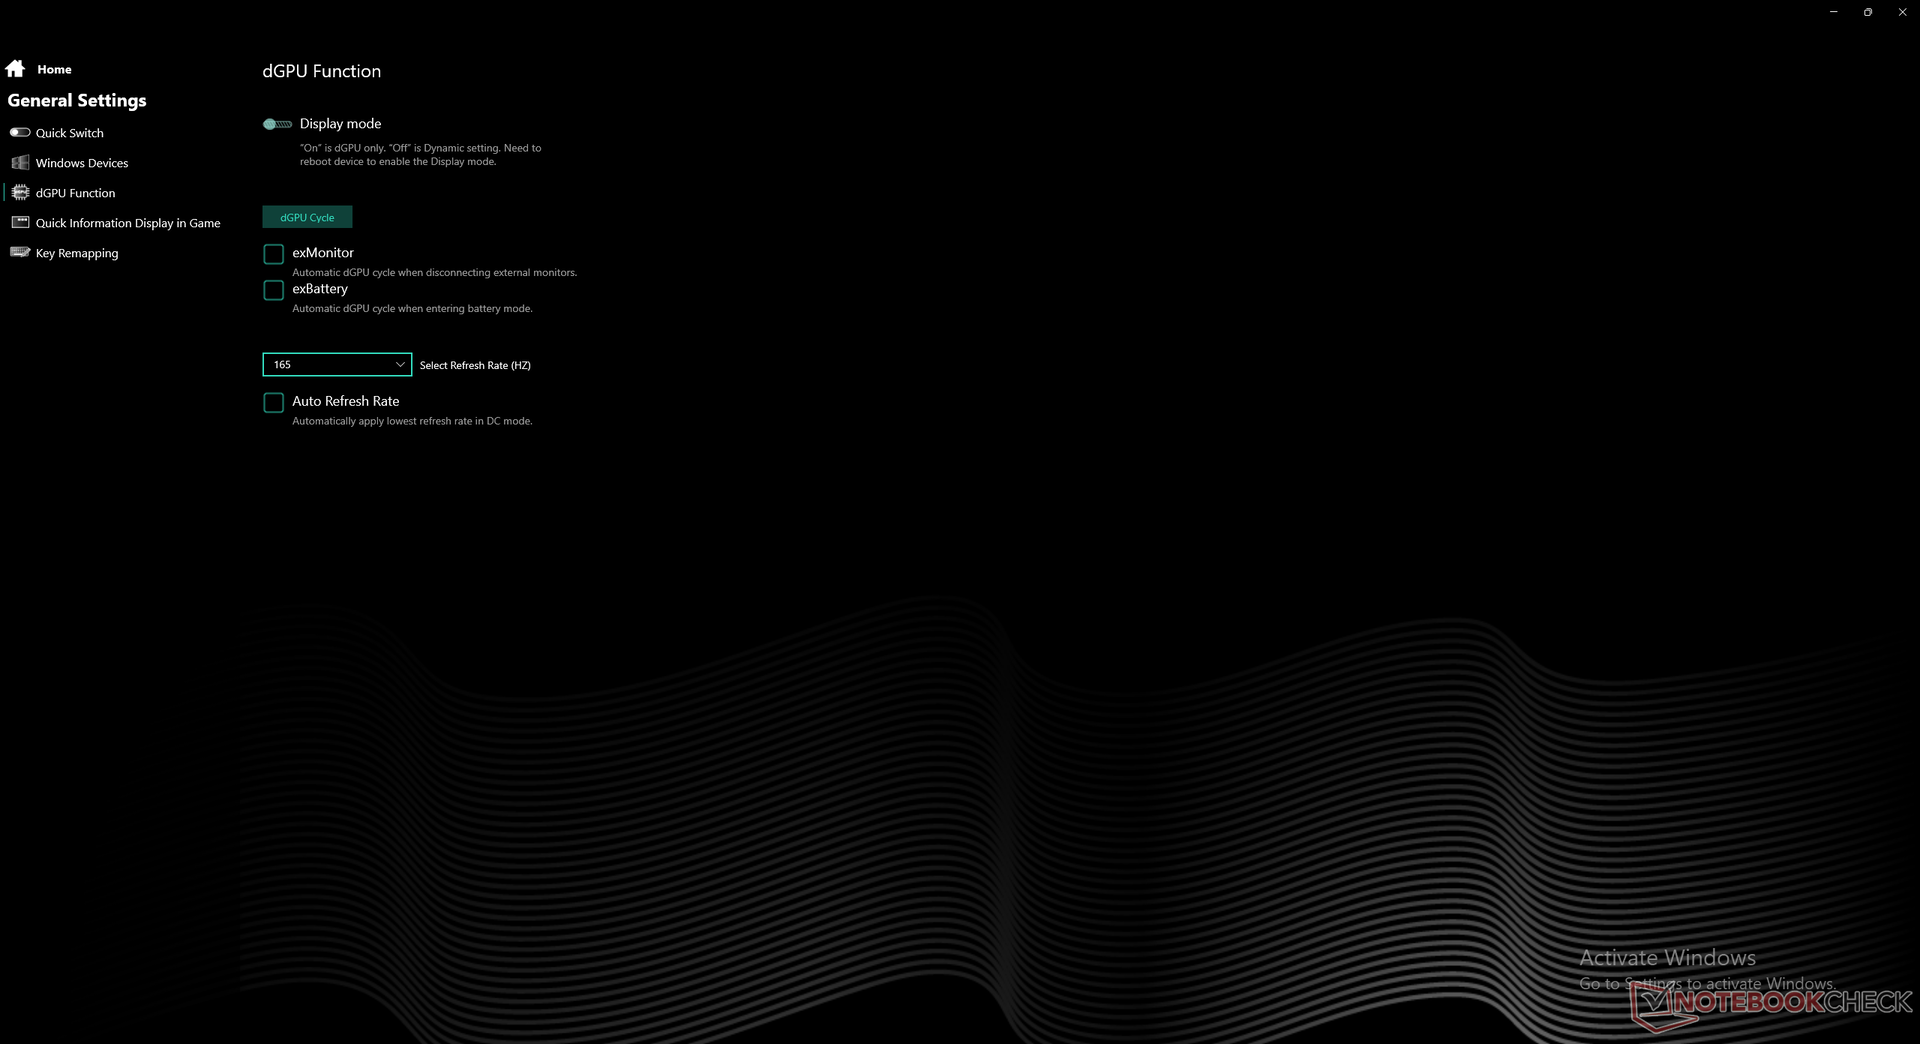
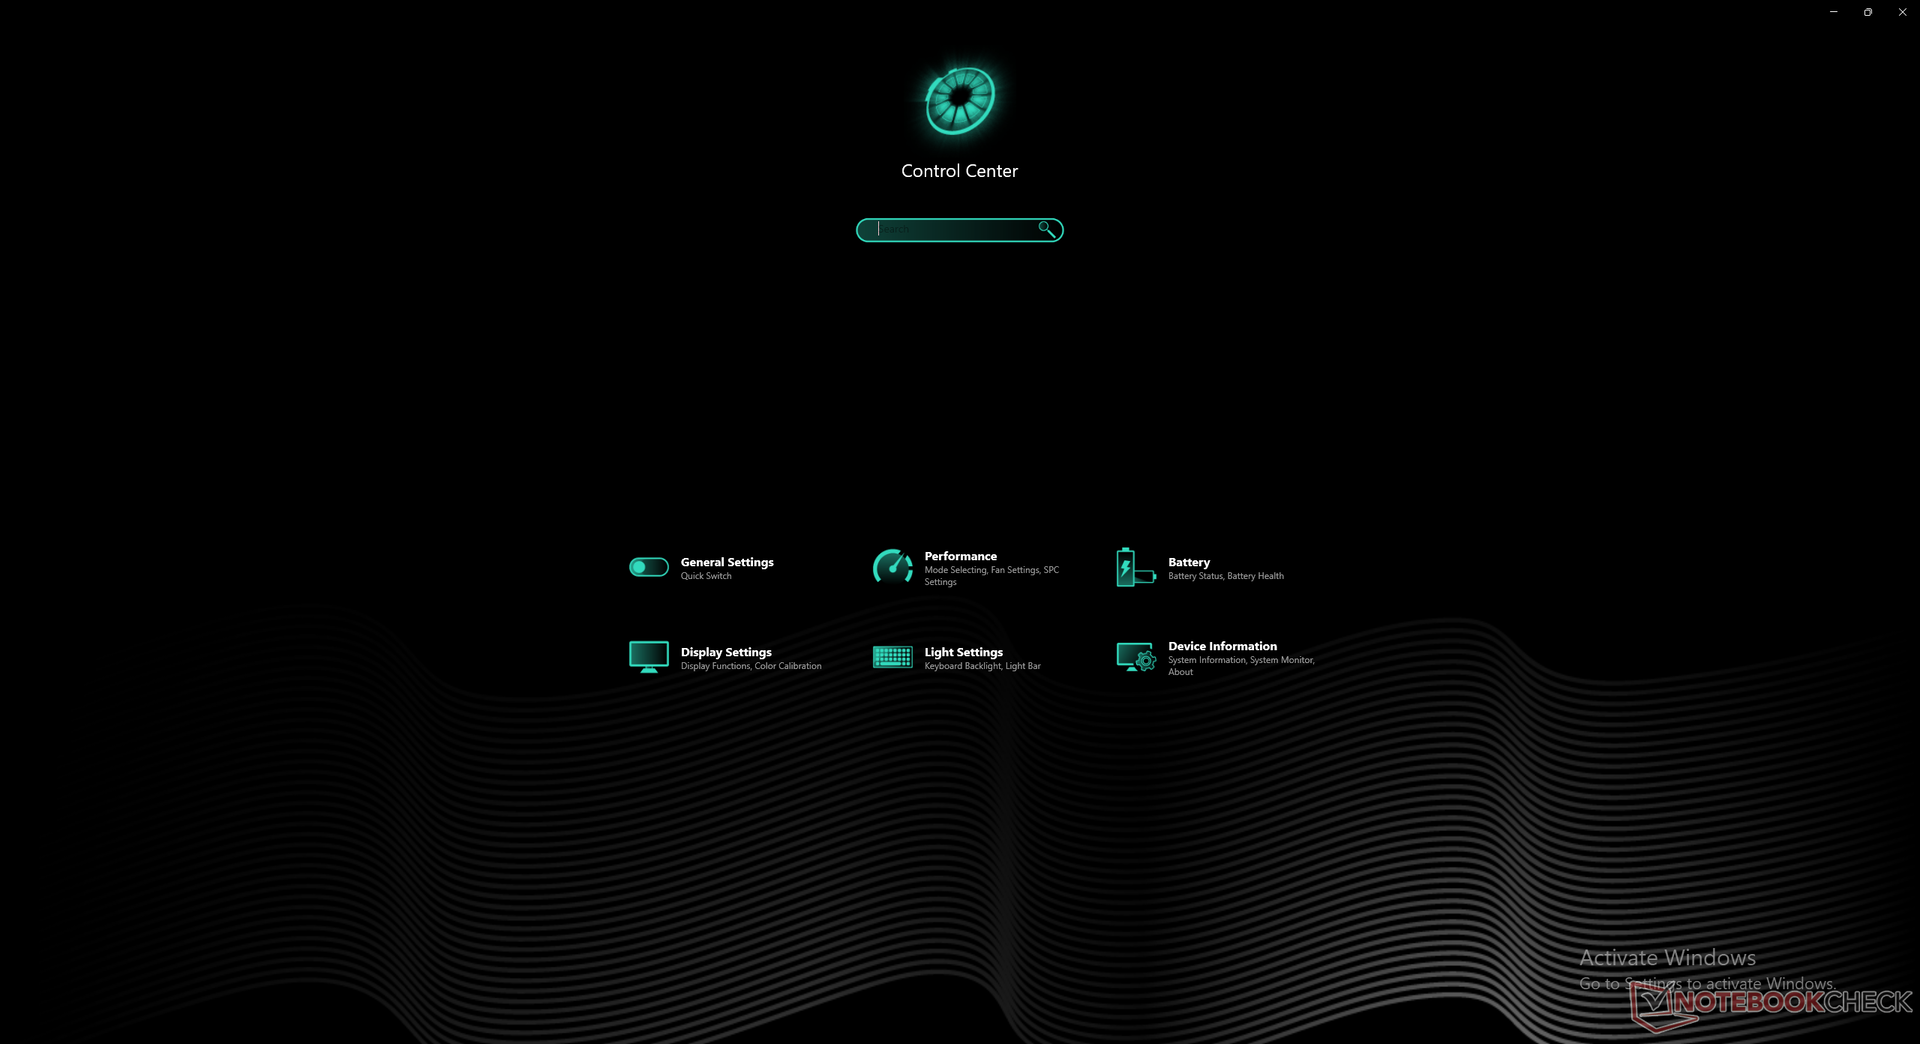
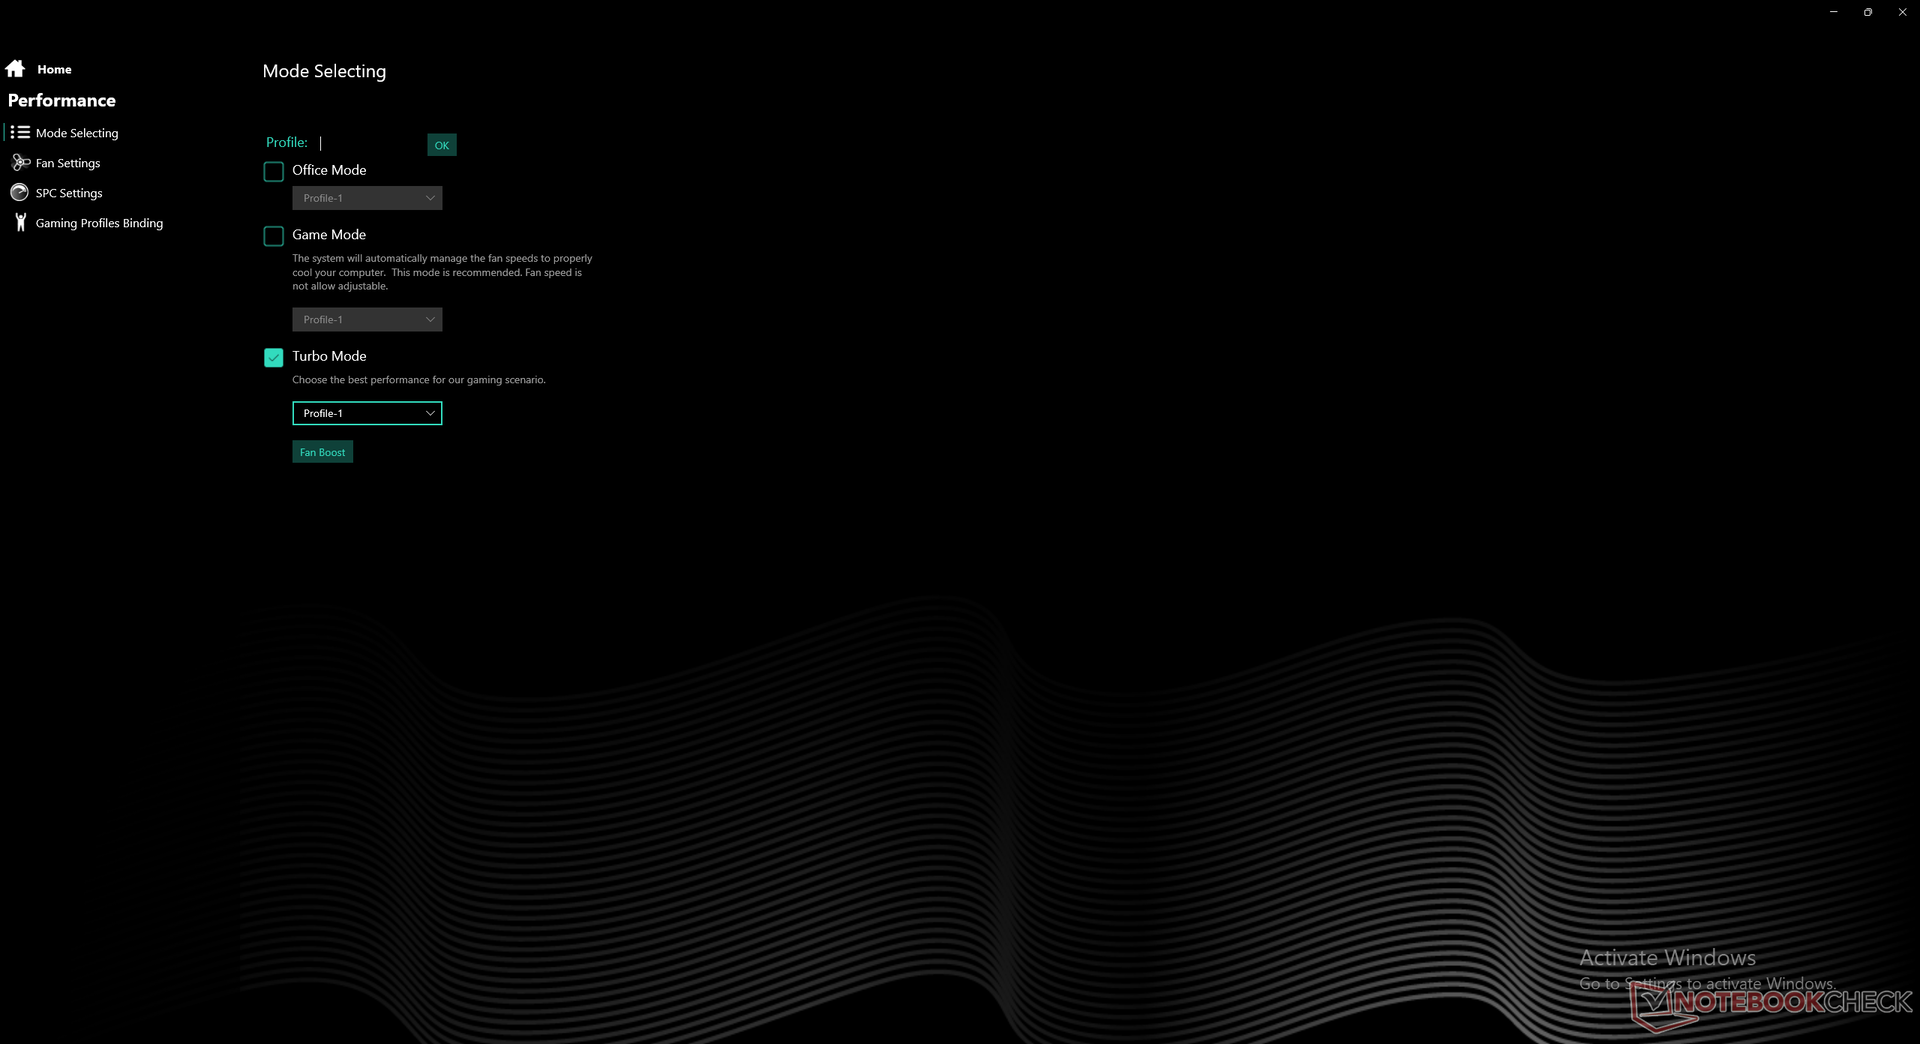
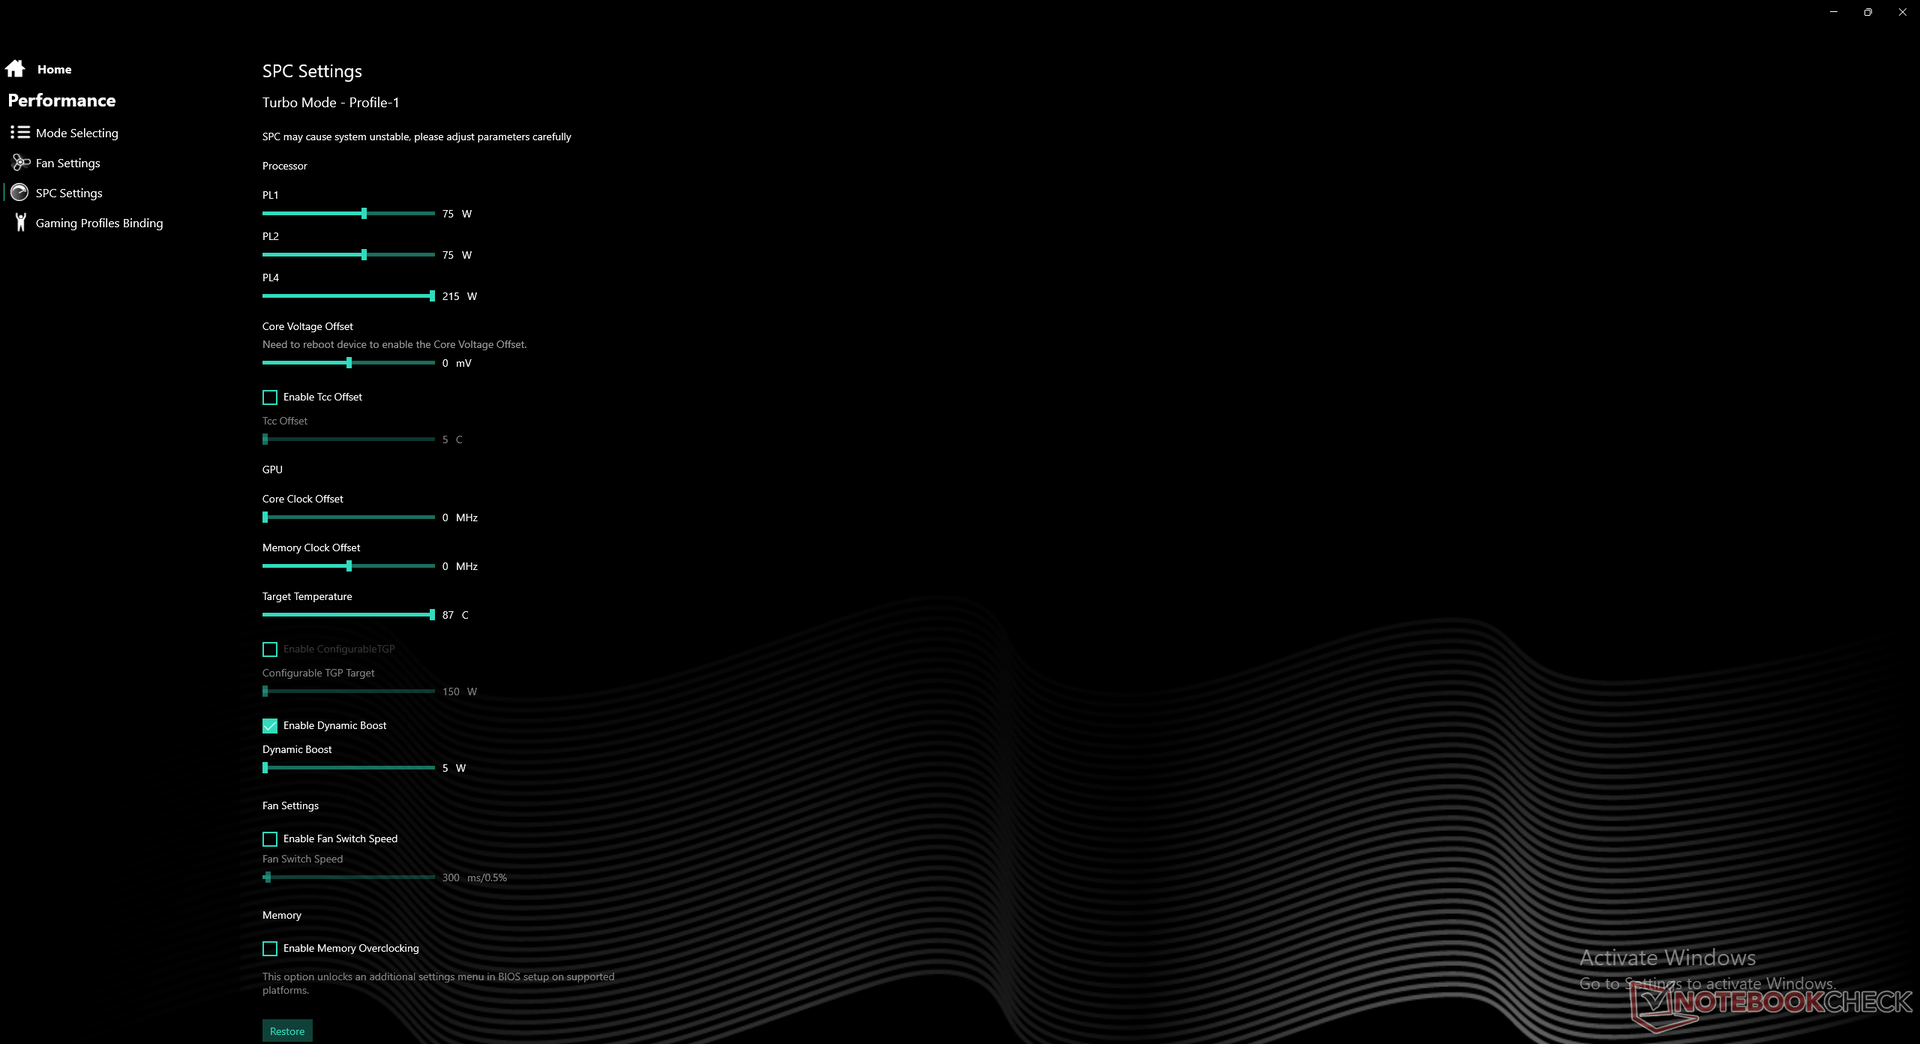
Advanced Optimus (or Optimus 2.0) is not available meaning users will have to switch between discrete GPU and MSHybrid manually via BIOS. Additionally, keep in mind that the GeForce RTX 3080 Ti GPU is set to 150 W TGP by default even though the Nvidia Control Panel states that it is capable of reaching up to 175 W. Users will have to manually set the GPU to 175 W via the included Control Center software instead.
Testing Conditions
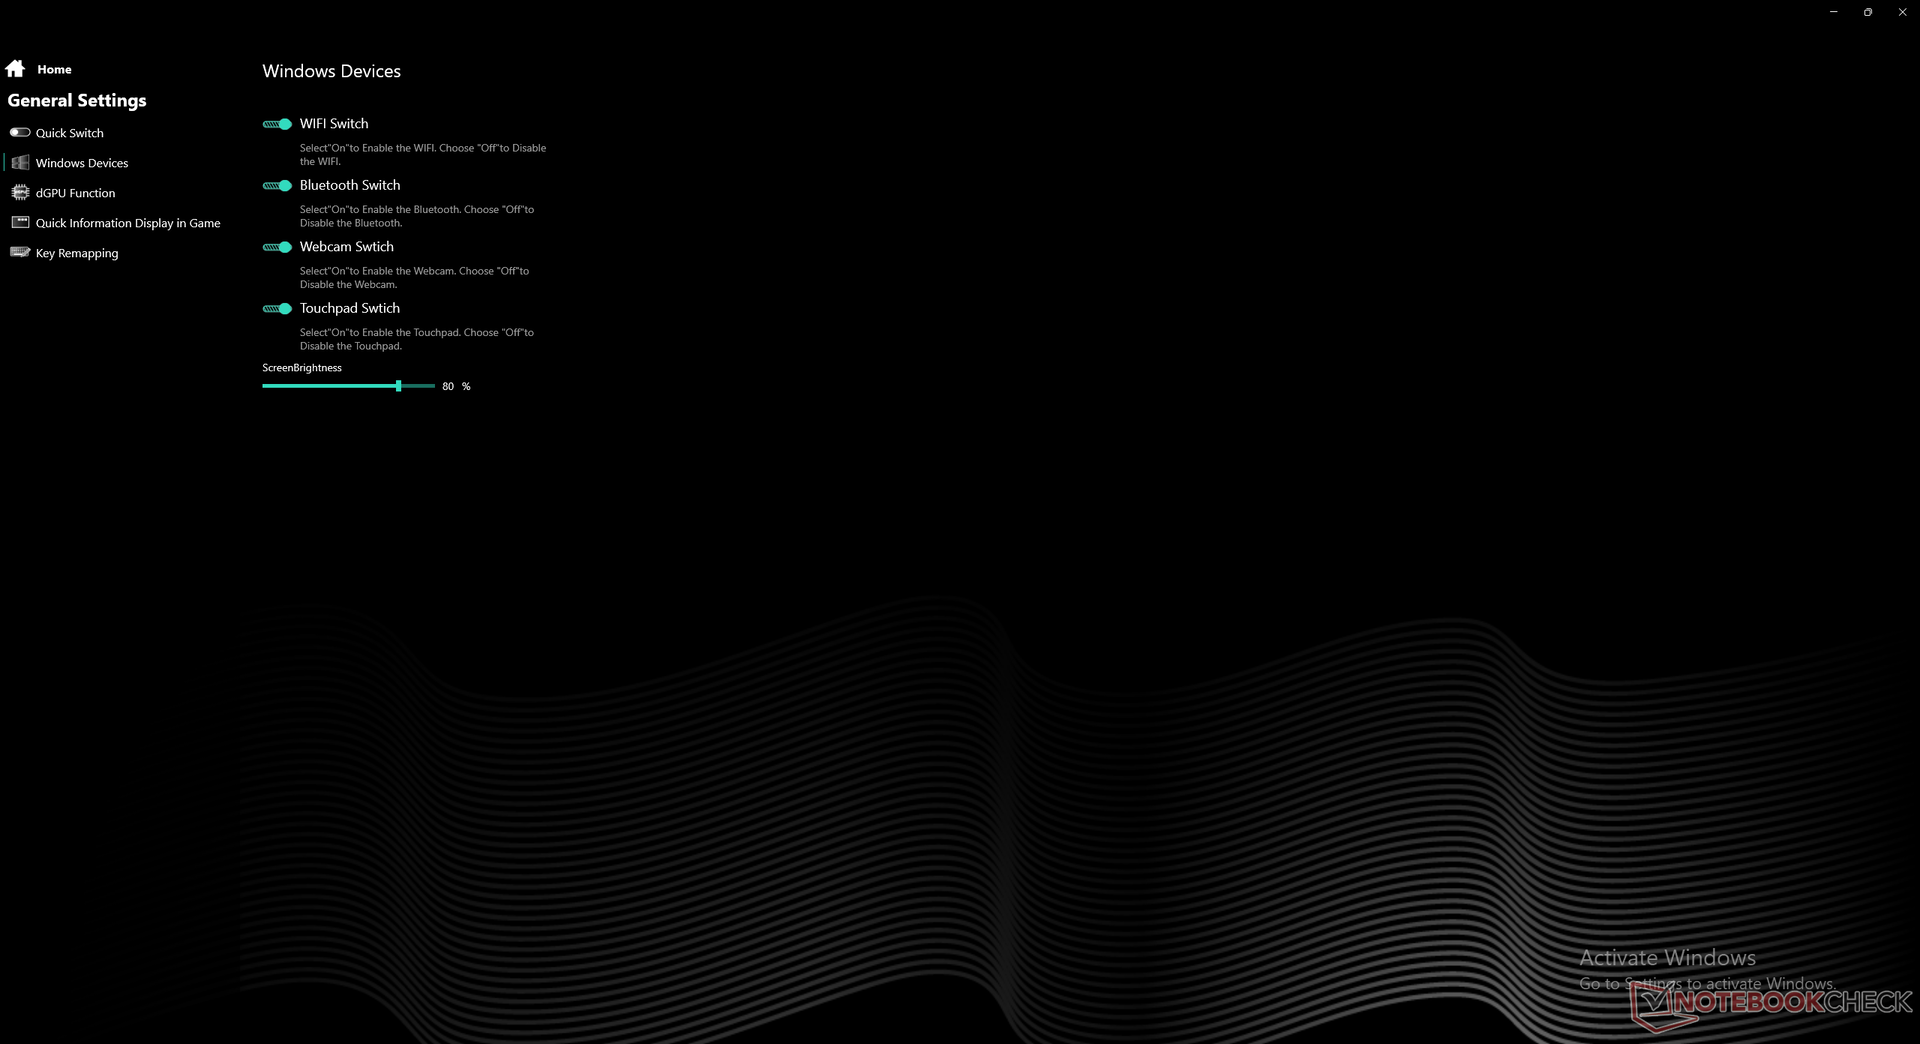
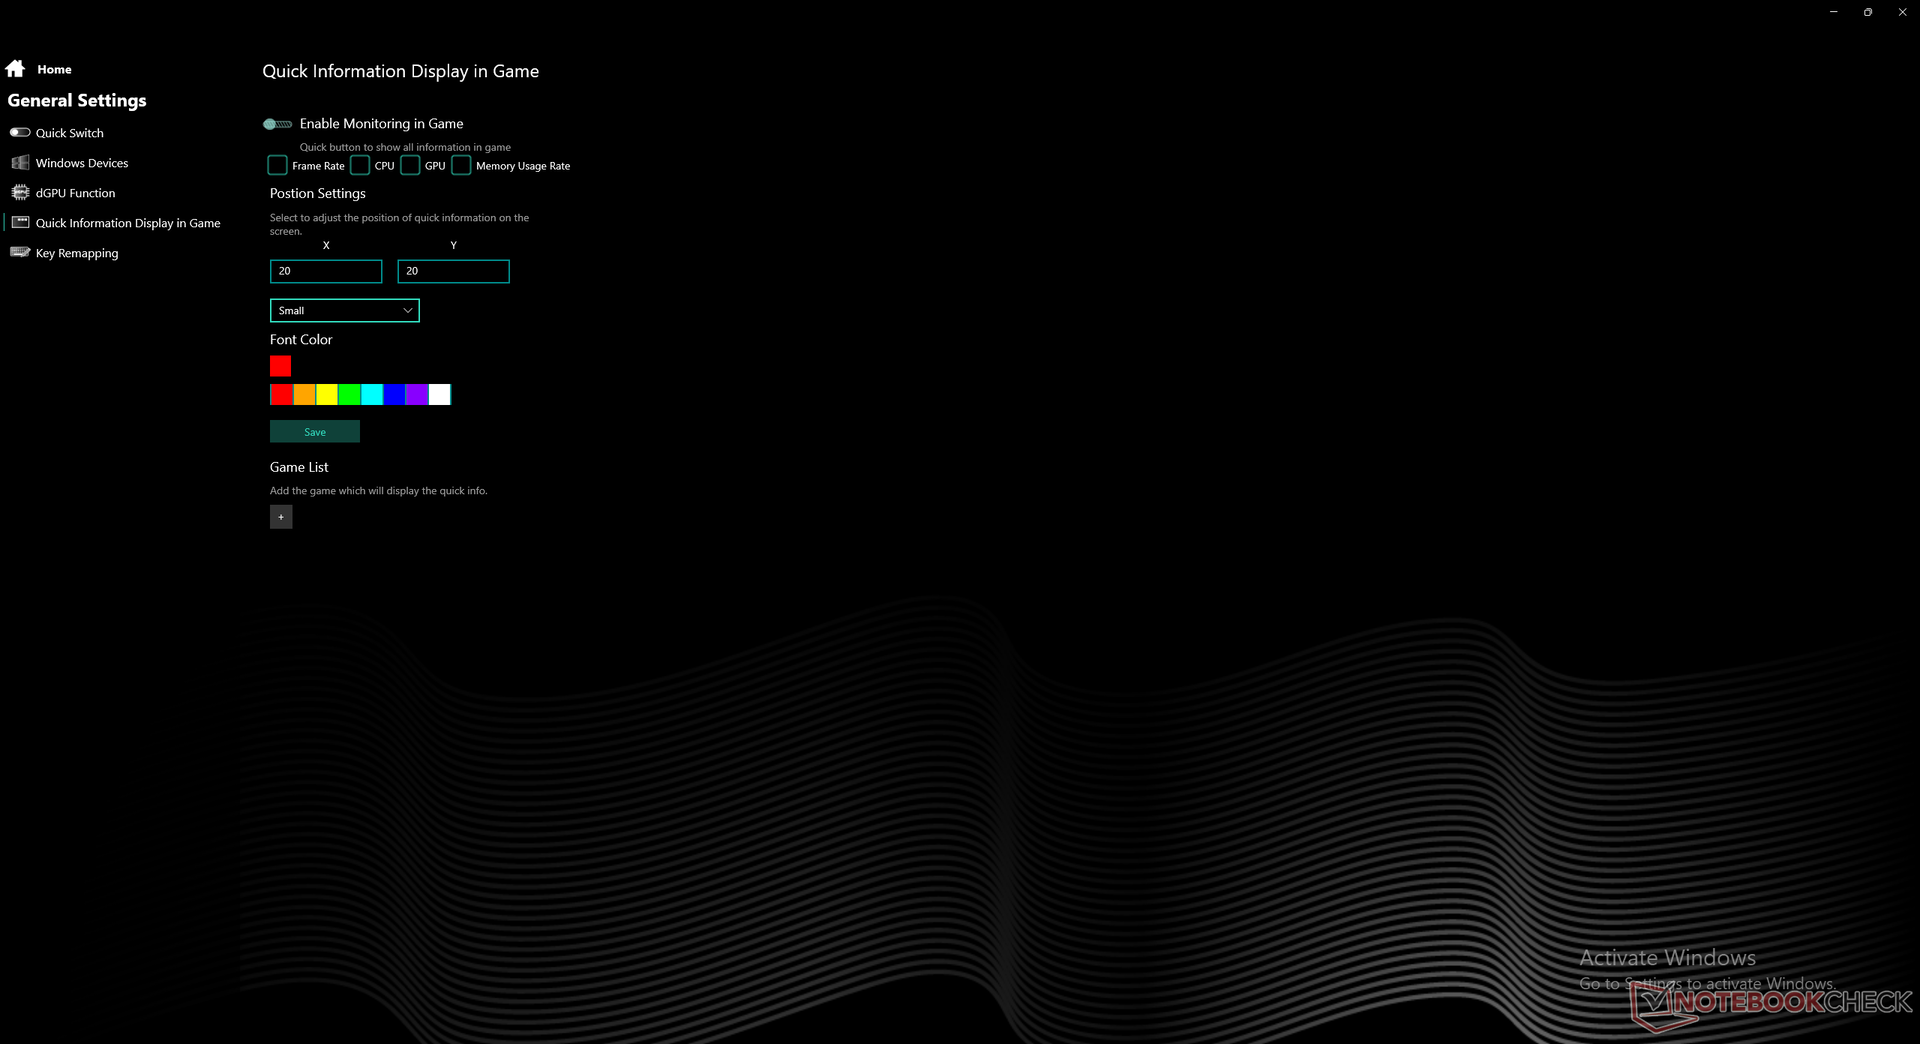
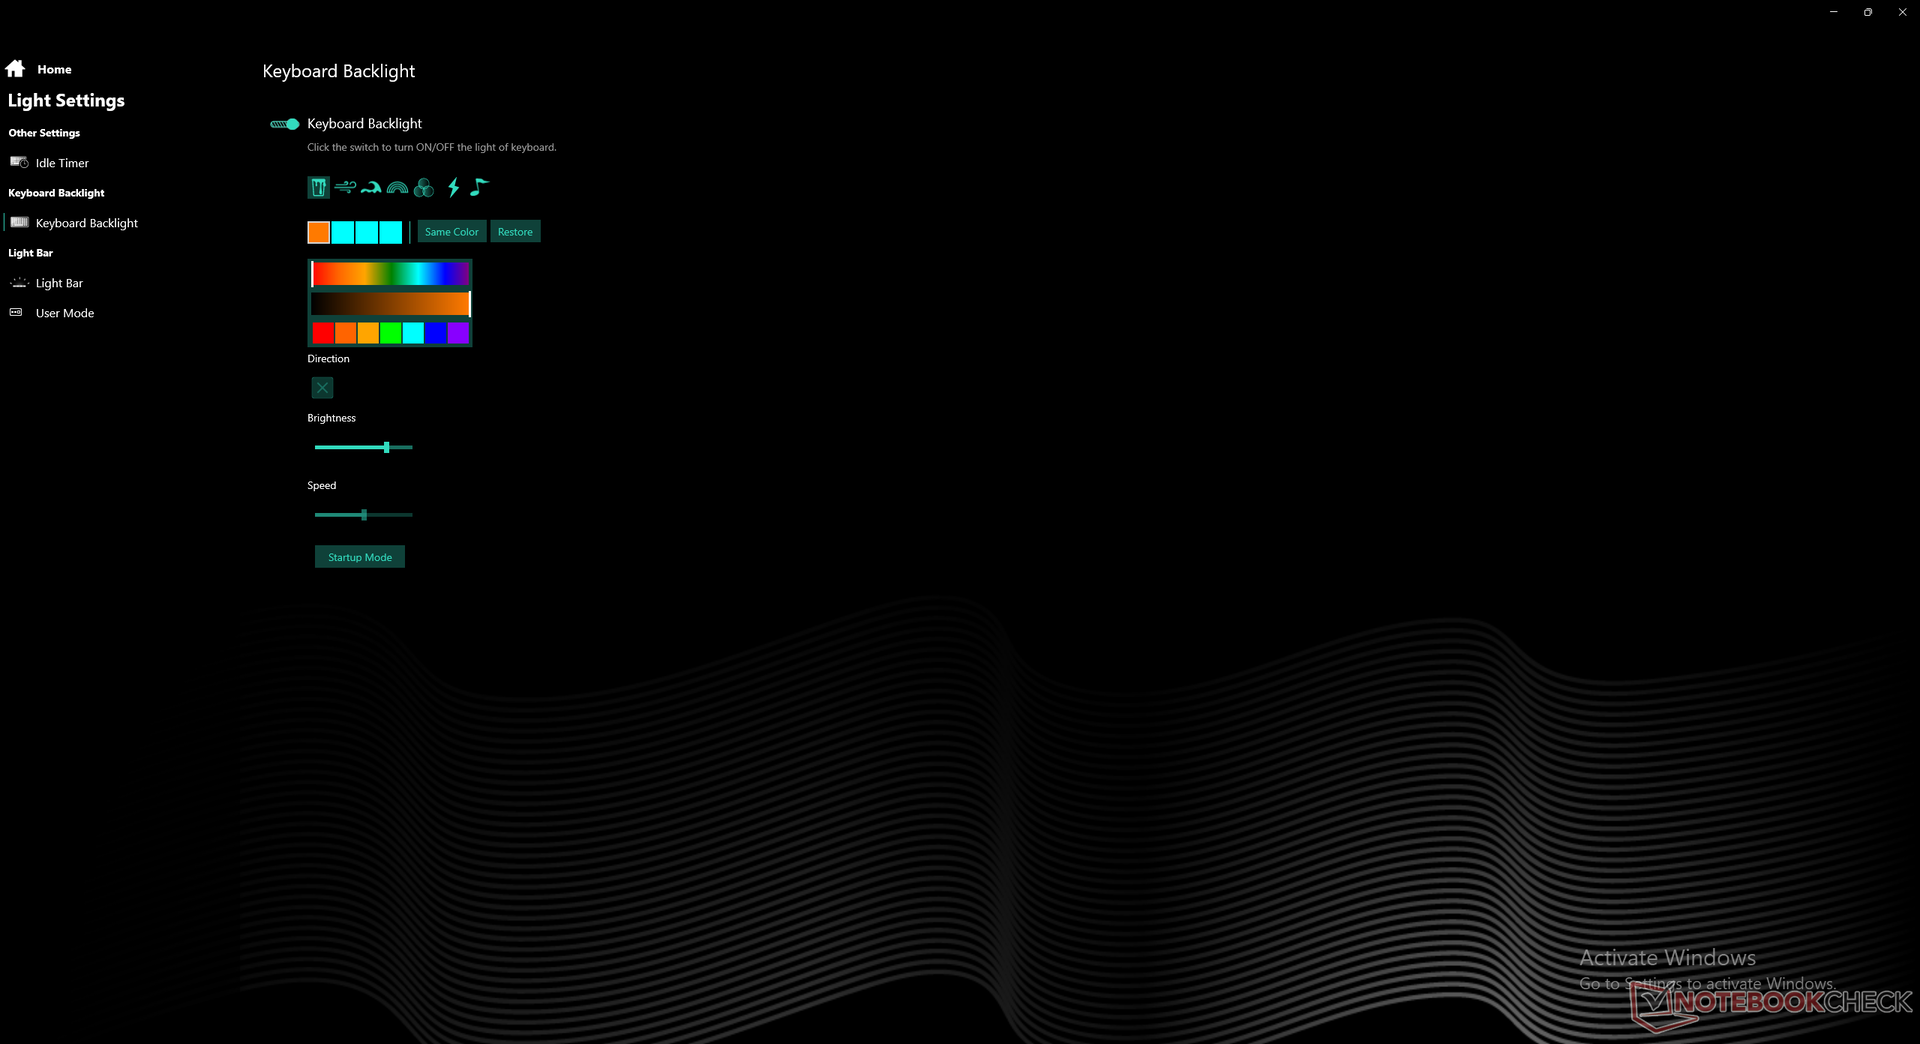
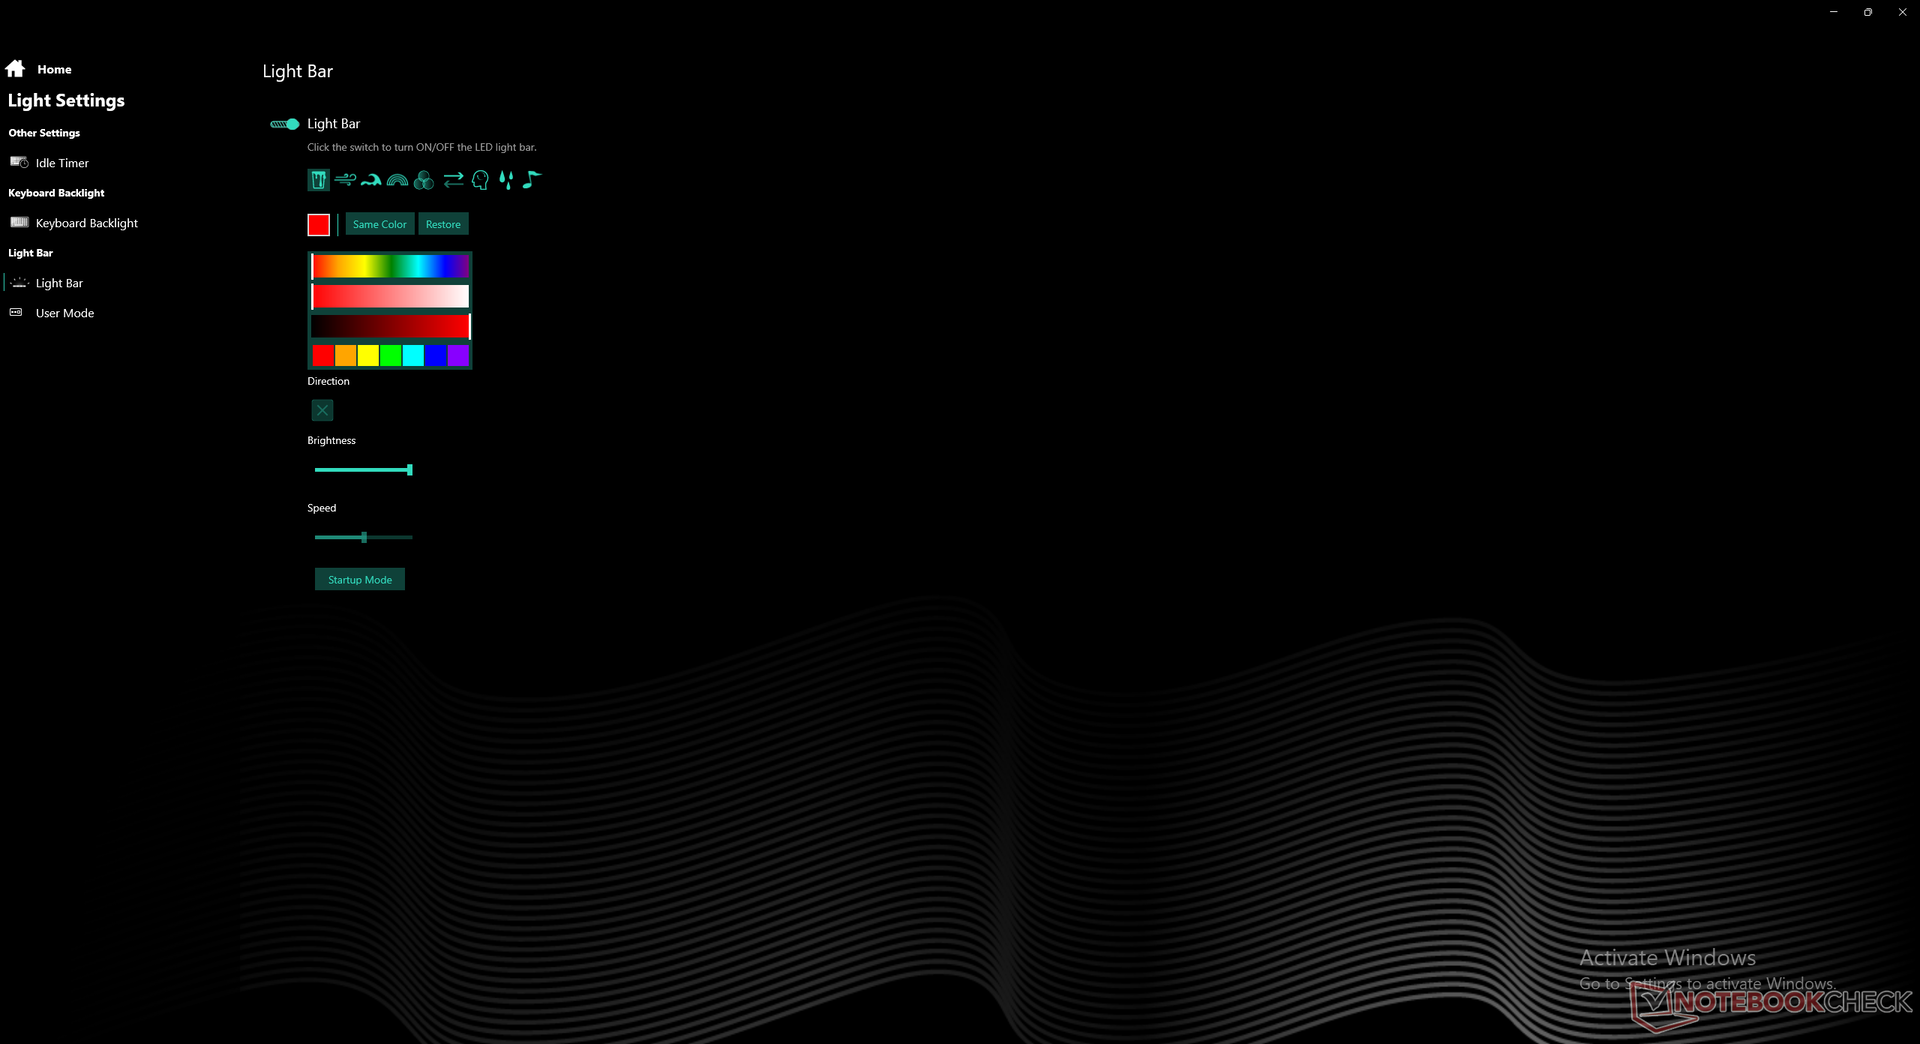
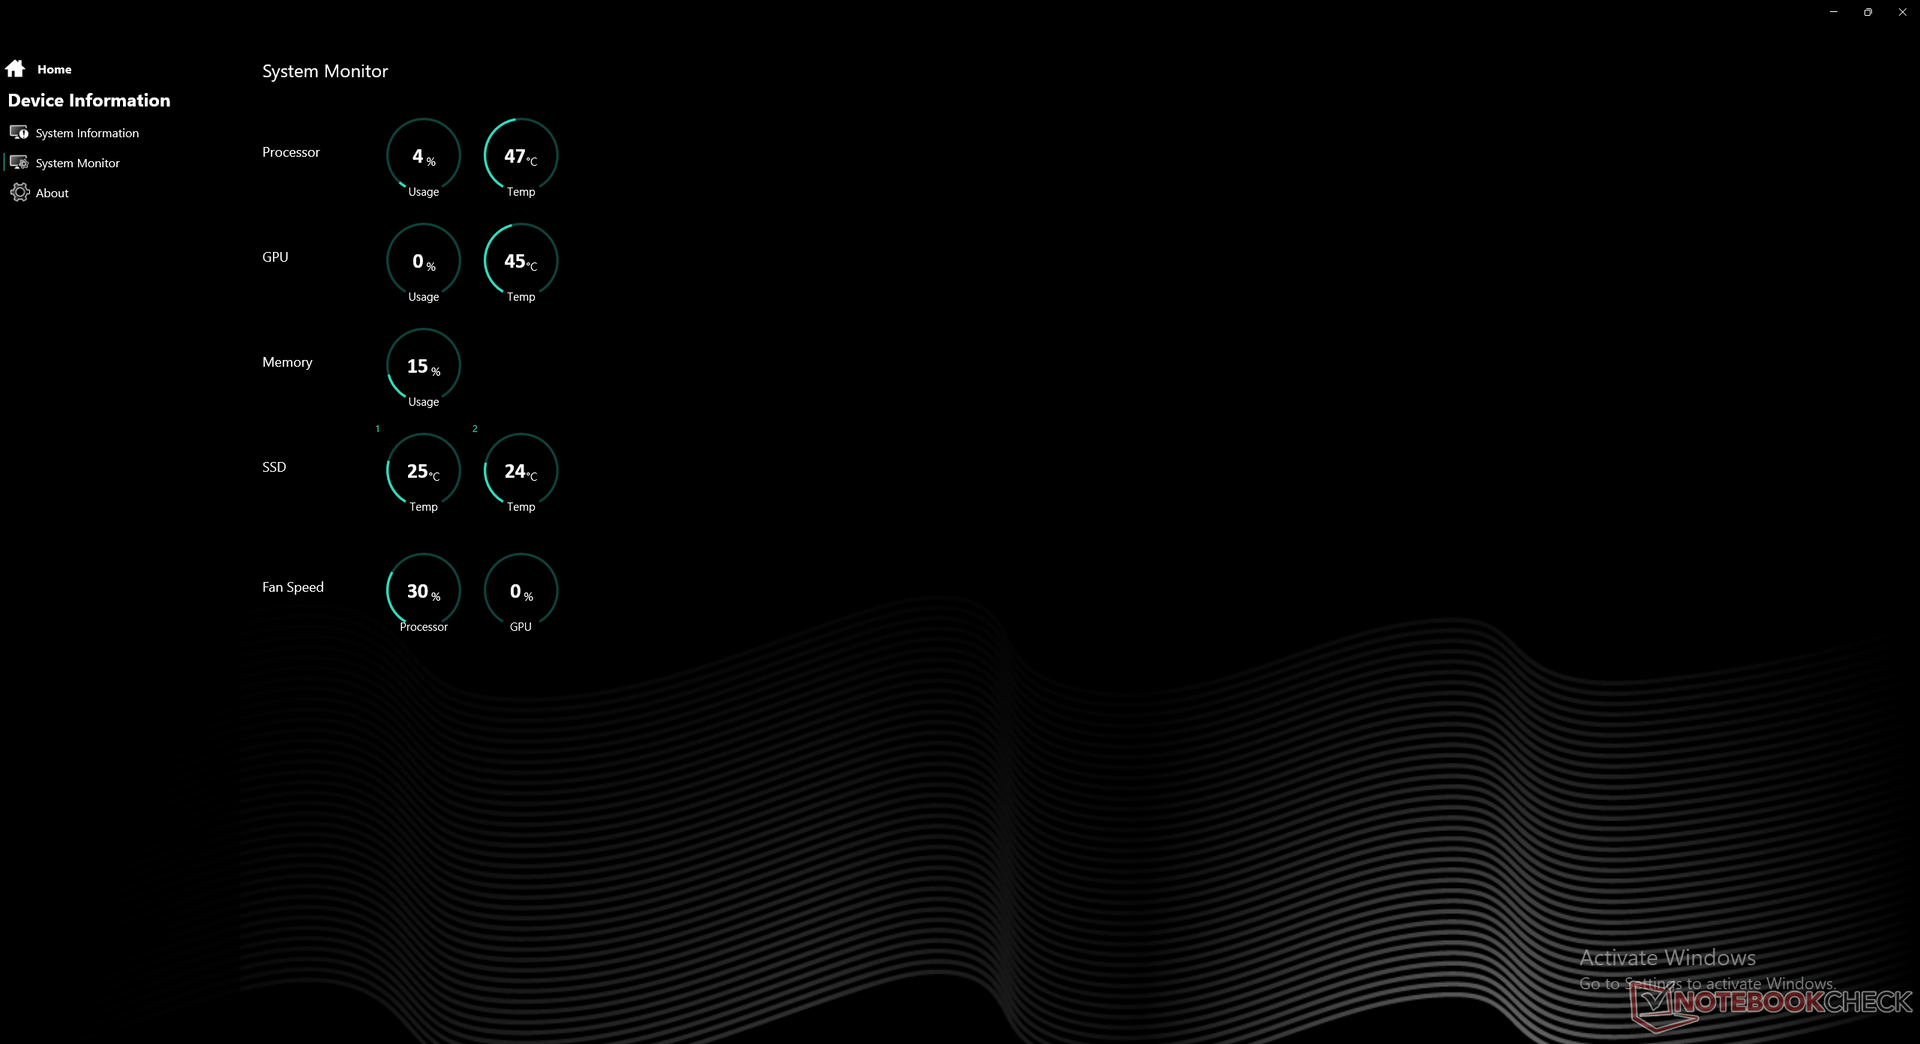
We set our unit to the default BIOS and Control Center settings prior to running any performance benchmarks below albeit with the Turbo power profile active. We highly recommend users become familiar with Control Center as important features are toggled here.

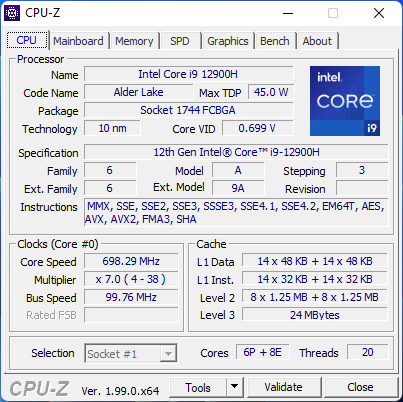
Processor — Noticeable Gen-to-Gen Improvements
Raw CPU performance is only about 9 percent slower than the Core i9-12900HK as found on the new MSI GE76. When compared to the last generation Core i9-11900H that the Core i9-12900H directly replaces, users can expect a single-thread and multi-thread performance uptick of about 20 percent and 30 percent, respectively. This boost is enough to propel the new Intel CPU above the Ryzen 7 5800H and Ryzen 9 5900HX which are some of the fastest mobile Zen 3 CPUs.
Additional details on the Alder Lake platform can be found on our overview here.
Cinebench R15 Multi Loop
Cinebench R23: Multi Core | Single Core
Cinebench R20: CPU (Multi Core) | CPU (Single Core)
Cinebench R15: CPU Multi 64Bit | CPU Single 64Bit
Blender: v2.79 BMW27 CPU
7-Zip 18.03: 7z b 4 | 7z b 4 -mmt1
Geekbench 5.5: Multi-Core | Single-Core
HWBOT x265 Benchmark v2.2: 4k Preset
LibreOffice : 20 Documents To PDF
R Benchmark 2.5: Overall mean
| CPU Performance rating | |
| Average of class Gaming | |
| MSI GE76 Raider | |
| Schenker Uniwill Technology GM7AG8P | |
| Average Intel Core i9-12900H | |
| Schenker XMG Ultra 17 Rocket Lake | |
| MSI WE76 11UM-456 -1! | |
| MSI GS76 Stealth 11UH | |
| Medion Erazer Beast X25 | |
| Schenker XMG Apex 17 M21 | |
| Gigabyte A7 X1 | |
| Maingear Vector Pro MG-VCP17 -2! | |
| Alienware m17 R4 | |
| Lenovo ThinkPad P73-20QR0030GE | |
| Schenker XMG Core 17 (Early 2021) | |
| Acer Aspire 5 A517-52G-79Z5 | |
| Cinebench R20 / CPU (Single Core) | |
| Average of class Gaming (442 - 895, n=111, last 2 years) | |
| Schenker Uniwill Technology GM7AG8P | |
| MSI GE76 Raider | |
| Average Intel Core i9-12900H (624 - 738, n=28) | |
| Schenker XMG Ultra 17 Rocket Lake | |
| MSI WE76 11UM-456 | |
| MSI GS76 Stealth 11UH | |
| Medion Erazer Beast X25 | |
| Maingear Vector Pro MG-VCP17 | |
| Gigabyte A7 X1 | |
| Acer Aspire 5 A517-52G-79Z5 | |
| Schenker XMG Apex 17 M21 | |
| Alienware m17 R4 | |
| Schenker XMG Core 17 (Early 2021) | |
| Lenovo ThinkPad P73-20QR0030GE | |
| Geekbench 5.5 / Single-Core | |
| Average of class Gaming (986 - 2474, n=110, last 2 years) | |
| MSI GE76 Raider | |
| Schenker Uniwill Technology GM7AG8P | |
| Average Intel Core i9-12900H (1631 - 1897, n=31) | |
| Schenker XMG Ultra 17 Rocket Lake | |
| MSI WE76 11UM-456 | |
| MSI GS76 Stealth 11UH | |
| Acer Aspire 5 A517-52G-79Z5 | |
| Gigabyte A7 X1 | |
| Medion Erazer Beast X25 | |
| Schenker XMG Apex 17 M21 | |
| Alienware m17 R4 | |
| Schenker XMG Core 17 (Early 2021) | |
| Lenovo ThinkPad P73-20QR0030GE | |
| HWBOT x265 Benchmark v2.2 / 4k Preset | |
| Average of class Gaming (11.5 - 44.3, n=110, last 2 years) | |
| MSI GE76 Raider | |
| Schenker Uniwill Technology GM7AG8P | |
| Schenker XMG Ultra 17 Rocket Lake | |
| Average Intel Core i9-12900H (8.05 - 22.5, n=28) | |
| Schenker XMG Apex 17 M21 | |
| Medion Erazer Beast X25 | |
| MSI WE76 11UM-456 | |
| MSI GS76 Stealth 11UH | |
| Gigabyte A7 X1 | |
| Alienware m17 R4 | |
| Maingear Vector Pro MG-VCP17 | |
| Lenovo ThinkPad P73-20QR0030GE | |
| Schenker XMG Core 17 (Early 2021) | |
| Acer Aspire 5 A517-52G-79Z5 | |
| LibreOffice / 20 Documents To PDF | |
| Gigabyte A7 X1 | |
| Schenker XMG Core 17 (Early 2021) | |
| Acer Aspire 5 A517-52G-79Z5 | |
| Alienware m17 R4 | |
| Lenovo ThinkPad P73-20QR0030GE | |
| Medion Erazer Beast X25 | |
| MSI GS76 Stealth 11UH | |
| Average of class Gaming (19 - 88.8, n=110, last 2 years) | |
| Schenker XMG Apex 17 M21 | |
| MSI WE76 11UM-456 | |
| Maingear Vector Pro MG-VCP17 | |
| Schenker Uniwill Technology GM7AG8P | |
| Average Intel Core i9-12900H (36.8 - 59.8, n=28) | |
| Schenker XMG Ultra 17 Rocket Lake | |
| MSI GE76 Raider | |
Cinebench R23: Multi Core | Single Core
Cinebench R20: CPU (Multi Core) | CPU (Single Core)
Cinebench R15: CPU Multi 64Bit | CPU Single 64Bit
Blender: v2.79 BMW27 CPU
7-Zip 18.03: 7z b 4 | 7z b 4 -mmt1
Geekbench 5.5: Multi-Core | Single-Core
HWBOT x265 Benchmark v2.2: 4k Preset
LibreOffice : 20 Documents To PDF
R Benchmark 2.5: Overall mean
* ... smaller is better
| AIDA64 / FP32 Ray-Trace | |
| Schenker Uniwill Technology GM7AG8P | |
| AIDA64 / FPU Julia | |
| Schenker Uniwill Technology GM7AG8P | |
| AIDA64 / CPU SHA3 | |
| Schenker Uniwill Technology GM7AG8P | |
| AIDA64 / CPU Queen | |
| Schenker Uniwill Technology GM7AG8P | |
| AIDA64 / FPU SinJulia | |
| Schenker Uniwill Technology GM7AG8P | |
| AIDA64 / FPU Mandel | |
| Schenker Uniwill Technology GM7AG8P | |
| AIDA64 / CPU AES | |
| Schenker Uniwill Technology GM7AG8P | |
| AIDA64 / CPU ZLib | |
| Schenker Uniwill Technology GM7AG8P | |
| Schenker XMG NEO 17 GM7TG8S | |
| Maingear Vector Pro MG-VCP17 | |
| Razer Blade 17 RTX 3070 | |
| Alienware x17 RTX 3080 P48E | |
| AIDA64 / FP64 Ray-Trace | |
| Schenker Uniwill Technology GM7AG8P | |
| AIDA64 / CPU PhotoWorxx | |
| Schenker Uniwill Technology GM7AG8P | |
System Performance
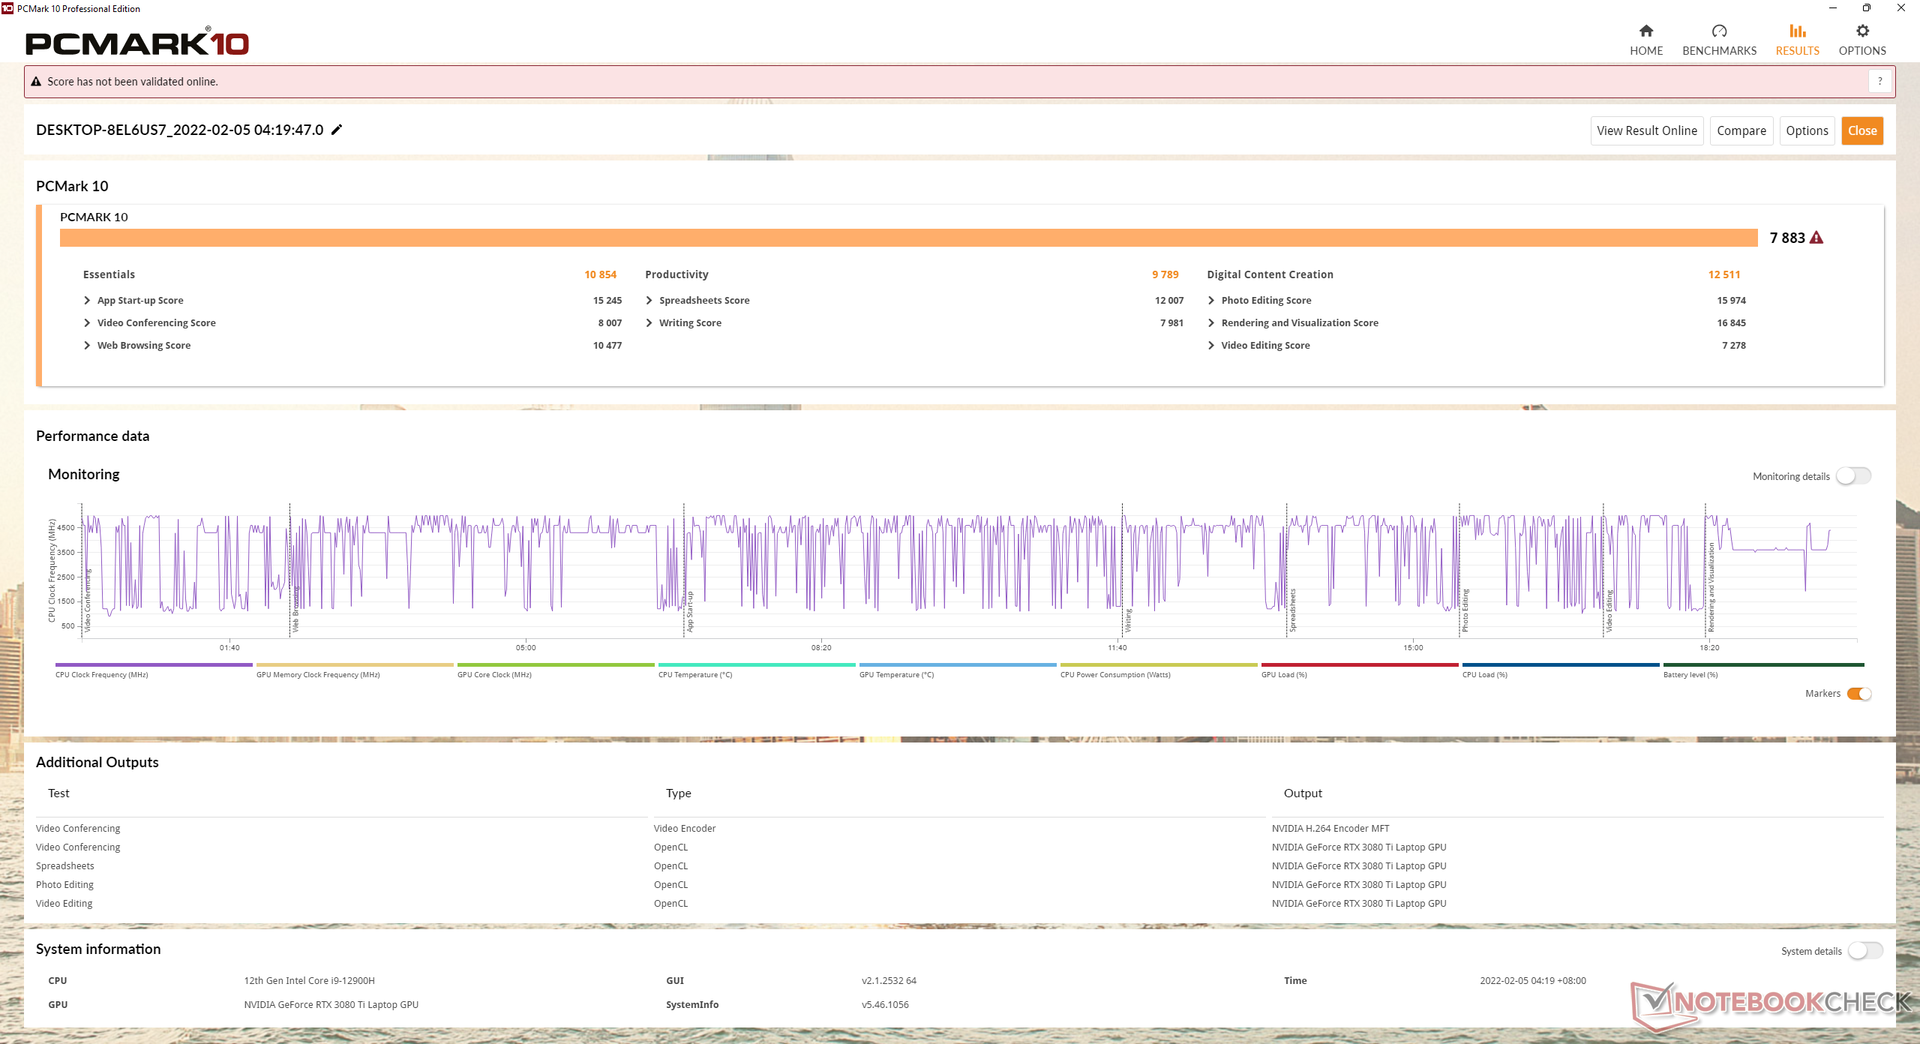
PCMark scores are some of the highest in our database essentially rivaling the Schenker XMG Ultra 17 equipped with the desktop Core i9-11900K.
| PCMark 10 / Score | |
| Schenker XMG Ultra 17 Rocket Lake | |
| Schenker Uniwill Technology GM7AG8P | |
| Average Intel Core i9-12900H, NVIDIA GeForce RTX 3080 Ti Laptop GPU (7139 - 8083, n=6) | |
| Eurocom Sky X4C i9-9900KS | |
| Schenker XMG Ultra 17 Comet Lake | |
| Schenker XMG NEO 17 GM7TG8S | |
| Schenker XMG Apex 17 M21 | |
| PCMark 10 / Essentials | |
| Eurocom Sky X4C i9-9900KS | |
| Schenker XMG Ultra 17 Rocket Lake | |
| Schenker Uniwill Technology GM7AG8P | |
| Average Intel Core i9-12900H, NVIDIA GeForce RTX 3080 Ti Laptop GPU (10254 - 11178, n=6) | |
| Schenker XMG Ultra 17 Comet Lake | |
| Schenker XMG NEO 17 GM7TG8S | |
| Schenker XMG Apex 17 M21 | |
| PCMark 10 / Productivity | |
| Average Intel Core i9-12900H, NVIDIA GeForce RTX 3080 Ti Laptop GPU (9102 - 11186, n=6) | |
| Schenker XMG Ultra 17 Rocket Lake | |
| Schenker Uniwill Technology GM7AG8P | |
| Schenker XMG NEO 17 GM7TG8S | |
| Schenker XMG Apex 17 M21 | |
| Eurocom Sky X4C i9-9900KS | |
| Schenker XMG Ultra 17 Comet Lake | |
| PCMark 10 / Digital Content Creation | |
| Schenker Uniwill Technology GM7AG8P | |
| Schenker XMG Ultra 17 Rocket Lake | |
| Schenker XMG Ultra 17 Comet Lake | |
| Average Intel Core i9-12900H, NVIDIA GeForce RTX 3080 Ti Laptop GPU (9847 - 12627, n=6) | |
| Eurocom Sky X4C i9-9900KS | |
| Schenker XMG NEO 17 GM7TG8S | |
| Schenker XMG Apex 17 M21 | |
| PCMark 10 Score | 7883 points | |
Help | ||
| AIDA64 / Memory Copy | |
| MSI GE76 Raider | |
| Schenker Uniwill Technology GM7AG8P | |
| Schenker XMG Pro 17 (Late 2021, RTX 3080) | |
| Schenker XMG Apex 17 M21 | |
| AIDA64 / Memory Read | |
| MSI GE76 Raider | |
| Schenker Uniwill Technology GM7AG8P | |
| Schenker XMG Pro 17 (Late 2021, RTX 3080) | |
| Schenker XMG Apex 17 M21 | |
| AIDA64 / Memory Write | |
| Schenker Uniwill Technology GM7AG8P | |
| MSI GE76 Raider | |
| Schenker XMG Apex 17 M21 | |
| Schenker XMG Pro 17 (Late 2021, RTX 3080) | |
| AIDA64 / Memory Latency | |
| MSI GE76 Raider | |
| Schenker XMG Pro 17 (Late 2021, RTX 3080) | |
| Schenker XMG Apex 17 M21 | |
| Razer Blade 17 RTX 3070 | |
| Alienware x17 RTX 3080 P48E | |
| Schenker Uniwill Technology GM7AG8P | |
* ... smaller is better
DPC Latency
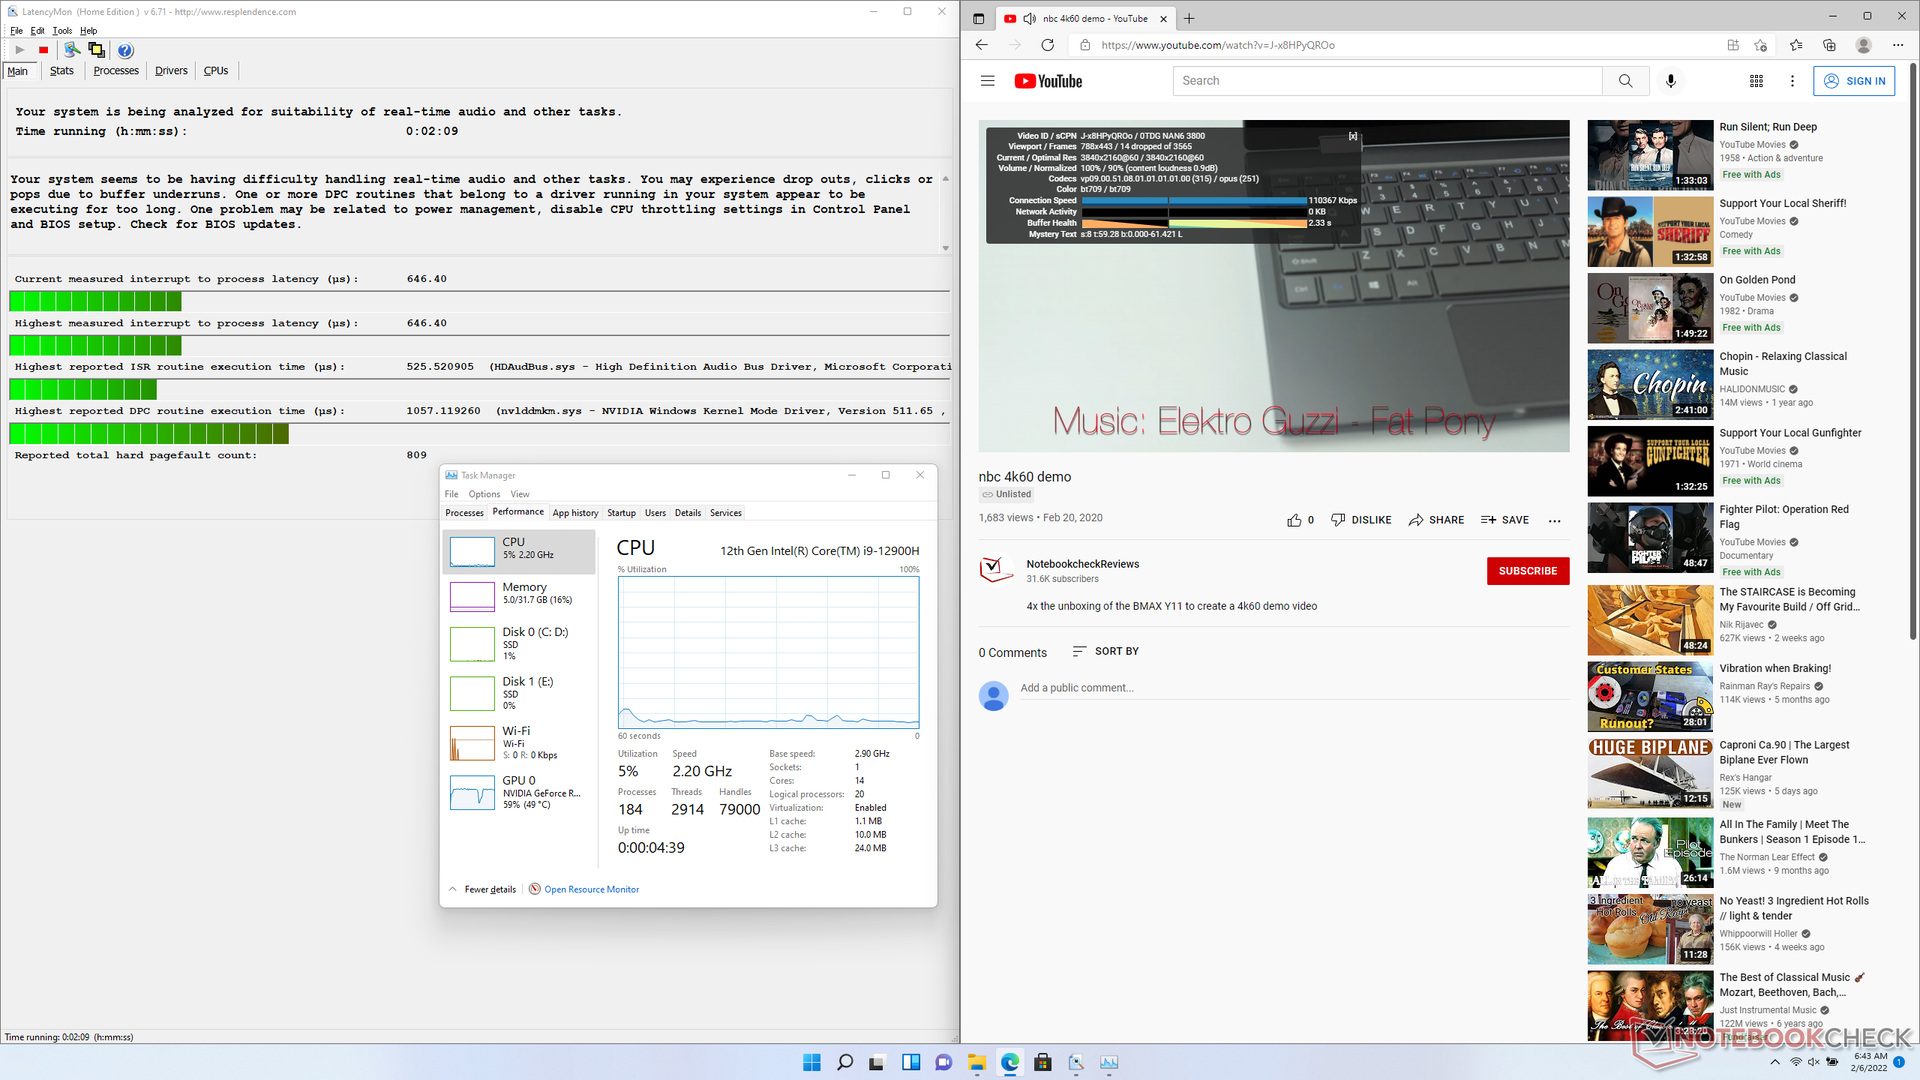
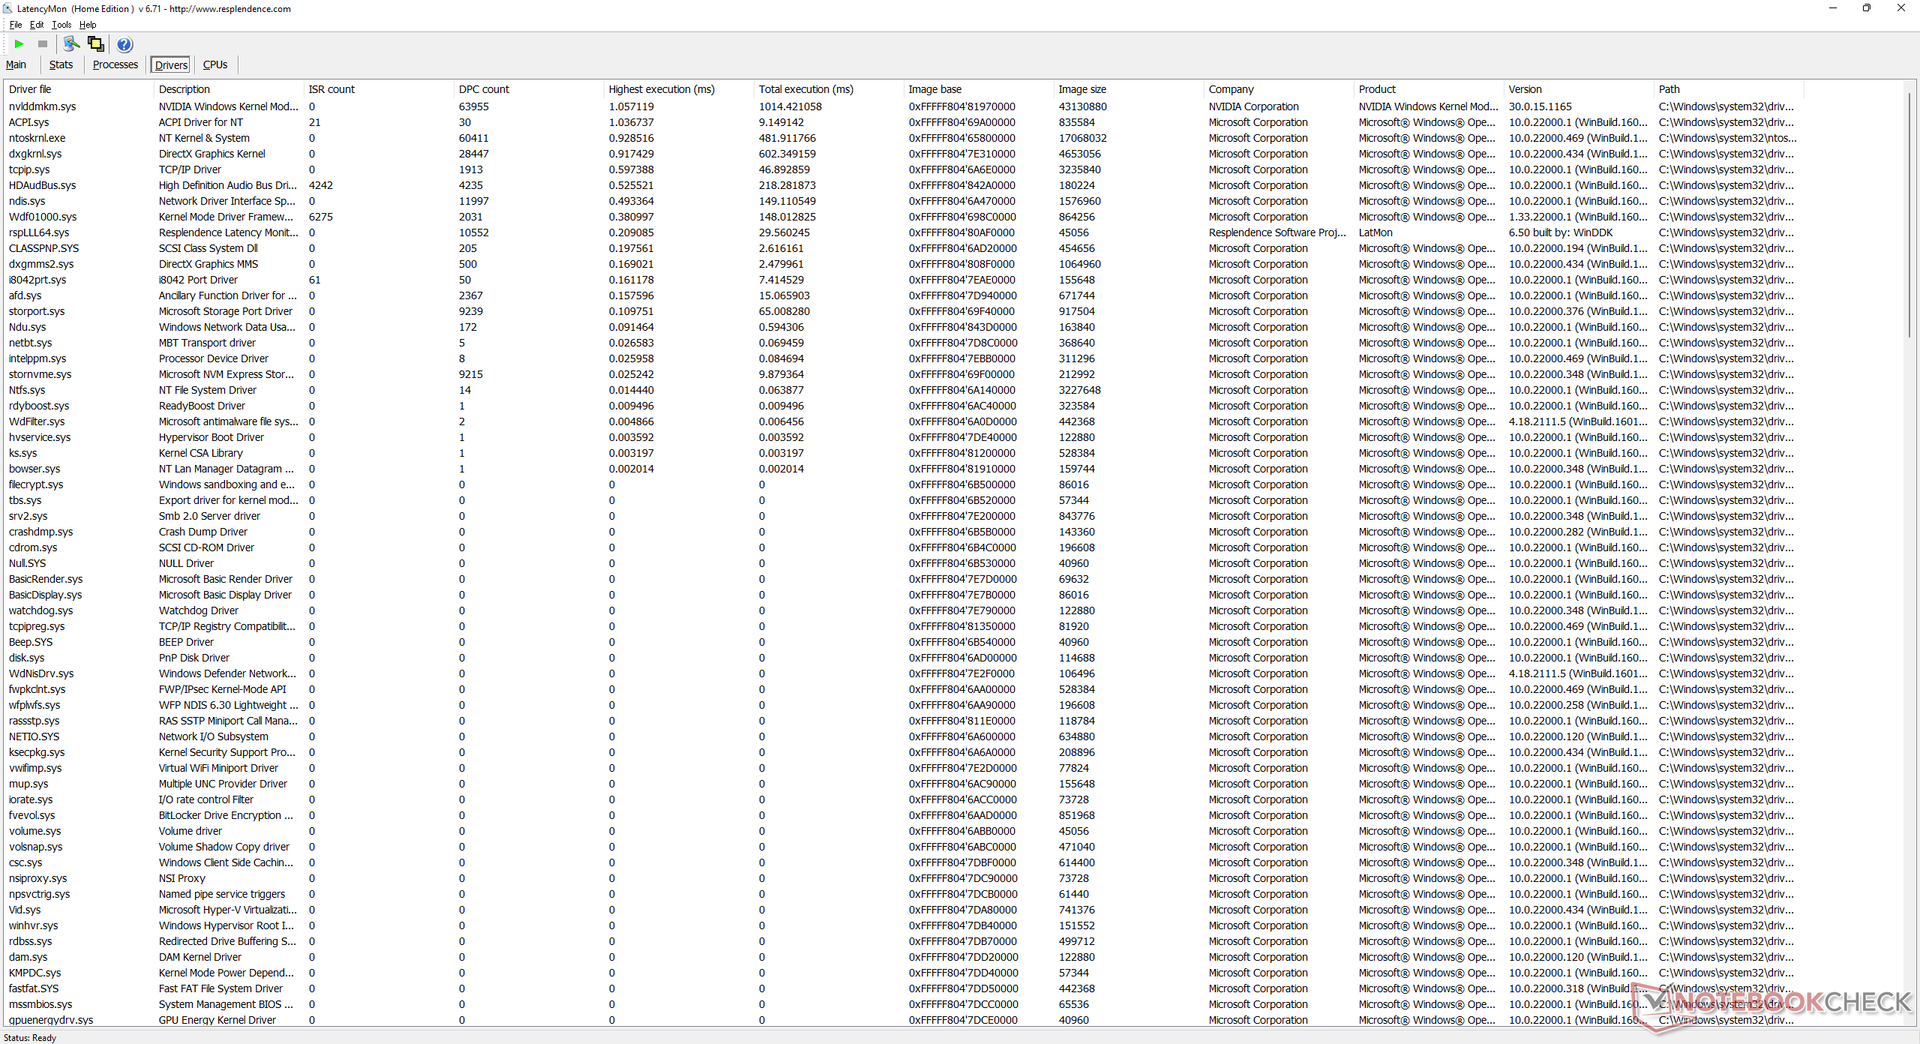
LatencyMon shows minor DPC issues when opening multiple tabs on our homepage. 4K video playback at 60 FPS is smooth but not perfect as we're able to record 14 dropped frames during our minute-long video test.
| DPC Latencies / LatencyMon - interrupt to process latency (max), Web, Youtube, Prime95 | |
| Schenker XMG NEO 17 GM7TG8S | |
| Alienware x17 RTX 3080 P48E | |
| MSI GS76 Stealth 11UH | |
| Schenker Uniwill Technology GM7AG8P | |
| Maingear Vector Pro MG-VCP17 | |
| Razer Blade 17 RTX 3070 | |
* ... smaller is better
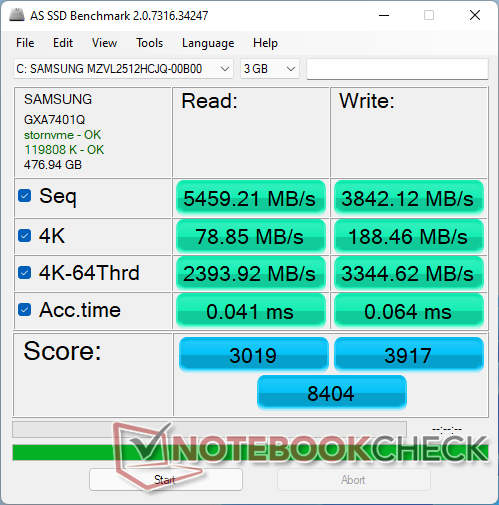
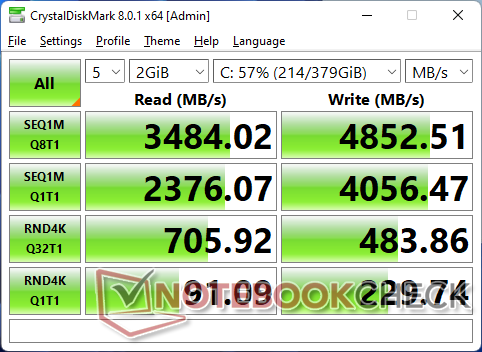
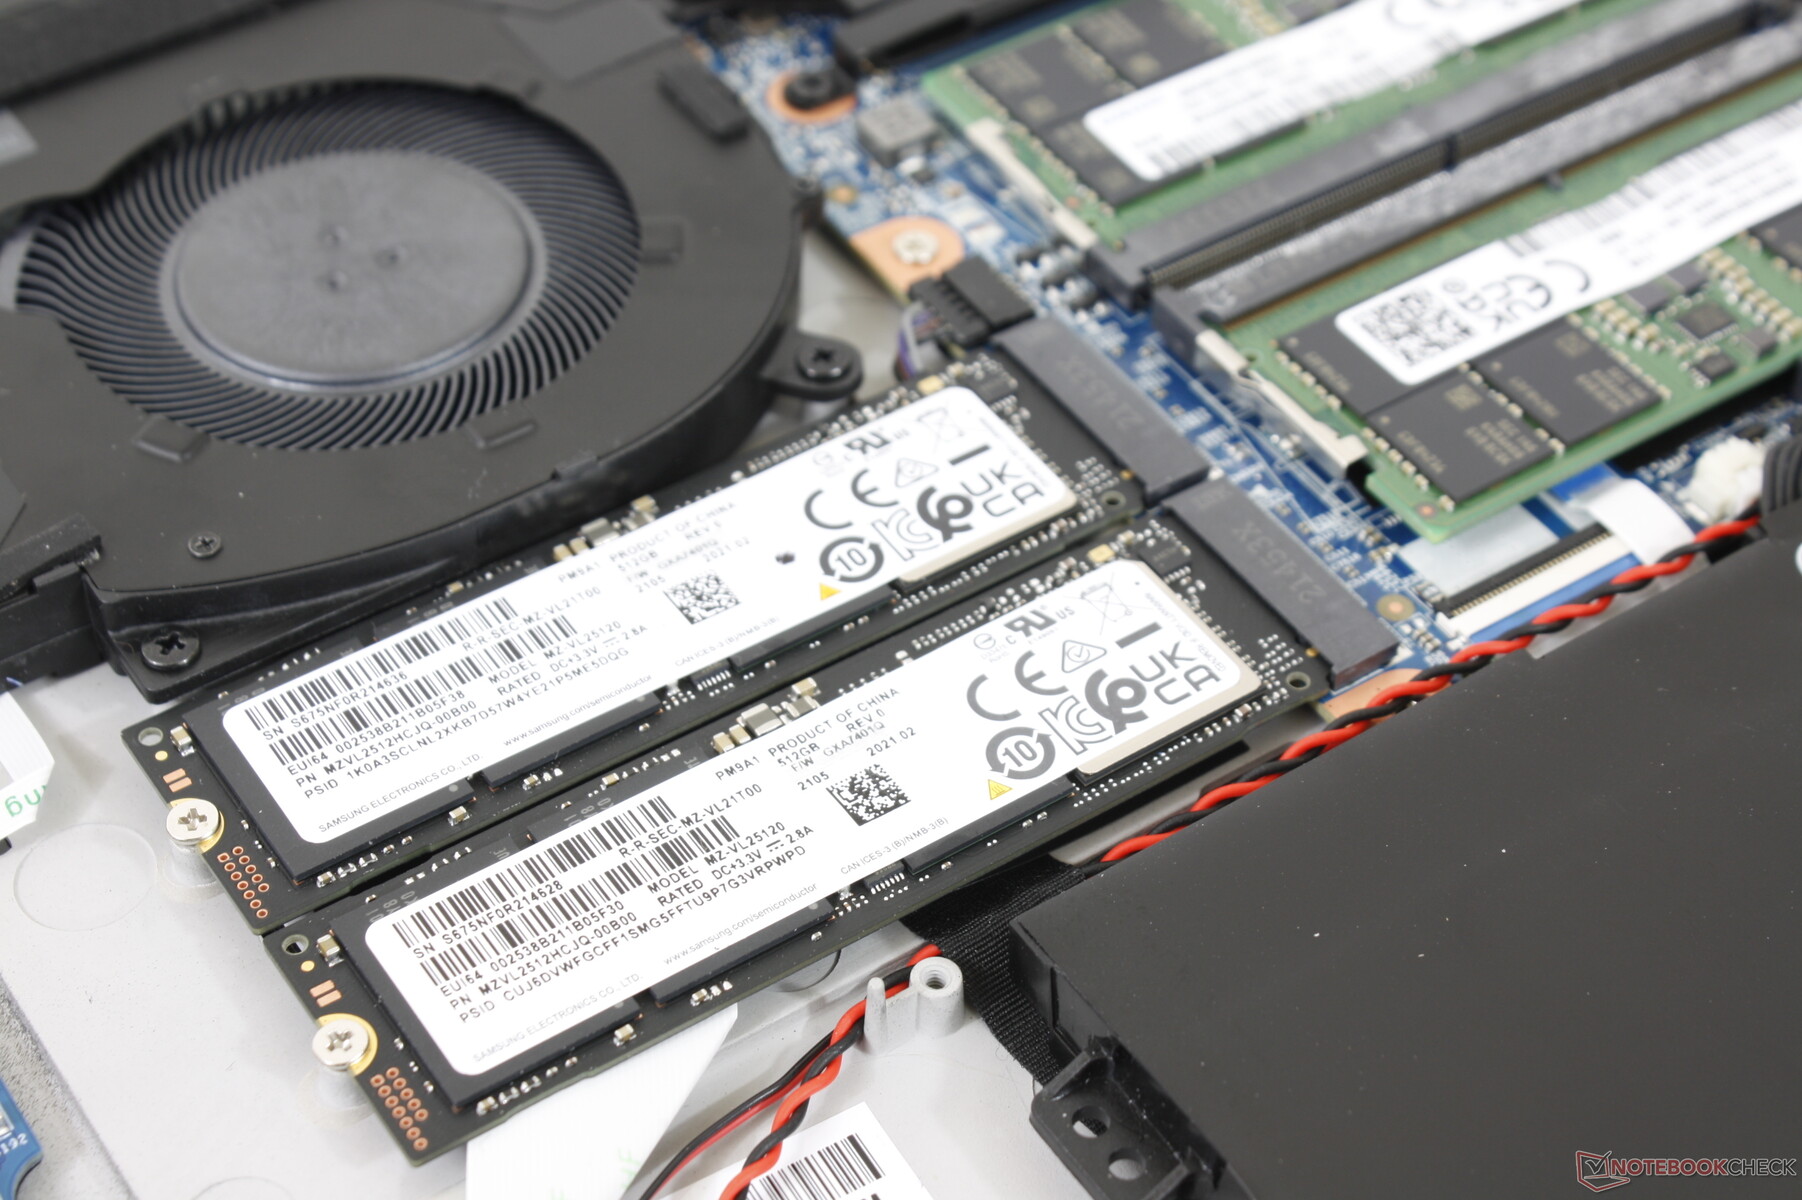
Storage Devices — 2x M.2 PCIe4 x4 NVMe SSDs
The 512 GB Samsung PM9A1 drive offers sequential read and writes rates of up to 6900 MB/s and 5000 MB/s, respectively. We're able to reach close to the maximum speeds when running DiskSpd in a loop, but performance would eventually fall off a cliff to "only" 3200 MB/s towards the end of our test as shown by the graph below. The results suggest that the drive is unable to maintain maximum performance for extended periods potentially due to temperature limitations.

| Drive Performance rating - Percent | |
| Maingear Vector Pro MG-VCP17 | |
| Schenker XMG NEO 17 GM7TG8S | |
| MSI GS76 Stealth 11UH | |
| Schenker Uniwill Technology GM7AG8P | |
| Razer Blade 17 RTX 3070 | |
| Alienware x17 RTX 3080 P48E | |
* ... smaller is better
Disk Throttling: DiskSpd Read Loop, Queue Depth 8
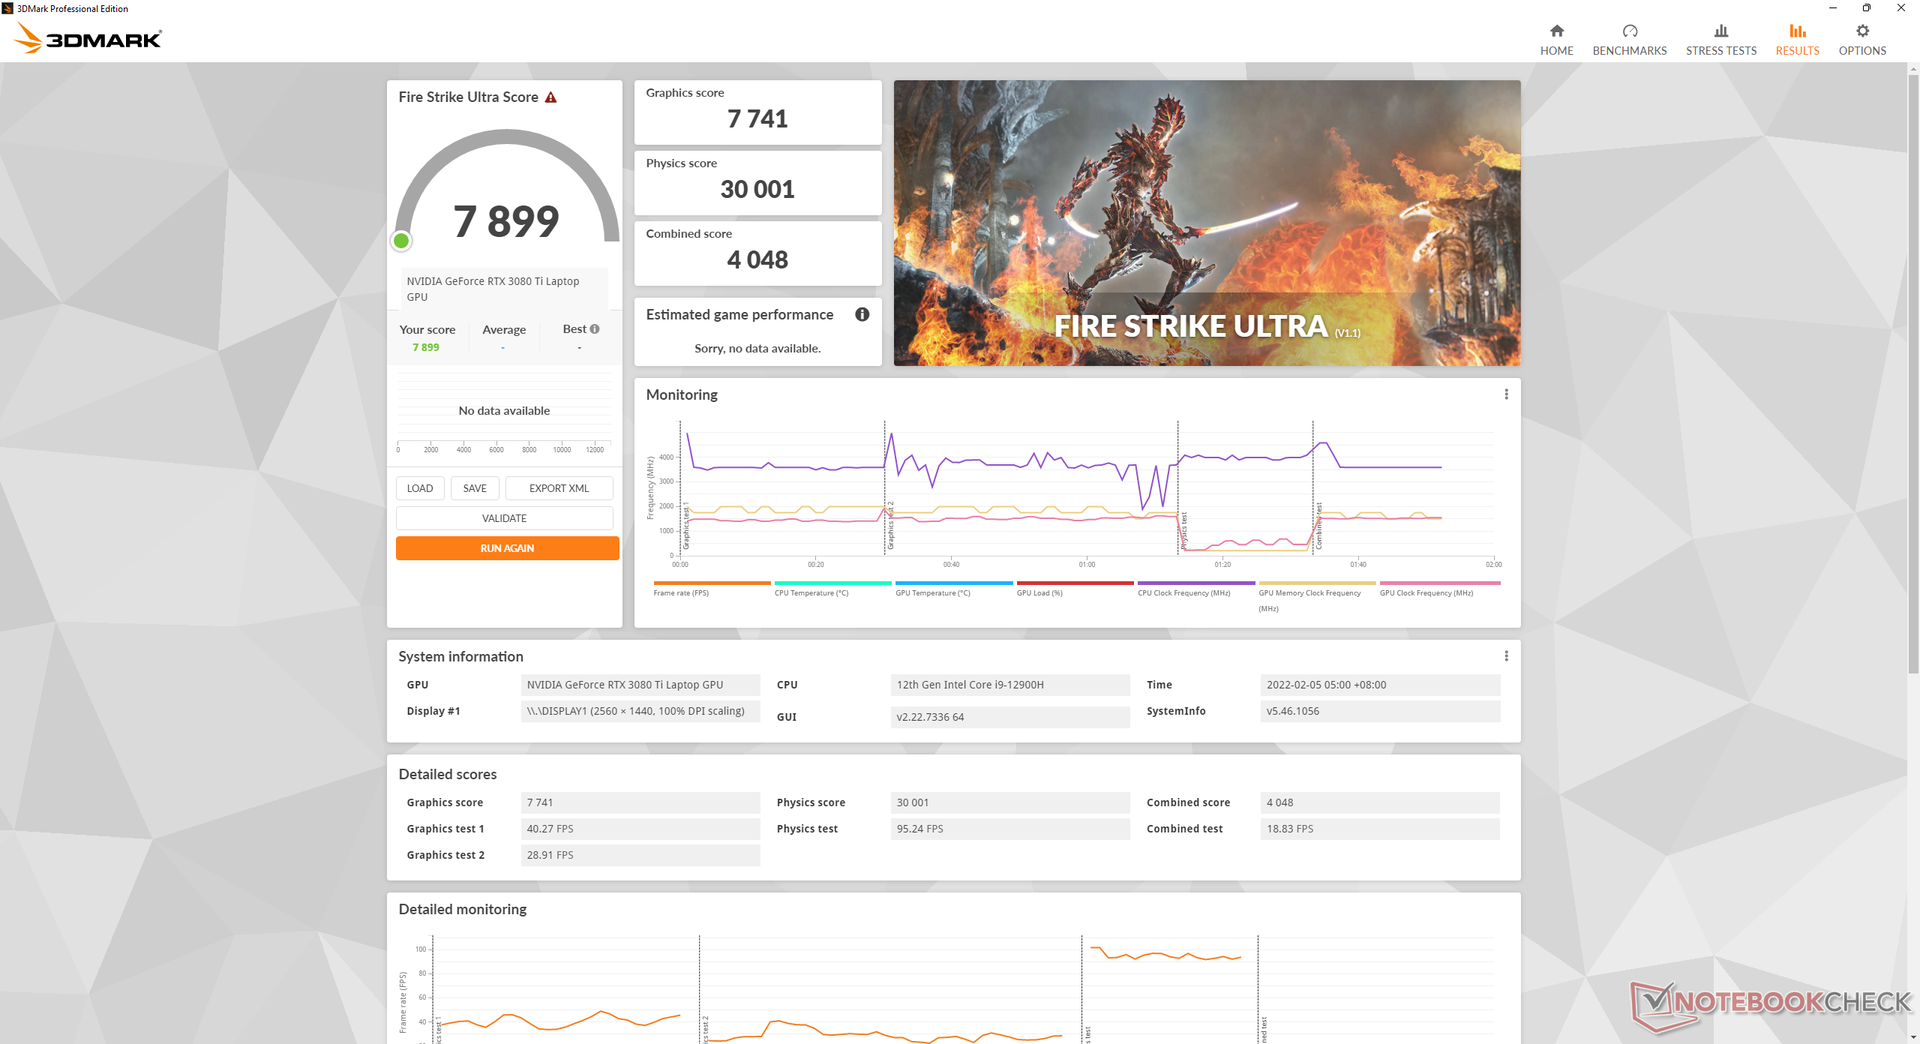
GPU Performance — A Bit Better than the Mobile GeForce RTX 3080
Much like how the desktop GeForce RTX 3080 Ti is about 10 percent faster than the desktop GeForce RTX 3080, the laptop GeForce RTX 3080 Ti is only about 10 percent faster than the laptop GeForce RTX 3080. Expect performance to be most similar to the desktop GeForce RTX 3070 which is a perfect fit for the native QHD 165 Hz display.
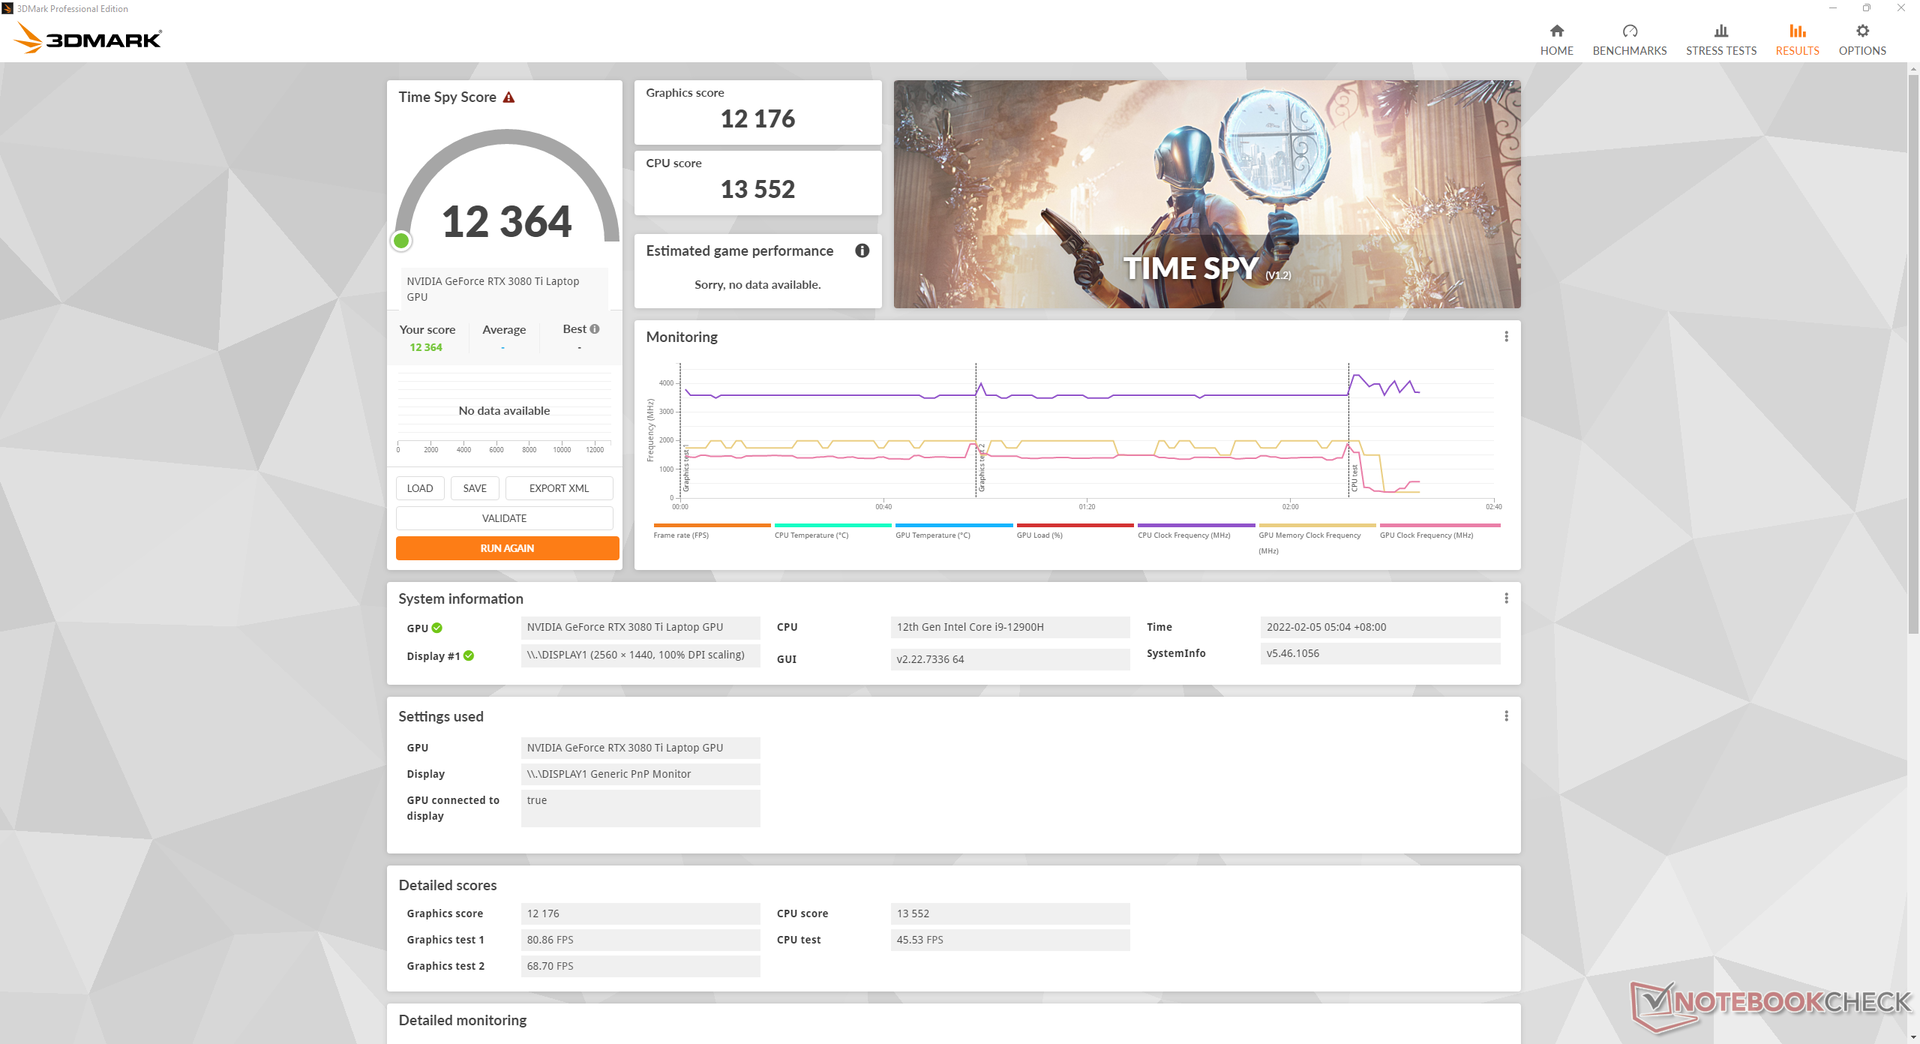
Running on MSHybrid mode instead of dGPU mode would result in a 1.2 percent lower Time Spy GPU score (12176 vs. 12020 points) to show that the performance drop when switching to MSHybrid is almost negligible.
When setting the GPU to 175 W via Control Center, our Time Spy graphics score would increase to 12714 points for a performance boost of only 4 to 5 percent.
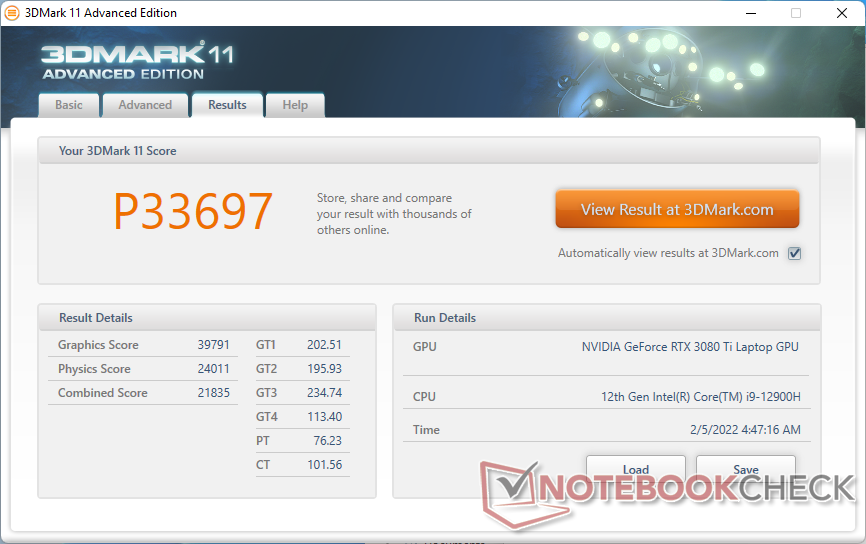
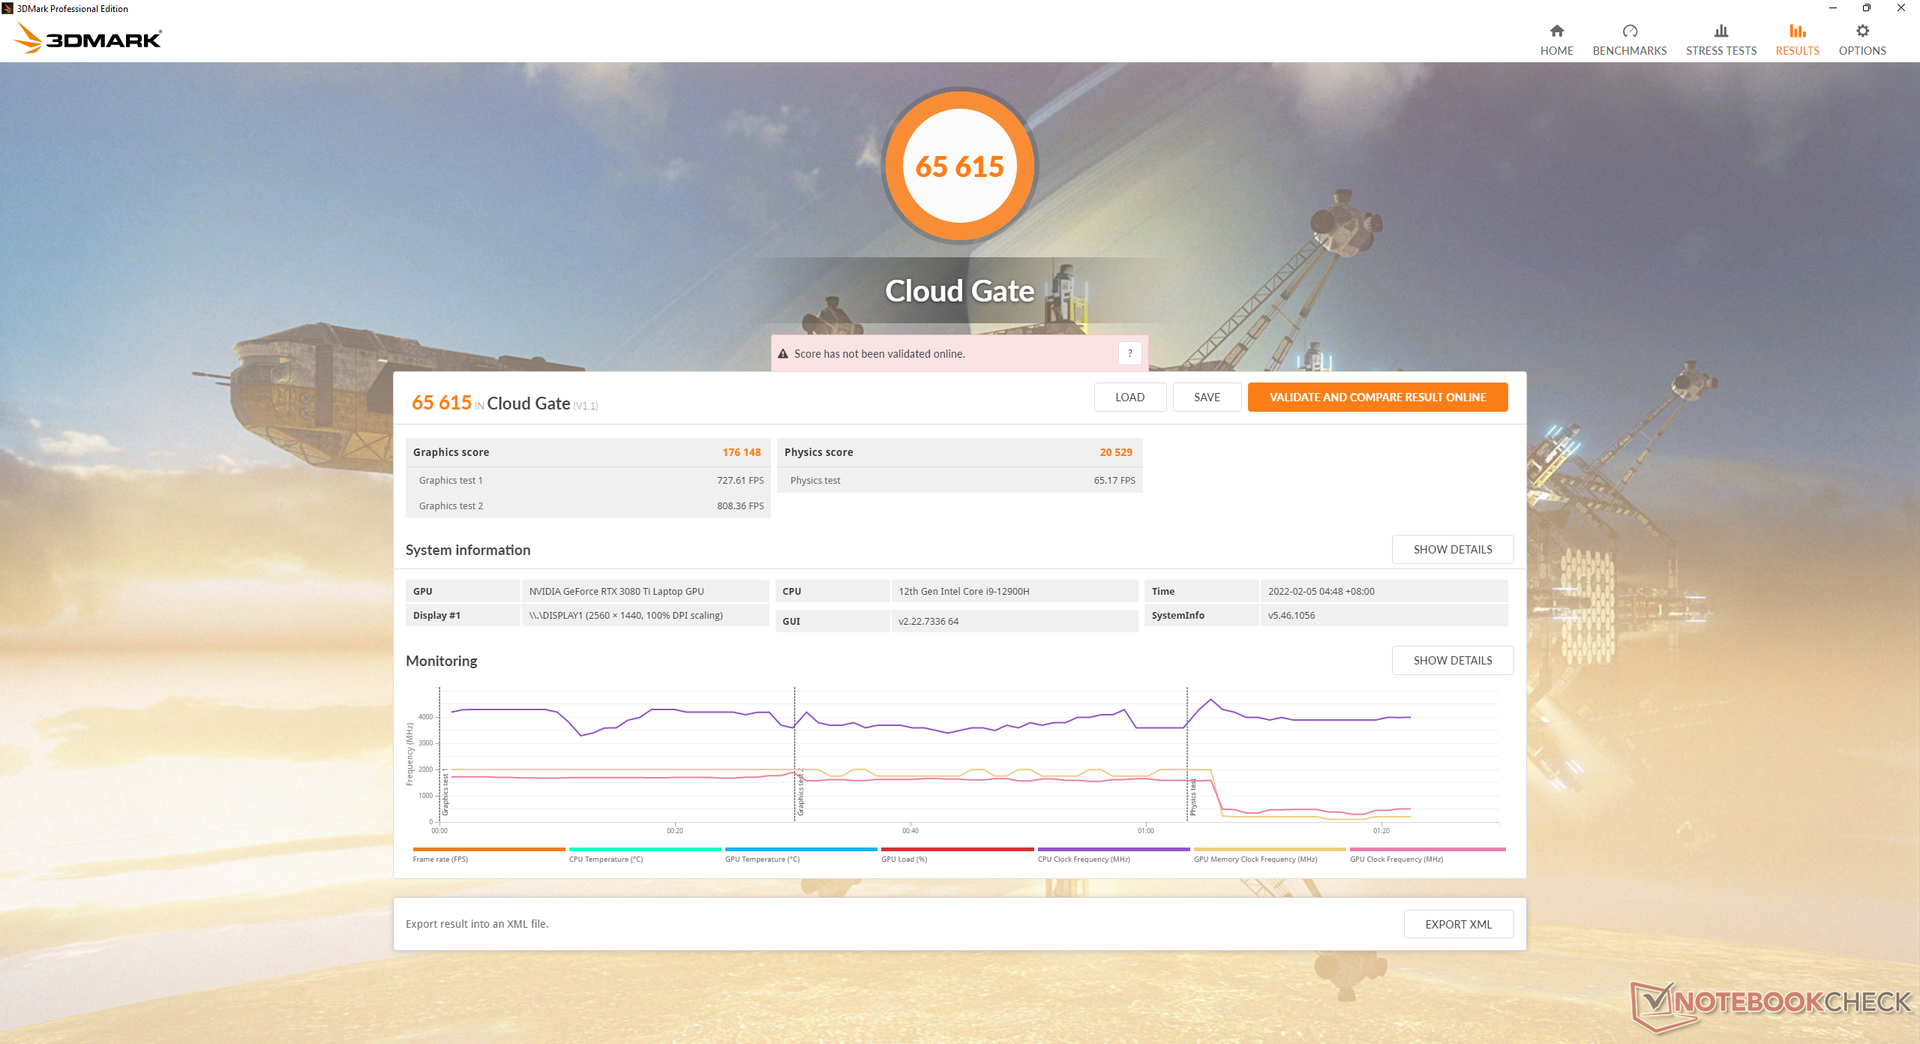
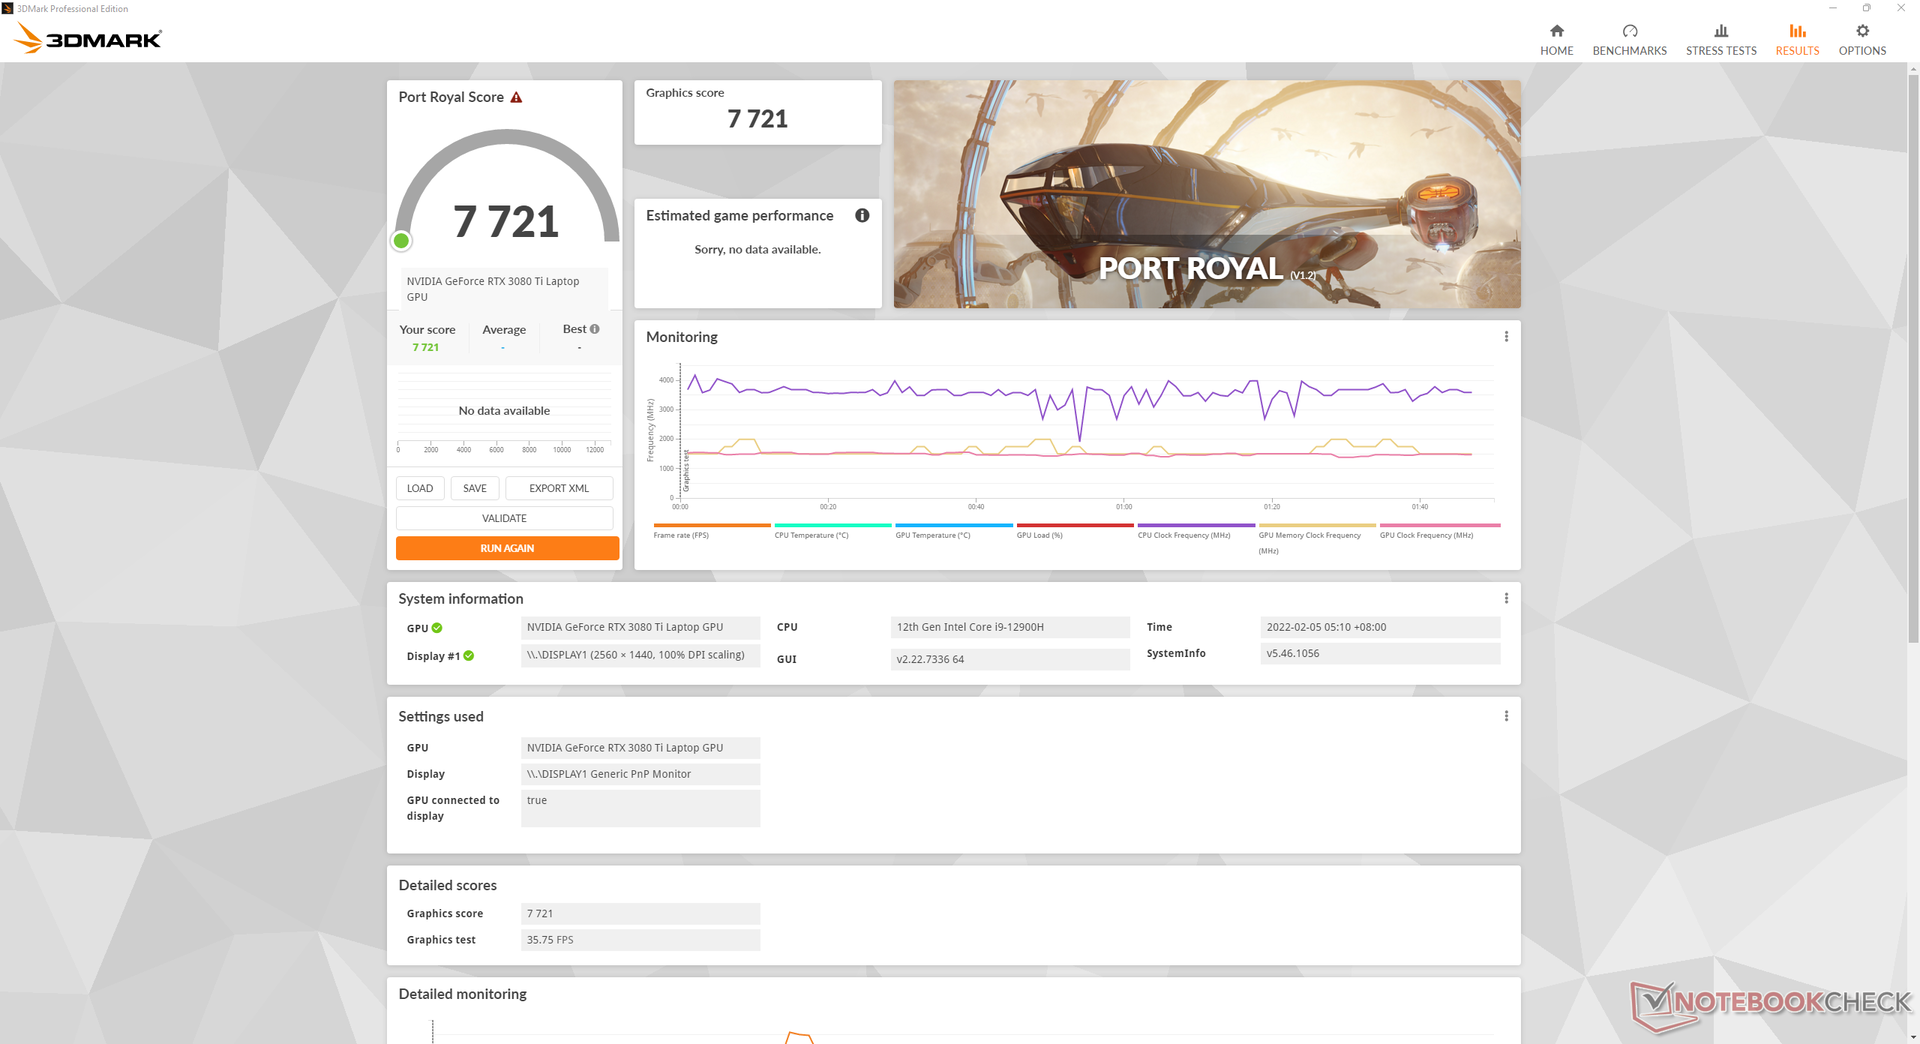
| 3DMark 11 Performance | 33697 points | |
| 3DMark Cloud Gate Standard Score | 65615 points | |
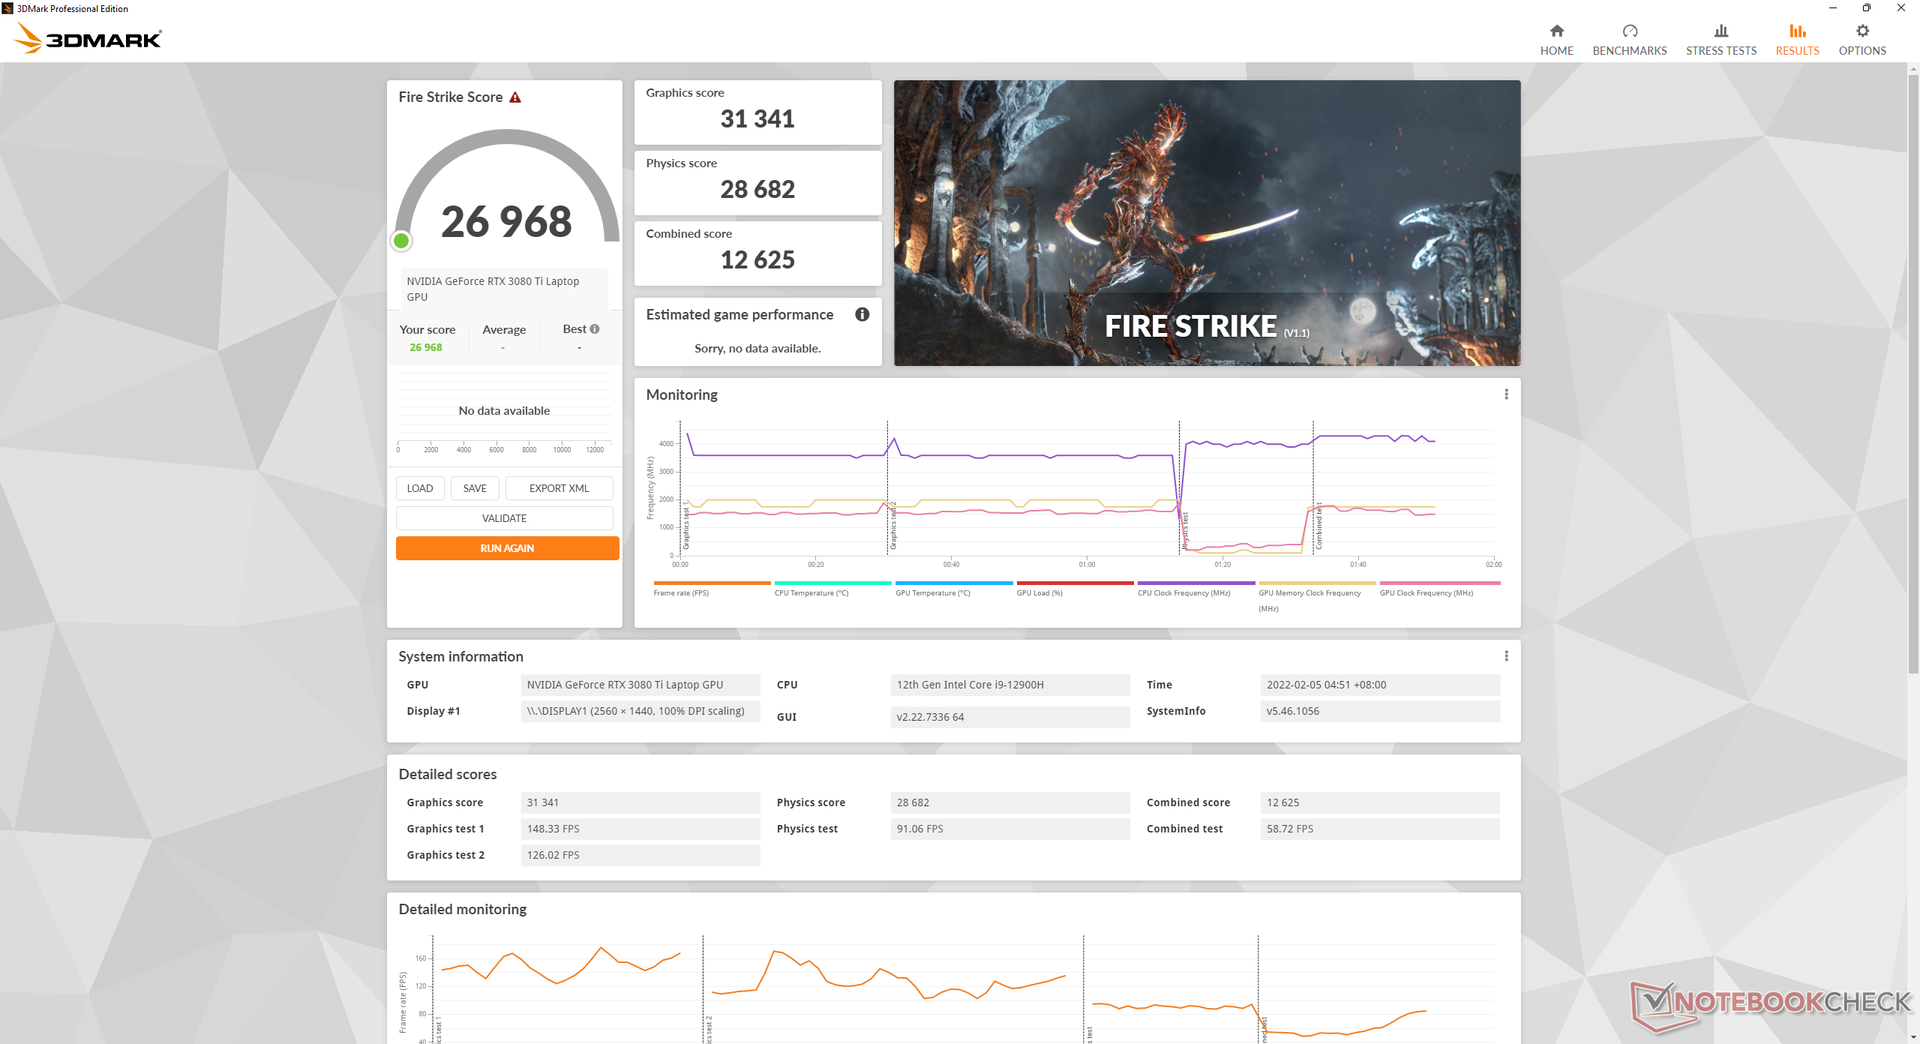
| 3DMark Fire Strike Score | 26968 points | |
| 3DMark Time Spy Score | 12364 points | |
Help | ||
Witcher 3 FPS Chart
| low | med. | high | ultra | QHD | |
|---|---|---|---|---|---|
| GTA V (2015) | 186 | 183 | 179 | 125 | 111 |
| The Witcher 3 (2015) | 472.4 | 368.4 | 236.3 | 117.2 | |
| Dota 2 Reborn (2015) | 186 | 172 | 166 | 159 | |
| Final Fantasy XV Benchmark (2018) | 167 | 155 | 117 | ||
| X-Plane 11.11 (2018) | 160 | 142 | 107 | ||
| Far Cry 5 (2018) | 186 | 160 | 150 | 138 | 120 |
| Strange Brigade (2018) | 472 | 290 | 231 | 203 | 151 |
| Hunt Showdown (2020) | 243.2 | 197.9 | 167.6 | 103.6 | |
| Doom Eternal (2020) | 491.8 | 321.3 | 292.4 | 279 | 210.6 |
| Gears Tactics (2020) | 366.3 | 270 | 195.5 | 136.5 | 97.1 |
| Horizon Zero Dawn (2020) | 162 | 141 | 130 | 118 | 98 |
| Watch Dogs Legion (2020) | 137 | 128 | 116 | 84 | 64 |
| Dirt 5 (2020) | 217.5 | 167.8 | 136.8 | 105.4 | 85.6 |
| Assassin´s Creed Valhalla (2020) | 166 | 118 | 99 | 85 | 68 |
| Hitman 3 (2021) | 297.5 | 228.9 | 211.9 | 201.8 | 133.9 |
| F1 2021 (2021) | 364 | 328 | 271 | 103 | 71 |
| Far Cry 6 (2021) | 158 | 131 | 117 | 107 | 88 |
| Guardians of the Galaxy (2021) | 157 | 157 | 157 | 152 | 122 |
| Riders Republic (2021) | 207 | 159 | 133 | 122 | 90 |
| Halo Infinite (2021) | 260.3 | 165.7 | 146.7 | 137.3 | 96.3 |
| God of War (2022) | 158.5 | 135.2 | 110.1 | 79 | 64.4 |
Emissions
System Noise — Unsurprisingly Loud
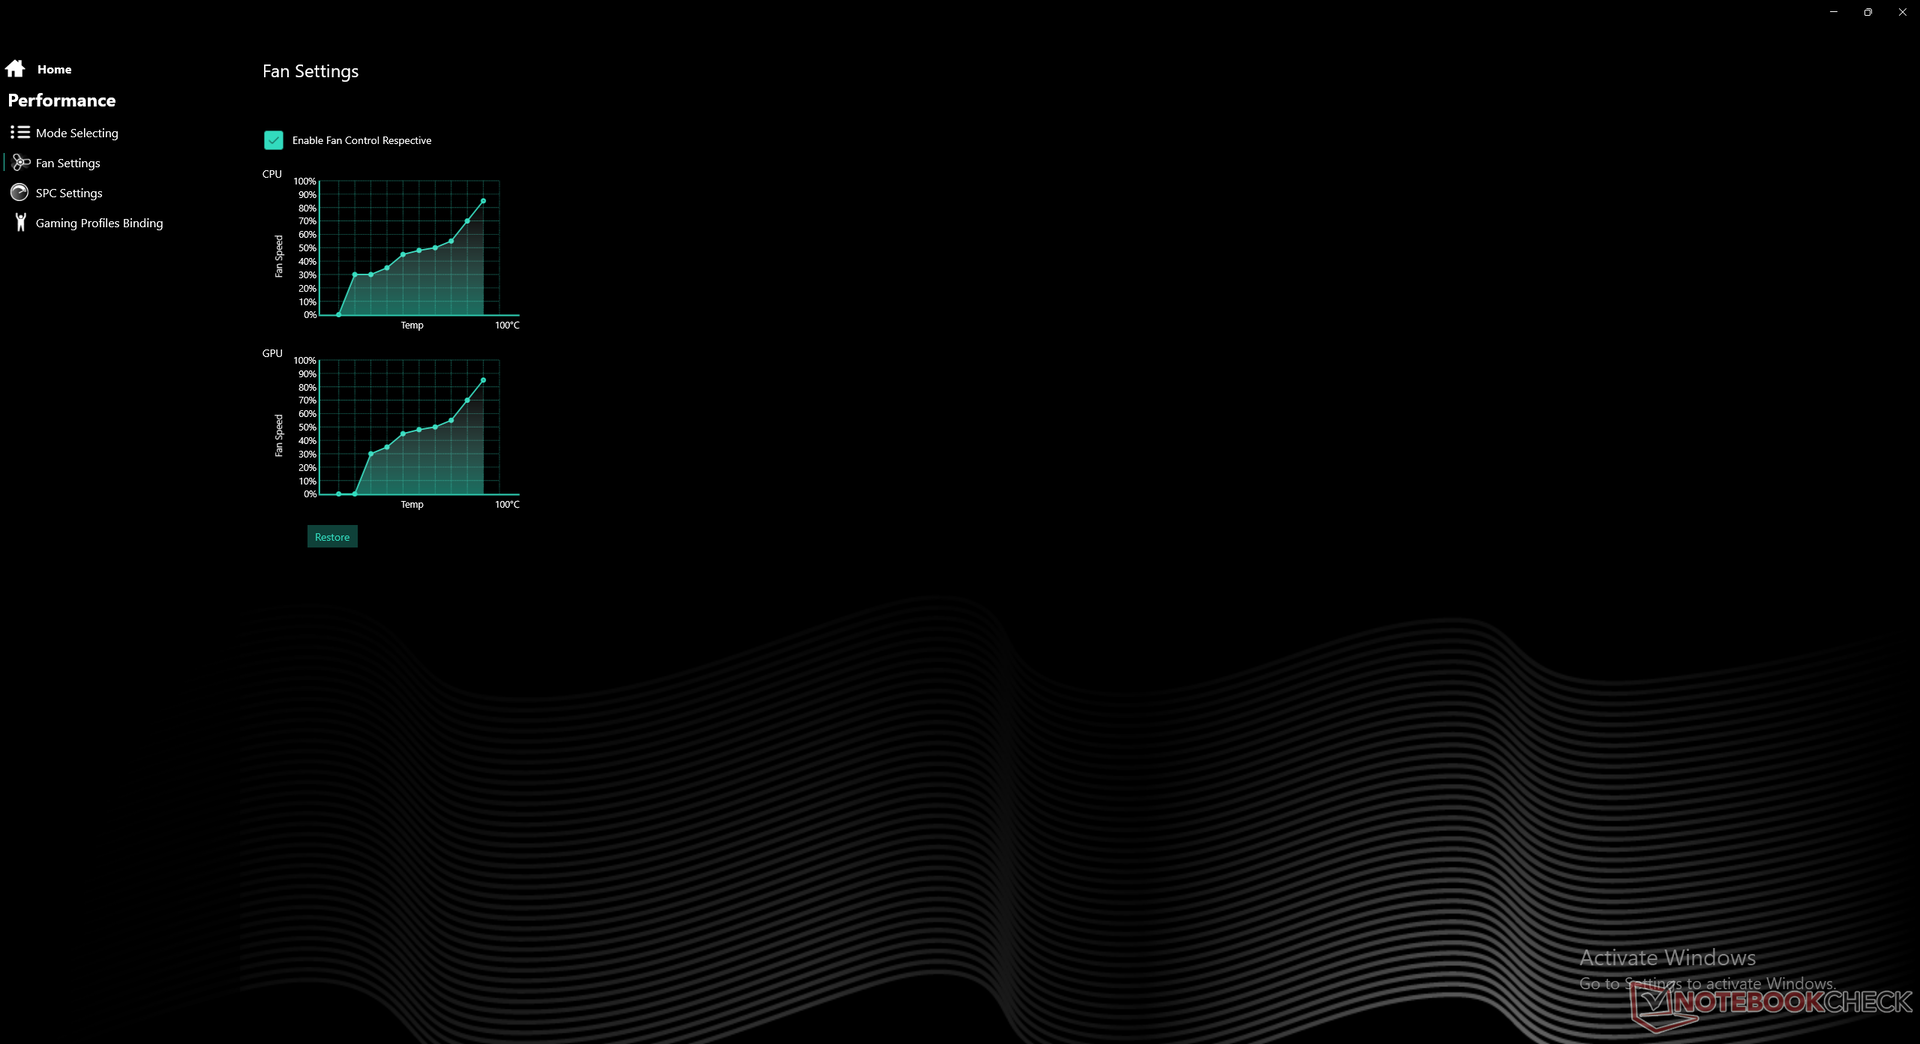
Like most other gaming laptops, it doesn't take a lot of onscreen activity to get the internal fans spinning. Undemanding actions like web browsing or video streaming would bump fan noise to 30.8 dB(A) against a silent background of 23.1 dB(A). The noise increase is noticeable, but fan RPM adjustments are generally gradual instead of sharp on the GM7AG8P to be more tolerable.
Running higher loads like games would result in noise levels that are very similar to what we observed on the XMG Neo 17 GM7TG8S. Expect fan noise to be in the low-to-mid 50 dB(A) range in such conditions which is a common range for enthusiast gaming laptops. The fans can be so loud that we recommend wearing headphones when playing titles like Fortnite where quieter audio cues are vital to gameplay.
Noise level
| Idle |
| 28.1 / 28.1 / 30.8 dB(A) |
| Load |
| 39.1 / 52.5 dB(A) |
 | ||
30 dB silent 40 dB(A) audible 50 dB(A) loud |
||
min: | ||
| Schenker Uniwill Technology GM7AG8P GeForce RTX 3080 Ti Laptop GPU, i9-12900H, Samsung PM9A1 MZVL2512HCJQ | Schenker XMG NEO 17 GM7TG8S GeForce RTX 3080 Laptop GPU, i7-11800H, Samsung SSD 980 Pro 1TB MZ-V8P1T0BW | Alienware x17 RTX 3080 P48E GeForce RTX 3080 Laptop GPU, i7-11800H, 2x WDC PC SN730 SDBPNTY-1T00 (RAID 0) | Razer Blade 17 RTX 3070 GeForce RTX 3070 Laptop GPU, i7-11800H, Samsung PM9A1 MZVL21T0HCLR | MSI GS76 Stealth 11UH GeForce RTX 3080 Laptop GPU, i9-11900H, Samsung PM9A1 MZVL22T0HBLB | Maingear Vector Pro MG-VCP17 GeForce RTX 3080 Laptop GPU, i7-11800H, Samsung PM9A1 MZVL21T0HCLR | |
|---|---|---|---|---|---|---|
| Noise | 7% | 6% | 4% | -2% | 6% | |
| off / environment * (dB) | 23.1 | 23 -0% | 24.9 -8% | 24.2 -5% | 24 -4% | 23.8 -3% |
| Idle Minimum * (dB) | 28.1 | 23 18% | 24.9 11% | 24.7 12% | 24 15% | 23.9 15% |
| Idle Average * (dB) | 28.1 | 23 18% | 24.9 11% | 24.7 12% | 25 11% | 23.9 15% |
| Idle Maximum * (dB) | 30.8 | 23 25% | 29.6 4% | 24.7 20% | 42 -36% | 23.9 22% |
| Load Average * (dB) | 39.1 | 39.5 -1% | 31.1 20% | 44.3 -13% | 46 -18% | 38 3% |
| Witcher 3 ultra * (dB) | 52.4 | 54.5 -4% | 49.7 5% | 56.3 -7% | 48 8% | 55.9 -7% |
| Load Maximum * (dB) | 52.5 | 55.09 -5% | 54.8 -4% | 47.7 9% | 48 9% | 55.9 -6% |
* ... smaller is better
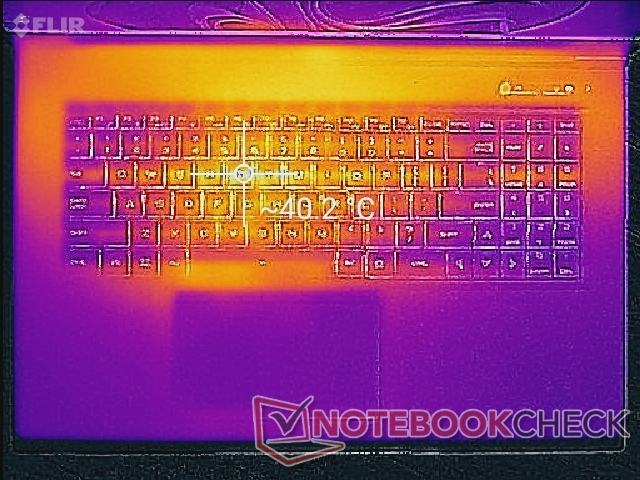
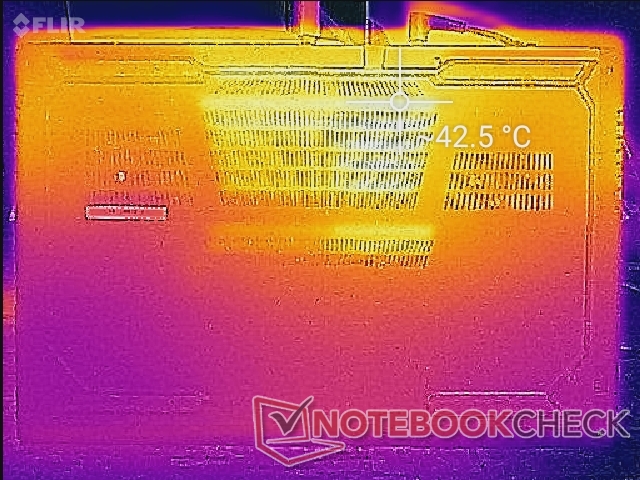
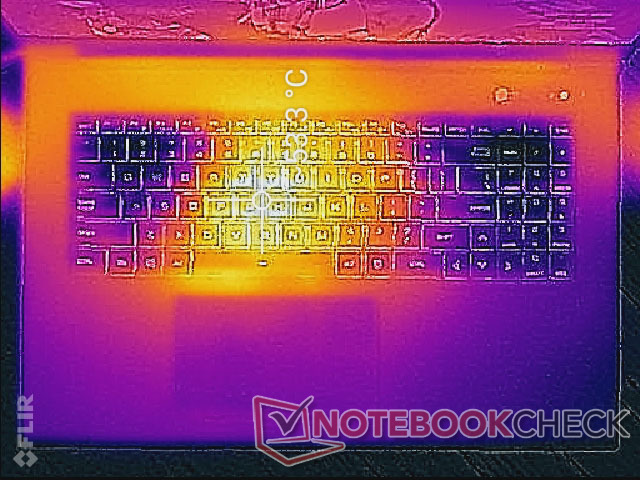
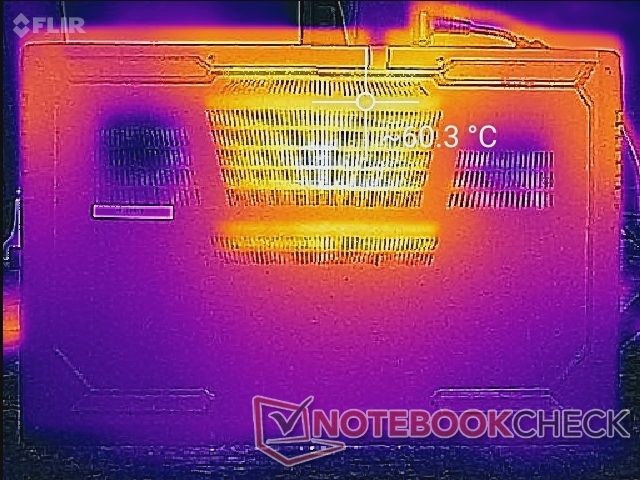
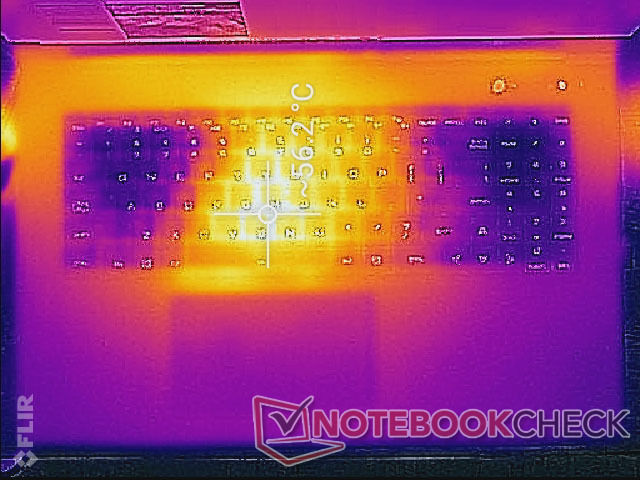
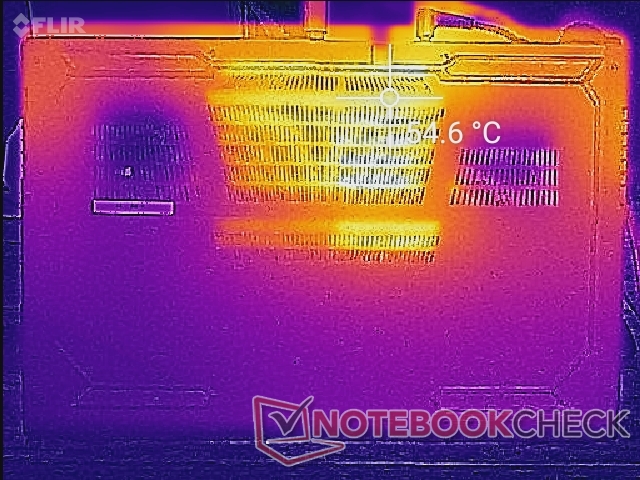
Temperature — Hot Center, Cool Corners
Surface temperatures will always be quite warm toward the center areas of the chassis. When idling on desktop with no other running applications, for example, the keyboard center and the rear of the bottom panel can each be as warm as 40 C. These same areas can warm up to 57 C when running more demanding applications as such as games.
Average surface temperatures are generally cooler than the competing Razer Blade Pro 17 which uses a magnesium alloy chassis instead of ABS plastic. Thus, the palm rests of our GM7AG8P manages to remain cooler and more comfortable than on the Razer when gaming by more than a few degrees C.
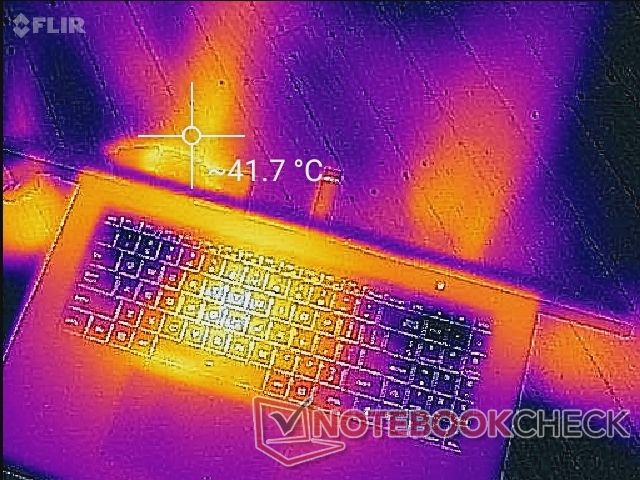
(-) The maximum temperature on the upper side is 56.8 °C / 134 F, compared to the average of 40.4 °C / 105 F, ranging from 21.2 to 68.8 °C for the class Gaming.
(-) The bottom heats up to a maximum of 60.2 °C / 140 F, compared to the average of 43.2 °C / 110 F
(+) In idle usage, the average temperature for the upper side is 31.1 °C / 88 F, compared to the device average of 33.9 °C / 93 F.
(±) Playing The Witcher 3, the average temperature for the upper side is 35.3 °C / 96 F, compared to the device average of 33.9 °C / 93 F.
(+) The palmrests and touchpad are cooler than skin temperature with a maximum of 30.2 °C / 86.4 F and are therefore cool to the touch.
(±) The average temperature of the palmrest area of similar devices was 28.8 °C / 83.8 F (-1.4 °C / -2.6 F).
| Schenker Uniwill Technology GM7AG8P Intel Core i9-12900H, NVIDIA GeForce RTX 3080 Ti Laptop GPU | Schenker XMG NEO 17 GM7TG8S Intel Core i7-11800H, NVIDIA GeForce RTX 3080 Laptop GPU | Alienware x17 RTX 3080 P48E Intel Core i7-11800H, NVIDIA GeForce RTX 3080 Laptop GPU | Razer Blade 17 RTX 3070 Intel Core i7-11800H, NVIDIA GeForce RTX 3070 Laptop GPU | MSI GS76 Stealth 11UH Intel Core i9-11900H, NVIDIA GeForce RTX 3080 Laptop GPU | Maingear Vector Pro MG-VCP17 Intel Core i7-11800H, NVIDIA GeForce RTX 3080 Laptop GPU | |
|---|---|---|---|---|---|---|
| Heat | 8% | 13% | 19% | 20% | 7% | |
| Maximum Upper Side * (°C) | 56.8 | 51 10% | 58.4 -3% | 41 28% | 49 14% | 54.2 5% |
| Maximum Bottom * (°C) | 60.2 | 62 -3% | 49 19% | 47.2 22% | 57 5% | 52.2 13% |
| Idle Upper Side * (°C) | 40.2 | 35 13% | 33.6 16% | 33.2 17% | 28 30% | 37.4 7% |
| Idle Bottom * (°C) | 43 | 38 12% | 34.6 20% | 39 9% | 30 30% | 41.4 4% |
* ... smaller is better
Stress Test
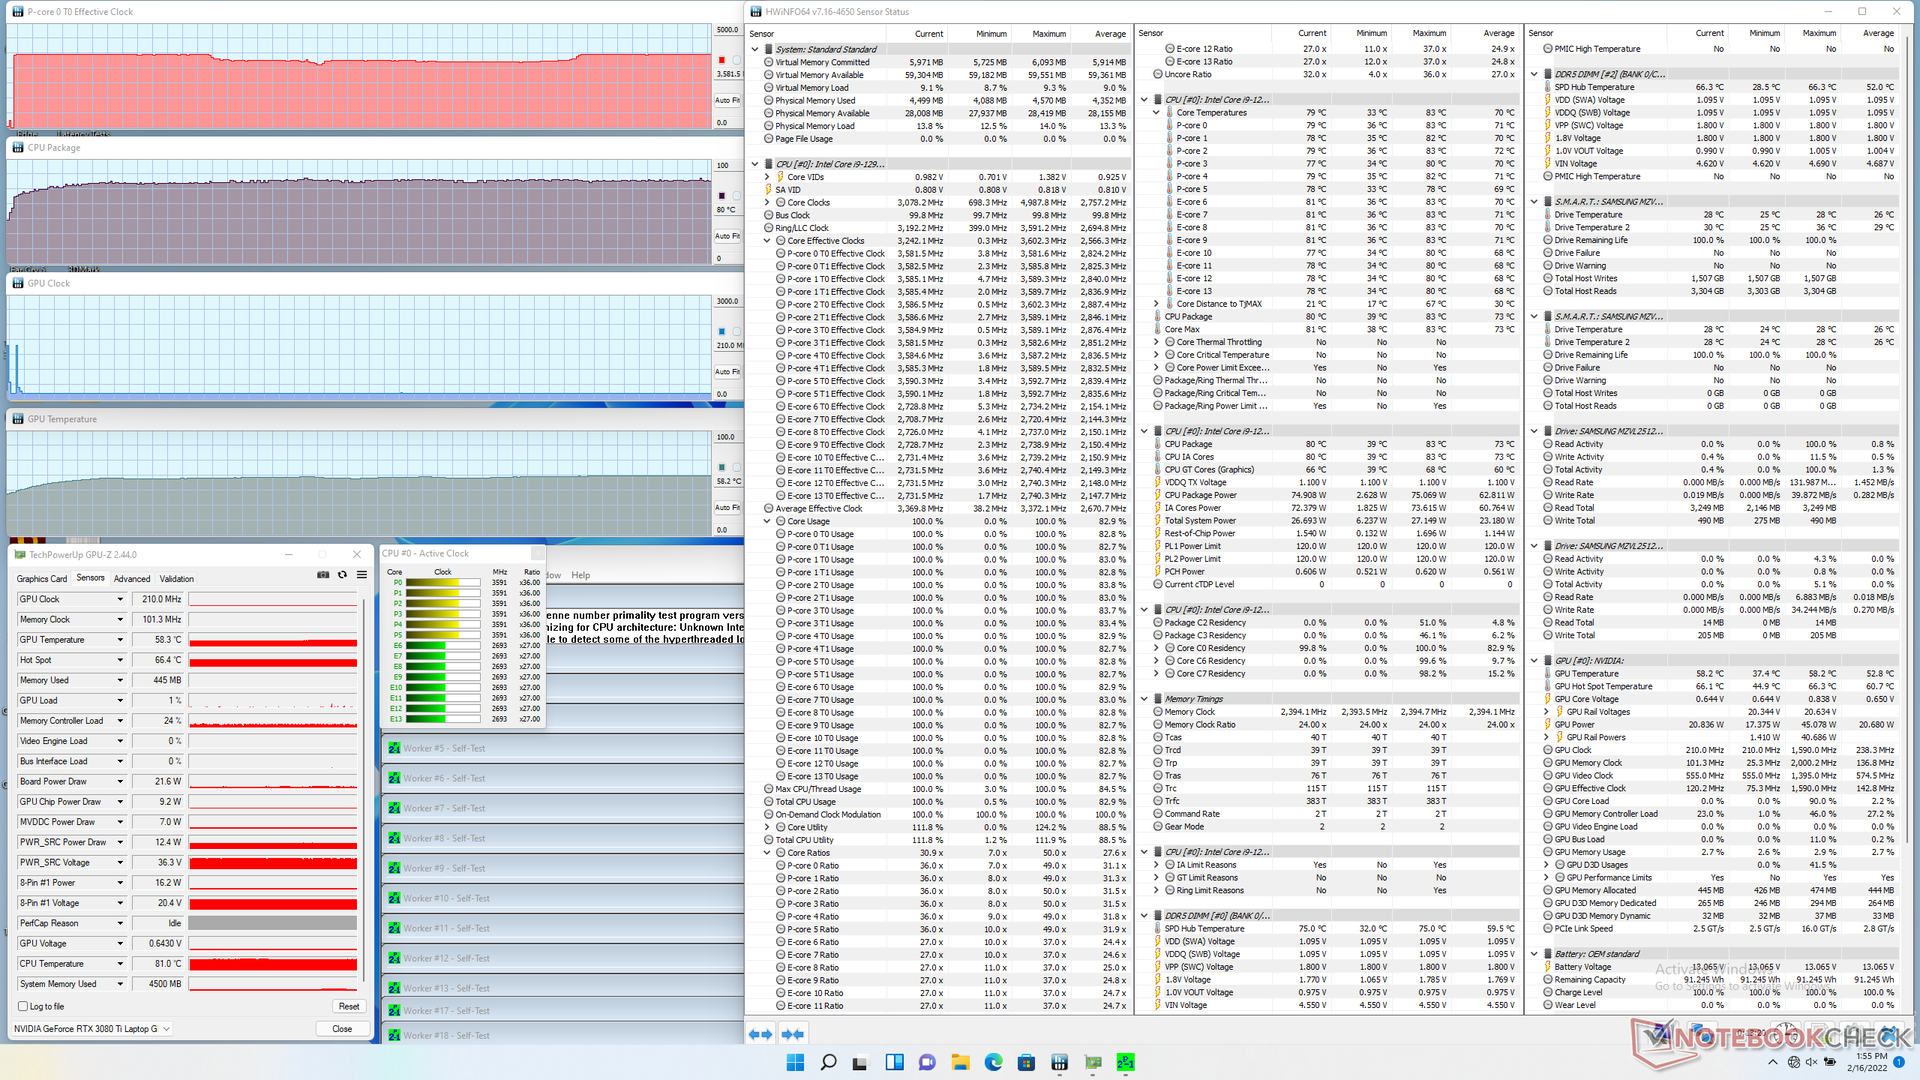
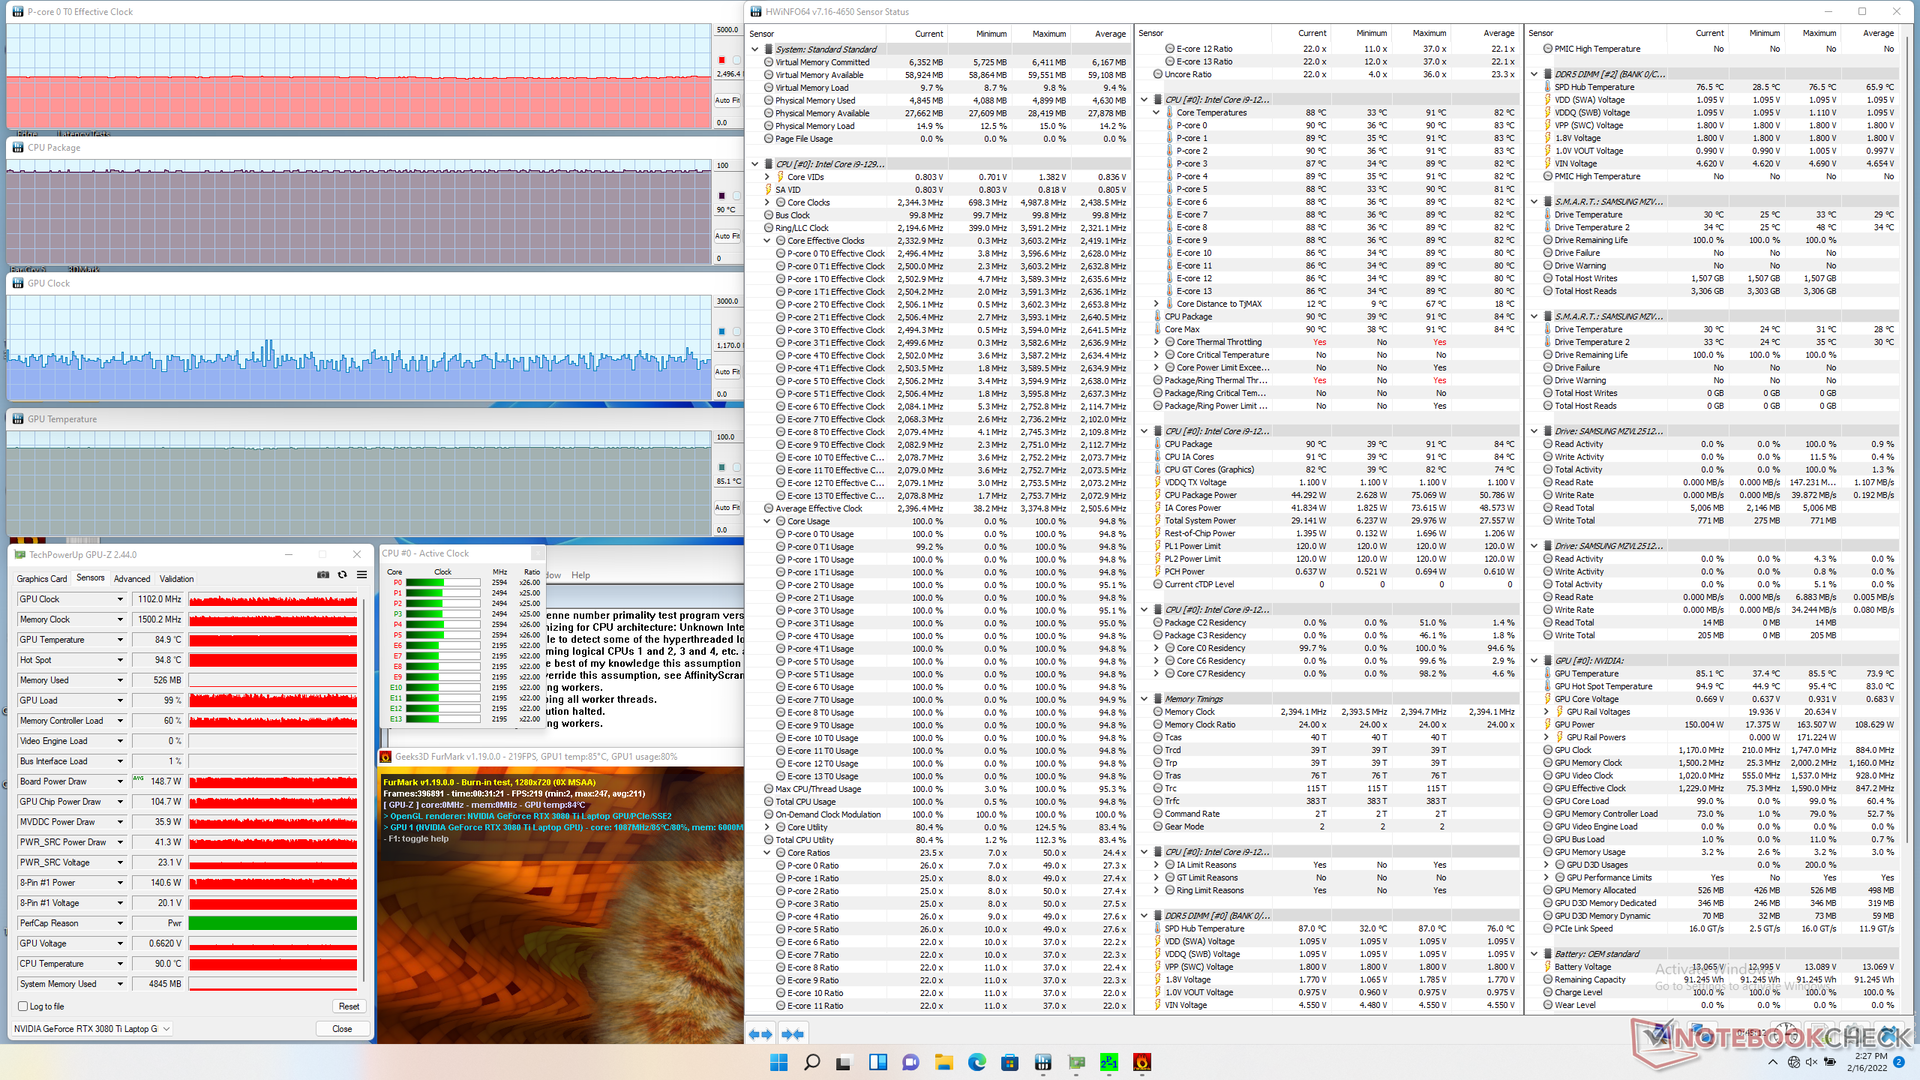
Running Prime95 to stress the CPU would result in a clock rate boost up to the 3.2 to 3.6 GHz range and at a stable core temperature of 80 C. CPU package power would also stabilize at 75 W indefinitely which is the default TDP setting. Users may up the PL1 and PL2 limits up to 120 W each via Control Center if desired.
Running Witcher 3 with the dGPU set to the default 150 W would result in a stable GPU temperature of 76 C and a board power draw of around 150 W according to GPU-Z. If set to 175 W via Control Center, memory clock would increase from 1750 MHz to 1800 MHz while GPU temperature would also increase from 76 C to 86 C. Board power draw would be stable at around 170 W or just shy of the 175 W maximum. Interestingly, GPU clock rates would remain in the 1500 - 1600 MHz range in both 150 W or 175 W TGP modes.
Running on battery power will limit performance by a greater degree than expected. A Time Spy test on dGPU and batteries would return Physics and Graphics scores of just 7150 and 897 points, respectively, compared to 13552 and 12176 points when on mains even with Nvidia Whisper Mode 2.0 and Battery Boost disabled.
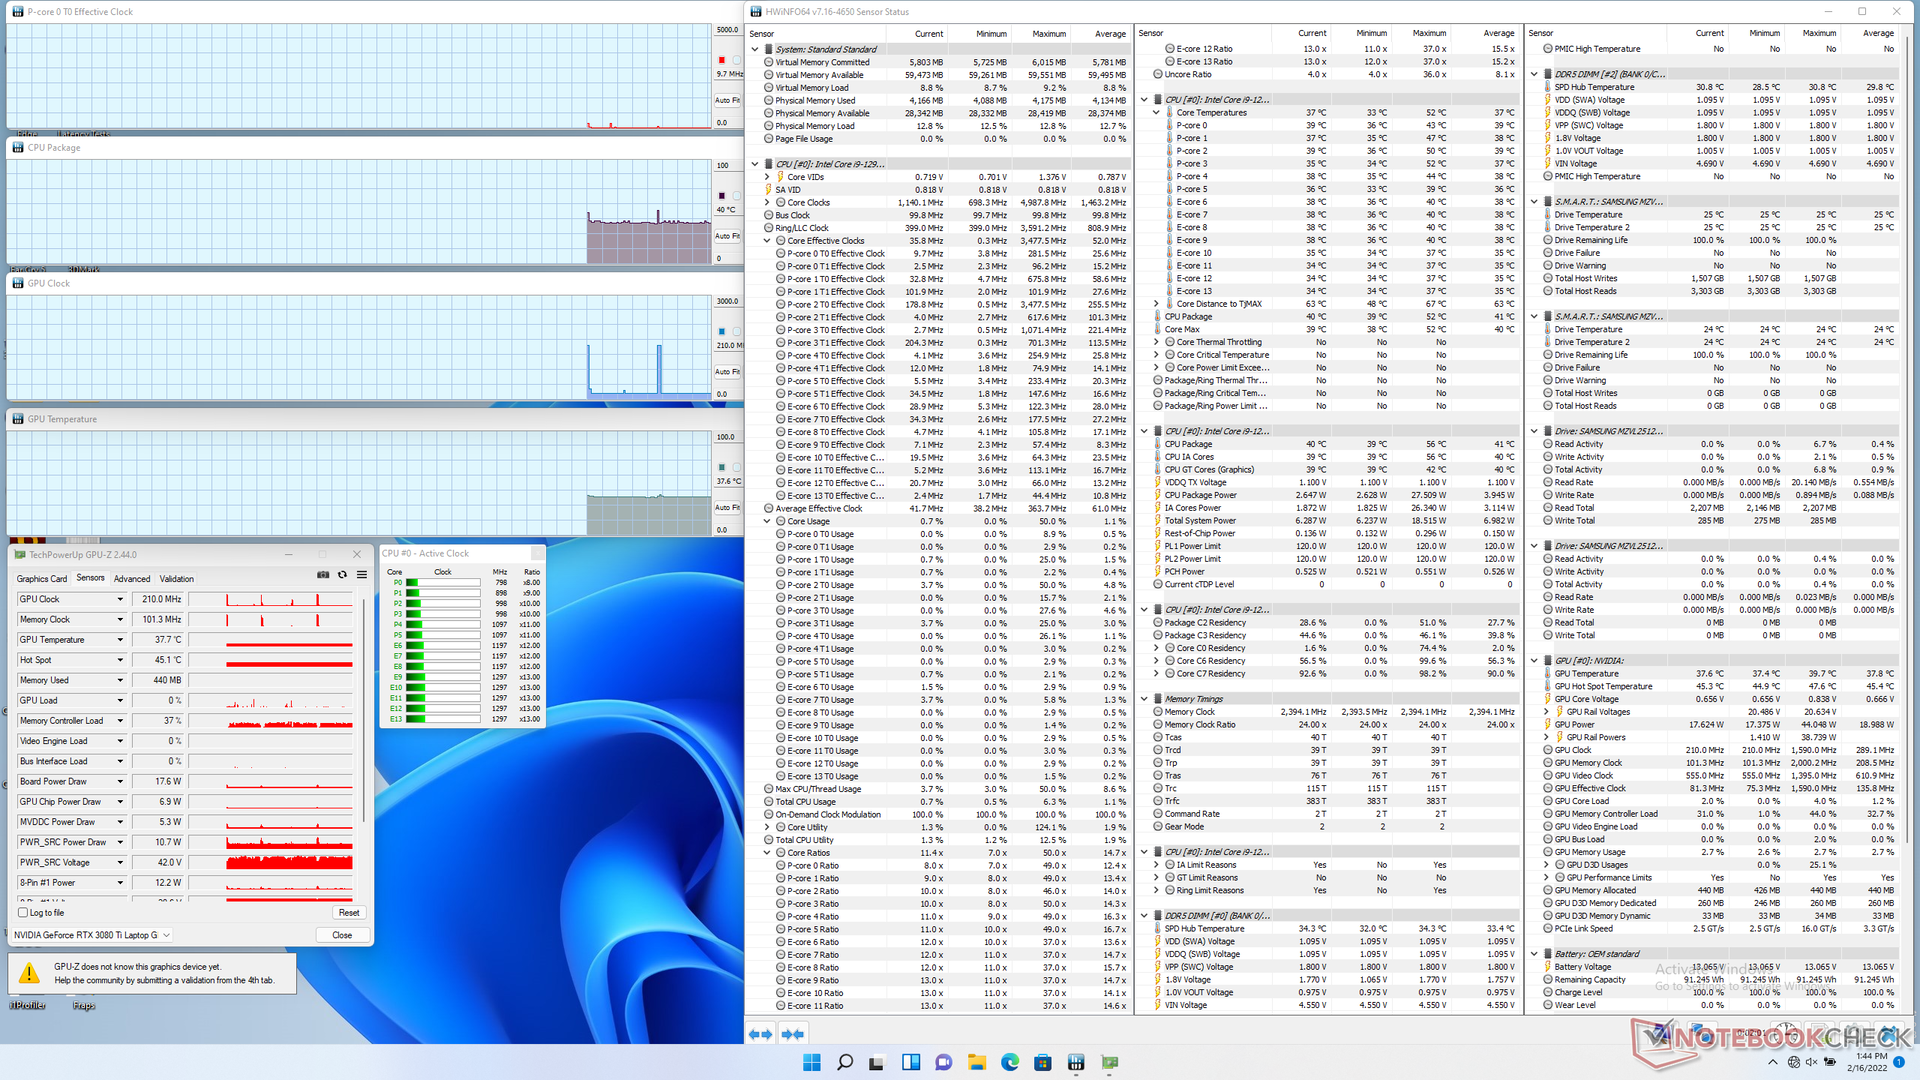
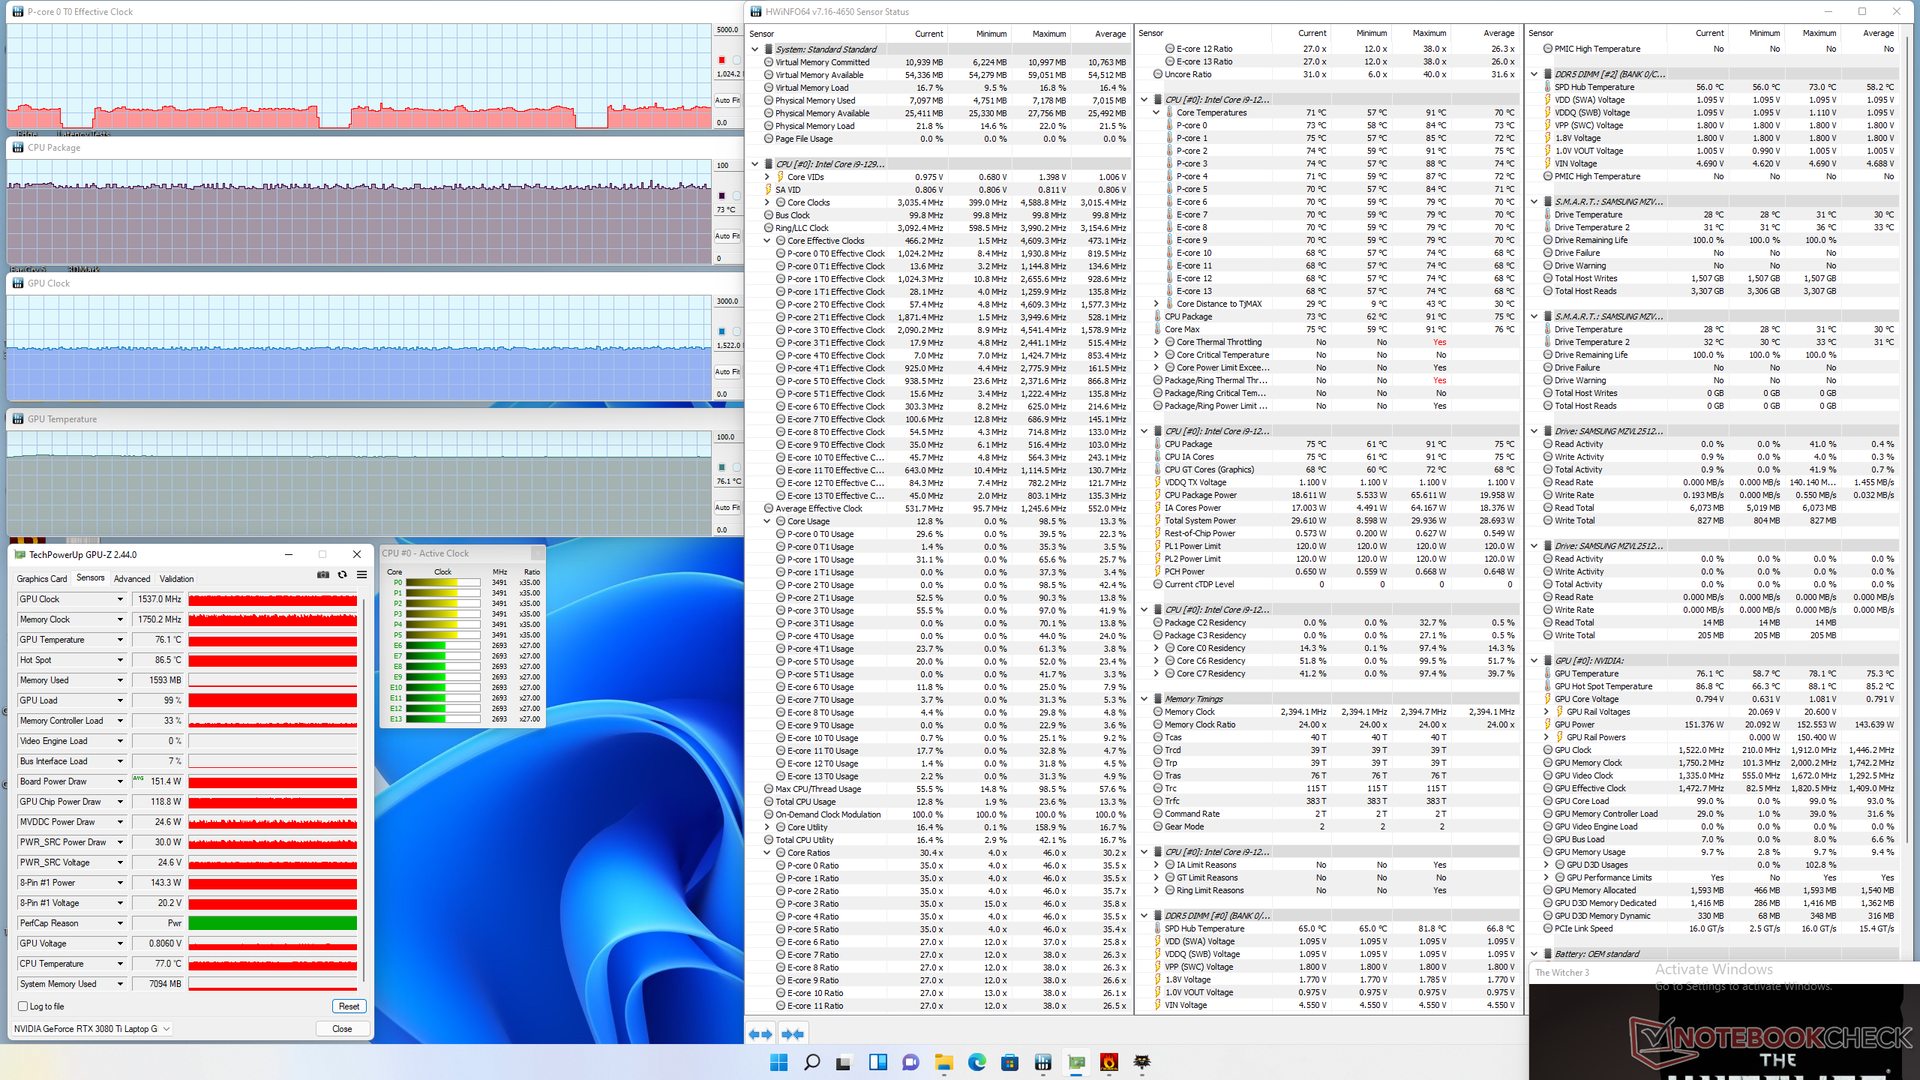
| CPU Clock (GHz) | GPU Clock (MHz) | Average CPU Temperature (°C) | Average GPU Temperature (°C) | |
| System Idle | -- | -- | 40 | 38 |
| Prime95 Stress | 3.2 - 3.6 | -- | 80 | 58 |
| Prime95 + FurMark Stress | 2.5 | ~1102 | 90 | 85 |
| Witcher 3 Stress (150 W TGP mode) | ~1.0 | ~1537 | 73 | 76 |
Speakers

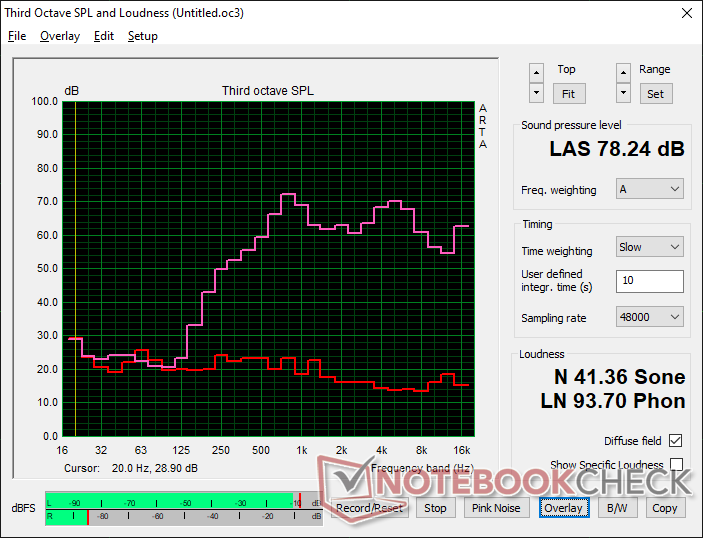
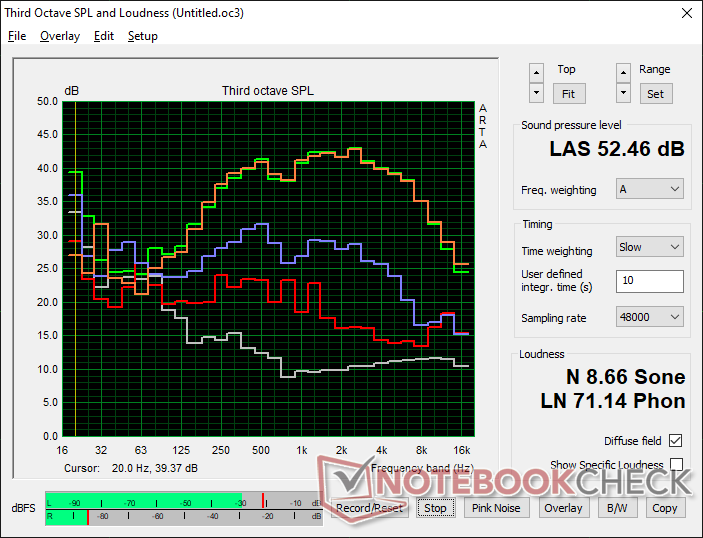
Schenker Uniwill Technology GM7AG8P audio analysis
(±) | speaker loudness is average but good (78.2 dB)
Bass 100 - 315 Hz
(-) | nearly no bass - on average 23.7% lower than median
(±) | linearity of bass is average (12.8% delta to prev. frequency)
Mids 400 - 2000 Hz
(+) | balanced mids - only 4.6% away from median
(±) | linearity of mids is average (9.2% delta to prev. frequency)
Highs 2 - 16 kHz
(+) | balanced highs - only 4.5% away from median
(±) | linearity of highs is average (8.6% delta to prev. frequency)
Overall 100 - 16.000 Hz
(±) | linearity of overall sound is average (24.1% difference to median)
Compared to same class
» 87% of all tested devices in this class were better, 4% similar, 9% worse
» The best had a delta of 6%, average was 18%, worst was 132%
Compared to all devices tested
» 73% of all tested devices were better, 6% similar, 22% worse
» The best had a delta of 4%, average was 24%, worst was 134%
Apple MacBook Pro 16 2021 M1 Pro audio analysis
(+) | speakers can play relatively loud (84.7 dB)
Bass 100 - 315 Hz
(+) | good bass - only 3.8% away from median
(+) | bass is linear (5.2% delta to prev. frequency)
Mids 400 - 2000 Hz
(+) | balanced mids - only 1.3% away from median
(+) | mids are linear (2.1% delta to prev. frequency)
Highs 2 - 16 kHz
(+) | balanced highs - only 1.9% away from median
(+) | highs are linear (2.7% delta to prev. frequency)
Overall 100 - 16.000 Hz
(+) | overall sound is linear (4.6% difference to median)
Compared to same class
» 0% of all tested devices in this class were better, 0% similar, 100% worse
» The best had a delta of 5%, average was 17%, worst was 45%
Compared to all devices tested
» 0% of all tested devices were better, 0% similar, 100% worse
» The best had a delta of 4%, average was 24%, worst was 134%
Energy Management
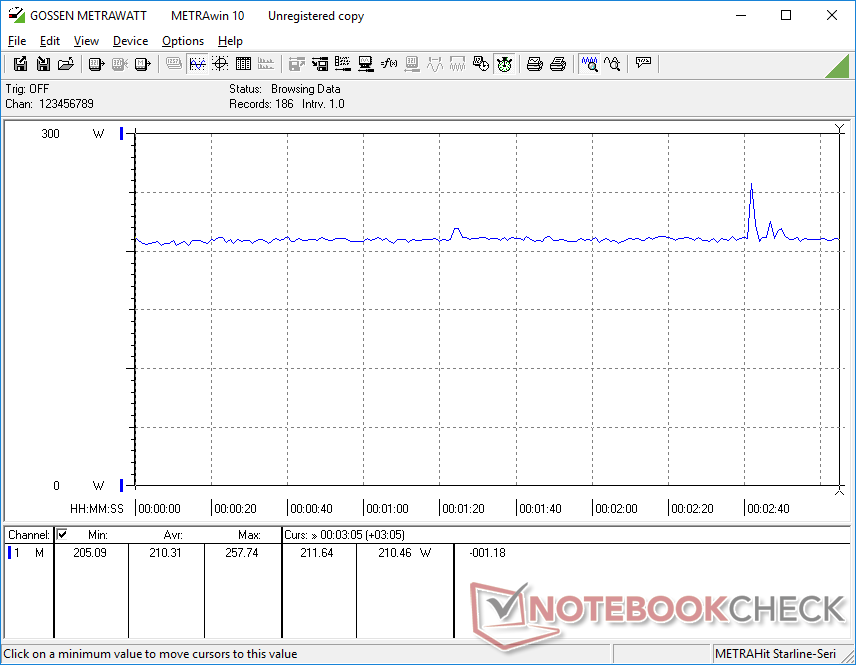
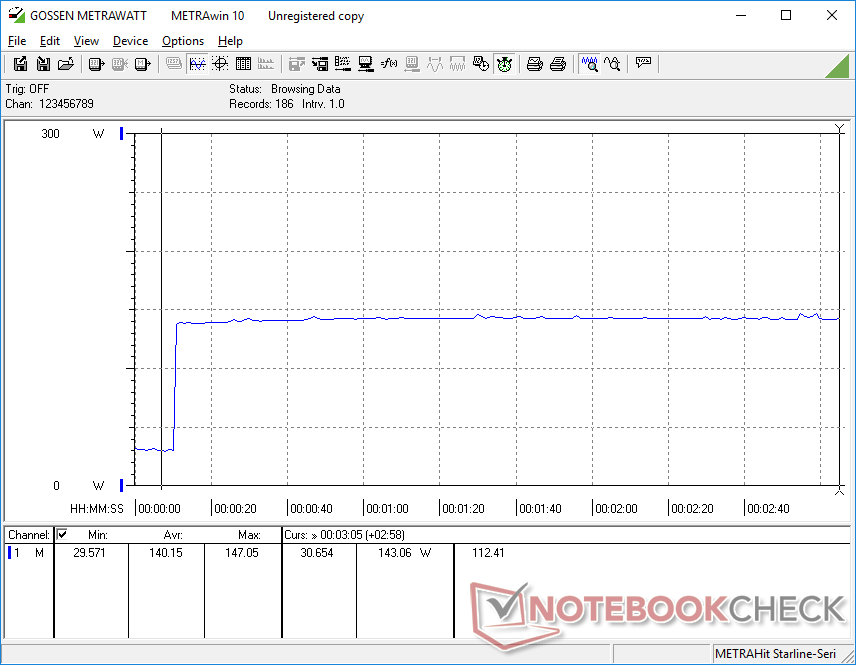
Power Consumption — Demanding Components
Our benchmarks above show a 20 to 30 percent improvement to CPU performance and 10 percent boost to GPU performance over the Core i9-11900H and GeForce RTX 3080, respectively, as found on the Schenker XMG Neo 17 GM7TG8S. Nonetheless, Metrahit measurements show that our GM7AG8P is slightly more power hungry than on the older GM7TG8S when under similar conditions. Running Prime95 in particular consumes about 10 to 15 percent more power on the GM7AG8P meaning that the aforementioned boost to CPU performance doesn't exactly come free. Performance-per-watt with Alder Lake-H is therefore not that much greater when compared to Tiger Lake-H.
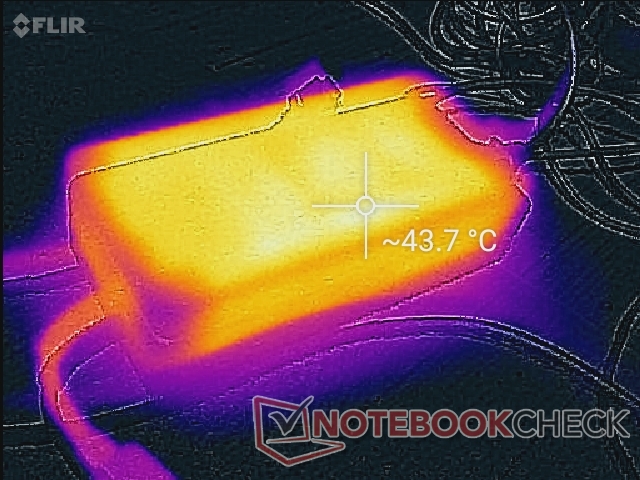
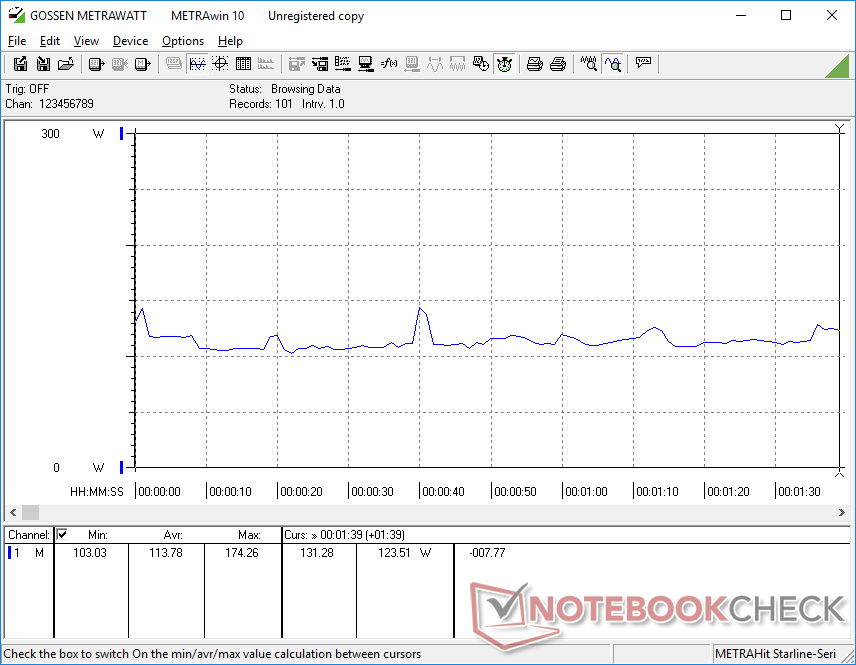
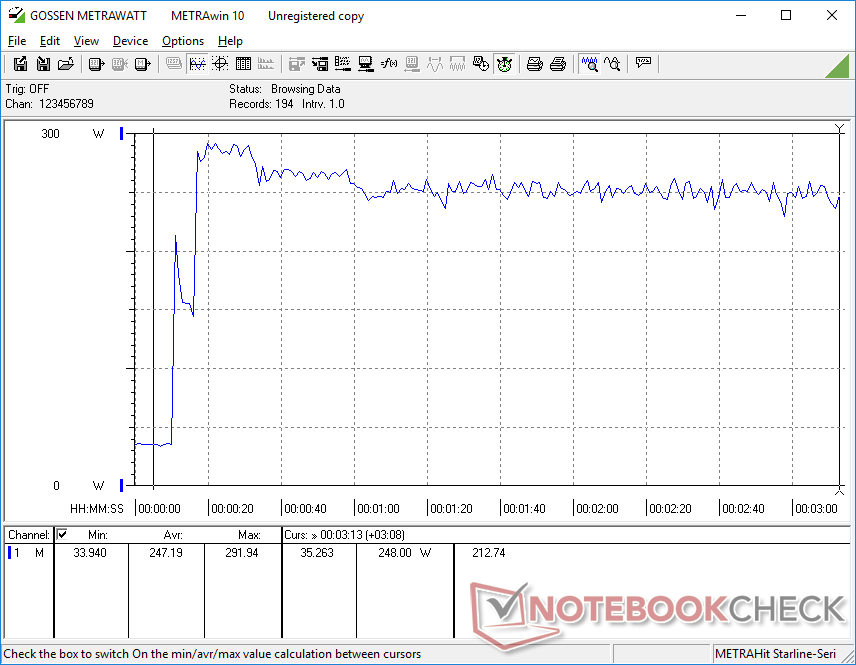
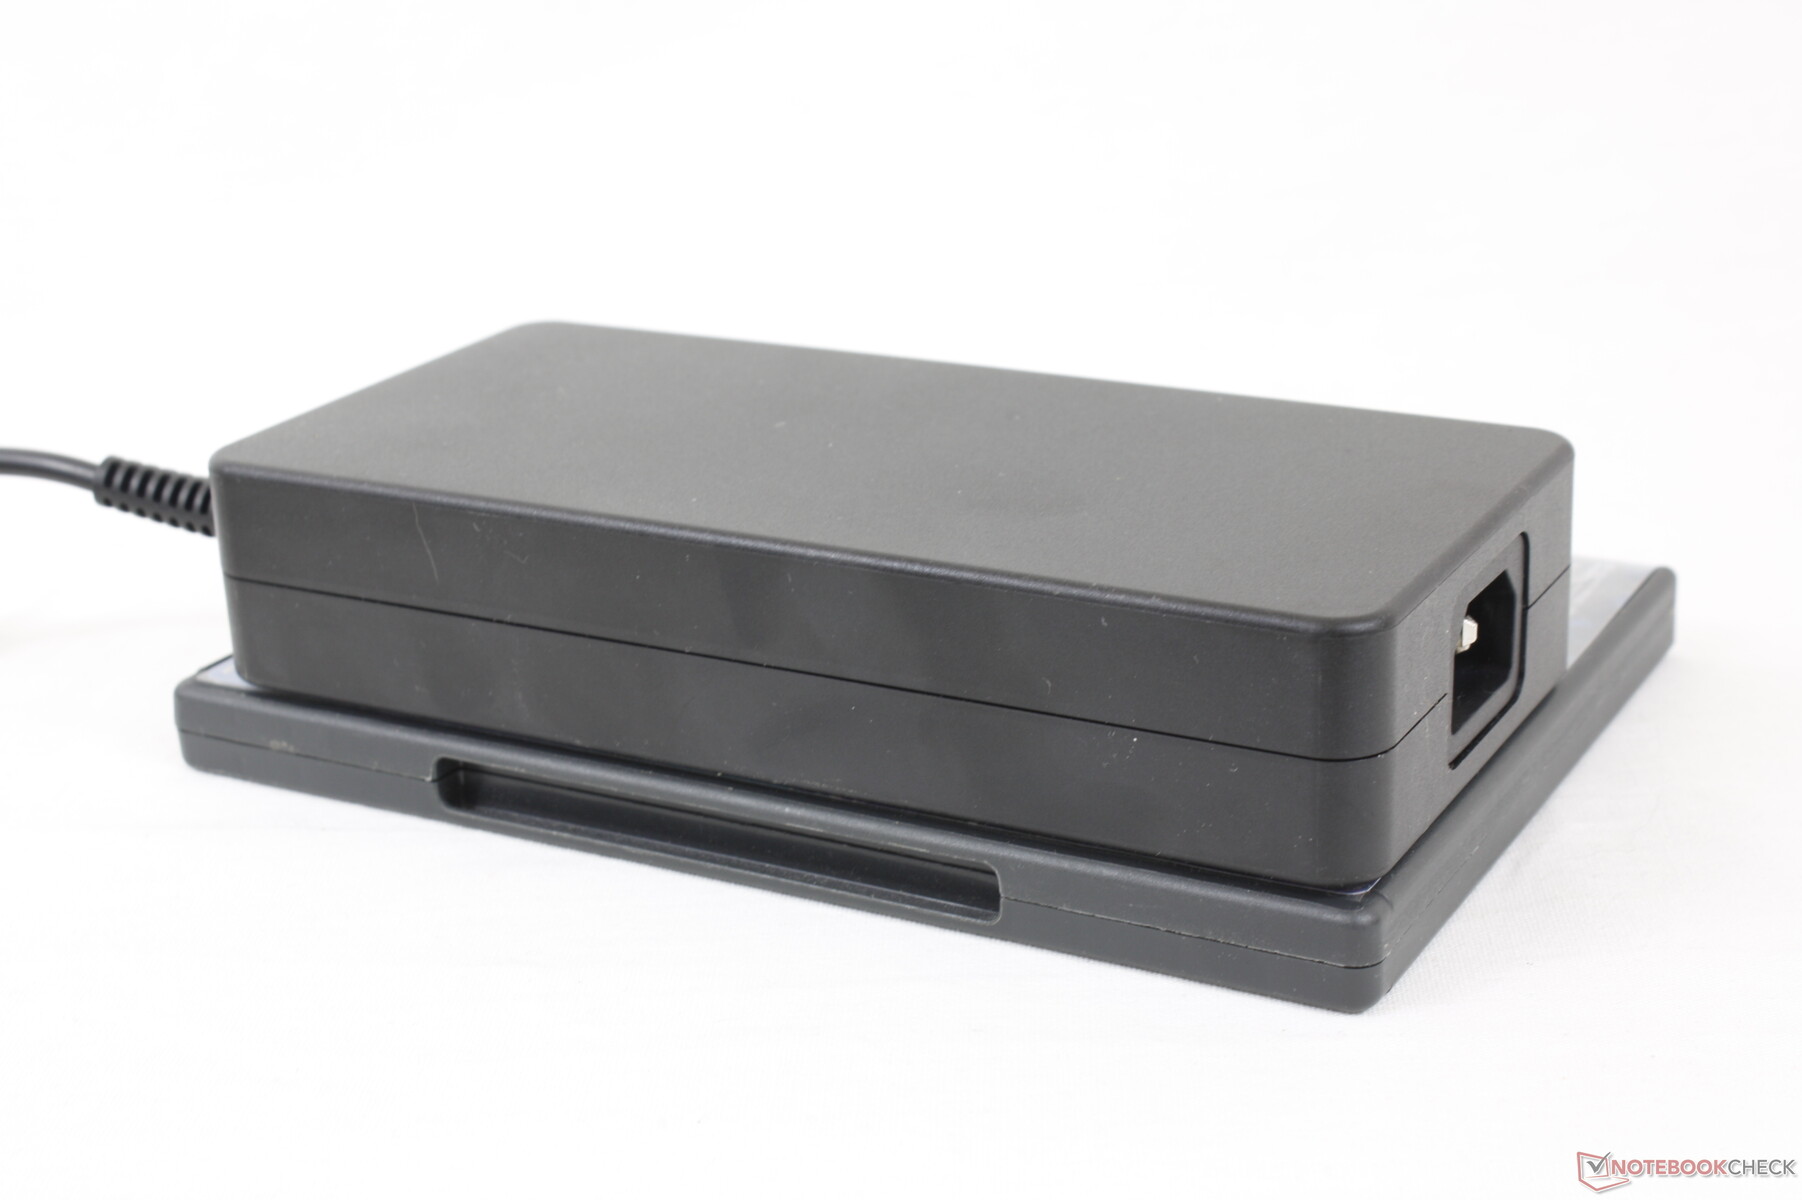
We're able to record a temporary maximum draw of 292 W from the large (~18 x 8.5 x 3.5 cm) 280 W AC adapter when running Prime95 and FurMark stress simultaneously. Expect this maximum to be even higher by 20 W or more if manually setting the GPU to 175 W mode. This rate would last about 20 seconds before falling and stabilizing at around 250 W as shown by our screenshot below likely due to thermal limitations.
| Off / Standby | |
| Idle | |
| Load |
|
Key:
min: | |
| Schenker Uniwill Technology GM7AG8P i9-12900H, GeForce RTX 3080 Ti Laptop GPU, Samsung PM9A1 MZVL2512HCJQ, IPS, 2560x1440, 17.3" | Schenker XMG NEO 17 GM7TG8S i7-11800H, GeForce RTX 3080 Laptop GPU, Samsung SSD 980 Pro 1TB MZ-V8P1T0BW, IPS, 2560x1440, 17.3" | Alienware x17 RTX 3080 P48E i7-11800H, GeForce RTX 3080 Laptop GPU, 2x WDC PC SN730 SDBPNTY-1T00 (RAID 0), IPS, 3840x2160, 17.3" | Razer Blade 17 RTX 3070 i7-11800H, GeForce RTX 3070 Laptop GPU, Samsung PM9A1 MZVL21T0HCLR, IPS, 1920x1080, 17.3" | MSI GS76 Stealth 11UH i9-11900H, GeForce RTX 3080 Laptop GPU, Samsung PM9A1 MZVL22T0HBLB, IPS, 3840x2160, 17.3" | Maingear Vector Pro MG-VCP17 i7-11800H, GeForce RTX 3080 Laptop GPU, Samsung PM9A1 MZVL21T0HCLR, IPS, 2560x1440, 17.3" | |
|---|---|---|---|---|---|---|
| Power Consumption | 18% | 9% | 11% | 29% | 28% | |
| Idle Minimum * (Watt) | 29.7 | 19 36% | 10.2 66% | 20.9 30% | 14 53% | 11 63% |
| Idle Average * (Watt) | 33.6 | 25 26% | 21.2 37% | 25.1 25% | 19 43% | 15.6 54% |
| Idle Maximum * (Watt) | 35.5 | 28 21% | 48.4 -36% | 45 -27% | 31 13% | 34 4% |
| Load Average * (Watt) | 113.8 | 105 8% | 118.7 -4% | 102 10% | 97 15% | 81.2 29% |
| Witcher 3 ultra * (Watt) | 210 | 223 -6% | 249 -19% | 189 10% | 156 26% | 204 3% |
| Load Maximum * (Watt) | 292 | 226 23% | 262 10% | 234.8 20% | 231 21% | 257.3 12% |
* ... smaller is better
Power Consumption Witcher 3 / Stresstest
Power Consumption external Monitor
Battery Life
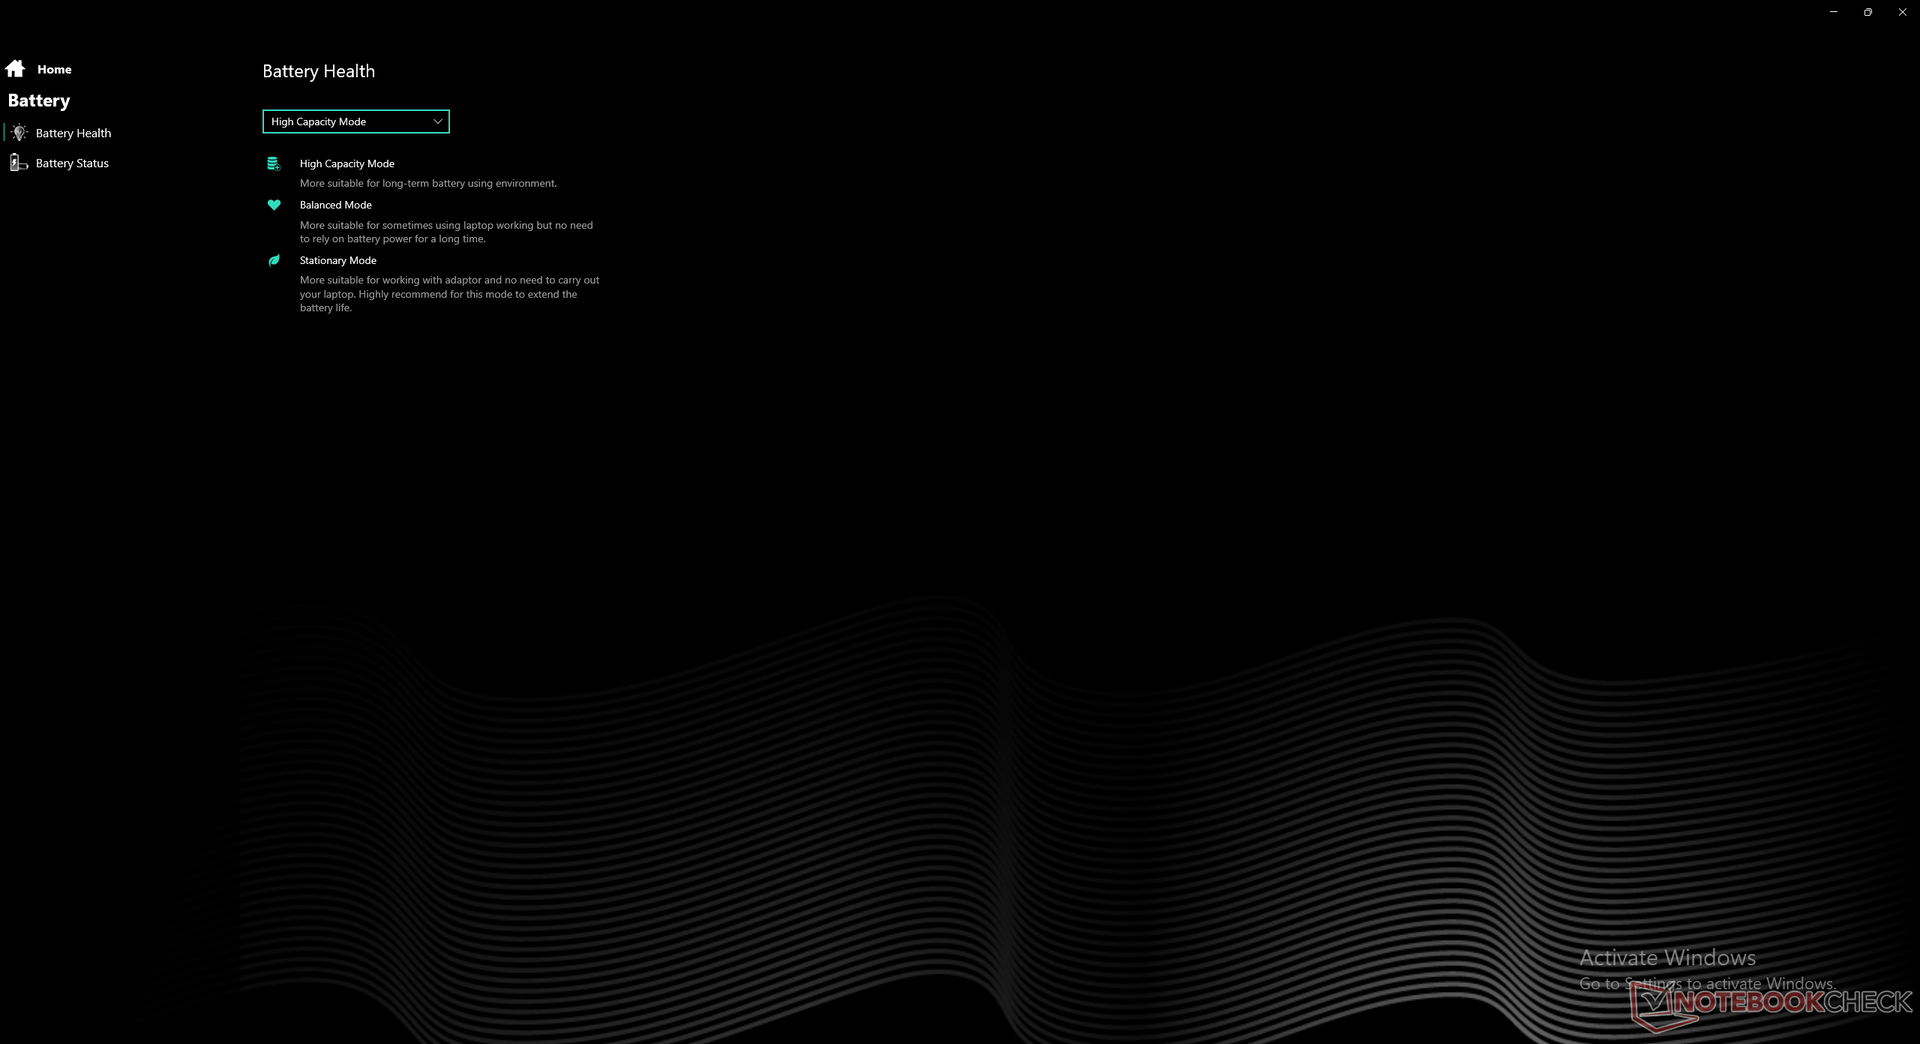
The integrated battery is relatively large at 91 Wh compared to only 62 W on the XMG Neo 17 with 11th gen Intel. Users can squeeze almost 6 hours of web browsing when on the Balanced profile with MSHybrid active or only 3 hours on discrete GPU mode.
Charging from empty to full with the included AC adapter is much slower than expected at 3 hours. Most Ultrabooks and other gaming laptops can fully recharge in 2 hours or faster.
Sadly, the system cannot recharge via third-party USB-C adapters unlike on the Razer Blade Pro and most other gaming laptops from Asus or Alienware.
| Schenker Uniwill Technology GM7AG8P i9-12900H, GeForce RTX 3080 Ti Laptop GPU, 91 Wh | Schenker XMG NEO 17 GM7TG8S i7-11800H, GeForce RTX 3080 Laptop GPU, 62 Wh | Alienware x17 RTX 3080 P48E i7-11800H, GeForce RTX 3080 Laptop GPU, 87 Wh | Razer Blade 17 RTX 3070 i7-11800H, GeForce RTX 3070 Laptop GPU, 70 Wh | MSI GS76 Stealth 11UH i9-11900H, GeForce RTX 3080 Laptop GPU, 99.9 Wh | Maingear Vector Pro MG-VCP17 i7-11800H, GeForce RTX 3080 Laptop GPU, 91 Wh | |
|---|---|---|---|---|---|---|
| Battery runtime | -18% | -28% | -10% | -7% | 8% | |
| Reader / Idle (h) | 7 | 6.7 | 9.9 | |||
| WiFi v1.3 (h) | 6.4 | 3.7 -42% | 5.9 -8% | 5.2 -19% | 6.4 0% | 6.9 8% |
| Load (h) | 1.5 | 1.6 7% | 0.8 -47% | 1.5 0% | 1.3 -13% | |
| H.264 (h) | 3.7 |
Pros
Cons
Verdict — Very High Performance-per-Volume
The mobile GeForce RTX 3070 Ti and RTX 3080 Ti were introduced to extend the life of the GeForce RTX 3000 series before the inevitable launch of mobile GeForce 4000 series. Until then, however, the mobile RTX 3080 Ti can provide the extra boost in performance that enthusiasts are craving for. Even though the GPU is only marginally faster than the mobile RTX 3080 Ti, it's still impressive to see an ultrathin model like the GM7AG8P outperform a much thicker and heavier alternative like the MSI GE76 10UH with the older RTX 3080.
Perhaps the more noteworthy aspect of the GM7AG8P is its ability to sustain a 150+ W TGP target despite its slim profile and relatively low weight. The Razer Blade Pro and MSI GS76 Stealth, which are both nearly the same size but heavier, ship with only a 95 W to 100 W RTX 3080 TGP target each. Uniwill Technology has managed to fit a more powerful GPU than we initially expected based on our experience with other ultrathin gaming laptops.
The CPU and GPU are some of the fastest for any gaming laptop regardless of size and weight, but the bulky 280 W AC adapter takes away from the otherwise thin and portable design of the laptop.
As for the Core i9-12900H CPU, the performance boost over the Core i9-11900H is more significant than the jump from a mobile RTX 3080 to the mobile RTX 3080 Ti. The gen-to-gen improvement is large enough to comfortably displace the AMD Zen 3 H-series as the top CPU for gaming laptops.
One of the biggest drawbacks to the GM7AG8P is its large 280 W brick that's required to power the demanding processors inside. At nearly a full kilogram, the adapter and associated cables are as heavy as some 15.6-inch Ultrabooks. It's a shame that the system cannot be recharged via USB-C which forces owners to carry the bulky adapter with them when traveling. In contrast, the Asus ROG Zephyrus and Alienware laptops can recharge via travel-friendly third-party USB-C adapters. Expect loud fan noise when gaming as well which is a common trait amongst all gaming laptops in this particular category.
Price and Availability
The Uniwill Technology GM7AG8P is not yet widely available for purchase. Resellers like Schenker and Eluktronics may adopt the chassis at a future date with similar specifications.
Schenker Uniwill Technology GM7AG8P
- 02/22/2022 v7 (old)
Allen Ngo
Price comparison
