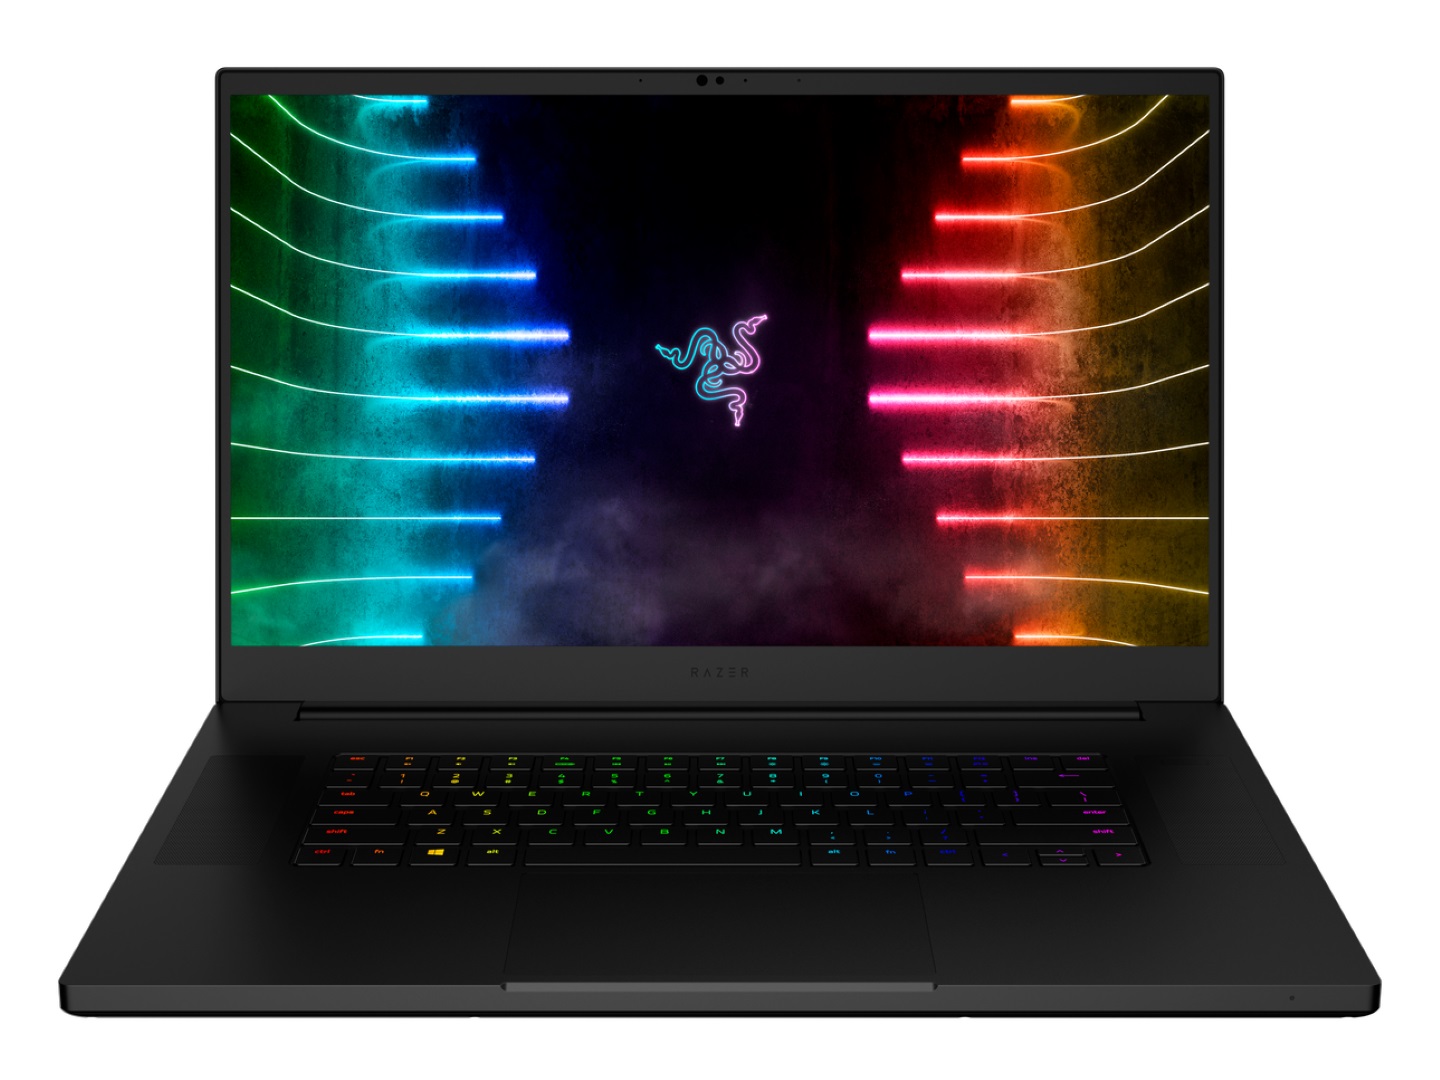
Razer Blade 17 laptop review: Now with 130 W TGP GeForce RTX graphics
Razer has always been quick to jump onto new CPUs and GPUs whenever they become available. Results are often excellent with appreciable gen-to-gen gains while they can other times fall flat. The Ice Lake Blade Stealth, for example, proved to worse than the cheaper Whiskey Lake-U version it was supposed to replace. Thankfully, this latest 17.3-inch Blade model has no such problems.
The 2021 Blade 17 succeeds the Blade Pro 17 by dropping the "Pro" and adding in new Intel 11th gen Tiger Lake-H processors into the mix. The GPU and display also get upgrades from 100 W TGP and 300 Hz to 130 W TGP and 360 Hz, respectively. The chassis design and physical features are otherwise identical to the original 2019 model that launched with 9th gen Coffee Lake-H CPUs and Turing GPUs.
Alternatives to the Blade 17 include other high-end ultrathin gaming laptops like the MSI GS76, Asus Zephyrus S17, Acer Predator Triton, or the Gigabyte Aero or Aorus series. Our exact configuration is currently shipping for $2799 USD.
More Razer reviews:
potential competitors in comparison
Rating | Date | Model | Weight | Height | Size | Resolution | Price |
|---|---|---|---|---|---|---|---|
| 89.4 % v7 (old) | 09 / 2021 | Razer Blade 17 RTX 3070 i7-11800H, GeForce RTX 3070 Laptop GPU | 2.8 kg | 19.9 mm | 17.30" | 1920x1080 | |
| 90.1 % v7 (old) | 07 / 2021 | Asus ROG Zephyrus S17 GX703HSD i9-11900H, GeForce RTX 3080 Laptop GPU | 2.8 kg | 19.9 mm | 17.30" | 2560x1440 | |
| 86.2 % v7 (old) | 09 / 2021 | MSI GS76 Stealth 11UH i9-11900H, GeForce RTX 3080 Laptop GPU | 2.4 kg | 20 mm | 17.30" | 3840x2160 | |
| 82 % v7 (old) | 08 / 2021 | Acer Nitro 5 AN517-41-R9S5 R7 5800H, GeForce RTX 3080 Laptop GPU | 2.7 kg | 24.9 mm | 17.30" | 1920x1080 | |
| 88 % v7 (old) | 05 / 2021 | Gigabyte Aero 17 HDR YD i9-11980HK, GeForce RTX 3080 Laptop GPU | 2.8 kg | 22 mm | 17.30" | 3840x2160 | |
| 87.8 % v7 (old) | 09 / 2021 | Maingear Vector Pro MG-VCP17 i7-11800H, GeForce RTX 3080 Laptop GPU | 2.3 kg | 19.81 mm | 17.30" | 2560x1440 |
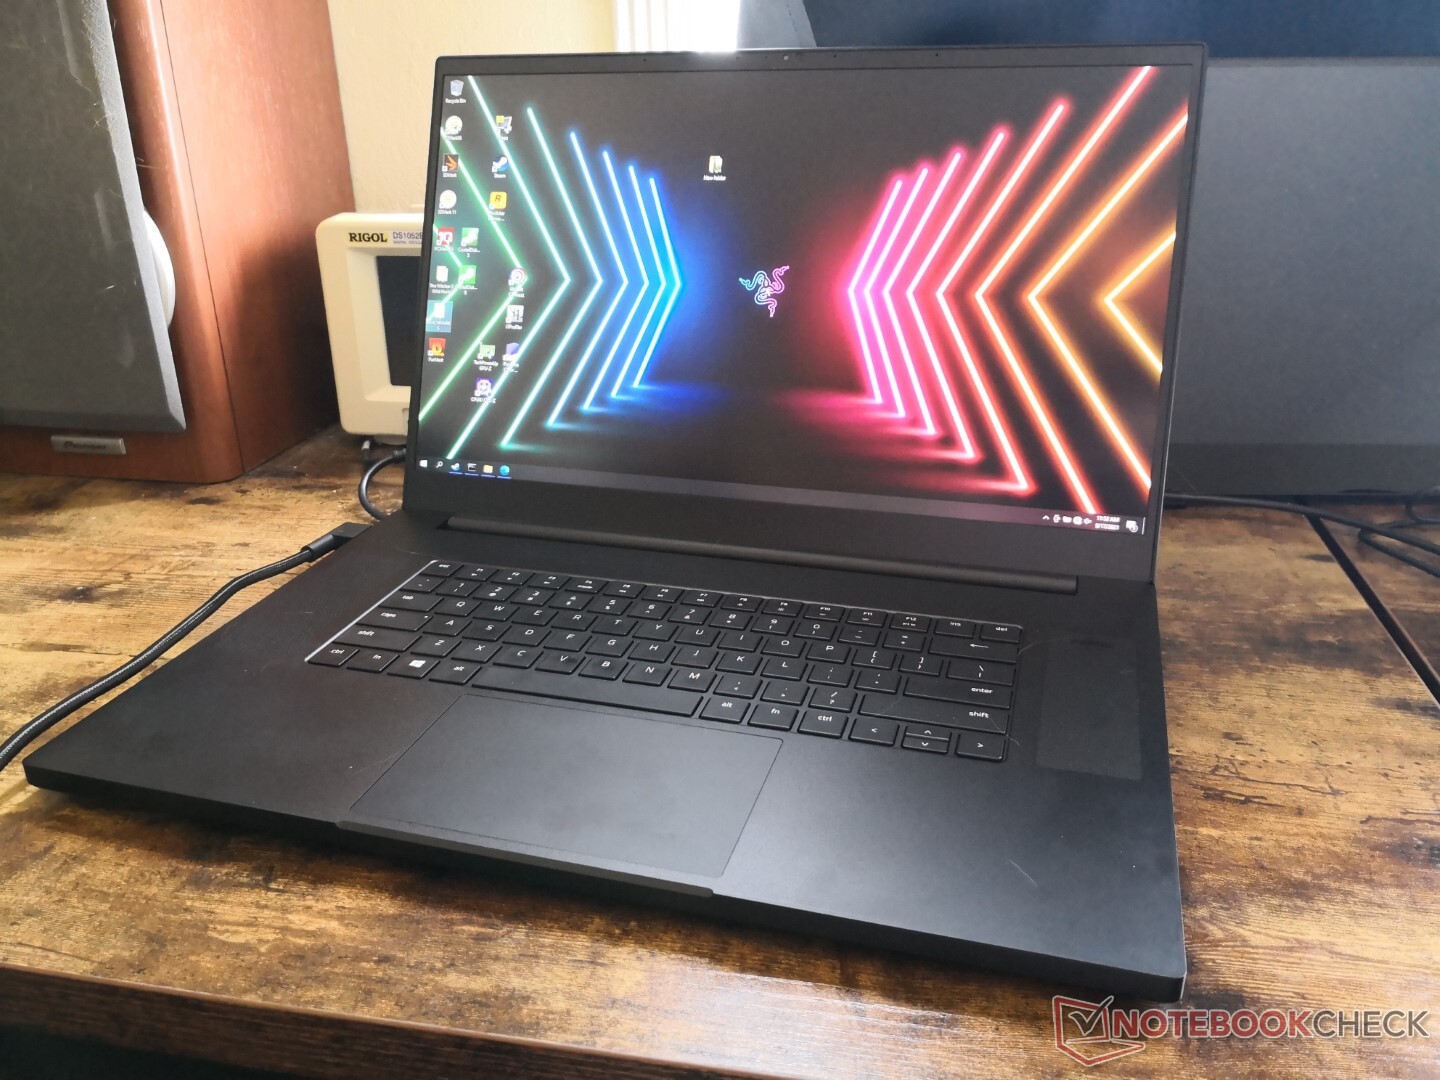
Case — Inside Changes
The year-over-year upgrades are all internal since there are no changes to the external skeleton. Major updates include:
- 11th gen Intel Tiger Lake-H CPUs (up to Core i9) to replace last year's 10th gen Comet Lake-H
- 130 W TGP GeForce RTX GPUs to replace last year's 100 W options
- 1080p (2.1 MP) webcam versus 720p (1 MP) on last year's model
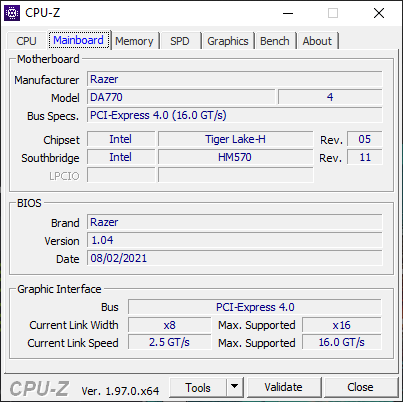
- Thunderbolt 4 compatibility instead of only Thunderbolt 3
- Support for two PCIe4 NVMe SSDs instead of only PCIe3
- New dispplay options including 360 Hz refresh rate instead of 300 Hz
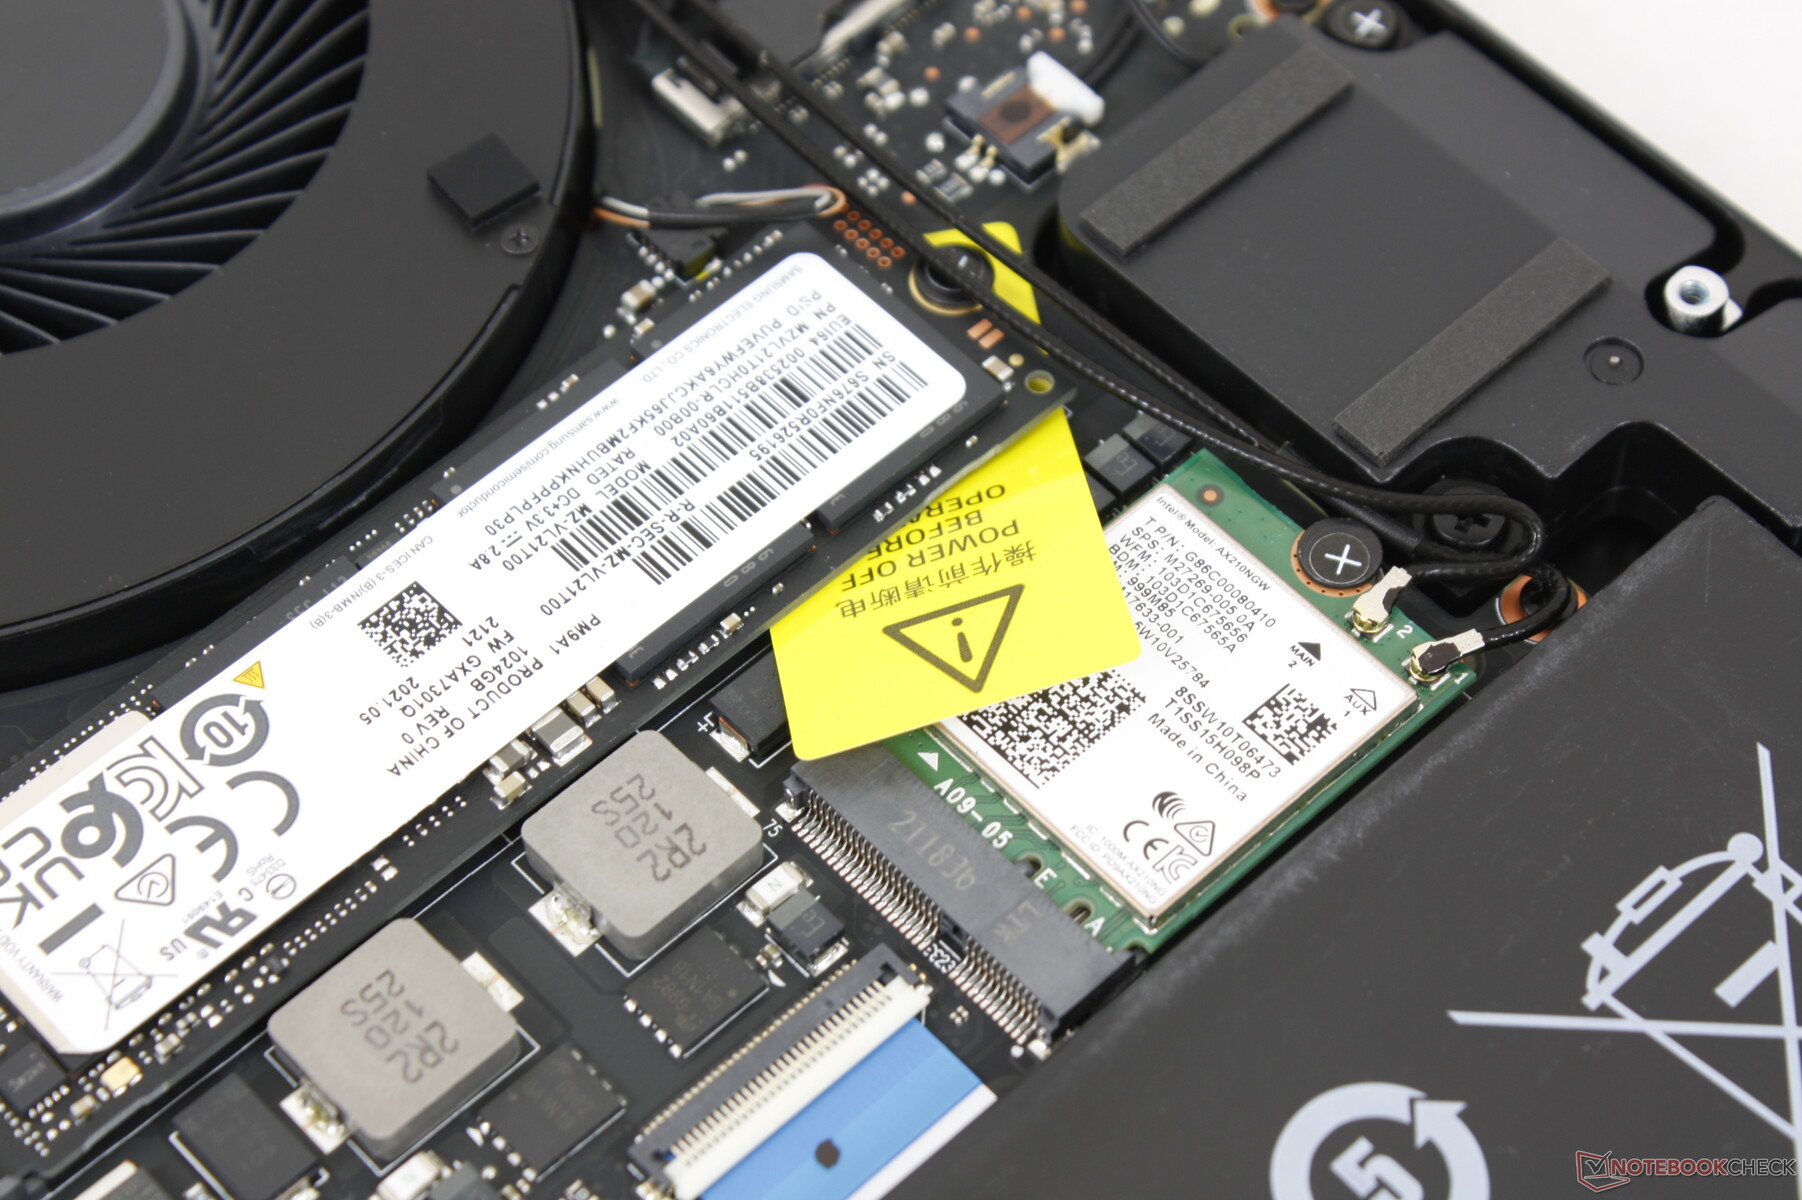
- Intel AX210 for Wi-Fi 6E support to replace last year's AX200/201
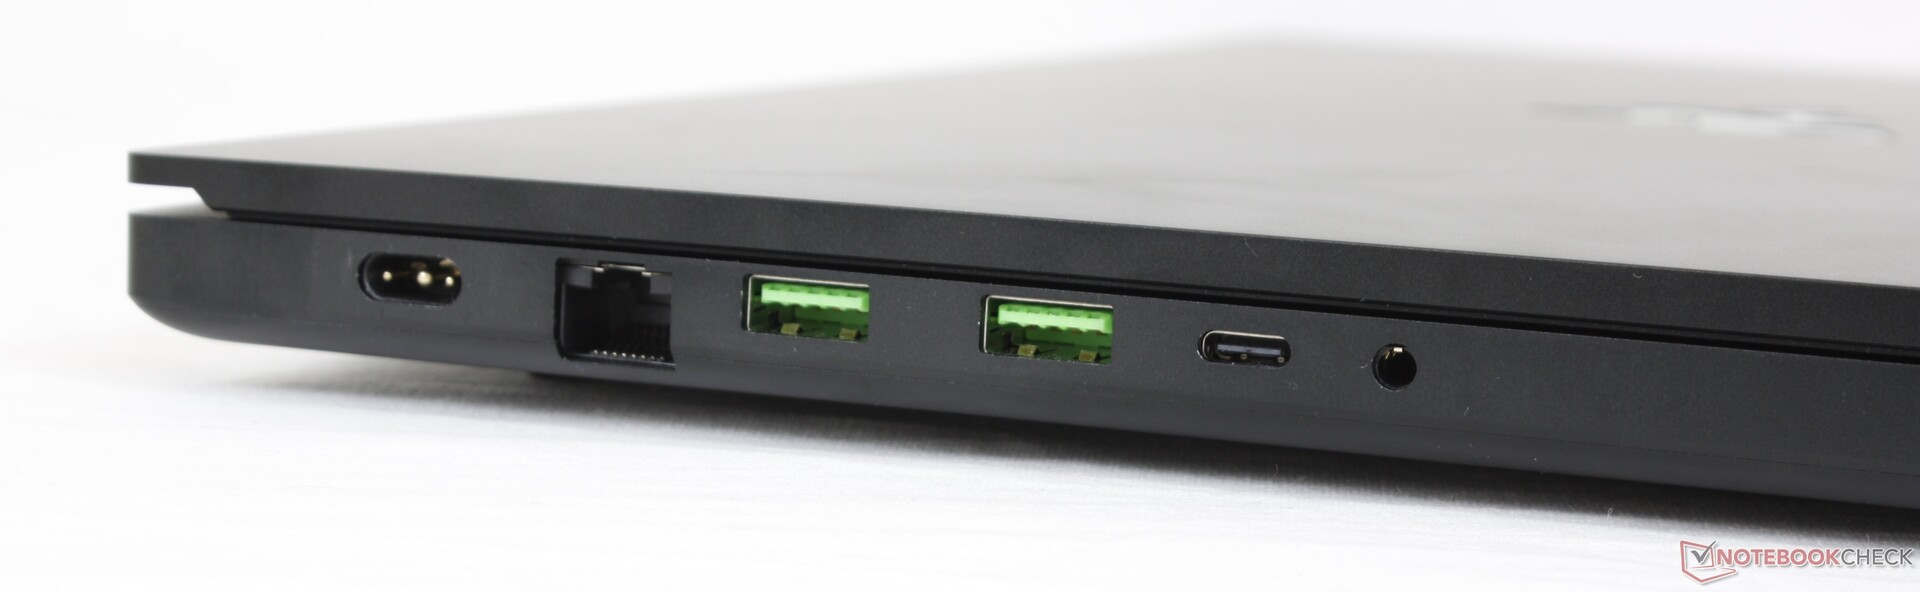
Connectivity — Now with Thunderbolt 4
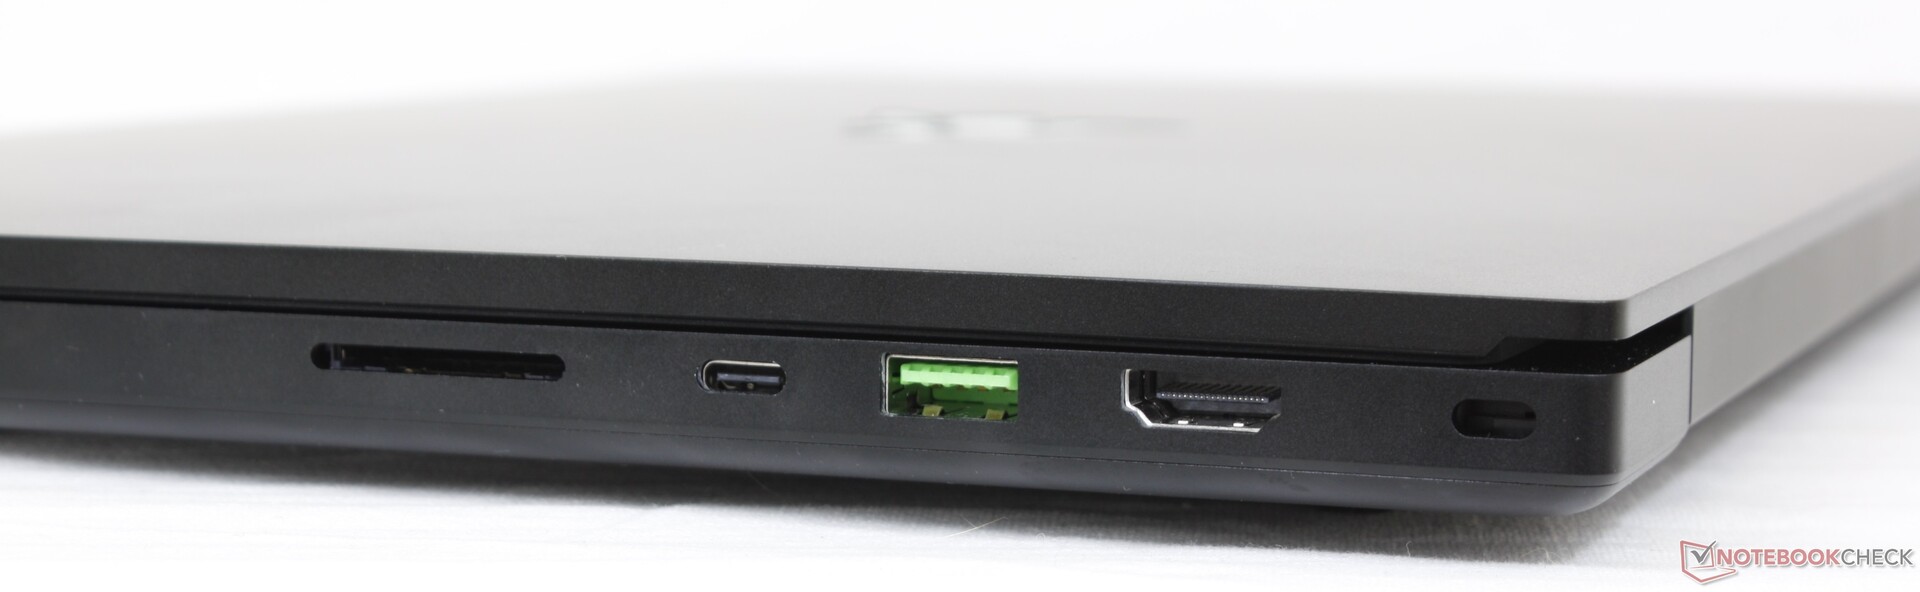
SD Card Reader
| SD Card Reader | |
| average JPG Copy Test (av. of 3 runs) | |
| Razer Blade 17 RTX 3070 (AV Pro V60) | |
| MSI GS76 Stealth 11UH (AV PRO microSD 128 GB V60) | |
| Gigabyte Aero 17 HDR YD (AV PRO microSD 128 GB V60) | |
| Asus ROG Zephyrus S17 GX703HSD | |
| Maingear Vector Pro MG-VCP17 (AV Pro V60) | |
| maximum AS SSD Seq Read Test (1GB) | |
| Asus ROG Zephyrus S17 GX703HSD | |
| MSI GS76 Stealth 11UH (AV PRO microSD 128 GB V60) | |
| Razer Blade 17 RTX 3070 (AV Pro V60) | |
| Gigabyte Aero 17 HDR YD (AV PRO microSD 128 GB V60) | |
| Maingear Vector Pro MG-VCP17 (AV Pro V60) | |
Communication — Wi-Fi 6E now Standard
For most users, Wi-Fi 6E will perform the same as existing Wi-Fi 6 laptops as users will need a Wi-Fi 6E router to exploit all of its benefits. Transfer rates are remain stable and mostly unchanged from last year's Wi-Fi 6 model when paired to our Netgear RAX200 test router.
Webcam — 1080p Instead of 720p
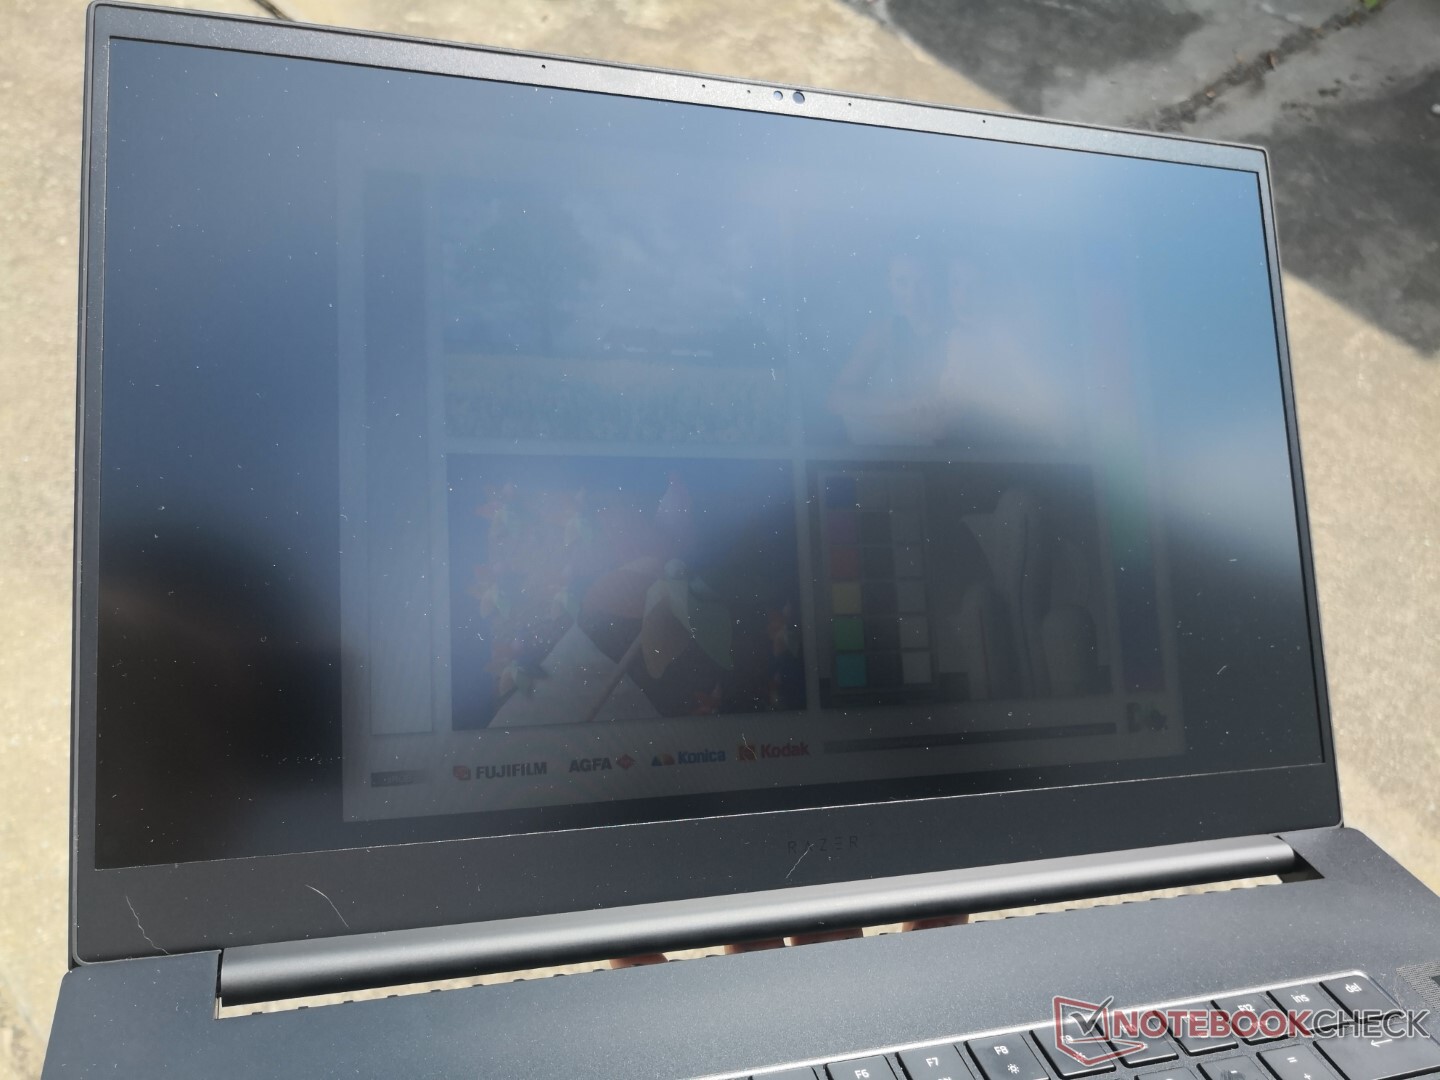
The camera is indeed sharper this time around as shown by our comparison images below. Color accuracy, however, does not appear to be any better or worse. A webcam shutter continues to be missing.

 GeForce RTX 3080 Laptop GPU, i7-10875H, Samsung PM981a MZVLB1T0HBLR")
 GeForce RTX 3080 Laptop GPU, i7-10875H, Samsung PM981a MZVLB1T0HBLR")


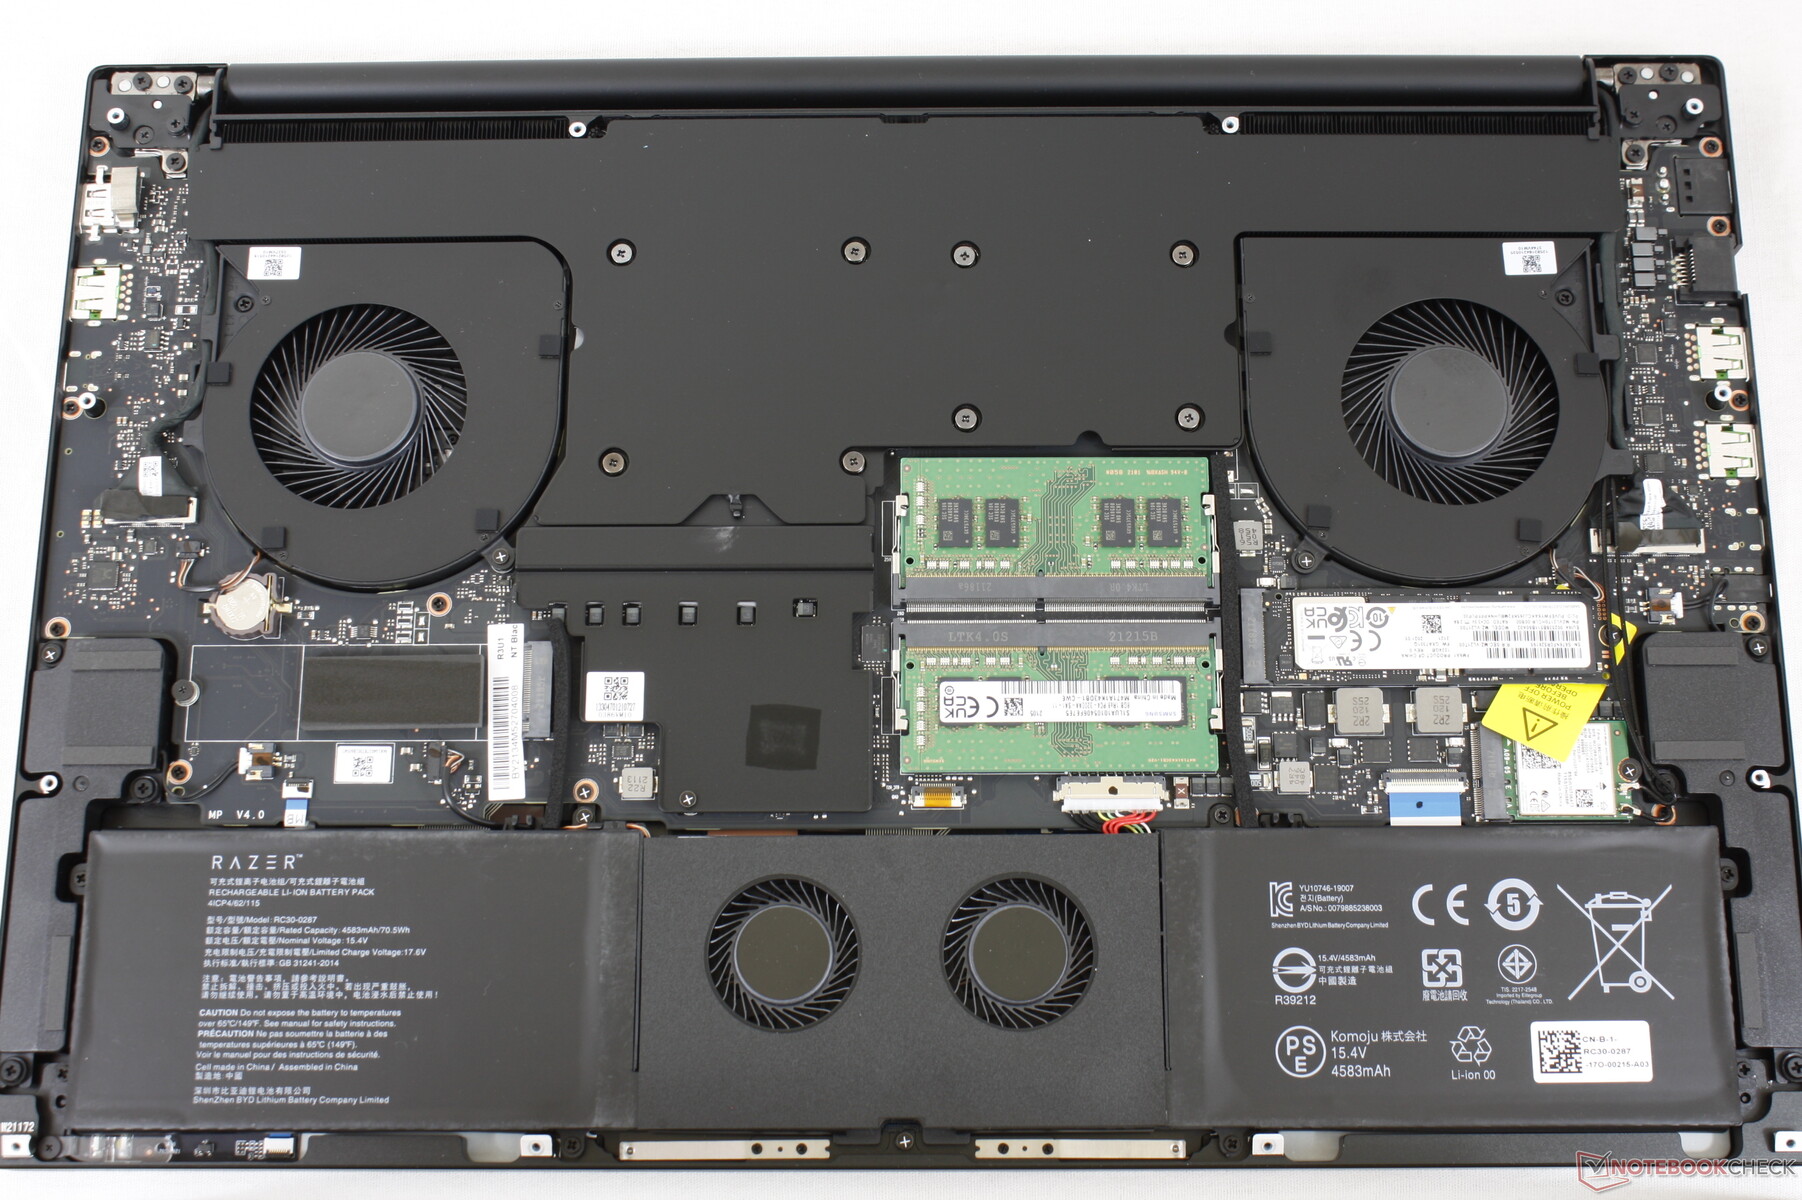
Maintenance
There are some slight changes to the positioning of the screws on the Blade 17 when compared to the Blade Pro. Otherwise, most everything else appears to be identical.
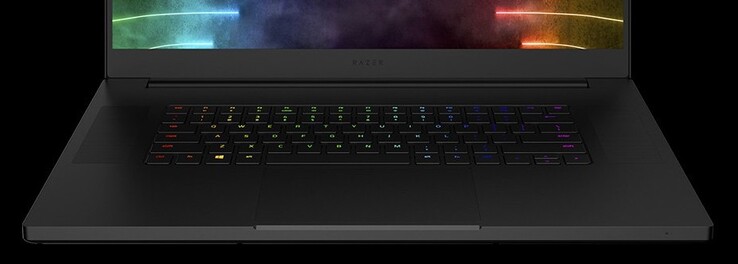
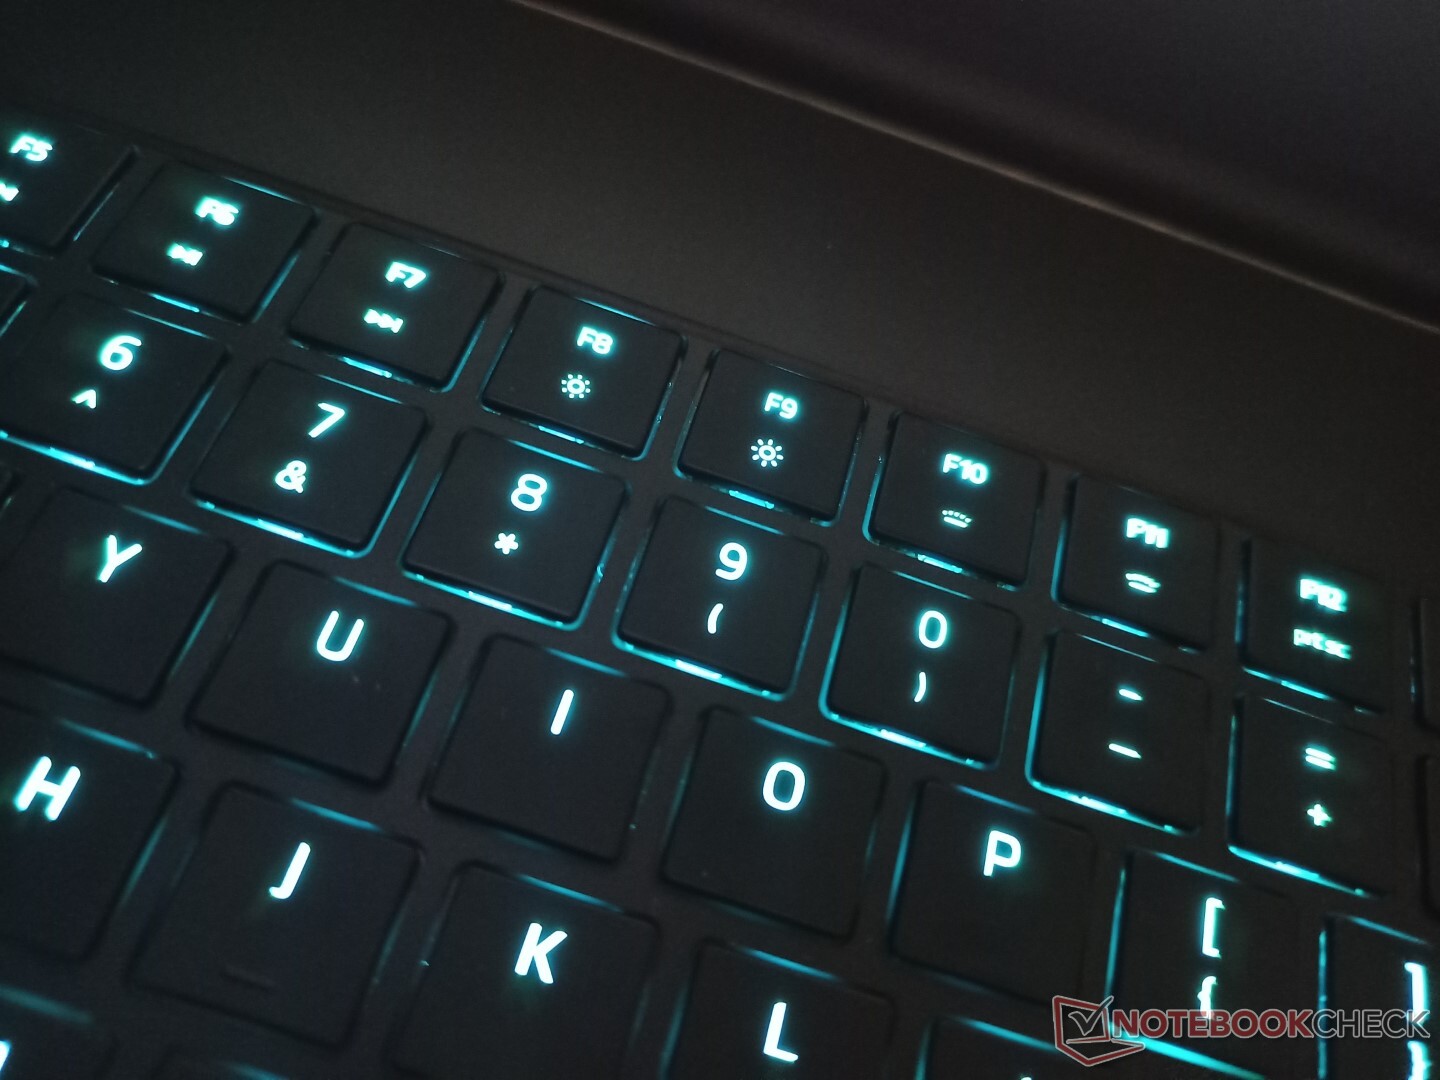
Input Devices
All keyboard keys and symbols are lit on our US unit. We suspect that some symbols may not be lit yet again for models overseas since Razer has made no external changes to the chassis.
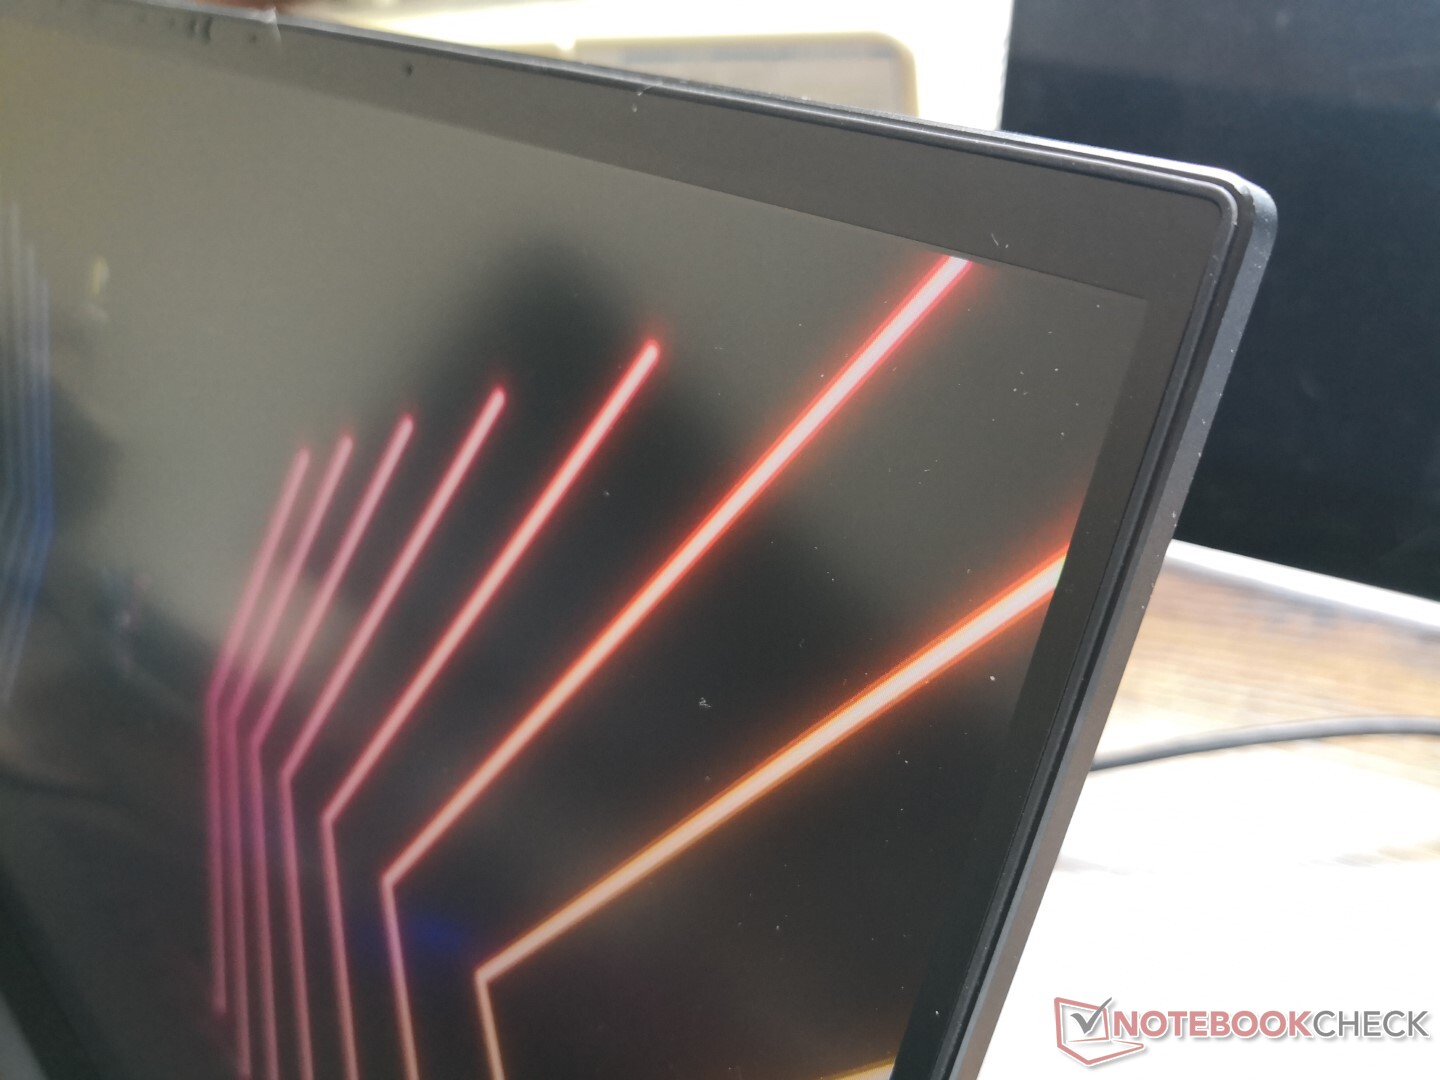
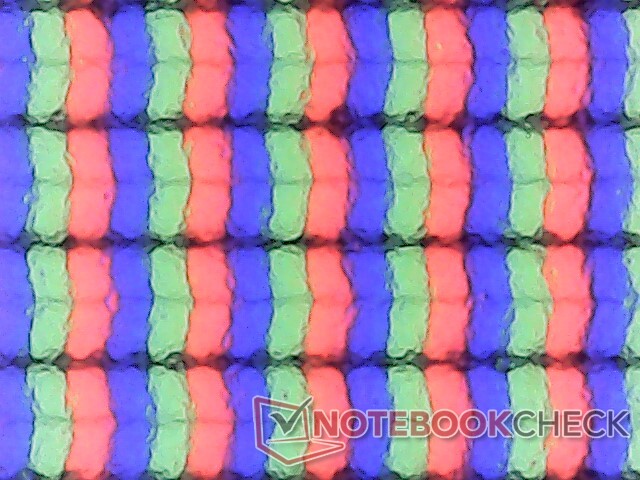
Display — Ultra-Smooth 360 Hz
Razer is using the same 1080p 360 Hz AU Optronics B173HAN05.4 IPS panel for its Blade 17 as Asus is using for its Strix Scar 17 G733QS. Thus, the viewing experience between these two laptops are very similar. This particular panel offers full sRGB coverage with very fast response times and a respectable contrast ratio of nearly 1000:1 to be good for both editing and gaming alike. Its attributes are nearly the same as the 300 Hz Sharp panel on last year's Blade Pro meaning users are really only paying for that slightly faster refresh rate.
Other display options include 165 Hz 1440p (QHD) with full sRGB coverage and a glossy 4K touchscreen with full AdobeRGB coverage. The latter is also expected to be brighter than our 360 Hz option (~400 nits vs. ~300 nits).
| |||||||||||||||||||||||||
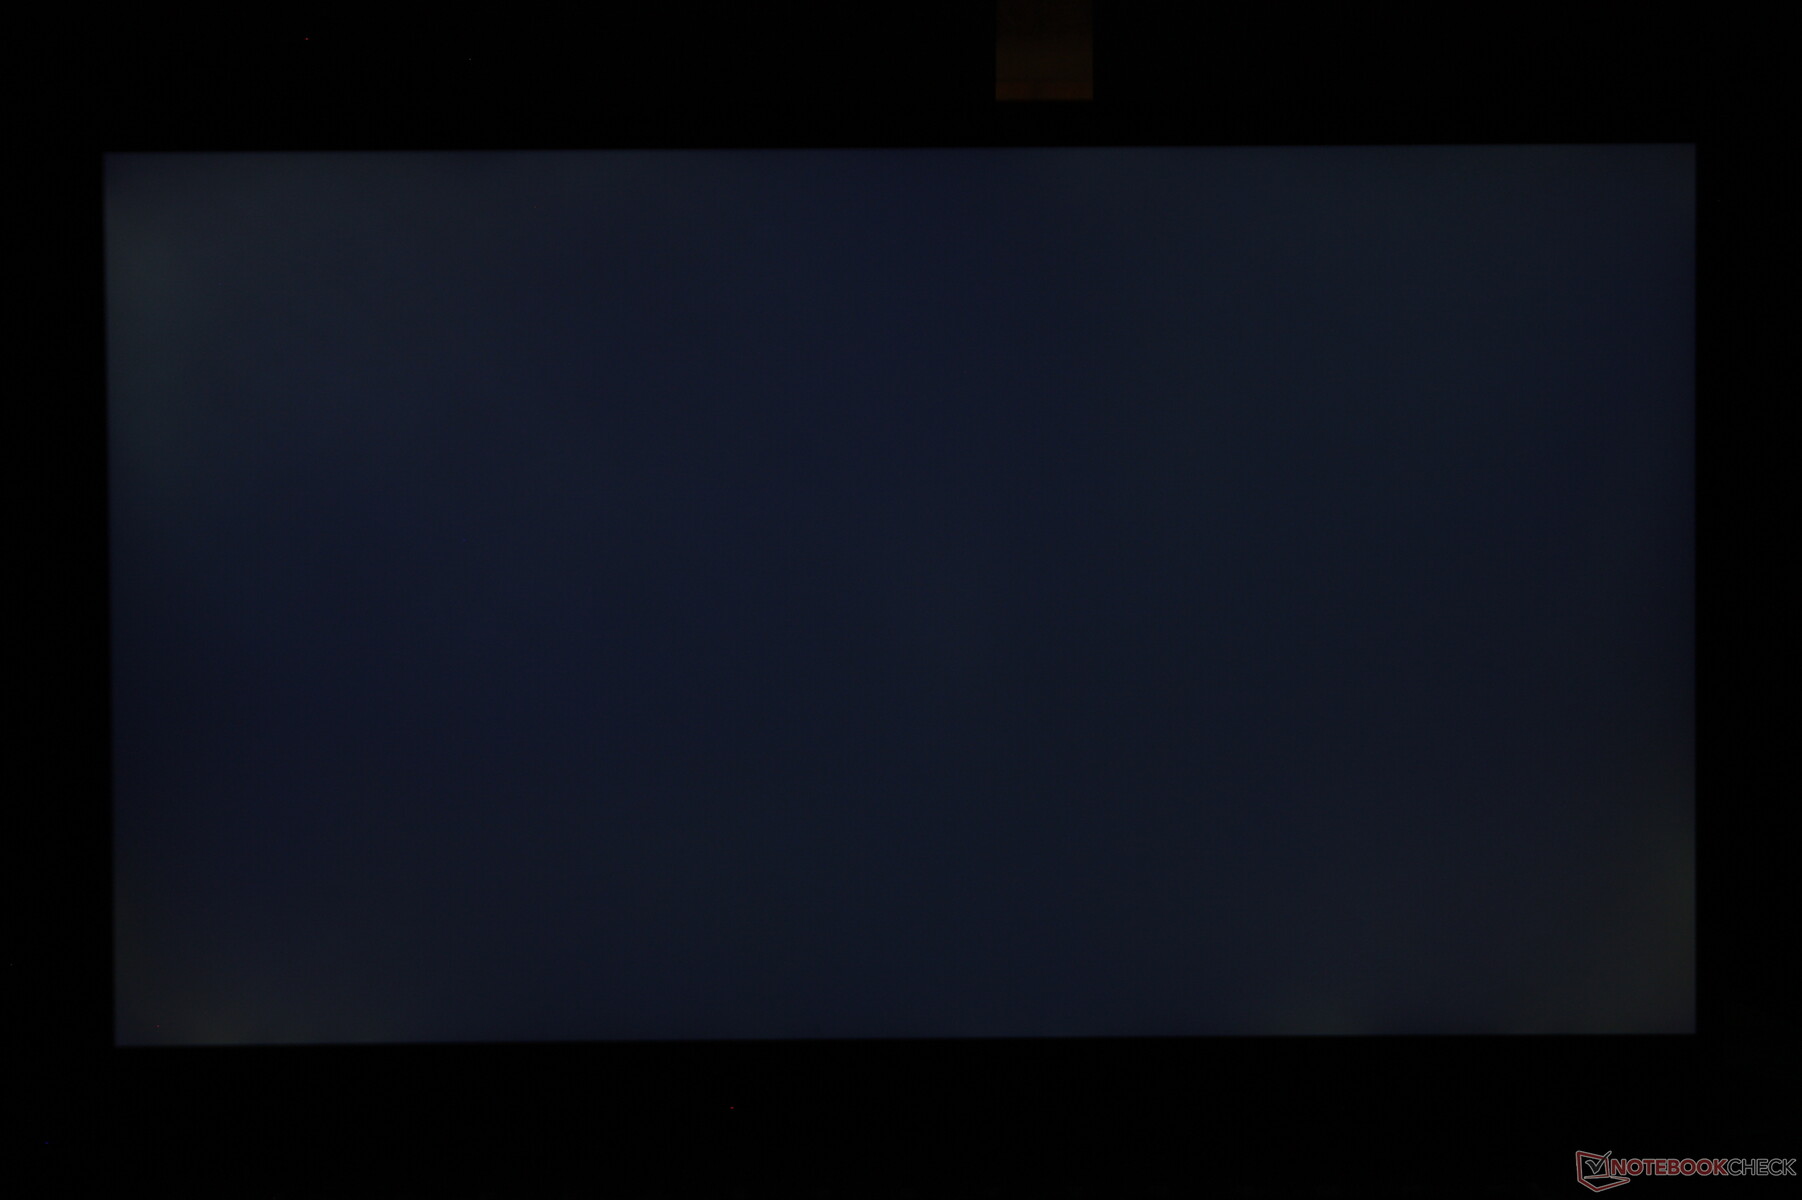
Brightness Distribution: 91 %
Center on Battery: 323.3 cd/m²
Contrast: 980:1 (Black: 0.33 cd/m²)
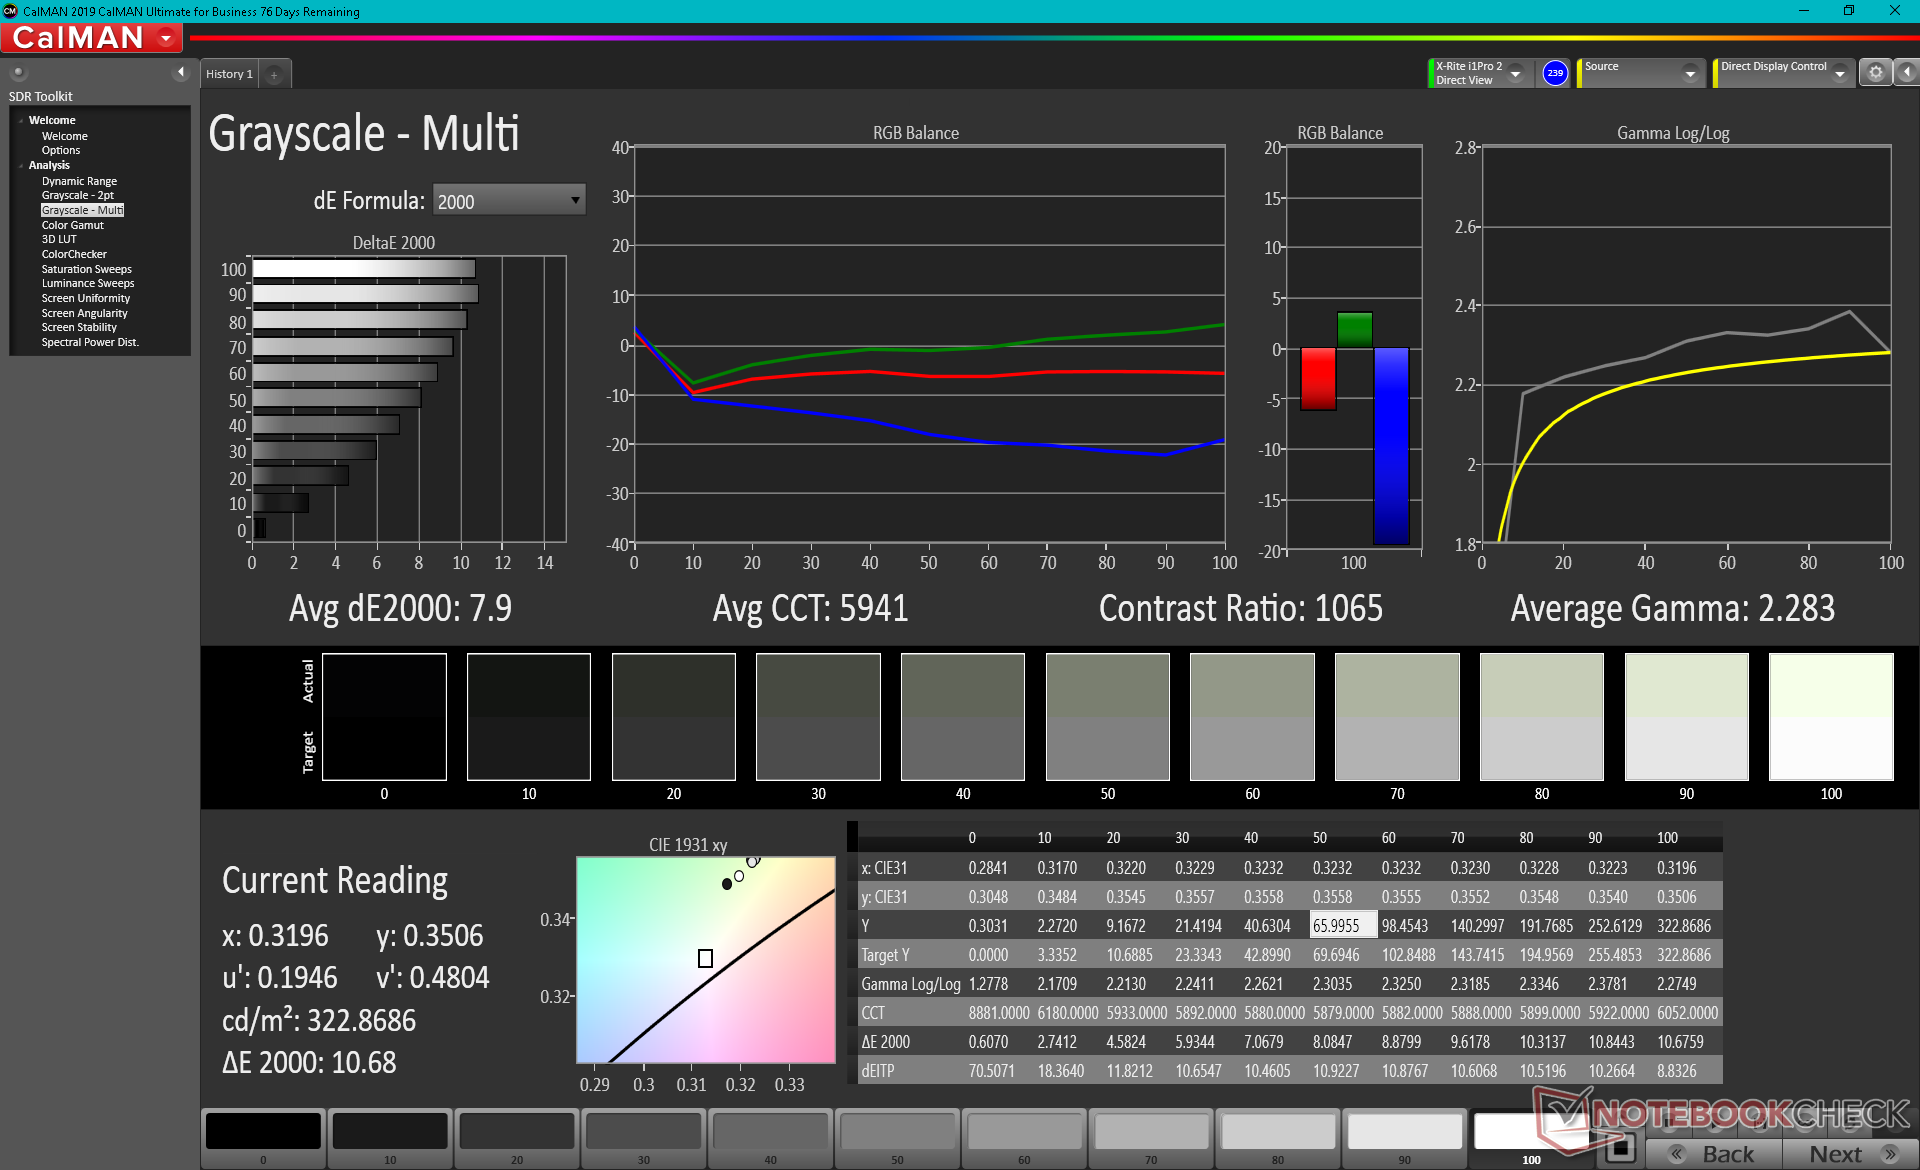
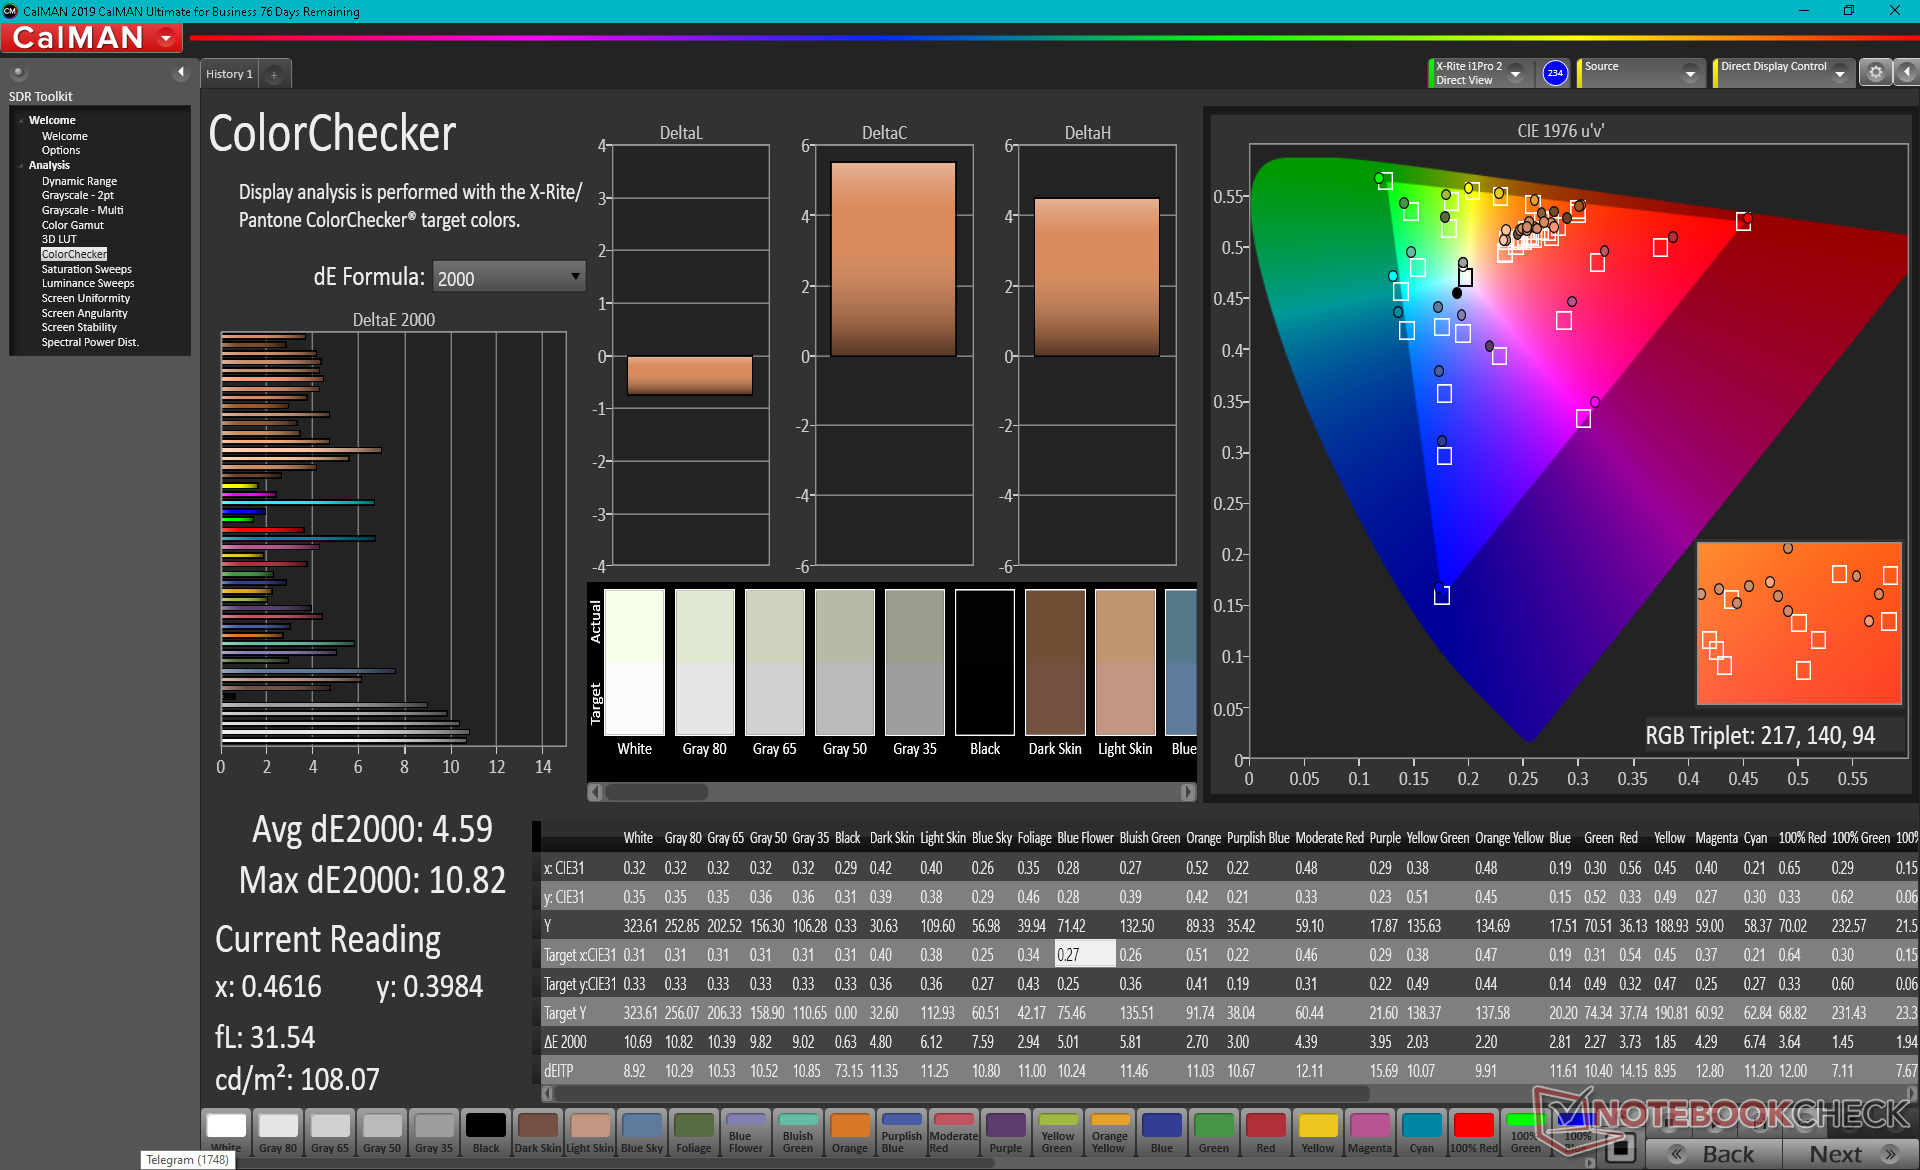
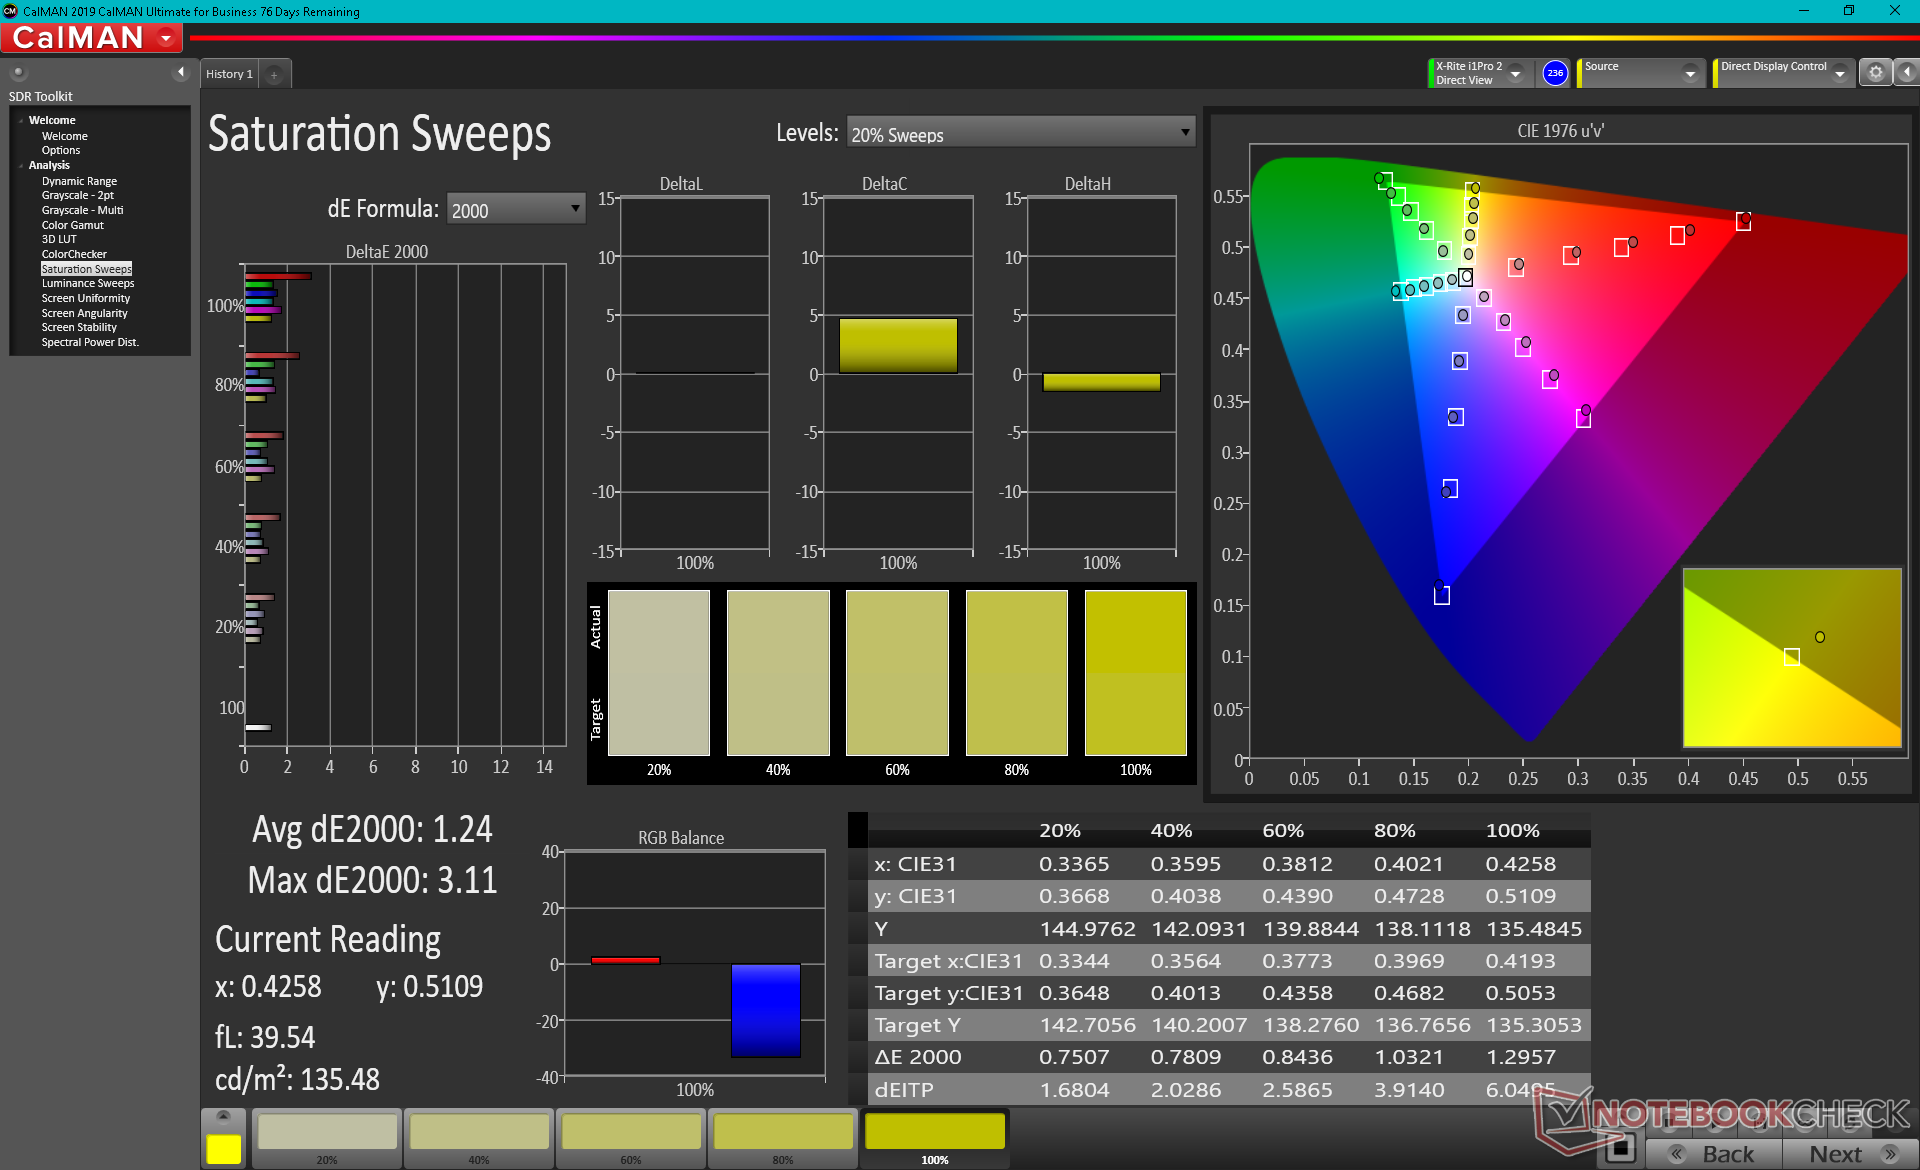
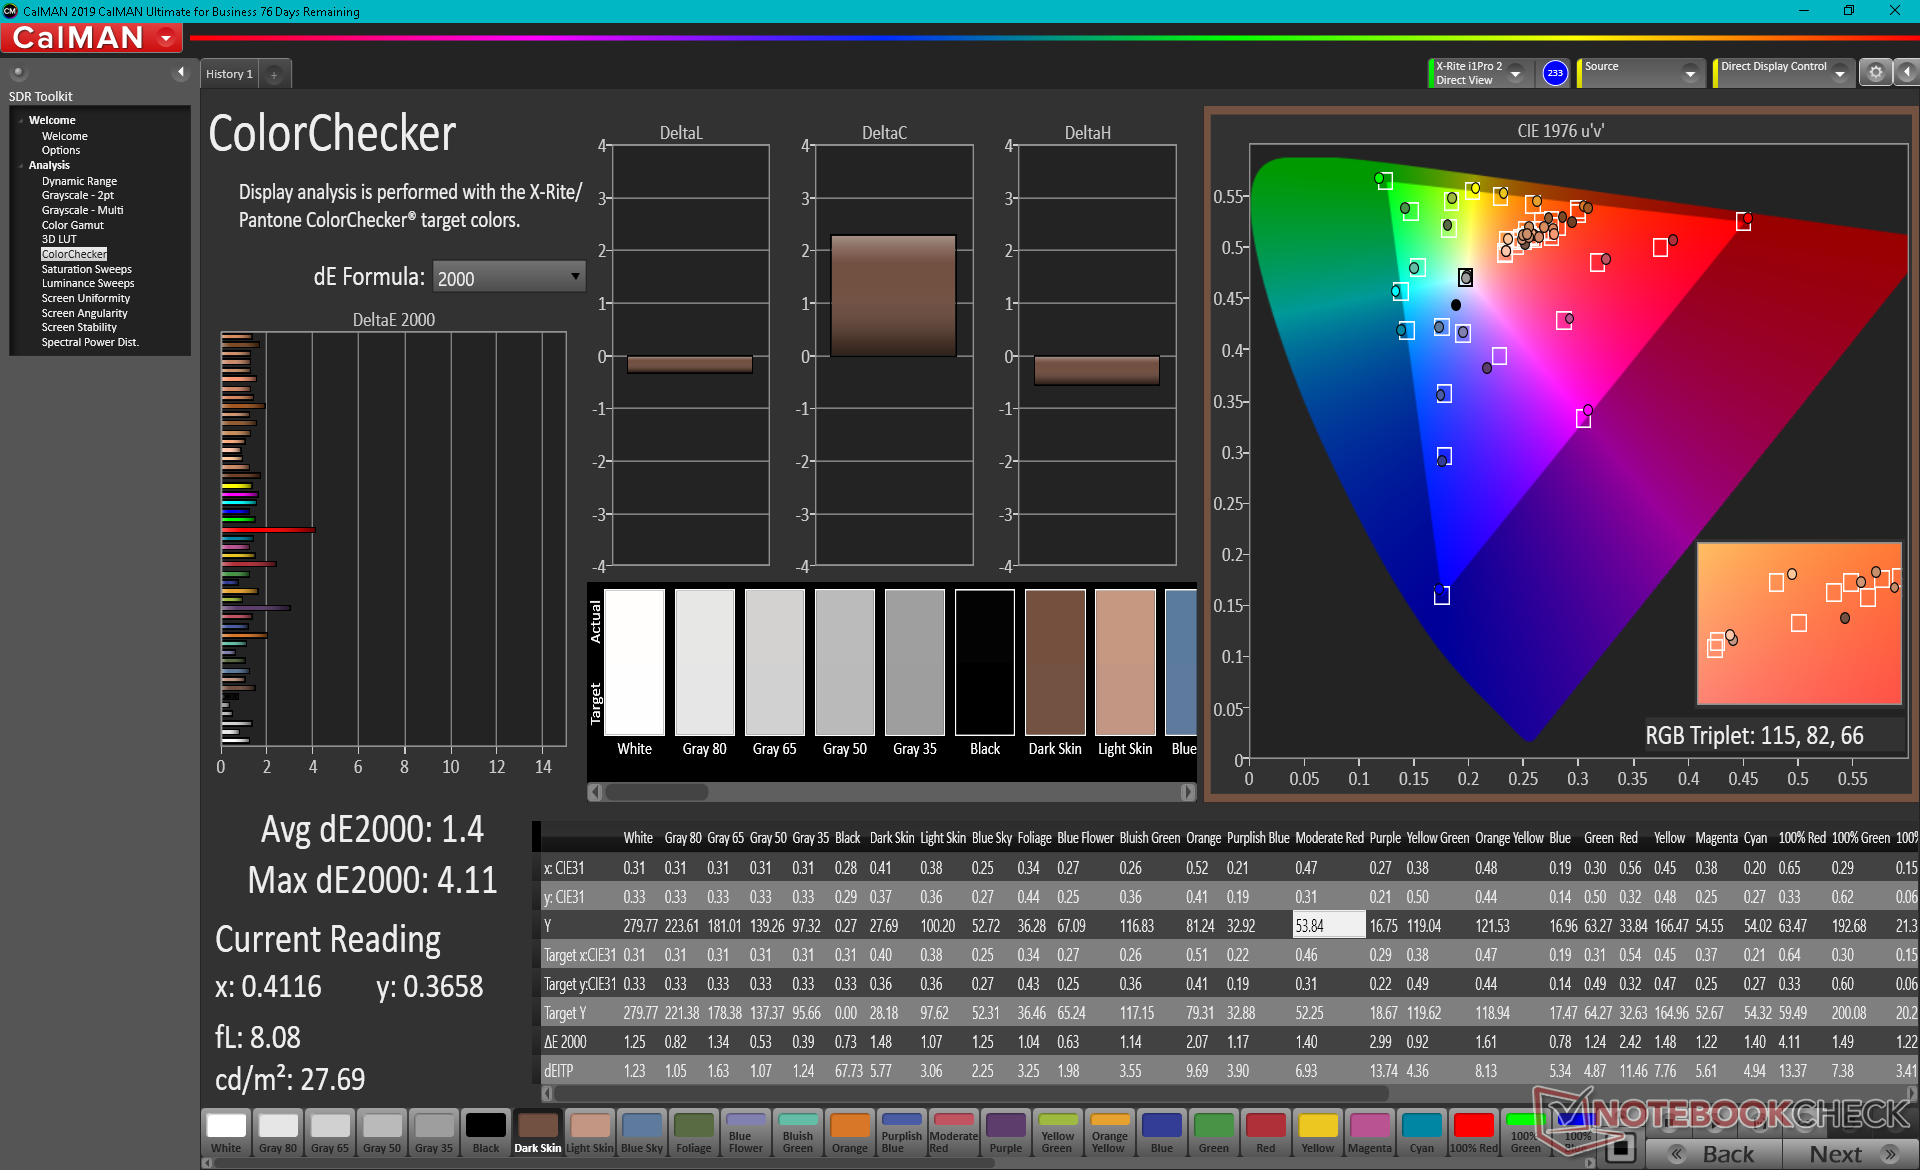
ΔE ColorChecker Calman: 4.59 | ∀{0.5-29.43 Ø4.73}
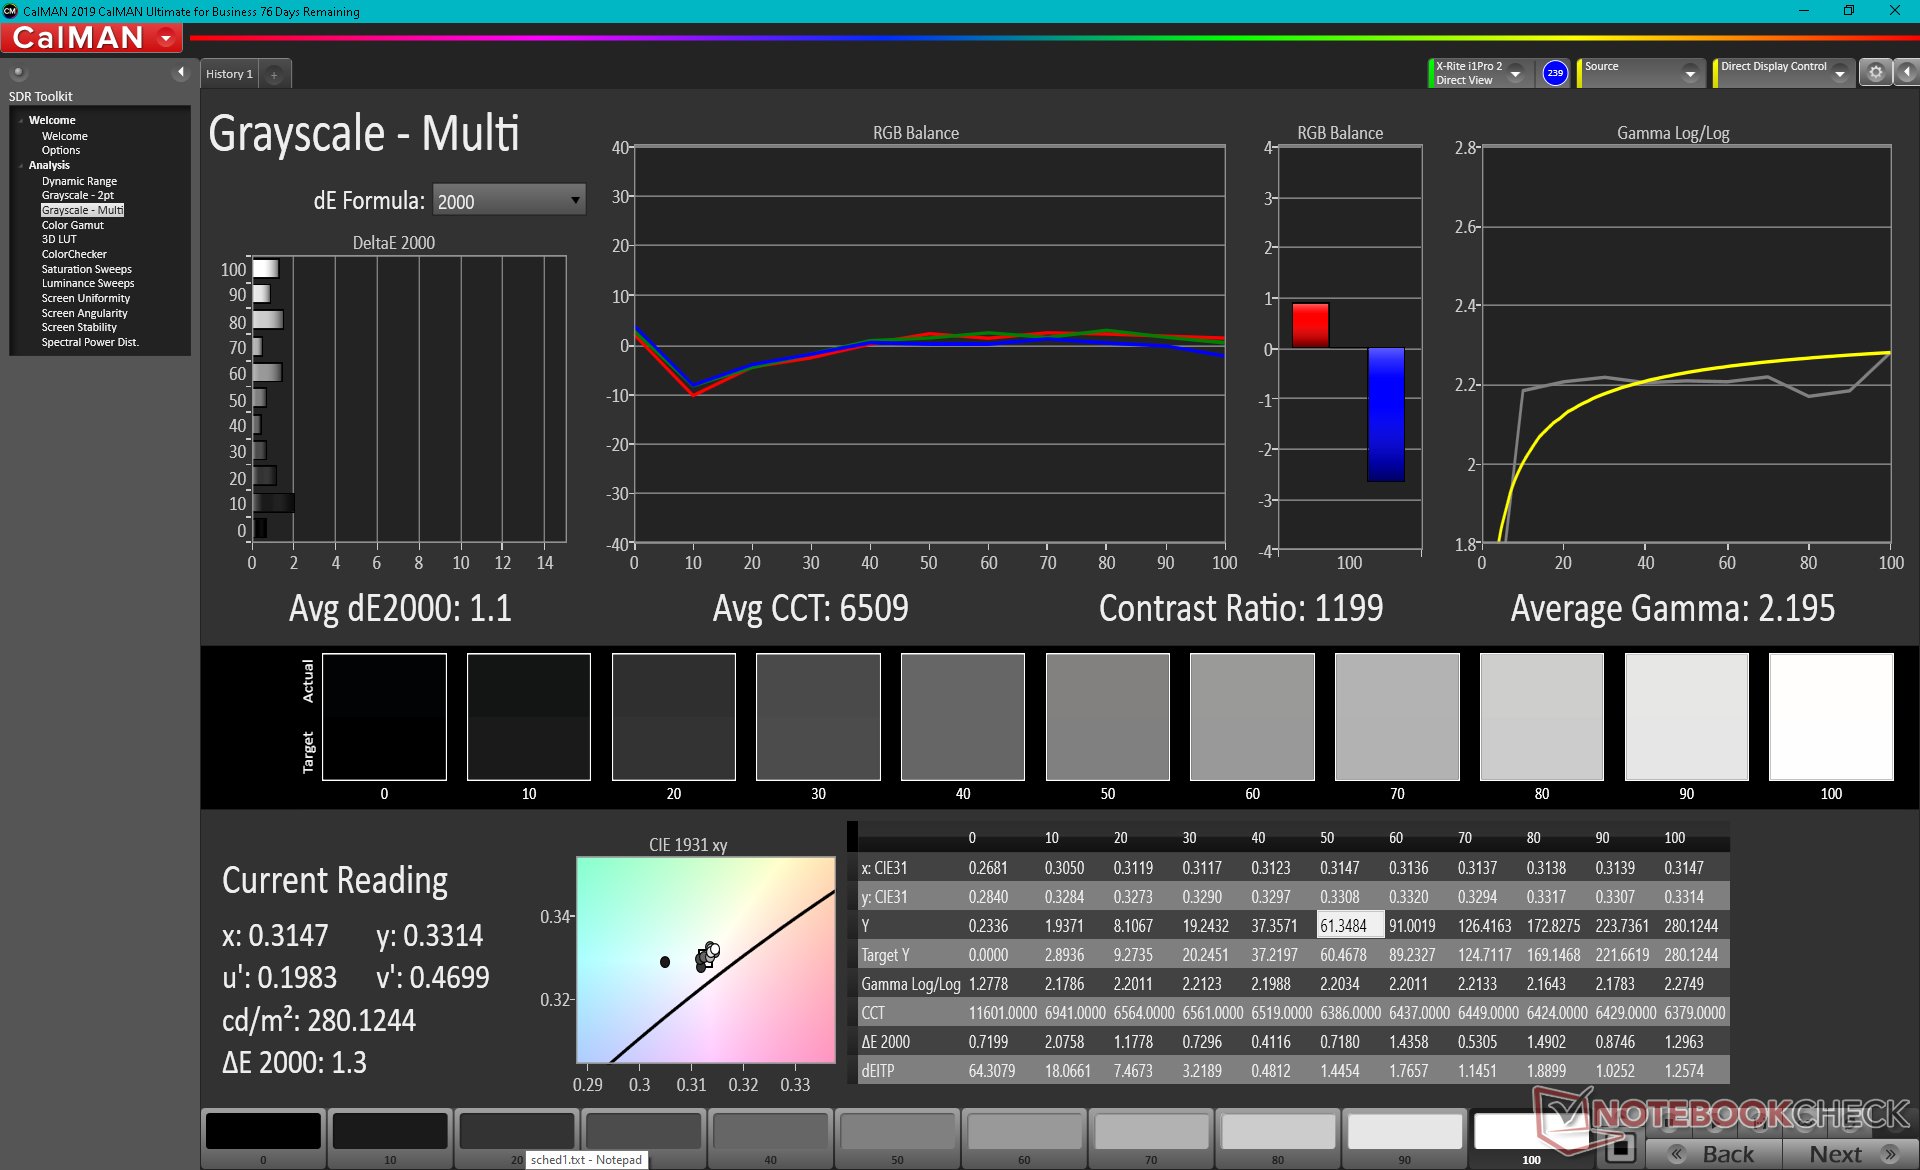
calibrated: 1.4
ΔE Greyscale Calman: 7.9 | ∀{0.09-98 Ø4.97}
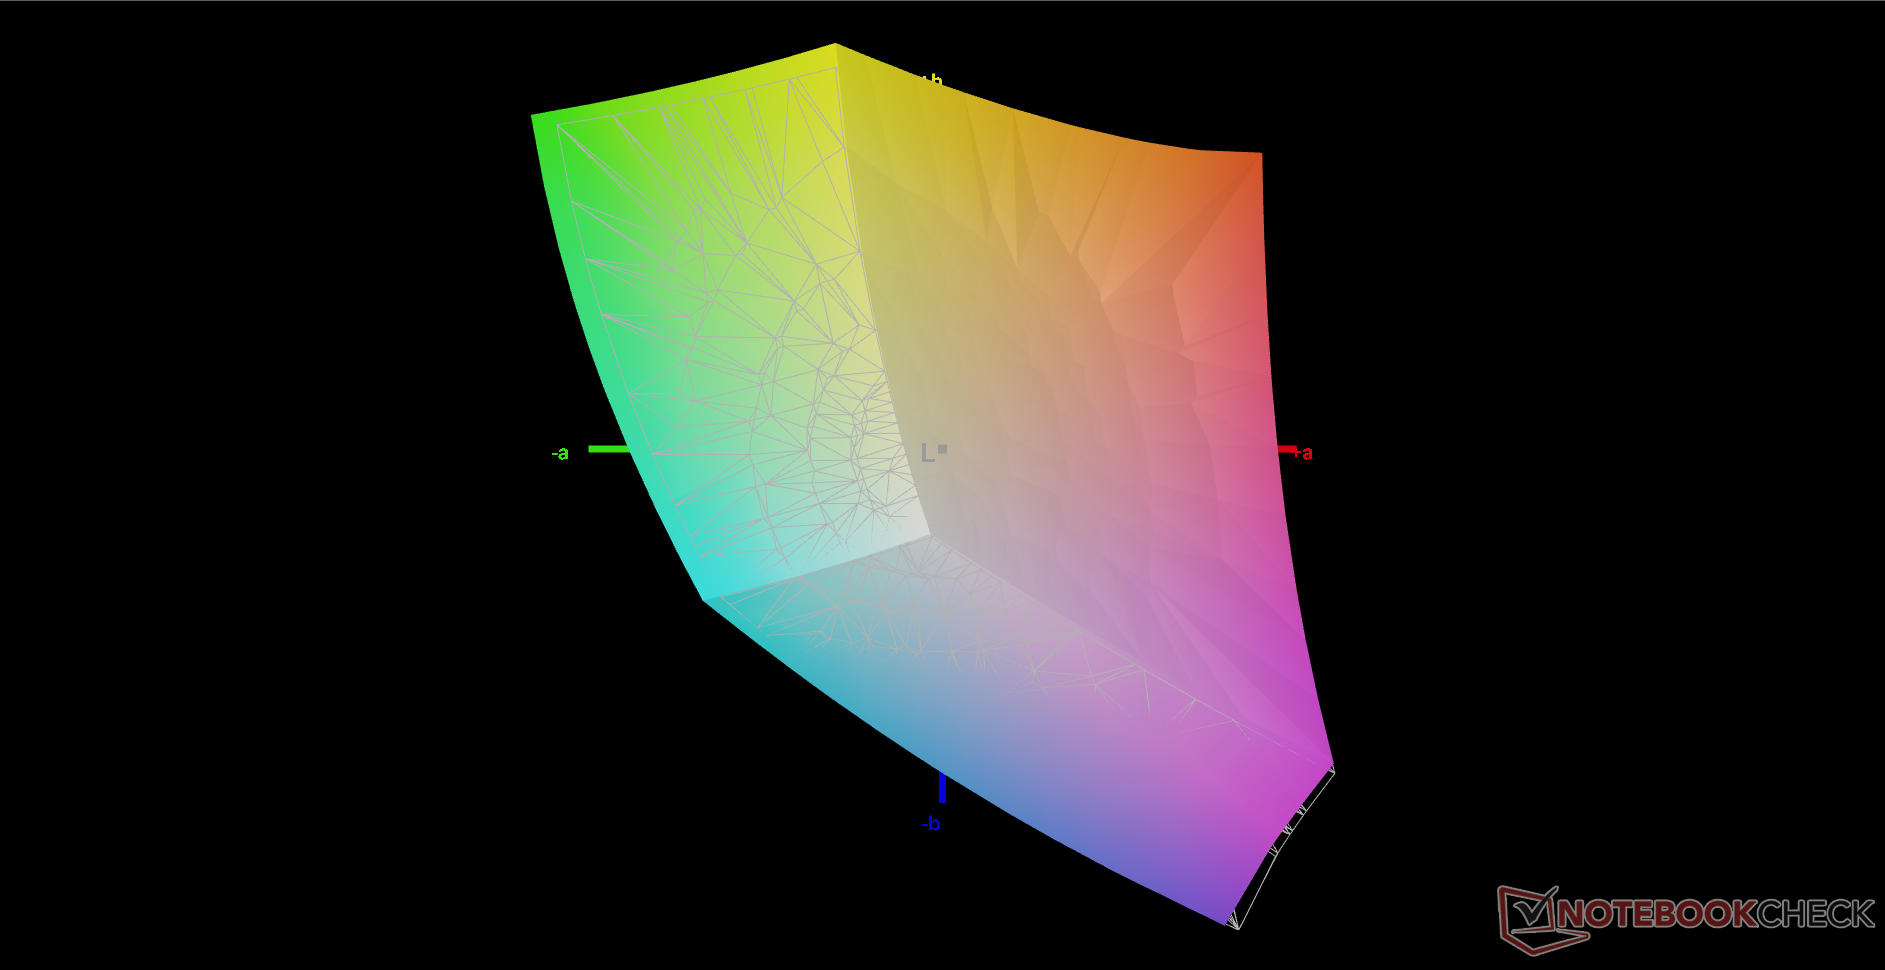
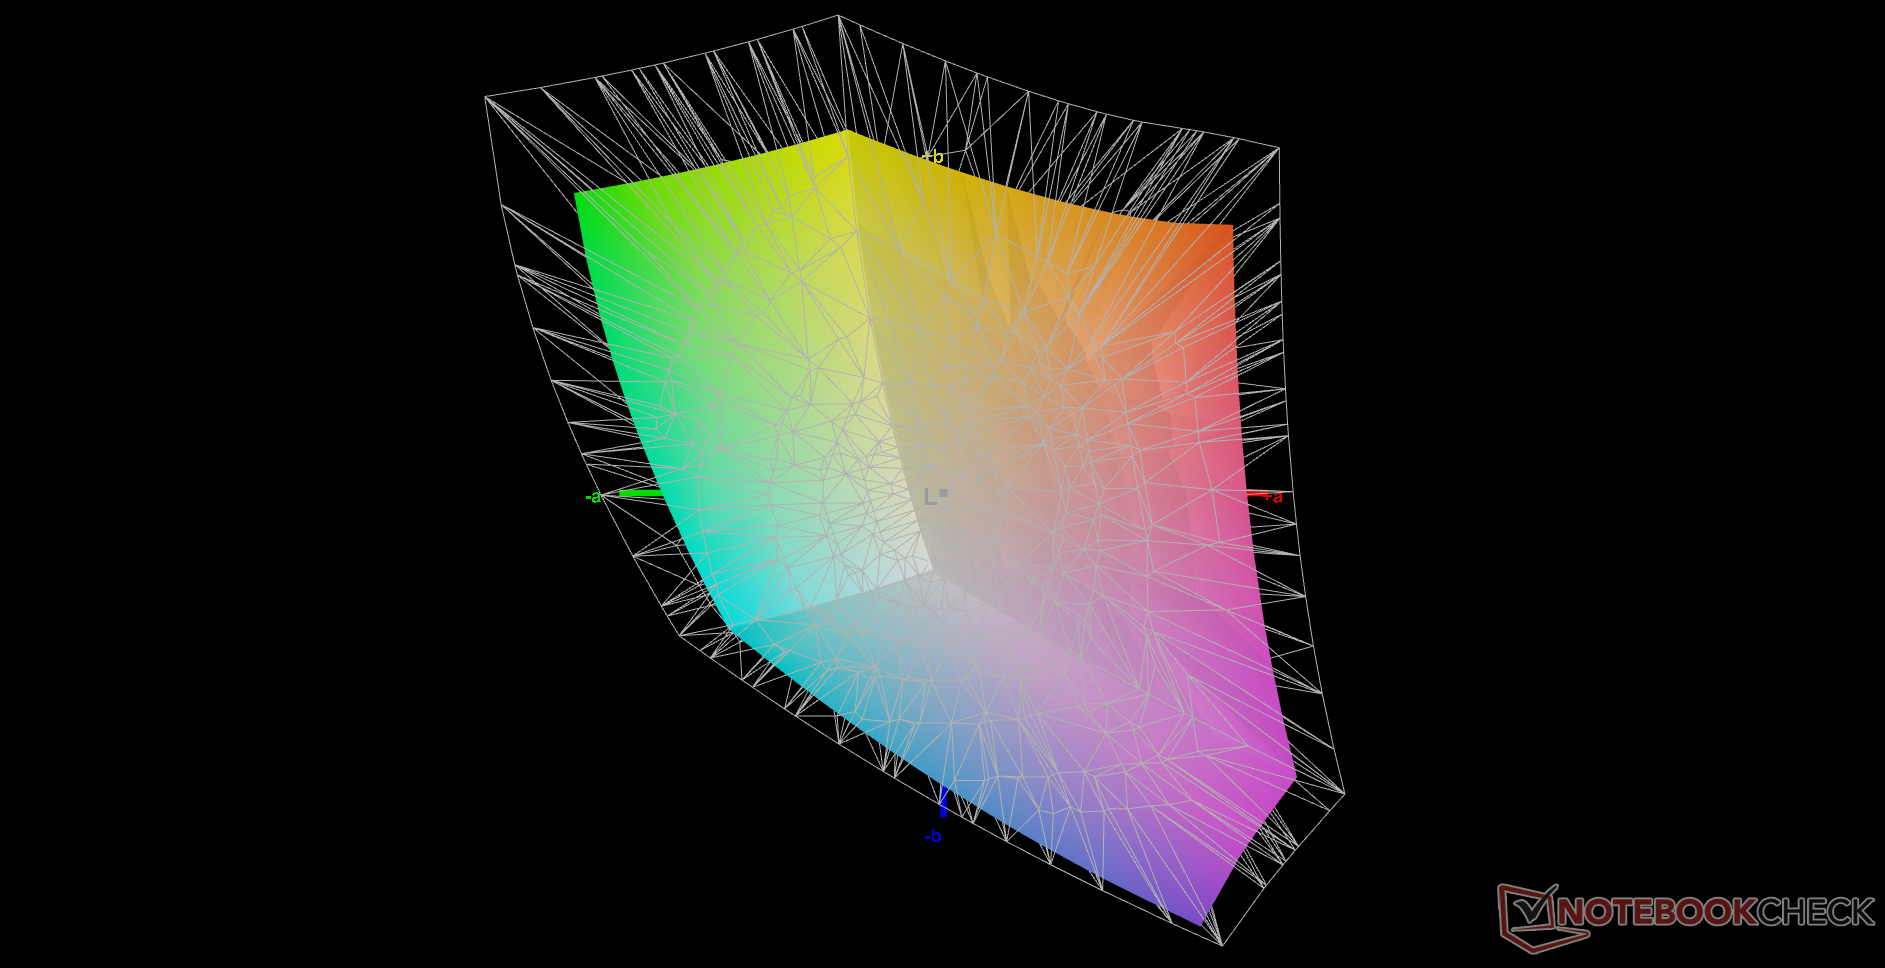
73.6% AdobeRGB 1998 (Argyll 3D)
98.8% sRGB (Argyll 3D)
71.7% Display P3 (Argyll 3D)
Gamma: 2.28
CCT: 5941 K
| Razer Blade 17 RTX 3070 AU Optronics B173HAN05.4, IPS, 17.3", 1920x1080 | Asus ROG Zephyrus S17 GX703HSD BOE099D (BOE CQ NE173QHM-NY3), IPS, 17.3", 2560x1440 | MSI GS76 Stealth 11UH AUO B173ZAN06.1 (AUODE95), IPS, 17.3", 3840x2160 | Acer Nitro 5 AN517-41-R9S5 BOE NV173FHM-NX4, IPS, 17.3", 1920x1080 | Gigabyte Aero 17 HDR YD AU Optronics AUO329B, IPS, 17.3", 3840x2160 | Maingear Vector Pro MG-VCP17 BOE NE173QHM-NY2, IPS, 17.3", 2560x1440 | |
|---|---|---|---|---|---|---|
| Display | 15% | -9% | -47% | 19% | -1% | |
| Display P3 Coverage (%) | 71.7 | 94.2 31% | 63 -12% | 36.7 -49% | 86.9 21% | 70.7 -1% |
| sRGB Coverage (%) | 98.8 | 98.7 0% | 94.8 -4% | 55.3 -44% | 100 1% | 99.4 1% |
| AdobeRGB 1998 Coverage (%) | 73.6 | 84.4 15% | 65 -12% | 37.9 -49% | 99.6 35% | 71.7 -3% |
| Response Times | -3% | -42% | -194% | -667% | -154% | |
| Response Time Grey 50% / Grey 80% * (ms) | 4.2 ? | 4.8 -14% | 8.8 ? -110% | 18 ? -329% | 52 ? -1138% | 15.6 ? -271% |
| Response Time Black / White * (ms) | 8.8 ? | 8 9% | 6.4 ? 27% | 14 ? -59% | 26 ? -195% | 12 ? -36% |
| PWM Frequency (Hz) | ||||||
| Screen | 11% | 30% | -0% | 46% | 16% | |
| Brightness middle (cd/m²) | 323.3 | 322 0% | 474 47% | 307 -5% | 488 51% | 389.7 21% |
| Brightness (cd/m²) | 315 | 288 -9% | 454 44% | 264 -16% | 467 48% | 363 15% |
| Brightness Distribution (%) | 91 | 72 -21% | 88 -3% | 76 -16% | 86 -5% | 84 -8% |
| Black Level * (cd/m²) | 0.33 | 0.3 9% | 0.46 -39% | 0.24 27% | 0.33 -0% | 0.47 -42% |
| Contrast (:1) | 980 | 1073 9% | 1030 5% | 1279 31% | 1479 51% | 829 -15% |
| Colorchecker dE 2000 * | 4.59 | 3.05 34% | 1.5 67% | 5.61 -22% | 1.23 73% | 1.93 58% |
| Colorchecker dE 2000 max. * | 10.82 | 5.23 52% | 5.59 48% | 18.29 -69% | 2.94 73% | 6.84 37% |
| Colorchecker dE 2000 calibrated * | 1.4 | 1.92 -37% | 0.86 39% | 0.77 45% | 1.31 6% | |
| Greyscale dE 2000 * | 7.9 | 3.11 61% | 2.8 65% | 2.63 67% | 1.5 81% | 2.4 70% |
| Gamma | 2.28 96% | 2.13 103% | 2.158 102% | 2.37 93% | 2.169 101% | 2.12 104% |
| CCT | 5941 109% | 6553 99% | 6597 99% | 6852 95% | 6614 98% | 6658 98% |
| Color Space (Percent of AdobeRGB 1998) (%) | 84 | 35 | 99 | |||
| Color Space (Percent of sRGB) (%) | 99 | 55 | 99 | |||
| Total Average (Program / Settings) | 8% /
10% | -7% /
12% | -80% /
-41% | -201% /
-61% | -46% /
-12% |
* ... smaller is better
Color space covers 100 percent of sRGB just as advertised by the manufacturer. For full AdobeRGB coverage, however, users will have to consider the 4K option instead.
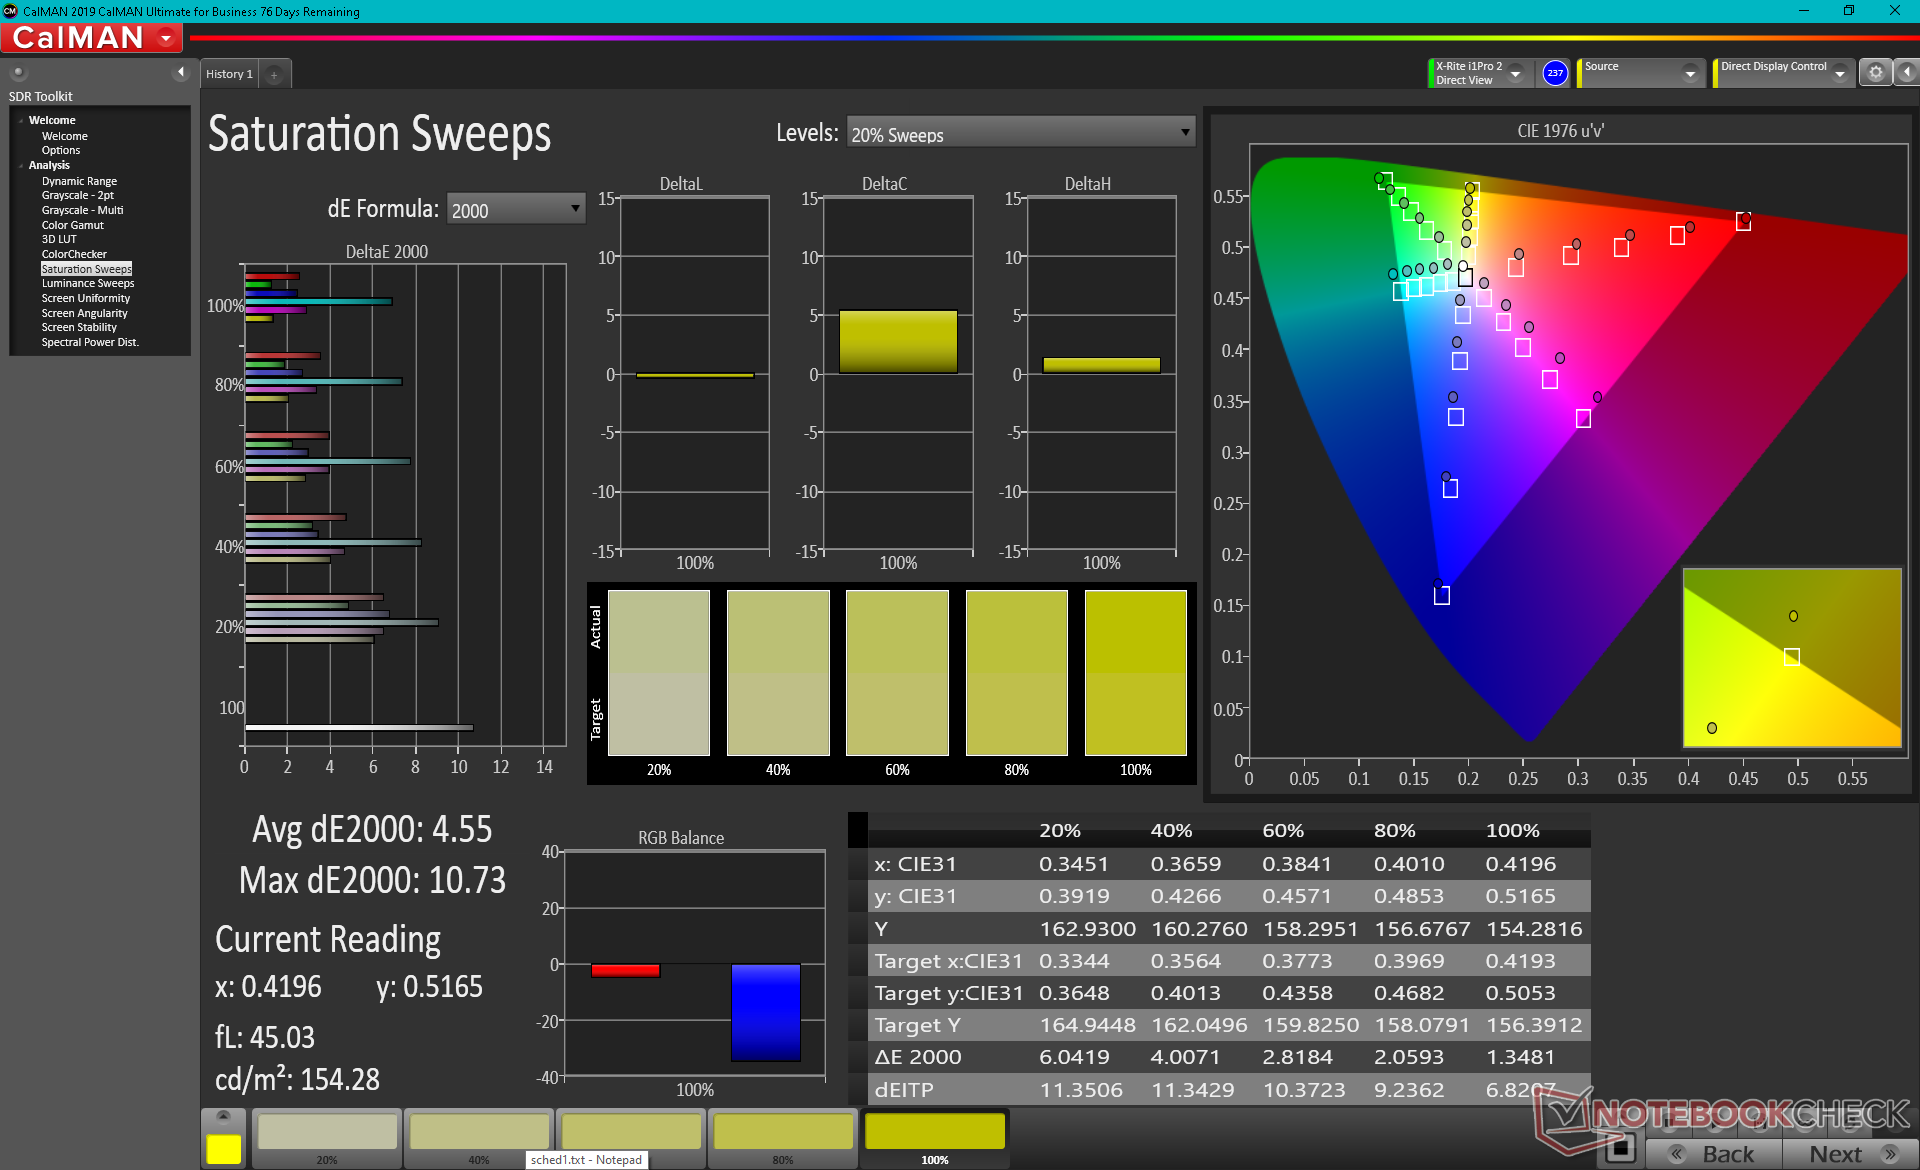
The display is in need of calibration out of the box. Color temperature is far too warm for average grayscale and color deltaE values of 7.9 and 4.59, respectively. Though nothing terrible, we definitely expected more from a high-end gaming laptop retailing for almost $3000 USD. Grayscale and colors would improve significantly to average deltaE values of less than 2 each once we calibrated the panel ourselves as shown by our Calman results below.
Display Response Times
| ↔ Response Time Black to White | ||
|---|---|---|
| 8.8 ms ... rise ↗ and fall ↘ combined | ↗ 4.4 ms rise | 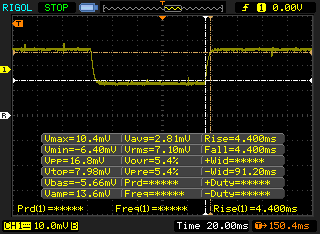 |
| ↘ 4.4 ms fall | ||
| The screen shows fast response rates in our tests and should be suited for gaming. In comparison, all tested devices range from 0.1 (minimum) to 240 (maximum) ms. » 24 % of all devices are better. This means that the measured response time is better than the average of all tested devices (19.9 ms). | ||
| ↔ Response Time 50% Grey to 80% Grey | ||
| 4.2 ms ... rise ↗ and fall ↘ combined | ↗ 1.6 ms rise | 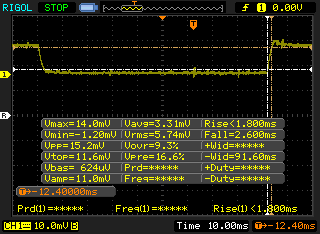 |
| ↘ 2.6 ms fall | ||
| The screen shows very fast response rates in our tests and should be very well suited for fast-paced gaming. In comparison, all tested devices range from 0.165 (minimum) to 636 (maximum) ms. » 16 % of all devices are better. This means that the measured response time is better than the average of all tested devices (31.1 ms). | ||
Screen Flickering / PWM (Pulse-Width Modulation)
| Screen flickering / PWM not detected | 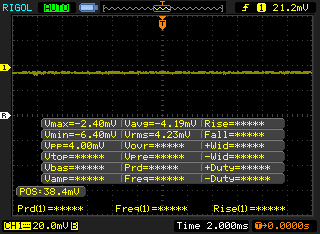 | ||
In comparison: 52 % of all tested devices do not use PWM to dim the display. If PWM was detected, an average of 7798 (minimum: 5 - maximum: 343500) Hz was measured. | |||
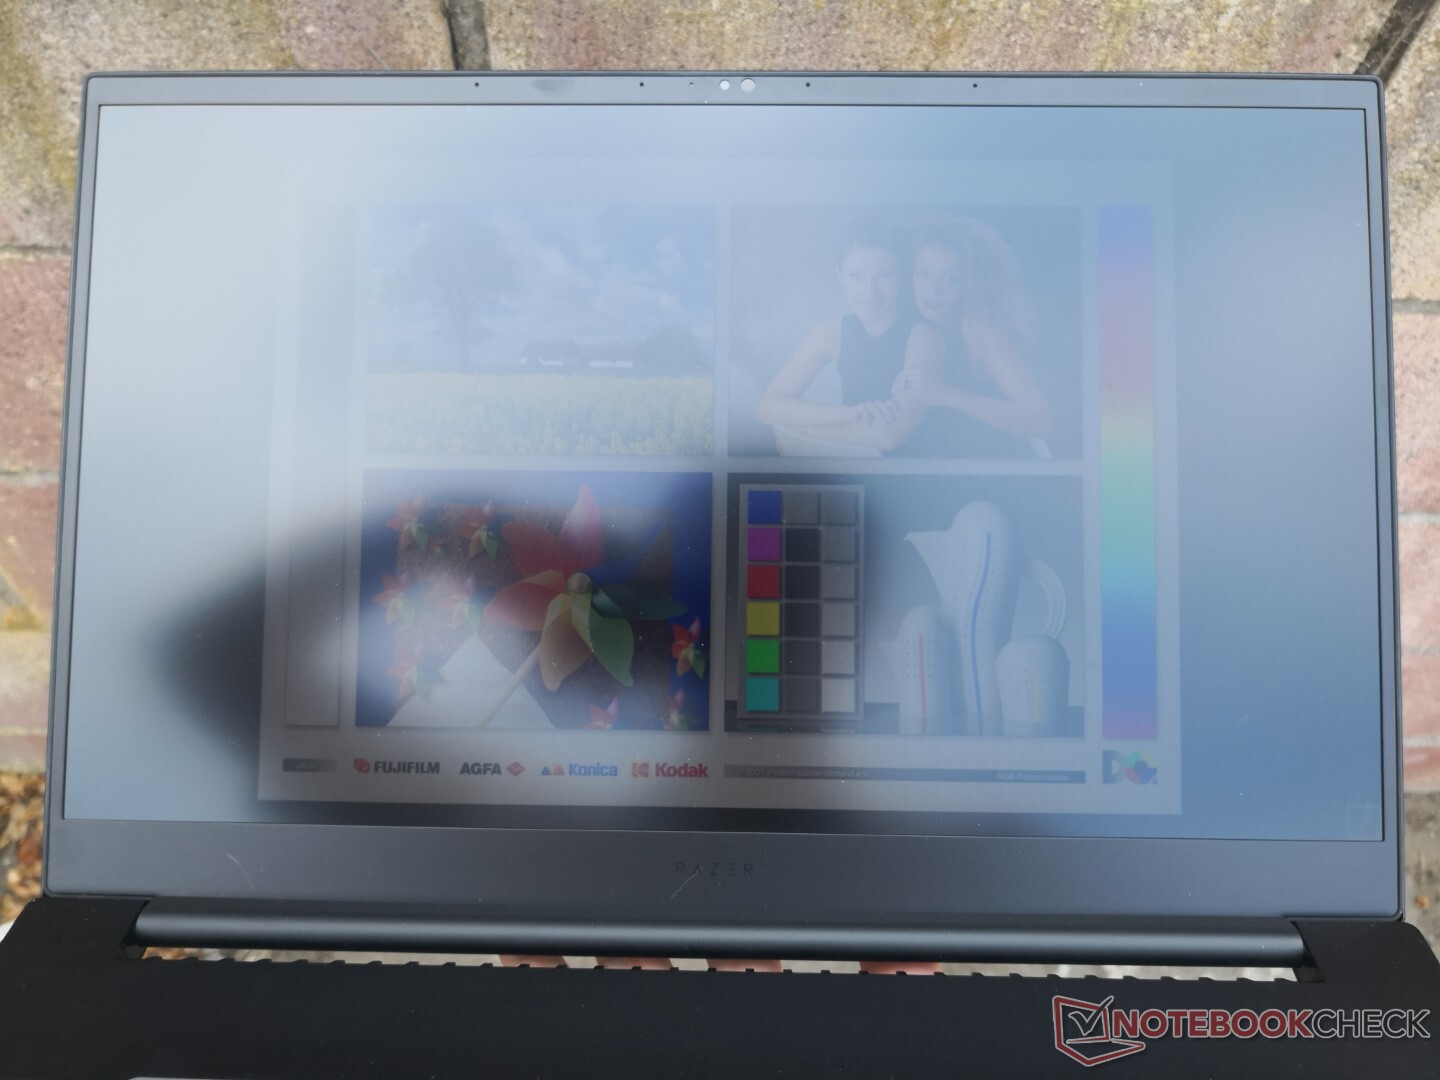
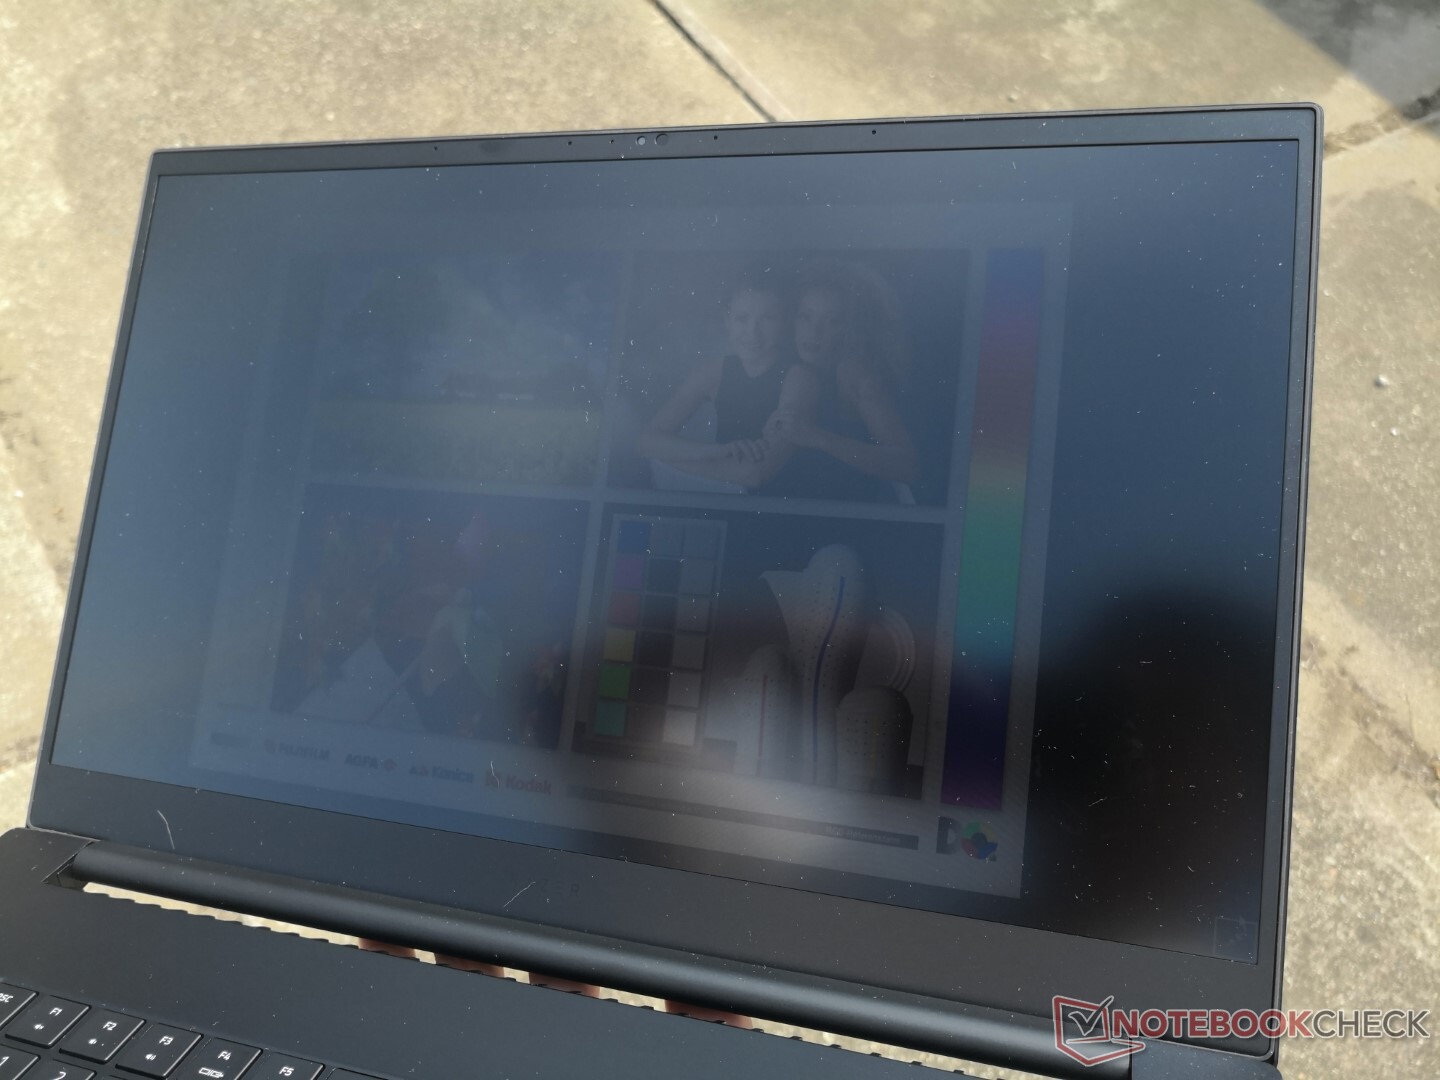
Outdoor visibility hasn't changed from last year's model since contrast and maximum brightness continue to be almost the same. The 4K touchscreen option may be brighter, but users will have to take into account the increase in glare from its glossy overlay as well.

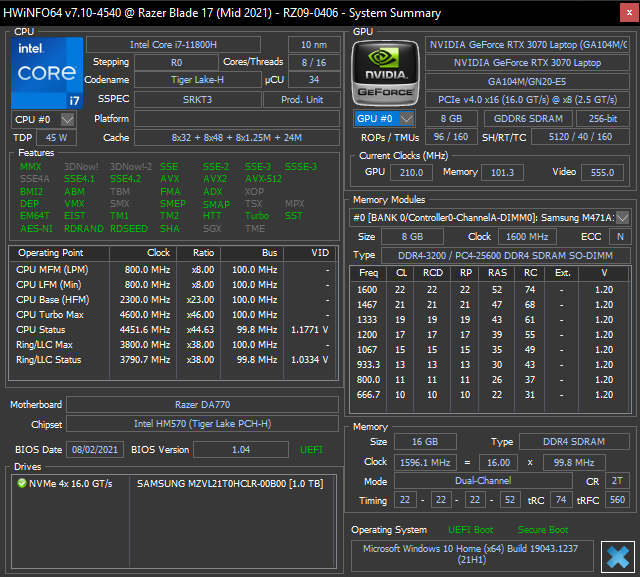
Performance — 130 W TGP GeForce RTX Graphics
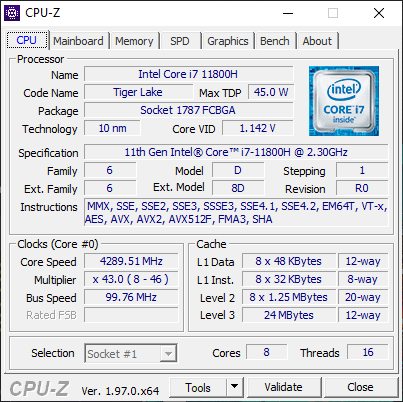
Users can now choose between the 11th gen Tiger Lake-H Core i7-11800H or Core i9-11900H to replace last year's 10th gen Comet Lake-H options. Aside from the obvious performance increase, the new CPUs also natively support PCIe4 and Thunderbolt 4 connectivity. Resizable Bar, Dynamic Boost 2.0, and WhisperMode 2.0 are all supported.
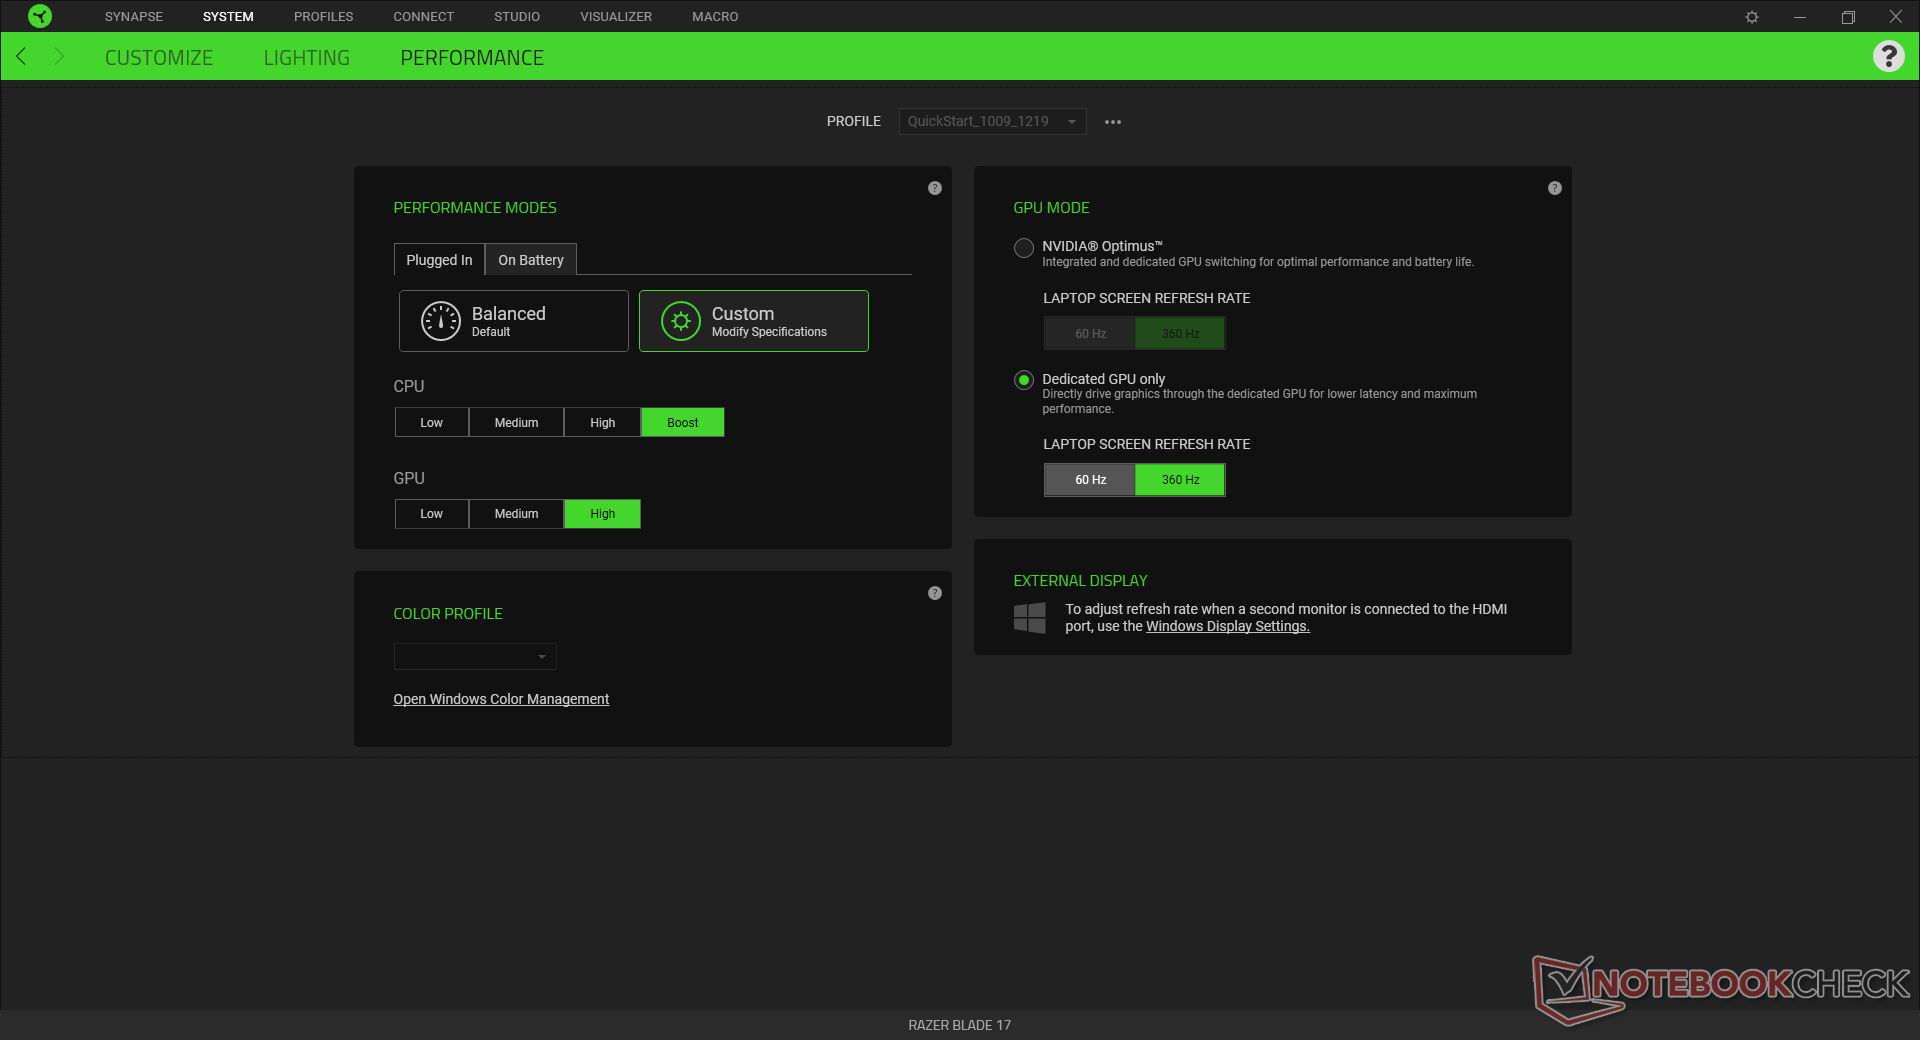
Advanced Optimus (or Optimus 2.0) is not supported meaning users will still have to manually switch and reboot between the dGPU and iGPU via the Razer software. Expect a small hit to performance if running on Optimus mode. We recommend users become familiar with Razer Central as important customizations and performance options are found here.
Processor — No AMD... Yet
Our Core i7-11800H is an excellent step up from the Core i7-10875H as found on last year's Blade Pro. Multi-thread performance in particular is 25 to 40 percent faster to finally be on par with competing Zen 2 or Zen 3 CPUs like the Ryzen 7 5800H. Upgrading to the Core i9-10900H is expected to only bring a 5 to 10 percent increase in raw performance based on our experience with other Core i9-11900H laptops like the MSI GS76 Stealth.
It's worth noting that the Ryzen 9 5900HX in the Blade 14 is neck-to-neck with our i7-11800H in multi-thread performance while being behind in single-thread performance by about 15 to 20 percent.
Cinebench R15 Multi Loop
Cinebench R23: Multi Core | Single Core
Cinebench R15: CPU Multi 64Bit | CPU Single 64Bit
Blender: v2.79 BMW27 CPU
7-Zip 18.03: 7z b 4 -mmt1 | 7z b 4
Geekbench 5.5: Single-Core | Multi-Core
HWBOT x265 Benchmark v2.2: 4k Preset
LibreOffice : 20 Documents To PDF
R Benchmark 2.5: Overall mean
| Cinebench R23 / Multi Core | |
| MSI GS76 Stealth 11UH | |
| Asus ROG Strix G17 G713QE-RB74 | |
| Razer Blade 14 Ryzen 9 RTX 3070 | |
| Razer Blade 17 RTX 3070 | |
| Average Intel Core i7-11800H (6508 - 14088, n=48) | |
| Alienware m17 R4 | |
| MSI GE76 Raider 10UH | |
| Cinebench R23 / Single Core | |
| MSI GS76 Stealth 11UH | |
| Razer Blade 17 RTX 3070 | |
| Average Intel Core i7-11800H (1386 - 1522, n=45) | |
| Asus ROG Strix G17 G713QE-RB74 | |
| Alienware m17 R4 | |
| Razer Blade 14 Ryzen 9 RTX 3070 | |
| MSI GE76 Raider 10UH | |
| Geekbench 5.5 / Single-Core | |
| MSI GS76 Stealth 11UH | |
| Gigabyte Aero 17 HDR YD | |
| Average Intel Core i7-11800H (1429 - 1625, n=40) | |
| Alienware m17 R4 | |
| Razer Blade Pro 17 RTX 2070 Max-Q 300 Hz | |
| MSI GE76 Raider 10UH | |
| MSI Alpha 17 A4DEK | |
| Geekbench 5.5 / Multi-Core | |
| Gigabyte Aero 17 HDR YD | |
| MSI GS76 Stealth 11UH | |
| Average Intel Core i7-11800H (4655 - 9851, n=40) | |
| Alienware m17 R4 | |
| MSI Alpha 17 A4DEK | |
| MSI GE76 Raider 10UH | |
| Razer Blade Pro 17 RTX 2070 Max-Q 300 Hz | |
| HWBOT x265 Benchmark v2.2 / 4k Preset | |
| Gigabyte Aero 17 HDR YD | |
| Razer Blade 14 Ryzen 9 RTX 3070 | |
| Razer Blade 17 RTX 3070 | |
| MSI GS76 Stealth 11UH | |
| Asus ROG Strix G17 G713QE-RB74 | |
| Alienware m17 R4 | |
| Average Intel Core i7-11800H (7.38 - 17.4, n=46) | |
| MSI GE76 Raider 10UH | |
| MSI Alpha 17 A4DEK | |
| MSI GE75 9SG | |
| LibreOffice / 20 Documents To PDF | |
| MSI Alpha 17 A4DEK | |
| Razer Blade 14 Ryzen 9 RTX 3070 | |
| Razer Blade Pro 17 RTX 2070 Max-Q 300 Hz | |
| Asus ROG Strix G17 G713QE-RB74 | |
| Alienware m17 R4 | |
| MSI GS76 Stealth 11UH | |
| MSI GE76 Raider 10UH | |
| Average Intel Core i7-11800H (38.6 - 59.9, n=45) | |
| Razer Blade 17 RTX 3070 | |
| Gigabyte Aero 17 HDR YD | |
| R Benchmark 2.5 / Overall mean | |
| Razer Blade 14 Ryzen 9 RTX 3070 | |
| MSI GE76 Raider 10UH | |
| MSI Alpha 17 A4DEK | |
| Alienware m17 R4 | |
| Average Intel Core i7-11800H (0.548 - 0.615, n=46) | |
| Razer Blade 17 RTX 3070 | |
| Gigabyte Aero 17 HDR YD | |
| MSI GS76 Stealth 11UH | |
| Asus ROG Strix G17 G713QE-RB74 | |
* ... smaller is better
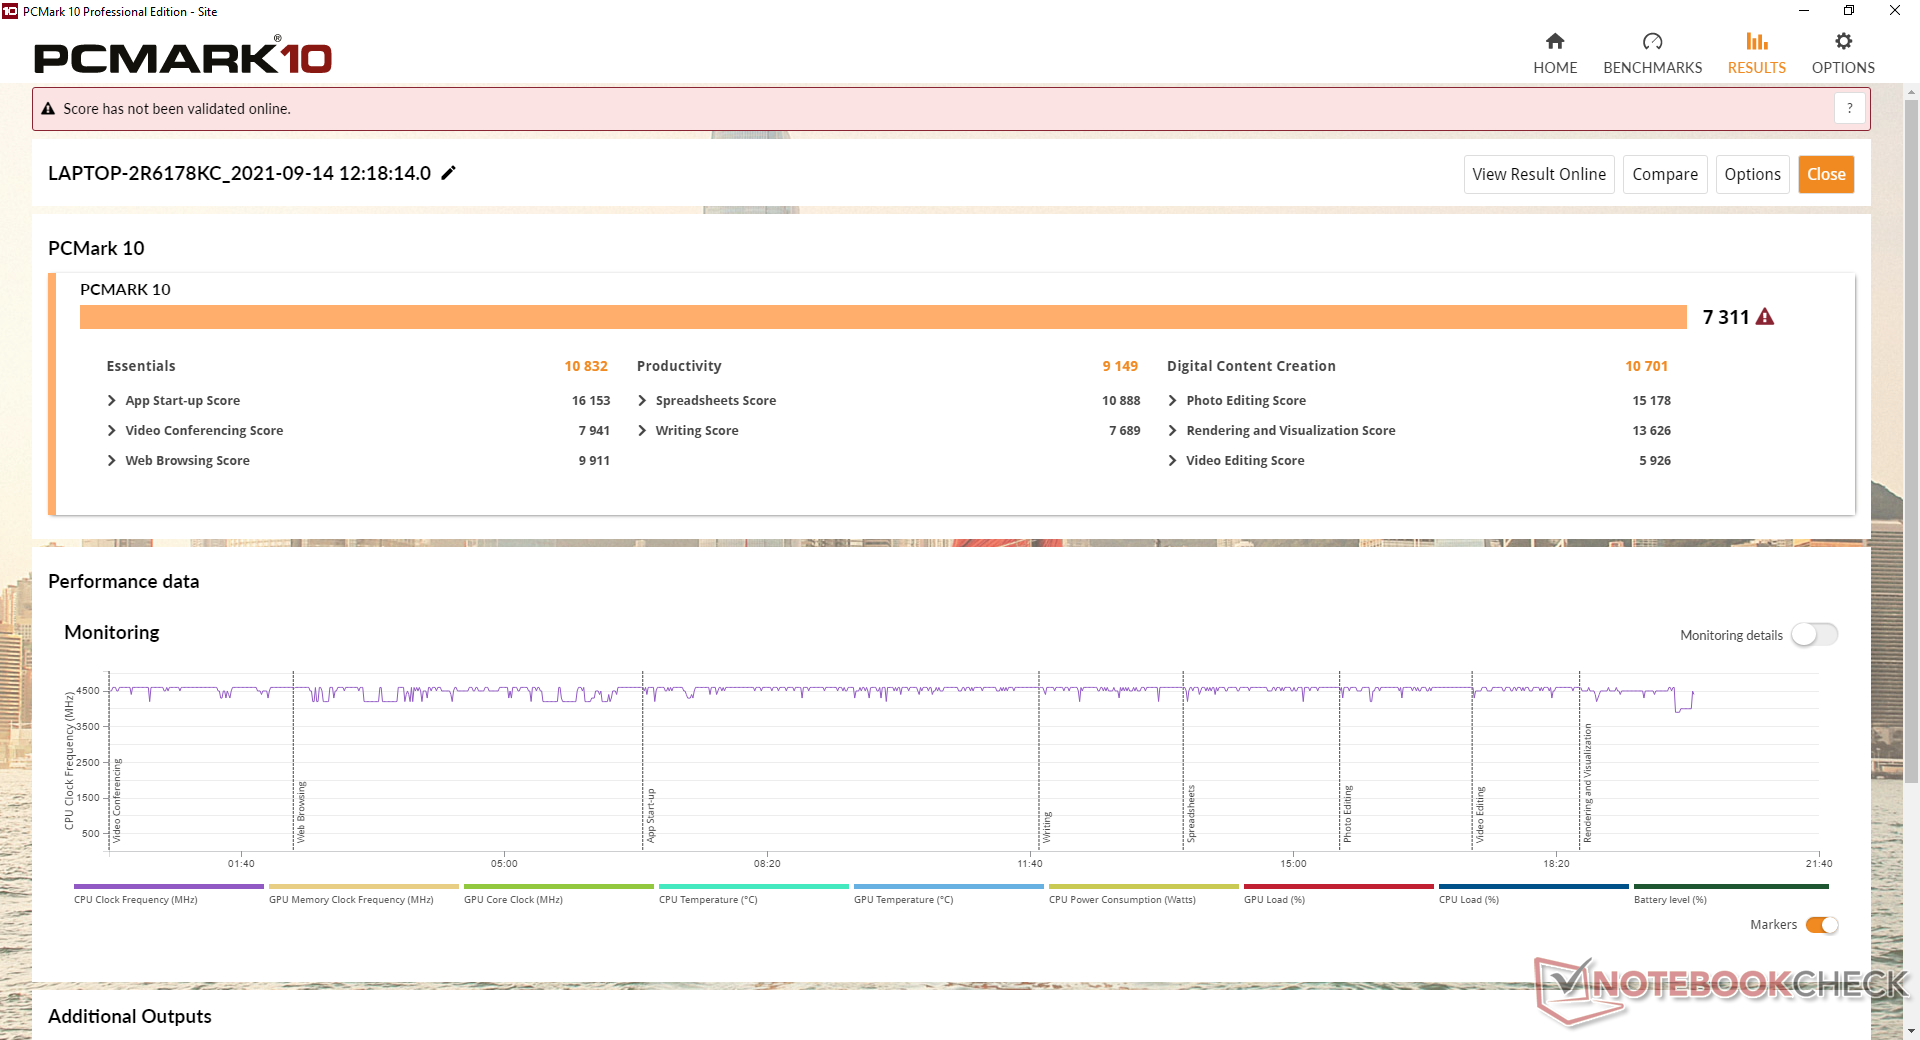
System Performance
PCMark 10 scores are noticeably higher than any Blade Pro laptop we've tested in the past. The leap can be partly attributed to the PCIe4 NVMe SSD that Tiger Lake-H chipsets natively support and the boost in multi-thread CPU performance.
| PCMark 10 / Score | |
| Razer Blade 17 RTX 3070 | |
| Average Intel Core i7-11800H, NVIDIA GeForce RTX 3070 Laptop GPU (6126 - 7311, n=11) | |
| Razer Blade Pro 17 2021 (QHD Touch) | |
| Razer Blade Pro 17 RTX 2070 Max-Q 300 Hz | |
| Razer Blade Pro 17 4K UHD 120 Hz | |
| Razer Blade Pro 17 RTX 2080 Max-Q | |
| Razer Blade Pro 17 RTX 2060 | |
| PCMark 10 / Essentials | |
| Razer Blade 17 RTX 3070 | |
| Average Intel Core i7-11800H, NVIDIA GeForce RTX 3070 Laptop GPU (9248 - 10832, n=11) | |
| Razer Blade Pro 17 4K UHD 120 Hz | |
| Razer Blade Pro 17 2021 (QHD Touch) | |
| Razer Blade Pro 17 RTX 2070 Max-Q 300 Hz | |
| Razer Blade Pro 17 RTX 2080 Max-Q | |
| Razer Blade Pro 17 RTX 2060 | |
| PCMark 10 / Productivity | |
| Razer Blade 17 RTX 3070 | |
| Average Intel Core i7-11800H, NVIDIA GeForce RTX 3070 Laptop GPU (8571 - 9669, n=11) | |
| Razer Blade Pro 17 2021 (QHD Touch) | |
| Razer Blade Pro 17 RTX 2070 Max-Q 300 Hz | |
| Razer Blade Pro 17 RTX 2060 | |
| Razer Blade Pro 17 RTX 2080 Max-Q | |
| Razer Blade Pro 17 4K UHD 120 Hz | |
| PCMark 10 / Digital Content Creation | |
| Razer Blade 17 RTX 3070 | |
| Average Intel Core i7-11800H, NVIDIA GeForce RTX 3070 Laptop GPU (7627 - 10851, n=11) | |
| Razer Blade Pro 17 2021 (QHD Touch) | |
| Razer Blade Pro 17 4K UHD 120 Hz | |
| Razer Blade Pro 17 RTX 2070 Max-Q 300 Hz | |
| Razer Blade Pro 17 RTX 2080 Max-Q | |
| Razer Blade Pro 17 RTX 2060 | |
| PCMark 10 Score | 7311 points | |
Help | ||
DPC Latency
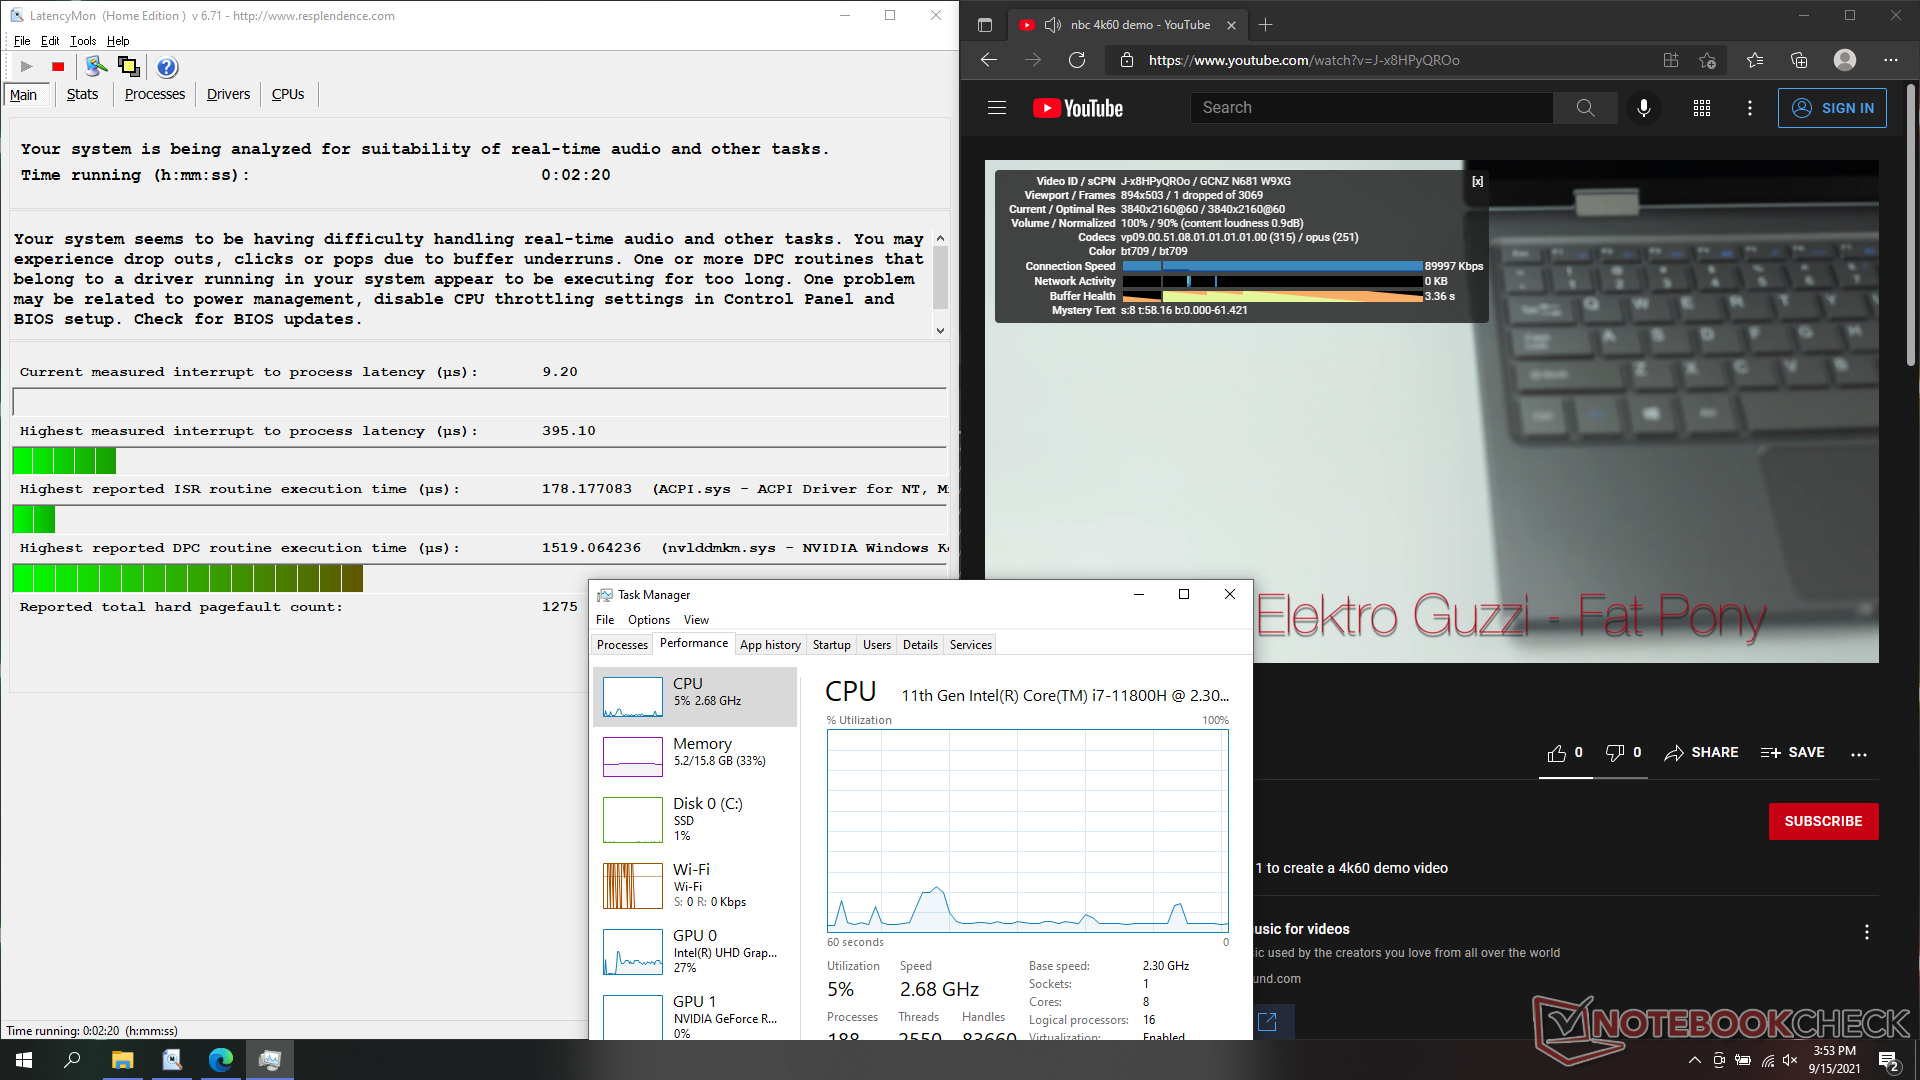
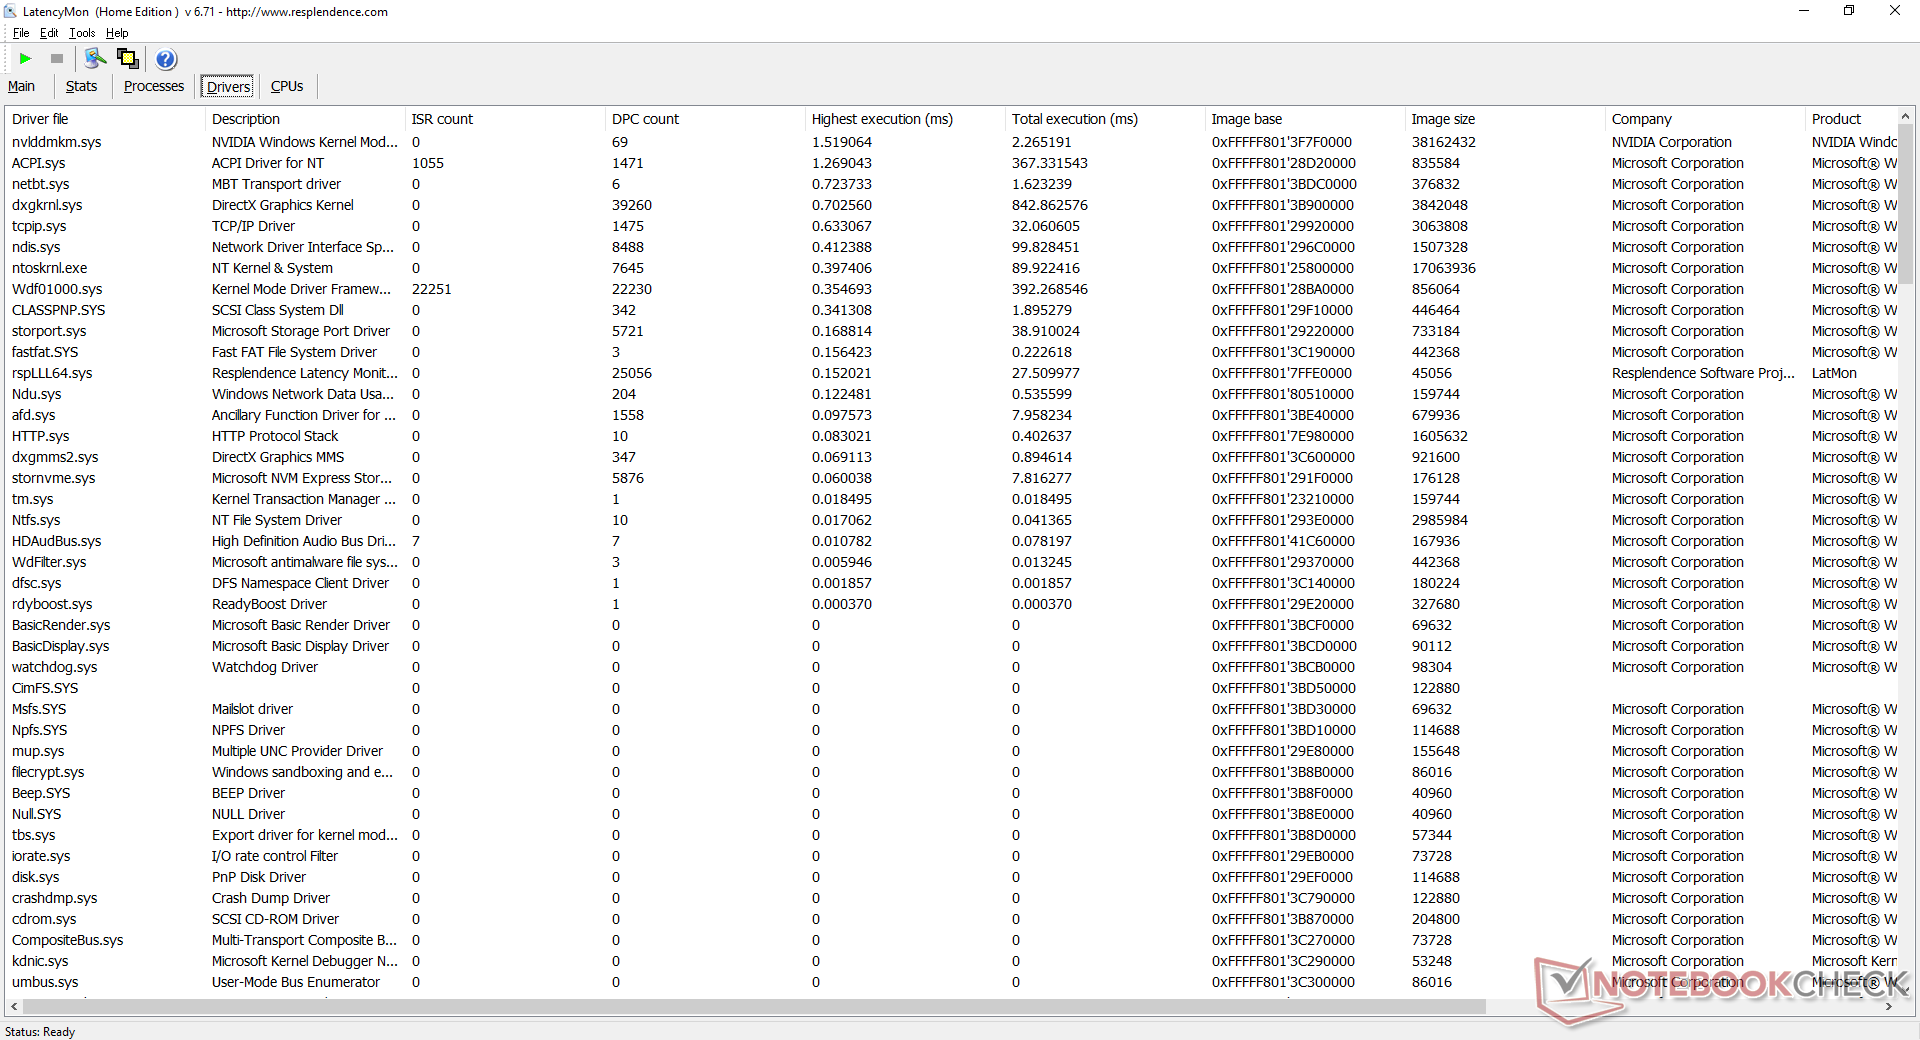
LatencyMon shows minor DPC latency issues when opening multiple browser tabs on our homepage or when running Prime95 stress. 4K video playback at 60 FPS is otherwise smooth and with only one dropped frame during our test session.
| DPC Latencies / LatencyMon - interrupt to process latency (max), Web, Youtube, Prime95 | |
| Gigabyte Aero 17 HDR YD | |
| Asus ROG Zephyrus S17 GX703HSD | |
| MSI GS76 Stealth 11UH | |
| Acer Nitro 5 AN517-41-R9S5 | |
| Maingear Vector Pro MG-VCP17 | |
| Razer Blade 17 RTX 3070 | |
* ... smaller is better
Storage Devices — PCIe4 Support
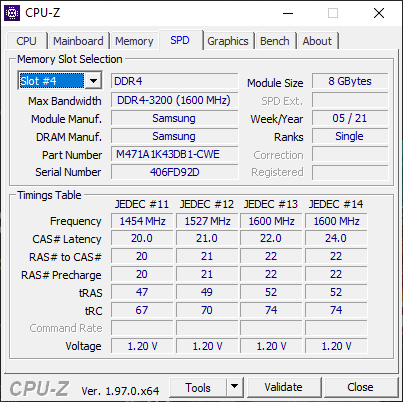
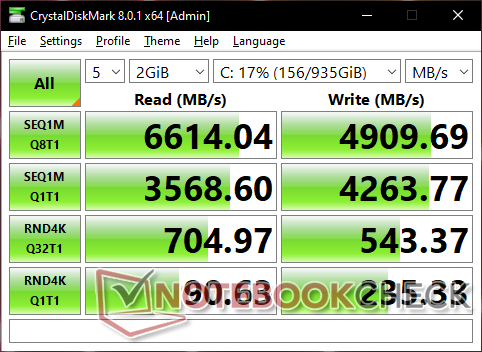
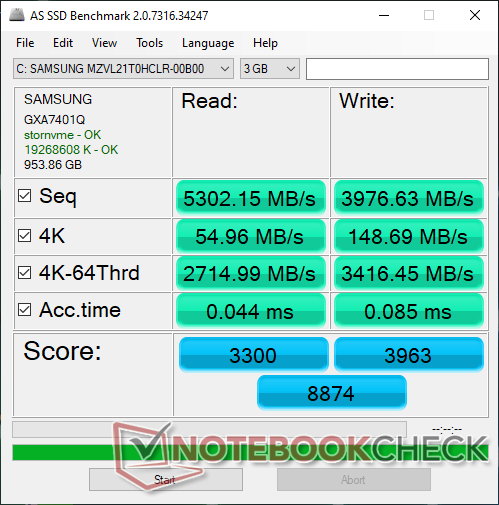
Razer is sticking with Samsung once again for its PCIe4 NVMe SSD needs. The 1 TB PM9A1 drive is significantly faster than the PM981a on last year's model in pretty much every aspect. Users can install up to two drives just like before.
| Razer Blade 17 RTX 3070 Samsung PM9A1 MZVL21T0HCLR | Razer Blade Pro 17 2021 (QHD Touch) Samsung PM981a MZVLB1T0HBLR | Asus ROG Zephyrus S17 GX703HSD Samsung PM9A1 MZVL22T0HBLB | MSI GS76 Stealth 11UH Samsung PM9A1 MZVL22T0HBLB | Acer Nitro 5 AN517-41-R9S5 SK Hynix BC711 1TB HFM001TD3JX016N | Gigabyte Aero 17 HDR YD Samsung PM9A1 MZVL2512HCJQ | |
|---|---|---|---|---|---|---|
| AS SSD | -35% | 14% | 5% | -21% | 4% | |
| Seq Read (MB/s) | 5302 | 2068 -61% | 5085 -4% | 5408 2% | 2974 -44% | 5438 3% |
| Seq Write (MB/s) | 3977 | 2047 -49% | 4434 11% | 3863 -3% | 2733 -31% | 3904 -2% |
| 4K Read (MB/s) | 55 | 47.85 -13% | 80.3 46% | 52.7 -4% | 55.7 1% | 56.2 2% |
| 4K Write (MB/s) | 148.7 | 87.4 -41% | 214.7 44% | 153.1 3% | 134 -10% | 165.8 11% |
| 4K-64 Read (MB/s) | 2715 | 1932 -29% | 2573 -5% | 2692 -1% | 1854 -32% | 2489 -8% |
| 4K-64 Write (MB/s) | 3416 | 2017 -41% | 2972 -13% | 3414 0% | 2165 -37% | 3480 2% |
| Access Time Read * (ms) | 0.044 | 0.055 -25% | 0.018 59% | 0.046 -5% | 0.054 -23% | |
| Access Time Write * (ms) | 0.085 | 0.128 -51% | 0.02 76% | 0.027 68% | 0.028 67% | 0.026 69% |
| Score Read (Points) | 3300 | 2187 -34% | 3161 -4% | 3285 0% | 2207 -33% | 3089 -6% |
| Score Write (Points) | 3963 | 2309 -42% | 3631 -8% | 3953 0% | 2573 -35% | 4036 2% |
| Score Total (Points) | 8874 | 5612 -37% | 8380 -6% | 8830 0% | 5899 -34% | 8620 -3% |
| Copy ISO MB/s (MB/s) | 2710 | 2400 -11% | 3239 20% | 2260 -17% | ||
| Copy Program MB/s (MB/s) | 1114 | 684 -39% | 899 -19% | 677 -39% | ||
| Copy Game MB/s (MB/s) | 2095 | 1629 -22% | 2171 4% | 1493 -29% | ||
| CrystalDiskMark 5.2 / 6 | -43% | 3% | 1% | -36% | 3% | |
| Write 4K (MB/s) | 233.5 | 123.5 -47% | 244.2 5% | 230.7 -1% | 133.4 -43% | 230.4 -1% |
| Read 4K (MB/s) | 90.1 | 45.96 -49% | 89.8 0% | 87.9 -2% | 64.7 -28% | 91.6 2% |
| Write Seq (MB/s) | 4263 | 1861 -56% | 4300 1% | 2934 -31% | 4216 -1% | |
| Read Seq (MB/s) | 4468 | 1584 -65% | 4392 -2% | 2364 -47% | 4543 2% | |
| Write 4K Q32T1 (MB/s) | 538 | 466.4 -13% | 607 13% | 582 8% | 438.4 -19% | 667 24% |
| Read 4K Q32T1 (MB/s) | 703 | 566 -19% | 658 -6% | 730 4% | 516 -27% | 728 4% |
| Write Seq Q32T1 (MB/s) | 5097 | 2981 -42% | 5270 3% | 5152 1% | 3083 -40% | 5043 -1% |
| Read Seq Q32T1 (MB/s) | 7065 | 3260 -54% | 7091 0% | 7094 0% | 3584 -49% | 6821 -3% |
| Write 4K Q8T8 (MB/s) | 2270 | |||||
| Read 4K Q8T8 (MB/s) | 2490 | |||||
| Total Average (Program / Settings) | -39% /
-38% | 9% /
11% | 3% /
4% | -29% /
-27% | 4% /
4% |
* ... smaller is better

Disk Throttling: DiskSpd Read Loop, Queue Depth 8
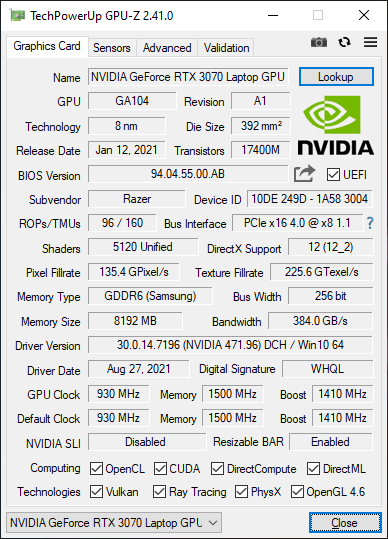
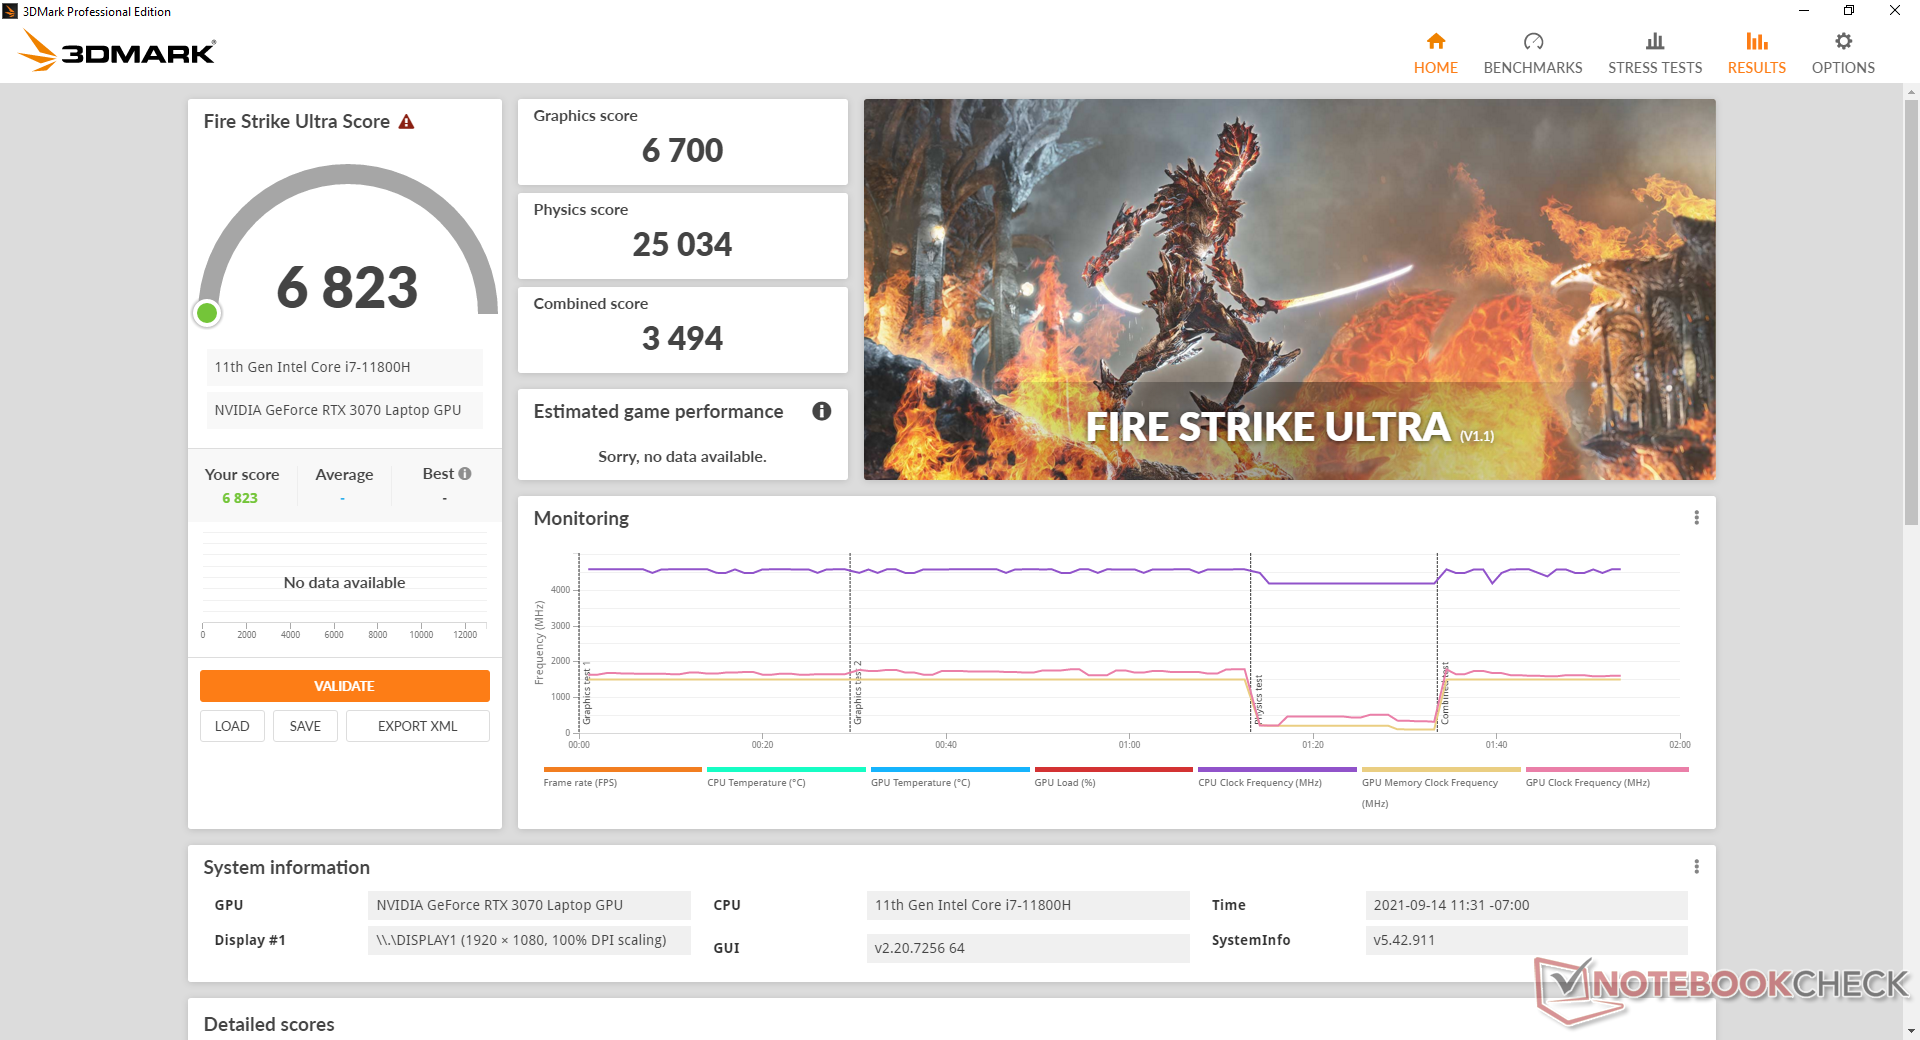
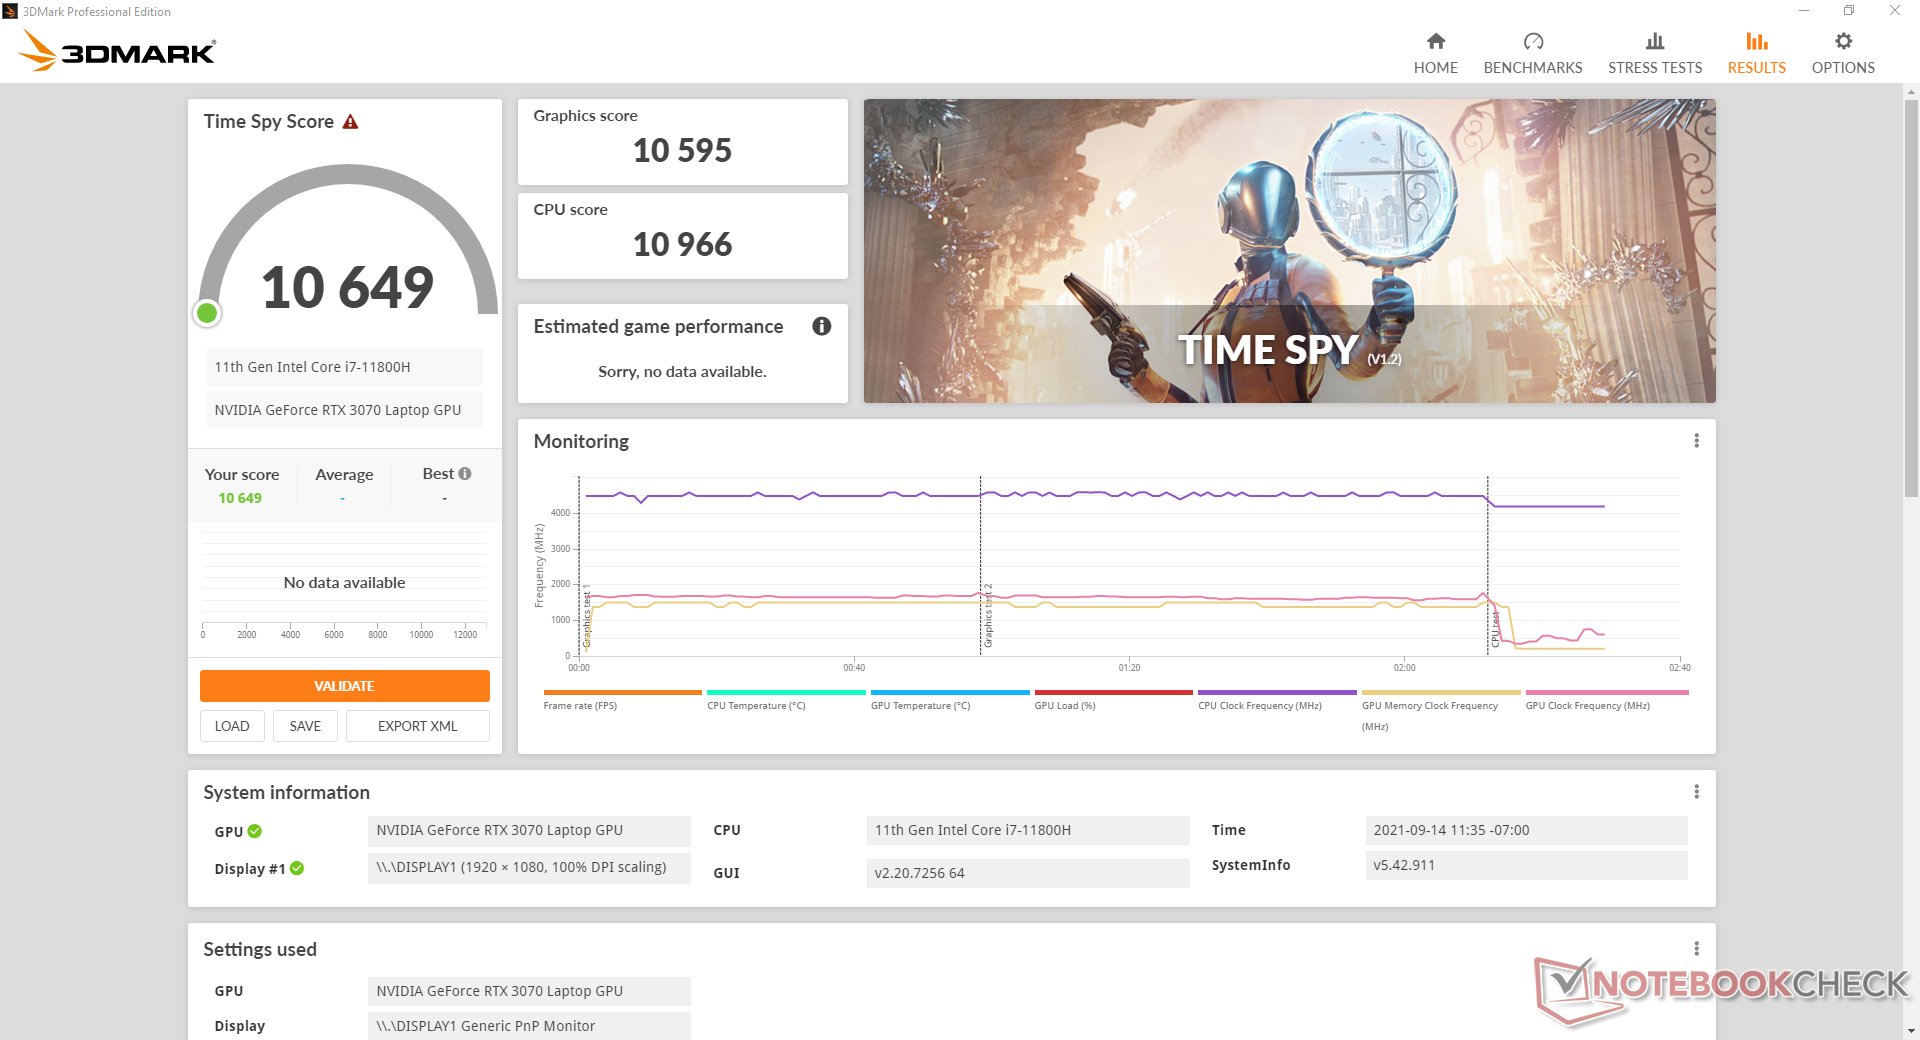
GPU Performance — Slightly Faster than a 100 W GeForce RTX 3080
Graphics performance is excellent with 3DMark results that are 10 to 15 percent faster than the average laptop in our database equipped with the same RTX 3070 GPU. In fact, raw performance is essentially on par with last year's Blade Pro RTX 3080 SKU. It's still significantly slower than a "proper" desktop RTX 3080, however, which is more of an Nvidia thing than a Razer thing.
Upgrading to the Blade 17 RTX 3080 SKU will likely bring very minor performance benefits over our RTX 3070 SKU of just a few percentage points based on our experience with at least a dozen other RTX 3080 laptops thus far. User should also keep in mind that frame rates don't necessarily need to reach 360 FPS in order to exploit the benefits of a 360 Hz display.
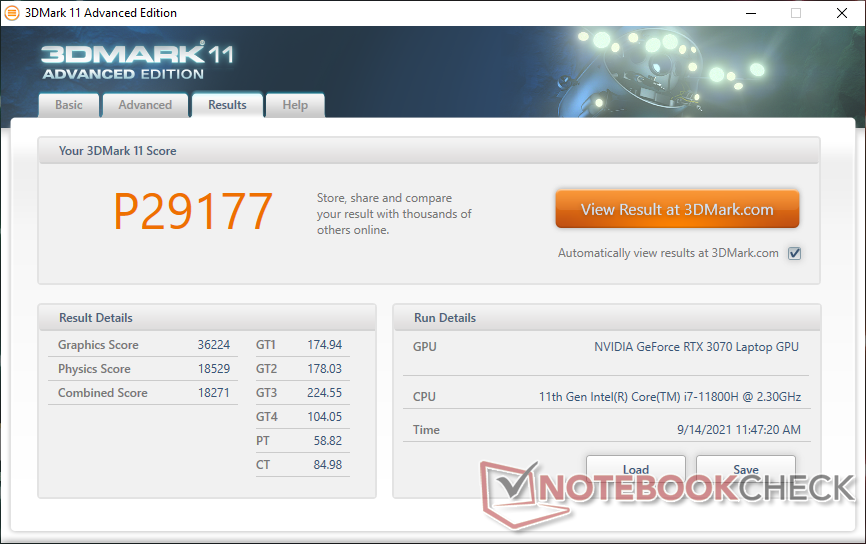
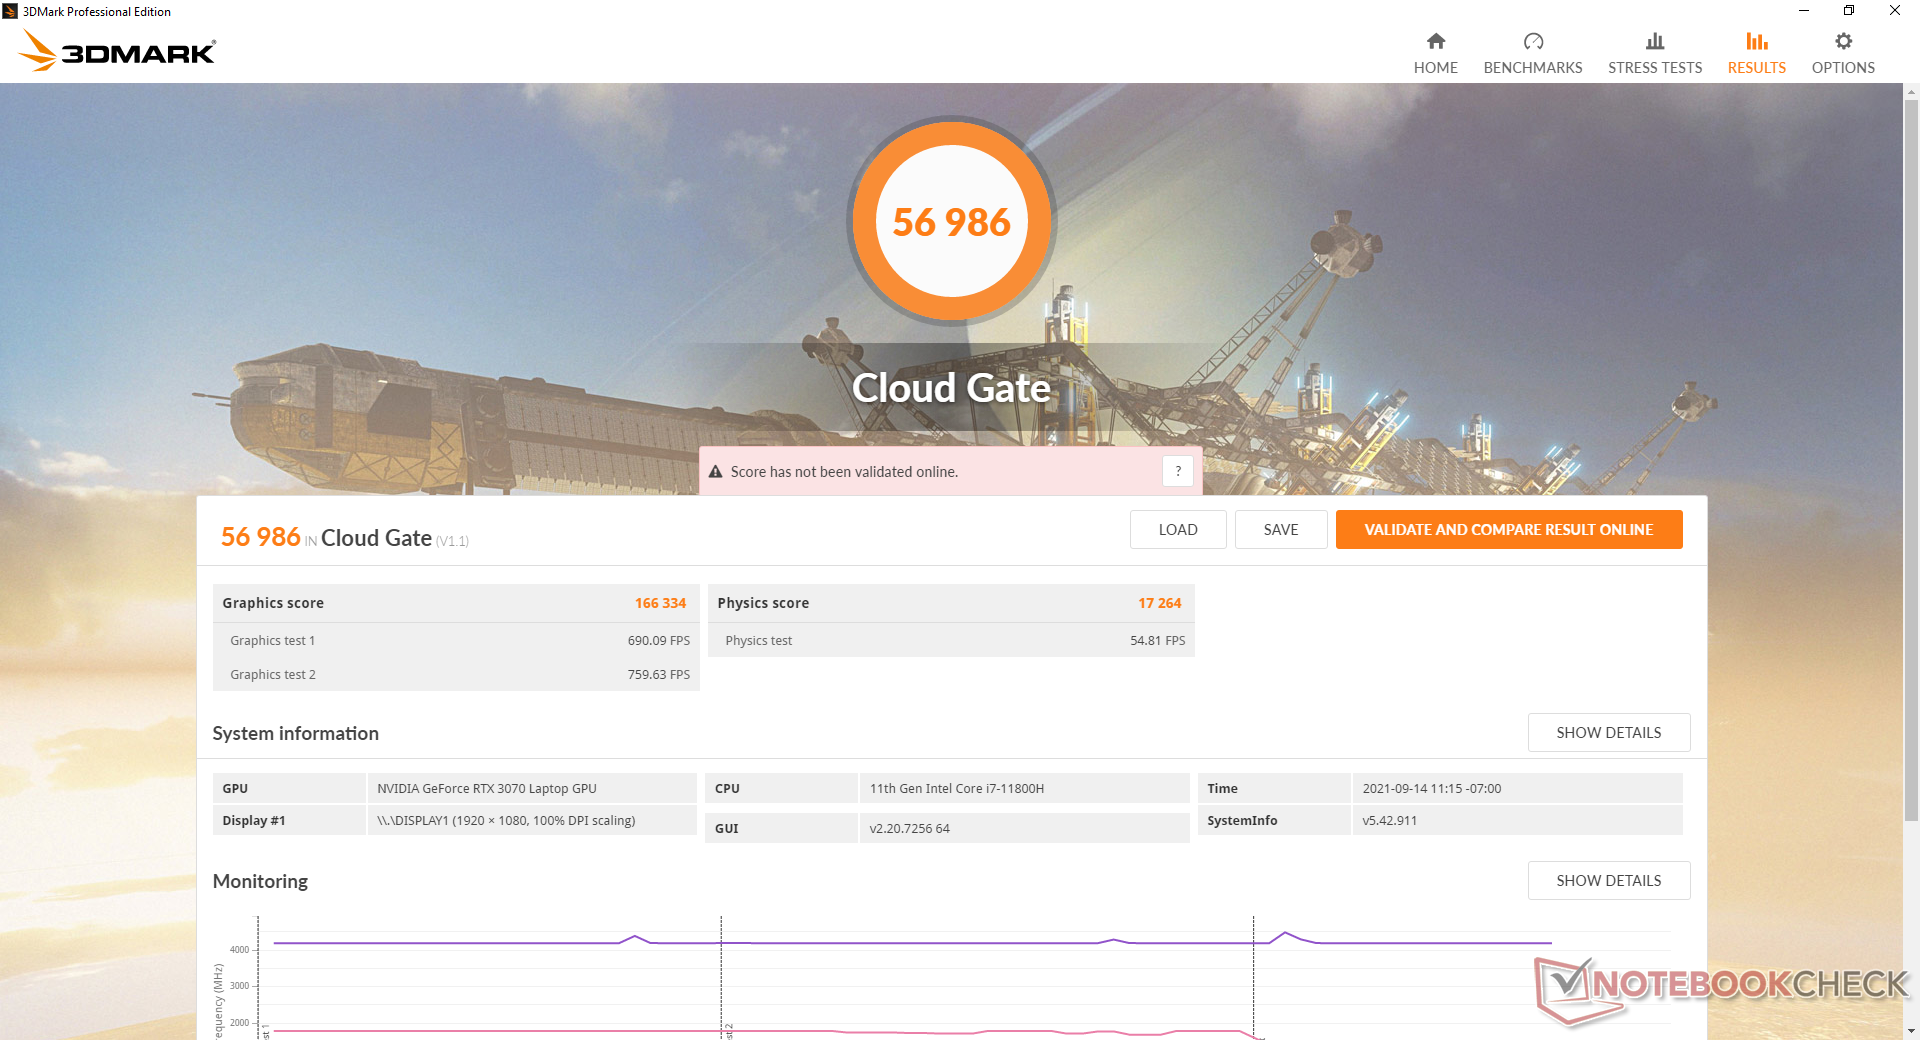
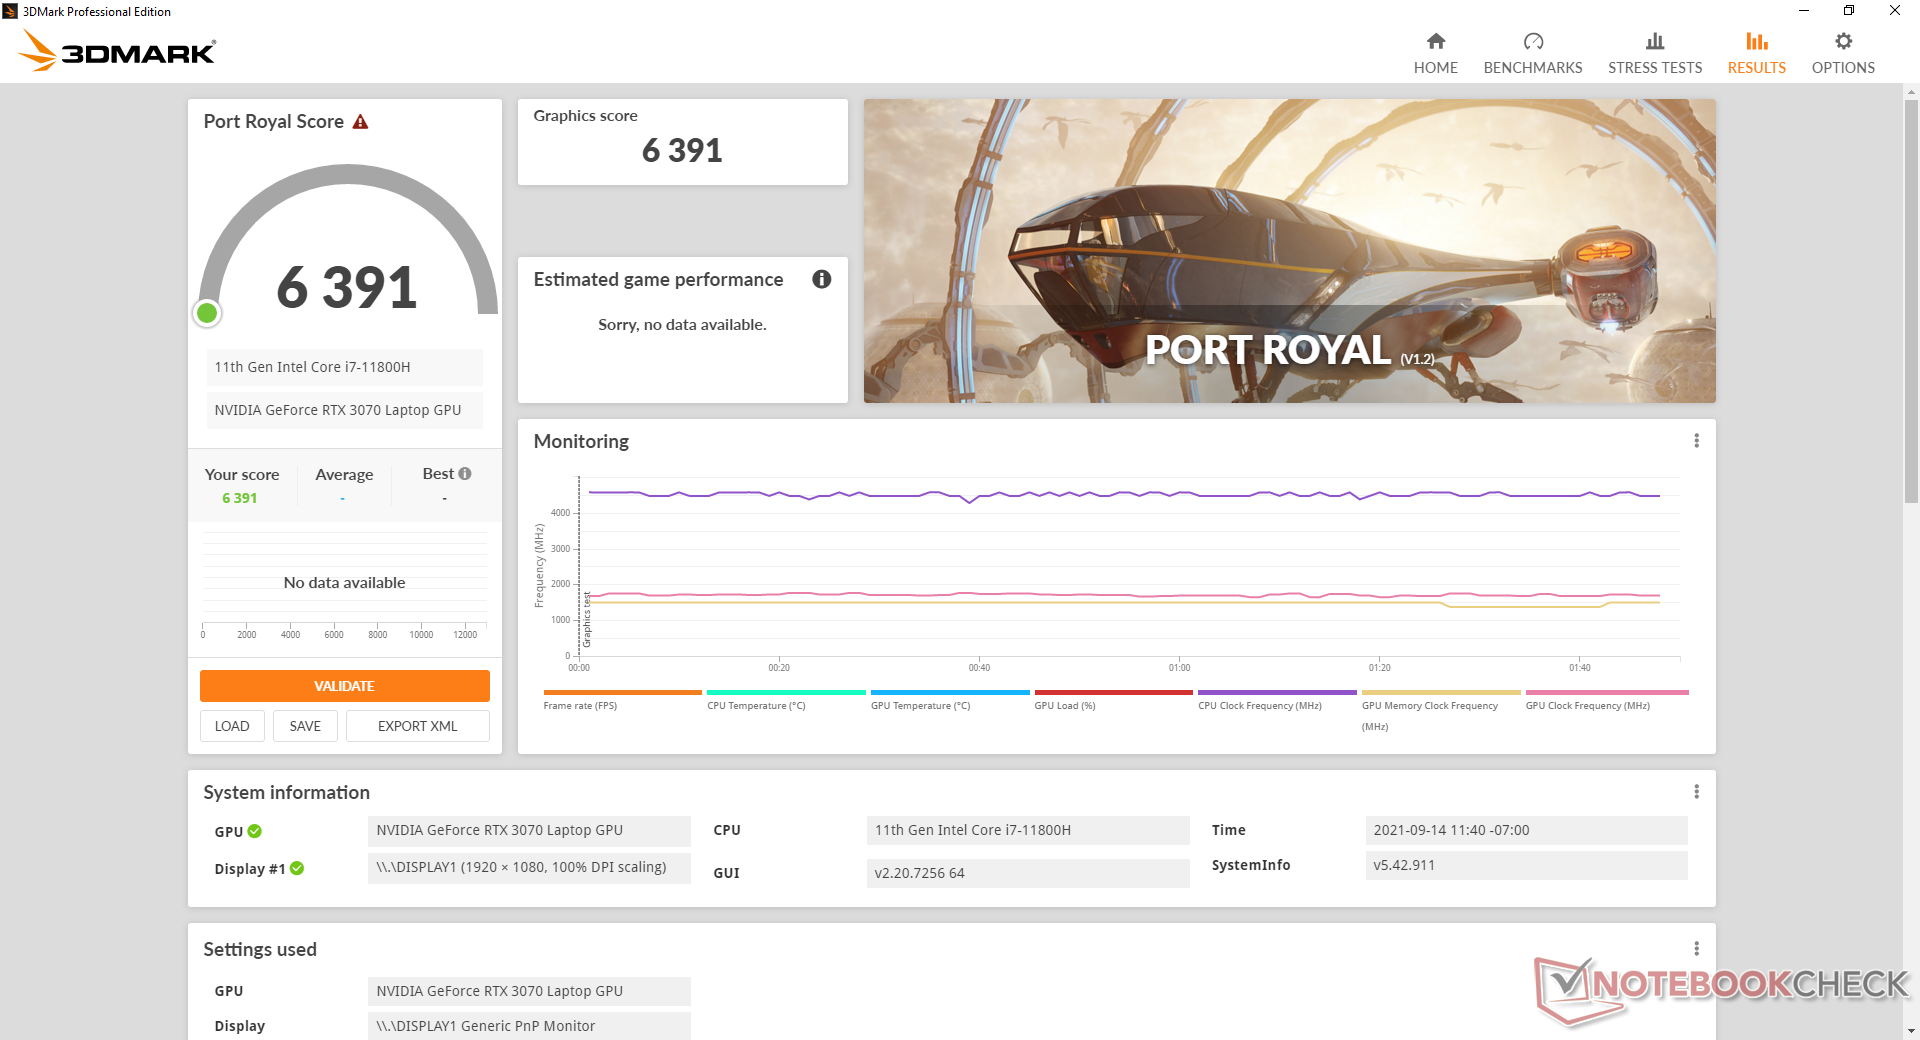
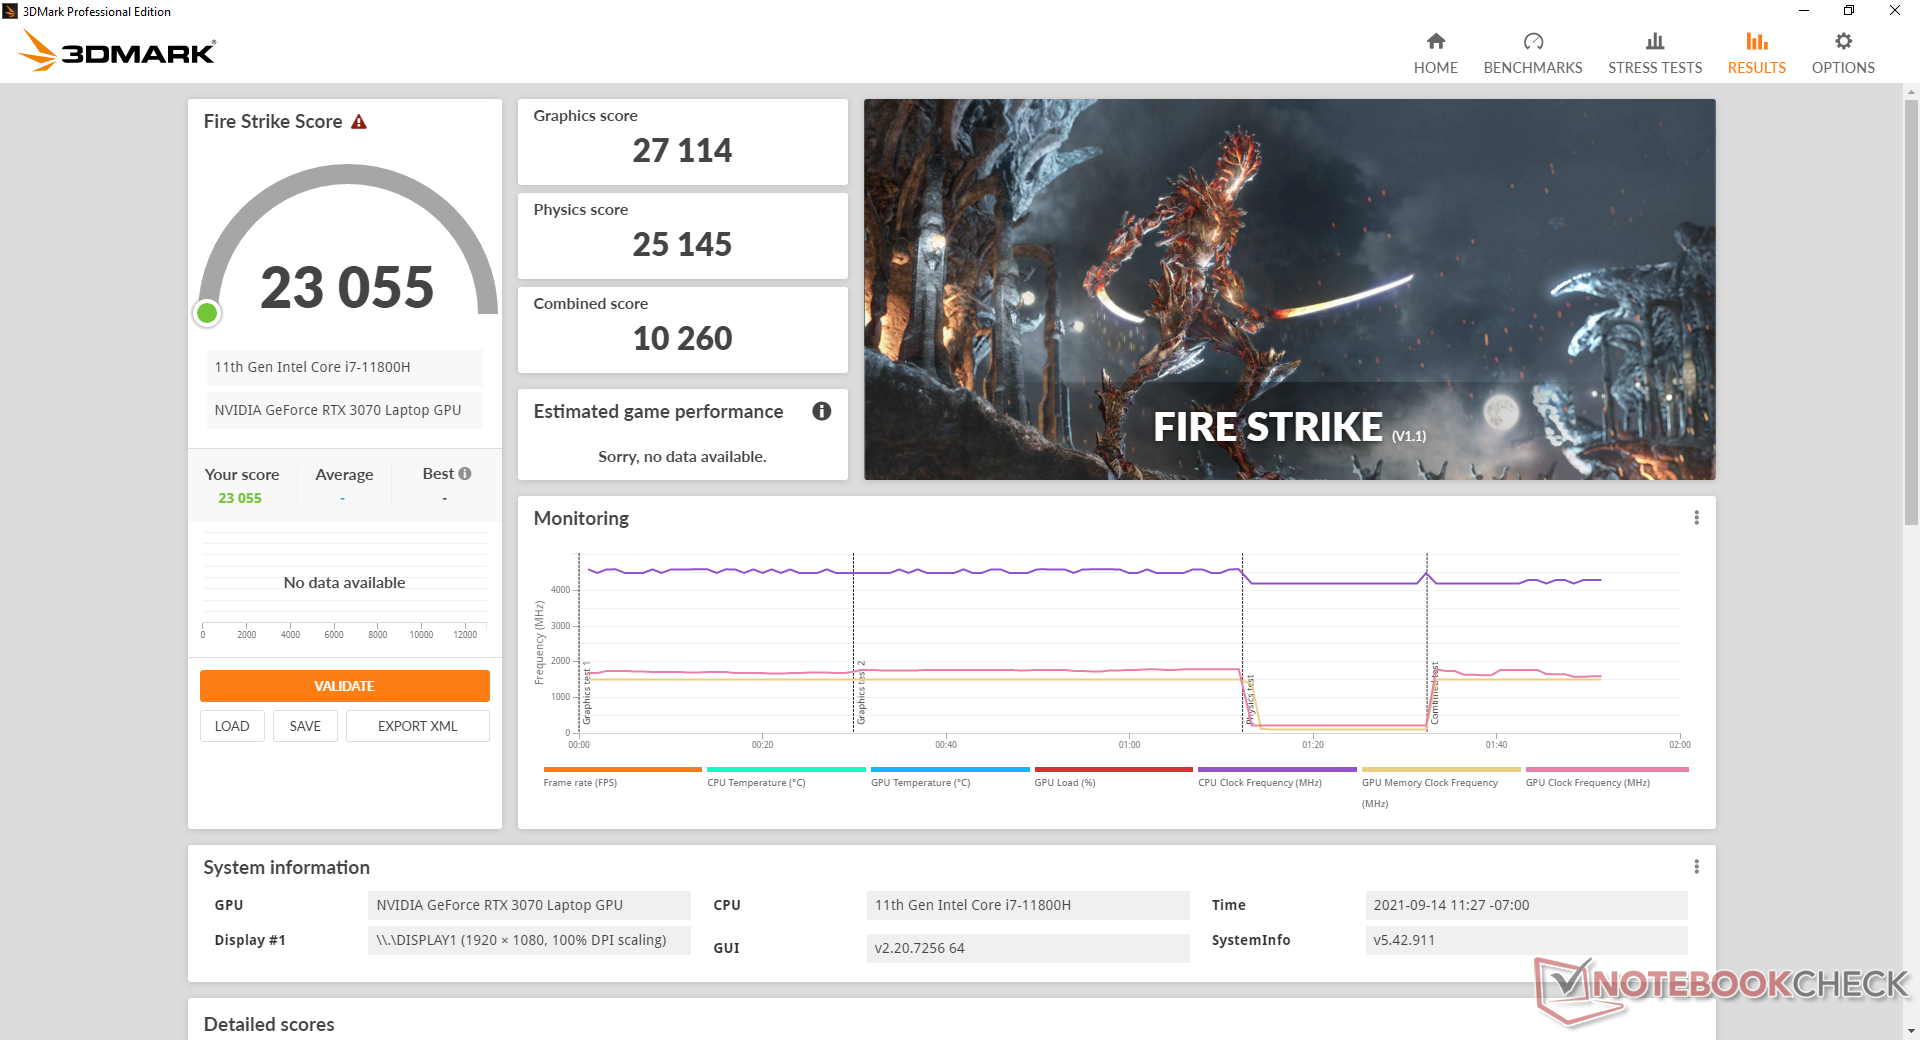
| 3DMark 11 Performance | 29177 points | |
| 3DMark Cloud Gate Standard Score | 56986 points | |
| 3DMark Fire Strike Score | 23055 points | |
| 3DMark Time Spy Score | 10649 points | |
Help | ||
Witcher 3 FPS Chart
| low | med. | high | ultra | |
|---|---|---|---|---|
| GTA V (2015) | 185 | 180 | 173 | 108 |
| The Witcher 3 (2015) | 460.9 | 312.7 | 204.8 | 100.6 |
| Dota 2 Reborn (2015) | 171 | 155 | 149 | 140 |
| Final Fantasy XV Benchmark (2018) | 195 | 136 | 103 | |
| X-Plane 11.11 (2018) | 142 | 125 | 98.4 | |
| Far Cry 5 (2018) | 149 | 138 | 131 | 122 |
| Strange Brigade (2018) | 522 | 261 | 212 | 186 |
Emissions — Still Loud when Gaming
System Noise
Fan noise is quieter than expected from a gaming laptop with four individual fans since the fans tend to idle as much as possible when web browsing or web surfing. When gaming on manual Turbo mode, however, fan noise can reach as high as 56 dB(A) to be louder than most other gaming laptops. The smaller fans underneath the clickpad are also higher-pitched than most other fans which makes them difficult to ignore.
Gaming on the default Balanced mode instead of manual Turbo mode will see fan noise top out at only 43.5 dB(A) when gaming. Of course, users will be sacrificing performance for that much lower fan noise.
There is some very slight electronic noise or coil whine on our unit that only becomes noticeable when placing an ear near the keyboard keys.
| Razer Blade 17 RTX 3070 GeForce RTX 3070 Laptop GPU, i7-11800H, Samsung PM9A1 MZVL21T0HCLR | Asus ROG Zephyrus S17 GX703HSD GeForce RTX 3080 Laptop GPU, i9-11900H, Samsung PM9A1 MZVL22T0HBLB | MSI GS76 Stealth 11UH GeForce RTX 3080 Laptop GPU, i9-11900H, Samsung PM9A1 MZVL22T0HBLB | Acer Nitro 5 AN517-41-R9S5 GeForce RTX 3080 Laptop GPU, R7 5800H, SK Hynix BC711 1TB HFM001TD3JX016N | Gigabyte Aero 17 HDR YD GeForce RTX 3080 Laptop GPU, i9-11980HK, Samsung PM9A1 MZVL2512HCJQ | Maingear Vector Pro MG-VCP17 GeForce RTX 3080 Laptop GPU, i7-11800H, Samsung PM9A1 MZVL21T0HCLR | |
|---|---|---|---|---|---|---|
| Noise | 6% | -8% | -4% | -19% | 1% | |
| off / environment * (dB) | 24.2 | 23 5% | 24 1% | 26 -7% | 25 -3% | 23.8 2% |
| Idle Minimum * (dB) | 24.7 | 23 7% | 24 3% | 26 -5% | 30 -21% | 23.9 3% |
| Idle Average * (dB) | 24.7 | 23 7% | 25 -1% | 28 -13% | 32 -30% | 23.9 3% |
| Idle Maximum * (dB) | 24.7 | 23 7% | 42 -70% | 41 -66% | 23.9 3% | |
| Load Average * (dB) | 44.3 | 41 7% | 46 -4% | 41.6 6% | 43 3% | 38 14% |
| Witcher 3 ultra * (dB) | 56.3 | 45 20% | 48 15% | 51 9% | 55.9 1% | |
| Load Maximum * (dB) | 47.7 | 52 -9% | 48 -1% | 48.6 -2% | 59 -24% | 55.9 -17% |
* ... smaller is better
Noise level
| Idle |
| 24.7 / 24.7 / 24.7 dB(A) |
| Load |
| 44.3 / 47.7 dB(A) |
 | ||
30 dB silent 40 dB(A) audible 50 dB(A) loud |
||
min: | ||
Temperature
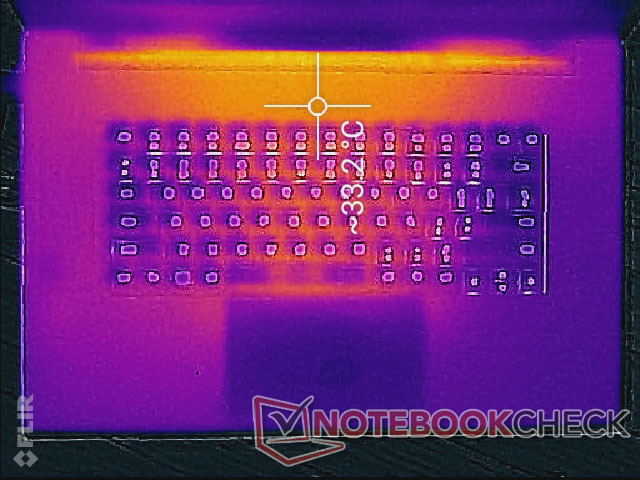
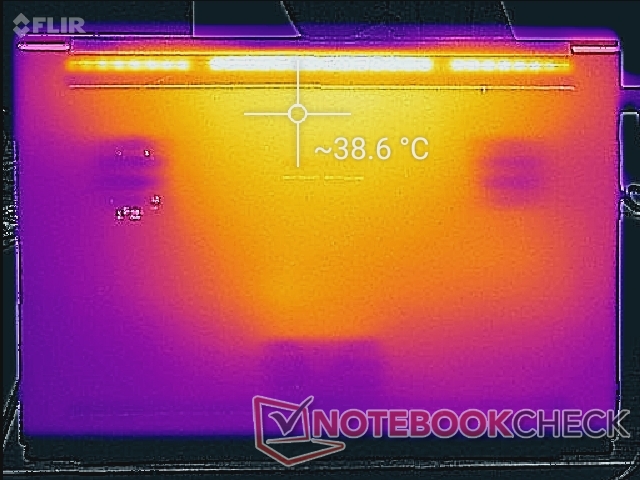
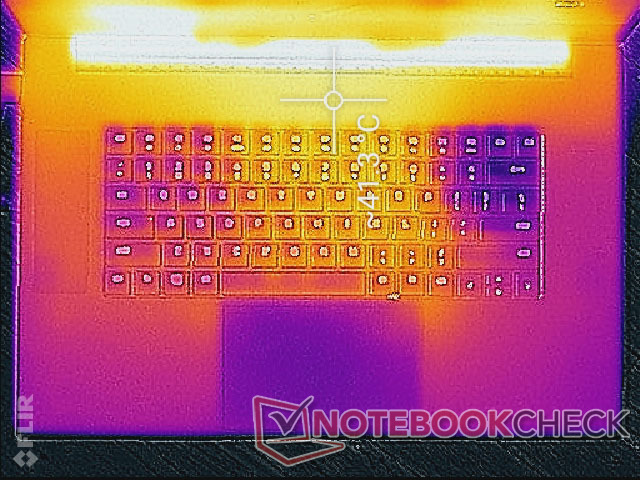
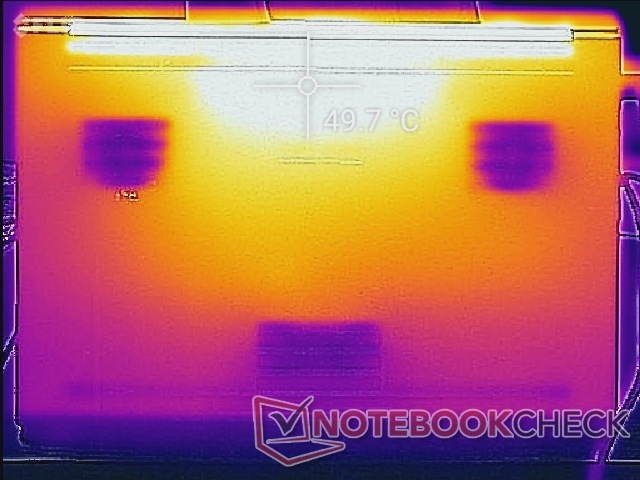
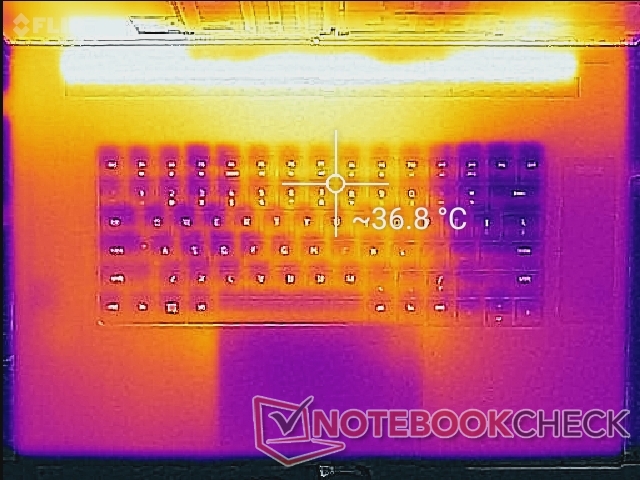
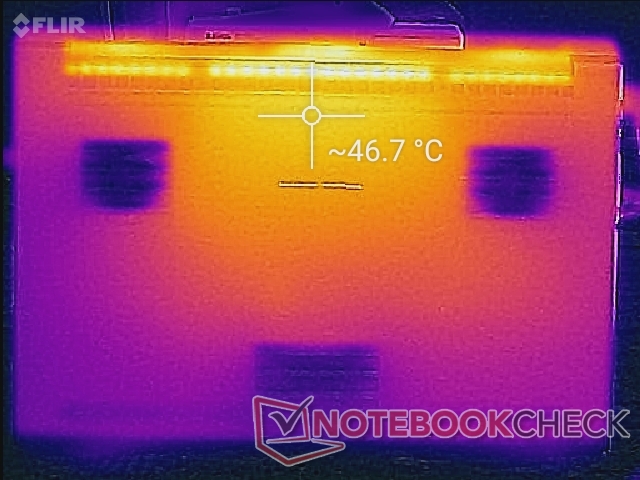
Surface temperatures are reasonable on the Blade 17 due in part to its four individual fans compared to just two on most other laptops. Hot spots can reach over 41 C and 49 C on the top and bottom, respectively, compared to 59 C or 53 C on the Asus Zephyrus S17. The palm rests don't get nearly as warm either even when compared to the Blade 15.
Surface temperatures when idling are still on the warm side since the fans tend to idle when workloads are low. The bottom hot spot can be as warm 39 C compared to 35 C on the aforementioned Asus.
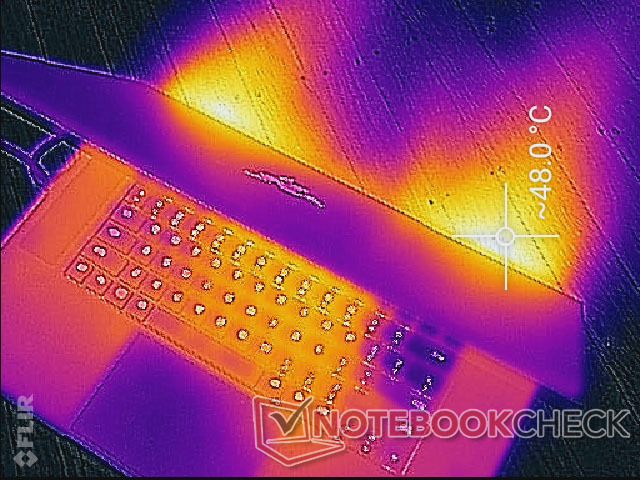
(±) The maximum temperature on the upper side is 41 °C / 106 F, compared to the average of 40.4 °C / 105 F, ranging from 21.2 to 68.8 °C for the class Gaming.
(-) The bottom heats up to a maximum of 47.2 °C / 117 F, compared to the average of 43.2 °C / 110 F
(+) In idle usage, the average temperature for the upper side is 29.9 °C / 86 F, compared to the device average of 33.9 °C / 93 F.
(±) Playing The Witcher 3, the average temperature for the upper side is 33.2 °C / 92 F, compared to the device average of 33.9 °C / 93 F.
(+) The palmrests and touchpad are reaching skin temperature as a maximum (33 °C / 91.4 F) and are therefore not hot.
(-) The average temperature of the palmrest area of similar devices was 28.8 °C / 83.8 F (-4.2 °C / -7.6 F).
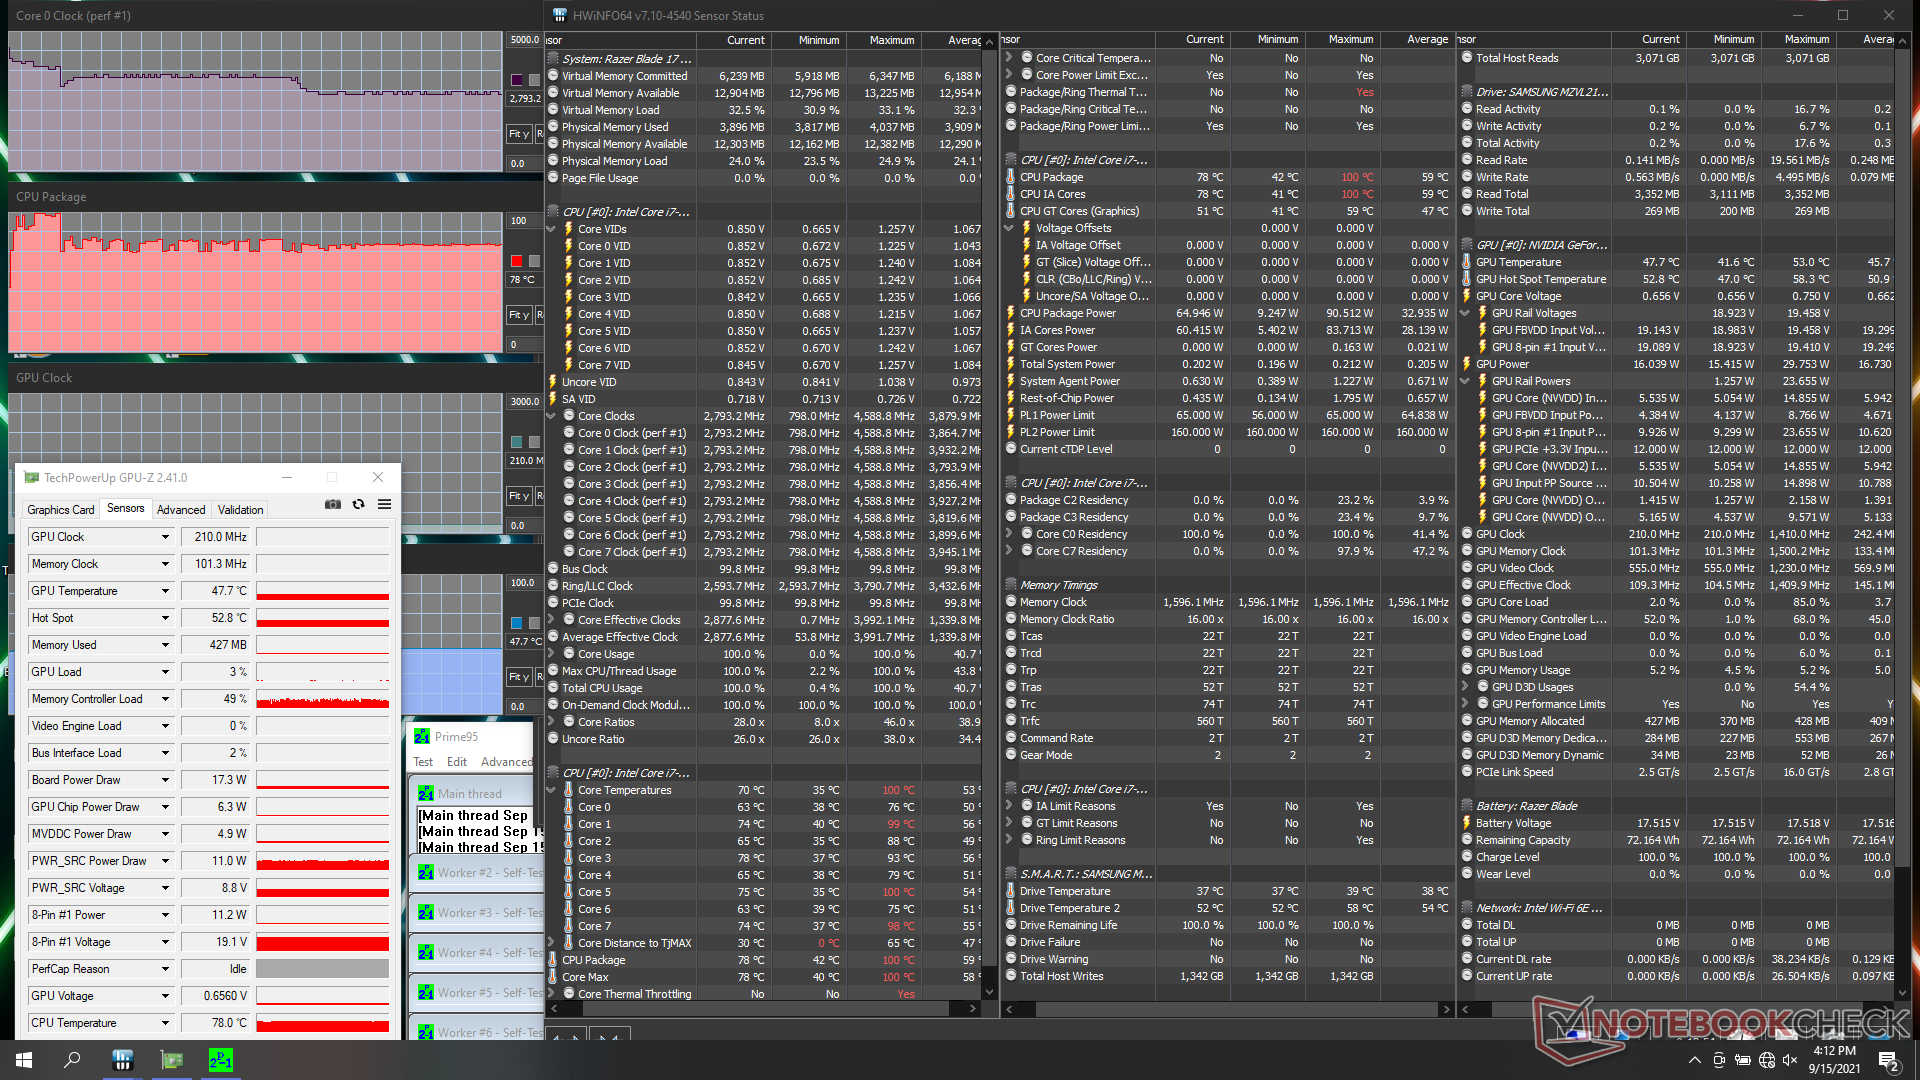
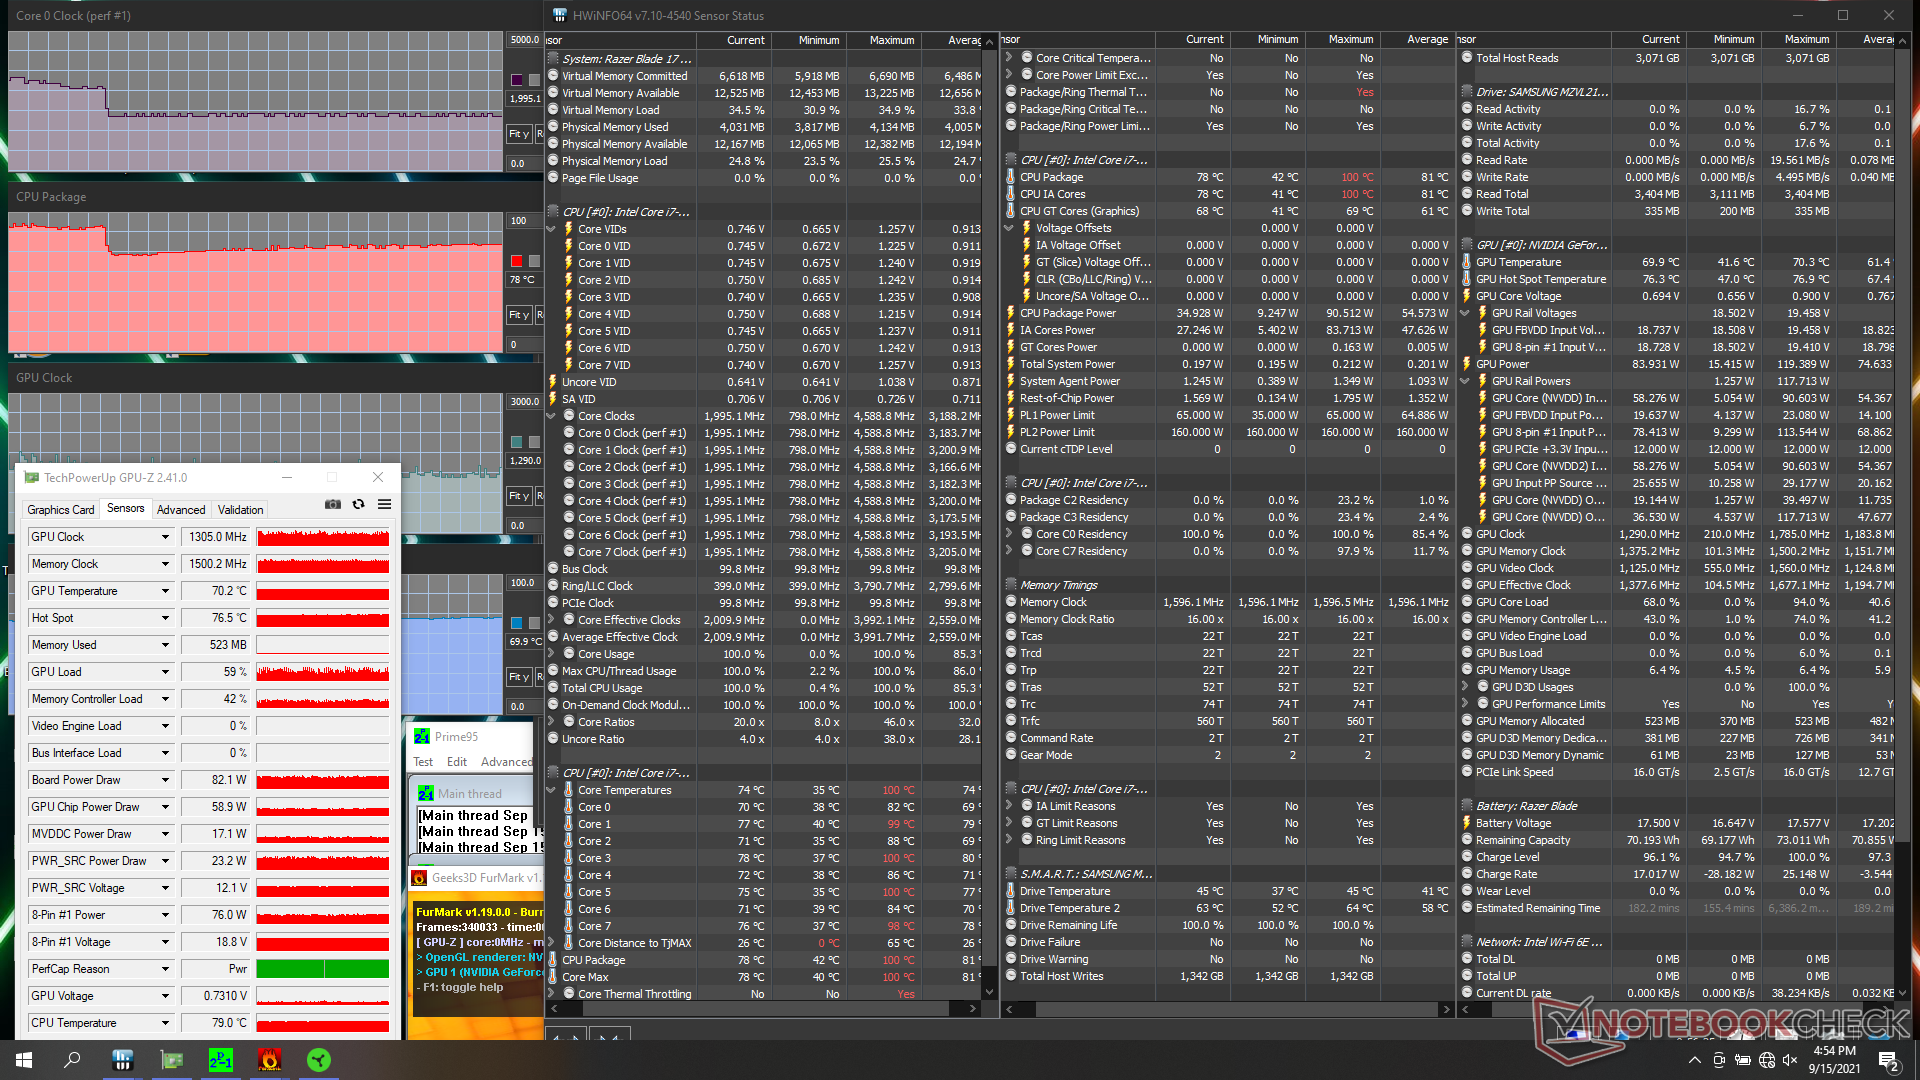
Stress Test
When stressed under Prime95 on Turbo mode, the CPU would boost to 3.9 GHz for about 20 seconds before falling to 3.5 GHz and then eventually 2.9 GHz in order to maintain a core temperature of 78 C. Though not terrible, it's too bad that the processor can't sustain faster clock rates for very long periods when at 100 percent utilization.
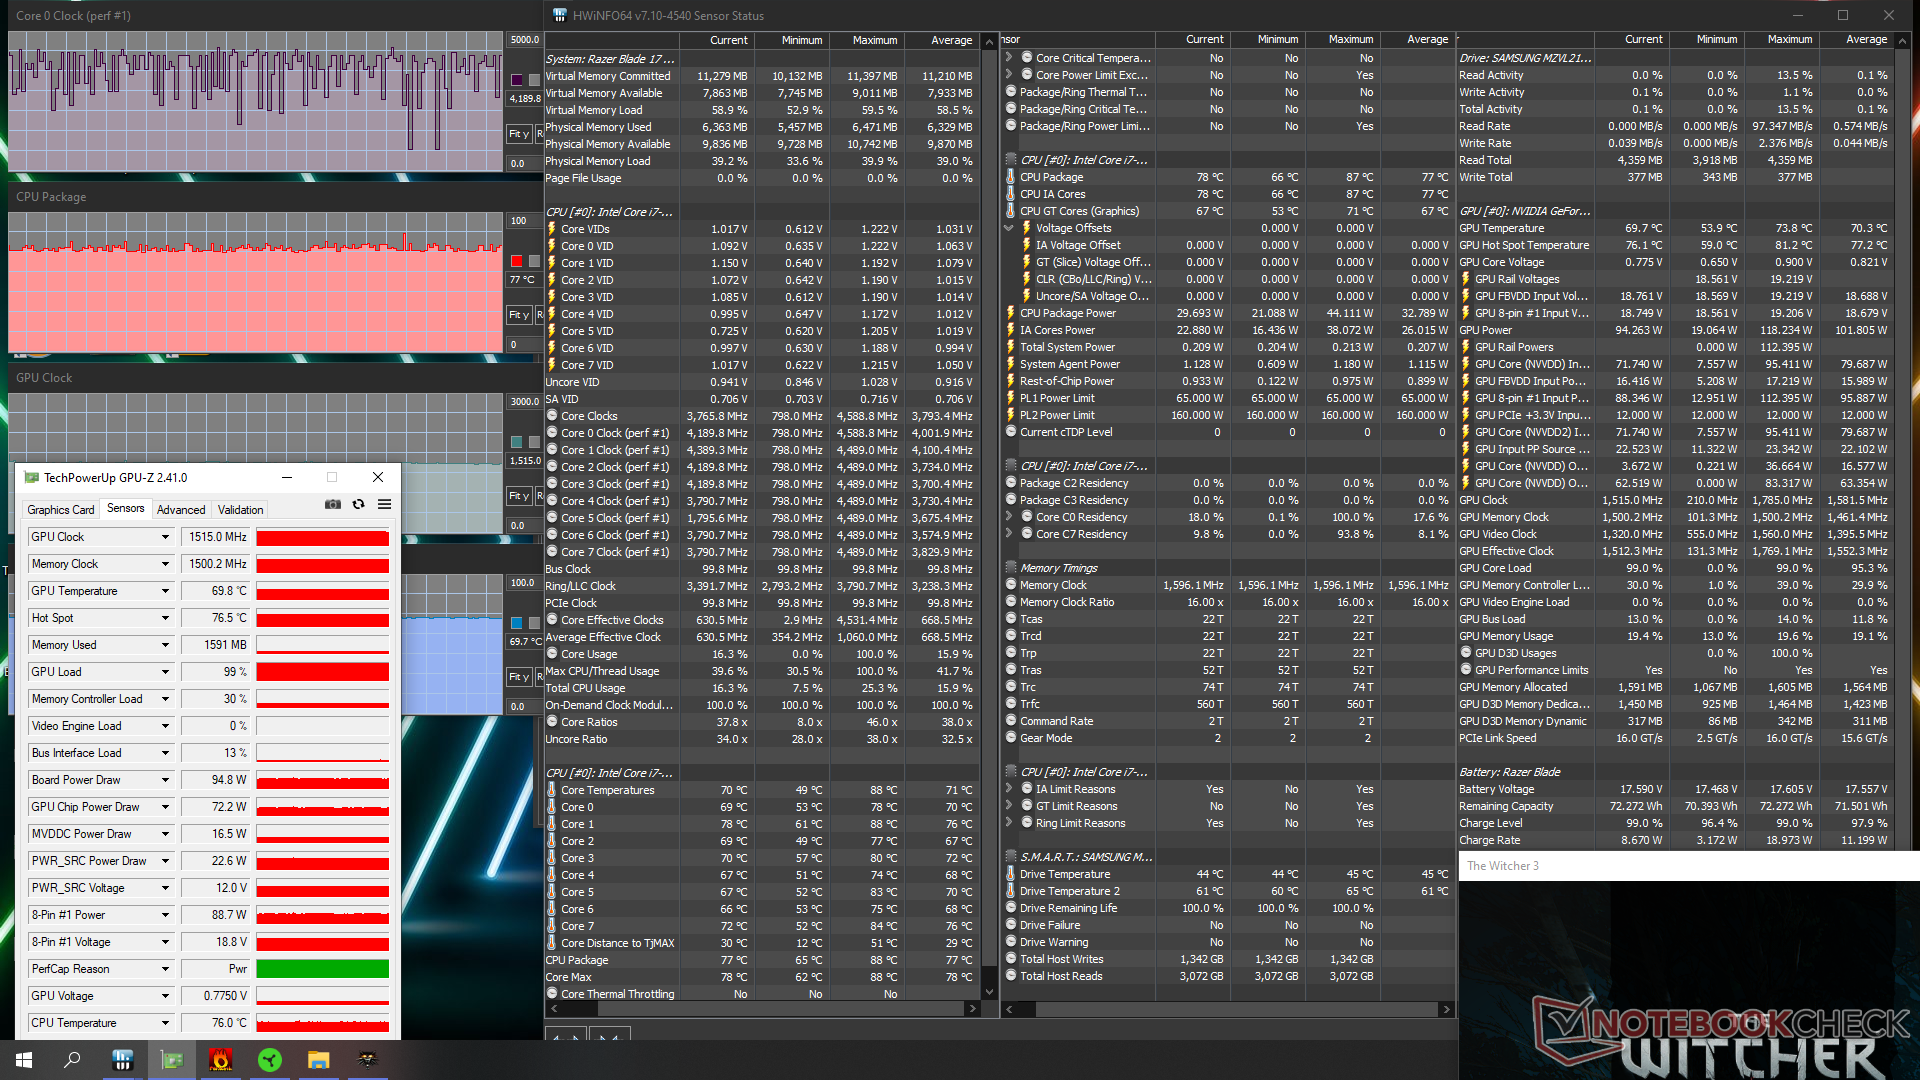
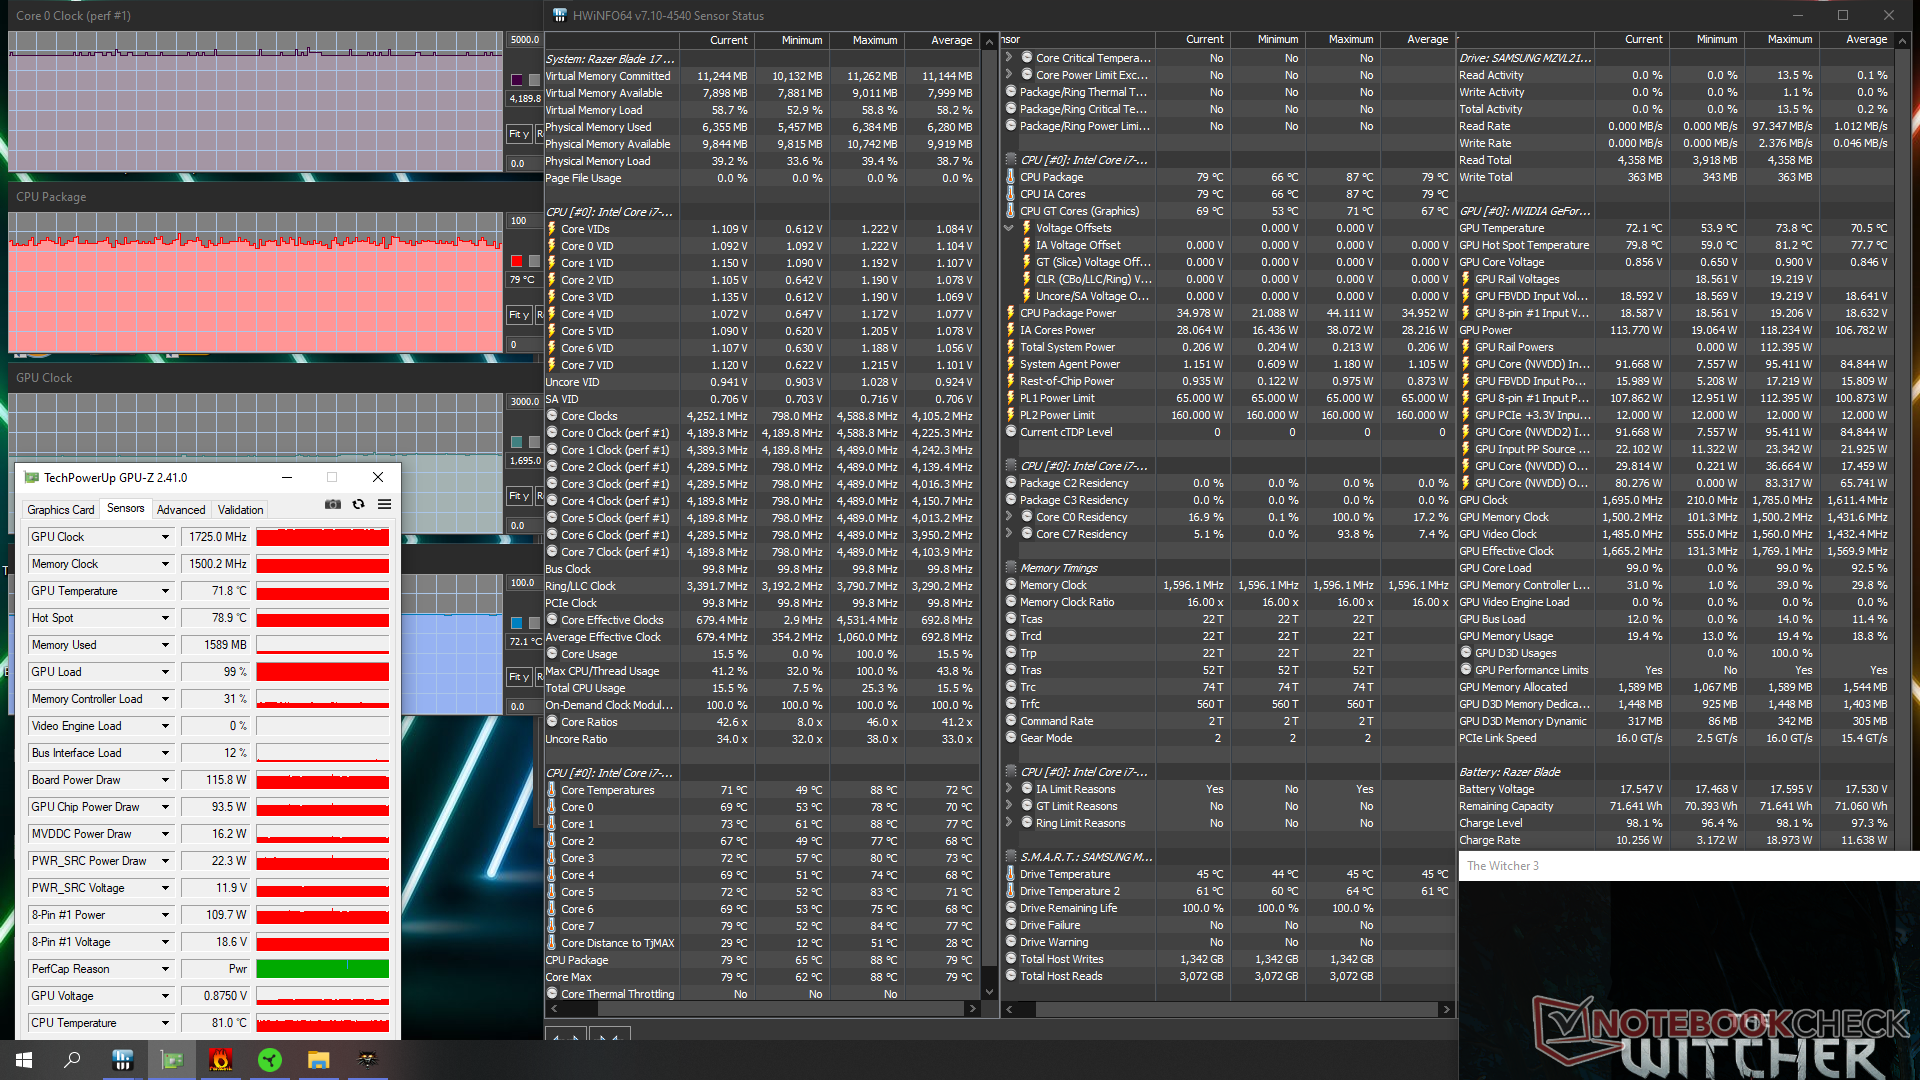
Running Witcher 3 on Turbo mode shows a steady GPU clock rate of 1725 MHz and board power draw of 116 W versus only 1515 MHz and 95 W if not on Turbo mode. Memory clock and GPU temperature would remain about the same, however, while a full 130 W draw appears to be unattainable without further tinkering. Users should therefore enable manual Turbo mode via the Razer Central software in order to squeeze more graphics performance out of the laptop.
Interestingly, CPU and GPU temperatures are warmer on the Blade 17 when compared to the older Blade Pro RTX 3080. Running Witcher 3 would result in stable CPU and GPU temperatures of 79 C and 72 C, respectively, while the older Blade Pro would be cooler at 65 C and 64 C. We suspect this could be due to the higher CPU PL2 (160 W vs. 120 W) and TGP (130 W vs. 100 W) targets for the newer Blade 17.
Running on battery power will limit performance because Turbo mode becomes unavailable. A 3DMark 11 test on batteries would return Physics and Graphics scores of 6377 and 11738 points, respectively, compared to 18529 and 36224 points when on mains.
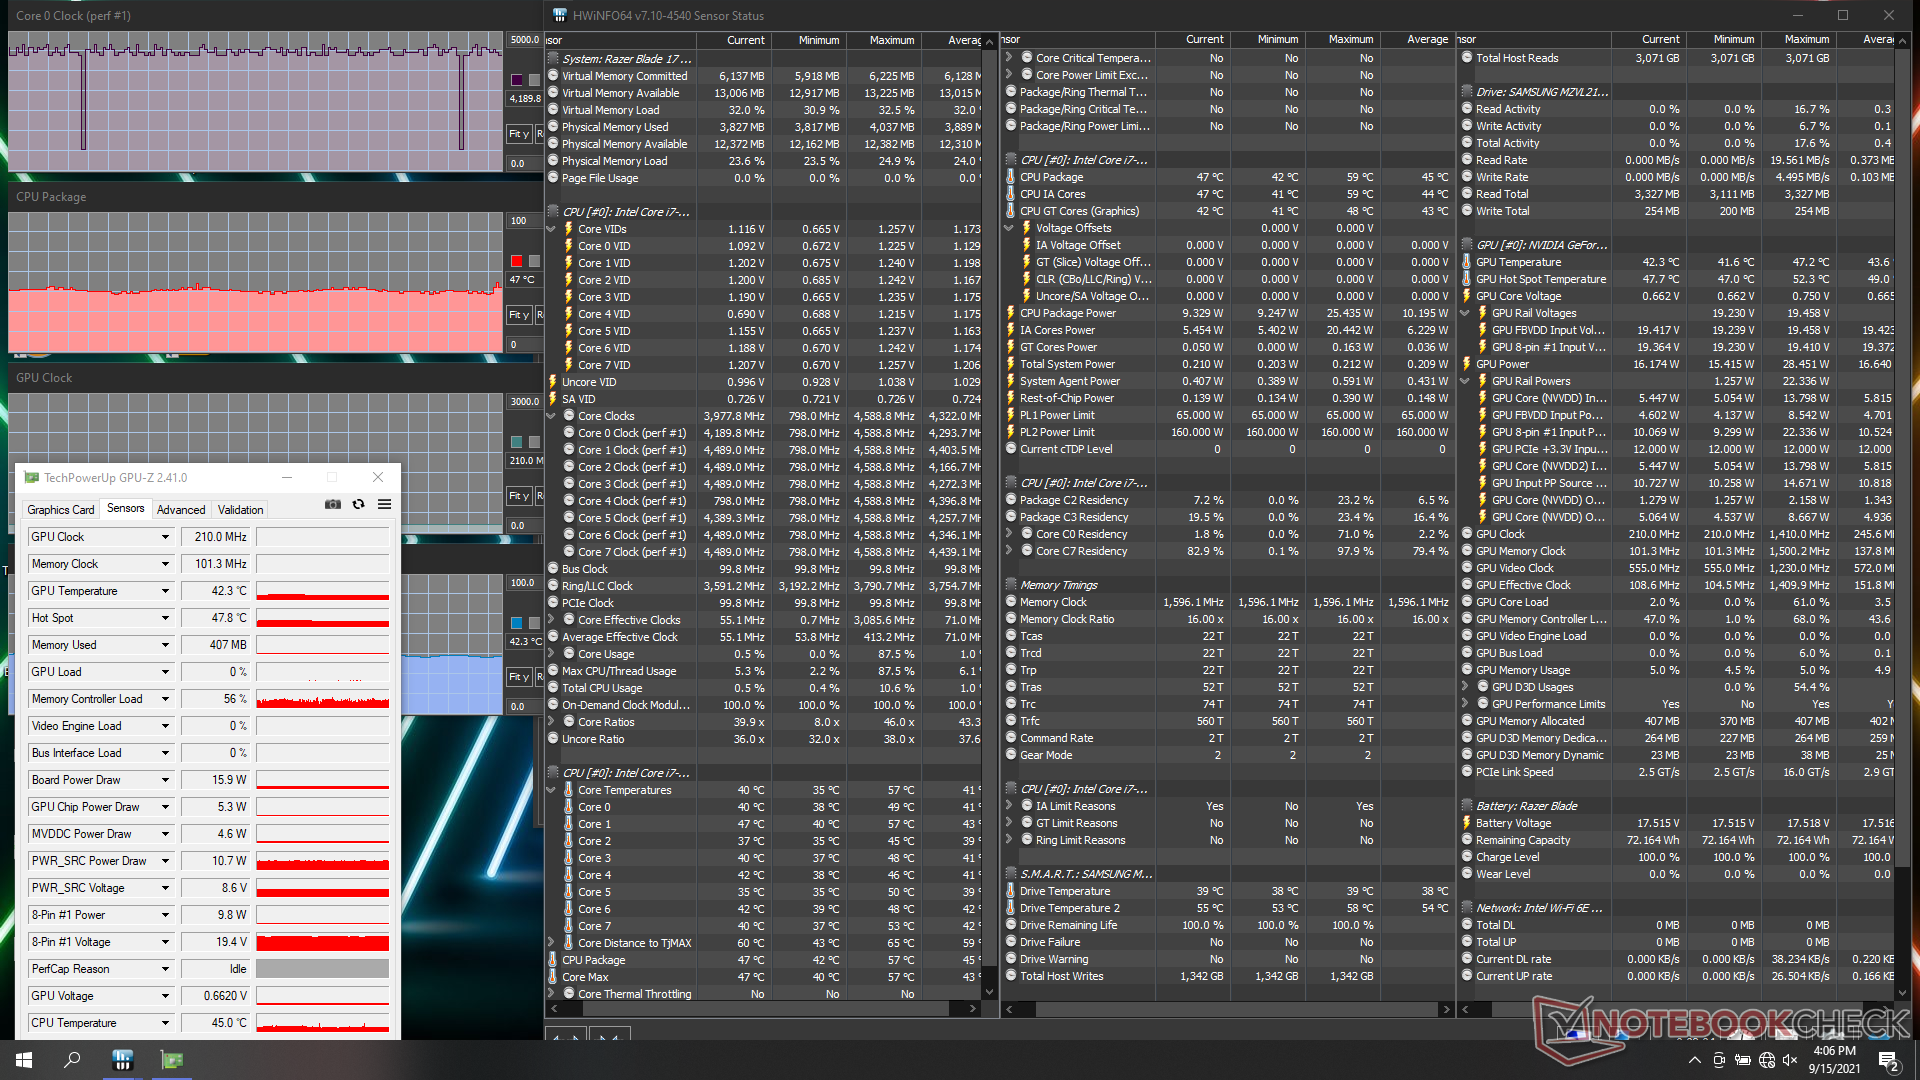
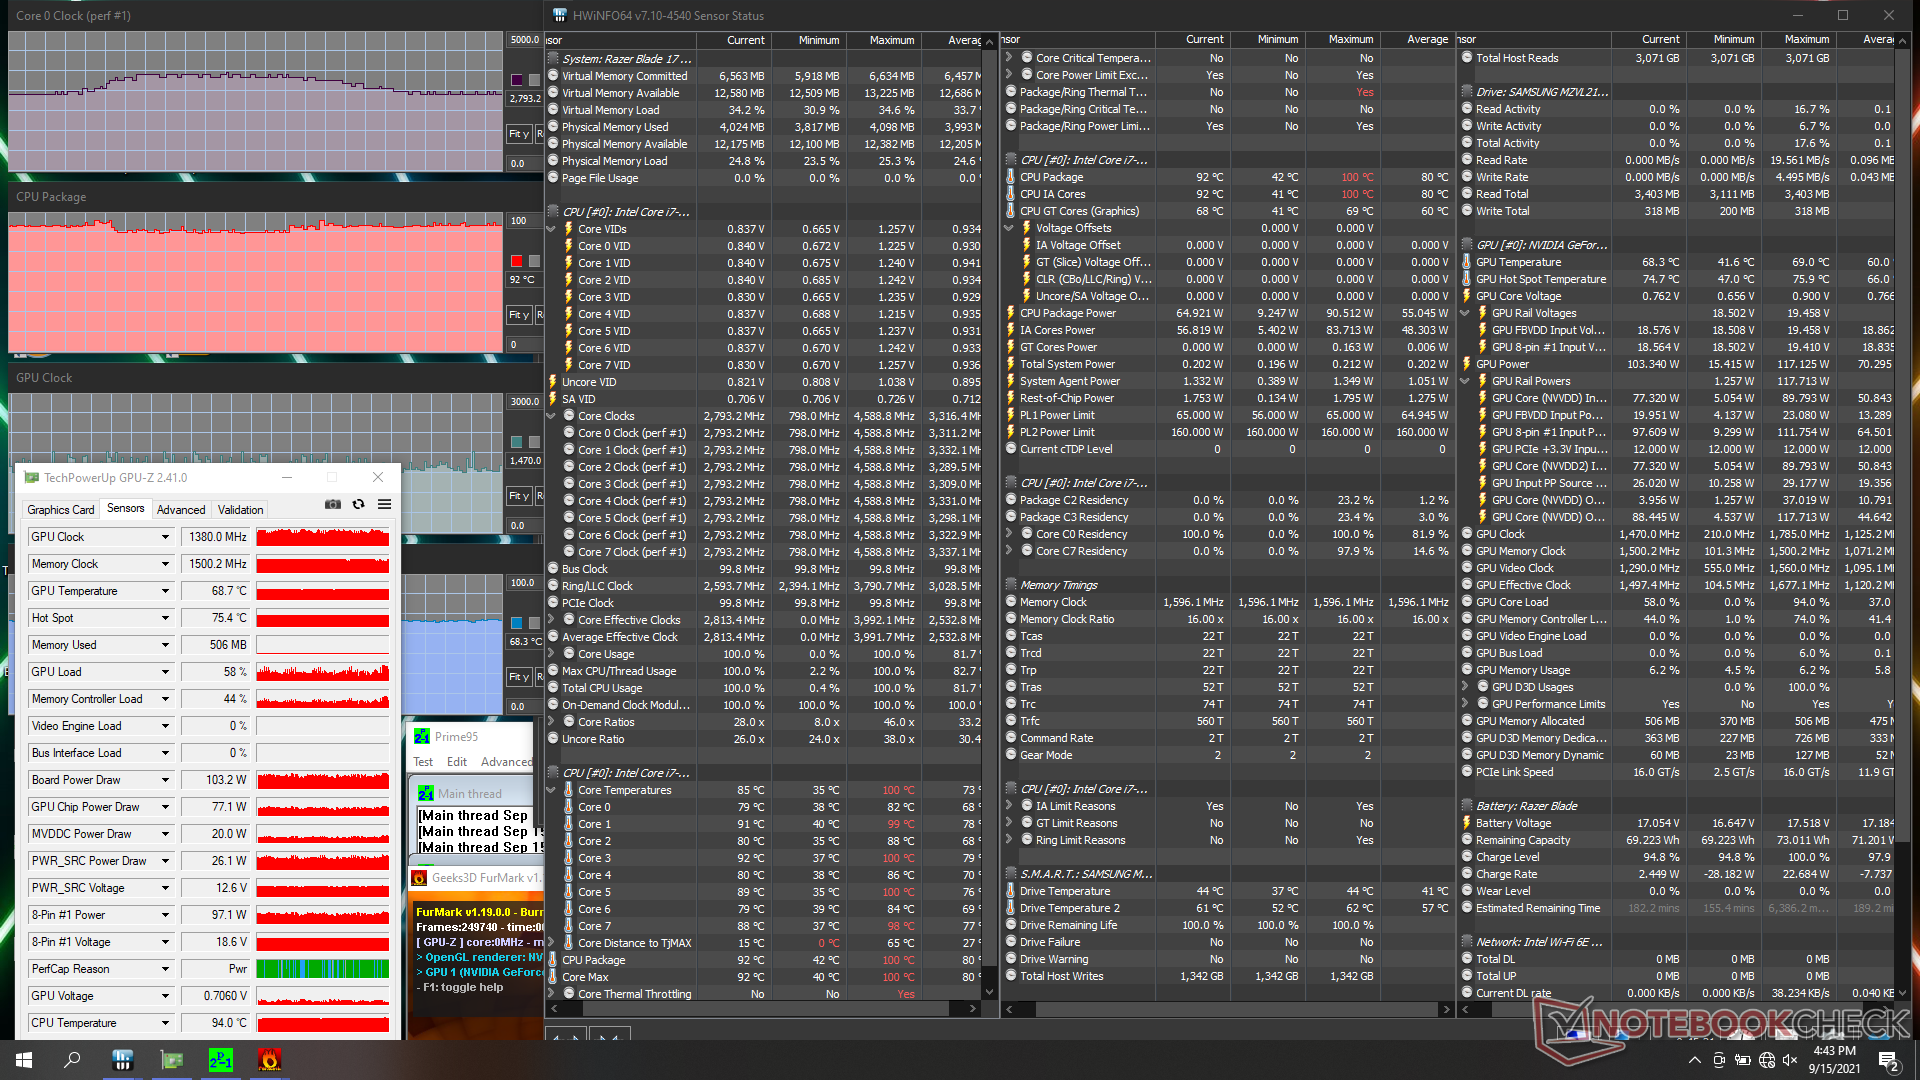
| CPU Clock (GHz) | GPU Clock (MHz) | Average CPU Temperature (°C) | Average GPU Temperature (°C) | |
| System Idle | -- | -- | 46 | 42 |
| Prime95 Stress (Turbo on) | 2.8 | -- | 78 | 48 |
| Prime95 + FurMark Stress (Turbo off) | 2.0 | 1305 | 78 | 70 |
| Prime95 + FurMark Stress (Turbo on) | 2.8 - 3.4 | 1380 | 92 | 69 |
| Witcher 3 Stress (Turbo off) | ~1.8 - 4.2 | 1515 | 77 | 70 |
| Witcher 3 Stress (Turbo on) | 4.2 | 1725 | 79 | 72 |
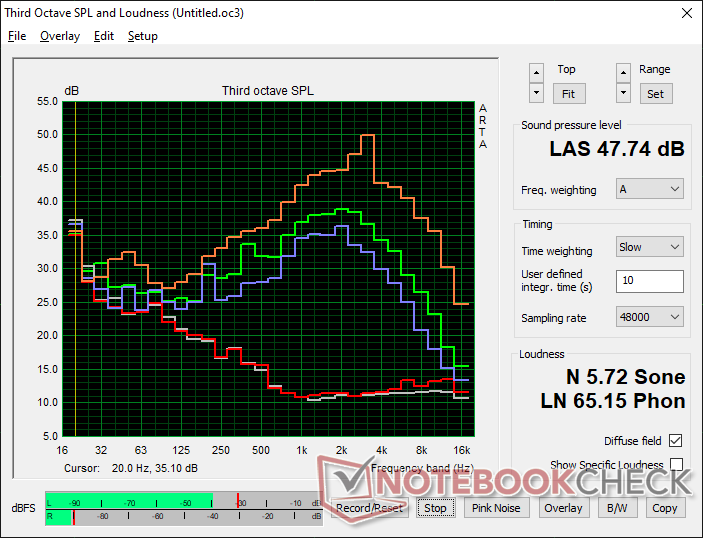
Speakers

Razer Blade 17 RTX 3070 audio analysis
(+) | speakers can play relatively loud (86.8 dB)
Bass 100 - 315 Hz
(-) | nearly no bass - on average 23.4% lower than median
(±) | linearity of bass is average (11.6% delta to prev. frequency)
Mids 400 - 2000 Hz
(+) | balanced mids - only 2.4% away from median
(+) | mids are linear (2.1% delta to prev. frequency)
Highs 2 - 16 kHz
(+) | balanced highs - only 2.7% away from median
(+) | highs are linear (5.1% delta to prev. frequency)
Overall 100 - 16.000 Hz
(+) | overall sound is linear (13.6% difference to median)
Compared to same class
» 20% of all tested devices in this class were better, 7% similar, 73% worse
» The best had a delta of 6%, average was 18%, worst was 132%
Compared to all devices tested
» 15% of all tested devices were better, 4% similar, 82% worse
» The best had a delta of 4%, average was 24%, worst was 134%
Apple MacBook 12 (Early 2016) 1.1 GHz audio analysis
(+) | speakers can play relatively loud (83.6 dB)
Bass 100 - 315 Hz
(±) | reduced bass - on average 11.3% lower than median
(±) | linearity of bass is average (14.2% delta to prev. frequency)
Mids 400 - 2000 Hz
(+) | balanced mids - only 2.4% away from median
(+) | mids are linear (5.5% delta to prev. frequency)
Highs 2 - 16 kHz
(+) | balanced highs - only 2% away from median
(+) | highs are linear (4.5% delta to prev. frequency)
Overall 100 - 16.000 Hz
(+) | overall sound is linear (10.2% difference to median)
Compared to same class
» 7% of all tested devices in this class were better, 2% similar, 91% worse
» The best had a delta of 5%, average was 18%, worst was 53%
Compared to all devices tested
» 5% of all tested devices were better, 1% similar, 94% worse
» The best had a delta of 4%, average was 24%, worst was 134%
Energy Management
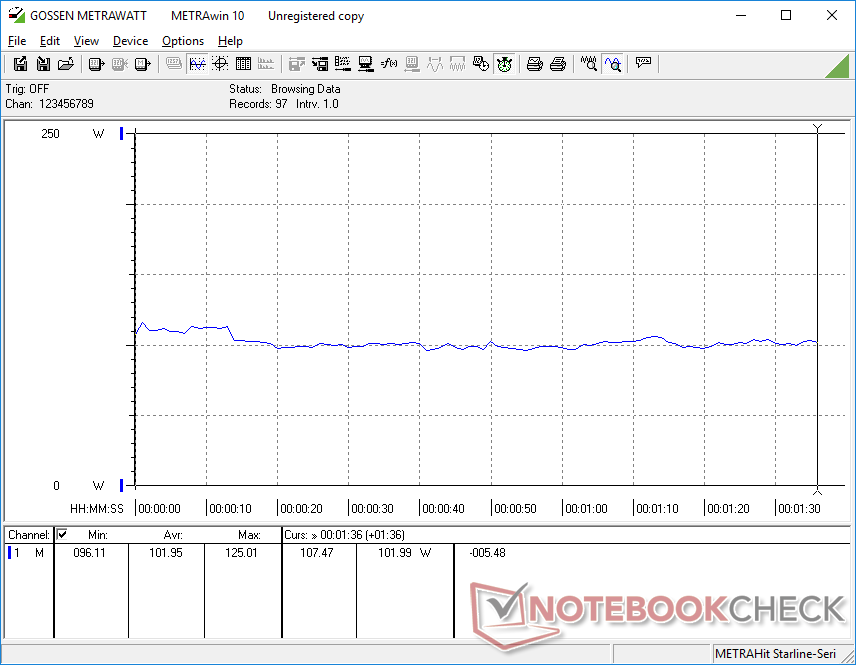
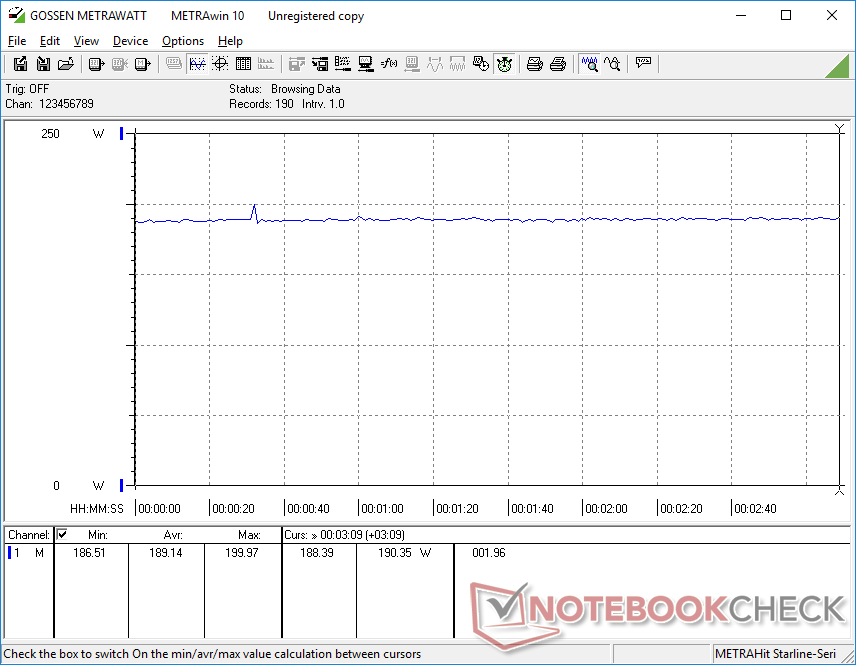
Power Consumption
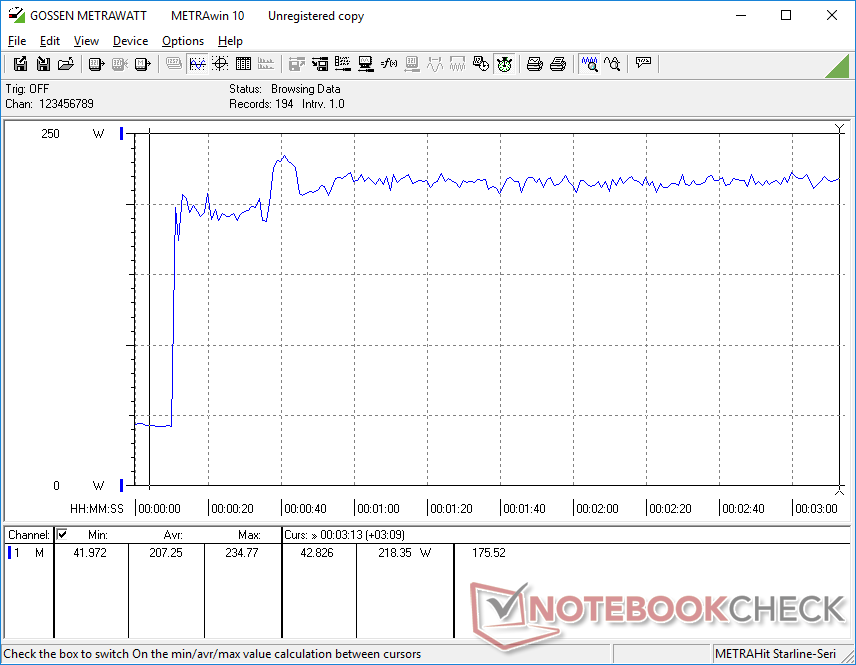
The Blade 17 is generally more power-hungry than the older Blade Pro models including even the Blade Pro RTX 3080 with 4K display. Running Witcher 3, for example, consumes 189 W on our Blade 17 compared to 158 W on the Blade Pro RTX 3080 or Blade Pro RTX 2070. Perhaps not coincidentally, this difference is almost equal to the difference in target TGP levels; the older Blade Pro models would target 100 W TGP while the newer Blade 17 would target 130 W. Unfortunately, the 20 percent increase in power consumption doesn't necessarily mean a 20 percent increase in graphics performance between the older early 2021 Blade Pro and newer Blade 17.
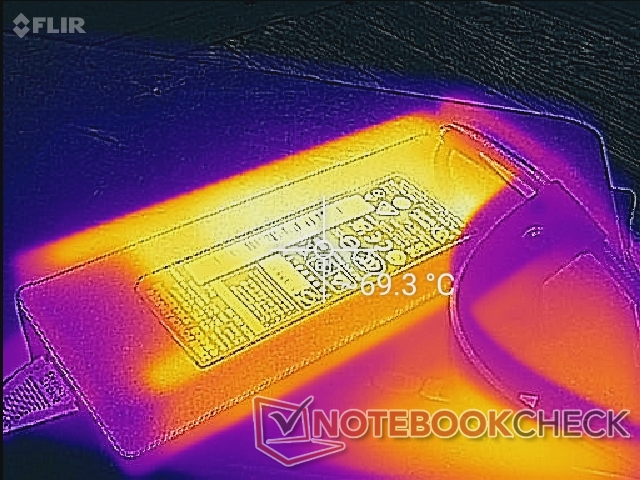
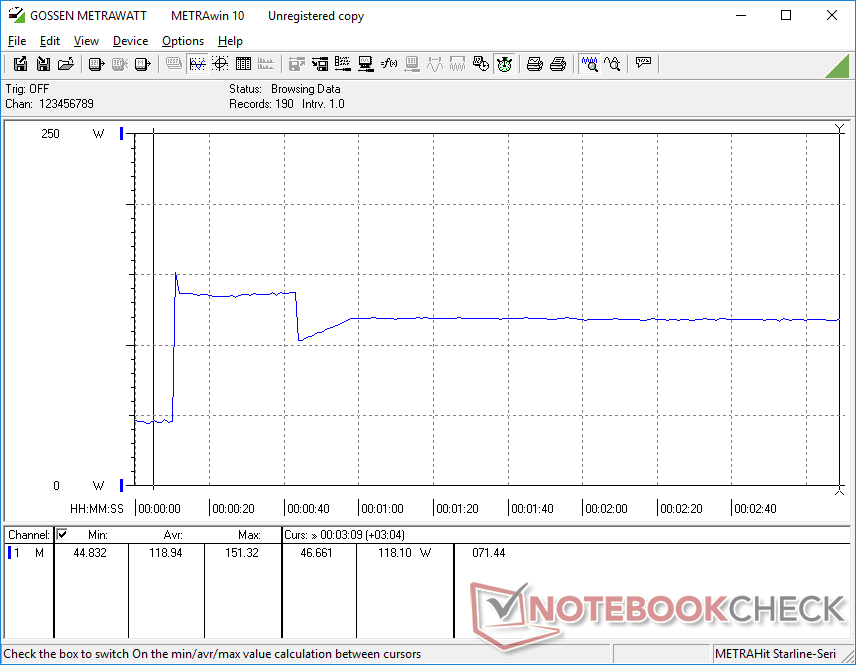
We're able to record a maximum draw of 235 W from the medium-sized (~17 x 7 x 2.5 cm) 230 W AC adapter. The charging rate will slow significantly when running stressful loads as a result.
| Off / Standby | |
| Idle | |
| Load |
|
Key:
min: | |
| Razer Blade 17 RTX 3070 i7-11800H, GeForce RTX 3070 Laptop GPU, Samsung PM9A1 MZVL21T0HCLR, IPS, 1920x1080, 17.3" | Razer Blade Pro 17 2021 (QHD Touch) i7-10875H, GeForce RTX 3080 Laptop GPU, Samsung PM981a MZVLB1T0HBLR, IPS, 3840x2160, 17.3" | Razer Blade Pro 17 RTX 2070 Max-Q 300 Hz i7-10875H, GeForce RTX 2070 Max-Q, Lite-On CA5-8D512, IPS, 1920x1080, 17.3" | Razer Blade Pro 17 4K UHD 120 Hz i7-9750H, GeForce RTX 2080 Max-Q, Samsung SSD PM981 MZVLB1T0HALR, IPS, 3840x2160, 17.3" | Razer Blade Pro 17 RTX 2060 i7-9750H, GeForce RTX 2060 Mobile, Samsung SSD PM981 MZVLB512HAJQ, IPS, 1920x1080, 17.3" | Razer Blade Pro 17 RTX 2080 Max-Q i7-9750H, GeForce RTX 2080 Max-Q, Samsung SSD PM981 MZVLB512HAJQ, IPS, 1920x1080, 17.3" | |
|---|---|---|---|---|---|---|
| Power Consumption | 12% | 8% | -20% | 16% | 17% | |
| Idle Minimum * (Watt) | 20.9 | 15.2 27% | 19.6 6% | 34.2 -64% | 16 23% | 16.2 22% |
| Idle Average * (Watt) | 25.1 | 20.3 19% | 21.7 14% | 37.2 -48% | 21.7 14% | 20.4 19% |
| Idle Maximum * (Watt) | 45 | 37.3 17% | 36.1 20% | 50 -11% | 26.1 42% | 26.1 42% |
| Load Average * (Watt) | 102 | 114.9 -13% | 115.6 -13% | 106.1 -4% | 105.6 -4% | 96.5 5% |
| Witcher 3 ultra * (Watt) | 189 | 158.4 16% | 157 17% | 178.7 5% | 161.8 14% | 182.9 3% |
| Load Maximum * (Watt) | 234.8 | 223.7 5% | 219.9 6% | 223.6 5% | 225.3 4% | 214.3 9% |
* ... smaller is better
Power Consumption Witcher 3 / Stresstest
Battery Life — Not Bad for a 17.3-inch Gaming Machine
Battery capacity remains the same as on the Blade Pro and so runtimes are also mostly unchanged despite the higher native refresh rate. We're able to squeeze just over 5 hours of WLAN use on the Balanced profile with Optimus active.
Charging from empty to full takes about 1.5 hours with the included AC adapter. Charging via USB-C like with the Razer USB-C GaN charger will take longer.
| Razer Blade 17 RTX 3070 i7-11800H, GeForce RTX 3070 Laptop GPU, 70 Wh | Asus ROG Zephyrus S17 GX703HSD i9-11900H, GeForce RTX 3080 Laptop GPU, 90 Wh | MSI GS76 Stealth 11UH i9-11900H, GeForce RTX 3080 Laptop GPU, 99.9 Wh | Acer Nitro 5 AN517-41-R9S5 R7 5800H, GeForce RTX 3080 Laptop GPU, 57.5 Wh | Gigabyte Aero 17 HDR YD i9-11980HK, GeForce RTX 3080 Laptop GPU, 99 Wh | Maingear Vector Pro MG-VCP17 i7-11800H, GeForce RTX 3080 Laptop GPU, 91 Wh | |
|---|---|---|---|---|---|---|
| Battery runtime | 62% | 19% | 10% | -6% | 33% | |
| Reader / Idle (h) | 6.7 | 9.9 48% | ||||
| WiFi v1.3 (h) | 5.2 | 7.5 44% | 6.4 23% | 5.7 10% | 5.6 8% | 6.9 33% |
| Load (h) | 1.5 | 2.7 80% | 1.3 -13% | 1.2 -20% | ||
| Witcher 3 ultra (h) | 1 |
Pros
Cons
Verdict — Huge CPU Boost with Minor GPU Gains
While the update to 130 W graphics may sound like a huge boost over 100 W on paper, real-world performance levels are only marginally better since we're still working within the same Ampere family of Nvidia GPUs. In this case, our 130 W RTX 3070 is essentially on par with the 100 W RTX 3080 on the Comet Lake-H Blade Pro. We're able to squeeze out a constant ~115 W GPU board draw on manual Turbo mode versus only ~95 W when on the default balanced mode meaning users must remember to activate Turbo mode and endure maximum fan noise if they wish to exploit the system to its fullest.
The biggest gain lies in processor performance instead where the jump from 10th gen to 11th gen Intel is much more impressive especially since the Core i7-10875H in the 2020 Blade Pro was slightly underperforming. The CPU update naturally brings PCIe4 and Thunderbolt 4 support which further future-proofs the system.
After two years of continuous updates, the 17.3-inch Blade now feels more refined than ever to be an easier recommendation than its initial 2019 launch.
As sleek as the 2019 chassis may be, it could use some actual physical updates beyond simply performance. Dell just launched the Alienware x17 with Cherry mechanical keys that make the Blade 17 keys feel economic in comparison. The lack of a webcam shutter is becoming more difficult to ignore as well and the two high-pitched fans underneath the clickpad should be addressed without impacting airflow.
Price and availability
Multiple Blade 17 SKUs are now available at Best Buy for $2499 USD and up. Other retailers like Amazon have yet to make them available at the time of writing. Keep in mind that the latest model is simply "Blade 17" and not "Blade Pro 17" which would be the name of the older model.
Razer Blade 17 RTX 3070
- 09/21/2021 v7 (old)
Allen Ngo
Price comparison
