AMD Ryzen 9 6900HX debut: Razer Blade 14 laptop review
Now almost a year old, the 2021 Blade 14 could be released today and it would still top most if not all 14-inch laptops currently available. Its AMD Zen 3 Ryzen 9 5900HX CPU and GeForce RTX 3070/3080 graphics are no slouch in the laptop gaming space, but this year's update ups the ante even further with the newer Zen 3+ Ryzen 6900HX CPU, faster RAM, and both GeForce RTX 3070 Ti and 3080 Ti graphics options.
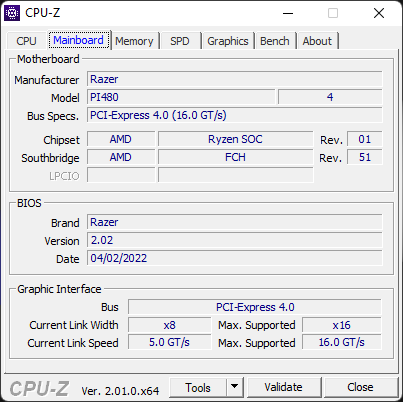
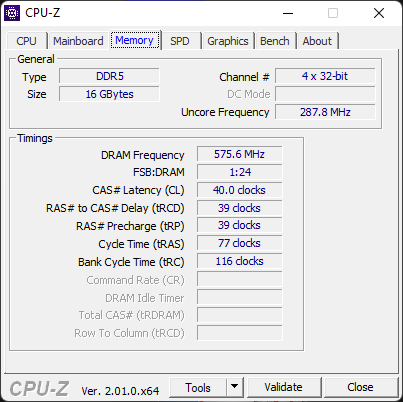
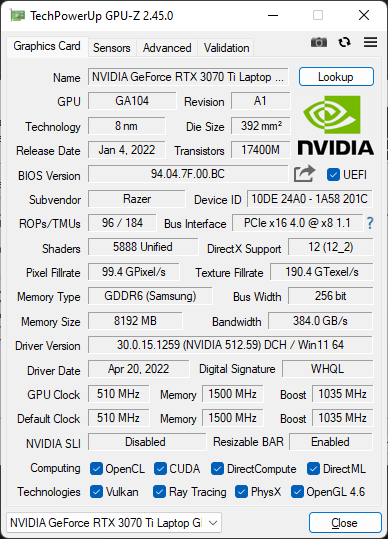
Configurations start at $2000 USD with the GeForce RTX 3060 and 144 Hz FHD display up to $3500 USD with the RTX 3080 Ti and 165 Hz QHD display. All SKUs otherwise ship with the same Ryzen 9 6900HX CPU, 100 W TGP target, 16 GB of DDR5-4800 soldered RAM, and 1 TB PCIe4 x4 NVMe SSD. Our unit in review is the middle option with the RTX 3070 Ti and 165 Hz QHD display for about $2700 retail.
The direct competitor to the Blade 14 is the Asus Zephyrus G14 series. Since there are so few 14-inch gaming laptops, however, we'll also be comparing the Blade 14 with more traditionally-sized 15.6-inch or larger models as well like the MSI Stealth GS66 or Lenovo Legion C7.
More Razer reviews:
Potential Competitors in Comparison
Rating | Date | Model | Weight | Height | Size | Resolution | Price |
|---|---|---|---|---|---|---|---|
| 89.4 % v7 (old) | 05 / 2022 | Razer Blade 14 Ryzen 9 6900HX R9 6900HX, GeForce RTX 3070 Ti Laptop GPU | 1.8 kg | 16.8 mm | 14.00" | 2560x1440 | |
| 87.5 % v7 (old) | 06 / 2021 | Razer Blade 14 Ryzen 9 RTX 3070 R9 5900HX, GeForce RTX 3070 Laptop GPU | 1.8 kg | 16.8 mm | 14.00" | 2560x1440 | |
| 91.2 % v7 (old) | 03 / 2022 | Razer Blade 17 RTX 3080 Ti i7-12800H, GeForce RTX 3080 Ti Laptop GPU | 2.7 kg | 19.9 mm | 17.30" | 2560x1440 | |
| 86.7 % v7 (old) | 03 / 2022 | Asus ROG Zephyrus G14 GA402RK R9 6900HS, Radeon RX 6800S | 1.7 kg | 19.5 mm | 14.00" | 2560x1600 | |
| 84.5 % v7 (old) | 02 / 2022 | MSI Stealth GS66 12UGS i7-12700H, GeForce RTX 3070 Ti Laptop GPU | 2.2 kg | 19.8 mm | 15.60" | 2560x1440 | |
| 86.6 % v7 (old) | 02 / 2021 | Asus ROG Zephyrus Duo 15 SE GX551QS R9 5900HX, GeForce RTX 3080 Laptop GPU | 2.5 kg | 20.9 mm | 15.60" | 3840x2160 |
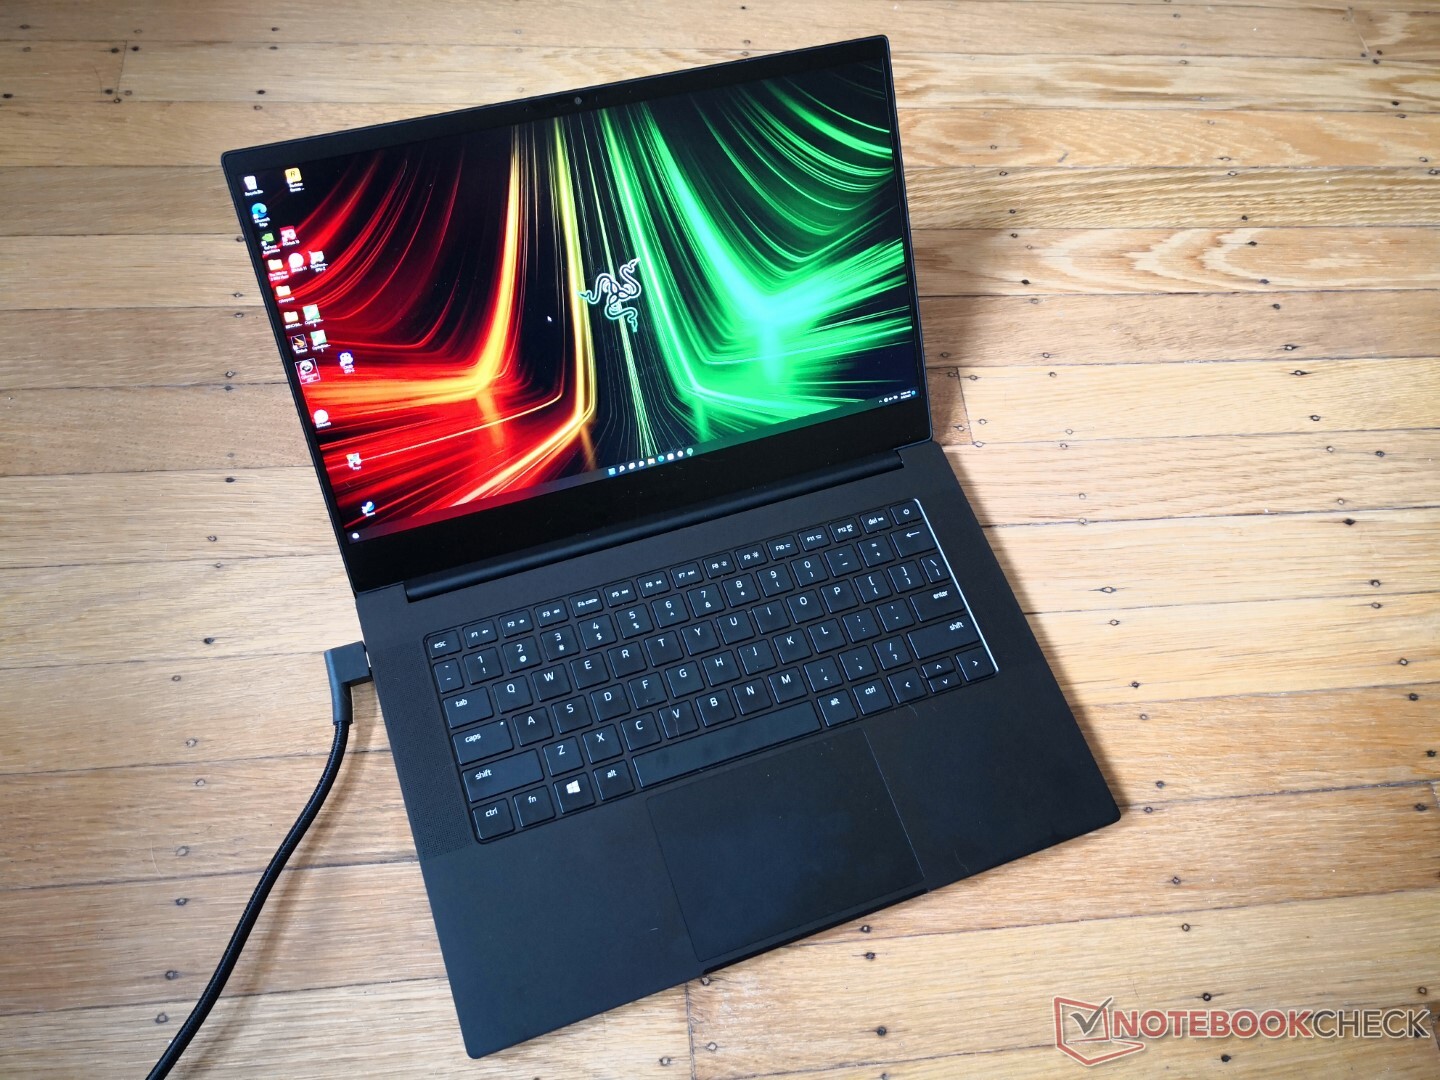
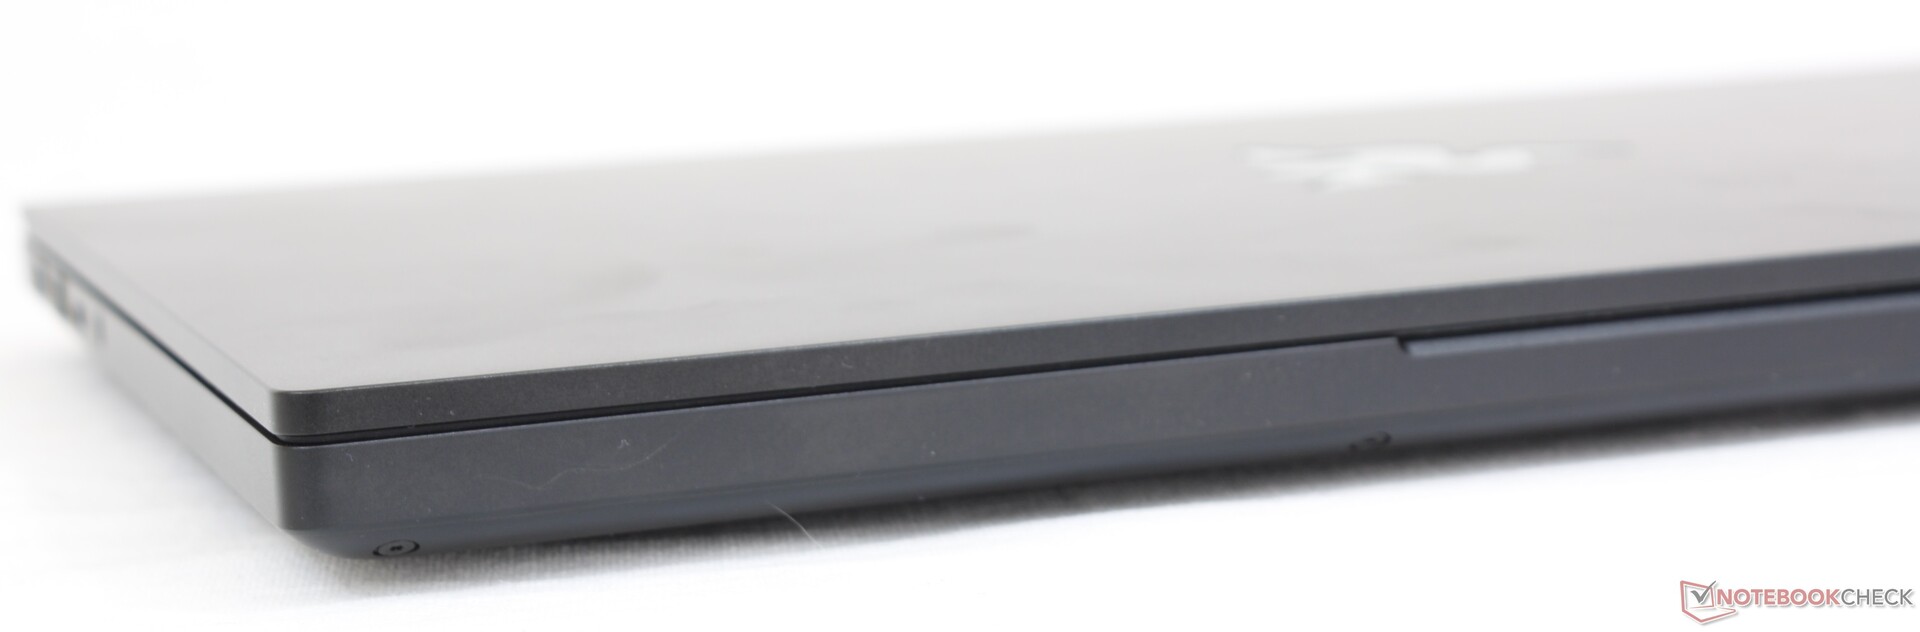
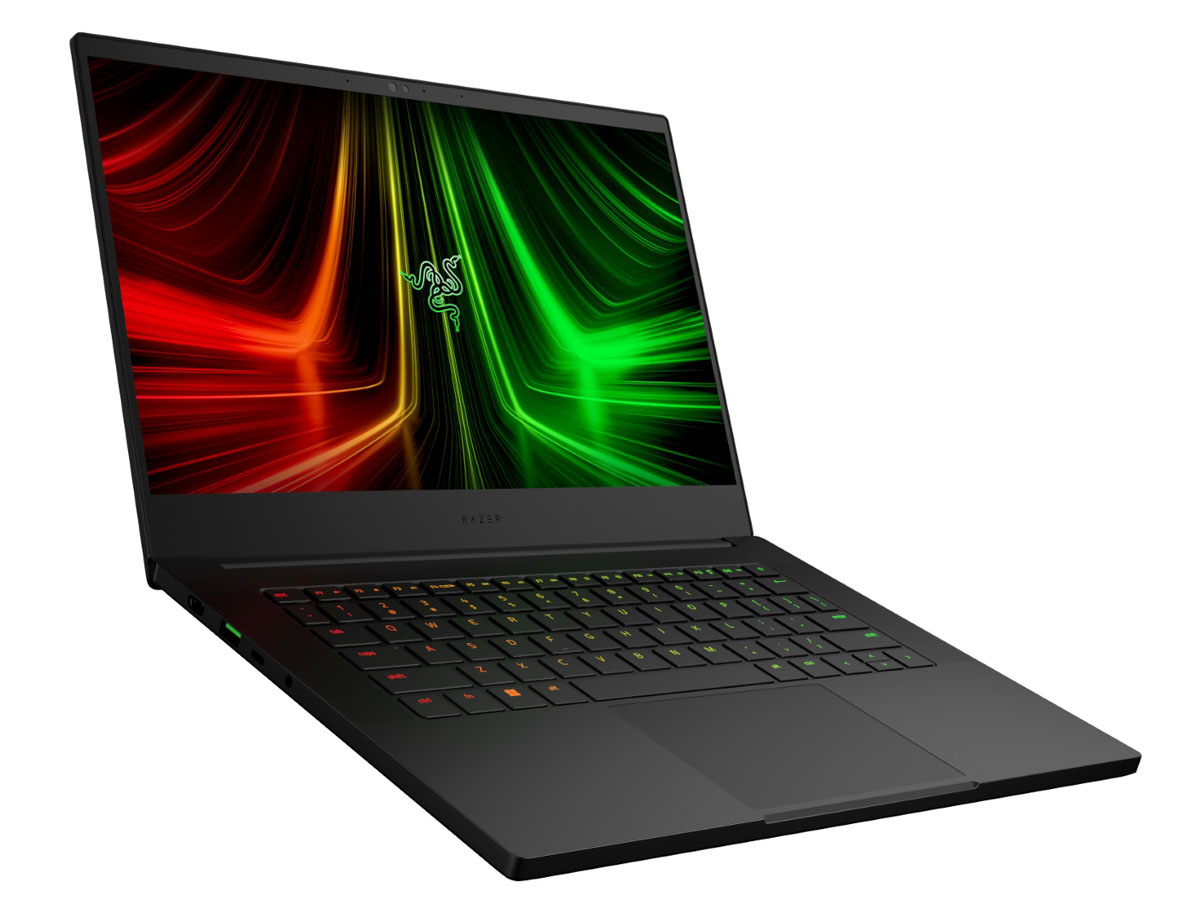
Case — Classic Razer In A Smaller Size
The chassis remains identical to last year's version since the 2022 version is an internal performance update only. The year-old design still feels fresh, however, especially since competition remains sparse in the 14-inch gaming space. It remains thinner than the Zephyrus G14 by a noticeable margin while weighing about the same for a denser feel. Of course, Razer users will be giving up on the unique AniMe Matrix LED features of the Asus for that slimmer and smoother unibody build.
Some basics that we've come to expect from high-end Ultrabooks like a fingerprint reader or webcam shutter continue to be missing.
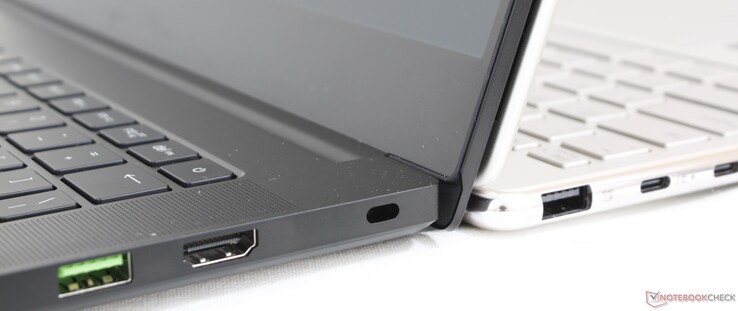
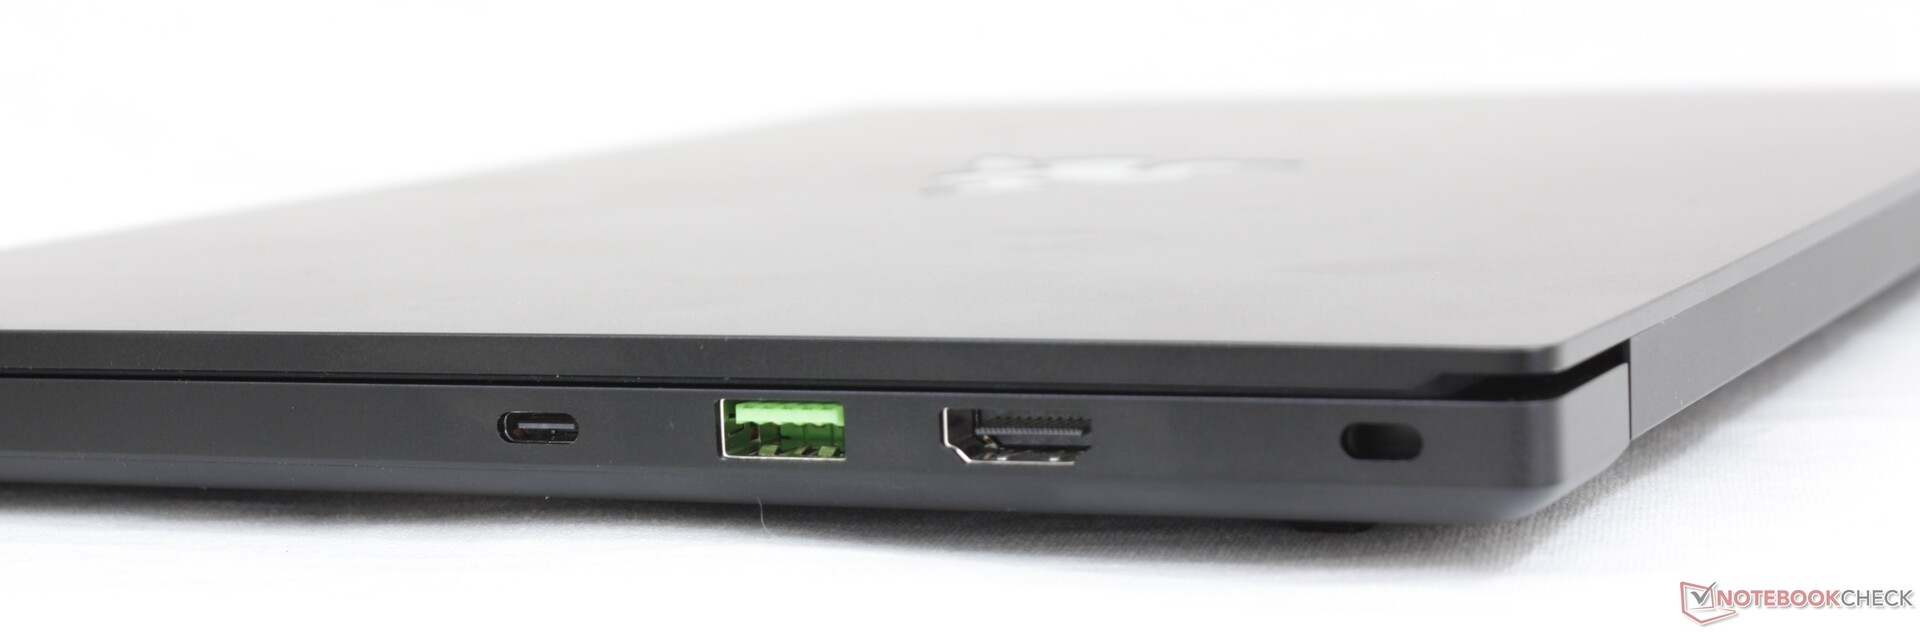
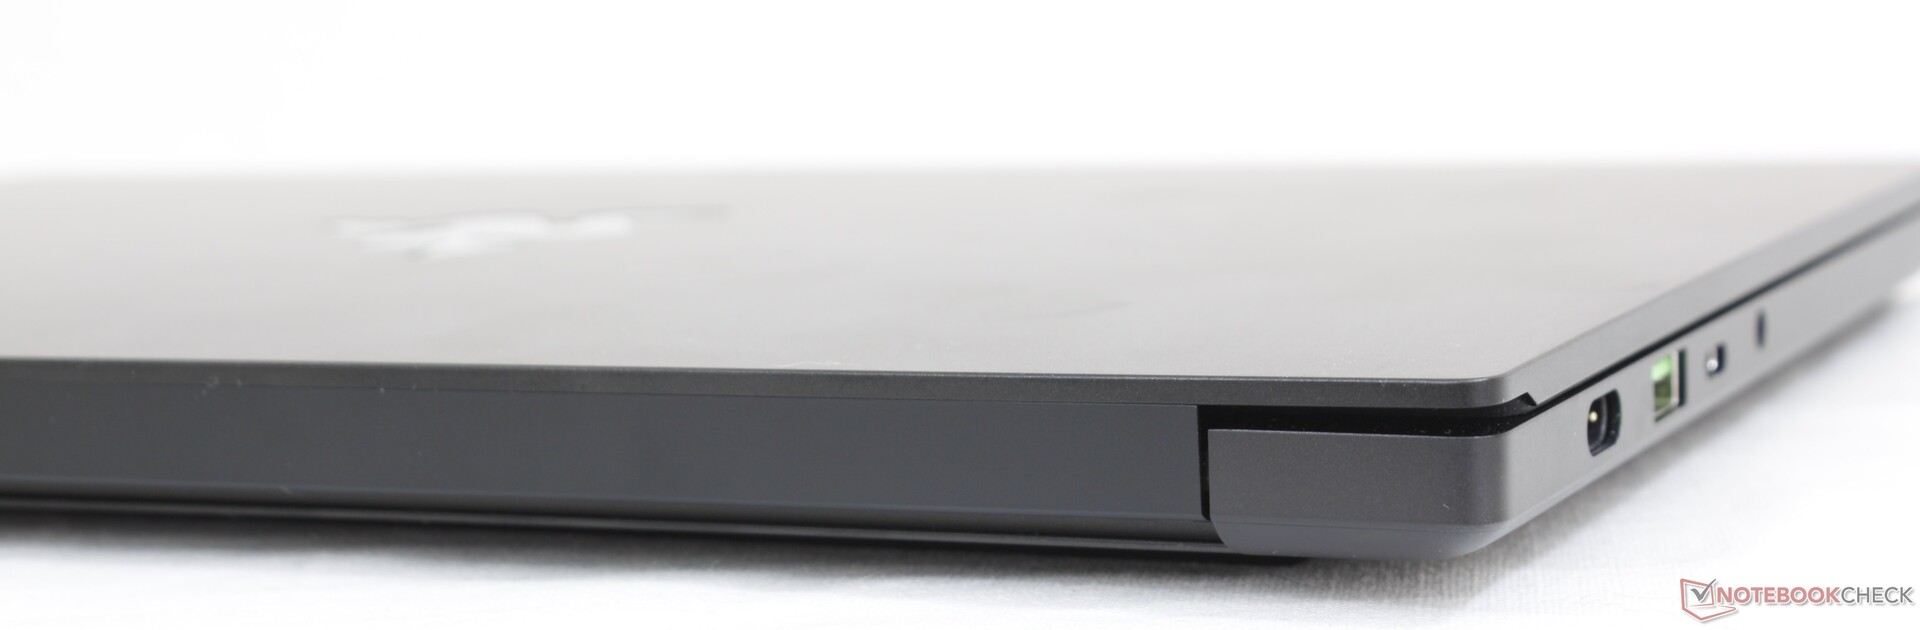
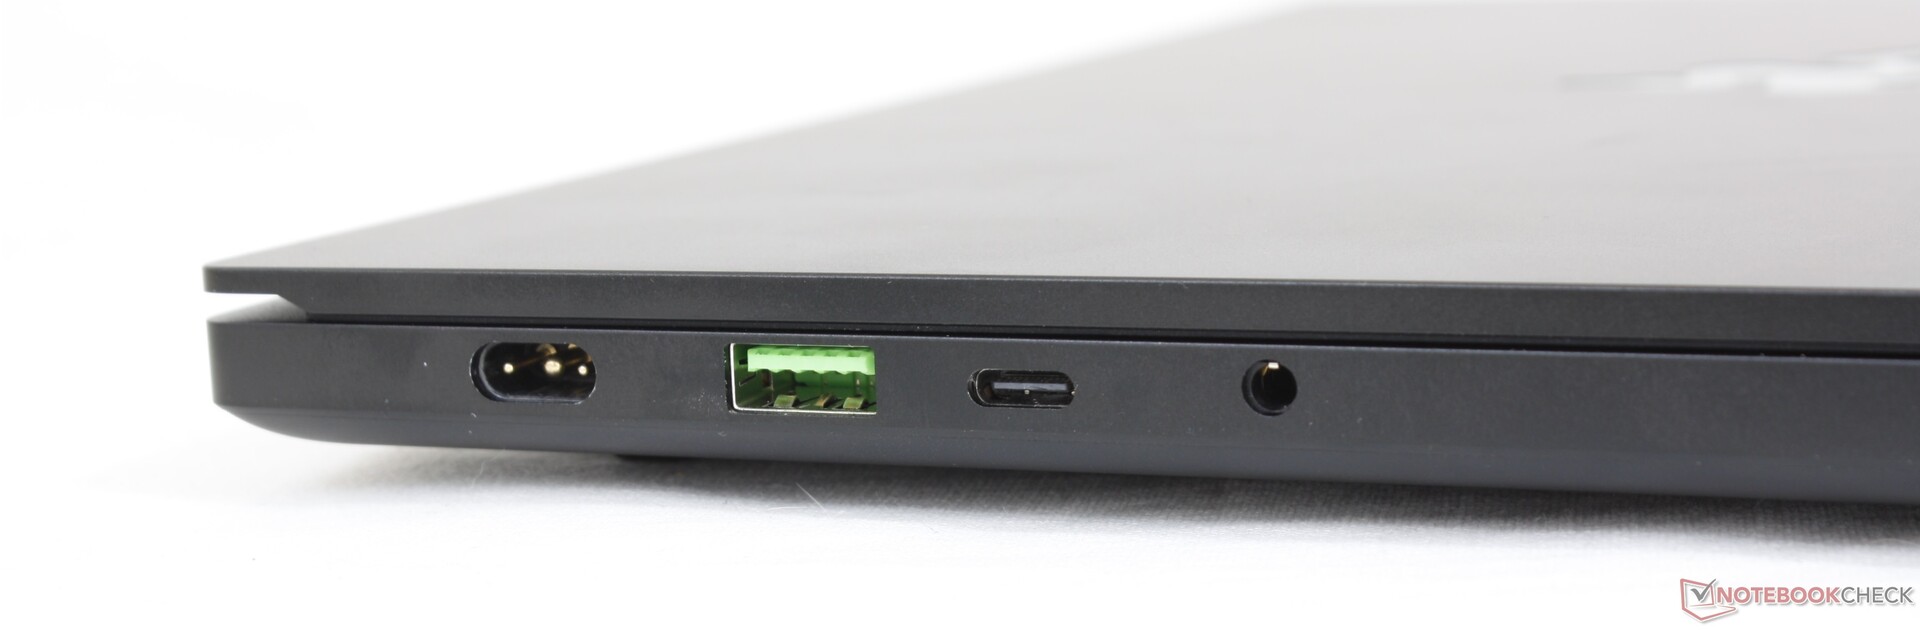
Connectivity — No Thunderbolt or Razer Core Compatibility
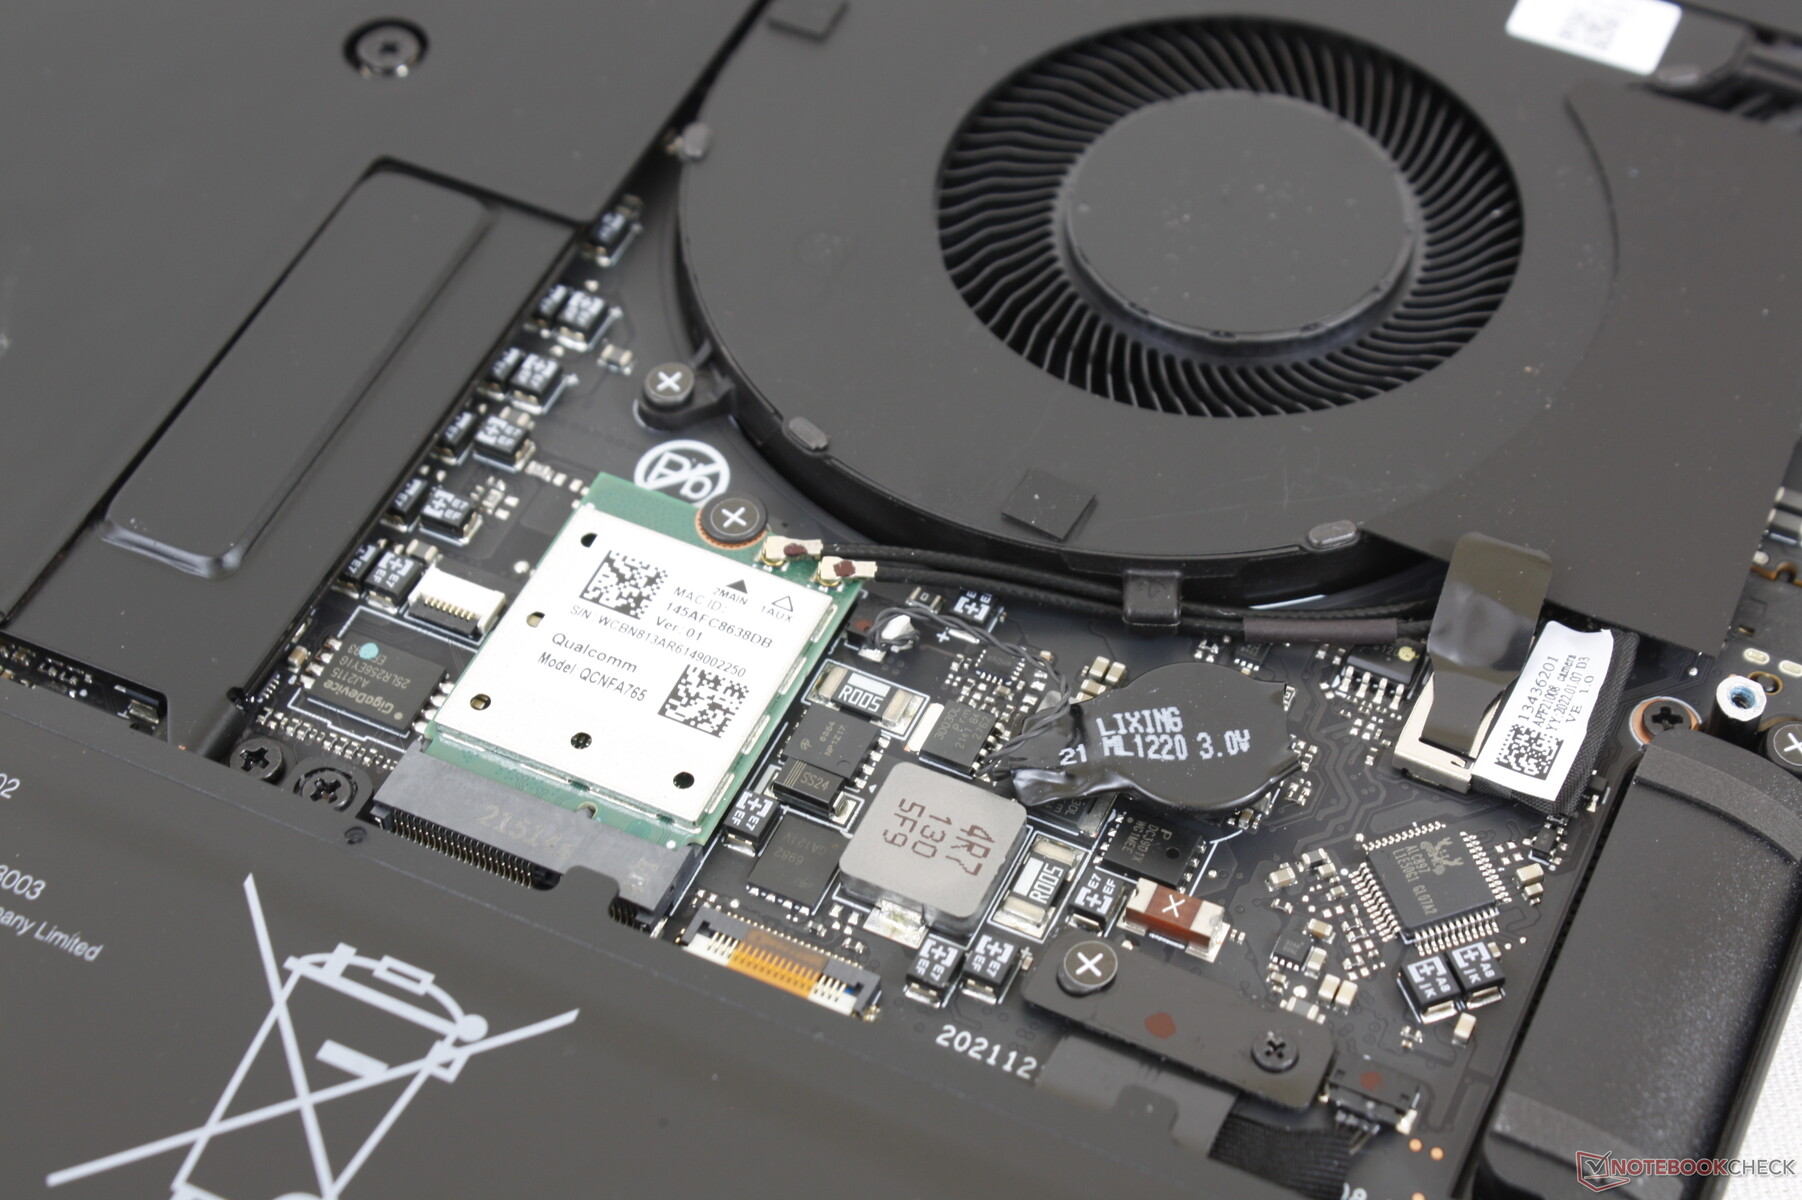
Communication
Wireless has been swapped from the Killer AX1690i to the Qualcomm WCN685x. Both are capable of Wi-Fi 6E speeds, however, and so the change is more of a sideways step than a full-on upgrade.
Webcam
The camera has been upgraded from 720p on last year's model to 1080p on this year's refresh for a sharper picture.


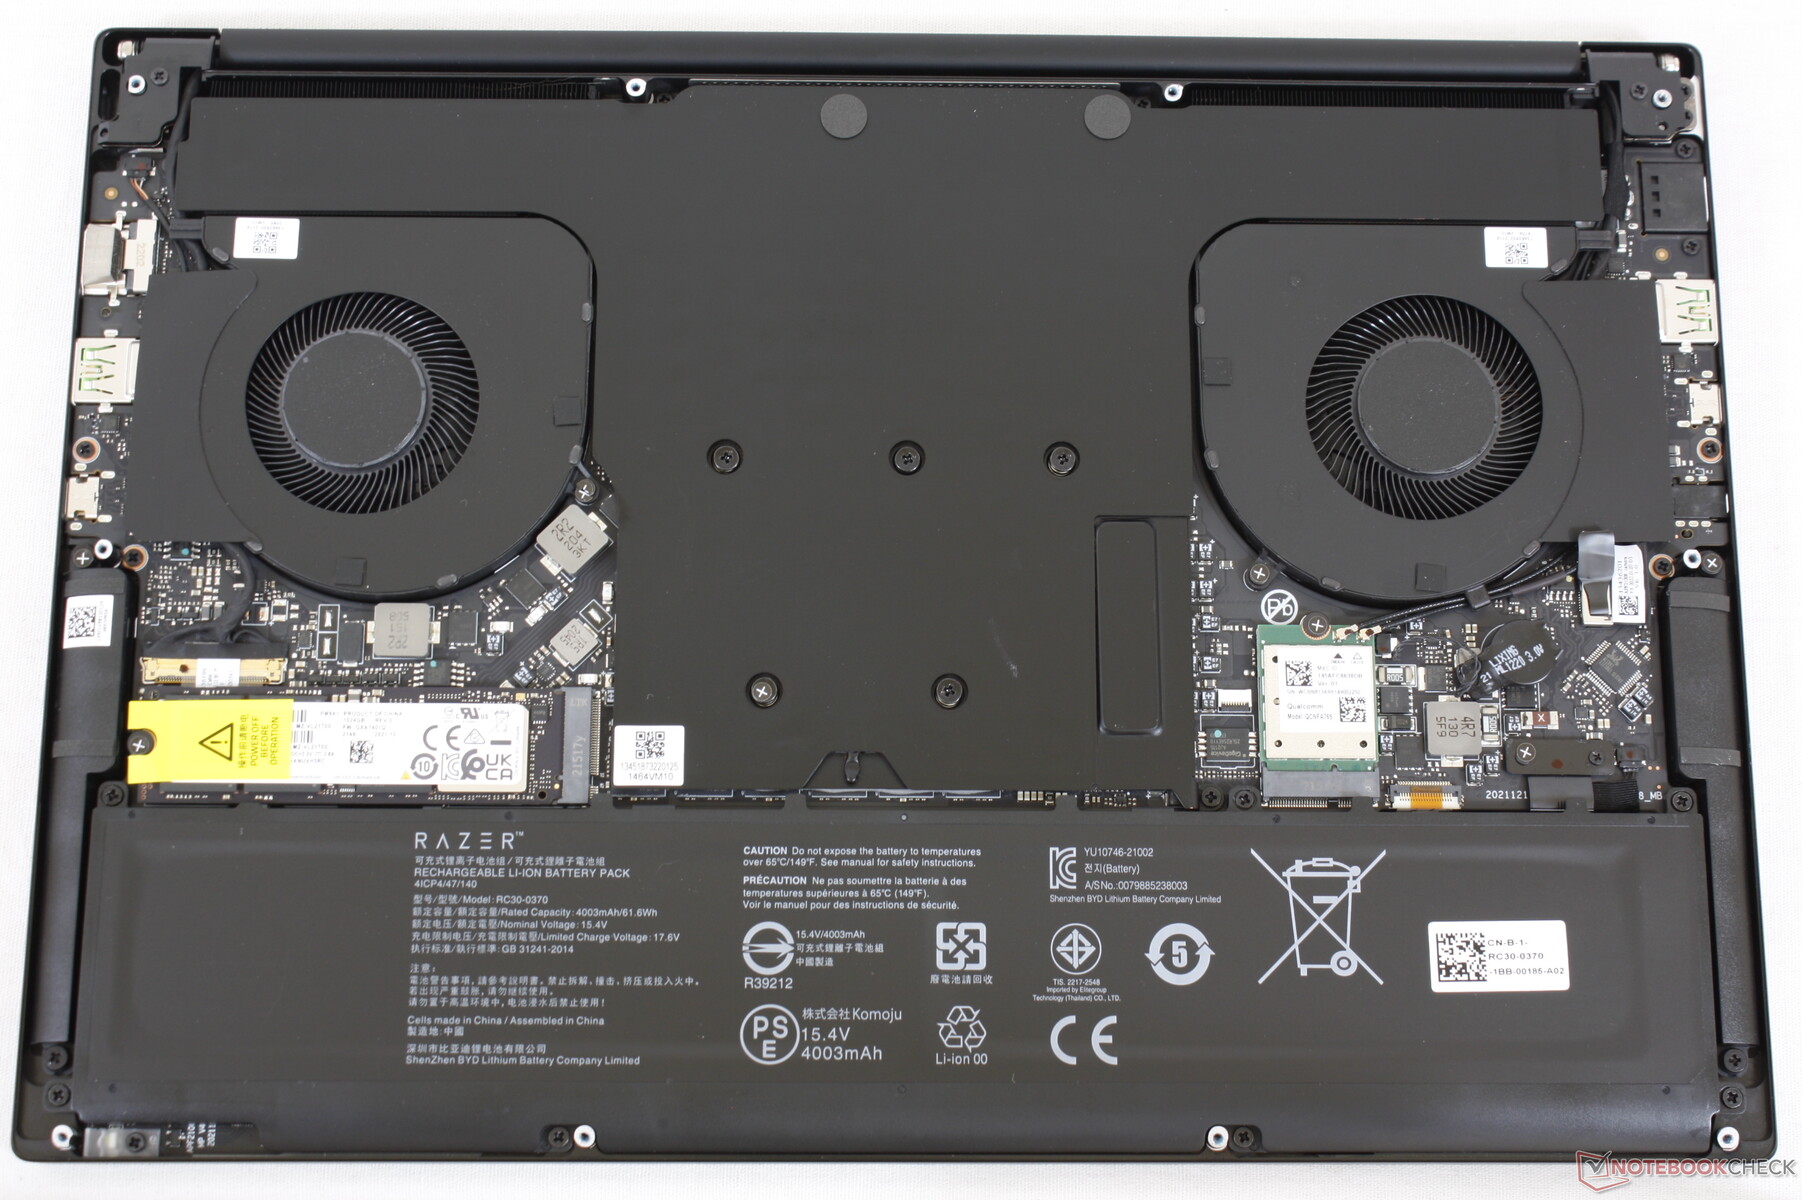
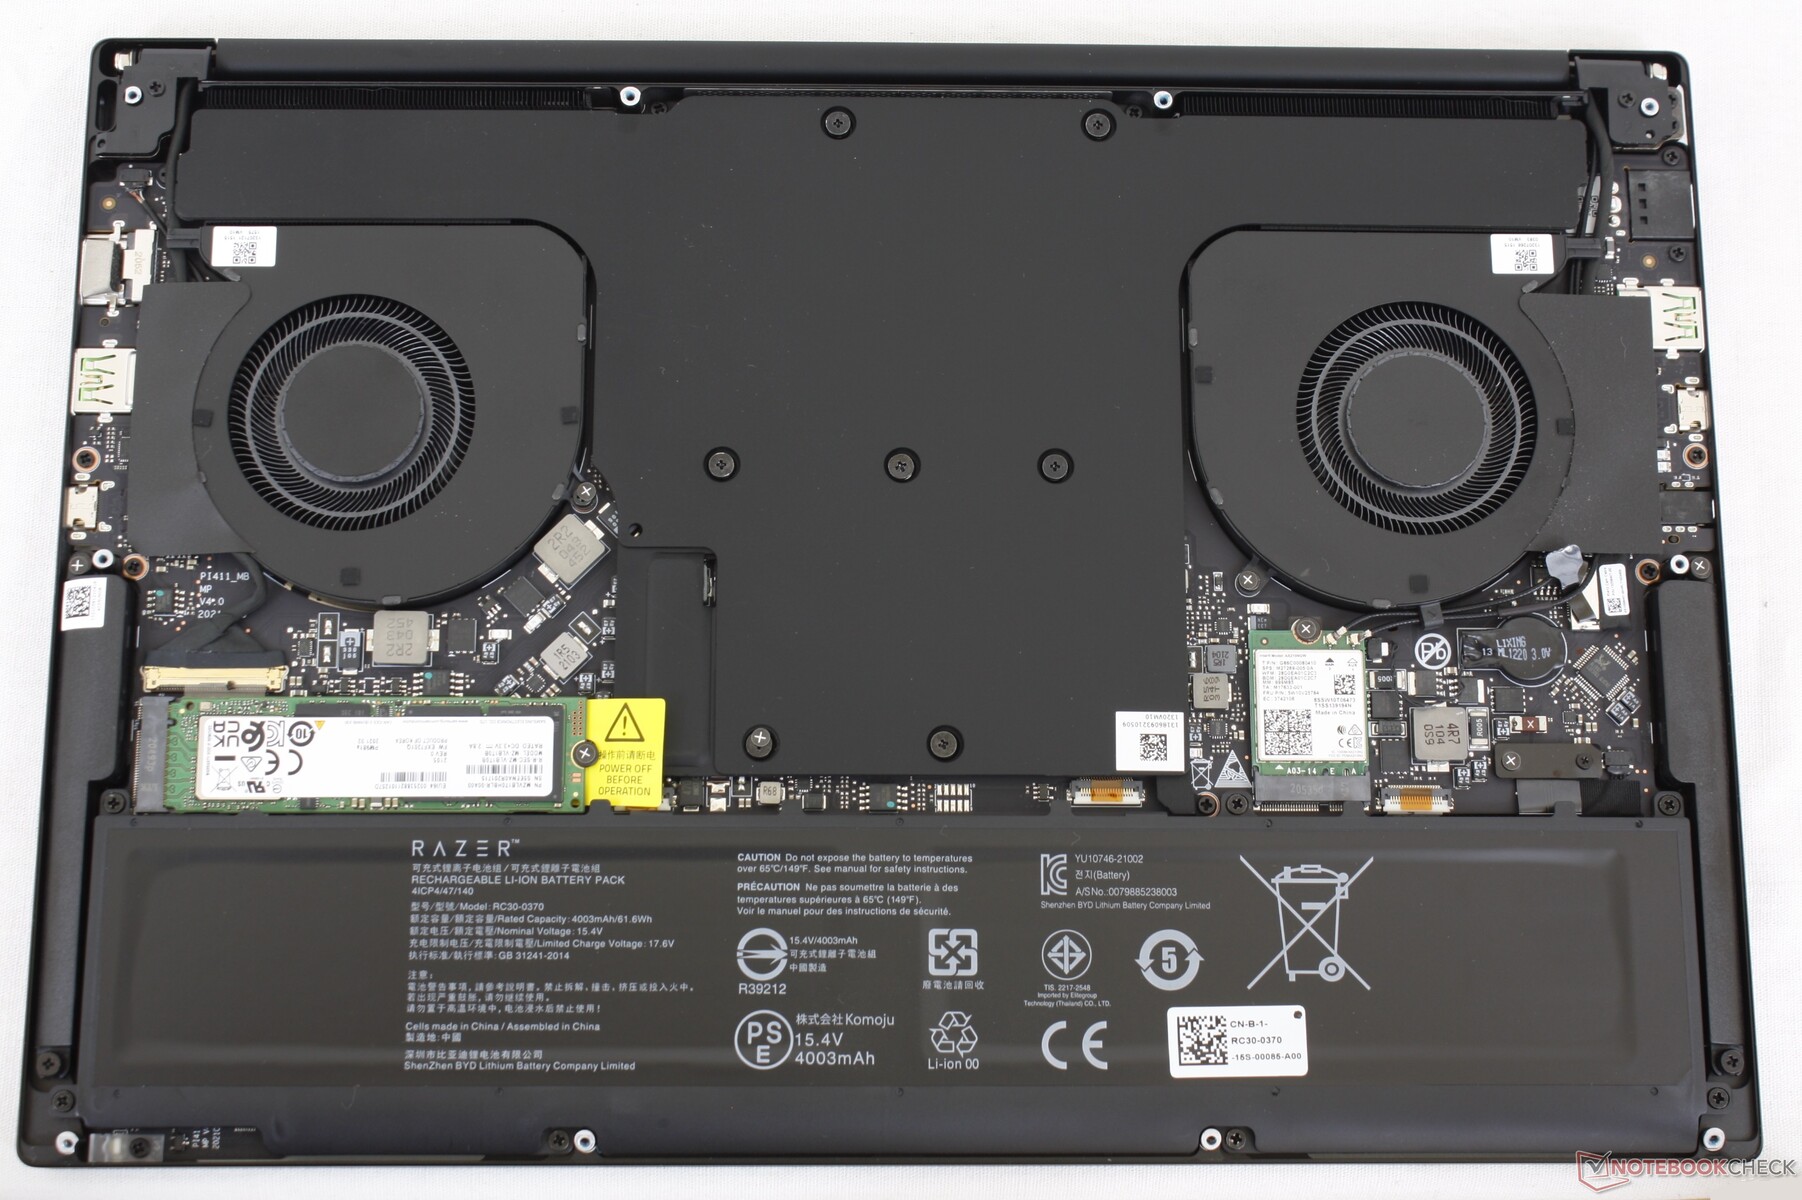
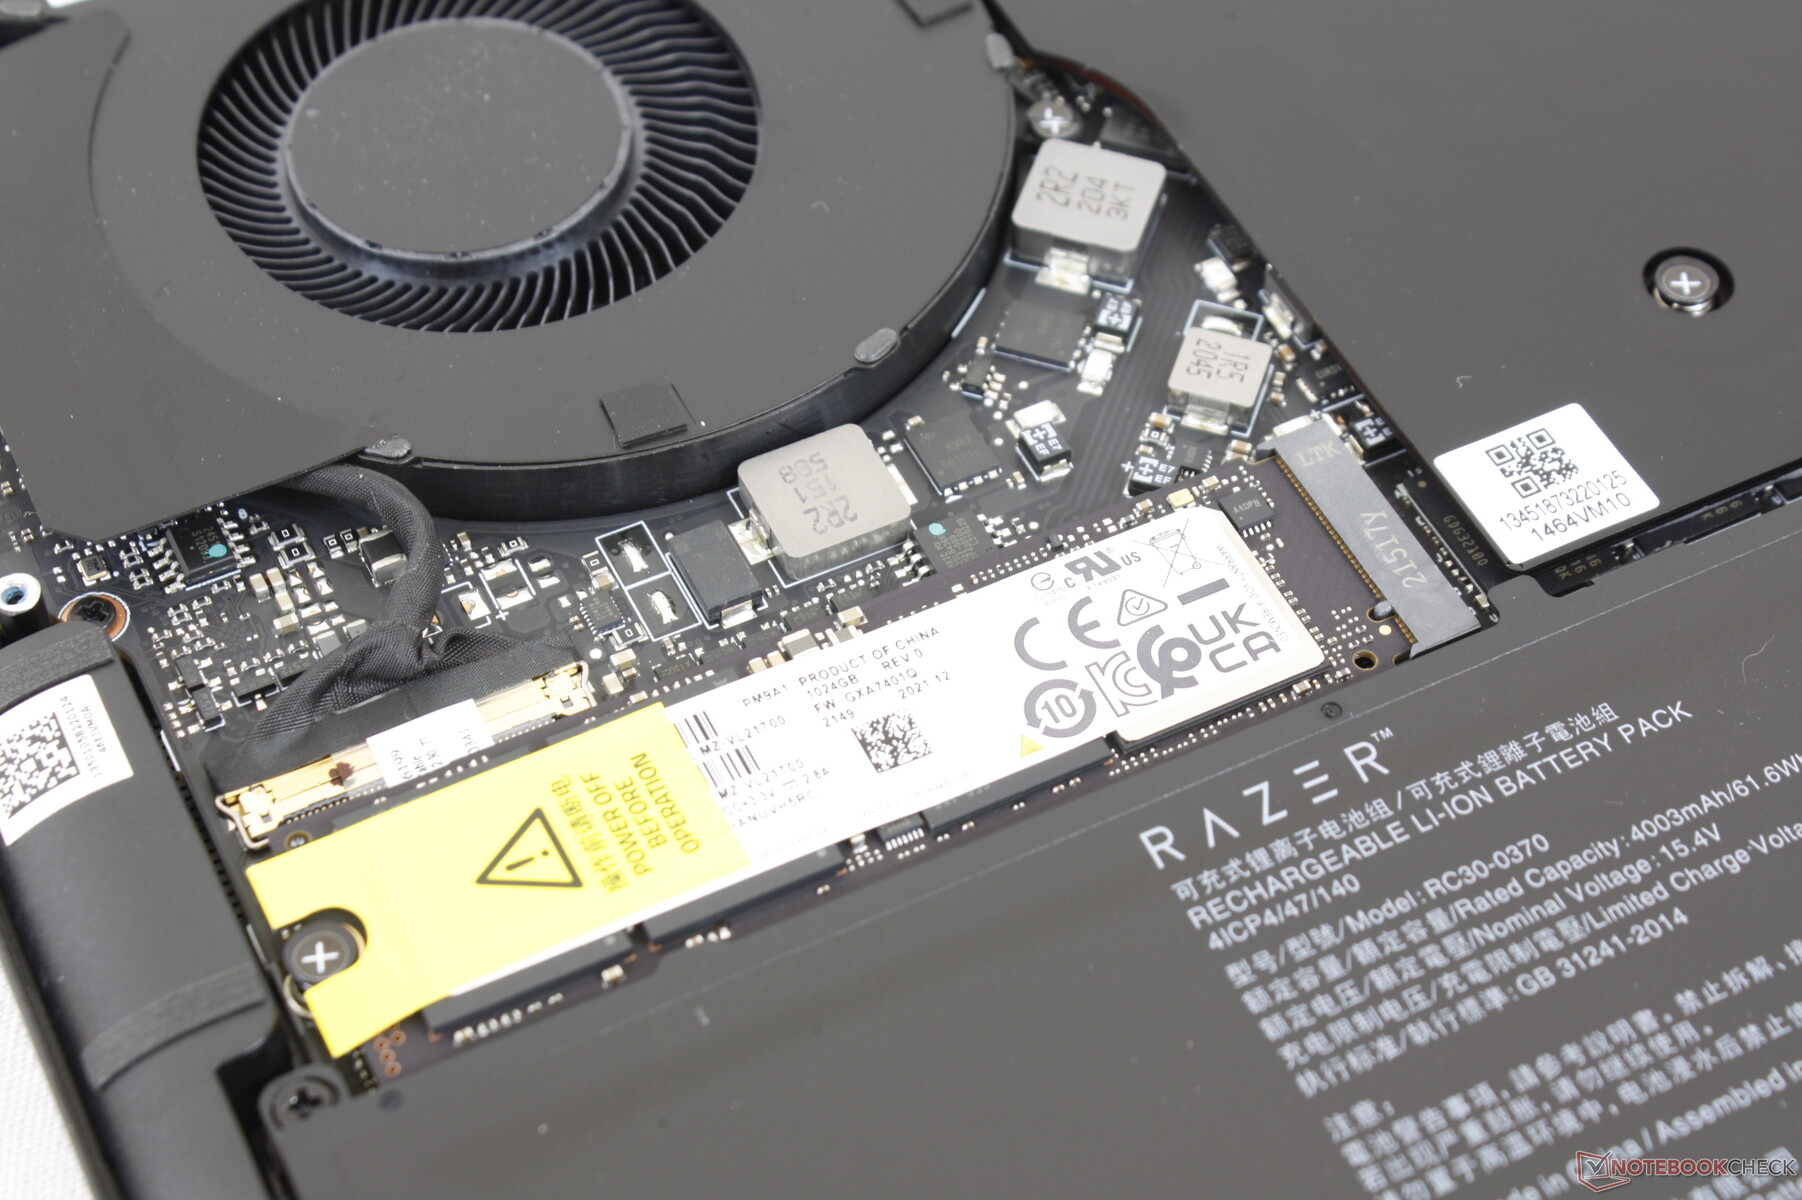
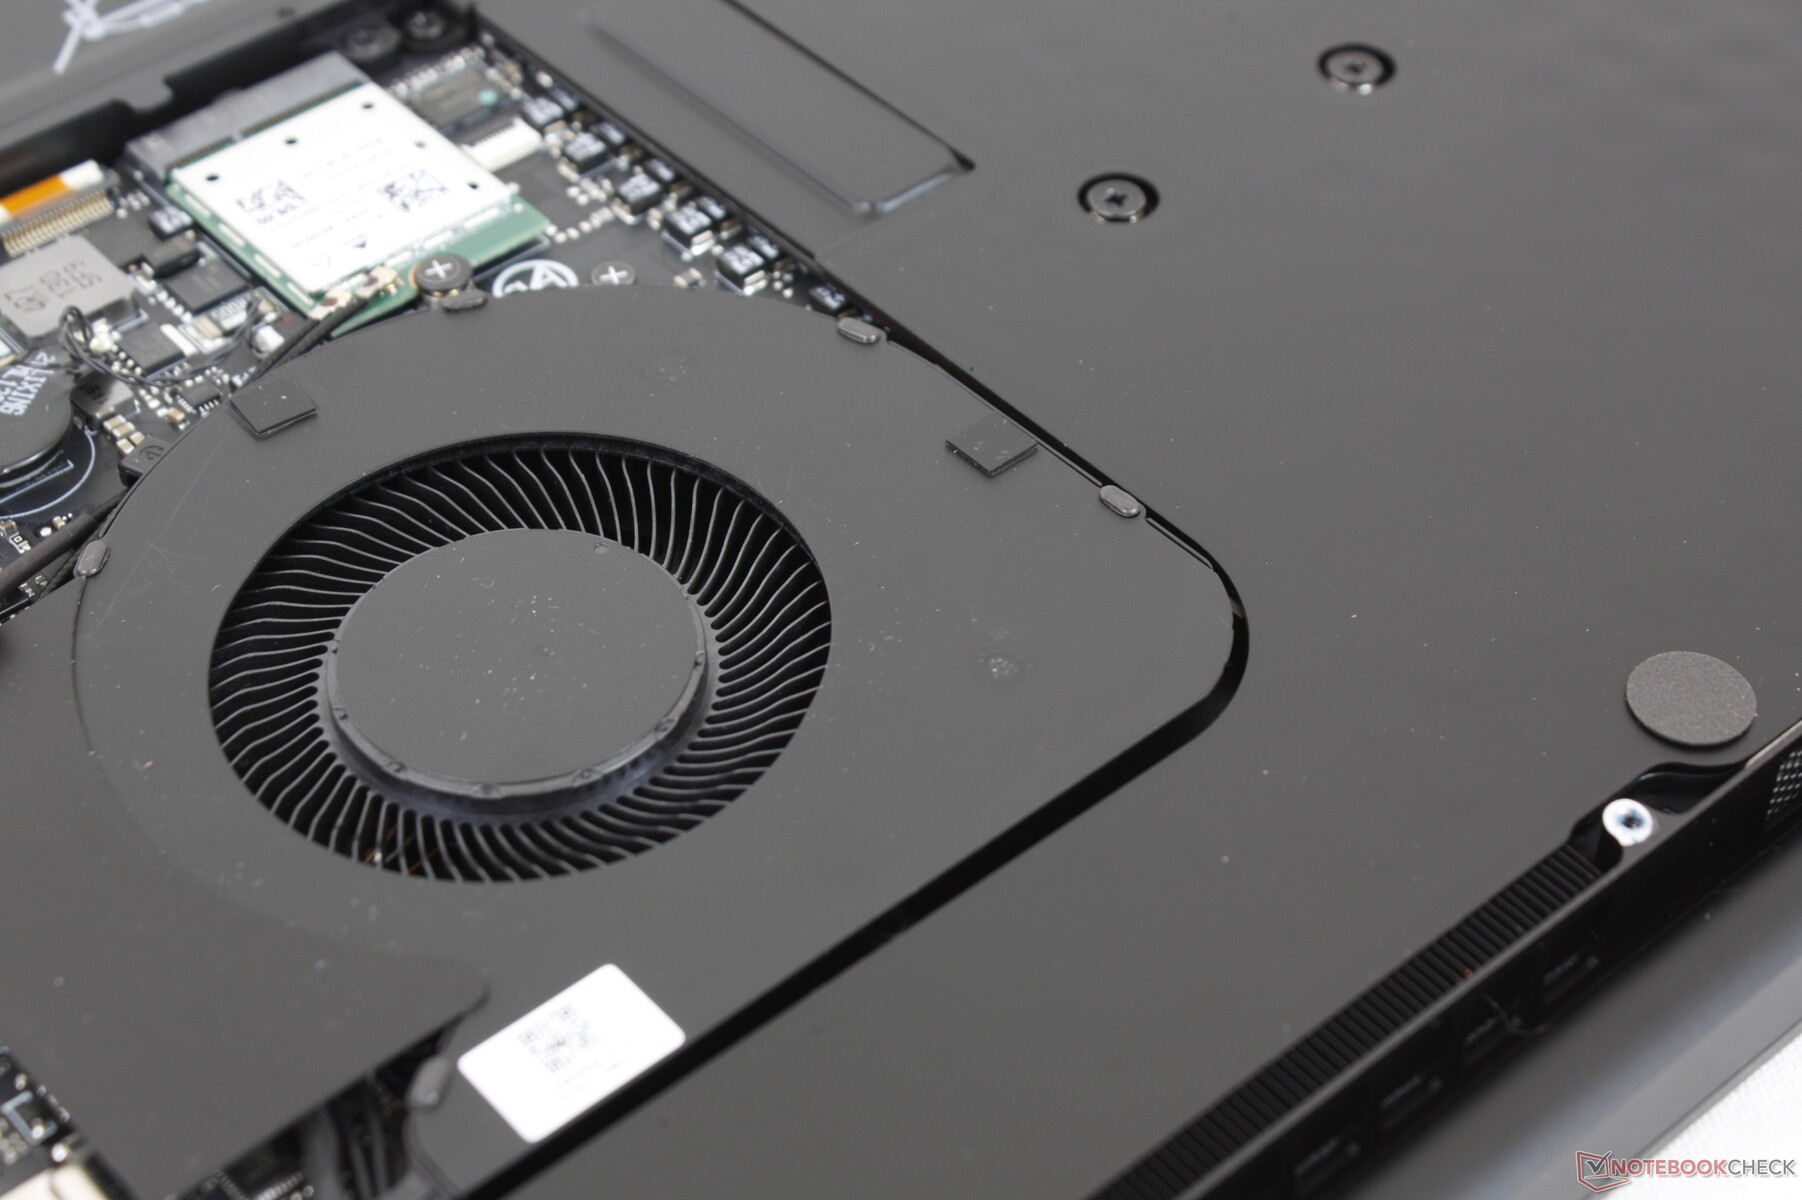
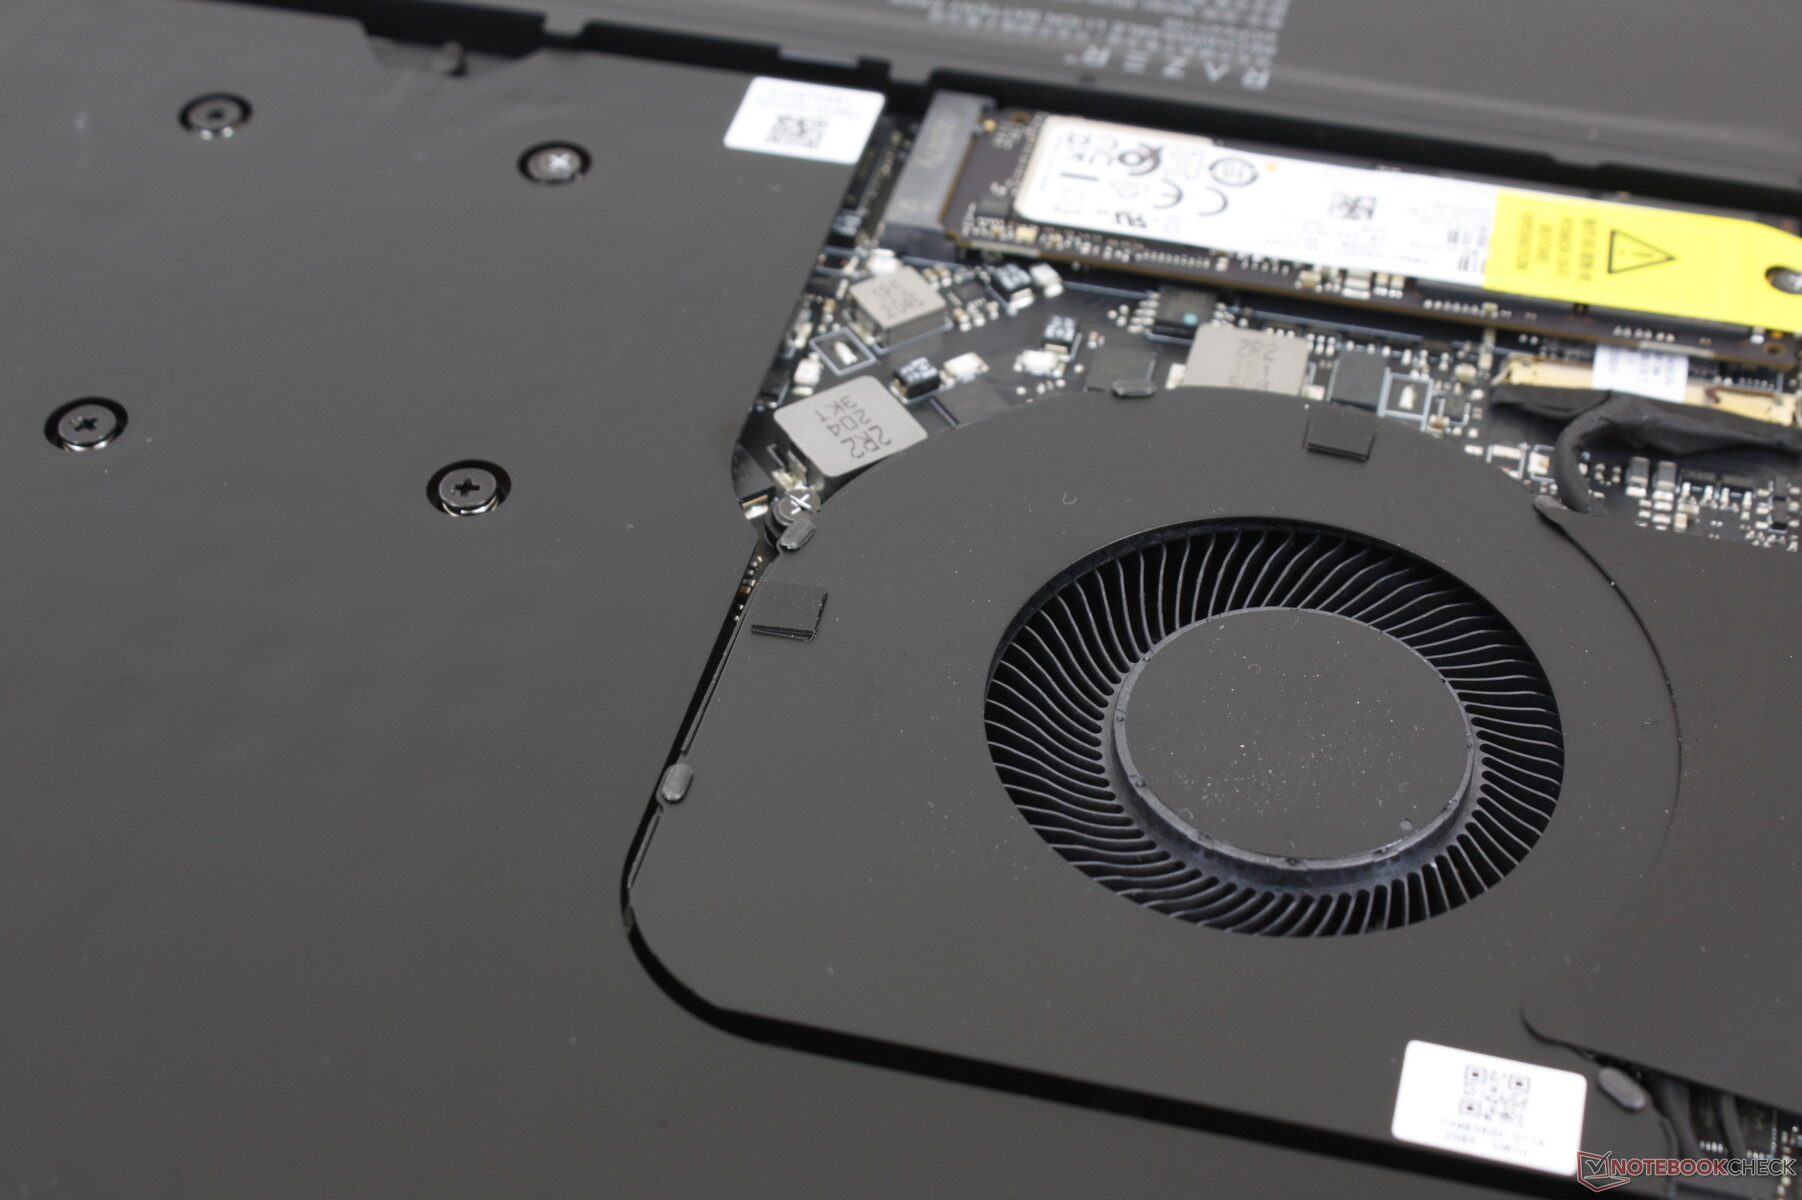
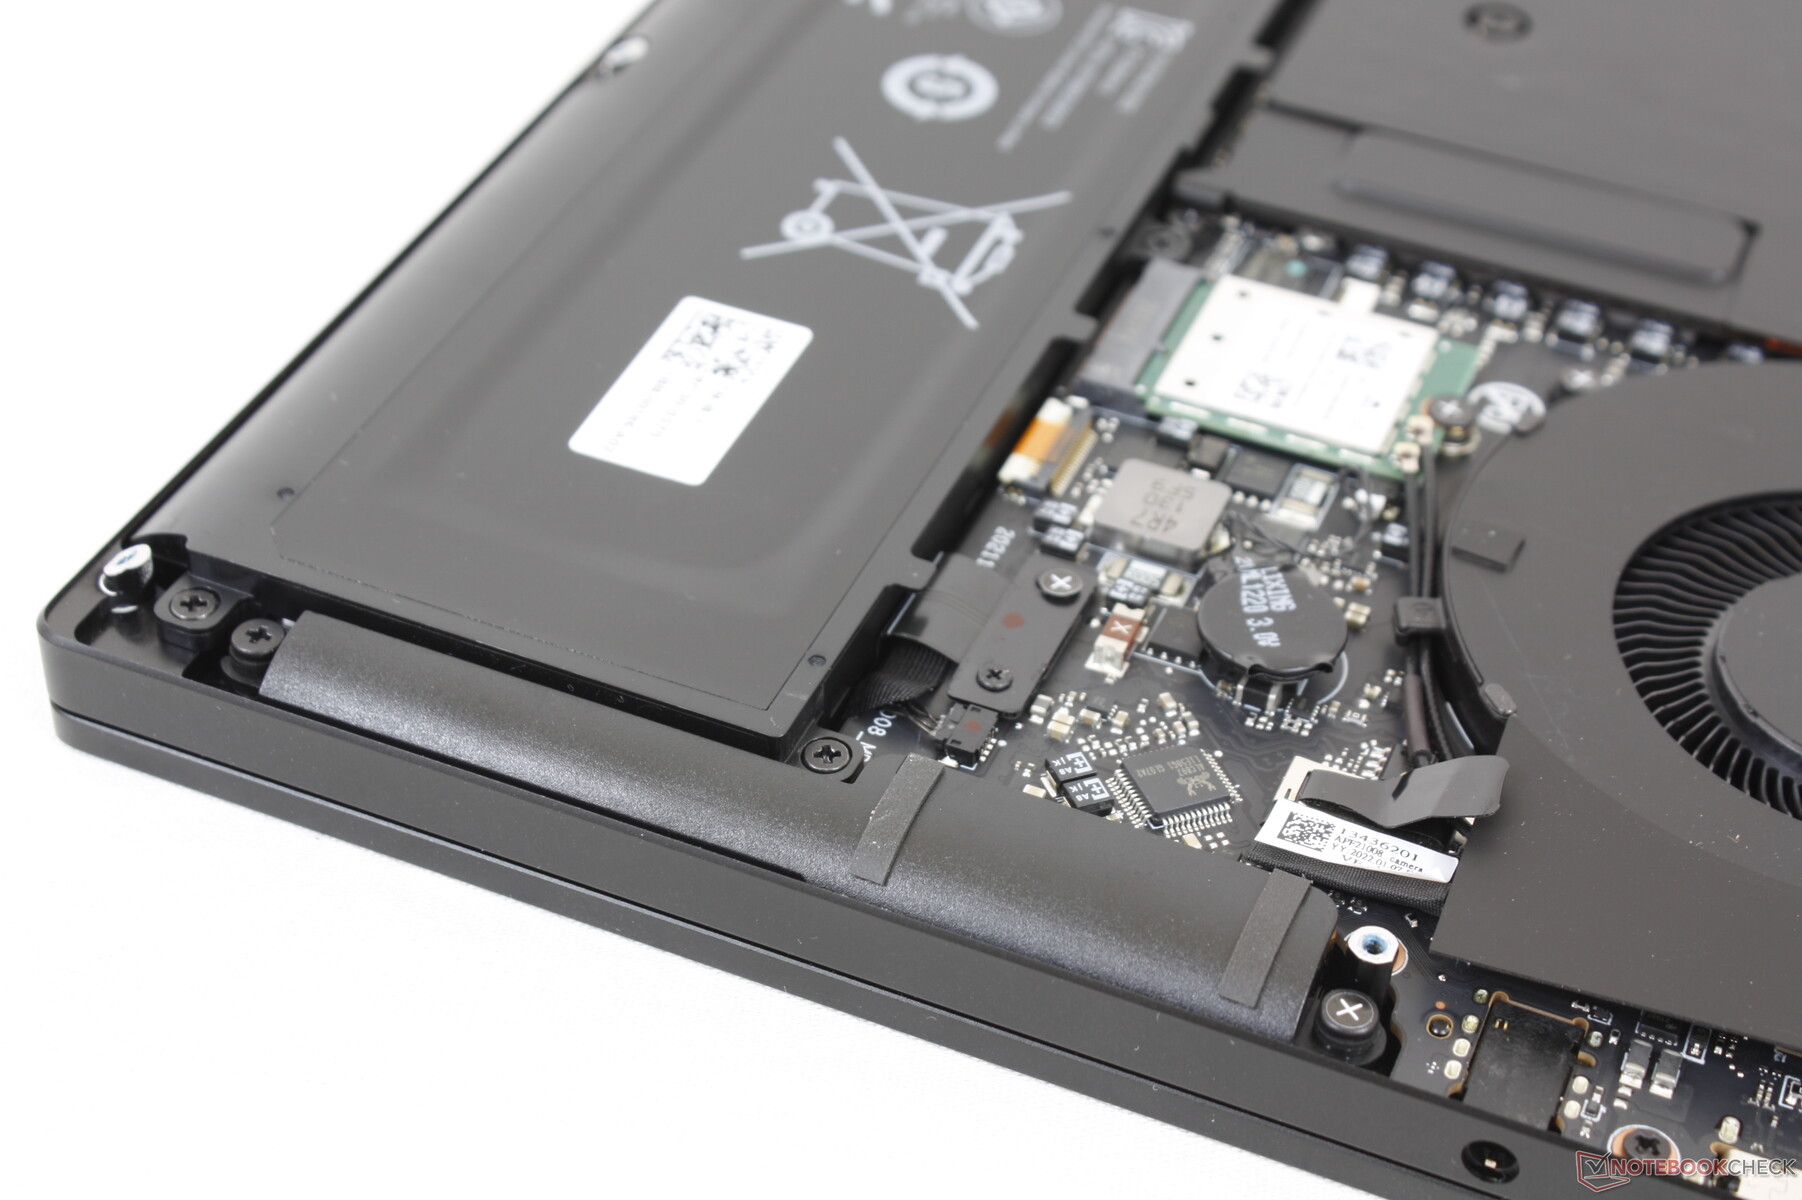
Maintenance
Removing the bottom panel shows a nearly identical layout to the 2021 Blade 14. Note that the fans are slightly different this time, however, but they are otherwise the same diameter.
Accessories and Warranty
Some Razer logo stickers are included in the box alongside the usual AC adapter and paperwork. As for the warranty, Razer is introducing two-year protection for the battery on each new purchase on top of the standard one-year limited warranty for the laptop.
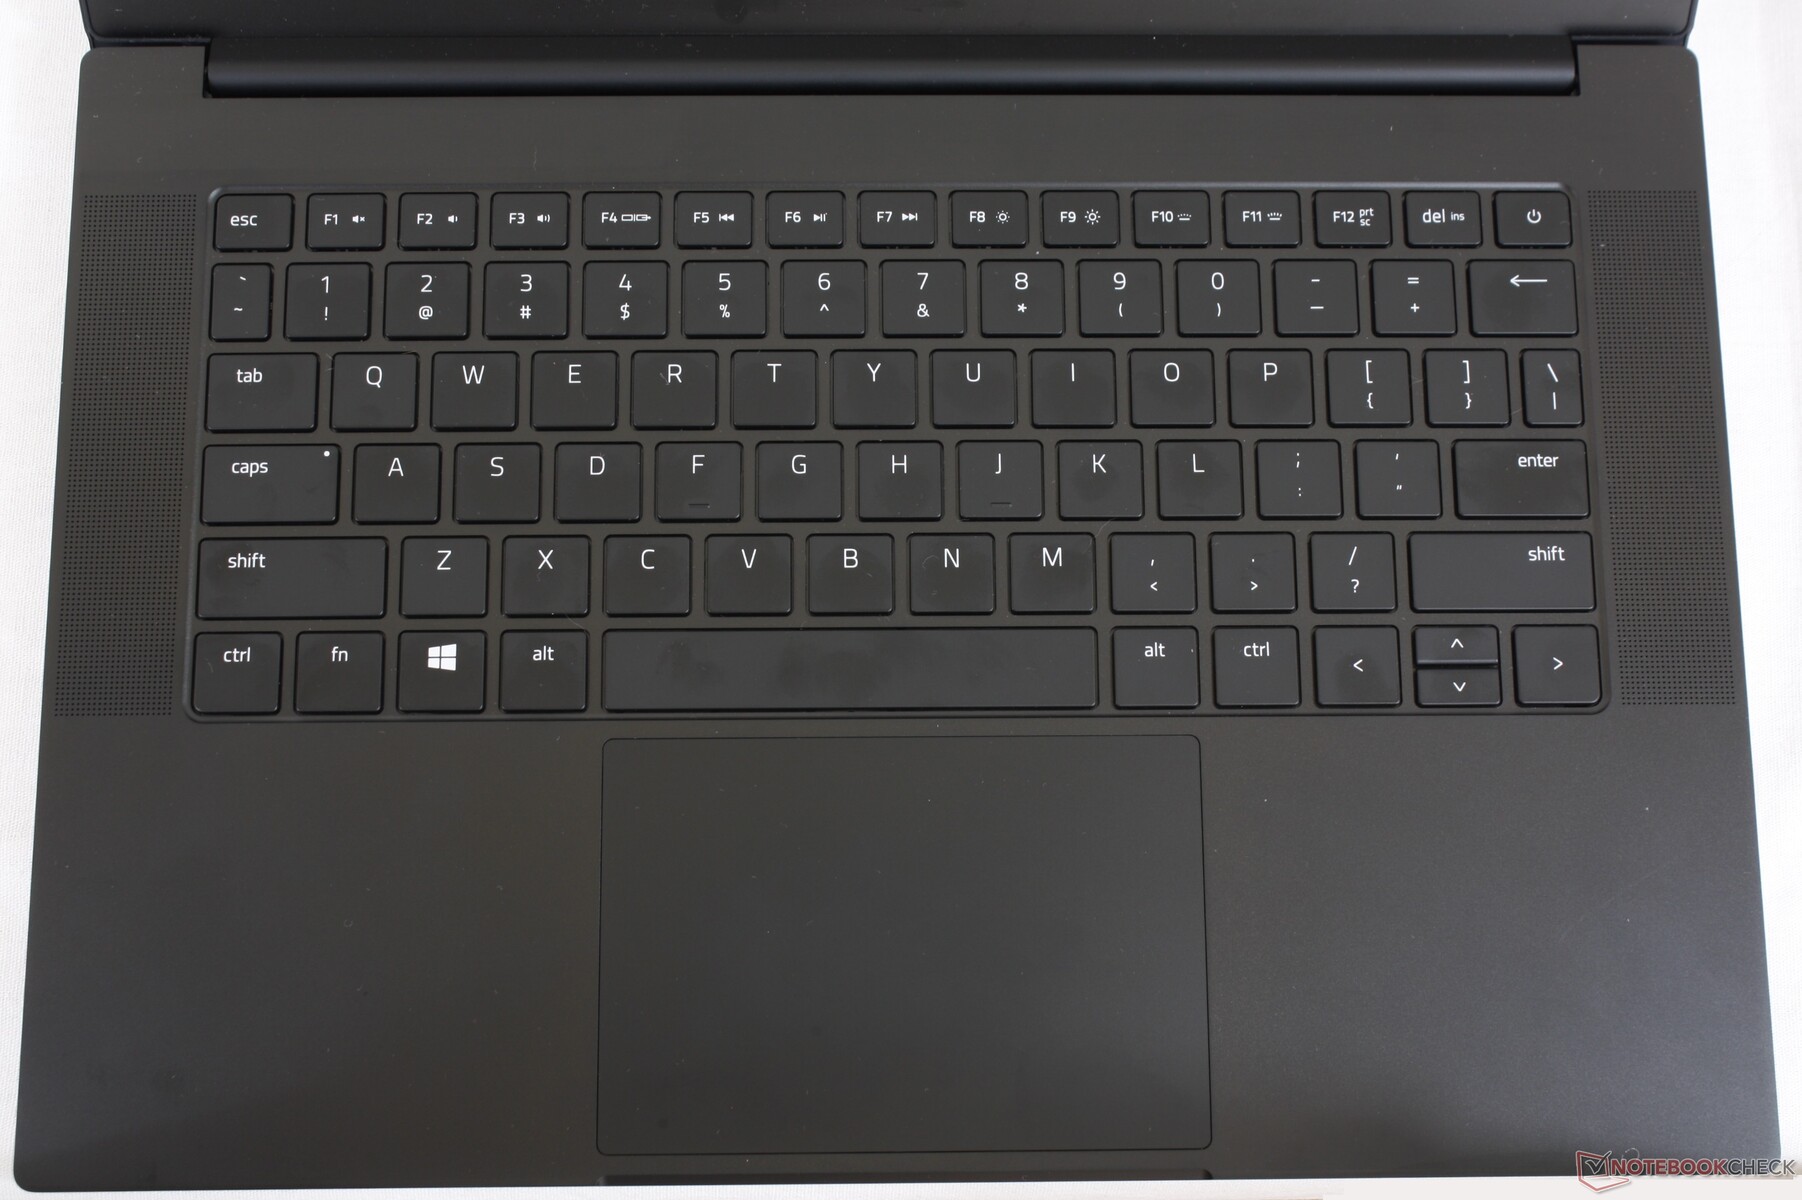
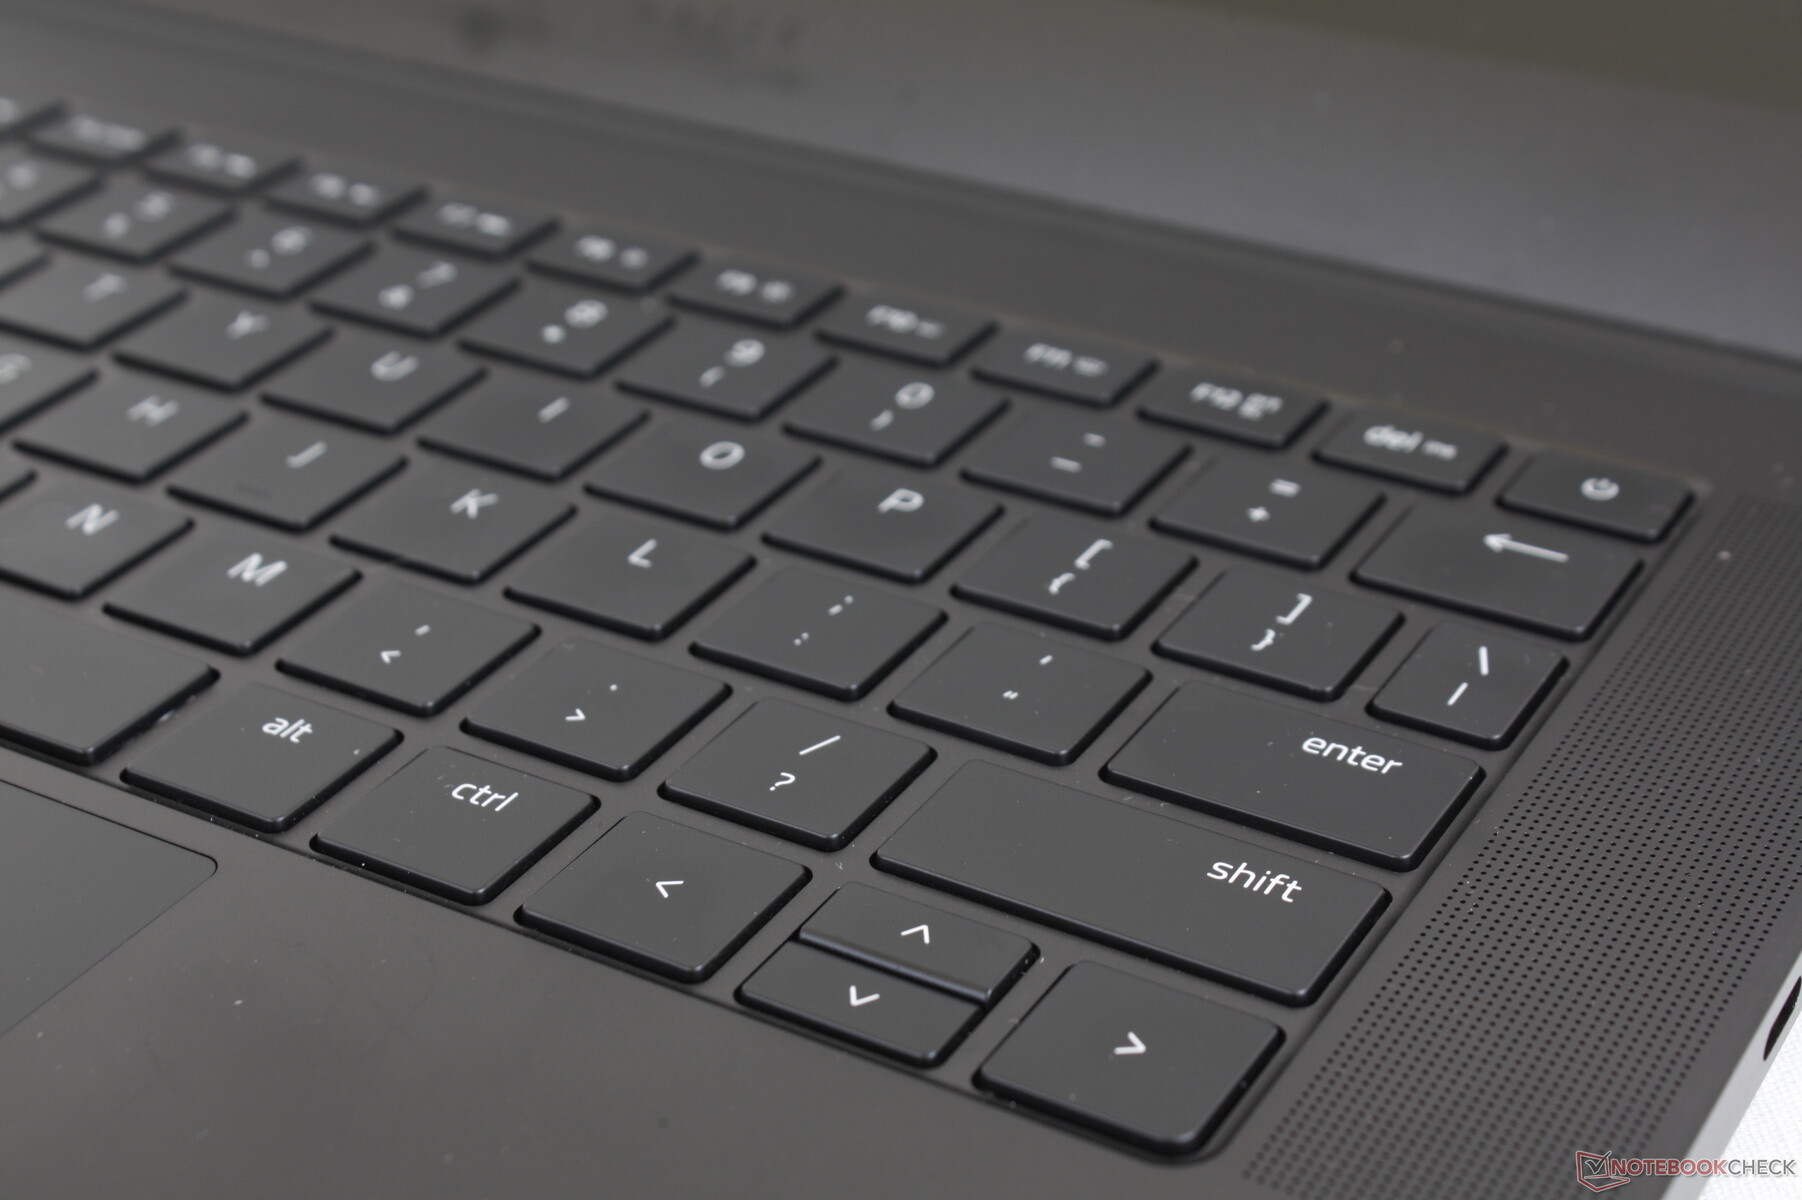
Input Devices — Feels Like Typing On An Ultrabook
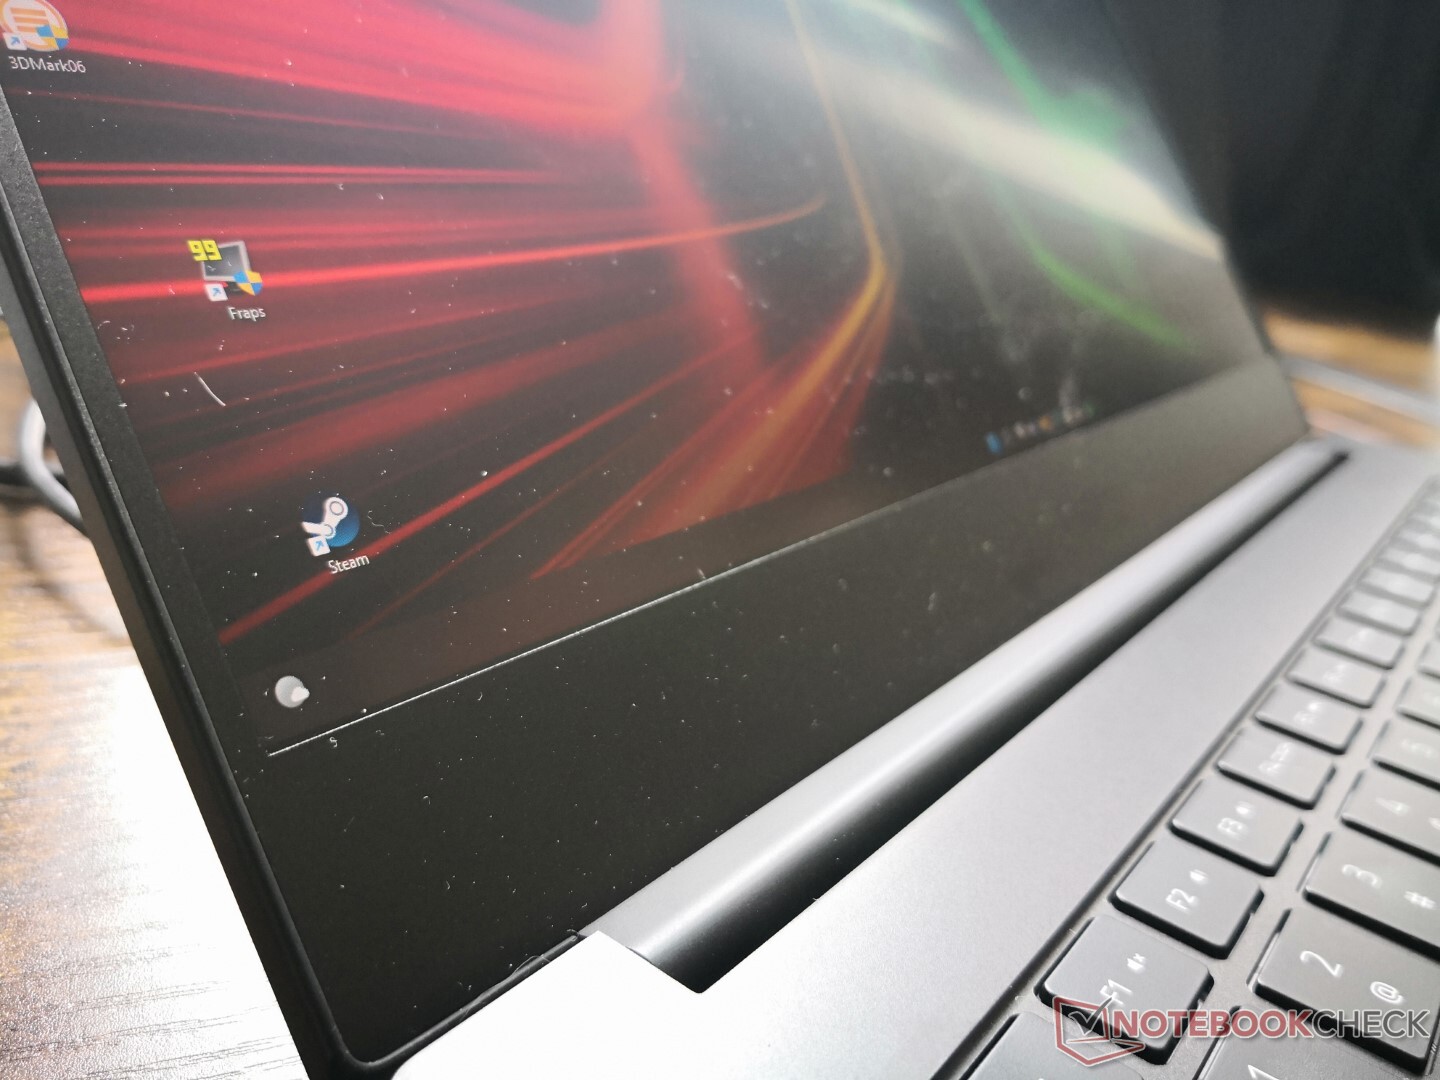
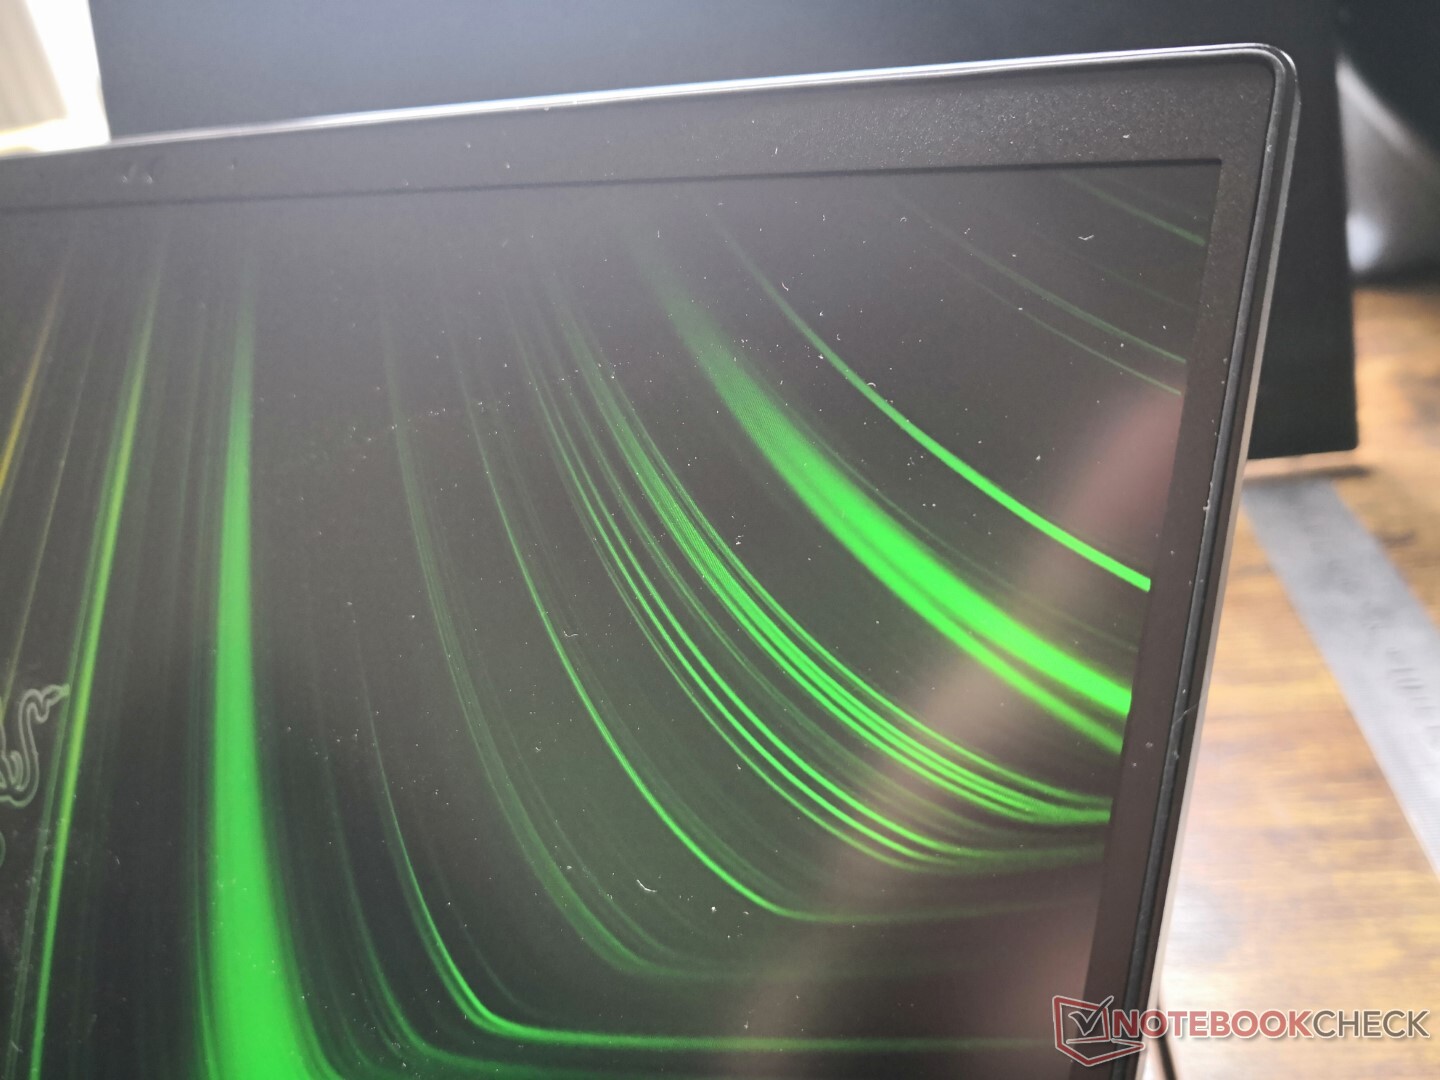
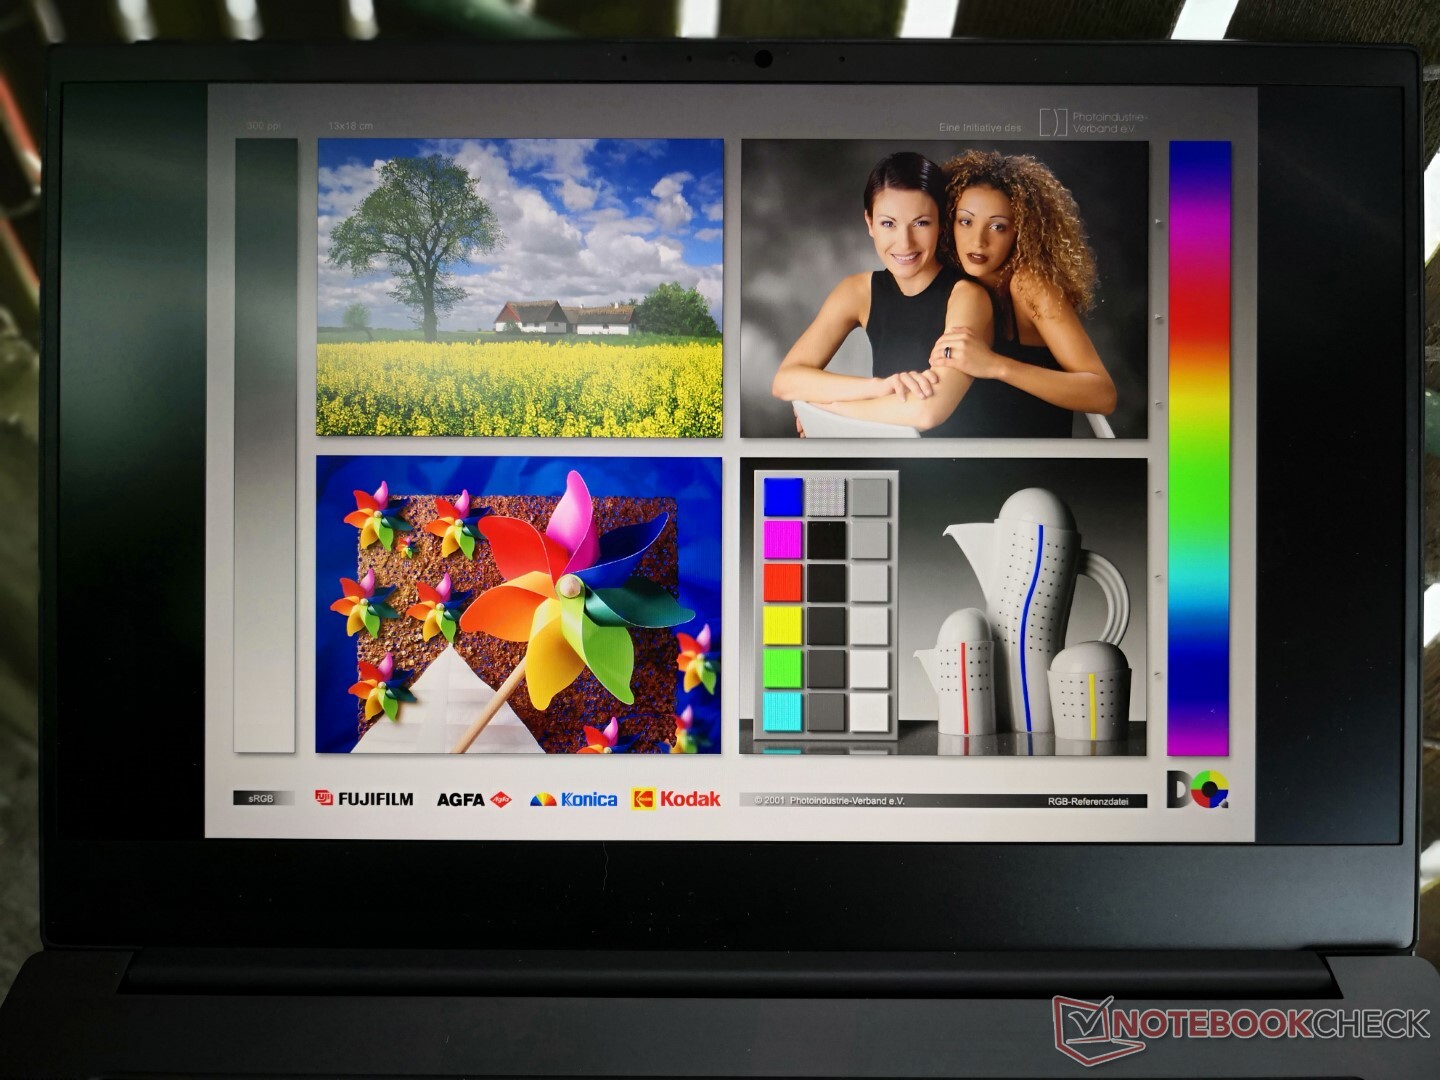
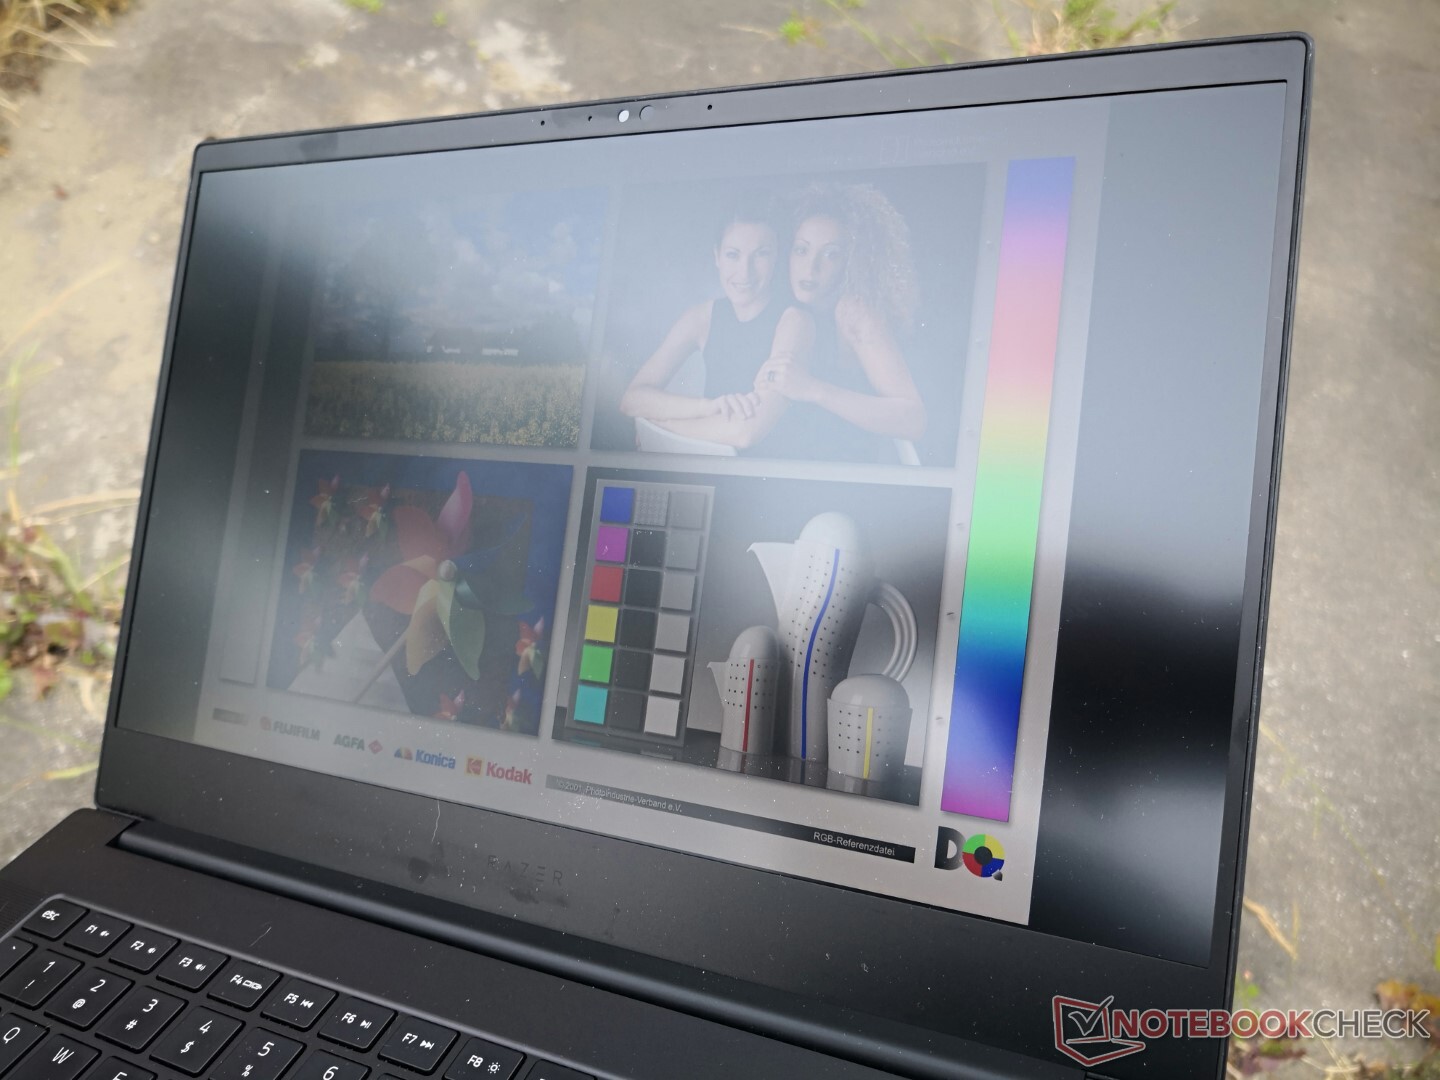
Display — QHD With All The Bells And Whistles
The 1440p IPS panel on our 2022 test unit is the TL140BDXP02-2 whereas our 2021 unit carried the TL140BDXP02-0. Everything else is otherwise nearly the same between them for essentially the same viewing experience year-over-year. This remains one of the only 14-inch models you can find in the market at the moment with native 165 Hz refresh rate, FreeSync Premium, full DCI-P3 coverage, and fast response times all in one.
It's worth noting that the latest Asus Zephyrus G14 model has moved to 16:10 whereas the Blade 14 is still 16:9. Unlike the Razer, however, the Asus model has no 165 Hz option.

| |||||||||||||||||||||||||
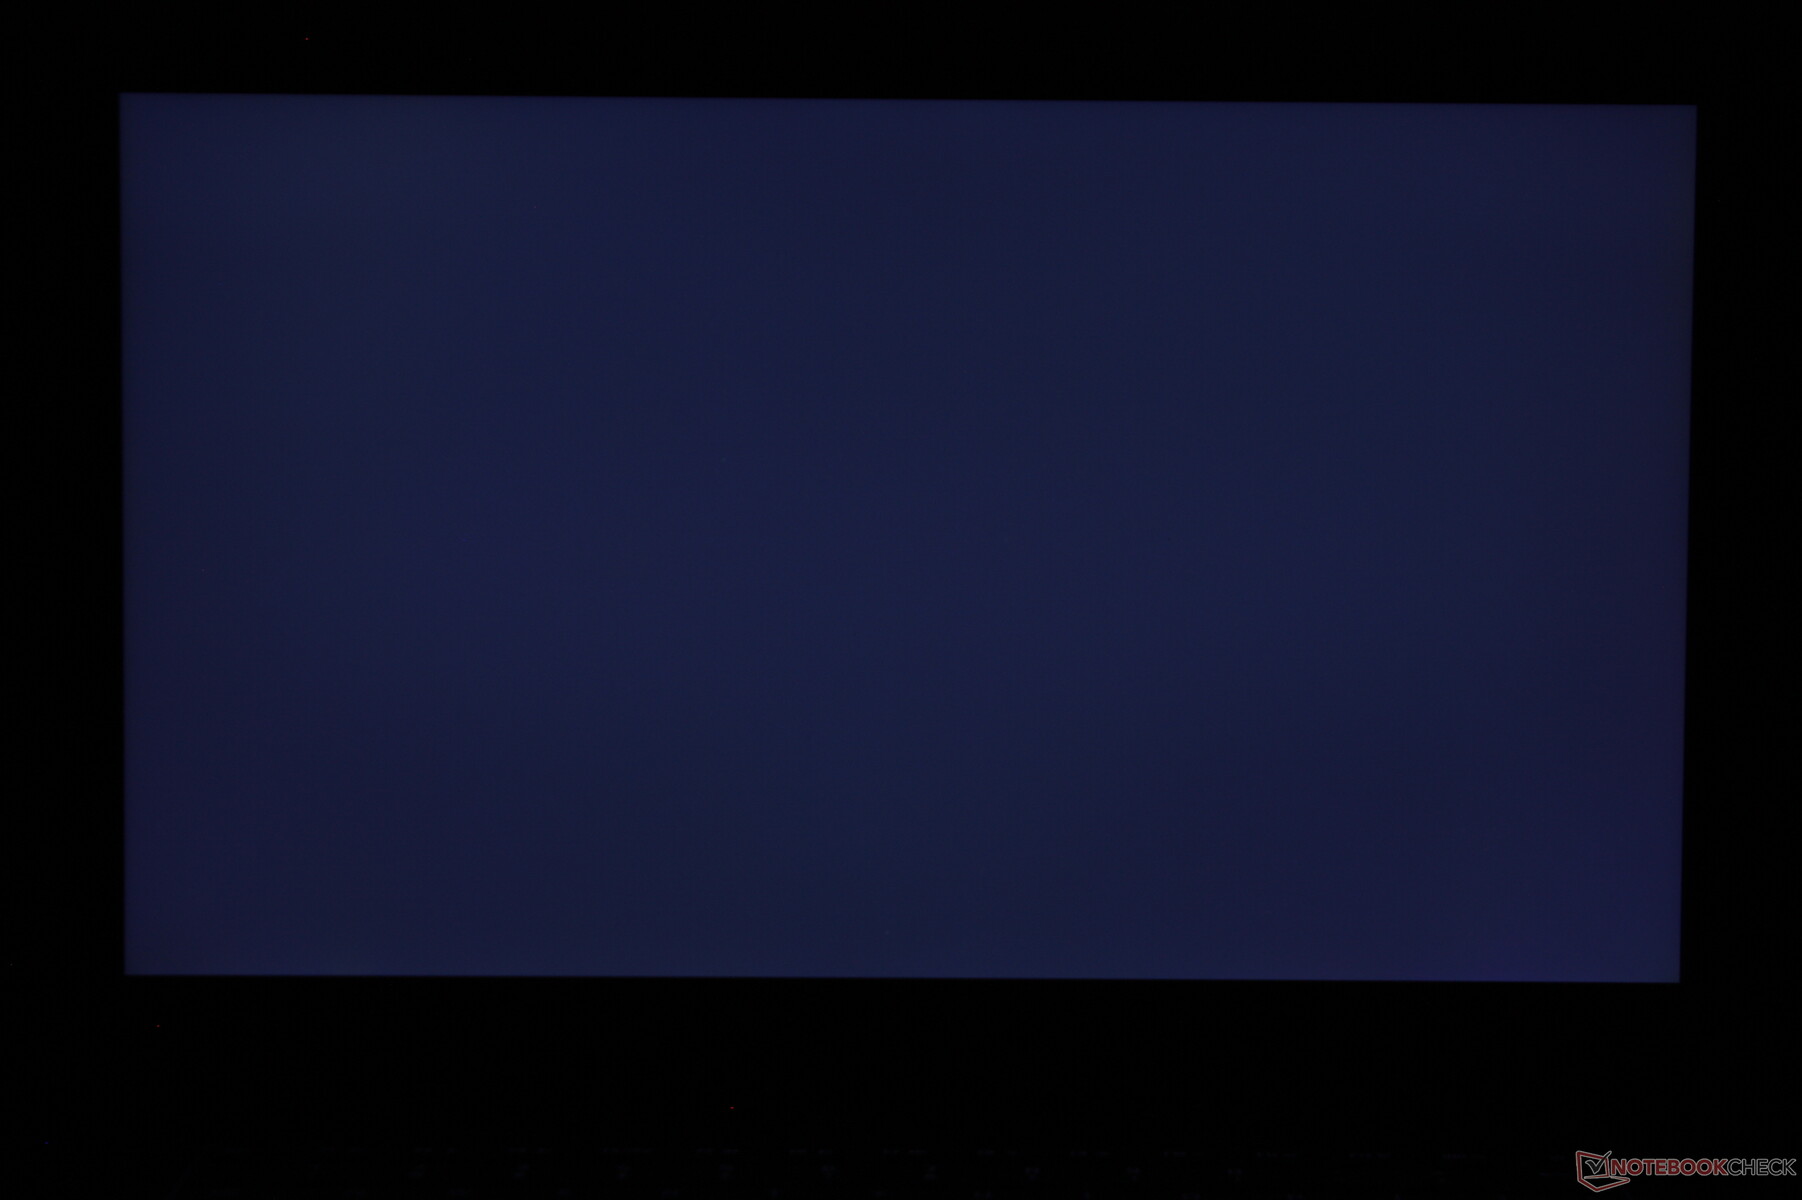
Brightness Distribution: 86 %
Center on Battery: 354 cd/m²
Contrast: 957:1 (Black: 0.37 cd/m²)
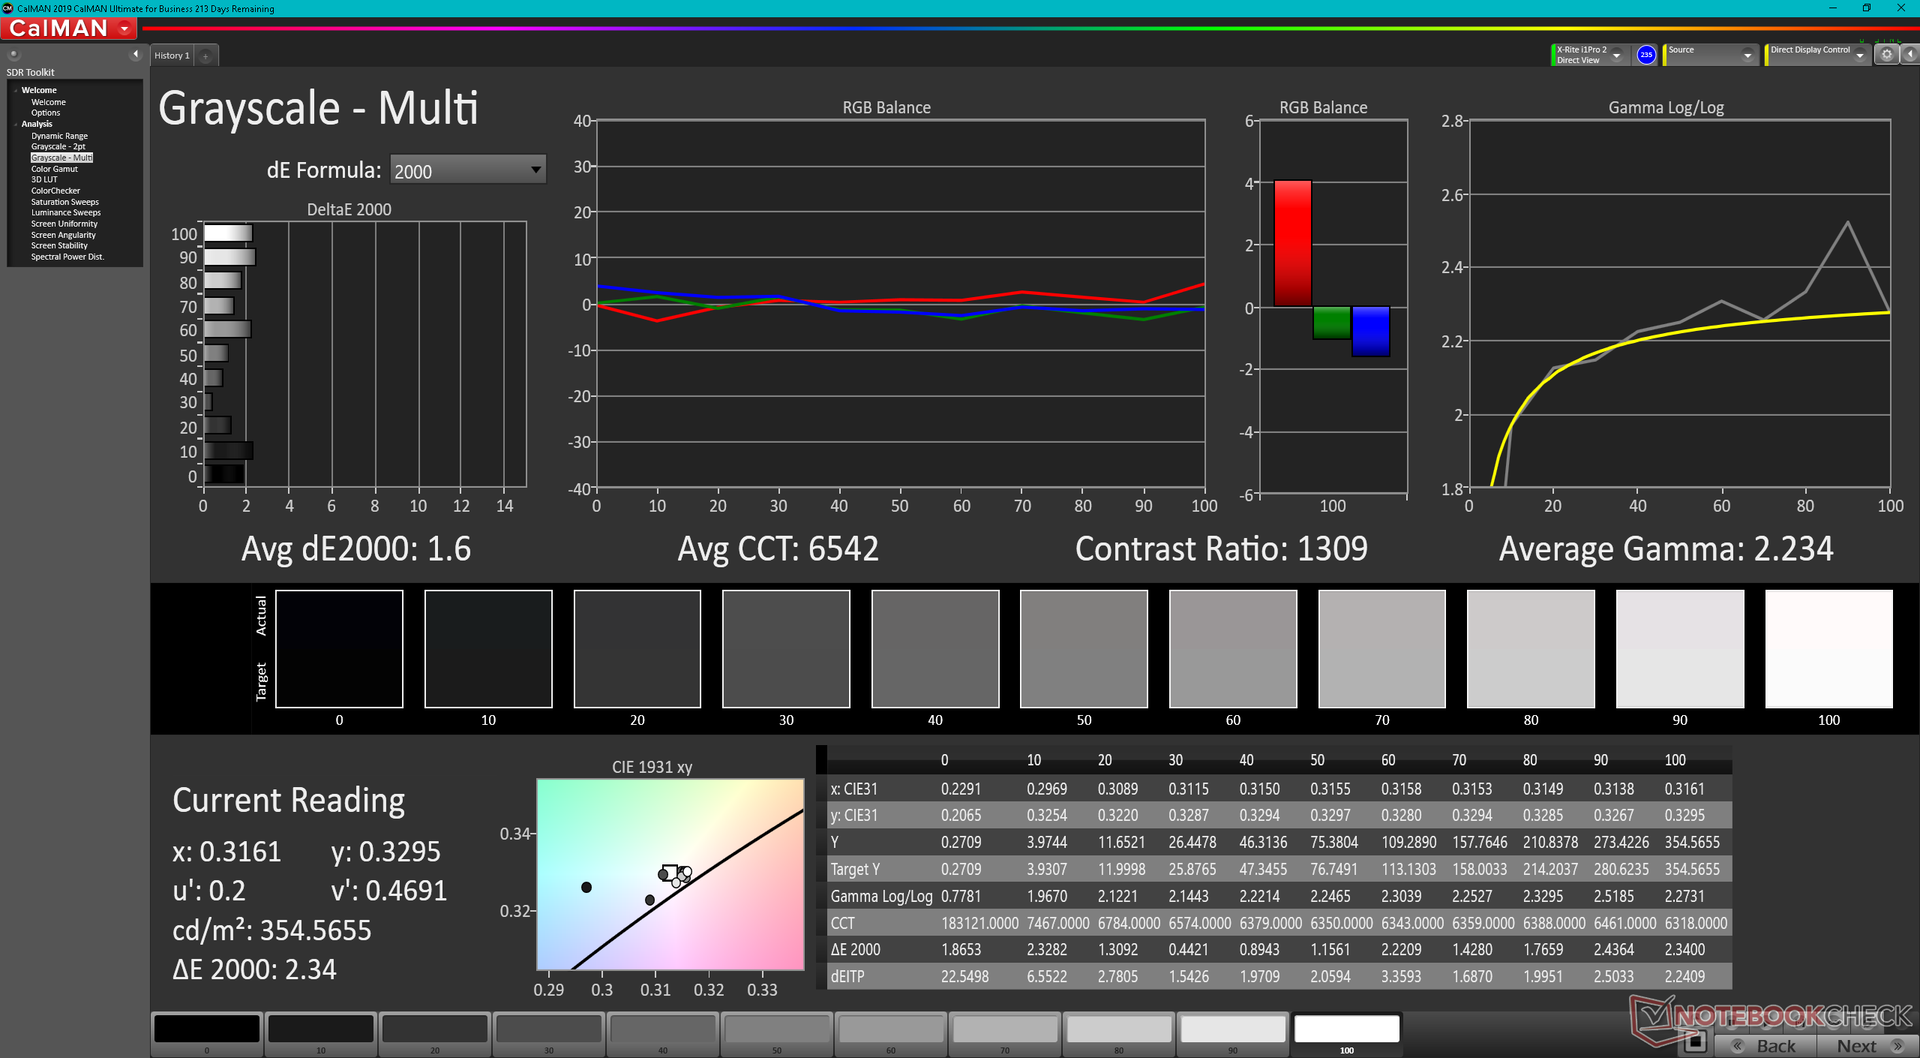
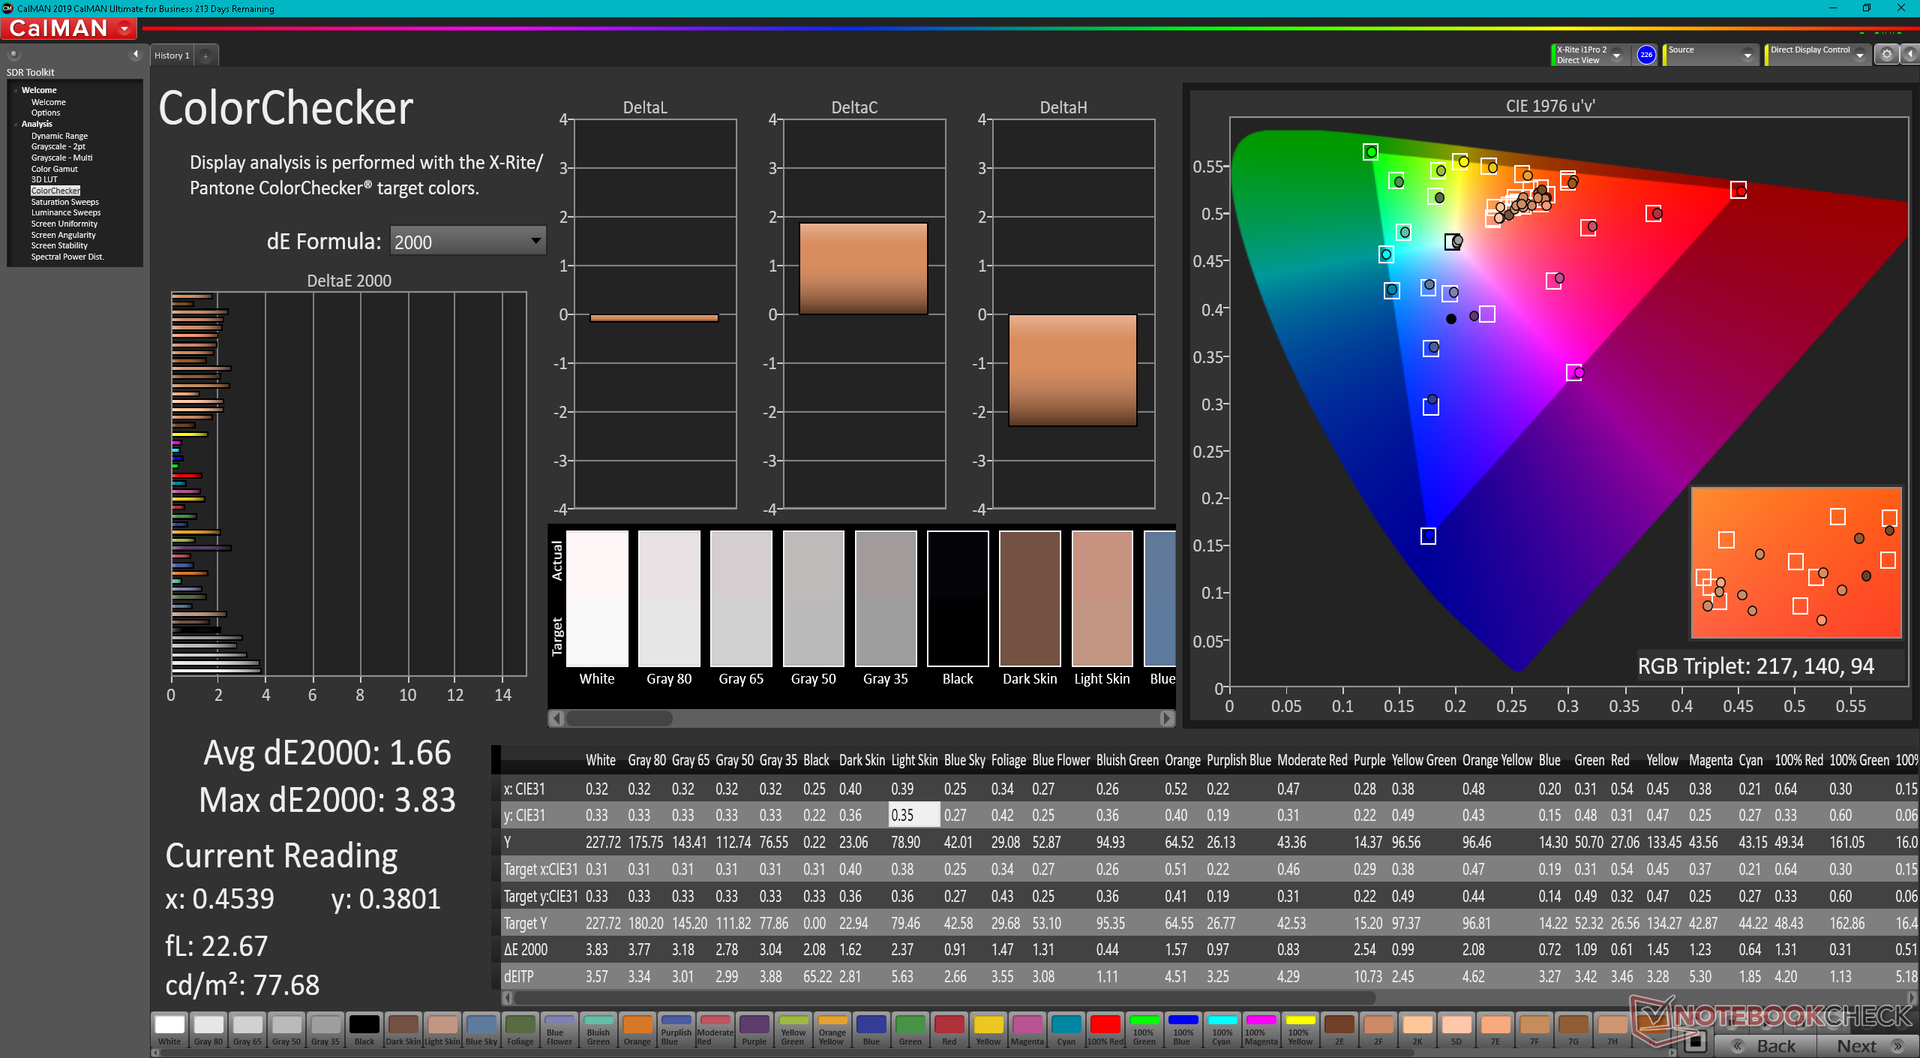
ΔE ColorChecker Calman: 1.66 | ∀{0.5-29.43 Ø4.73}
ΔE Greyscale Calman: 1.6 | ∀{0.09-98 Ø4.97}
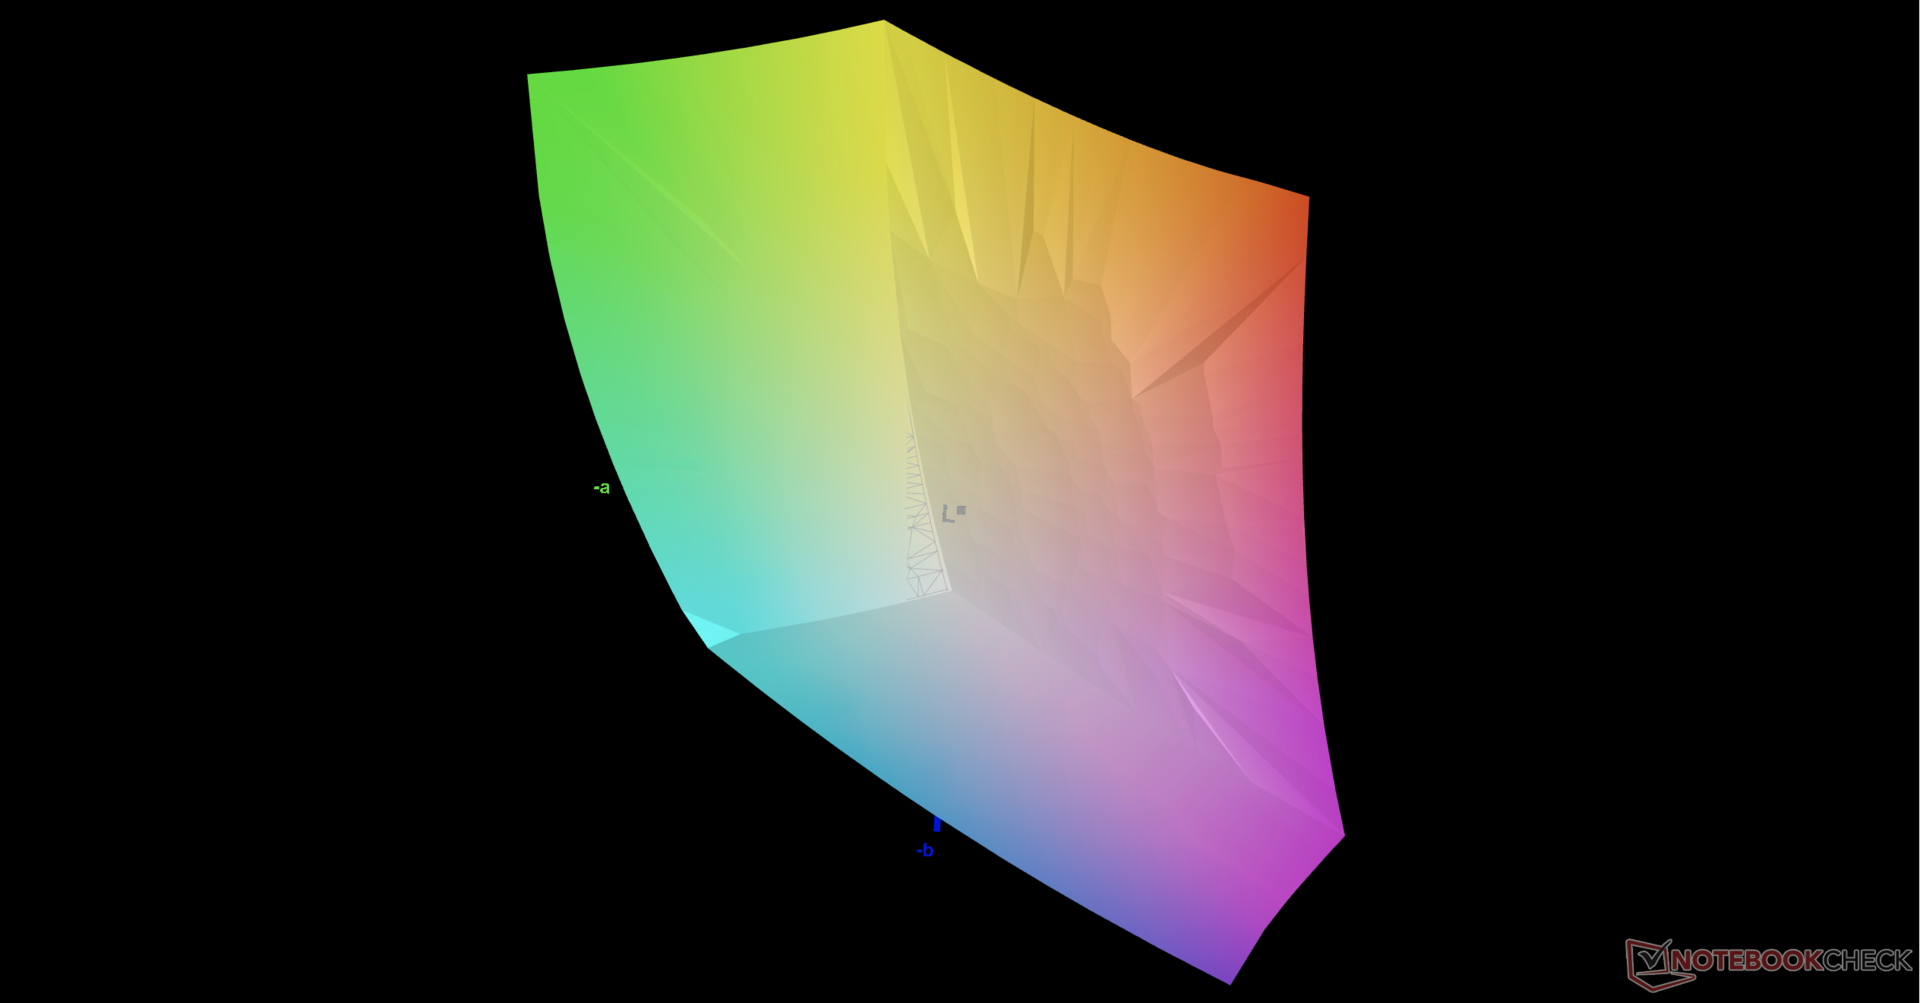
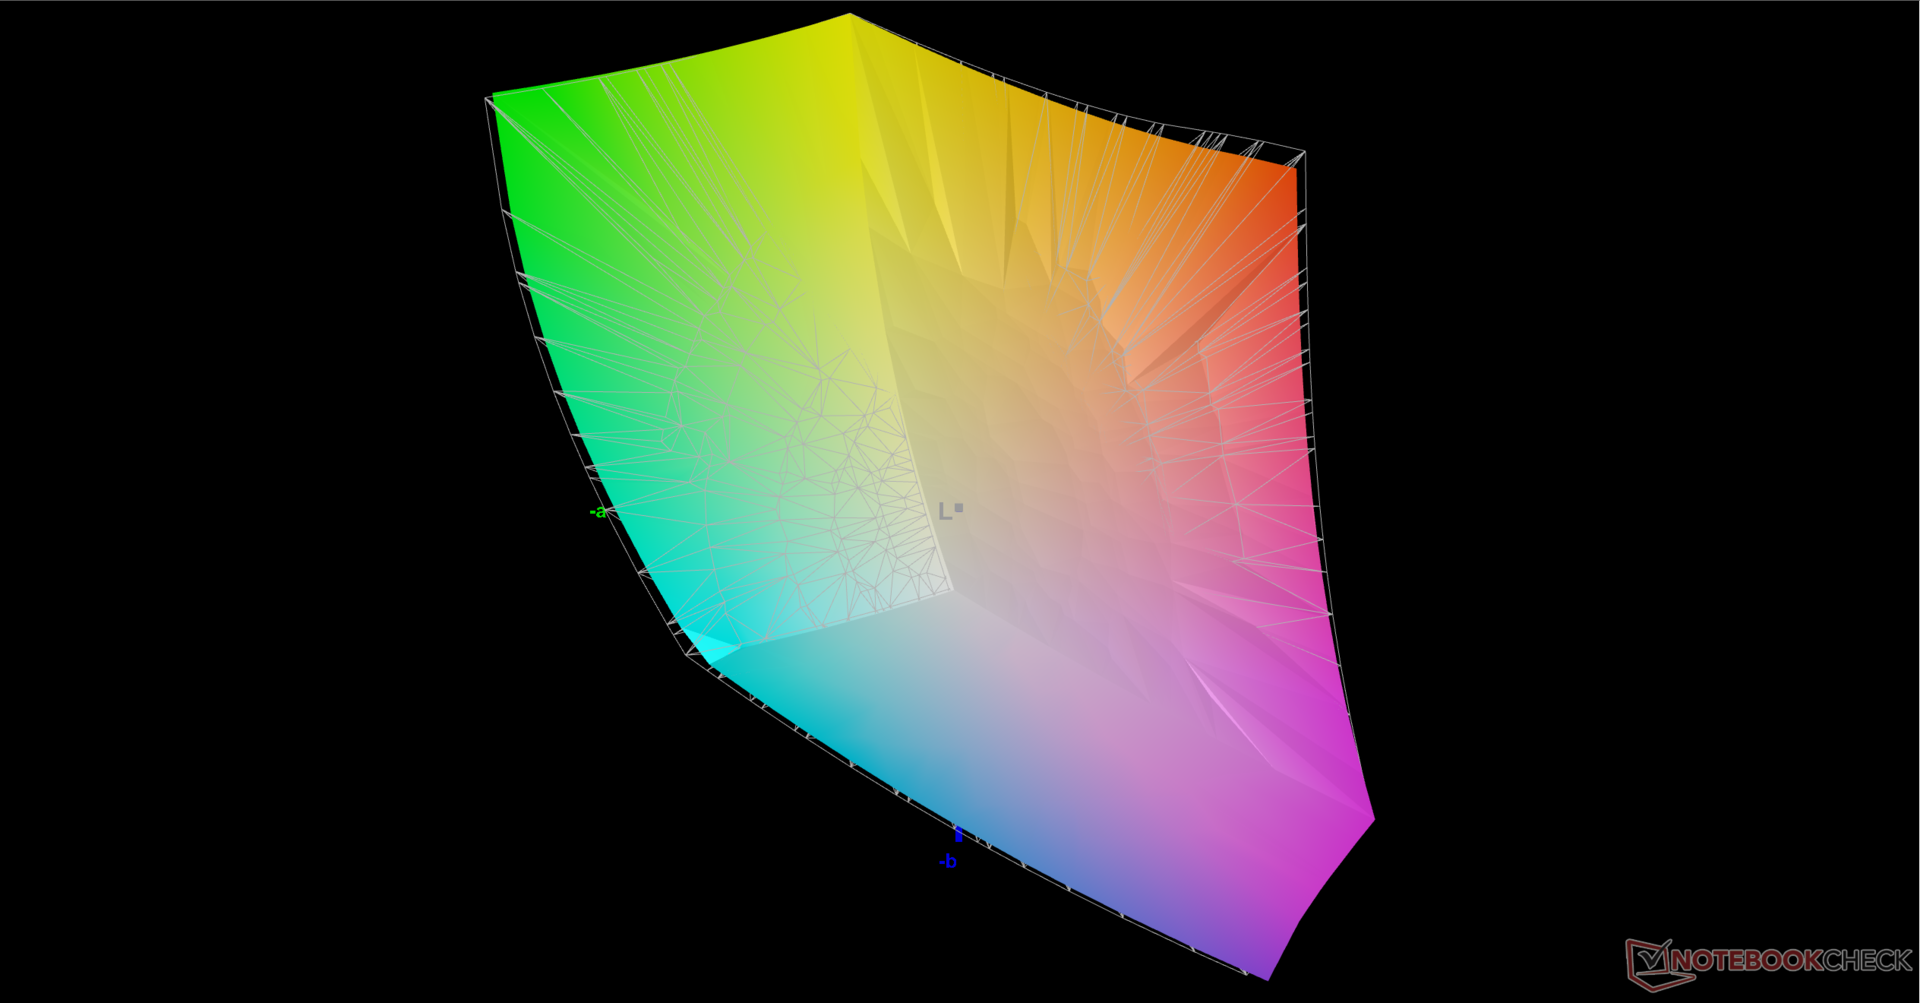
85.7% AdobeRGB 1998 (Argyll 3D)
99.9% sRGB (Argyll 3D)
97.2% Display P3 (Argyll 3D)
Gamma: 2.23
CCT: 6542 K
| Razer Blade 14 Ryzen 9 6900HX TL140BDXP02-0, IPS, 2560x1440, 14" | Razer Blade 14 Ryzen 9 RTX 3070 TL140BDXP02-2, IPS, 2560x1440, 14" | Razer Blade 17 RTX 3080 Ti BOE NE173QHM-NZ1, IPS, 2560x1440, 17.3" | Asus ROG Zephyrus G14 GA402RK NE140QDM-NX1 (BOE0A1D), IPS-Level, 2560x1600, 14" | MSI Stealth GS66 12UGS Sharp LQ156T1JW04 (SHP153C), IPS-Level, 2560x1440, 15.6" | Asus ROG Zephyrus Duo 15 SE GX551QS AU Optronics B156ZAN05.1, IPS, 3840x2160, 15.6" | |
|---|---|---|---|---|---|---|
| Display | 0% | 1% | 0% | -0% | 3% | |
| Display P3 Coverage (%) | 97.2 | 97.2 0% | 98.7 2% | 97.4 0% | 96.4 -1% | 89.1 -8% |
| sRGB Coverage (%) | 99.9 | 99.9 0% | 99.9 0% | 99.9 0% | 99.7 0% | 99.9 0% |
| AdobeRGB 1998 Coverage (%) | 85.7 | 85.4 0% | 86.2 1% | 85.5 0% | 85.6 0% | 99.1 16% |
| Response Times | 16% | 10% | 55% | 55% | 42% | |
| Response Time Grey 50% / Grey 80% * (ms) | 16.8 ? | 16.4 ? 2% | 17.6 ? -5% | 8.8 ? 48% | 6 ? 64% | 8.2 ? 51% |
| Response Time Black / White * (ms) | 15.2 ? | 10.8 ? 29% | 11.4 ? 25% | 6 ? 61% | 8.4 ? 45% | 10.4 ? 32% |
| PWM Frequency (Hz) | 27170 ? | |||||
| Screen | -8% | -18% | -32% | -72% | -41% | |
| Brightness middle (cd/m²) | 354 | 331.1 -6% | 335.9 -5% | 480 36% | 272 -23% | 406 15% |
| Brightness (cd/m²) | 328 | 318 -3% | 294 -10% | 456 39% | 253 -23% | 407 24% |
| Brightness Distribution (%) | 86 | 91 6% | 75 -13% | 80 -7% | 87 1% | 88 2% |
| Black Level * (cd/m²) | 0.37 | 0.36 3% | 0.38 -3% | 0.48 -30% | 0.25 32% | 0.42 -14% |
| Contrast (:1) | 957 | 920 -4% | 884 -8% | 1000 4% | 1088 14% | 967 1% |
| Colorchecker dE 2000 * | 1.66 | 2.25 -36% | 2.82 -70% | 2.62 -58% | 3.73 -125% | 4.36 -163% |
| Colorchecker dE 2000 max. * | 3.83 | 4.62 -21% | 5.04 -32% | 6.71 -75% | 9.43 -146% | 7.55 -97% |
| Greyscale dE 2000 * | 1.6 | 1.7 -6% | 1.7 -6% | 4.2 -163% | 6.5 -306% | 3.1 -94% |
| Gamma | 2.23 99% | 2.3 96% | 2.14 103% | 2.16 102% | 2.172 101% | 2.36 93% |
| CCT | 6542 99% | 6751 96% | 6382 102% | 7122 91% | 6485 100% | 6371 102% |
| Colorchecker dE 2000 calibrated * | 1.12 | 0.98 | 3.63 | |||
| Color Space (Percent of AdobeRGB 1998) (%) | 86.7 | |||||
| Color Space (Percent of sRGB) (%) | 99.9 | |||||
| Total Average (Program / Settings) | 3% /
-3% | -2% /
-10% | 8% /
-11% | -6% /
-36% | 1% /
-18% |
* ... smaller is better
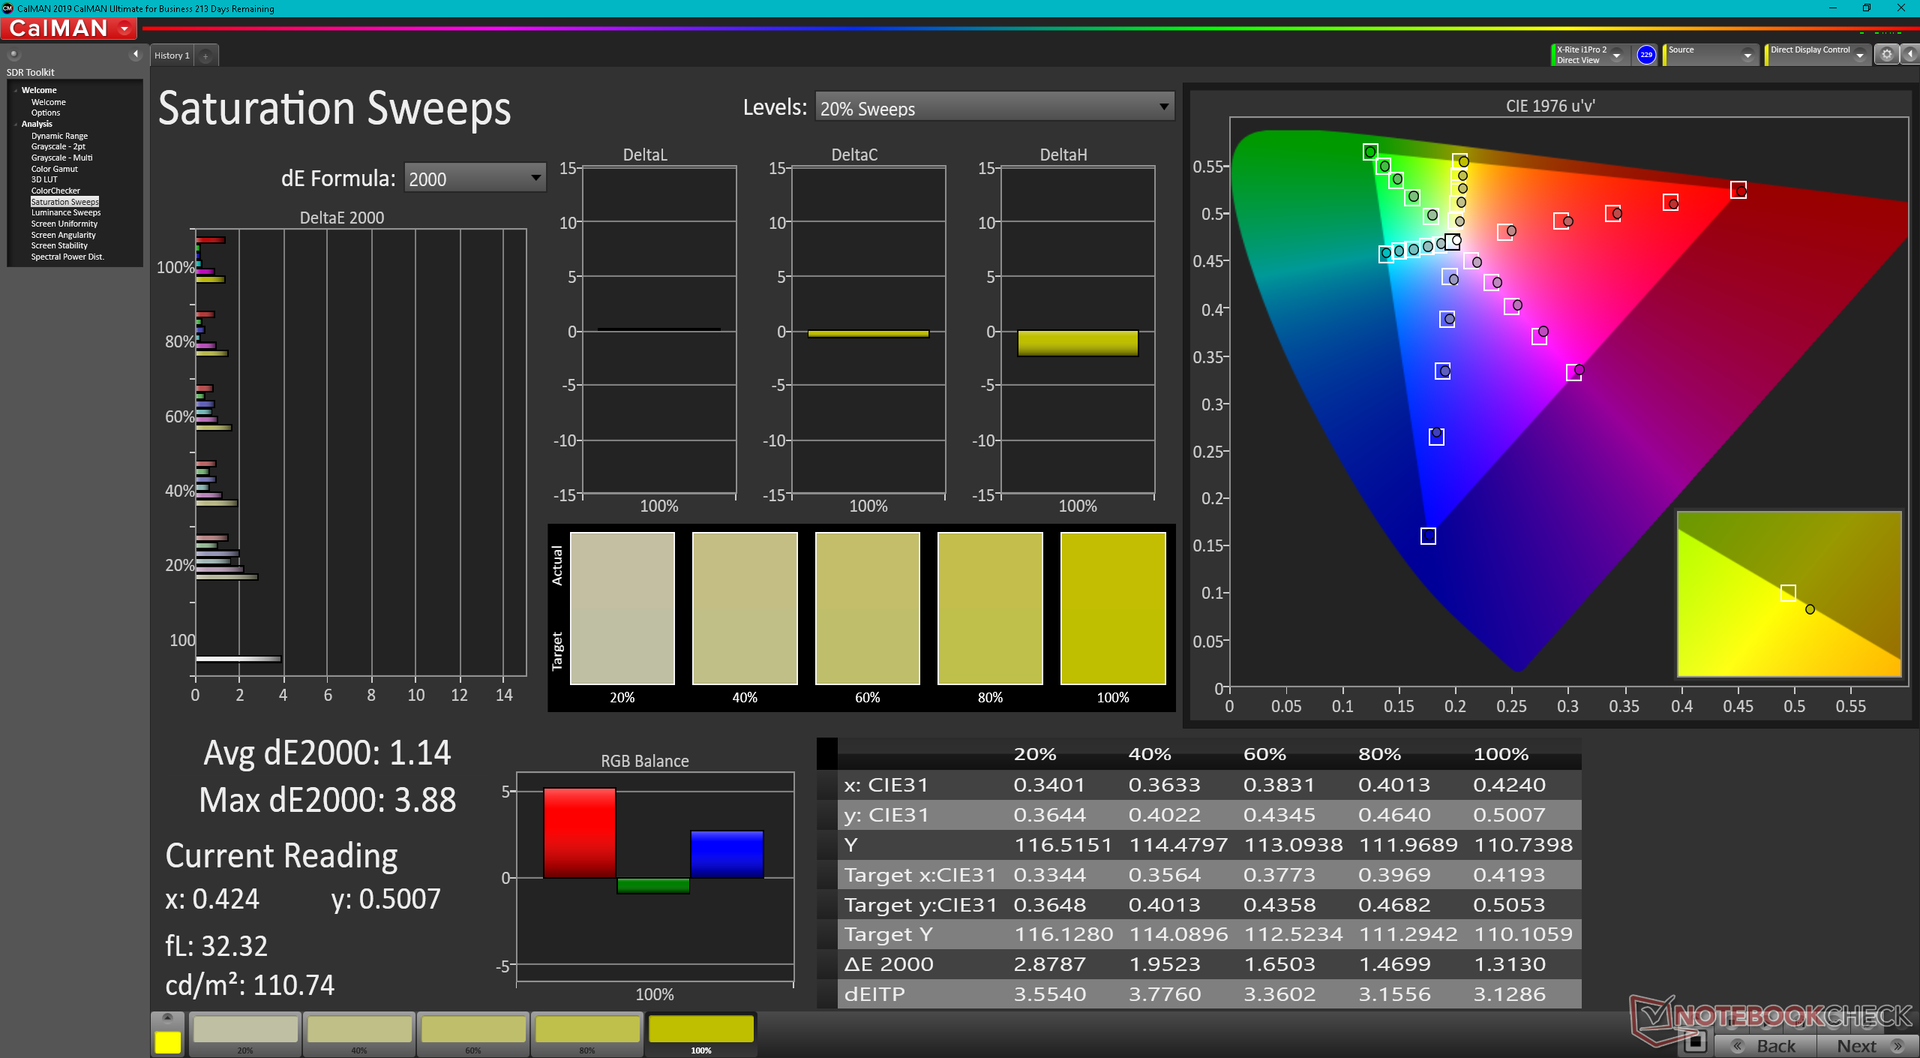
Independent measurements with our X-Rite colorimeter show nearly identical color spaces between the QUD 2021 Blade 14 and QUD 2022 Blade 14 at approximately 97 percent of DCI-P3. By default, however, the display appears to be set to sRGB instead of DCI-P3 with no clear way to switch to DCI-P3. In comparison, the original 2021 model was set to DCI-P3 by default. We'll update this section of the review should we successfully switch the color profile from sRGB to DCI-P3. Razer advertises full sRGB and DCI-P3 coverage for its FHD SKUs and QHD SKUs, respectively.
Display Response Times
| ↔ Response Time Black to White | ||
|---|---|---|
| 15.2 ms ... rise ↗ and fall ↘ combined | ↗ 8.4 ms rise | 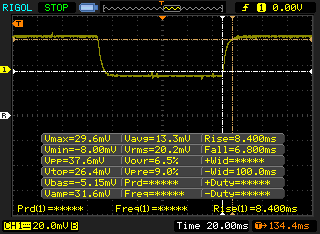 |
| ↘ 6.8 ms fall | ||
| The screen shows good response rates in our tests, but may be too slow for competitive gamers. In comparison, all tested devices range from 0.1 (minimum) to 240 (maximum) ms. » 36 % of all devices are better. This means that the measured response time is better than the average of all tested devices (19.9 ms). | ||
| ↔ Response Time 50% Grey to 80% Grey | ||
| 16.8 ms ... rise ↗ and fall ↘ combined | ↗ 8.4 ms rise | 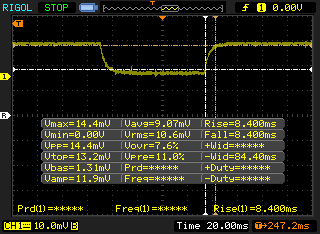 |
| ↘ 8.4 ms fall | ||
| The screen shows good response rates in our tests, but may be too slow for competitive gamers. In comparison, all tested devices range from 0.165 (minimum) to 636 (maximum) ms. » 31 % of all devices are better. This means that the measured response time is better than the average of all tested devices (31.1 ms). | ||
Screen Flickering / PWM (Pulse-Width Modulation)
| Screen flickering / PWM not detected | 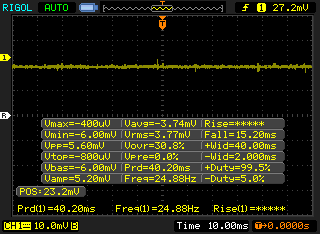 | ||
In comparison: 52 % of all tested devices do not use PWM to dim the display. If PWM was detected, an average of 7798 (minimum: 5 - maximum: 343500) Hz was measured. | |||

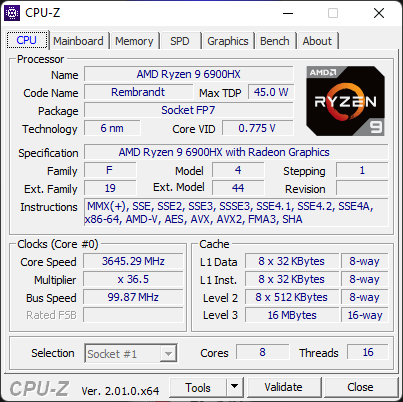
Performance — Ryzen 9 6900HX Debut
Testing Conditions
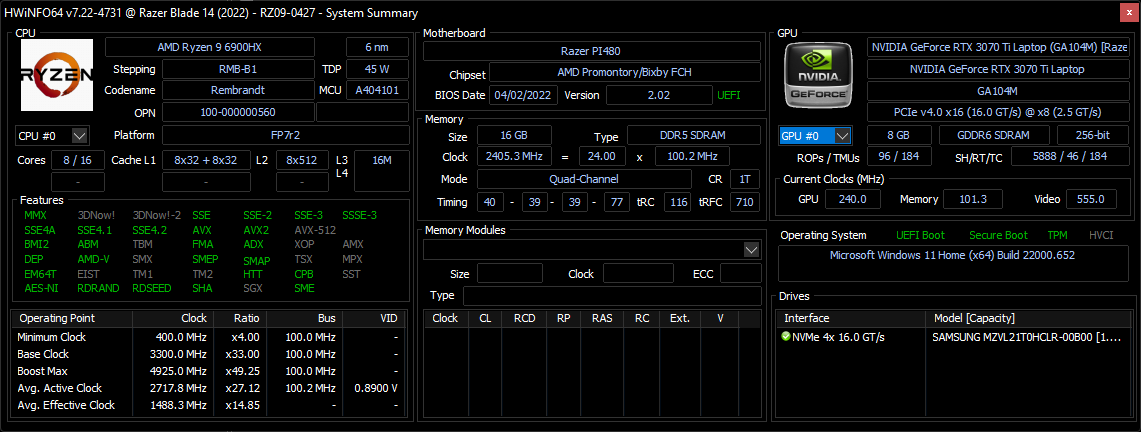
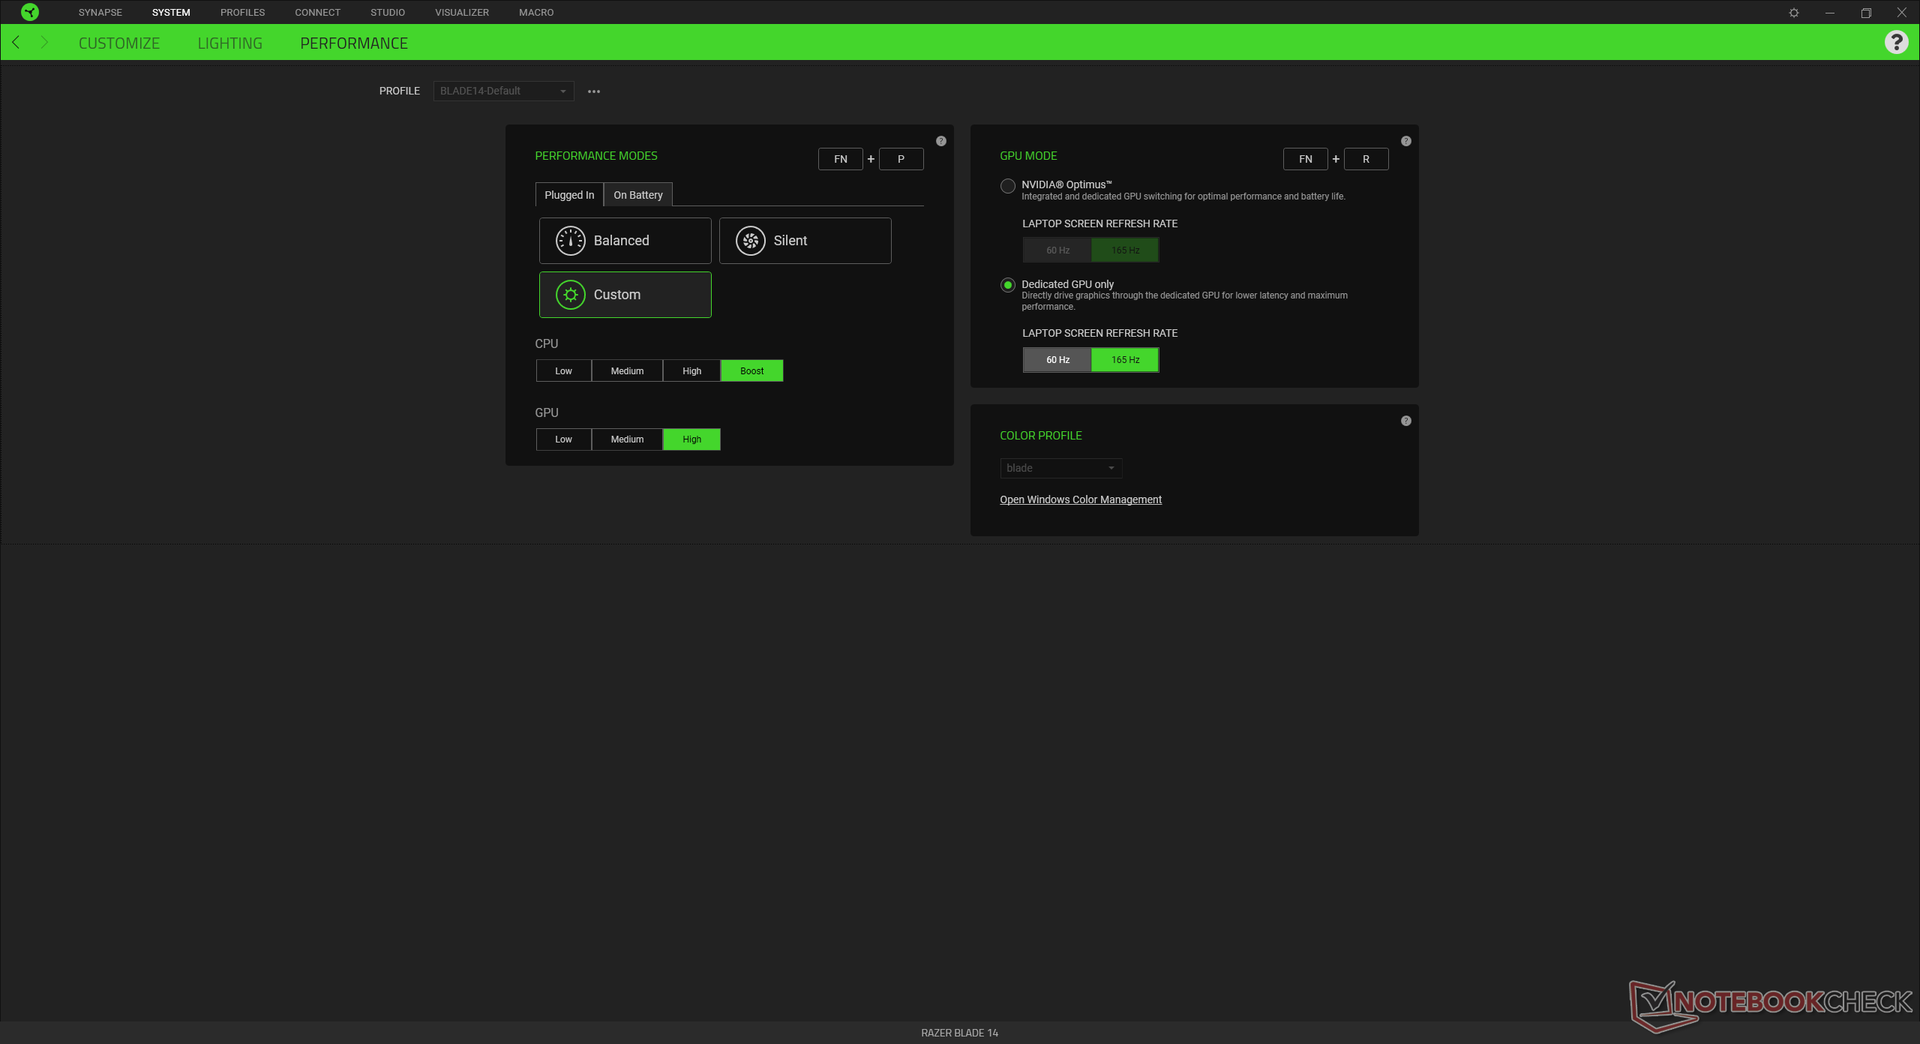
Our unit was set to Performance mode via Windows and the CPU and GPU set to Boost and High, respectively, via Synapse prior to running any performance benchmarks below. We recommend users become familiar with the Synapse software as many key features are toggled here including the video refresh rate and MUX switch between Optimus and discrete graphics. In comparison, the 2021 Blade 14 Synapse software lacked the MUX switch option.
Processor — Noticeable Single-Thread Performance Boost
We noted in our 2021 Blade 14 review that single-thread performance was disappointing relative to other H-series CPUs. Thankfully, the newer Ryzen 9 6900HX has addressed these concerns with single-thread and multi-thread performance boosts of about 30 percent and 10 percent, respectively, over its previous generation Ryzen 9 5900HX counterpart. Raw multi-thread performance is within single-digit percentage points of the 12th gen Core i7-12800H as found on the larger Blade 17. In short, the Blade 14 can indeed offer a similar level of CPU performance as a "regular sized" gaming laptop.
The Ryzen 9 6900HX can likely run faster on a larger chassis. The 15.6-inch Asus ROG Zephyrus Duo 15 SE GX551QS with the older Ryzen 9 5900HX, for example, is neck-to-neck with our smaller Blade 14 in terms of processor performance.
Cinebench R15 Multi Loop
Cinebench R23: Multi Core | Single Core
Cinebench R15: CPU Multi 64Bit | CPU Single 64Bit
Blender: v2.79 BMW27 CPU
7-Zip 18.03: 7z b 4 | 7z b 4 -mmt1
Geekbench 5.5: Multi-Core | Single-Core
HWBOT x265 Benchmark v2.2: 4k Preset
LibreOffice : 20 Documents To PDF
R Benchmark 2.5: Overall mean
Cinebench R23: Multi Core | Single Core
Cinebench R15: CPU Multi 64Bit | CPU Single 64Bit
Blender: v2.79 BMW27 CPU
7-Zip 18.03: 7z b 4 | 7z b 4 -mmt1
Geekbench 5.5: Multi-Core | Single-Core
HWBOT x265 Benchmark v2.2: 4k Preset
LibreOffice : 20 Documents To PDF
R Benchmark 2.5: Overall mean
* ... smaller is better
AIDA64: FP32 Ray-Trace | FPU Julia | CPU SHA3 | CPU Queen | FPU SinJulia | FPU Mandel | CPU AES | CPU ZLib | FP64 Ray-Trace | CPU PhotoWorxx
| Performance rating | |
| Razer Blade 14 Ryzen 9 6900HX | |
| Average AMD Ryzen 9 6900HX | |
| Asus ROG Zephyrus G14 GA402RK | |
| Razer Blade 14 Ryzen 9 RTX 3070 | |
| MSI Stealth GS66 12UGS | |
| Razer Blade 17 RTX 3080 Ti | |
| AIDA64 / FP32 Ray-Trace | |
| Razer Blade 14 Ryzen 9 6900HX | |
| Average AMD Ryzen 9 6900HX (10950 - 17963, n=20) | |
| Razer Blade 14 Ryzen 9 RTX 3070 | |
| Asus ROG Zephyrus G14 GA402RK | |
| MSI Stealth GS66 12UGS | |
| Razer Blade 17 RTX 3080 Ti | |
| AIDA64 / FPU Julia | |
| Razer Blade 14 Ryzen 9 6900HX | |
| Average AMD Ryzen 9 6900HX (71414 - 110797, n=20) | |
| Razer Blade 14 Ryzen 9 RTX 3070 | |
| Asus ROG Zephyrus G14 GA402RK | |
| MSI Stealth GS66 12UGS | |
| Razer Blade 17 RTX 3080 Ti | |
| AIDA64 / CPU SHA3 | |
| Razer Blade 14 Ryzen 9 6900HX | |
| Average AMD Ryzen 9 6900HX (2471 - 3804, n=20) | |
| MSI Stealth GS66 12UGS | |
| Razer Blade 14 Ryzen 9 RTX 3070 | |
| Asus ROG Zephyrus G14 GA402RK | |
| Razer Blade 17 RTX 3080 Ti | |
| AIDA64 / CPU Queen | |
| Asus ROG Zephyrus G14 GA402RK | |
| Razer Blade 14 Ryzen 9 6900HX | |
| Razer Blade 17 RTX 3080 Ti | |
| Average AMD Ryzen 9 6900HX (84185 - 107544, n=20) | |
| MSI Stealth GS66 12UGS | |
| Razer Blade 14 Ryzen 9 RTX 3070 | |
| AIDA64 / FPU SinJulia | |
| Razer Blade 14 Ryzen 9 6900HX | |
| Asus ROG Zephyrus G14 GA402RK | |
| Average AMD Ryzen 9 6900HX (10970 - 13205, n=20) | |
| Razer Blade 14 Ryzen 9 RTX 3070 | |
| MSI Stealth GS66 12UGS | |
| Razer Blade 17 RTX 3080 Ti | |
| AIDA64 / FPU Mandel | |
| Razer Blade 14 Ryzen 9 6900HX | |
| Average AMD Ryzen 9 6900HX (39164 - 61370, n=20) | |
| Razer Blade 14 Ryzen 9 RTX 3070 | |
| Asus ROG Zephyrus G14 GA402RK | |
| MSI Stealth GS66 12UGS | |
| Razer Blade 17 RTX 3080 Ti | |
| AIDA64 / CPU AES | |
| Razer Blade 14 Ryzen 9 6900HX | |
| Asus ROG Zephyrus G14 GA402RK | |
| Razer Blade 14 Ryzen 9 RTX 3070 | |
| Average AMD Ryzen 9 6900HX (54613 - 142360, n=20) | |
| MSI Stealth GS66 12UGS | |
| Razer Blade 17 RTX 3080 Ti | |
| AIDA64 / CPU ZLib | |
| MSI Stealth GS66 12UGS | |
| Razer Blade 17 RTX 3080 Ti | |
| Razer Blade 14 Ryzen 9 6900HX | |
| Average AMD Ryzen 9 6900HX (578 - 911, n=20) | |
| Asus ROG Zephyrus G14 GA402RK | |
| Razer Blade 14 Ryzen 9 RTX 3070 | |
| AIDA64 / FP64 Ray-Trace | |
| Razer Blade 14 Ryzen 9 6900HX | |
| Razer Blade 14 Ryzen 9 RTX 3070 | |
| Average AMD Ryzen 9 6900HX (5798 - 9540, n=20) | |
| Asus ROG Zephyrus G14 GA402RK | |
| MSI Stealth GS66 12UGS | |
| Razer Blade 17 RTX 3080 Ti | |
| AIDA64 / CPU PhotoWorxx | |
| Razer Blade 17 RTX 3080 Ti | |
| MSI Stealth GS66 12UGS | |
| Asus ROG Zephyrus G14 GA402RK | |
| Average AMD Ryzen 9 6900HX (26873 - 30604, n=20) | |
| Razer Blade 14 Ryzen 9 6900HX | |
| Razer Blade 14 Ryzen 9 RTX 3070 | |
System Performance
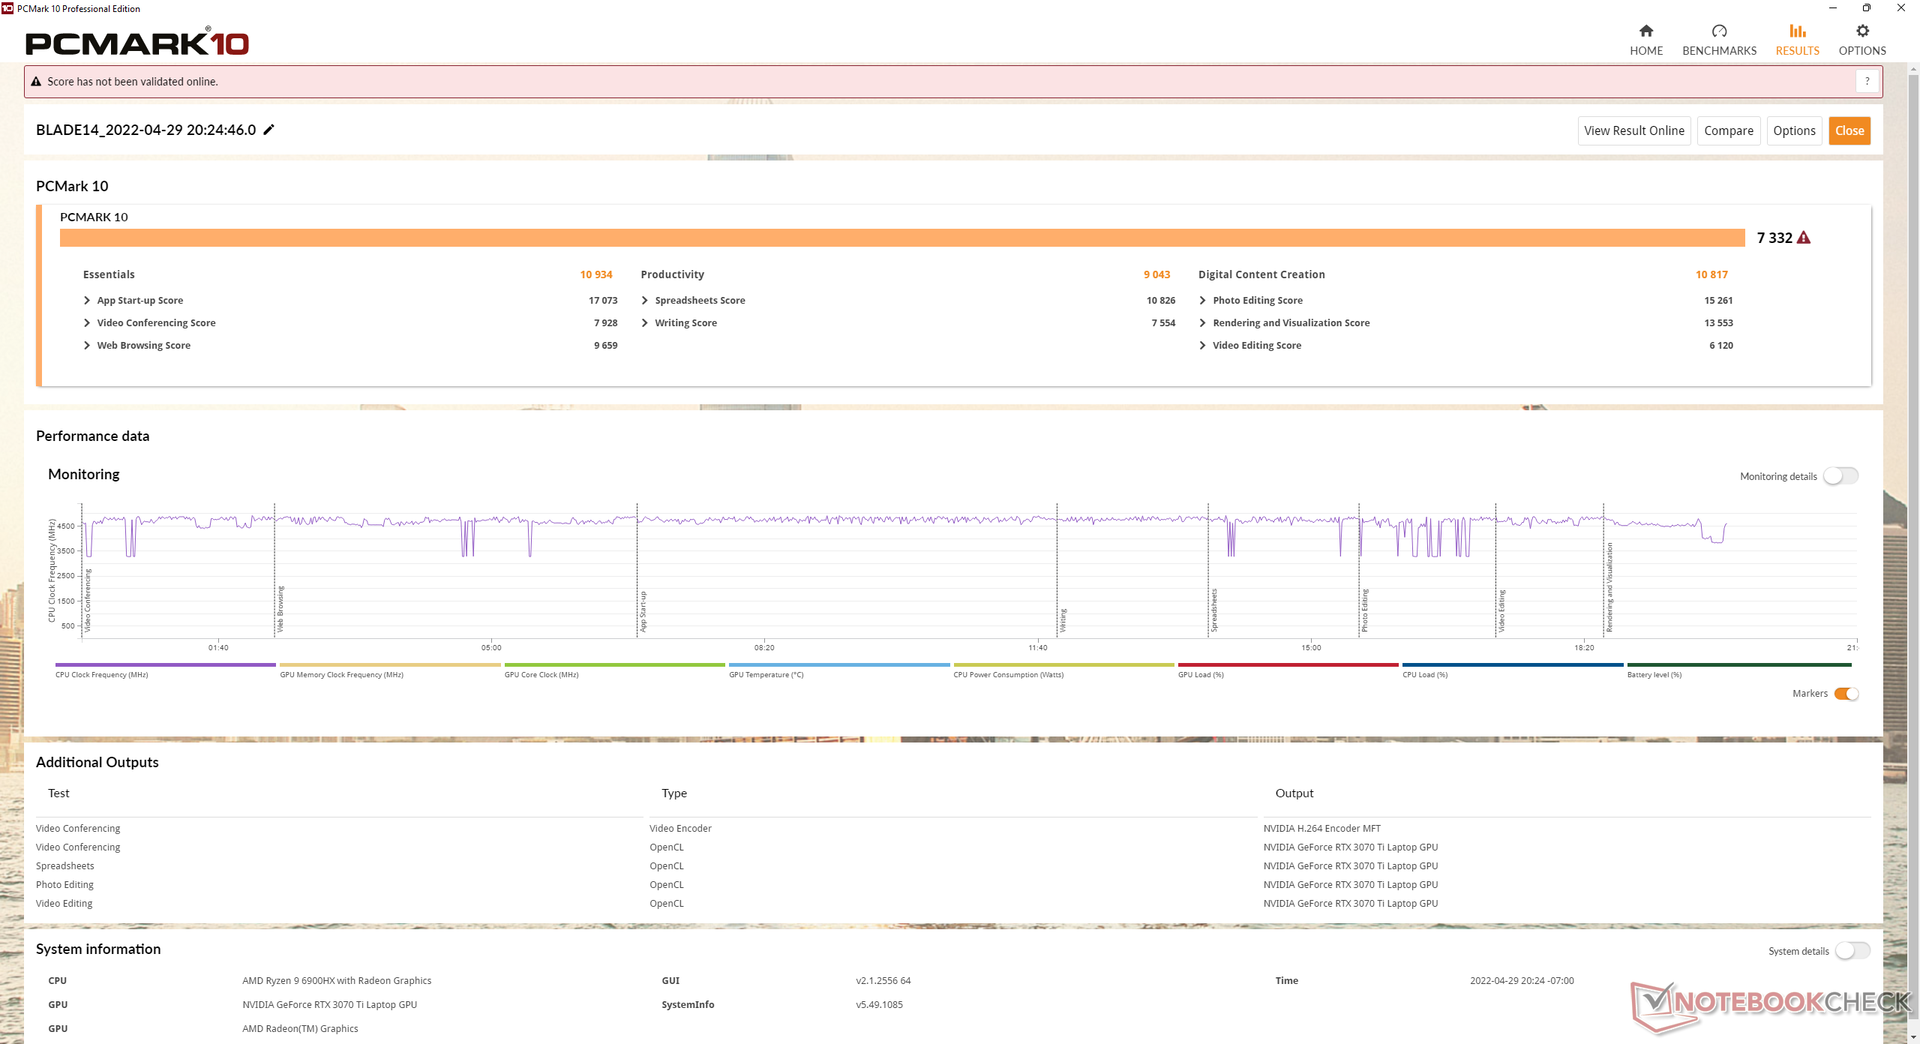
PCMark results are ever-so-slightly faster than on last year's model by just a few percentage points. More notably, scores are comparable to many larger gaming laptops including the MSI GE76 series.
| PCMark 10 / Score | |
| Razer Blade 17 RTX 3080 Ti | |
| Asus ROG Zephyrus G14 GA402RK | |
| MSI Stealth GS66 12UGS | |
| Razer Blade 14 Ryzen 9 6900HX | |
| Average AMD Ryzen 9 6900HX, NVIDIA GeForce RTX 3070 Ti Laptop GPU (7161 - 7332, n=3) | |
| Razer Blade 14 Ryzen 9 RTX 3070 | |
| Asus ROG Zephyrus Duo 15 SE GX551QS | |
| PCMark 10 / Essentials | |
| Razer Blade 14 Ryzen 9 6900HX | |
| Asus ROG Zephyrus G14 GA402RK | |
| MSI Stealth GS66 12UGS | |
| Razer Blade 17 RTX 3080 Ti | |
| Average AMD Ryzen 9 6900HX, NVIDIA GeForce RTX 3070 Ti Laptop GPU (10431 - 10934, n=3) | |
| Razer Blade 14 Ryzen 9 RTX 3070 | |
| Asus ROG Zephyrus Duo 15 SE GX551QS | |
| PCMark 10 / Productivity | |
| Asus ROG Zephyrus G14 GA402RK | |
| Average AMD Ryzen 9 6900HX, NVIDIA GeForce RTX 3070 Ti Laptop GPU (9043 - 9960, n=3) | |
| MSI Stealth GS66 12UGS | |
| Razer Blade 17 RTX 3080 Ti | |
| Razer Blade 14 Ryzen 9 RTX 3070 | |
| Razer Blade 14 Ryzen 9 6900HX | |
| Asus ROG Zephyrus Duo 15 SE GX551QS | |
| PCMark 10 / Digital Content Creation | |
| Razer Blade 17 RTX 3080 Ti | |
| Asus ROG Zephyrus G14 GA402RK | |
| MSI Stealth GS66 12UGS | |
| Razer Blade 14 Ryzen 9 6900HX | |
| Average AMD Ryzen 9 6900HX, NVIDIA GeForce RTX 3070 Ti Laptop GPU (9351 - 10817, n=3) | |
| Asus ROG Zephyrus Duo 15 SE GX551QS | |
| Razer Blade 14 Ryzen 9 RTX 3070 | |
| PCMark 10 Score | 7332 points | |
Help | ||
| AIDA64 / Memory Copy | |
| Razer Blade 17 RTX 3080 Ti | |
| MSI Stealth GS66 12UGS | |
| Asus ROG Zephyrus G14 GA402RK | |
| Average AMD Ryzen 9 6900HX (47938 - 53345, n=20) | |
| Razer Blade 14 Ryzen 9 6900HX | |
| Razer Blade 14 Ryzen 9 RTX 3070 | |
| AIDA64 / Memory Read | |
| Razer Blade 17 RTX 3080 Ti | |
| MSI Stealth GS66 12UGS | |
| Asus ROG Zephyrus G14 GA402RK | |
| Average AMD Ryzen 9 6900HX (43892 - 53321, n=20) | |
| Razer Blade 14 Ryzen 9 6900HX | |
| Razer Blade 14 Ryzen 9 RTX 3070 | |
| AIDA64 / Memory Write | |
| MSI Stealth GS66 12UGS | |
| Razer Blade 17 RTX 3080 Ti | |
| Asus ROG Zephyrus G14 GA402RK | |
| Average AMD Ryzen 9 6900HX (51085 - 57202, n=20) | |
| Razer Blade 14 Ryzen 9 6900HX | |
| Razer Blade 14 Ryzen 9 RTX 3070 | |
| AIDA64 / Memory Latency | |
| MSI Stealth GS66 12UGS | |
| Average AMD Ryzen 9 6900HX (80.7 - 120.6, n=20) | |
| Razer Blade 14 Ryzen 9 RTX 3070 | |
| Razer Blade 14 Ryzen 9 6900HX | |
| Asus ROG Zephyrus G14 GA402RK | |
| Razer Blade 17 RTX 3080 Ti | |
* ... smaller is better
DPC Latency
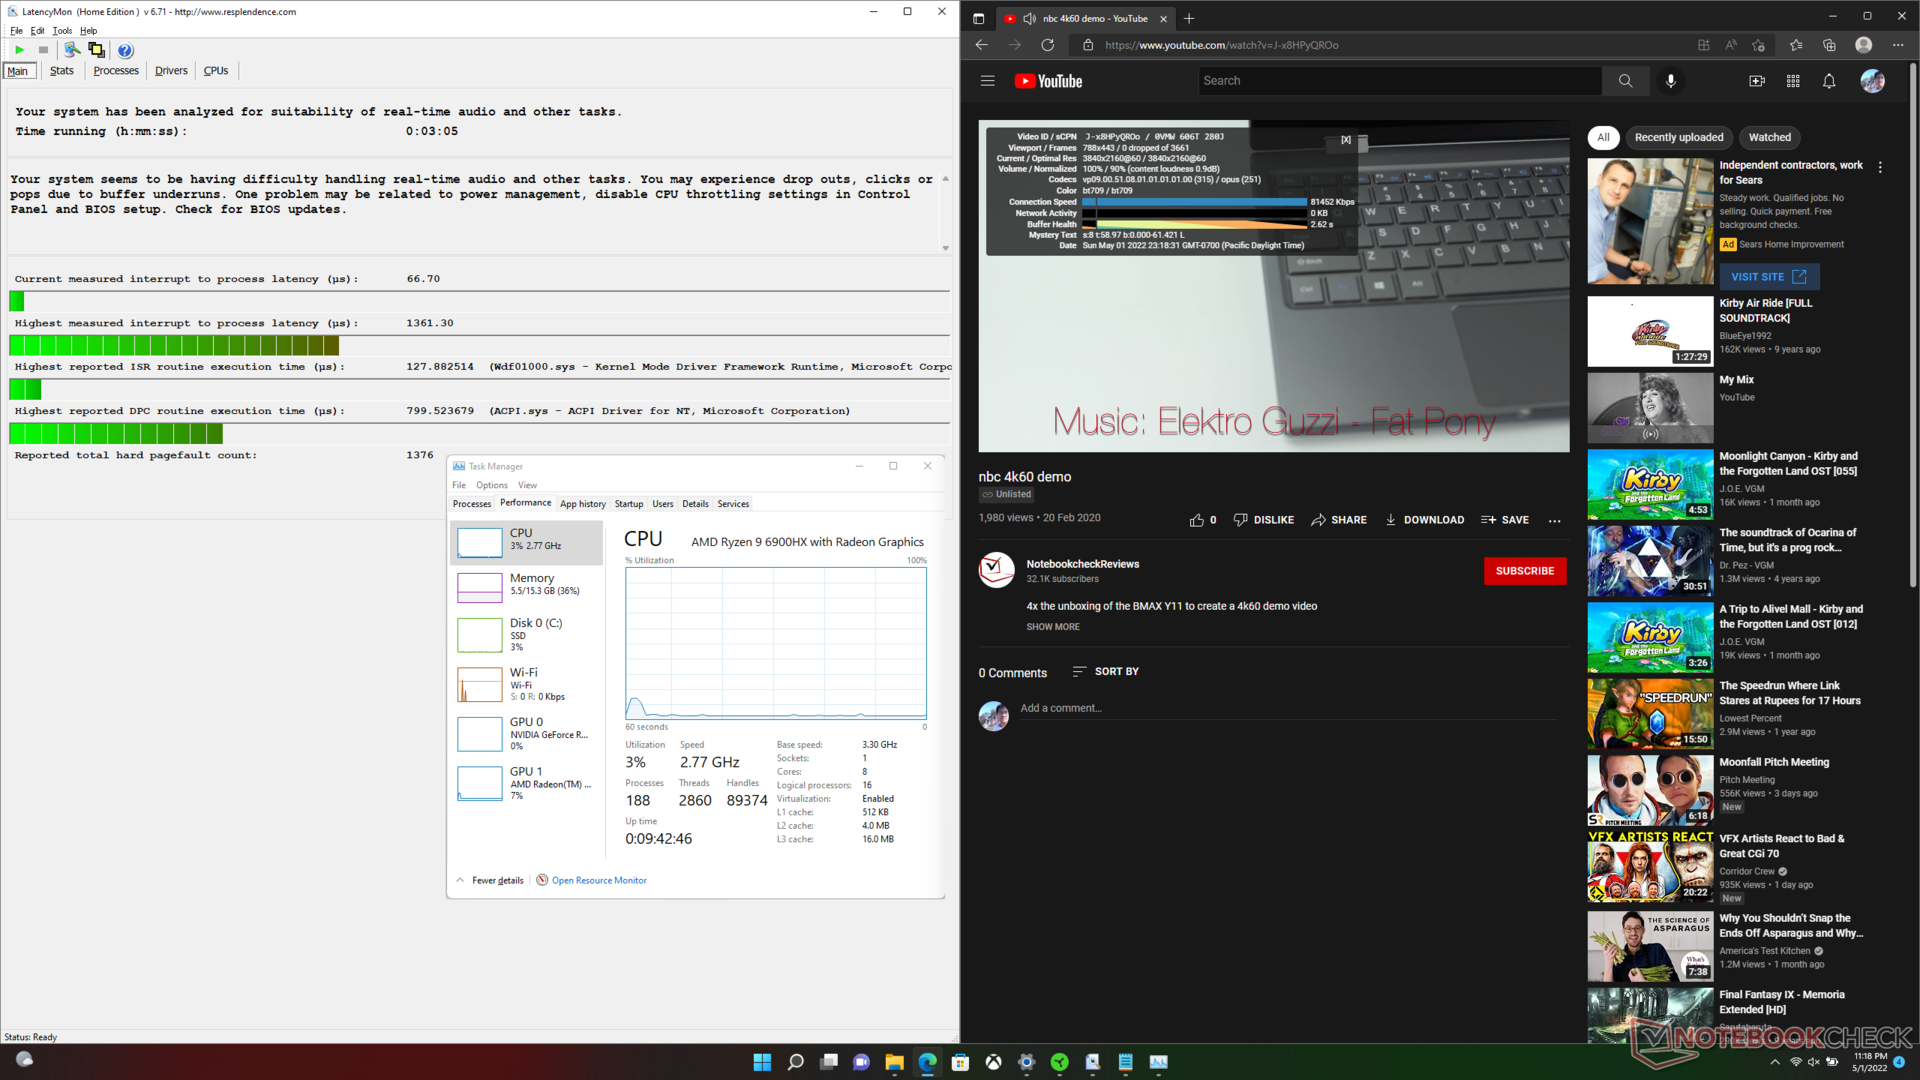
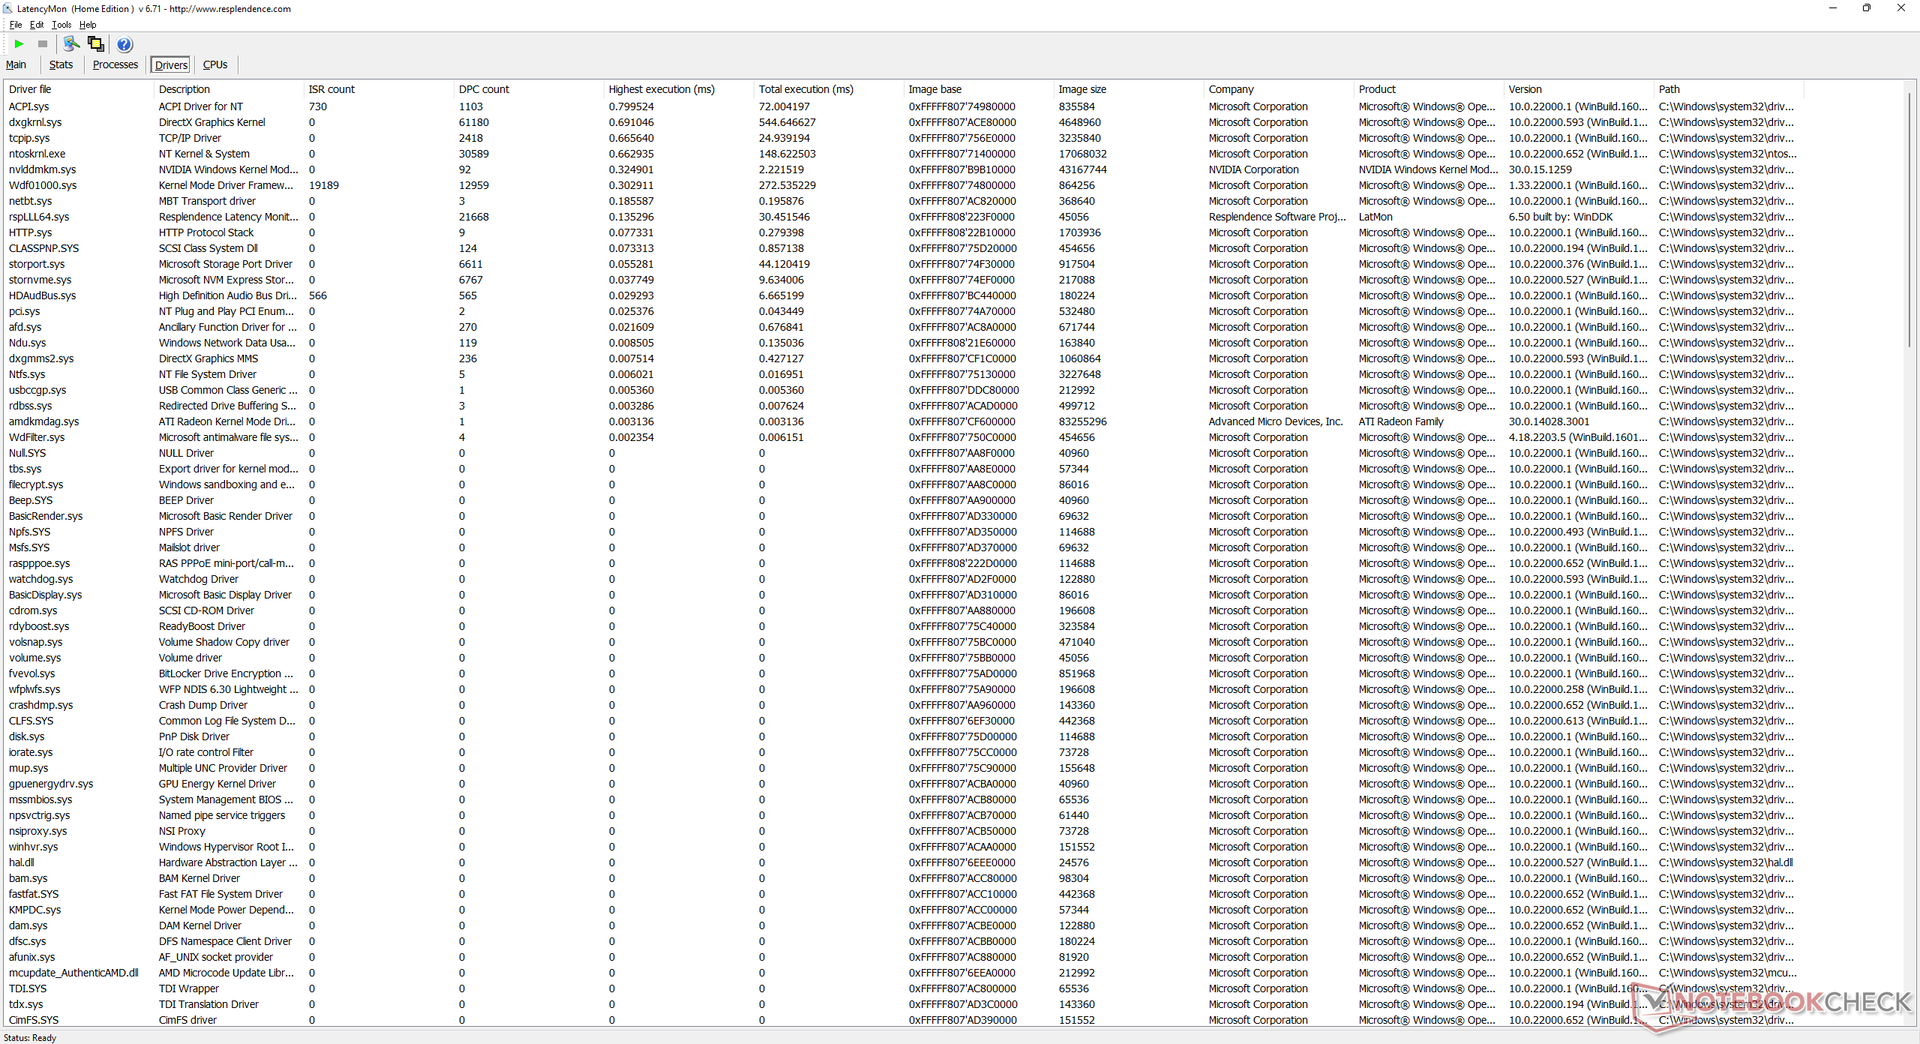
LatencyMon shows no DPC issues when opening multiple browser tabs on our homepage. However, a latency spike may occur when running Prime95 to stress the CPU. 4K video playback at 60 FPS is otherwise smooth and with no dropped frames. CPU and GPU utilization would be very low at just 3 percent and 7 percent, respectively.
| DPC Latencies / LatencyMon - interrupt to process latency (max), Web, Youtube, Prime95 | |
| Asus ROG Zephyrus G14 GA402RK | |
| MSI Stealth GS66 12UGS | |
| Razer Blade 14 Ryzen 9 6900HX | |
| Asus ROG Zephyrus Duo 15 SE GX551QS | |
| Razer Blade 17 RTX 3080 Ti | |
| Razer Blade 14 Ryzen 9 RTX 3070 | |
* ... smaller is better
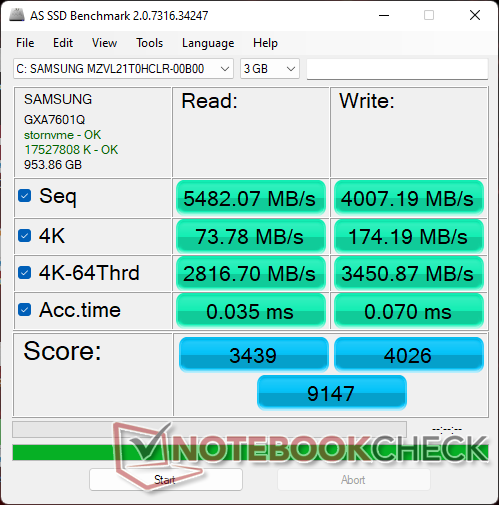
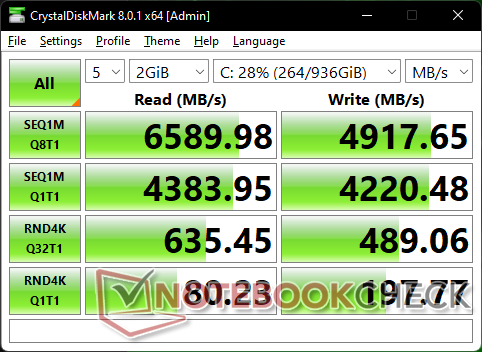
Storage Devices — Now With PCIe4 x4 Support
One of our main complaints about the 2021 Blade 14 has been addressed on the 2022 model. Users can now configure with faster PCIe4 x4 NVMe SSDs instead of being limited to PCIe3 x4 speeds. Sequential read rates from our Samsung PM9A1 MZVL21T0HCLR can reach over 6600 MB/s sustained compared to ~3500 MB/s sustained on last year's Samsung PM981a MZVLB1T0HBLR.

* ... smaller is better
Disk Throttling: DiskSpd Read Loop, Queue Depth 8
GPU Performance — Not Much Of An Upgrade
The performance jump from the GeForce RTX 3070 in the 2021 Blade 14 to the GeForce RTX 3070 Ti in our 2022 model is minor-to-moderate depending on the game and resolution setting. Games on the 2022 model can run up to 30 to 40 percent faster if on lower graphical settings while higher settings at the native 1440p resolution will see much smaller advantages of under 10 percent. Cyberpunk 2077 is an excellent example where this would occur. We suspect that the significant bump in single-thread CPU performance over the Ryzen 9 5900HX is responsible for the much faster frame rates in CPU-bound scenarios while the faster DDR5-4800 RAM of the 2022 model can contribute more than the slower DDR4-3200 RAM in the older 2021 model when gaming at higher resolutions.
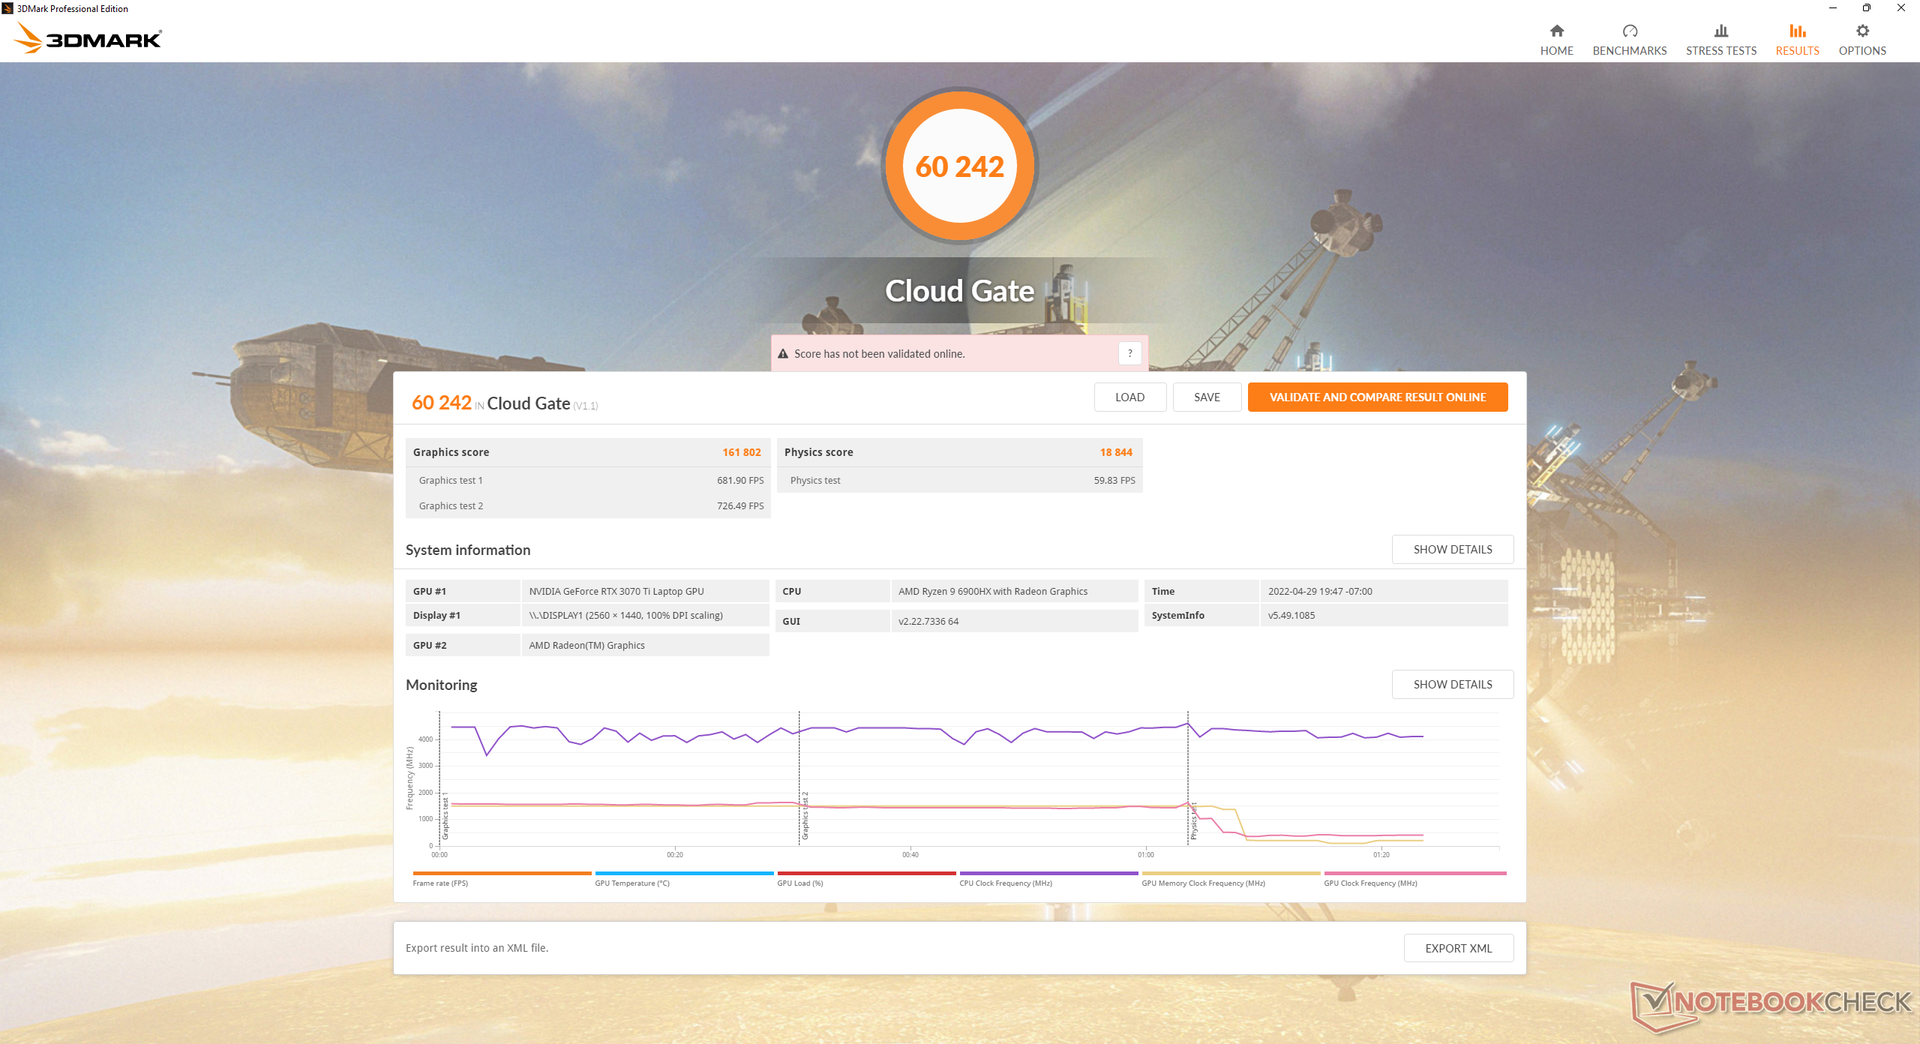
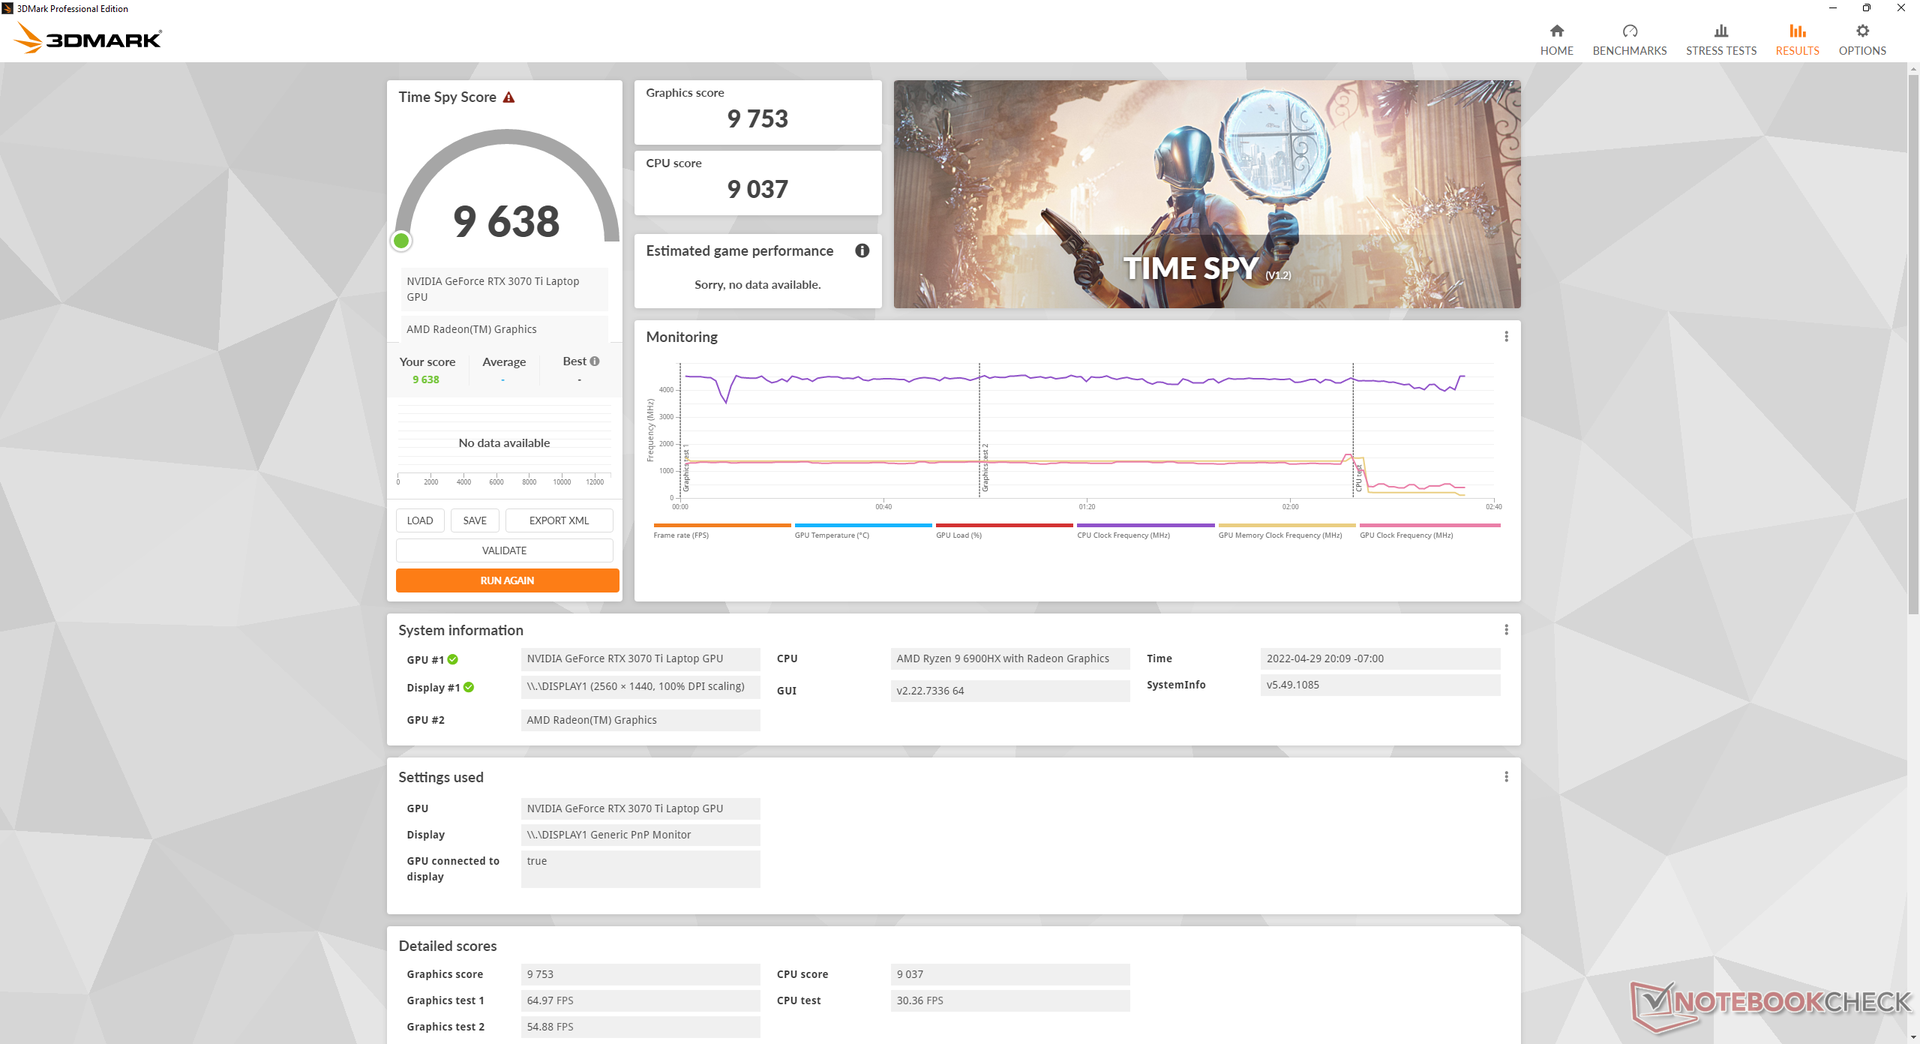
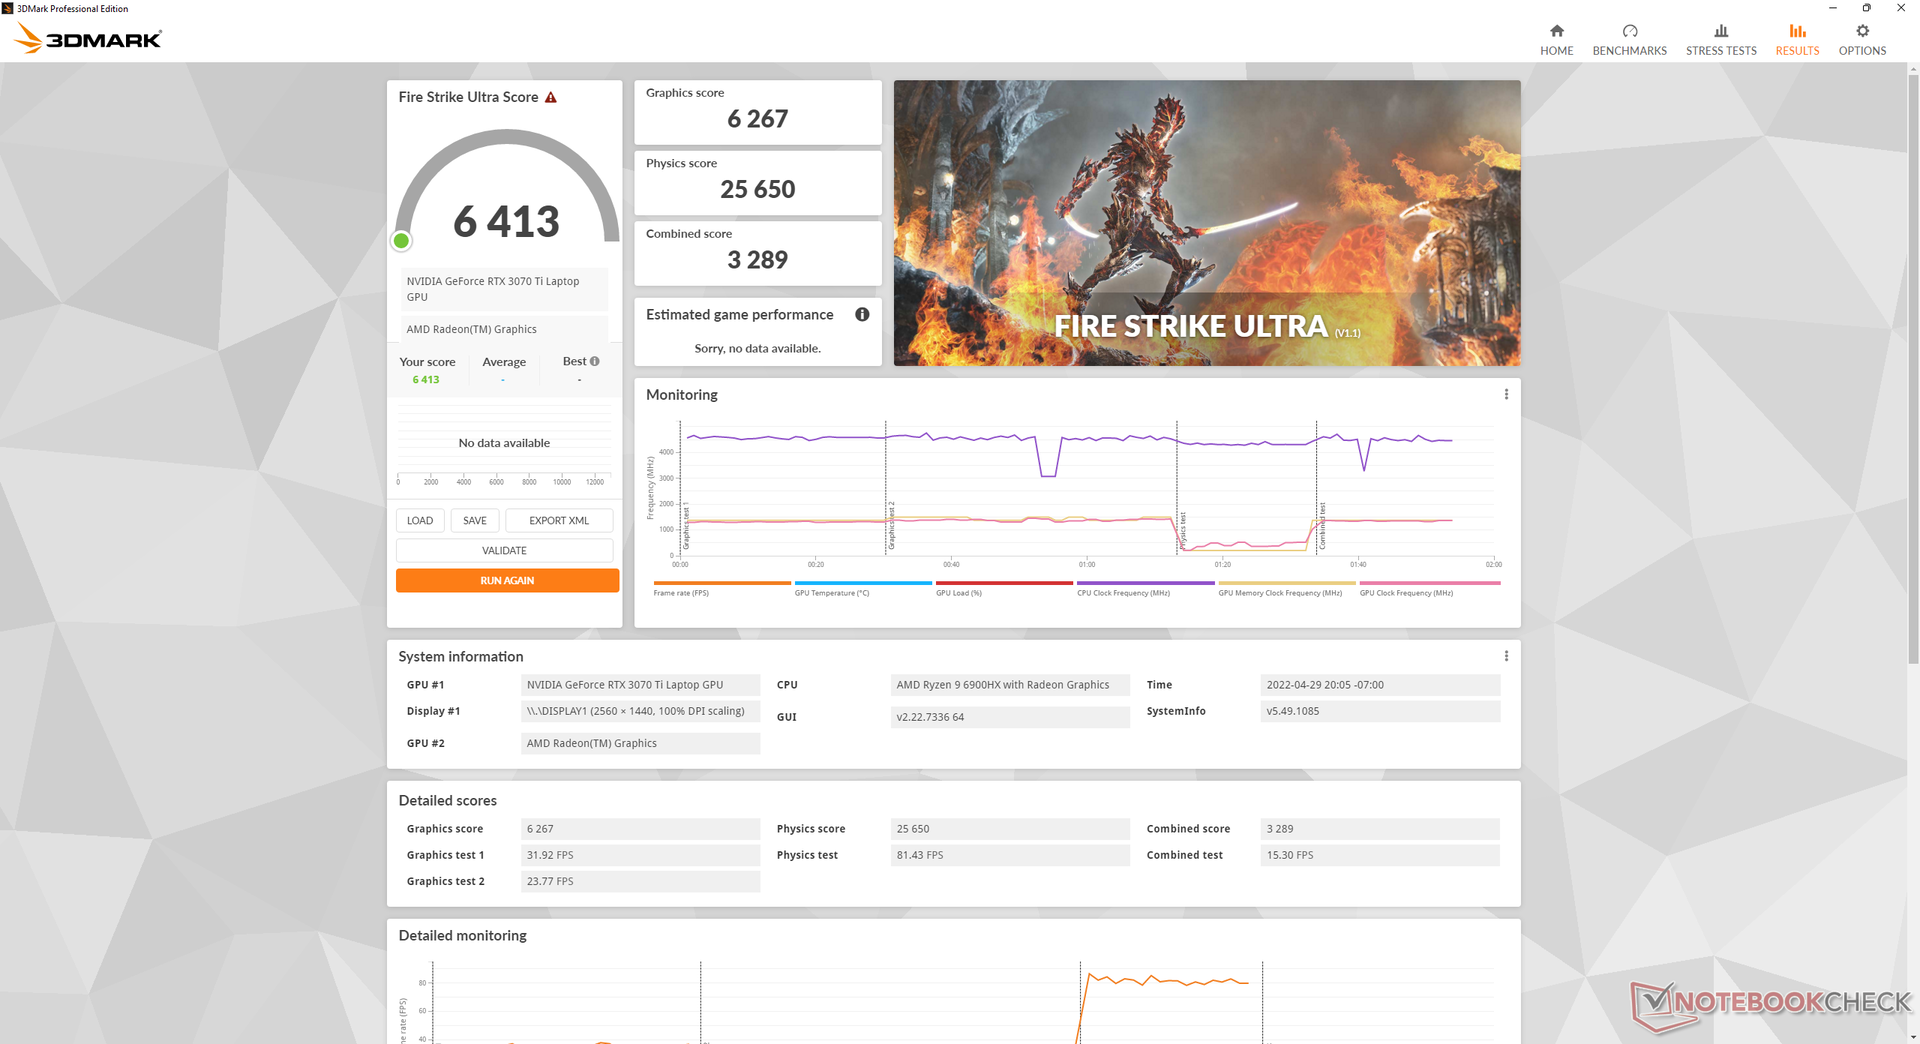
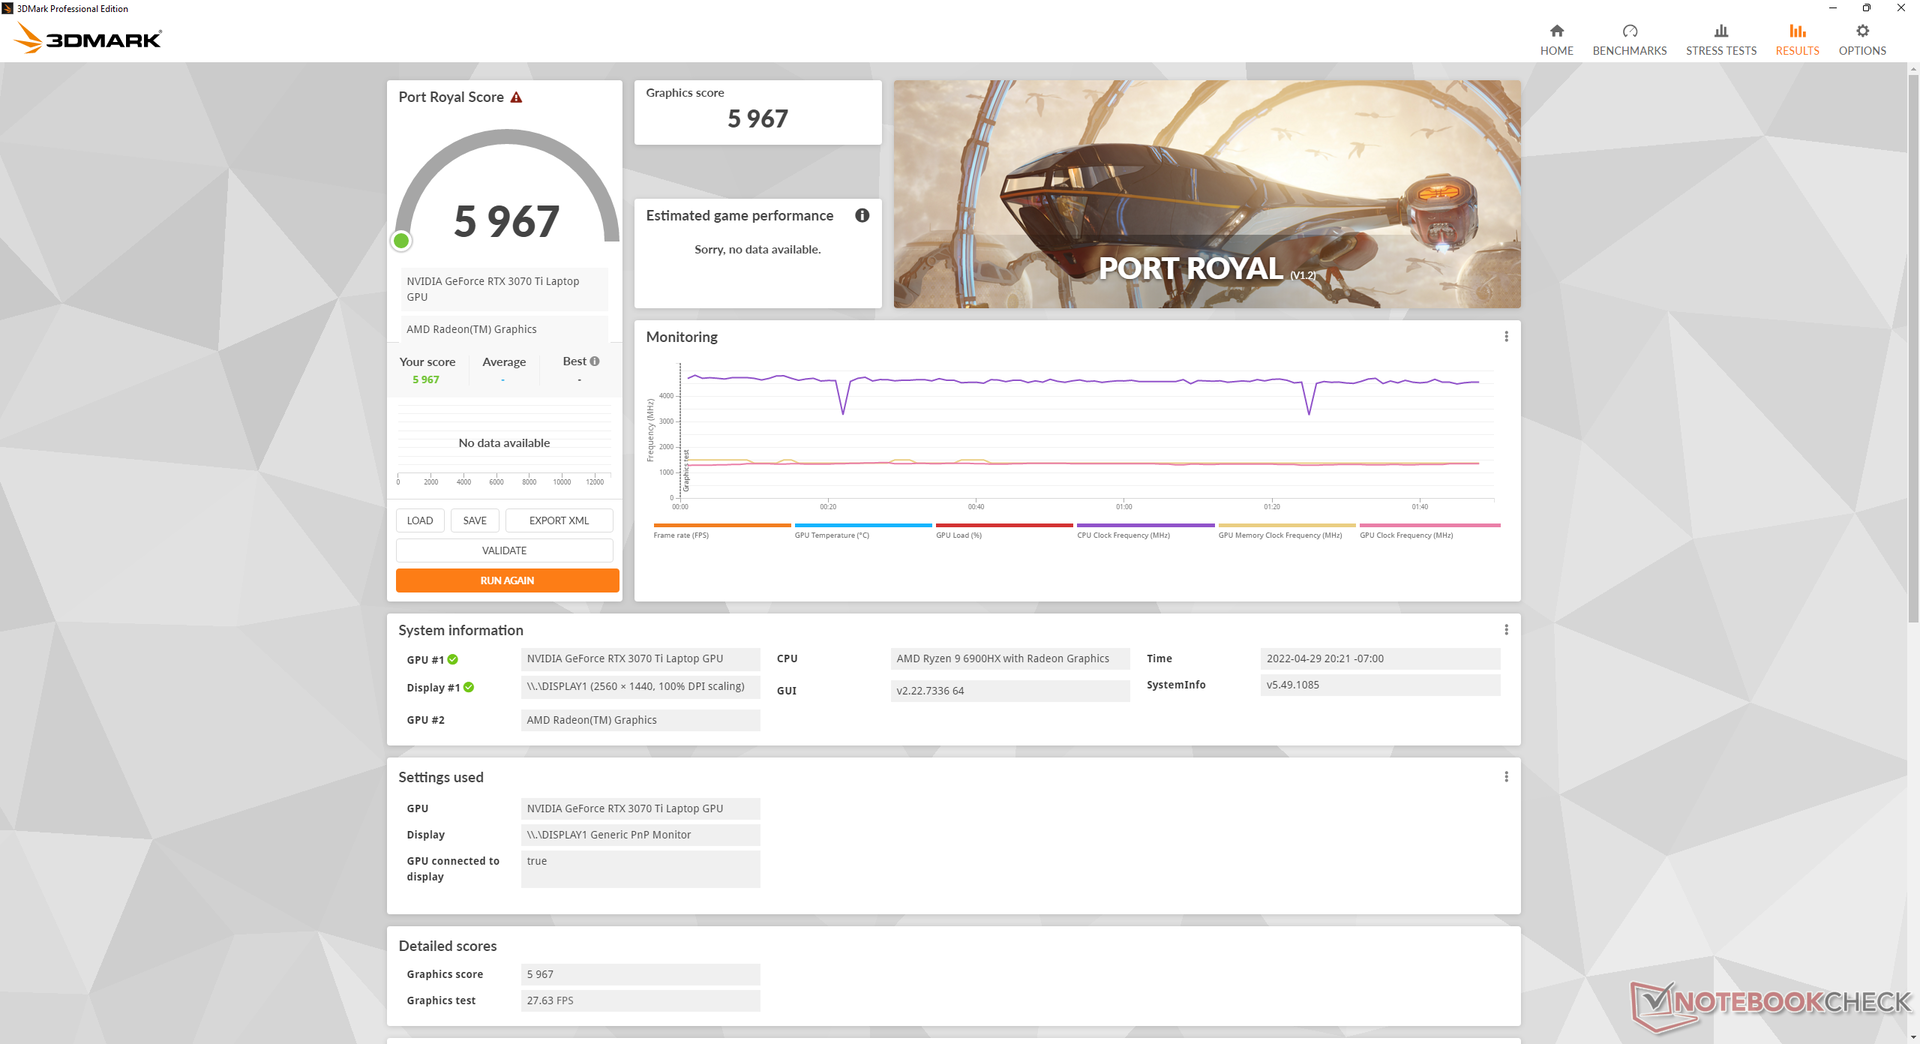
The difference between the mobile RTX 3070 and mobile RTX 3070 Ti is relatively minor according to 3DMark benchmarks despite the fact that larger performance margins can be observed when running actual games on certain resolutions. This suggests that the faster CPU and RAM on this year's Blade 14 are less of a bottleneck to the GPU.
Target TGP continues to be limited to 100 W which is on the lower-end of the performance scale. The MSI Vector GP66, for example, comes with the same RTX 3070 Ti GPU as our 2022 Blade 14 but with a higher TGP target of 150 W for up to 15 to 20 percent faster graphics performance.
Running on the Balanced profile instead of the Maximum Performance profile will impact both CPU and GPU performance by about 6 percent.
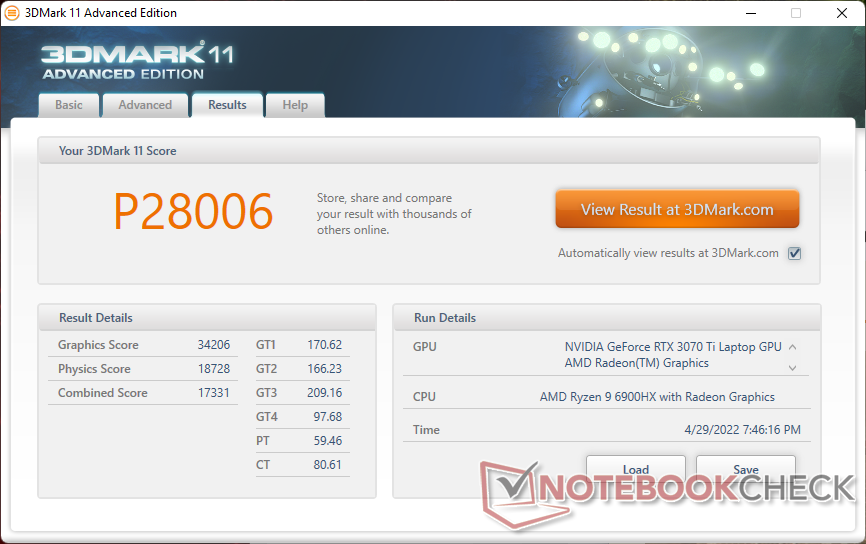

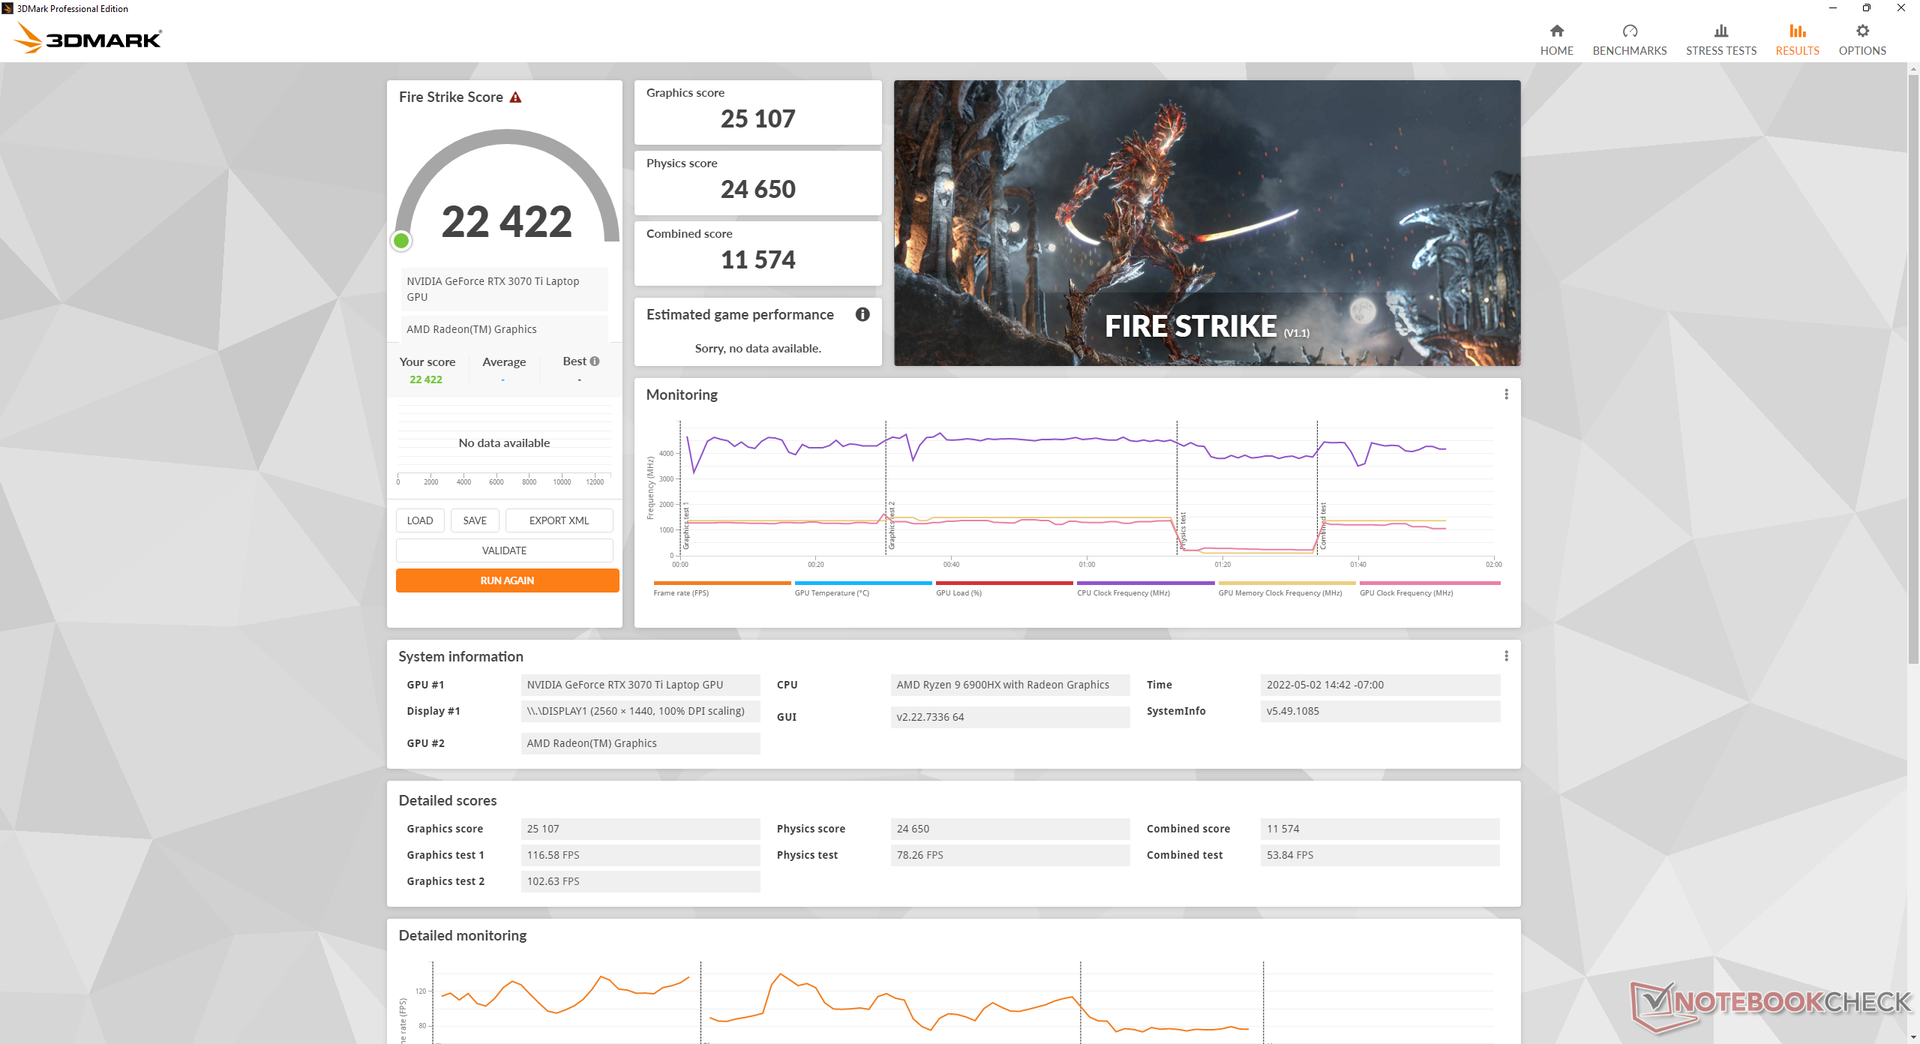
| 3DMark 11 Performance | 28006 points | |
| 3DMark Cloud Gate Standard Score | 60242 points | |
| 3DMark Fire Strike Score | 23725 points | |
| 3DMark Time Spy Score | 9638 points | |
Help | ||
Witcher 3 FPS Chart
| low | med. | high | ultra | QHD | |
|---|---|---|---|---|---|
| GTA V (2015) | 178.4 | 173.1 | 158.4 | 93 | 89.5 |
| The Witcher 3 (2015) | 386.2 | 300.4 | 187.5 | 95.2 | |
| Dota 2 Reborn (2015) | 145.6 | 131.1 | 126 | 120.5 | |
| Final Fantasy XV Benchmark (2018) | 177.1 | 128.9 | 98.1 | 74.1 | |
| X-Plane 11.11 (2018) | 114.9 | 100.8 | 81.7 | ||
| Far Cry 5 (2018) | 141 | 123 | 116 | 110 | 94 |
| Strange Brigade (2018) | 393 | 254 | 202 | 177.4 | 130 |
| Cyberpunk 2077 1.6 (2022) | 129.3 | 108.6 | 86 | 86 | 45.2 |
Emissions
System Noise — Not As Loud As Expected
Fan noise is not dissimilar to what we recorded on the 2021 model. We recommend running the system on either Silent or Balanced mode when browsing or video streaming for a much quieter experience. When gaming on High Performance mode, fan noise will stabilize at around 42 dB(A) to be similar to both the Zephyrus G14 or MSI GS66 under similar conditions.
Interestingly, we're unable to reach the same maximum 50+ dB(A) range that we observed on last year's model even when running Prime95 and FurMark on High Performance mode. This isn't to say that the newer model can't be as loud, but it's unlikely that users will reach such high fan noise levels in most scenarios.
Noise level
| Idle |
| 23.3 / 23.3 / 23.3 dB(A) |
| Load |
| 34.7 / 42.1 dB(A) |
 | ||
30 dB silent 40 dB(A) audible 50 dB(A) loud |
||
min: | ||
| Razer Blade 14 Ryzen 9 6900HX GeForce RTX 3070 Ti Laptop GPU, R9 6900HX, Samsung PM9A1 MZVL21T0HCLR | Razer Blade 14 Ryzen 9 RTX 3070 GeForce RTX 3070 Laptop GPU, R9 5900HX, Samsung PM981a MZVLB1T0HBLR | Razer Blade 17 RTX 3080 Ti GeForce RTX 3080 Ti Laptop GPU, i7-12800H, Samsung PM9A1 MZVL21T0HCLR | Asus ROG Zephyrus G14 GA402RK Radeon RX 6800S, R9 6900HS, Micron 2450 1TB MTFDKBK1T0TFK | MSI Stealth GS66 12UGS GeForce RTX 3070 Ti Laptop GPU, i7-12700H, WDC PC SN810 1TB | Asus ROG Zephyrus Duo 15 SE GX551QS GeForce RTX 3080 Laptop GPU, R9 5900HX, 2x Samsung PM981a MZVLB1T0HBLR (RAID 0) | |
|---|---|---|---|---|---|---|
| Noise | -7% | -9% | -13% | -25% | -12% | |
| off / environment * (dB) | 23.3 | 25.1 -8% | 23.3 -0% | 24 -3% | 24 -3% | 27 -16% |
| Idle Minimum * (dB) | 23.3 | 25.2 -8% | 23.3 -0% | 24 -3% | 31 -33% | 27 -16% |
| Idle Average * (dB) | 23.3 | 25.2 -8% | 23.3 -0% | 26 -12% | 32 -37% | 27 -16% |
| Idle Maximum * (dB) | 23.3 | 25.2 -8% | 26.3 -13% | 31 -33% | 35 -50% | 27 -16% |
| Load Average * (dB) | 34.7 | 31 11% | 38.2 -10% | 45 -30% | 48 -38% | 31.2 10% |
| Witcher 3 ultra * (dB) | 42.1 | 44 -5% | 50.9 -21% | 43 -2% | 43 -2% | 44.5 -6% |
| Load Maximum * (dB) | 42.1 | 51.7 -23% | 49.1 -17% | 45 -7% | 48 -14% | 53.5 -27% |
* ... smaller is better
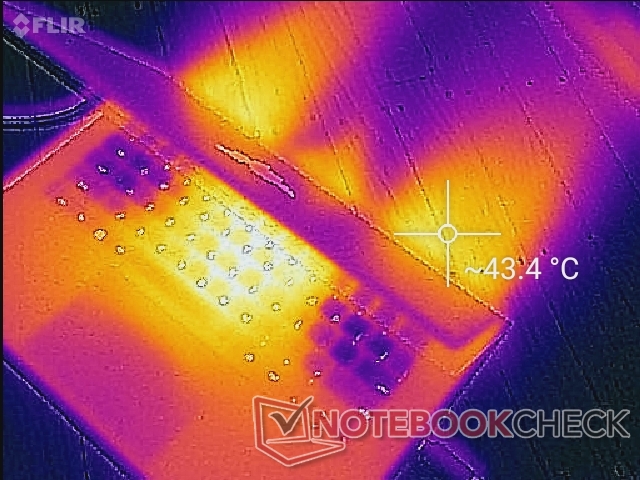
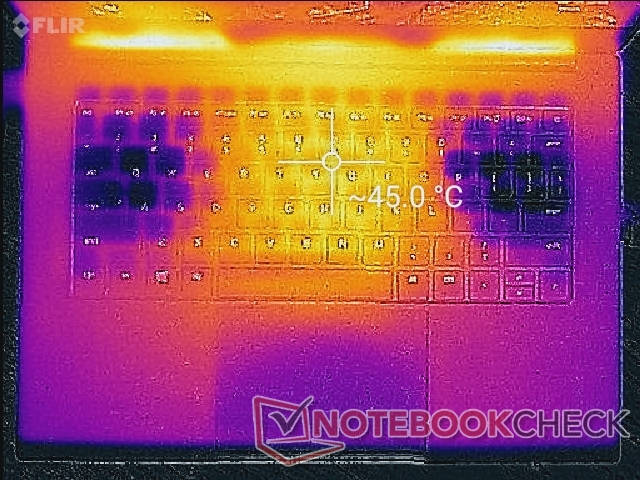
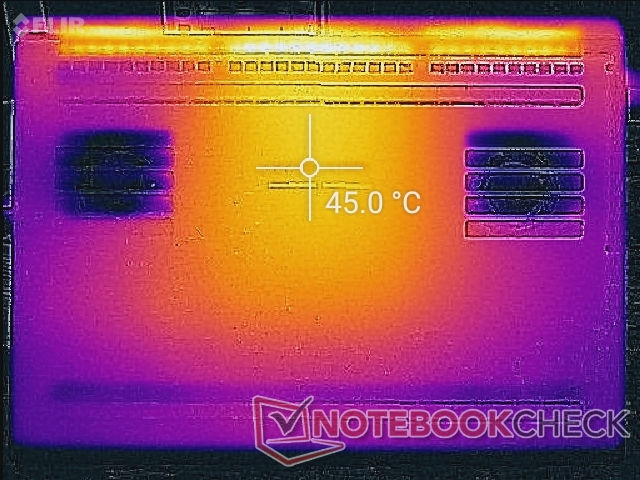
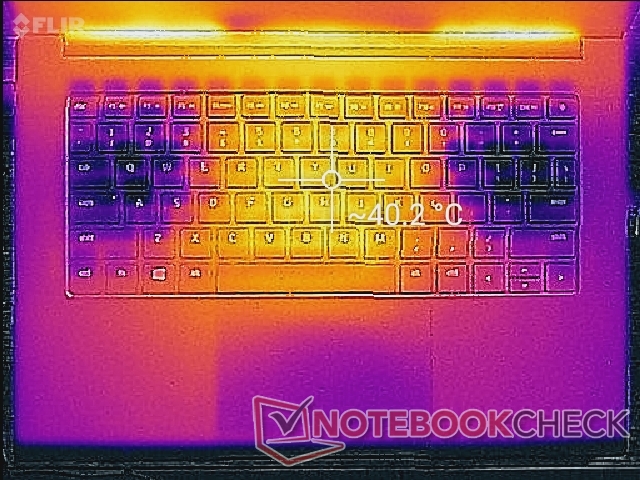
Temperature
Surface temperatures continue to be very warm even when simply idling on desktop with no demanding applications running. A typical 14-inch Ultrabook like the Asus Zenbook 14 UX425EA would be just 27 C on both its top and bottom sides when idling on desktop compared to 37 C on our Blade 14. It's not hot enough to be discomforting, but it's certainly noticeable on the palms or legs.
Running higher loads like games will induce hot spots of around 45 C to be similar to the aforementioned Zenbook 14 despite their massive performance differences. Most notably, the competing Zephyrus G14 can run even warmer than our Razer at up to 54 C when under similar gaming conditions.
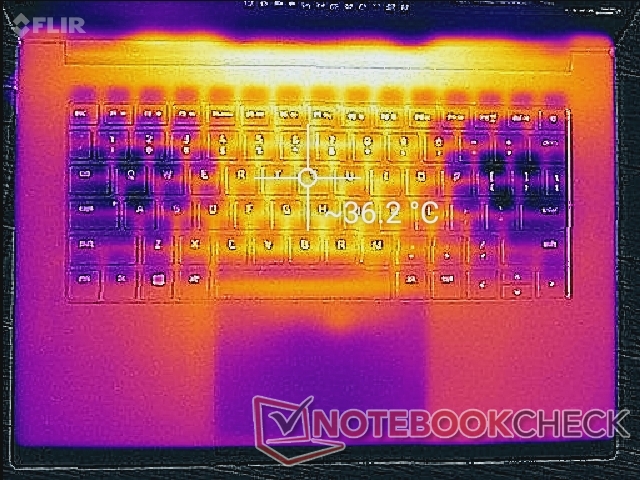
(±) The maximum temperature on the upper side is 40.6 °C / 105 F, compared to the average of 40.4 °C / 105 F, ranging from 21.2 to 68.8 °C for the class Gaming.
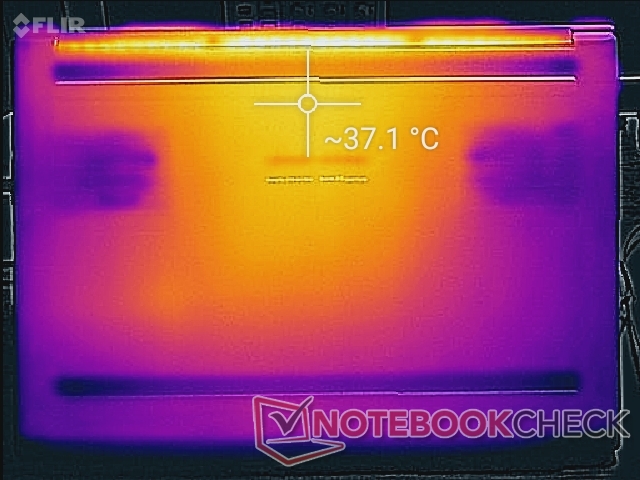
(±) The bottom heats up to a maximum of 42.6 °C / 109 F, compared to the average of 43.2 °C / 110 F
(±) In idle usage, the average temperature for the upper side is 32.3 °C / 90 F, compared to the device average of 33.9 °C / 93 F.
(±) Playing The Witcher 3, the average temperature for the upper side is 35.6 °C / 96 F, compared to the device average of 33.9 °C / 93 F.
(+) The palmrests and touchpad are cooler than skin temperature with a maximum of 31.8 °C / 89.2 F and are therefore cool to the touch.
(-) The average temperature of the palmrest area of similar devices was 28.8 °C / 83.8 F (-3 °C / -5.4 F).

| Razer Blade 14 Ryzen 9 6900HX AMD Ryzen 9 6900HX, NVIDIA GeForce RTX 3070 Ti Laptop GPU | Razer Blade 17 RTX 3080 Ti Intel Core i7-12800H, NVIDIA GeForce RTX 3080 Ti Laptop GPU | Asus ROG Zephyrus G14 GA402RK AMD Ryzen 9 6900HS, AMD Radeon RX 6800S | MSI Stealth GS66 12UGS Intel Core i7-12700H, NVIDIA GeForce RTX 3070 Ti Laptop GPU | Asus ROG Zephyrus Duo 15 SE GX551QS AMD Ryzen 9 5900HX, NVIDIA GeForce RTX 3080 Laptop GPU | |
|---|---|---|---|---|---|
| Heat | -6% | -7% | -3% | 9% | |
| Maximum Upper Side * (°C) | 40.6 | 46 -13% | 55 -35% | 54 -33% | 33.4 18% |
| Maximum Bottom * (°C) | 42.6 | 46.8 -10% | 55 -29% | 59 -38% | 45 -6% |
| Idle Upper Side * (°C) | 38 | 36.2 5% | 30 21% | 26 32% | 30.8 19% |
| Idle Bottom * (°C) | 37 | 38.6 -4% | 32 14% | 27 27% | 35.4 4% |
* ... smaller is better
Stress Test
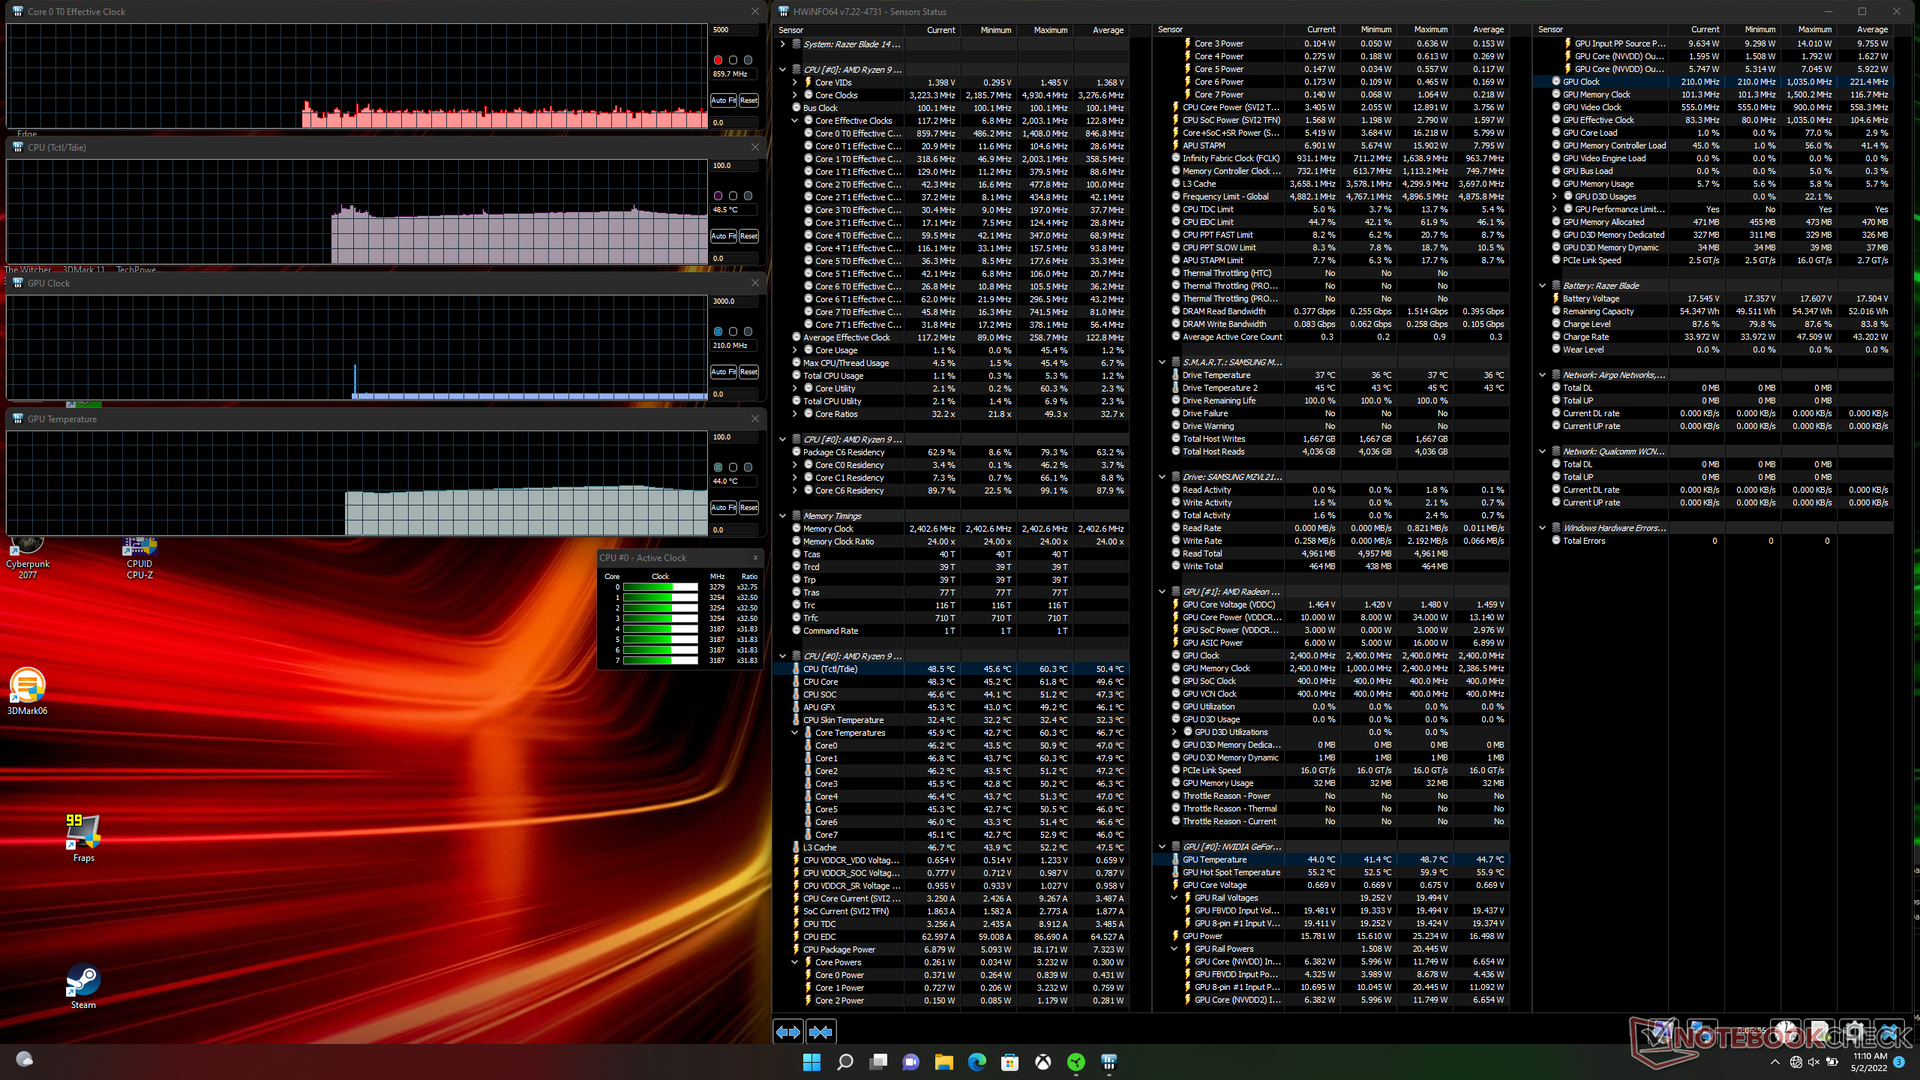
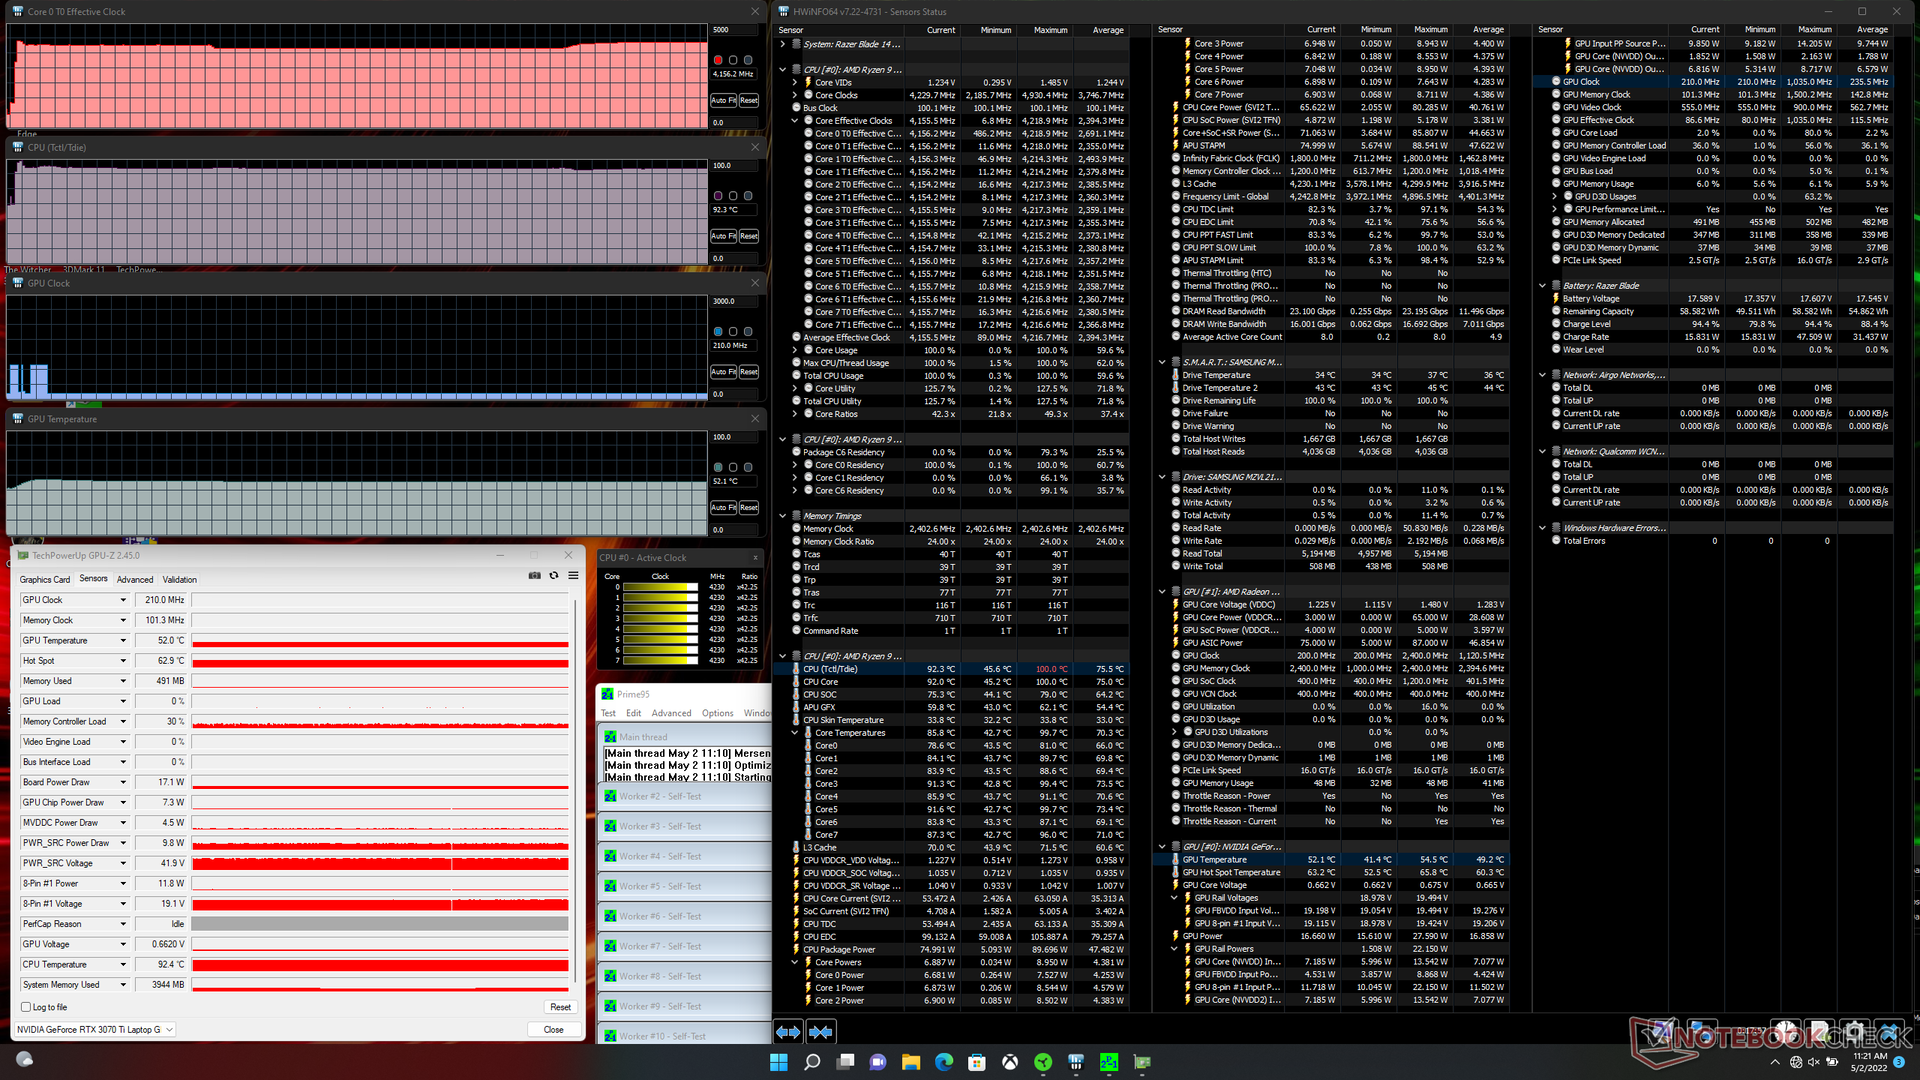
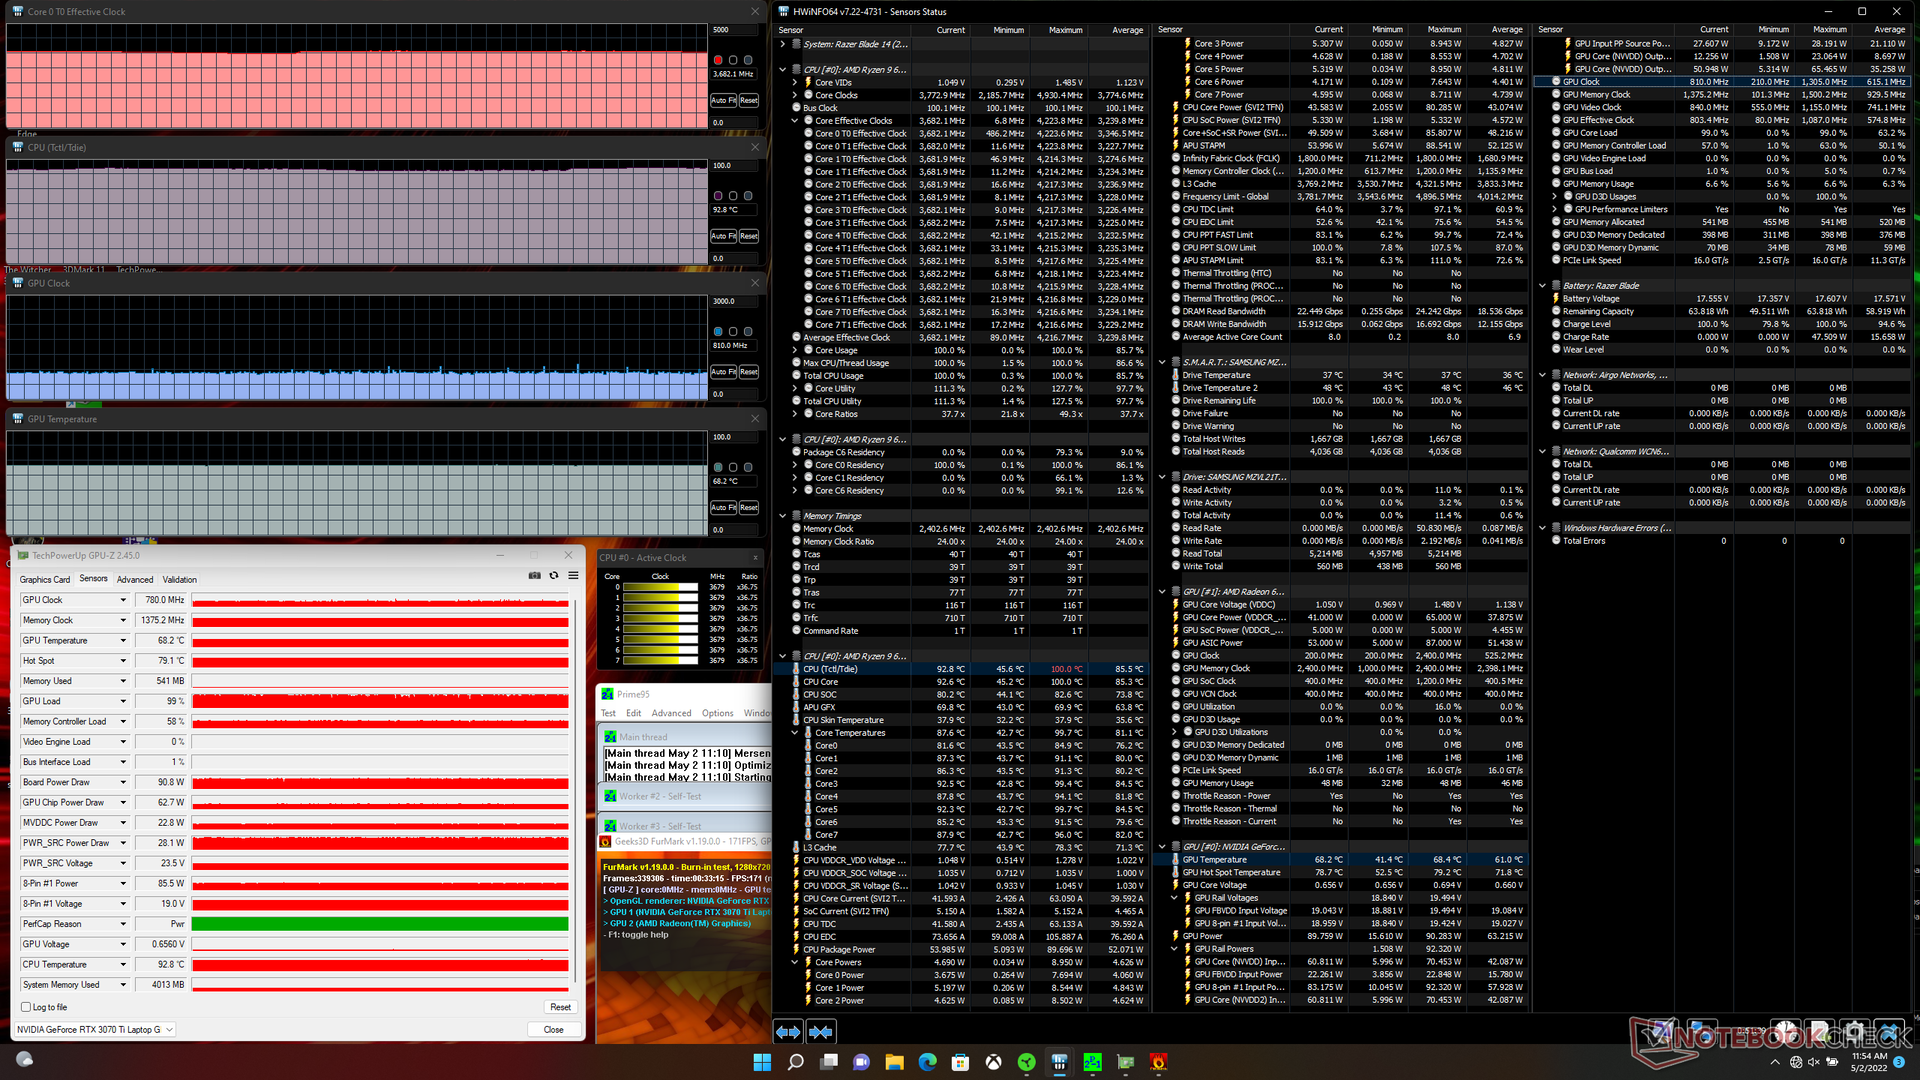
When running Prime95 to stress the CPU, clock rates would settle at around 4.0 to 4.2 GHz and at a very warm core temperature of almost 93 C to be close to what we recorded on the 2021 Blade 14 with the older Ryzen 9 5900HX. However, CPU package power is higher this time around at 90 W during the start of the test before stabilizing at 75 W compared to 77 W and 53 W on the 2021 model. It's clear that the CPU is making the most of the small chassis size here by running as fast as it can while staying a hair below 100 C.
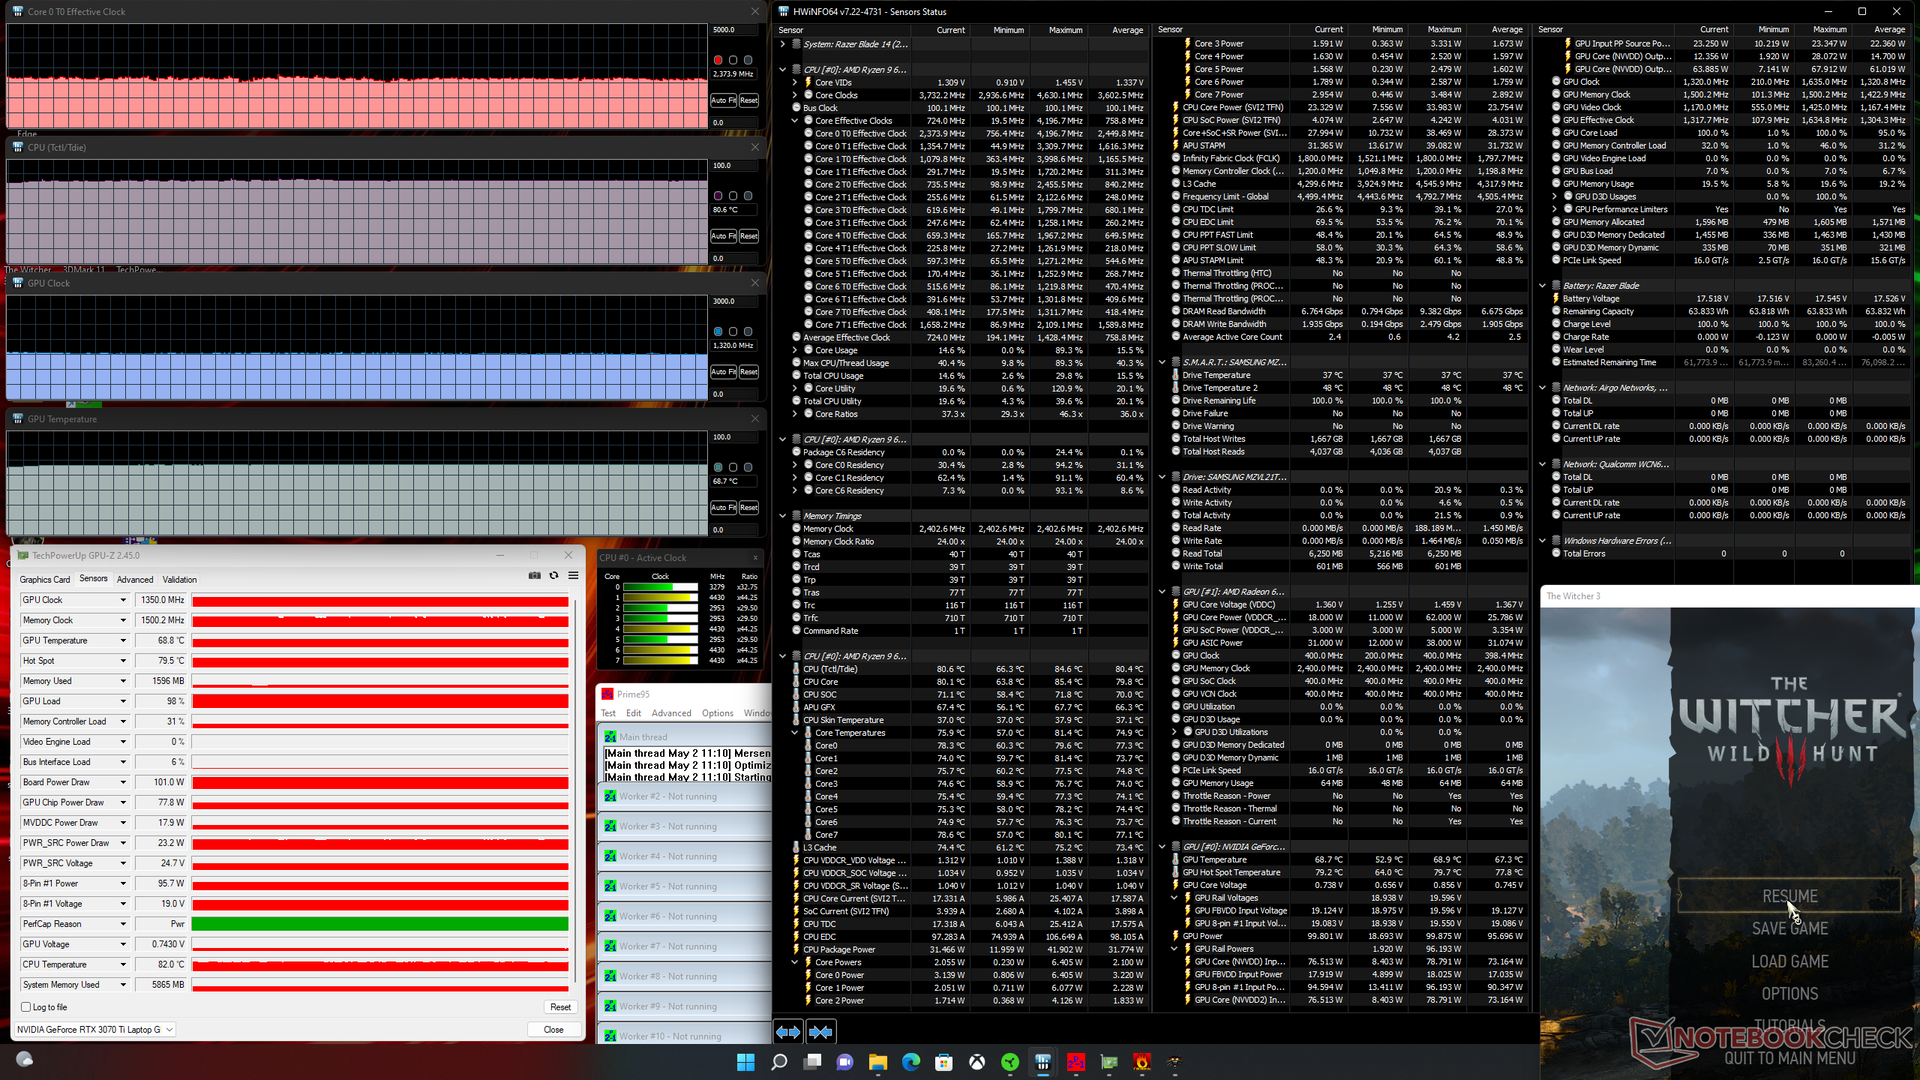
Running Witcher 3 on Maximum Performance mode shows a GPU clock, memory clock, and board power draw of 1350 MHz, 1500 MHz, and 101 W, respectively, compared to 1275 MHz, 1375 MHz, and 89 W if running on Balanced mode. Thus, users will want to enable maximum performance via the Synapse software if they want to get the most performance out of the laptop. Running this same test on the larger MSI Vector GP66 with the same RTX 3070 Ti GPU would see higher GPU and memory clock rates of 1650 MHz and 1750 MHz, respectively, due to its higher TGP target.
CPU and GPU core temperatures are warmer (81 C vs. 74 C) and cooler (69 C vs 77 C), respectively, than on the Zephyrus G14 when running the same Witcher 3 test.
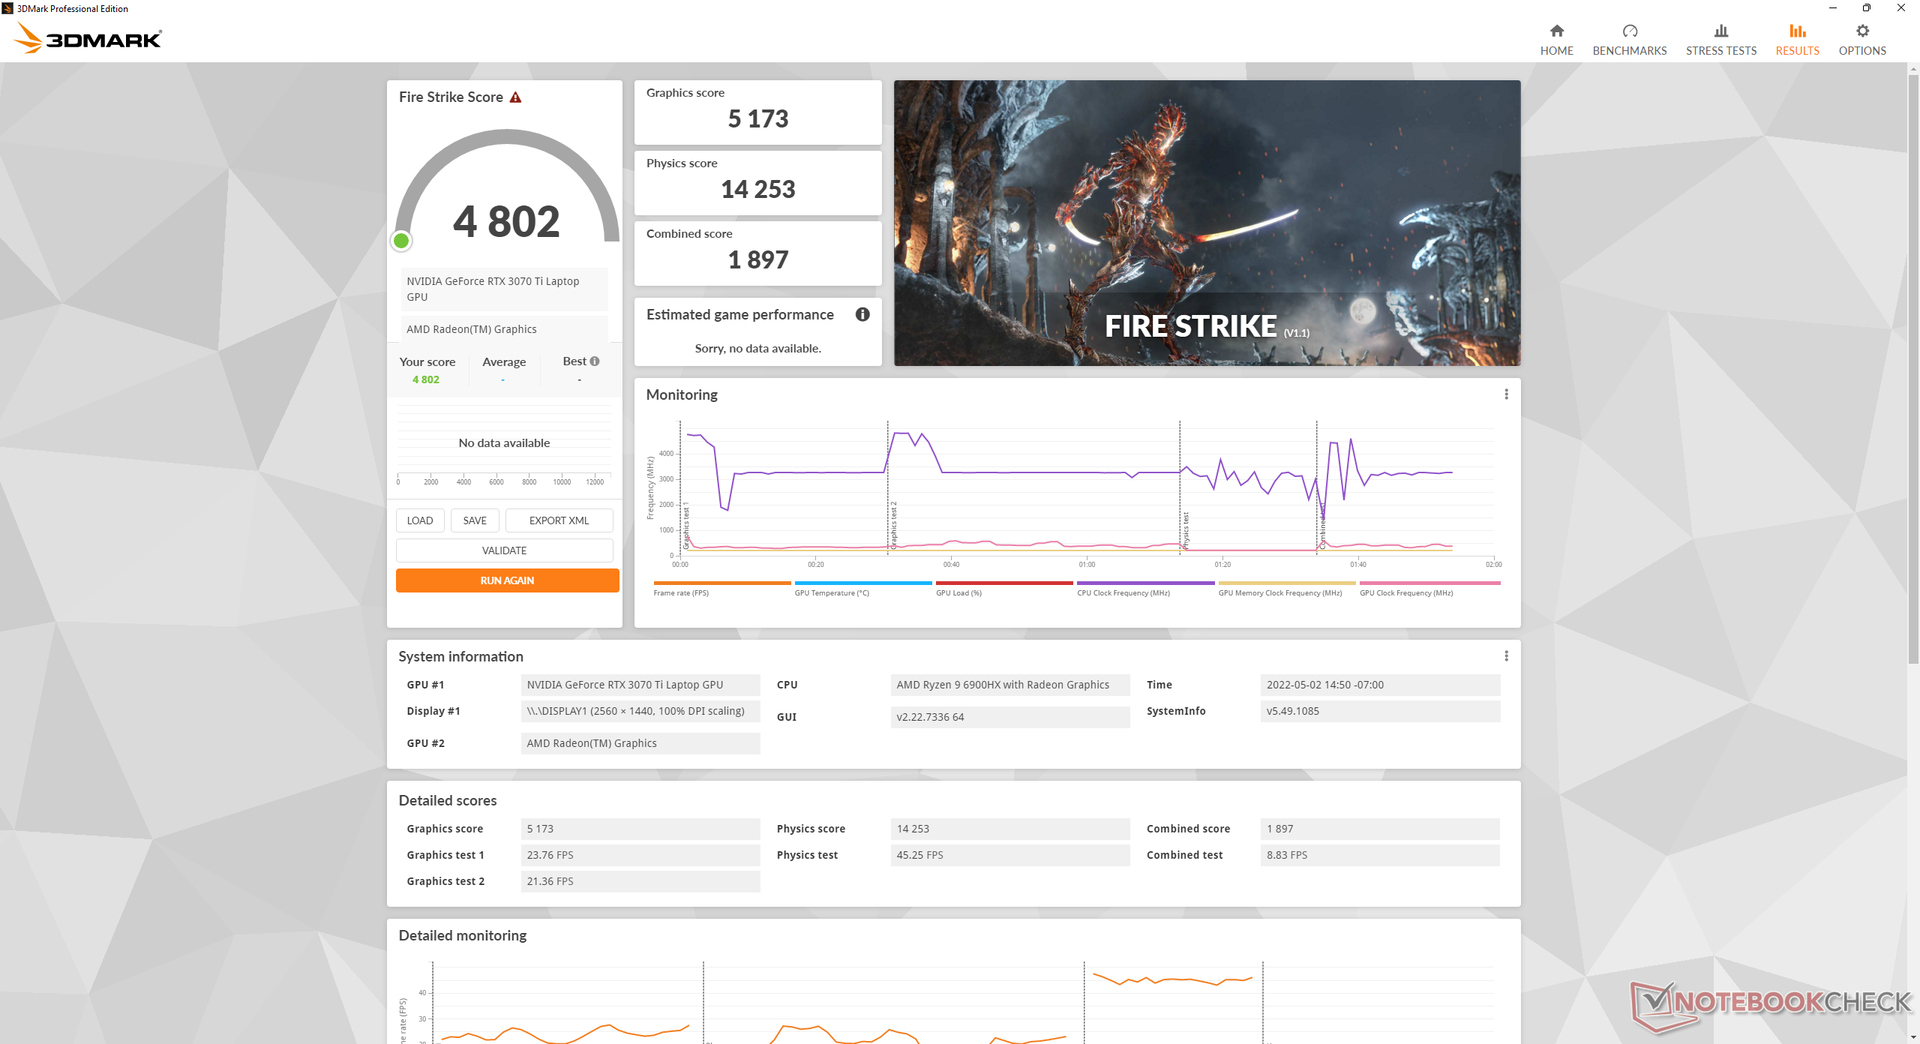
Running on battery power will limit performance. A Fire Strike run on batteries would return Physics and Graphics scores of 14253 and 5173 points, respectively, compared to 26044 and 26398 points when on mains.

| CPU Clock (GHz) | GPU Clock (MHz) | Average CPU Temperature Tctl/Tdie (°C) | Average GPU Temperature (°C) | |
| System Idle | -- | -- | 49 | 44 |
| Prime95 Stress | 4.0 - 4.2 | -- | 93 | 52 |
| Prime95 + FurMark Stress | 3.7 | 780 | 93 | 68 |
| Witcher 3 Stress (Balanced Power Profile) | 2.2 | 1275 | 77 | 69 |
| Witcher 3 Stress (Maximum Performance Power Profile) | 2.4 | 1350 | 81 | 69 |
Speakers
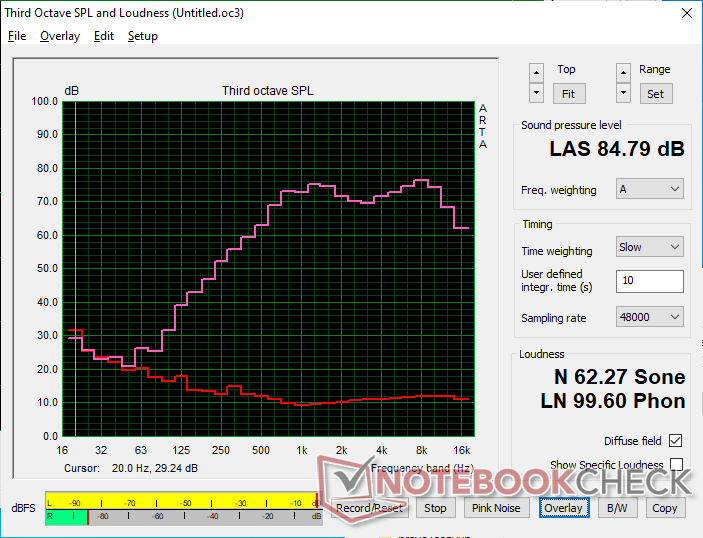
Razer Blade 14 Ryzen 9 6900HX audio analysis
(±) | speaker loudness is average but good (78.8 dB)
Bass 100 - 315 Hz
(-) | nearly no bass - on average 16.2% lower than median
(±) | linearity of bass is average (12.2% delta to prev. frequency)
Mids 400 - 2000 Hz
(+) | balanced mids - only 4% away from median
(+) | mids are linear (5.2% delta to prev. frequency)
Highs 2 - 16 kHz
(+) | balanced highs - only 2.8% away from median
(+) | highs are linear (5.3% delta to prev. frequency)
Overall 100 - 16.000 Hz
(±) | linearity of overall sound is average (15% difference to median)
Compared to same class
» 32% of all tested devices in this class were better, 6% similar, 62% worse
» The best had a delta of 6%, average was 18%, worst was 132%
Compared to all devices tested
» 20% of all tested devices were better, 4% similar, 75% worse
» The best had a delta of 4%, average was 24%, worst was 134%
Apple MacBook Pro 16 2021 M1 Pro audio analysis
(+) | speakers can play relatively loud (84.7 dB)
Bass 100 - 315 Hz
(+) | good bass - only 3.8% away from median
(+) | bass is linear (5.2% delta to prev. frequency)
Mids 400 - 2000 Hz
(+) | balanced mids - only 1.3% away from median
(+) | mids are linear (2.1% delta to prev. frequency)
Highs 2 - 16 kHz
(+) | balanced highs - only 1.9% away from median
(+) | highs are linear (2.7% delta to prev. frequency)
Overall 100 - 16.000 Hz
(+) | overall sound is linear (4.6% difference to median)
Compared to same class
» 0% of all tested devices in this class were better, 0% similar, 100% worse
» The best had a delta of 5%, average was 17%, worst was 45%
Compared to all devices tested
» 0% of all tested devices were better, 0% similar, 100% worse
» The best had a delta of 4%, average was 24%, worst was 134%
Energy Management
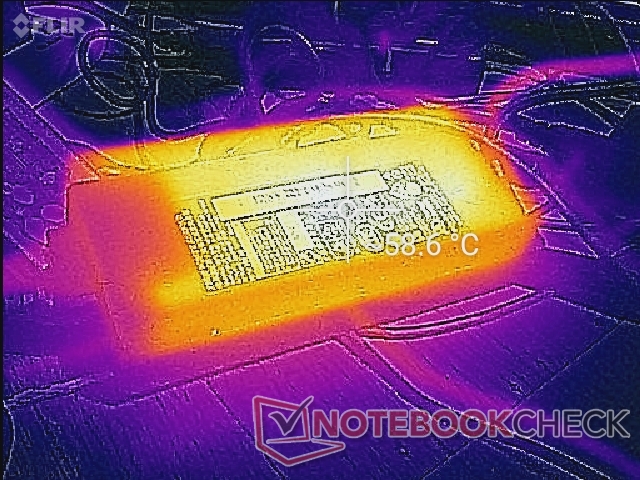
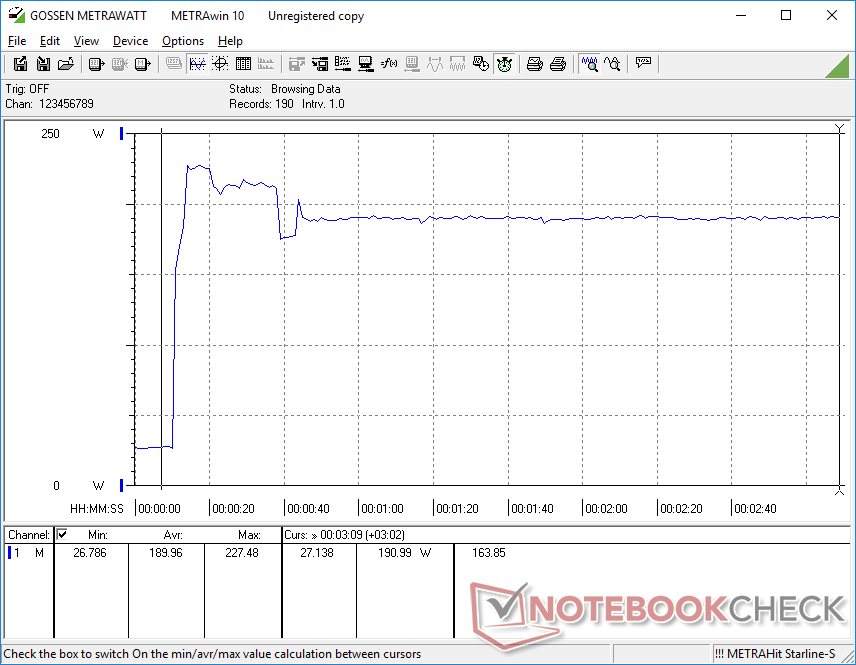
Power Consumption — Very High For A 14-inch Laptop
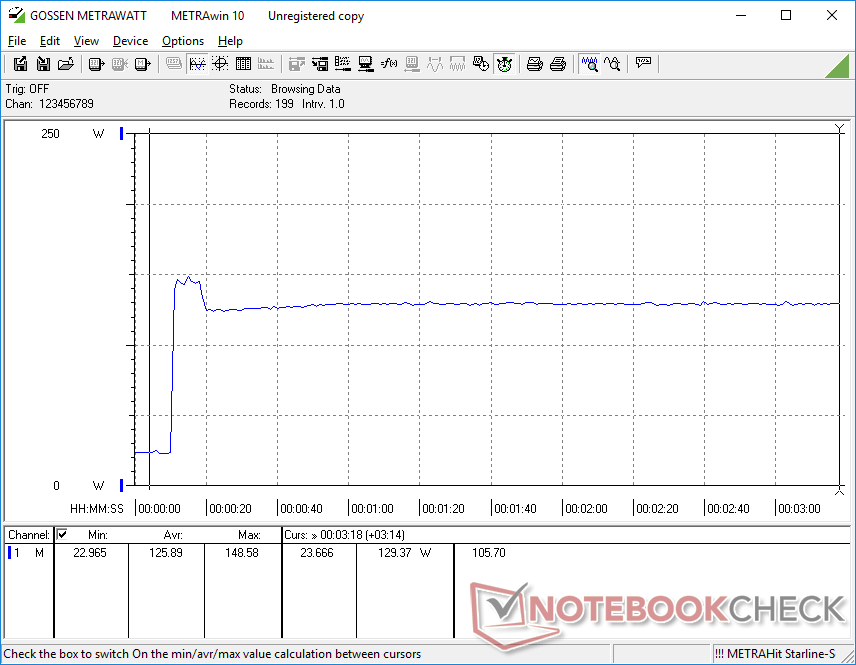
The slight uptick in CPU and GPU performance comes at the cost of a slight uptick in power consumption when running demanding loads. We're able to record a higher maximum consumption of 228 W compared to just 190 W on last year's model to suggest better Turbo Boost performance this time around even if it only lasts for just a few seconds.
When compared to the competing Zephyrus G14 GA402R with the Ryzen 9 6900HS and Radeon RX 6800S, the Razer is slightly more demanding in most situations even though raw CPU and GPU performance is similar between them.
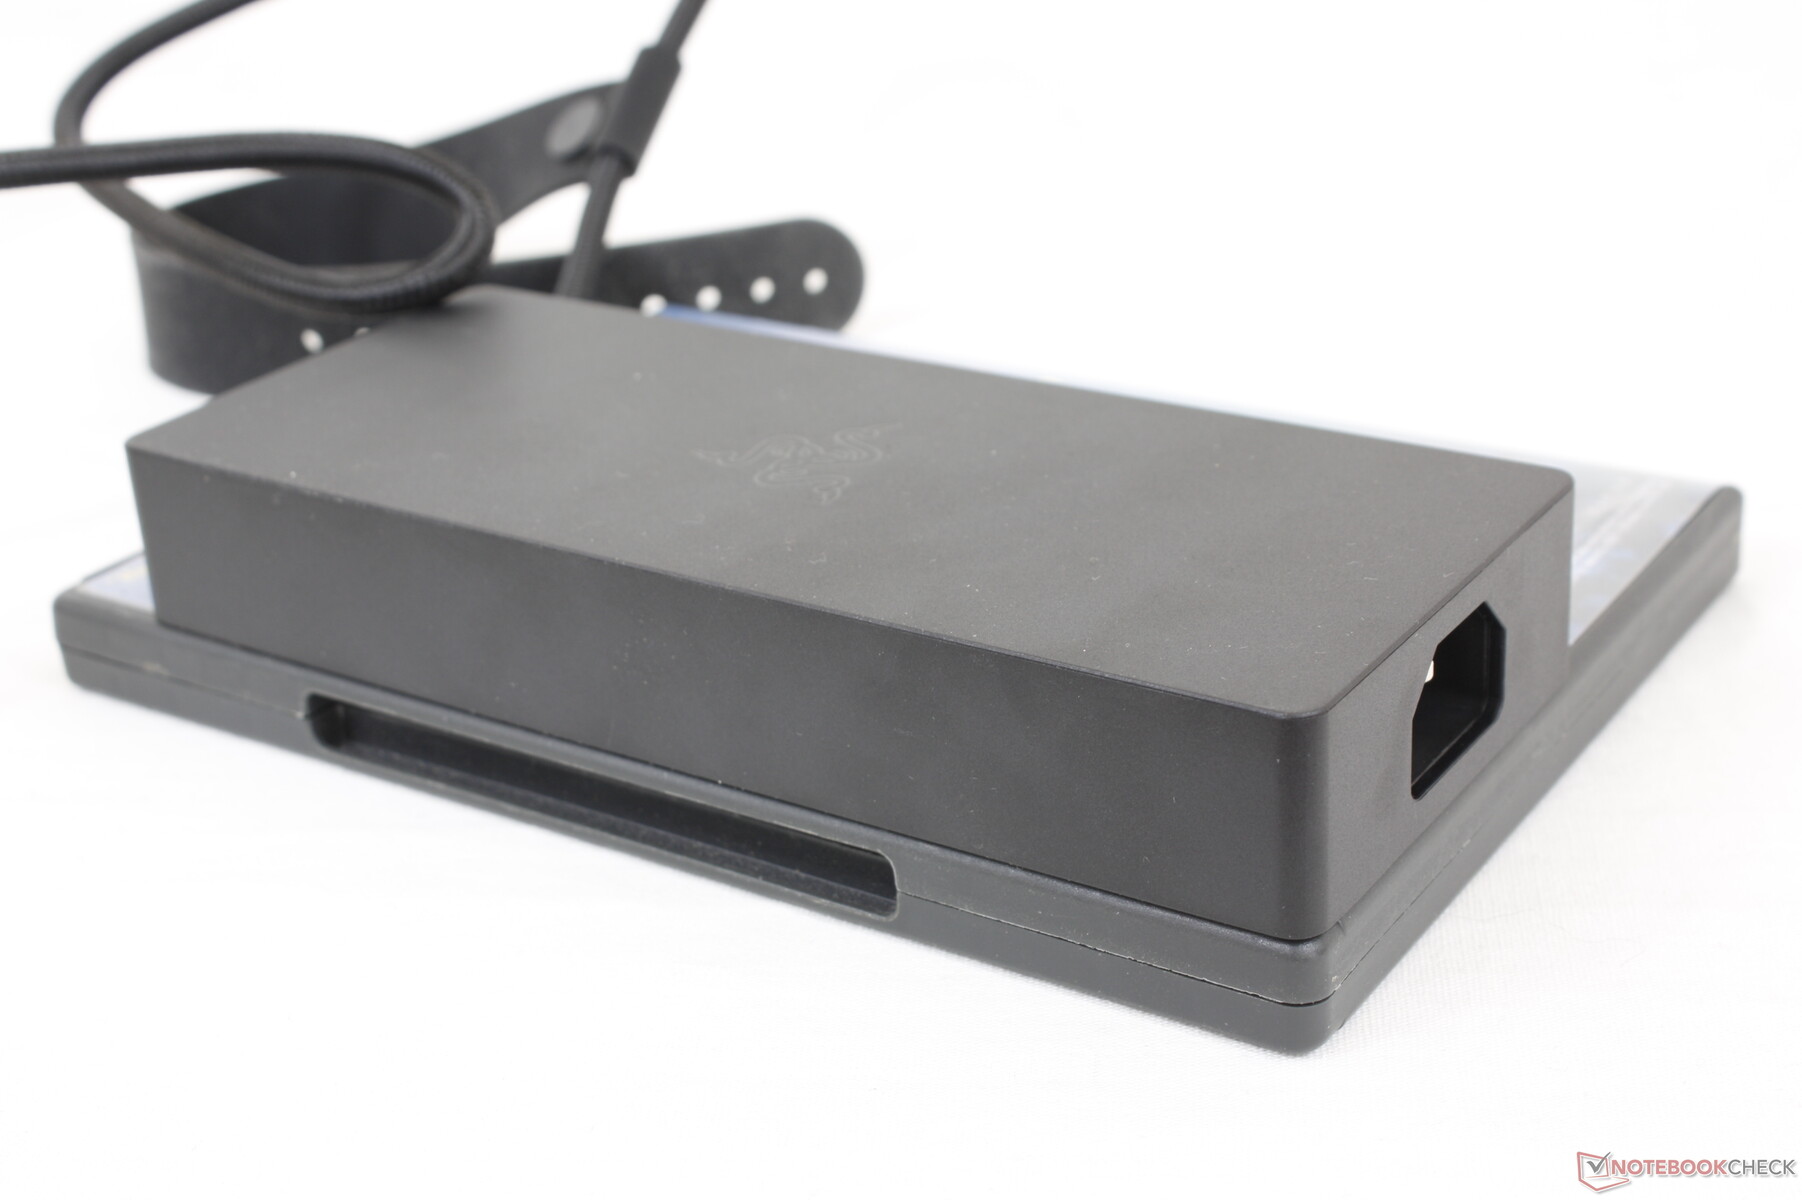
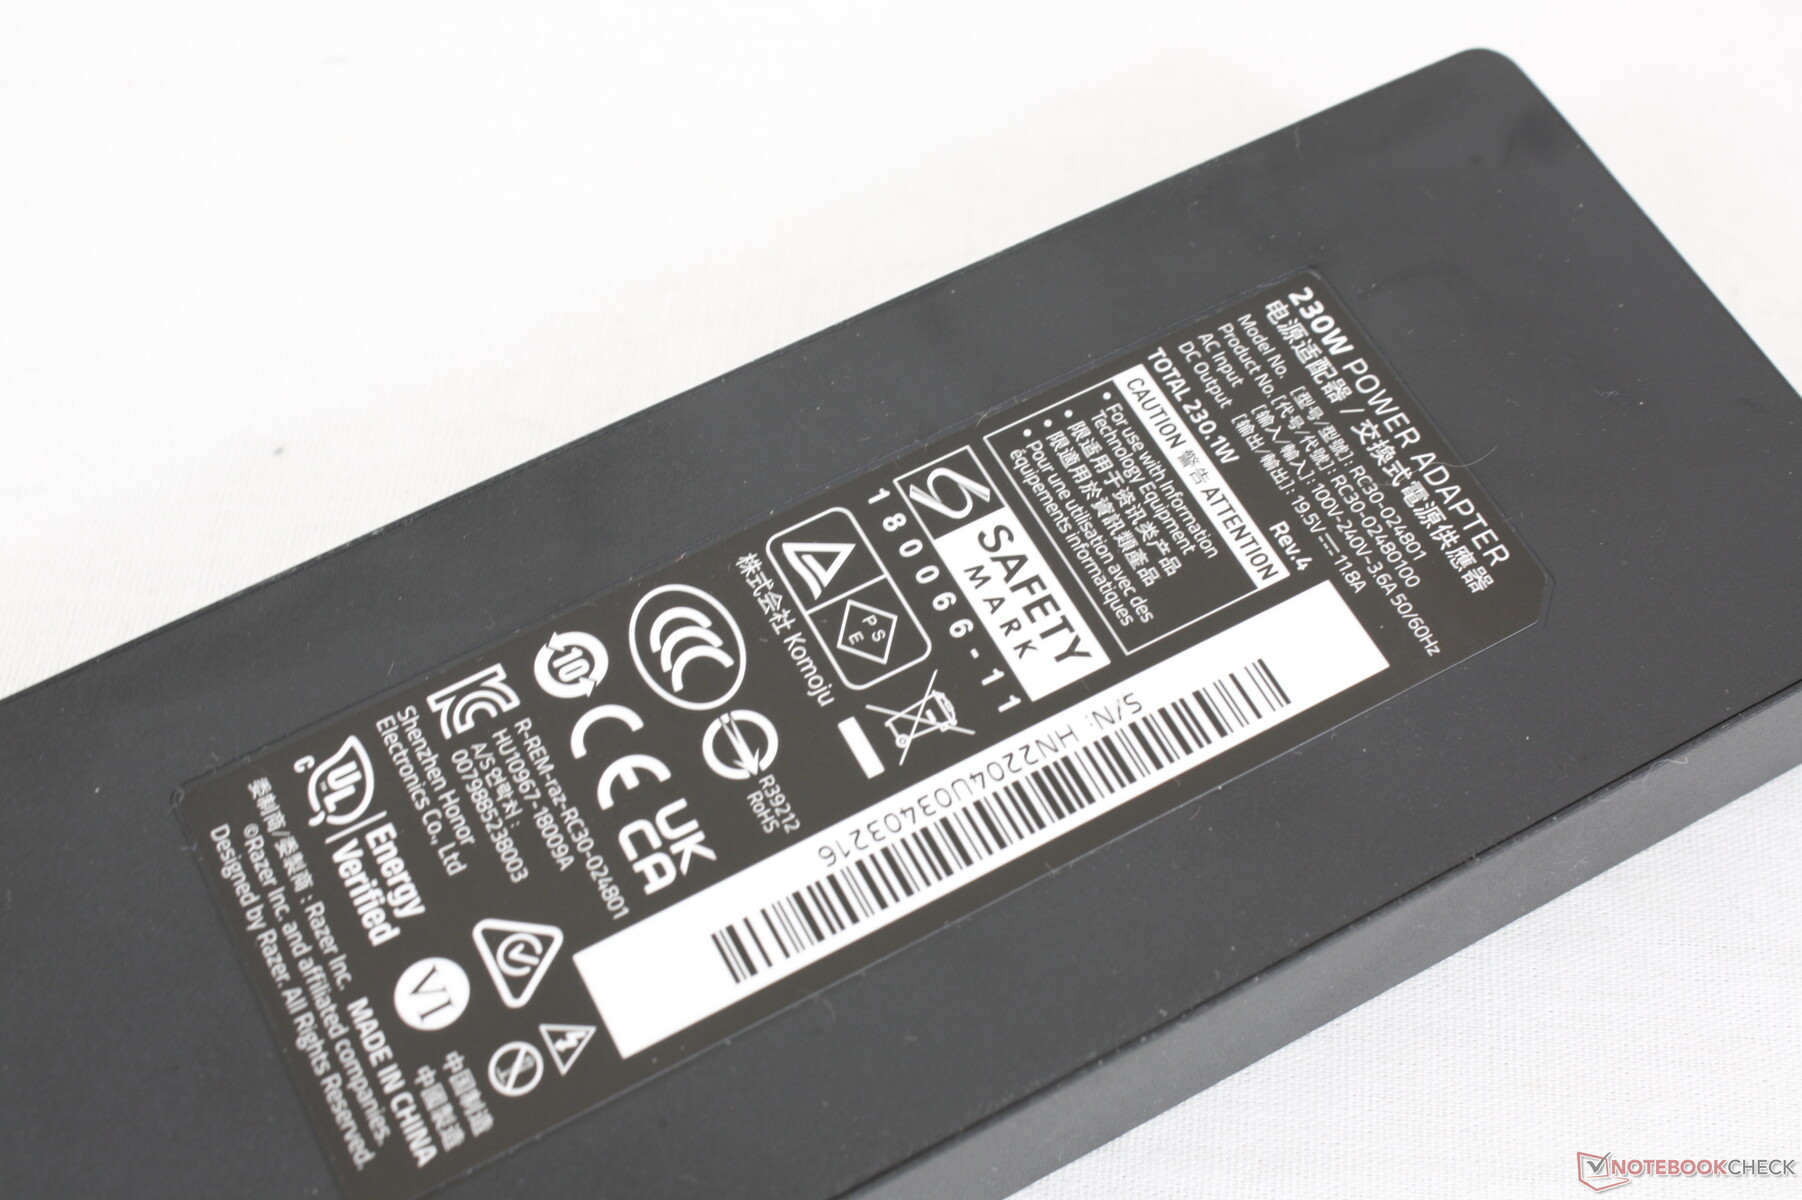
The small-medium (~17 x 7 x 2.5 cm) 230 W AC adapter hasn't changed year-over-year.
| Off / Standby | |
| Idle | |
| Load |
|
Key:
min: | |
| Razer Blade 14 Ryzen 9 6900HX R9 6900HX, GeForce RTX 3070 Ti Laptop GPU, Samsung PM9A1 MZVL21T0HCLR, IPS, 2560x1440, 14" | Razer Blade 14 Ryzen 9 RTX 3070 R9 5900HX, GeForce RTX 3070 Laptop GPU, Samsung PM981a MZVLB1T0HBLR, IPS, 2560x1440, 14" | Razer Blade 17 RTX 3080 Ti i7-12800H, GeForce RTX 3080 Ti Laptop GPU, Samsung PM9A1 MZVL21T0HCLR, IPS, 2560x1440, 17.3" | Asus ROG Zephyrus G14 GA402RK R9 6900HS, Radeon RX 6800S, Micron 2450 1TB MTFDKBK1T0TFK, IPS-Level, 2560x1600, 14" | MSI Stealth GS66 12UGS i7-12700H, GeForce RTX 3070 Ti Laptop GPU, WDC PC SN810 1TB, IPS-Level, 2560x1440, 15.6" | Asus ROG Zephyrus Duo 15 SE GX551QS R9 5900HX, GeForce RTX 3080 Laptop GPU, 2x Samsung PM981a MZVLB1T0HBLR (RAID 0), IPS, 3840x2160, 15.6" | |
|---|---|---|---|---|---|---|
| Power Consumption | 15% | -81% | 19% | 4% | -21% | |
| Idle Minimum * (Watt) | 10.2 | 9.4 8% | 29.8 -192% | 7 31% | 11 -8% | 16.3 -60% |
| Idle Average * (Watt) | 26 | 15.8 39% | 37.1 -43% | 14 46% | 16 38% | 22.5 13% |
| Idle Maximum * (Watt) | 26.7 | 24.1 10% | 60.8 -128% | 22 18% | 23 14% | 39.9 -49% |
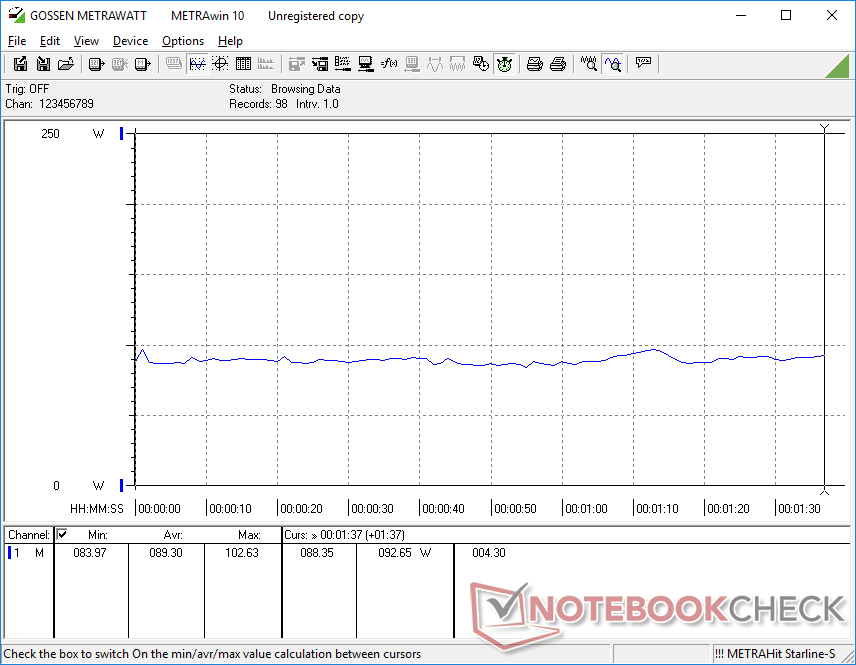
| Load Average * (Watt) | 89.3 | 76.8 14% | 135.3 -52% | 98 -10% | 110 -23% | 116.1 -30% |
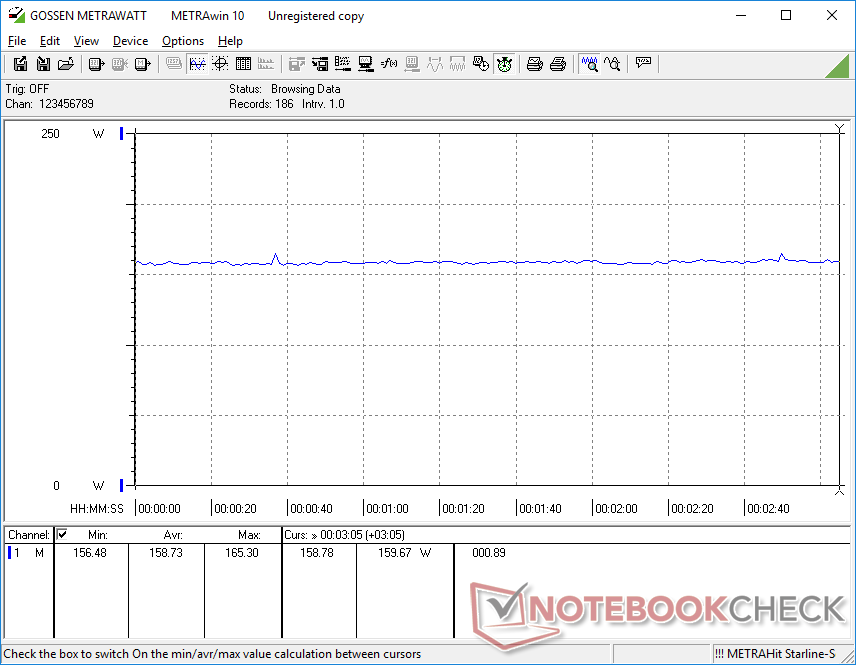
| Witcher 3 ultra * (Watt) | 158.7 | 154 3% | 243 -53% | 141 11% | 151 5% | 181.2 -14% |
| Load Maximum * (Watt) | 227.5 | 189.7 17% | 273.1 -20% | 188 17% | 230 -1% | 196.7 14% |
* ... smaller is better
Power Consumption Witcher 3 / Stresstest
Power Consumption external Monitor
Battery Life
WLAN runtimes are a couple of hours longer than what we recorded on the 2021 model when both are set to the same Balanced power profile on the 60 Hz Optimus graphics setting. The 9.5 hours of runtime is almost exactly what we recorded on the latest Zephyrus G14 despite the smaller battery capacity in the Razer (62 Wh vs. 76 Wh).
Charging from empty to full capacity still takes about 90 minutes with the included barrel AC adapter. The system can also be recharged with most universal USB-C chargers through either of its two USB-C ports.
| Razer Blade 14 Ryzen 9 6900HX R9 6900HX, GeForce RTX 3070 Ti Laptop GPU, 62 Wh | Razer Blade 14 Ryzen 9 RTX 3070 R9 5900HX, GeForce RTX 3070 Laptop GPU, 62 Wh | Razer Blade 17 RTX 3080 Ti i7-12800H, GeForce RTX 3080 Ti Laptop GPU, 82 Wh | Asus ROG Zephyrus G14 GA402RK R9 6900HS, Radeon RX 6800S, 76 Wh | MSI Stealth GS66 12UGS i7-12700H, GeForce RTX 3070 Ti Laptop GPU, 99.9 Wh | Asus ROG Zephyrus Duo 15 SE GX551QS R9 5900HX, GeForce RTX 3080 Laptop GPU, 90 Wh | |
|---|---|---|---|---|---|---|
| Battery runtime | -10% | -36% | 1% | -26% | -38% | |
| Reader / Idle (h) | 12.2 | 13.8 13% | 8 -34% | 18.1 48% | 7.8 -36% | 6.8 -44% |
| WiFi v1.3 (h) | 9.5 | 7.3 -23% | 5.5 -42% | 9.5 0% | 5.4 -43% | 5.3 -44% |
| Load (h) | 1.6 | 1.3 -19% | 1.1 -31% | 0.9 -44% | 1.6 0% | 1.2 -25% |
Pros
Cons
Verdict — Small Upgrades That Add Up
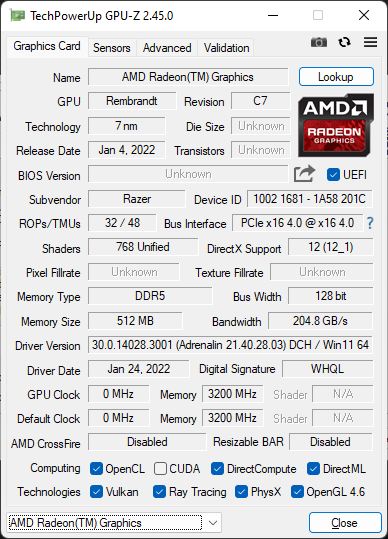
After making a huge splash with the original 2021 model, it's expected that the 2022 refresh would be more of a minor update to an already impressive machine. It adds a higher resolution webcam (720p to 1080p), faster CPU (Ryzen 9 5900HX to Ryzen 9 6900HX), faster GPU (RTX 3070/3080 to 3070/3080 Ti), faster RAM (DDR4-3200 to DDR5-4800), faster M.2 SSD support (PCIe3 x4 to PCIe4 x4), newer WLAN module (Killer AX1690i to Qualcomm WCN685x), and a MUX switch for the new integrated Radeon 680M GPU. It's indubitably an upgrade especially in terms of single-thread processor performance.
The 2022 Blade 14 is the best version of itself thus far as all the new changes are direct upgrades from the original 2021 model especially in single-thread processor performance. However, it's becoming clear that the GPU has hit a wall with its 100 W TGP limit.
If gaming is your primary workload, however, then the 2022 model can't provide much of a boost. Its GPU is still restrained by a 100 W TGP limit and so the move to GeForce Ti GPUs is ultimately only a minor upgrade especially when gaming at the native 1440p resolution. Instead, what the model needs is a way to push the TGP ceiling even further to the 130+ W range to better exploit the potential of any future GPU options. Regardless, it's still an insanely fast gaming machine that can easily stand toe-to-toe with many larger options out there. If the 16:9 aspect ratio is a deal breaker, then users can consider the slightly larger Zephyrus G14 with its 16:10 aspect ratio and very similar performance levels.
Price and Availability
Amazon is currently shipping the higher-end configuration with the GeForce RTX 3080 Ti for $3500 USD. Alternatively, users can purchase directly from Razerzone.com where multiple configurations are available.
Razer Blade 14 Ryzen 9 6900HX
- 05/06/2022 v7 (old)
Allen Ngo
Price comparison
