Dell G15 5510 laptop review: Budget 120 Hz gaming laptop faces its AMD counterpart
After reviewing the Dell G15 5515 with the AMD Ryzen 7 5800H and the Nvidia GeForce RTX 3050 Ti Laptop GPU at the end of last year, we will review the Dell G15 5510 now. Although the differences aren't that big, they're still significant as our review shows. This review unit also offers the same dedicated GPU from Nvidia. Instead of AMD power, however, the gaming laptop, which costs just under 1,000 Euros (~$1,061) (MSRP), has an Intel Core i5-10200H paired with only 8 GB of RAM under the hood.
Our test results show how this affects performance. In the following review, we'll only discuss the areas where the Intel-powered Dell G15 5510 differs from the Dell G15 5515 Ryzen Edition, since this is a review update. You can find all everything else in our review of the AMD version.
In addition, the test candidate has to compete with other gaming laptops in this price range, including the Lenovo IdeaPad Gaming 3 15 G6 with the same GPU and a newer CPU, as well as the Gigabyte G5 GD with the Nvidia GeForce RTX 3050 Laptop GPU and the Intel Core i5-11400H.
Possible contenders in comparison
Rating | Date | Model | Weight | Height | Size | Resolution | Price |
|---|---|---|---|---|---|---|---|
| 79.1 % v7 (old) | 05 / 2022 | Dell G15 5510-43NHT i5-10200H, GeForce RTX 3050 Ti Laptop GPU | 2.5 kg | 23.33 mm | 15.60" | 1920x1080 | |
| 79.7 % v7 (old) | 03 / 2022 | Lenovo Ideapad Gaming 3 15IHU-82K1002RGE i5-11300H, GeForce RTX 3050 Ti Laptop GPU | 2 kg | 24.2 mm | 15.60" | 1920x1080 | |
| 82.7 % v7 (old) | 10 / 2021 | Dell G15 5515 R7 5800H, GeForce RTX 3050 Ti Laptop GPU | 2.4 kg | 24.9 mm | 15.60" | 1920x1080 | |
| 80.5 % v7 (old) | 05 / 2021 | Acer Aspire Nitro 5 AN515-55-57GF i5-10300H, GeForce RTX 3060 Laptop GPU | 2.3 kg | 23.9 mm | 15.60" | 1920x1080 | |
| 81.7 % v7 (old) | 11 / 2021 | Gigabyte G5 GD i5-11400H, GeForce RTX 3050 4GB Laptop GPU | 2.1 kg | 31.6 mm | 15.60" | 1920x1080 |
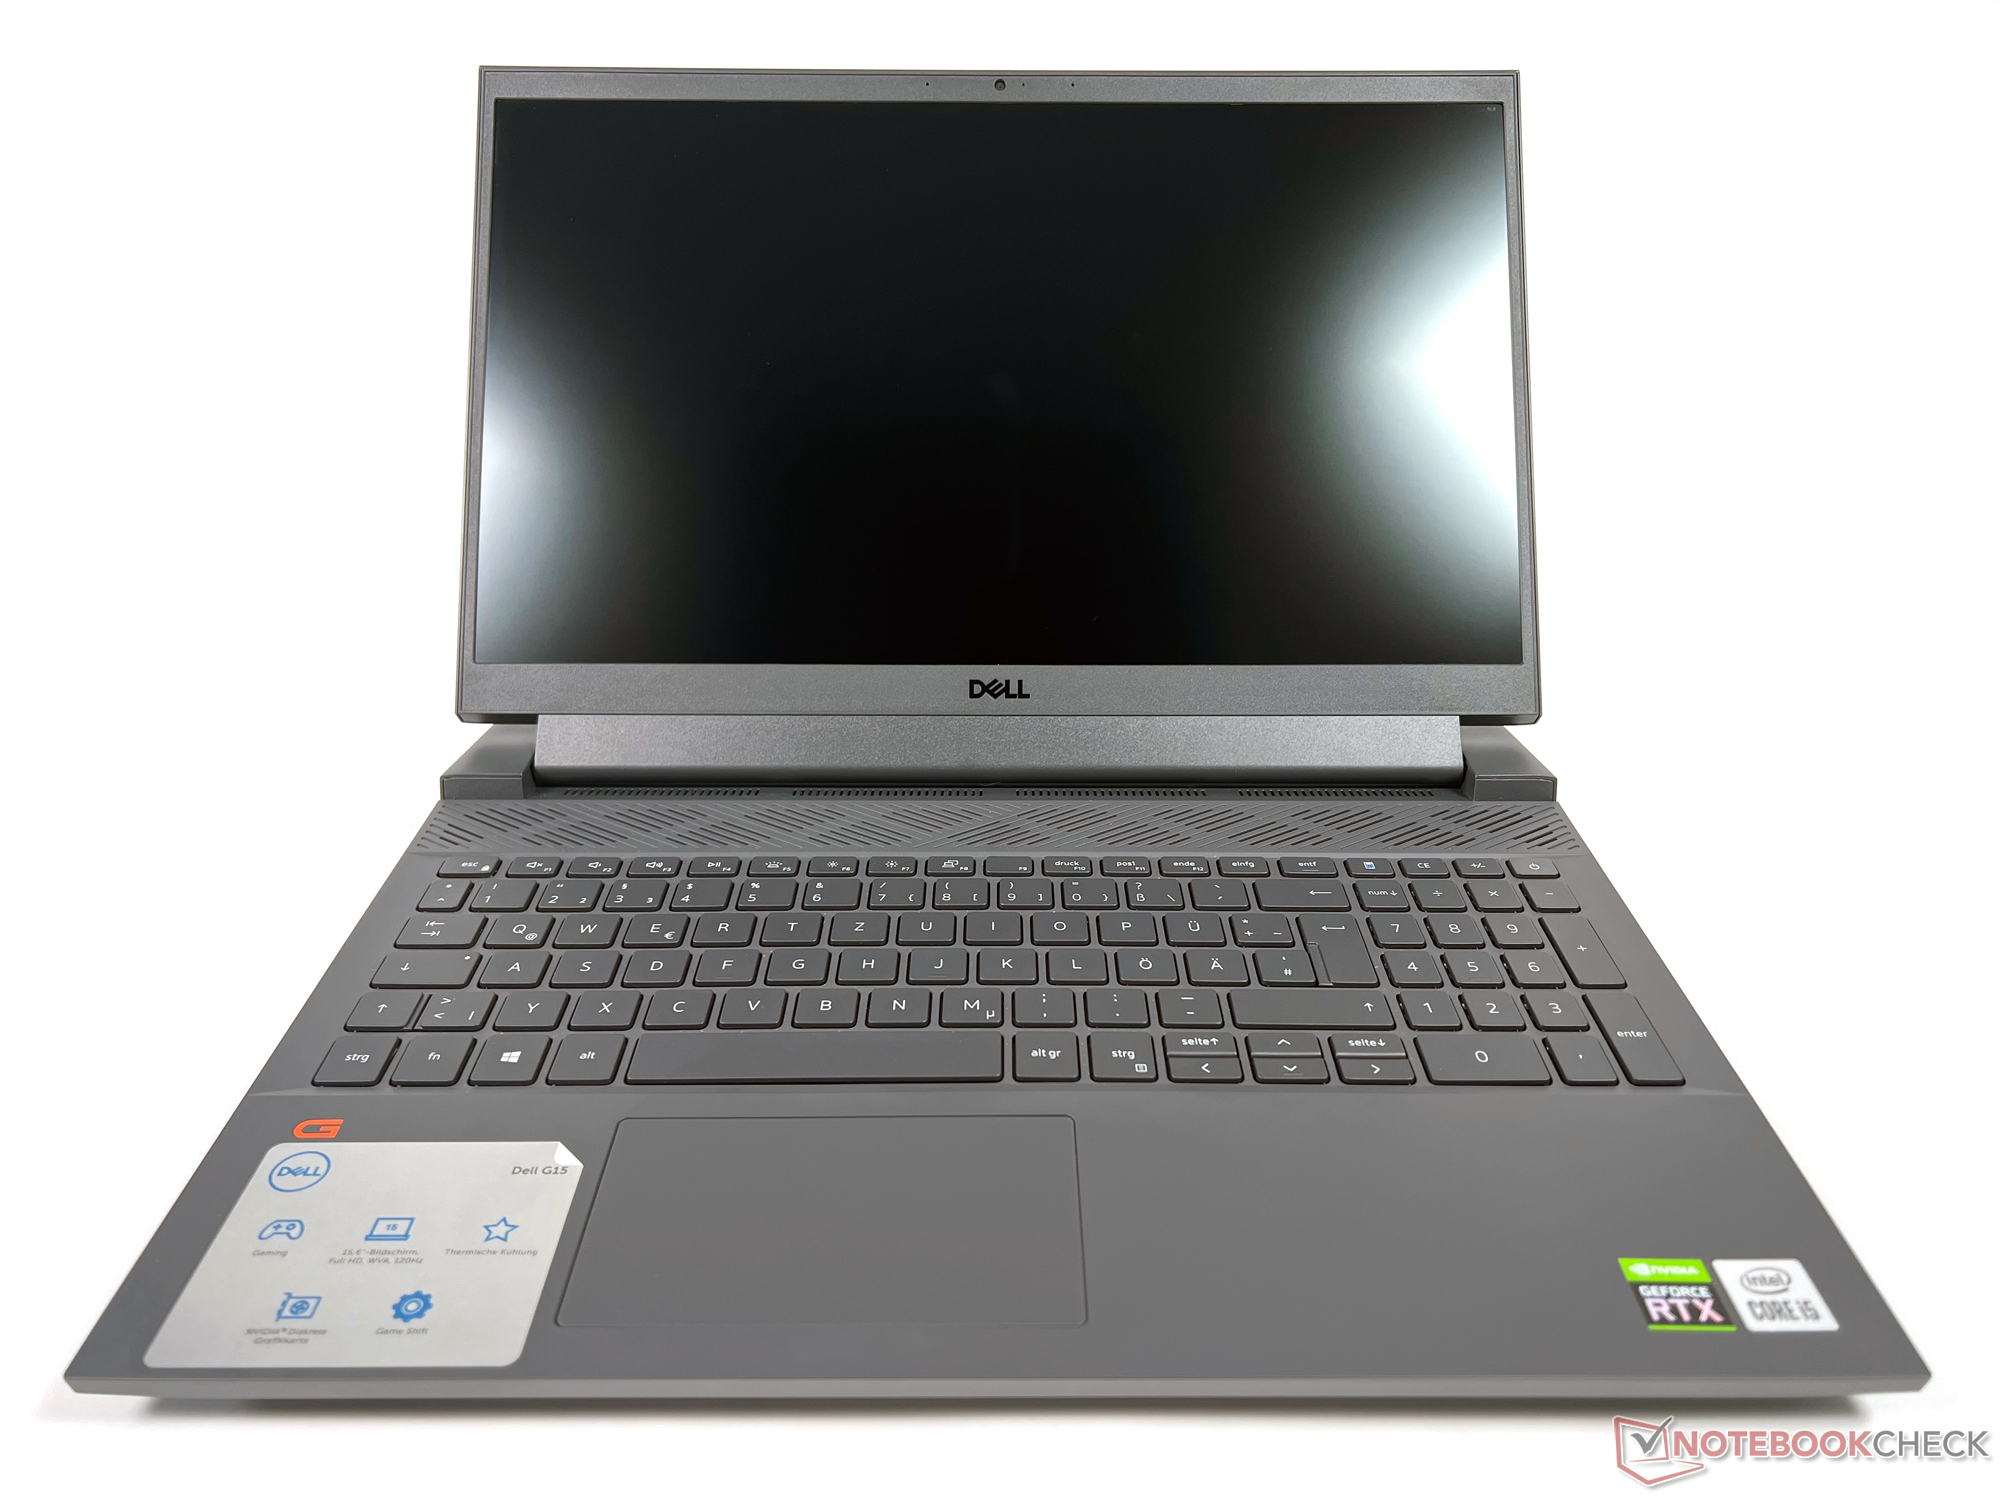
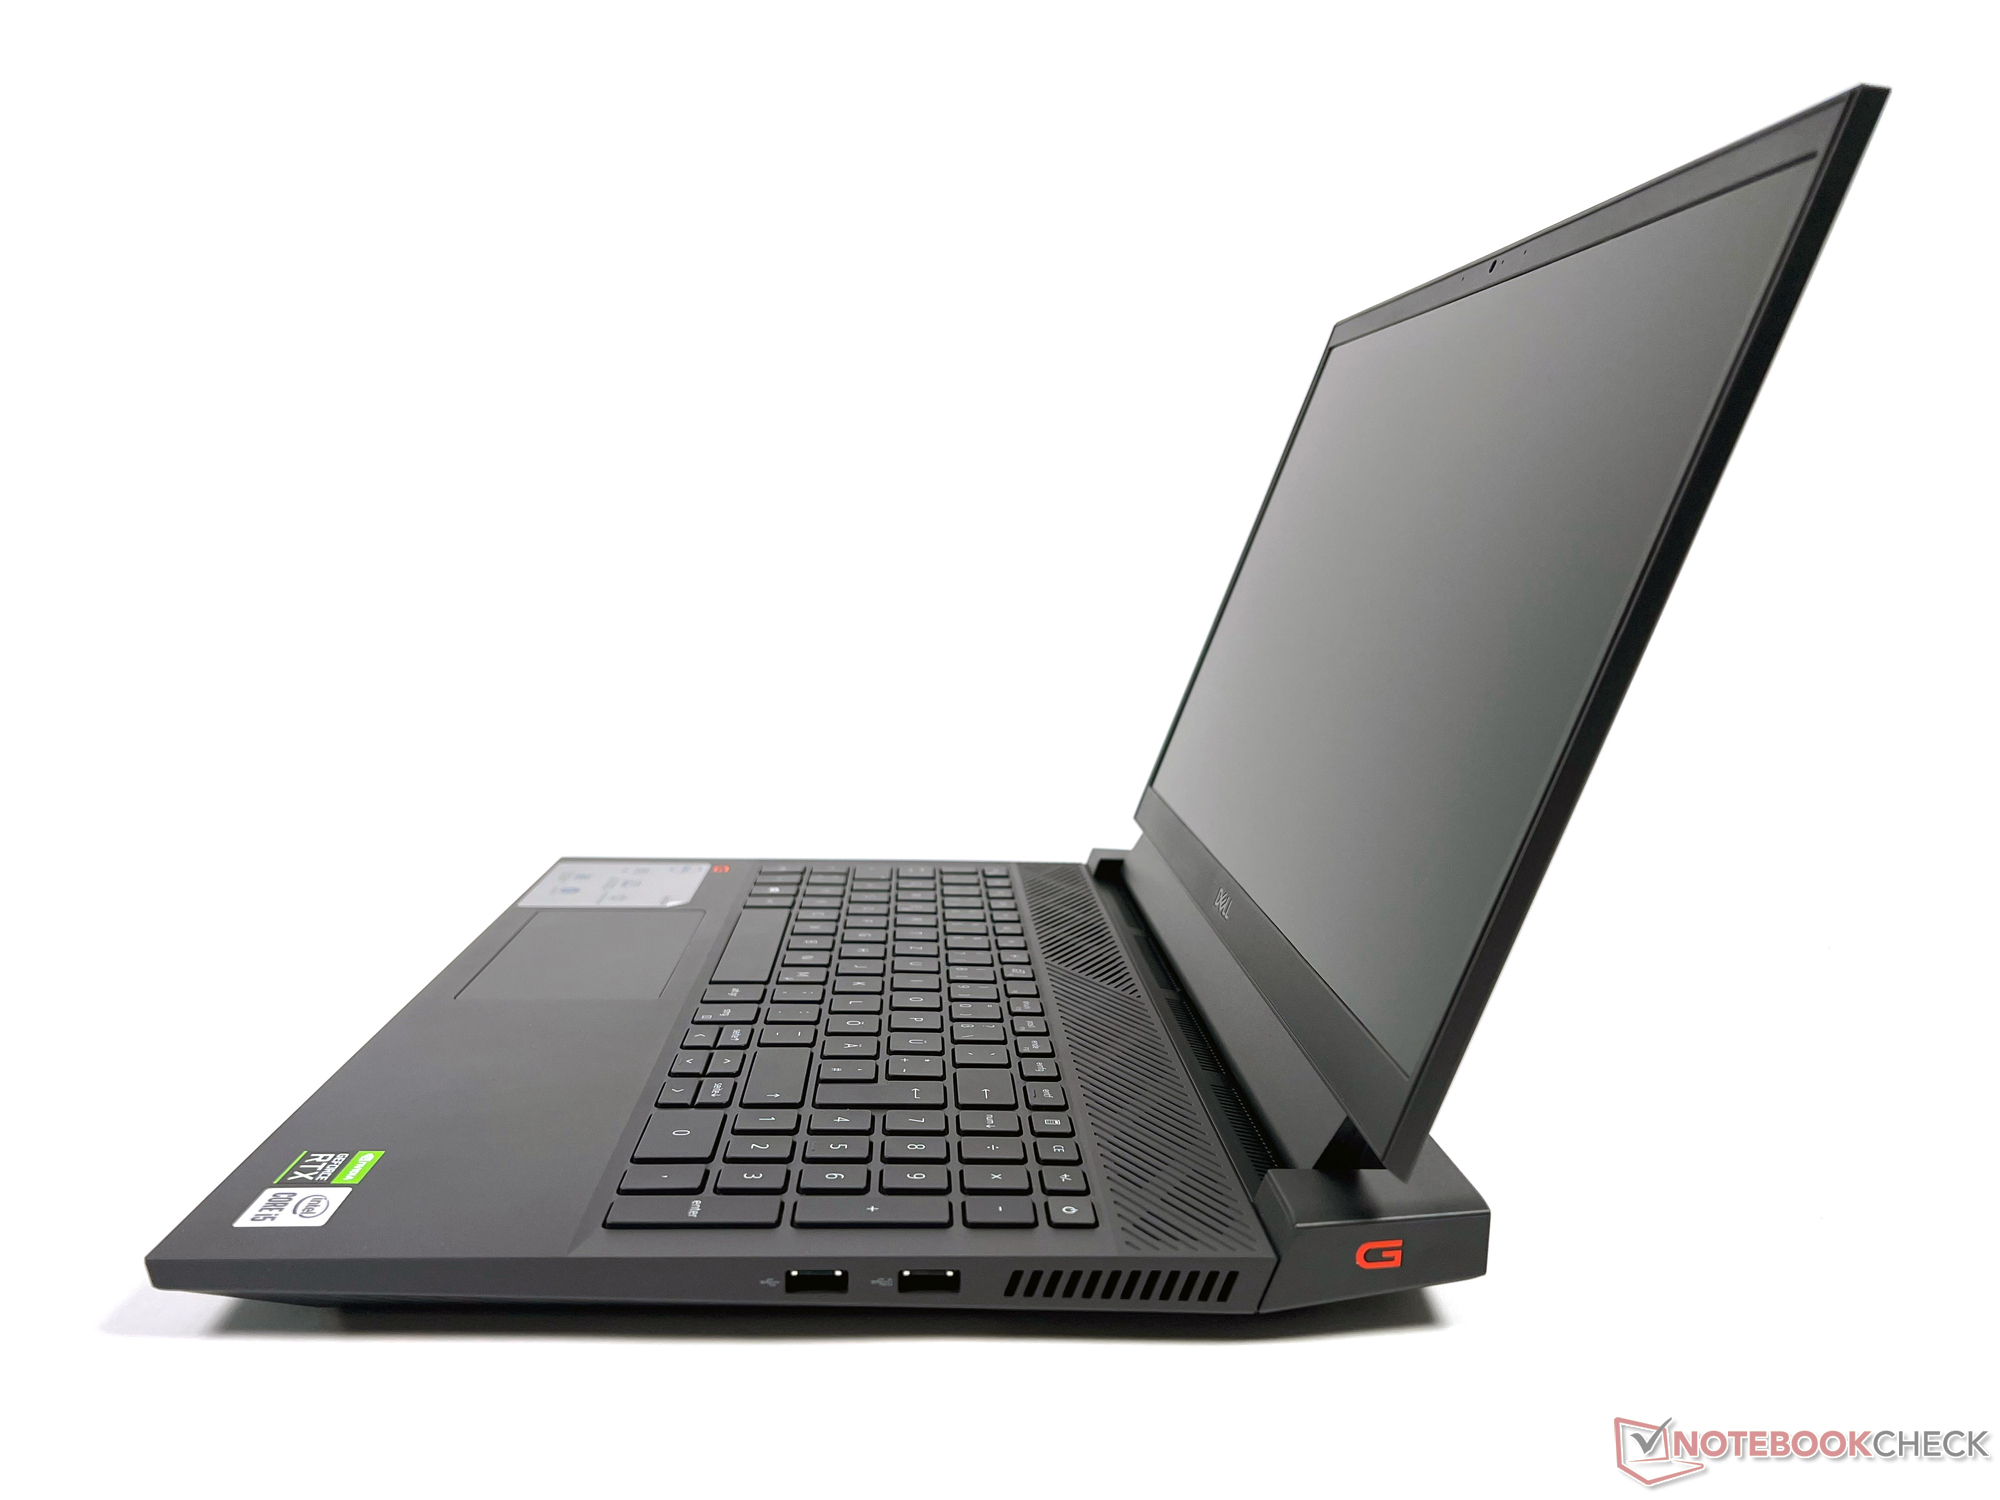
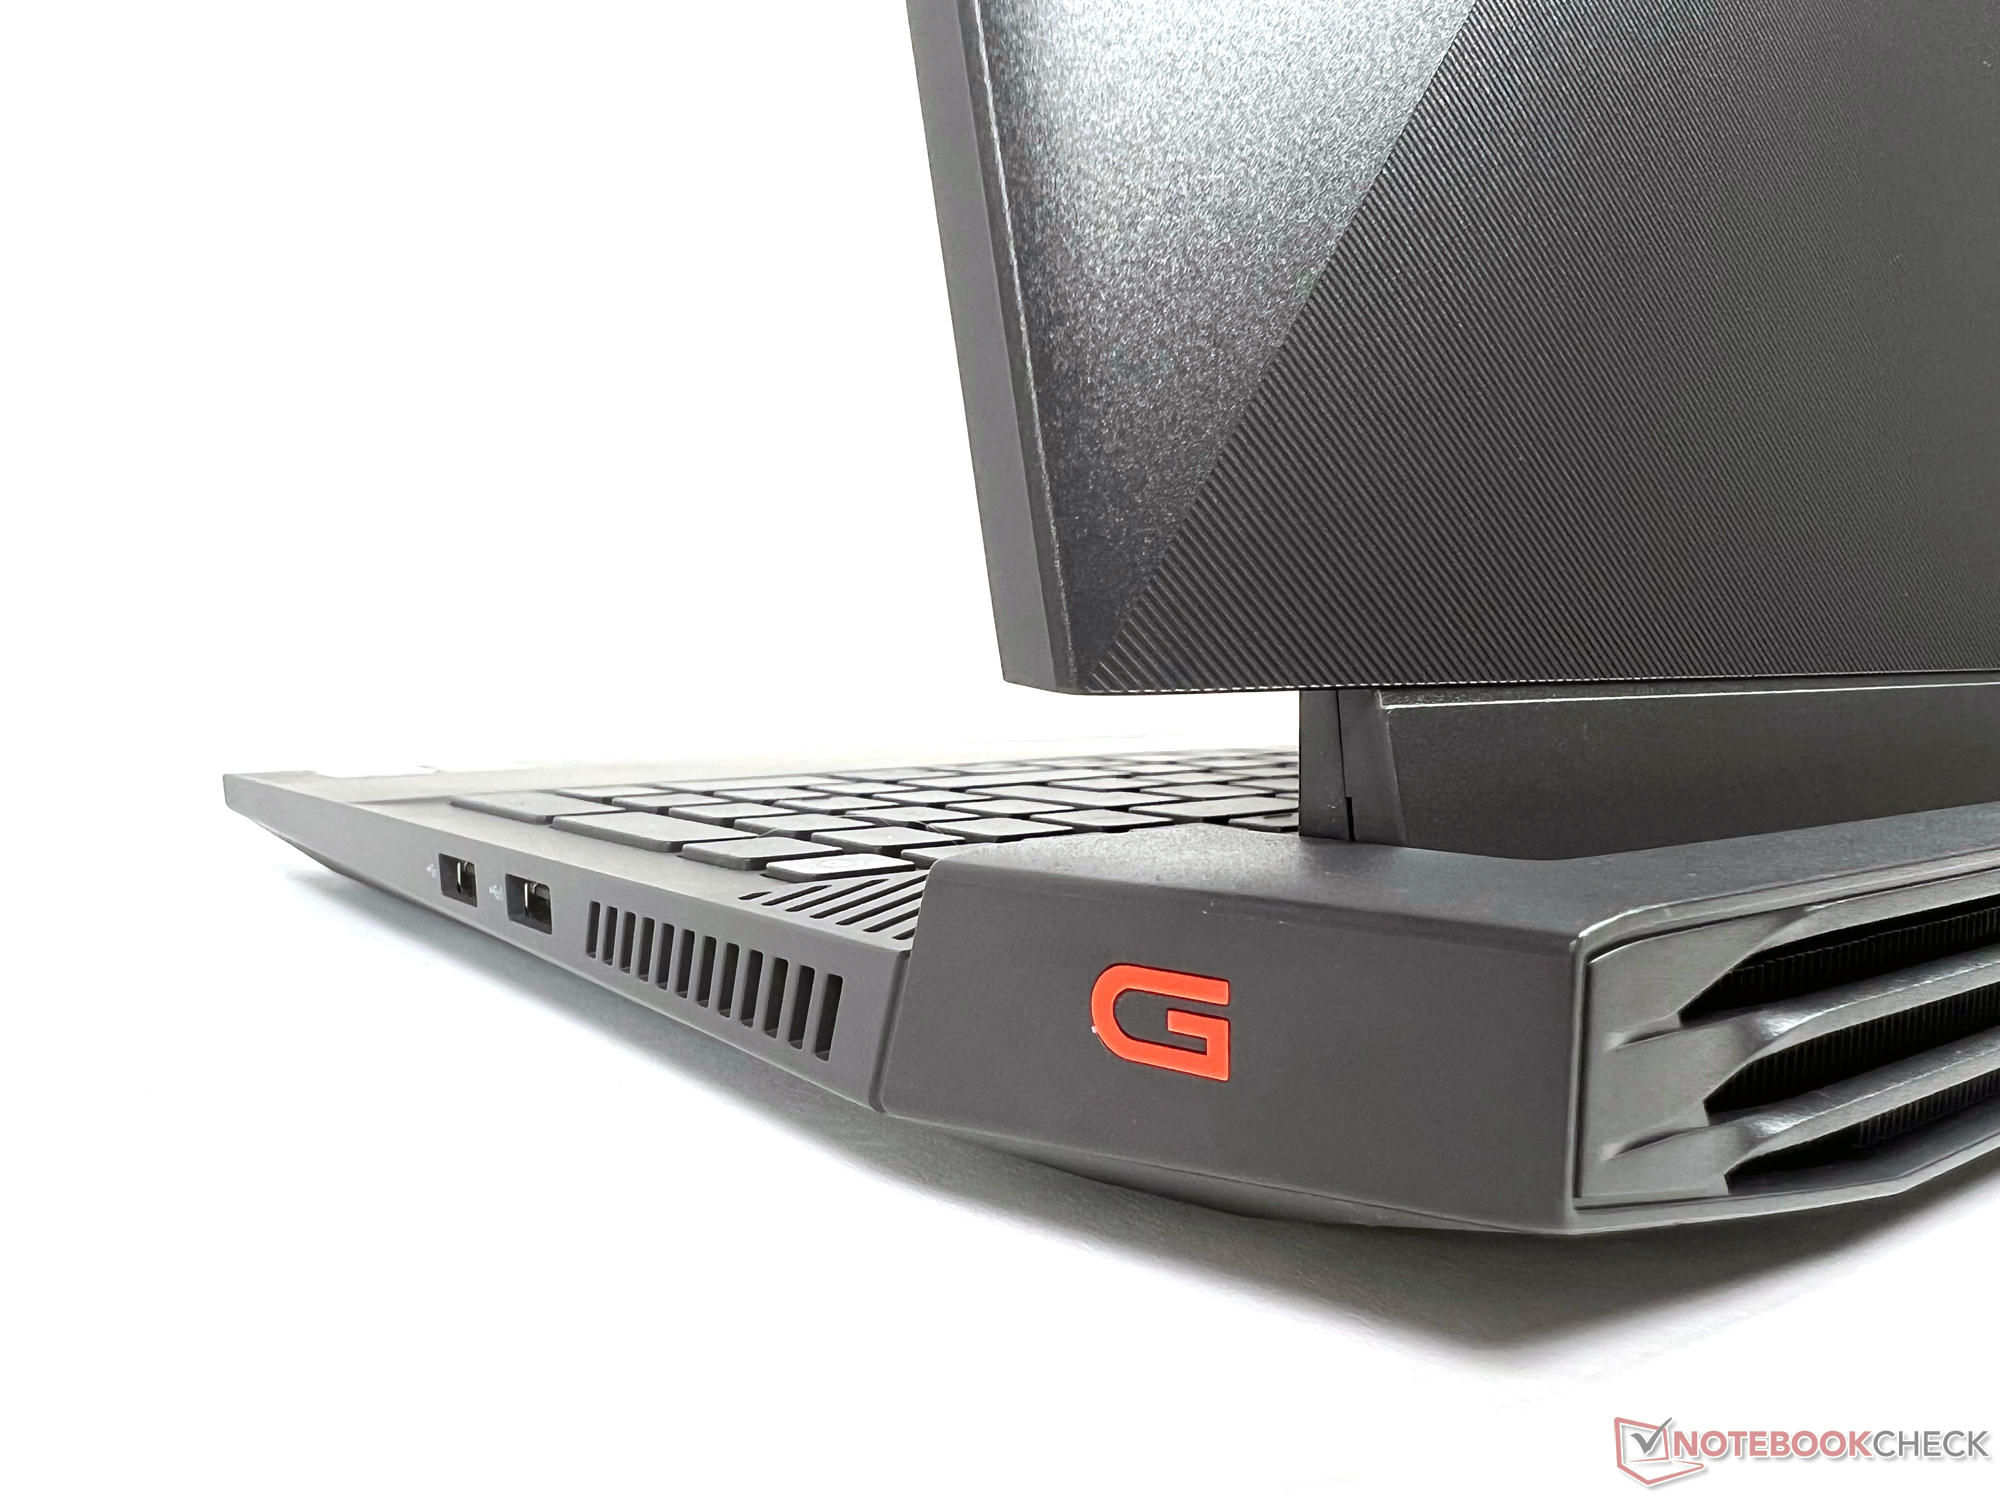
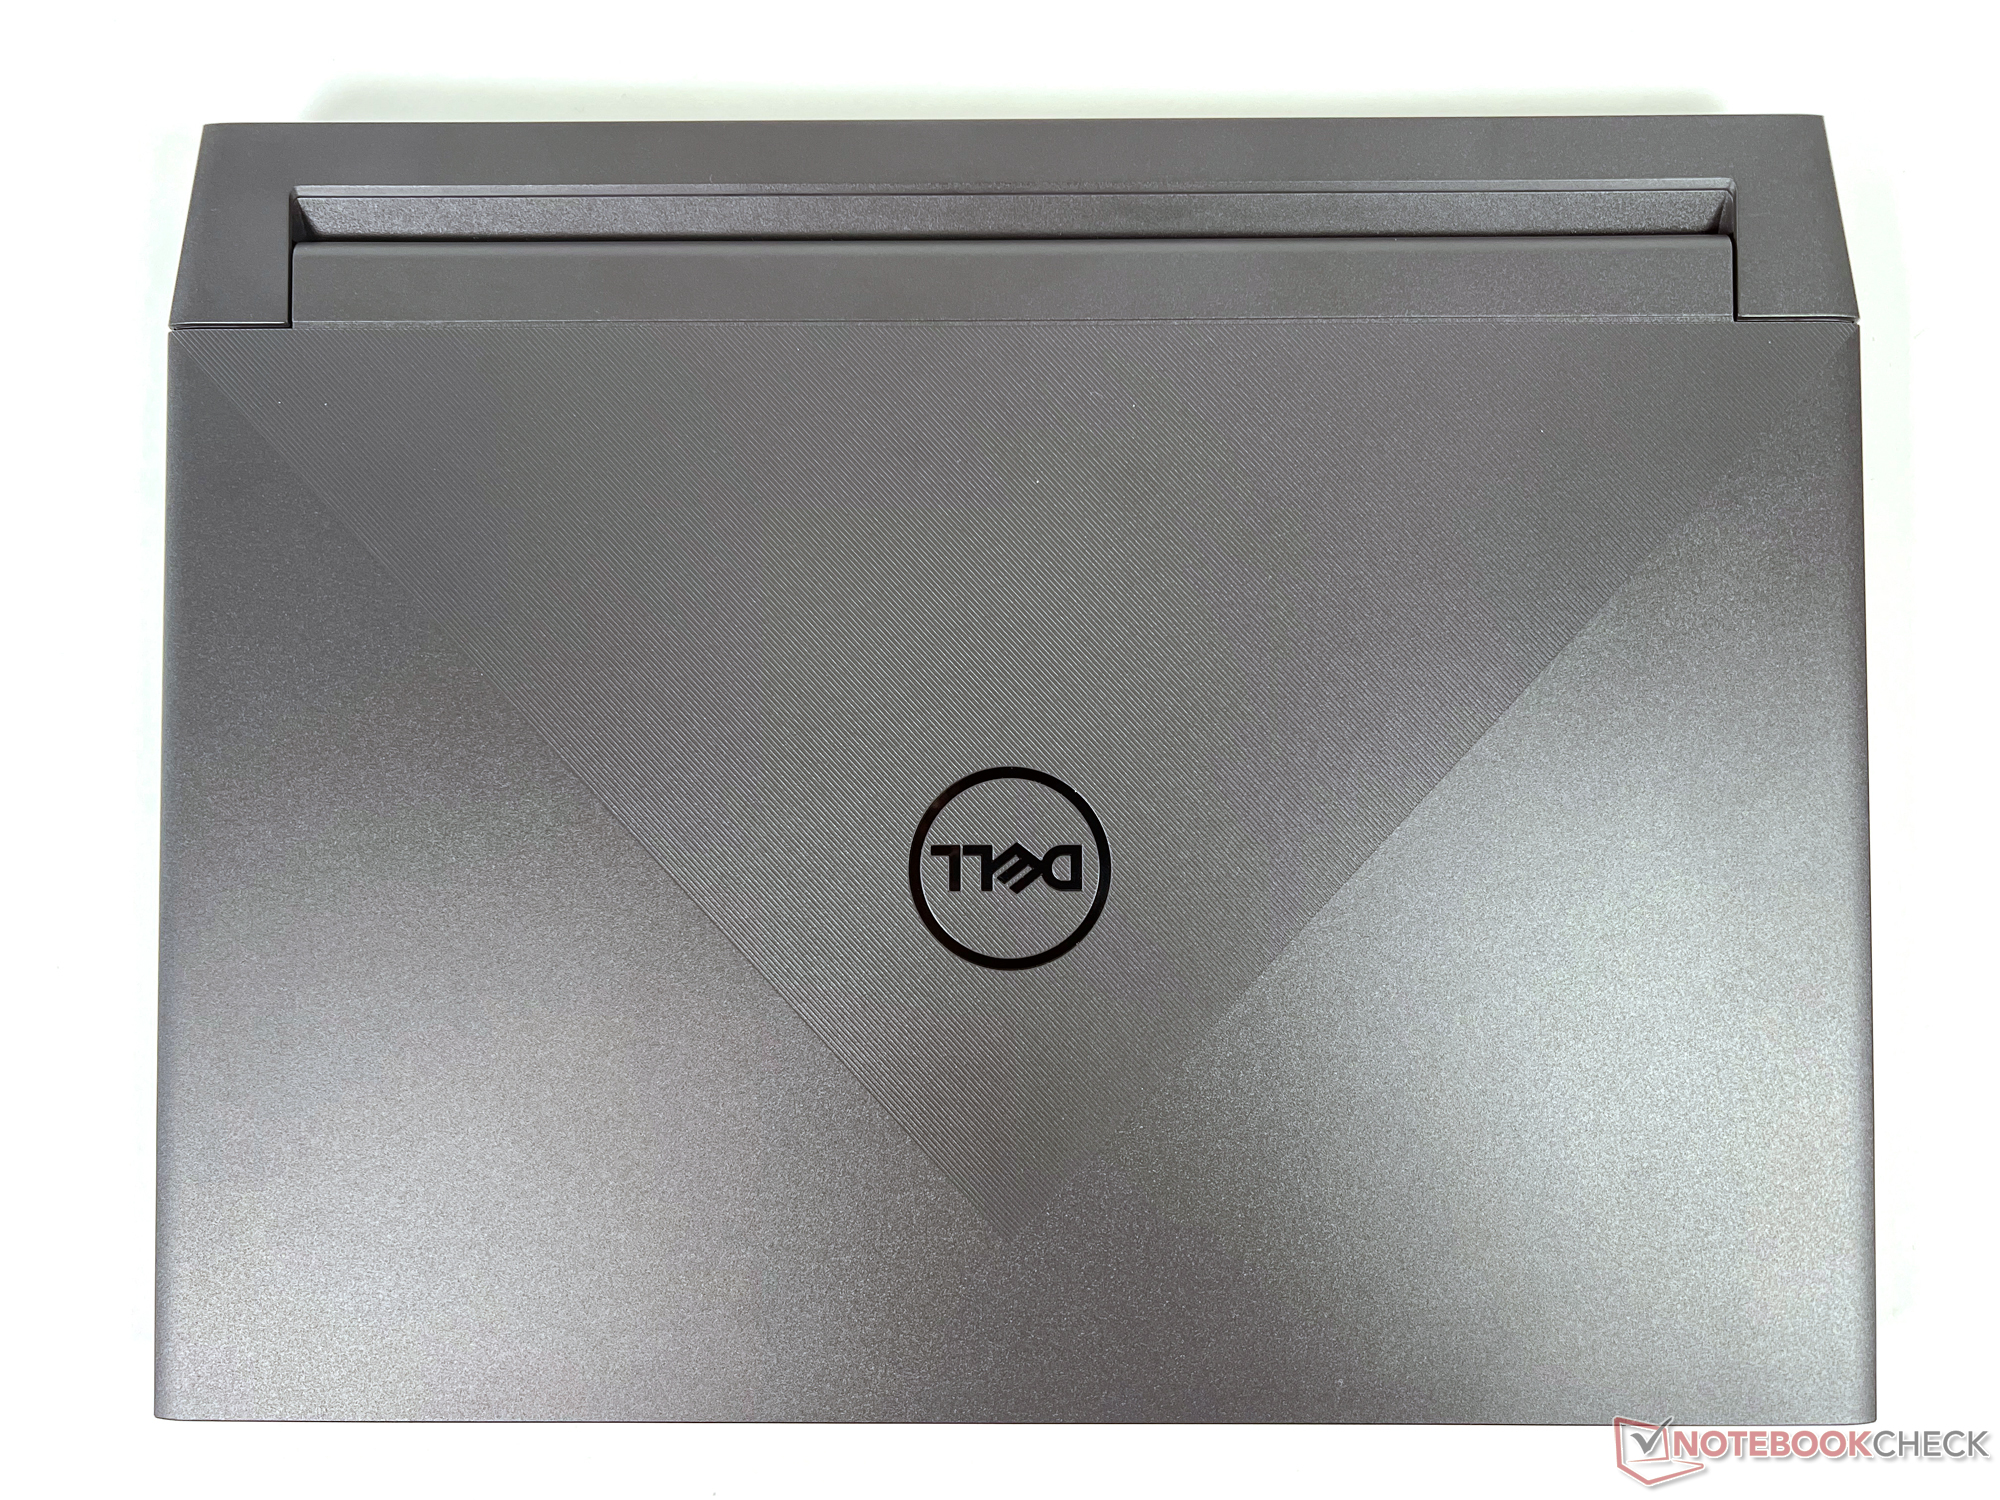
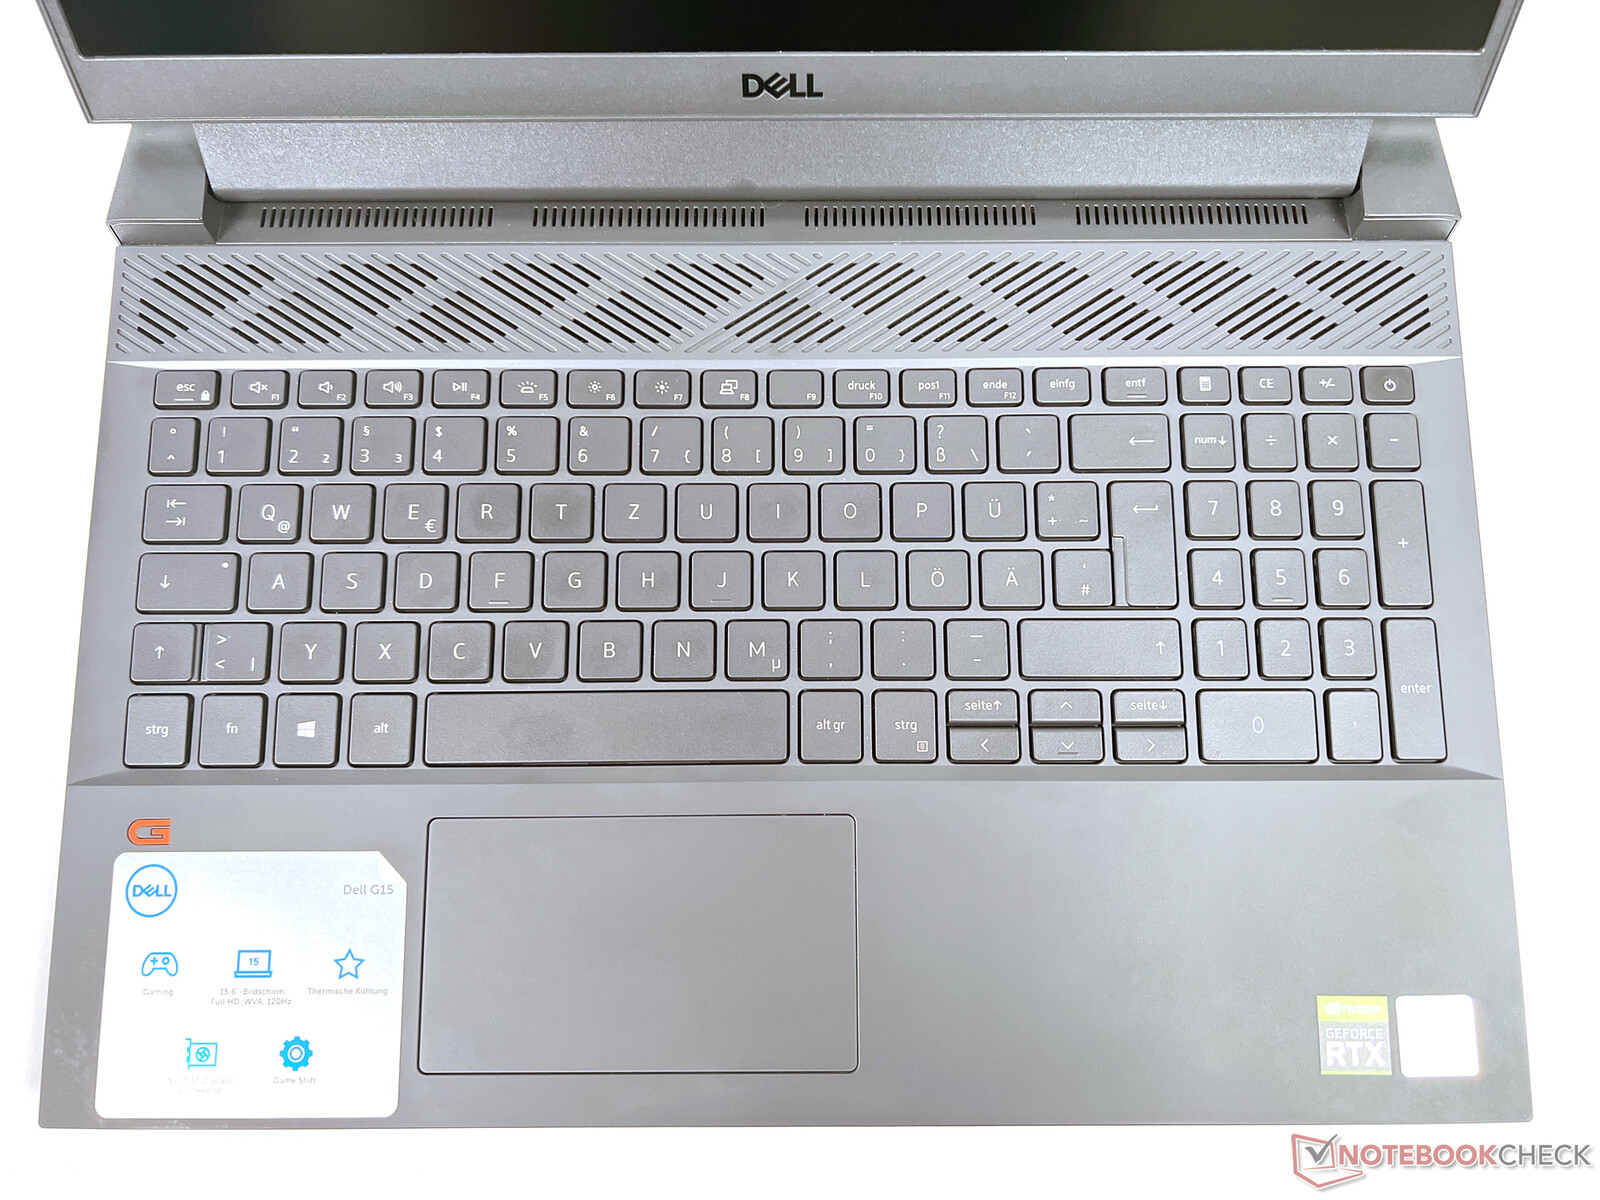
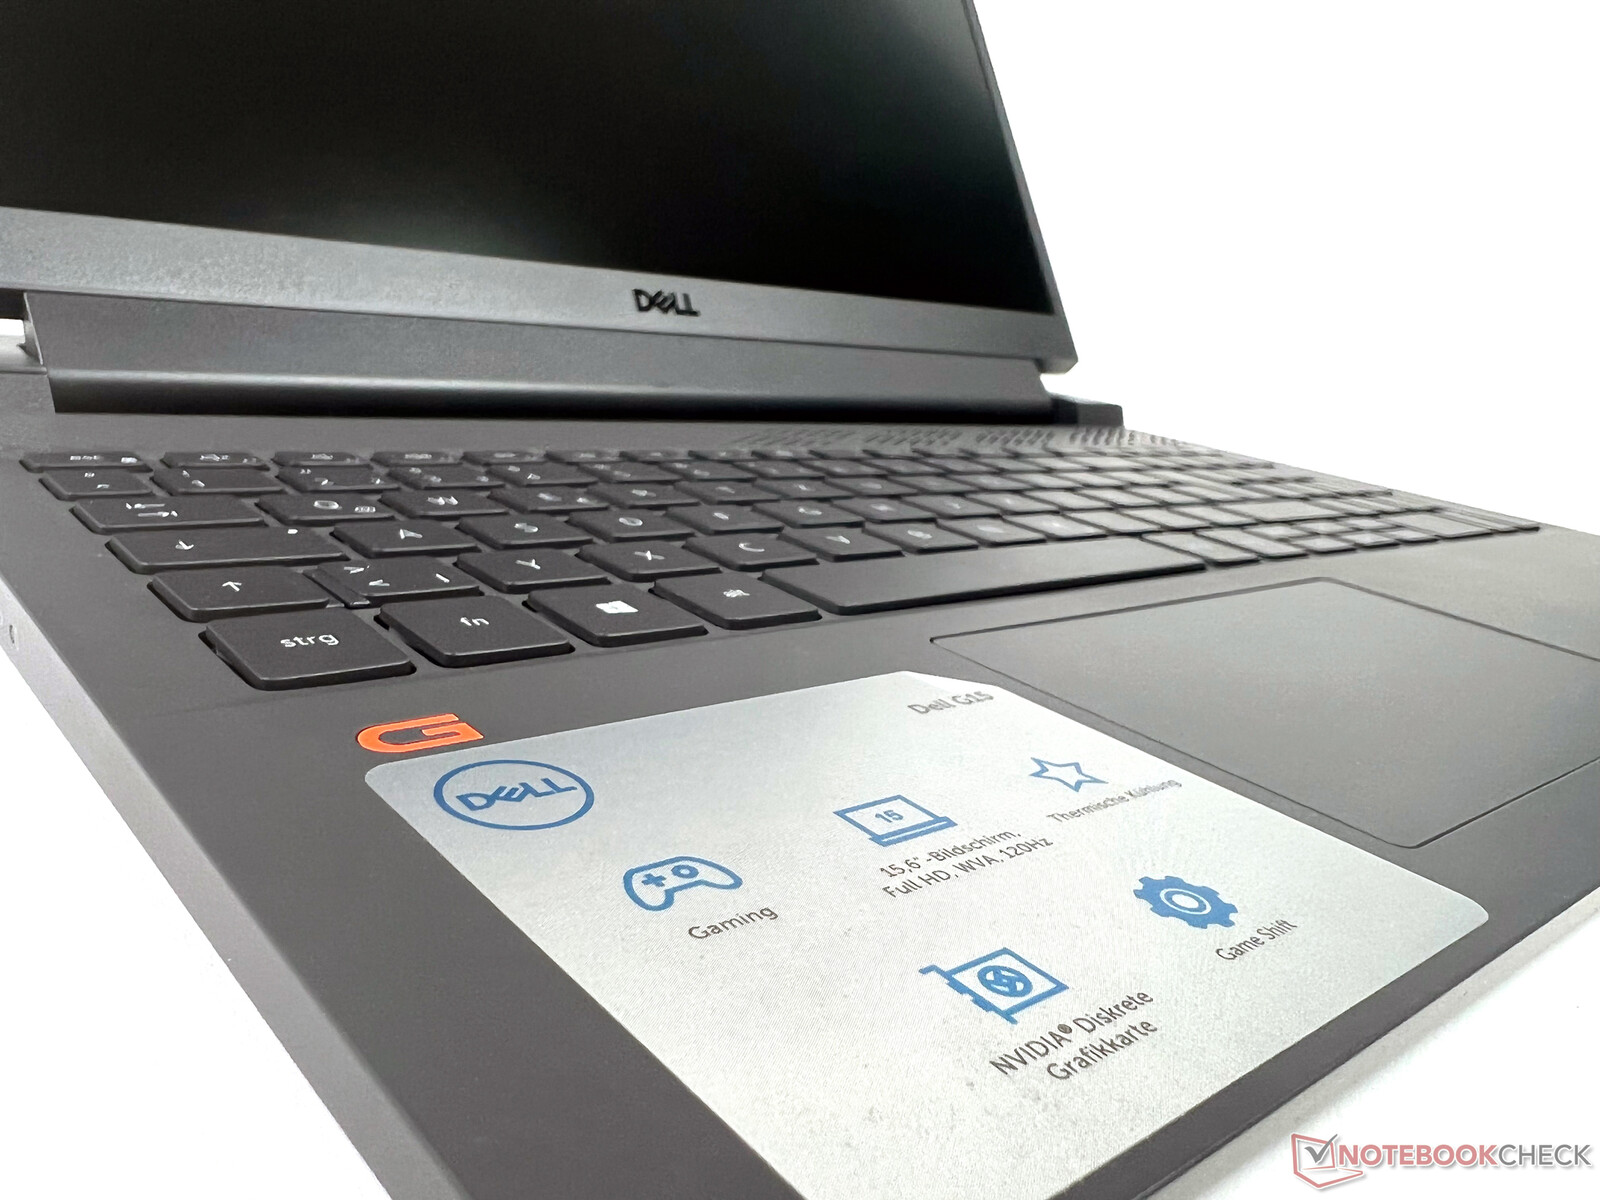
Case: Sober gaming laptop made of gray plastic
Apart from the color ("Phantom Gray with Speckles" vs. "Dark Shadow Gray"), there's no difference between the Intel and the AMD CPU versions of the G15 in terms of design. Once again, the case is well manufactured and quite sturdy, but it's only made of plastic. In addition, it doesn't look quite as stylish compared to the light-gray AMD model; it's much more sober instead.
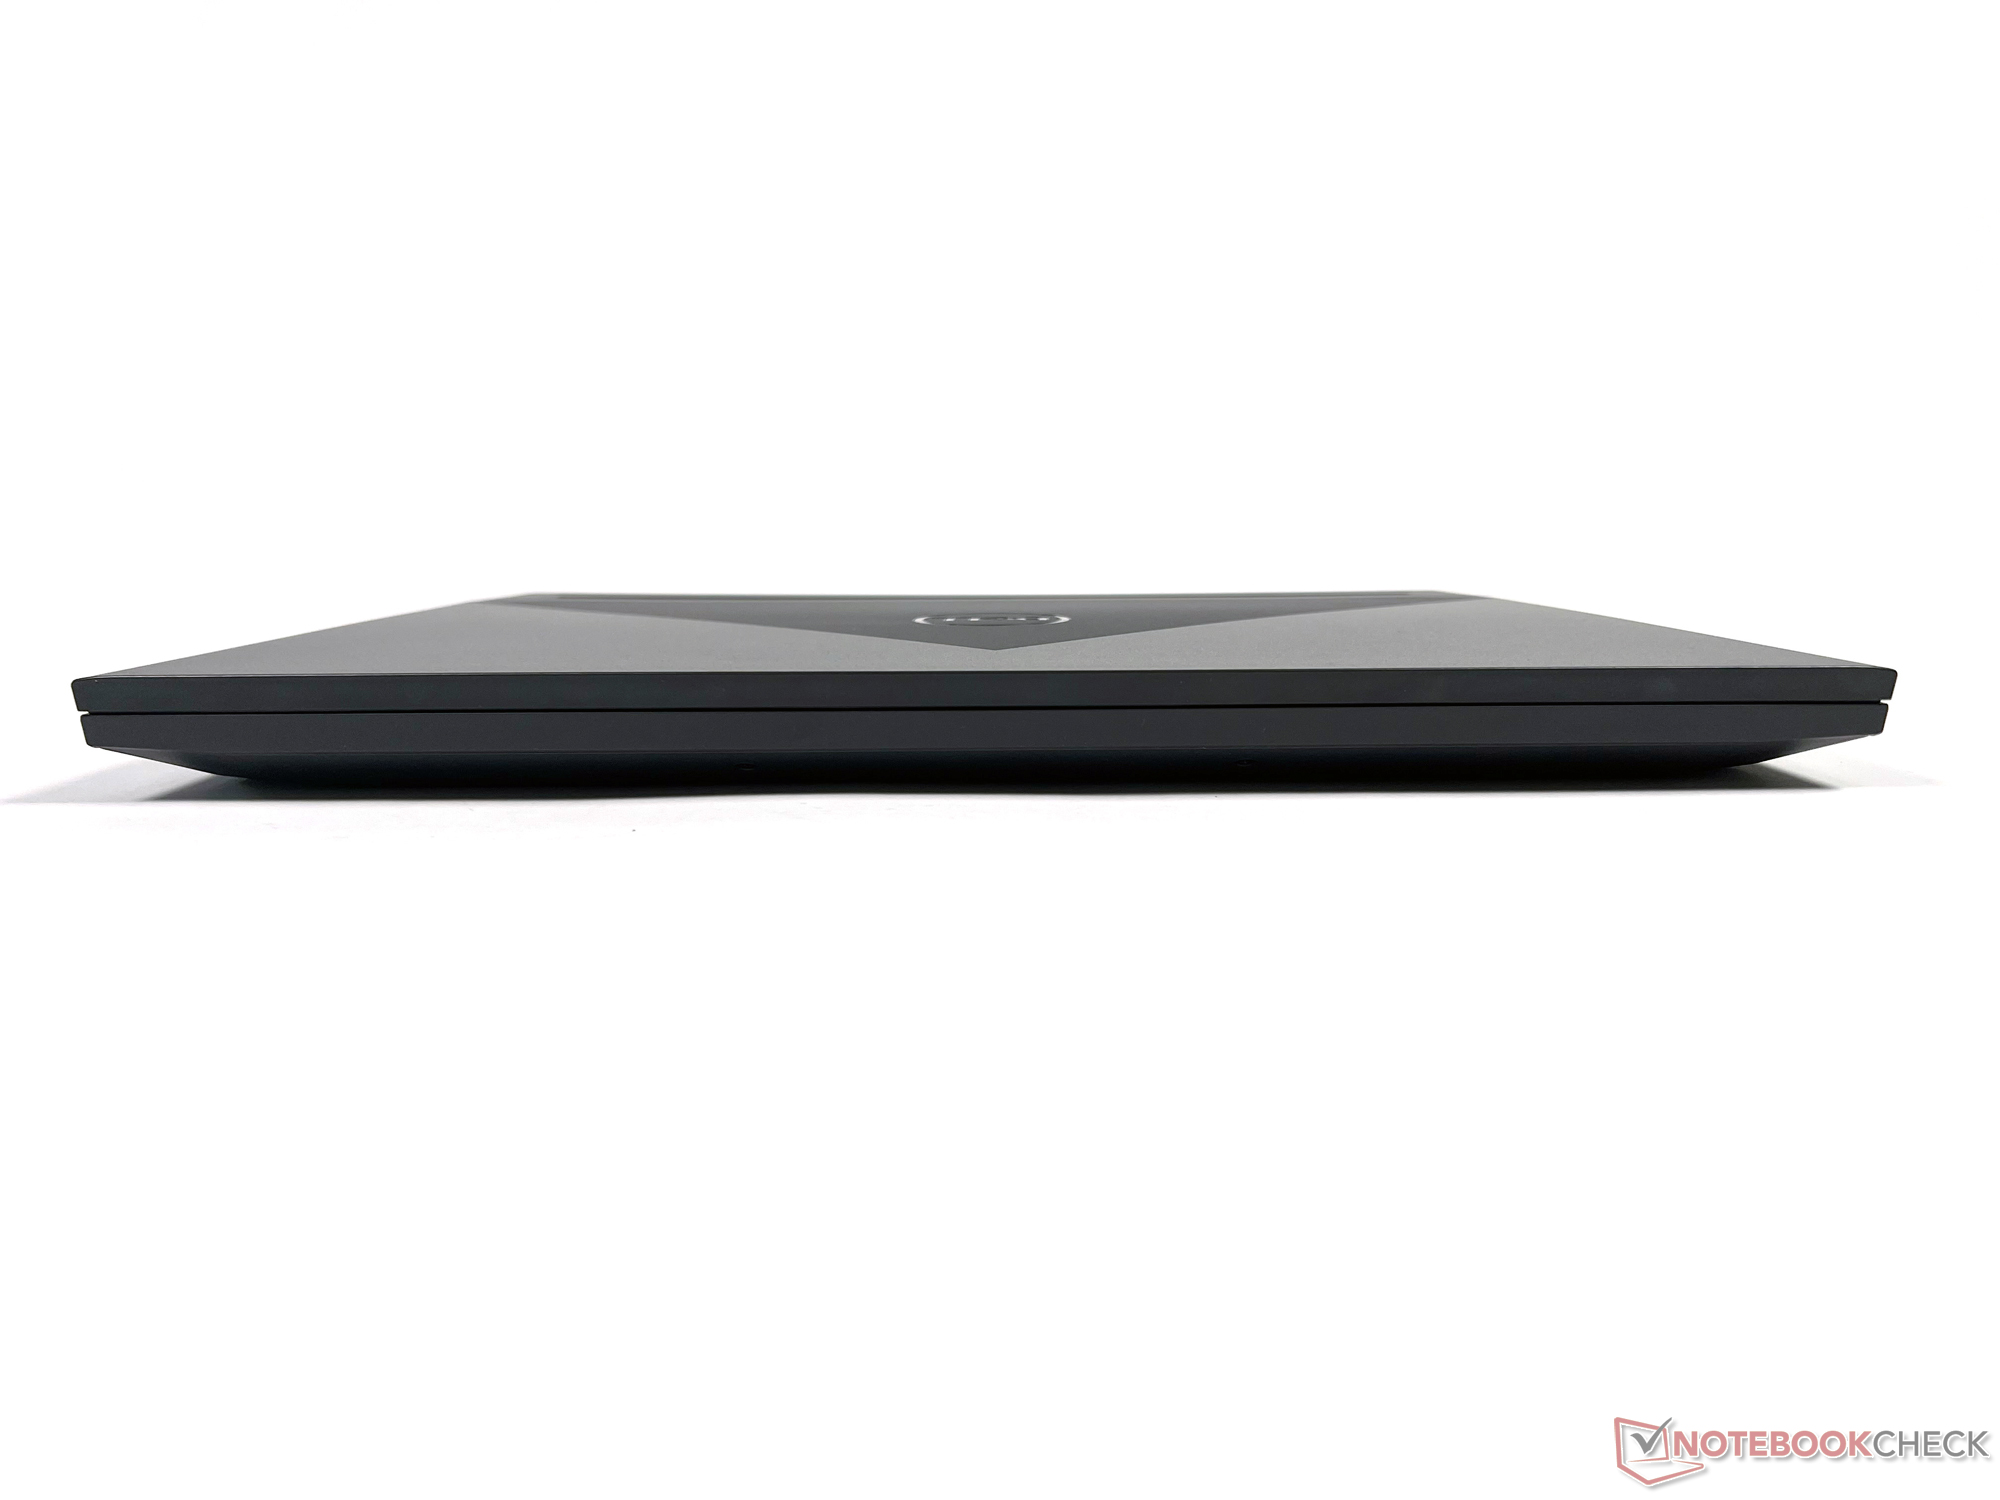
At just under 2.5 kg, the Dell G15 5510 weighs slightly more. Together with the power adapter, which weighs around 1 kg, the device weighs a good 3.5 kg. In return, it's marginally thinner, it has a similar width and thickness compared to the other models, but its depth exceeds that of the devices from the other manufacturers in the comparison.
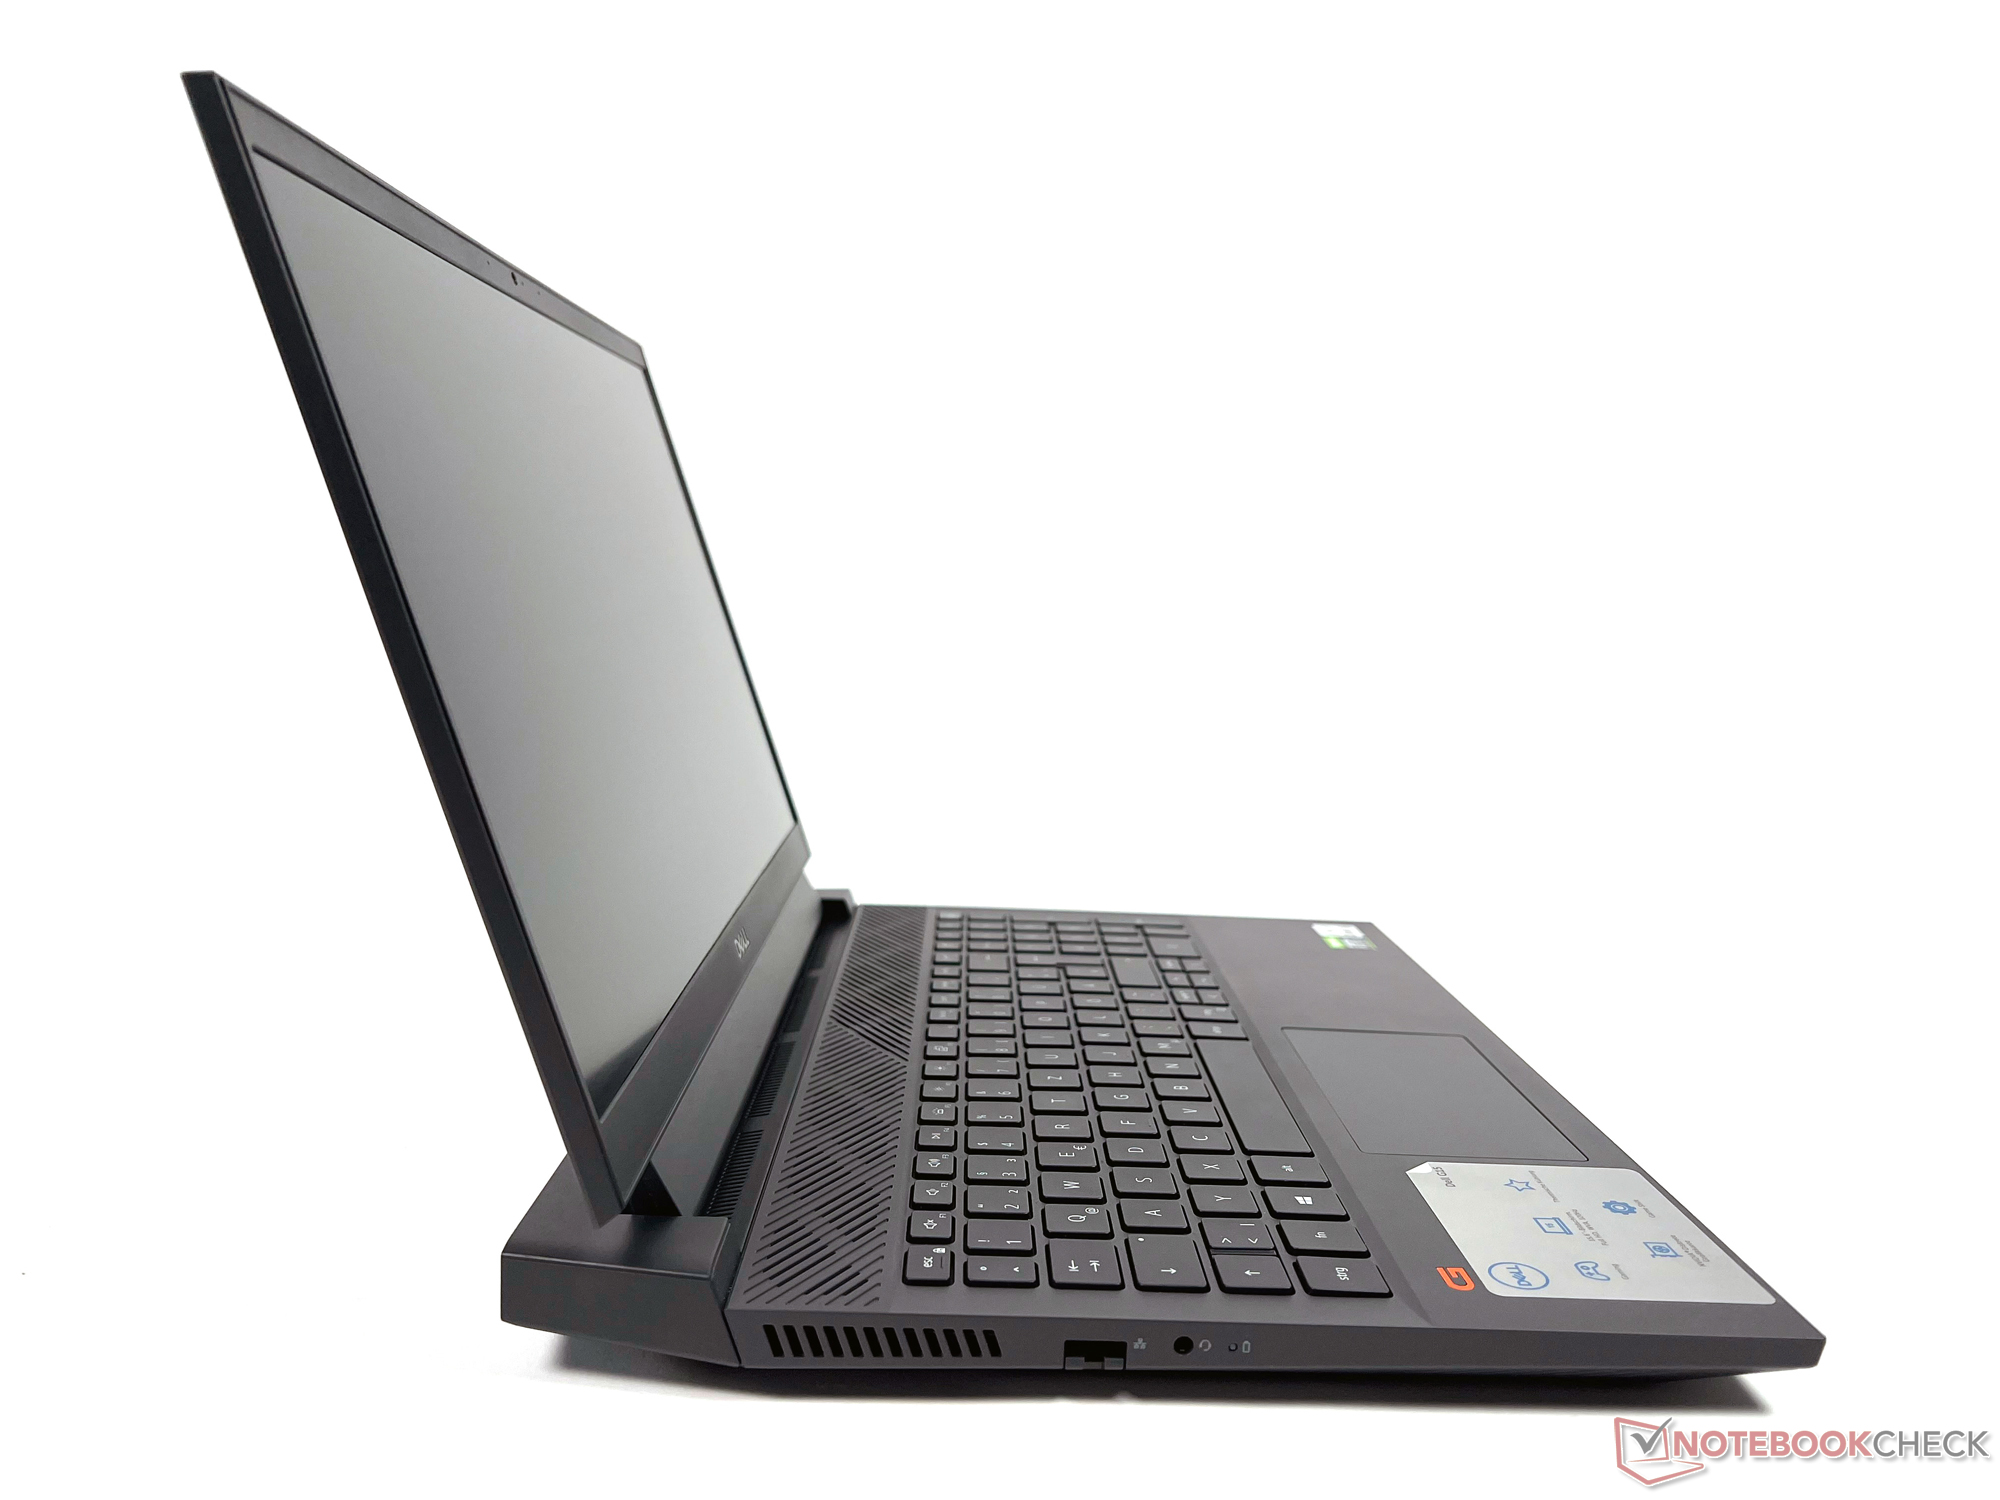
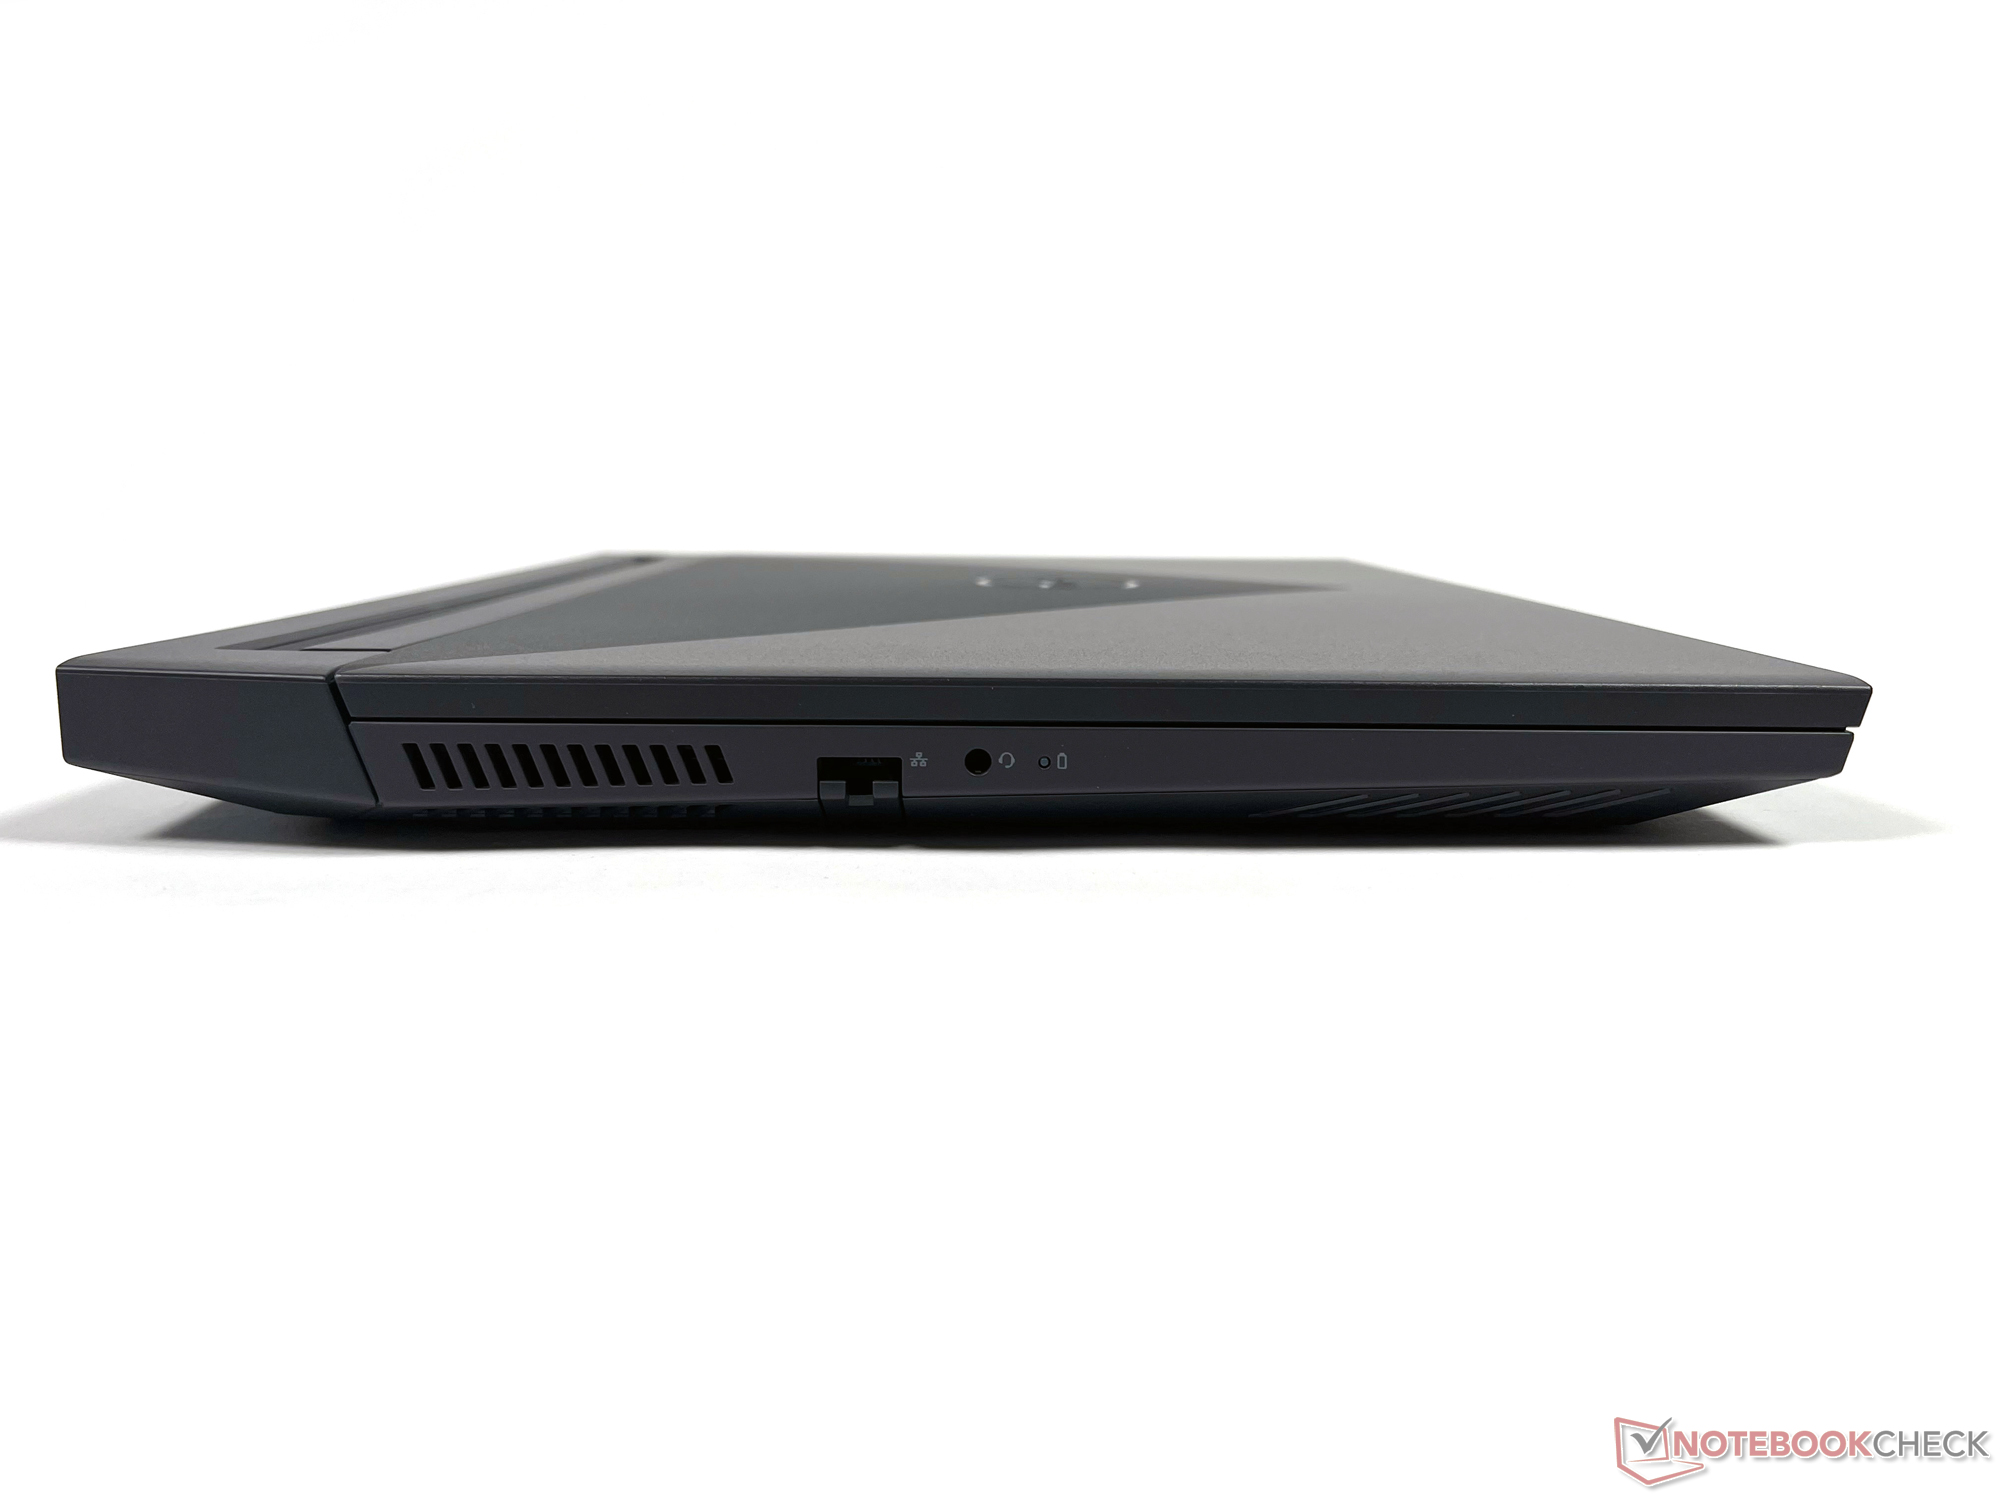
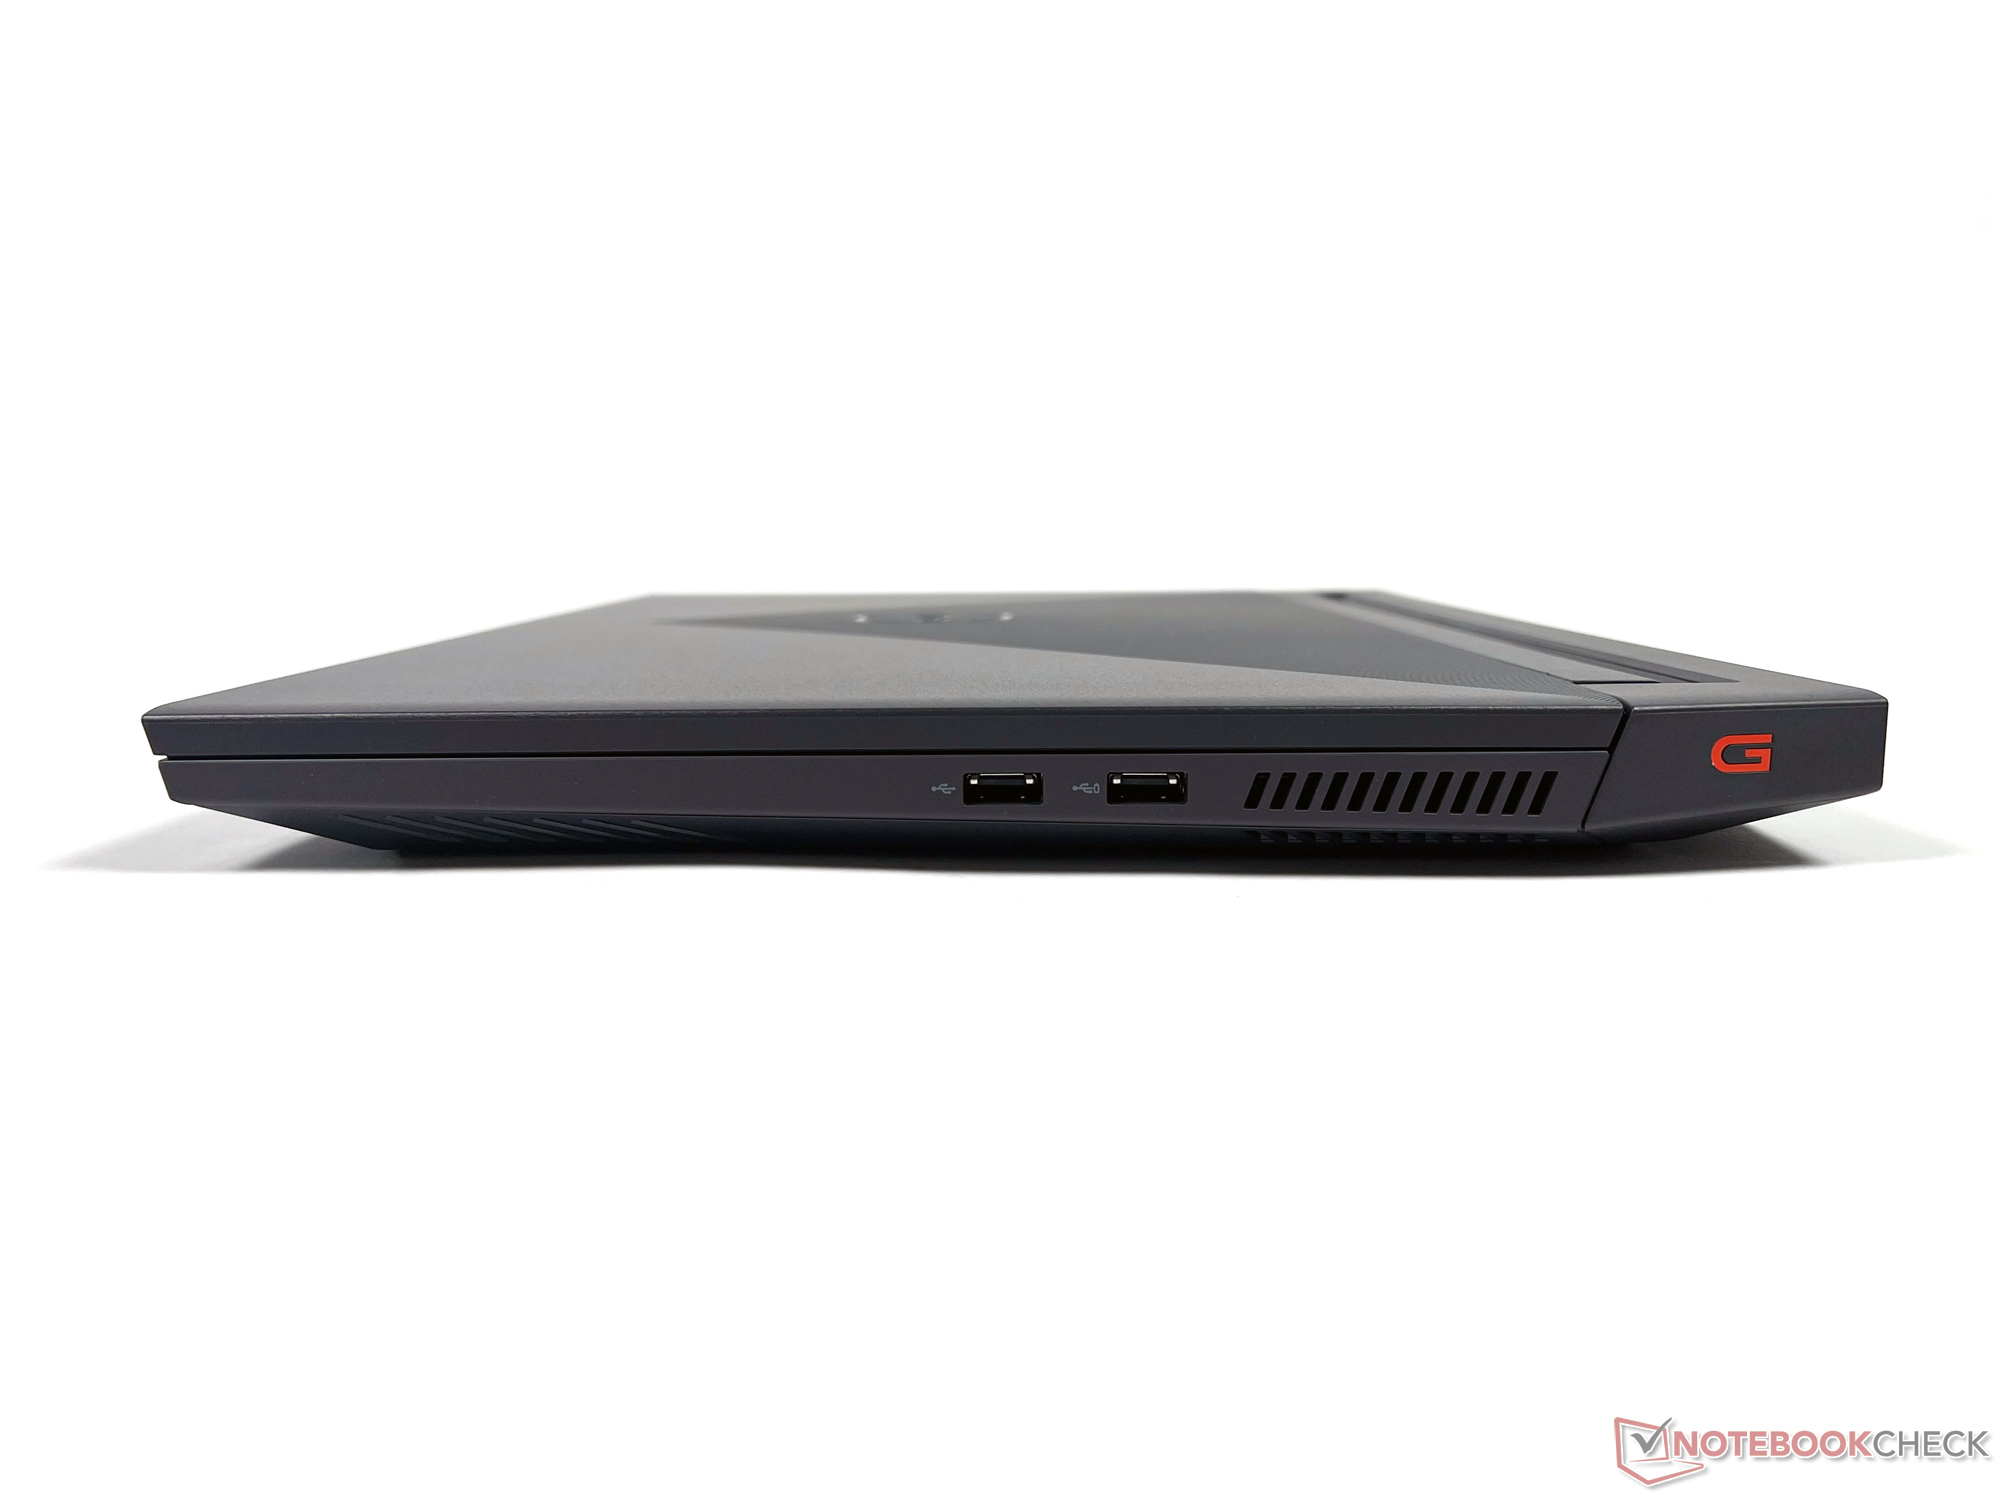
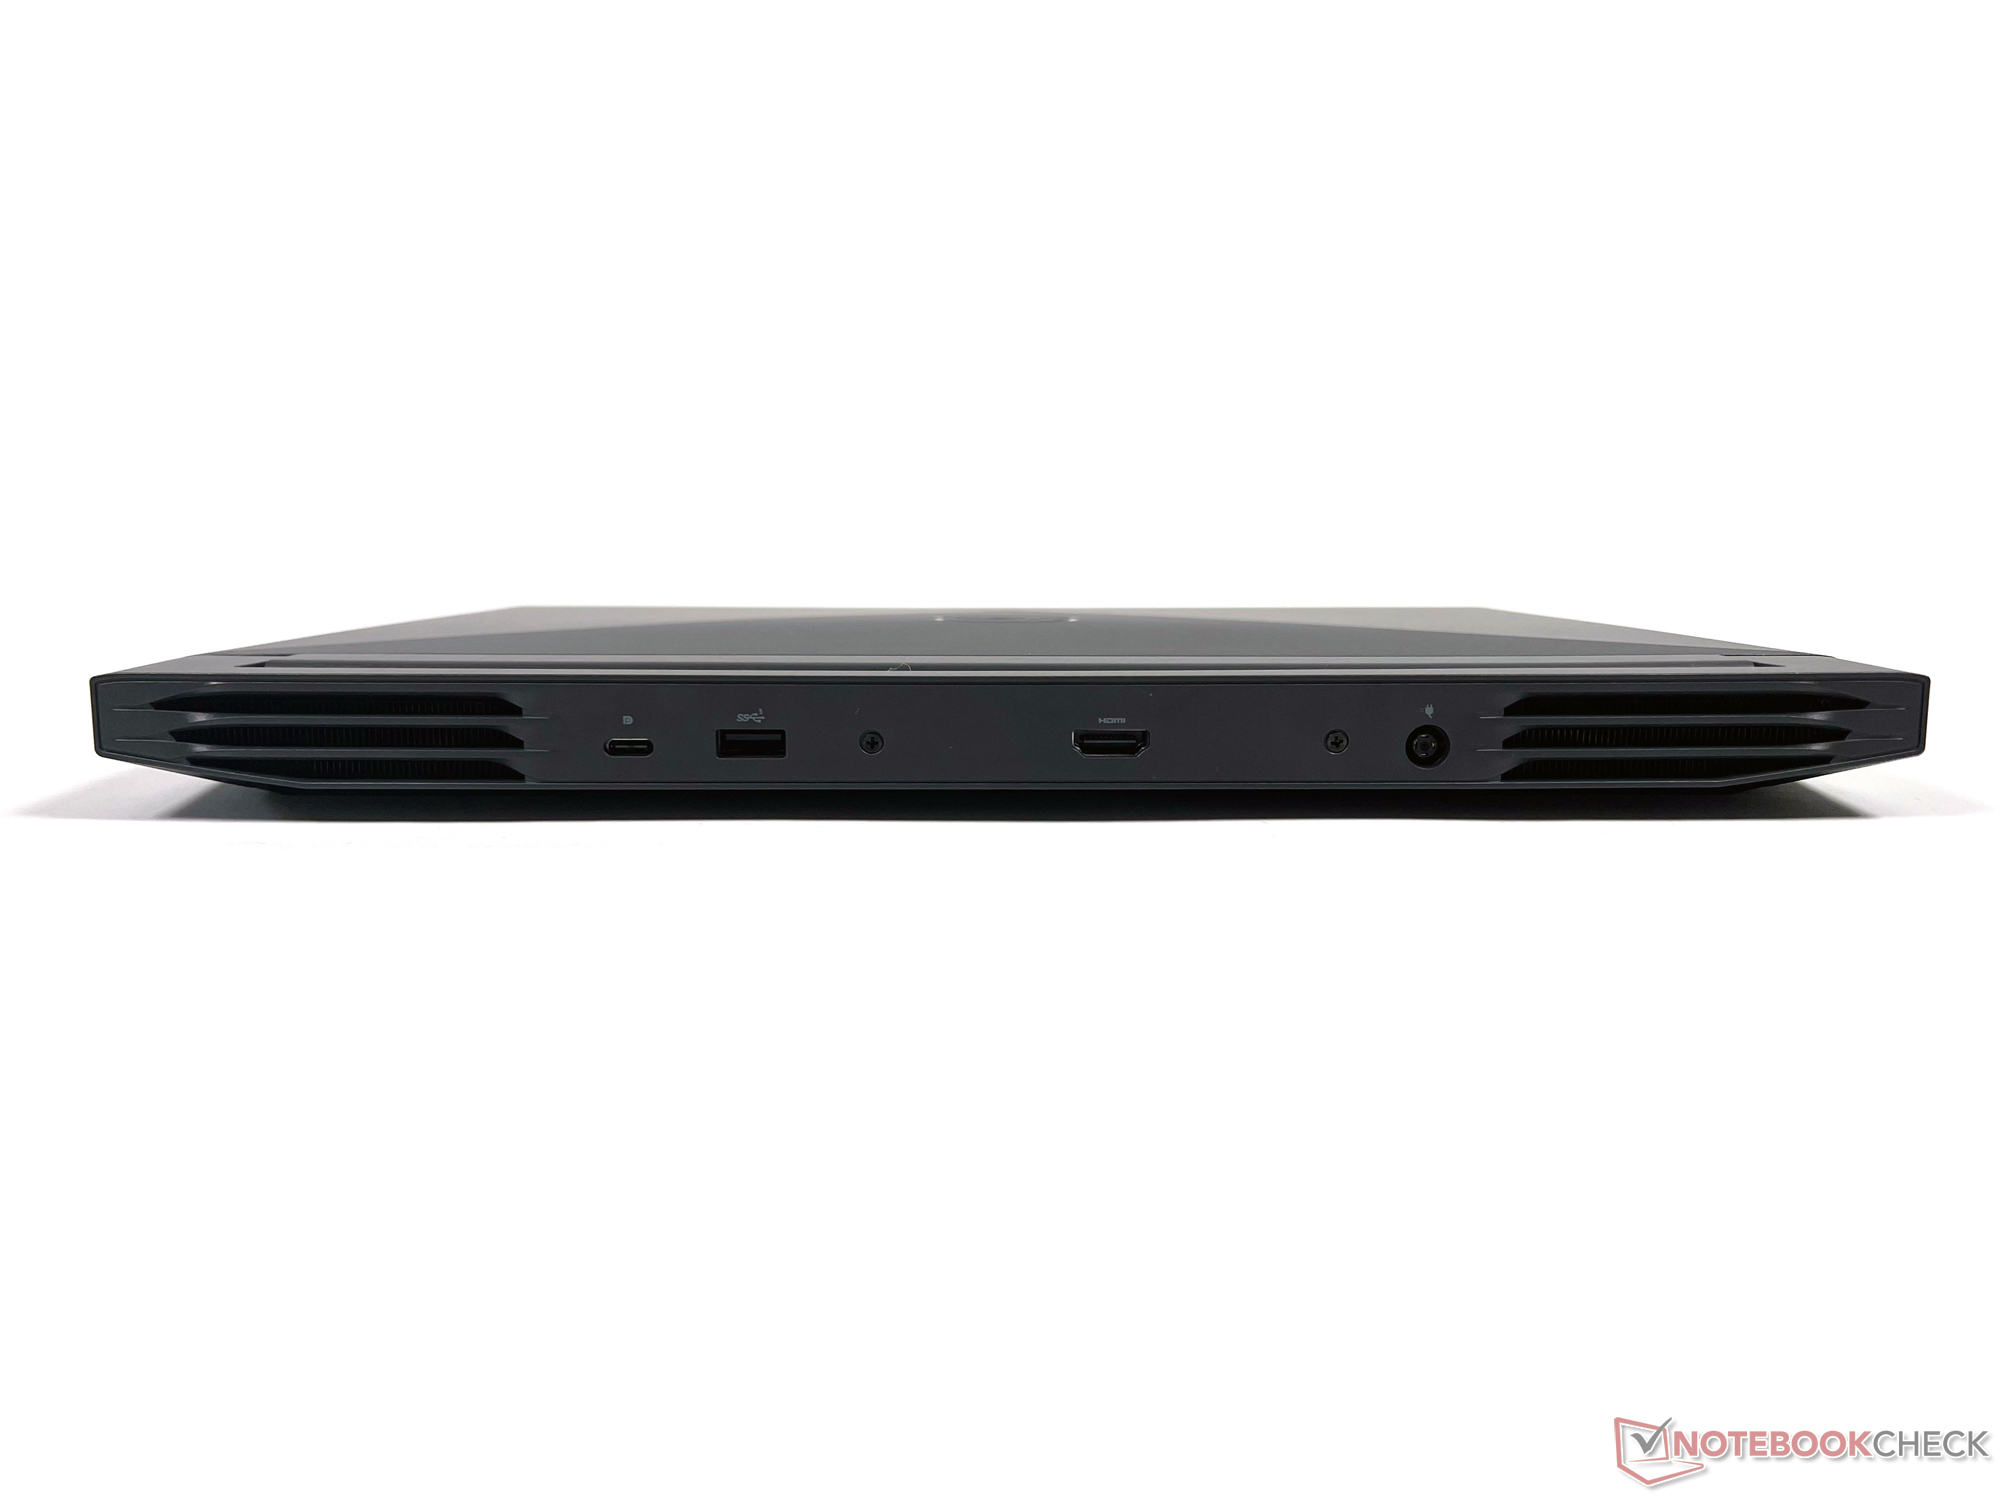
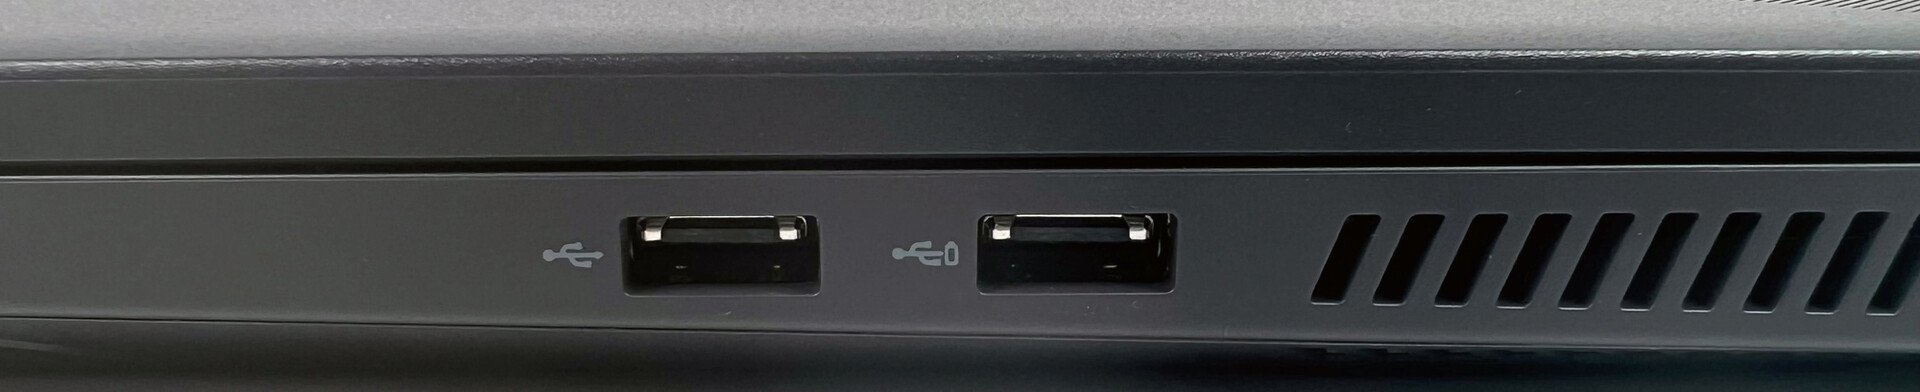
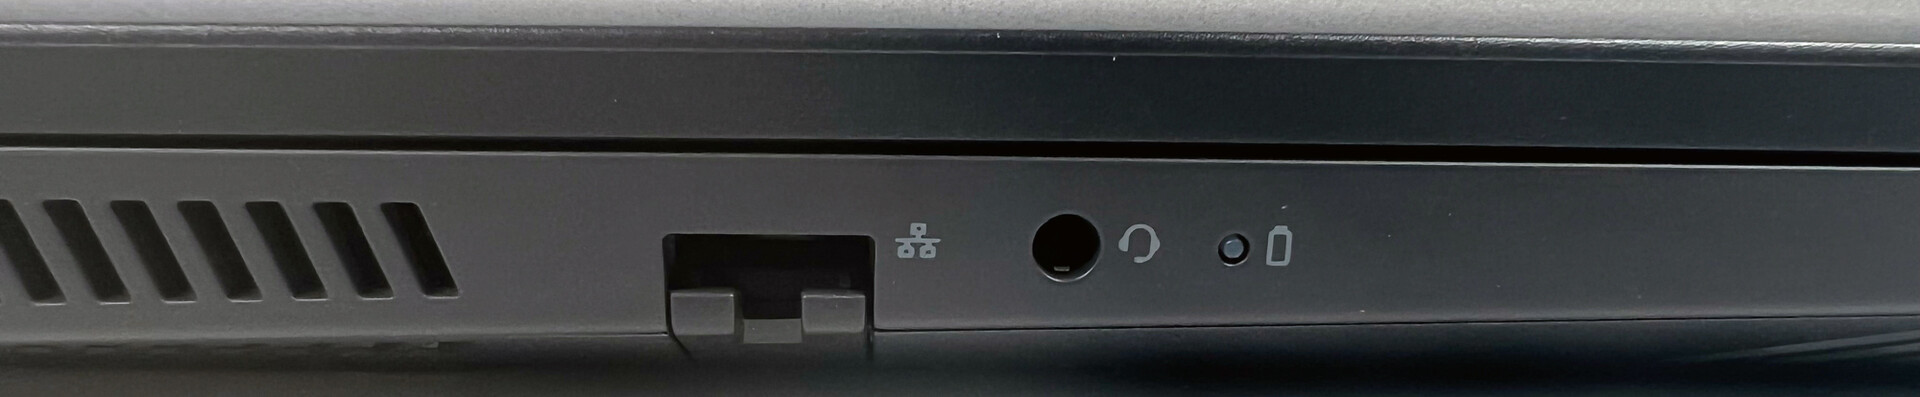
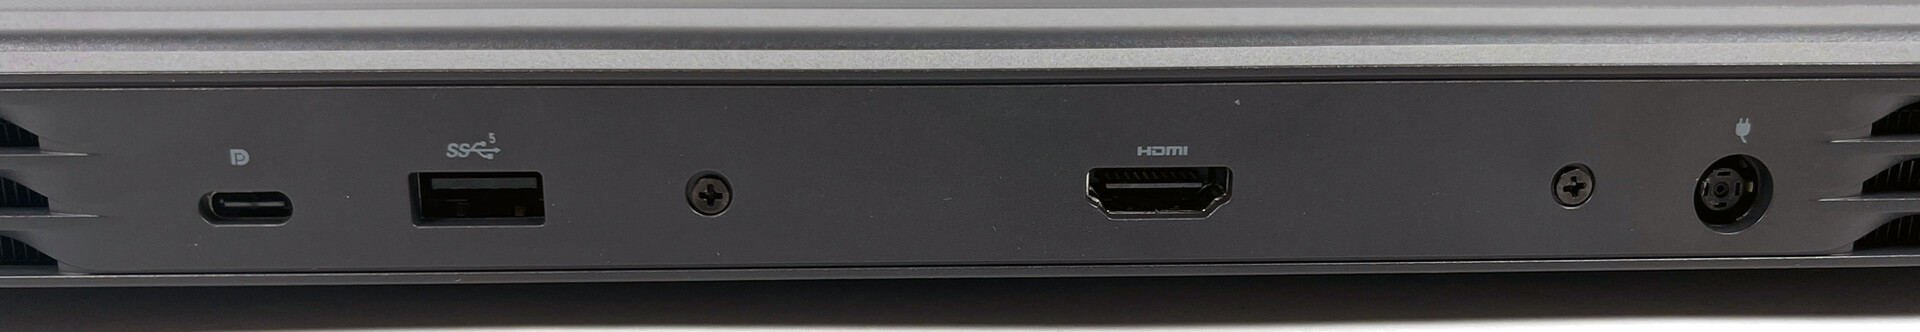
Connectivity: Dell G15 5510 with ports on three sides
The ports are identical to those of the Dell G15 5515, and they're distributed across the left and right edges of the case, as well as the back.
Communication
When sending data in our test, the built-in Intel Wi-Fi 6 AX201 WLAN module performs significantly below average, and it's inferior to all competitors. In return, it managed to climb to first place when receiving data, leaving all rivals behind.
Webcam
As expected, the Dell G15 5510's webcam performs similarly to that of the G15 5515, and it's at the bottom of the field in terms of color accuracy.


Accessories
Dell includes a 240-watt power adapter and the usual documentation with the gaming laptop.
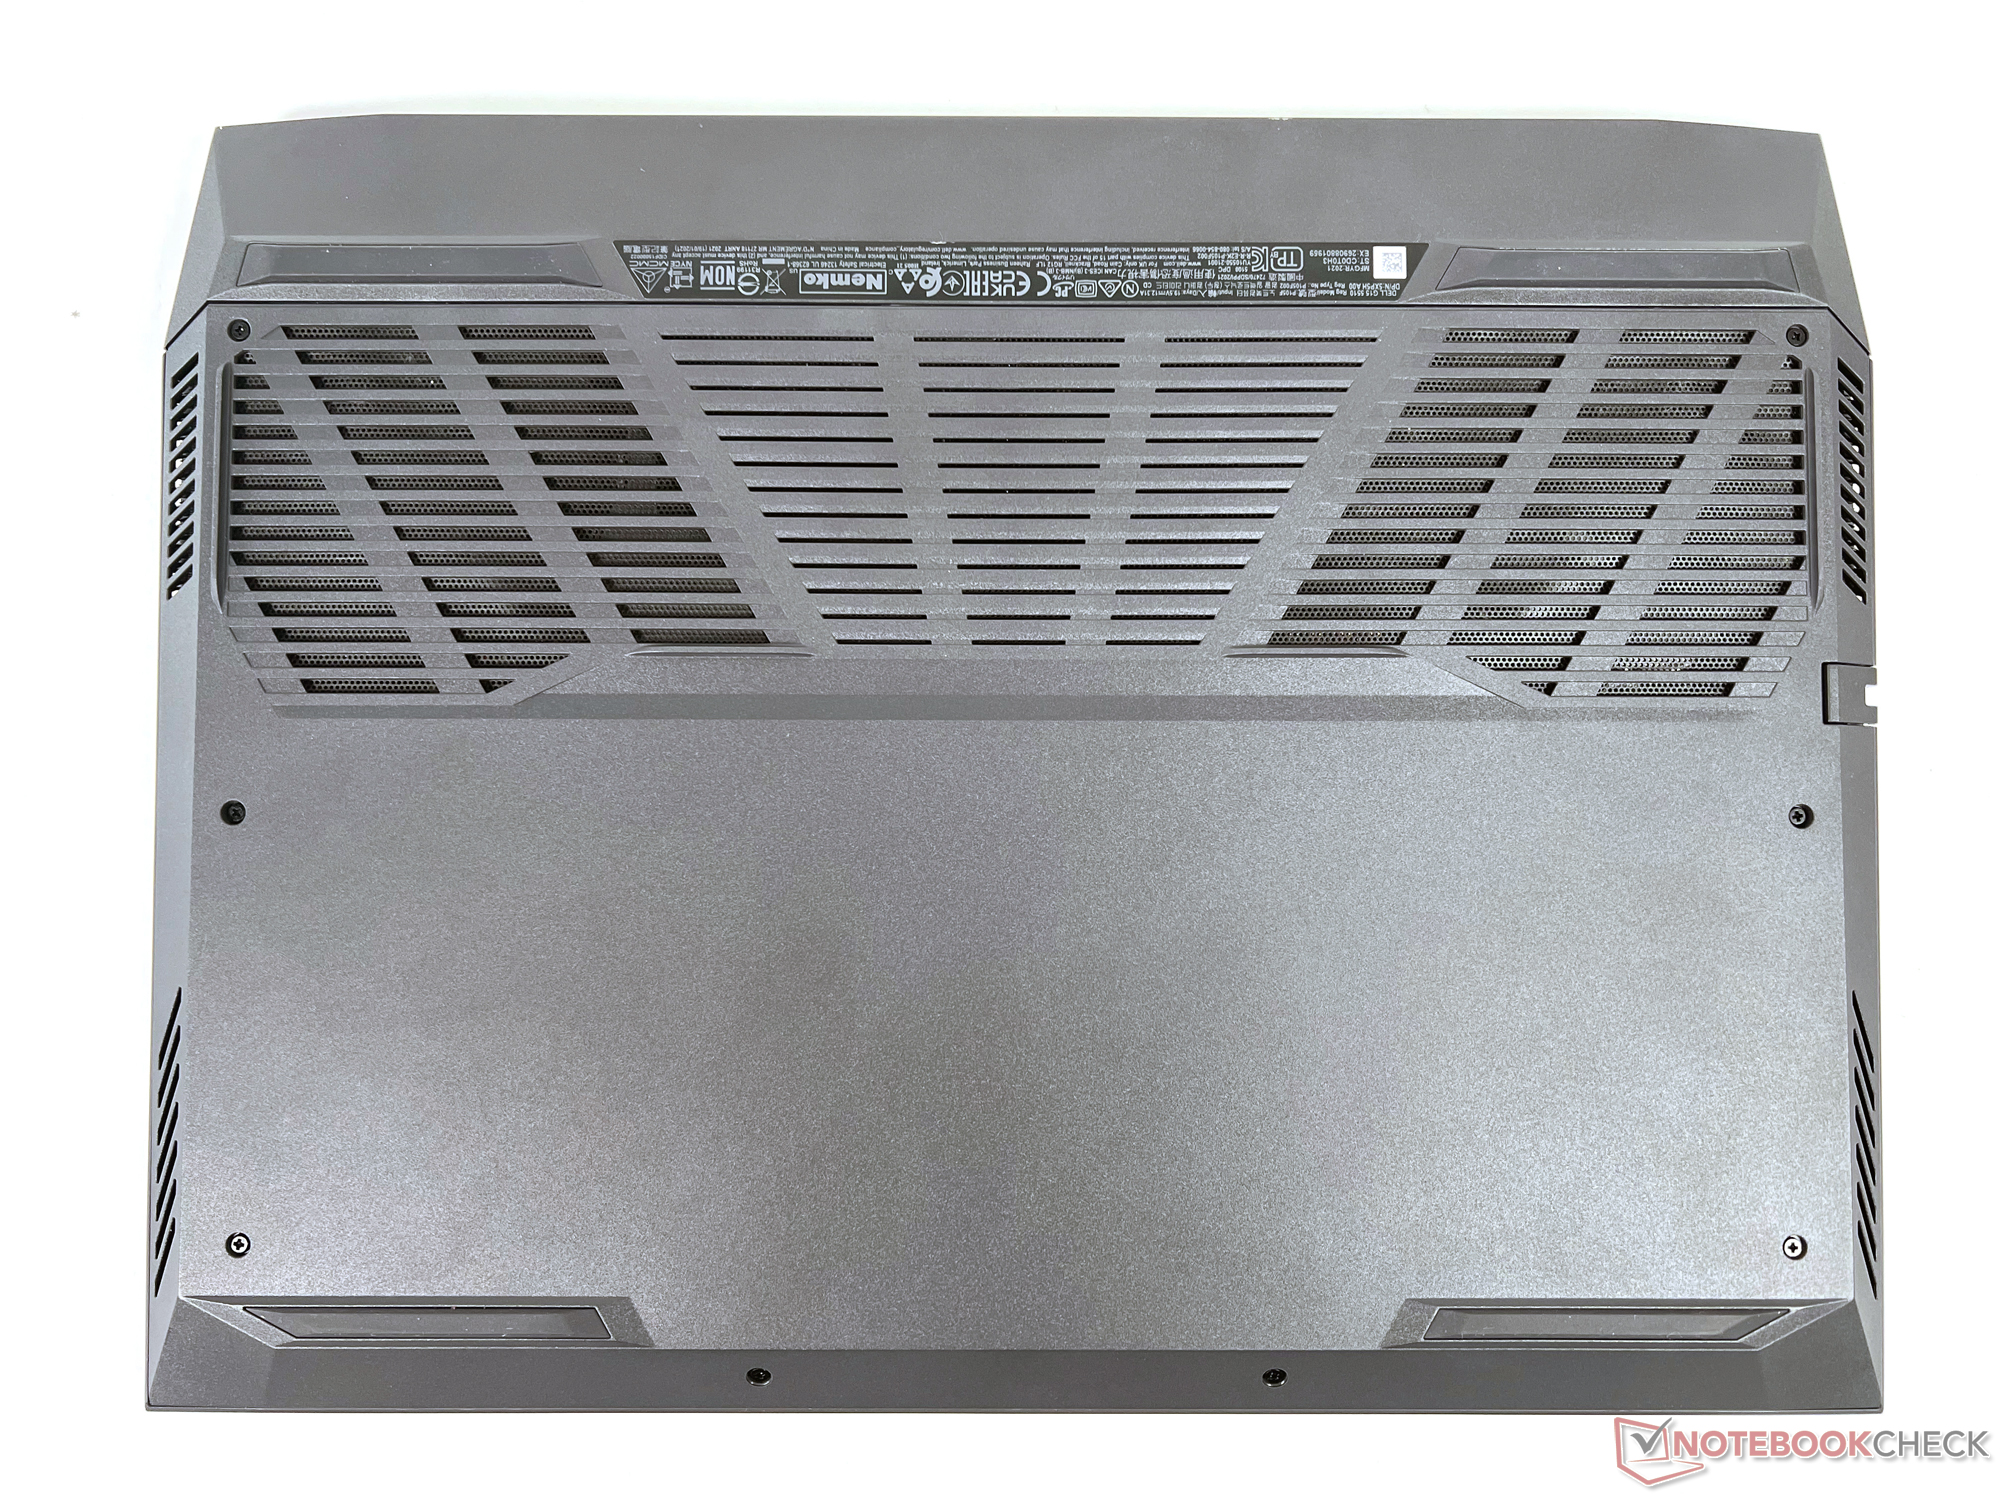
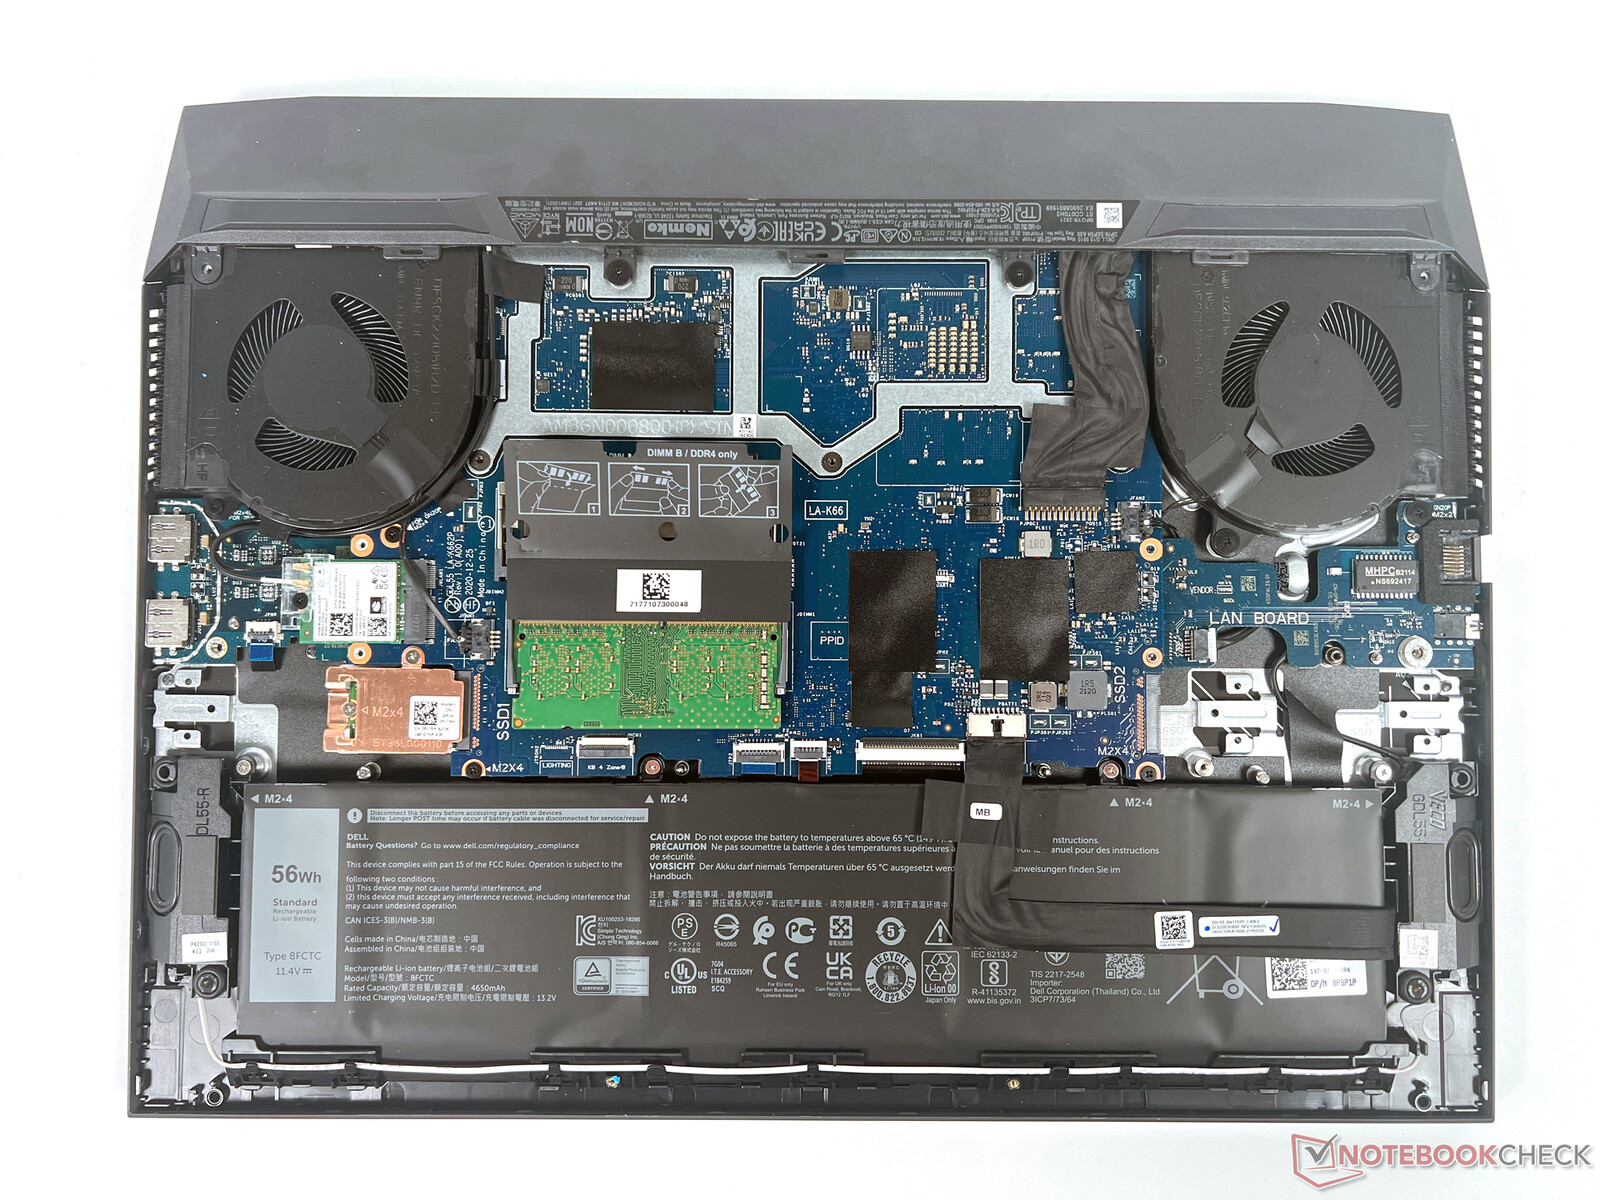
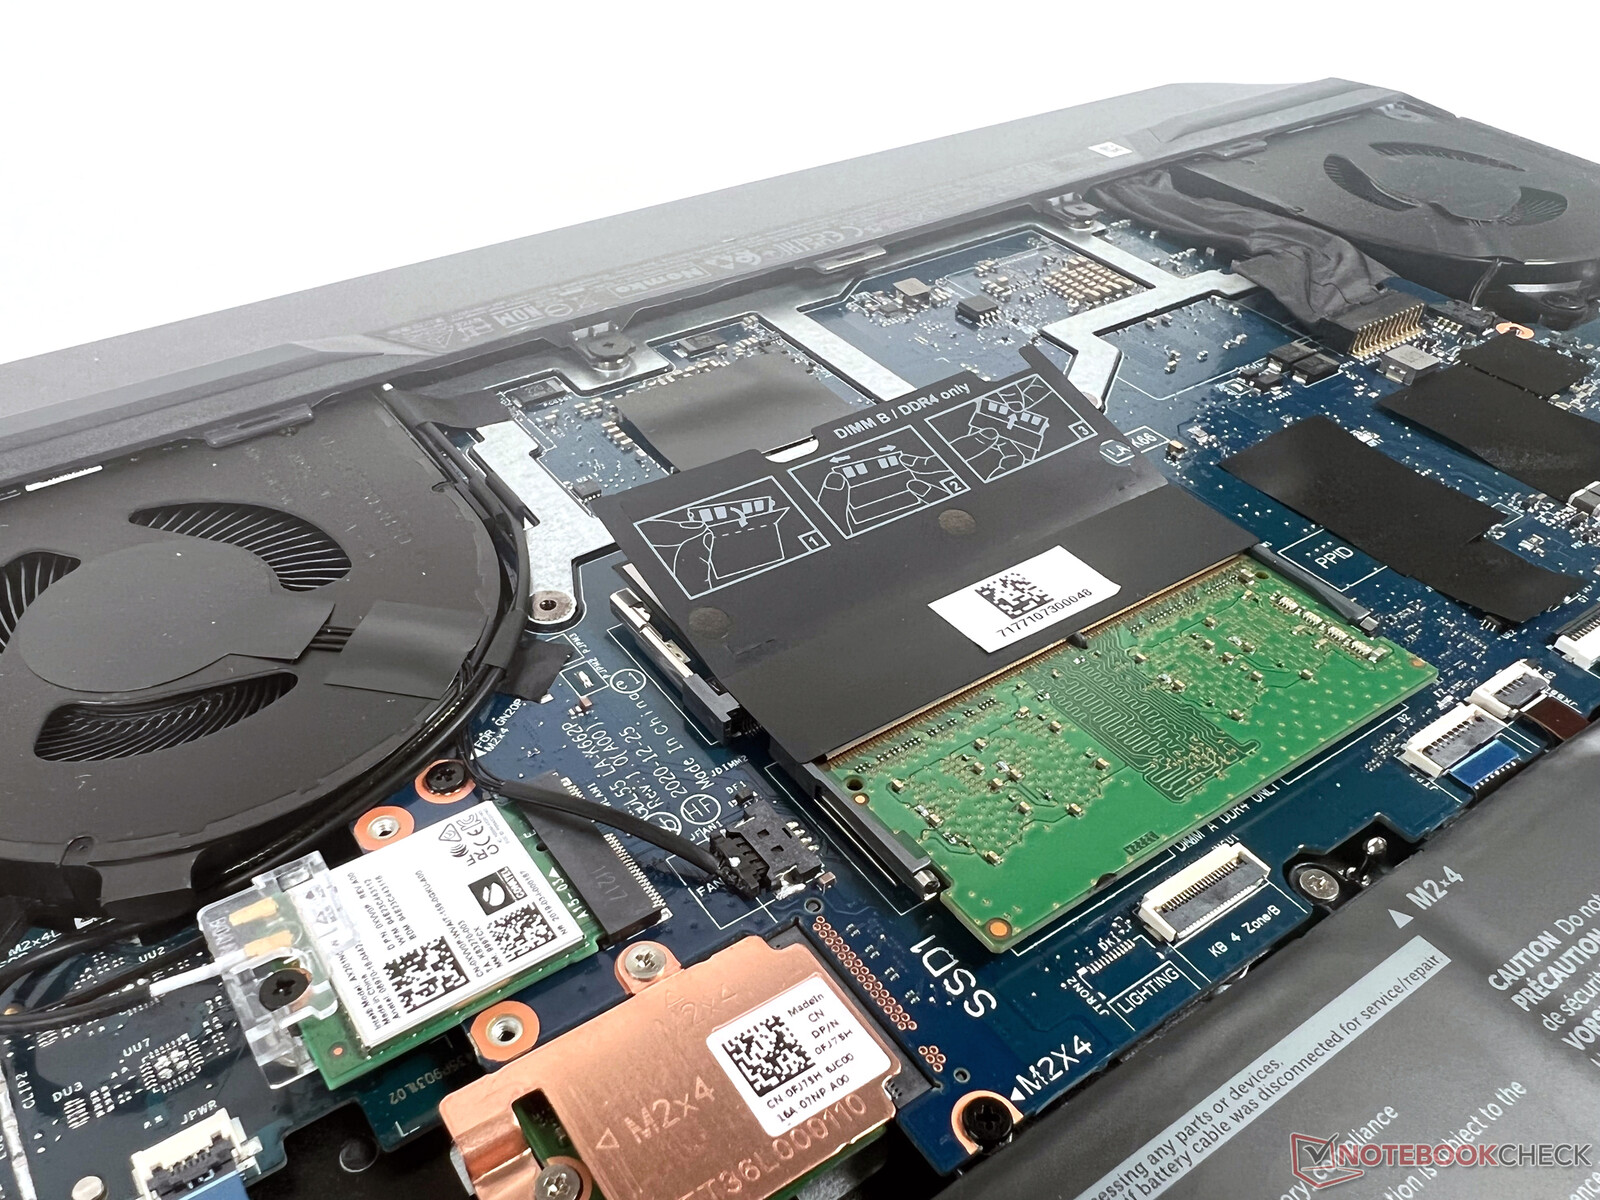
Maintenance
The way inside is blocked by eight small cross screws. One RAM slot and one SSD slot allow the upgrade of memory as well as of storage space. A maximum of 32 GB of RAM can be installed.
Warranty
Dell only offers a 12-month warranty. Upgrades can be purchased for an additional charge, though.
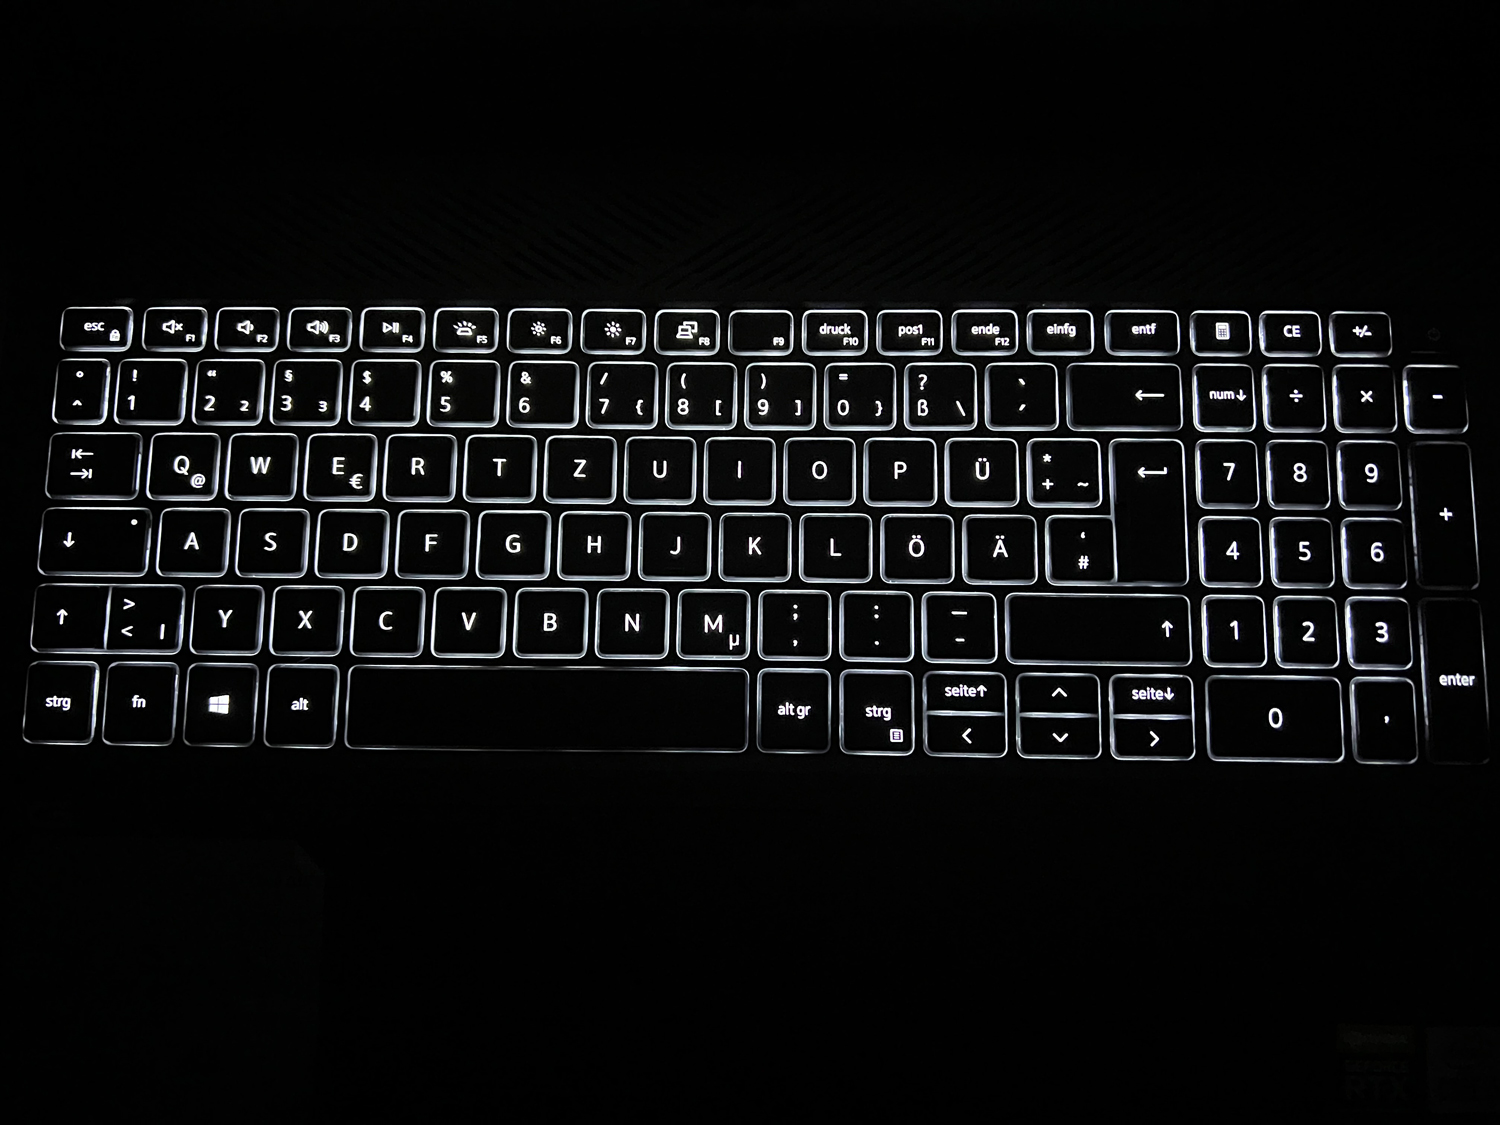
Input devices: Keyboard and touchpad without issues
The backlit chiclet keyboard with the accompanying number pad is identical to that of the Ryzen Edition, which is why we refer to the latter's review at this point. You can find more information there regarding the quality and typing experience, as well as the 10.5 x 6 cm touchpad.
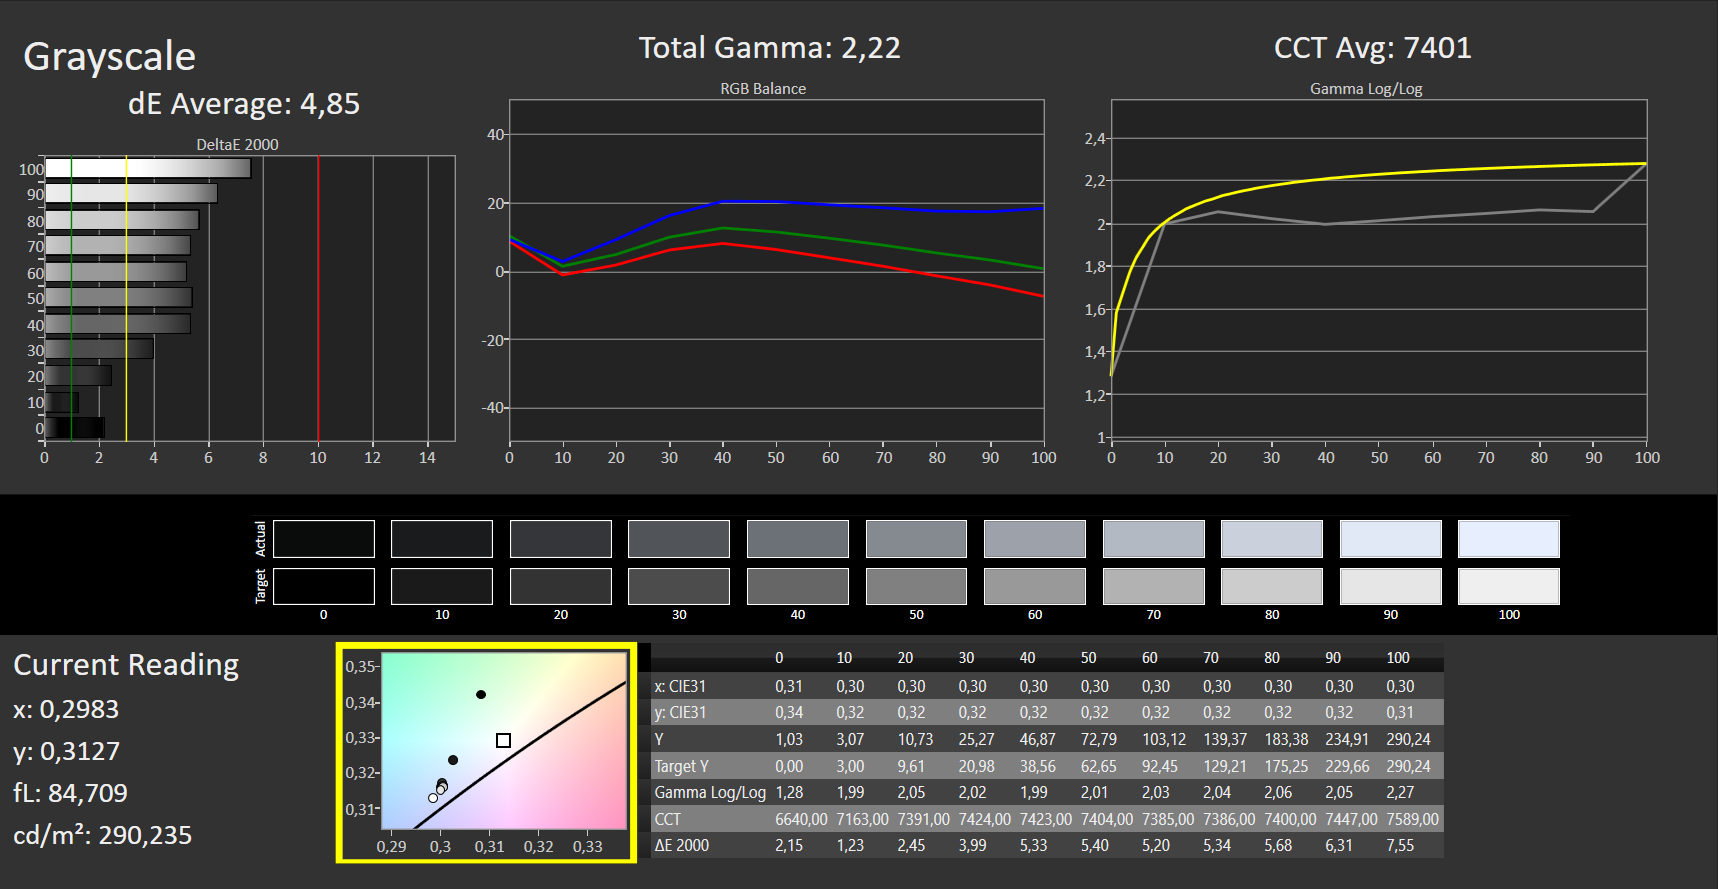
Display: Dell gaming laptop with a fast 120 Hz display that is low in contrast


As opposed to the BOE panel from the AMD model, Dell has used its own IPS display in this 5510. The base specs are identical: 15.6-inch diagonal, 1,920x1,080 pixels (Full HD), and a 120 Hz refresh rate.
In terms of the traditional measurements, the panel installed here is largely on par. While the brightness values of the likewise matte display are marginally higher, other measurements, such as the extremely low contrast, score worse.
What is striking is that the response times of the Dell panel are significantly slower than those of the AMD variant. At 27 ms (black to white) and 35 ms (50% gray to 80% gray), respectively, they're about 10 ms higher on average, which isn't good for a gaming laptop. This means that the rates are below average overall, which slightly diminishes the advantage of a 120 Hz panel.
| |||||||||||||||||||||||||
Brightness Distribution: 87 %
Center on Battery: 289 cd/m²
Contrast: 267:1 (Black: 1.085 cd/m²)
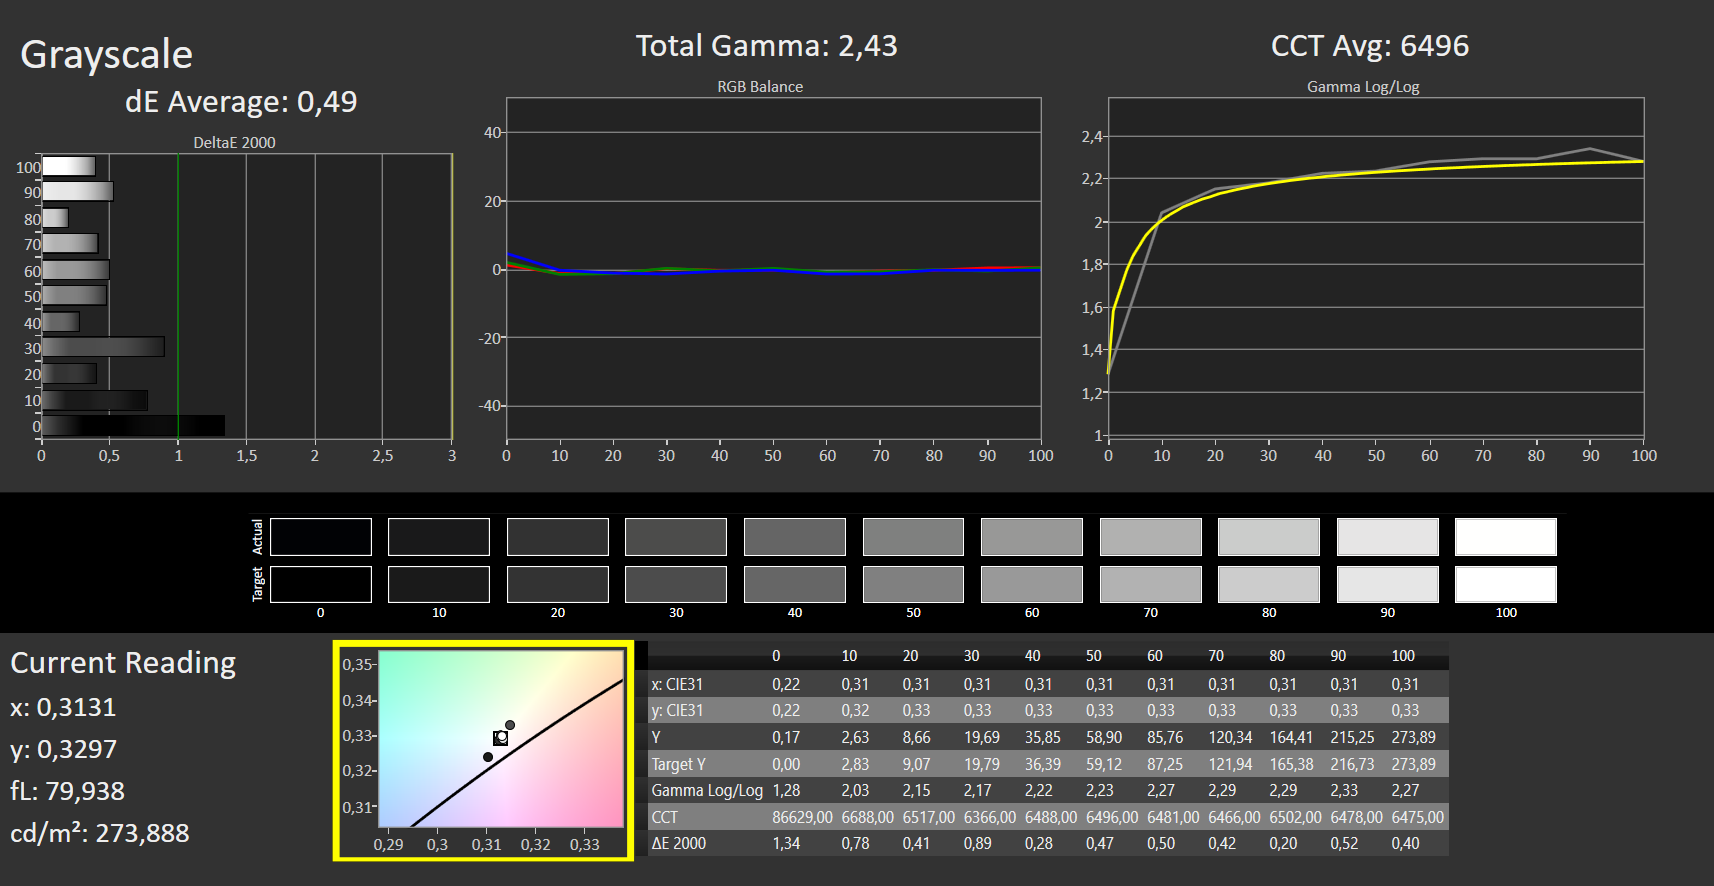
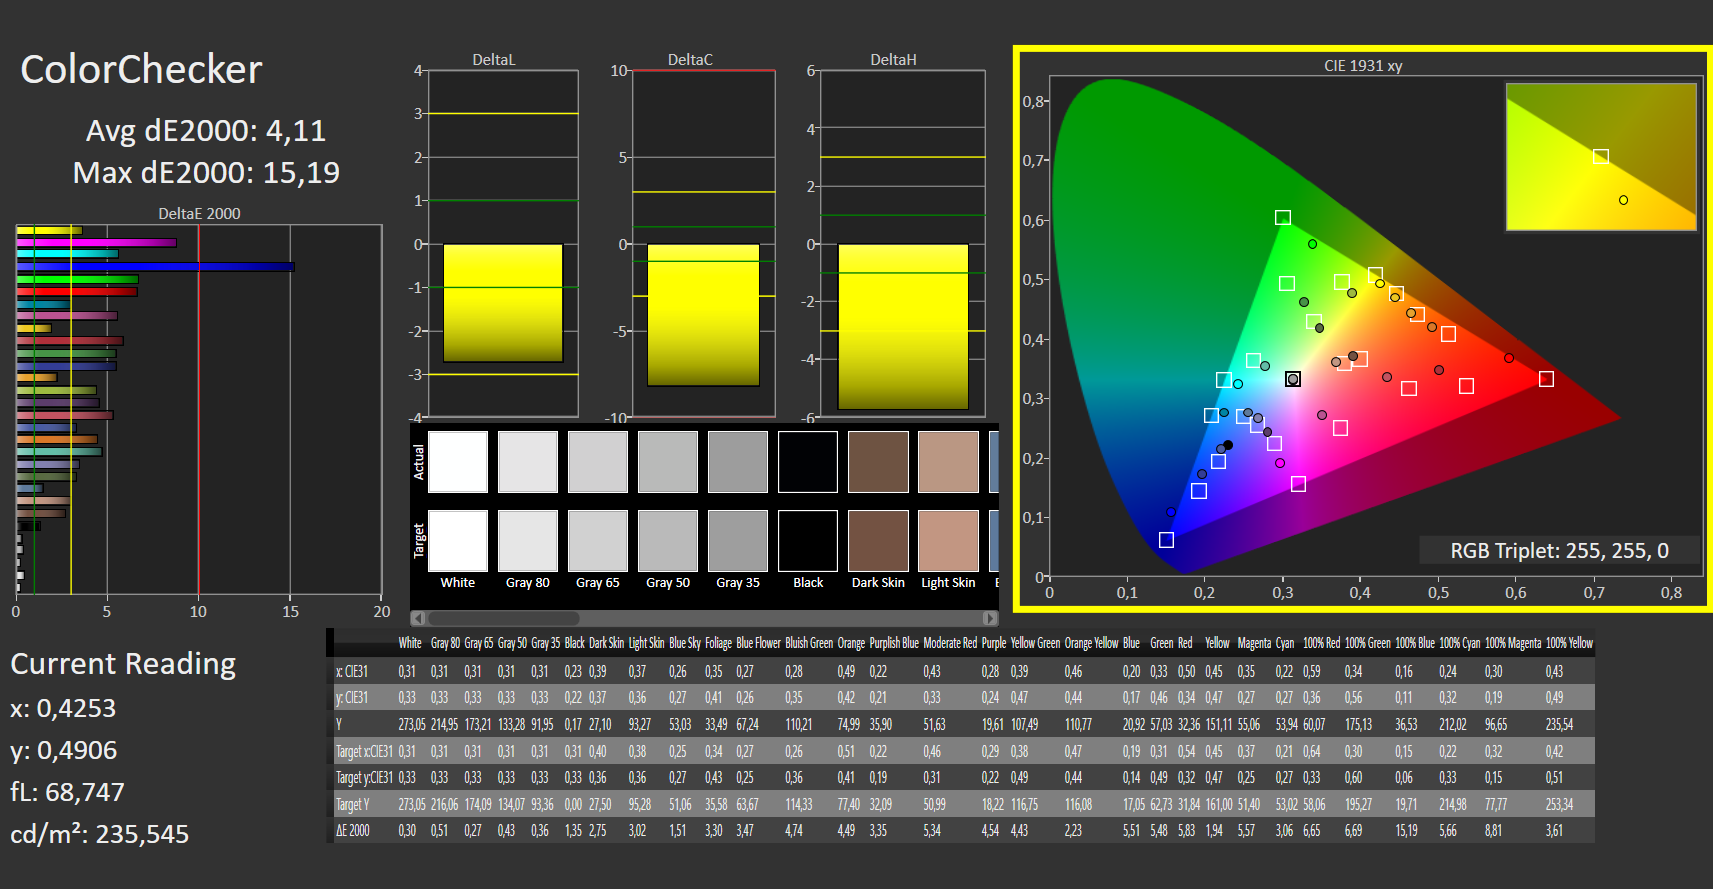
ΔE ColorChecker Calman: 6.5 | ∀{0.5-29.43 Ø4.73}
calibrated: 4.11
ΔE Greyscale Calman: 4.85 | ∀{0.09-98 Ø4.97}
42.2% AdobeRGB 1998 (Argyll 3D)
61.4% sRGB (Argyll 3D)
40.8% Display P3 (Argyll 3D)
Gamma: 2.22
CCT: 7401 K
| Dell G15 5510-43NHT Dell 156GL05, IPS, 1920x1080, 15.6" | Lenovo Ideapad Gaming 3 15IHU-82K1002RGE LEN156FHD, IPS, 1920x1080, 15.6" | Dell G15 5515 BOE092A, IPS, 1920x1080, 15.6" | Acer Aspire Nitro 5 AN515-55-57GF Chi Mei CMN N156HRA-EA1, IPS, 1920x1080, 15.6" | Gigabyte G5 GD Chi Mei N156HRA-EA1, IPS, 1920x1080, 15.6" | |
|---|---|---|---|---|---|
| Display | -3% | -5% | 4% | 2% | |
| Display P3 Coverage (%) | 40.8 | 39.7 -3% | 39.1 -4% | 42.54 4% | 41.8 2% |
| sRGB Coverage (%) | 61.4 | 59.6 -3% | 56.9 -7% | 63.5 3% | 62.3 1% |
| AdobeRGB 1998 Coverage (%) | 42.2 | 41.1 -3% | 40.4 -4% | 44.02 4% | 43.2 2% |
| Response Times | -32% | 33% | 9% | 8% | |
| Response Time Grey 50% / Grey 80% * (ms) | 35 ? | 46.4 ? -33% | 25.2 ? 28% | 33.8 ? 3% | 34.4 ? 2% |
| Response Time Black / White * (ms) | 27 ? | 35.2 ? -30% | 16.8 ? 38% | 23.2 ? 14% | 23.2 ? 14% |
| PWM Frequency (Hz) | 200 ? | ||||
| Screen | 57% | 29% | 67% | 63% | |
| Brightness middle (cd/m²) | 290 | 307 6% | 278 -4% | 288 -1% | 261 -10% |
| Brightness (cd/m²) | 267 | 292 9% | 262 -2% | 262 -2% | 246 -8% |
| Brightness Distribution (%) | 87 | 88 1% | 83 -5% | 88 1% | 87 0% |
| Black Level * (cd/m²) | 1.085 | 0.21 81% | 0.36 67% | 0.21 81% | 0.19 82% |
| Contrast (:1) | 267 | 1462 448% | 772 189% | 1371 413% | 1374 415% |
| Colorchecker dE 2000 * | 6.5 | 5.9 9% | 5.74 12% | 3.61 44% | 3.9 40% |
| Colorchecker dE 2000 max. * | 16.96 | 21.6 -27% | 19.63 -16% | 18.07 -7% | 19.26 -14% |
| Colorchecker dE 2000 calibrated * | 4.11 | 4.8 -17% | 4.7 -14% | 3.12 24% | 3.24 21% |
| Greyscale dE 2000 * | 4.85 | 4.9 -1% | 3.1 36% | 2.4 51% | 2.7 44% |
| Gamma | 2.22 99% | 2.26 97% | 2.011 109% | 2.216 99% | 2.248 98% |
| CCT | 7401 88% | 6504 100% | 6207 105% | 6675 97% | 6828 95% |
| Color Space (Percent of AdobeRGB 1998) (%) | 44 | ||||
| Color Space (Percent of sRGB) (%) | 62 | ||||
| Total Average (Program / Settings) | 7% /
31% | 19% /
22% | 27% /
45% | 24% /
42% |
* ... smaller is better
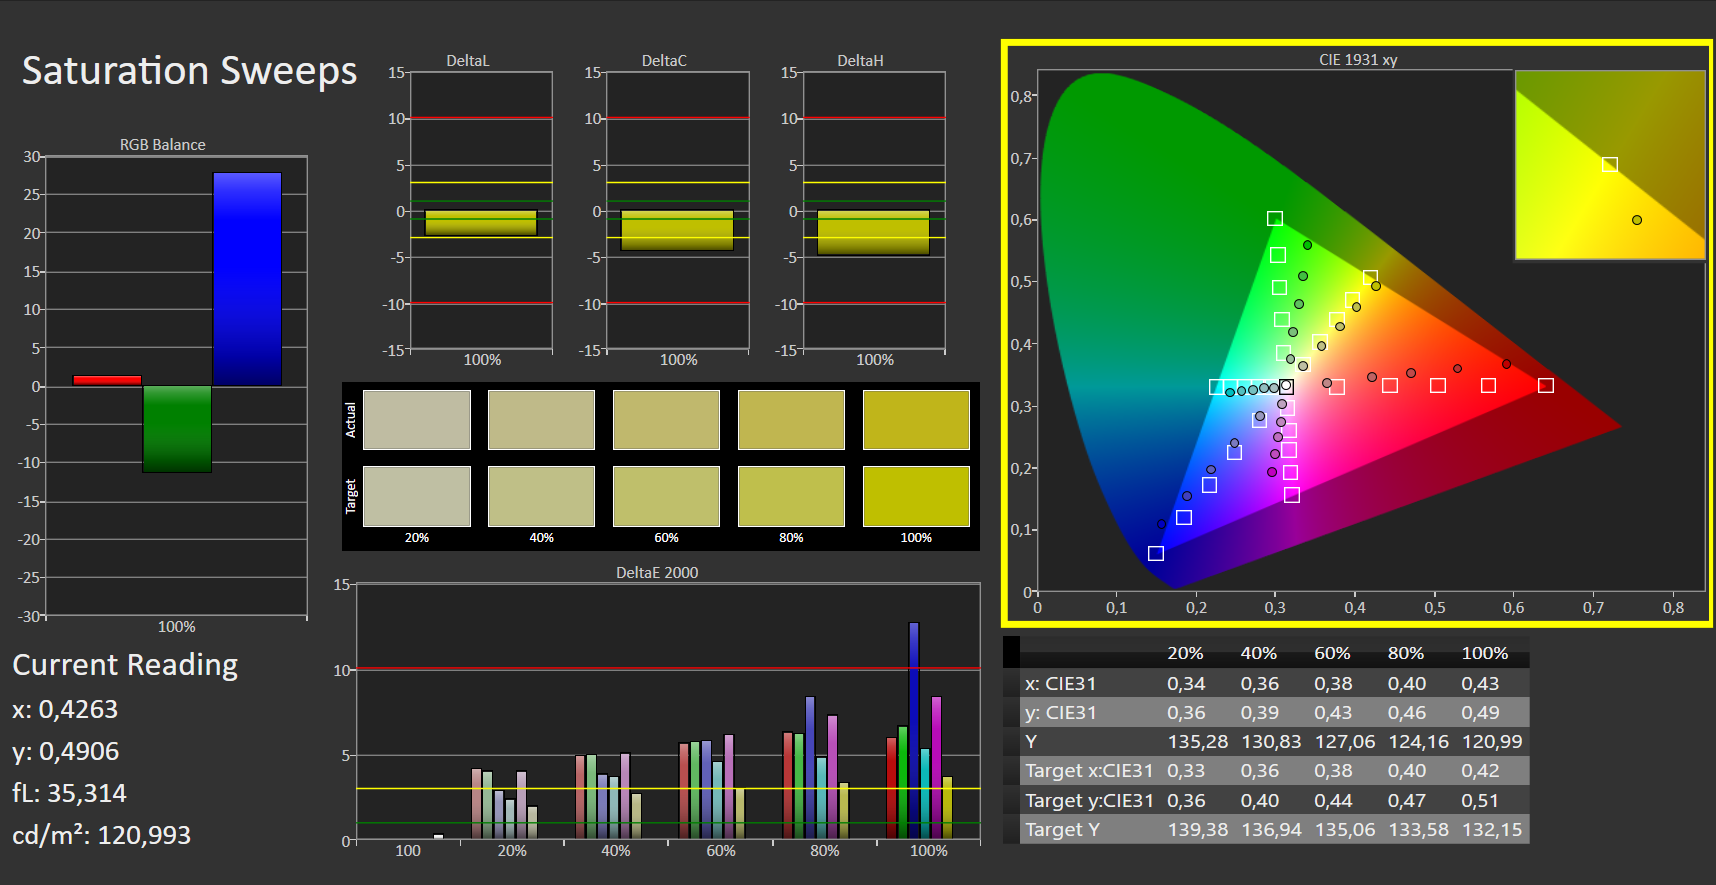
The Dell panel covers the AdobeRGB (41%), sRGB (61%), and DCI-P3 (42%) color spaces better than the AMD alternative in our review unit. Out of the box, the color reproduction is below average, but it can be slightly improved by calibration.


Display Response Times
| ↔ Response Time Black to White | ||
|---|---|---|
| 27 ms ... rise ↗ and fall ↘ combined | ↗ 14 ms rise |  |
| ↘ 13 ms fall | ||
| The screen shows relatively slow response rates in our tests and may be too slow for gamers. In comparison, all tested devices range from 0.1 (minimum) to 240 (maximum) ms. » 67 % of all devices are better. This means that the measured response time is worse than the average of all tested devices (19.9 ms). | ||
| ↔ Response Time 50% Grey to 80% Grey | ||
| 35 ms ... rise ↗ and fall ↘ combined | ↗ 17 ms rise |  |
| ↘ 18 ms fall | ||
| The screen shows slow response rates in our tests and will be unsatisfactory for gamers. In comparison, all tested devices range from 0.165 (minimum) to 636 (maximum) ms. » 49 % of all devices are better. This means that the measured response time is worse than the average of all tested devices (31.1 ms). | ||
Screen Flickering / PWM (Pulse-Width Modulation)
| Screen flickering / PWM not detected |  | ||
In comparison: 52 % of all tested devices do not use PWM to dim the display. If PWM was detected, an average of 7798 (minimum: 5 - maximum: 343500) Hz was measured. | |||
The IPS panel offers the expected high viewing-angle stability. Therefore, content is also legible from very oblique viewing angles. However, the display's average brightness of around 270 cd/m² is suitable at most for using the device outdoors if you're in the shade. It would be nice if the panel were brighter.


Performance: As expected, the Intel CPU doesn't stand a chance
Fundamentally, the Dell G15 5510 differs from the 5515 Ryzen alternative in terms of the CPU. On paper, the Intel Core i5-10200H is considerably less powerful than the AMD Ryzen 7 5800H. On top of that, the manufacturer has also cut the amount of memory in half to only 8 GB of DDR4-3200 SO-DIMM RAM. It was to be expected that this wouldn't remain without consequences in the performance tests - despite the fact that both versions use the same Nvidia GeForce RTX 3050 Ti Laptop GPU...
Alternatively, Dell also sells the G15 5510 with the Intel Core i5-10500H for a small extra charge, and it also offers the model with newer 12th generation Intel CPUs now.
Test conditions
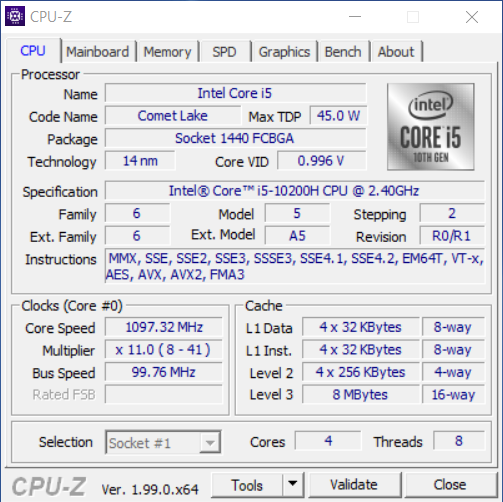
Unless otherwise stated, we conducted the benchmarks with the laptop plugged in and using the Windows performance mode "Best Performance". Dell has configured the Intel Core i5-10200H with a TDP of 45 watts. The CPU consumes up to 135 watts (PL2) for a short time, but it settles at around 45 watts (PL1) in the long run.
Processor
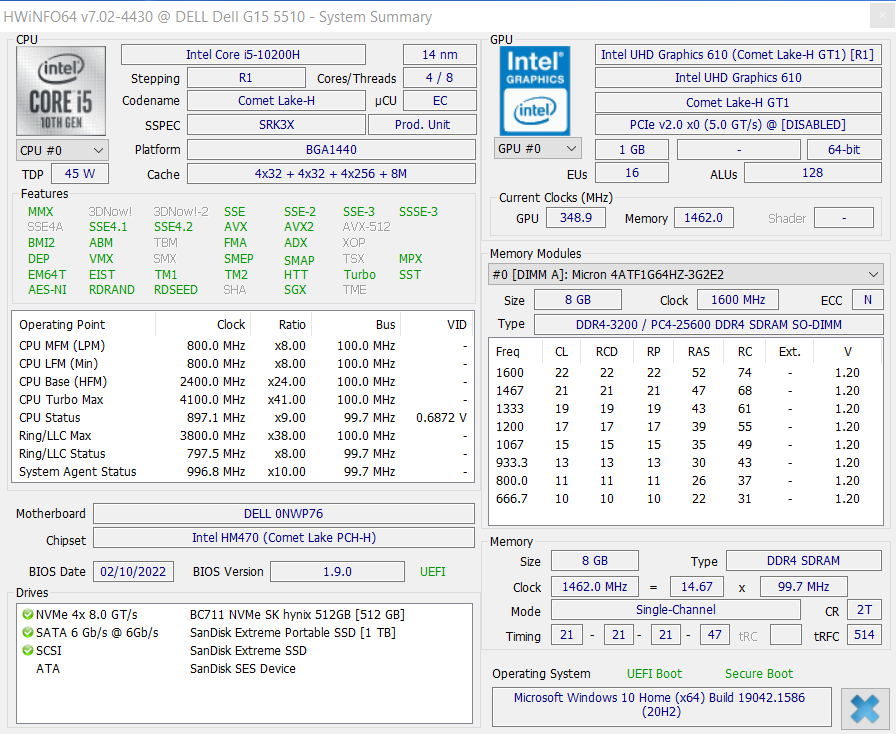
The built-in Core i5-10200H is part of Intel's 10th processor generation, and it's based on the Comet Lake architecture (4th generation of the Skylake architecture), which means that it's no longer brand-new. It's comprised of four cores (quad-core CPU) that operate at a base clock speed of 2.4 GHz and a maximum speed of 4.1 GHz. Dell has paired it with 8 GB of DDR4-3200 RAM.
Compared to the AMD Ryzen 7 5800H (Cezanne) found in the Dell G15 5515, which runs at up to 4.3 GHz and consists of eight cores, the processor used here is completely inferior, as expected, but it's also a generation older. In the Cinebench R15 Multi endurance test, the AMD model achieves scores that are over twice as high. The CPU at least manages to keep its performance constant and almost keeps up with the slightly faster Intel Core i5-10300H found in the Acer Aspire Nitro 5. It's also just behind the Lenovo IdeaPad Gaming 3, which has an Intel Core i5-11300H that's one generation newer.
The remaining CPU benchmarks paint the same picture as well. As expected, the G15 5510 usually occupies the lower places among the comparison models due to having the weakest CPU. It doesn't stand a chance against the AMD power in its sibling model, especially not in multi-core applications. The Intel CPU's single-core scores are about 30% below the AMD competition on average. On battery power, the CPU performance drops by 10% to 50% in various benchmarks.
Cinebench R15 Multi endurance test
Cinebench R23: Multi Core | Single Core
Cinebench R20: CPU (Multi Core) | CPU (Single Core)
Cinebench R15: CPU Multi 64Bit | CPU Single 64Bit
Blender: v2.79 BMW27 CPU
7-Zip 18.03: 7z b 4 | 7z b 4 -mmt1
Geekbench 5.5: Multi-Core | Single-Core
HWBOT x265 Benchmark v2.2: 4k Preset
LibreOffice : 20 Documents To PDF
R Benchmark 2.5: Overall mean
| CPU Performance rating | |
| Average of class Gaming | |
| Dell G15 5515 | |
| Gigabyte G5 GD | |
| Lenovo Ideapad Gaming 3 15IHU-82K1002RGE | |
| Acer Aspire Nitro 5 AN515-55-57GF | |
| Average Intel Core i5-10200H | |
| Dell G15 5510-43NHT | |
| Cinebench R23 / Multi Core | |
| Average of class Gaming (10488 - 40970, n=112, last 2 years) | |
| Dell G15 5515 | |
| Gigabyte G5 GD | |
| Lenovo Ideapad Gaming 3 15IHU-82K1002RGE | |
| Dell G15 5510-43NHT | |
| Average Intel Core i5-10200H (n=1) | |
| Acer Aspire Nitro 5 AN515-55-57GF | |
| Cinebench R23 / Single Core | |
| Average of class Gaming (1166 - 2356, n=112, last 2 years) | |
| Gigabyte G5 GD | |
| Dell G15 5515 | |
| Lenovo Ideapad Gaming 3 15IHU-82K1002RGE | |
| Acer Aspire Nitro 5 AN515-55-57GF | |
| Dell G15 5510-43NHT | |
| Average Intel Core i5-10200H (n=1) | |
| Cinebench R20 / CPU (Multi Core) | |
| Average of class Gaming (4029 - 16108, n=111, last 2 years) | |
| Dell G15 5515 | |
| Gigabyte G5 GD | |
| Lenovo Ideapad Gaming 3 15IHU-82K1002RGE | |
| Dell G15 5510-43NHT | |
| Average Intel Core i5-10200H (n=1) | |
| Acer Aspire Nitro 5 AN515-55-57GF | |
| Cinebench R20 / CPU (Single Core) | |
| Average of class Gaming (442 - 895, n=111, last 2 years) | |
| Gigabyte G5 GD | |
| Dell G15 5515 | |
| Lenovo Ideapad Gaming 3 15IHU-82K1002RGE | |
| Acer Aspire Nitro 5 AN515-55-57GF | |
| Dell G15 5510-43NHT | |
| Average Intel Core i5-10200H (n=1) | |
| Cinebench R15 / CPU Multi 64Bit | |
| Average of class Gaming (1578 - 6271, n=111, last 2 years) | |
| Dell G15 5515 | |
| Gigabyte G5 GD | |
| Lenovo Ideapad Gaming 3 15IHU-82K1002RGE | |
| Acer Aspire Nitro 5 AN515-55-57GF | |
| Dell G15 5510-43NHT | |
| Average Intel Core i5-10200H (n=1) | |
| Cinebench R15 / CPU Single 64Bit | |
| Average of class Gaming (188.8 - 343, n=111, last 2 years) | |
| Dell G15 5515 | |
| Gigabyte G5 GD | |
| Lenovo Ideapad Gaming 3 15IHU-82K1002RGE | |
| Acer Aspire Nitro 5 AN515-55-57GF | |
| Dell G15 5510-43NHT | |
| Average Intel Core i5-10200H (n=1) | |
| Blender / v2.79 BMW27 CPU | |
| Acer Aspire Nitro 5 AN515-55-57GF | |
| Dell G15 5510-43NHT | |
| Average Intel Core i5-10200H (n=1) | |
| Lenovo Ideapad Gaming 3 15IHU-82K1002RGE | |
| Gigabyte G5 GD | |
| Dell G15 5515 | |
| Average of class Gaming (80 - 330, n=109, last 2 years) | |
| 7-Zip 18.03 / 7z b 4 | |
| Average of class Gaming (33491 - 148086, n=110, last 2 years) | |
| Dell G15 5515 | |
| Gigabyte G5 GD | |
| Acer Aspire Nitro 5 AN515-55-57GF | |
| Lenovo Ideapad Gaming 3 15IHU-82K1002RGE | |
| Dell G15 5510-43NHT | |
| Average Intel Core i5-10200H (n=1) | |
| 7-Zip 18.03 / 7z b 4 -mmt1 | |
| Average of class Gaming (4199 - 7436, n=110, last 2 years) | |
| Dell G15 5515 | |
| Gigabyte G5 GD | |
| Acer Aspire Nitro 5 AN515-55-57GF | |
| Lenovo Ideapad Gaming 3 15IHU-82K1002RGE | |
| Dell G15 5510-43NHT | |
| Average Intel Core i5-10200H (n=1) | |
| Geekbench 5.5 / Multi-Core | |
| Average of class Gaming (6460 - 27010, n=110, last 2 years) | |
| Dell G15 5515 | |
| Gigabyte G5 GD | |
| Acer Aspire Nitro 5 AN515-55-57GF | |
| Lenovo Ideapad Gaming 3 15IHU-82K1002RGE | |
| Average Intel Core i5-10200H (3564 - 4126, n=2) | |
| Dell G15 5510-43NHT | |
| Geekbench 5.5 / Single-Core | |
| Average of class Gaming (986 - 2474, n=110, last 2 years) | |
| Gigabyte G5 GD | |
| Dell G15 5515 | |
| Lenovo Ideapad Gaming 3 15IHU-82K1002RGE | |
| Acer Aspire Nitro 5 AN515-55-57GF | |
| Dell G15 5510-43NHT | |
| Average Intel Core i5-10200H (1093 - 1095, n=2) | |
| HWBOT x265 Benchmark v2.2 / 4k Preset | |
| Average of class Gaming (11.5 - 44.3, n=110, last 2 years) | |
| Dell G15 5515 | |
| Gigabyte G5 GD | |
| Lenovo Ideapad Gaming 3 15IHU-82K1002RGE | |
| Acer Aspire Nitro 5 AN515-55-57GF | |
| Dell G15 5510-43NHT | |
| Average Intel Core i5-10200H (n=1) | |
| LibreOffice / 20 Documents To PDF | |
| Dell G15 5515 | |
| Dell G15 5510-43NHT | |
| Average Intel Core i5-10200H (n=1) | |
| Acer Aspire Nitro 5 AN515-55-57GF | |
| Lenovo Ideapad Gaming 3 15IHU-82K1002RGE | |
| Average of class Gaming (19 - 88.8, n=110, last 2 years) | |
| Gigabyte G5 GD | |
| R Benchmark 2.5 / Overall mean | |
| Dell G15 5510-43NHT | |
| Average Intel Core i5-10200H (n=1) | |
| Acer Aspire Nitro 5 AN515-55-57GF | |
| Lenovo Ideapad Gaming 3 15IHU-82K1002RGE | |
| Gigabyte G5 GD | |
| Dell G15 5515 | |
| Average of class Gaming (0.3439 - 0.759, n=111, last 2 years) | |
* ... smaller is better
AIDA64: FP32 Ray-Trace | FPU Julia | CPU SHA3 | CPU Queen | FPU SinJulia | FPU Mandel | CPU AES | CPU ZLib | FP64 Ray-Trace | CPU PhotoWorxx
| Performance rating | |
| Average of class Gaming | |
| Dell G15 5515 | |
| Gigabyte G5 GD | |
| Lenovo Ideapad Gaming 3 15IHU-82K1002RGE | |
| Acer Aspire Nitro 5 AN515-55-57GF | |
| Dell G15 5510-43NHT | |
| Average Intel Core i5-10200H | |
| AIDA64 / FP32 Ray-Trace | |
| Average of class Gaming (10227 - 85542, n=109, last 2 years) | |
| Dell G15 5515 | |
| Gigabyte G5 GD | |
| Lenovo Ideapad Gaming 3 15IHU-82K1002RGE | |
| Acer Aspire Nitro 5 AN515-55-57GF | |
| Dell G15 5510-43NHT | |
| Average Intel Core i5-10200H (n=1) | |
| AIDA64 / FPU Julia | |
| Average of class Gaming (51376 - 238426, n=109, last 2 years) | |
| Dell G15 5515 | |
| Gigabyte G5 GD | |
| Acer Aspire Nitro 5 AN515-55-57GF | |
| Lenovo Ideapad Gaming 3 15IHU-82K1002RGE | |
| Dell G15 5510-43NHT | |
| Average Intel Core i5-10200H (n=1) | |
| AIDA64 / CPU SHA3 | |
| Average of class Gaming (2180 - 9817, n=109, last 2 years) | |
| Dell G15 5515 | |
| Gigabyte G5 GD | |
| Lenovo Ideapad Gaming 3 15IHU-82K1002RGE | |
| Acer Aspire Nitro 5 AN515-55-57GF | |
| Dell G15 5510-43NHT | |
| Average Intel Core i5-10200H (n=1) | |
| AIDA64 / CPU Queen | |
| Average of class Gaming (49785 - 173351, n=100, last 2 years) | |
| Dell G15 5515 | |
| Gigabyte G5 GD | |
| Acer Aspire Nitro 5 AN515-55-57GF | |
| Lenovo Ideapad Gaming 3 15IHU-82K1002RGE | |
| Dell G15 5510-43NHT | |
| Average Intel Core i5-10200H (n=1) | |
| AIDA64 / FPU SinJulia | |
| Average of class Gaming (4424 - 33636, n=109, last 2 years) | |
| Dell G15 5515 | |
| Gigabyte G5 GD | |
| Acer Aspire Nitro 5 AN515-55-57GF | |
| Dell G15 5510-43NHT | |
| Average Intel Core i5-10200H (n=1) | |
| Lenovo Ideapad Gaming 3 15IHU-82K1002RGE | |
| AIDA64 / FPU Mandel | |
| Average of class Gaming (25115 - 128721, n=109, last 2 years) | |
| Dell G15 5515 | |
| Gigabyte G5 GD | |
| Lenovo Ideapad Gaming 3 15IHU-82K1002RGE | |
| Acer Aspire Nitro 5 AN515-55-57GF | |
| Dell G15 5510-43NHT | |
| Average Intel Core i5-10200H (n=1) | |
| AIDA64 / CPU AES | |
| Dell G15 5515 | |
| Average of class Gaming (39258 - 247074, n=109, last 2 years) | |
| Gigabyte G5 GD | |
| Lenovo Ideapad Gaming 3 15IHU-82K1002RGE | |
| Acer Aspire Nitro 5 AN515-55-57GF | |
| Dell G15 5510-43NHT | |
| Average Intel Core i5-10200H (n=1) | |
| AIDA64 / CPU ZLib | |
| Average of class Gaming (574 - 2531, n=109, last 2 years) | |
| Dell G15 5515 | |
| Gigabyte G5 GD | |
| Lenovo Ideapad Gaming 3 15IHU-82K1002RGE | |
| Acer Aspire Nitro 5 AN515-55-57GF | |
| Dell G15 5510-43NHT | |
| Average Intel Core i5-10200H (n=1) | |
| AIDA64 / FP64 Ray-Trace | |
| Average of class Gaming (5509 - 45446, n=109, last 2 years) | |
| Dell G15 5515 | |
| Gigabyte G5 GD | |
| Lenovo Ideapad Gaming 3 15IHU-82K1002RGE | |
| Acer Aspire Nitro 5 AN515-55-57GF | |
| Dell G15 5510-43NHT | |
| Average Intel Core i5-10200H (n=1) | |
| AIDA64 / CPU PhotoWorxx | |
| Average of class Gaming (12271 - 89891, n=109, last 2 years) | |
| Gigabyte G5 GD | |
| Acer Aspire Nitro 5 AN515-55-57GF | |
| Dell G15 5515 | |
| Lenovo Ideapad Gaming 3 15IHU-82K1002RGE | |
| Dell G15 5510-43NHT | |
| Average Intel Core i5-10200H (n=1) | |
System performance
With a slower CPU and less - not to say almost too little - RAM, we obviously expect a significantly worse system performance, something that also proves to be true in the test results. The Dell G15 5510 scores worse than the competition in all PCMark 10 tests, and it repeatedly ends up at the bottom of the field.
You won't notice much of this in common applications. However, if the device is loaded with several or more complex programs, its performance quickly reaches its limit.
CrossMark: Overall | Productivity | Creativity | Responsiveness
| PCMark 10 / Score | |
| Average of class Gaming (5828 - 11574, n=95, last 2 years) | |
| Dell G15 5515 | |
| Gigabyte G5 GD | |
| Lenovo Ideapad Gaming 3 15IHU-82K1002RGE | |
| Acer Aspire Nitro 5 AN515-55-57GF | |
| Dell G15 5510-43NHT | |
| Average Intel Core i5-10200H, NVIDIA GeForce RTX 3050 Ti Laptop GPU (n=1) | |
| PCMark 10 / Essentials | |
| Average of class Gaming (8810 - 12600, n=99, last 2 years) | |
| Dell G15 5515 | |
| Gigabyte G5 GD | |
| Acer Aspire Nitro 5 AN515-55-57GF | |
| Lenovo Ideapad Gaming 3 15IHU-82K1002RGE | |
| Dell G15 5510-43NHT | |
| Average Intel Core i5-10200H, NVIDIA GeForce RTX 3050 Ti Laptop GPU (n=1) | |
| PCMark 10 / Productivity | |
| Average of class Gaming (6845 - 18766, n=97, last 2 years) | |
| Lenovo Ideapad Gaming 3 15IHU-82K1002RGE | |
| Dell G15 5515 | |
| Gigabyte G5 GD | |
| Acer Aspire Nitro 5 AN515-55-57GF | |
| Dell G15 5510-43NHT | |
| Average Intel Core i5-10200H, NVIDIA GeForce RTX 3050 Ti Laptop GPU (n=1) | |
| PCMark 10 / Digital Content Creation | |
| Average of class Gaming (7602 - 19657, n=97, last 2 years) | |
| Dell G15 5515 | |
| Gigabyte G5 GD | |
| Lenovo Ideapad Gaming 3 15IHU-82K1002RGE | |
| Acer Aspire Nitro 5 AN515-55-57GF | |
| Dell G15 5510-43NHT | |
| Average Intel Core i5-10200H, NVIDIA GeForce RTX 3050 Ti Laptop GPU (n=1) | |
| CrossMark / Overall | |
| Average of class Gaming (1366 - 2409, n=97, last 2 years) | |
| Lenovo Ideapad Gaming 3 15IHU-82K1002RGE | |
| CrossMark / Productivity | |
| Average of class Gaming (1386 - 2254, n=97, last 2 years) | |
| Lenovo Ideapad Gaming 3 15IHU-82K1002RGE | |
| CrossMark / Creativity | |
| Average of class Gaming (1343 - 2729, n=97, last 2 years) | |
| Lenovo Ideapad Gaming 3 15IHU-82K1002RGE | |
| CrossMark / Responsiveness | |
| Average of class Gaming (1226 - 2334, n=97, last 2 years) | |
| Lenovo Ideapad Gaming 3 15IHU-82K1002RGE | |
| PCMark 8 Home Score Accelerated v2 | 3570 points | |
| PCMark 8 Creative Score Accelerated v2 | 6662 points | |
| PCMark 8 Work Score Accelerated v2 | 5120 points | |
| PCMark 10 Score | 4477 points | |
Help | ||
| AIDA64 / Memory Copy | |
| Average of class Gaming (21750 - 129946, n=109, last 2 years) | |
| Gigabyte G5 GD | |
| Dell G15 5515 | |
| Acer Aspire Nitro 5 AN515-55-57GF | |
| Lenovo Ideapad Gaming 3 15IHU-82K1002RGE | |
| Dell G15 5510-43NHT | |
| Average Intel Core i5-10200H (n=1) | |
| AIDA64 / Memory Read | |
| Average of class Gaming (22956 - 118858, n=109, last 2 years) | |
| Gigabyte G5 GD | |
| Dell G15 5515 | |
| Acer Aspire Nitro 5 AN515-55-57GF | |
| Lenovo Ideapad Gaming 3 15IHU-82K1002RGE | |
| Dell G15 5510-43NHT | |
| Average Intel Core i5-10200H (n=1) | |
| AIDA64 / Memory Write | |
| Average of class Gaming (22297 - 135096, n=109, last 2 years) | |
| Gigabyte G5 GD | |
| Acer Aspire Nitro 5 AN515-55-57GF | |
| Dell G15 5515 | |
| Lenovo Ideapad Gaming 3 15IHU-82K1002RGE | |
| Dell G15 5510-43NHT | |
| Average Intel Core i5-10200H (n=1) | |
| AIDA64 / Memory Latency | |
| Average of class Gaming (75.3 - 259, n=109, last 2 years) | |
| Gigabyte G5 GD | |
| Lenovo Ideapad Gaming 3 15IHU-82K1002RGE | |
| Dell G15 5515 | |
| Dell G15 5510-43NHT | |
| Average Intel Core i5-10200H (n=1) | |
| Acer Aspire Nitro 5 AN515-55-57GF | |
* ... smaller is better
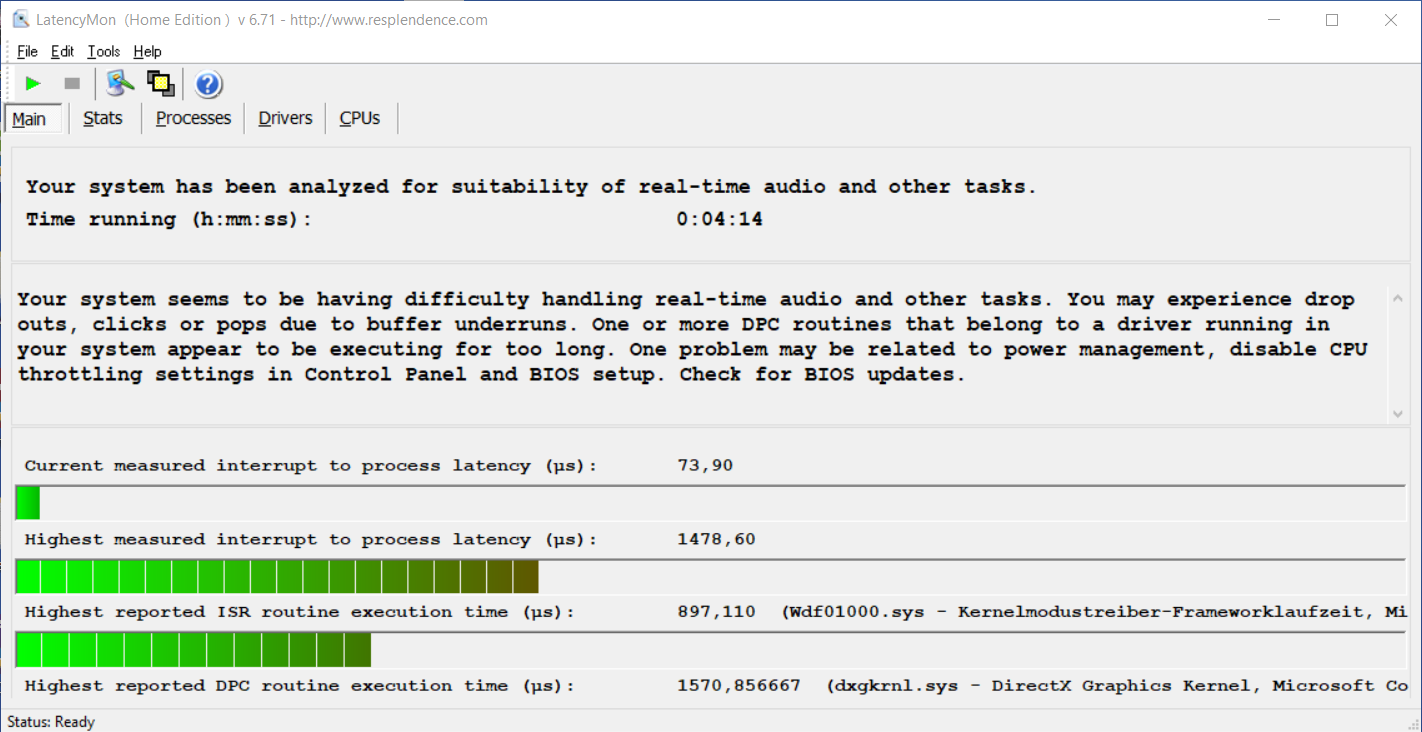
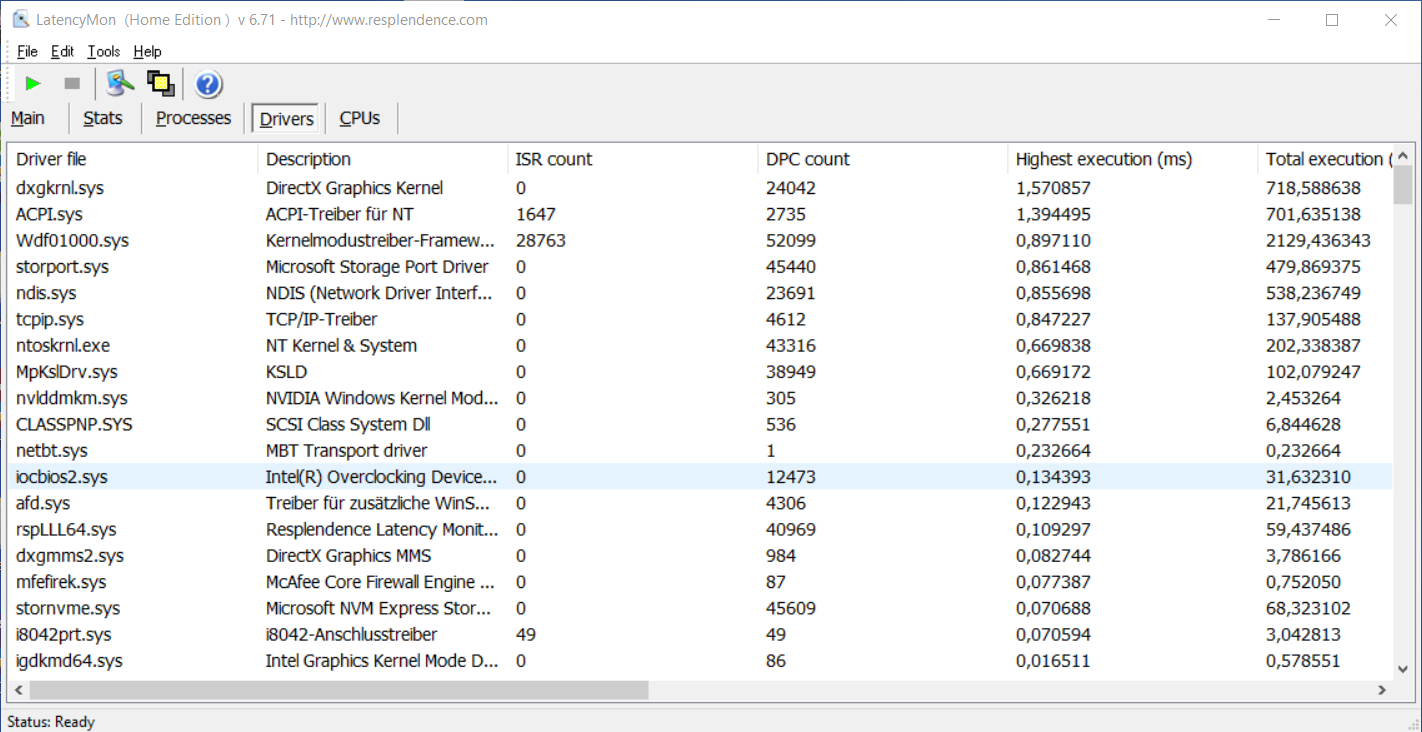
DPC latencies
The Dell G15 5510 also scores the worst when it comes to DPC latencies compared to the other models in the test. This could indicate that the device is rather inadequate for real-time audio and video editing. That said, the amount of RAM is too low for intensive programs anyway. In addition, it's important to note that the test is only a momentary snapshot.
| DPC Latencies / LatencyMon - interrupt to process latency (max), Web, Youtube, Prime95 | |
| Dell G15 5510-43NHT | |
| Lenovo Ideapad Gaming 3 15IHU-82K1002RGE | |
| Dell G15 5515 | |
| Acer Aspire Nitro 5 AN515-55-57GF | |
| Gigabyte G5 GD | |
* ... smaller is better
Storage
As for the SSD, which also has 512 GB and therefore gets full quickly if you play a couple of modern games, Dell opts for a different storage drive for the Intel model compared to the AMD alternative. An M.2 PCIe NVMe SSD from SK Hynix is installed here, and it lags behind the Samsung drive in the AMD version in most benchmark results. However, this isn't noticeable in everyday use unless very large amounts of data are copied.

* ... smaller is better
Continuous load read: DiskSpd Read Loop, Queue Depth 8
Graphics card
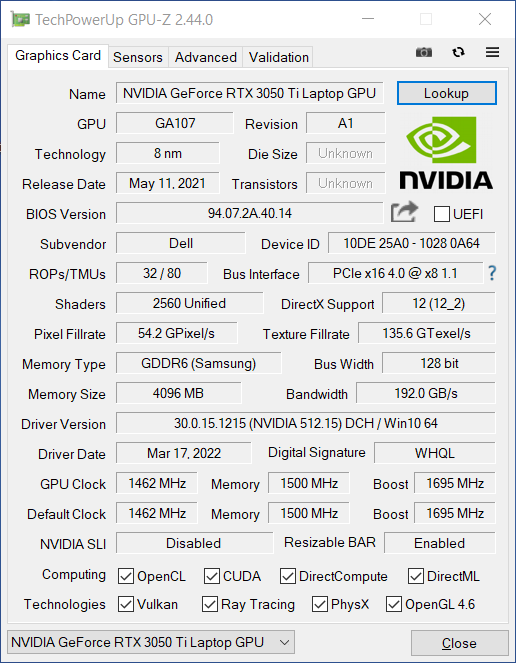
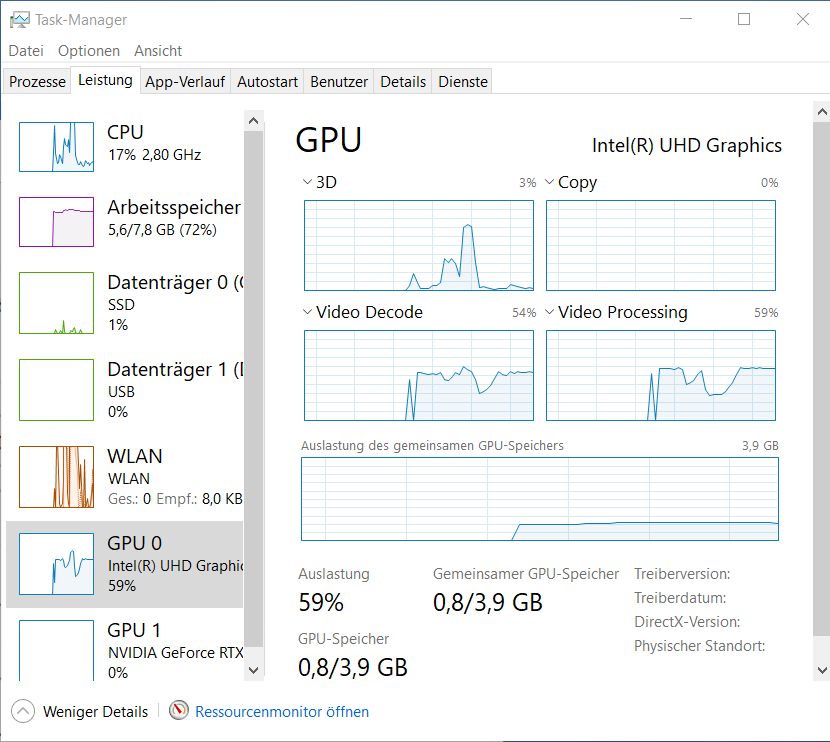
The only aspect where the G15 5510 can keep up with the G15 5515 in terms of performance is when it comes to the graphics card. This isn't surprising since both models are equipped with the dedicated Nvidia GeForce RTX 3050 Ti Laptop GPU, which comes with 4 GB of fast GDDR6 graphics memory from Samsung; the GPU is configured in the same way in both models.
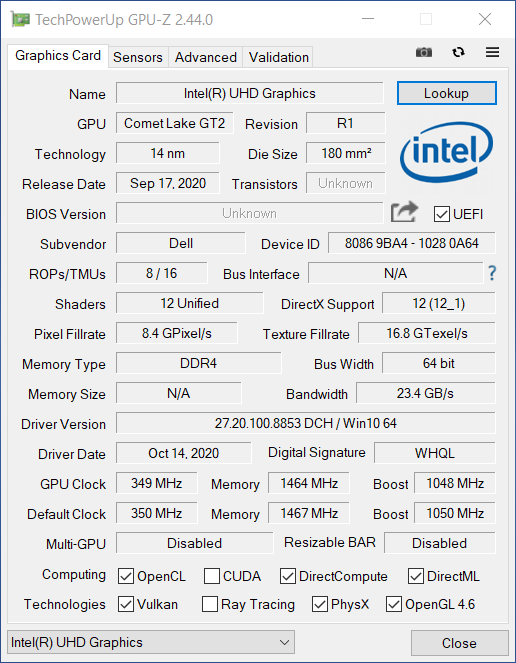
Again, Dell has chosen a TGP of 80 watts for the dedicated GPU, allowing it to run at up to 1,695 MHz. This is the most that Nvidia allows for this graphics solution. In addition, the CPU's integrated GPU, the UHD Graphics 630, is on board; this GPU kicks in when the graphics requirements aren't high, and it operates in a power-saving manner.
The Nvidia GeForce RTX 3050 Ti Laptop GPU delivers a good performance in the test, and it can usually position itself above the benchmark average. Its power is continuously available as a score of 99.1% in 3DMark's Time Spy stress test proves. The scores are on par with the AMD version in many benchmarks, and they're only a bit lower in 3DMark's Cloud Gate benchmark.
On battery power (Windows setting "Best Performance"), performance decreases significantly. For example, the graphics score of 3DMark's Fire Strike benchmark of 6,900 points is over 50% lower than when plugged in.
| 3DMark 11 Performance | 13046 points | |
| 3DMark Ice Storm Standard Score | 56573 points | |
| 3DMark Cloud Gate Standard Score | 22377 points | |
| 3DMark Fire Strike Score | 11989 points | |
| 3DMark Time Spy Score | 5303 points | |
Help | ||
Gaming performance
The G15 5510 is far from being able to keep up with the gaming performance of the AMD alternative despite having the same GPU. This can be seen when directly comparing the different frame rates. Nevertheless, the performance displayed is still sufficient for more than solid frame rates and smooth gameplay in nearly all tested games, even at high graphics settings.
The previously described performance throttling on battery power causes The Witcher 3's frame rate to drop to 30 fps at the highest graphics setting - about 45% less than when plugged in. The GPU clock speed is around 1,000 MHz. This is just enough for a smooth gaming experience with this title, but this is no longer true for newer and more demanding titles.
| Dirt 5 | |
| 1280x720 Ultra Low Preset | |
| Dell G15 5515 | |
| Average NVIDIA GeForce RTX 3050 Ti Laptop GPU (59.8 - 162, n=4) | |
| Dell G15 5510-43NHT | |
| 1920x1080 Medium Preset | |
| Dell G15 5515 | |
| Average NVIDIA GeForce RTX 3050 Ti Laptop GPU (58.9 - 84.3, n=5) | |
| Dell G15 5510-43NHT | |
| 1920x1080 High Preset | |
| Dell G15 5515 | |
| Average NVIDIA GeForce RTX 3050 Ti Laptop GPU (51.2 - 69.1, n=5) | |
| Dell G15 5510-43NHT | |
| 1920x1080 Ultra High Preset | |
| Dell G15 5515 | |
| Average NVIDIA GeForce RTX 3050 Ti Laptop GPU (40.5 - 54.3, n=5) | |
| Dell G15 5510-43NHT | |
| F1 2021 | |
| 1280x720 Ultra Low Preset | |
| Gigabyte G5 GD | |
| Dell G15 5515 | |
| Average NVIDIA GeForce RTX 3050 Ti Laptop GPU (105 - 230, n=11) | |
| Lenovo Ideapad Gaming 3 15IHU-82K1002RGE | |
| Dell G15 5510-43NHT | |
| 1920x1080 Medium Preset AA:T AF:16x | |
| Dell G15 5515 | |
| Gigabyte G5 GD | |
| Average NVIDIA GeForce RTX 3050 Ti Laptop GPU (72 - 150, n=11) | |
| Lenovo Ideapad Gaming 3 15IHU-82K1002RGE | |
| Dell G15 5510-43NHT | |
| 1920x1080 High Preset AA:T AF:16x | |
| Dell G15 5515 | |
| Gigabyte G5 GD | |
| Average NVIDIA GeForce RTX 3050 Ti Laptop GPU (68 - 131, n=11) | |
| Lenovo Ideapad Gaming 3 15IHU-82K1002RGE | |
| Dell G15 5510-43NHT | |
| 1920x1080 Ultra High Preset + Raytracing AA:T AF:16x | |
| Dell G15 5515 | |
| Gigabyte G5 GD | |
| Average NVIDIA GeForce RTX 3050 Ti Laptop GPU (44.4 - 69, n=11) | |
| Dell G15 5510-43NHT | |
| Lenovo Ideapad Gaming 3 15IHU-82K1002RGE | |
| New World | |
| 1280x720 Low Video Quality | |
| Dell G15 5515 | |
| Gigabyte G5 GD | |
| Average NVIDIA GeForce RTX 3050 Ti Laptop GPU (40.1 - 99.3, n=3) | |
| Dell G15 5510-43NHT | |
| 1920x1080 Medium Video Quality | |
| Dell G15 5515 | |
| Gigabyte G5 GD | |
| Average NVIDIA GeForce RTX 3050 Ti Laptop GPU (35.1 - 73.6, n=4) | |
| Dell G15 5510-43NHT | |
| 1920x1080 High Video Quality | |
| Dell G15 5515 | |
| Gigabyte G5 GD | |
| Average NVIDIA GeForce RTX 3050 Ti Laptop GPU (33.6 - 68.9, n=4) | |
| Dell G15 5510-43NHT | |
| 1920x1080 Very High Video Quality | |
| Dell G15 5515 | |
| Gigabyte G5 GD | |
| Average NVIDIA GeForce RTX 3050 Ti Laptop GPU (24.9 - 52.2, n=4) | |
| Dell G15 5510-43NHT | |
| Far Cry 6 | |
| 1280x720 Low Graphics Quality | |
| Average of class Gaming (150.2 - 170.9, n=2, last 2 years) | |
| Gigabyte G5 GD | |
| Dell G15 5515 | |
| Average NVIDIA GeForce RTX 3050 Ti Laptop GPU (59 - 107, n=2) | |
| Dell G15 5510-43NHT | |
| 1920x1080 Medium Graphics Quality AA:SM | |
| Average of class Gaming (132.1 - 150.2, n=2, last 2 years) | |
| Dell G15 5515 | |
| Gigabyte G5 GD | |
| Average NVIDIA GeForce RTX 3050 Ti Laptop GPU (48 - 86, n=3) | |
| Dell G15 5510-43NHT | |
| 1920x1080 High Graphics Quality AA:T | |
| Average of class Gaming (120.8 - 136, n=2, last 2 years) | |
| Dell G15 5515 | |
| Gigabyte G5 GD | |
| Average NVIDIA GeForce RTX 3050 Ti Laptop GPU (44 - 79, n=3) | |
| Dell G15 5510-43NHT | |
| 1920x1080 Ultra Graphics Quality + HD Textures AA:T | |
| Average of class Gaming (96.3 - 135.7, n=3, last 2 years) | |
| Gigabyte G5 GD | |
| Average NVIDIA GeForce RTX 3050 Ti Laptop GPU (53 - 62, n=2) | |
| Dell G15 5515 | |
As the load test of about an hour of The Witcher 3 in Full HD resolution and at maximum quality settings shows, not only does the graphics unit fully exploit its potential, but it can also keep this rate constant over time.
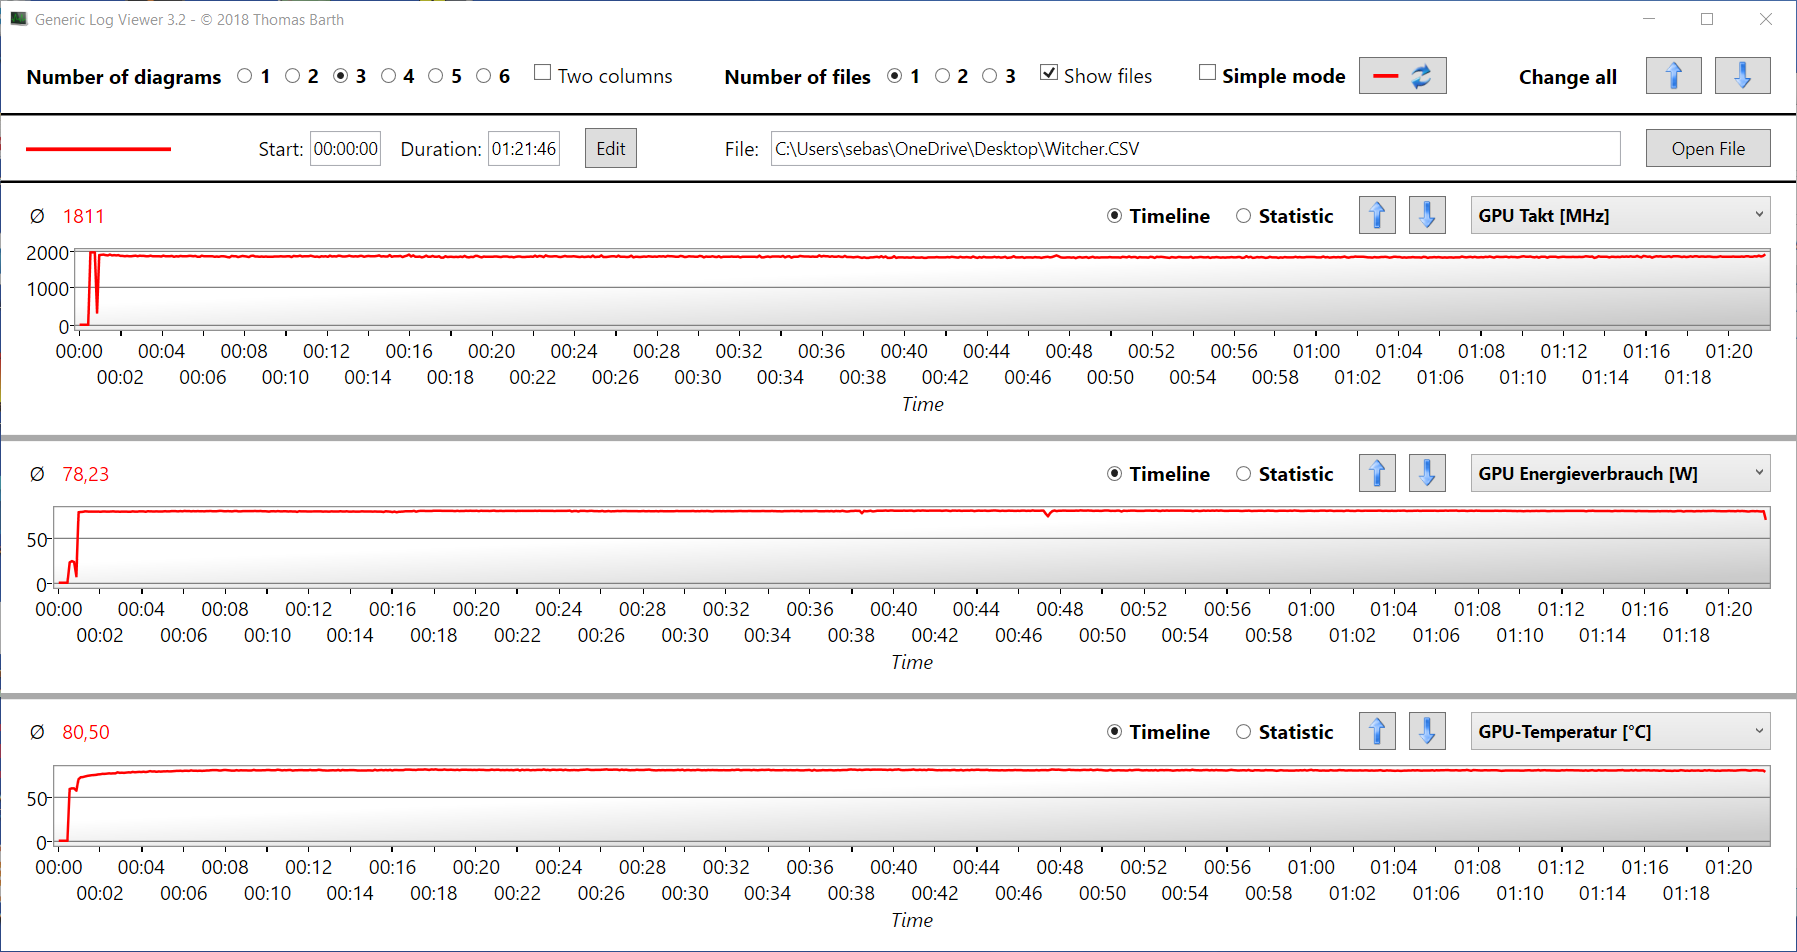
The Witcher 3 FPS diagram
| low | med. | high | ultra | |
|---|---|---|---|---|
| GTA V (2015) | 102.7 | 88.4 | 62.2 | 39.6 |
| The Witcher 3 (2015) | 132.9 | 107.5 | 75.3 | 54.4 |
| Dota 2 Reborn (2015) | 101.5 | 88.8 | 78.8 | 73.7 |
| Final Fantasy XV Benchmark (2018) | 67.2 | 51.5 | 39.1 | |
| X-Plane 11.11 (2018) | 64.9 | 54.6 | 48.8 | |
| Far Cry 5 (2018) | 69 | 54 | 52 | 49 |
| Strange Brigade (2018) | 183.7 | 115.9 | 95.1 | 94.9 |
| Dirt 5 (2020) | 59.8 | 58.9 | 52.7 | 44.9 |
| F1 2021 (2021) | 105 | 72 | 68 | 47 |
| New World (2021) | 40.1 | 35.1 | 33.6 | 24.9 |
| Far Cry 6 (2021) | 59 | 48 | 44 | |
| GRID Legends (2022) | 66.6 | 61.8 | 57.1 | 52.9 |
| Cyberpunk 2077 1.6 (2022) | 48.2 | 48 | 50 | 50.5 |
Emissions: The G15 5510 is at times quiet, at times loud, and at times so-so
Noise emissions
The Dell G15 5510 remains discreetly and silently in the background in idle usage and under low load, e.g. while browsing the web, streaming, or doing office tasks. When it's put through its paces during gaming, the two fans kick in and spin at a fairly consistent pitch and volume of up to around 52 dB. This is louder than most comparison models, such as the Dell G15 5515, and it gets bothersome over time; however, it's not overly uncomfortable due to the fact that the pitch is consistent at least. Apart from that, the review sample doesn't emit any annoying noises like coil whine or the like.
Noise level
| Idle |
| 25 / 25 / 25 dB(A) |
| Load |
| 52.2 / 52.2 dB(A) |
 | ||
30 dB silent 40 dB(A) audible 50 dB(A) loud |
||
min: | ||
| Dell G15 5510-43NHT GeForce RTX 3050 Ti Laptop GPU, i5-10200H, SK Hynix BC711 HFM512GD3HX015N | Lenovo Ideapad Gaming 3 15IHU-82K1002RGE GeForce RTX 3050 Ti Laptop GPU, i5-11300H, Micron 2210 MTFDHBA512QFD | Dell G15 5515 GeForce RTX 3050 Ti Laptop GPU, R7 5800H, Samsung PM991a MZ9LQ512HBLU-00BD1 | Acer Aspire Nitro 5 AN515-55-57GF GeForce RTX 3060 Laptop GPU, i5-10300H, WDC PC SN530 SDBPNPZ-512G | Gigabyte G5 GD GeForce RTX 3050 4GB Laptop GPU, i5-11400H, ESR512GTLG-E6GBTNB4 | |
|---|---|---|---|---|---|
| Noise | 2% | 1% | -6% | -11% | |
| off / environment * (dB) | 25 | 23.9 4% | 24 4% | 25 -0% | 24 4% |
| Idle Minimum * (dB) | 25 | 23.9 4% | 25 -0% | 25 -0% | 29 -16% |
| Idle Average * (dB) | 25 | 26.8 -7% | 26 -4% | 30 -20% | 30 -20% |
| Idle Maximum * (dB) | 25 | 26.8 -7% | 30 -20% | 33 -32% | 32 -28% |
| Load Average * (dB) | 52.2 | 43.5 17% | 44 16% | 46 12% | 53 -2% |
| Load Maximum * (dB) | 52.2 | 53.1 -2% | 48 8% | 50 4% | 54 -3% |
| Witcher 3 ultra * (dB) | 43.5 | 44 | 47 | 52 |
* ... smaller is better
Temperature
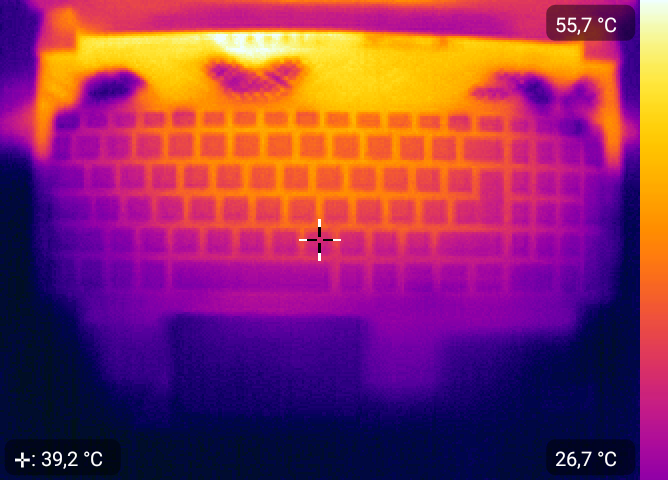
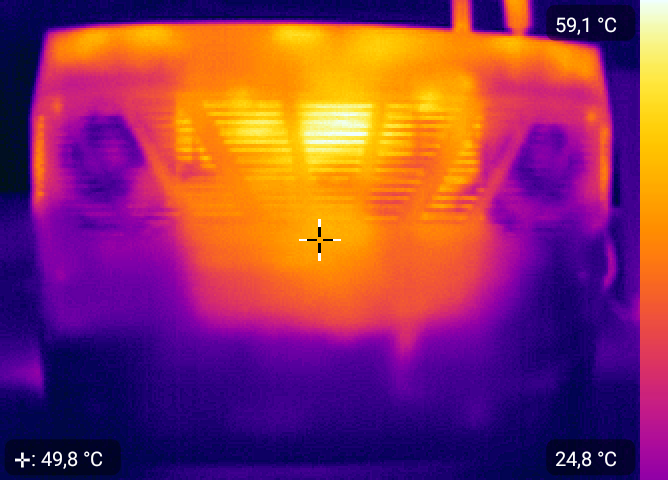
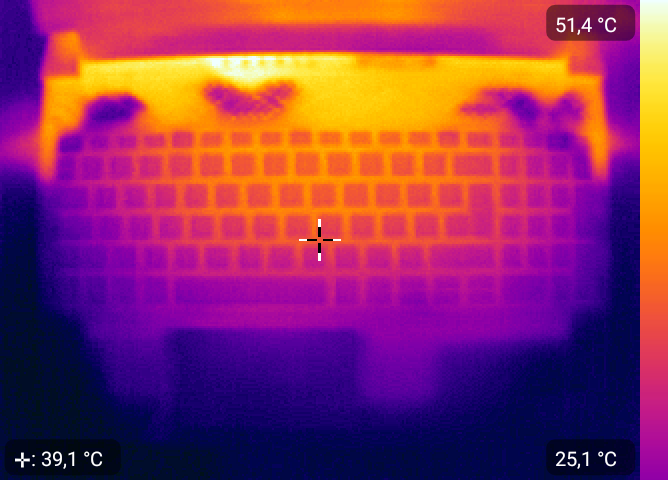
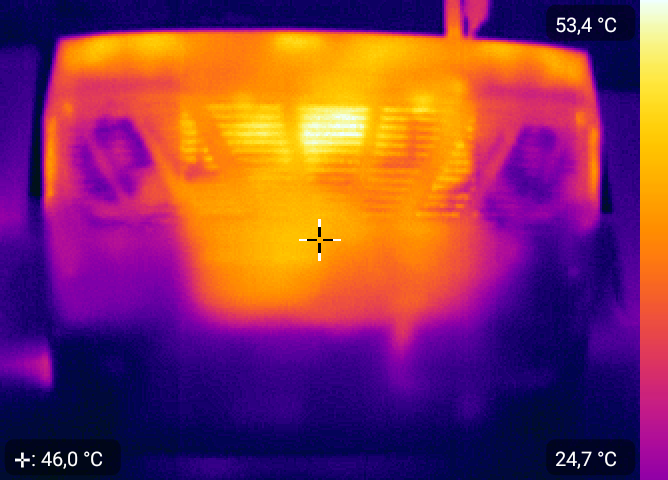
The internal components reach temperatures of over 90 °C (~194 °F) under full load. It goes without saying that the case is also affected by this. As usual, the device gets particularly hot in the areas in front and behind the display, where not only the hardware is installed, but also the fan outlets for the warm waste air are located. The laptop's bottom in particular reaches over 50 °C (~122 °F) there during gaming. Gaming in shorts and with the device on the lap will quickly become ("too") hot.
However, the touchpad and keyboard area remains so cool in all situations that it's possible to use the laptop without any issues. In idle usage, most parts of the gaming laptop are barely warmer than room temperature, but they're always above the values of the AMD version.
(-) The maximum temperature on the upper side is 45.9 °C / 115 F, compared to the average of 40.4 °C / 105 F, ranging from 21.2 to 68.8 °C for the class Gaming.
(-) The bottom heats up to a maximum of 51.9 °C / 125 F, compared to the average of 43.2 °C / 110 F
(+) In idle usage, the average temperature for the upper side is 27.2 °C / 81 F, compared to the device average of 33.9 °C / 93 F.
(+) The palmrests and touchpad are cooler than skin temperature with a maximum of 28.3 °C / 82.9 F and are therefore cool to the touch.
(±) The average temperature of the palmrest area of similar devices was 28.8 °C / 83.8 F (+0.5 °C / 0.9 F).
| Dell G15 5510-43NHT Intel Core i5-10200H, NVIDIA GeForce RTX 3050 Ti Laptop GPU | Lenovo Ideapad Gaming 3 15IHU-82K1002RGE Intel Core i5-11300H, NVIDIA GeForce RTX 3050 Ti Laptop GPU | Dell G15 5515 AMD Ryzen 7 5800H, NVIDIA GeForce RTX 3050 Ti Laptop GPU | Acer Aspire Nitro 5 AN515-55-57GF Intel Core i5-10300H, NVIDIA GeForce RTX 3060 Laptop GPU | Gigabyte G5 GD Intel Core i5-11400H, NVIDIA GeForce RTX 3050 4GB Laptop GPU | |
|---|---|---|---|---|---|
| Heat | 10% | 6% | 5% | 3% | |
| Maximum Upper Side * (°C) | 45.9 | 43.2 6% | 50 -9% | 49 -7% | 45 2% |
| Maximum Bottom * (°C) | 51.9 | 47.9 8% | 49 6% | 51 2% | 50 4% |
| Idle Upper Side * (°C) | 30.1 | 24.9 17% | 26 14% | 26 14% | 28 7% |
| Idle Bottom * (°C) | 30.1 | 27 10% | 26 14% | 27 10% | 31 -3% |
* ... smaller is better
Stress test
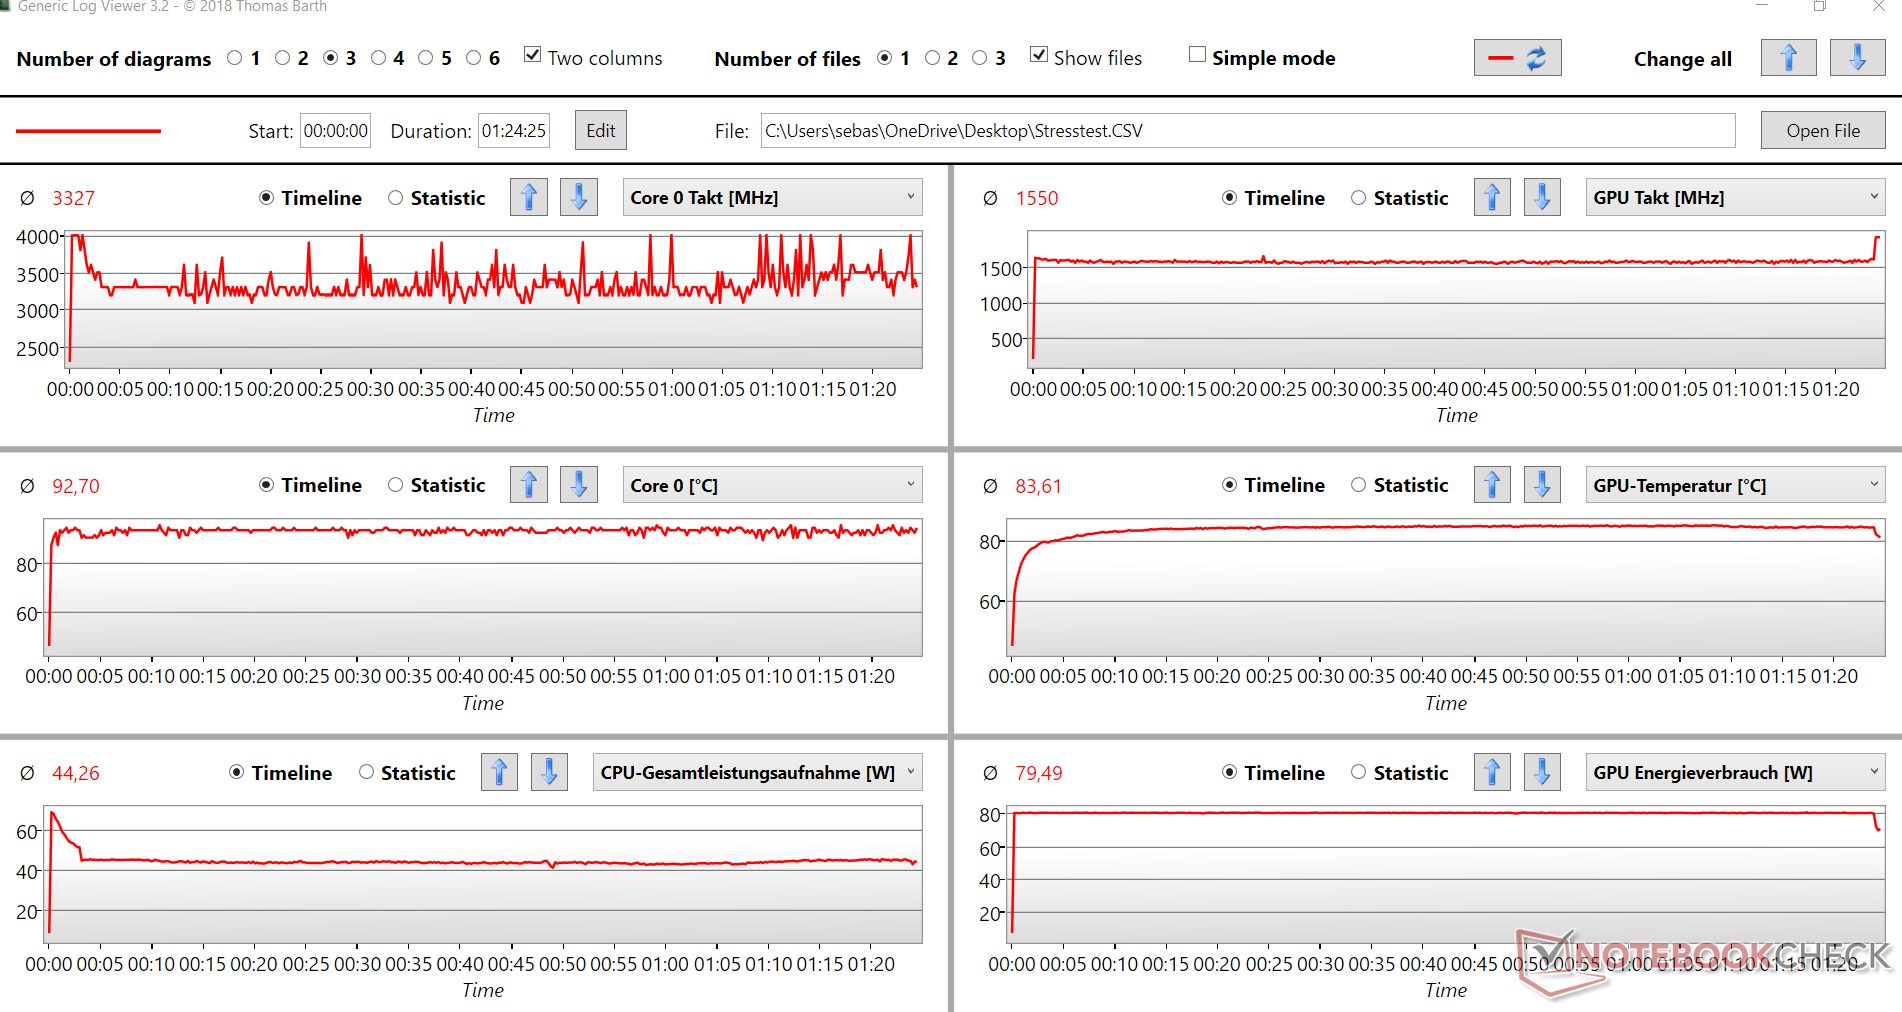
In the stress test (Prime95 and FurMark run for at least an hour), the CPU settles at around 3.3 GHz and a temperature of around 93 °C (~199 °F) after a brief initial peak at the limit. At an average of 1,550 MHz, the graphics card operates relatively just below its maximum at a constant level and a temperature of slightly below 85 °C (~185 °F). The system remains stable even under full load.
On battery power, the CPU clock rate drops to around 2.3 GHz and the GPU to about 700 MHz. Naturally, this hurts performance, but at least it's beneficial in terms of noise and heat development (60 to 70 °C (~140 °F to ~158 °F)).
| CPU clock speed (GHz) | GPU clock speed (MHz) | Average CPU temperature (°C) | Average GPU temperature (°C) | |
| System idle | 1.9 | 0 | 45 | 55 |
| Prime95 stress | 3.7 | 350 | 86 | 57 |
| Prime95 + FurMark stress | 3.3 | 1,550 | 93 | 93 |
| The Witcher 3 stress | 3.9 | 1,800 | 87 | 81 |
Speakers
The built-in speakers hardly deliver any bass, and overall, sound reproduction is solid at most. A more balanced and fuller sound would be desirable for a gaming device. Therefore, the use of external solutions like headphones or speakers is recommended.
Dell G15 5510-43NHT audio analysis
(±) | speaker loudness is average but good (80.6 dB)
Bass 100 - 315 Hz
(-) | nearly no bass - on average 36.3% lower than median
(±) | linearity of bass is average (11% delta to prev. frequency)
Mids 400 - 2000 Hz
(+) | balanced mids - only 4.9% away from median
(+) | mids are linear (5.9% delta to prev. frequency)
Highs 2 - 16 kHz
(+) | balanced highs - only 2.2% away from median
(+) | highs are linear (3.4% delta to prev. frequency)
Overall 100 - 16.000 Hz
(±) | linearity of overall sound is average (21.9% difference to median)
Compared to same class
» 79% of all tested devices in this class were better, 6% similar, 16% worse
» The best had a delta of 6%, average was 18%, worst was 132%
Compared to all devices tested
» 63% of all tested devices were better, 7% similar, 31% worse
» The best had a delta of 4%, average was 24%, worst was 134%
Lenovo Ideapad Gaming 3 15IHU-82K1002RGE audio analysis
(±) | speaker loudness is average but good (80 dB)
Bass 100 - 315 Hz
(-) | nearly no bass - on average 23.8% lower than median
(±) | linearity of bass is average (10.3% delta to prev. frequency)
Mids 400 - 2000 Hz
(±) | higher mids - on average 6.7% higher than median
(+) | mids are linear (6% delta to prev. frequency)
Highs 2 - 16 kHz
(+) | balanced highs - only 3.6% away from median
(±) | linearity of highs is average (7.4% delta to prev. frequency)
Overall 100 - 16.000 Hz
(±) | linearity of overall sound is average (20.7% difference to median)
Compared to same class
» 74% of all tested devices in this class were better, 4% similar, 21% worse
» The best had a delta of 6%, average was 18%, worst was 132%
Compared to all devices tested
» 56% of all tested devices were better, 8% similar, 37% worse
» The best had a delta of 4%, average was 24%, worst was 134%
Energy management: The Dell G15 5515 beats the G15 5510 here too
Energy consumption
In idle usage, the Dell G15 5510 uses less energy than the AMD version. Under load, however, the situation is reversed, and the G15 5515 runs more frugally. The device excels in the class comparison, but this is also due to its rather rudimentary configuration by gaming laptop standards. The 240-watt power adapter is beyond reproach and adequately rated.
| Off / Standby | |
| Idle | |
| Load |
|
Key:
min: | |
| Dell G15 5510-43NHT i5-10200H, GeForce RTX 3050 Ti Laptop GPU, SK Hynix BC711 HFM512GD3HX015N, IPS, 1920x1080, 15.6" | Lenovo Ideapad Gaming 3 15IHU-82K1002RGE i5-11300H, GeForce RTX 3050 Ti Laptop GPU, Micron 2210 MTFDHBA512QFD, IPS, 1920x1080, 15.6" | Dell G15 5515 R7 5800H, GeForce RTX 3050 Ti Laptop GPU, Samsung PM991a MZ9LQ512HBLU-00BD1, IPS, 1920x1080, 15.6" | Acer Aspire Nitro 5 AN515-55-57GF i5-10300H, GeForce RTX 3060 Laptop GPU, WDC PC SN530 SDBPNPZ-512G, IPS, 1920x1080, 15.6" | Gigabyte G5 GD i5-11400H, GeForce RTX 3050 4GB Laptop GPU, ESR512GTLG-E6GBTNB4, IPS, 1920x1080, 15.6" | Average NVIDIA GeForce RTX 3050 Ti Laptop GPU | Average of class Gaming | |
|---|---|---|---|---|---|---|---|
| Power Consumption | 6% | -17% | -6% | -61% | -37% | -107% | |
| Idle Minimum * (Watt) | 4.6 | 4.9 -7% | 5 -9% | 5 -9% | 13 -183% | 8.2 ? -78% | 13.2 ? -187% |
| Idle Average * (Watt) | 6.5 | 8.3 -28% | 9 -38% | 9 -38% | 15 -131% | 12.6 ? -94% | 18.9 ? -191% |
| Idle Maximum * (Watt) | 10.1 | 8.9 12% | 20 -98% | 13 -29% | 20 -98% | 17.2 ? -70% | 24.3 ? -141% |
| Load Average * (Watt) | 129 | 81 37% | 94 27% | 84 35% | 102 21% | 92 ? 29% | 108 ? 16% |
| Witcher 3 ultra * (Watt) | 129 | 119 8% | 123 5% | 125 3% | 124 4% | ||
| Load Maximum * (Watt) | 195 | 172 12% | 172 12% | 190 3% | 148 24% | 139.1 ? 29% | 254 ? -30% |
* ... smaller is better
Energy consumption during The Witcher 3 / stress test
Energy consumption with an external monitor
Battery life
For a gaming laptop, the Dell G15 5510 delivers solid battery life. However, these are lower than those of the AMD alternative despite the fact that both of the models have the same 56 Wh battery. We just explained the reason for this. The AMD CPU consumes less power under load, so one battery charge lasts longer in the end.
However, you can still browse the web for a good 6 hours or watch videos for 8:30 hours. Under load, however, the screen goes black after just over an hour. Therefore, extensive gaming sessions away from a power outlet aren't possible.
| Dell G15 5510-43NHT i5-10200H, GeForce RTX 3050 Ti Laptop GPU, 56 Wh | Lenovo Ideapad Gaming 3 15IHU-82K1002RGE i5-11300H, GeForce RTX 3050 Ti Laptop GPU, 45 Wh | Dell G15 5515 R7 5800H, GeForce RTX 3050 Ti Laptop GPU, 56 Wh | Acer Aspire Nitro 5 AN515-55-57GF i5-10300H, GeForce RTX 3060 Laptop GPU, 57.5 Wh | Gigabyte G5 GD i5-11400H, GeForce RTX 3050 4GB Laptop GPU, 41 Wh | Average of class Gaming | |
|---|---|---|---|---|---|---|
| Battery runtime | -2% | 22% | -1% | -36% | 14% | |
| H.264 (h) | 8.6 | 7.7 -10% | 8.8 2% | 6.2 -28% | 3.6 -58% | 8.26 ? -4% |
| WiFi v1.3 (h) | 6.3 | 6.6 5% | 8 27% | 5.7 -10% | 3.1 -51% | 7.02 ? 11% |
| Load (h) | 1.1 | 1.1 0% | 1.5 36% | 1.5 36% | 1.1 0% | 1.47 ? 34% |
| Reader / Idle (h) | 13.5 | 5.7 | 8.71 ? |
Pros
Cons
Verdict

The gaming performance of the Dell G15 5510 is certainly alright - especially considering its price of around 1,000 Euros (~$1,061). Most games, including newer ones, run smoothly even at high graphics levels thanks to the graphics power available.
Unfortunately, the dedicated GPU is the only component of the gaming laptop that is actually more powerful. The CPU and RAM push the device to its limits pretty quickly, which also compromises gaming performance.
The Dell G15 5515 AMD version offers even better graphics and gaming performance, but also significantly higher system performance thanks to a faster CPU and twice as much RAM.
Since Dell still isn't charging much more for the more powerful alternative, the Dell G15 5515 (about 850 Euros (~$901) at Cyberport.de) is definitely the better choice compared to the 5510. Not only is it faster, but it's also quieter and more enduring, and it also looks much more stylish in the "Phantom Gray with Speckles" color. Likewise, the recently reviewed Lenovo IdeaPad Gaming 3 15 G6 outperforms this review sample thanks to the combination of a newer CPU and the same GPU.
Price and availability
At the time of writing, it's a little bit hard to find our exact review configuration of the Dell G15 5510 in the United States (Core i5-10200H, GeForce RTX 3050 Ti Laptop GPU, 8 GB of RAM, 512 GB of SSD). Walmart's online store has this exact model listed for 1,199.99. On Amazon, you'll find an option with the RTX 3050 laptop GPU for $958 and another one with the Core i5-10500H and the RTX 3050 Ti for $1,197. The best option, though, might be the one offered in Best Buy's online store with the Core i7-11800H and 16 GB of RAM for $1,199.
Dell G15 5510-43NHT
- 05/01/2022 v7 (old)
Marcus Schwarten
Price comparison

