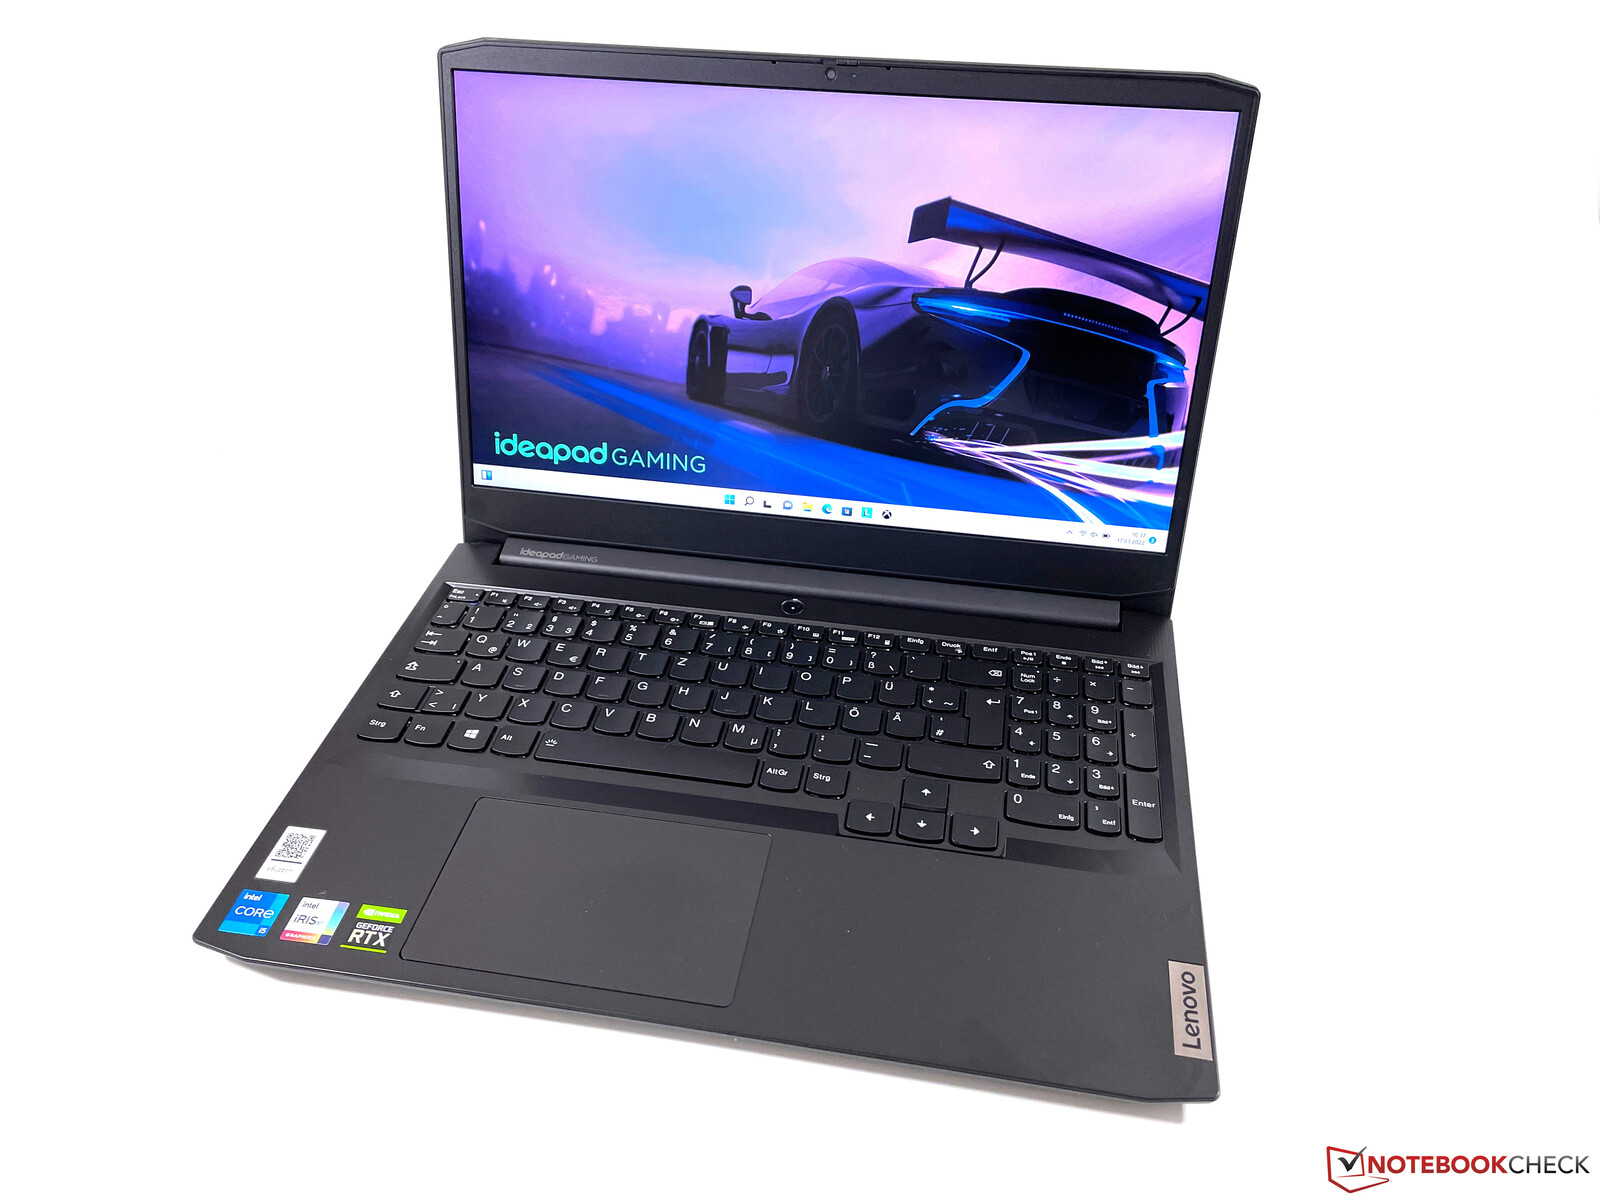
Lenovo IdeaPad Gaming 3i 15 G6 Laptop Review: Budget Gaming Laptop with Poor Display
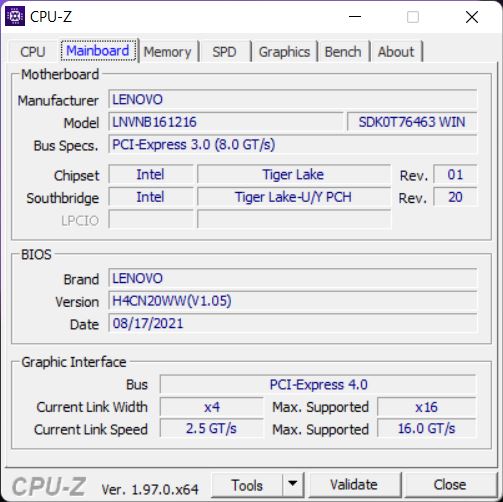
Lenovo’s IdeaPad Gaming series is the affordable gateway to Lenovo’s gaming laptops with a focus on what is important, namely gaming performance, without any bells and whistles. The 6th generation IdeaPad Gaming 3i 15 is based on Intel's current Intel Tiger Lake, and it comes with a Nvidia GeForce RTX 3050 Ti, 16 GB of RAM, a 512 GB PCIe SSD, and a 15-inch IPS FHD display. This exact model is currently not sold in the US. There is, however, an Intel Core i7-11370H-based device with 8 GB of RAM and a 256 GB SSD priced at $1,000.
Potential Competitors in Comparison
Rating | Date | Model | Weight | Height | Size | Resolution | Price |
|---|---|---|---|---|---|---|---|
| 79.7 % v7 (old) | 03 / 2022 | Lenovo Ideapad Gaming 3 15IHU-82K1002RGE i5-11300H, GeForce RTX 3050 Ti Laptop GPU | 2 kg | 24.2 mm | 15.60" | 1920x1080 | |
| 82.7 % v7 (old) | 10 / 2021 | Dell G15 5515 R7 5800H, GeForce RTX 3050 Ti Laptop GPU | 2.4 kg | 24.9 mm | 15.60" | 1920x1080 | |
| 81.7 % v7 (old) | 11 / 2021 | Gigabyte G5 GD i5-11400H, GeForce RTX 3050 4GB Laptop GPU | 2.1 kg | 31.6 mm | 15.60" | 1920x1080 | |
| 81.4 % v7 (old) | 12 / 2021 | Medion Erazer Deputy P25 R7 5800H, GeForce RTX 3060 Laptop GPU | 2.3 kg | 26 mm | 15.60" | 1920x1080 | |
| 83.2 % v7 (old) | 09 / 2021 | Schenker XMG Focus 15 i7-11800H, GeForce RTX 3050 Ti Laptop GPU | 1.9 kg | 22 mm | 15.60" | 1920x1080 | |
| 83.4 % v7 (old) | 09 / 2021 | Lenovo Legion 5 15ACH-82JU00C6GE-FL R7 5800H, GeForce RTX 3060 Laptop GPU | 2.5 kg | 26 mm | 15.60" | 1920x1080 |
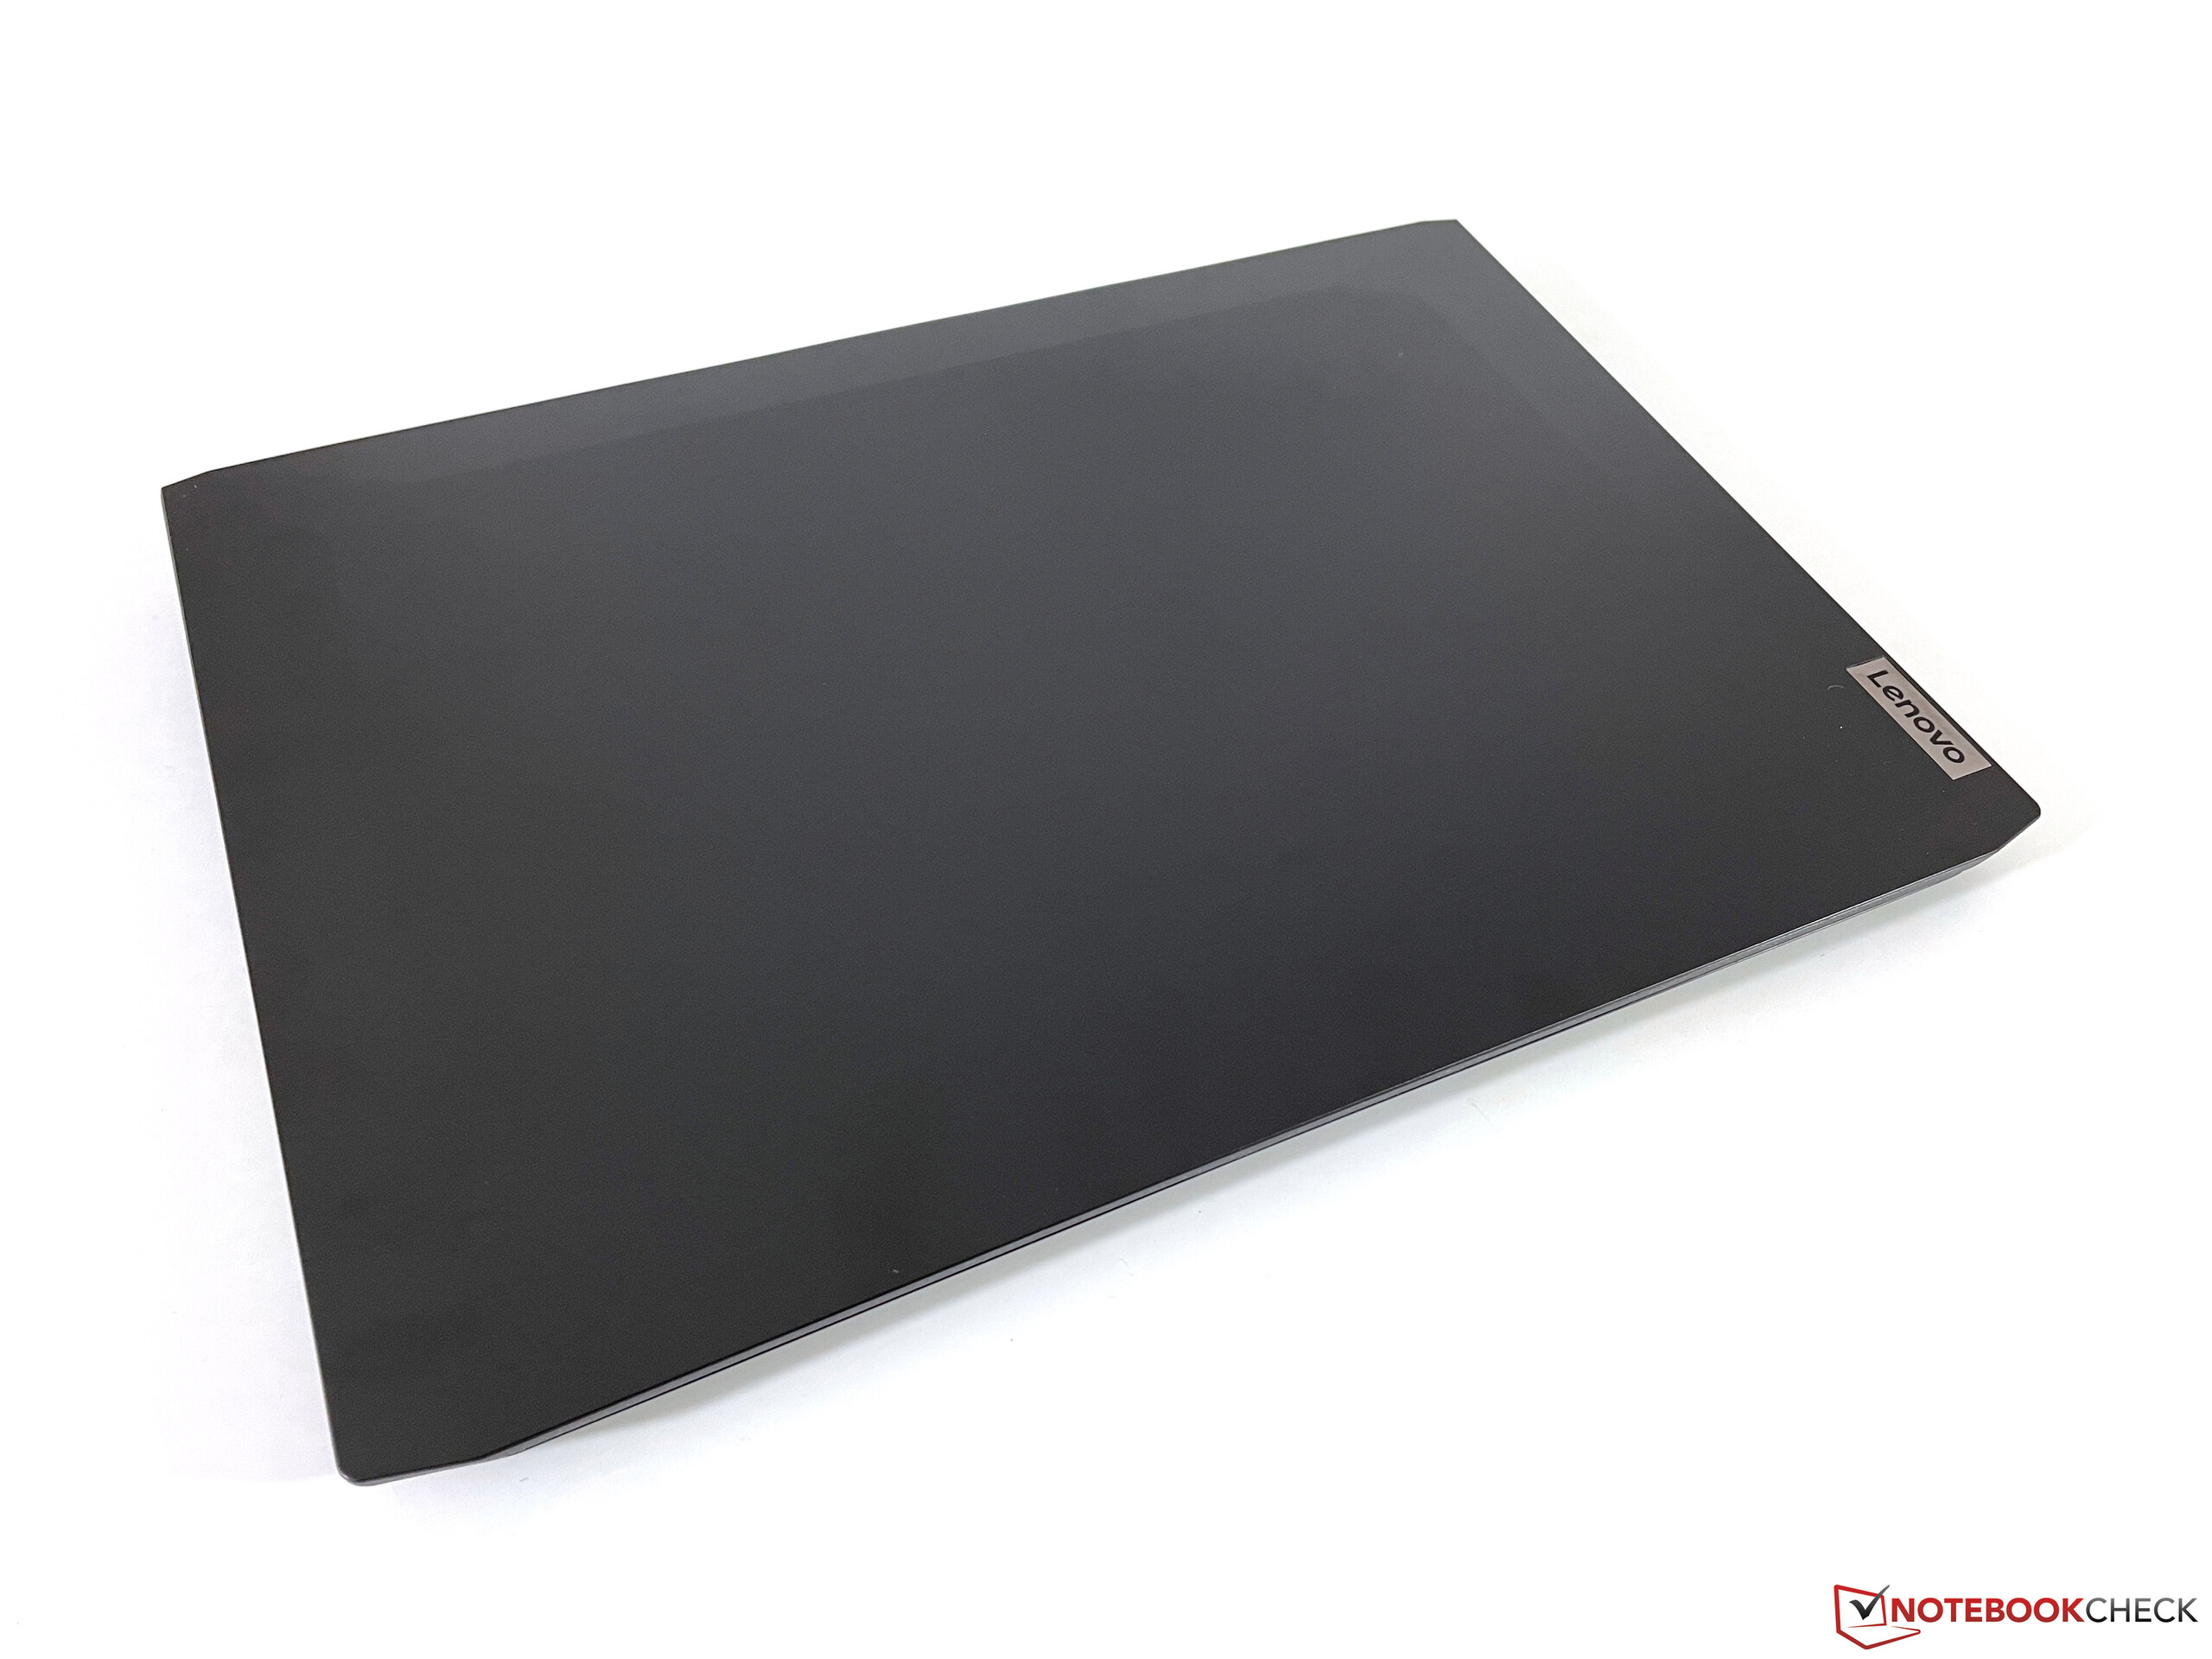
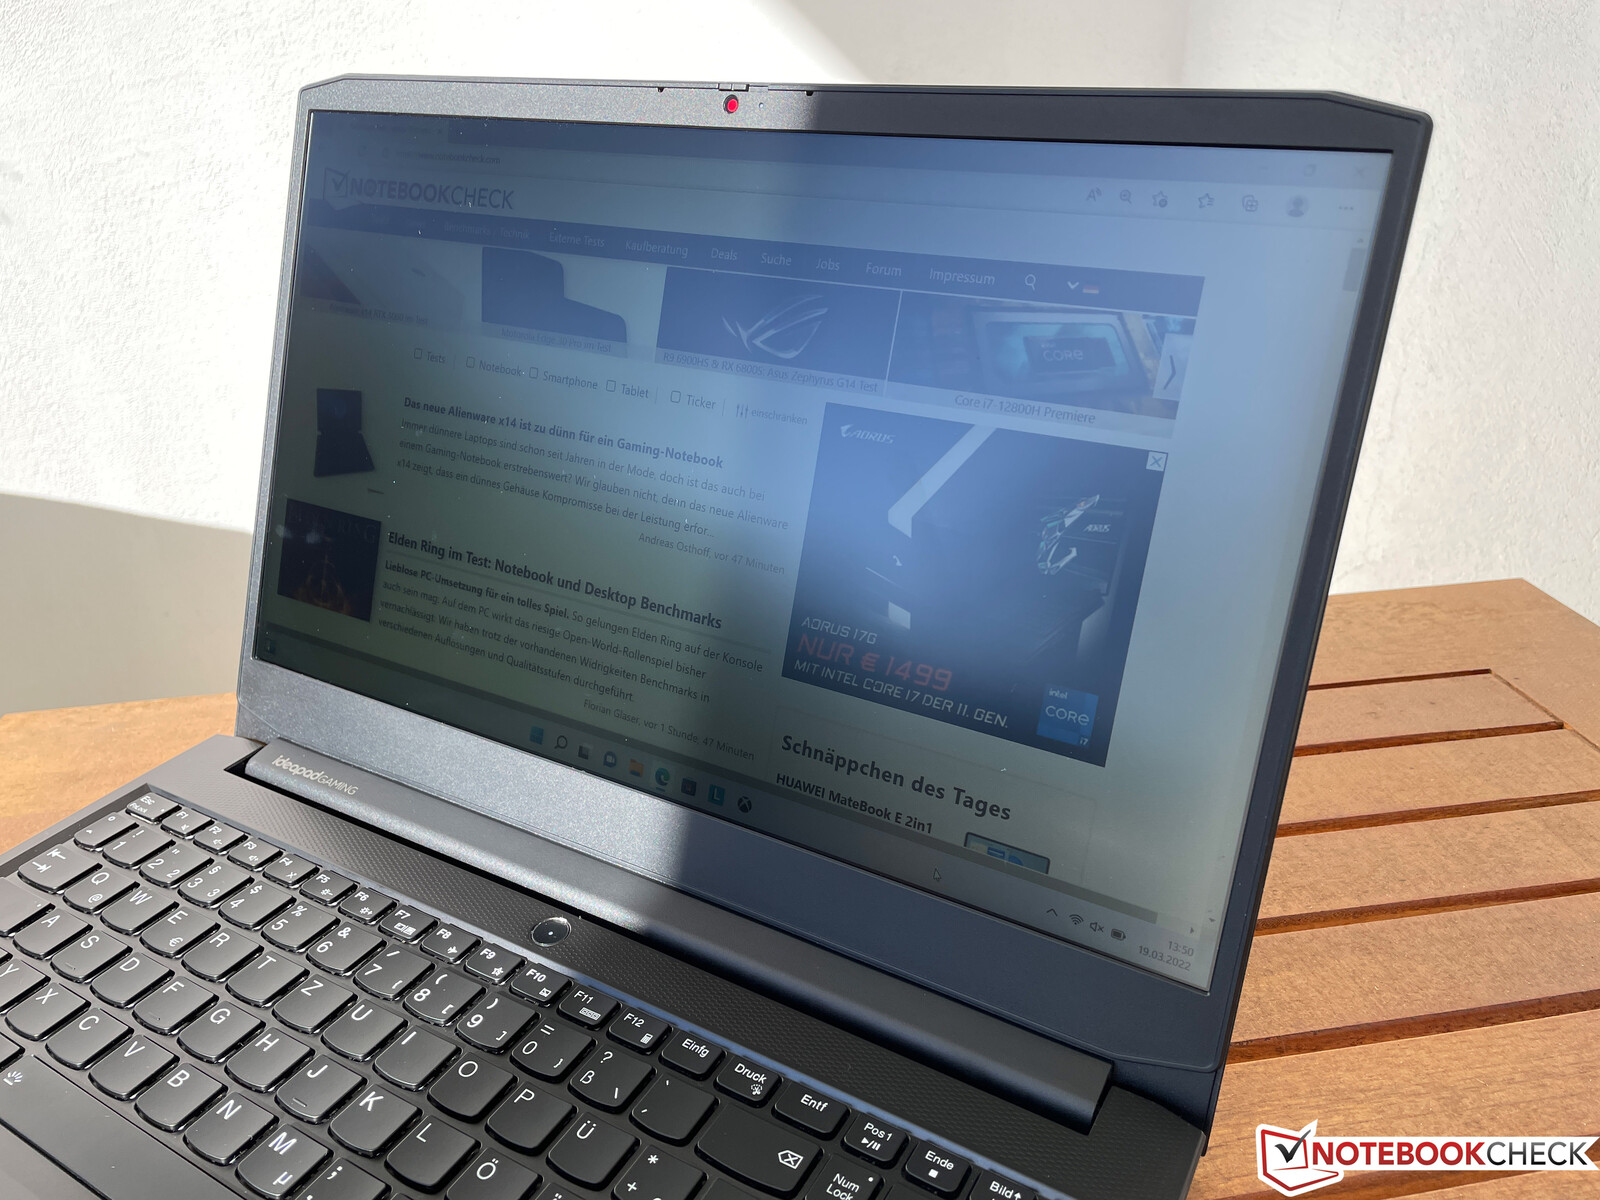
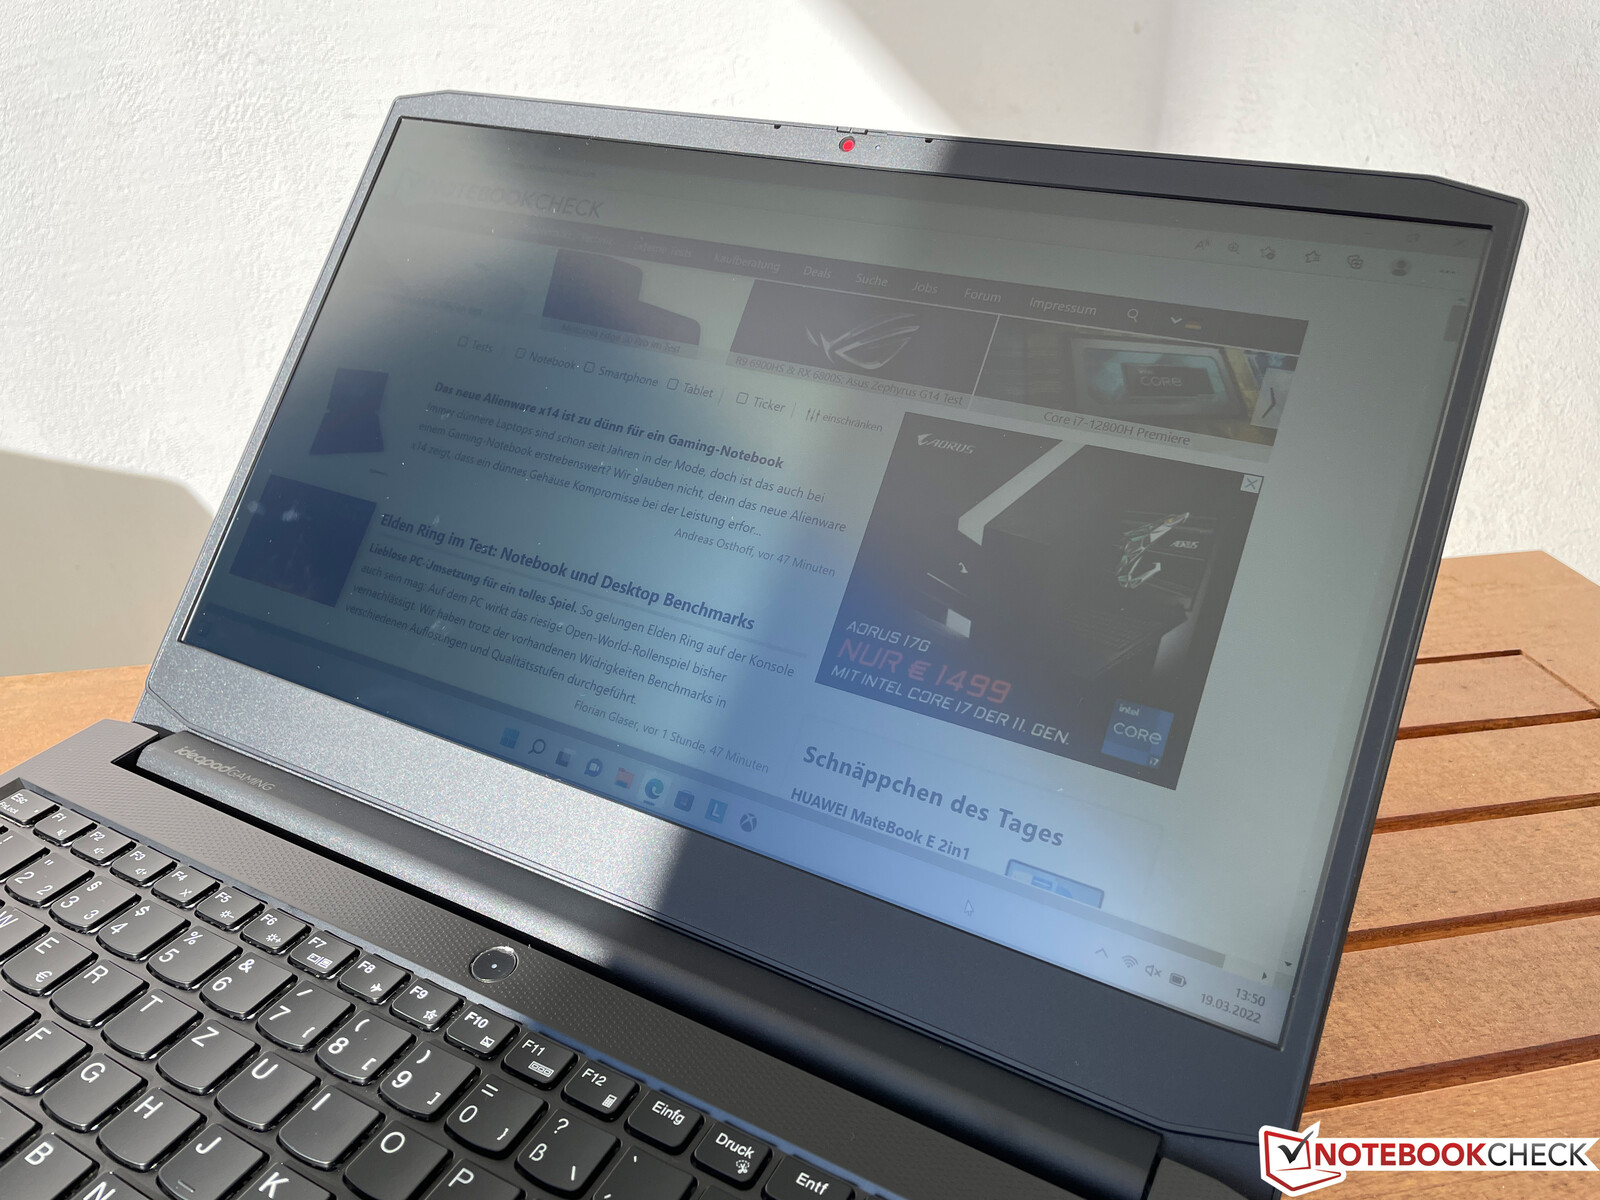
Case – Playing Hard to Get (Into)
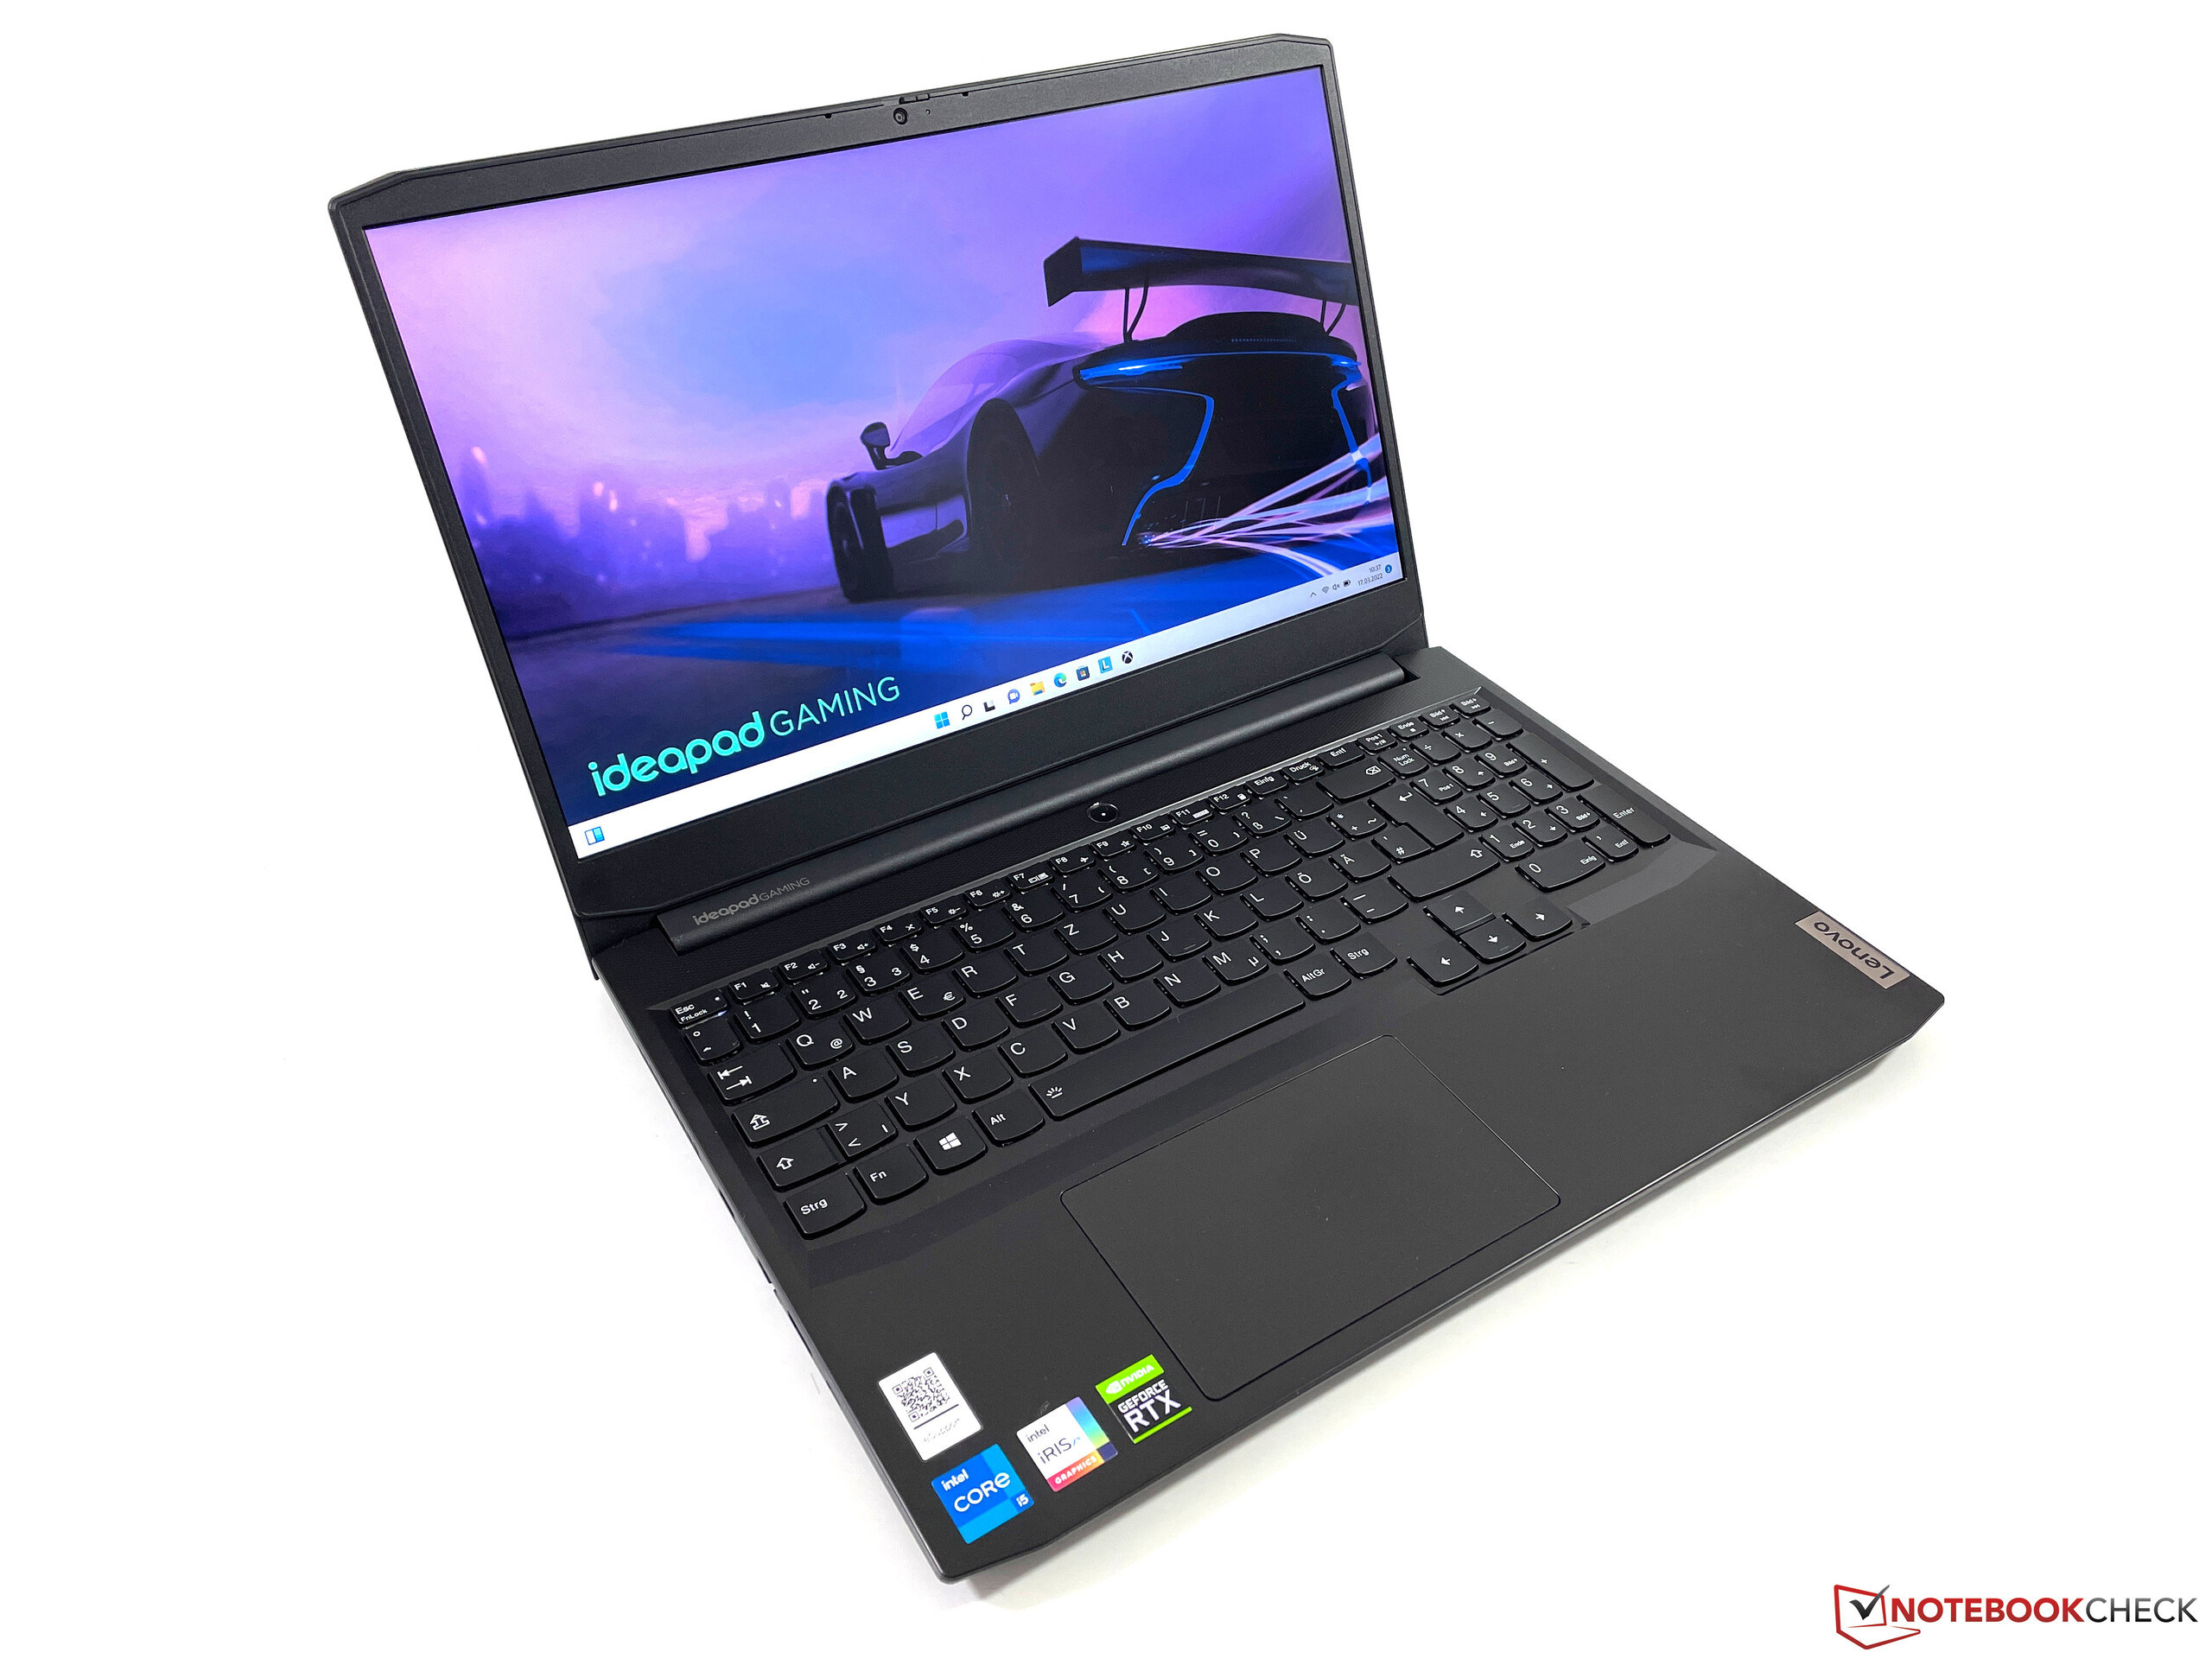
The IdeaPad Gaming 3’s case is made entirely of plastic, and its rough bottom cover is indicative of its low price. The overall design is utilitarian and discreet. There are no gaming-specific design elements, and the device is not recognizable as a gaming laptop. It even lacks any form of case lighting effects.
Both the top cover as well as the base unit feature a smooth finish susceptible to fingerprints and smudges. The base unit’s rigidity is decent, albeit the center of the keyboard can be depressed quite easily, and the entire unit creaked slightly when we attempted to warp it.
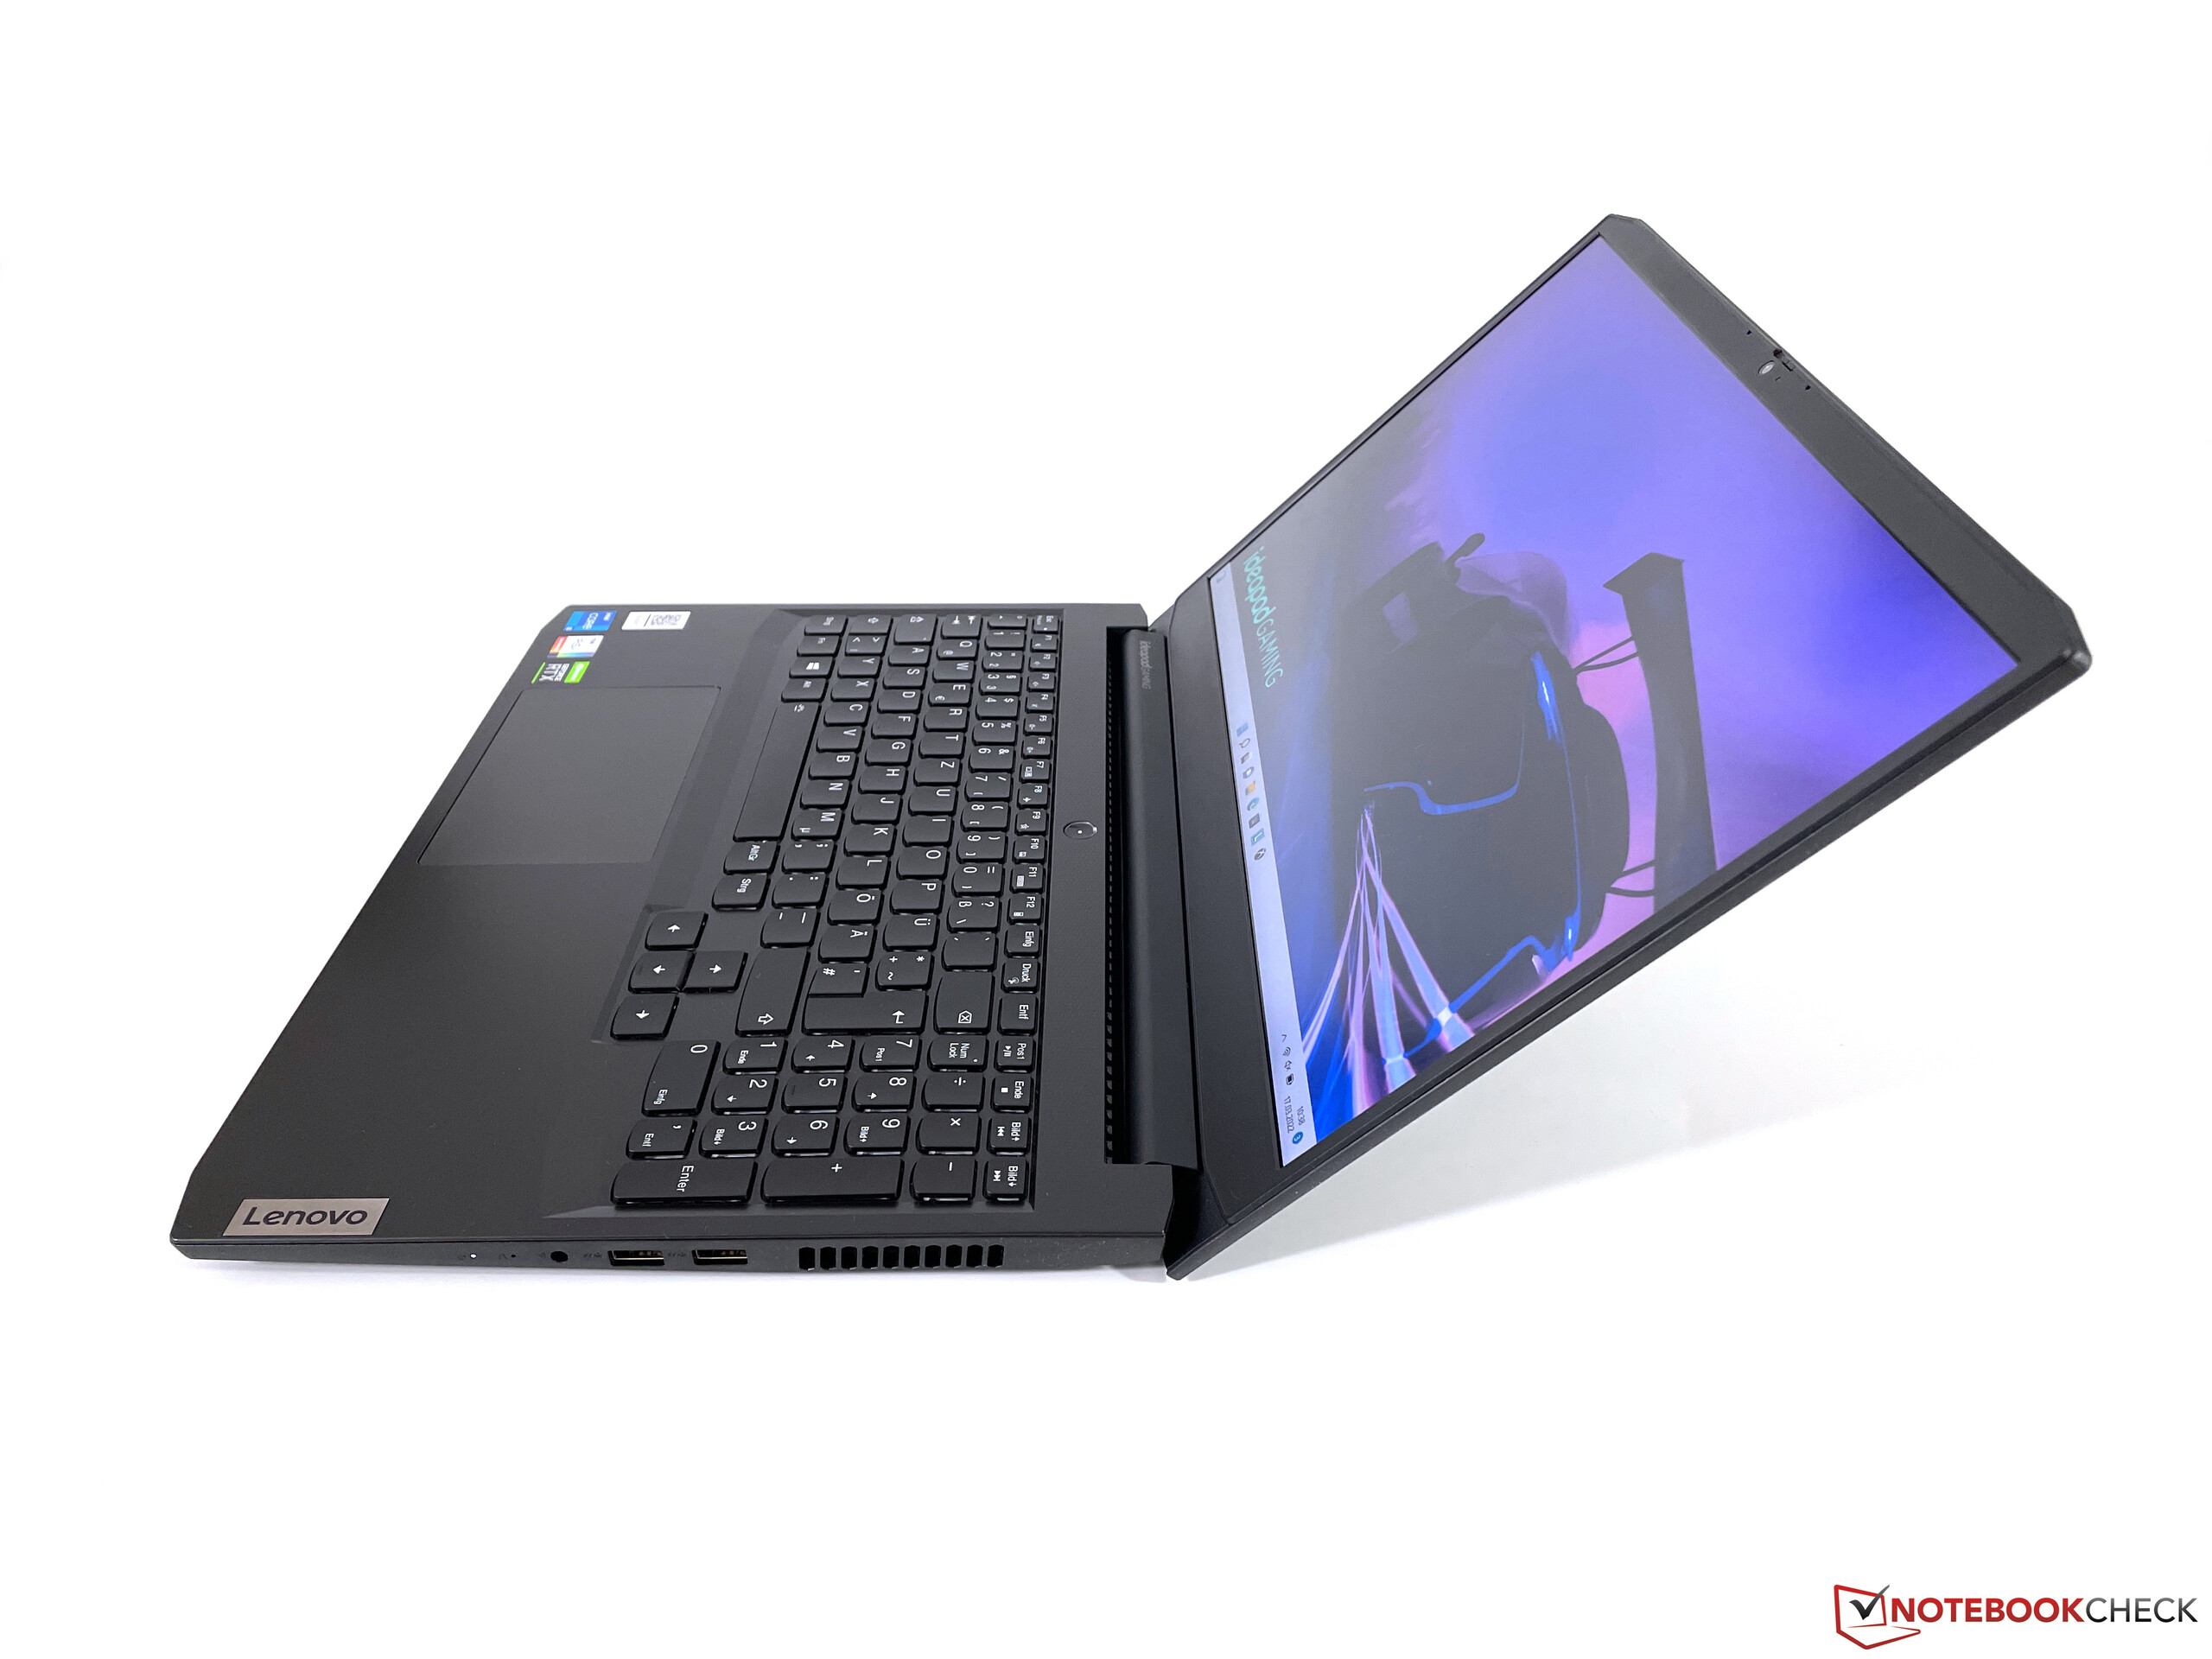
The hinge itself is adjusted fairly well overall with some minor teetering when adjusting the display (max. opening angle: 135°). The display lid is noticeably less rigid than the base, and the panel showed a very clear ripple effect with pressure applied to its backside.
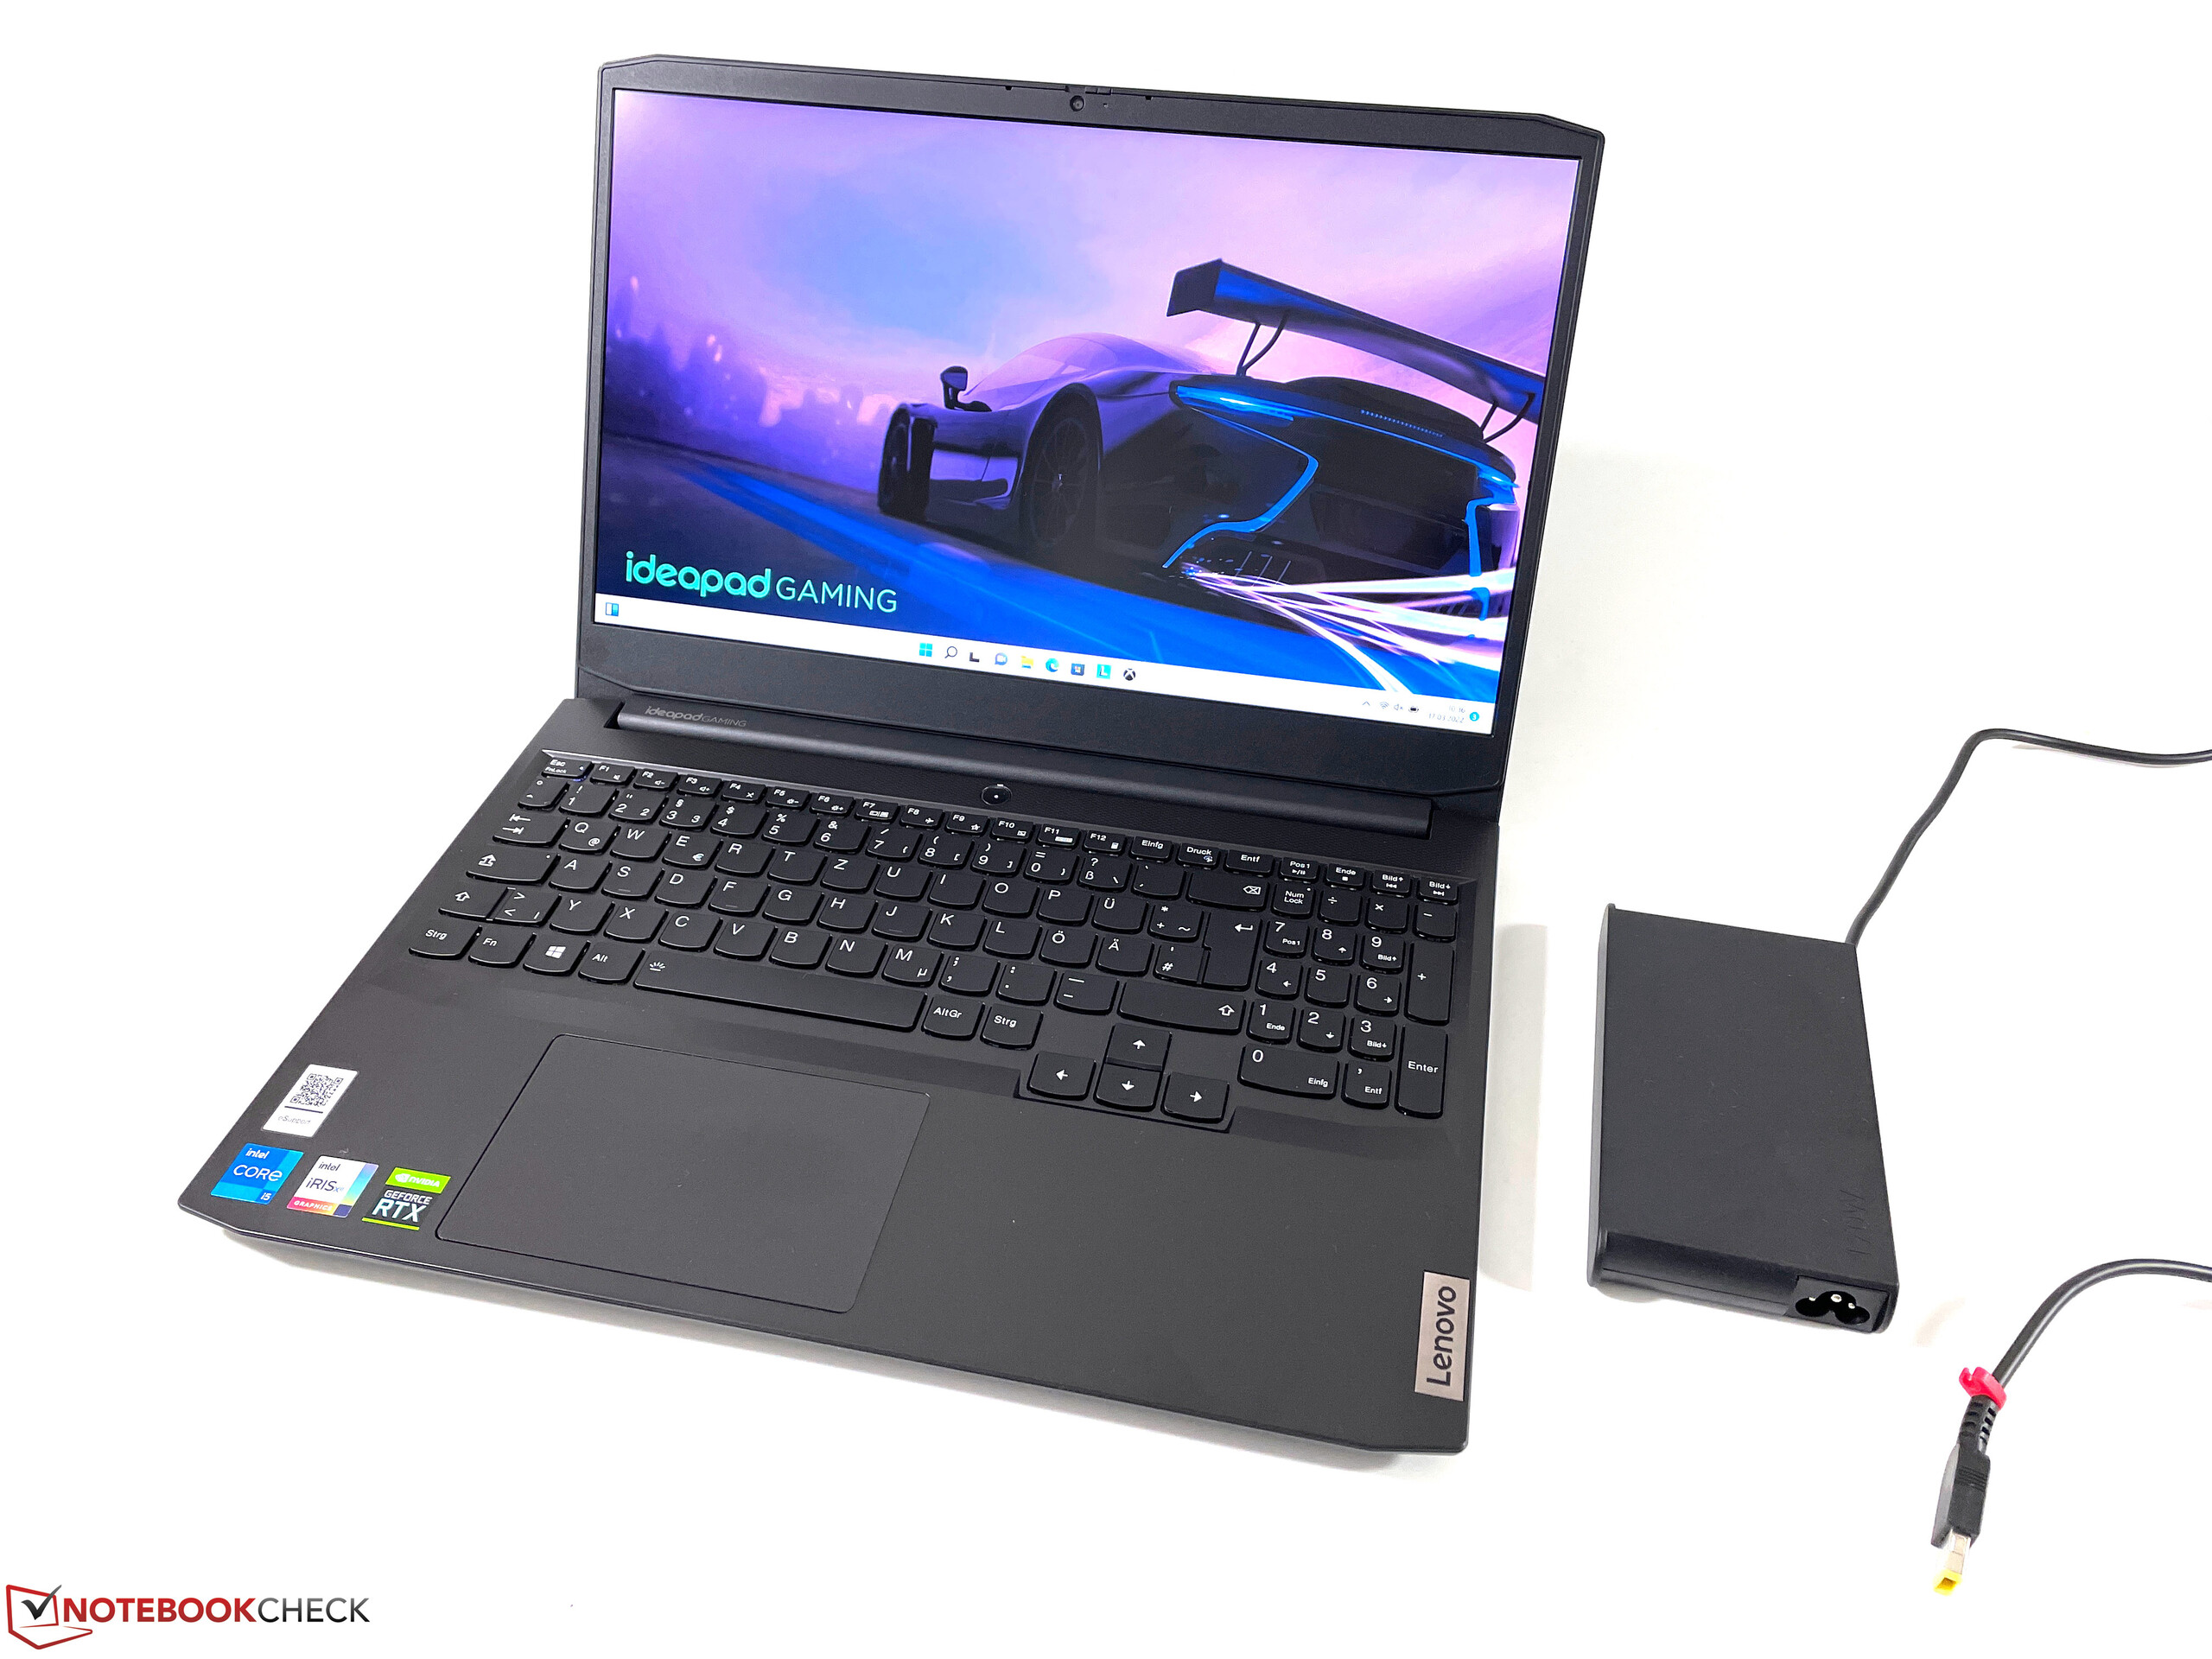
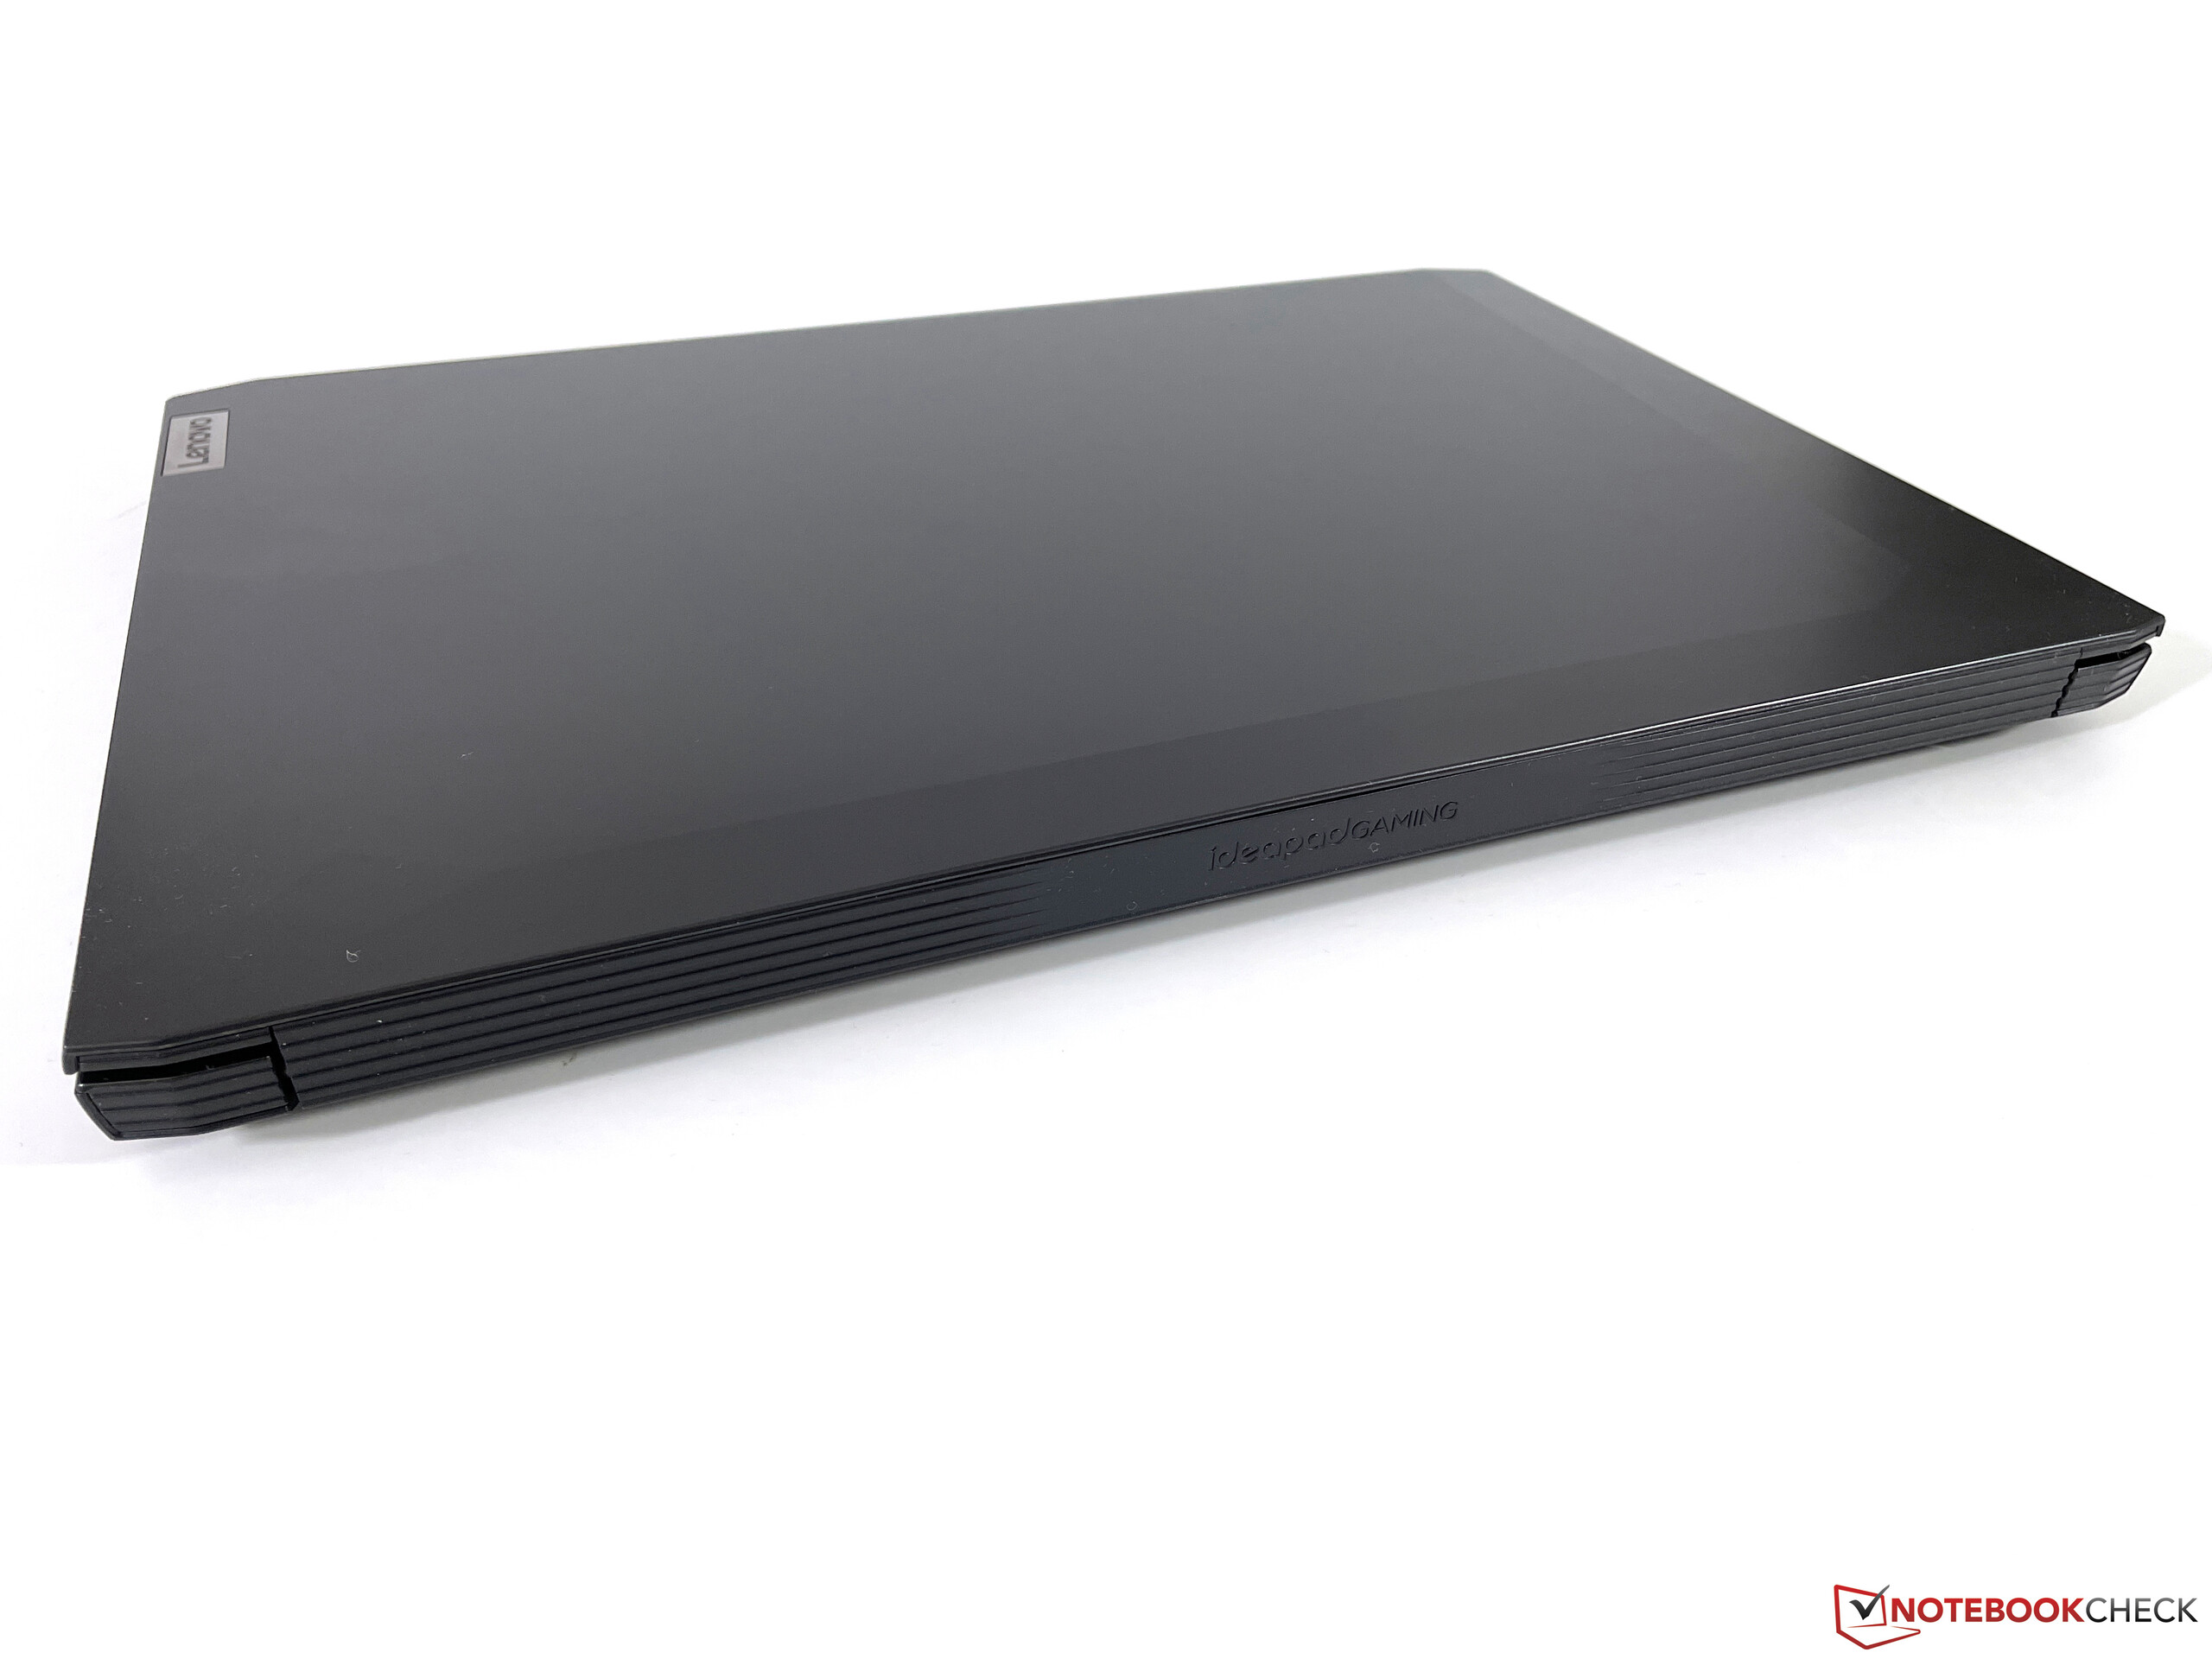
All things considered the IdeaPad Gaming 3 is one of the more compact units among its competitors, although the differences were pretty minor. At slightly over 2 kg (4.41 lbs) it was also relatively lightweight. Keep in mind that the power supply increases the weight budget by more than 25 % (500 g/1.1 lbs).
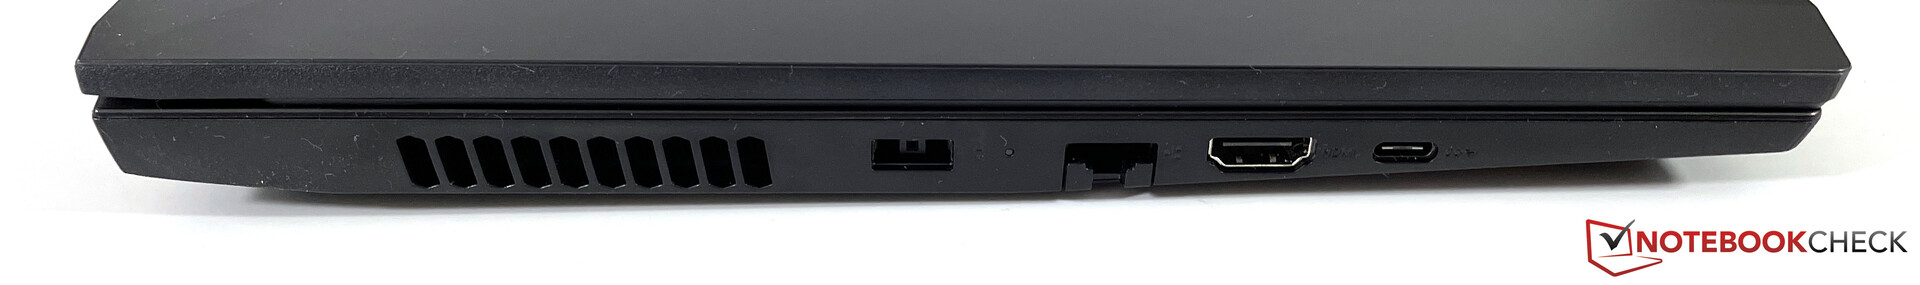
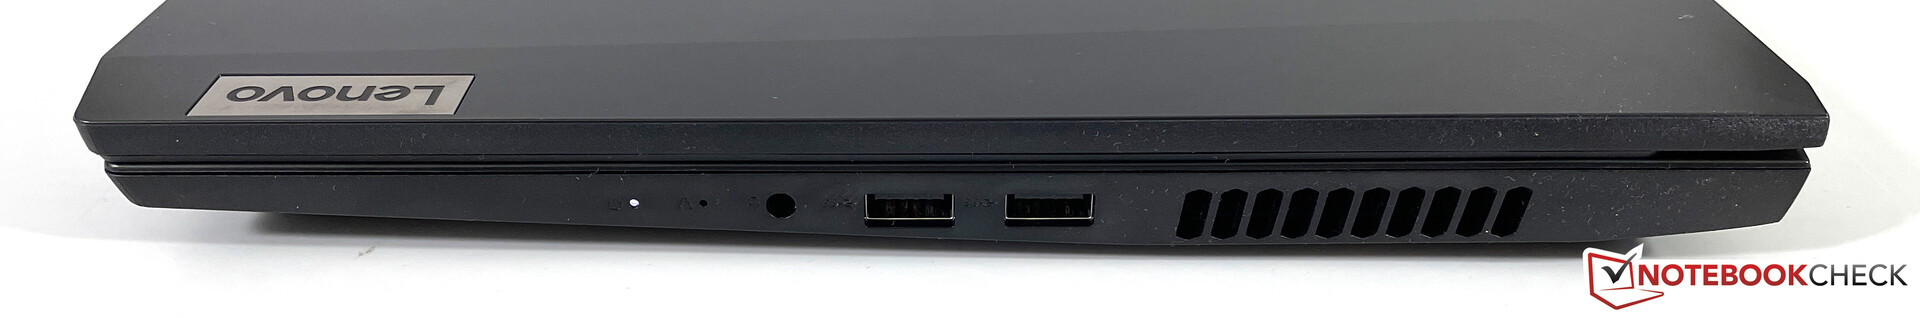
Connectivity – IdeaPad Gaming Covers the Basics
All ports are located towards the middle on both sides. We found the location of the power port particularly unwieldy for left-handed gamers intending to use an external mouse. The supported protocols are once again indicative of its low price point. The device lacks Thunderbolt support and cannot be charge via its USB-C port, nor does the port carry a DisplayPort signal. A card reader is also nowhere to be found.
Communication
In terms of network connectivity, the IdeaPad Gaming 3 offers an ethernet port as well as a Wi-Fi modem. Lenovo did not skimp on this part and opted for an up-to-date Intel AX201 module with support for Wi-Fi 6 (802.11ax, 160 MHz) and Bluetooth 5.1. Transfer rates when connected to our Netgear Nighthawk AX12 reference router were very good, and we did not encounter any connectivity issues during our review period.
Webcam
Above the display we find a standard 720p webcam producing the expected results. In other words: its image quality is poor even in decent lighting. At least the camera offers a physical privacy shutter.


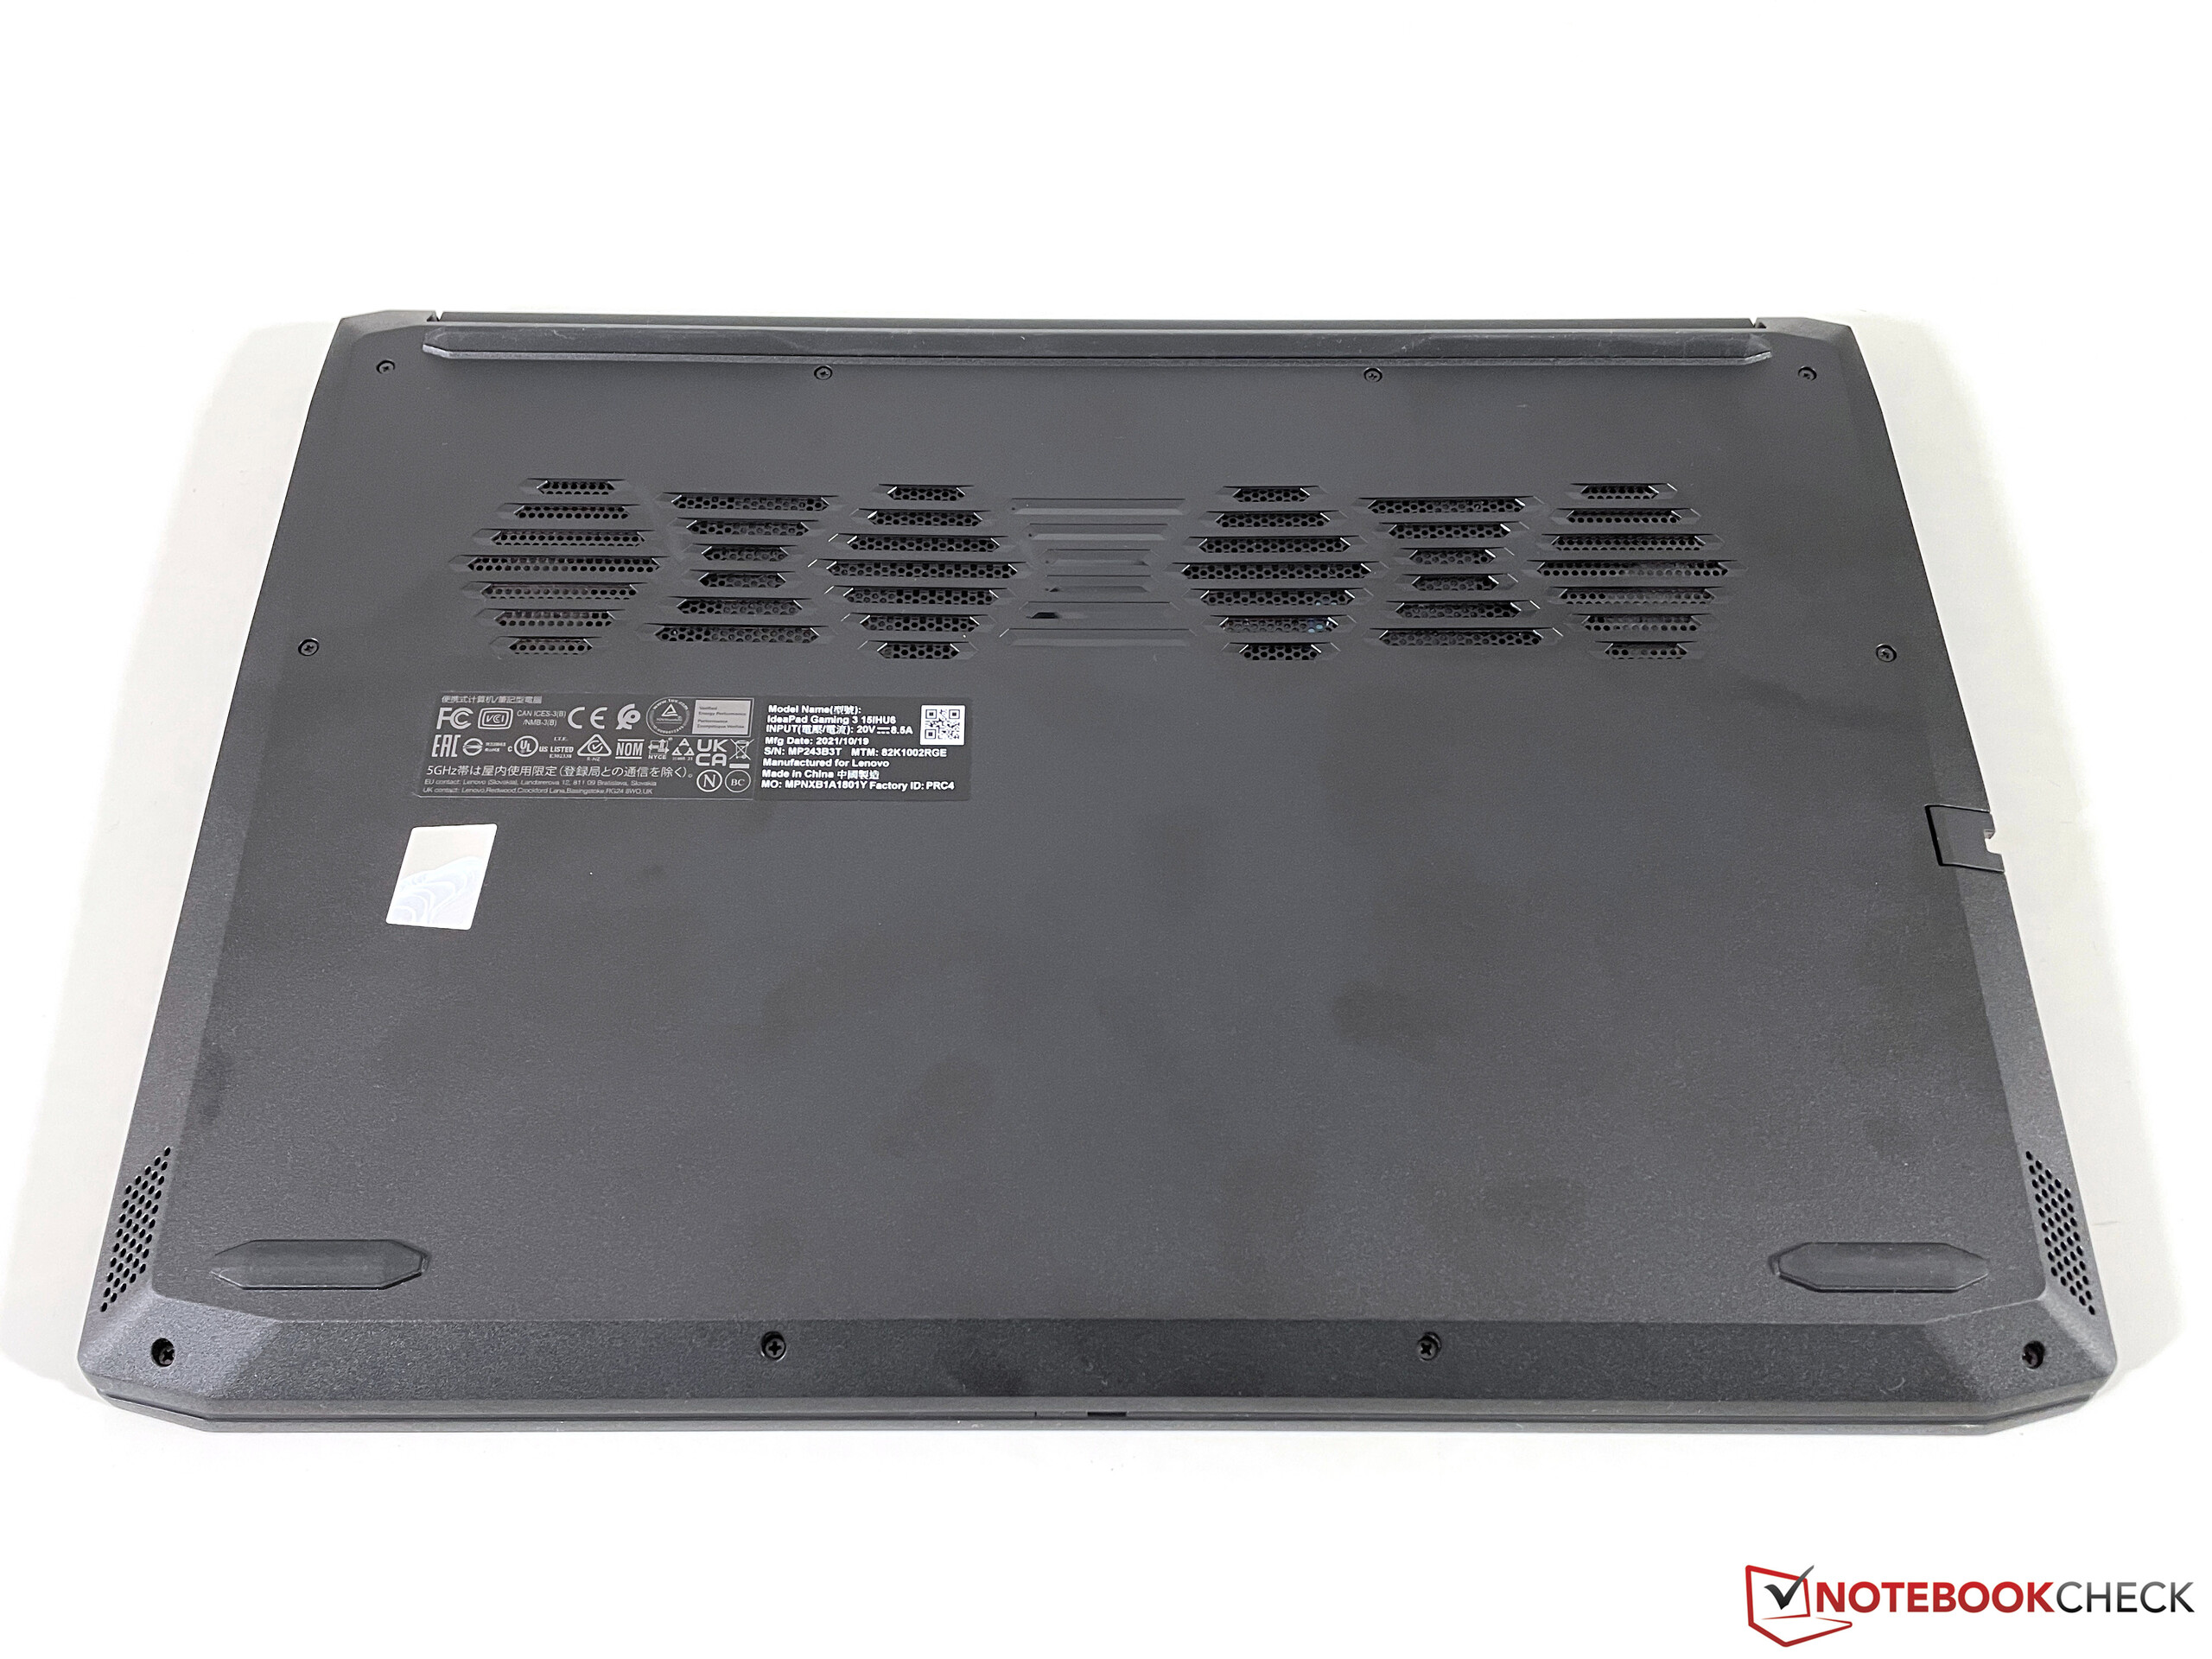
Maintenance
In theory, you can take off the entire bottom panel in order to gain access to the IdeaPad Gaming 3’s internal components. And while the Philips screws holding the cover in place can be easily undone we found the bottom cover it impossible to remove without damaging the base unit either visually or physically. Considering that our review unit was a shop unit we decided to call it a day.
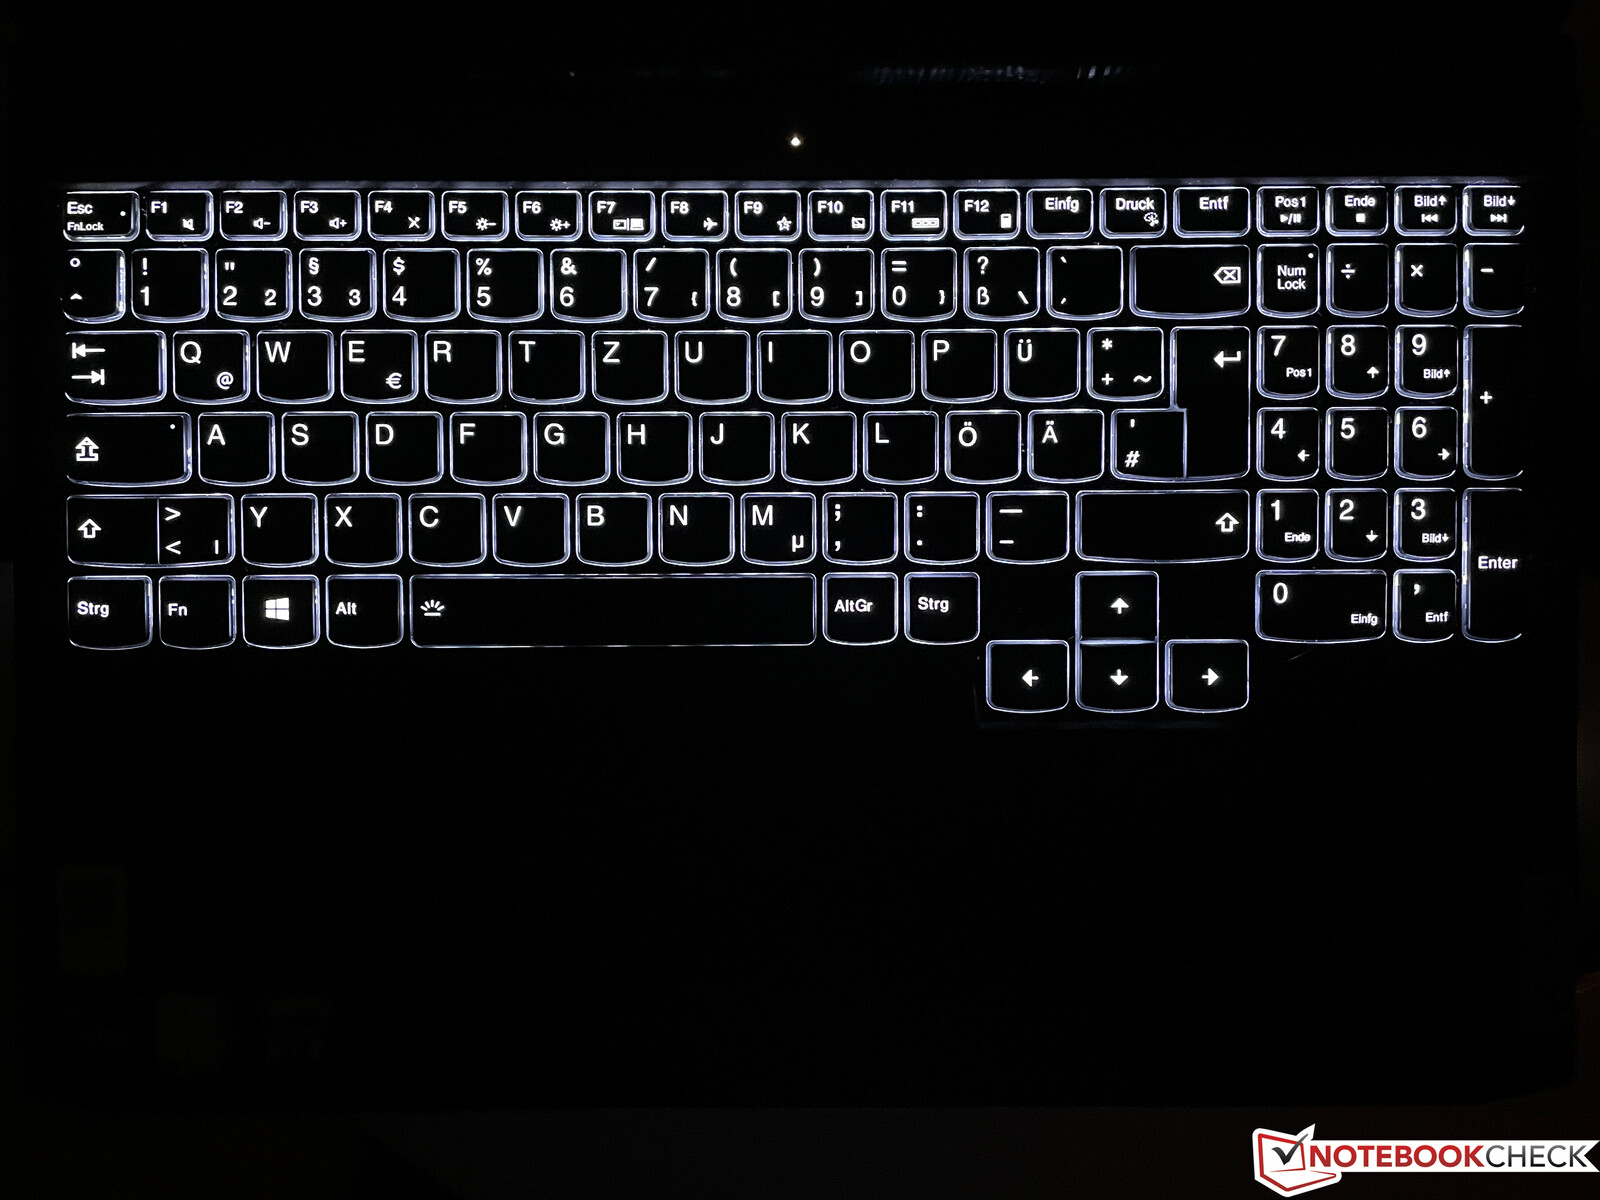
Input Devices – IdeaPad Gaming with Backlit Keyboard
Keyboard
The IdeaPad Gaming 3 comes with a full-sized keyboard with numpad, although the latter is comparatively narrow. Unlike other IdeaPads this keyboard comes with increased travel (1.5 mm) rendering typing very comfortable and pleasing. Even when compared to more expensive Legion Gaming notebooks our review unit fared very well, and we had no issues typing long texts. Gamers will benefit from the large offset cursor keys. The device lacks an RGB backlight and comes with a two-stage white backlight instead. With that said an optional 4-zone RGB backlight is also available.
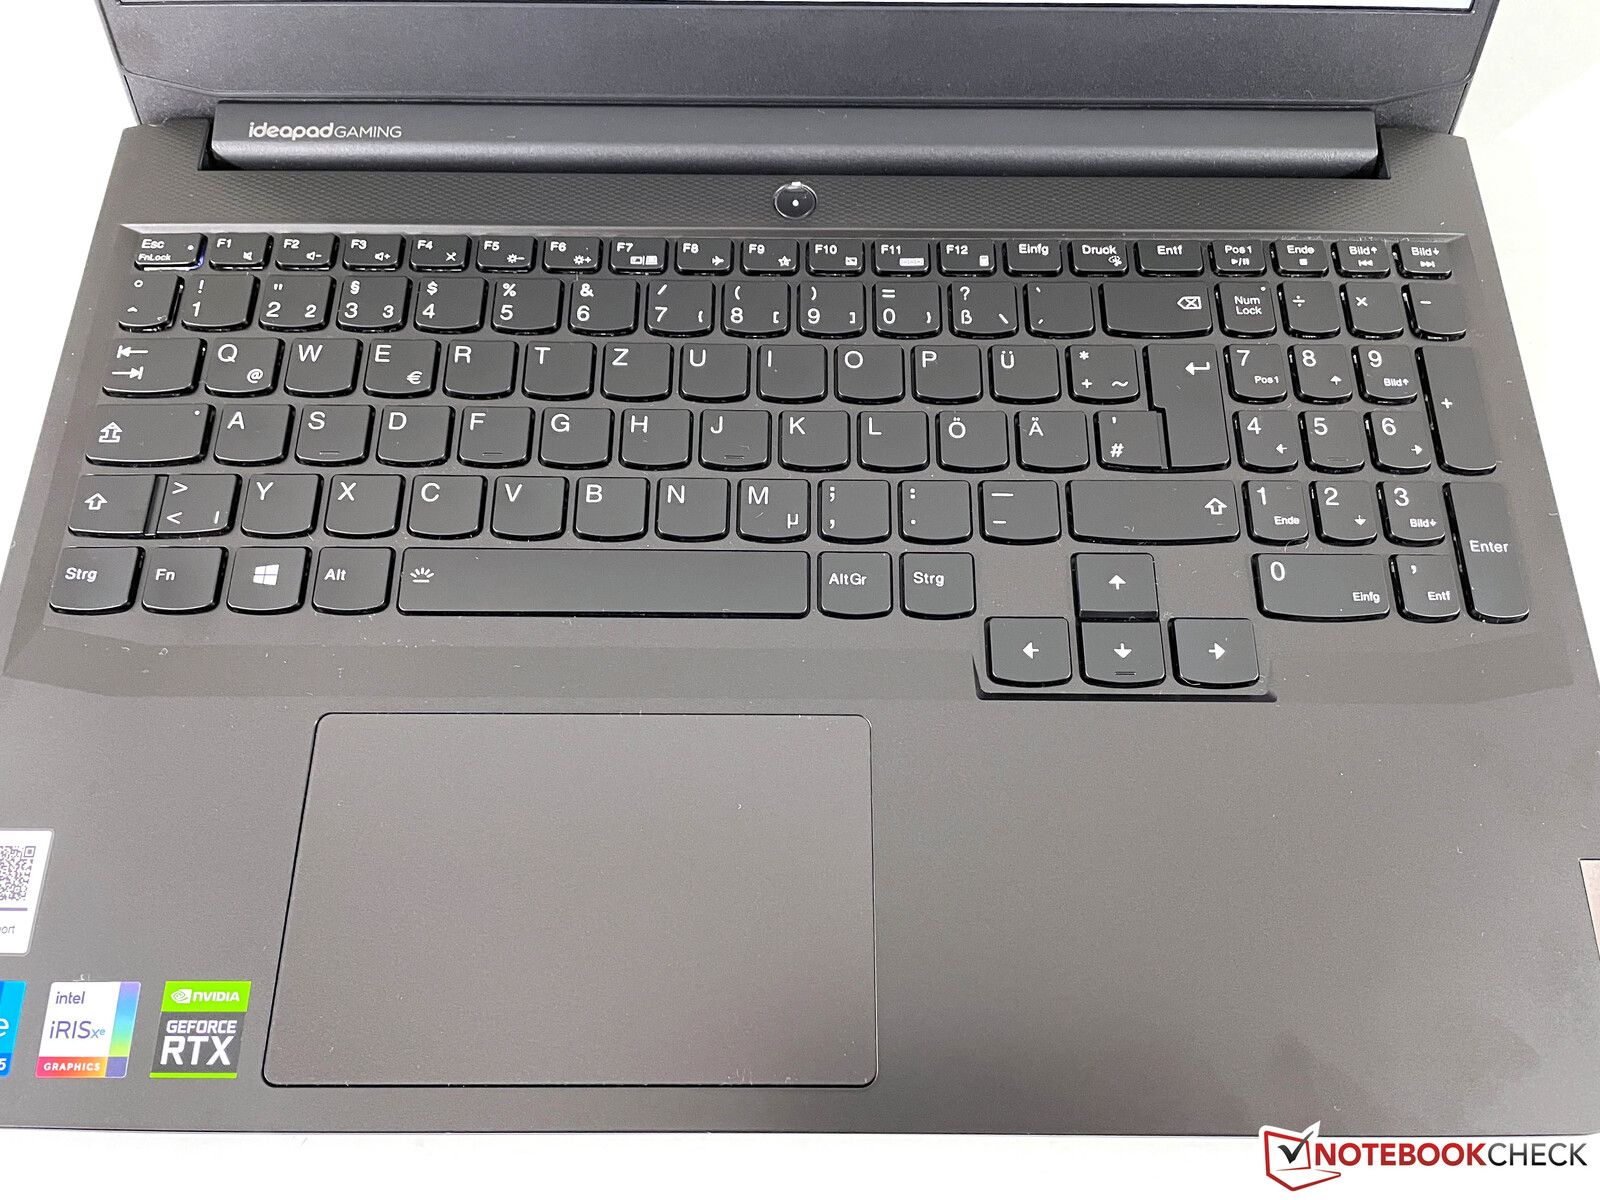
Touchpad
The clickpad is shifted to the left and centered underneath the space bar. With 12 x 7.5 cm (4.72 x 2.95 inches) it is sufficiently large, and thanks to its smooth surface usability and cursor control was a breeze. At the bottom we found the integrated buttons which produced a loud and very noticeable clicking noise when pressed. The pad supports Microsoft’s Precision Standard and thus gestures with up to four fingers.
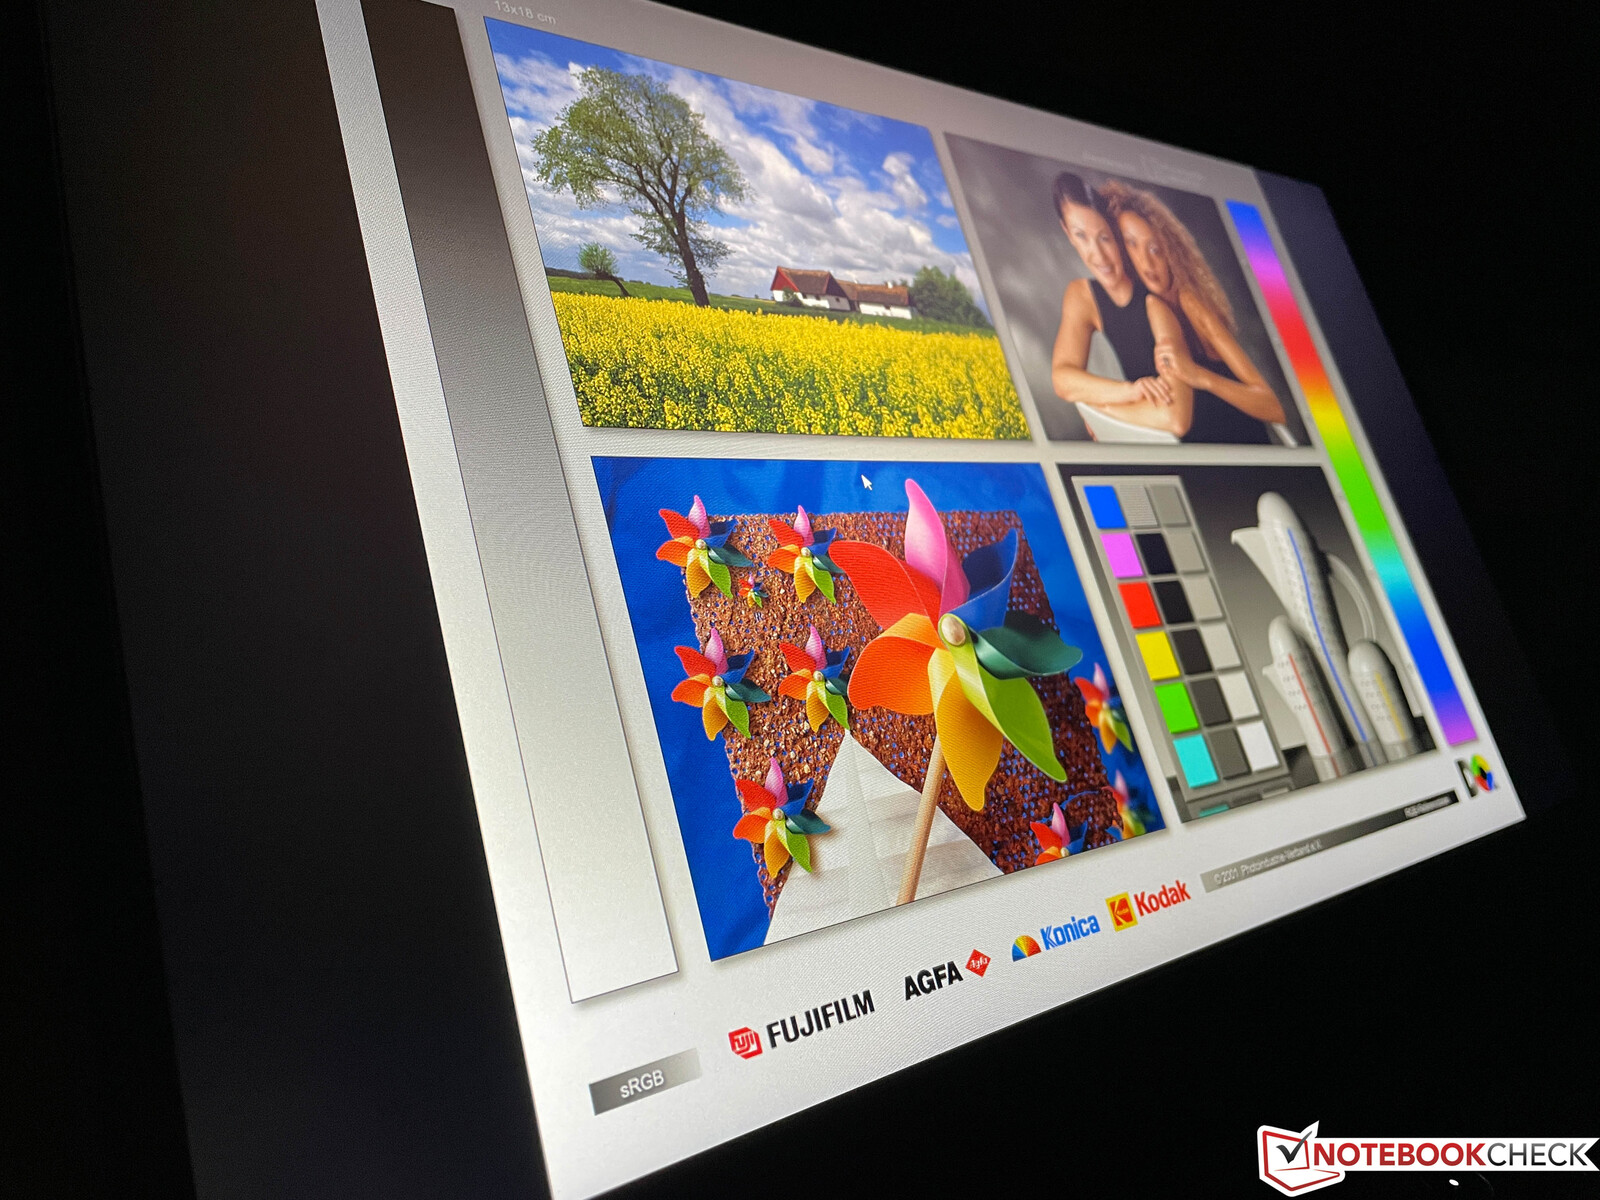
Display – Matte IPS Panel


A total of three different 1080p panels are available for the IdeaPad Gaming 3, all of which are matte and based on IPS technology: the standard 60 Hz display (250 nits) that our review unit was equipped with, a 120 Hz panel (250 nits), and a 165 Hz panel (300 nits) with full sRGB coverage.
In our tests, the standard display peaked at above Lenovo’s brightness rating and managed a good 300 nits. Nevertheless, subjectively it is okay at best and most certainly the IdeaPad Gaming 3’s most glaring downside. Display contents are somewhat grainy, courtesy of the matte display coating, and colors are not particularly beefy either. We found no evidence of PWM flickering but on the flipside rather lethargic response times. If at all doable we would strongly suggest opting for the optional 165 Hz panel. Keep in mind that not all display options are available in all regions.
| |||||||||||||||||||||||||
Brightness Distribution: 88 %
Center on Battery: 307 cd/m²
Contrast: 1462:1 (Black: 0.21 cd/m²)
ΔE ColorChecker Calman: 5.9 | ∀{0.5-29.43 Ø4.73}
calibrated: 4.8
ΔE Greyscale Calman: 4.9 | ∀{0.09-98 Ø4.97}
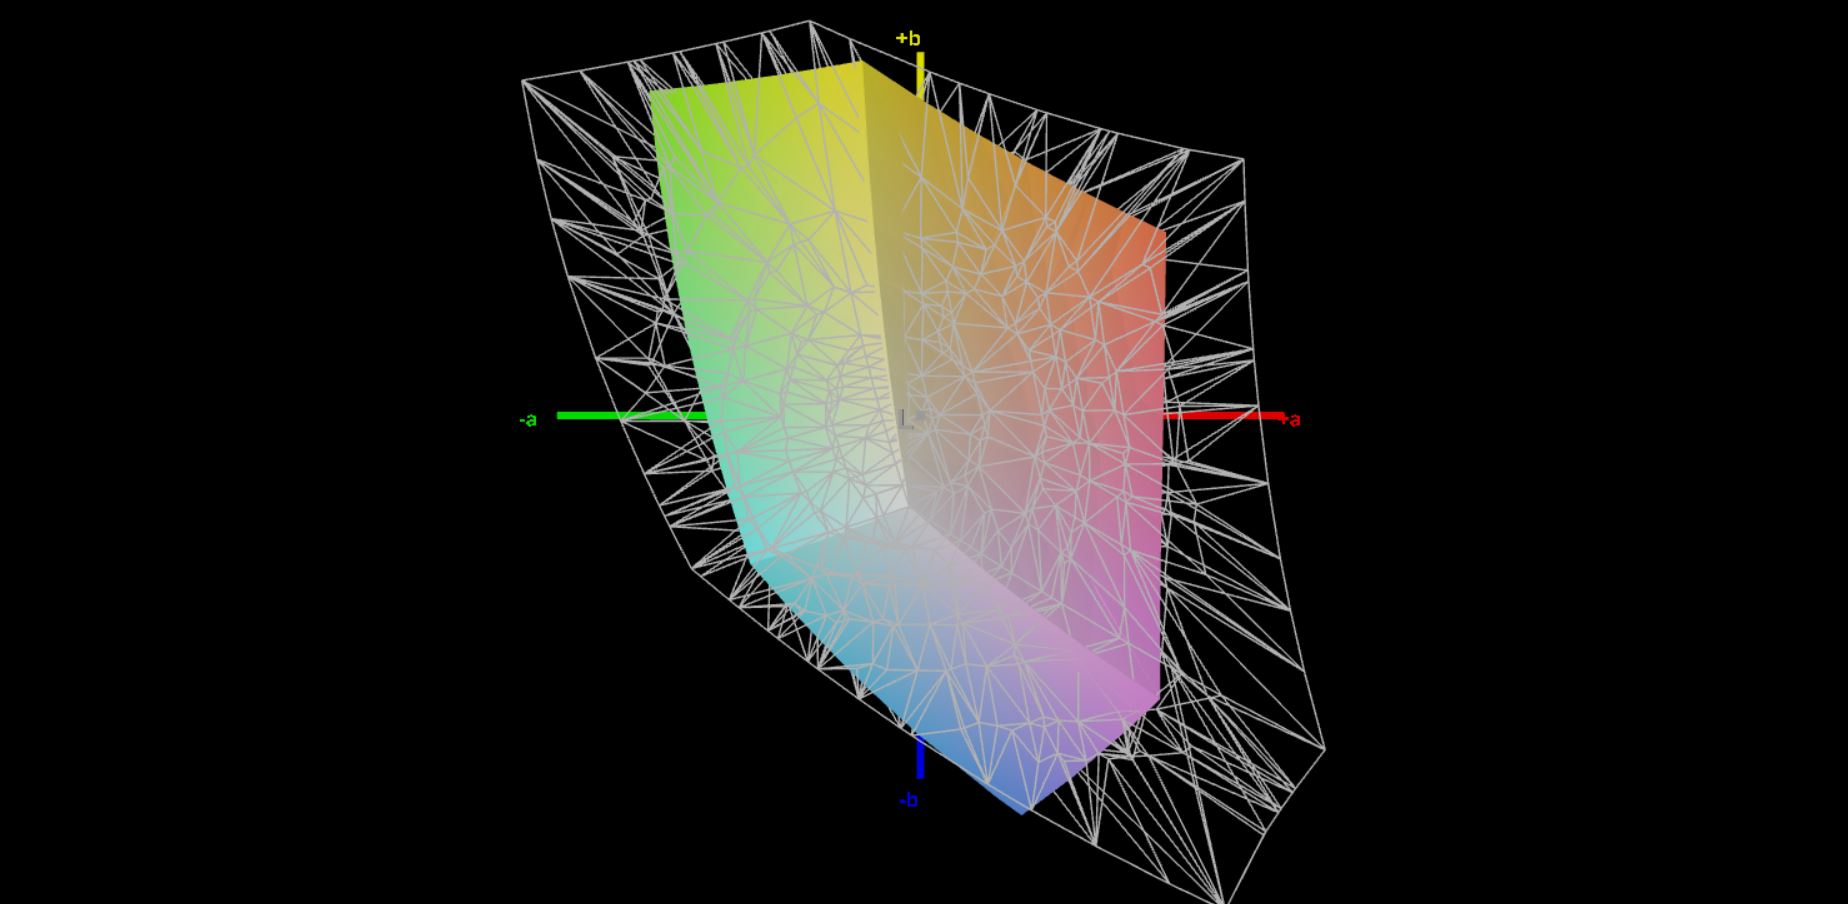
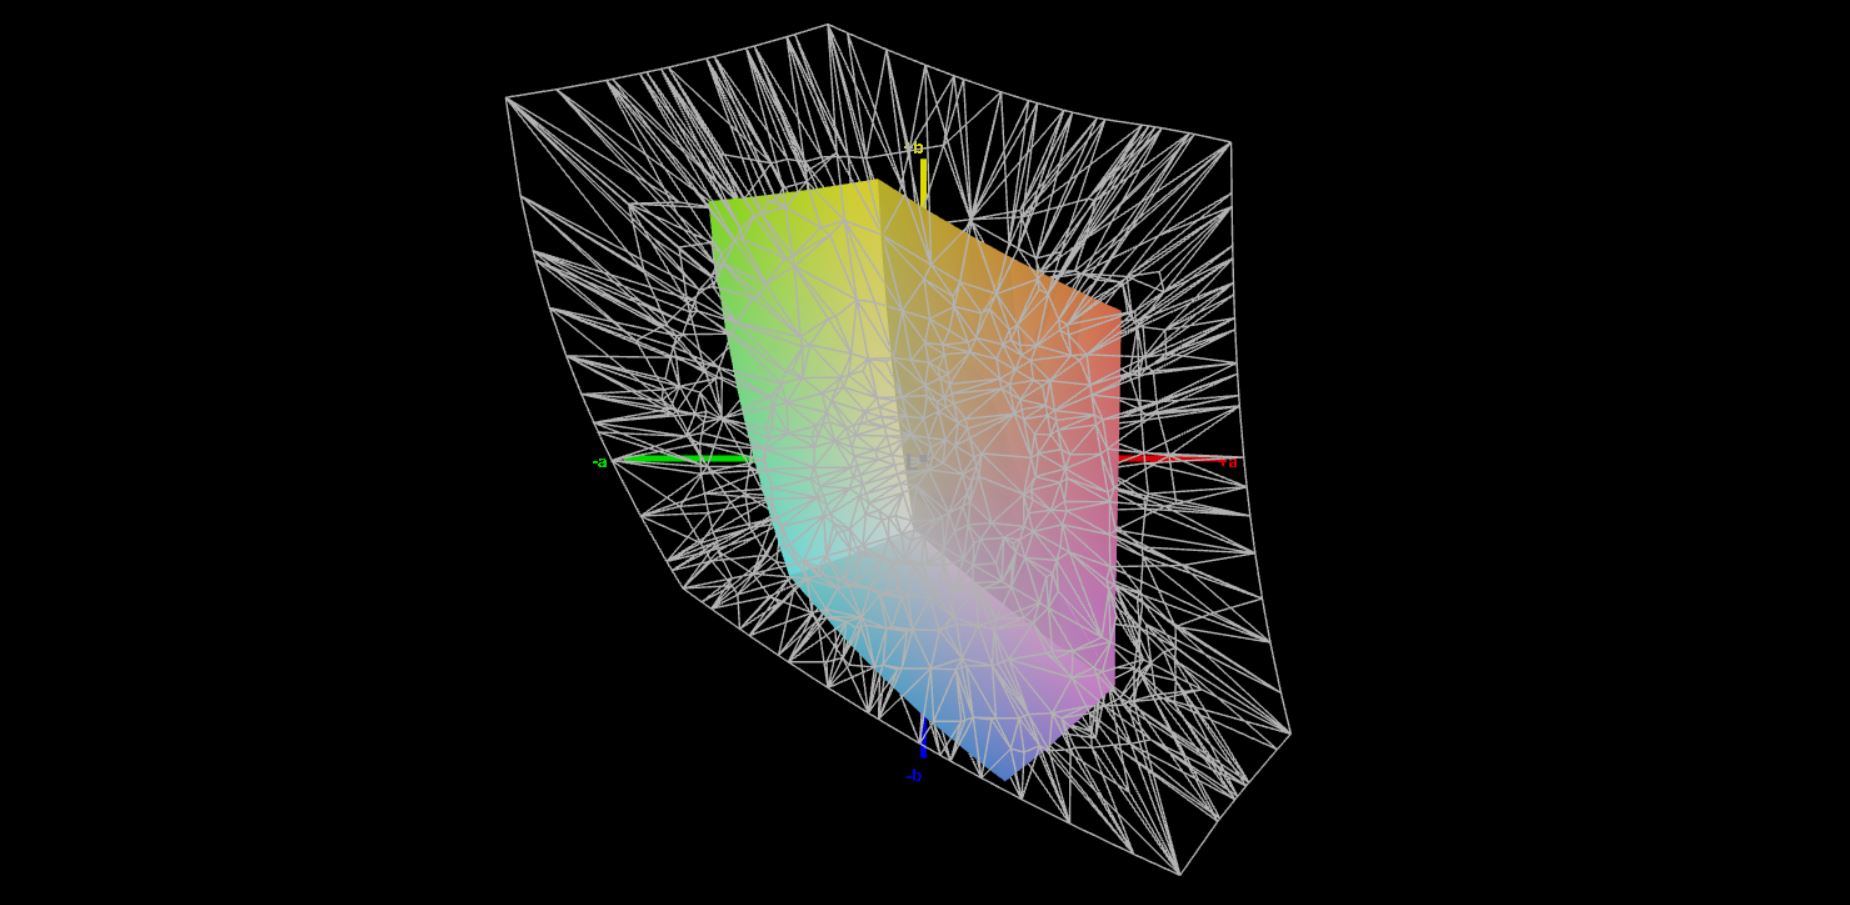
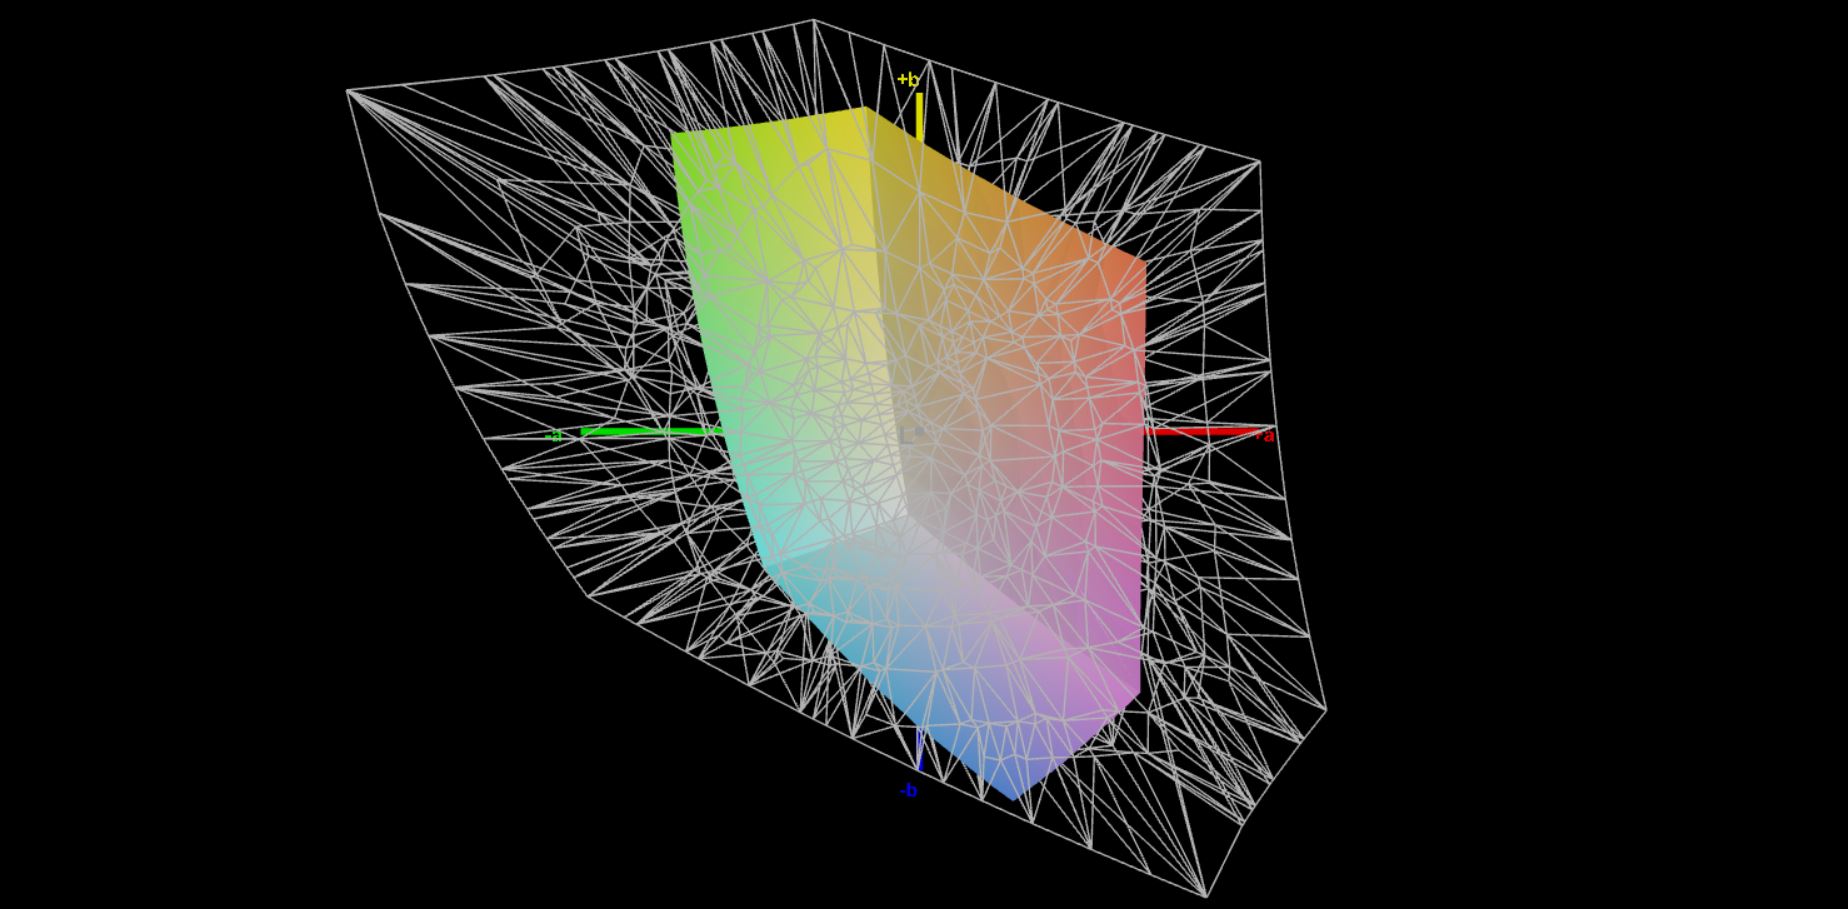
41.1% AdobeRGB 1998 (Argyll 3D)
59.6% sRGB (Argyll 3D)
39.7% Display P3 (Argyll 3D)
Gamma: 2.26
CCT: 6504 K
| Lenovo Ideapad Gaming 3 15IHU-82K1002RGE LEN156FHD, IPS, 1920x1080, 15.6" | Dell G15 5515 BOE092A, IPS, 1920x1080, 15.6" | Gigabyte G5 GD Chi Mei N156HRA-EA1, IPS, 1920x1080, 15.6" | Medion Erazer Deputy P25 Panda LM156LF-2F03, IPS, 1920x1080, 15.6" | Schenker XMG Focus 15 LG Philips LP156WFG-SPB5, IPS, 1920x1080, 15.6" | Lenovo Legion 5 15ACH-82JU00C6GE-FL B156HAN12.H, , 1920x1080, 15.6" | |
|---|---|---|---|---|---|---|
| Display | -3% | 5% | 0% | 62% | 64% | |
| Display P3 Coverage (%) | 39.7 | 39.1 -2% | 41.8 5% | 39.7 0% | 64.6 63% | 65.4 65% |
| sRGB Coverage (%) | 59.6 | 56.9 -5% | 62.3 5% | 59.7 0% | 95.3 60% | 96.3 62% |
| AdobeRGB 1998 Coverage (%) | 41.1 | 40.4 -2% | 43.2 5% | 41.1 0% | 66.5 62% | 67.5 64% |
| Response Times | 49% | 30% | 14% | 68% | 73% | |
| Response Time Grey 50% / Grey 80% * (ms) | 46.4 ? | 25.2 ? 46% | 34.4 ? 26% | 40.4 ? 13% | 18 ? 61% | 13.6 ? 71% |
| Response Time Black / White * (ms) | 35.2 ? | 16.8 ? 52% | 23.2 ? 34% | 30.4 ? 14% | 8.8 ? 75% | 9.2 ? 74% |
| PWM Frequency (Hz) | 200 ? | |||||
| Screen | -10% | 10% | 8% | 23% | 15% | |
| Brightness middle (cd/m²) | 307 | 278 -9% | 261 -15% | 283 -8% | 418 36% | 350 14% |
| Brightness (cd/m²) | 292 | 262 -10% | 246 -16% | 266 -9% | 376 29% | 350 20% |
| Brightness Distribution (%) | 88 | 83 -6% | 87 -1% | 85 -3% | 83 -6% | 96 9% |
| Black Level * (cd/m²) | 0.21 | 0.36 -71% | 0.19 10% | 0.2 5% | 0.41 -95% | 0.3 -43% |
| Contrast (:1) | 1462 | 772 -47% | 1374 -6% | 1415 -3% | 1020 -30% | 1167 -20% |
| Colorchecker dE 2000 * | 5.9 | 5.74 3% | 3.9 34% | 5.32 10% | 1.67 72% | 3.9 34% |
| Colorchecker dE 2000 max. * | 21.6 | 19.63 9% | 19.26 11% | 17.68 18% | 3.88 82% | 8.2 62% |
| Colorchecker dE 2000 calibrated * | 4.8 | 4.7 2% | 3.24 32% | 3.94 18% | 0.98 80% | 1.6 67% |
| Greyscale dE 2000 * | 4.9 | 3.1 37% | 2.7 45% | 2.9 41% | 2.9 41% | 5.5 -12% |
| Gamma | 2.26 97% | 2.011 109% | 2.248 98% | 2.062 107% | 2.26 97% | 2.15 102% |
| CCT | 6504 100% | 6207 105% | 6828 95% | 7167 91% | 6209 105% | 7414 88% |
| Total Average (Program / Settings) | 12% /
-0% | 15% /
12% | 7% /
7% | 51% /
38% | 51% /
33% |
* ... smaller is better
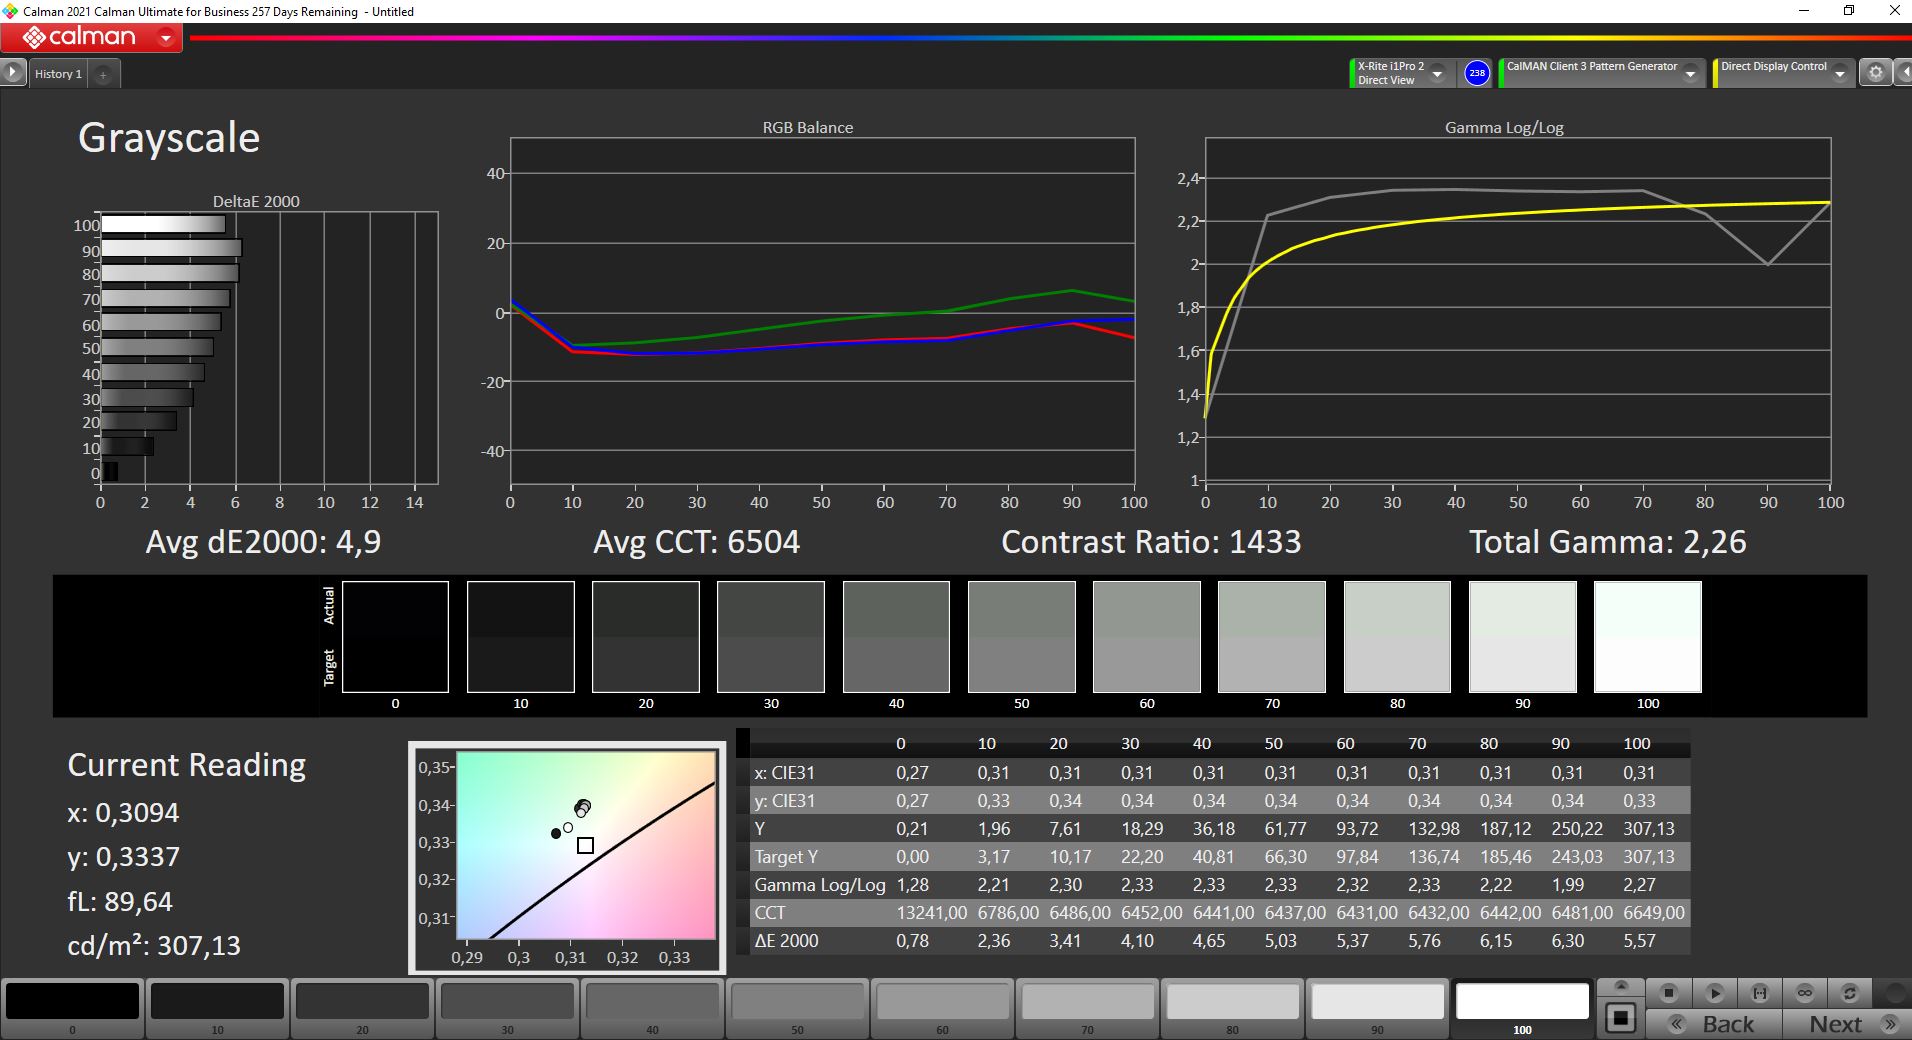
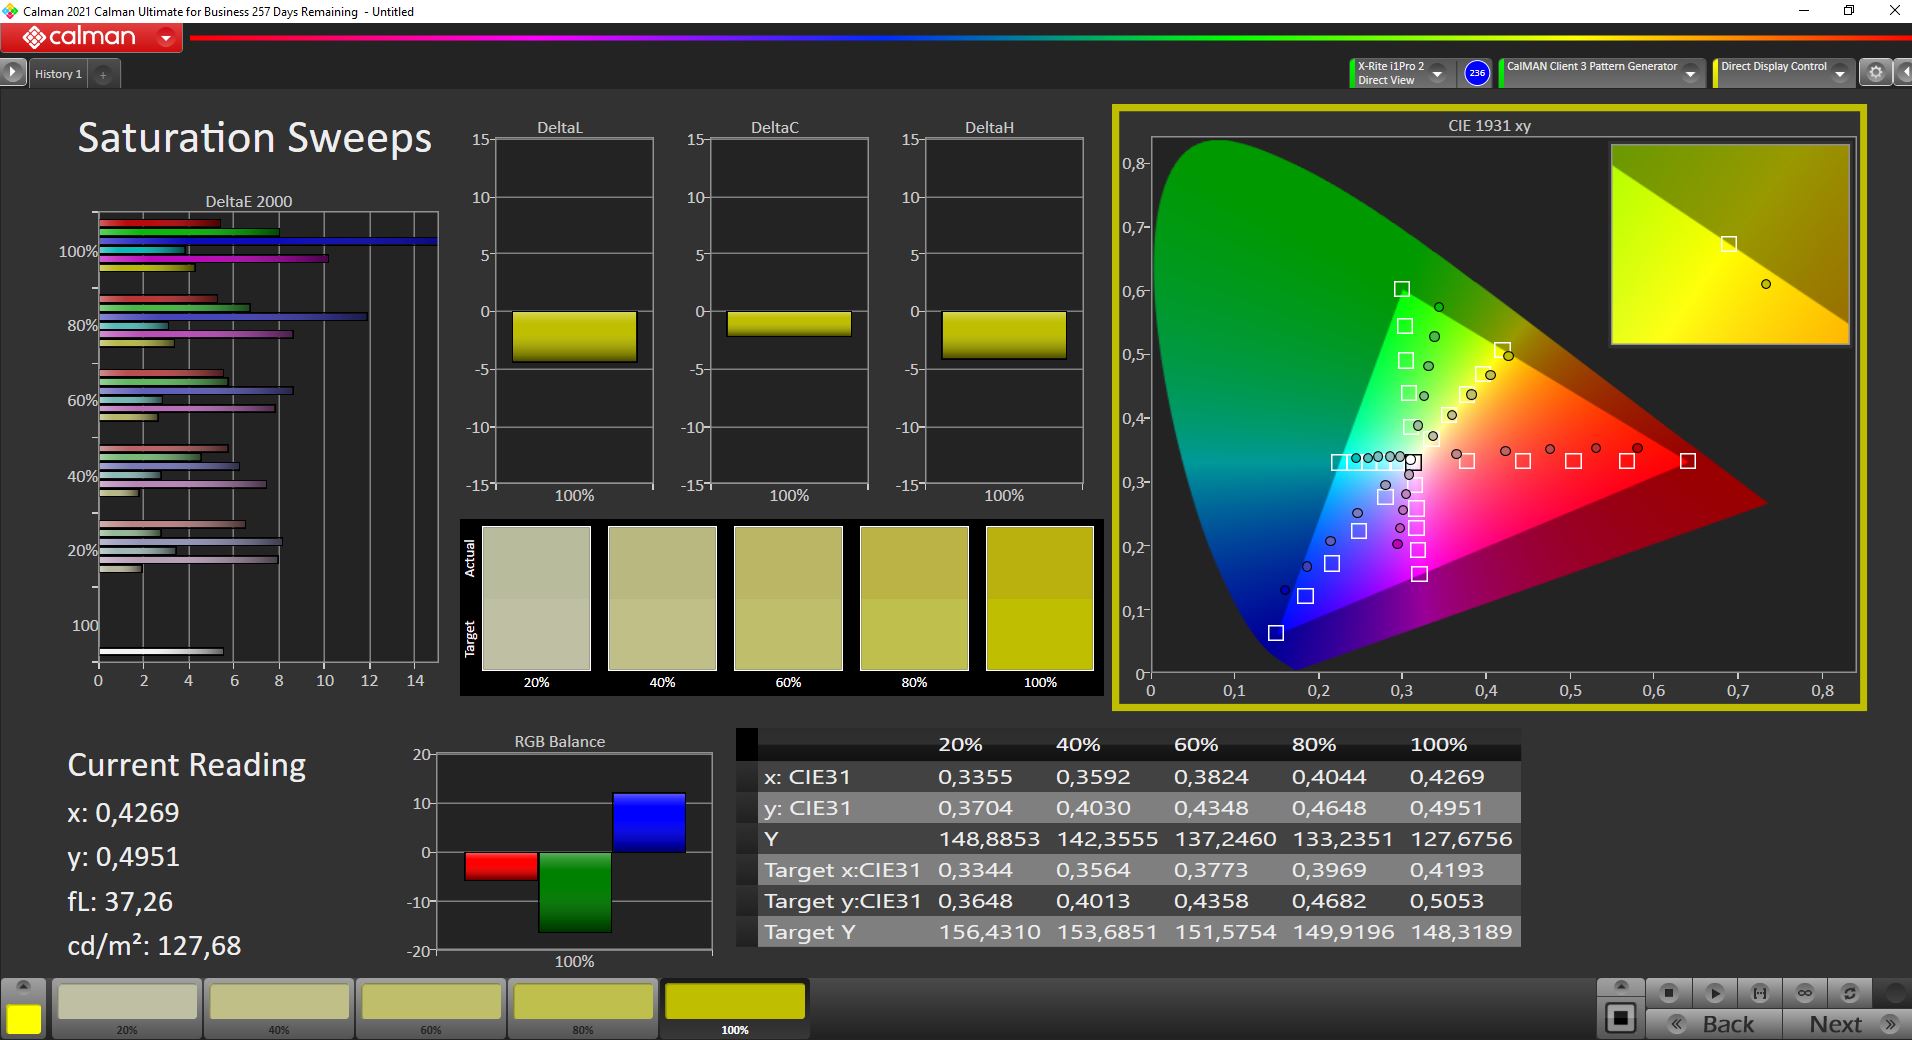
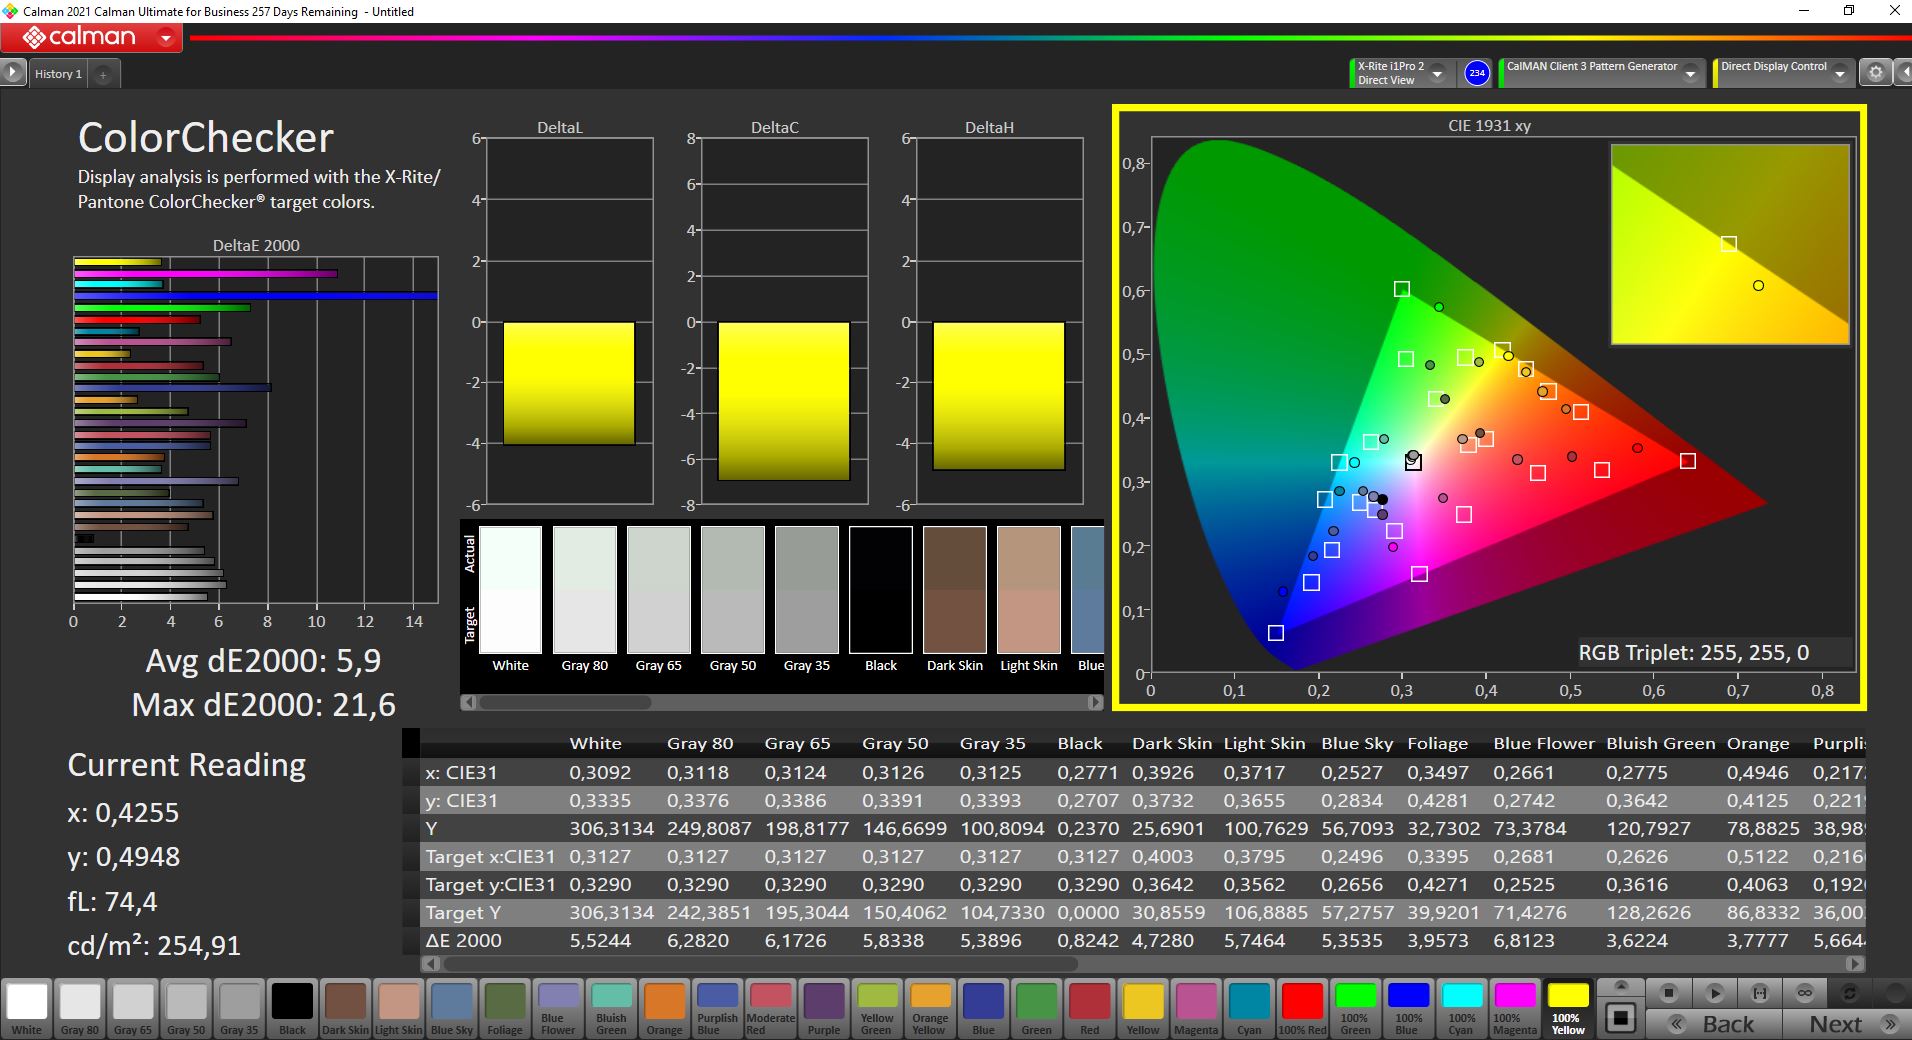
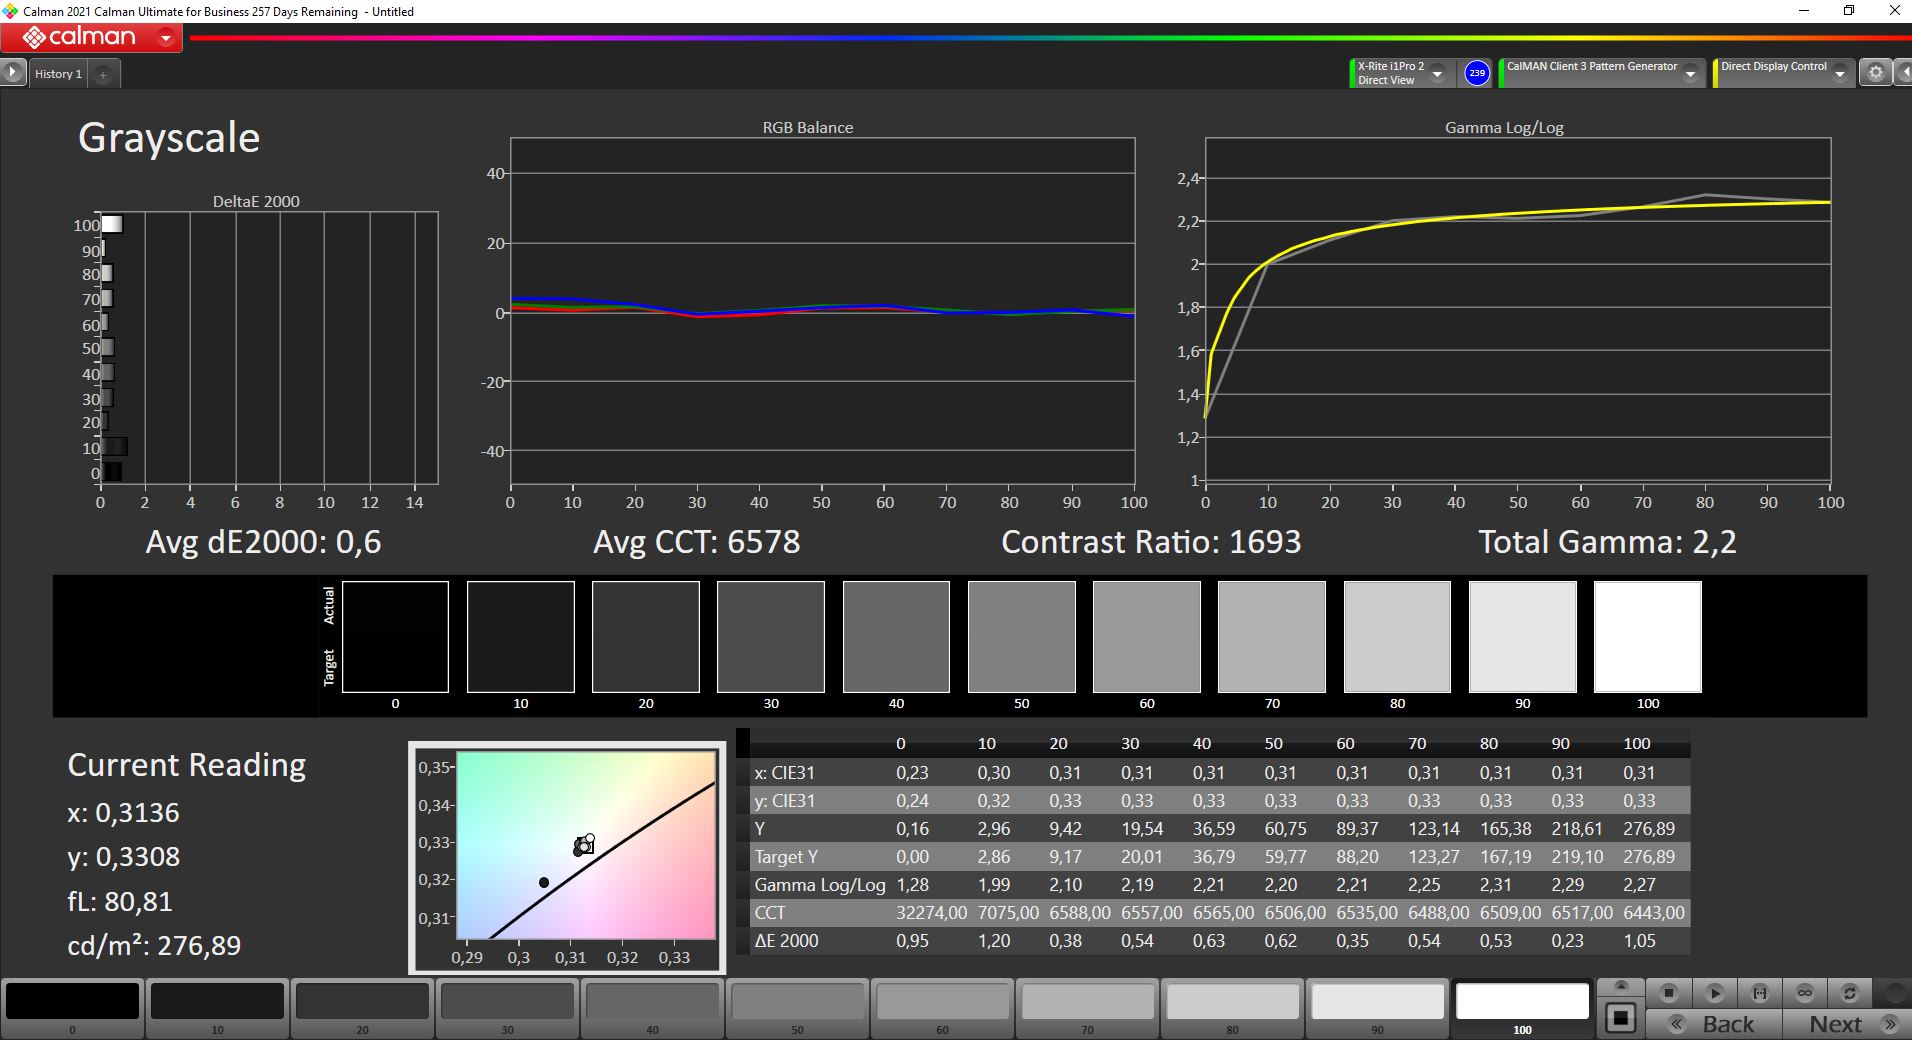
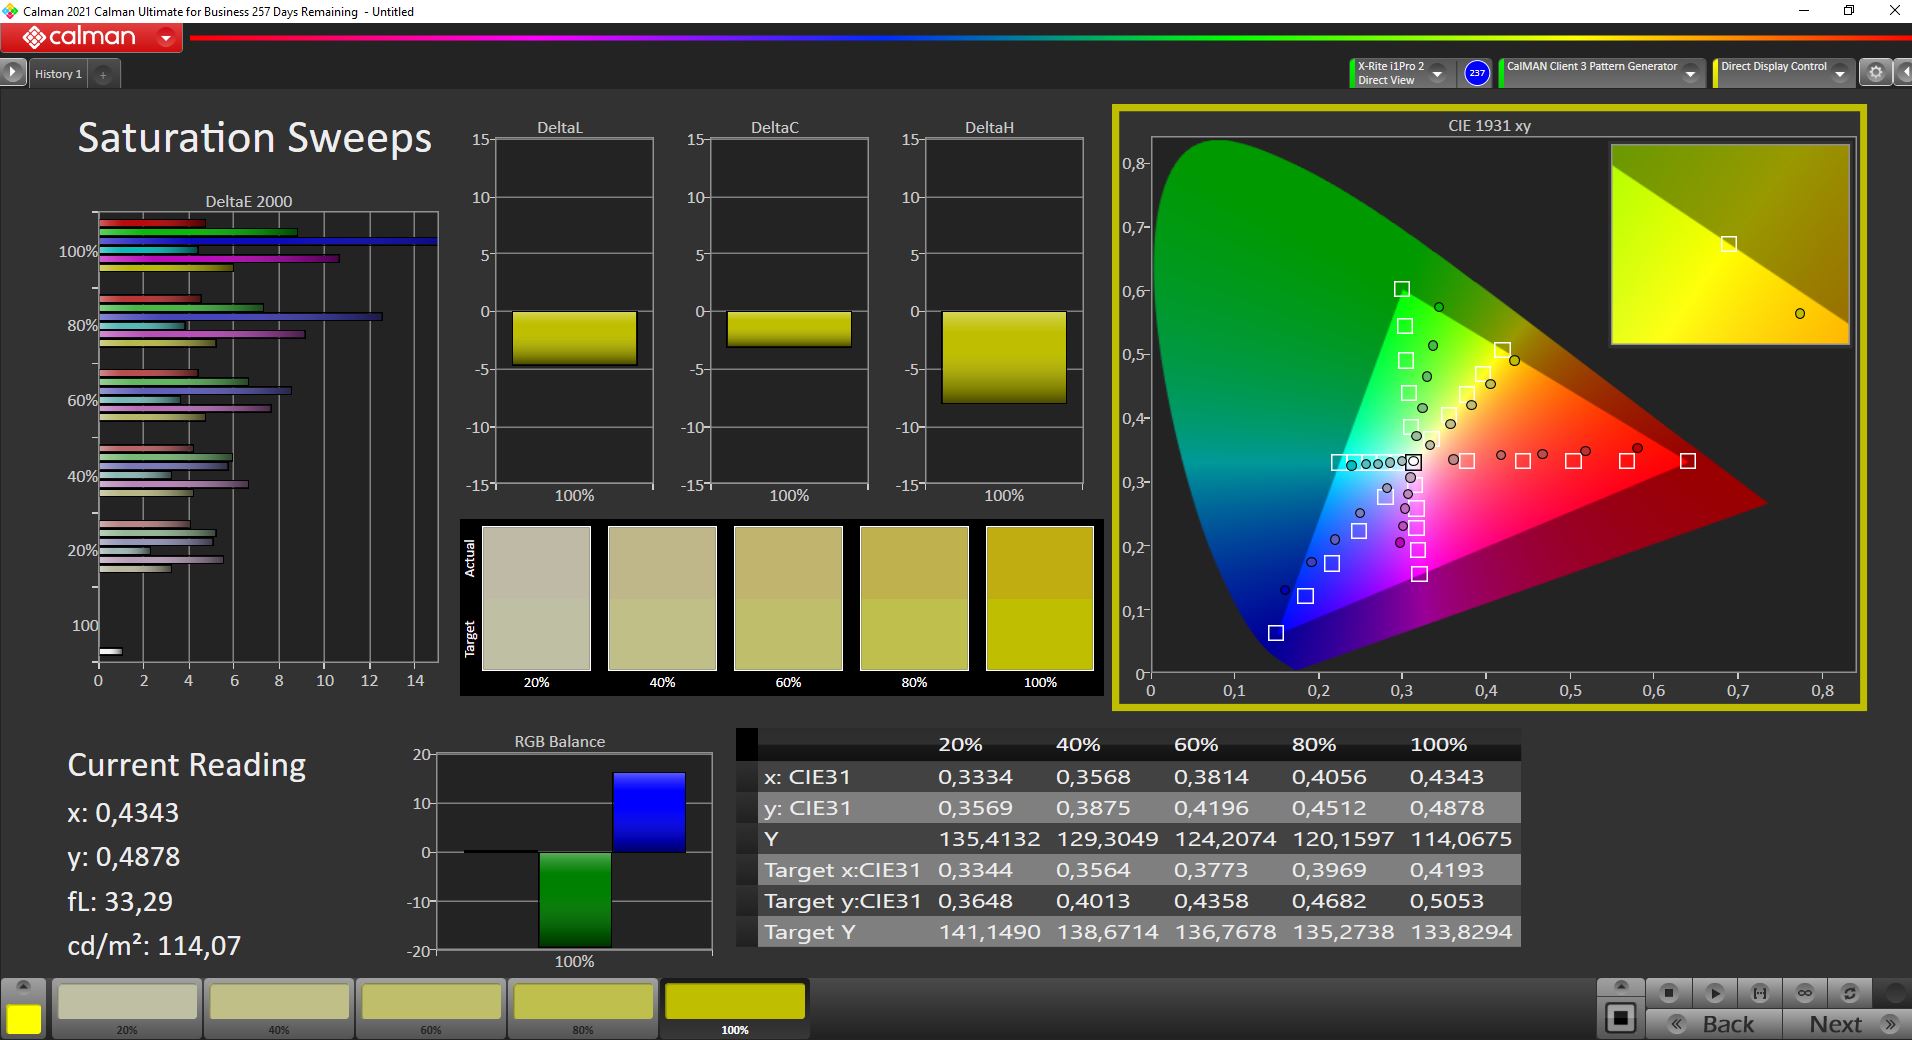
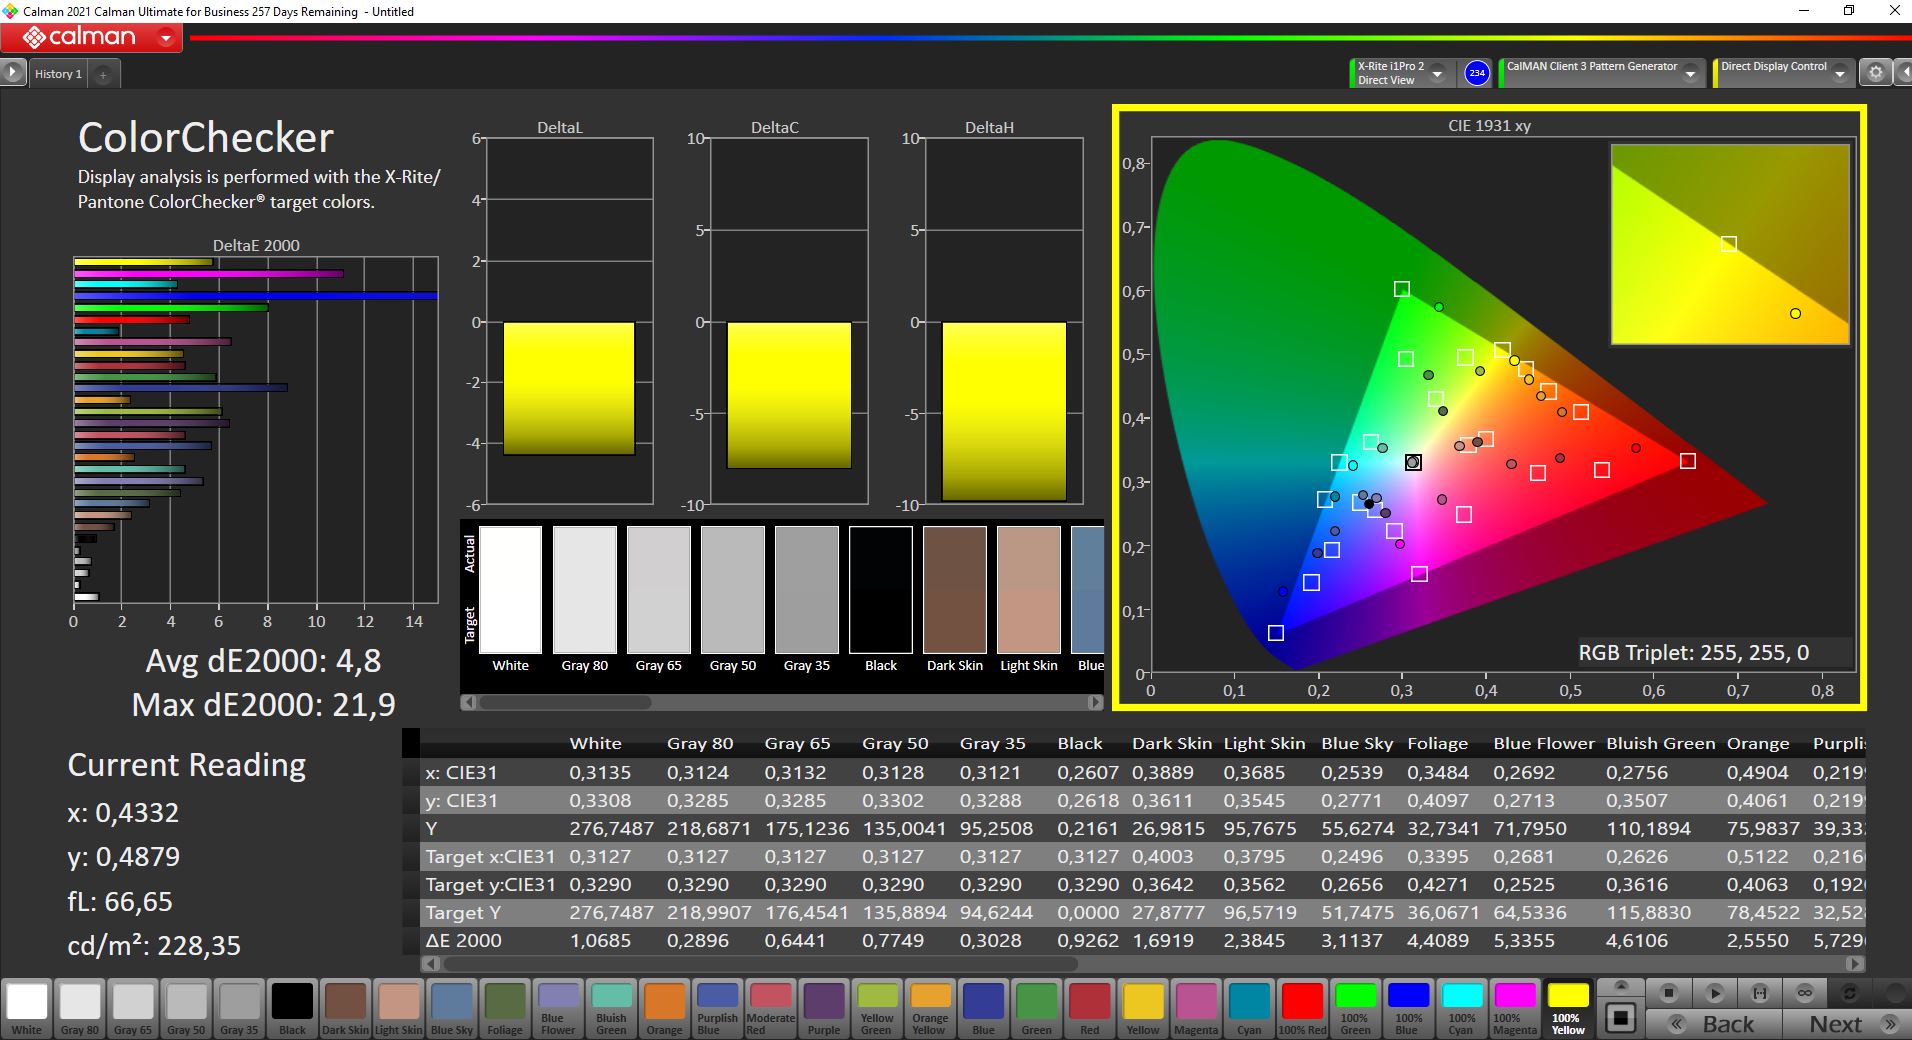
When analyzed using the professional CalMAN software (X-Rite i1 Pro 2) the low price of the IPS panel really showed. While its grayscale did not suffer from any form of noticeable color tint we found colors to be extremely inaccurate. We were able to improve upon grayscale through calibration, and as always you can find the resulting ICC profile for download above. Keep in mind that our calibration resulted in a slight decrease in overall brightness, and that we were unable to improve upon the display panel’s color accuracy at all. The display is simply incapable of better colors as can be witnessed by its relatively poor sRGB color space coverage of just 60 %. The display is thus not suitable for any form of photo editing.
Display Response Times
| ↔ Response Time Black to White | ||
|---|---|---|
| 35.2 ms ... rise ↗ and fall ↘ combined | ↗ 18.8 ms rise | 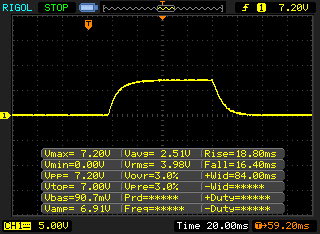 |
| ↘ 16.4 ms fall | ||
| The screen shows slow response rates in our tests and will be unsatisfactory for gamers. In comparison, all tested devices range from 0.1 (minimum) to 240 (maximum) ms. » 93 % of all devices are better. This means that the measured response time is worse than the average of all tested devices (19.9 ms). | ||
| ↔ Response Time 50% Grey to 80% Grey | ||
| 46.4 ms ... rise ↗ and fall ↘ combined | ↗ 21.2 ms rise | 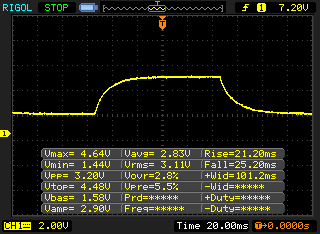 |
| ↘ 25.2 ms fall | ||
| The screen shows slow response rates in our tests and will be unsatisfactory for gamers. In comparison, all tested devices range from 0.165 (minimum) to 636 (maximum) ms. » 80 % of all devices are better. This means that the measured response time is worse than the average of all tested devices (31.1 ms). | ||
Screen Flickering / PWM (Pulse-Width Modulation)
| Screen flickering / PWM not detected | 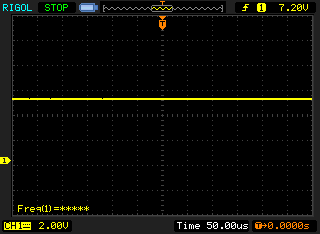 | ||
In comparison: 52 % of all tested devices do not use PWM to dim the display. If PWM was detected, an average of 7798 (minimum: 5 - maximum: 343500) Hz was measured. | |||
Thanks to its matte display coating the IdeaPad Gaming 3 can be used outdoors as long as it is not too bright. As is typical for IPS panels its viewing angles were very wide.

Performance – IdeaPad with Tiger Lake and RTX 3000
Test Conditions
Lenovo’s preloaded Vantage software comes with three power profiles: Silent, Auto, and Performance. In both Silent and Auto the GPU is limited to 60 W while Performance unlocks the full 90 W. Accordingly, we ran all our benchmarks with this profile selected. Keep in mind that Performance mode is not available on battery, which means that our battery tests were run in the Auto profile.
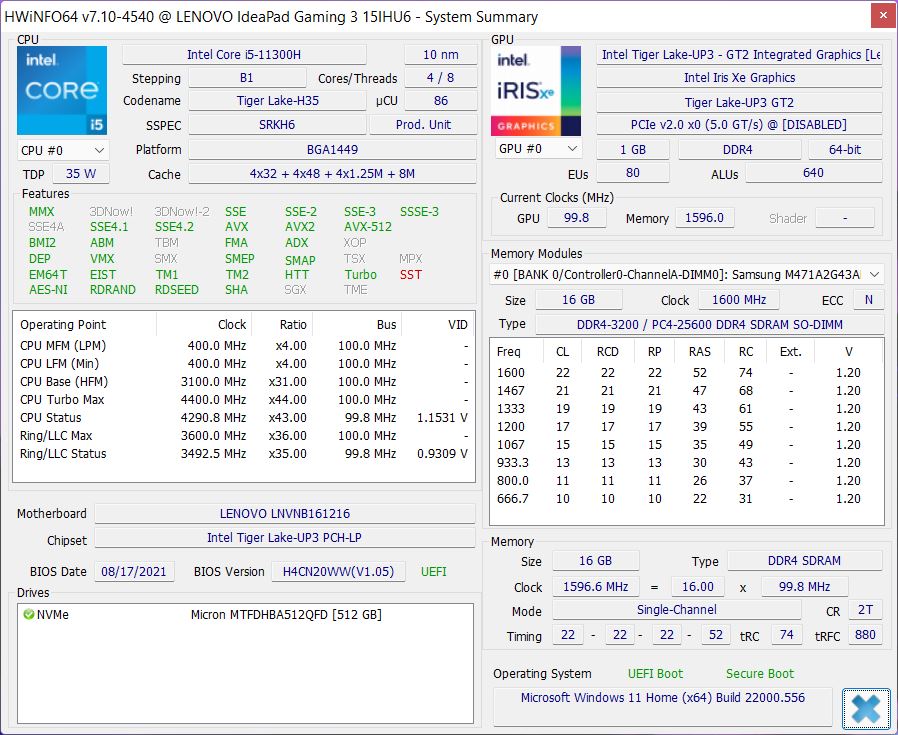
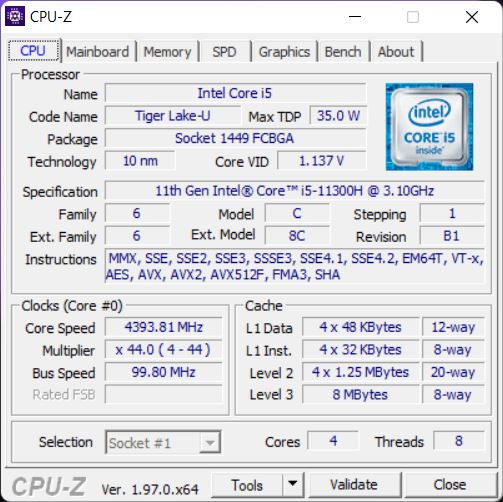
Processor
The Intel Tiger Lake H35 processor is an old friend. It is a slightly faster version of its Tiger Lake U siblings with four cores and a built-in Iris Xe GPU. Our review unit’s Core i5-11300H is rated at 42 W, and it thus performed very consistently even under long-lasting sustained load.
Cinebench R15 Multi Loop
Our benchmarks indicate that while the Core i5-11300H may be able to keep up with its competitors in single-core performance it is completely destroyed in multi-core scenarios. The H35 Tiger Lake’s biggest benefit, the Iris Xe GPU, is of no use in a laptop with dedicated GPU, and we would have preferred a different Tiger Lake CPU, such as for example the 6-core Core i5-11400H. As subsequent tests showed the device suffers immensely from its poor CPU performance, for example when it comes to gaming. Alternatively, the IdeaPad Gaming 3 is also available with an AMD Ryzen 5 5600H with a much higher multi-core performance.
On battery, the CPU is limited to just 25 W after a short while. Accordingly, it performs even worse in multi-core load situations. Additional CPU benchmarks can be found in our technology section.
Cinebench R23: Multi Core | Single Core
Cinebench R20: CPU (Multi Core) | CPU (Single Core)
Cinebench R15: CPU Multi 64Bit | CPU Single 64Bit
Blender: v2.79 BMW27 CPU
7-Zip 18.03: 7z b 4 | 7z b 4 -mmt1
Geekbench 5.5: Multi-Core | Single-Core
HWBOT x265 Benchmark v2.2: 4k Preset
LibreOffice : 20 Documents To PDF
R Benchmark 2.5: Overall mean
| CPU Performance rating | |
| Average of class Gaming | |
| Medion Erazer Deputy P25 | |
| Schenker XMG Focus 15 | |
| Lenovo Legion 5 15ACH-82JU00C6GE-FL | |
| Dell G15 5515 | |
| Gigabyte G5 GD | |
| Lenovo Ideapad Gaming 3 15IHU-82K1002RGE | |
| Average Intel Core i5-11300H | |
| Cinebench R23 / Multi Core | |
| Average of class Gaming (10488 - 40970, n=113, last 2 years) | |
| Lenovo Legion 5 15ACH-82JU00C6GE-FL | |
| Medion Erazer Deputy P25 | |
| Dell G15 5515 | |
| Schenker XMG Focus 15 | |
| Gigabyte G5 GD | |
| Lenovo Ideapad Gaming 3 15IHU-82K1002RGE | |
| Average Intel Core i5-11300H (3313 - 6581, n=10) | |
| Cinebench R23 / Single Core | |
| Average of class Gaming (1166 - 2356, n=113, last 2 years) | |
| Gigabyte G5 GD | |
| Medion Erazer Deputy P25 | |
| Dell G15 5515 | |
| Lenovo Legion 5 15ACH-82JU00C6GE-FL | |
| Schenker XMG Focus 15 | |
| Average Intel Core i5-11300H (1218 - 1431, n=11) | |
| Lenovo Ideapad Gaming 3 15IHU-82K1002RGE | |
| Cinebench R20 / CPU (Multi Core) | |
| Average of class Gaming (4029 - 16108, n=112, last 2 years) | |
| Lenovo Legion 5 15ACH-82JU00C6GE-FL | |
| Medion Erazer Deputy P25 | |
| Dell G15 5515 | |
| Schenker XMG Focus 15 | |
| Gigabyte G5 GD | |
| Lenovo Ideapad Gaming 3 15IHU-82K1002RGE | |
| Average Intel Core i5-11300H (1300 - 2533, n=10) | |
| Cinebench R20 / CPU (Single Core) | |
| Average of class Gaming (442 - 895, n=112, last 2 years) | |
| Gigabyte G5 GD | |
| Medion Erazer Deputy P25 | |
| Dell G15 5515 | |
| Lenovo Legion 5 15ACH-82JU00C6GE-FL | |
| Schenker XMG Focus 15 | |
| Average Intel Core i5-11300H (431 - 548, n=11) | |
| Lenovo Ideapad Gaming 3 15IHU-82K1002RGE | |
| Cinebench R15 / CPU Multi 64Bit | |
| Average of class Gaming (1578 - 6271, n=113, last 2 years) | |
| Lenovo Legion 5 15ACH-82JU00C6GE-FL | |
| Medion Erazer Deputy P25 | |
| Dell G15 5515 | |
| Schenker XMG Focus 15 | |
| Gigabyte G5 GD | |
| Lenovo Ideapad Gaming 3 15IHU-82K1002RGE | |
| Average Intel Core i5-11300H (632 - 990, n=11) | |
| Cinebench R15 / CPU Single 64Bit | |
| Average of class Gaming (188.8 - 343, n=112, last 2 years) | |
| Medion Erazer Deputy P25 | |
| Dell G15 5515 | |
| Lenovo Legion 5 15ACH-82JU00C6GE-FL | |
| Gigabyte G5 GD | |
| Schenker XMG Focus 15 | |
| Lenovo Ideapad Gaming 3 15IHU-82K1002RGE | |
| Average Intel Core i5-11300H (123 - 211, n=8) | |
| Blender / v2.79 BMW27 CPU | |
| Average Intel Core i5-11300H (466 - 862, n=10) | |
| Lenovo Ideapad Gaming 3 15IHU-82K1002RGE | |
| Gigabyte G5 GD | |
| Schenker XMG Focus 15 | |
| Dell G15 5515 | |
| Medion Erazer Deputy P25 | |
| Lenovo Legion 5 15ACH-82JU00C6GE-FL | |
| Average of class Gaming (80 - 330, n=110, last 2 years) | |
| 7-Zip 18.03 / 7z b 4 | |
| Average of class Gaming (33491 - 148086, n=111, last 2 years) | |
| Medion Erazer Deputy P25 | |
| Dell G15 5515 | |
| Lenovo Legion 5 15ACH-82JU00C6GE-FL | |
| Schenker XMG Focus 15 | |
| Gigabyte G5 GD | |
| Lenovo Ideapad Gaming 3 15IHU-82K1002RGE | |
| Average Intel Core i5-11300H (17573 - 26001, n=10) | |
| 7-Zip 18.03 / 7z b 4 -mmt1 | |
| Average of class Gaming (4199 - 7436, n=111, last 2 years) | |
| Dell G15 5515 | |
| Medion Erazer Deputy P25 | |
| Lenovo Legion 5 15ACH-82JU00C6GE-FL | |
| Schenker XMG Focus 15 | |
| Gigabyte G5 GD | |
| Average Intel Core i5-11300H (4603 - 4969, n=10) | |
| Lenovo Ideapad Gaming 3 15IHU-82K1002RGE | |
| Geekbench 5.5 / Multi-Core | |
| Average of class Gaming (6460 - 27010, n=111, last 2 years) | |
| Schenker XMG Focus 15 | |
| Lenovo Legion 5 15ACH-82JU00C6GE-FL | |
| Dell G15 5515 | |
| Medion Erazer Deputy P25 | |
| Gigabyte G5 GD | |
| Average Intel Core i5-11300H (3631 - 5499, n=10) | |
| Lenovo Ideapad Gaming 3 15IHU-82K1002RGE | |
| Geekbench 5.5 / Single-Core | |
| Average of class Gaming (986 - 2474, n=111, last 2 years) | |
| Gigabyte G5 GD | |
| Schenker XMG Focus 15 | |
| Medion Erazer Deputy P25 | |
| Lenovo Legion 5 15ACH-82JU00C6GE-FL | |
| Dell G15 5515 | |
| Average Intel Core i5-11300H (1342 - 1462, n=10) | |
| Lenovo Ideapad Gaming 3 15IHU-82K1002RGE | |
| HWBOT x265 Benchmark v2.2 / 4k Preset | |
| Average of class Gaming (11.5 - 44.3, n=111, last 2 years) | |
| Medion Erazer Deputy P25 | |
| Lenovo Legion 5 15ACH-82JU00C6GE-FL | |
| Dell G15 5515 | |
| Schenker XMG Focus 15 | |
| Gigabyte G5 GD | |
| Lenovo Ideapad Gaming 3 15IHU-82K1002RGE | |
| Average Intel Core i5-11300H (4.32 - 8.38, n=10) | |
| LibreOffice / 20 Documents To PDF | |
| Lenovo Legion 5 15ACH-82JU00C6GE-FL | |
| Dell G15 5515 | |
| Medion Erazer Deputy P25 | |
| Lenovo Ideapad Gaming 3 15IHU-82K1002RGE | |
| Average Intel Core i5-11300H (43.6 - 59.4, n=10) | |
| Average of class Gaming (19 - 88.8, n=111, last 2 years) | |
| Schenker XMG Focus 15 | |
| Gigabyte G5 GD | |
| R Benchmark 2.5 / Overall mean | |
| Average Intel Core i5-11300H (0.6 - 0.644, n=10) | |
| Lenovo Ideapad Gaming 3 15IHU-82K1002RGE | |
| Schenker XMG Focus 15 | |
| Gigabyte G5 GD | |
| Lenovo Legion 5 15ACH-82JU00C6GE-FL | |
| Medion Erazer Deputy P25 | |
| Dell G15 5515 | |
| Average of class Gaming (0.3439 - 0.759, n=112, last 2 years) | |
* ... smaller is better
AIDA64: FP32 Ray-Trace | FPU Julia | CPU SHA3 | CPU Queen | FPU SinJulia | FPU Mandel | CPU AES | CPU ZLib | FP64 Ray-Trace | CPU PhotoWorxx
| Performance rating | |
| Average of class Gaming | |
| Lenovo Legion 5 15ACH-82JU00C6GE-FL | |
| Dell G15 5515 | |
| Medion Erazer Deputy P25 | |
| Gigabyte G5 GD | |
| Lenovo Ideapad Gaming 3 15IHU-82K1002RGE | |
| Average Intel Core i5-11300H | |
| AIDA64 / FP32 Ray-Trace | |
| Average of class Gaming (10227 - 85542, n=110, last 2 years) | |
| Lenovo Legion 5 15ACH-82JU00C6GE-FL | |
| Medion Erazer Deputy P25 | |
| Dell G15 5515 | |
| Gigabyte G5 GD | |
| Lenovo Ideapad Gaming 3 15IHU-82K1002RGE | |
| Average Intel Core i5-11300H (6128 - 8440, n=9) | |
| AIDA64 / FPU Julia | |
| Average of class Gaming (51376 - 238426, n=110, last 2 years) | |
| Lenovo Legion 5 15ACH-82JU00C6GE-FL | |
| Medion Erazer Deputy P25 | |
| Dell G15 5515 | |
| Gigabyte G5 GD | |
| Lenovo Ideapad Gaming 3 15IHU-82K1002RGE | |
| Average Intel Core i5-11300H (25739 - 33986, n=9) | |
| AIDA64 / CPU SHA3 | |
| Average of class Gaming (2180 - 9817, n=110, last 2 years) | |
| Lenovo Legion 5 15ACH-82JU00C6GE-FL | |
| Medion Erazer Deputy P25 | |
| Dell G15 5515 | |
| Gigabyte G5 GD | |
| Lenovo Ideapad Gaming 3 15IHU-82K1002RGE | |
| Average Intel Core i5-11300H (1773 - 2286, n=9) | |
| AIDA64 / CPU Queen | |
| Average of class Gaming (49785 - 173351, n=101, last 2 years) | |
| Lenovo Legion 5 15ACH-82JU00C6GE-FL | |
| Medion Erazer Deputy P25 | |
| Dell G15 5515 | |
| Gigabyte G5 GD | |
| Lenovo Ideapad Gaming 3 15IHU-82K1002RGE | |
| Average Intel Core i5-11300H (41257 - 49312, n=9) | |
| AIDA64 / FPU SinJulia | |
| Average of class Gaming (4424 - 33636, n=110, last 2 years) | |
| Medion Erazer Deputy P25 | |
| Dell G15 5515 | |
| Lenovo Legion 5 15ACH-82JU00C6GE-FL | |
| Gigabyte G5 GD | |
| Lenovo Ideapad Gaming 3 15IHU-82K1002RGE | |
| Average Intel Core i5-11300H (3925 - 4677, n=9) | |
| AIDA64 / FPU Mandel | |
| Average of class Gaming (25115 - 128721, n=110, last 2 years) | |
| Lenovo Legion 5 15ACH-82JU00C6GE-FL | |
| Medion Erazer Deputy P25 | |
| Dell G15 5515 | |
| Gigabyte G5 GD | |
| Lenovo Ideapad Gaming 3 15IHU-82K1002RGE | |
| Average Intel Core i5-11300H (15820 - 20669, n=9) | |
| AIDA64 / CPU AES | |
| Lenovo Legion 5 15ACH-82JU00C6GE-FL | |
| Dell G15 5515 | |
| Average of class Gaming (39258 - 247074, n=110, last 2 years) | |
| Gigabyte G5 GD | |
| Lenovo Ideapad Gaming 3 15IHU-82K1002RGE | |
| Average Intel Core i5-11300H (37694 - 71519, n=9) | |
| Medion Erazer Deputy P25 | |
| AIDA64 / CPU ZLib | |
| Average of class Gaming (574 - 2531, n=110, last 2 years) | |
| Lenovo Legion 5 15ACH-82JU00C6GE-FL | |
| Medion Erazer Deputy P25 | |
| Dell G15 5515 | |
| Gigabyte G5 GD | |
| Lenovo Ideapad Gaming 3 15IHU-82K1002RGE | |
| Average Intel Core i5-11300H (269 - 390, n=9) | |
| AIDA64 / FP64 Ray-Trace | |
| Average of class Gaming (5509 - 45446, n=110, last 2 years) | |
| Medion Erazer Deputy P25 | |
| Lenovo Legion 5 15ACH-82JU00C6GE-FL | |
| Dell G15 5515 | |
| Gigabyte G5 GD | |
| Lenovo Ideapad Gaming 3 15IHU-82K1002RGE | |
| Average Intel Core i5-11300H (3322 - 4613, n=9) | |
| AIDA64 / CPU PhotoWorxx | |
| Average of class Gaming (12271 - 89891, n=110, last 2 years) | |
| Gigabyte G5 GD | |
| Average Intel Core i5-11300H (9705 - 38002, n=9) | |
| Dell G15 5515 | |
| Lenovo Legion 5 15ACH-82JU00C6GE-FL | |
| Medion Erazer Deputy P25 | |
| Lenovo Ideapad Gaming 3 15IHU-82K1002RGE | |
System Performance
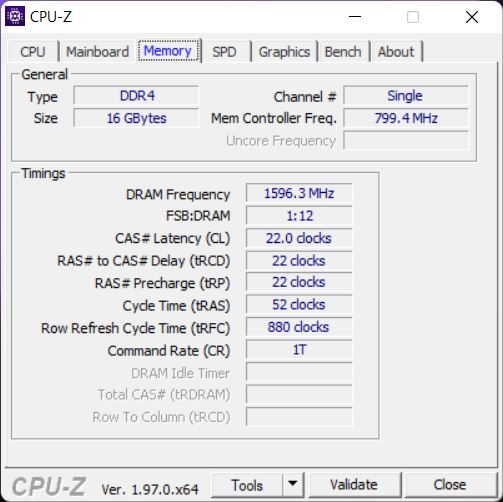
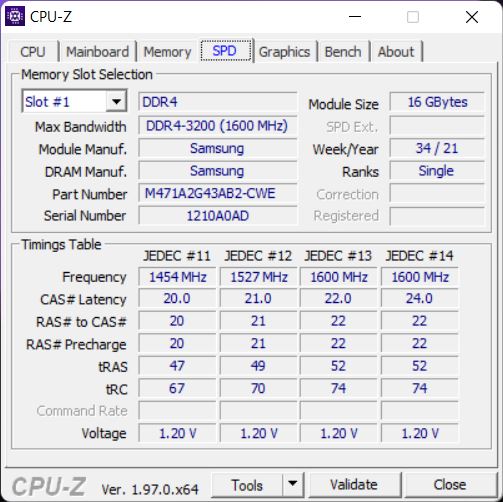
Subjectively, the device performed very well and responded instantaneously to input. In contrast, it often performed rather poorly in benchmarks and only managed to secure one of the spots at the far end of the list. This poor performance is partly due the fact that the CPU features no more than four cores and partly because our review unit was equipped with just a single DDR4-3200 RAM module running in single-channel mode.
CrossMark: Overall | Productivity | Creativity | Responsiveness
| PCMark 10 / Score | |
| Average of class Gaming (5828 - 11574, n=96, last 2 years) | |
| Medion Erazer Deputy P25 | |
| Lenovo Legion 5 15ACH-82JU00C6GE-FL | |
| Schenker XMG Focus 15 | |
| Dell G15 5515 | |
| Gigabyte G5 GD | |
| Lenovo Ideapad Gaming 3 15IHU-82K1002RGE | |
| Average Intel Core i5-11300H, NVIDIA GeForce RTX 3050 Ti Laptop GPU (5442 - 5641, n=2) | |
| PCMark 10 / Essentials | |
| Average of class Gaming (8810 - 12600, n=100, last 2 years) | |
| Lenovo Legion 5 15ACH-82JU00C6GE-FL | |
| Schenker XMG Focus 15 | |
| Medion Erazer Deputy P25 | |
| Dell G15 5515 | |
| Gigabyte G5 GD | |
| Average Intel Core i5-11300H, NVIDIA GeForce RTX 3050 Ti Laptop GPU (8524 - 8829, n=2) | |
| Lenovo Ideapad Gaming 3 15IHU-82K1002RGE | |
| PCMark 10 / Productivity | |
| Average of class Gaming (6845 - 18766, n=98, last 2 years) | |
| Lenovo Legion 5 15ACH-82JU00C6GE-FL | |
| Lenovo Ideapad Gaming 3 15IHU-82K1002RGE | |
| Medion Erazer Deputy P25 | |
| Schenker XMG Focus 15 | |
| Dell G15 5515 | |
| Gigabyte G5 GD | |
| Average Intel Core i5-11300H, NVIDIA GeForce RTX 3050 Ti Laptop GPU (7664 - 9112, n=2) | |
| PCMark 10 / Digital Content Creation | |
| Average of class Gaming (7602 - 19657, n=98, last 2 years) | |
| Medion Erazer Deputy P25 | |
| Schenker XMG Focus 15 | |
| Lenovo Legion 5 15ACH-82JU00C6GE-FL | |
| Dell G15 5515 | |
| Gigabyte G5 GD | |
| Average Intel Core i5-11300H, NVIDIA GeForce RTX 3050 Ti Laptop GPU (6271 - 6462, n=2) | |
| Lenovo Ideapad Gaming 3 15IHU-82K1002RGE | |
| CrossMark / Overall | |
| Average of class Gaming (1366 - 2409, n=98, last 2 years) | |
| Lenovo Ideapad Gaming 3 15IHU-82K1002RGE | |
| Average Intel Core i5-11300H, NVIDIA GeForce RTX 3050 Ti Laptop GPU (n=1) | |
| CrossMark / Productivity | |
| Average of class Gaming (1386 - 2254, n=98, last 2 years) | |
| Lenovo Ideapad Gaming 3 15IHU-82K1002RGE | |
| Average Intel Core i5-11300H, NVIDIA GeForce RTX 3050 Ti Laptop GPU (n=1) | |
| CrossMark / Creativity | |
| Average of class Gaming (1343 - 2729, n=98, last 2 years) | |
| Lenovo Ideapad Gaming 3 15IHU-82K1002RGE | |
| Average Intel Core i5-11300H, NVIDIA GeForce RTX 3050 Ti Laptop GPU (n=1) | |
| CrossMark / Responsiveness | |
| Average of class Gaming (1226 - 2334, n=98, last 2 years) | |
| Lenovo Ideapad Gaming 3 15IHU-82K1002RGE | |
| Average Intel Core i5-11300H, NVIDIA GeForce RTX 3050 Ti Laptop GPU (n=1) | |
| PCMark 10 Score | 5641 points | |
Help | ||
| AIDA64 / Memory Copy | |
| Average of class Gaming (21750 - 129946, n=110, last 2 years) | |
| Gigabyte G5 GD | |
| Dell G15 5515 | |
| Medion Erazer Deputy P25 | |
| Lenovo Legion 5 15ACH-82JU00C6GE-FL | |
| Average Intel Core i5-11300H (19947 - 60141, n=9) | |
| Lenovo Ideapad Gaming 3 15IHU-82K1002RGE | |
| AIDA64 / Memory Read | |
| Average of class Gaming (22956 - 118858, n=110, last 2 years) | |
| Gigabyte G5 GD | |
| Dell G15 5515 | |
| Lenovo Legion 5 15ACH-82JU00C6GE-FL | |
| Medion Erazer Deputy P25 | |
| Average Intel Core i5-11300H (22688 - 62684, n=9) | |
| Lenovo Ideapad Gaming 3 15IHU-82K1002RGE | |
| AIDA64 / Memory Write | |
| Average of class Gaming (22297 - 135096, n=110, last 2 years) | |
| Gigabyte G5 GD | |
| Average Intel Core i5-11300H (20959 - 65245, n=9) | |
| Medion Erazer Deputy P25 | |
| Dell G15 5515 | |
| Lenovo Legion 5 15ACH-82JU00C6GE-FL | |
| Lenovo Ideapad Gaming 3 15IHU-82K1002RGE | |
| AIDA64 / Memory Latency | |
| Average of class Gaming (75.3 - 259, n=110, last 2 years) | |
| Gigabyte G5 GD | |
| Lenovo Ideapad Gaming 3 15IHU-82K1002RGE | |
| Average Intel Core i5-11300H (76.3 - 93.6, n=9) | |
| Lenovo Legion 5 15ACH-82JU00C6GE-FL | |
| Medion Erazer Deputy P25 | |
| Dell G15 5515 | |
* ... smaller is better
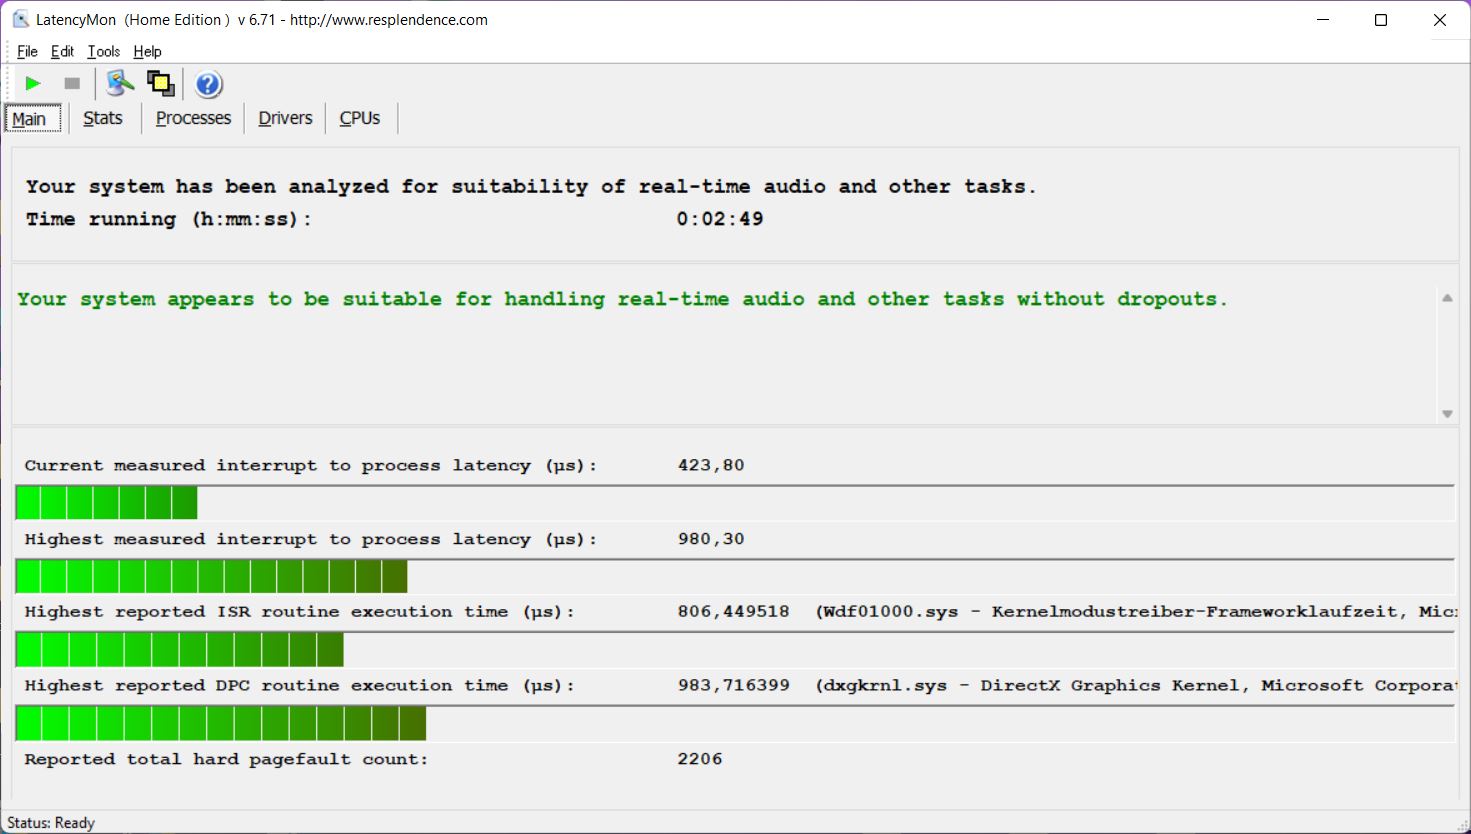
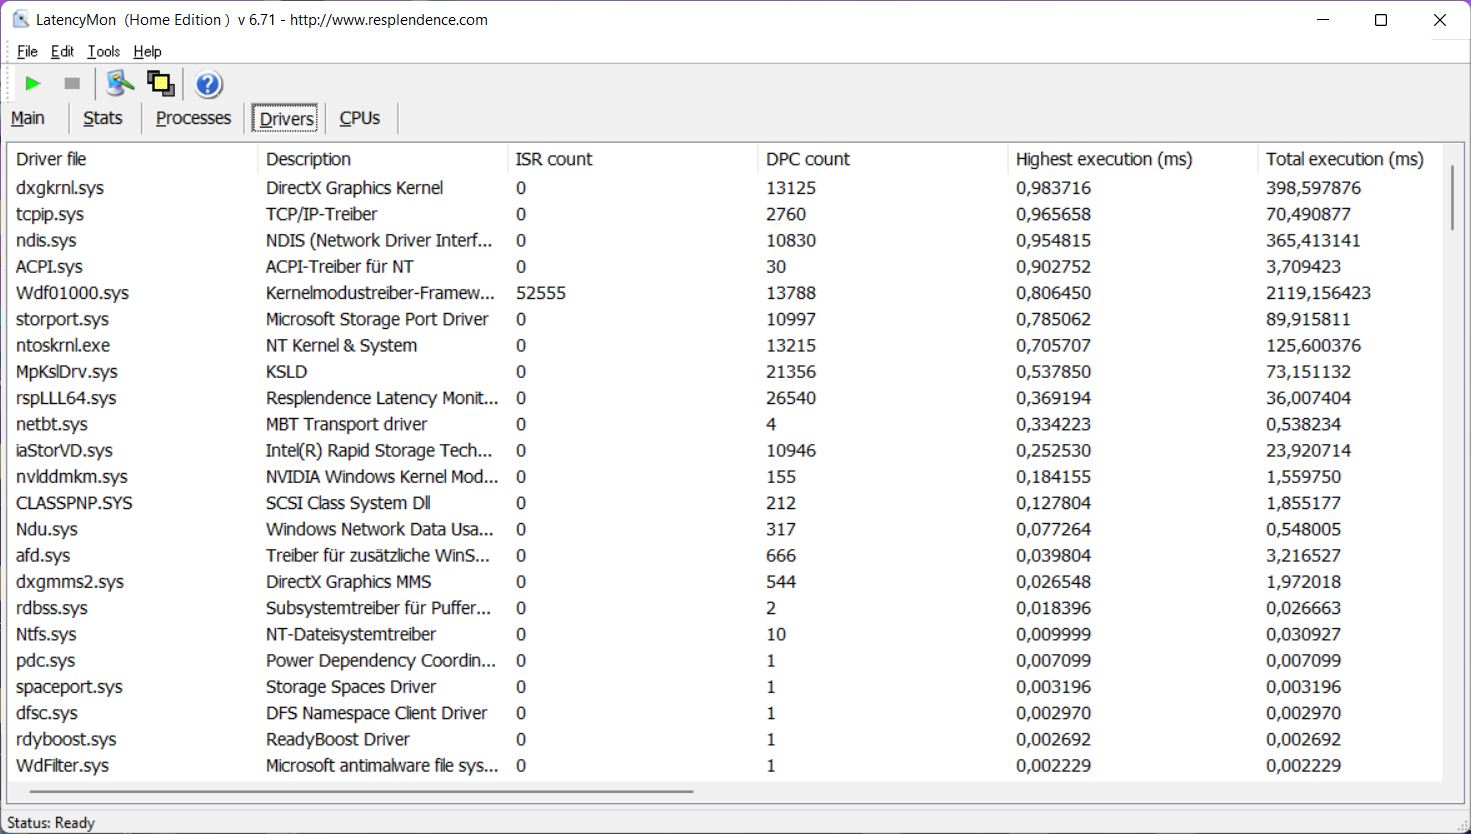
DPC Latencies
Our latency test revealed no major issues with the most recent BIOS available at the time of writing. With that said we did encounter a few dropped frames during our 4K video playback test.
| DPC Latencies / LatencyMon - interrupt to process latency (max), Web, Youtube, Prime95 | |
| Medion Erazer Deputy P25 | |
| Lenovo Ideapad Gaming 3 15IHU-82K1002RGE | |
| Lenovo Legion 5 15ACH-82JU00C6GE-FL | |
| Dell G15 5515 | |
| Schenker XMG Focus 15 | |
| Gigabyte G5 GD | |
* ... smaller is better
Storage Devices
Inside the IdeaPad Gaming 3 we find an M.2-2280 SSD made by Micron connected to a PCIe 3.0 x4 interface. It performed fast enough for everyday use but not particularly fast when compared to its competitors. After first boot we found a total of 424 GB of free space on the 512 GB SSD, and the device also features a secondary 2.5-inch slot. Note: all SKUs sold in the United States feature a 1 TB hard drive paired with a 256 GB SSD by default. Additional SSD benchmarks can be found here.

* ... smaller is better
Sustained Read: DiskSpd Read Loop, Queue Depth 8
Graphics Performance
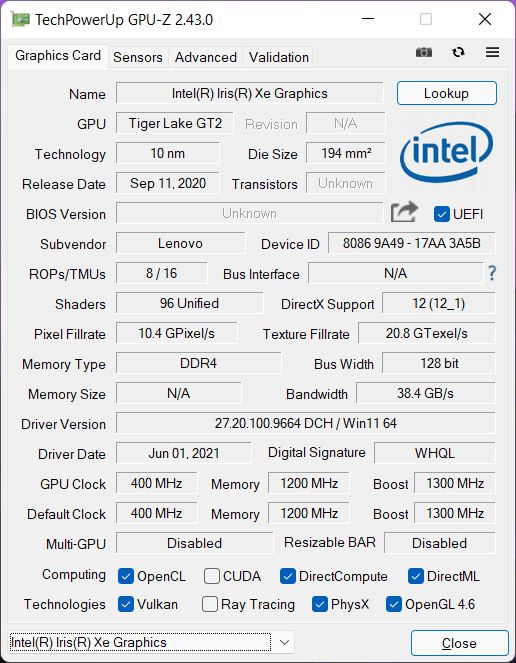
The IdeaPad Gaming 3 supports Nvidia Optimus for fully automatic load-based GPU switching between the dedicated and the integrated GPU. However, it lacks support for MUX (Advanced Optimus), and the Vantage app does not support GPU pinning to the dedicated GeForce chip. The only supported form of GPU pinning is via the BIOS setup which allows disabling the dedicated GPU and using the integrated Iris Xe exclusively.
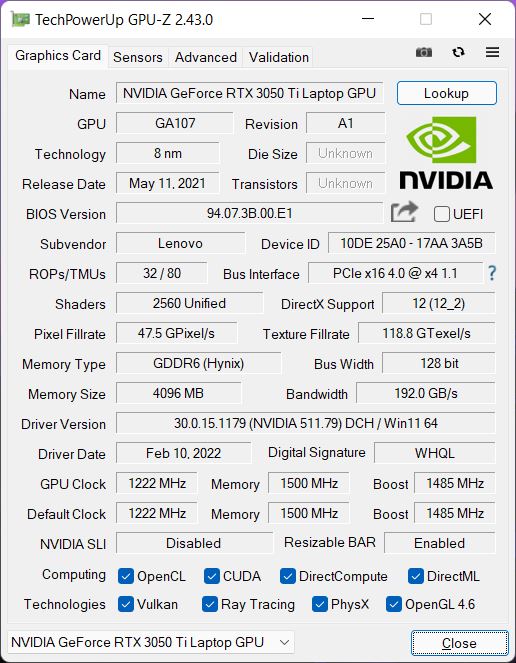
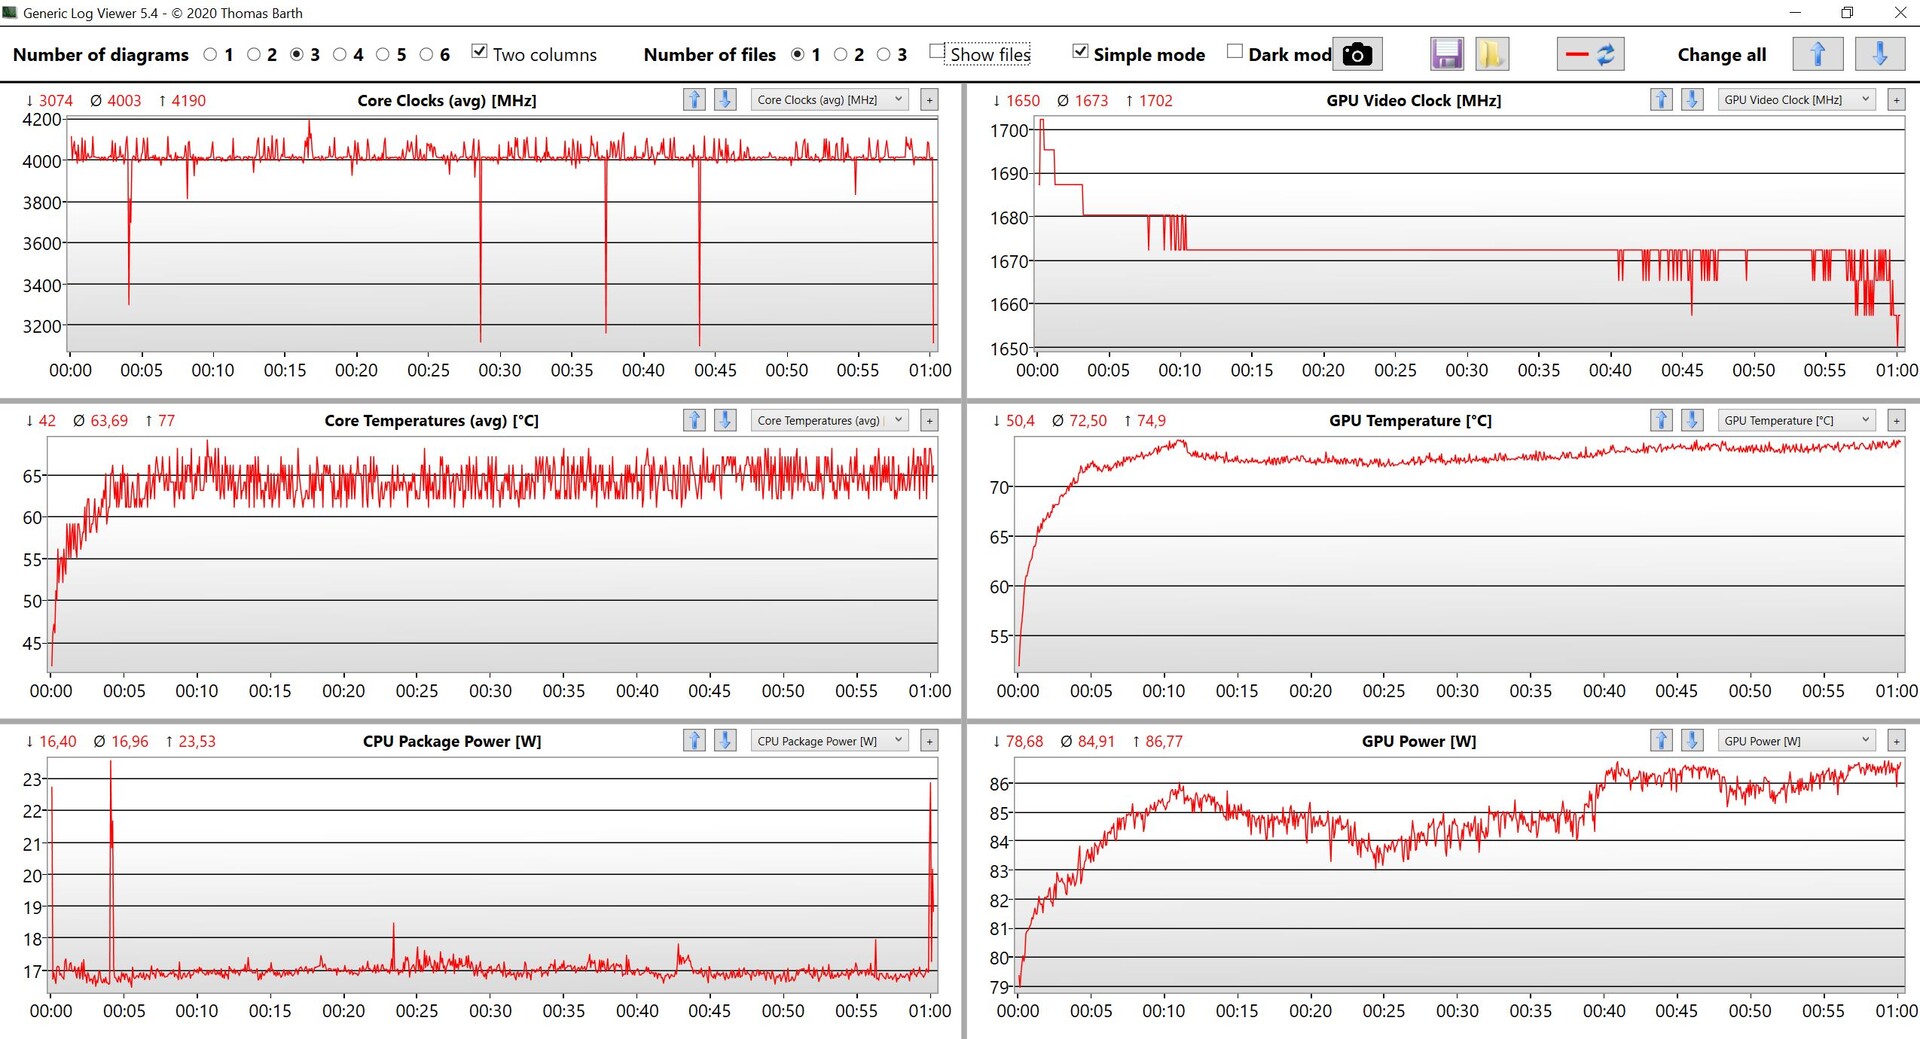
The GeForce RTX 3050 Ti chip installed is the fastest available model with a 90 W TGP and a maximum clock speed of 1,702 MHz. In our benchmarks, the device performed above average for an RTX 3050 Ti device. That being said various RTX 3050 Ti and RTX 3060-equipped competitors have managed to outperform the IdeaPad Gaming 3 slightly. GPU performance is consistent over time, and the IdeaPad Gaming 3 completed the Time Spy stress test with a score of 98.5 %.
GPU performance is limited to just 30 W on battery. Accordingly, the IdeaPad Gaming 3 suffers a 50 % performance loss (2,815 vs, 5,677 in Time Spy Graphics). Additional GPU benchmarks can be found in our technology section.
| 3DMark 11 Performance | 15615 points | |
| 3DMark Cloud Gate Standard Score | 26518 points | |
| 3DMark Fire Strike Score | 11894 points | |
| 3DMark Time Spy Score | 5512 points | |
Help | ||
Gaming Performance
On Paper, gaming performance should be decent with even current games, such as Cyberpunk 2077, running smoothly in highest settings. However, as we already noted during our CPU benchmarks, the comparatively slow CPU is chiefly responsible for the IdeaPad Gaming 3 performing slightly worse than most of its competitors. During our Witcher 3 loop we were able to discover that graphics performance remained consistent over long periods of time. On battery, Witcher 3 Ultra dropped from 47 FPS to just 32 FPS. Additional gaming benchmarks can be found here.
| The Witcher 3 | |
| 1920x1080 High Graphics & Postprocessing (Nvidia HairWorks Off) | |
| Average of class Gaming (181 - 341, n=3, last 2 years) | |
| Lenovo Legion 5 15ACH-82JU00C6GE-FL | |
| Medion Erazer Deputy P25 | |
| Schenker XMG Focus 15 | |
| Dell G15 5515 | |
| Gigabyte G5 GD | |
| Lenovo Ideapad Gaming 3 15IHU-82K1002RGE | |
| Average NVIDIA GeForce RTX 3050 Ti Laptop GPU (30 - 110, n=26) | |
| 1920x1080 Ultra Graphics & Postprocessing (HBAO+) | |
| Average of class Gaming (95 - 240, n=8, last 2 years) | |
| Medion Erazer Deputy P25 | |
| Lenovo Legion 5 15ACH-82JU00C6GE-FL (Ultra Performance) | |
| Lenovo Legion 5 15ACH-82JU00C6GE-FL (Auto) | |
| Lenovo Legion 5 15ACH-82JU00C6GE-FL (Eco) | |
| Dell G15 5515 | |
| Schenker XMG Focus 15 | |
| Gigabyte G5 GD | |
| Average NVIDIA GeForce RTX 3050 Ti Laptop GPU (19 - 58.5, n=29) | |
| Lenovo Ideapad Gaming 3 15IHU-82K1002RGE | |
| Final Fantasy XV Benchmark | |
| 1920x1080 High Quality | |
| Average of class Gaming (41 - 215, n=104, last 2 years) | |
| Lenovo Legion 5 15ACH-82JU00C6GE-FL (1.3) | |
| Medion Erazer Deputy P25 | |
| Schenker XMG Focus 15 | |
| Dell G15 5515 (1.3) | |
| Average NVIDIA GeForce RTX 3050 Ti Laptop GPU (23.5 - 106, n=24) | |
| Gigabyte G5 GD (1.3) | |
| Lenovo Ideapad Gaming 3 15IHU-82K1002RGE (1.3) | |
| 1920x1080 Standard Quality | |
| Average of class Gaming (85.7 - 236, n=90, last 2 years) | |
| Lenovo Legion 5 15ACH-82JU00C6GE-FL (1.3) | |
| Schenker XMG Focus 15 | |
| Dell G15 5515 (1.3) | |
| Gigabyte G5 GD (1.3) | |
| Average NVIDIA GeForce RTX 3050 Ti Laptop GPU (33.4 - 106, n=24) | |
| Lenovo Ideapad Gaming 3 15IHU-82K1002RGE (1.3) | |
| Strange Brigade | |
| 1920x1080 high AA:high AF:8 | |
| Average of class Gaming (129.5 - 485, n=80, last 2 years) | |
| Medion Erazer Deputy P25 (1.47.22.14 D3D12) | |
| Schenker XMG Focus 15 (1.47.22.14 D3D12) | |
| Dell G15 5515 (1.47.22.14 D3D12) | |
| Lenovo Ideapad Gaming 3 15IHU-82K1002RGE (1.47.22.14 D3D12) | |
| Gigabyte G5 GD (1.47.22.14 D3D12) | |
| Average NVIDIA GeForce RTX 3050 Ti Laptop GPU (79.2 - 117.3, n=23) | |
| 1920x1080 ultra AA:ultra AF:16 | |
| Average of class Gaming (76.3 - 456, n=94, last 2 years) | |
| Medion Erazer Deputy P25 (1.47.22.14 D3D12) | |
| Dell G15 5515 (1.47.22.14 D3D12) | |
| Schenker XMG Focus 15 (1.47.22.14 D3D12) | |
| Gigabyte G5 GD (1.47.22.14 D3D12) | |
| Lenovo Ideapad Gaming 3 15IHU-82K1002RGE (1.47.22.14 D3D12) | |
| Average NVIDIA GeForce RTX 3050 Ti Laptop GPU (34.8 - 101.3, n=25) | |
| F1 2021 | |
| 1920x1080 High Preset AA:T AF:16x | |
| Lenovo Legion 5 15ACH-82JU00C6GE-FL | |
| Dell G15 5515 (807588) | |
| Gigabyte G5 GD (824817) | |
| Average NVIDIA GeForce RTX 3050 Ti Laptop GPU (68 - 131, n=11) | |
| Lenovo Ideapad Gaming 3 15IHU-82K1002RGE (852849) | |
| 1920x1080 Ultra High Preset + Raytracing AA:T AF:16x | |
| Lenovo Legion 5 15ACH-82JU00C6GE-FL | |
| Dell G15 5515 (807588) | |
| Gigabyte G5 GD (824817) | |
| Average NVIDIA GeForce RTX 3050 Ti Laptop GPU (44.4 - 69, n=11) | |
| Lenovo Ideapad Gaming 3 15IHU-82K1002RGE (852849) | |
Witcher 3 FPS Graph
| low | med. | high | ultra | |
|---|---|---|---|---|
| GTA V (2015) | 134 | 118 | 85.6 | 55 |
| The Witcher 3 (2015) | 172 | 136 | 91 | 47.1 |
| Dota 2 Reborn (2015) | 115 | 103 | 94.5 | 90.6 |
| Final Fantasy XV Benchmark (2018) | 98.9 | 68.9 | 47.9 | |
| X-Plane 11.11 (2018) | 87.5 | 72 | 61 | |
| Far Cry 5 (2018) | 88 | 67 | 66 | 62 |
| Strange Brigade (2018) | 208 | 129 | 106 | 90 |
| F1 2021 (2021) | 157 | 102 | 82.3 | 44.4 |
| GRID Legends (2022) | 91 | 84 | 73 | 56 |
| Cyberpunk 2077 1.6 (2022) | 55 | 50 | 39 | 37 |
Emissions – Agreeable Lenovo Gaming Laptop
Noise Emissions
The fan’s performance can be easily adjusted to your liking thanks to the three available power profiles. For example, you can expect occasional noticeable noise emissions with the Performance profile enabled and are better off selecting the Silent profile if you insist on ultimate silence with no fan or other noise such as coil whine.
Under load, we found significant differences between noise emissions while gaming and noise emissions during our stress test torturing both CPU and GPU to their fullest. When gaming, the IdeaPad remained comparatively quiet at just 43 dB(A) even with Performance profile enabled. However, we strongly suggest testing your games in the other two power profiles as well as some of you might benefit from quieter fans without sacrificing too much performance. The following table depicts fan noise emissions in all three profiles during both games and our stress test.
| Scenario | Silent | Auto | Performance |
|---|---|---|---|
| Witcher 3 Ultra | 35.2 dB(A) (46 FPS) | 39.8 dB(A) (47 FPS) | 43.5 dB(A) (47 FPS) |
| Cyberpunk 2077 1.5 Ultra | 35.2 dB(A) (27 FPS) | 39.8 dB(A) (29 FPS) | 43.5 dB(A) (37 FPS) |
| Stress test | 35.2 dB(A) | 48.3 dB(A) | 53.1 dB(A) |
Noise level
| Idle |
| 23.9 / 26.8 / 26.8 dB(A) |
| Load |
| 43.5 / 53.1 dB(A) |
 | ||
30 dB silent 40 dB(A) audible 50 dB(A) loud |
||
min: | ||
| Lenovo Ideapad Gaming 3 15IHU-82K1002RGE GeForce RTX 3050 Ti Laptop GPU, i5-11300H, Micron 2210 MTFDHBA512QFD | Dell G15 5515 GeForce RTX 3050 Ti Laptop GPU, R7 5800H, Samsung PM991a MZ9LQ512HBLU-00BD1 | Gigabyte G5 GD GeForce RTX 3050 4GB Laptop GPU, i5-11400H, ESR512GTLG-E6GBTNB4 | Medion Erazer Deputy P25 GeForce RTX 3060 Laptop GPU, R7 5800H, Phison E12S-512GB-Phison-SSD-BICS4 | Schenker XMG Focus 15 GeForce RTX 3050 Ti Laptop GPU, i7-11800H, Samsung SSD 970 EVO Plus 1TB | Lenovo Legion 5 15ACH-82JU00C6GE-FL GeForce RTX 3060 Laptop GPU, R7 5800H, Micron 2300 512GB MTFDHBA512TDV | |
|---|---|---|---|---|---|---|
| Noise | -1% | -14% | -16% | -21% | -12% | |
| off / environment * (dB) | 23.9 | 24 -0% | 24 -0% | 25 -5% | 24 -0% | 24.2 -1% |
| Idle Minimum * (dB) | 23.9 | 25 -5% | 29 -21% | 27 -13% | 25 -5% | 29 -21% |
| Idle Average * (dB) | 26.8 | 26 3% | 30 -12% | 29 -8% | 30 -12% | 29 -8% |
| Idle Maximum * (dB) | 26.8 | 30 -12% | 32 -19% | 31 -16% | 43 -60% | 29 -8% |
| Load Average * (dB) | 43.5 | 44 -1% | 53 -22% | 57 -31% | 56 -29% | 53.5 -23% |
| Witcher 3 ultra * (dB) | 43.5 | 44 -1% | 52 -20% | 56 -29% | 56 -29% | 53.5 -23% |
| Load Maximum * (dB) | 53.1 | 48 10% | 54 -2% | 58 -9% | 58 -9% | 53.5 -1% |
* ... smaller is better
Temperature
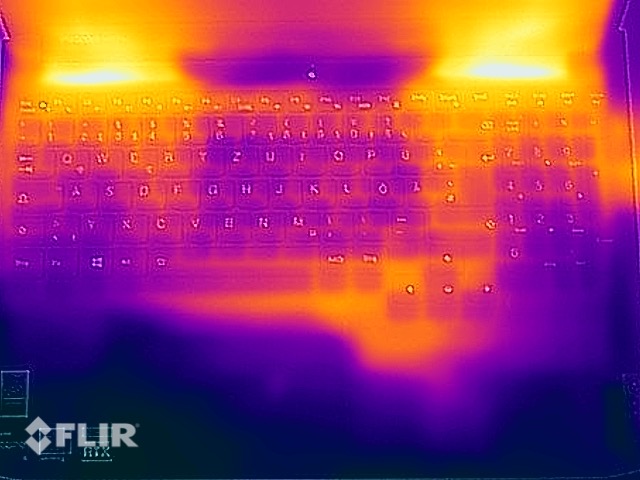
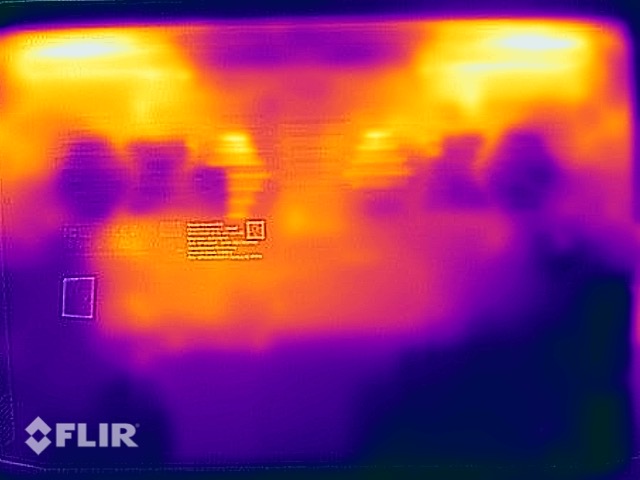
The IdeaPad Gaming 3’s cooling system does a decent job, and surface temperatures remained fairly low while gaming. Only at the bottom were we able to find a single hot spot reaching a maximum of 45 °C, which means the device should be easily usable on your lap. The laptop remained very cool when idle and in low load situations.
During our stress test we found both CPU (42 W) and dedicated GPU (80 W) to be consistent over long periods of time, and performance was not impeded at all immediately following the stress test.
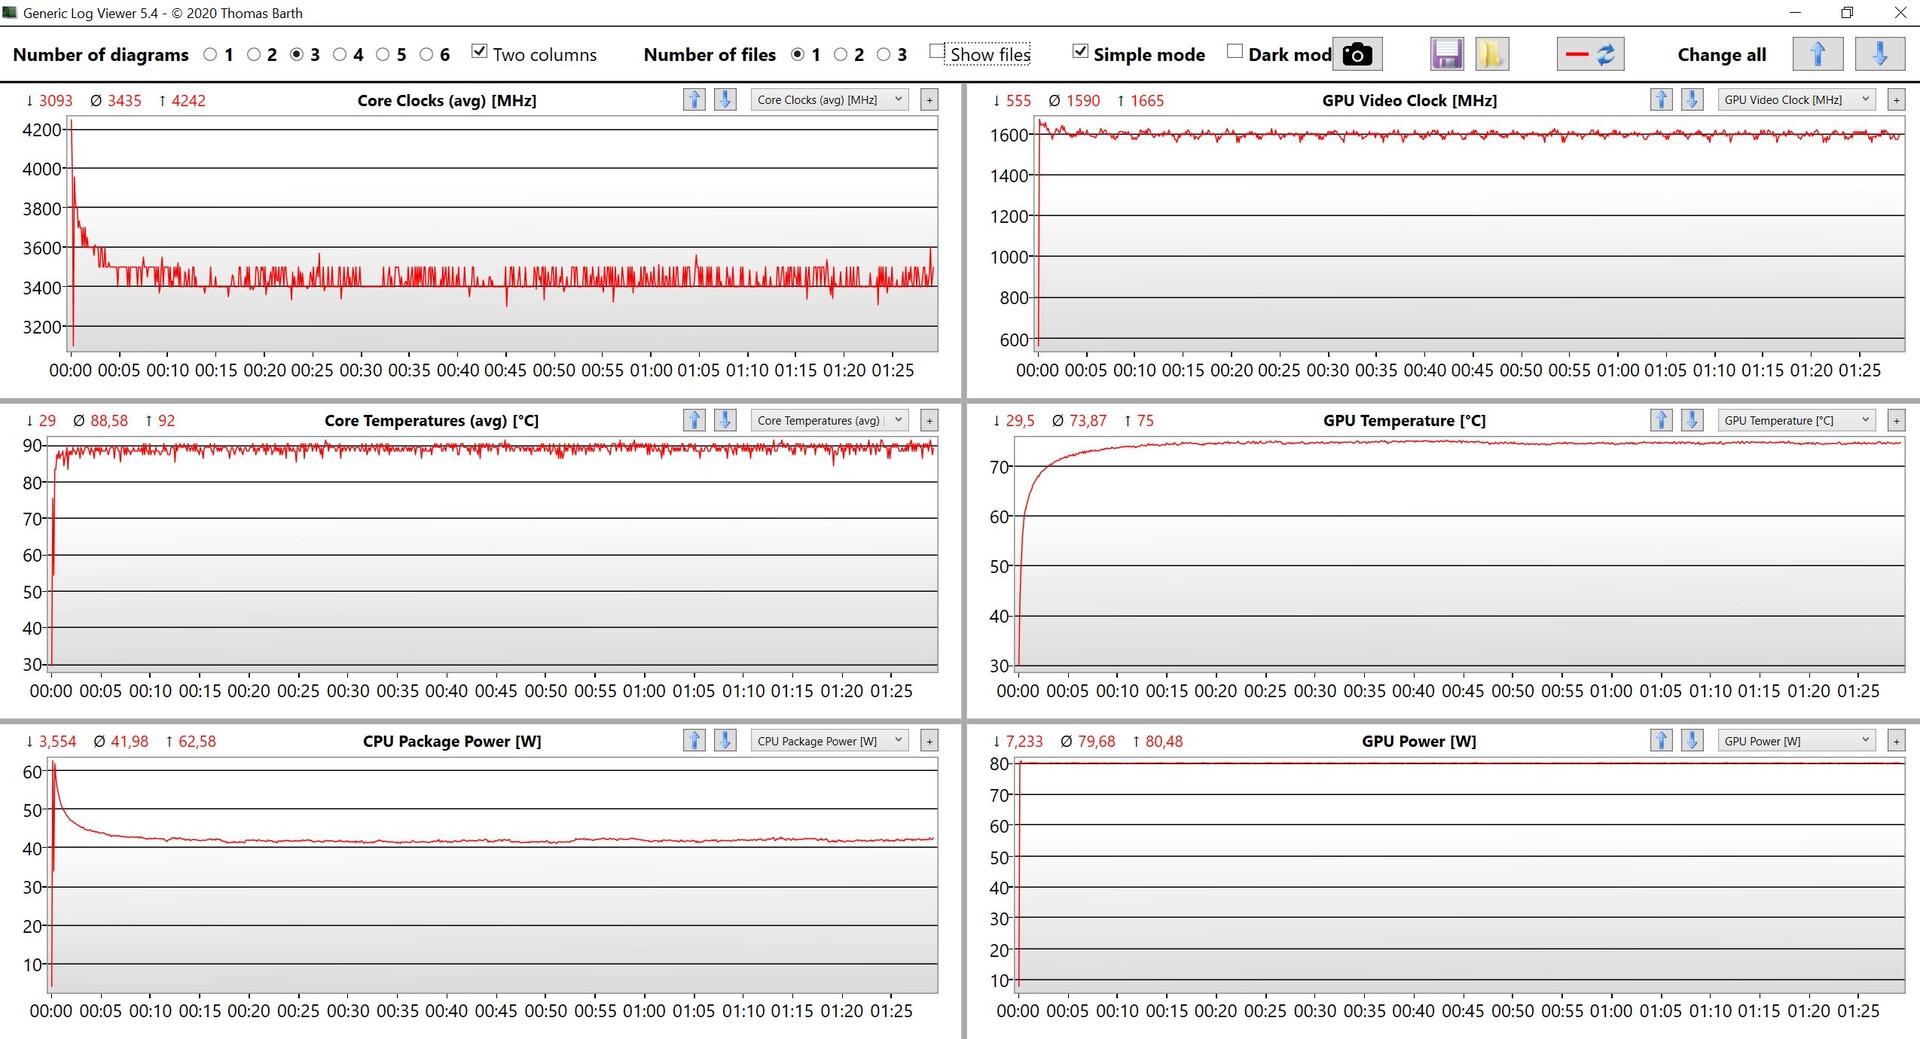
(±) The maximum temperature on the upper side is 43.2 °C / 110 F, compared to the average of 40.4 °C / 105 F, ranging from 21.2 to 68.8 °C for the class Gaming.
(-) The bottom heats up to a maximum of 47.9 °C / 118 F, compared to the average of 43.2 °C / 110 F
(+) In idle usage, the average temperature for the upper side is 24.2 °C / 76 F, compared to the device average of 33.9 °C / 93 F.
(±) Playing The Witcher 3, the average temperature for the upper side is 35.5 °C / 96 F, compared to the device average of 33.9 °C / 93 F.
(±) The palmrests and touchpad can get very hot to the touch with a maximum of 38.2 °C / 100.8 F.
(-) The average temperature of the palmrest area of similar devices was 28.8 °C / 83.8 F (-9.4 °C / -17 F).
| Lenovo Ideapad Gaming 3 15IHU-82K1002RGE Intel Core i5-11300H, NVIDIA GeForce RTX 3050 Ti Laptop GPU | Dell G15 5515 AMD Ryzen 7 5800H, NVIDIA GeForce RTX 3050 Ti Laptop GPU | Gigabyte G5 GD Intel Core i5-11400H, NVIDIA GeForce RTX 3050 4GB Laptop GPU | Medion Erazer Deputy P25 AMD Ryzen 7 5800H, NVIDIA GeForce RTX 3060 Laptop GPU | Schenker XMG Focus 15 Intel Core i7-11800H, NVIDIA GeForce RTX 3050 Ti Laptop GPU | Lenovo Legion 5 15ACH-82JU00C6GE-FL AMD Ryzen 7 5800H, NVIDIA GeForce RTX 3060 Laptop GPU | |
|---|---|---|---|---|---|---|
| Heat | -5% | -9% | 4% | -25% | -1% | |
| Maximum Upper Side * (°C) | 43.2 | 50 -16% | 45 -4% | 37 14% | 43 -0% | 42.6 1% |
| Maximum Bottom * (°C) | 47.9 | 49 -2% | 50 -4% | 40 16% | 46 4% | 52.2 -9% |
| Idle Upper Side * (°C) | 24.9 | 26 -4% | 28 -12% | 27 -8% | 39 -57% | 24.9 -0% |
| Idle Bottom * (°C) | 27 | 26 4% | 31 -15% | 29 -7% | 40 -48% | 25.3 6% |
* ... smaller is better
Speakers
The stereo speakers are rated at 2 W each and are sufficiently loud yet very tinny overall. And while the preloaded Nahimic software allows for some noticeable fine-tuning using preinstalled profiles we found other laptops to perform much better in this regard. We would thus strongly suggest connecting external speakers or headphones for most use cases, from gaming to music.
Lenovo Ideapad Gaming 3 15IHU-82K1002RGE audio analysis
(±) | speaker loudness is average but good (80 dB)
Bass 100 - 315 Hz
(-) | nearly no bass - on average 23.8% lower than median
(±) | linearity of bass is average (10.3% delta to prev. frequency)
Mids 400 - 2000 Hz
(±) | higher mids - on average 6.7% higher than median
(+) | mids are linear (6% delta to prev. frequency)
Highs 2 - 16 kHz
(+) | balanced highs - only 3.6% away from median
(±) | linearity of highs is average (7.4% delta to prev. frequency)
Overall 100 - 16.000 Hz
(±) | linearity of overall sound is average (20.7% difference to median)
Compared to same class
» 74% of all tested devices in this class were better, 4% similar, 21% worse
» The best had a delta of 6%, average was 18%, worst was 132%
Compared to all devices tested
» 56% of all tested devices were better, 8% similar, 37% worse
» The best had a delta of 4%, average was 24%, worst was 134%
Lenovo Legion 5 15ACH-82JU00C6GE-FL audio analysis
(±) | speaker loudness is average but good (81 dB)
Bass 100 - 315 Hz
(-) | nearly no bass - on average 22.1% lower than median
(±) | linearity of bass is average (11.4% delta to prev. frequency)
Mids 400 - 2000 Hz
(+) | balanced mids - only 4.5% away from median
(+) | mids are linear (5% delta to prev. frequency)
Highs 2 - 16 kHz
(+) | balanced highs - only 2.9% away from median
(+) | highs are linear (4.5% delta to prev. frequency)
Overall 100 - 16.000 Hz
(±) | linearity of overall sound is average (17.8% difference to median)
Compared to same class
» 53% of all tested devices in this class were better, 10% similar, 37% worse
» The best had a delta of 6%, average was 18%, worst was 132%
Compared to all devices tested
» 36% of all tested devices were better, 8% similar, 56% worse
» The best had a delta of 4%, average was 24%, worst was 134%
Energy Management – Lenovo Gaming Laptop with Small Battery
Power Consumption
Our review unit turned out to be surprisingly efficient when idle. While gaming it consumed a total of 120-130 W and peaked at 172 W during our stress test before settling at a more reasonable 150 W. The included 170 W power supply is thus adequate.
| Off / Standby | |
| Idle | |
| Load |
|
Key:
min: | |
| Lenovo Ideapad Gaming 3 15IHU-82K1002RGE i5-11300H, GeForce RTX 3050 Ti Laptop GPU, Micron 2210 MTFDHBA512QFD, IPS, 1920x1080, 15.6" | Dell G15 5515 R7 5800H, GeForce RTX 3050 Ti Laptop GPU, Samsung PM991a MZ9LQ512HBLU-00BD1, IPS, 1920x1080, 15.6" | Gigabyte G5 GD i5-11400H, GeForce RTX 3050 4GB Laptop GPU, ESR512GTLG-E6GBTNB4, IPS, 1920x1080, 15.6" | Medion Erazer Deputy P25 R7 5800H, GeForce RTX 3060 Laptop GPU, Phison E12S-512GB-Phison-SSD-BICS4, IPS, 1920x1080, 15.6" | Schenker XMG Focus 15 i7-11800H, GeForce RTX 3050 Ti Laptop GPU, Samsung SSD 970 EVO Plus 1TB, IPS, 1920x1080, 15.6" | Lenovo Legion 5 15ACH-82JU00C6GE-FL R7 5800H, GeForce RTX 3060 Laptop GPU, Micron 2300 512GB MTFDHBA512TDV, , 1920x1080, 15.6" | Average NVIDIA GeForce RTX 3050 Ti Laptop GPU | Average of class Gaming | |
|---|---|---|---|---|---|---|---|---|
| Power Consumption | -26% | -65% | -48% | -138% | -44% | -41% | -111% | |
| Idle Minimum * (Watt) | 4.9 | 5 -2% | 13 -165% | 8 -63% | 23 -369% | 7.3 -49% | 8.2 ? -67% | 13.3 ? -171% |
| Idle Average * (Watt) | 8.3 | 9 -8% | 15 -81% | 11 -33% | 25 -201% | 10.5 -27% | 12.6 ? -52% | 19 ? -129% |
| Idle Maximum * (Watt) | 8.9 | 20 -125% | 20 -125% | 16 -80% | 29 -226% | 15.7 -76% | 17.2 ? -93% | 24.5 ? -175% |
| Load Average * (Watt) | 81 | 94 -16% | 102 -26% | 109 -35% | 106 -31% | 108 -33% | 92 ? -14% | 108.1 ? -33% |
| Witcher 3 ultra * (Watt) | 119 | 123 -3% | 124 -4% | 183 -54% | 128 -8% | 175 -47% | ||
| Load Maximum * (Watt) | 172 | 172 -0% | 148 14% | 211 -23% | 156 9% | 228 -33% | 139.1 ? 19% | 254 ? -48% |
* ... smaller is better
Power Consumption Witcher 3 / stress test
Power Consumption with External Monitor
Battery Life
Despite its large case the IdeaPad Gaming 3 comes with a small 3-cell 45 Wh battery allowing for a decent overall battery life, at least when idle. Under load it managed to last for around one hour. In our Wi-Fi test browsing the web it lasted between 5.5 and 6.5 hours depending on display brightness. In our video test it lasted for more than 7.5 hours with display brightness normalized at 150 nits (84 % on our device). Charging a powered-on device from near empty to full takes around two hours.
| Lenovo Ideapad Gaming 3 15IHU-82K1002RGE i5-11300H, GeForce RTX 3050 Ti Laptop GPU, 45 Wh | Dell G15 5515 R7 5800H, GeForce RTX 3050 Ti Laptop GPU, 56 Wh | Gigabyte G5 GD i5-11400H, GeForce RTX 3050 4GB Laptop GPU, 41 Wh | Medion Erazer Deputy P25 R7 5800H, GeForce RTX 3060 Laptop GPU, 49 Wh | Schenker XMG Focus 15 i7-11800H, GeForce RTX 3050 Ti Laptop GPU, 49 Wh | Lenovo Legion 5 15ACH-82JU00C6GE-FL R7 5800H, GeForce RTX 3060 Laptop GPU, 80 Wh | Average of class Gaming | |
|---|---|---|---|---|---|---|---|
| Battery runtime | 24% | -35% | 1% | -30% | -2% | 16% | |
| H.264 (h) | 7.7 | 8.8 14% | 3.6 -53% | 4.3 -44% | 8.26 ? 7% | ||
| WiFi v1.3 (h) | 6.6 | 8 21% | 3.1 -53% | 6.7 2% | 3.9 -41% | 4.8 -27% | 7.01 ? 6% |
| Load (h) | 1.1 | 1.5 36% | 1.1 0% | 1.1 0% | 0.9 -18% | 1.8 64% | 1.47 ? 34% |
| Reader / Idle (h) | 13.5 | 5.7 | 10.5 | 6.5 | 8.71 ? |
Pros
Cons
Verdict – Budget Gamers Better with AMD
The IdeaPad Gaming 3i 15 G6 is an affordable gaming notebook equipped with a fast RTX 3050 Ti for adequate FHD gaming performance. We are, however, surprised by Lenovo’s choice of CPU. Intel’s comparatively slow Tiger Lake quad-core processor simply makes no sense in a device with a powerful dedicated GPU. The results are a comparatively low gaming performance, and the notebook would have benefitted immensely from the 6-core Core i5-11400H. And to add insult to injury this Tiger Lake CPU would have been even cheaper than the i5-11300H Lenovo opted for. And AMD-equipped SKU based on the Ryzen 5 5600H is also available, and it offers a much better overall performance. It is, however, hard to obtain in many regions.
Overall, the IdeaPad Gaming 3 covers the most important gaming basics without any bells and whistles. Besides the slow CPU we also found the default display to be subpar. It may be matte and offer wide viewing angles thanks to its built-in IPS panel but its image quality (grainy) and color representation are rather poor. Without a doubt the default panel is a rather cheap unit as its poor color accuracy and low sRGB coverage bear further witness to. Optionally, the IdeaPad Gaming 3 is available with a 165 Hz 1080p panel with full sRGB coverage in select regions which, if at all available, would certainly be a much better choice.
The IdeaPad Gaming 3i 15 is a budget gaming notebook with an RTX 3050 Ti and adequate FHD gaming performance. If you can stretch your budget a bit further we would highly recommend the optional 165 Hz panel.
Its competitors, such as the Dell G15, Medion Erazer, Schenker XMG Focus, or even Lenovo’s own Legion 5 15 offer a much higher performance and often also significantly better displays. However, if you are operating on a tight budget the default FHD panel will certainly suffice.
Price and Availability
A total of four SKUs are available in the United States equipped with either a Core i5-11300H and a GeForce GTX 1650 or a Core i7-11370H and a GTX 1650, RTX 3050, or RTX 3050 Ti. Prices start at around $800 for the base model, and the devices are sold through Lenovo’s own webshop as well as various retailers such as Amazon.
Lenovo Ideapad Gaming 3 15IHU-82K1002RGE
- 03/22/2022 v7 (old)
Andreas Osthoff
Price comparison

