Gigabyte G5 GD in review: Affordable gaming laptop without Windows

Its configuration (Core i5-11400H, GeForce RTX 3050) and pricing (around 750 Euros (~$848)) position the Gigabyte G5 GD as an entry-level gaming laptop. Competitors include devices like the Lenovo Legion 5 15ACH, the MSI GF65 Thin 10UE, and the Dell G15 5515.
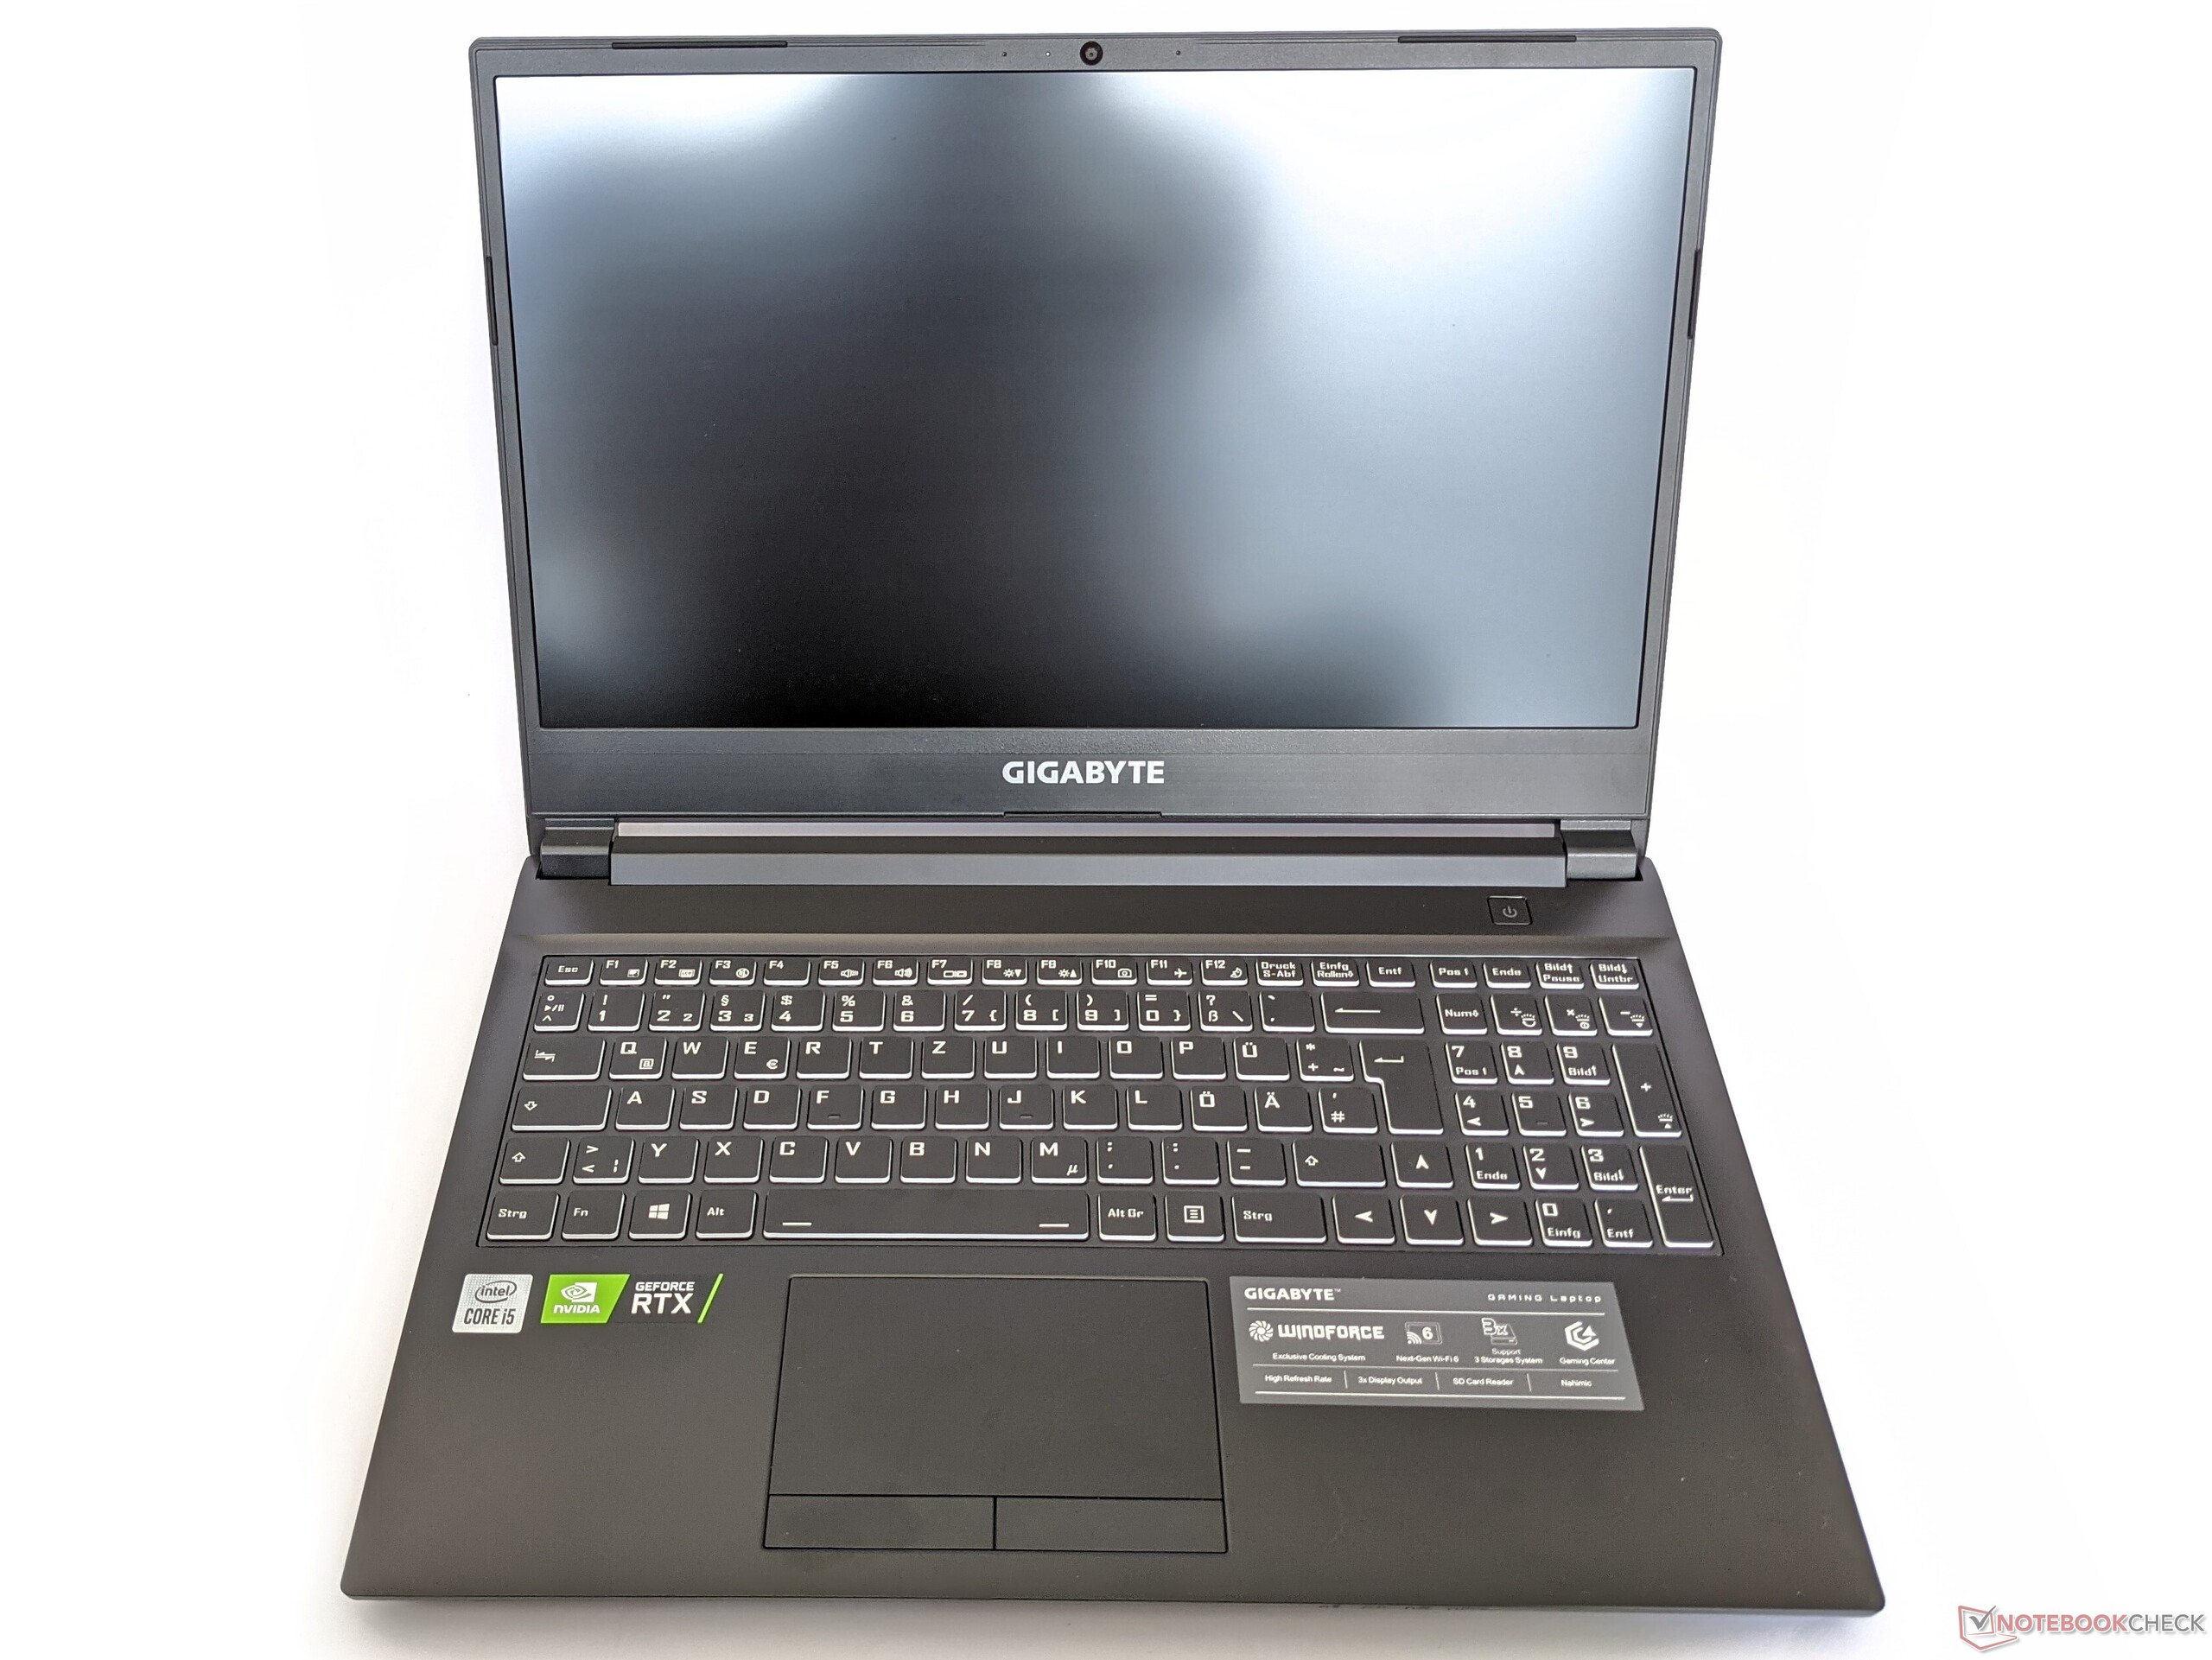
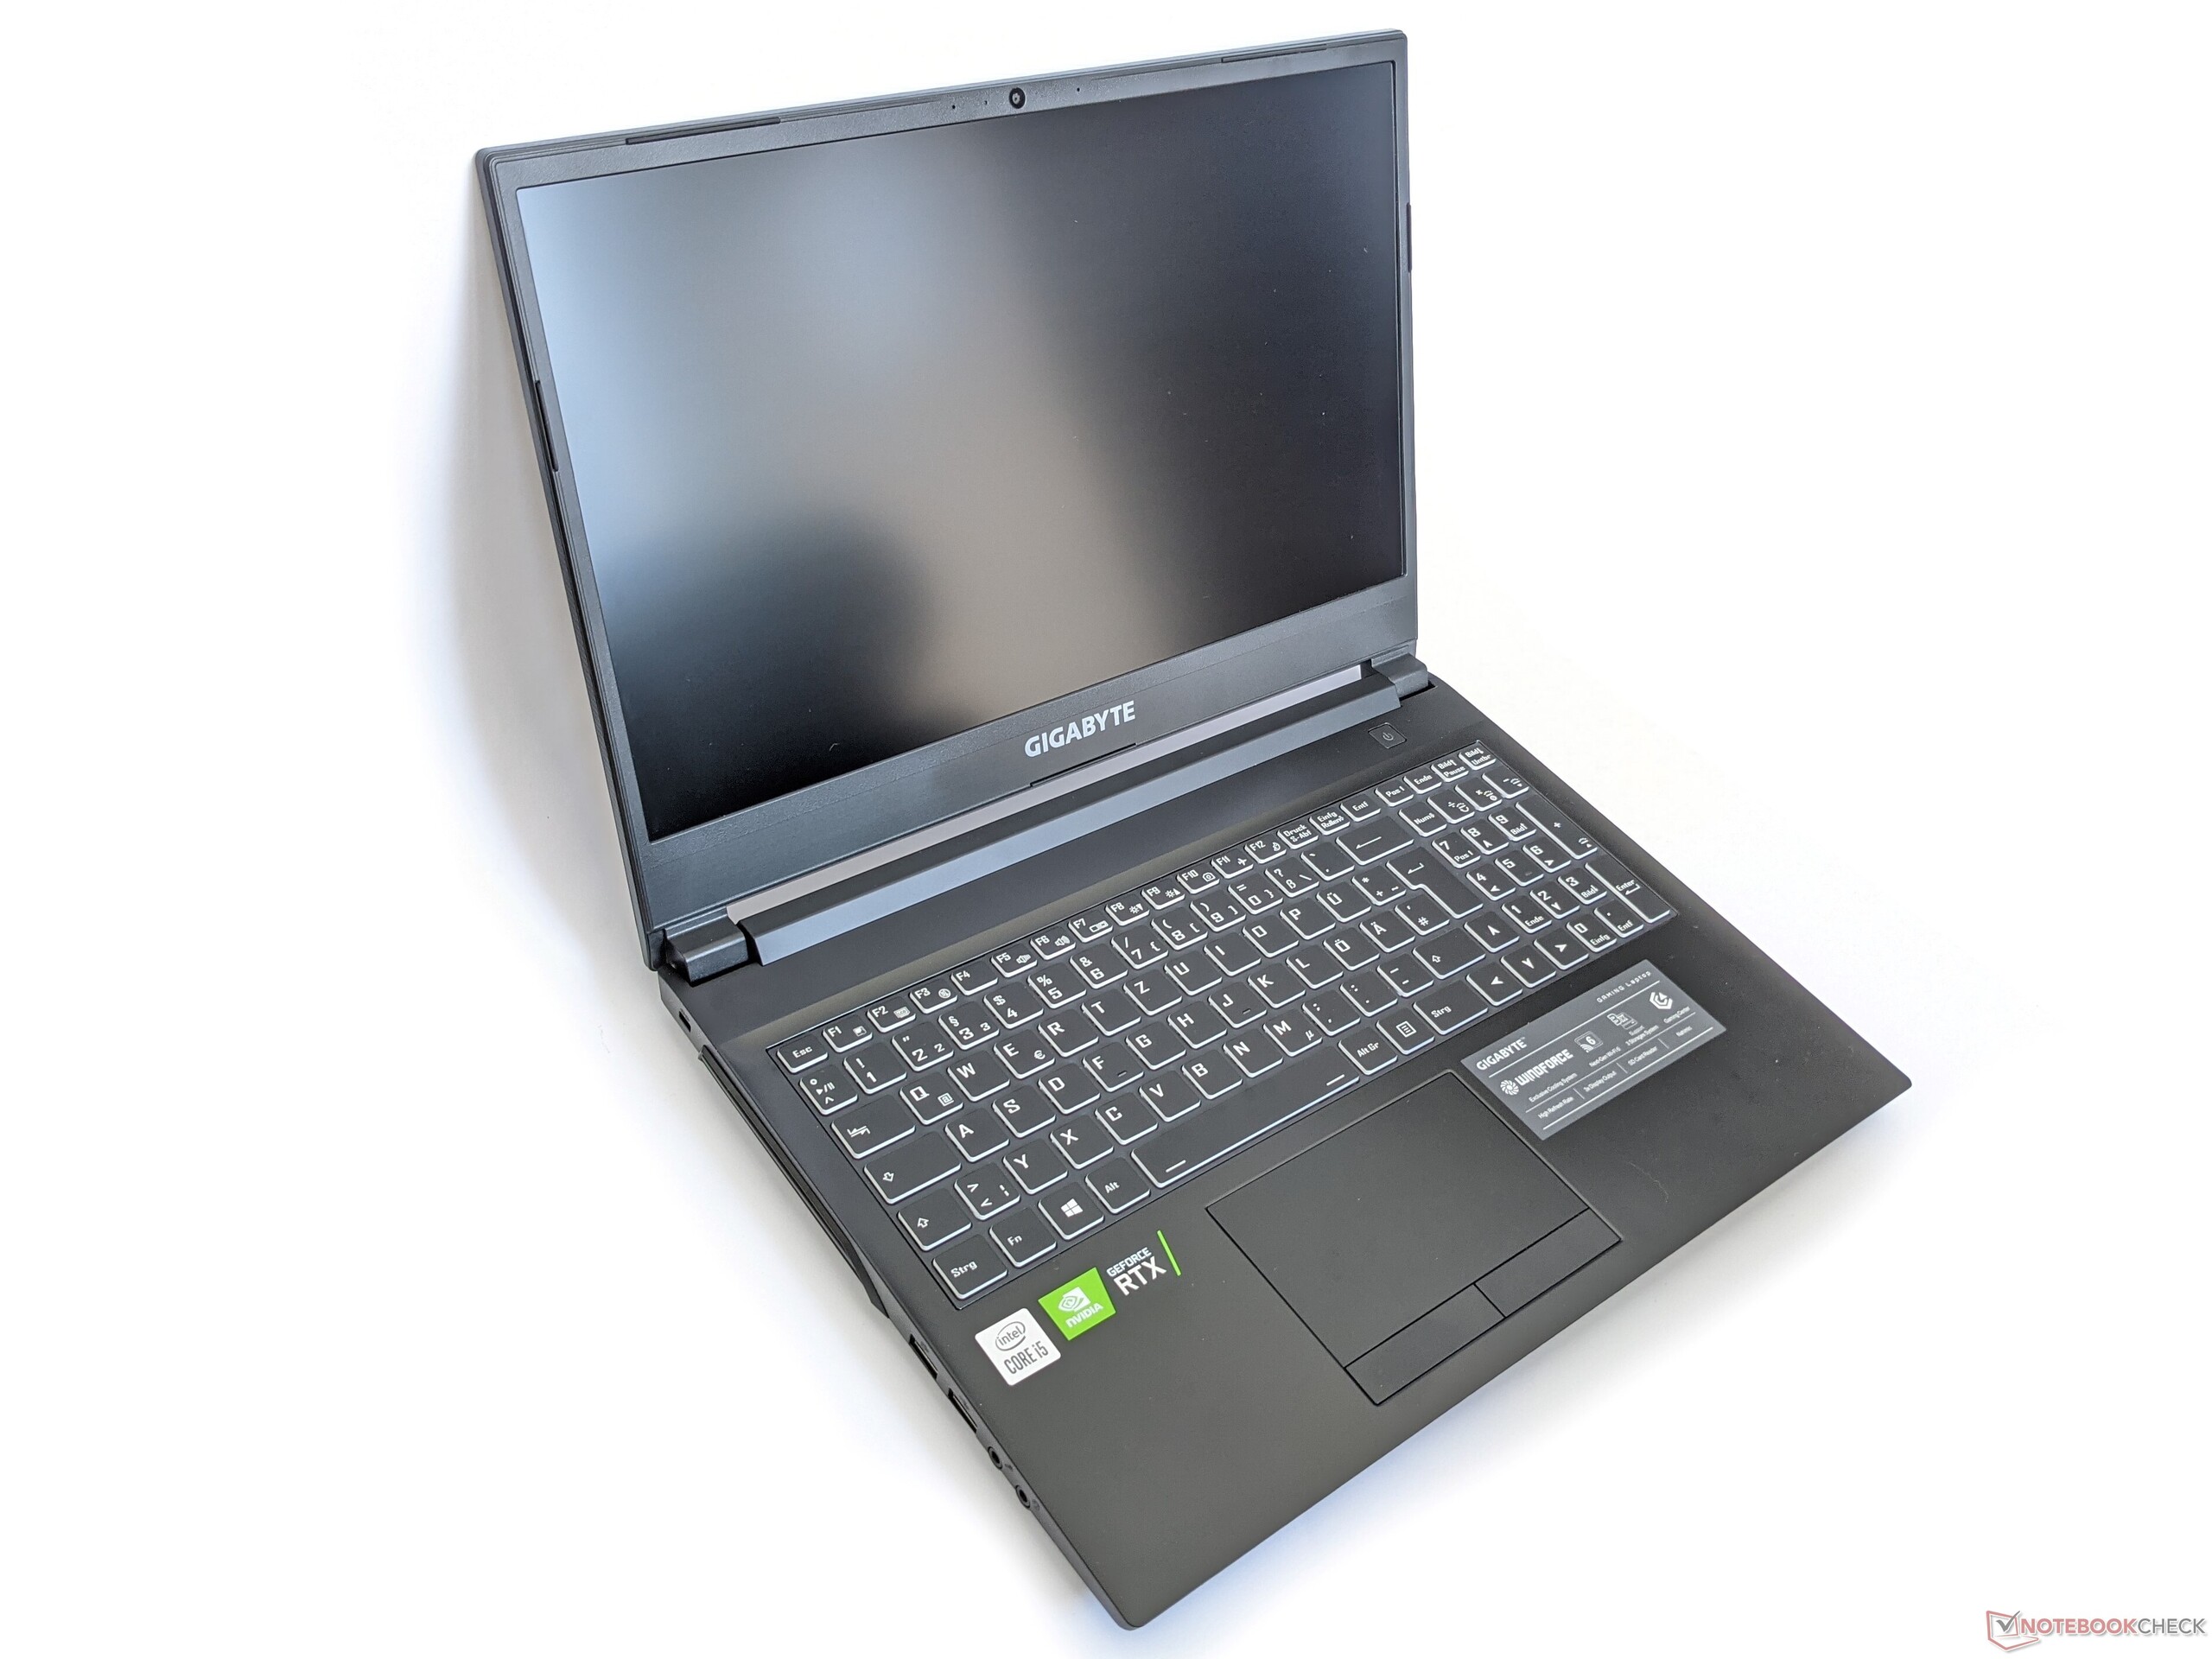
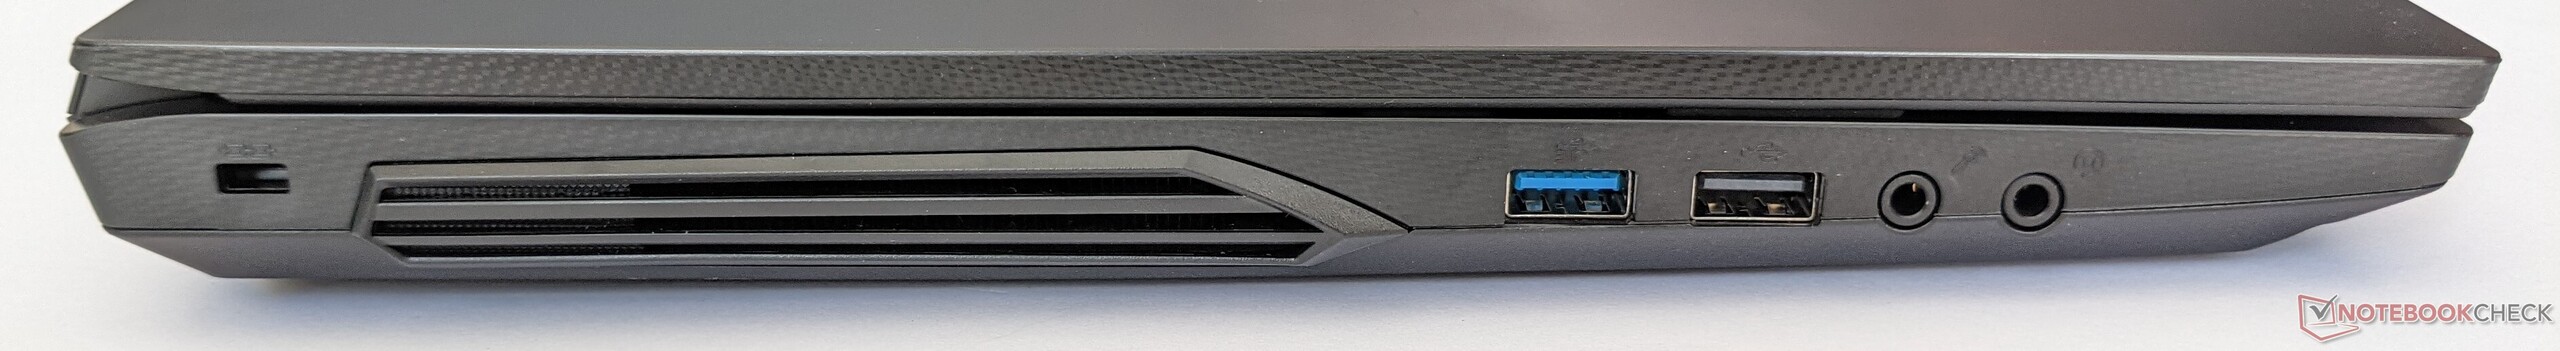
We won't go into further details regarding the case, connectivity, input devices, and speakers in this review. The corresponding information can be found in the review of the identically built Gigabyte G5 KC.
Possible contenders in comparison
Rating | Date | Model | Weight | Height | Size | Resolution | Price |
|---|---|---|---|---|---|---|---|
| 81.7 % v7 (old) | 11 / 2021 | Gigabyte G5 GD i5-11400H, GeForce RTX 3050 4GB Laptop GPU | 2.1 kg | 31.6 mm | 15.60" | 1920x1080 | |
| 82.7 % v7 (old) | 10 / 2021 | Dell G15 5515 R7 5800H, GeForce RTX 3050 Ti Laptop GPU | 2.4 kg | 24.9 mm | 15.60" | 1920x1080 | |
| 83.4 % v7 (old) | 09 / 2021 | Lenovo Legion 5 15ACH-82JU00C6GE-FL R7 5800H, GeForce RTX 3060 Laptop GPU | 2.5 kg | 26 mm | 15.60" | 1920x1080 | |
| 80.4 % v7 (old) | 03 / 2021 | MSI GF65 Thin 10UE i7-10750H, GeForce RTX 3060 Laptop GPU | 1.9 kg | 21.7 mm | 15.60" | 1920x1080 |


| SD Card Reader | |
| average JPG Copy Test (av. of 3 runs) | |
| Average of class Gaming (20.9 - 210, n=54, last 2 years) | |
| Gigabyte G5 GD (AV PRO microSD 128 GB V60) | |
| Gigabyte G5 KC (AV PRO microSD 128 GB V60) | |
| maximum AS SSD Seq Read Test (1GB) | |
| Average of class Gaming (25.5 - 261, n=51, last 2 years) | |
| Gigabyte G5 GD (AV PRO microSD 128 GB V60) | |
| Gigabyte G5 KC (AV PRO microSD 128 GB V60) | |


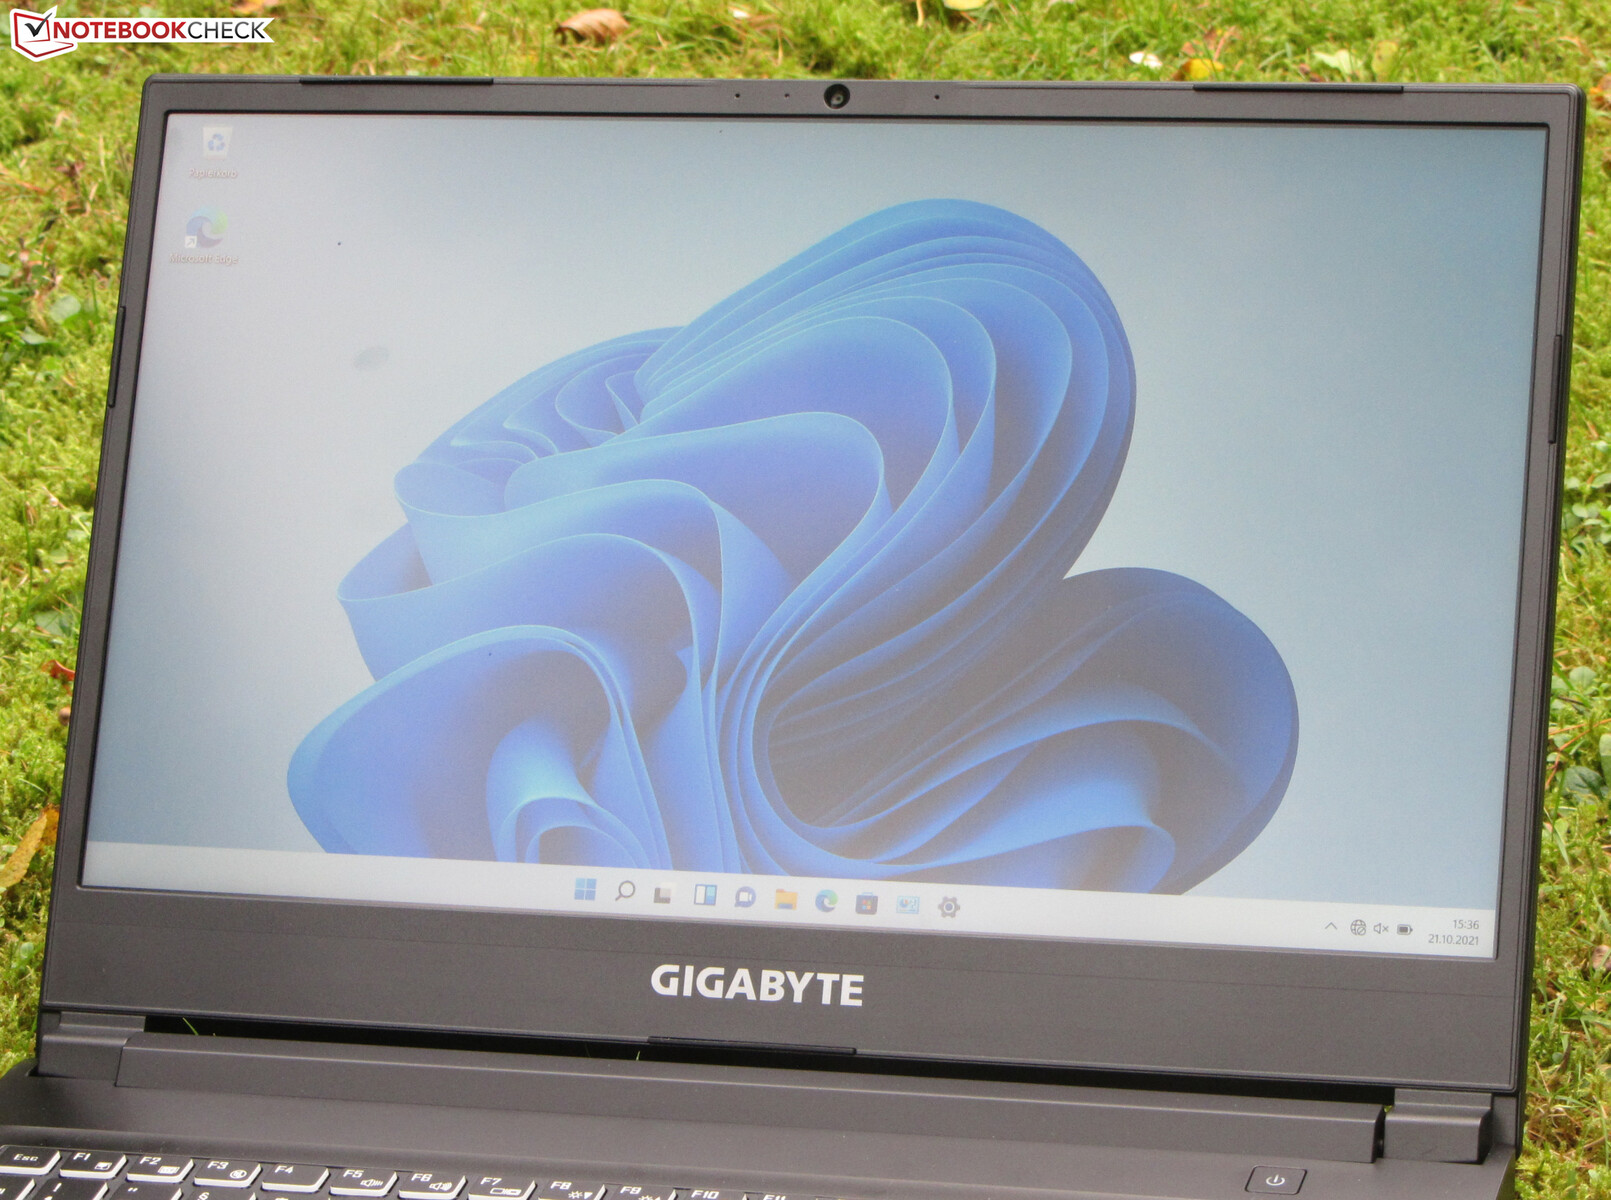
Display - 144 Hz IPS
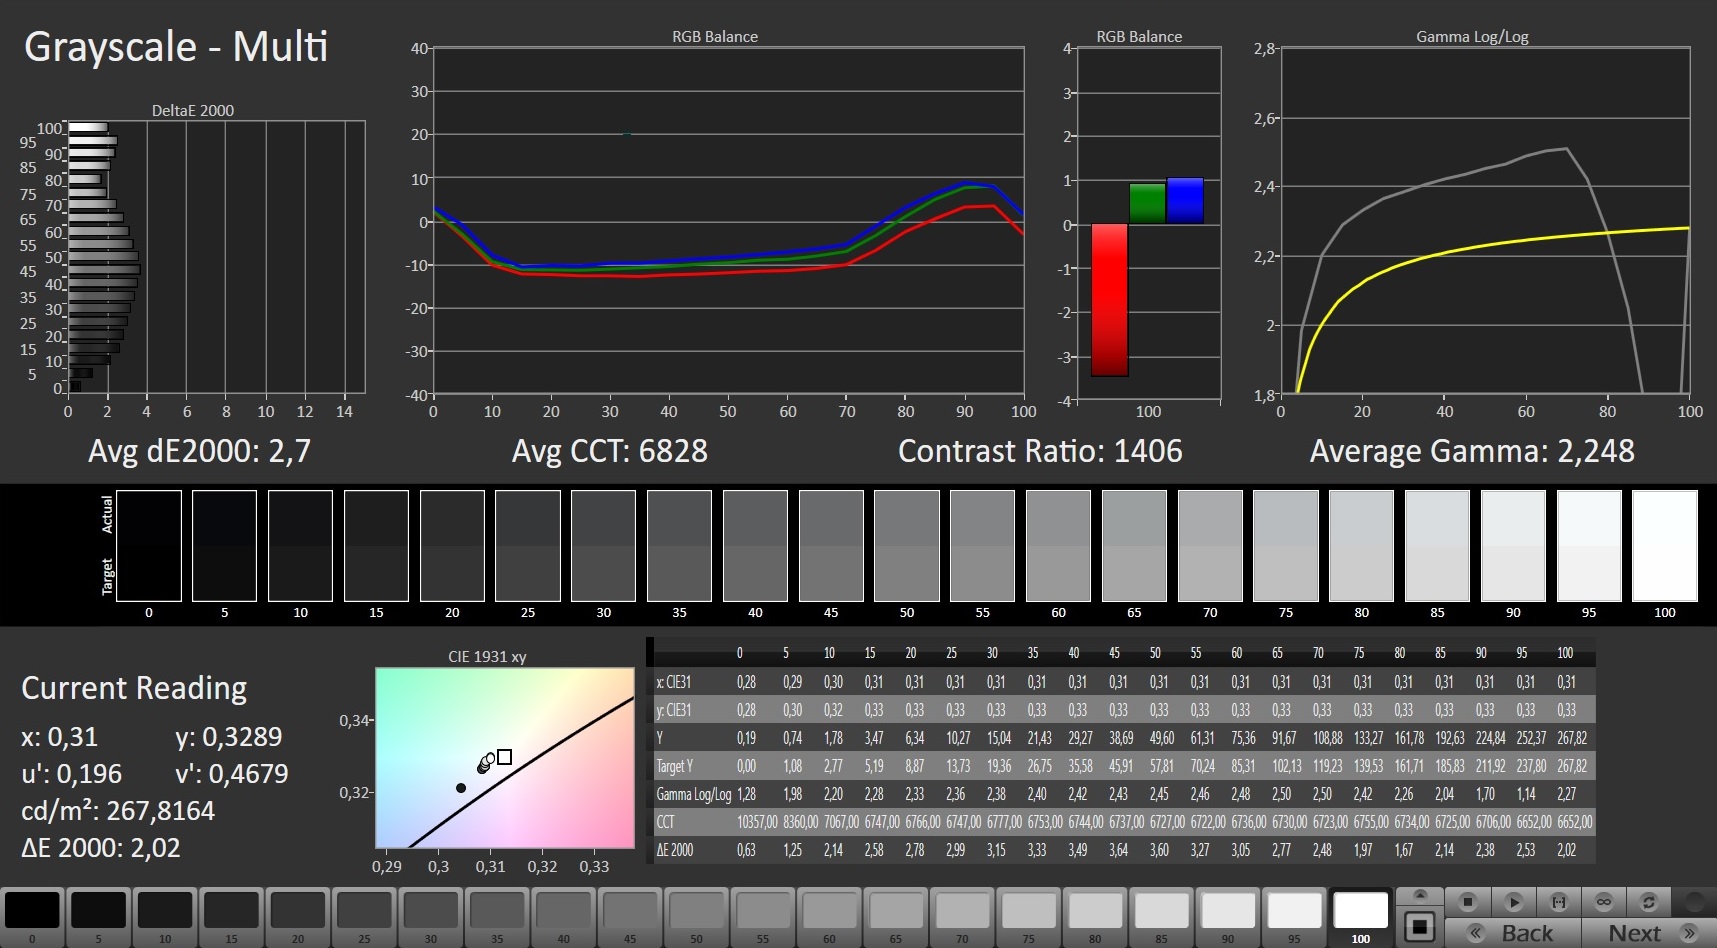
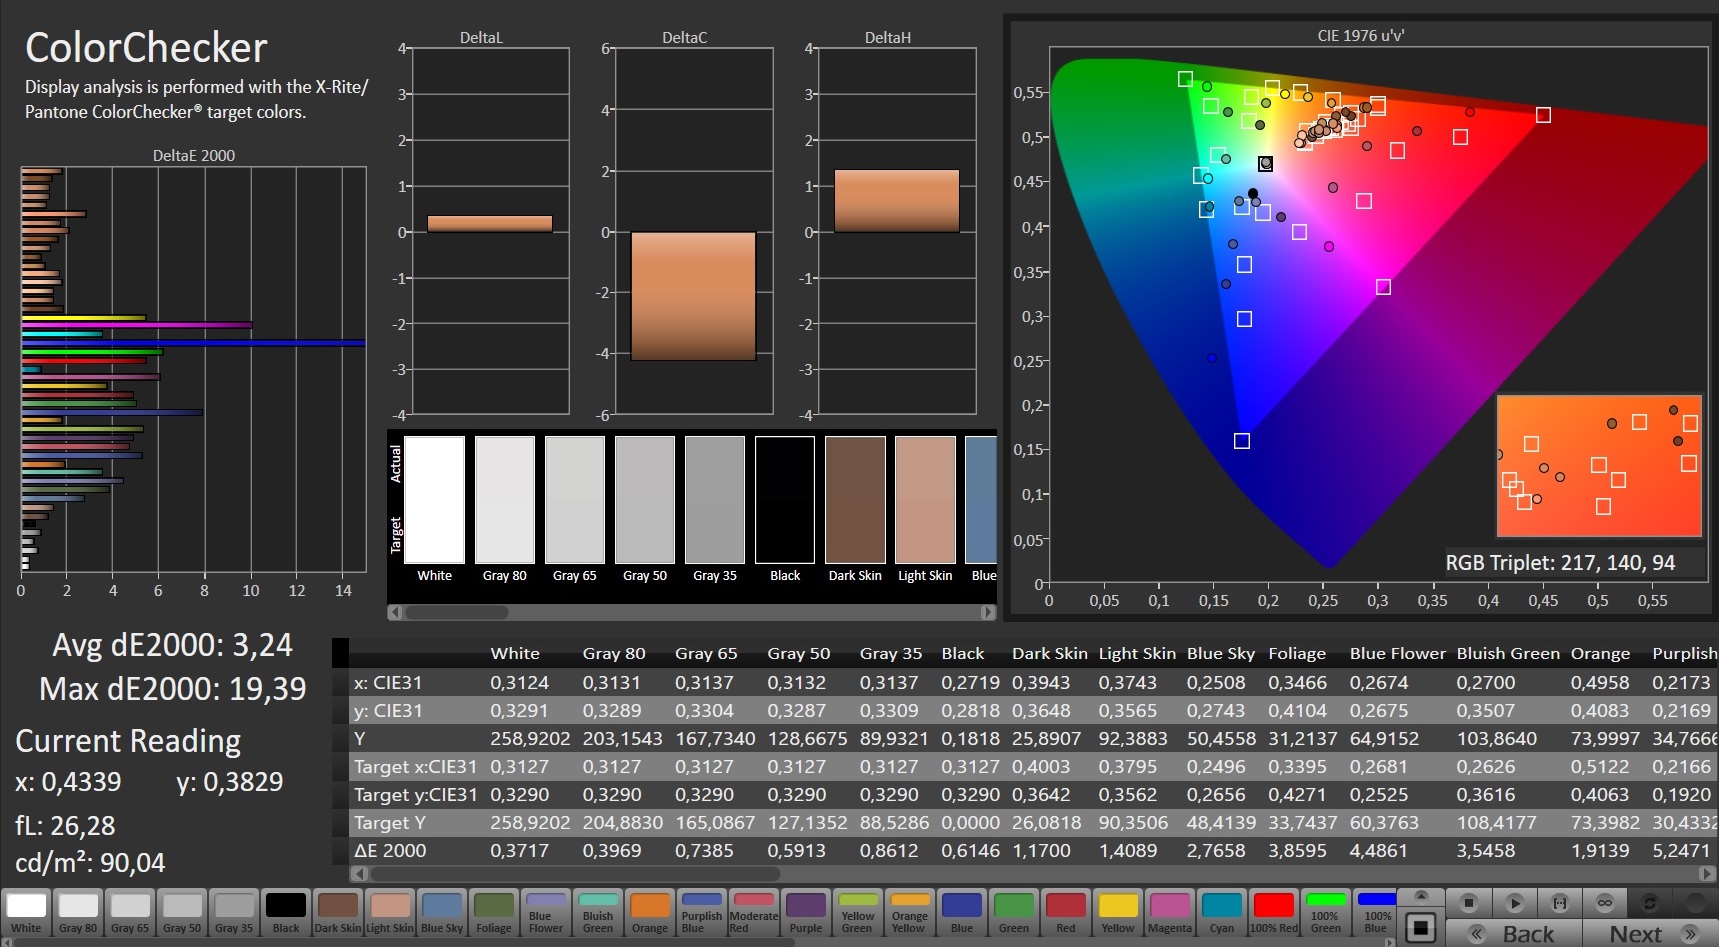
While the contrast (1,374:1) of the matte 15.6-inch display (1920x1080 pixels) meets the target (> 1,000:1), the average brightness (245.7 cd/m²) is too low. We consider values beyond 300 cd/m² to be good. The 144 Hz panel has poor response times. PWM flickering was not observed.
| |||||||||||||||||||||||||
Brightness Distribution: 87 %
Center on Battery: 261 cd/m²
Contrast: 1374:1 (Black: 0.19 cd/m²)
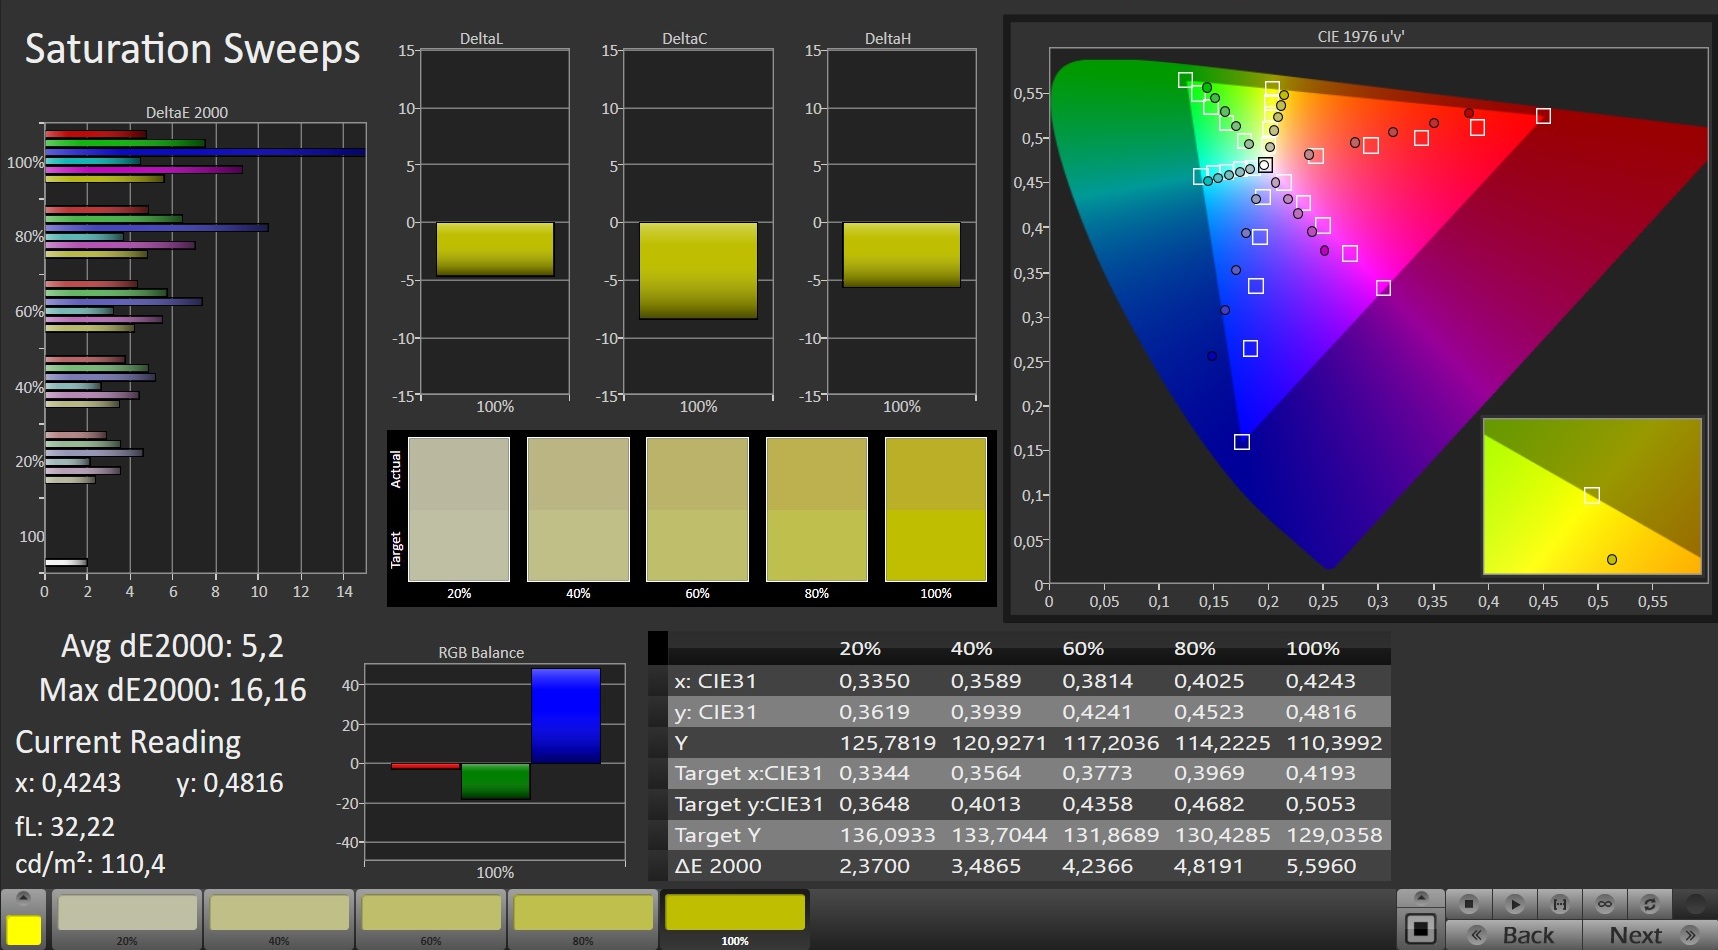
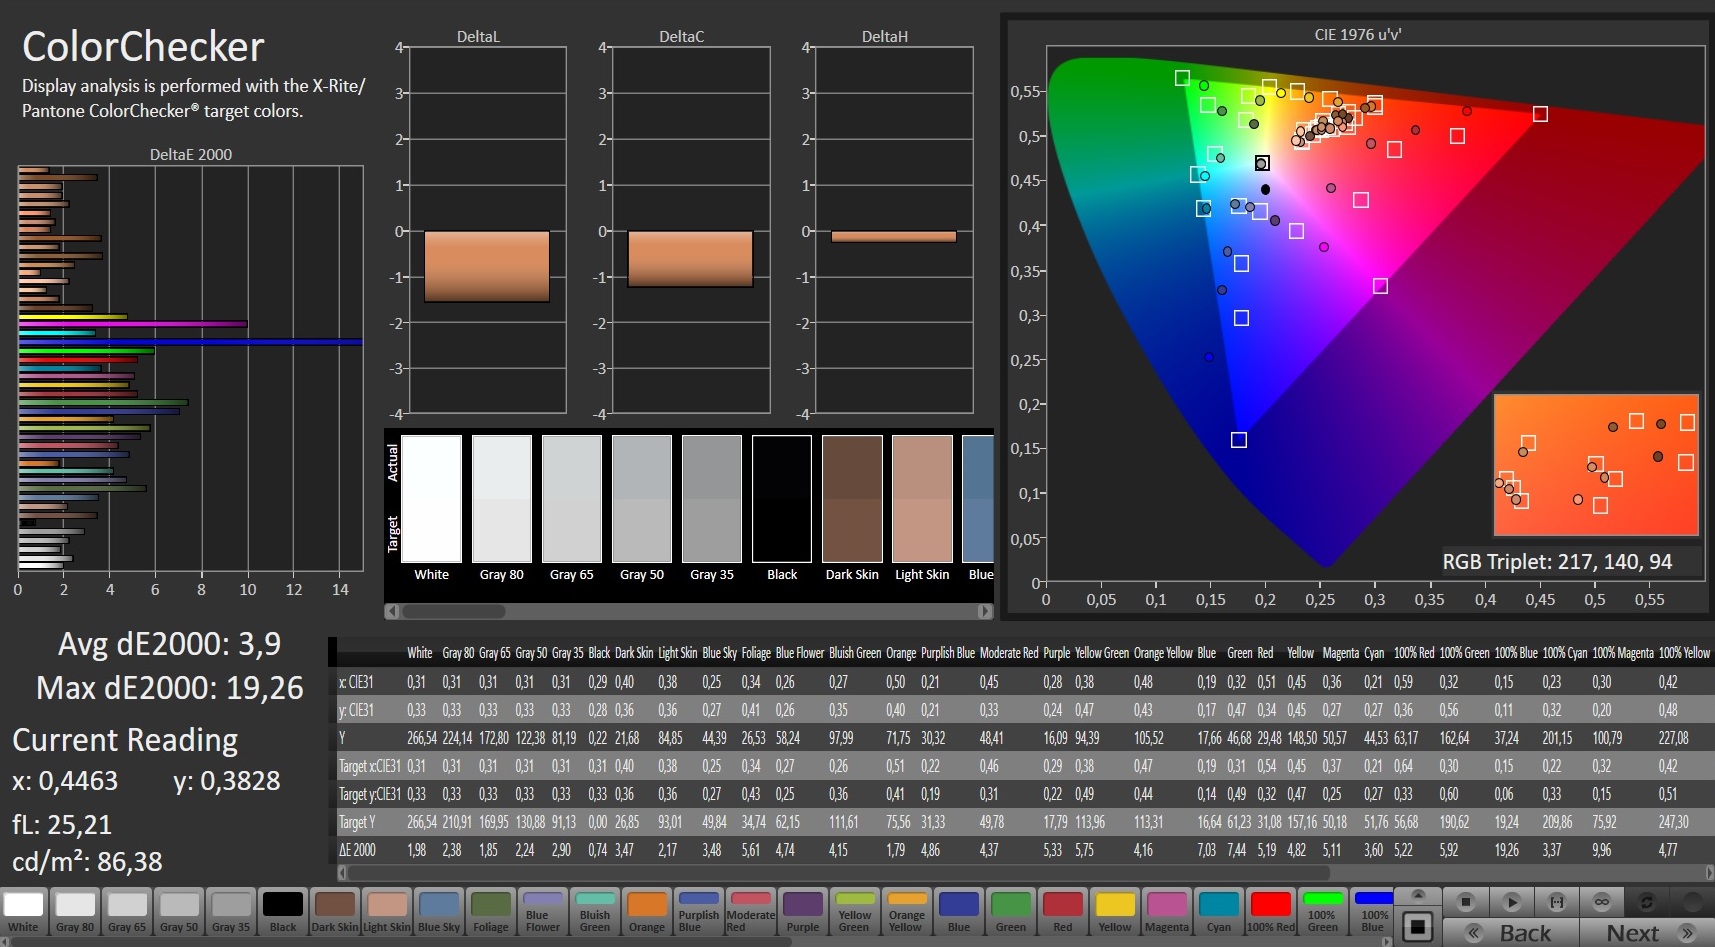
ΔE ColorChecker Calman: 3.9 | ∀{0.5-29.43 Ø4.71}
calibrated: 3.24
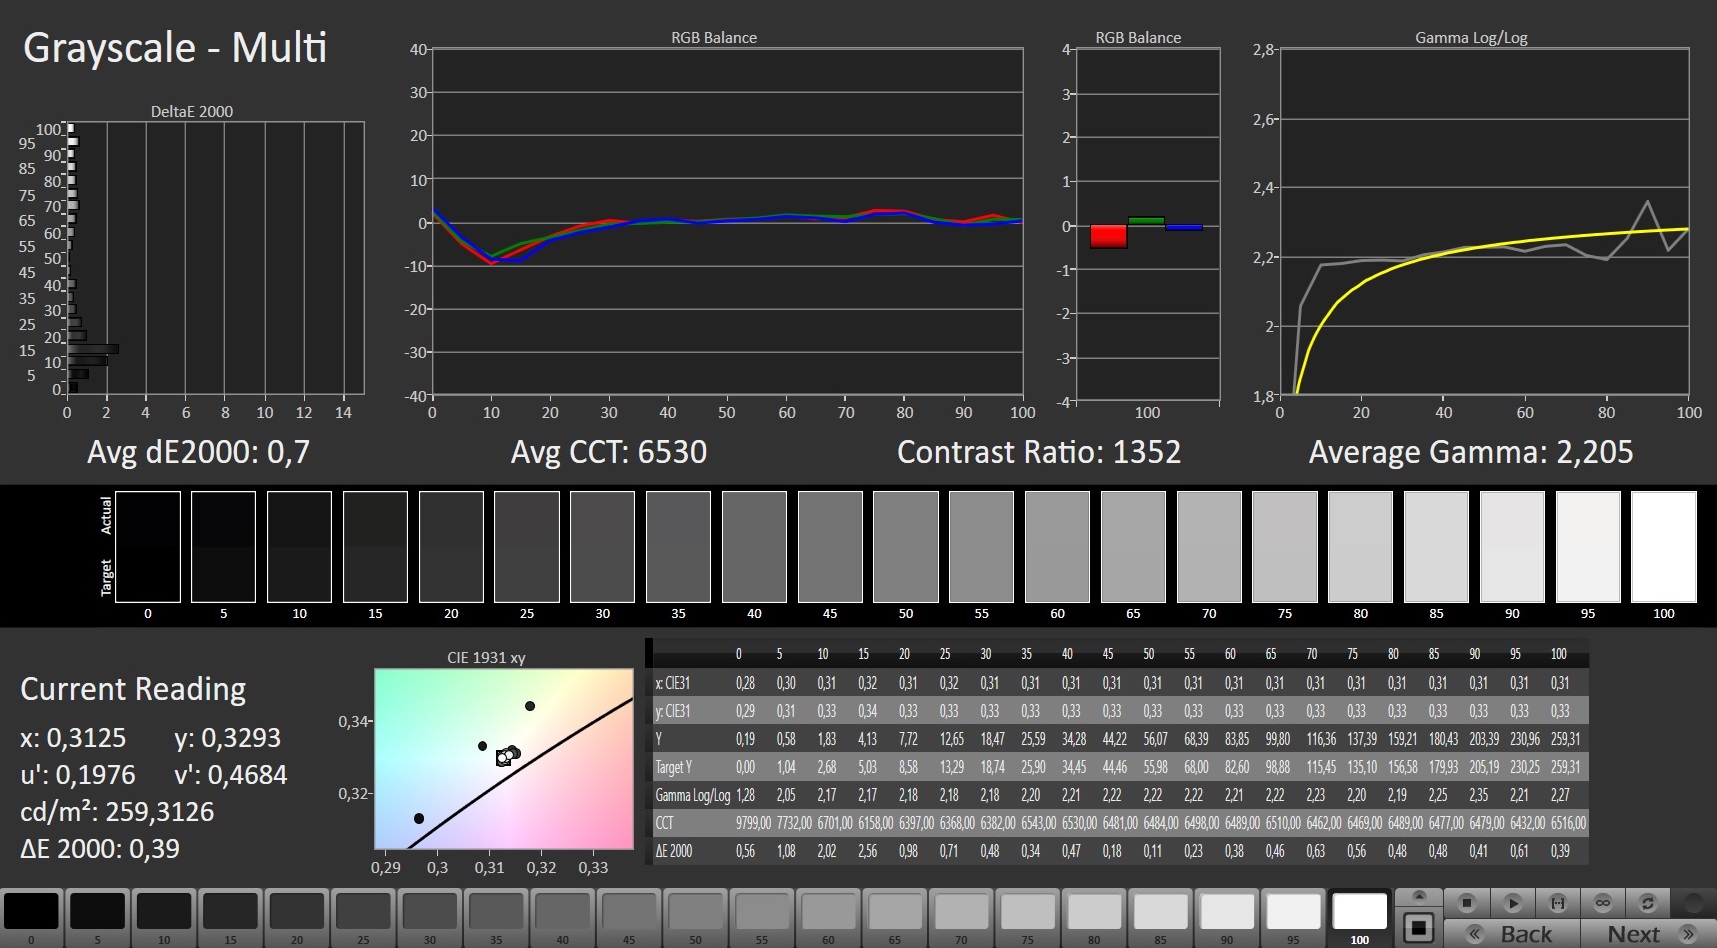
ΔE Greyscale Calman: 2.7 | ∀{0.09-98 Ø4.96}
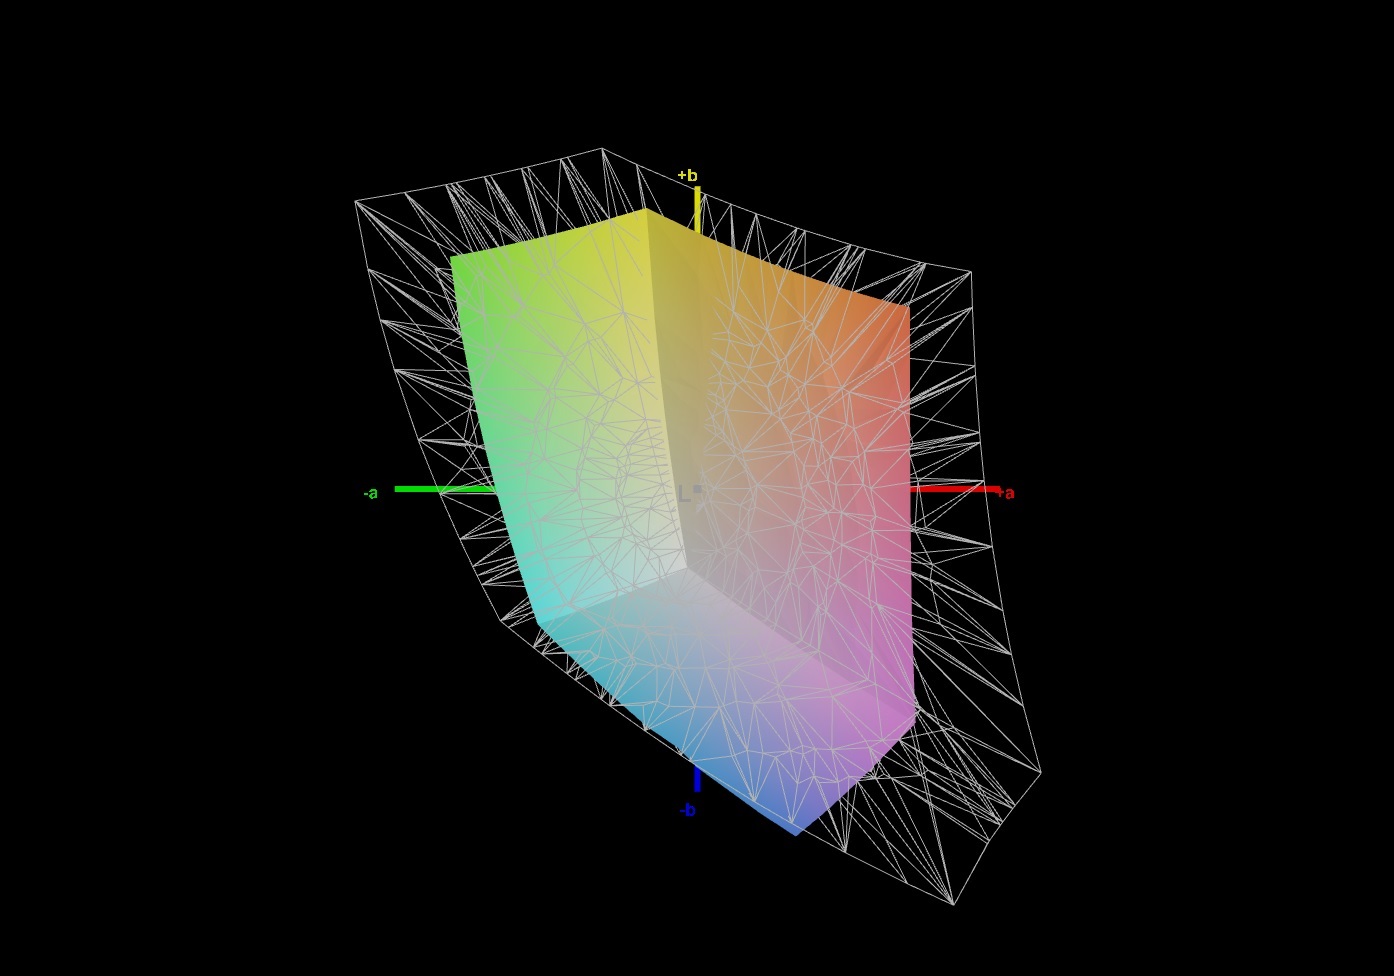
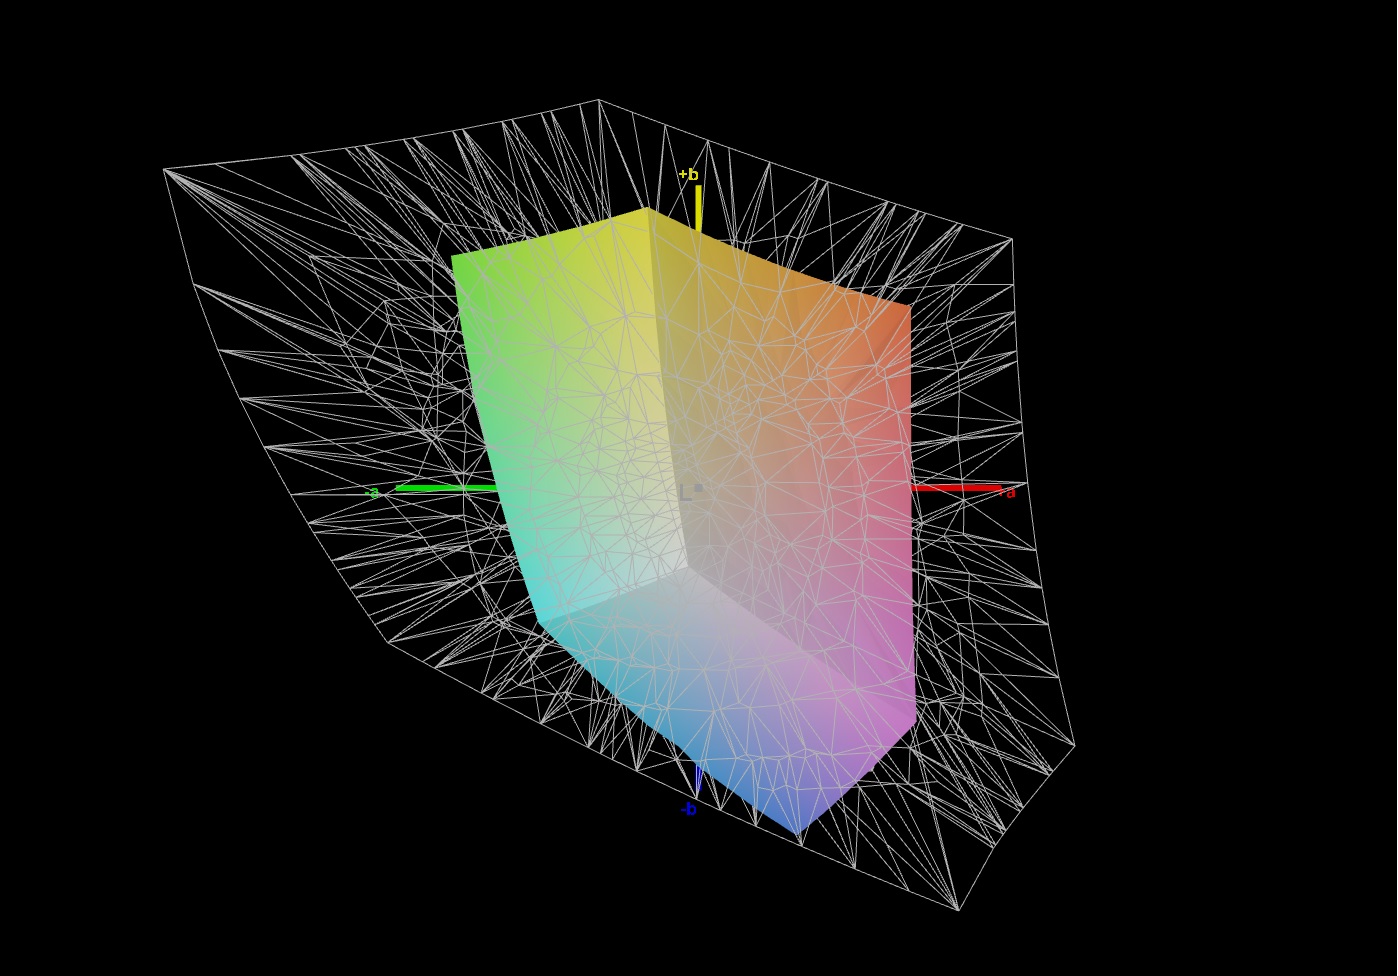
43.2% AdobeRGB 1998 (Argyll 3D)
62.3% sRGB (Argyll 3D)
41.8% Display P3 (Argyll 3D)
Gamma: 2.248
CCT: 6828 K
| Gigabyte G5 GD Chi Mei N156HRA-EA1, IPS, 1920x1080, 15.6" | Dell G15 5515 BOE092A, IPS, 1920x1080, 15.6" | Lenovo Legion 5 15ACH-82JU00C6GE-FL B156HAN12.H, , 1920x1080, 15.6" | MSI GF65 Thin 10UE AU Optronics B156HAN08.4, IPS, 1920x1080, 15.6" | Gigabyte G5 KC LM156LF-1F02, IPS, 1920x1080, 15.6" | |
|---|---|---|---|---|---|
| Display | -7% | 56% | -10% | 60% | |
| Display P3 Coverage (%) | 41.8 | 39.1 -6% | 65.4 56% | 37.65 -10% | 68.2 63% |
| sRGB Coverage (%) | 62.3 | 56.9 -9% | 96.3 55% | 56.3 -10% | 96.7 55% |
| AdobeRGB 1998 Coverage (%) | 43.2 | 40.4 -6% | 67.5 56% | 38.9 -10% | 69.6 61% |
| Response Times | 28% | 60% | -22% | 63% | |
| Response Time Grey 50% / Grey 80% * (ms) | 34.4 ? | 25.2 ? 27% | 13.6 ? 60% | 36.8 ? -7% | 10 ? 71% |
| Response Time Black / White * (ms) | 23.2 ? | 16.8 ? 28% | 9.2 ? 60% | 31.6 ? -36% | 10.4 ? 55% |
| PWM Frequency (Hz) | 200 ? | ||||
| Screen | -26% | 2% | -12% | -24% | |
| Brightness middle (cd/m²) | 261 | 278 7% | 350 34% | 266.5 2% | 295 13% |
| Brightness (cd/m²) | 246 | 262 7% | 350 42% | 262 7% | 275 12% |
| Brightness Distribution (%) | 87 | 83 -5% | 96 10% | 91 5% | 86 -1% |
| Black Level * (cd/m²) | 0.19 | 0.36 -89% | 0.3 -58% | 0.18 5% | 0.23 -21% |
| Contrast (:1) | 1374 | 772 -44% | 1167 -15% | 1481 8% | 1283 -7% |
| Colorchecker dE 2000 * | 3.9 | 5.74 -47% | 3.9 -0% | 5.33 -37% | 5.21 -34% |
| Colorchecker dE 2000 max. * | 19.26 | 19.63 -2% | 8.2 57% | 18.28 5% | 14.03 27% |
| Colorchecker dE 2000 calibrated * | 3.24 | 4.7 -45% | 1.6 51% | 4.36 -35% | 1.73 47% |
| Greyscale dE 2000 * | 2.7 | 3.1 -15% | 5.5 -104% | 4.5 -67% | 9.4 -248% |
| Gamma | 2.248 98% | 2.011 109% | 2.15 102% | 2.35 94% | 2.046 108% |
| CCT | 6828 95% | 6207 105% | 7414 88% | 6289 103% | 8002 81% |
| Color Space (Percent of AdobeRGB 1998) (%) | 35.6 | ||||
| Color Space (Percent of sRGB) (%) | 55.8 | ||||
| Total Average (Program / Settings) | -2% /
-14% | 39% /
22% | -15% /
-13% | 33% /
7% |
* ... smaller is better
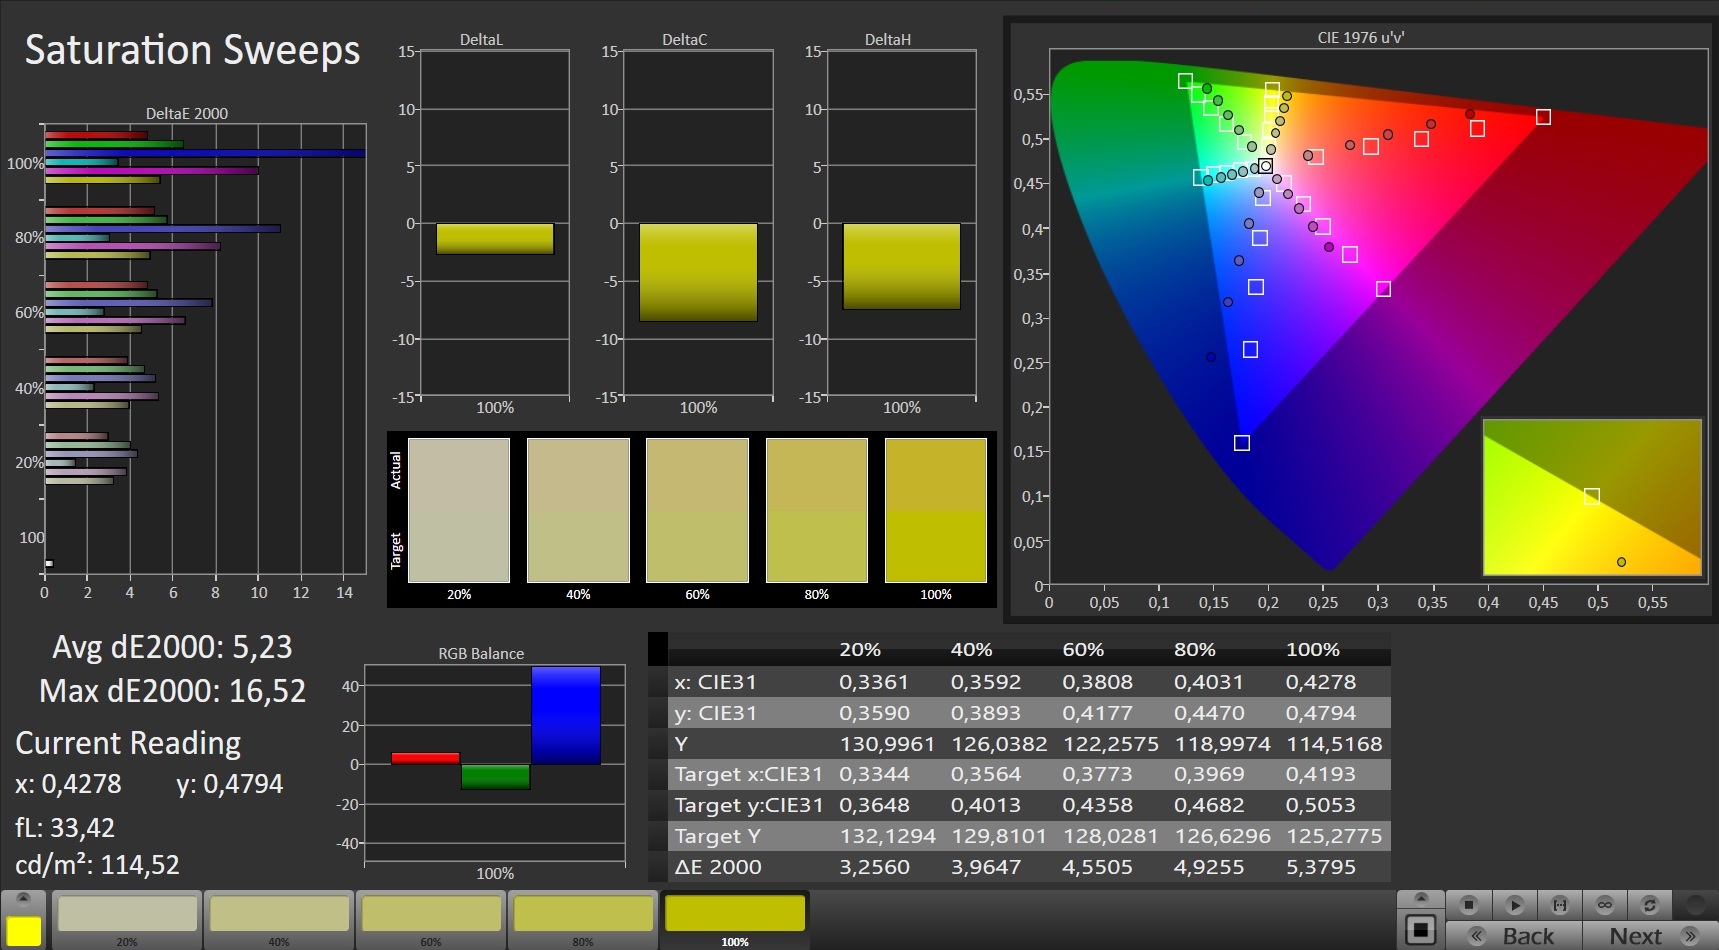
Out of the box, color reproduction deviates slightly from the target. However, this is not noticeable. Calibration only provides minor improvements. Furthermore, the panel doesn't suffer from a blue tint. The display can't represent the AdobeRGB (43%), sRGB (62%), and DCI-P3 (42%) color spaces.
Display Response Times
| ↔ Response Time Black to White | ||
|---|---|---|
| 23.2 ms ... rise ↗ and fall ↘ combined | ↗ 13.2 ms rise | 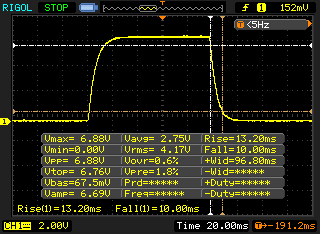 |
| ↘ 10 ms fall | ||
| The screen shows good response rates in our tests, but may be too slow for competitive gamers. In comparison, all tested devices range from 0.1 (minimum) to 240 (maximum) ms. » 53 % of all devices are better. This means that the measured response time is worse than the average of all tested devices (19.8 ms). | ||
| ↔ Response Time 50% Grey to 80% Grey | ||
| 34.4 ms ... rise ↗ and fall ↘ combined | ↗ 16.4 ms rise | 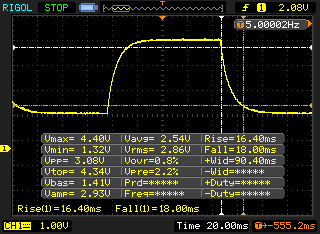 |
| ↘ 18 ms fall | ||
| The screen shows slow response rates in our tests and will be unsatisfactory for gamers. In comparison, all tested devices range from 0.165 (minimum) to 636 (maximum) ms. » 48 % of all devices are better. This means that the measured response time is worse than the average of all tested devices (30.9 ms). | ||
Screen Flickering / PWM (Pulse-Width Modulation)
| Screen flickering / PWM not detected | 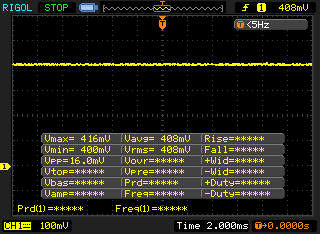 | ||
In comparison: 52 % of all tested devices do not use PWM to dim the display. If PWM was detected, an average of 7741 (minimum: 5 - maximum: 343500) Hz was measured. | |||
The viewing-angle stable IPS panel can be read from any position. Outdoor readability is possible when the sun isn't shining too brightly.

Performance - Gigabyte laptop with full RTX 3050 performance
The Gigabyte G5 GD is a 15.6-inch gaming laptop that brings every modern game smoothly onto the screen.
Test conditions
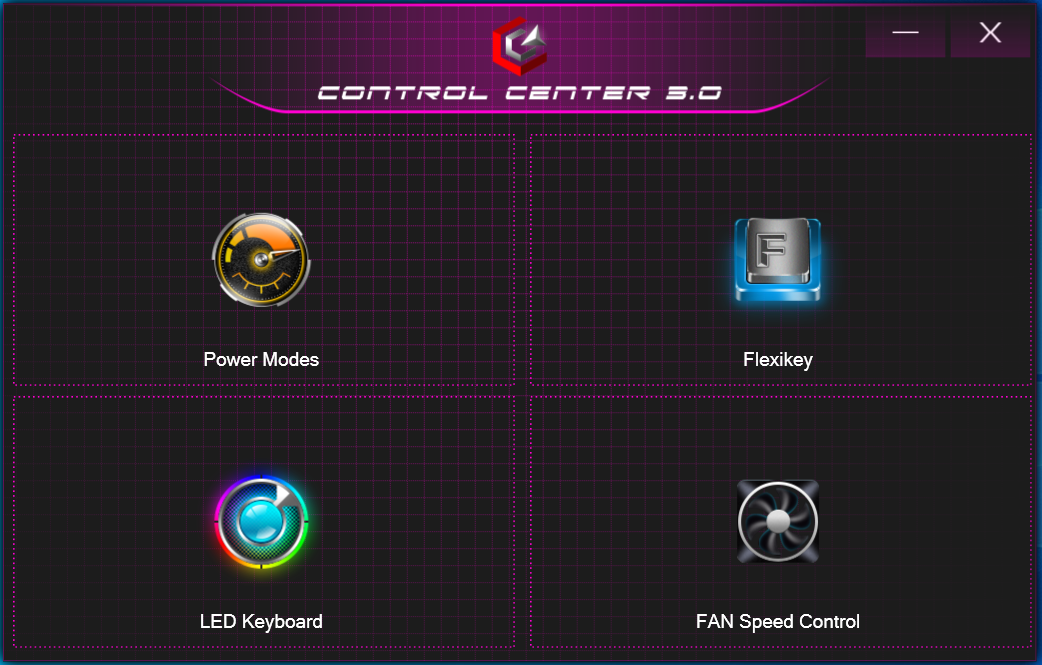
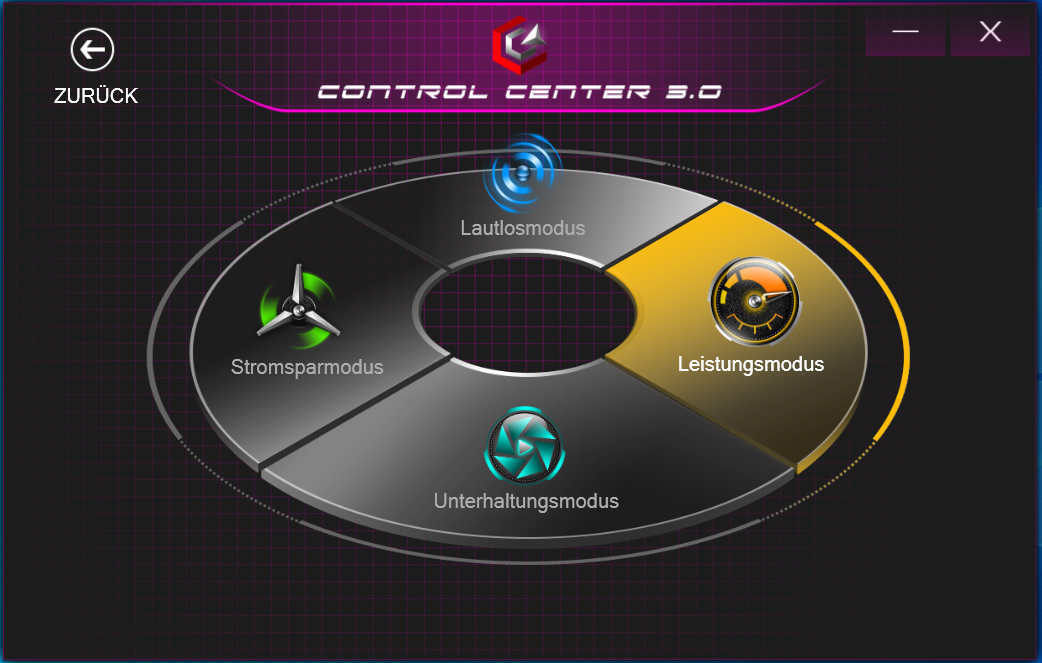
The preinstalled Control Center allows choosing a performance profile (see table), among other things. We used the "Entertainment Mode" profile including automatic fan control. We also performed some benchmarks under the "Performance Mode" and "Power Saving Mode" profiles. The results can be found in the comparison tables.
| Performance Mode | Entertainment Mode | Power Saving Mode | Silent Mode | |
|---|---|---|---|---|
| Power Limit 1 | 60 watts | 45 watt | 30 watts | 15 watts |
| Power Limit 2 | 135 watts | 109 watts | 30 watts | 30 watts |
Self-help advice: BIOS problems with the G5 GD
The test device provided to us exhibited a problem: CPU throttling while running 3D applications. This was reflected in choppy games - sometimes to a greater extent, sometimes to a lesser extent. It was possible to trace the problem back to the BIOS: Out of the seven BIOS versions released so far, only the first three versions (FB01 to FB03) work without problems - our test device was shipped with BIOS version FB07. Therefore, we ultimately chose to install BIOS version FB03 to carry out our testing.
Windows 10 or Windows 11 - It depends on the BIOS version
The G5 is only compatible with Windows 11 starting with BIOS version FB06. Earlier versions cause the laptop to freeze even before the actual boot of a previously installed Windows 11 OS. Windows 10 works with all BIOS versions.
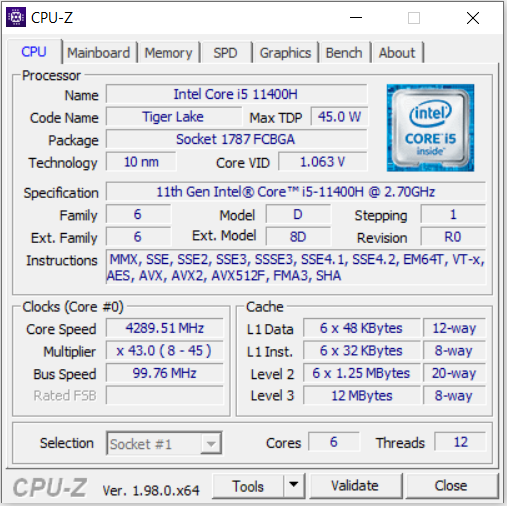
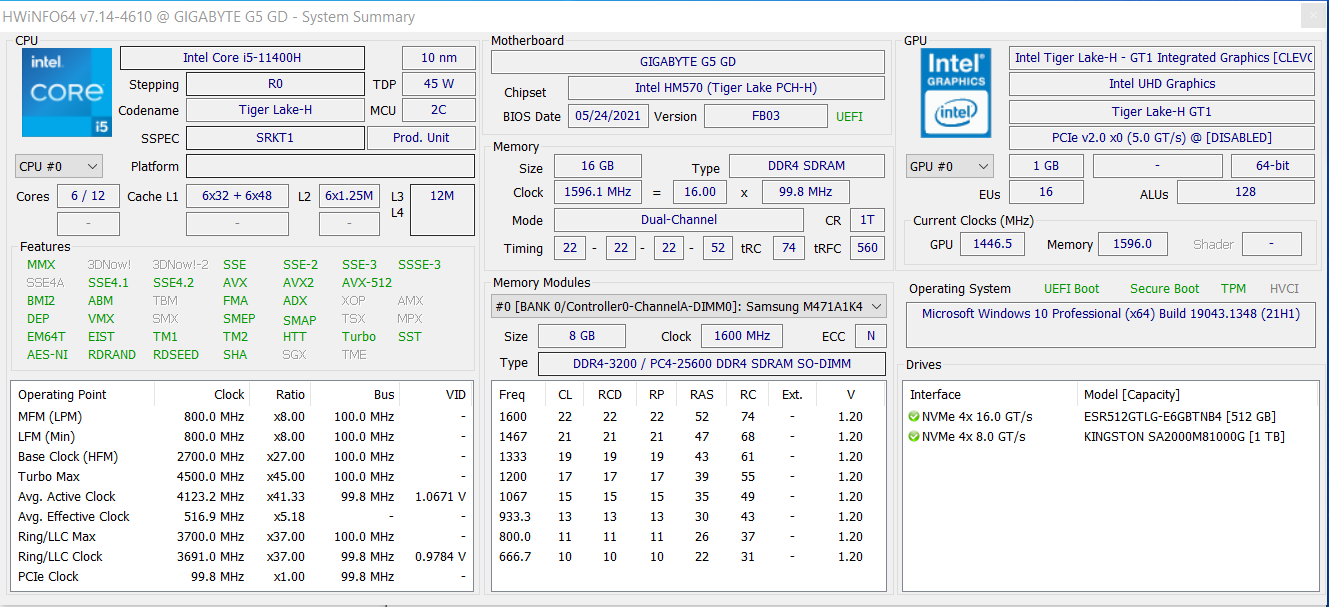
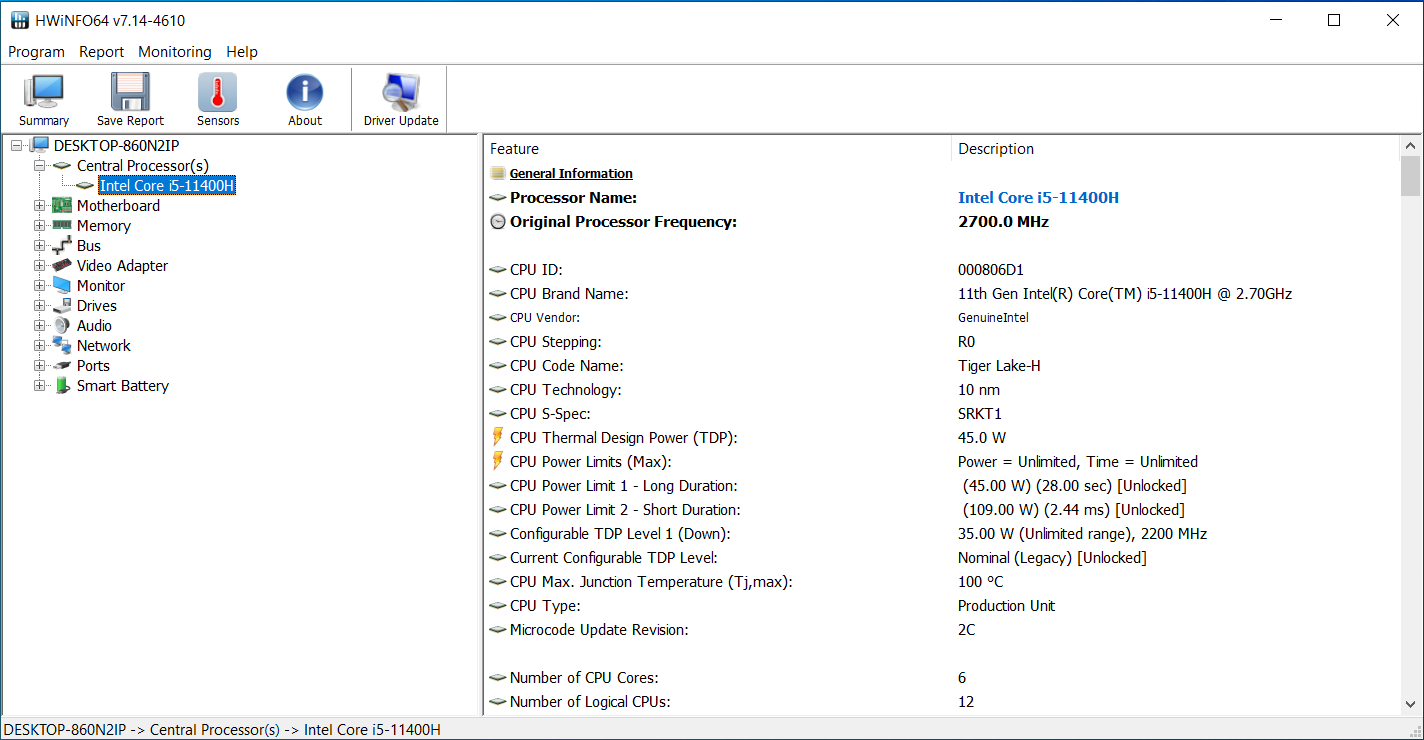
Processor
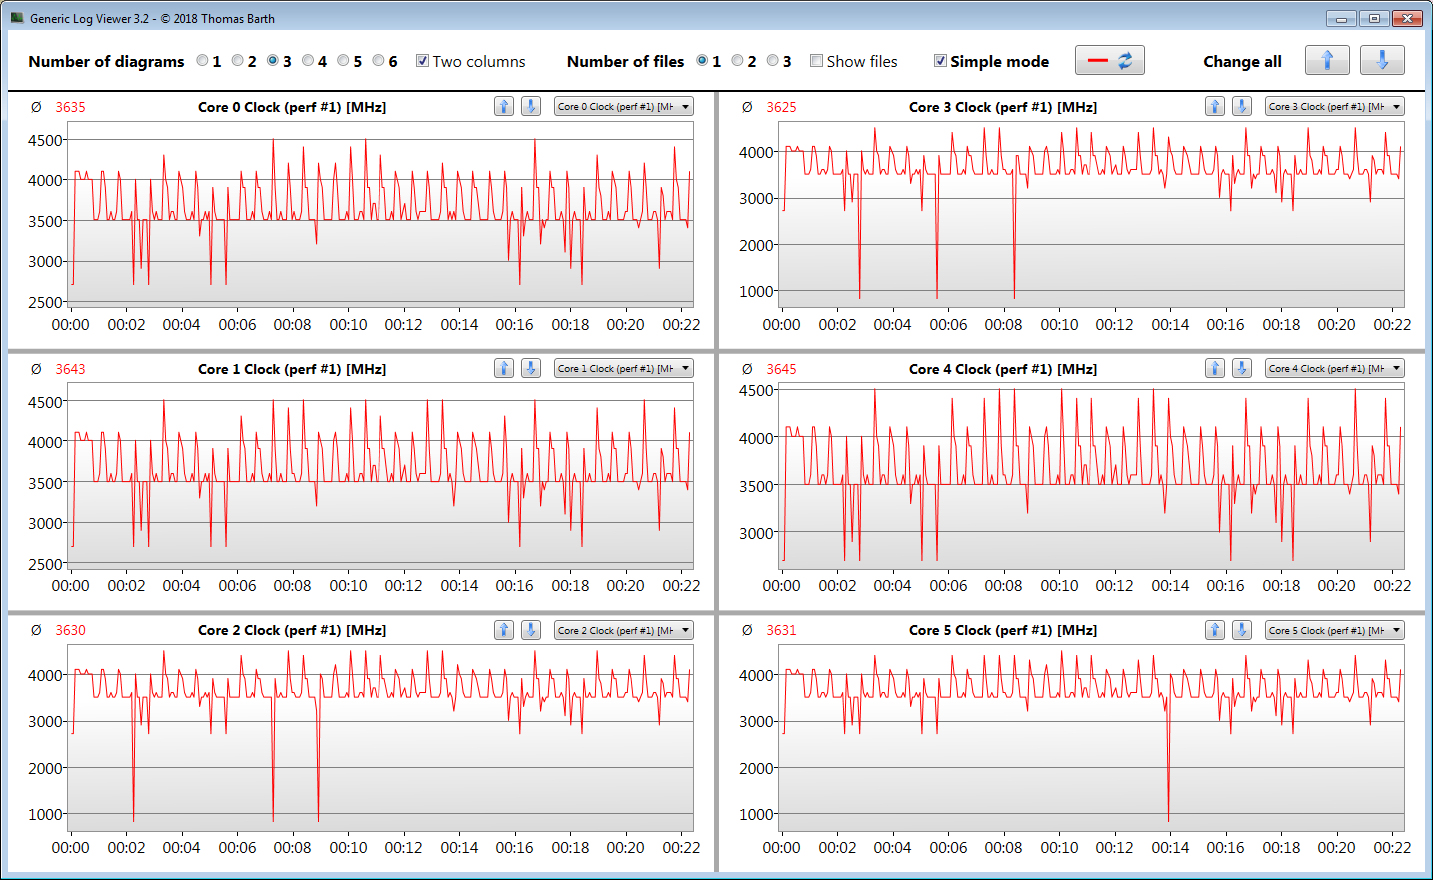
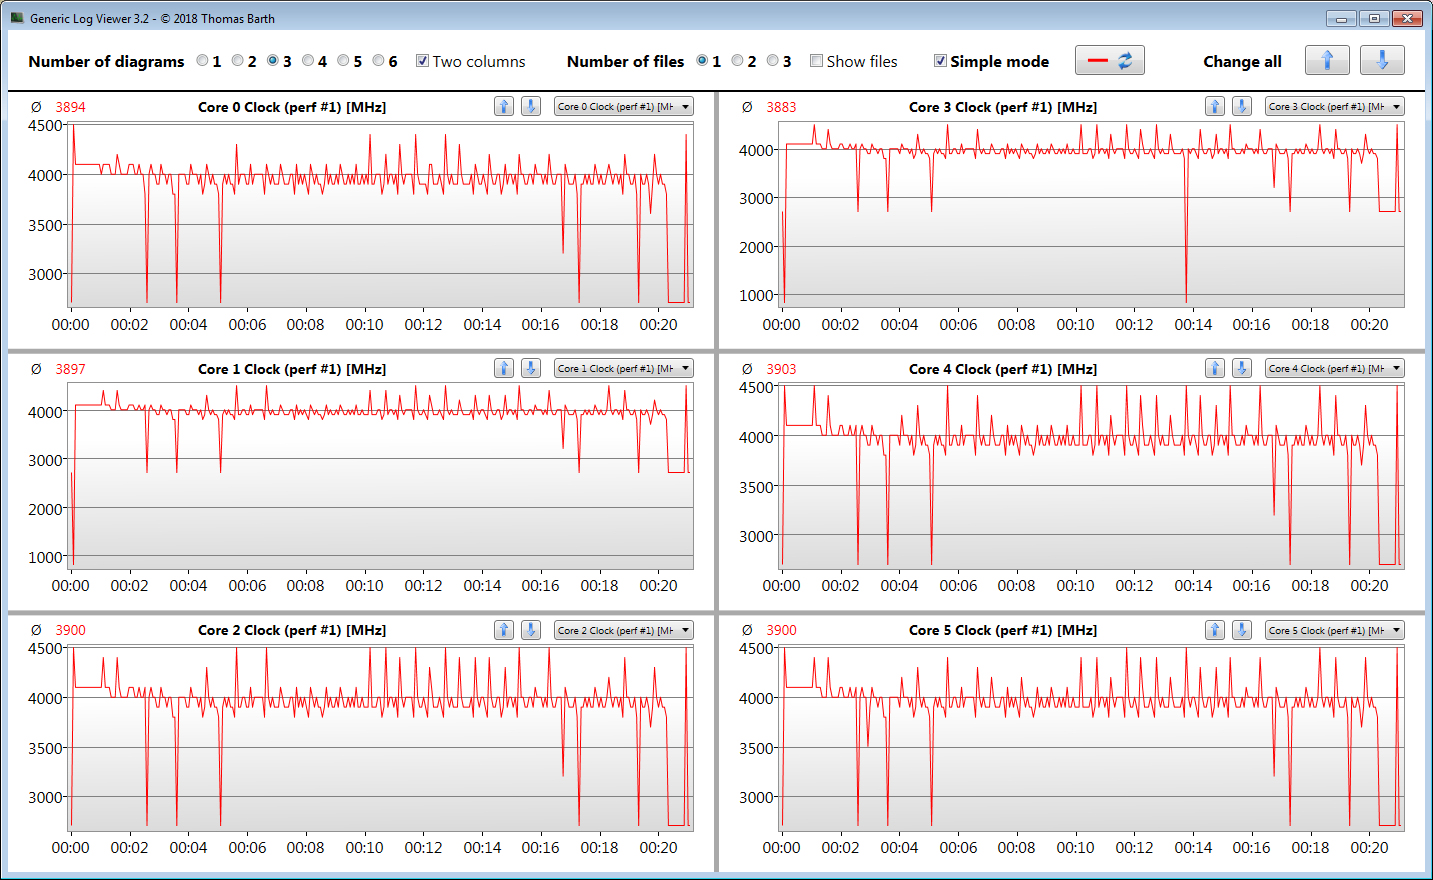
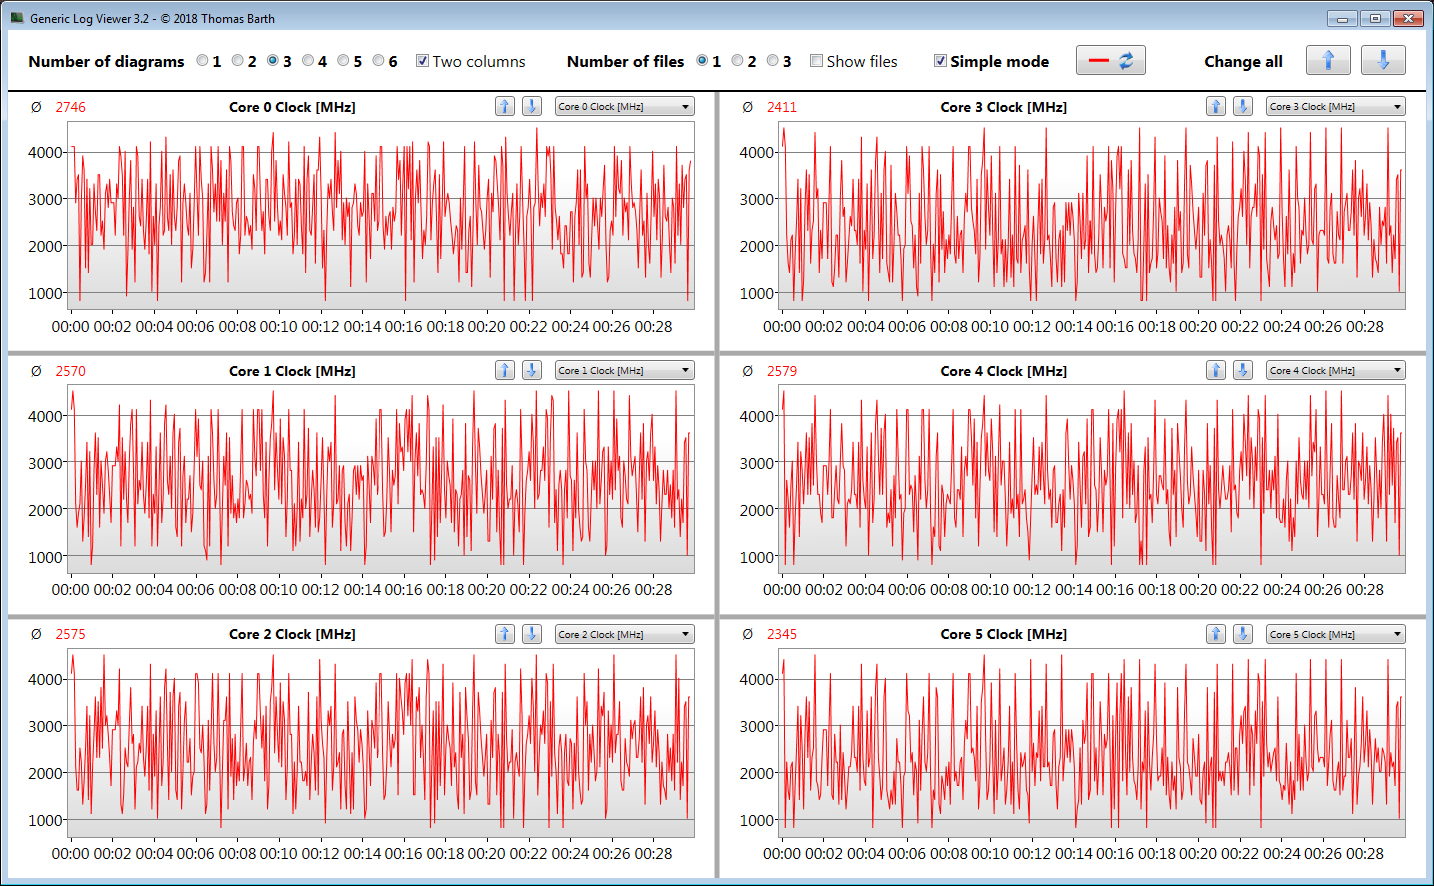
The Core i7-11400H hexa-core processor (Tiger Lake) reaches clock rates of 4.1 GHz (six cores) to 4.5 GHz (one core). Hyper-Threading (two threads per core) is supported. The CPU tests of the CB R15 benchmark are run at 4.1 GHz (multi) and 4.1 to 4.5 GHz (single). The clock rates are 1.9 to 2 GHz (multi) and 3.1 to 4.5 GHz (single), respectively, on battery power.
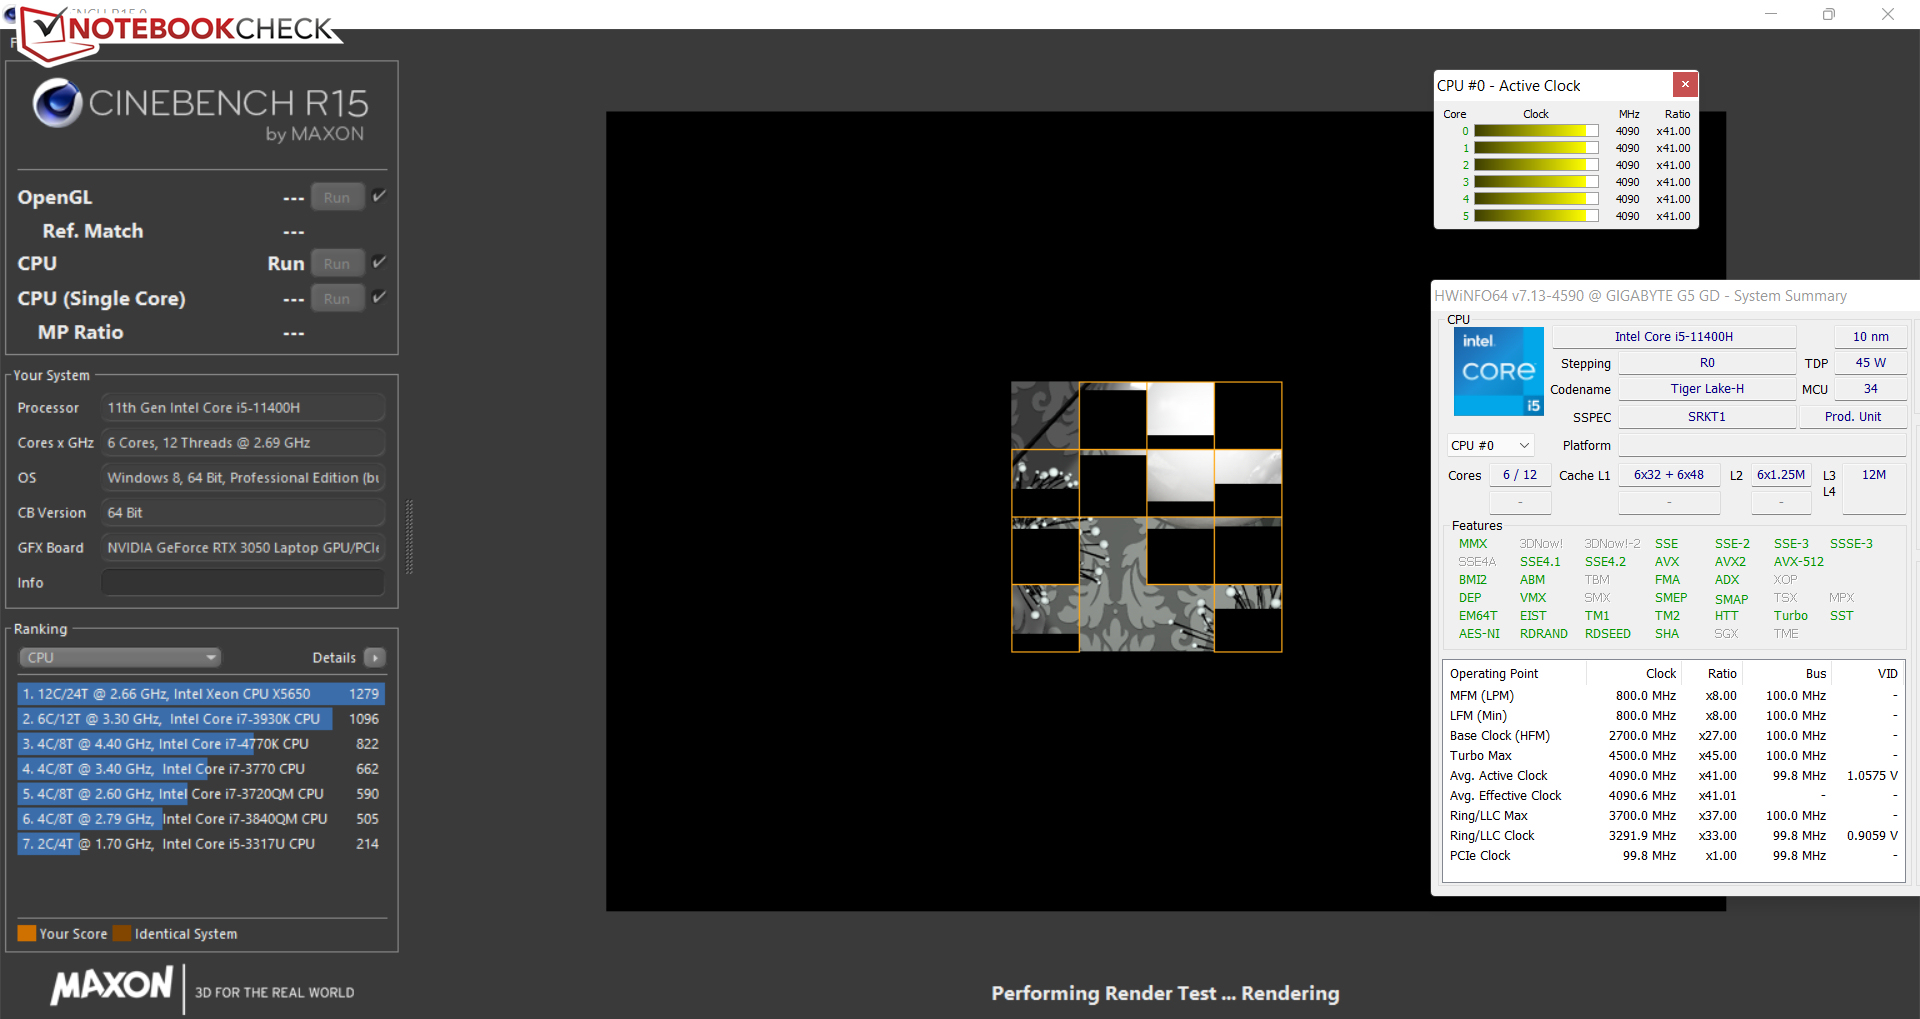
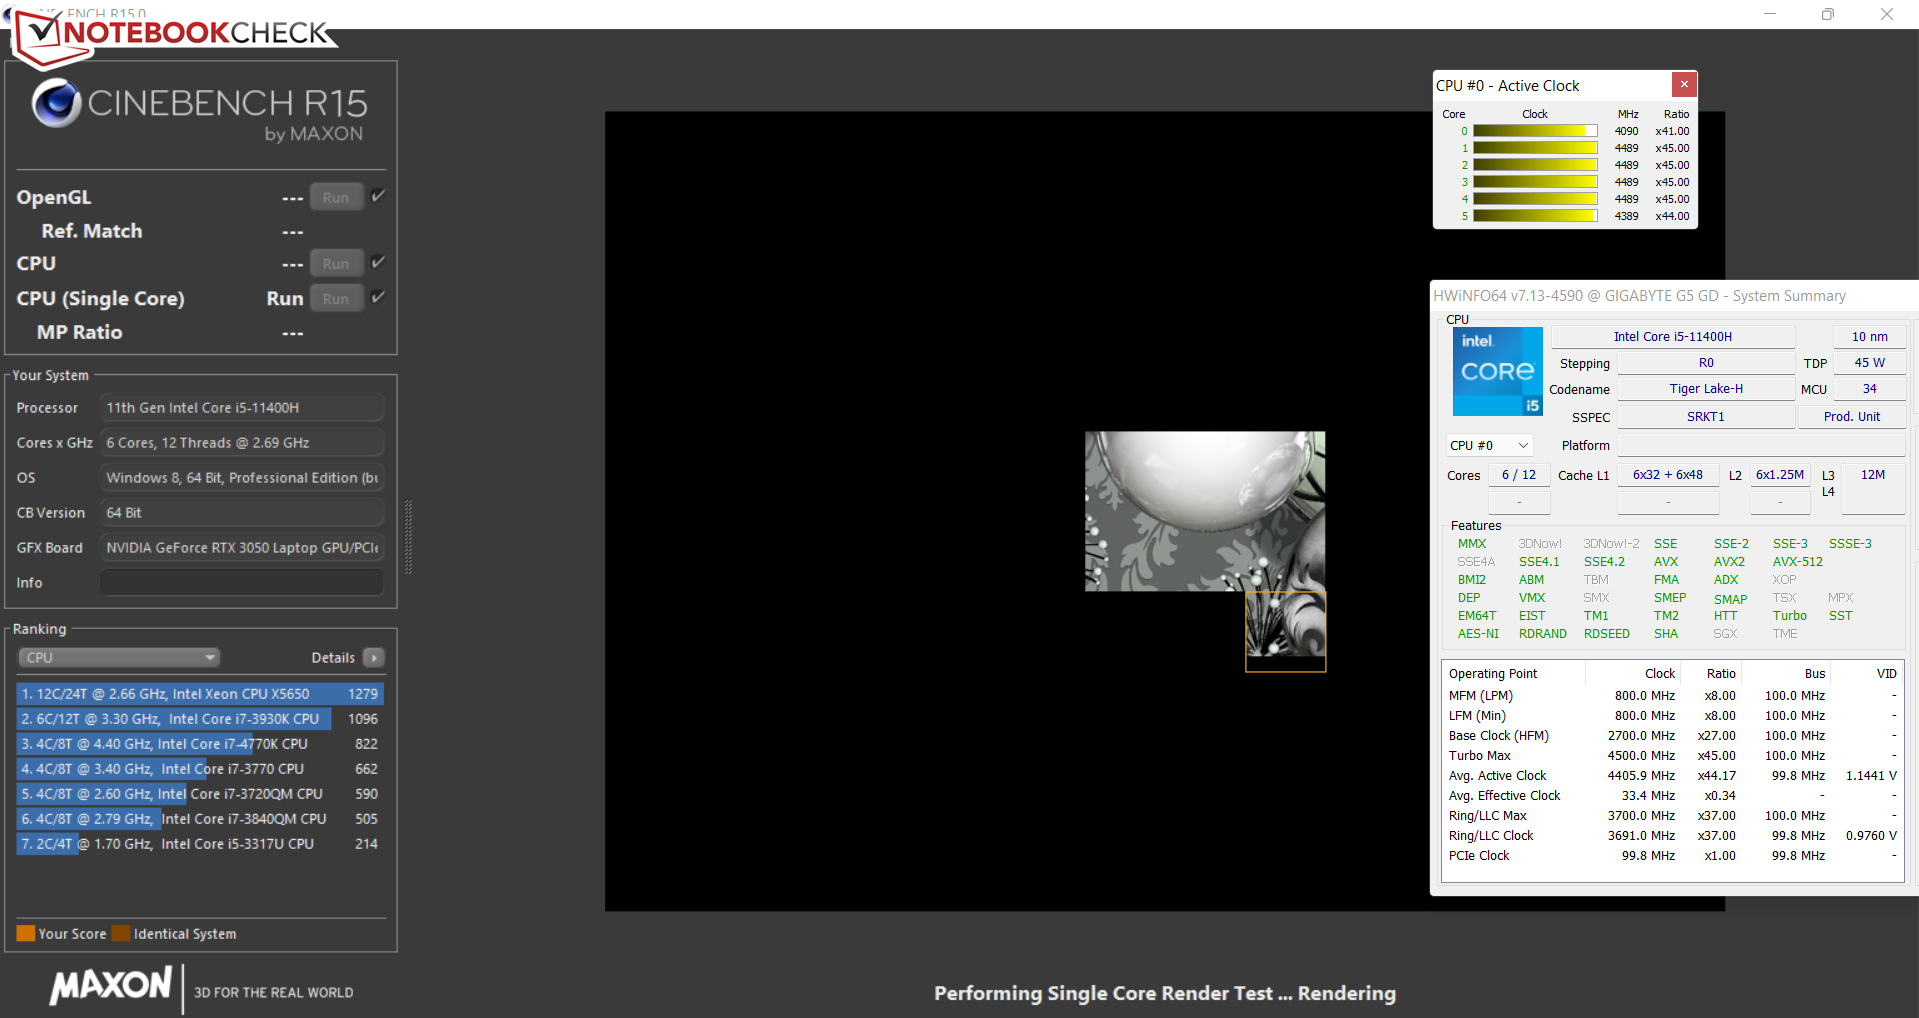
The Cinebench R15 multi endurance test (min. 30 minutes) shows that the CPU Turbo is used continuously - at a medium level. A slight increase of the Turbo clock rate is achieved by selecting the "Performance Mode" profile.
Odd: While the "Performance Mode" profile increases multithread performance a bit, single-thread performance drops at the same time. This might be related to the outdated BIOS version that we had to install.
Cinebench R15 Multi endurance test
| CPU Performance rating - Percent | |
| Average of class Gaming | |
| Lenovo Legion 5 15ACH-82JU00C6GE-FL | |
| Dell G15 5515 | |
| Gigabyte G5 GD | |
| Gigabyte G5 GD | |
| Average Intel Core i5-11400H | |
| Gigabyte G5 GD | |
| MSI GF65 Thin 10UE | |
| Gigabyte G5 KC | |
| Cinebench R23 | |
| Multi Core | |
| Average of class Gaming (10488 - 42661, n=104, last 2 years) | |
| Lenovo Legion 5 15ACH-82JU00C6GE-FL | |
| Dell G15 5515 | |
| Gigabyte G5 GD (Leistungsmodus) | |
| Gigabyte G5 GD | |
| Average Intel Core i5-11400H (6674 - 9406, n=7) | |
| MSI GF65 Thin 10UE | |
| Gigabyte G5 KC | |
| Gigabyte G5 GD (Stromsparmodus) | |
| Single Core | |
| Average of class Gaming (1601 - 2415, n=104, last 2 years) | |
| Gigabyte G5 GD | |
| Gigabyte G5 GD (Stromsparmodus) | |
| Average Intel Core i5-11400H (1349 - 1472, n=6) | |
| Dell G15 5515 | |
| Lenovo Legion 5 15ACH-82JU00C6GE-FL | |
| Gigabyte G5 GD (Leistungsmodus) | |
| MSI GF65 Thin 10UE | |
| Gigabyte G5 KC | |
| Cinebench R20 | |
| CPU (Multi Core) | |
| Average of class Gaming (4029 - 16433, n=103, last 2 years) | |
| Lenovo Legion 5 15ACH-82JU00C6GE-FL | |
| Dell G15 5515 | |
| Gigabyte G5 GD (Leistungsmodus) | |
| Gigabyte G5 GD | |
| Average Intel Core i5-11400H (2550 - 3740, n=7) | |
| Gigabyte G5 KC | |
| MSI GF65 Thin 10UE | |
| Gigabyte G5 GD (Stromsparmodus) | |
| CPU (Single Core) | |
| Average of class Gaming (622 - 913, n=103, last 2 years) | |
| Gigabyte G5 GD | |
| Gigabyte G5 GD (Stromsparmodus) | |
| Average Intel Core i5-11400H (522 - 569, n=6) | |
| Dell G15 5515 | |
| Lenovo Legion 5 15ACH-82JU00C6GE-FL | |
| Gigabyte G5 GD (Leistungsmodus) | |
| MSI GF65 Thin 10UE | |
| Gigabyte G5 KC | |
| Cinebench R15 | |
| CPU Multi 64Bit | |
| Average of class Gaming (1578 - 6330, n=102, last 2 years) | |
| Lenovo Legion 5 15ACH-82JU00C6GE-FL | |
| Dell G15 5515 | |
| Gigabyte G5 GD (Leistungsmodus) | |
| Gigabyte G5 GD | |
| Average Intel Core i5-11400H (1014 - 1532, n=7) | |
| Gigabyte G5 KC | |
| MSI GF65 Thin 10UE | |
| Gigabyte G5 GD (Stromsparmodus) | |
| CPU Single 64Bit | |
| Average of class Gaming (188.8 - 350, n=103, last 2 years) | |
| Dell G15 5515 | |
| Lenovo Legion 5 15ACH-82JU00C6GE-FL | |
| Gigabyte G5 GD (Stromsparmodus) | |
| Gigabyte G5 GD | |
| Average Intel Core i5-11400H (202 - 219, n=6) | |
| MSI GF65 Thin 10UE | |
| Gigabyte G5 GD (Leistungsmodus) | |
| Gigabyte G5 KC | |
| Blender - v2.79 BMW27 CPU | |
| Gigabyte G5 GD (Stromsparmodus) | |
| MSI GF65 Thin 10UE | |
| Average Intel Core i5-11400H (340 - 483, n=6) | |
| Gigabyte G5 KC | |
| Gigabyte G5 GD | |
| Gigabyte G5 GD (Leistungsmodus) | |
| Dell G15 5515 | |
| Lenovo Legion 5 15ACH-82JU00C6GE-FL | |
| Average of class Gaming (79 - 330, n=101, last 2 years) | |
| 7-Zip 18.03 | |
| 7z b 4 | |
| Average of class Gaming (33491 - 148086, n=102, last 2 years) | |
| Dell G15 5515 | |
| Lenovo Legion 5 15ACH-82JU00C6GE-FL | |
| Gigabyte G5 GD (Leistungsmodus) | |
| Gigabyte G5 GD | |
| Average Intel Core i5-11400H (27615 - 40268, n=6) | |
| MSI GF65 Thin 10UE | |
| Gigabyte G5 KC | |
| Gigabyte G5 GD (Stromsparmodus) | |
| 7z b 4 -mmt1 | |
| Average of class Gaming (4824 - 7436, n=102, last 2 years) | |
| Dell G15 5515 | |
| Lenovo Legion 5 15ACH-82JU00C6GE-FL | |
| MSI GF65 Thin 10UE | |
| Gigabyte G5 GD | |
| Gigabyte G5 GD (Stromsparmodus) | |
| Average Intel Core i5-11400H (4802 - 5343, n=6) | |
| Gigabyte G5 KC | |
| Gigabyte G5 GD (Leistungsmodus) | |
| Geekbench 5.5 | |
| Multi-Core | |
| Average of class Gaming (6460 - 28263, n=102, last 2 years) | |
| Lenovo Legion 5 15ACH-82JU00C6GE-FL | |
| Dell G15 5515 | |
| Gigabyte G5 GD (Leistungsmodus) | |
| Gigabyte G5 GD | |
| MSI GF65 Thin 10UE | |
| Gigabyte G5 KC | |
| Gigabyte G5 KC | |
| Average Intel Core i5-11400H (4679 - 7018, n=7) | |
| Gigabyte G5 GD (Stromsparmodus) | |
| Single-Core | |
| Average of class Gaming (1403 - 2474, n=102, last 2 years) | |
| Gigabyte G5 GD (Stromsparmodus) | |
| Gigabyte G5 GD | |
| Average Intel Core i5-11400H (1396 - 1528, n=7) | |
| Lenovo Legion 5 15ACH-82JU00C6GE-FL | |
| Dell G15 5515 | |
| Gigabyte G5 GD (Leistungsmodus) | |
| MSI GF65 Thin 10UE | |
| Gigabyte G5 KC | |
| Gigabyte G5 KC | |
| HWBOT x265 Benchmark v2.2 - 4k Preset | |
| Average of class Gaming (11.5 - 44.4, n=102, last 2 years) | |
| Lenovo Legion 5 15ACH-82JU00C6GE-FL | |
| Dell G15 5515 | |
| Gigabyte G5 GD (Leistungsmodus) | |
| Gigabyte G5 GD | |
| Average Intel Core i5-11400H (8.19 - 11.3, n=6) | |
| MSI GF65 Thin 10UE | |
| Gigabyte G5 KC | |
| Gigabyte G5 GD (Stromsparmodus) | |
| LibreOffice - 20 Documents To PDF | |
| Lenovo Legion 5 15ACH-82JU00C6GE-FL | |
| Dell G15 5515 | |
| Gigabyte G5 KC | |
| Average of class Gaming (33.2 - 88.8, n=102, last 2 years) | |
| Average Intel Core i5-11400H (41.4 - 53, n=6) | |
| MSI GF65 Thin 10UE | |
| Gigabyte G5 GD (Leistungsmodus) | |
| Gigabyte G5 GD | |
| Gigabyte G5 GD (Stromsparmodus) | |
| R Benchmark 2.5 - Overall mean | |
| Gigabyte G5 KC | |
| Gigabyte G5 GD (Leistungsmodus) | |
| Average Intel Core i5-11400H (0.581 - 0.644, n=6) | |
| MSI GF65 Thin 10UE | |
| Gigabyte G5 GD | |
| Gigabyte G5 GD (Stromsparmodus) | |
| Lenovo Legion 5 15ACH-82JU00C6GE-FL | |
| Dell G15 5515 | |
| Average of class Gaming (0.3439 - 0.59, n=102, last 2 years) | |
* ... smaller is better
| Performance rating - Percent | |
| Average of class Gaming | |
| Lenovo Legion 5 15ACH-82JU00C6GE-FL | |
| Dell G15 5515 | |
| Gigabyte G5 GD | |
| Gigabyte G5 GD | |
| Average Intel Core i5-11400H | |
| Gigabyte G5 KC | |
System performance
The fast and smooth system offers enough computing power for all common tasks - gaming, video editing, and image processing are no major challenges for the laptop. This is accompanied by good PCMark results.
| PCMark 8 Home Score Accelerated v2 | 4312 points | |
| PCMark 8 Creative Score Accelerated v2 | 5850 points | |
| PCMark 8 Work Score Accelerated v2 | 6010 points | |
| PCMark 10 Score | 5895 points | |
Help | ||
| PCMark 10 / Score | |
| Average of class Gaming (5828 - 12414, n=93, last 2 years) | |
| Lenovo Legion 5 15ACH-82JU00C6GE-FL | |
| Dell G15 5515 | |
| Gigabyte G5 KC | |
| Gigabyte G5 GD | |
| Average Intel Core i5-11400H, NVIDIA GeForce RTX 3050 4GB Laptop GPU (5136 - 5895, n=2) | |
| MSI GF65 Thin 10UE | |
| PCMark 10 / Essentials | |
| Average of class Gaming (8810 - 11935, n=97, last 2 years) | |
| Lenovo Legion 5 15ACH-82JU00C6GE-FL | |
| Dell G15 5515 | |
| Gigabyte G5 GD | |
| MSI GF65 Thin 10UE | |
| Gigabyte G5 KC | |
| Average Intel Core i5-11400H, NVIDIA GeForce RTX 3050 4GB Laptop GPU (8610 - 9155, n=2) | |
| PCMark 10 / Productivity | |
| Average of class Gaming (6845 - 25323, n=95, last 2 years) | |
| Lenovo Legion 5 15ACH-82JU00C6GE-FL | |
| Dell G15 5515 | |
| Gigabyte G5 GD | |
| Average Intel Core i5-11400H, NVIDIA GeForce RTX 3050 4GB Laptop GPU (8149 - 8506, n=2) | |
| Gigabyte G5 KC | |
| MSI GF65 Thin 10UE | |
| PCMark 10 / Digital Content Creation | |
| Average of class Gaming (7602 - 19954, n=95, last 2 years) | |
| Gigabyte G5 KC | |
| Lenovo Legion 5 15ACH-82JU00C6GE-FL | |
| Dell G15 5515 | |
| Gigabyte G5 GD | |
| Average Intel Core i5-11400H, NVIDIA GeForce RTX 3050 4GB Laptop GPU (5242 - 7140, n=2) | |
| MSI GF65 Thin 10UE | |
| AIDA64 / Memory Copy | |
| Average of class Gaming (21750 - 129946, n=102, last 2 years) | |
| Gigabyte G5 GD | |
| Dell G15 5515 | |
| Lenovo Legion 5 15ACH-82JU00C6GE-FL | |
| Gigabyte G5 KC | |
| Average Intel Core i5-11400H (20513 - 42471, n=4) | |
| AIDA64 / Memory Read | |
| Average of class Gaming (22956 - 118858, n=102, last 2 years) | |
| Gigabyte G5 GD | |
| Dell G15 5515 | |
| Lenovo Legion 5 15ACH-82JU00C6GE-FL | |
| Gigabyte G5 KC | |
| Average Intel Core i5-11400H (23172 - 48221, n=4) | |
| AIDA64 / Memory Write | |
| Average of class Gaming (22297 - 135096, n=102, last 2 years) | |
| Gigabyte G5 GD | |
| Gigabyte G5 KC | |
| Dell G15 5515 | |
| Average Intel Core i5-11400H (21862 - 45893, n=4) | |
| Lenovo Legion 5 15ACH-82JU00C6GE-FL | |
| AIDA64 / Memory Latency | |
| Average of class Gaming (75.3 - 165.4, n=102, last 2 years) | |
| Gigabyte G5 GD | |
| Lenovo Legion 5 15ACH-82JU00C6GE-FL | |
| Dell G15 5515 | |
| Average Intel Core i5-11400H (73.3 - 95.9, n=5) | |
| Gigabyte G5 KC | |
* ... smaller is better
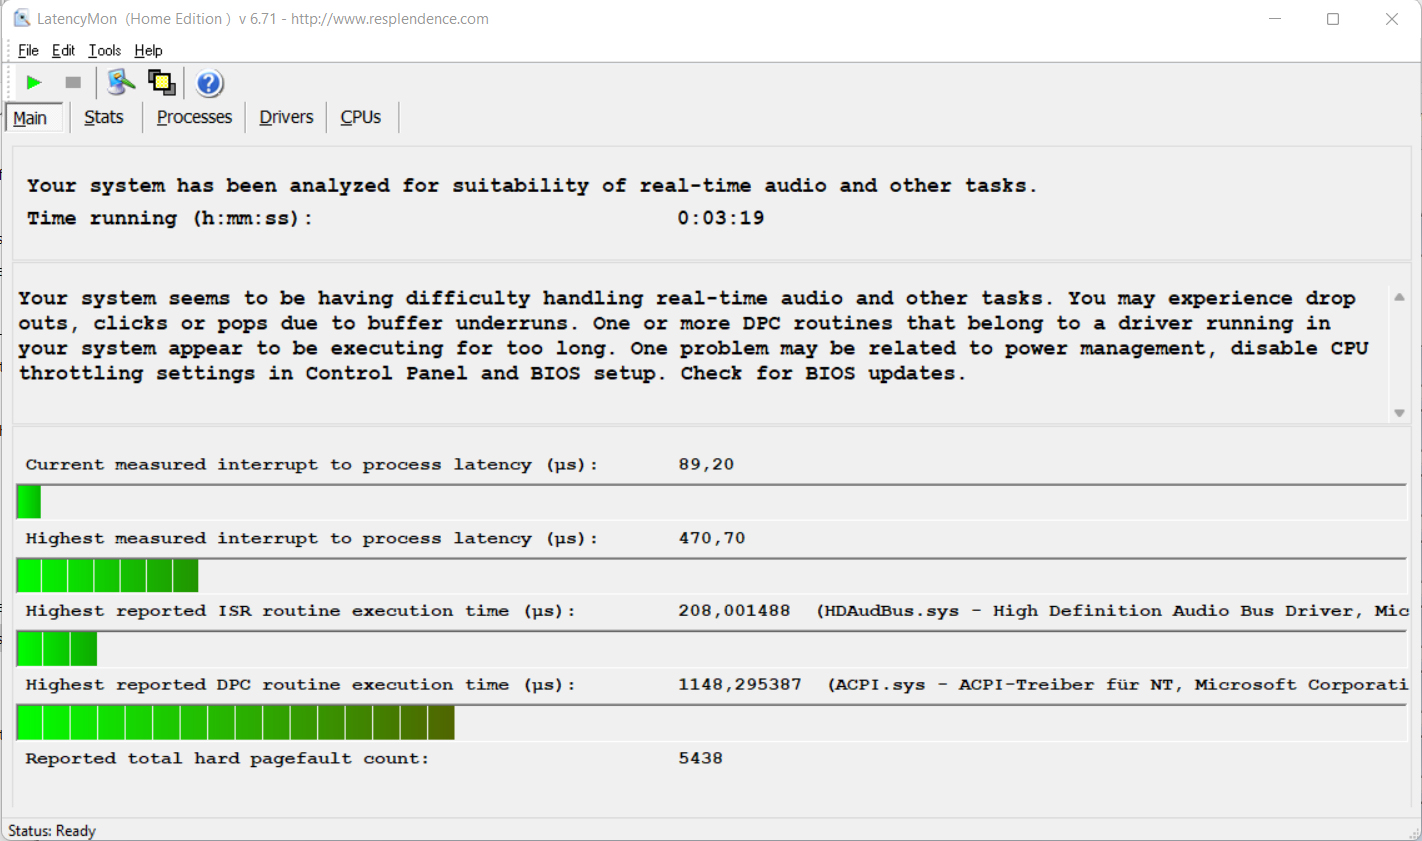
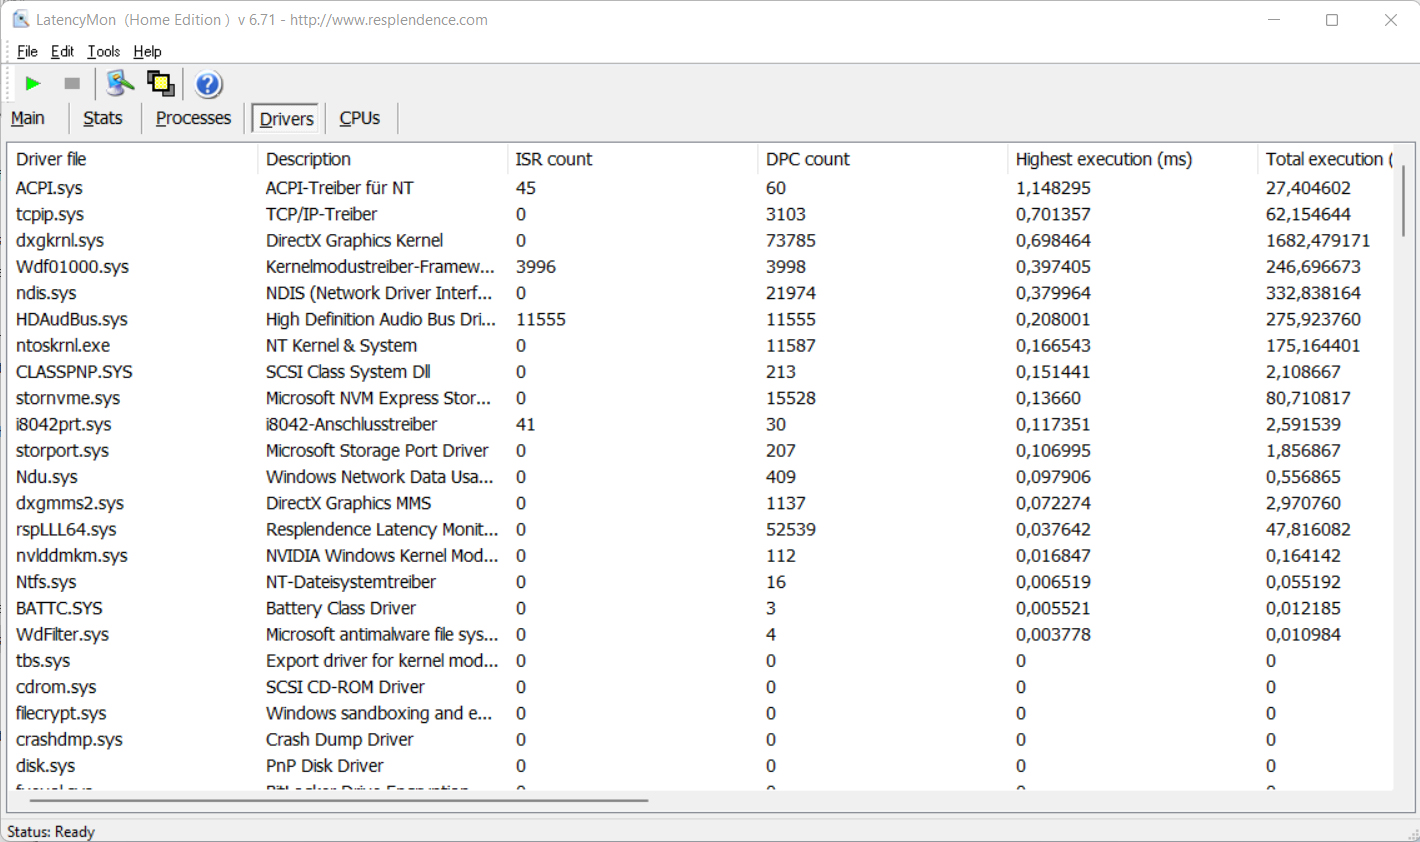
DPC latencies
Our standardized latency monitor test (web browsing, 4K video playback, high-load Prime95) revealed irregularities with DPC latencies. The system doesn't seem to be suitable for real-time video and audio editing. Future software updates could lead to improvements or even to worse performance.
| DPC Latencies / LatencyMon - interrupt to process latency (max), Web, Youtube, Prime95 | |
| MSI GF65 Thin 10UE | |
| Lenovo Legion 5 15ACH-82JU00C6GE-FL | |
| Dell G15 5515 | |
| Gigabyte G5 KC | |
| Gigabyte G5 GD | |
* ... smaller is better
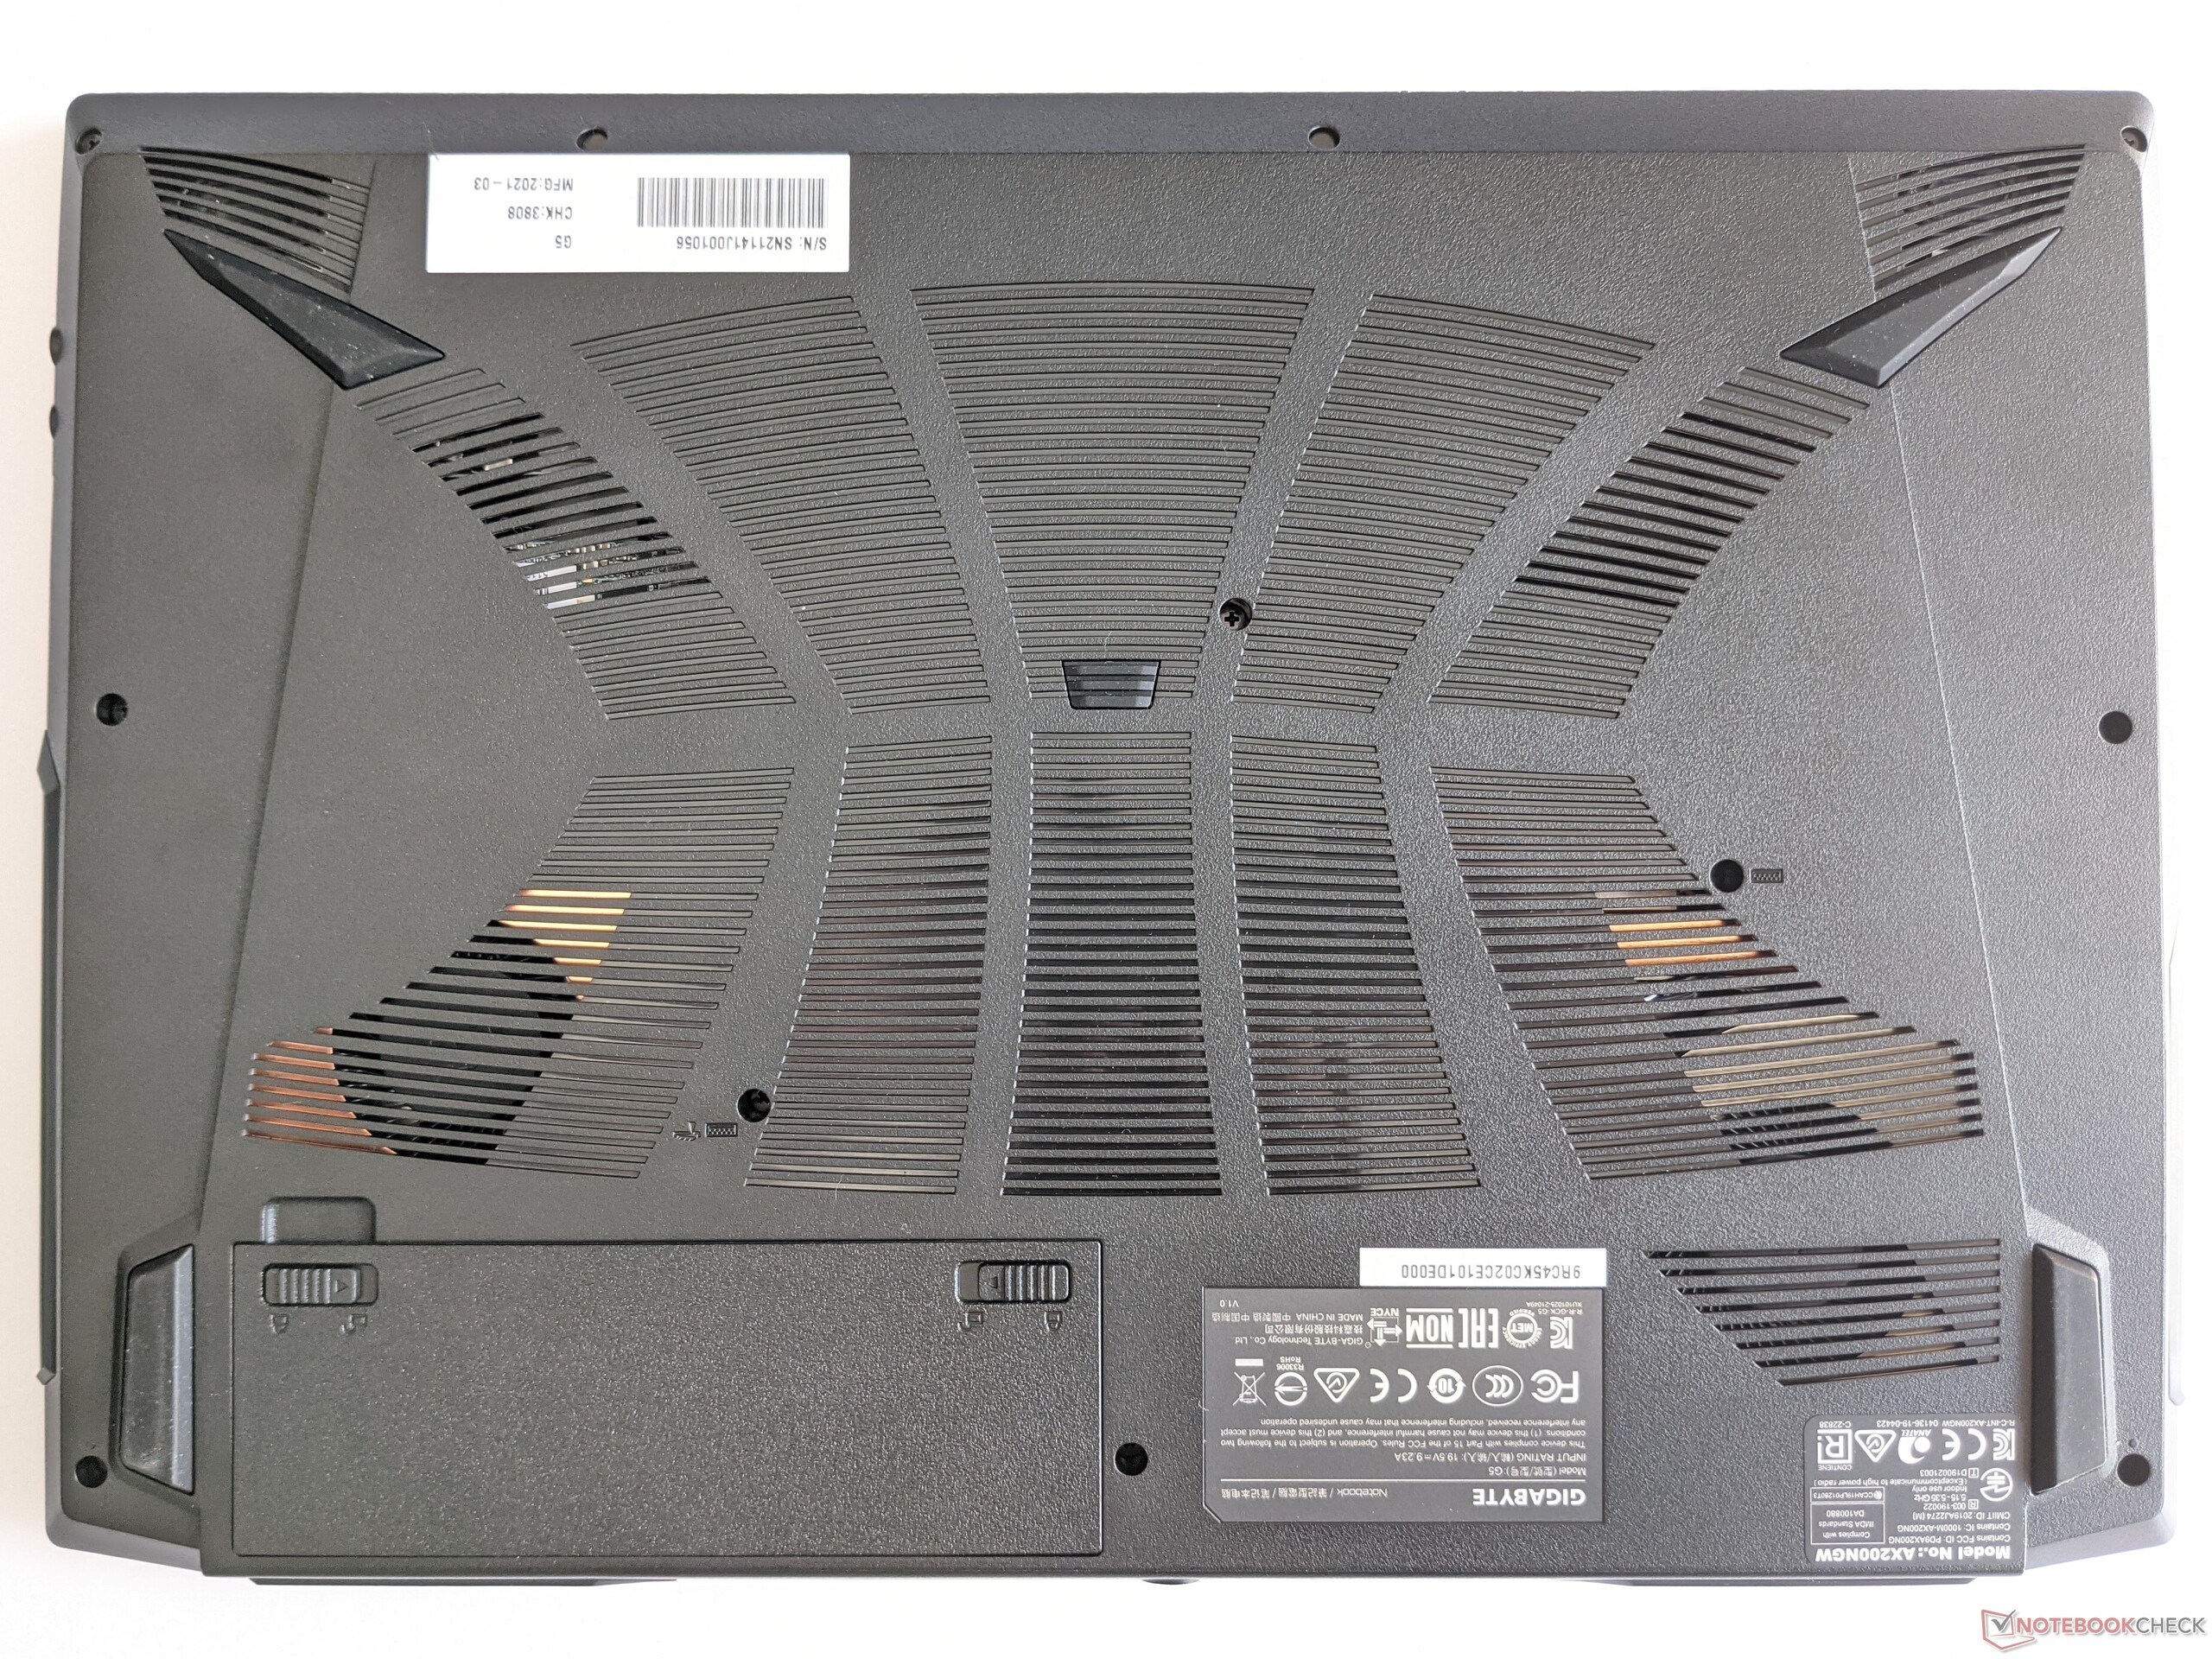
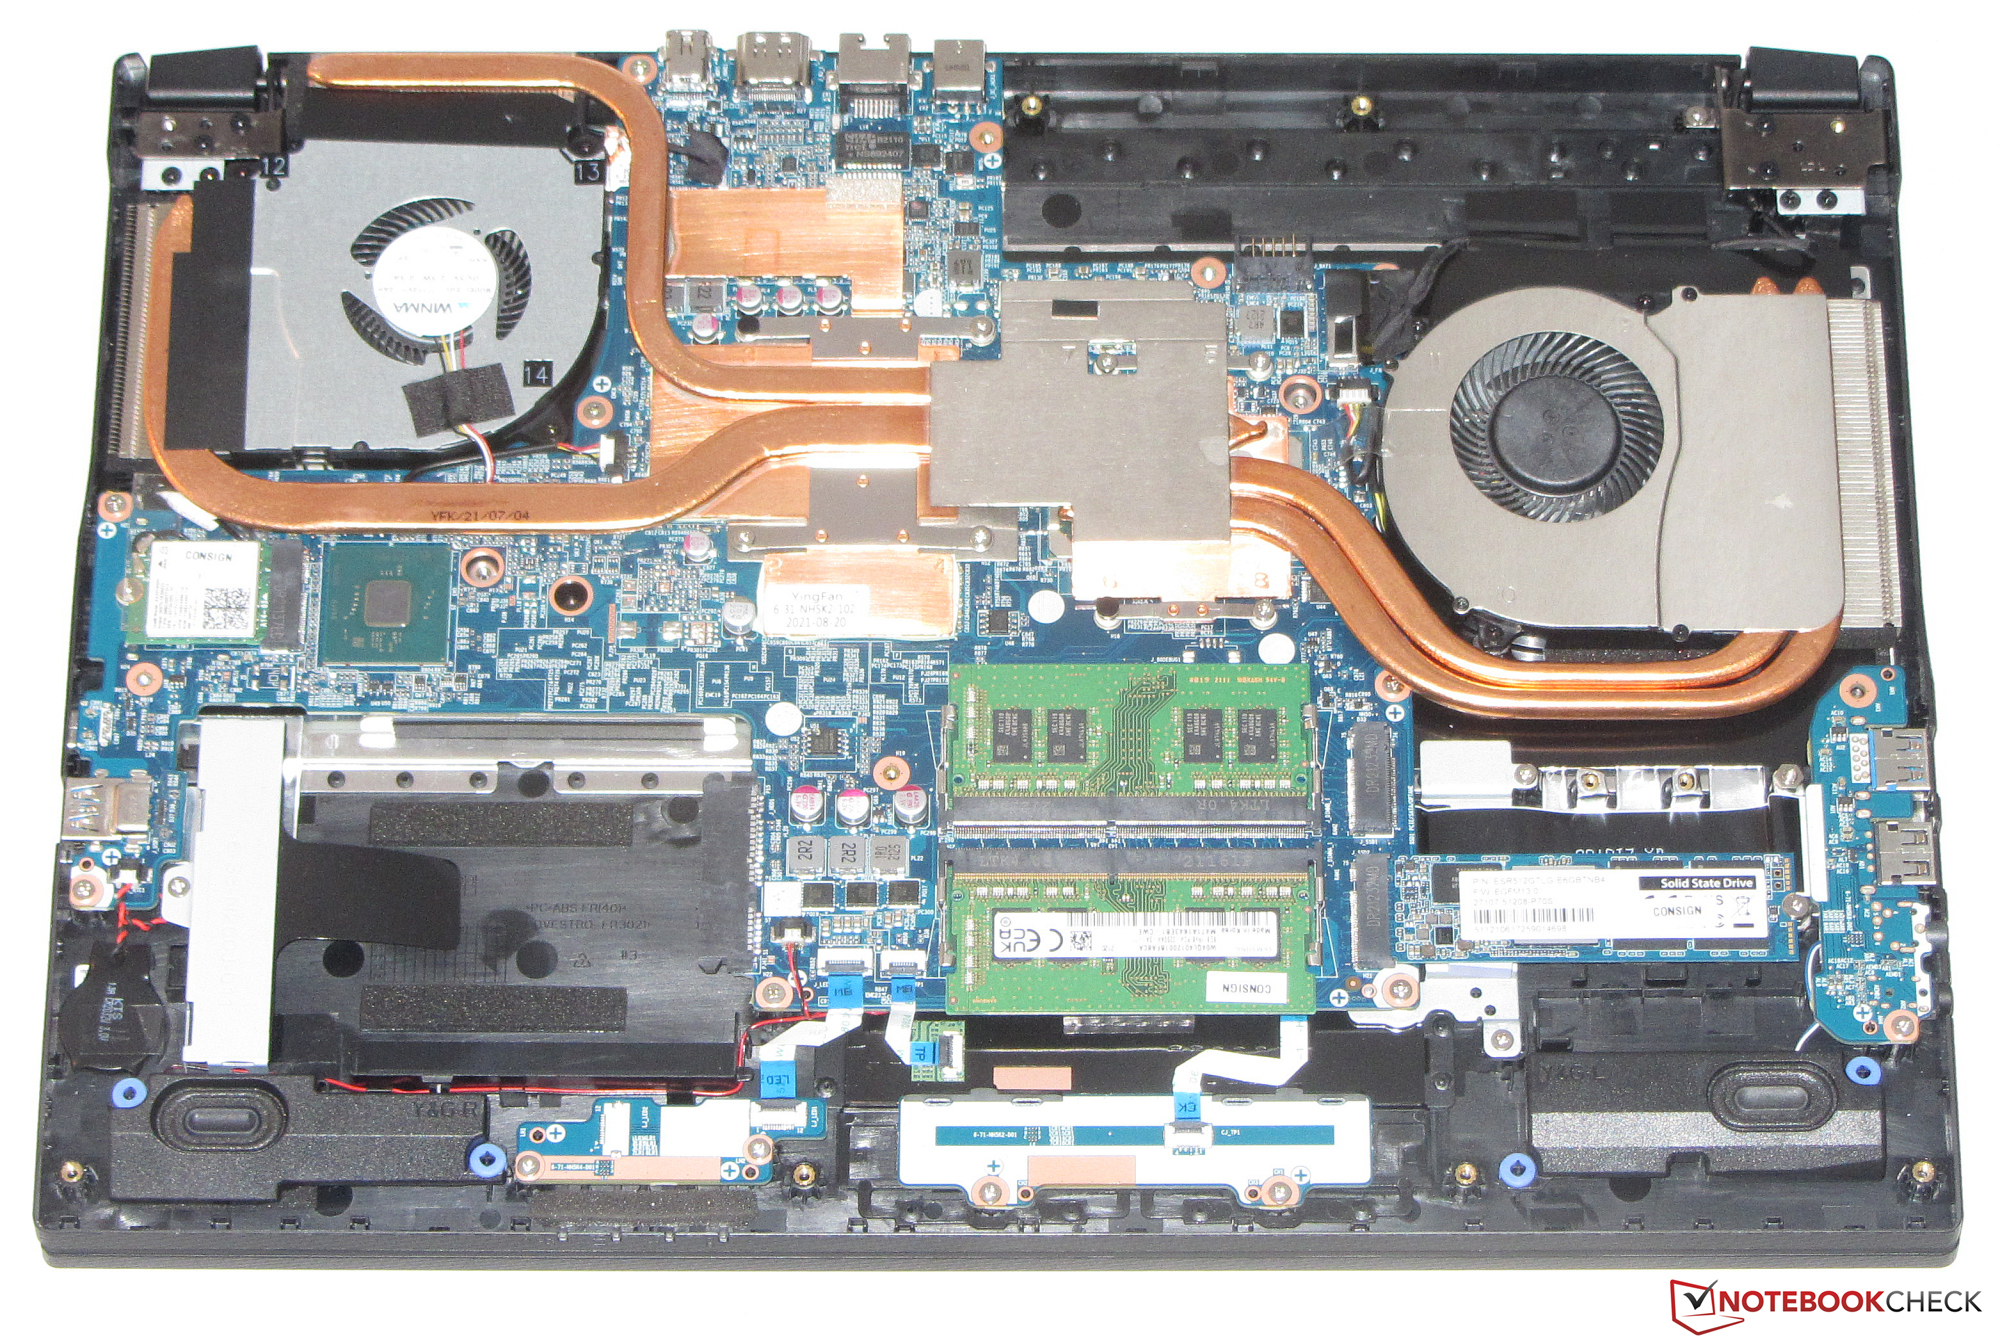
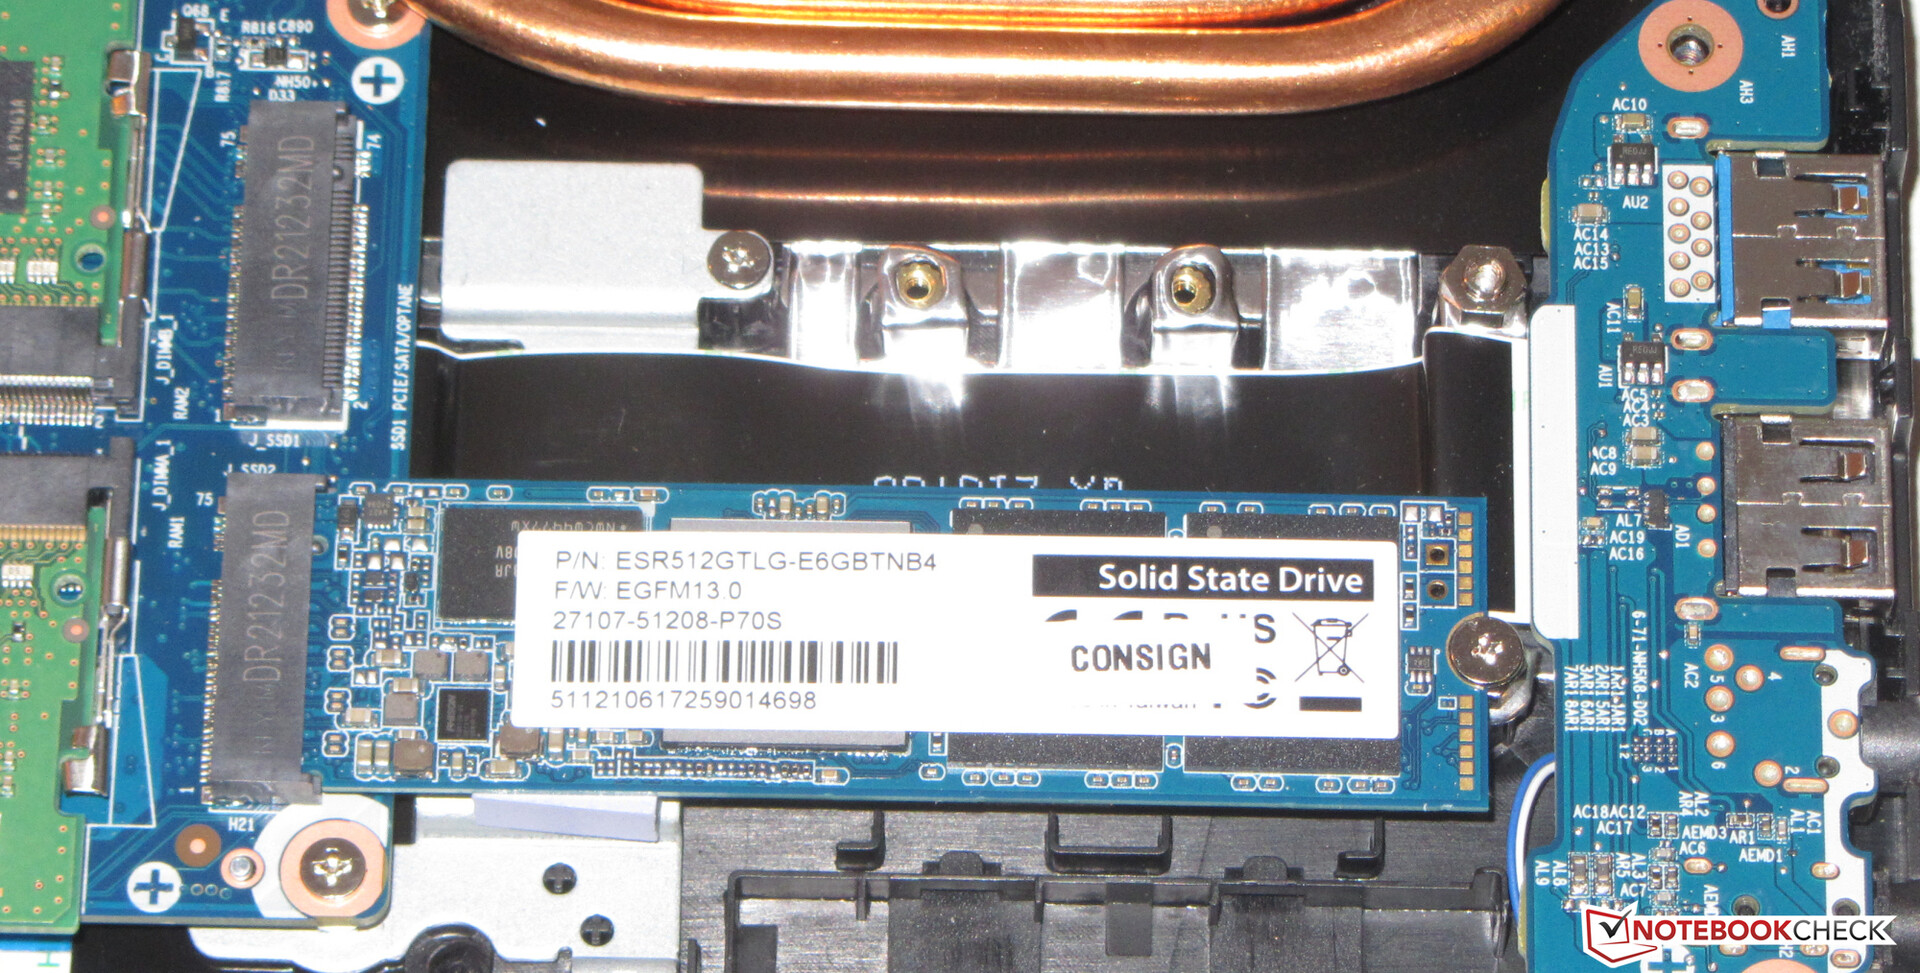
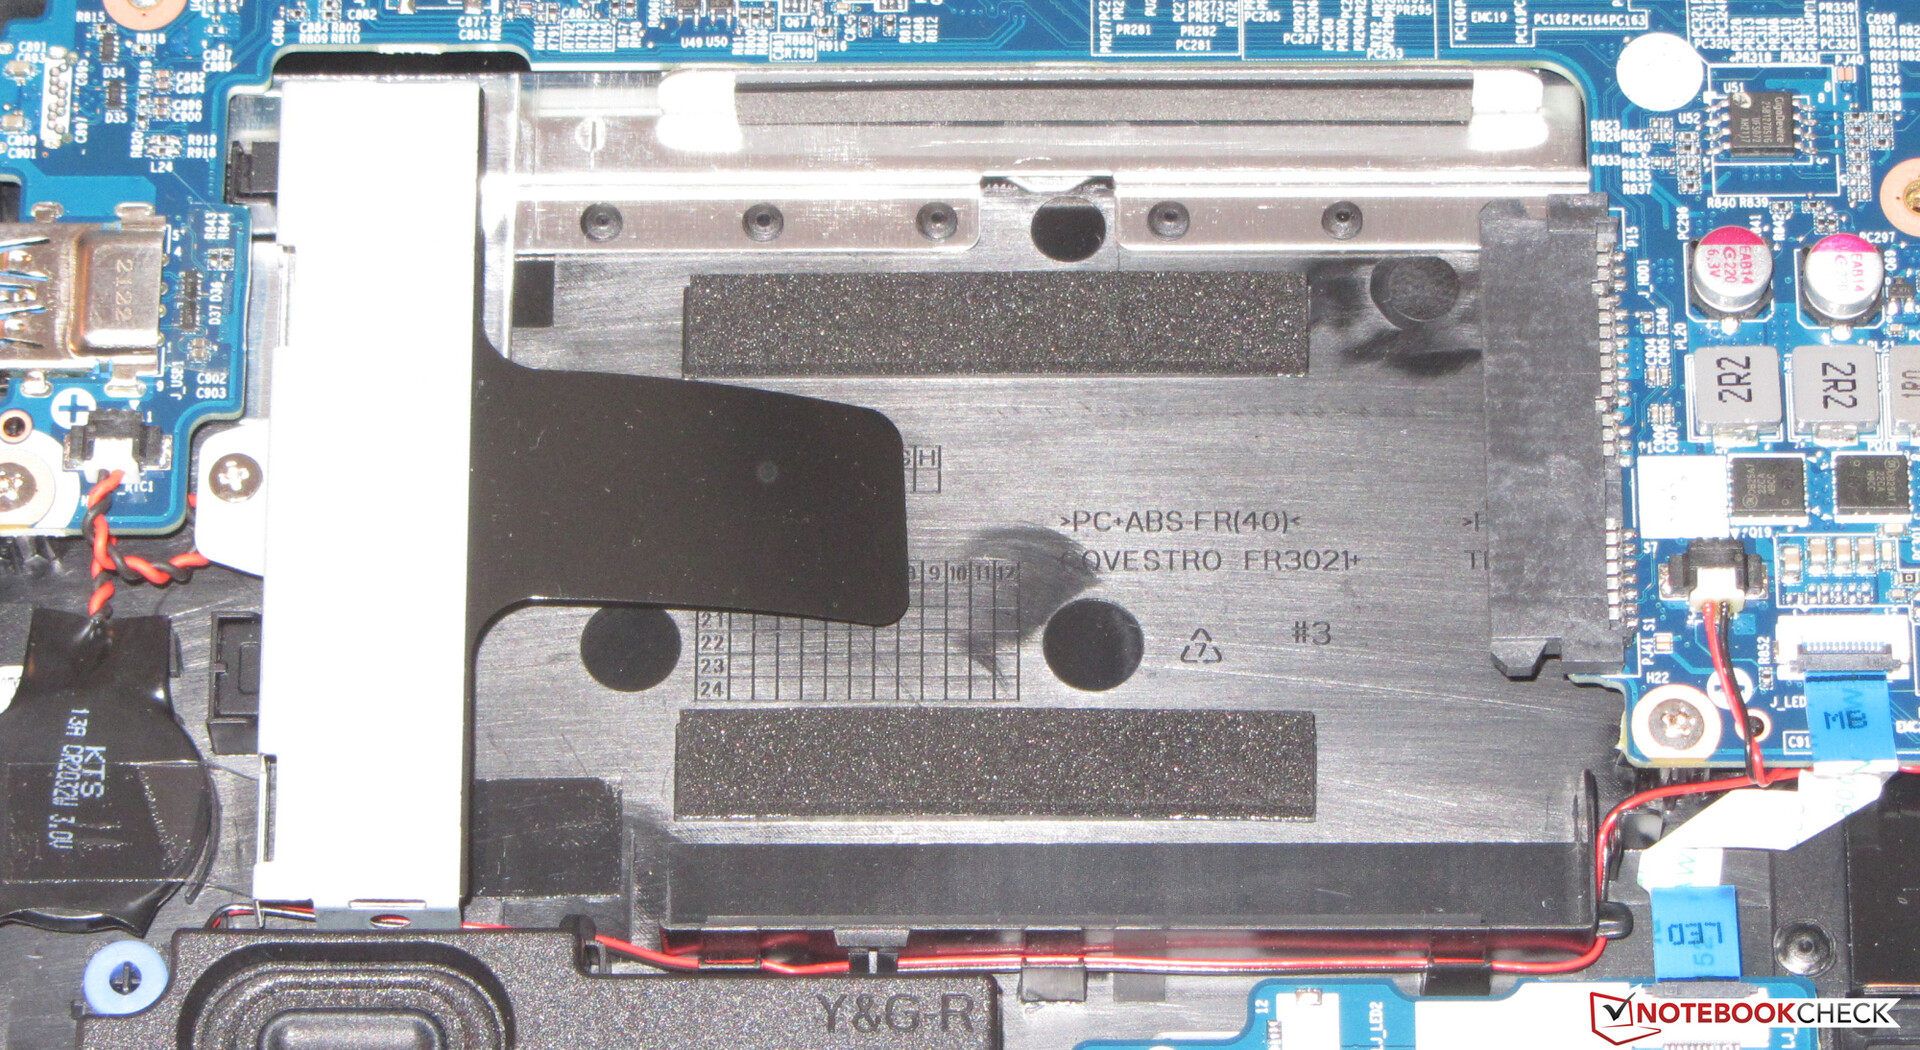
Storage
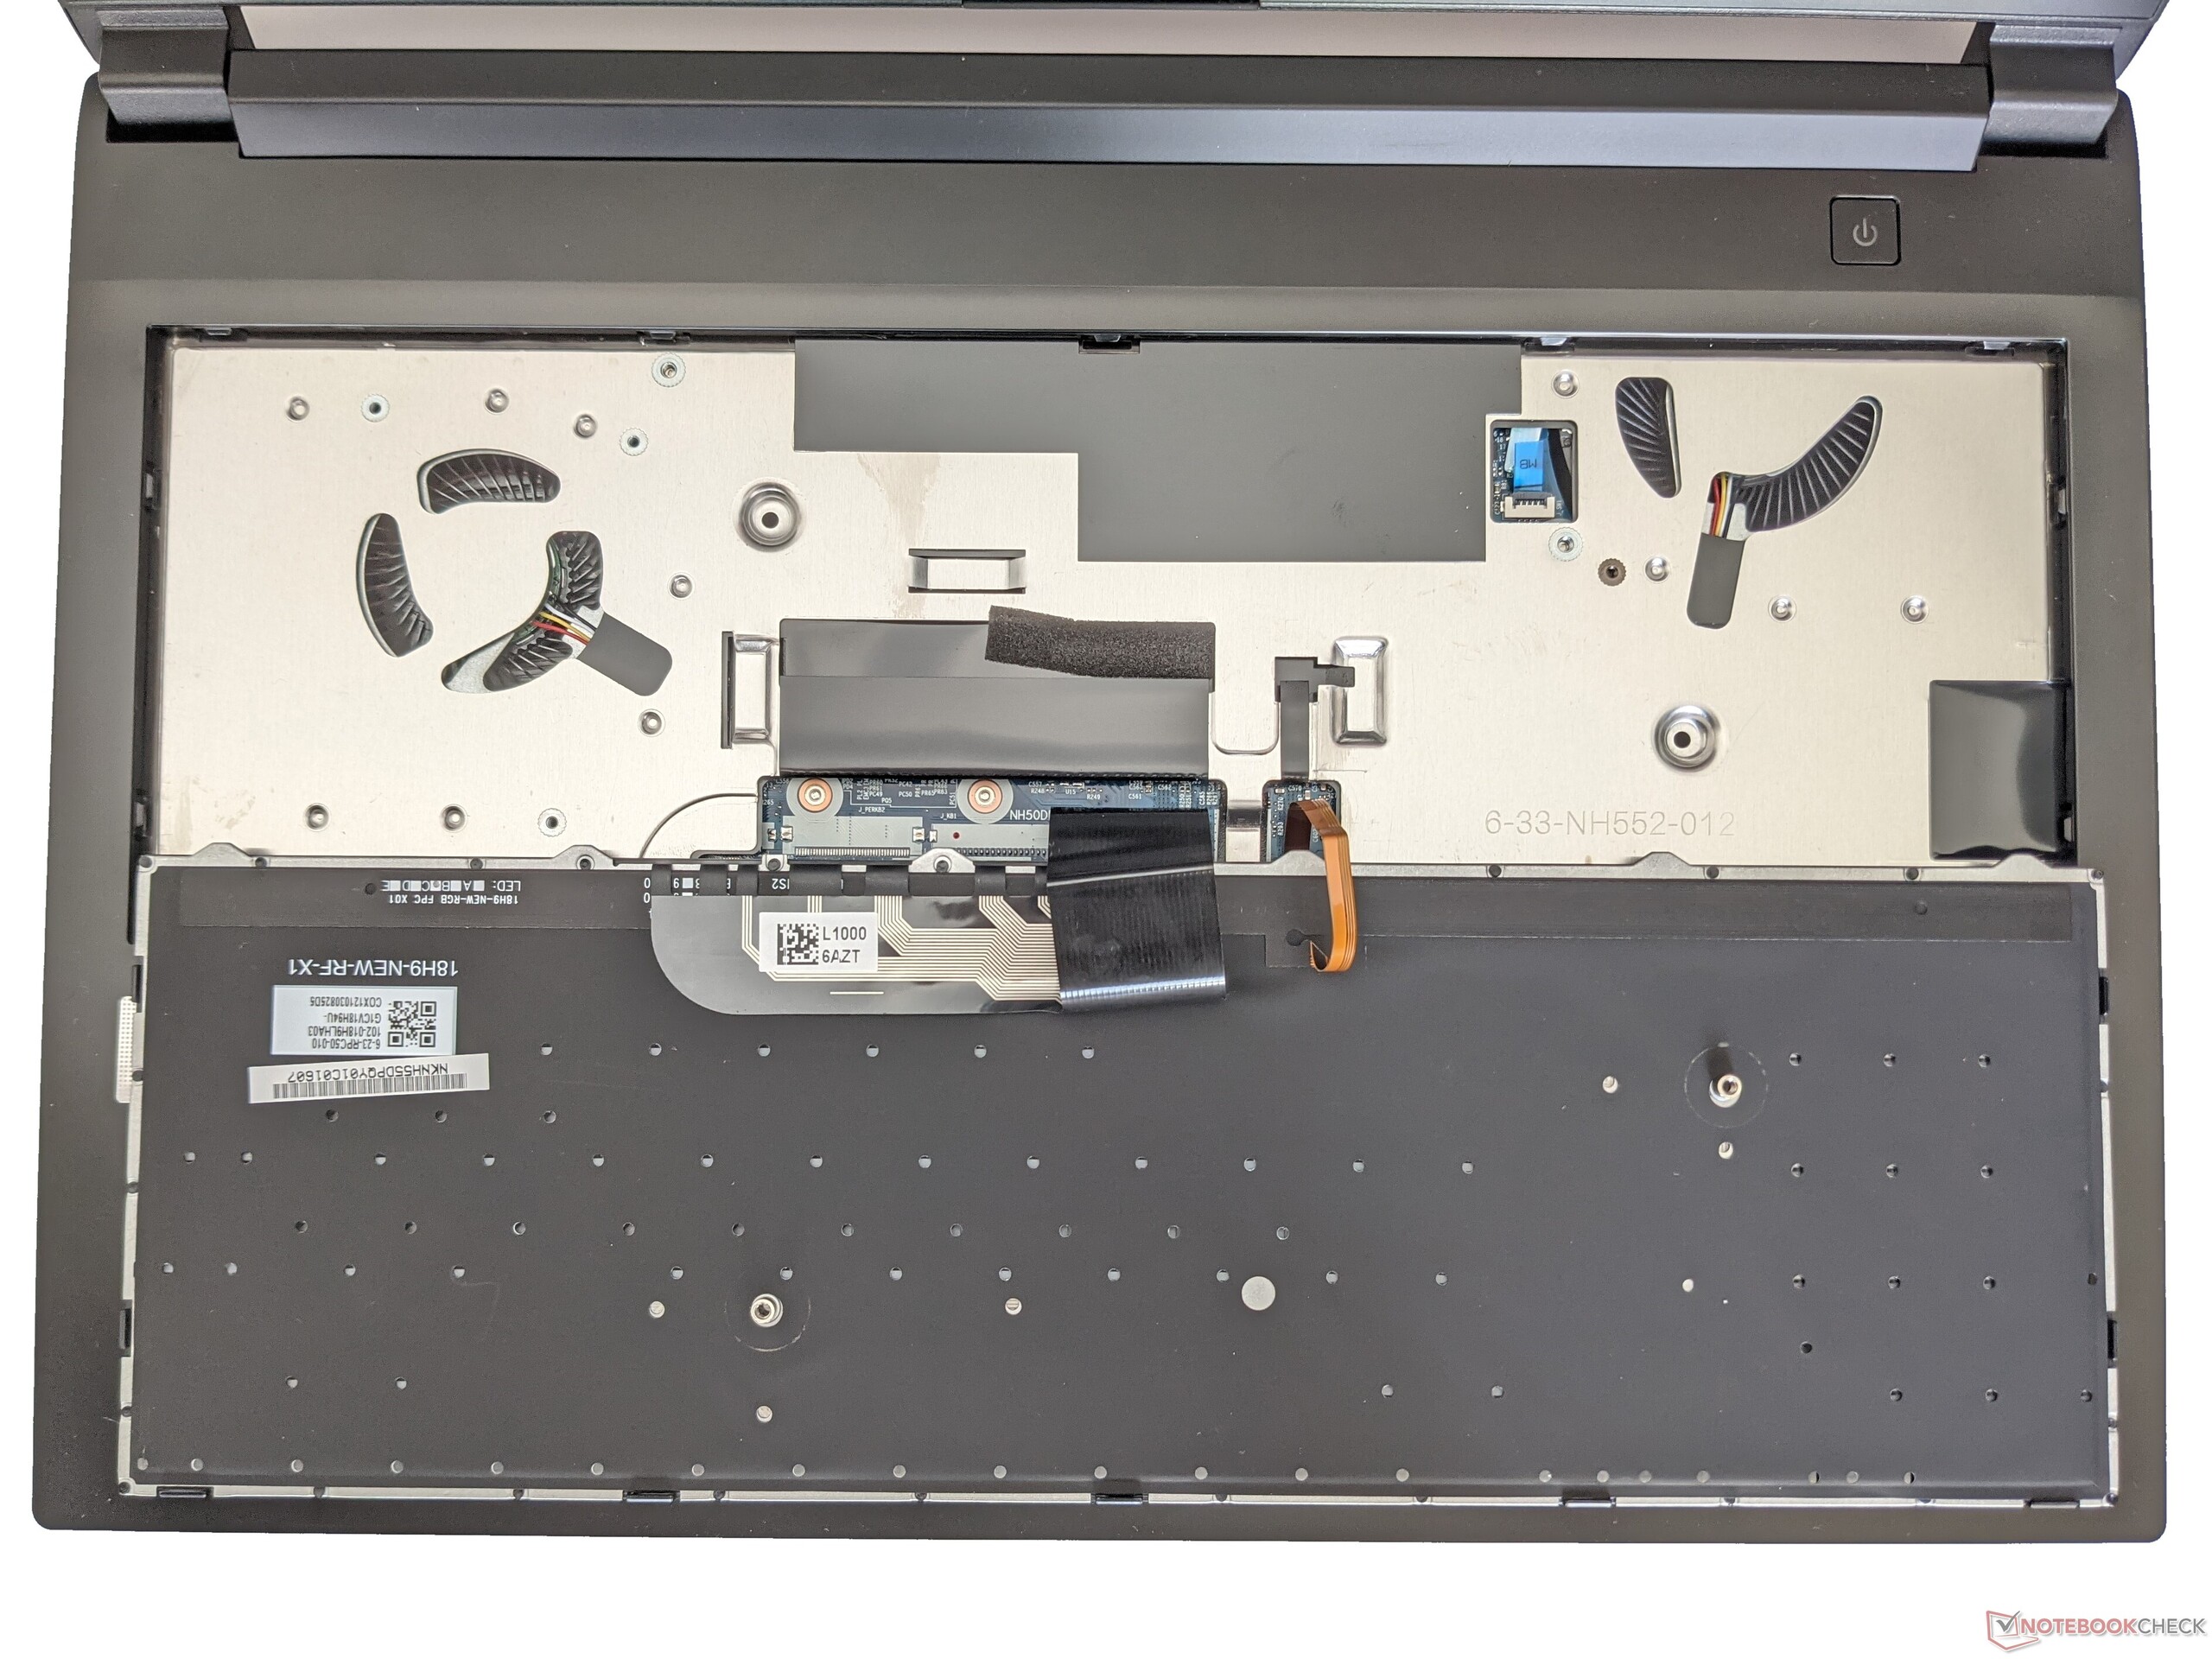
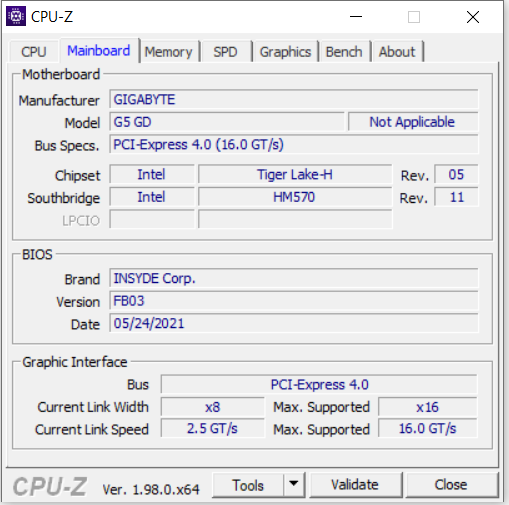
A 512 GB NVMe SSD (M.2 2280) from Phison serves as system drive. The connection via PCIe 4 makes for very good transfer rates. Storage space could be expanded through a second M.2 SSD (PCIe 3/SATA) and a 2.5-inch storage drive. Both M.2 slots can accommodate SSDs in the 2242, 2260, and 2280 formats.

| Drive Performance rating - Percent | |
| Average of class Gaming | |
| Gigabyte G5 GD | |
| Gigabyte G5 KC | |
| Average ESR512GTLG-E6GBTNB4 | |
| MSI GF65 Thin 10UE | |
| Lenovo Legion 5 15ACH-82JU00C6GE-FL | |
| Dell G15 5515 | |
* ... smaller is better
Continuous load read: DiskSpd Read Loop, Queue Depth 8
GPU performance
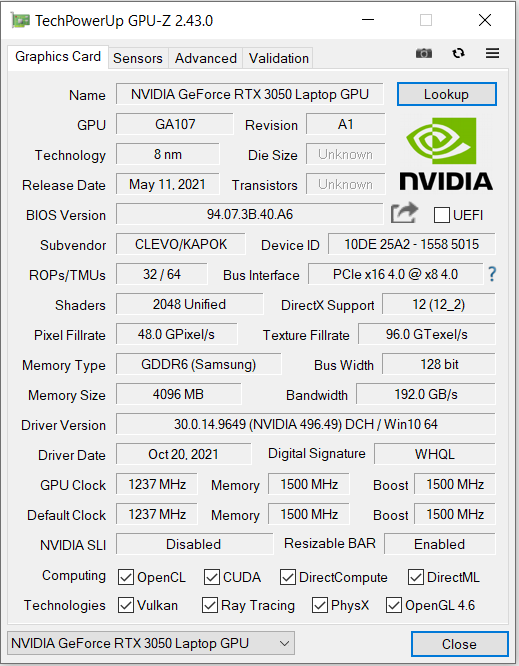
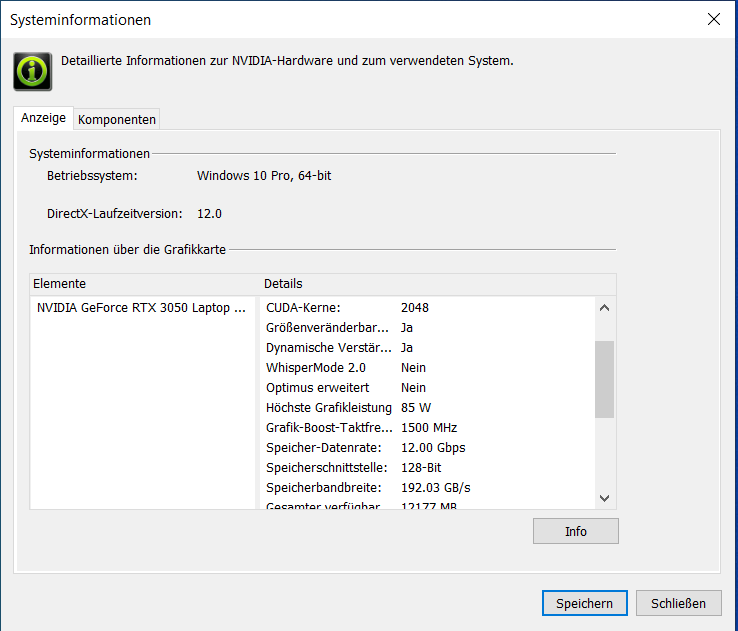
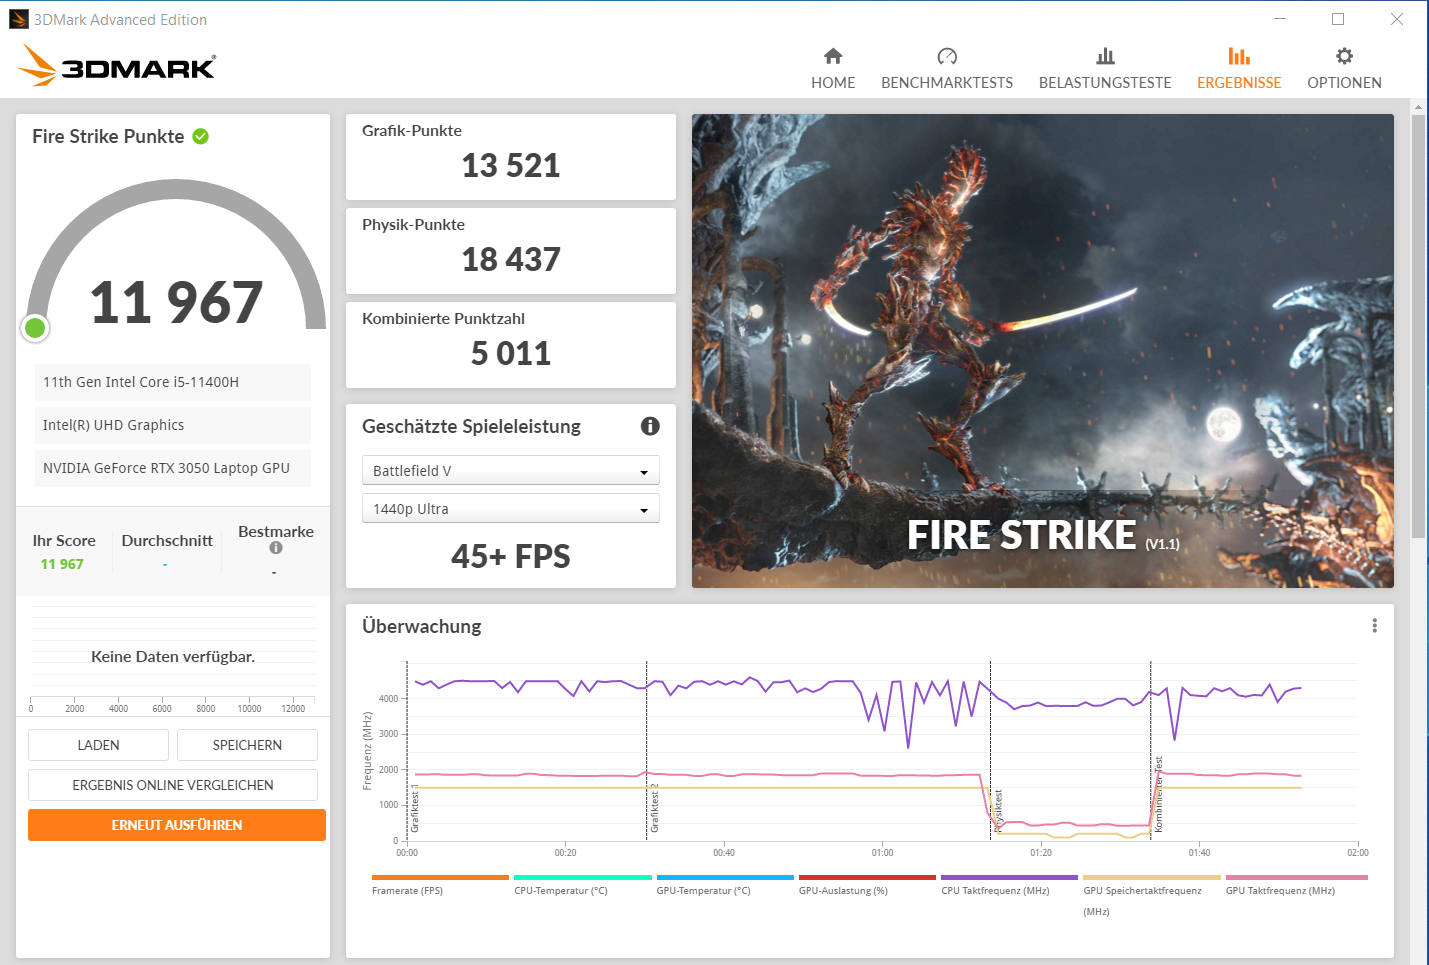
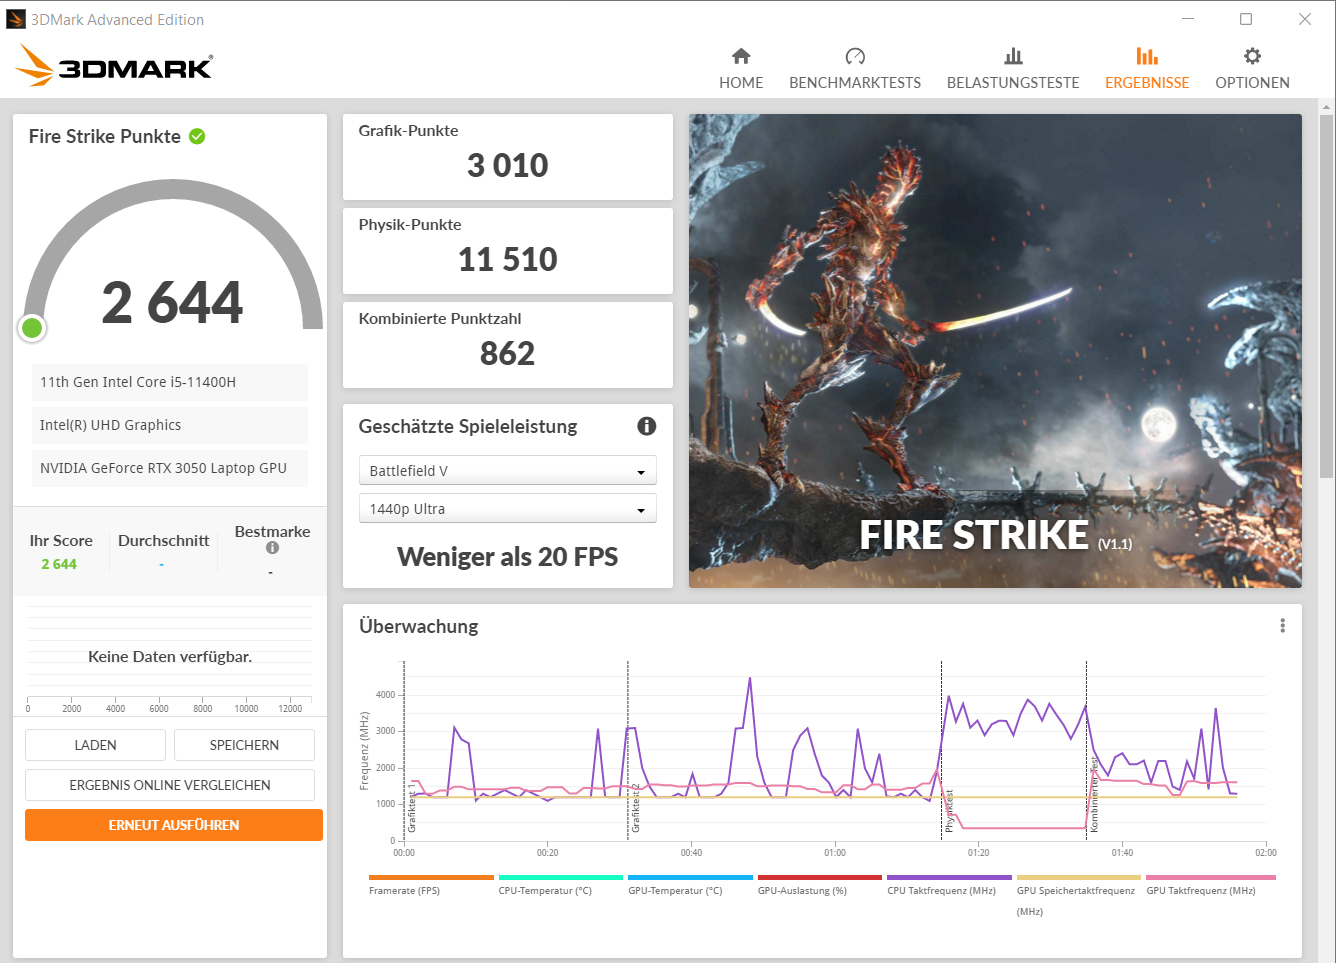
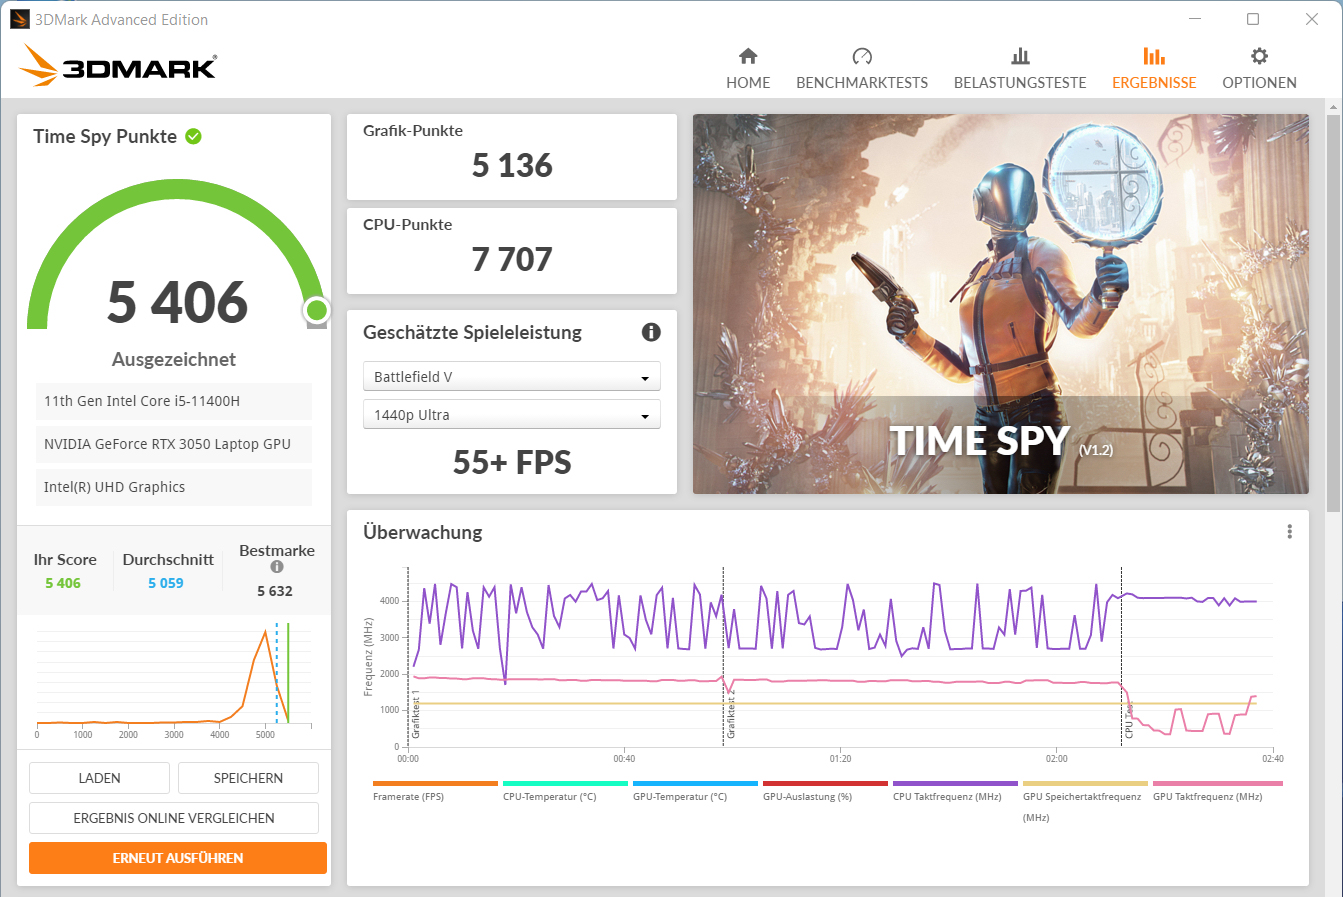
Gigabyte grants the GeForce RTX 3050 laptop GPU (overview of all RTX 3050 laptops including their TGPs) a maximum TGP of 85 watts. Consequently, it delivers the best 3DMark results that we have been able to determine with the RTX 3050 so far. The "Performance Mode" profile leads to a slight increase in graphics performance.
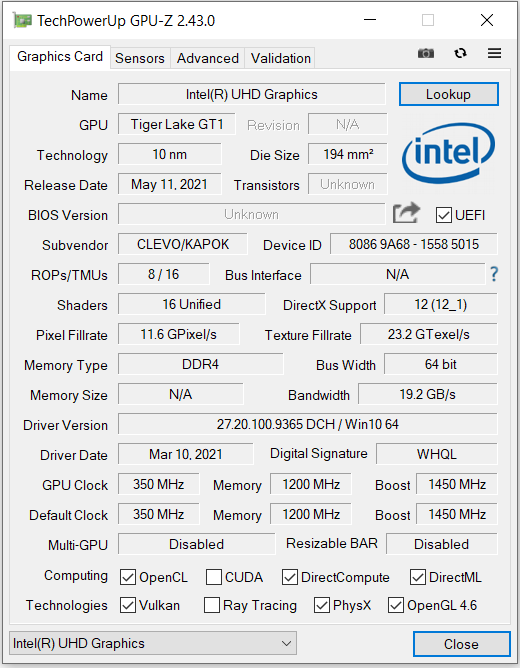
The RTX 3050 can access fast GDDR6 graphics memory (4,096 MB). The UHD Graphics Xe 16EUs graphics core that's integrated into the processor is active, and the laptop works with Nvidia's Optimus graphics-switching solution.
| 3DMark 06 Standard Score | 42599 points | |
| 3DMark 11 Performance | 16190 points | |
| 3DMark Cloud Gate Standard Score | 37239 points | |
| 3DMark Fire Strike Score | 11967 points | |
| 3DMark Time Spy Score | 5406 points | |
Help | ||
| 3DMark Performance rating - Percent | |
| Average of class Gaming | |
| Lenovo Legion 5 15ACH-82JU00C6GE-FL | |
| Gigabyte G5 KC | |
| MSI GF65 Thin 10UE | |
| Dell G15 5515 | |
| Gigabyte G5 GD | |
| Gigabyte G5 GD -1! | |
| Average NVIDIA GeForce RTX 3050 4GB Laptop GPU | |
| Acer Nitro 5 AN517-53-54DQ | |
| Gigabyte G5 GD -1! | |
| 3DMark 11 - 1280x720 Performance GPU | |
| Average of class Gaming (21841 - 80022, n=103, last 2 years) | |
| Lenovo Legion 5 15ACH-82JU00C6GE-FL | |
| Gigabyte G5 KC | |
| MSI GF65 Thin 10UE | |
| Dell G15 5515 | |
| Gigabyte G5 GD (Leistungsmodus) | |
| Gigabyte G5 GD | |
| Acer Nitro 5 AN517-53-54DQ | |
| Average NVIDIA GeForce RTX 3050 4GB Laptop GPU (11980 - 18557, n=23) | |
| Gigabyte G5 GD (Stromsparmodus) | |
| 3DMark | |
| 1280x720 Cloud Gate Standard Graphics | |
| Average of class Gaming (86886 - 223650, n=60, last 2 years) | |
| Lenovo Legion 5 15ACH-82JU00C6GE-FL | |
| Gigabyte G5 KC | |
| MSI GF65 Thin 10UE | |
| Gigabyte G5 GD | |
| Dell G15 5515 | |
| Average NVIDIA GeForce RTX 3050 4GB Laptop GPU (33426 - 87403, n=18) | |
| Acer Nitro 5 AN517-53-54DQ | |
| 1920x1080 Fire Strike Graphics | |
| Average of class Gaming (18629 - 62849, n=112, last 2 years) | |
| Lenovo Legion 5 15ACH-82JU00C6GE-FL | |
| Gigabyte G5 KC | |
| MSI GF65 Thin 10UE | |
| Dell G15 5515 | |
| Gigabyte G5 GD (Leistungsmodus) | |
| Gigabyte G5 GD | |
| Acer Nitro 5 AN517-53-54DQ | |
| Average NVIDIA GeForce RTX 3050 4GB Laptop GPU (9138 - 14157, n=22) | |
| Gigabyte G5 GD (Stromsparmodus) | |
| 2560x1440 Time Spy Graphics | |
| Average of class Gaming (6387 - 26212, n=112, last 2 years) | |
| Lenovo Legion 5 15ACH-82JU00C6GE-FL | |
| Gigabyte G5 KC | |
| MSI GF65 Thin 10UE | |
| Dell G15 5515 | |
| Gigabyte G5 GD (Leistungsmodus) | |
| Gigabyte G5 GD | |
| Acer Nitro 5 AN517-53-54DQ | |
| Average NVIDIA GeForce RTX 3050 4GB Laptop GPU (3281 - 5295, n=23) | |
| Gigabyte G5 GD (Stromsparmodus) | |
Gaming performance
The laptop brings all the latest games smoothly onto the screen. Usually, Full HD resolution and high to maximum quality settings can be selected. Some performance-hungry titles - Cyberpunk 2077, for example - will require compromises in terms of quality levels. The G5 GD delivers the best frame rates that we've been able to register with the RTX 3050 laptop GPU so far. The gap to the RTX 3050 Ti laptop GPU in the Dell G15 5515 is not that big.
| The Witcher 3 - 1920x1080 Ultra Graphics & Postprocessing (HBAO+) | |
| Average of class Gaming (104.7 - 240, n=7, last 2 years) | |
| Gigabyte G5 KC | |
| Lenovo Legion 5 15ACH-82JU00C6GE-FL (Ultra Performance) | |
| Lenovo Legion 5 15ACH-82JU00C6GE-FL (Auto) | |
| Lenovo Legion 5 15ACH-82JU00C6GE-FL (Eco) | |
| MSI GF65 Thin 10UE | |
| Dell G15 5515 | |
| Gigabyte G5 GD (Leistungsmodus) | |
| Gigabyte G5 GD | |
| Average NVIDIA GeForce RTX 3050 4GB Laptop GPU (31.5 - 55.8, n=21) | |
| Gigabyte G5 GD (Stromsparmodus) | |
| Dota 2 Reborn - 1920x1080 ultra (3/3) best looking | |
| Average of class Gaming (84.8 - 252, n=104, last 2 years) | |
| Gigabyte G5 GD (Leistungsmodus) | |
| Gigabyte G5 GD | |
| Gigabyte G5 KC | |
| Gigabyte G5 GD (Stromsparmodus) | |
| Average NVIDIA GeForce RTX 3050 4GB Laptop GPU (82.8 - 147.7, n=22) | |
| Dell G15 5515 | |
| Lenovo Legion 5 15ACH-82JU00C6GE-FL | |
| MSI GF65 Thin 10UE | |
| X-Plane 11.11 - 1920x1080 high (fps_test=3) | |
| Average of class Gaming (55.5 - 148.5, n=106, last 2 years) | |
| Gigabyte G5 GD (Leistungsmodus) | |
| Gigabyte G5 KC | |
| Gigabyte G5 GD | |
| Gigabyte G5 GD (Stromsparmodus) | |
| Average NVIDIA GeForce RTX 3050 4GB Laptop GPU (51.6 - 103.1, n=22) | |
| Dell G15 5515 | |
| Lenovo Legion 5 15ACH-82JU00C6GE-FL | |
| MSI GF65 Thin 10UE | |
| Final Fantasy XV Benchmark - 1920x1080 High Quality | |
| Average of class Gaming (64.2 - 215, n=91, last 2 years) | |
| Lenovo Legion 5 15ACH-82JU00C6GE-FL (1.3) | |
| Gigabyte G5 KC (1.3) | |
| MSI GF65 Thin 10UE (1.3) | |
| Dell G15 5515 (1.3) | |
| Gigabyte G5 GD (1.3, Leistungsmodus) | |
| Gigabyte G5 GD (1.3) | |
| Average NVIDIA GeForce RTX 3050 4GB Laptop GPU (35.9 - 53.5, n=21) | |
| Gigabyte G5 GD (1.3, Stromsparmodus) | |
| GTA V - 1920x1080 Highest AA:4xMSAA + FX AF:16x | |
| Average of class Gaming (67.1 - 186.9, n=90, last 2 years) | |
| Gigabyte G5 KC | |
| Lenovo Legion 5 15ACH-82JU00C6GE-FL | |
| Dell G15 5515 | |
| Gigabyte G5 GD | |
| MSI GF65 Thin 10UE | |
| Gigabyte G5 GD (Leistungsmodus) | |
| Average NVIDIA GeForce RTX 3050 4GB Laptop GPU (48 - 72.5, n=21) | |
| Gigabyte G5 GD (Stromsparmodus) | |
| Strange Brigade - 1920x1080 ultra AA:ultra AF:16 | |
| Average of class Gaming (113.6 - 458, n=83, last 2 years) | |
| Gigabyte G5 KC (1.47.22.14 D3D12) | |
| MSI GF65 Thin 10UE (1.47.22.14 D3D12) | |
| Dell G15 5515 (1.47.22.14 D3D12) | |
| Gigabyte G5 GD (1.47.22.14 D3D12, Leistungsmodus) | |
| Gigabyte G5 GD (1.47.22.14 D3D12) | |
| Average NVIDIA GeForce RTX 3050 4GB Laptop GPU (57.9 - 95.1, n=21) | |
| Gigabyte G5 GD (1.47.22.14 D3D12, Stromsparmodus) | |
| F1 2021 - 1920x1080 Ultra High Preset + Raytracing AA:T AF:16x | |
| Gigabyte G5 KC (803111) | |
| Lenovo Legion 5 15ACH-82JU00C6GE-FL | |
| Dell G15 5515 (807588) | |
| Gigabyte G5 GD (824817) | |
| Average NVIDIA GeForce RTX 3050 4GB Laptop GPU (44.1 - 62, n=8) | |
| Gigabyte G5 GD (824817, Stromsparmodus) | |
| Deathloop - 1920x1080 High Preset | |
| Gigabyte G5 GD | |
| Average NVIDIA GeForce RTX 3050 4GB Laptop GPU (n=1) | |
| New World - 1920x1080 Very High Video Quality | |
| Dell G15 5515 | |
| Gigabyte G5 GD | |
| Average NVIDIA GeForce RTX 3050 4GB Laptop GPU (n=1) | |
| Alan Wake Remastered - 1920x1080 High Preset | |
| Gigabyte G5 GD | |
| Average NVIDIA GeForce RTX 3050 4GB Laptop GPU (n=1) | |
| Far Cry 6 - 1920x1080 Ultra Graphics Quality + HD Textures AA:T | |
| Average of class Gaming (n=1last 2 years) | |
| Gigabyte G5 GD | |
| Dell G15 5515 | |
| Average NVIDIA GeForce RTX 3050 4GB Laptop GPU (45 - 59, n=3) | |
| Back 4 Blood - 1920x1080 Epic Preset (DX12) AA:T | |
| Gigabyte G5 GD | |
| Average NVIDIA GeForce RTX 3050 4GB Laptop GPU (n=1) | |
| Guardians of the Galaxy - 1920x1080 High Preset | |
| Gigabyte G5 GD | |
| Average NVIDIA GeForce RTX 3050 4GB Laptop GPU (n=1) | |
| Riders Republic - 1920x1080 Ultra Preset | |
| Gigabyte G5 GD | |
| Average NVIDIA GeForce RTX 3050 4GB Laptop GPU (n=1) | |
| Forza Horizon 5 - 1920x1080 High Preset | |
| Gigabyte G5 GD | |
| Average NVIDIA GeForce RTX 3050 4GB Laptop GPU (n=1) | |
In order to verify whether the frame rates remain largely constant over a prolonged period of time, we let the game The Witcher 3 run for about 60 minutes at Full HD resolution and maximum quality settings. The character is not moved. A drop in frame rates wasn't found.
The Witcher 3 FPS diagram
| low | med. | high | ultra | |
|---|---|---|---|---|
| GTA V (2015) | 178 | 171 | 138 | 70.8 |
| The Witcher 3 (2015) | 258 | 166 | 93.6 | 51.7 |
| Dota 2 Reborn (2015) | 146 | 137 | 131 | 123 |
| Final Fantasy XV Benchmark (2018) | 136 | 73.1 | 51.1 | |
| X-Plane 11.11 (2018) | 112 | 95.7 | 77.3 | |
| Far Cry 5 (2018) | 131 | 84 | 79 | 75 |
| Strange Brigade (2018) | 287 | 130 | 105 | 91.3 |
| F1 2021 (2021) | 235 | 150 | 126 | 59.4 |
| Deathloop (2021) | 109 | 63.4 | 51.7 | 38.1 |
| New World (2021) | 95 | 65.2 | 60.2 | 49.2 |
| Alan Wake Remastered (2021) | 91.9 | 70.6 | 64.2 | |
| Far Cry 6 (2021) | 110 | 77 | 67 | 59 |
| Back 4 Blood (2021) | 247 | 138 | 112 | 103 |
| Guardians of the Galaxy (2021) | 96 | 74 | 73 | 32 |
| Riders Republic (2021) | 144 | 80 | 61 | 55 |
| Forza Horizon 5 (2021) | 154 | 87 | 77 | 28 |
Emissions - The G5 produces a lot of noise under load
Fan noise
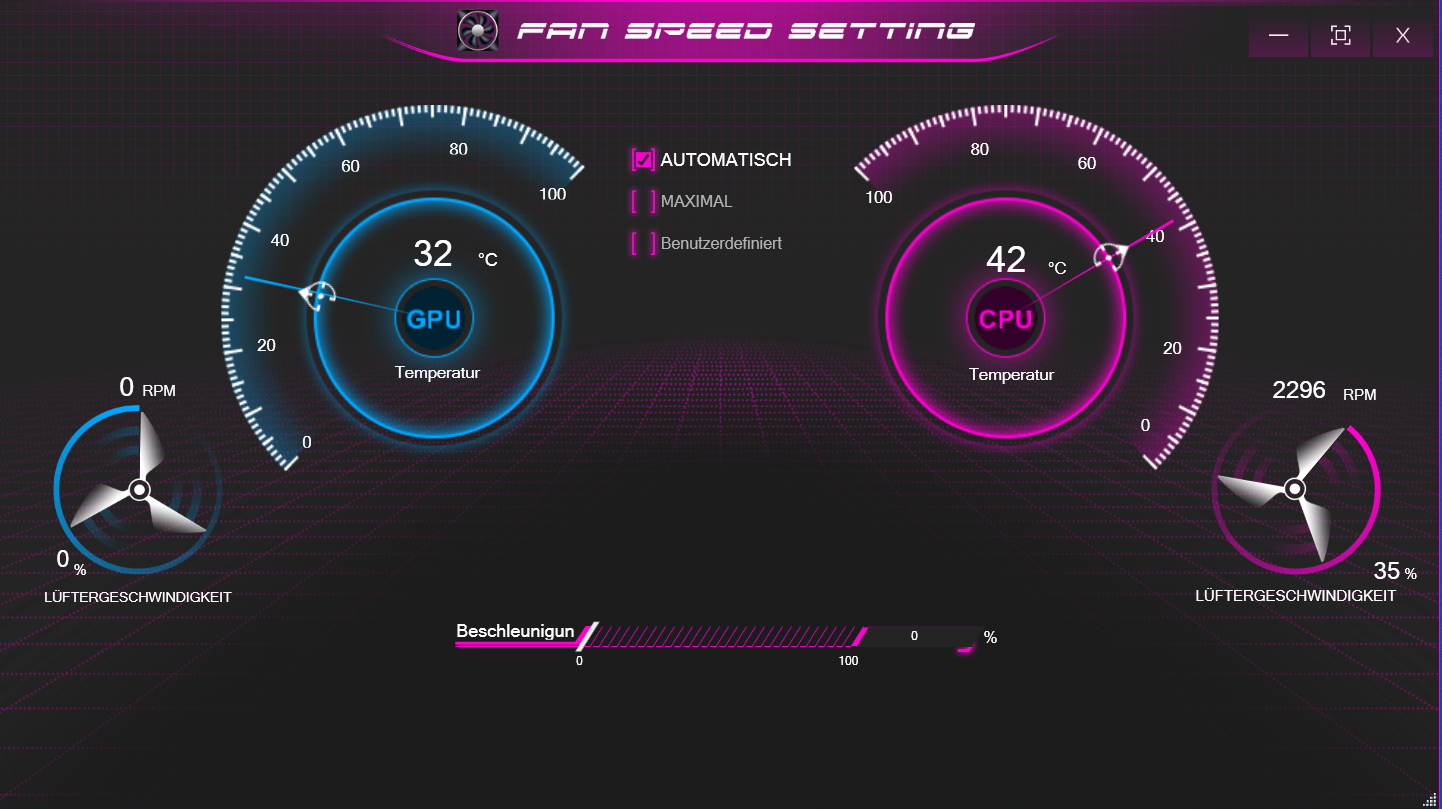
In everyday use (office, Internet), the two fans work at a low speed and are barely audible. From time to time, they stand still. However, it gets quite loud under load with maximum sound pressure levels of 54 dB(A) (stress test) and 52 dB(A) (our The Witcher 3 test), respectively. The noise level under load can be reduced considerably by using the profiles "Power Saving Mode" and "Silent Mode" - with decreased computing performance. Overall, the Dell G15 5515 produces less noise.
| Gigabyte G5 GD GeForce RTX 3050 4GB Laptop GPU, i5-11400H | Dell G15 5515 GeForce RTX 3050 Ti Laptop GPU, R7 5800H | Lenovo Legion 5 15ACH-82JU00C6GE-FL GeForce RTX 3060 Laptop GPU, R7 5800H | MSI GF65 Thin 10UE GeForce RTX 3060 Laptop GPU, i7-10750H | Gigabyte G5 KC GeForce RTX 3060 Laptop GPU, i5-10500H | |
|---|---|---|---|---|---|
| Noise | 11% | 1% | 0% | -16% | |
| off / environment * (dB) | 24 | 24 -0% | 24.2 -1% | 24.7 -3% | 27 -13% |
| Idle Minimum * (dB) | 29 | 25 14% | 29 -0% | 33.1 -14% | 31 -7% |
| Idle Average * (dB) | 30 | 26 13% | 29 3% | 33.1 -10% | 32 -7% |
| Idle Maximum * (dB) | 32 | 30 6% | 29 9% | 33.1 -3% | 51 -59% |
| Load Average * (dB) | 53 | 44 17% | 53.5 -1% | 42.7 19% | 57 -8% |
| Witcher 3 ultra * (dB) | 52 | 44 15% | 53.5 -3% | 40.6 22% | 56 -8% |
| Load Maximum * (dB) | 54 | 48 11% | 53.5 1% | 59.4 -10% | 58 -7% |
* ... smaller is better
Noise level
| Idle |
| 29 / 30 / 32 dB(A) |
| Load |
| 53 / 54 dB(A) |
 | ||
30 dB silent 40 dB(A) audible 50 dB(A) loud |
||
min: | ||
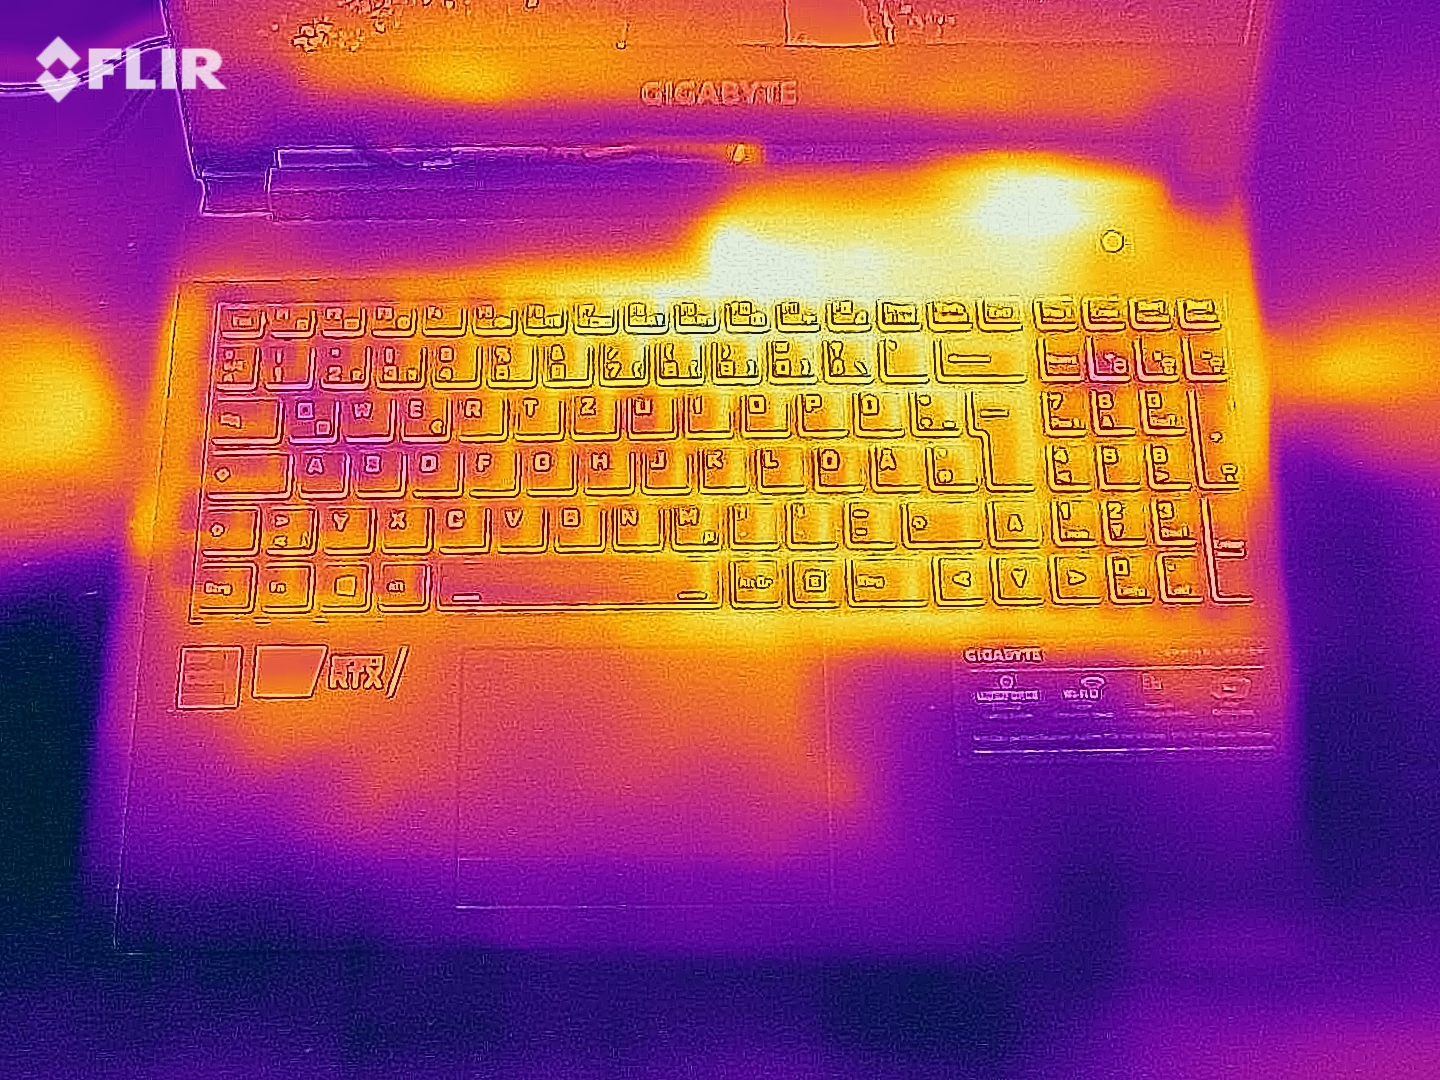
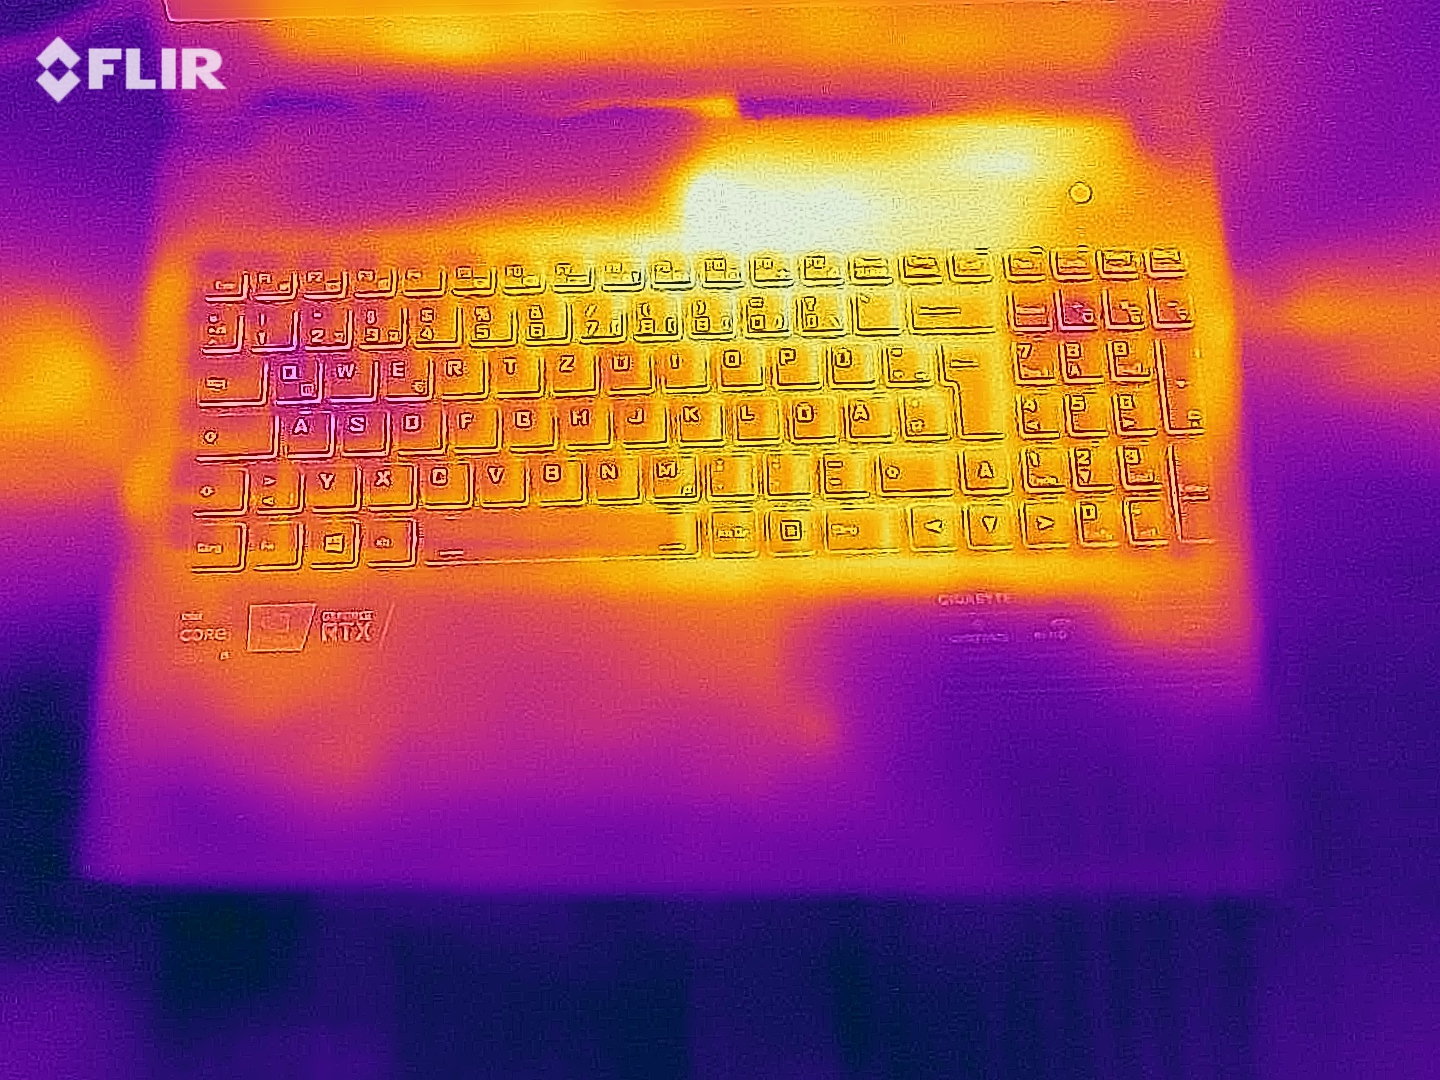
Temperature
The case temperatures of the G5 remain well within the green range in everyday use (office, Internet). Under load (stress test, our The Witcher 3 test), temperatures are higher in certain areas, but they remain moderate overall. The competition is generally on par. The CPU temperatures are no cause for concern, either.
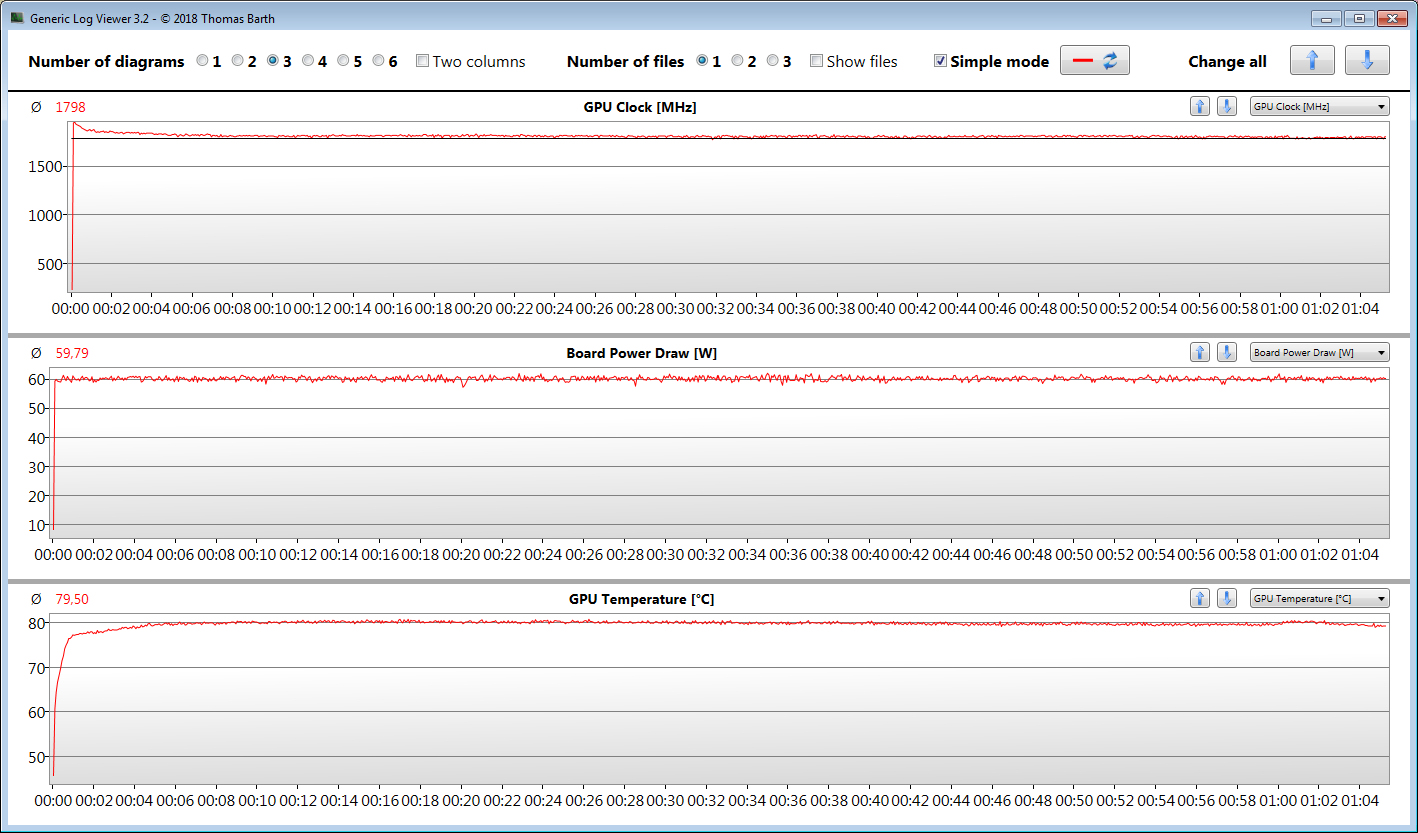
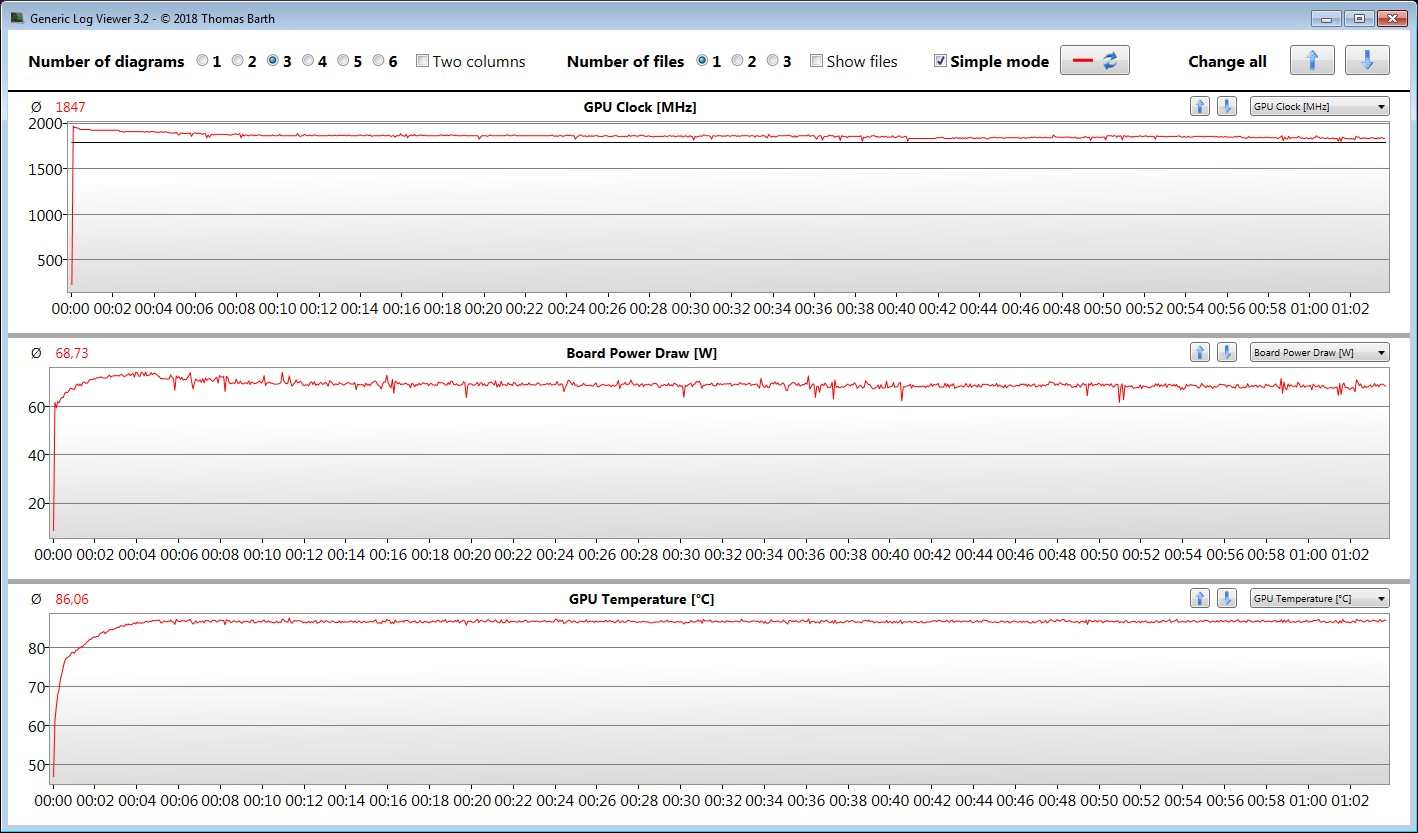
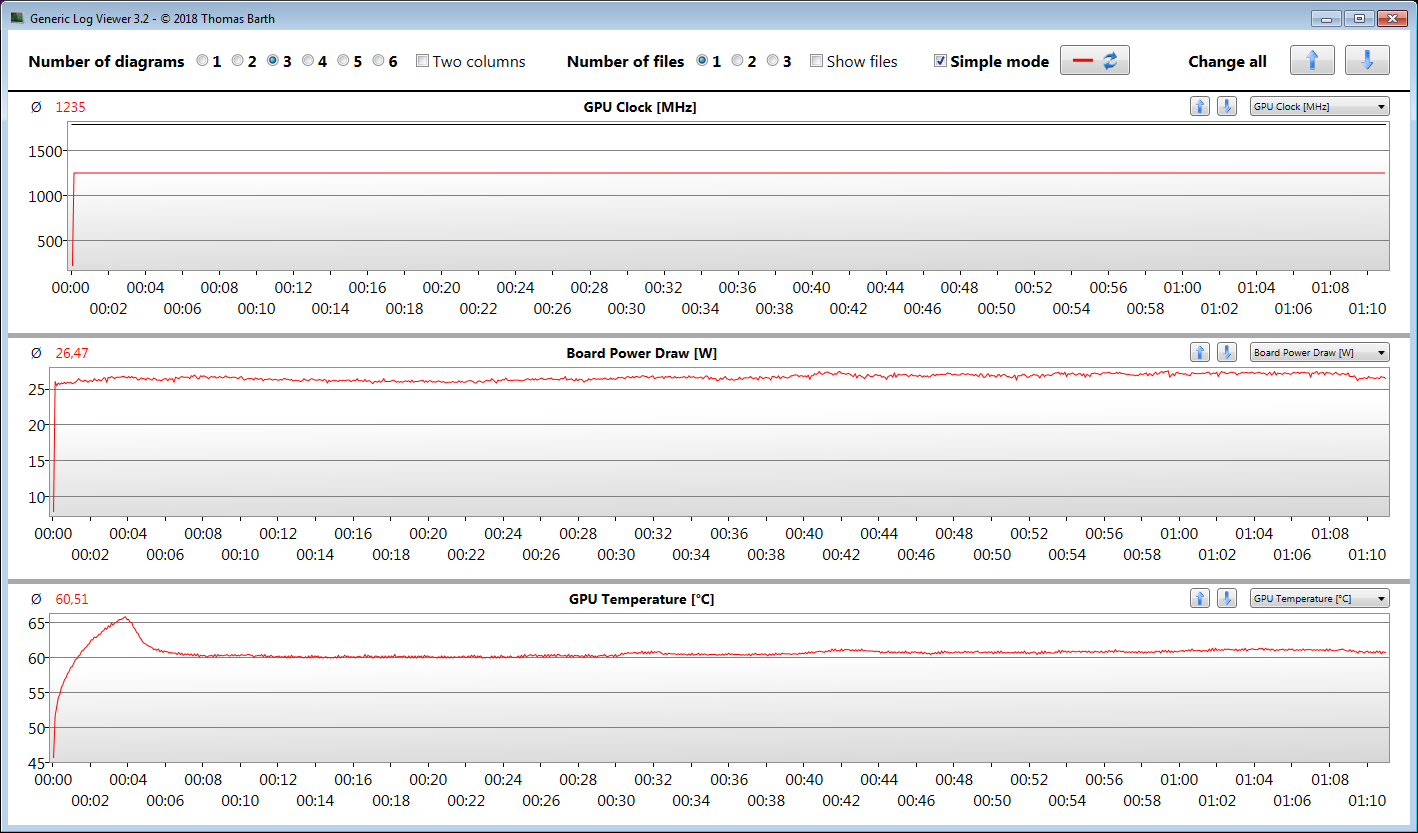
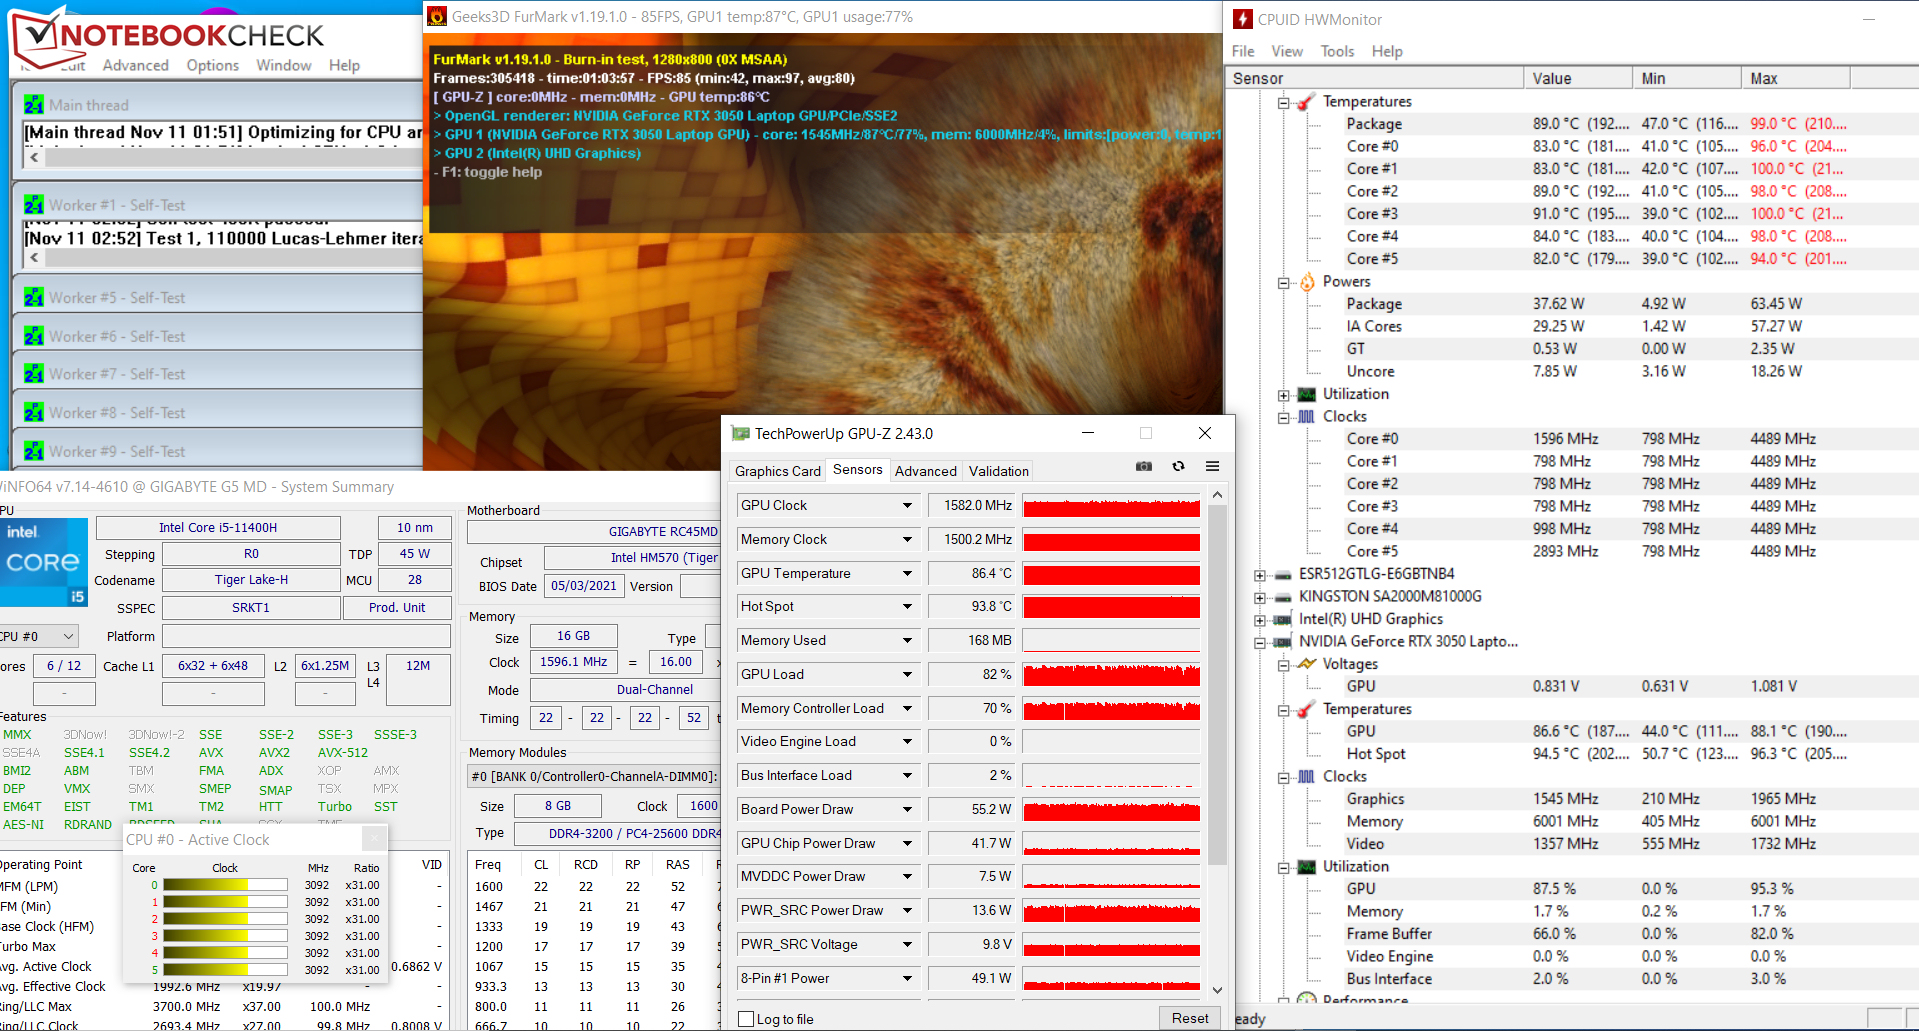
Stress test
The CPU and GPU process the stress test (Prime95 and FurMark run for at least an hour) at 2.6 to 3.1 GHz and about 1,600 MHz, respectively. The test represents an extreme scenario that we use to check whether the system remains stable under full load.
(±) The maximum temperature on the upper side is 45 °C / 113 F, compared to the average of 40.4 °C / 105 F, ranging from 21.2 to 68.8 °C for the class Gaming.
(-) The bottom heats up to a maximum of 50 °C / 122 F, compared to the average of 43.2 °C / 110 F
(+) In idle usage, the average temperature for the upper side is 26.7 °C / 80 F, compared to the device average of 33.9 °C / 93 F.
(±) Playing The Witcher 3, the average temperature for the upper side is 36.3 °C / 97 F, compared to the device average of 33.9 °C / 93 F.
(+) The palmrests and touchpad are reaching skin temperature as a maximum (33 °C / 91.4 F) and are therefore not hot.
(-) The average temperature of the palmrest area of similar devices was 28.8 °C / 83.8 F (-4.2 °C / -7.6 F).
| Gigabyte G5 GD GeForce RTX 3050 4GB Laptop GPU, i5-11400H | Dell G15 5515 GeForce RTX 3050 Ti Laptop GPU, R7 5800H | Lenovo Legion 5 15ACH-82JU00C6GE-FL GeForce RTX 3060 Laptop GPU, R7 5800H | MSI GF65 Thin 10UE GeForce RTX 3060 Laptop GPU, i7-10750H | Gigabyte G5 KC GeForce RTX 3060 Laptop GPU, i5-10500H | |
|---|---|---|---|---|---|
| Heat | 4% | 8% | 5% | -9% | |
| Maximum Upper Side * (°C) | 45 | 50 -11% | 42.6 5% | 43.4 4% | 50 -11% |
| Maximum Bottom * (°C) | 50 | 49 2% | 52.2 -4% | 41.8 16% | 49 2% |
| Idle Upper Side * (°C) | 28 | 26 7% | 24.9 11% | 30.2 -8% | 33 -18% |
| Idle Bottom * (°C) | 31 | 26 16% | 25.3 18% | 28.4 8% | 34 -10% |
* ... smaller is better


Speakers
Gigabyte G5 GD audio analysis
(±) | speaker loudness is average but good (80 dB)
Bass 100 - 315 Hz
(-) | nearly no bass - on average 25.4% lower than median
(-) | bass is not linear (16.2% delta to prev. frequency)
Mids 400 - 2000 Hz
(+) | balanced mids - only 3.2% away from median
(+) | mids are linear (4.6% delta to prev. frequency)
Highs 2 - 16 kHz
(+) | balanced highs - only 3.9% away from median
(±) | linearity of highs is average (10.1% delta to prev. frequency)
Overall 100 - 16.000 Hz
(±) | linearity of overall sound is average (19.1% difference to median)
Compared to same class
» 64% of all tested devices in this class were better, 7% similar, 28% worse
» The best had a delta of 6%, average was 18%, worst was 132%
Compared to all devices tested
» 46% of all tested devices were better, 7% similar, 47% worse
» The best had a delta of 4%, average was 23%, worst was 134%
Dell G15 5515 audio analysis
(±) | speaker loudness is average but good (76 dB)
Bass 100 - 315 Hz
(-) | nearly no bass - on average 22% lower than median
(±) | linearity of bass is average (14.9% delta to prev. frequency)
Mids 400 - 2000 Hz
(+) | balanced mids - only 2.8% away from median
(+) | mids are linear (3% delta to prev. frequency)
Highs 2 - 16 kHz
(+) | balanced highs - only 1.4% away from median
(+) | highs are linear (3.7% delta to prev. frequency)
Overall 100 - 16.000 Hz
(±) | linearity of overall sound is average (16.8% difference to median)
Compared to same class
» 44% of all tested devices in this class were better, 11% similar, 45% worse
» The best had a delta of 6%, average was 18%, worst was 132%
Compared to all devices tested
» 30% of all tested devices were better, 7% similar, 63% worse
» The best had a delta of 4%, average was 23%, worst was 134%
Energy consumption - The Gigabyte laptop only offers short battery runtimes
The G5 consumes a relatively high amount of power in idle usage and under low load. The competition does a better job here. The demand is normal for the hardware installed here when the device is under medium to high load. The following diagram illustrates the laptop's constant power consumption during our The Witcher 3 test. The power adapter seems to have an adequate capacity with a nominal output of 150 watts. The battery doesn't drain when the laptop's hardware is under full load.
| Off / Standby | |
| Idle | |
| Load |
|
Key:
min: | |
Energy consumption during The Witcher 3
| Gigabyte G5 GD i5-11400H, GeForce RTX 3050 4GB Laptop GPU | Dell G15 5515 R7 5800H, GeForce RTX 3050 Ti Laptop GPU | Lenovo Legion 5 15ACH-82JU00C6GE-FL R7 5800H, GeForce RTX 3060 Laptop GPU | MSI GF65 Thin 10UE i7-10750H, GeForce RTX 3060 Laptop GPU | Gigabyte G5 KC i5-10500H, GeForce RTX 3060 Laptop GPU | Average of class Gaming | |
|---|---|---|---|---|---|---|
| Power Consumption | 16% | -1% | 13% | -7% | -27% | |
| Idle Minimum * (Watt) | 13 | 5 62% | 7.3 44% | 5.4 58% | 8 38% | 13.1 ? -1% |
| Idle Average * (Watt) | 15 | 9 40% | 10.5 30% | 12.8 15% | 13 13% | 19 ? -27% |
| Idle Maximum * (Watt) | 20 | 20 -0% | 15.7 22% | 19.5 2% | 20 -0% | 24.6 ? -23% |
| Load Average * (Watt) | 102 | 94 8% | 108 -6% | 86.6 15% | 98 4% | 111.3 ? -9% |
| Witcher 3 ultra * (Watt) | 124 | 123 1% | 175 -41% | 115.7 7% | 166 -34% | |
| Load Maximum * (Watt) | 148 | 172 -16% | 228 -54% | 175.2 -18% | 242 -64% | 260 ? -76% |
* ... smaller is better
Battery life
The 15.6-incher achieves runtimes of 3:06 hours and 3:34 hours in the Wi-Fi test (accessing websites via a script) and video test (short film Big Buck Bunny (H.264 encoding, Full HD) running in a loop), respectively. The power-saving features are disabled here, and the display brightness is set to about 150 cd/m². In addition, the wireless modules are disabled for the video test.
The use of the energy profiles "Power Saving Mode" and "Silent Mode" does not lead to any improvements in battery life.
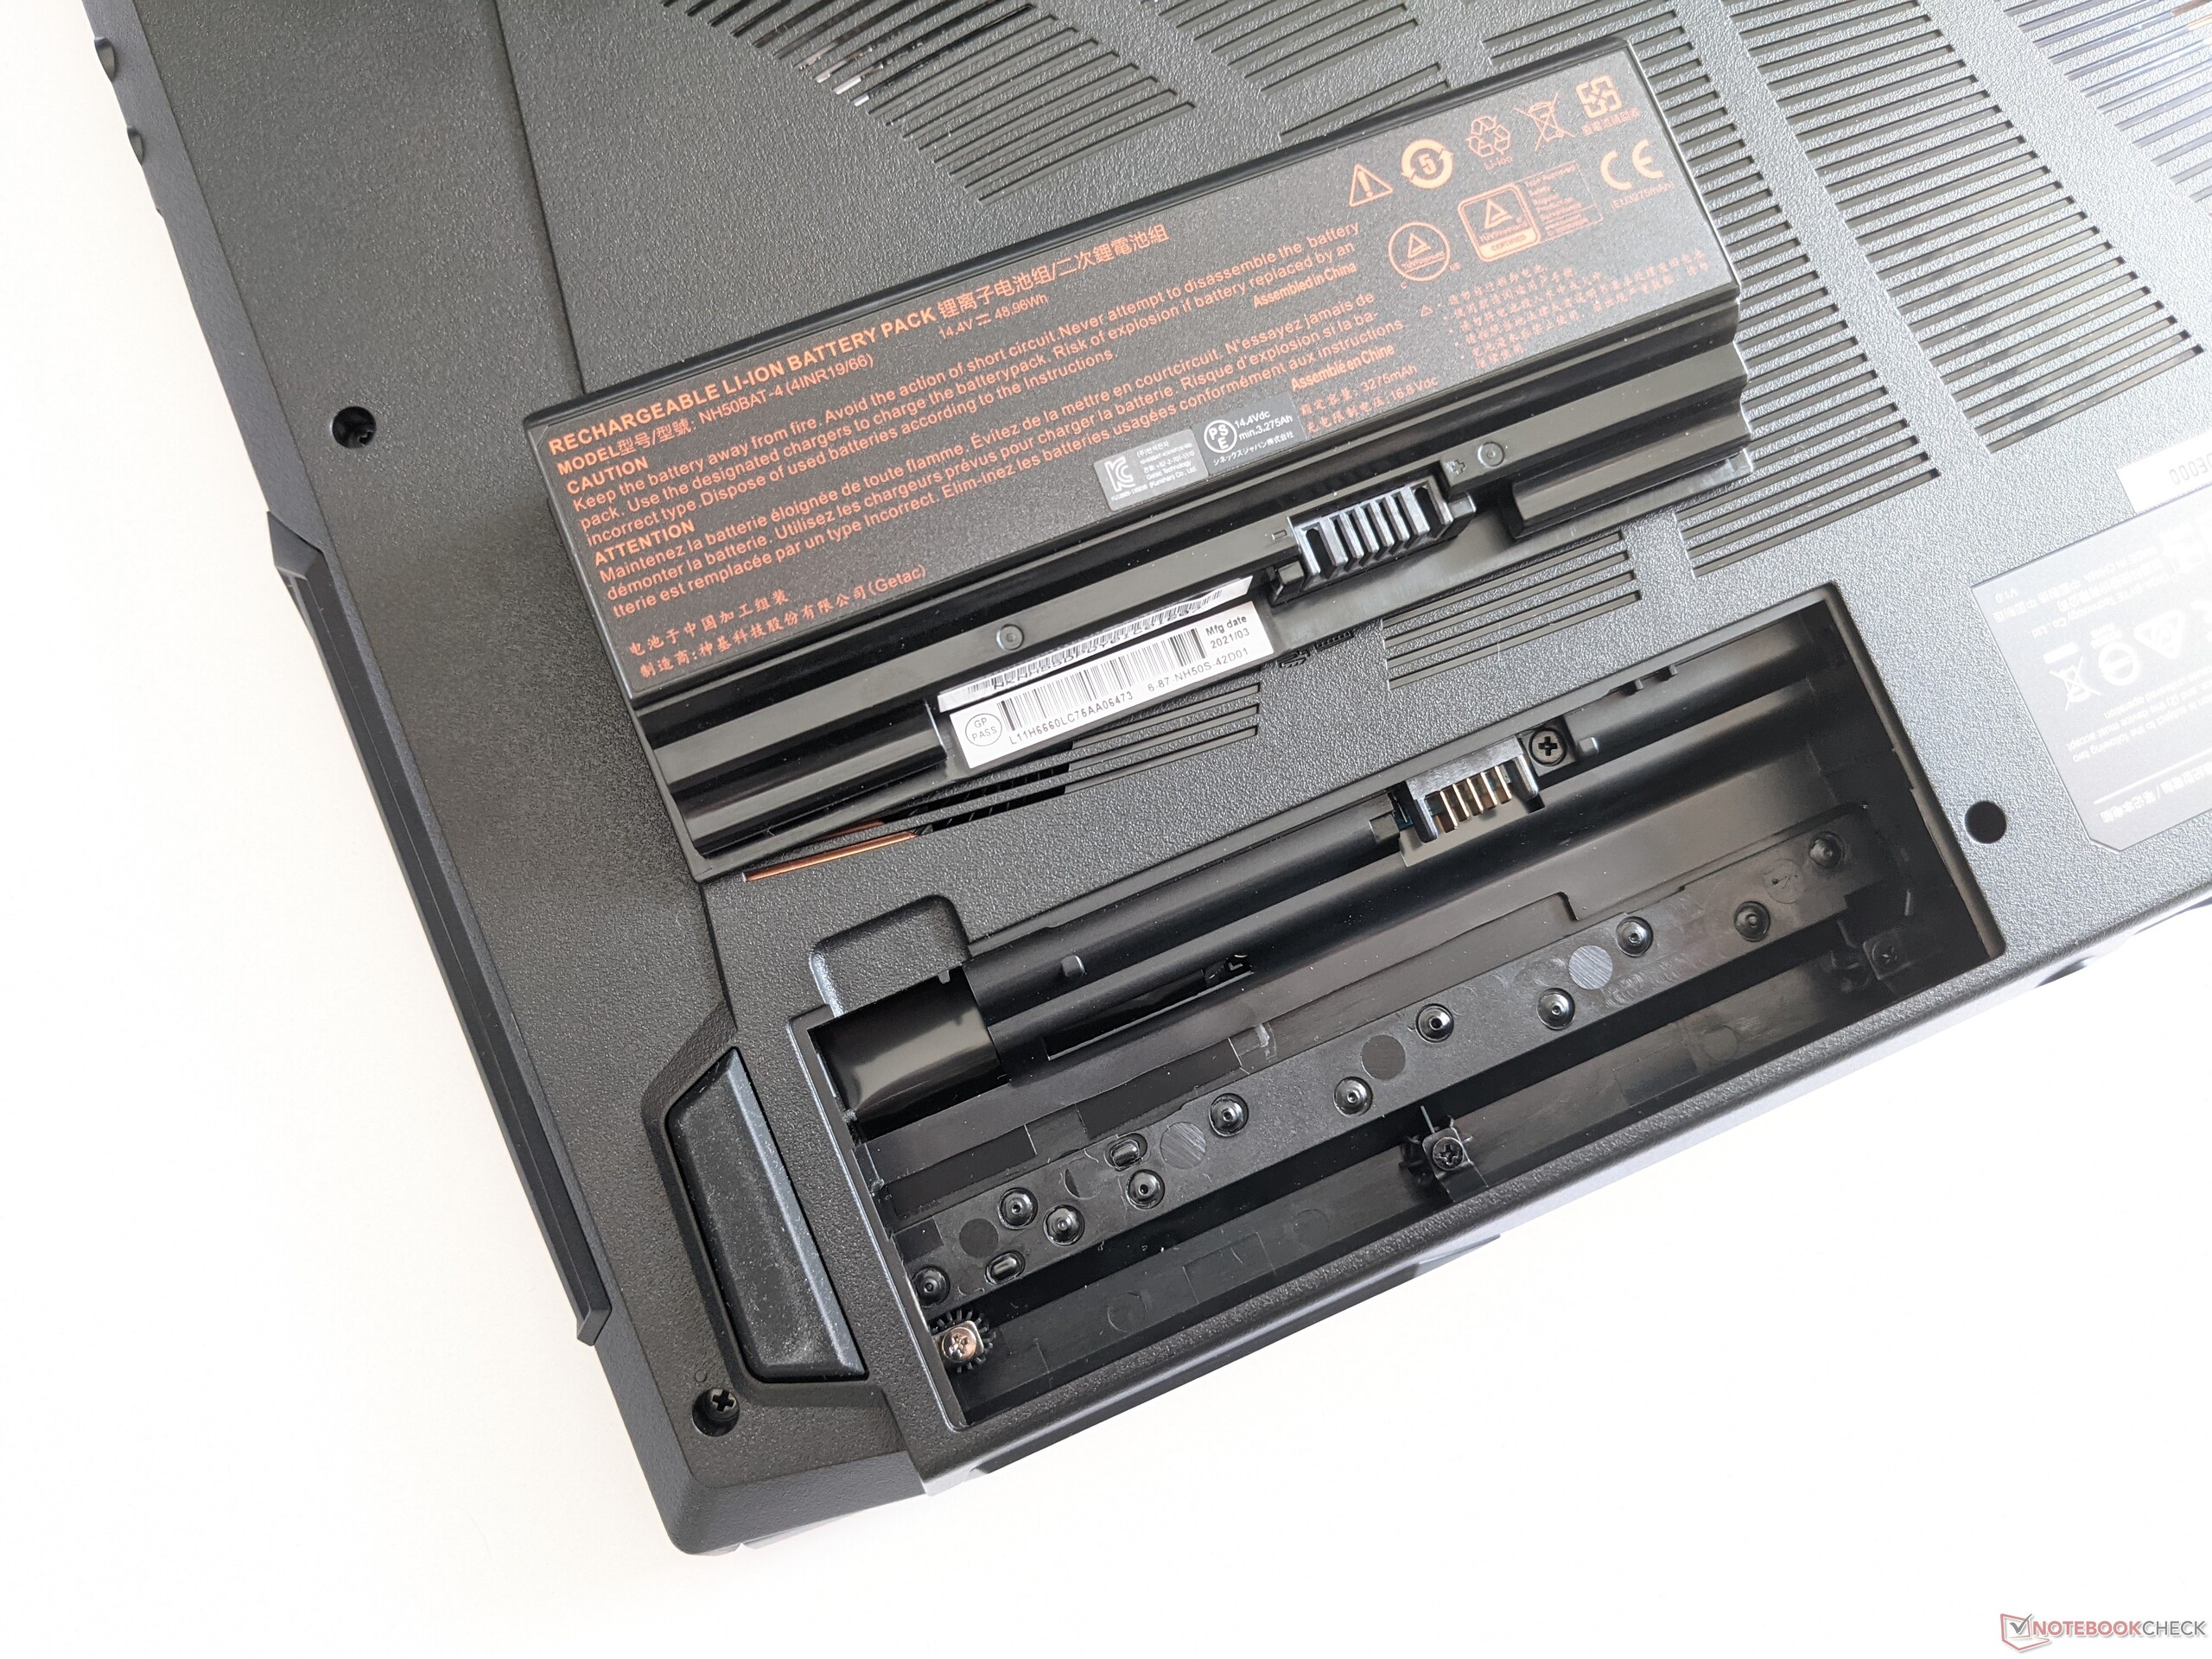
| Gigabyte G5 GD i5-11400H, GeForce RTX 3050 4GB Laptop GPU, 41 Wh | Dell G15 5515 R7 5800H, GeForce RTX 3050 Ti Laptop GPU, 56 Wh | Lenovo Legion 5 15ACH-82JU00C6GE-FL R7 5800H, GeForce RTX 3060 Laptop GPU, 80 Wh | MSI GF65 Thin 10UE i7-10750H, GeForce RTX 3060 Laptop GPU, 51 Wh | Gigabyte G5 KC i5-10500H, GeForce RTX 3060 Laptop GPU, 48.96 Wh | Average of class Gaming | |
|---|---|---|---|---|---|---|
| Battery runtime | 119% | 46% | 48% | 2% | 83% | |
| Reader / Idle (h) | 5.7 | 13.5 137% | 11.1 95% | 5.2 -9% | 7.84 ? 38% | |
| H.264 (h) | 3.6 | 8.8 144% | 4.3 19% | 8.27 ? 130% | ||
| WiFi v1.3 (h) | 3.1 | 8 158% | 4.8 55% | 4.6 48% | 3.6 16% | 7.08 ? 128% |
| Load (h) | 1.1 | 1.5 36% | 1.8 64% | 1.1 0% | 1.1 0% | 1.496 ? 36% |
Pros
Cons
Verdict - Solid gaming laptop at a low price
The G5 GD left a good overall impression - despite some shortcomings. For a low price, you can get a Full HD gaming laptop that brings all of the latest games smoothly onto the screen (although not always at maximum details).
The Core i5-11400H processor and the GeForce RTX 3050 laptop GPU can work at constant clock rates - if a working BIOS version is installed. Thanks to a TGP of 85 watts, the GPU delivers the best overall results that we've been able to determine for the RTX 3050 so far.
Gigabyte offers a well-rounded entry-level gaming laptop with the G5 GD, which is available for just under 750 Euros (~$848).
The laptop heats up noticeably under load, but not excessively. Noise development is a bit above average. The laptop runs quietly when performing everyday tasks, though. The energy profile "Power Saving Mode" is recommended for this. The resulting reduced computing power is still more than sufficient for office and Internet applications as well as HD gaming.
The meager storage capacity (512 GB, PCIe 4) can be expanded: There's space for a second M.2 SSD (PCIe 3 or SATA) and a 2.5-inch storage drive. The matte display (Full HD, IPS, 144 Hz) offers stable viewing angles, good contrast, and decent color reproduction. There is room for improvement in terms of brightness, color-space coverage, and response times. Furthermore, battery life is nothing special.
The relatively low price level of 750 Euros (~$848) is not least due to the fact that no Windows operating system is included. As a result, Linux would be the first obvious choice for an operating system, but installing and setting up the system would probably be too much of a hassle for several users. In the end, it will probably come down to Windows 10 in most cases. Windows 11 is currently only compatible with newer BIOS versions, which cause problems in terms of gaming performance. Users will have to wait for future BIOS updates here.
An alternative to the G5 GD would be the Dell G15 5515. It's equipped with more powerful components, and at the same time, it offers much better battery life than the Gigabyte laptop.
Price and availability
At the time of writing, the Gigabyte G5 GD can be found on Amazon in our same test configuration (Core i5-11400H, GeForce RTX 3050, 16 GB RAM, 512 GB SSD) and with Windows 10 Home at a discounted price of $849.
Gigabyte G5 GD
- 11/21/2021 v7 (old)
Sascha Mölck
Price comparison

