Gigabyte G5 KC in review: Upgradeable gaming laptop

With laptops like the Aero 15 OLED XD and the Aero 17 HDR YD, Gigabyte offers very high-quality, but also quite expensive devices. However, the Gigabyte G5 KC proves that the manufacturer can also offer more affordable models. In our test configuration, it's available with an Intel Core i5-10500H, an Nvidia GeForce RTX 3060, 16 GB of RAM, and a 512 GB SSD for roughly 1,000 Euros (~$1,184).
With this configuration, it has to face the competition listed below, to which additional laptops from our database can be added under each section.
Possible contenders in comparison
Rating | Date | Model | Weight | Height | Size | Resolution | Price |
|---|---|---|---|---|---|---|---|
| 80.7 % v7 (old) | 09 / 2021 | Gigabyte G5 KC i5-10500H, GeForce RTX 3060 Laptop GPU | 2.1 kg | 28 mm | 15.60" | 1920x1080 | |
| 81.1 % v7 (old) | 08 / 2021 | Acer Nitro 5 AN517-53-54DQ i5-11300H, GeForce RTX 3050 4GB Laptop GPU | 2.6 kg | 25 mm | 17.30" | 1920x1080 | |
| 80.4 % v7 (old) | 03 / 2021 | MSI GF65 Thin 10UE i7-10750H, GeForce RTX 3060 Laptop GPU | 1.9 kg | 21.7 mm | 15.60" | 1920x1080 | |
v (old) | 12 / 2020 | Dell G5 15 5500 09E2 i5-10300H, GeForce GTX 1650 Ti Mobile | 2.3 kg | 21.6 mm | 15.60" | 1920x1080 |
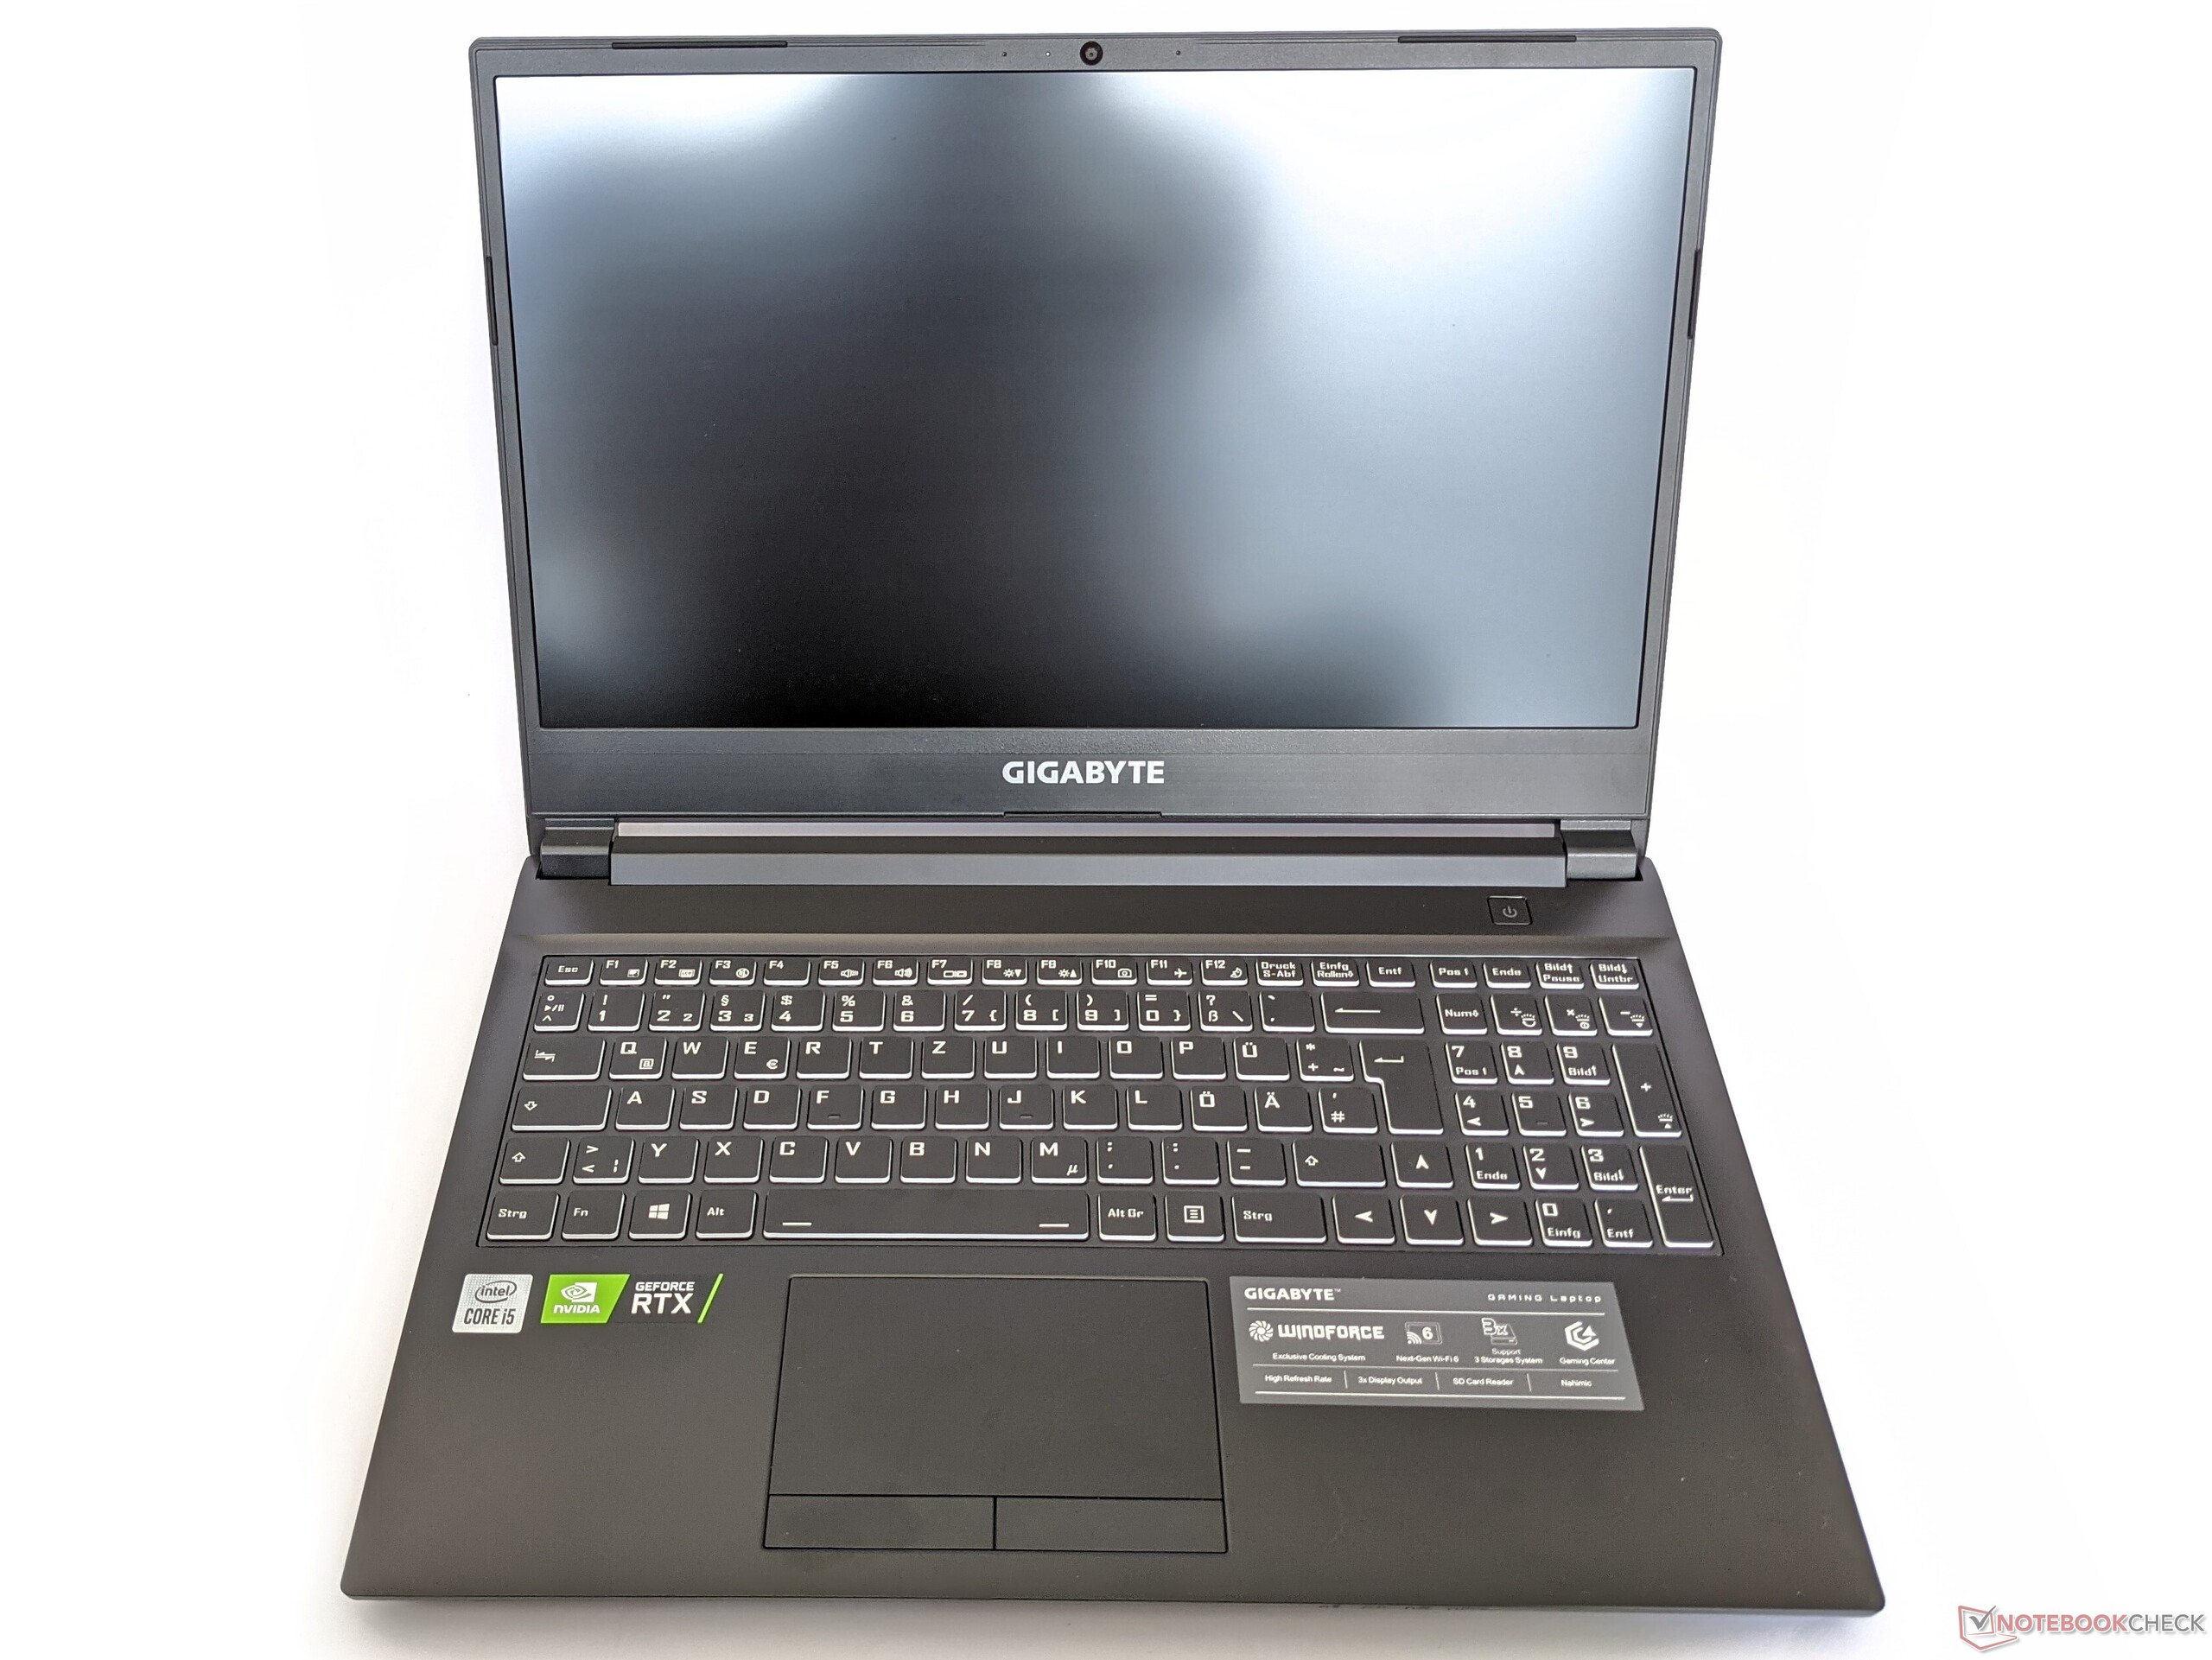
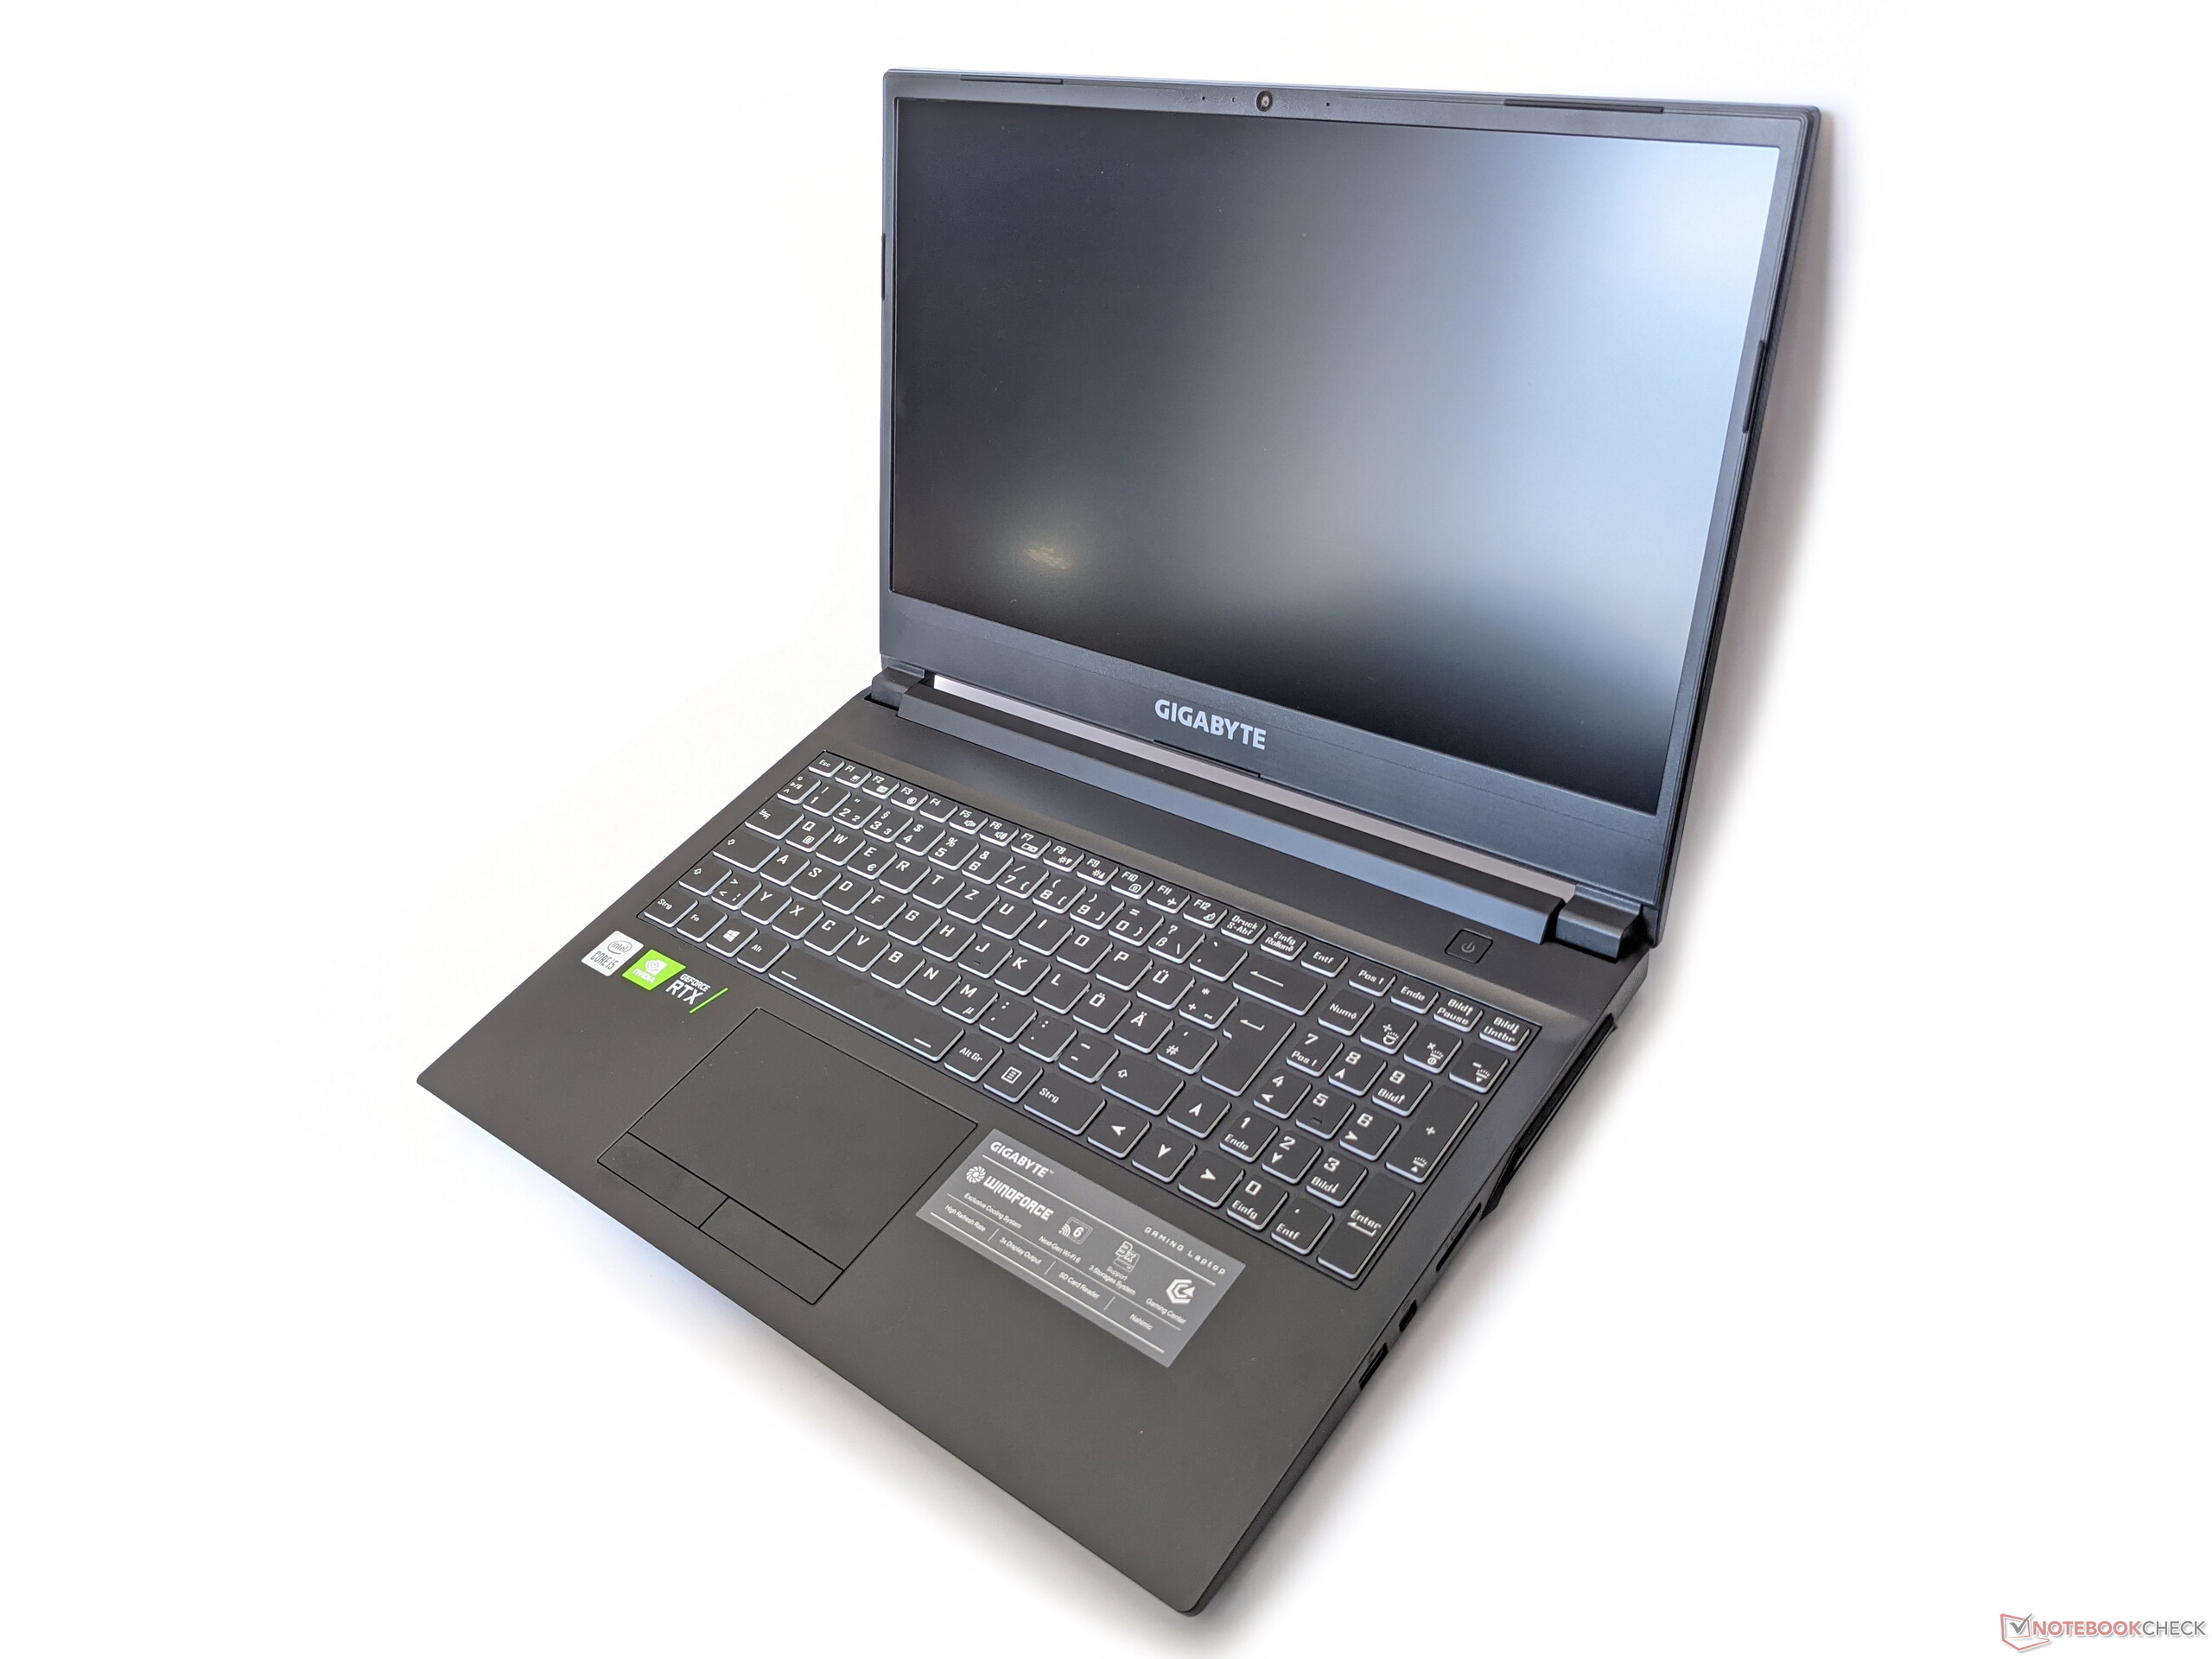
Case - Laptop with replaceable battery
The Gigabyte G5 KC's case is made of sturdy plastic that protects both the base unit as well as the lid of the gaming laptop against torsion. The screen can be folded back by about 135 degrees, and it's kept firmly in its respective position by the hinges. The build quality is good, and we were unable to find any uneven gap dimensions or the like.
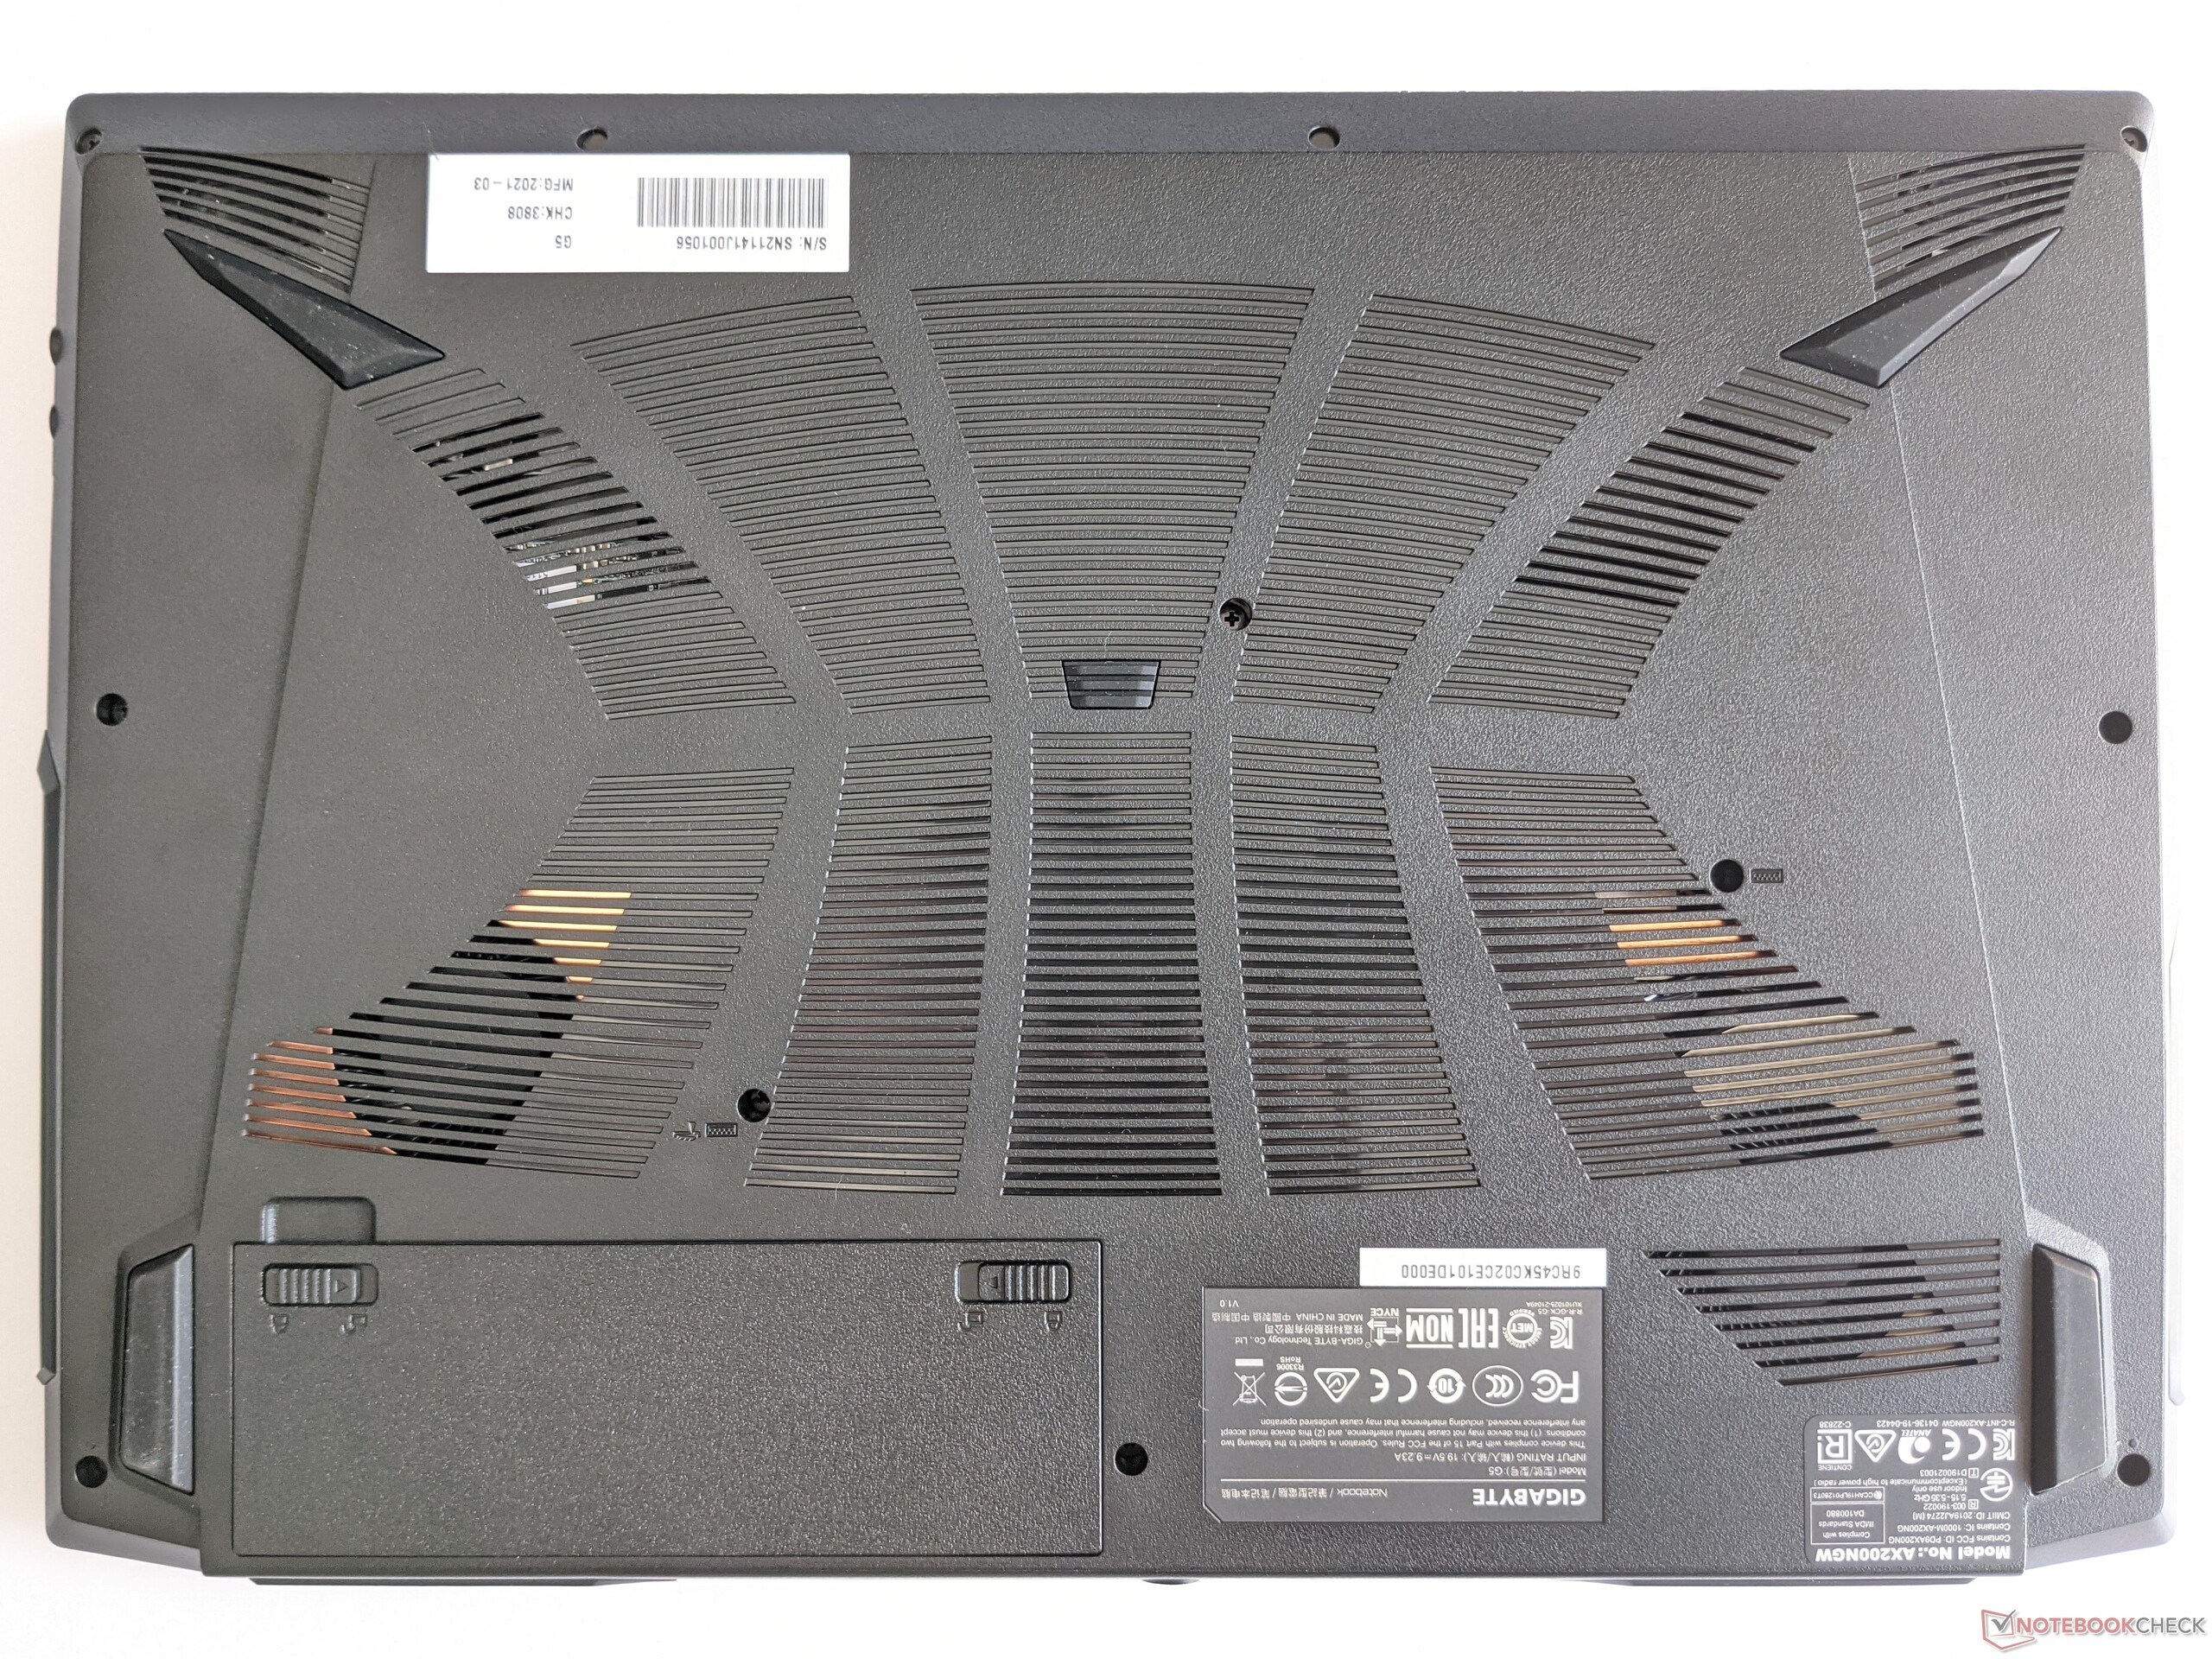
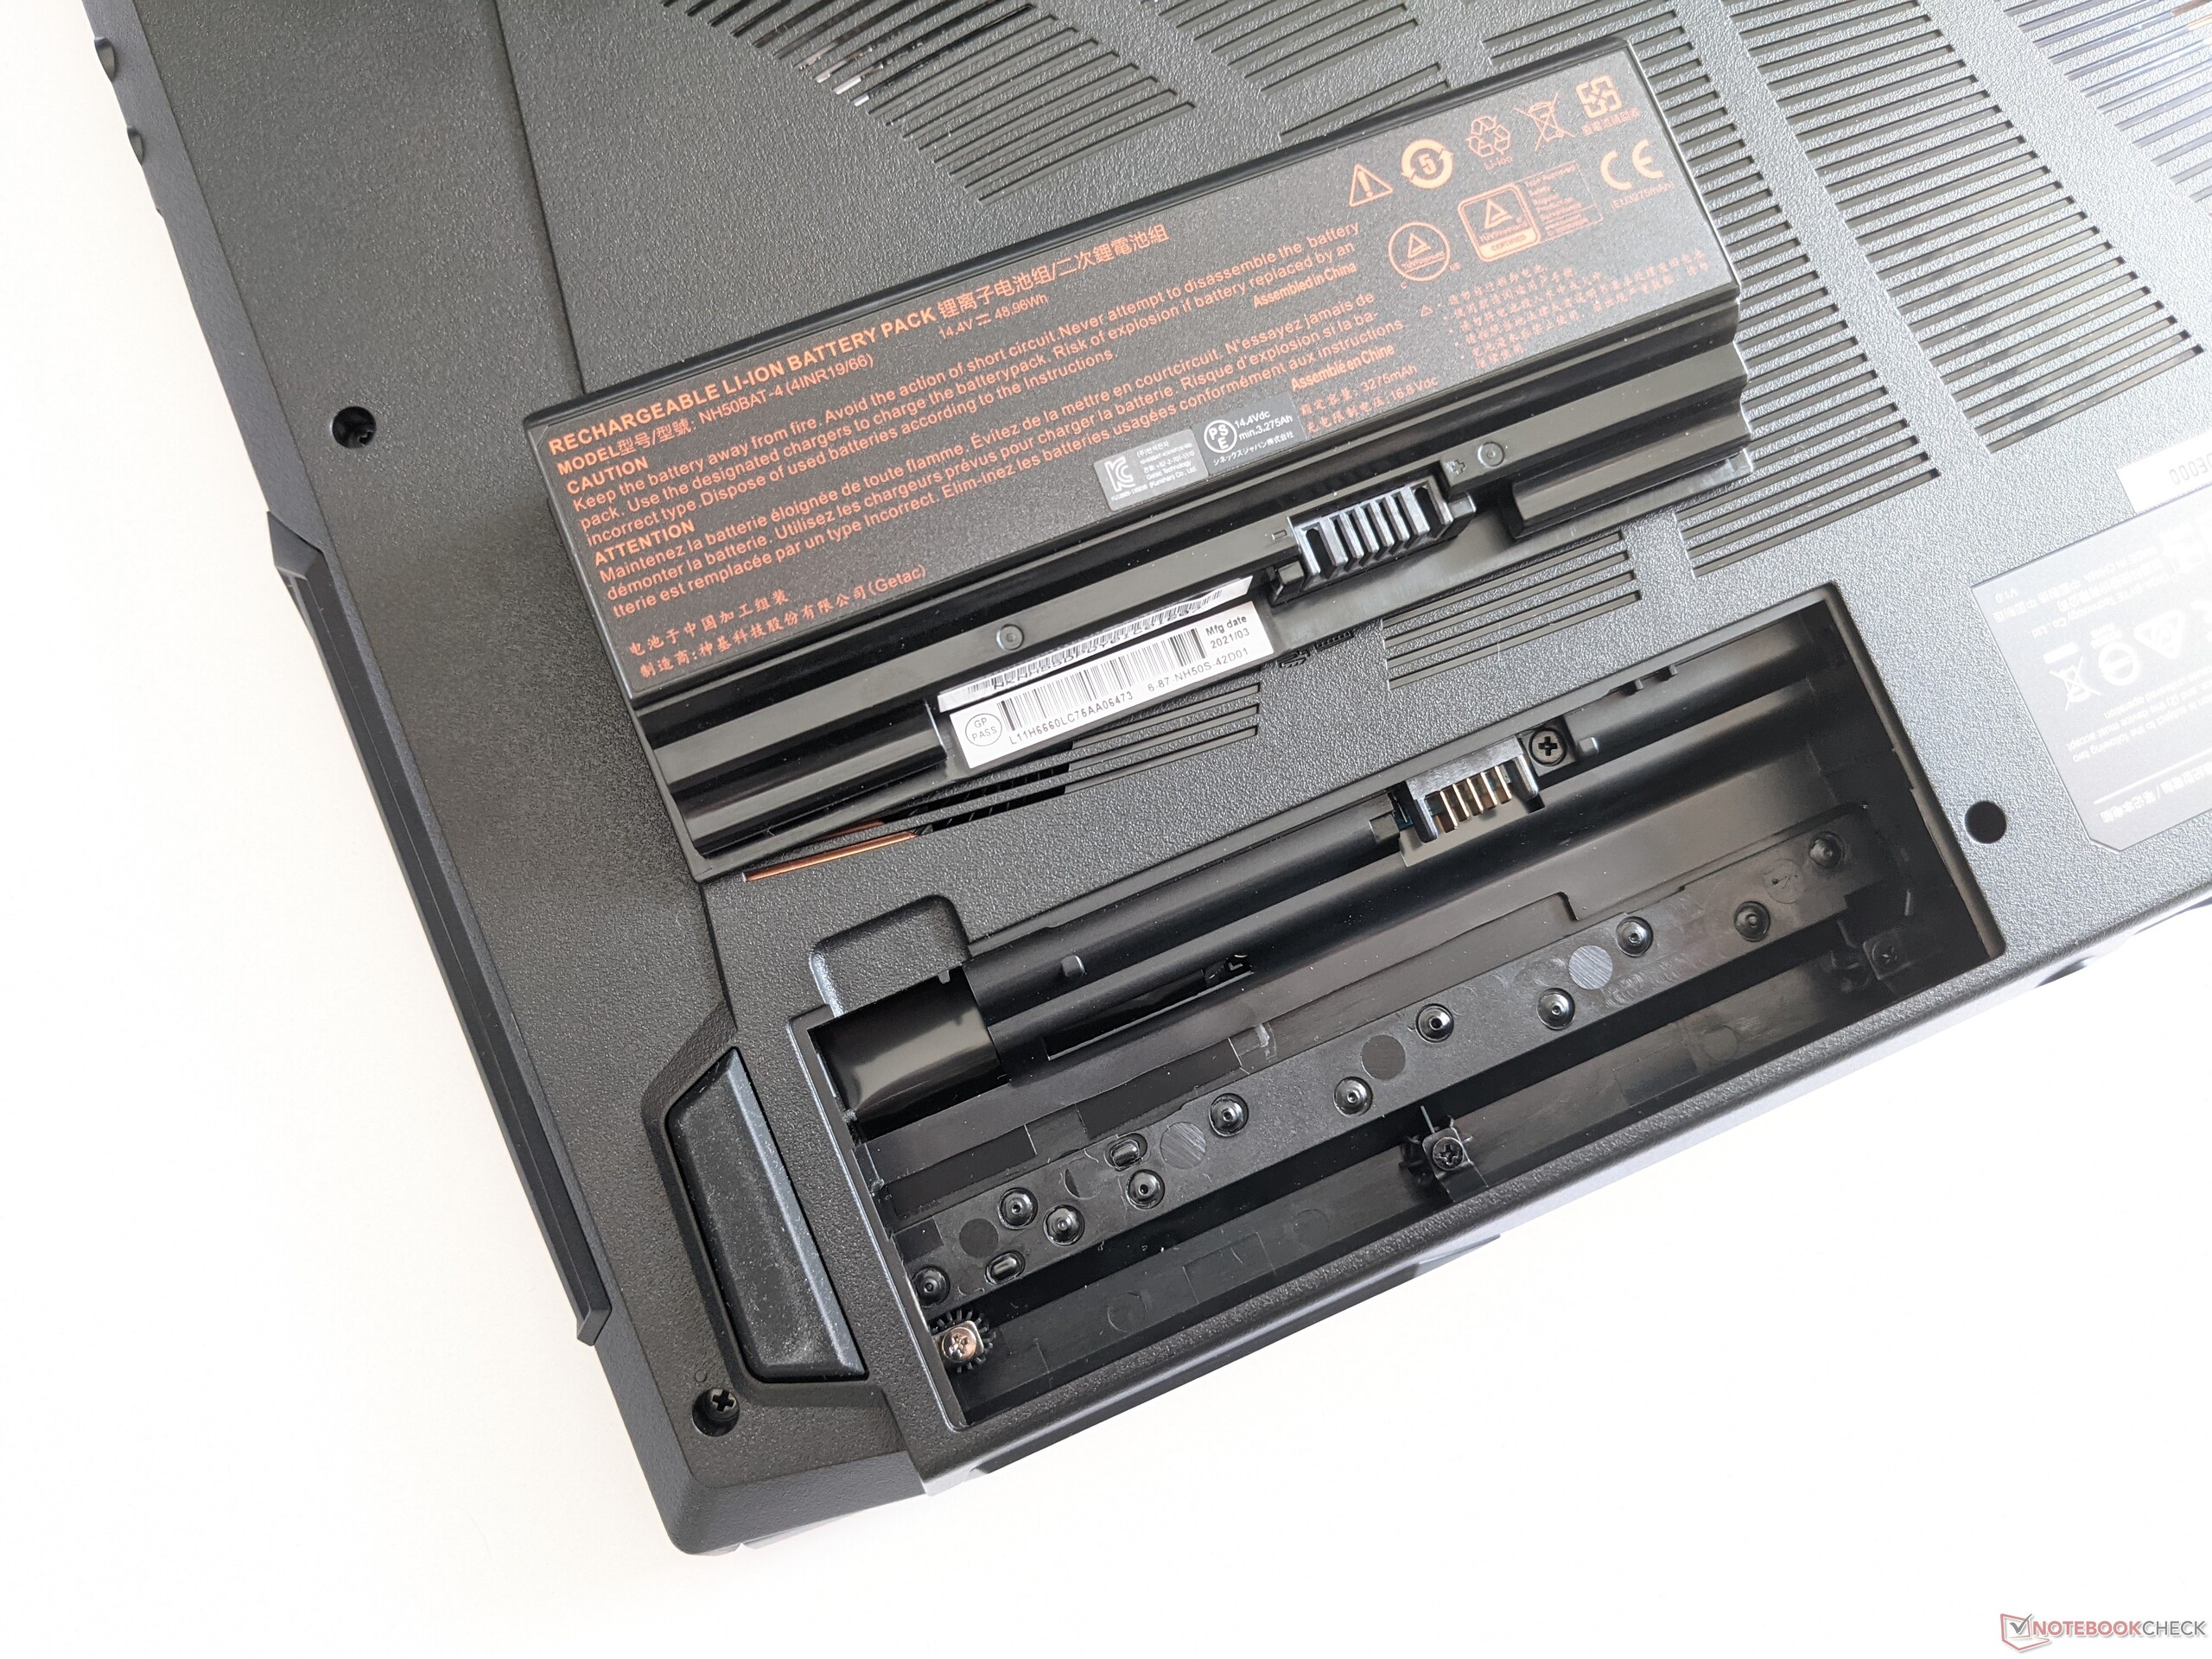
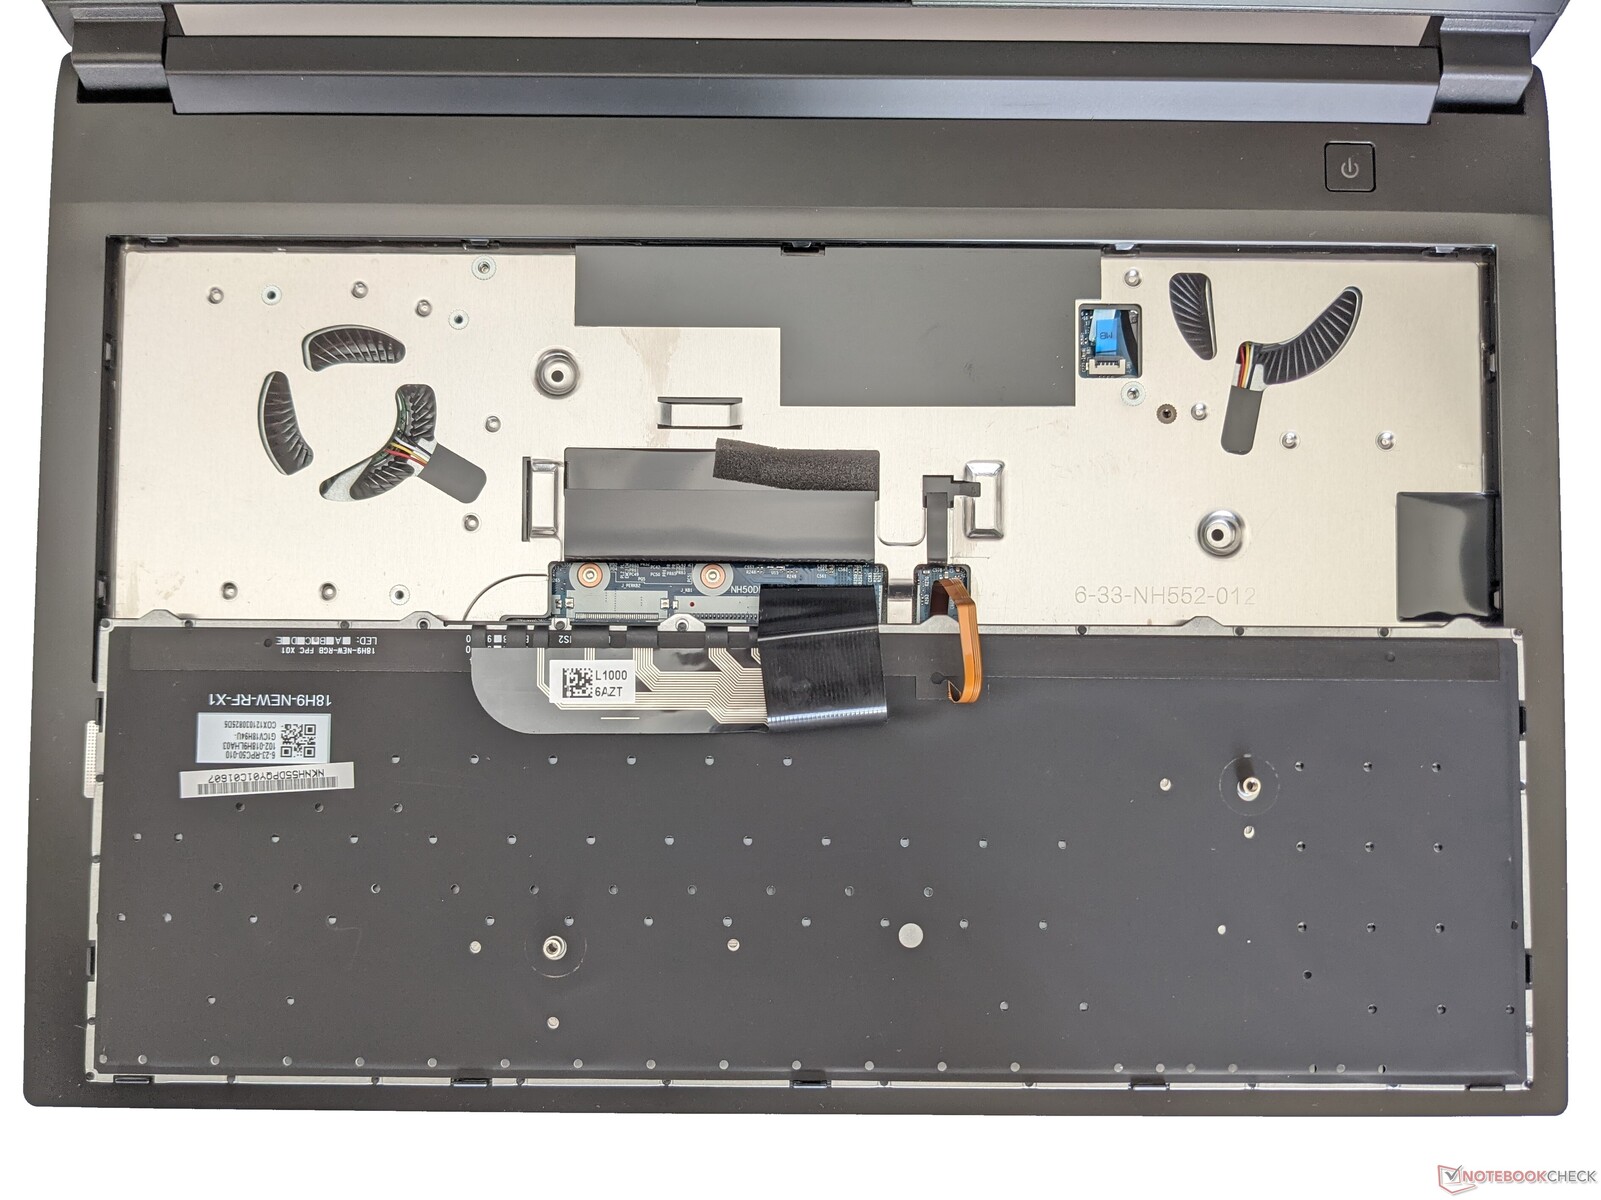
A unique feature of the G5 is that the battery can be removed at the bottom without requiring any tools. You only need to release the lock, and then you can replace the battery.
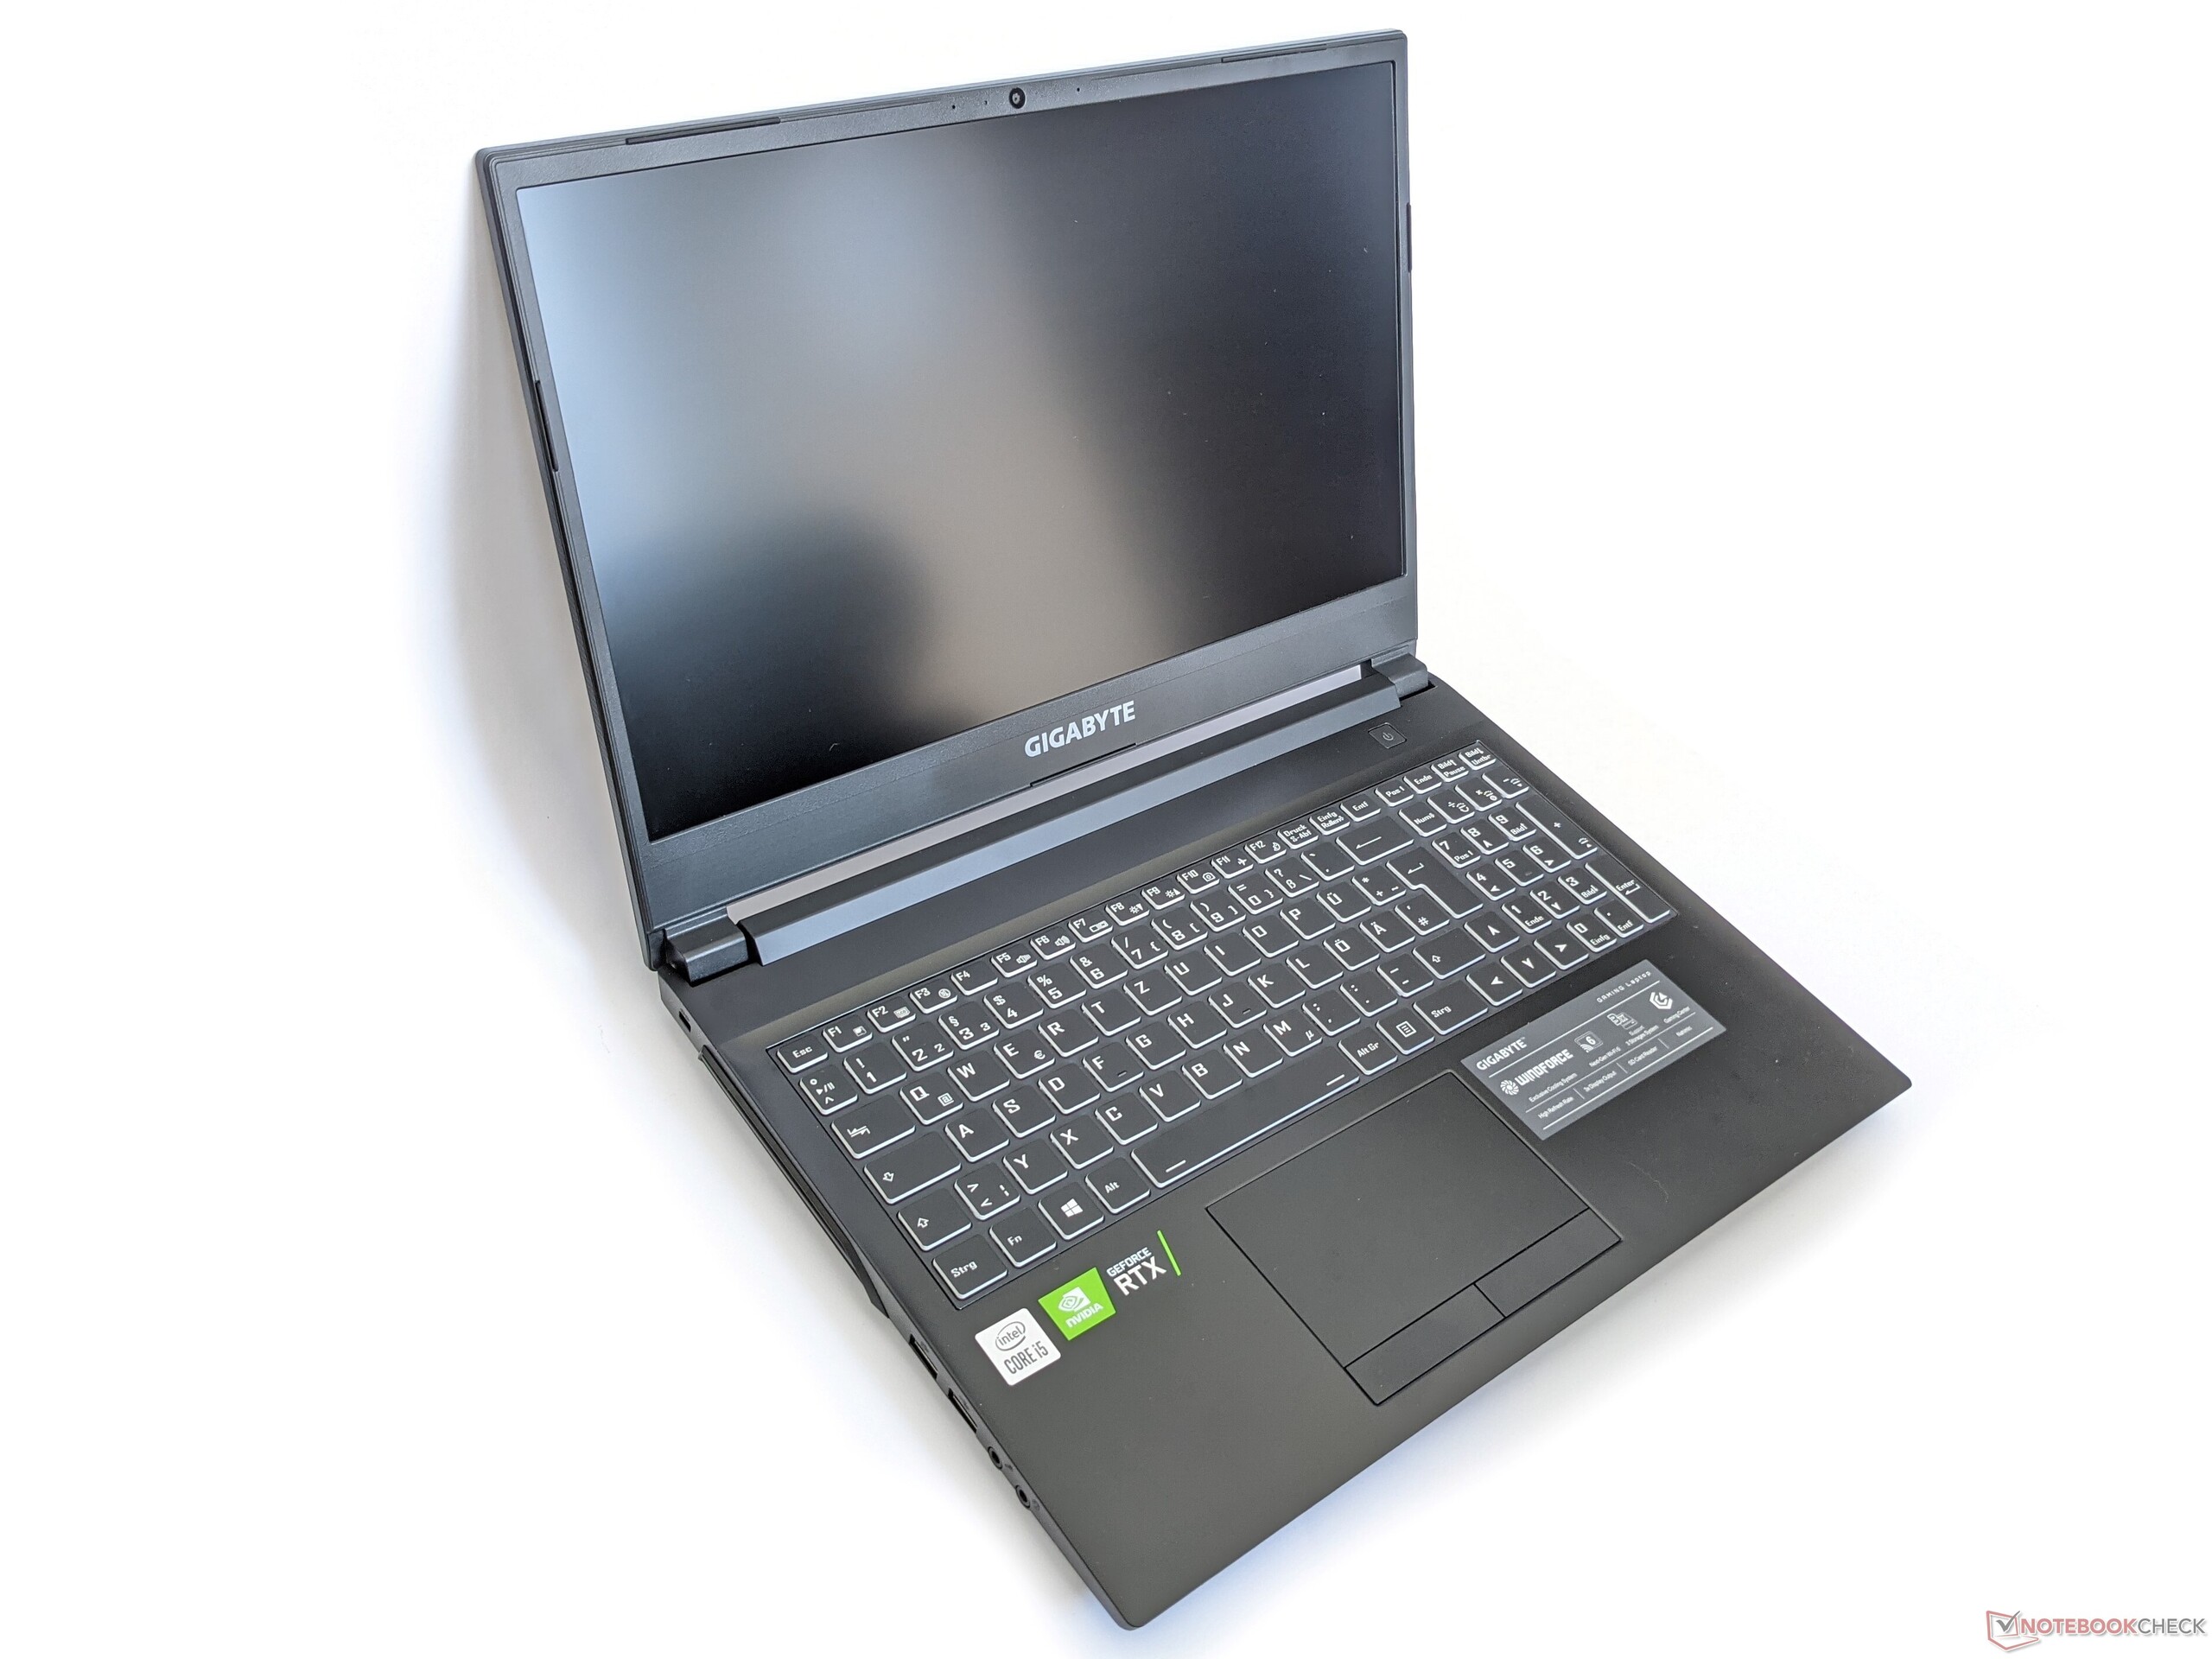
The G5's footprint is similar to that of other 15-inch laptops. However, it's significantly thicker than the rest of the devices in our test field. At around 2.1 kilograms, though, the weight is once again in the midfield.
Connectivity - Gaming laptop offers many ports
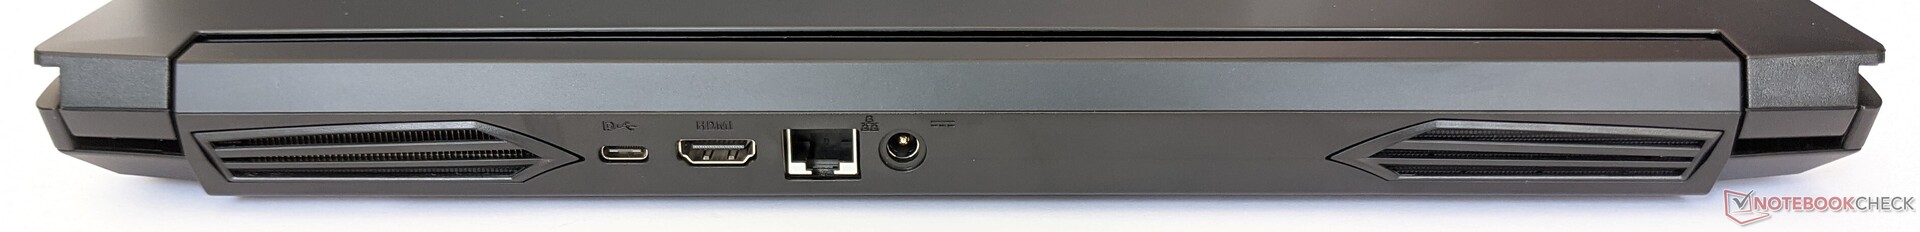
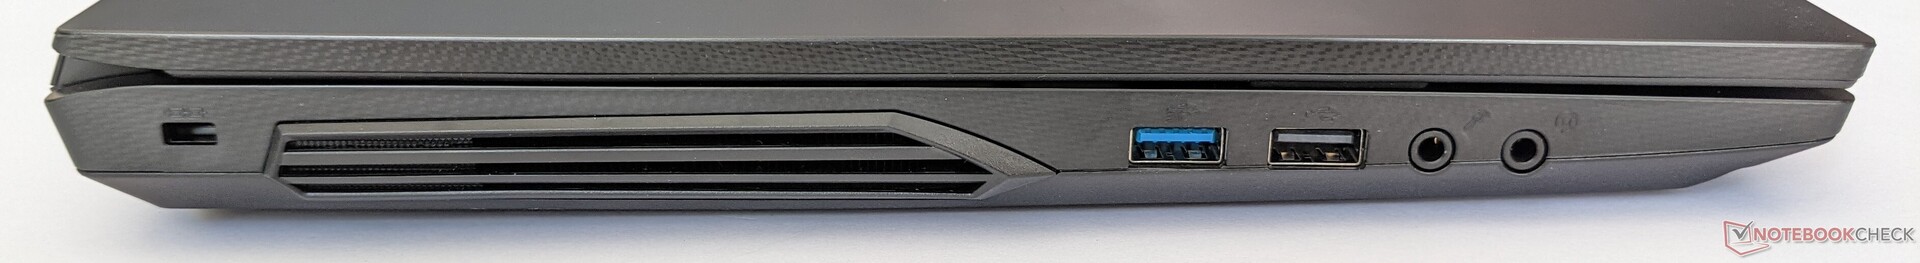
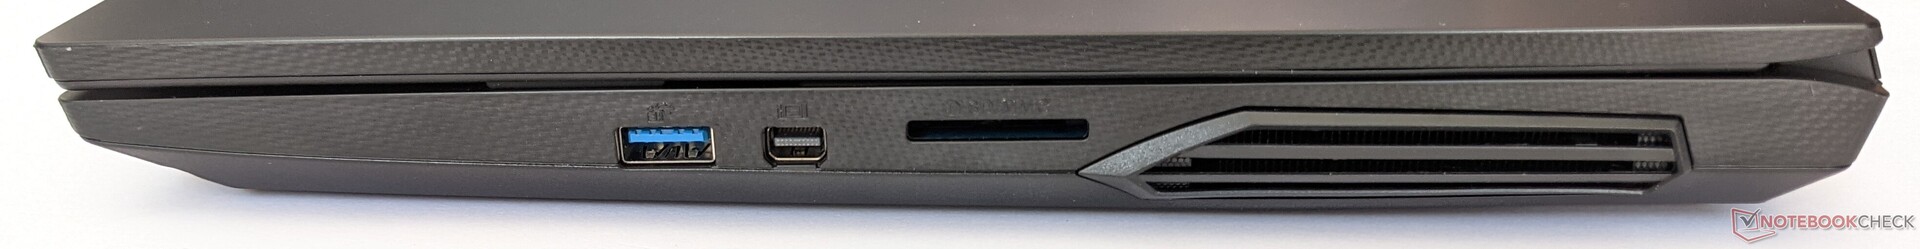
The Gigabyte G5 KC has a respectable range of ports. These include a Gigabit LAN port and a Mini DisplayPort. Since some interfaces, including the power supply, have been placed on the back, you shouldn't expect too much congestion caused by connected cables.

SD card reader
With our 128 GB AV PRO microSD V60 reference memory card, the Gigabyte G5 achieves a passable result of 77 MB/s for copying data and 87 MB/s for reading data. Furthermore, the G5 is the only gaming laptop with an SD card reader in our test field.
| SD Card Reader | |
| average JPG Copy Test (av. of 3 runs) | |
| Average of class Gaming (20.9 - 210, n=54, last 2 years) | |
| Gigabyte G5 KC (AV PRO microSD 128 GB V60) | |
| maximum AS SSD Seq Read Test (1GB) | |
| Average of class Gaming (25.5 - 261, n=51, last 2 years) | |
| Gigabyte G5 KC (AV PRO microSD 128 GB V60) | |
Communication
The Gigabyte G5 KC has a Gigabit LAN port and is able to establish wireless connections via Bluetooth 5.2 as well as Wi-Fi 6. Using the latter in combination with our Netgear Nighthawk AX12 reference router, we reach average speeds of 1,388 Mb/s for receiving data and 1,520 Mb/s for sending data. This allows the gaming laptop to claim the first place in our test field.
| Networking | |
| iperf3 transmit AX12 | |
| Gigabyte G5 KC | |
| Acer Nitro 5 AN517-53-54DQ | |
| MSI GF65 Thin 10UE | |
| Average Intel Wi-Fi 6 AX200 (447 - 1645, n=127) | |
| iperf3 receive AX12 | |
| Gigabyte G5 KC | |
| Acer Nitro 5 AN517-53-54DQ | |
| MSI GF65 Thin 10UE | |
| Average Intel Wi-Fi 6 AX200 (523 - 1684, n=128) | |
Webcam
The Gigabyte G5 also comes with a low-resolution 0.9 MP webcam like most recent laptops. Image quality is correspondingly mediocre, with subjects appearing blurry and with pale colors even in good lighting conditions.


Maintenance
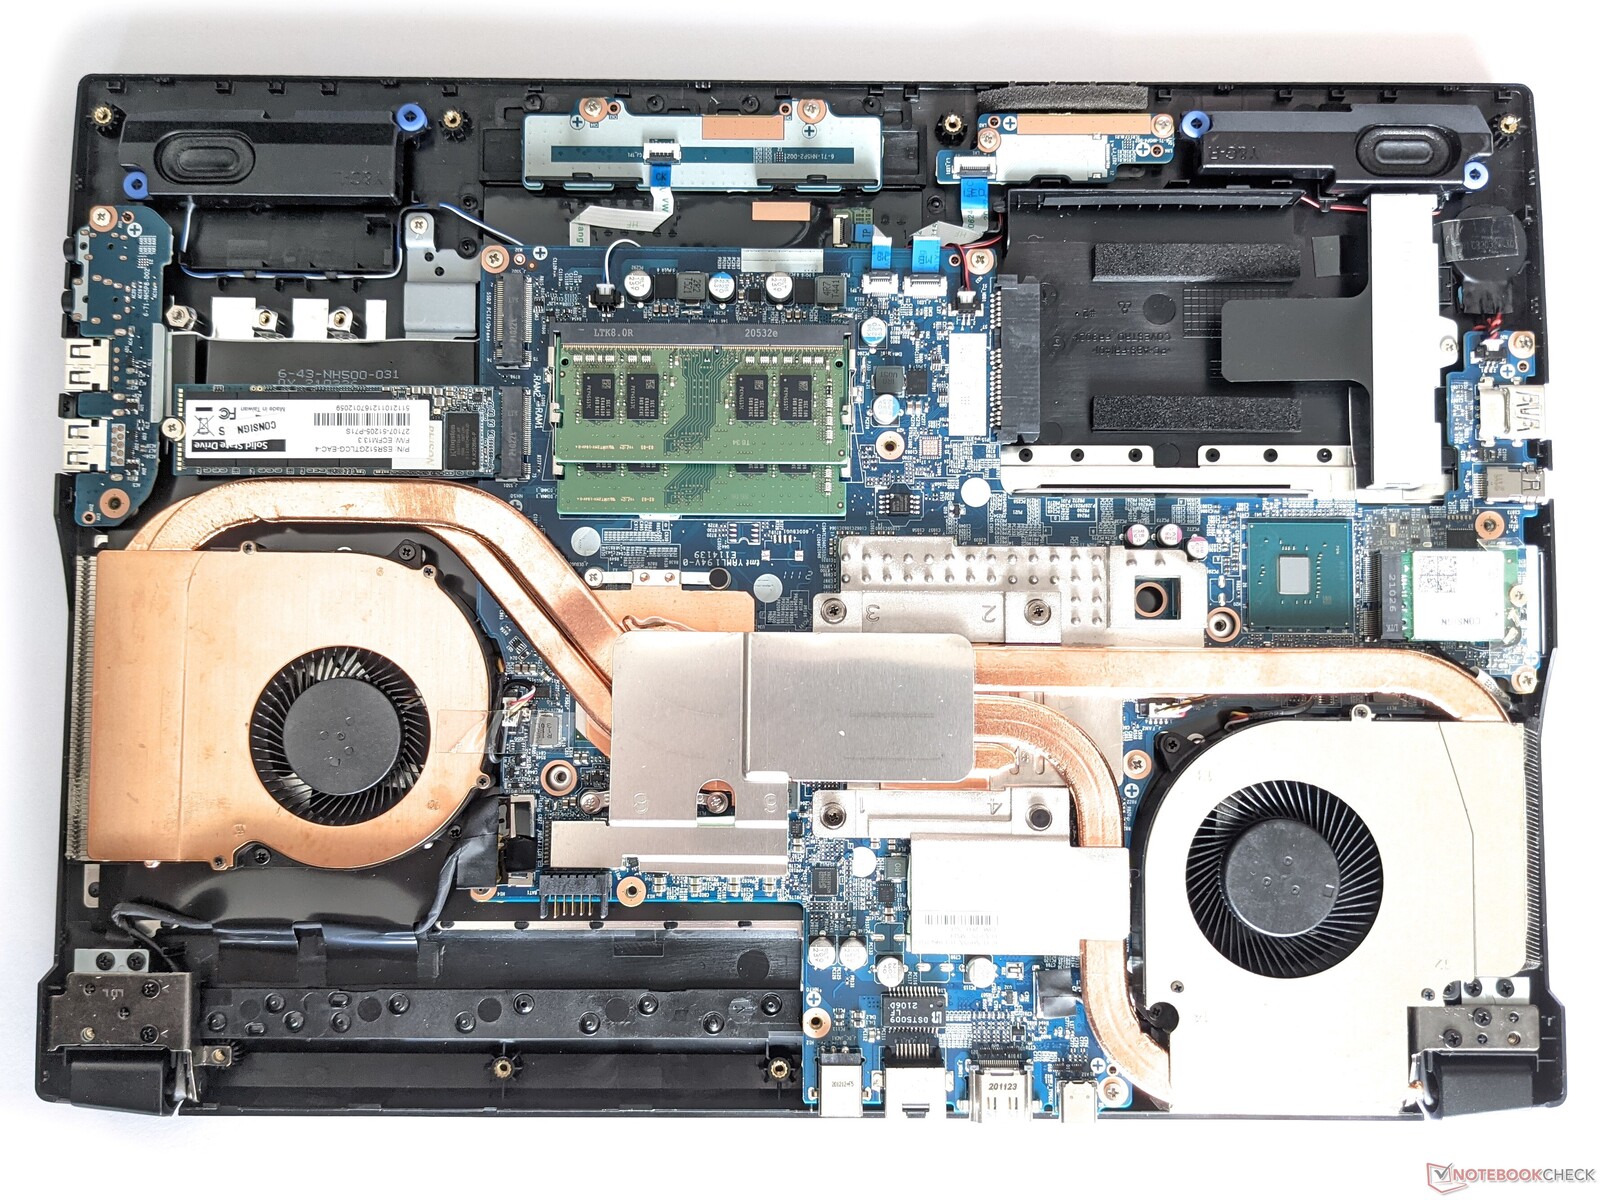
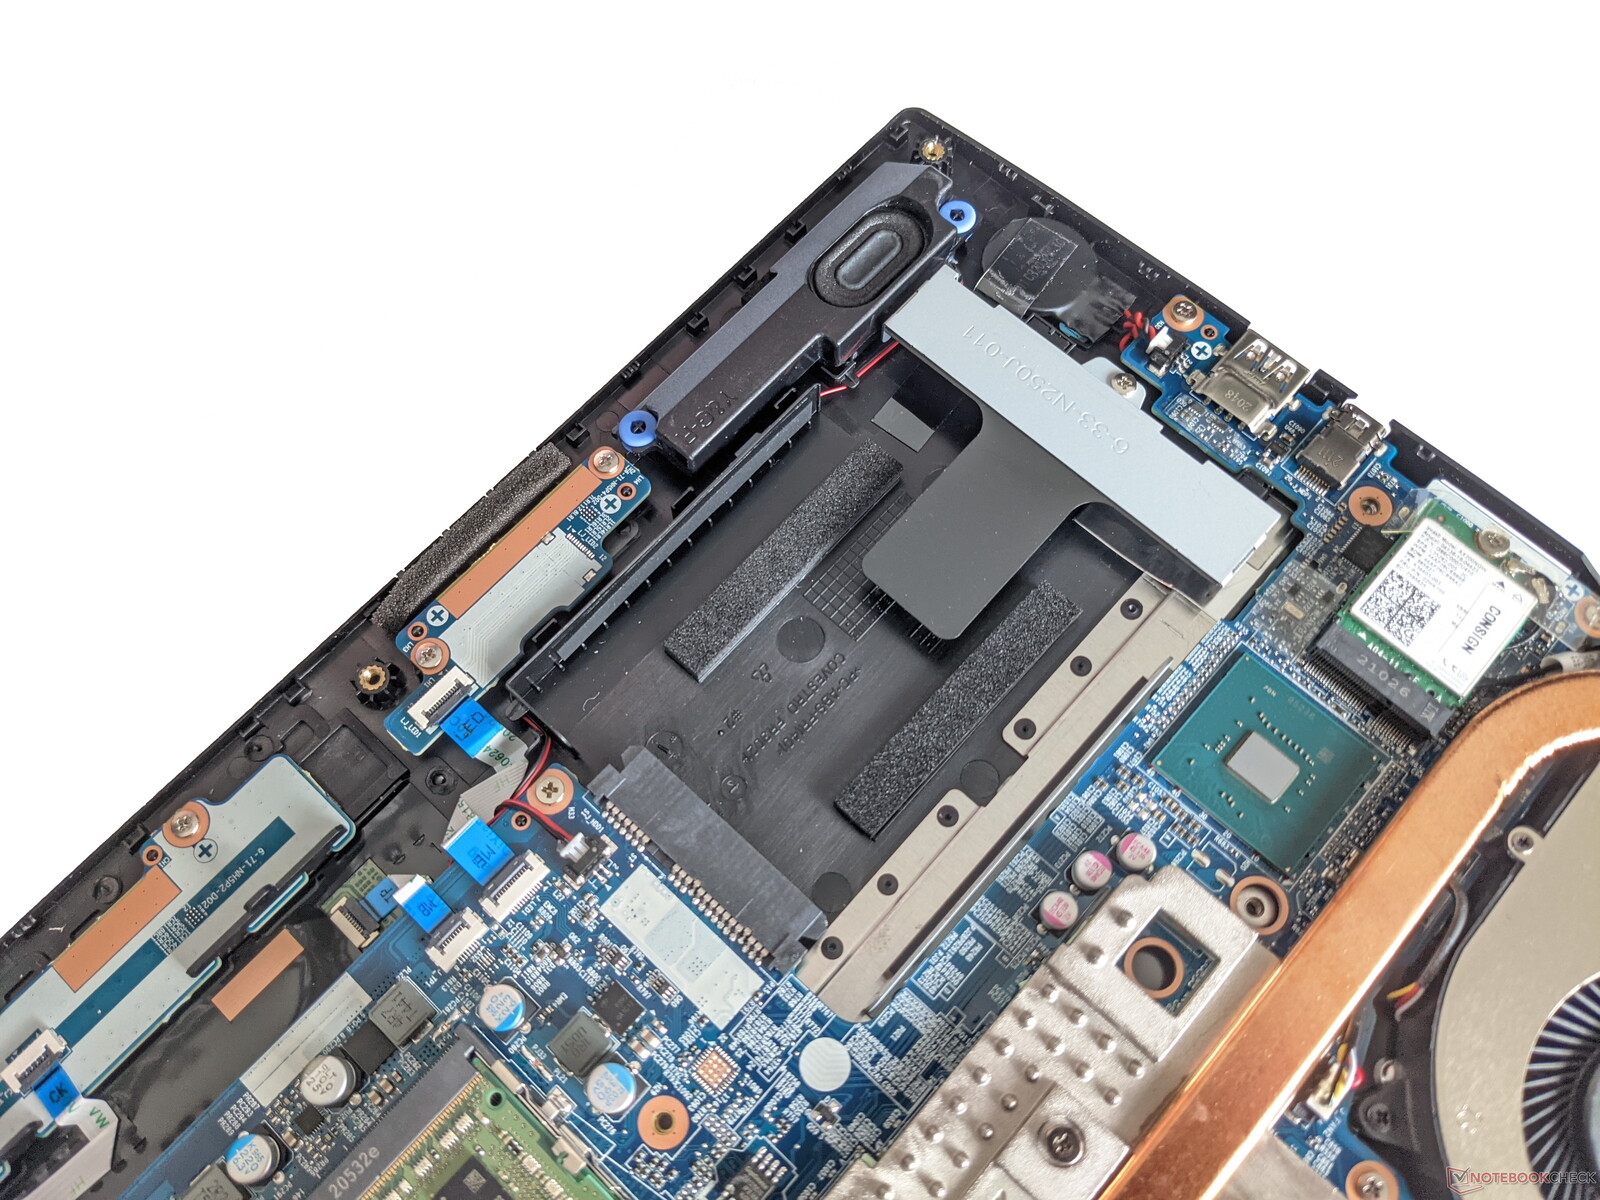
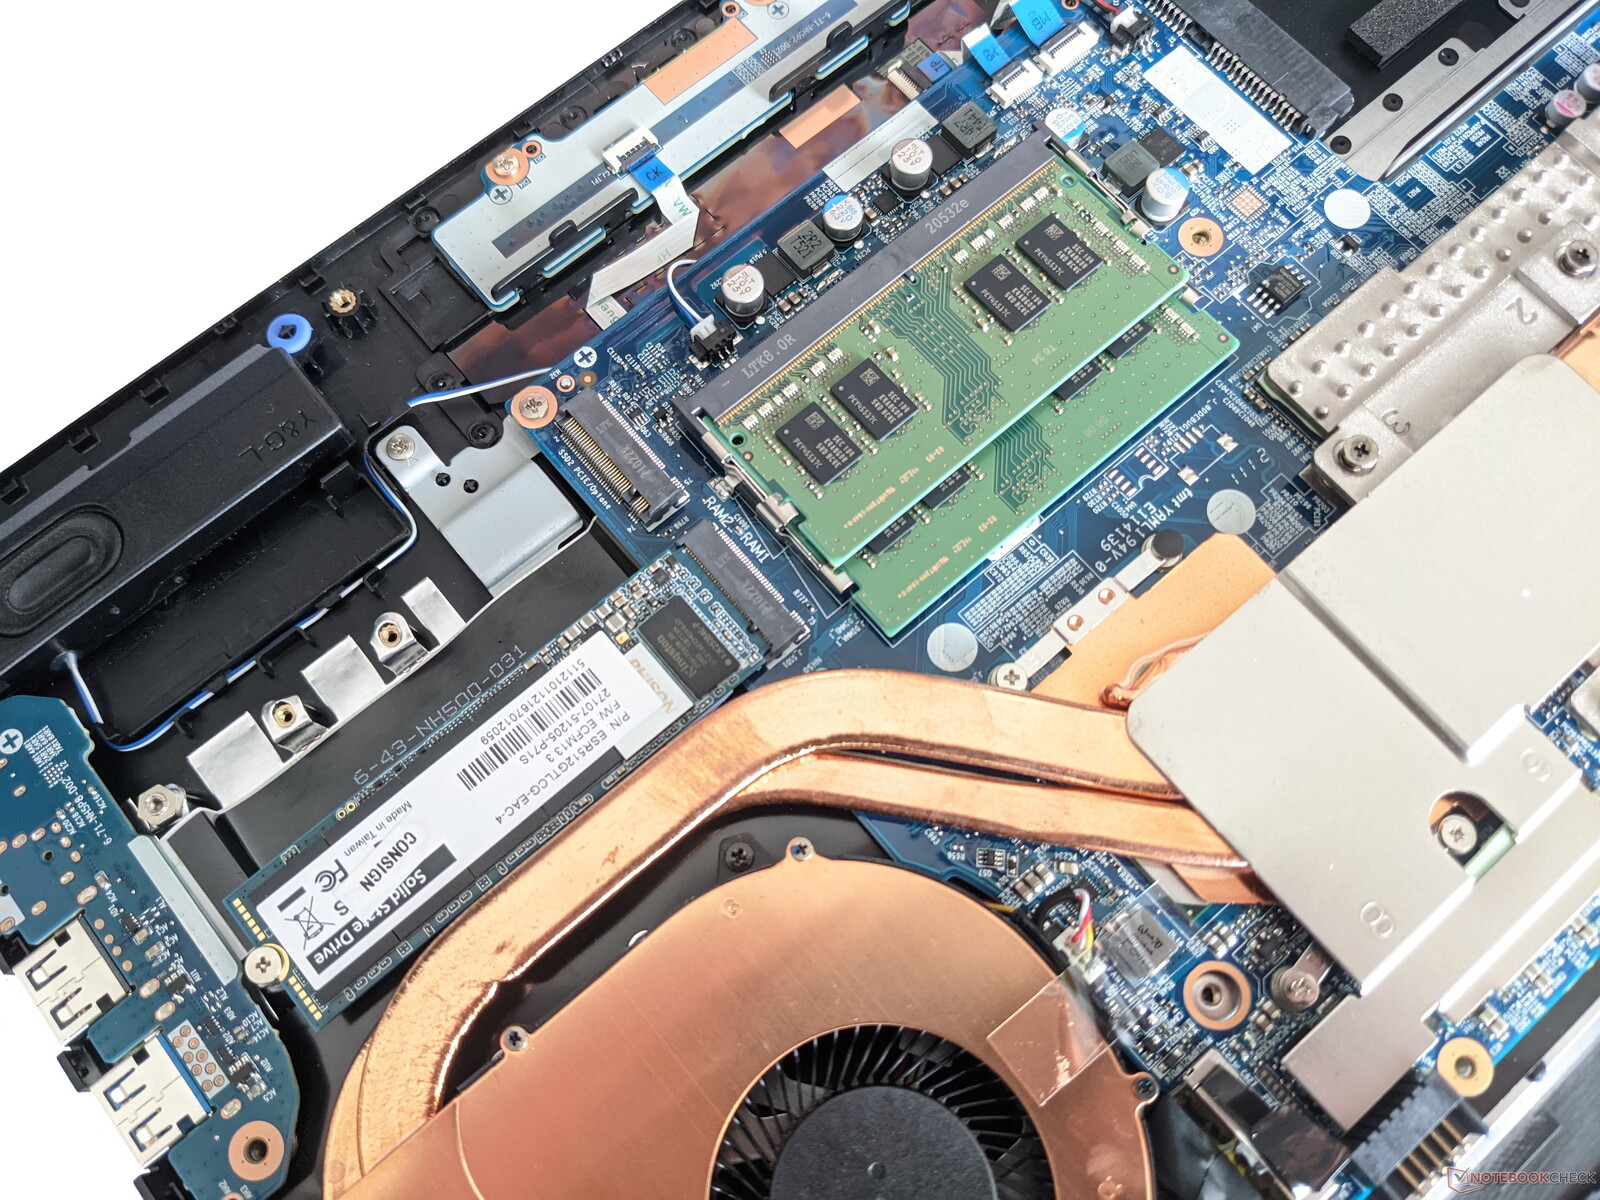
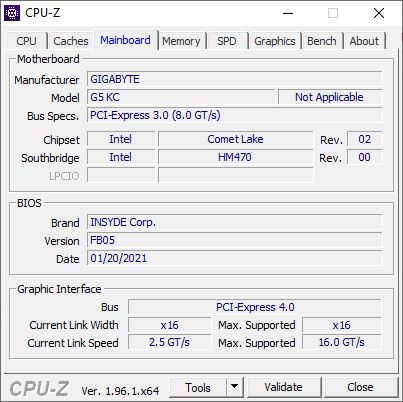
Apart from the battery, which can be replaced without tools, the Gigabyte G5's keyboard can also be changed if necessary. Removing the numerous screws on the underside also provides access to two RAM slots, two SSD slots, and a free 2.5-inch drive slot. The WLAN module can be replaced here as well.
Warranty
Gigabyte offers a 24-month warranty period for the G5 KC.
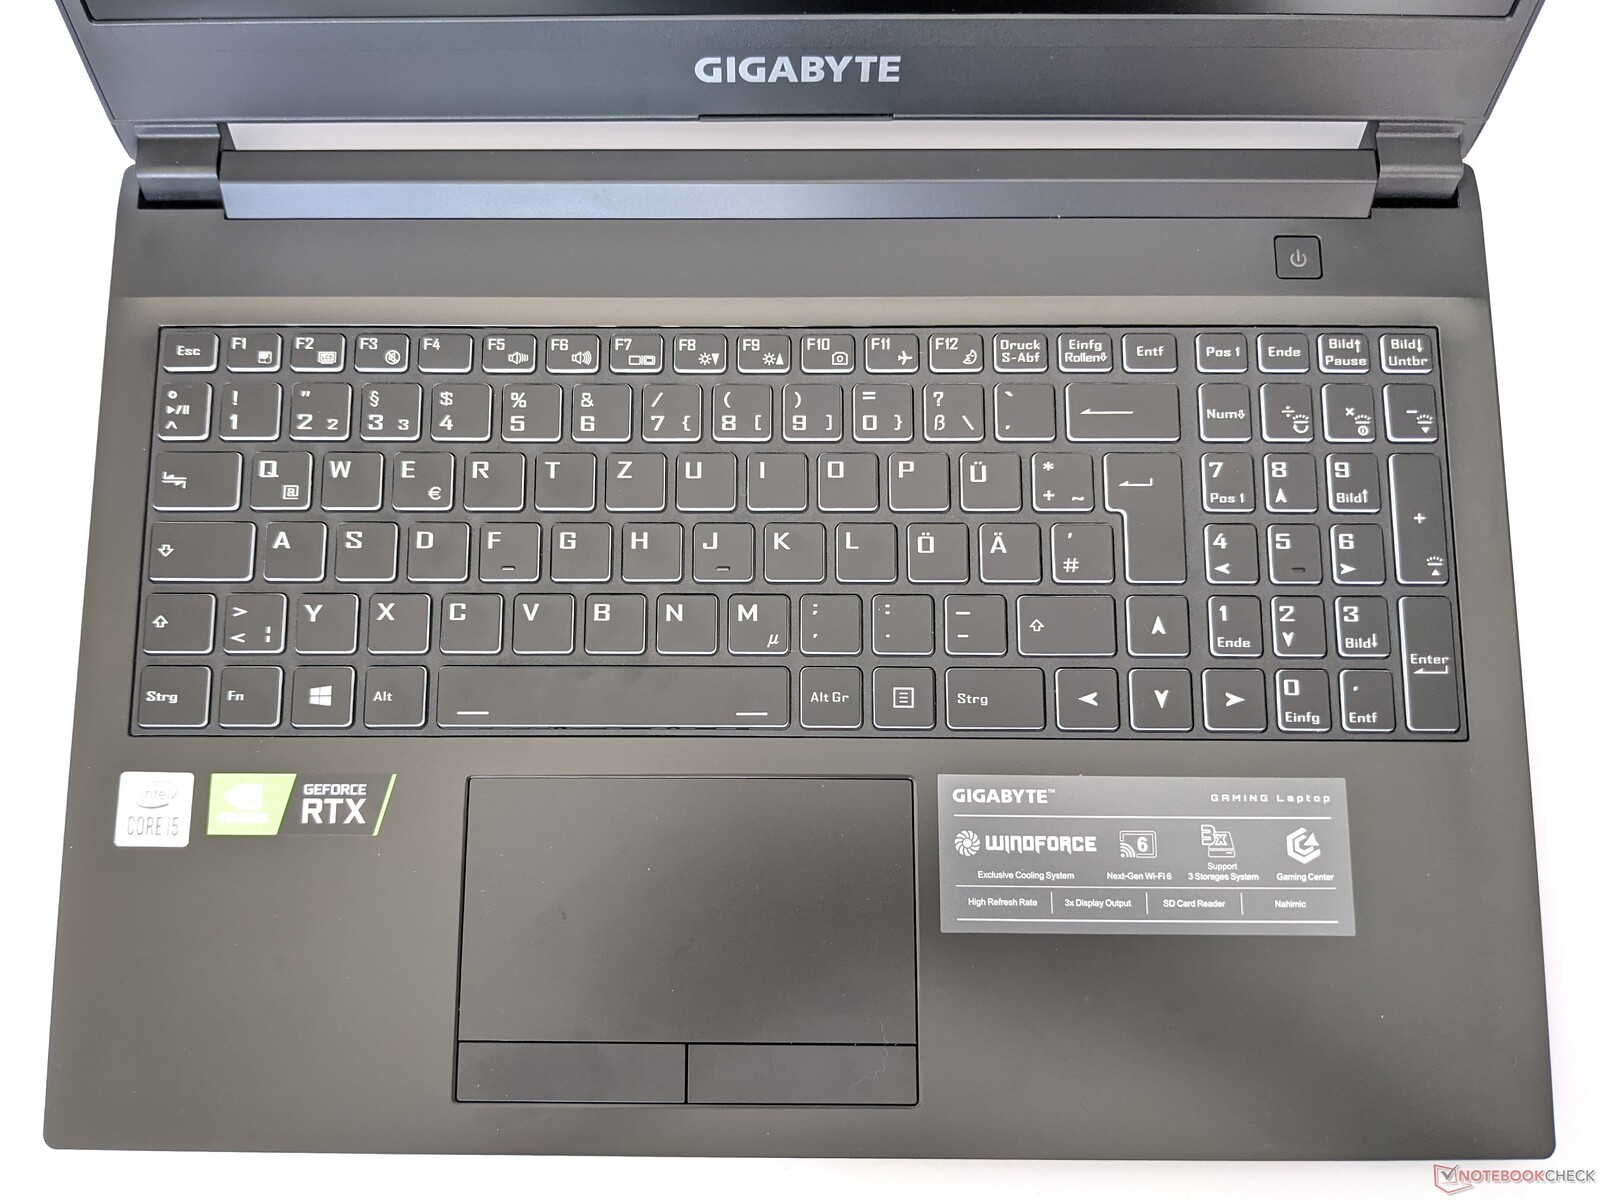
Input devices - Solid keyboard with backlighting
Keyboard
The Gigabyte G5's keyboard offers a clear feedback and is well suited for typing longer text. A full-sized numeric keypad is available, and the arrow keys were made in the standard size. Furthermore, most of the special keys are available as single keys, which prevents the keyboard from having an excessive amount of keys with a secondary function.
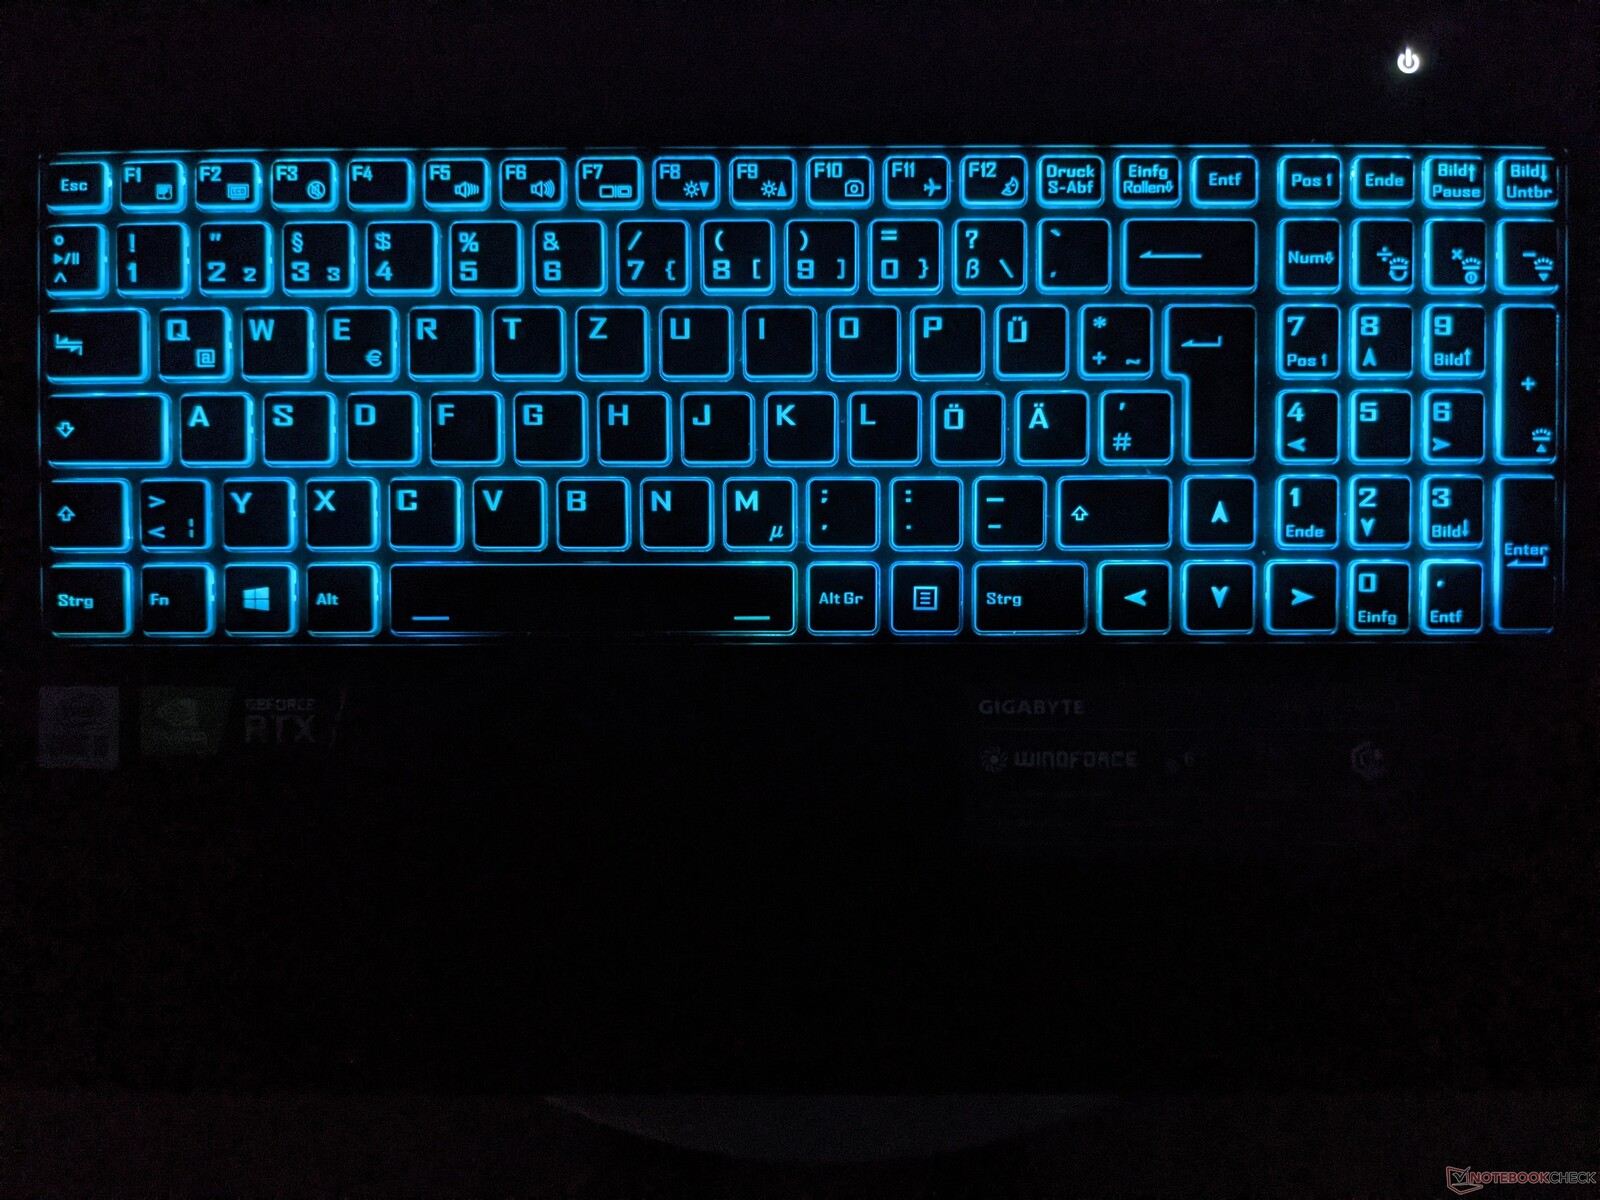
In addition, Gigabyte has integrated a keyboard backlight that ensures a uniform illumination of the labeling on the keys. However, users can't choose the colors themselves, since they can only select them from a predefined palette, which means that you can't set a white backlight, for example.
Touchpad
A classic touchpad with separated mouse buttons is available as mouse replacement in the G5 KC. It's well suited for navigating the mouse pointer. However, the pad responds a bit sluggishly when mouse clicks are triggered by touch. Nevertheless, the two mouse buttons are triggered reliably and audibly, although their feedback is a bit soft.
Display - 144 Hz panel with vivid colors

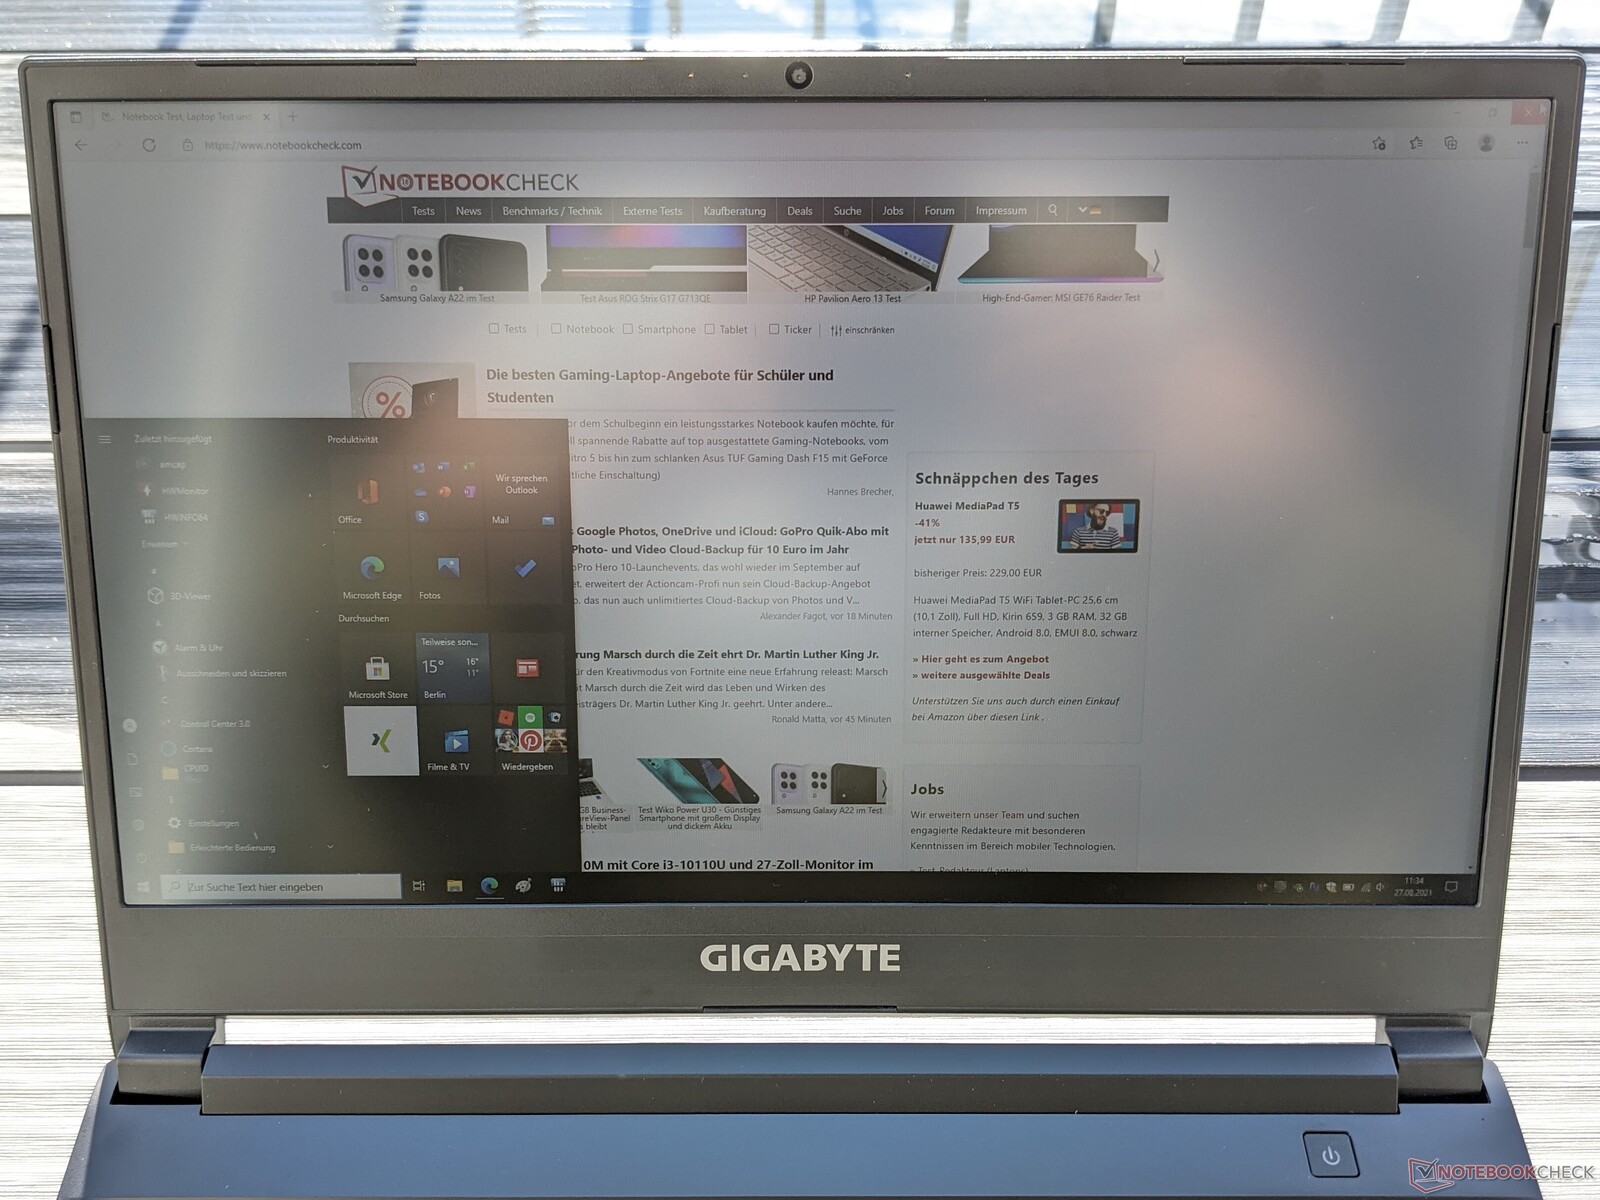
The screen of the Gigabyte G5 KC consists of a 15.6-inch IPS panel that offers a resolution of 1920x1080 pixels and a refresh rate of 165 Hz. The average maximum brightness of 275 cd/m² is the highest in our test field. The brightness distribution of 86% is average, though.
Furthermore, no PWM is used for brightness control, which means that users with sensitive eyes don't have to fear any difficulties during use. In addition to the display used here, a version of the gaming laptop with a 240 Hz panel is also available.
| |||||||||||||||||||||||||
Brightness Distribution: 86 %
Center on Battery: 295 cd/m²
Contrast: 1283:1 (Black: 0.23 cd/m²)
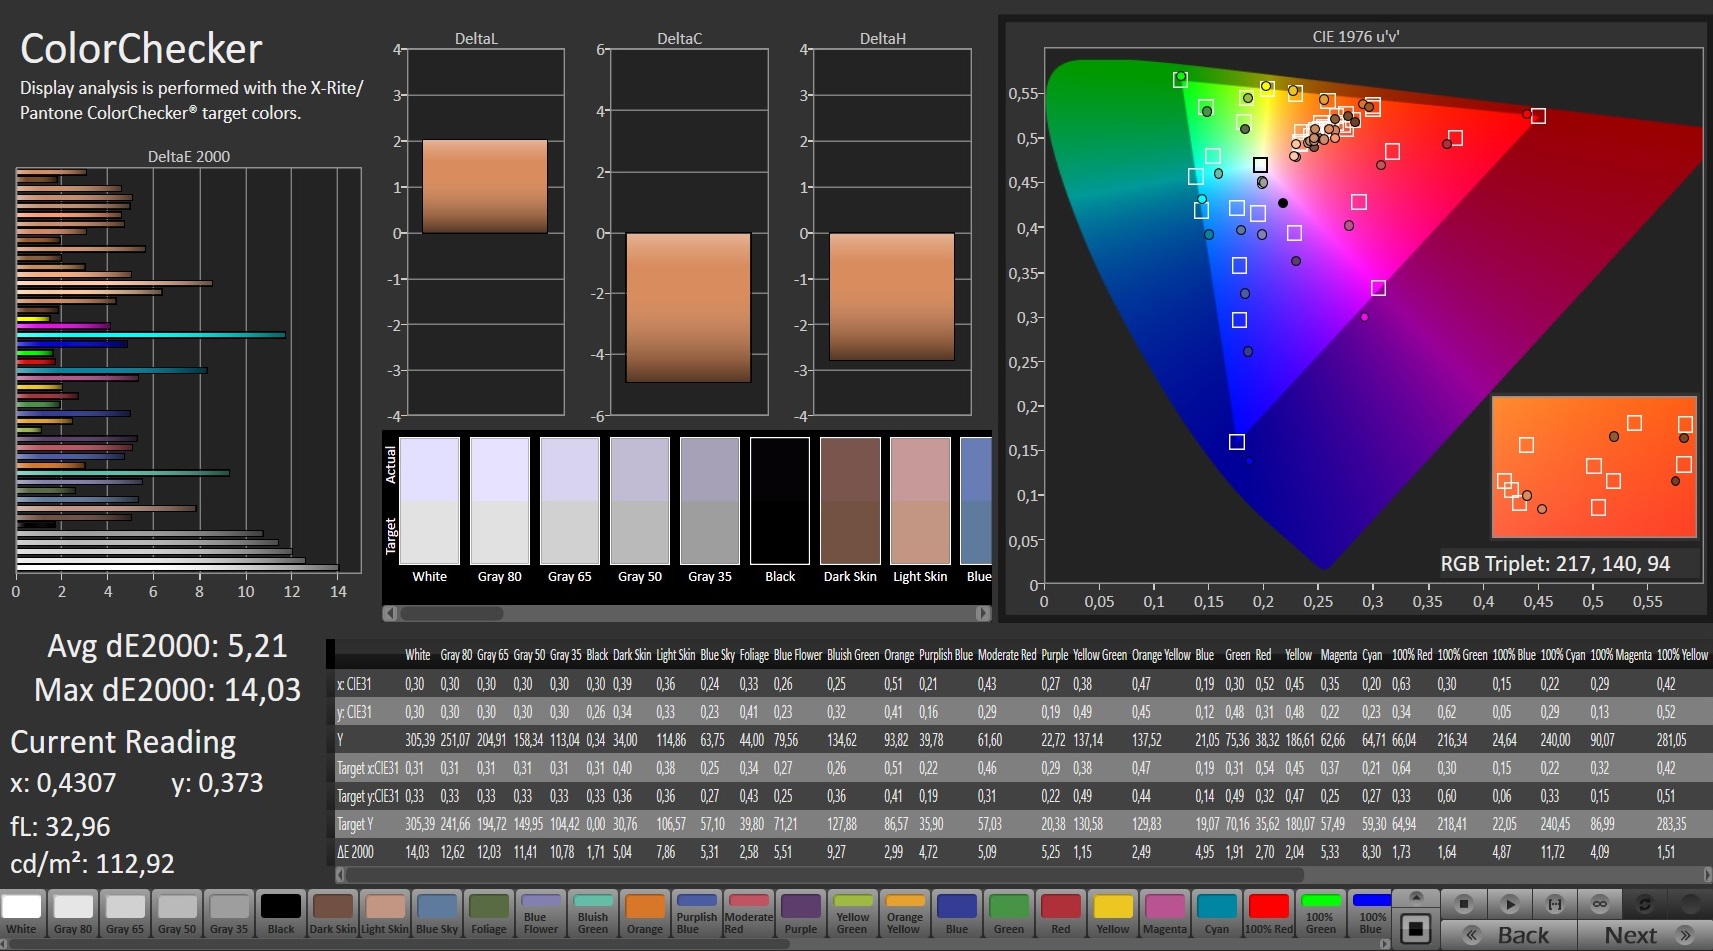
ΔE ColorChecker Calman: 5.21 | ∀{0.5-29.43 Ø4.73}
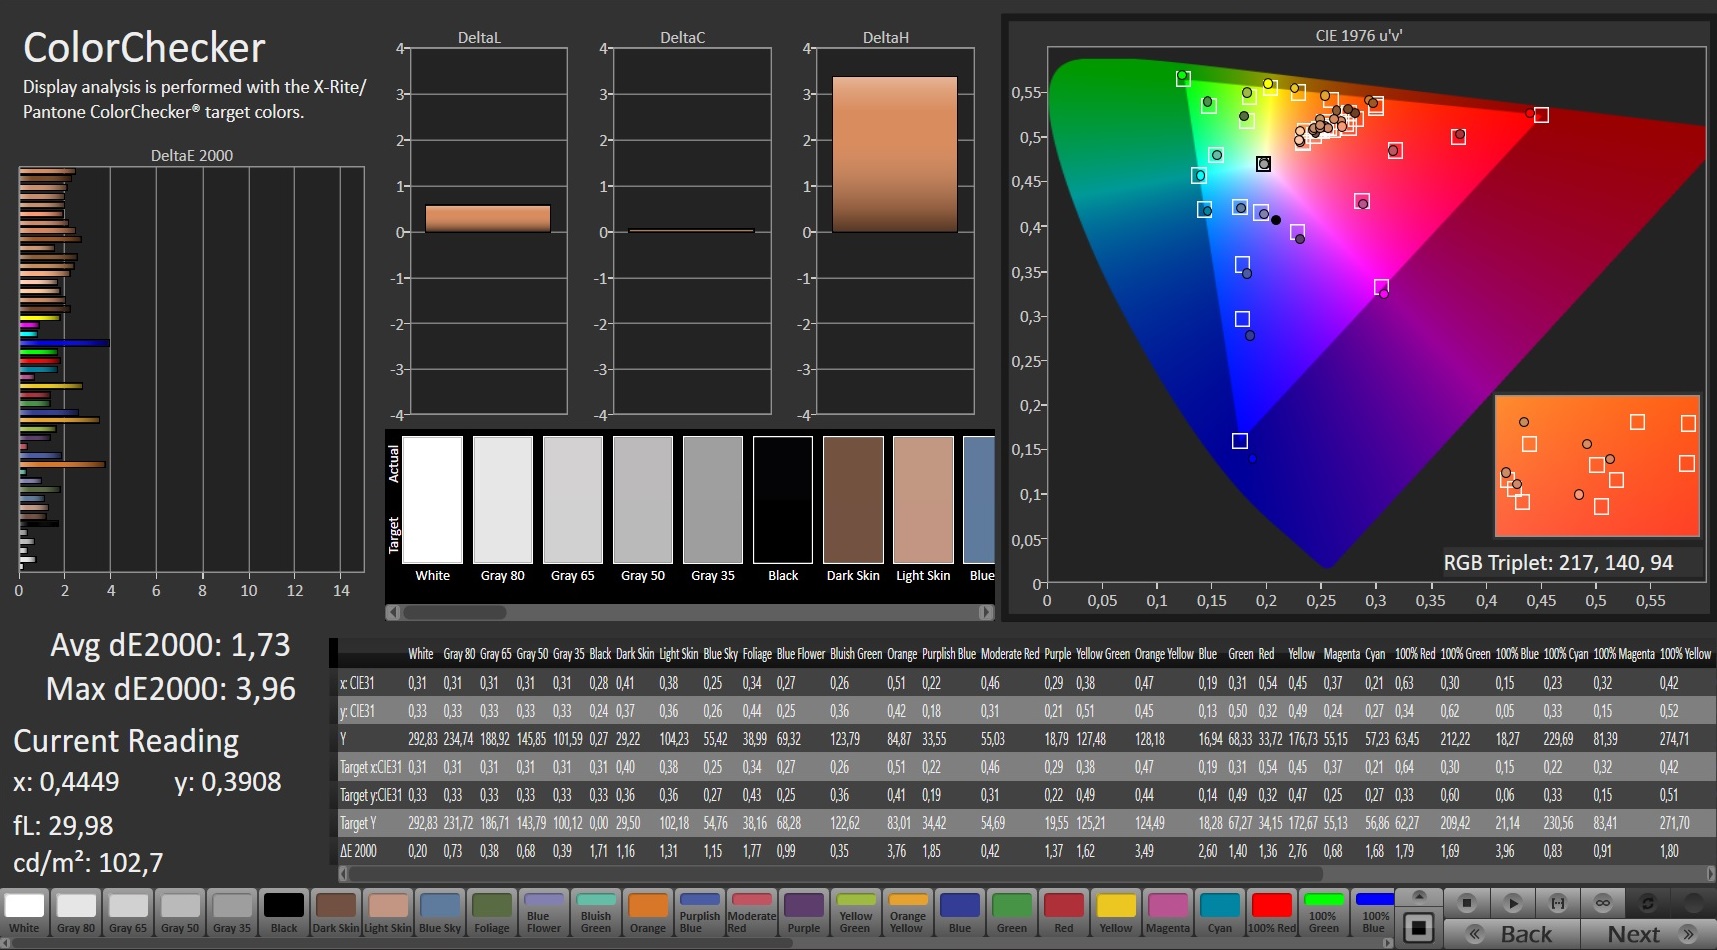
calibrated: 1.73
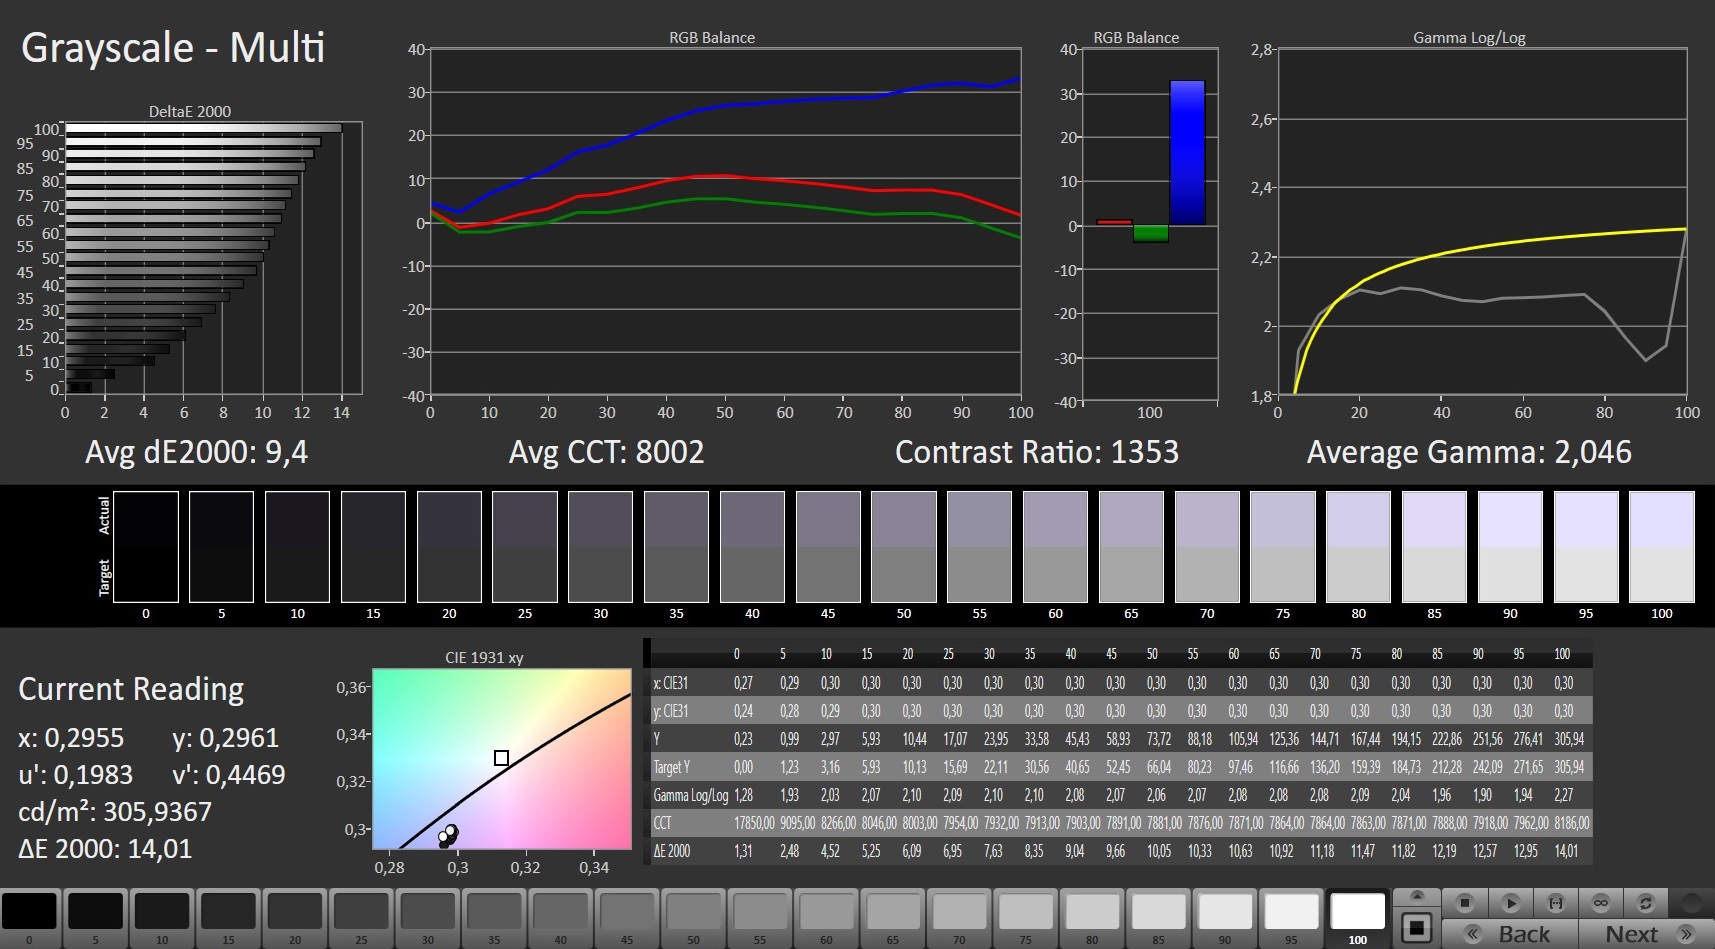
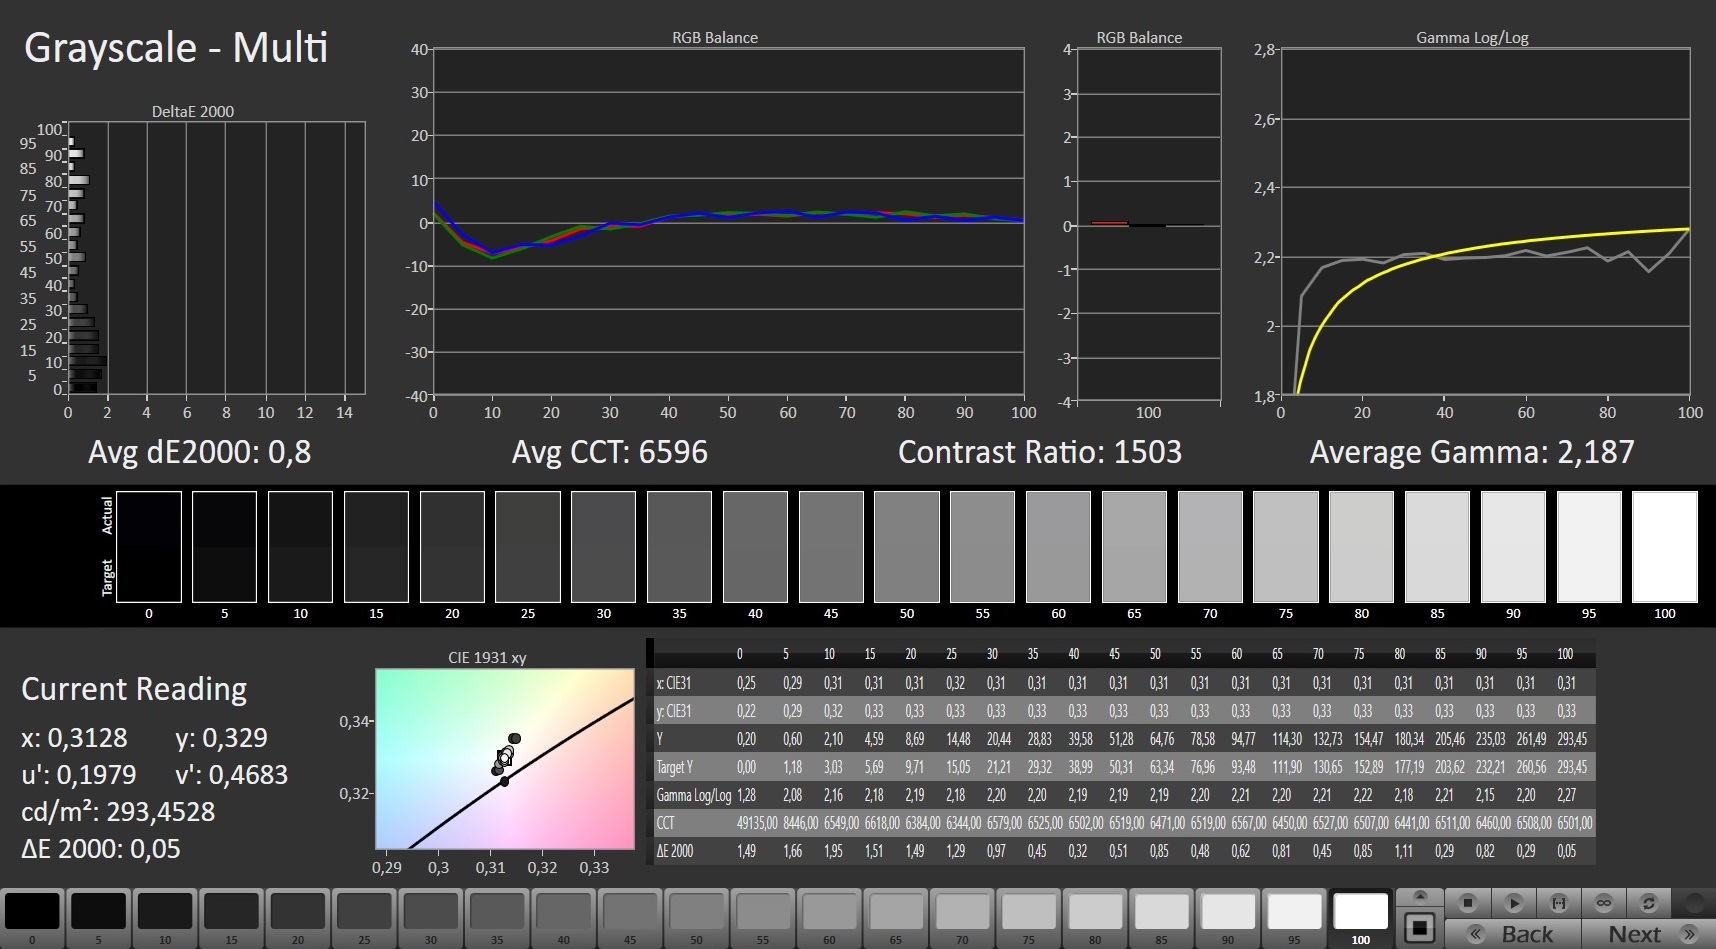
ΔE Greyscale Calman: 9.4 | ∀{0.09-98 Ø4.97}
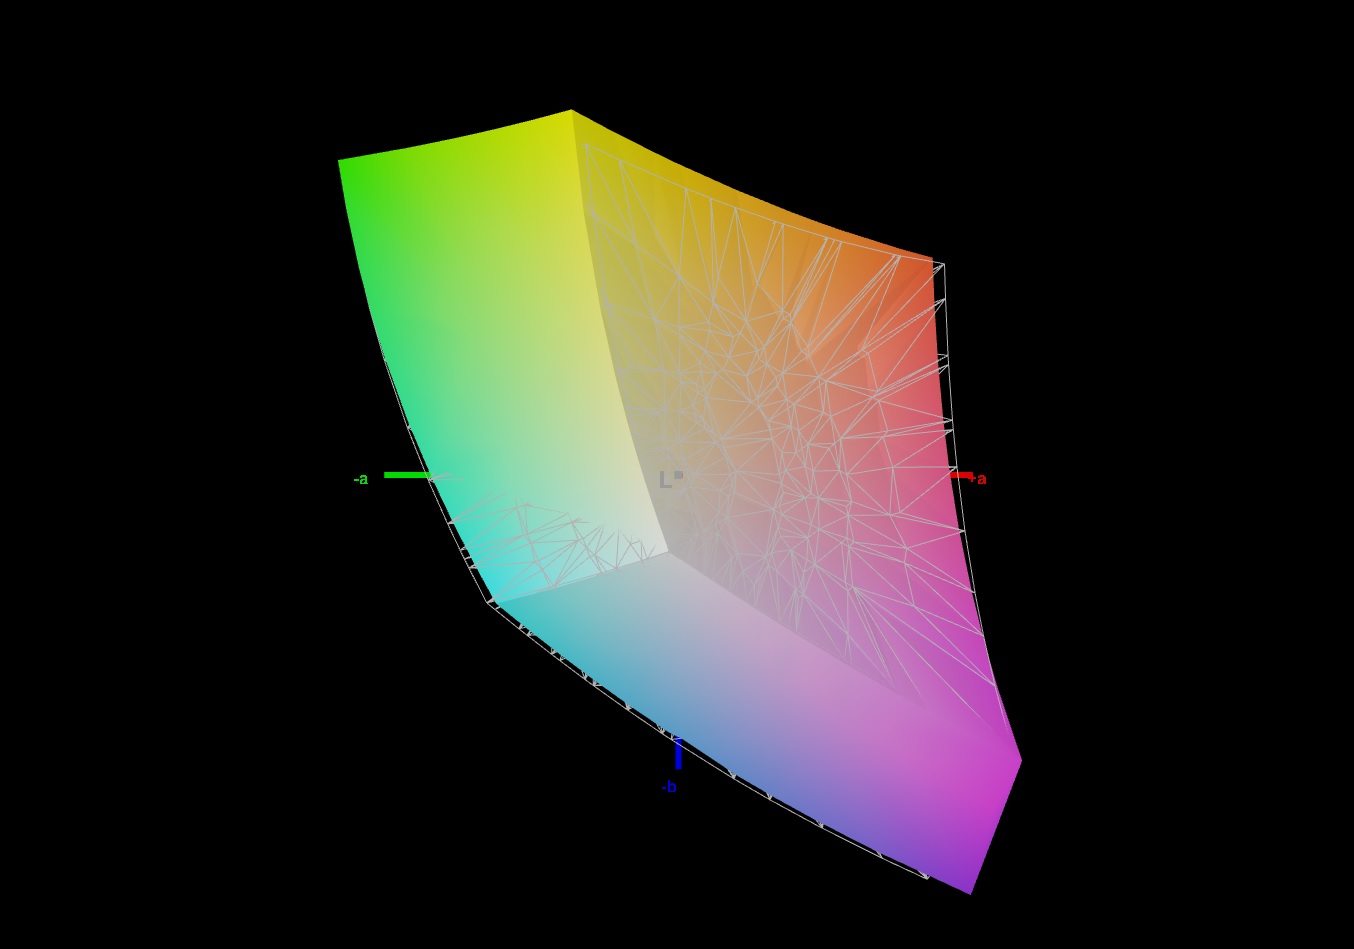
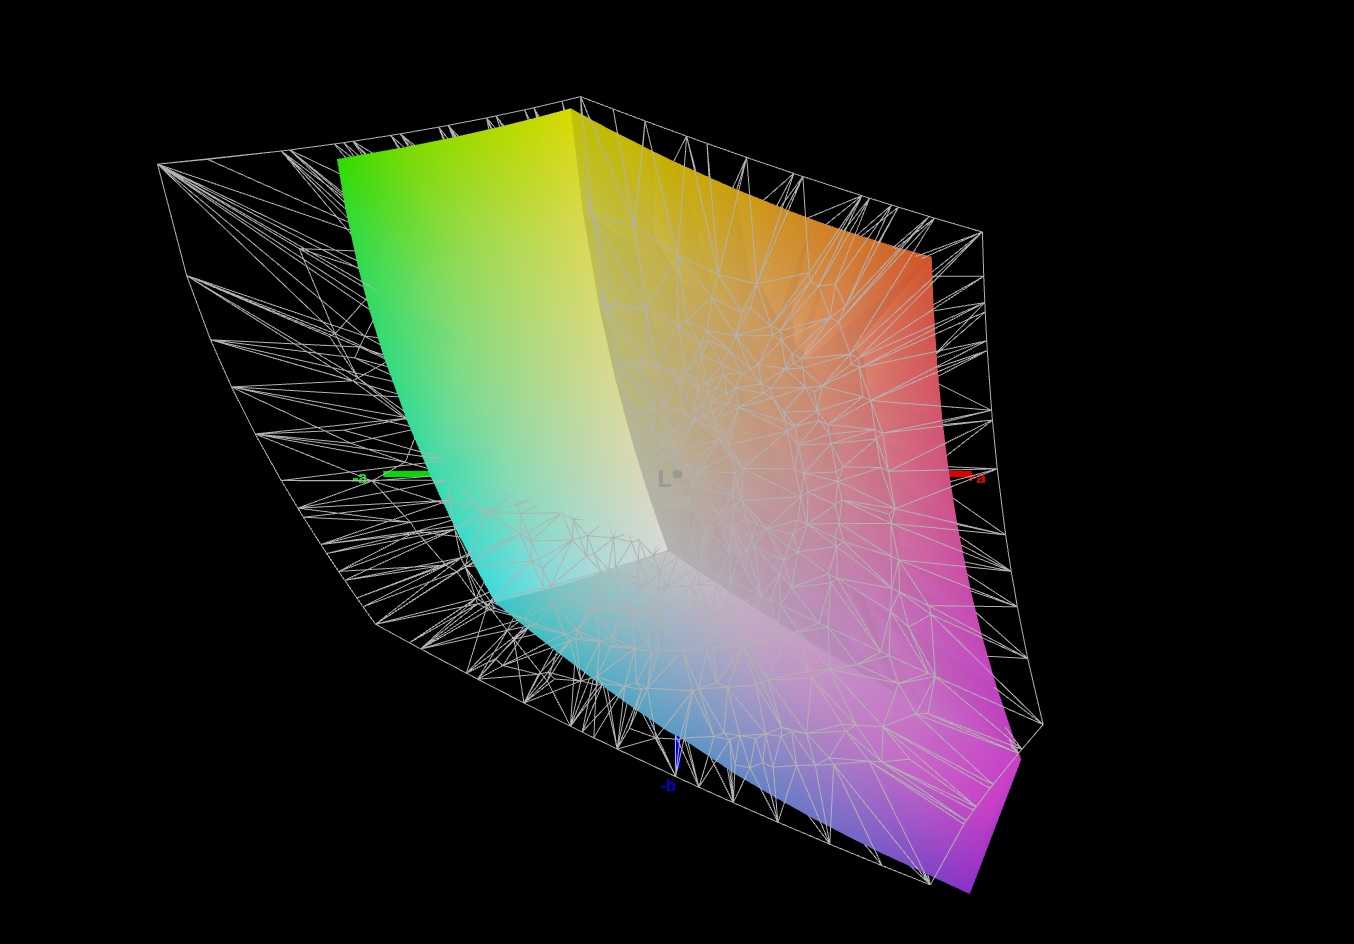
69.6% AdobeRGB 1998 (Argyll 3D)
96.7% sRGB (Argyll 3D)
68.2% Display P3 (Argyll 3D)
Gamma: 2.046
CCT: 8002 K
| Gigabyte G5 KC LM156LF-1F02, IPS, 1920x1080, 15.6" | Acer Nitro 5 AN517-53-54DQ BOE NV173FHM-NX4 (BOE09B4), IPS, 1920x1080, 17.3" | MSI GF65 Thin 10UE AU Optronics B156HAN08.4, IPS, 1920x1080, 15.6" | Dell G5 15 5500 09E2 AU Optronics B156HAN, IPS, 1920x1080, 15.6" | |
|---|---|---|---|---|
| Display | -45% | -44% | -45% | |
| Display P3 Coverage (%) | 68.2 | 36.7 -46% | 37.65 -45% | 36.73 -46% |
| sRGB Coverage (%) | 96.7 | 55 -43% | 56.3 -42% | 55.3 -43% |
| AdobeRGB 1998 Coverage (%) | 69.6 | 37.9 -46% | 38.9 -44% | 37.95 -45% |
| Response Times | -115% | -236% | ||
| Response Time Grey 50% / Grey 80% * (ms) | 10 ? | 24.8 ? -148% | 36.8 ? -268% | |
| Response Time Black / White * (ms) | 10.4 ? | 18.8 ? -81% | 31.6 ? -204% | |
| PWM Frequency (Hz) | ||||
| Screen | -15% | -12% | -18% | |
| Brightness middle (cd/m²) | 295 | 286 -3% | 266.5 -10% | 285.4 -3% |
| Brightness (cd/m²) | 275 | 261 -5% | 262 -5% | 260 -5% |
| Brightness Distribution (%) | 86 | 83 -3% | 91 6% | 86 0% |
| Black Level * (cd/m²) | 0.23 | 0.23 -0% | 0.18 22% | 0.19 17% |
| Contrast (:1) | 1283 | 1243 -3% | 1481 15% | 1502 17% |
| Colorchecker dE 2000 * | 5.21 | 4.92 6% | 5.33 -2% | 5.35 -3% |
| Colorchecker dE 2000 max. * | 14.03 | 19.29 -37% | 18.28 -30% | 18.48 -32% |
| Colorchecker dE 2000 calibrated * | 1.73 | 4.73 -173% | 4.36 -152% | 5.3 -206% |
| Greyscale dE 2000 * | 9.4 | 1.9 80% | 4.5 52% | 4.2 55% |
| Gamma | 2.046 108% | 2.175 101% | 2.35 94% | 2.2 100% |
| CCT | 8002 81% | 6782 96% | 6289 103% | 7627 85% |
| Color Space (Percent of AdobeRGB 1998) (%) | 35.6 | 37.95 | ||
| Color Space (Percent of sRGB) (%) | 55.8 | 55.26 | ||
| Total Average (Program / Settings) | -58% /
-36% | -97% /
-51% | -32% /
-25% |
* ... smaller is better
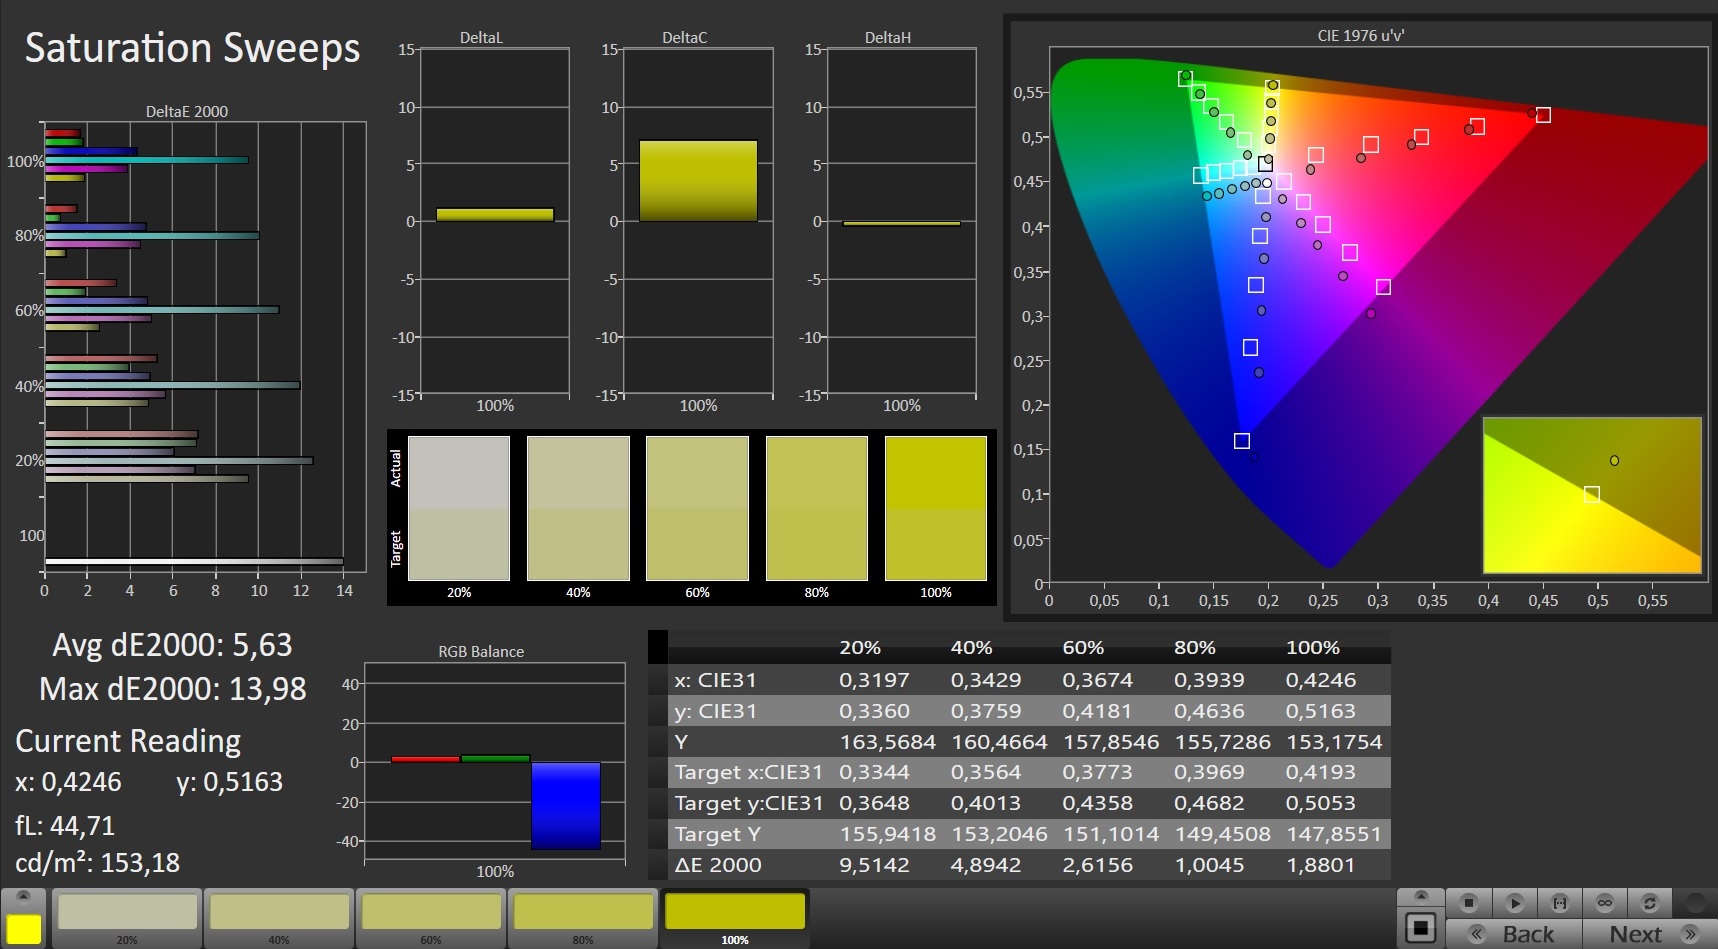
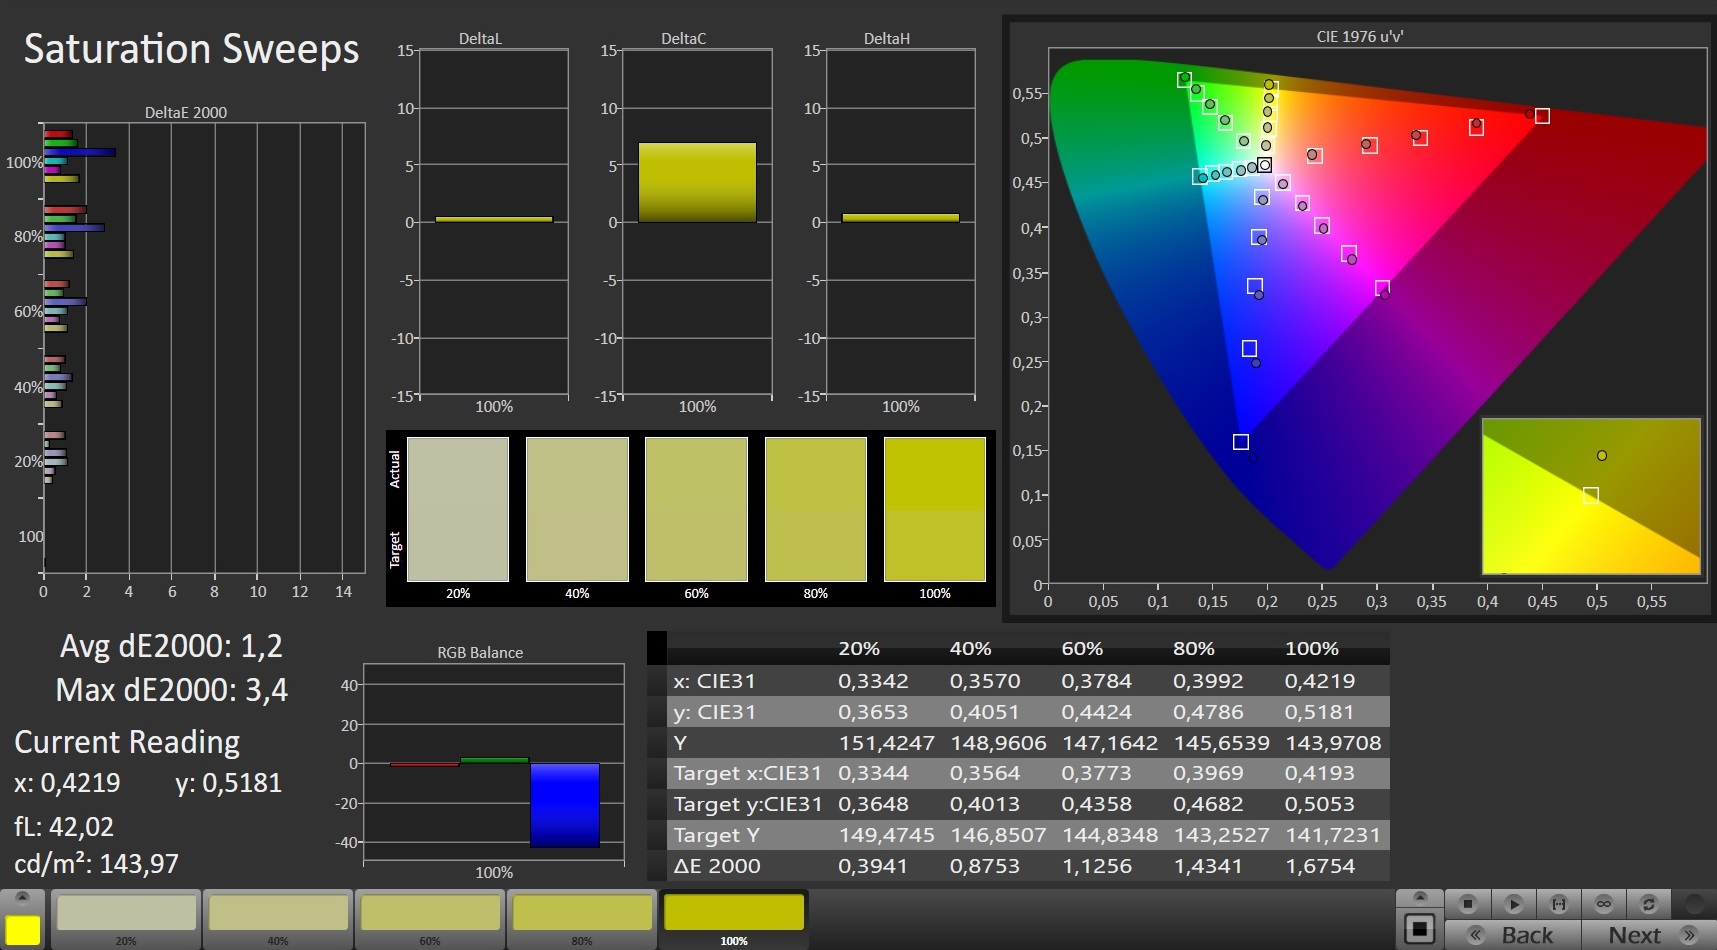
According to our measurements, the panel in the Gigabyte G5 offers a good contrast ratio of 1,283:1 and an equally good black level of 0.23 cd/m². As a result, colors are well separated from each other, and black image content only shows a minimal gray veil. The color-space coverage of 96.7% (sRGB) and 69.6% (AdobeRGB), respectively, is the highest in our test field.
The CalMAN analysis also shows that colors are displayed out of the box with an excessive proportion of blue. However, this can be corrected almost completely with a calibration. The corresponding ICC file can be downloaded in the window located at the top, to the right of the display's brightness distribution graph.
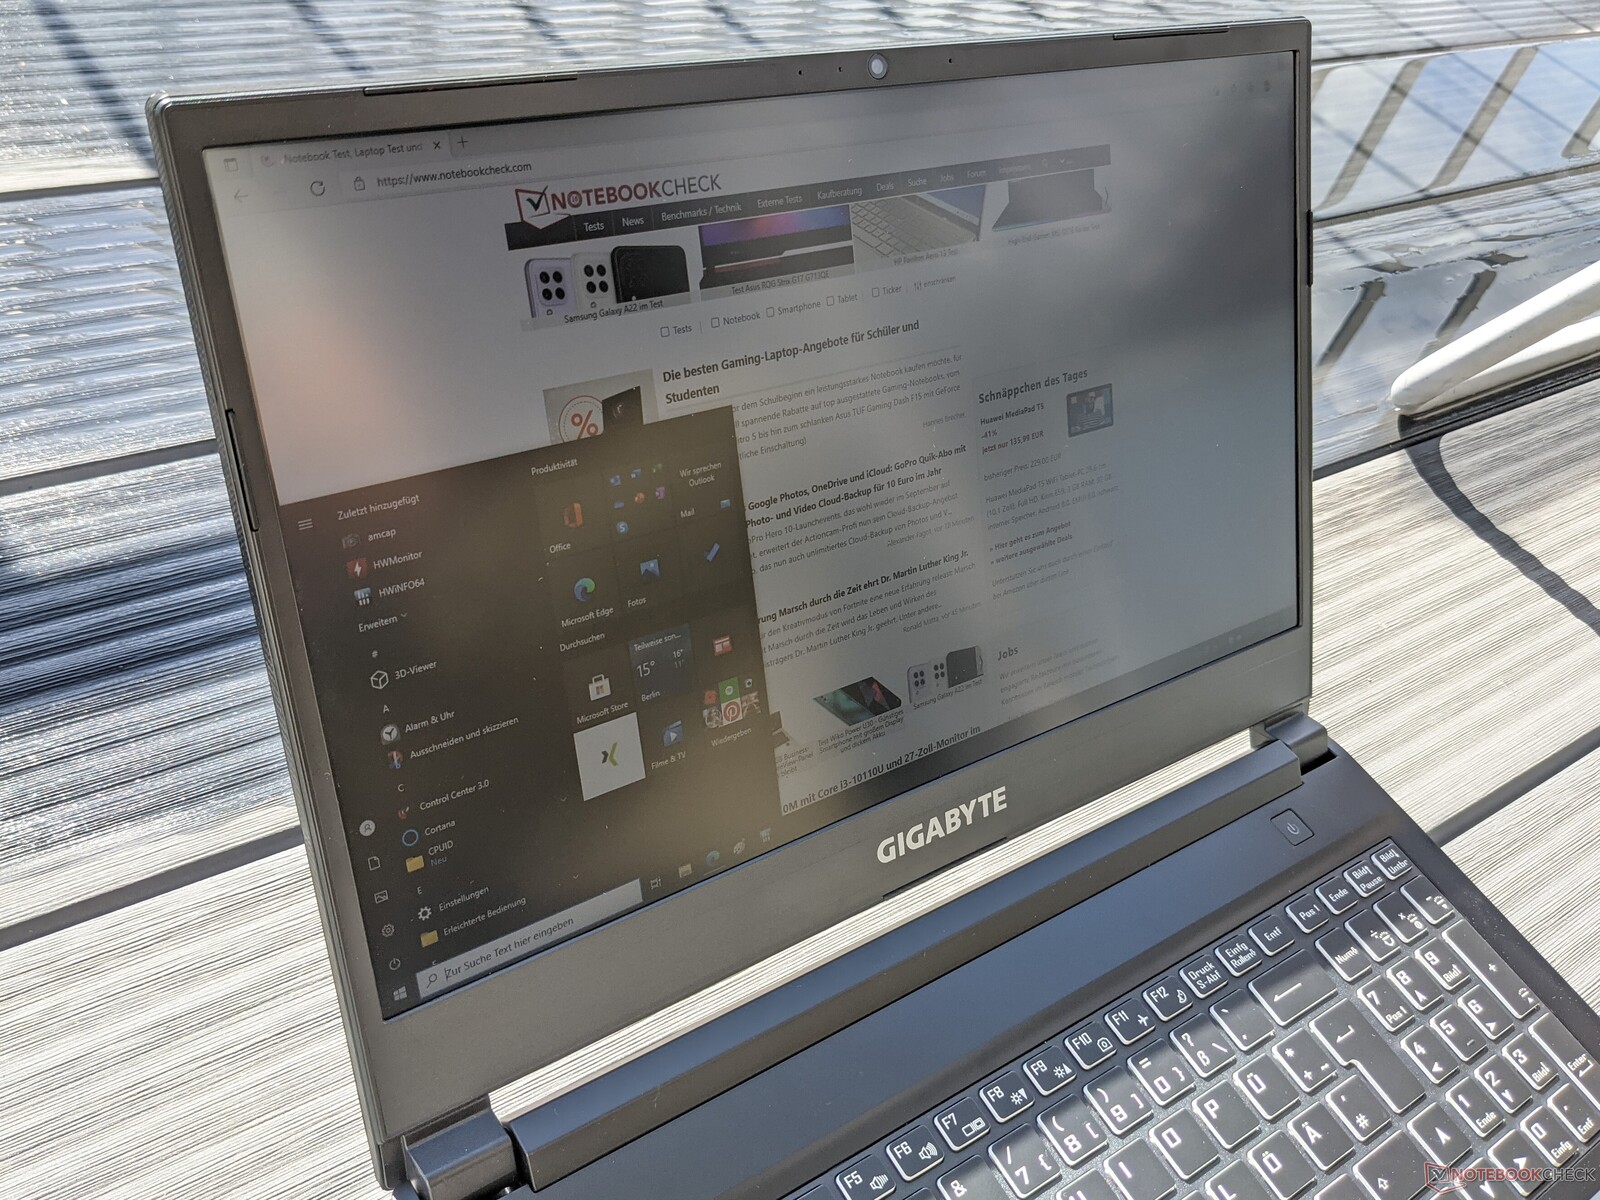
Gigabyte's gaming laptop can only be used outdoors as long as places in the shade are preferred. The display's brightness isn't high enough to present image content legibly in direct sunlight.
Display Response Times
| ↔ Response Time Black to White | ||
|---|---|---|
| 10.4 ms ... rise ↗ and fall ↘ combined | ↗ 5.2 ms rise | 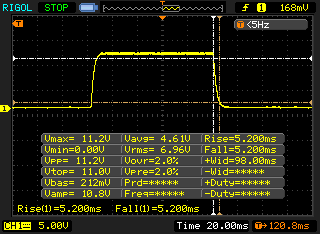 |
| ↘ 5.2 ms fall | ||
| The screen shows good response rates in our tests, but may be too slow for competitive gamers. In comparison, all tested devices range from 0.1 (minimum) to 240 (maximum) ms. » 28 % of all devices are better. This means that the measured response time is better than the average of all tested devices (19.9 ms). | ||
| ↔ Response Time 50% Grey to 80% Grey | ||
| 10 ms ... rise ↗ and fall ↘ combined | ↗ 5.2 ms rise | 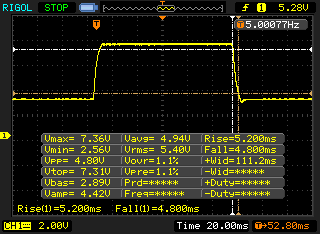 |
| ↘ 4.8 ms fall | ||
| The screen shows good response rates in our tests, but may be too slow for competitive gamers. In comparison, all tested devices range from 0.165 (minimum) to 636 (maximum) ms. » 23 % of all devices are better. This means that the measured response time is better than the average of all tested devices (31.1 ms). | ||
Screen Flickering / PWM (Pulse-Width Modulation)
| Screen flickering / PWM not detected | 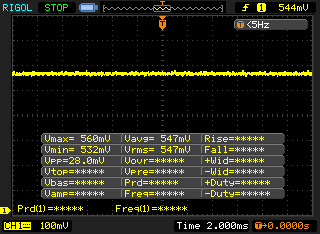 | ||
In comparison: 52 % of all tested devices do not use PWM to dim the display. If PWM was detected, an average of 7794 (minimum: 5 - maximum: 343500) Hz was measured. | |||
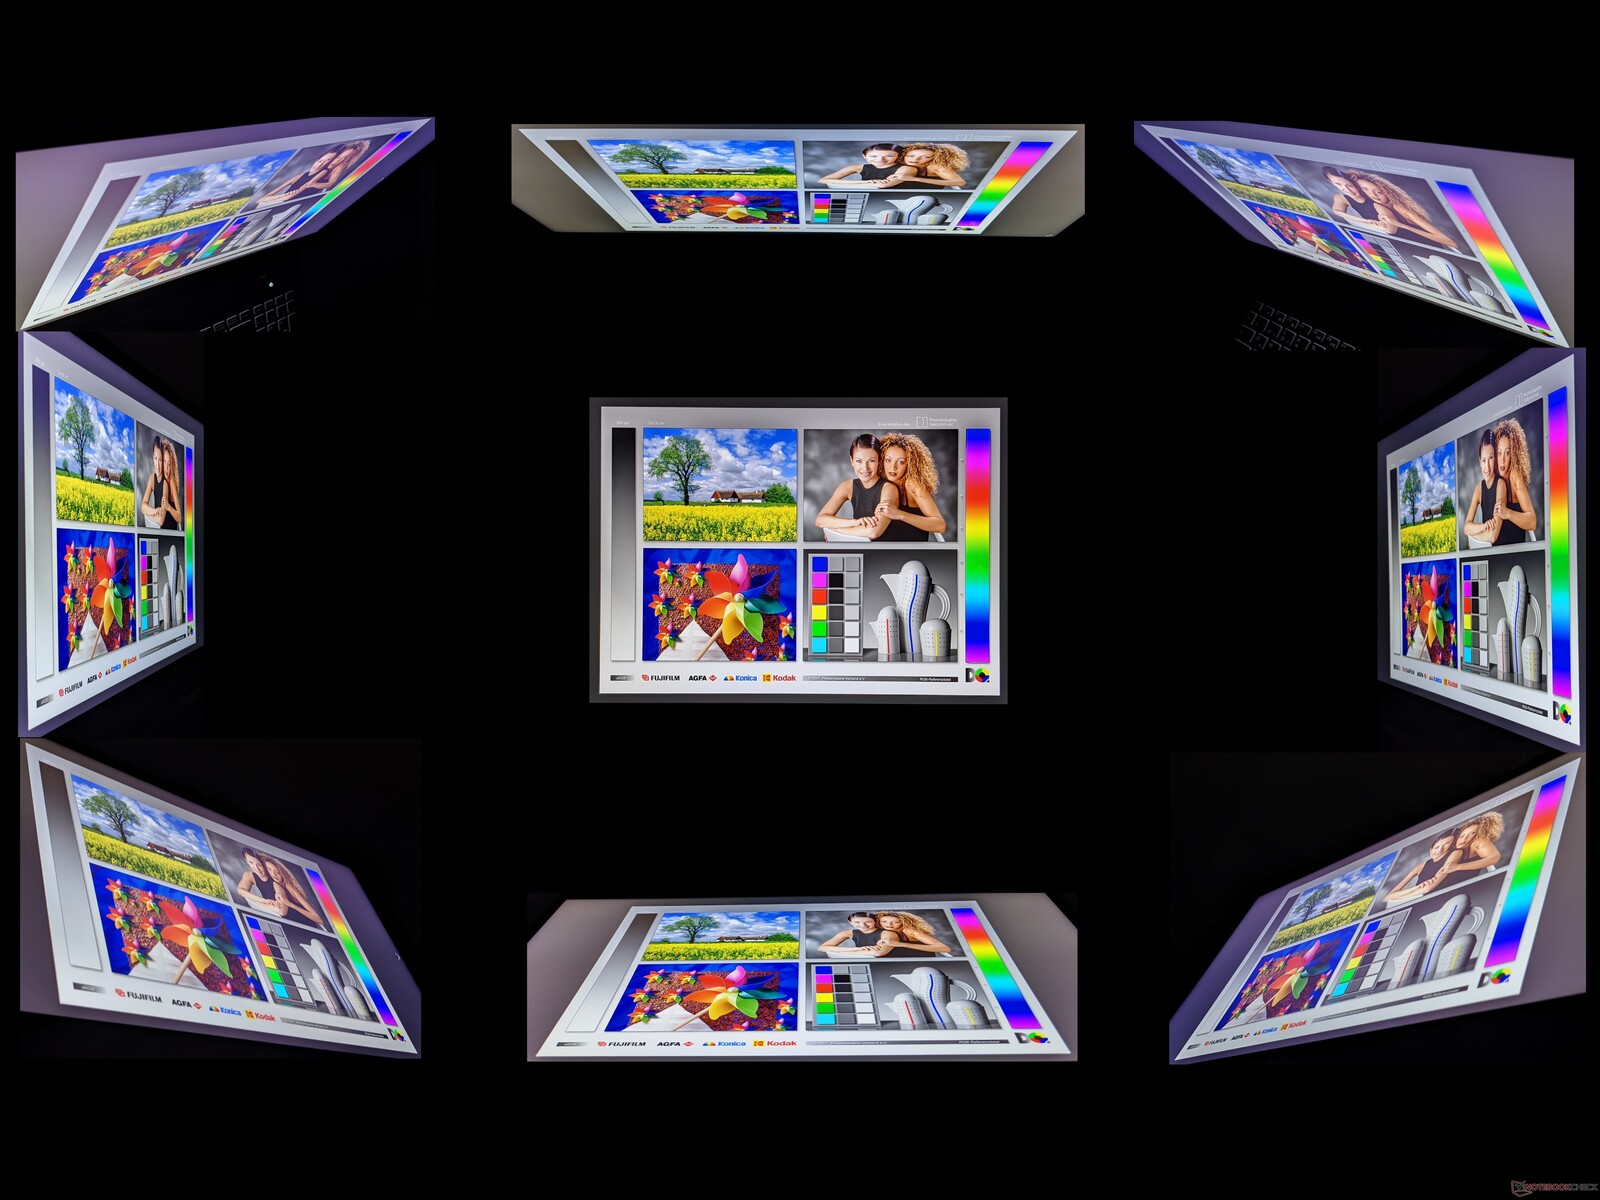
The IPS panel of the G5 KC is very viewing-angle stable, allowing image content to be viewed without distorted colors even from flat angles.
Performance - High-level performance in the Gigabyte G5
Gigabyte markets the G5 KC as a budget entry-level gaming laptop. However, they still make sure that the hardware can run all the latest games smoothly. Apart from our test configuration, the laptop is also available with a stronger processor. The Nvidia GeForce RTX 3060 installed here is always used as the graphics card.
Processor
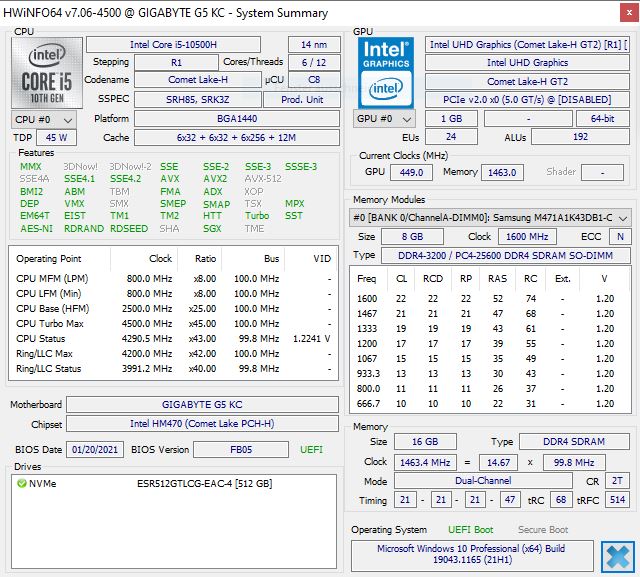
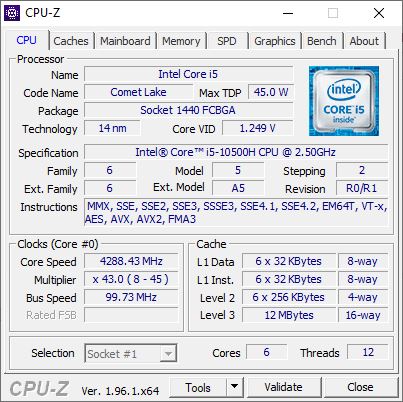
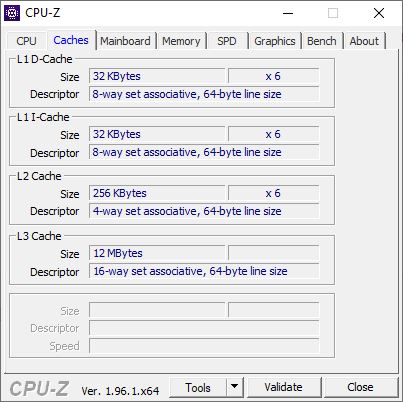
An Intel Core i5-10500H ensures smooth system operation in our test configuration of the Gigabyte G5 KC. The processor has six cores and can therefore process up to 12 tasks simultaneously. The clock rates are between 2.5 and 4.5 GHz. Besides the cooling system, the TDP that has been configured also determines how long the clock speeds can be maintained at a high level. In this case, the TDP settings are generous with a long-term PL1 of 55 watts and a short-term PL2 of 135 watts.
Our Cinebench R15 continuous loop shows that the Core i5-10500H reaches a higher value right at the beginning compared to the Core i7-10750H in the MSI GF65 Thin 10UE, for example. Following a gradual descent, the sustained performance of the i5-10500H is slightly above that of the Intel Core i7-10750H and can consequently lead our test field.
The individual tests show that the single-core performance of the Intel Core i5-10500H is slightly above that of the Intel Core i5-10300H in the Dell G5 15 5500. The multi-core performance is considerably better and can once again compete with or exceed that of the Intel Core i7-10750H. Our CPU Benchmarks article shows how the performance provided here compares with other processors.
Cinebench R15 Multi endurance test
* ... smaller is better
System performance
The Gigabyte G5 KC achieves a very good overall score in the PCMark 10 test, with which it can lead our test field. While the individual scores for Digital Content Creation and Productivity are comparatively high, the Essentials score is only enough for the penultimate place in the test field.
During the test period, the gaming laptop always showed a smooth system operation, and we didn't experience any micro stutters or the like. Programs were launched quickly, and accessing files was done without any lags.
| PCMark 10 / Score | |
| Average of class Gaming (5828 - 11574, n=95, last 2 years) | |
| Gigabyte G5 KC | |
| Average Intel Core i5-10500H, NVIDIA GeForce RTX 3060 Laptop GPU (n=1) | |
| Acer Nitro 5 AN517-53-54DQ | |
| MSI GF65 Thin 10UE | |
| Dell G5 15 5500 09E2 | |
| PCMark 10 / Essentials | |
| Average of class Gaming (8810 - 12600, n=99, last 2 years) | |
| Acer Nitro 5 AN517-53-54DQ | |
| MSI GF65 Thin 10UE | |
| Gigabyte G5 KC | |
| Average Intel Core i5-10500H, NVIDIA GeForce RTX 3060 Laptop GPU (n=1) | |
| Dell G5 15 5500 09E2 | |
| PCMark 10 / Productivity | |
| Average of class Gaming (6845 - 18766, n=97, last 2 years) | |
| Acer Nitro 5 AN517-53-54DQ | |
| Gigabyte G5 KC | |
| Average Intel Core i5-10500H, NVIDIA GeForce RTX 3060 Laptop GPU (n=1) | |
| MSI GF65 Thin 10UE | |
| Dell G5 15 5500 09E2 | |
| PCMark 10 / Digital Content Creation | |
| Average of class Gaming (7602 - 19657, n=97, last 2 years) | |
| Gigabyte G5 KC | |
| Average Intel Core i5-10500H, NVIDIA GeForce RTX 3060 Laptop GPU (n=1) | |
| Acer Nitro 5 AN517-53-54DQ | |
| MSI GF65 Thin 10UE | |
| Dell G5 15 5500 09E2 | |
| PCMark 10 Score | 5968 points | |
Help | ||
DPC latencies
With the hardware used here, the Gigabyte G5 KC shows very low interruption times in the test with LatencyMon. This makes it very well suited for real-time applications.
| DPC Latencies / LatencyMon - interrupt to process latency (max), Web, Youtube, Prime95 | |
| Dell G5 15 5500 09E2 | |
| Acer Nitro 5 AN517-53-54DQ | |
| MSI GF65 Thin 10UE | |
| Gigabyte G5 KC | |
* ... smaller is better
Storage
Gigabyte installs a 512 GB SSD in the G5 KC that achieves average rates in the storage benchmarks. This places the gaming laptop in the middle of our test field.
A comparison with other storage devices can be found in our HDD/SSD Benchmarks article.
| Gigabyte G5 KC ESR512GTLCG-EAC-4 | Acer Nitro 5 AN517-53-54DQ SK Hynix BC711 HFM512GD3HX015N | MSI GF65 Thin 10UE Samsung SSD PM981 MZVLB1T0HALR | Dell G5 15 5500 09E2 Toshiba KBG40ZNS512G NVMe | Average ESR512GTLCG-EAC-4 | |
|---|---|---|---|---|---|
| CrystalDiskMark 5.2 / 6 | 32% | 2% | -34% | 2% | |
| Write 4K (MB/s) | 133.7 | 206.1 54% | 157.3 18% | 89.3 -33% | 131.6 ? -2% |
| Read 4K (MB/s) | 46.88 | 77.8 66% | 46.69 0% | 41.42 -12% | 45.4 ? -3% |
| Write Seq (MB/s) | 2509 | 2842 13% | 2389 -5% | 1182 -53% | 2303 ? -8% |
| Read Seq (MB/s) | 2209 | 2552 16% | 2196 -1% | 1532 -31% | 1716 ? -22% |
| Write 4K Q32T1 (MB/s) | 373.7 | 583 56% | 407.6 9% | 283.2 -24% | 525 ? 40% |
| Read 4K Q32T1 (MB/s) | 528 | 663 26% | 519 -2% | 353.2 -33% | 581 ? 10% |
| Write Seq Q32T1 (MB/s) | 2511 | 3014 20% | 2401 -4% | 1220 -51% | 2515 ? 0% |
| Read Seq Q32T1 (MB/s) | 3440 | 3556 3% | 3344 -3% | 2329 -32% | 3417 ? -1% |
| AS SSD | 8% | -21% | -231% | -10% | |
| Seq Read (MB/s) | 2972 | 2859 -4% | 3002 1% | 1776 -40% | 2643 ? -11% |
| Seq Write (MB/s) | 2276 | 2693 18% | 2420 6% | 721 -68% | 2134 ? -6% |
| 4K Read (MB/s) | 55.7 | 68.8 24% | 48.46 -13% | 38.58 -31% | 48.3 ? -13% |
| 4K Write (MB/s) | 131.2 | 154.5 18% | 114.3 -13% | 70.9 -46% | 116.4 ? -11% |
| 4K-64 Read (MB/s) | 1775 | 1860 5% | 1873 6% | 945 -47% | 1586 ? -11% |
| 4K-64 Write (MB/s) | 2051 | 1680 -18% | 1882 -8% | 191.8 -91% | 1975 ? -4% |
| Access Time Read * (ms) | 0.091 | 0.043 53% | 0.045 51% | 0.111 -22% | 0.09975 ? -10% |
| Access Time Write * (ms) | 0.028 | 0.028 -0% | 0.101 -261% | 0.588 -2000% | 0.03325 ? -19% |
| Score Read (Points) | 2128 | 2214 4% | 2221 4% | 1161 -45% | 1899 ? -11% |
| Score Write (Points) | 2410 | 2104 -13% | 2238 -7% | 335 -86% | 2305 ? -4% |
| Score Total (Points) | 5595 | 5451 -3% | 5565 -1% | 2043 -63% | 5151 ? -8% |
| Total Average (Program / Settings) | 20% /
18% | -10% /
-12% | -133% /
-148% | -4% /
-5% |
* ... smaller is better

Continuous load read: DiskSpd Read Loop, Queue Depth 8
Graphics card
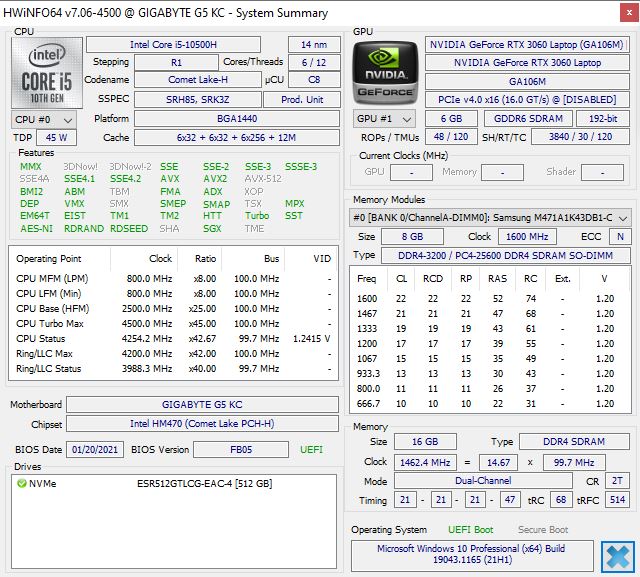
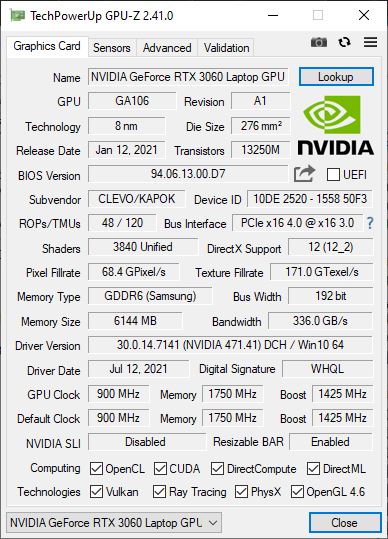
An Nvidia GeForce RTX 3060 is responsible for rendering graphically demanding applications in the Gigabyte G5 KC. It can be configured by manufacturers with varying TGP settings, and Gigabyte has set it to 90 watts. However, Dynamic Boost can increase power consumption up to 105 watts.
The RTX 3060 achieves very good results in the 3DMark benchmarks that we performed, and it can place itself at the top of our test field. As a result, the G5 KC is also suitable for demanding 3D applications. In our GPU Benchmarks article, the RTX 3060 can be compared with other graphics cards.
| 3DMark 06 Standard Score | 37418 points | |
| 3DMark 11 Performance | 21277 points | |
| 3DMark Cloud Gate Standard Score | 38579 points | |
| 3DMark Fire Strike Score | 17918 points | |
| 3DMark Time Spy Score | 7783 points | |
Help | ||
Gaming performance
The Gigabyte G5 KC can run modern games smoothly and at high detail levels. Even in demanding games, the frame rates are always above 60 fps as long as the game is played in Full HD resolution. Only in the very challenging Cyberpunk 2077 did we have to reduce the detail levels from "Ultra" to "High" in order to reach over 60 fps.
The performance that can be expected in other games can be found in our GPU Games article.
| F1 2021 - 1920x1080 Ultra High Preset + Raytracing AA:T AF:16x | |
| Average NVIDIA GeForce RTX 3060 Laptop GPU (67 - 112.8, n=9) | |
| Gigabyte G5 KC | |
| Acer Nitro 5 AN517-53-54DQ | |
| Cyberpunk 2077 1.0 - 1920x1080 Ultra Preset | |
| Gigabyte G5 KC | |
| Average NVIDIA GeForce RTX 3060 Laptop GPU (48.9 - 58, n=6) | |
| Acer Nitro 5 AN517-53-54DQ | |
| Dell G5 15 5500 09E2 | |
| Strange Brigade - 1920x1080 ultra AA:ultra AF:16 | |
| Average of class Gaming (76.3 - 456, n=93, last 2 years) | |
| Gigabyte G5 KC | |
| Average NVIDIA GeForce RTX 3060 Laptop GPU (102.2 - 166.3, n=43) | |
| MSI GF65 Thin 10UE | |
| Acer Nitro 5 AN517-53-54DQ | |
| Far Cry 5 - 1920x1080 Ultra Preset AA:T | |
| Average of class Gaming (70 - 151, n=10, last 2 years) | |
| Gigabyte G5 KC | |
| Average NVIDIA GeForce RTX 3060 Laptop GPU (80 - 120, n=31) | |
| MSI GF65 Thin 10UE | |
| Acer Nitro 5 AN517-53-54DQ | |
| X-Plane 11.11 - 1920x1080 high (fps_test=3) | |
| Average of class Gaming (52.1 - 143.5, n=115, last 2 years) | |
| Average NVIDIA GeForce RTX 3060 Laptop GPU (61.9 - 109.3, n=48) | |
| Gigabyte G5 KC | |
| MSI GF65 Thin 10UE | |
| Acer Nitro 5 AN517-53-54DQ | |
| Final Fantasy XV Benchmark - 1920x1080 High Quality | |
| Average of class Gaming (41 - 215, n=103, last 2 years) | |
| Average NVIDIA GeForce RTX 3060 Laptop GPU (55 - 100.9, n=42) | |
| Gigabyte G5 KC | |
| MSI GF65 Thin 10UE | |
| Acer Nitro 5 AN517-53-54DQ | |
| Dota 2 Reborn - 1920x1080 ultra (3/3) best looking | |
| Average of class Gaming (84.8 - 248, n=112, last 2 years) | |
| Average NVIDIA GeForce RTX 3060 Laptop GPU (90.7 - 154.8, n=49) | |
| Gigabyte G5 KC | |
| MSI GF65 Thin 10UE | |
| Acer Nitro 5 AN517-53-54DQ | |
| The Witcher 3 - 1920x1080 Ultra Graphics & Postprocessing (HBAO+) | |
| Average of class Gaming (95 - 240, n=8, last 2 years) | |
| Gigabyte G5 KC | |
| Average NVIDIA GeForce RTX 3060 Laptop GPU (58.2 - 91.5, n=48) | |
| MSI GF65 Thin 10UE | |
| Acer Nitro 5 AN517-53-54DQ | |
| Dell G5 15 5500 09E2 | |
| GTA V - 1920x1080 Highest AA:4xMSAA + FX AF:16x | |
| Average of class Gaming (48.3 - 186.9, n=102, last 2 years) | |
| Average NVIDIA GeForce RTX 3060 Laptop GPU (69.2 - 109.8, n=46) | |
| Gigabyte G5 KC | |
| MSI GF65 Thin 10UE | |
| Acer Nitro 5 AN517-53-54DQ | |
Our endurance load test with The Witcher 3 shows that the gaming laptop from Gigabyte does experience slight fluctuations in frame rates, but it can always stabilize them again even over a prolonged period of time.
The Witcher 3 FPS diagram
| low | med. | high | ultra | |
|---|---|---|---|---|
| GTA V (2015) | 178 | 171 | 151 | 87.4 |
| The Witcher 3 (2015) | 80.8 | |||
| Dota 2 Reborn (2015) | 144 | 129 | 120 | 115 |
| Final Fantasy XV Benchmark (2018) | 146 | 104 | 78.5 | |
| X-Plane 11.11 (2018) | 105 | 93.3 | 78.1 | |
| Far Cry 5 (2018) | 132 | 112 | 109 | 104 |
| Strange Brigade (2018) | 336 | 202 | 162 | 141 |
| Cyberpunk 2077 1.0 (2020) | 106.5 | 76.7 | 65 | 55.6 |
| F1 2021 (2021) | 130 | 120 | 119 | 80.2 |
Emissions - Loud fans in 3D mode
Noise emissions

The Gigabyte G5 KC's fans emit a uniform noise under load that is clearly audible. Therefore, the noise level is very high when gaming or using demanding applications. However, in desktop use with office programs and several open tabs in the Internet browser, the G5 is mostly quiet or silent - except for sporadic ramp-up phases.
We weren't able to determine any other background noises, such as coil whine or the like.
Noise level
| Idle |
| 31 / 32 / 51 dB(A) |
| Load |
| 57 / 58 dB(A) |
 | ||
30 dB silent 40 dB(A) audible 50 dB(A) loud |
||
min: | ||
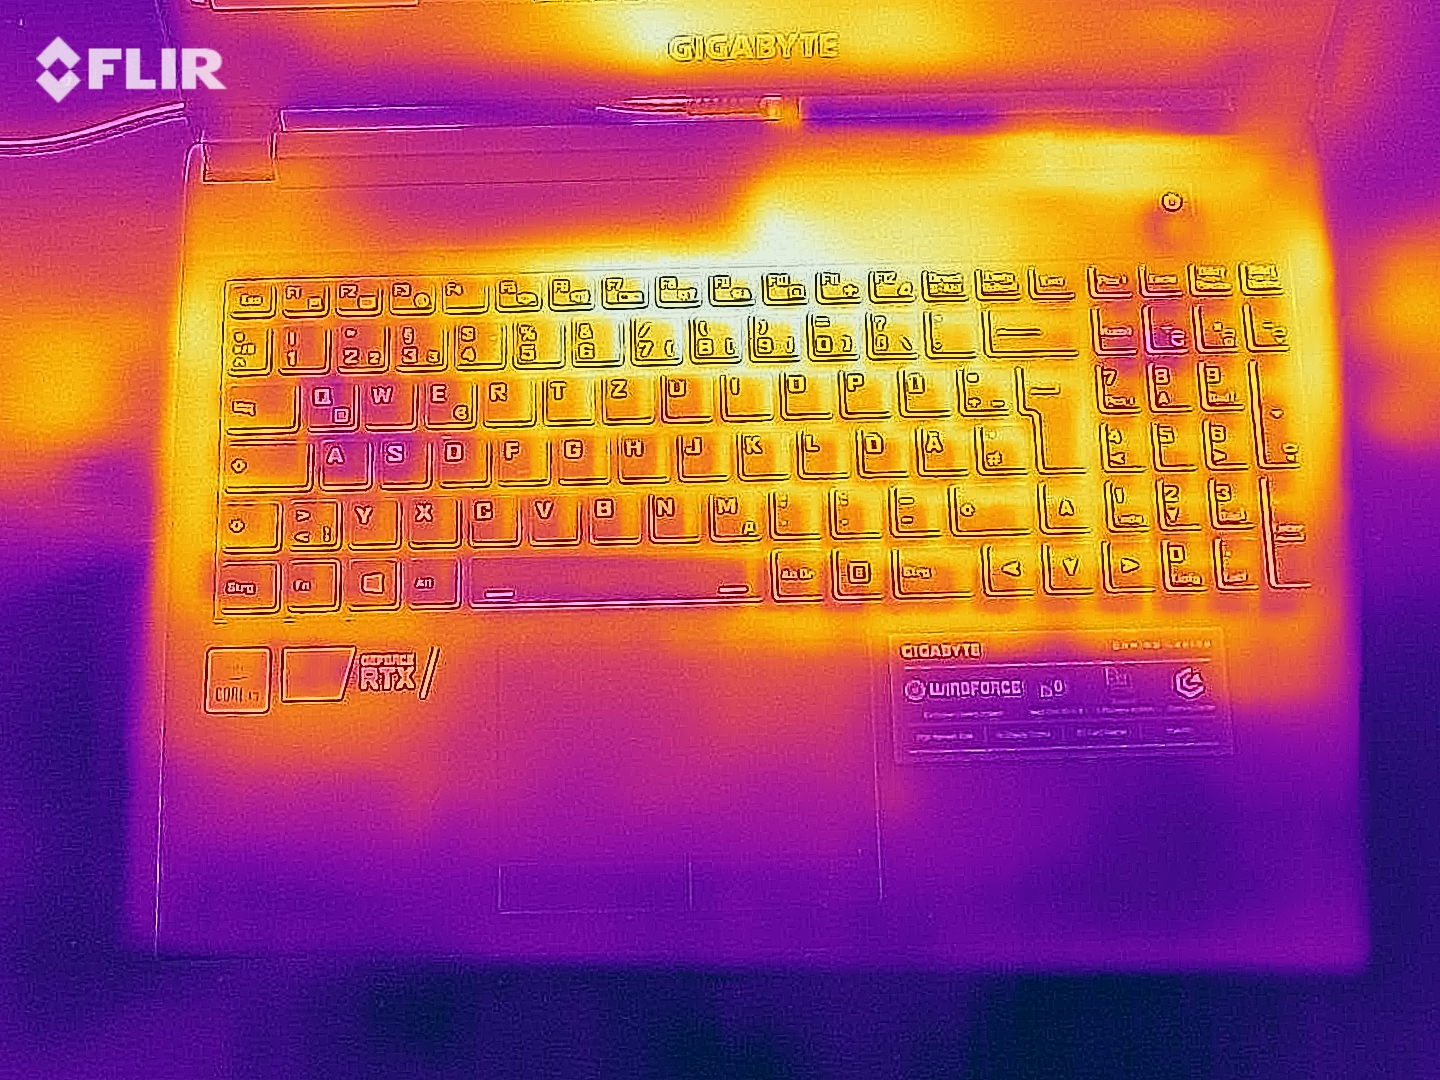
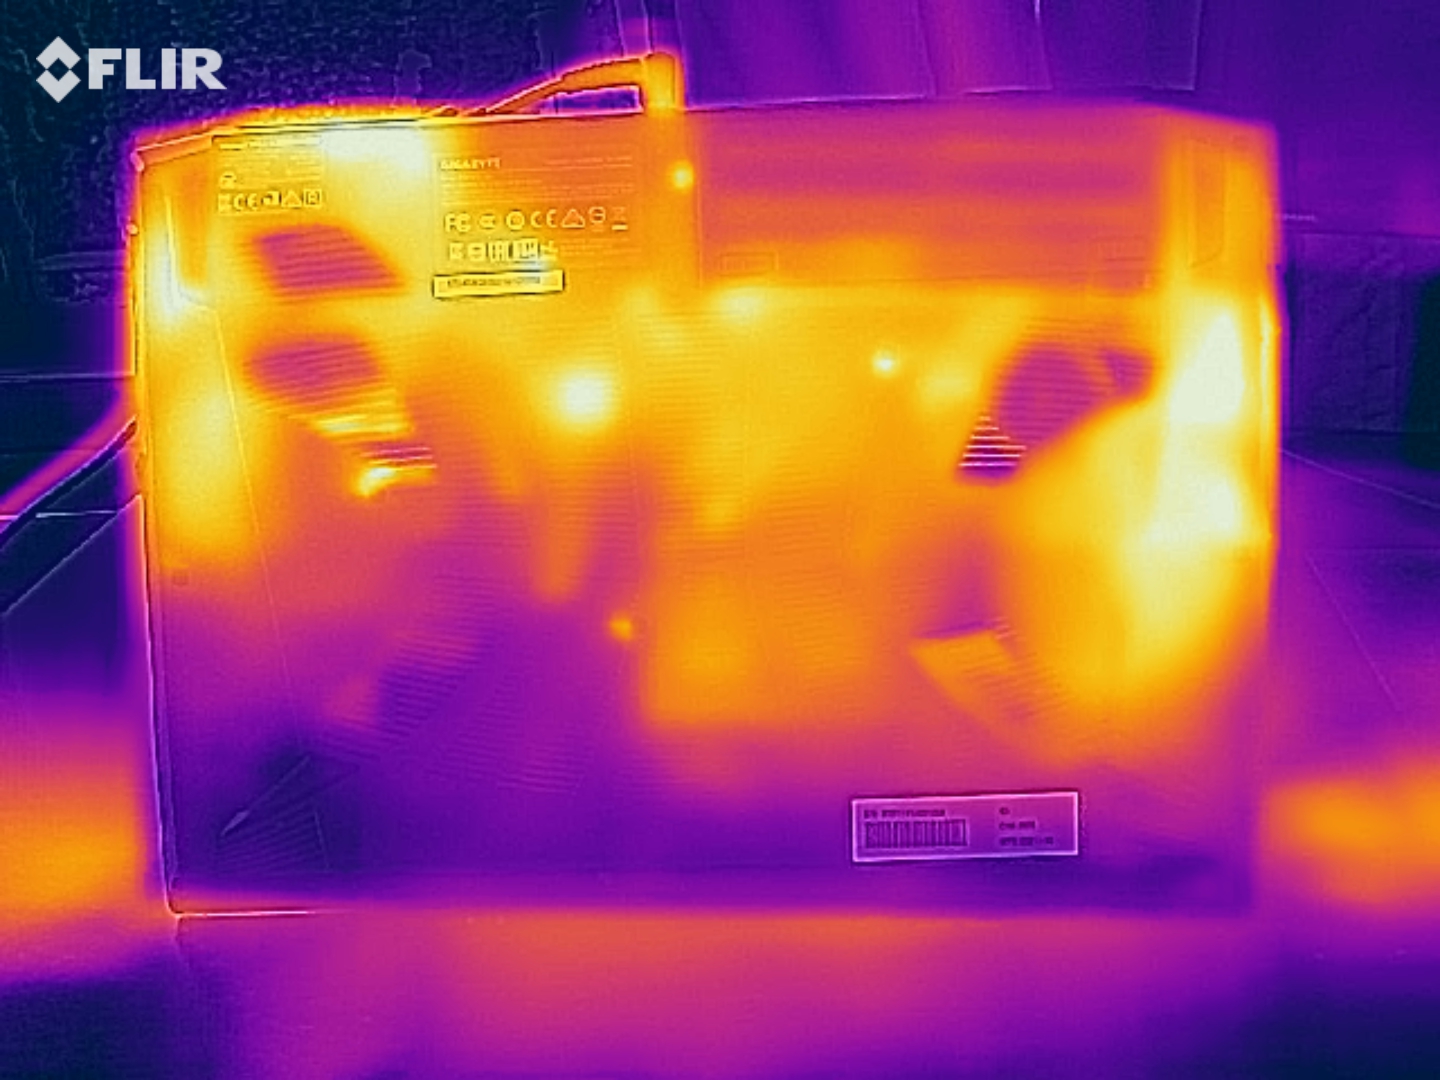
Temperature
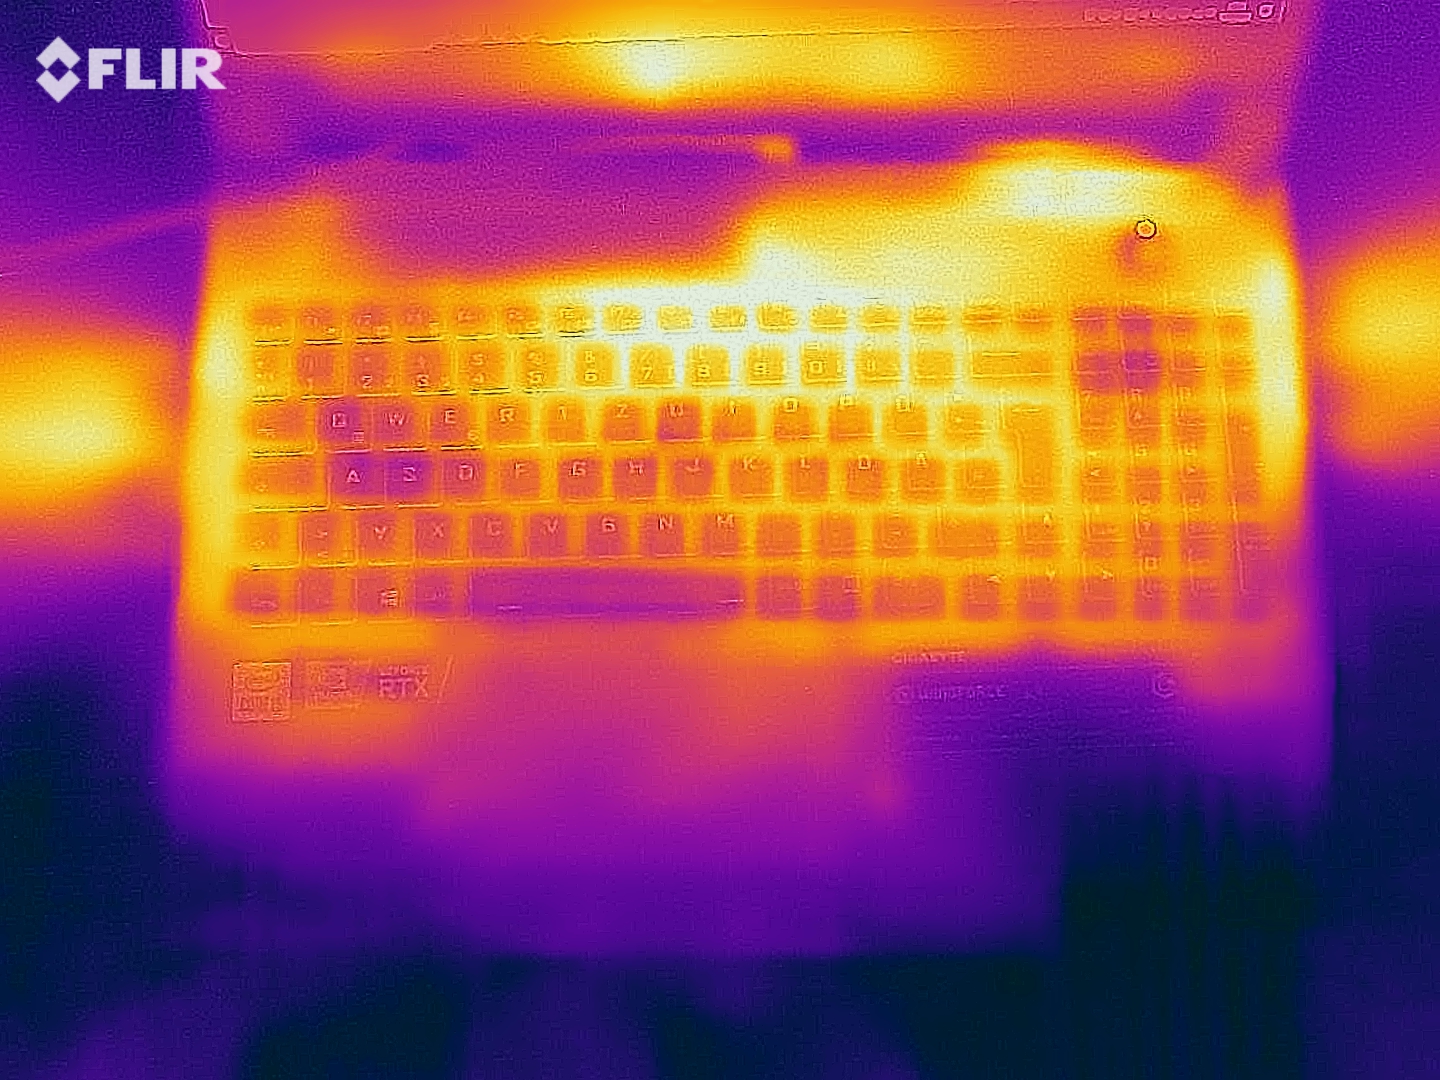
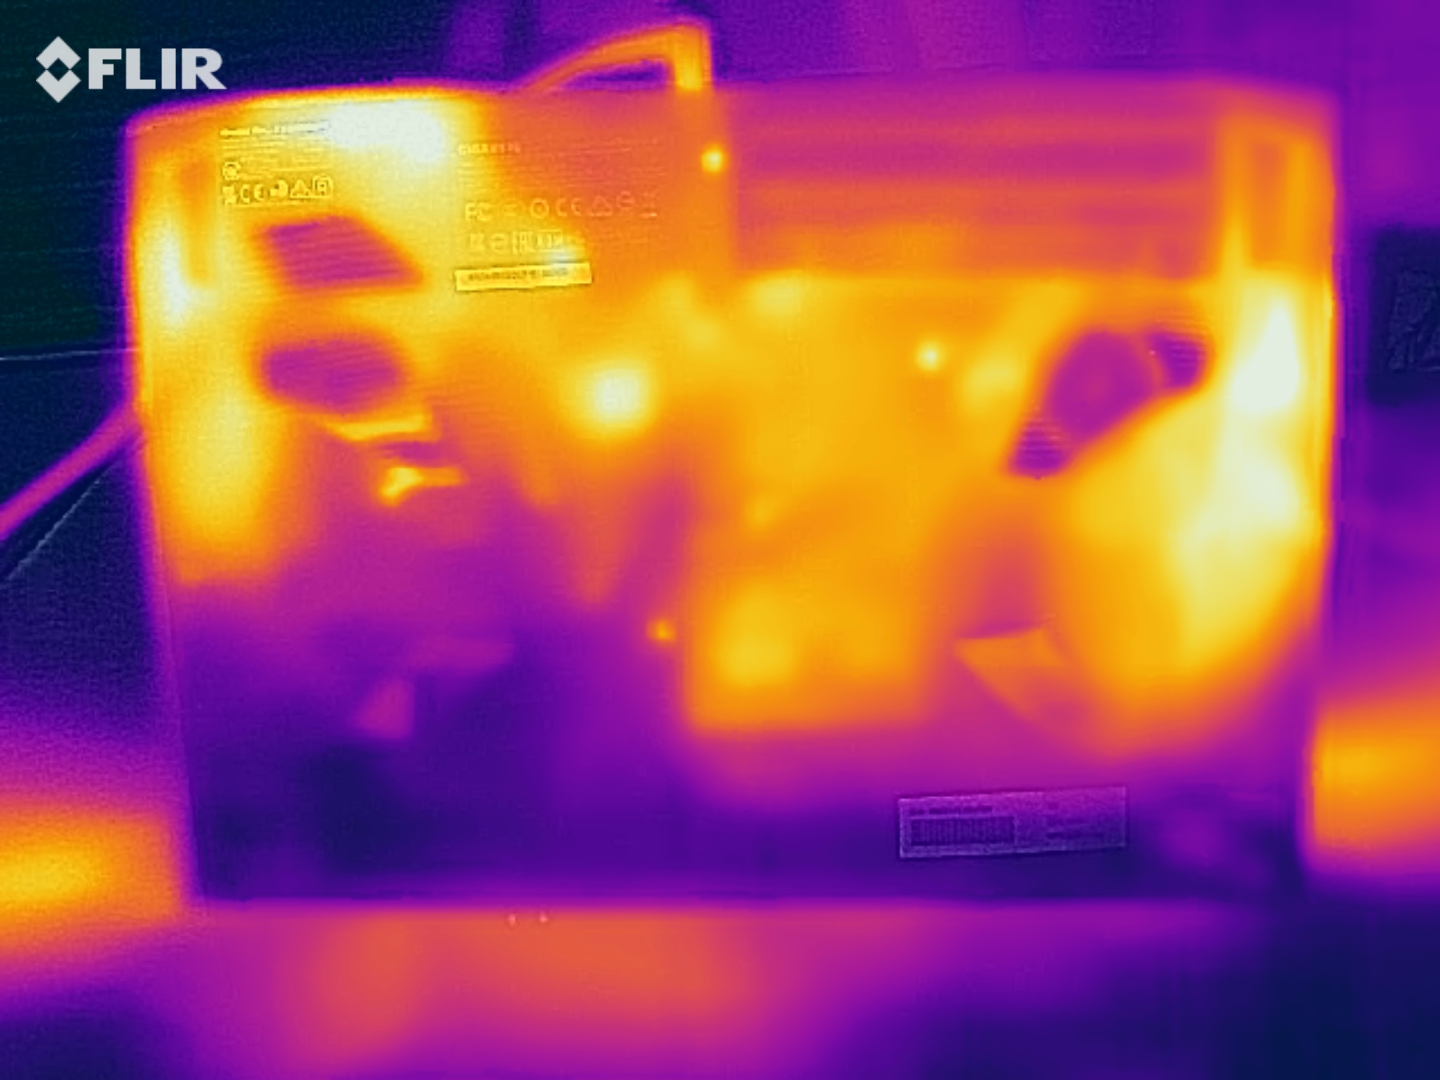
At up to 50 °C (~122 °F), the surface temperatures of the Gigabyte G5 can get quite high. Since this is only the case during our very demanding stress test, though, you shouldn't expect such high rates in everyday use and even when gaming. Furthermore, the temperatures of the palm rests always remain moderate.
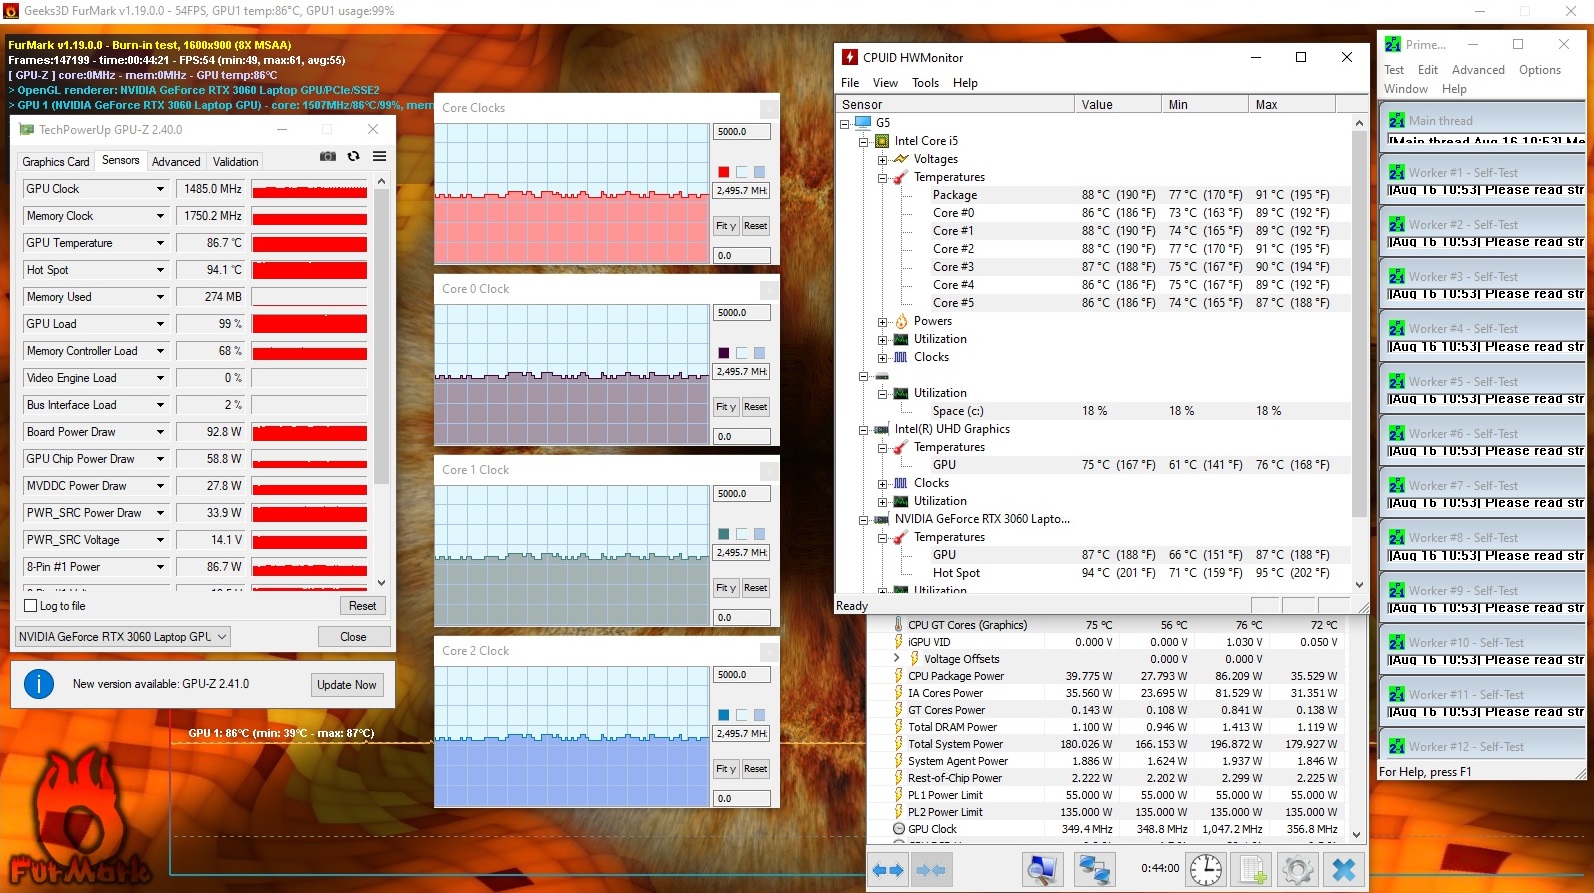
During our demanding endurance stress test, the temperatures inside the laptop climbed up to 91 °C (~196 °F). During this period, the CPU was kept at around 2.5 GHz, meaning that it didn't fall below the base clock speed.
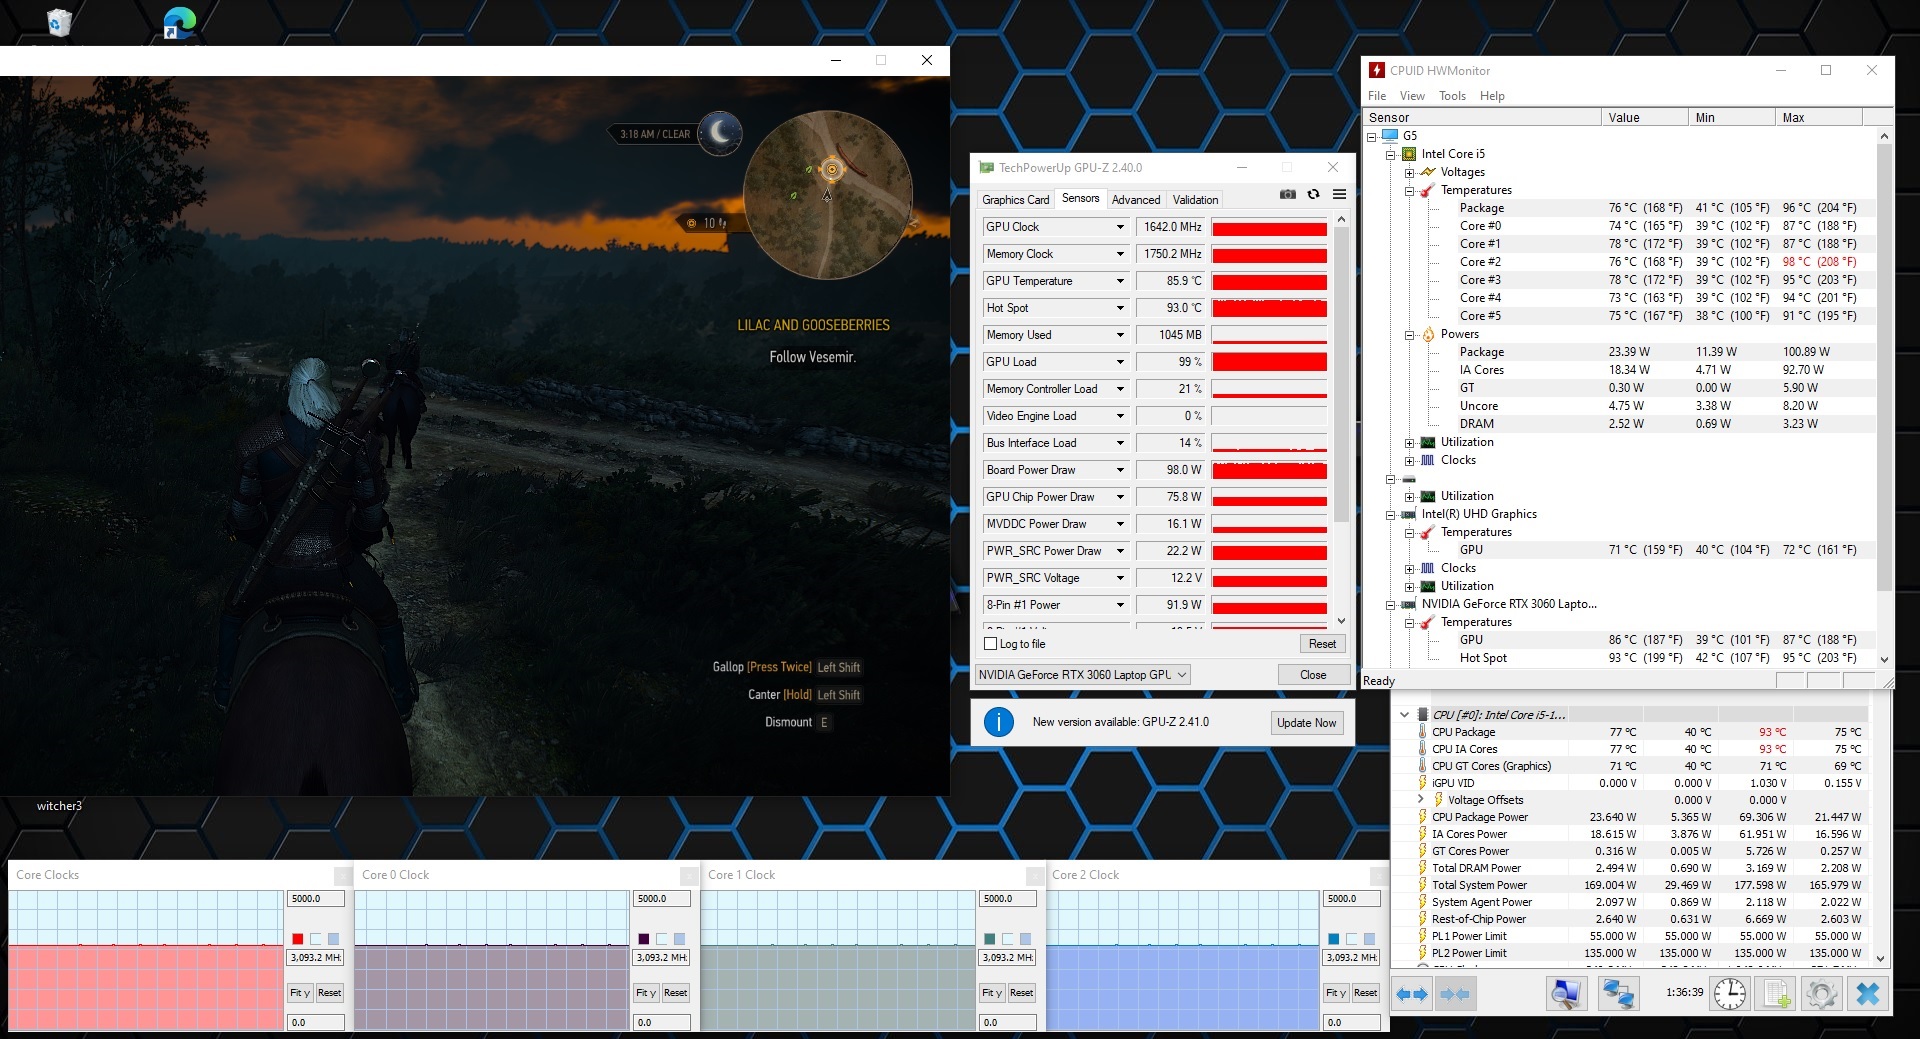
During our The Witcher 3 test, the temperatures briefly rose up to 98 °C (~208 °F.). The clock rates remained at around 3.1 GHz throughout the entire gaming test. Therefore, users shouldn't expect restrictions due to excessive temperatures, even under heavy system load.
(-) The maximum temperature on the upper side is 50 °C / 122 F, compared to the average of 40.4 °C / 105 F, ranging from 21.2 to 68.8 °C for the class Gaming.
(-) The bottom heats up to a maximum of 49 °C / 120 F, compared to the average of 43.2 °C / 110 F
(+) In idle usage, the average temperature for the upper side is 30.9 °C / 88 F, compared to the device average of 33.9 °C / 93 F.
(-) Playing The Witcher 3, the average temperature for the upper side is 42.8 °C / 109 F, compared to the device average of 33.9 °C / 93 F.
(-) The palmrests and touchpad can get very hot to the touch with a maximum of 42 °C / 107.6 F.
(-) The average temperature of the palmrest area of similar devices was 28.8 °C / 83.8 F (-13.2 °C / -23.8 F).
Speakers
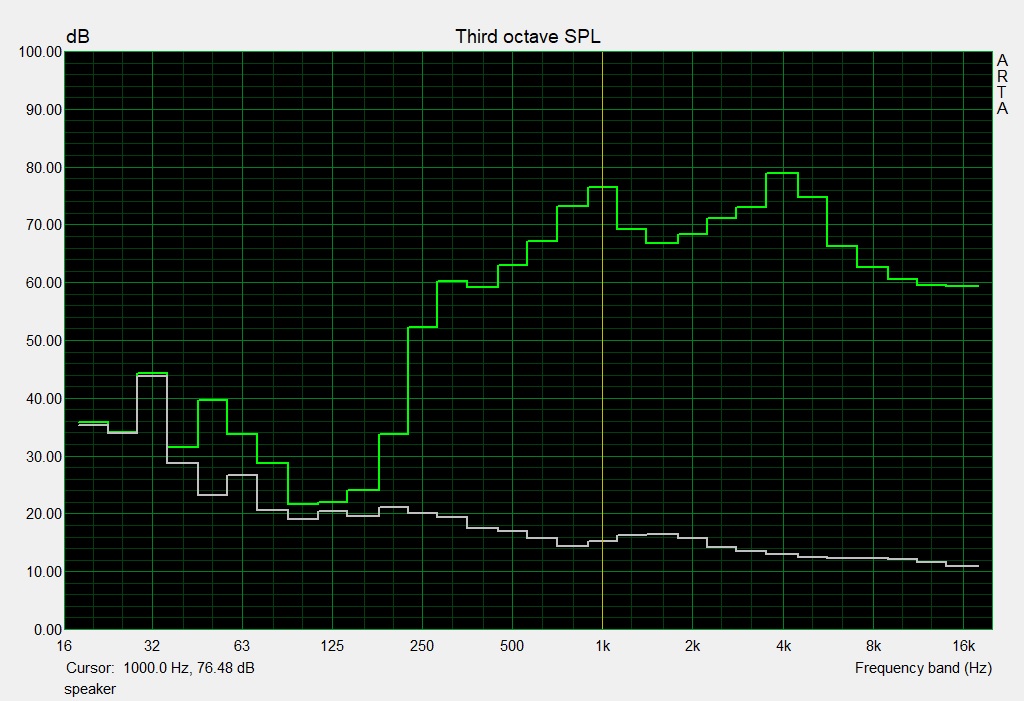
The speakers of the G5 KC offer relatively high volume and a sound spectrum with pronounced mids and highs. This makes them quite suitable for media playback, but headphones or external speakers should be preferred in games, for example.
Gigabyte G5 KC audio analysis
(+) | speakers can play relatively loud (85 dB)
Bass 100 - 315 Hz
(-) | nearly no bass - on average 27.4% lower than median
(-) | bass is not linear (16.1% delta to prev. frequency)
Mids 400 - 2000 Hz
(±) | higher mids - on average 5.8% higher than median
(±) | linearity of mids is average (7.8% delta to prev. frequency)
Highs 2 - 16 kHz
(±) | higher highs - on average 7.4% higher than median
(±) | linearity of highs is average (8.8% delta to prev. frequency)
Overall 100 - 16.000 Hz
(±) | linearity of overall sound is average (25.1% difference to median)
Compared to same class
» 90% of all tested devices in this class were better, 3% similar, 7% worse
» The best had a delta of 6%, average was 18%, worst was 132%
Compared to all devices tested
» 77% of all tested devices were better, 5% similar, 18% worse
» The best had a delta of 4%, average was 24%, worst was 134%
MSI GF65 Thin 10UE audio analysis
(±) | speaker loudness is average but good (80.7 dB)
Bass 100 - 315 Hz
(-) | nearly no bass - on average 19.6% lower than median
(-) | bass is not linear (16.1% delta to prev. frequency)
Mids 400 - 2000 Hz
(+) | balanced mids - only 3.2% away from median
(±) | linearity of mids is average (7.6% delta to prev. frequency)
Highs 2 - 16 kHz
(+) | balanced highs - only 3.6% away from median
(±) | linearity of highs is average (8.6% delta to prev. frequency)
Overall 100 - 16.000 Hz
(±) | linearity of overall sound is average (17.9% difference to median)
Compared to same class
» 54% of all tested devices in this class were better, 9% similar, 37% worse
» The best had a delta of 6%, average was 18%, worst was 132%
Compared to all devices tested
» 37% of all tested devices were better, 8% similar, 55% worse
» The best had a delta of 4%, average was 24%, worst was 134%
Energy management - Very short battery life
Energy consumption
According to our measurements, the maximum power consumption of the Gigabyte G5 KC can climb up to 242 watts. During our The Witcher 3 endurance test, the power consumption remained relatively stable at around 166 watts, and 13 watts was reached in our idle scenario. While the rates under load were above the average of other devices that we've tested with the Nvidia GeForce RTX 3060, the rates were lower in the idle scenarios.
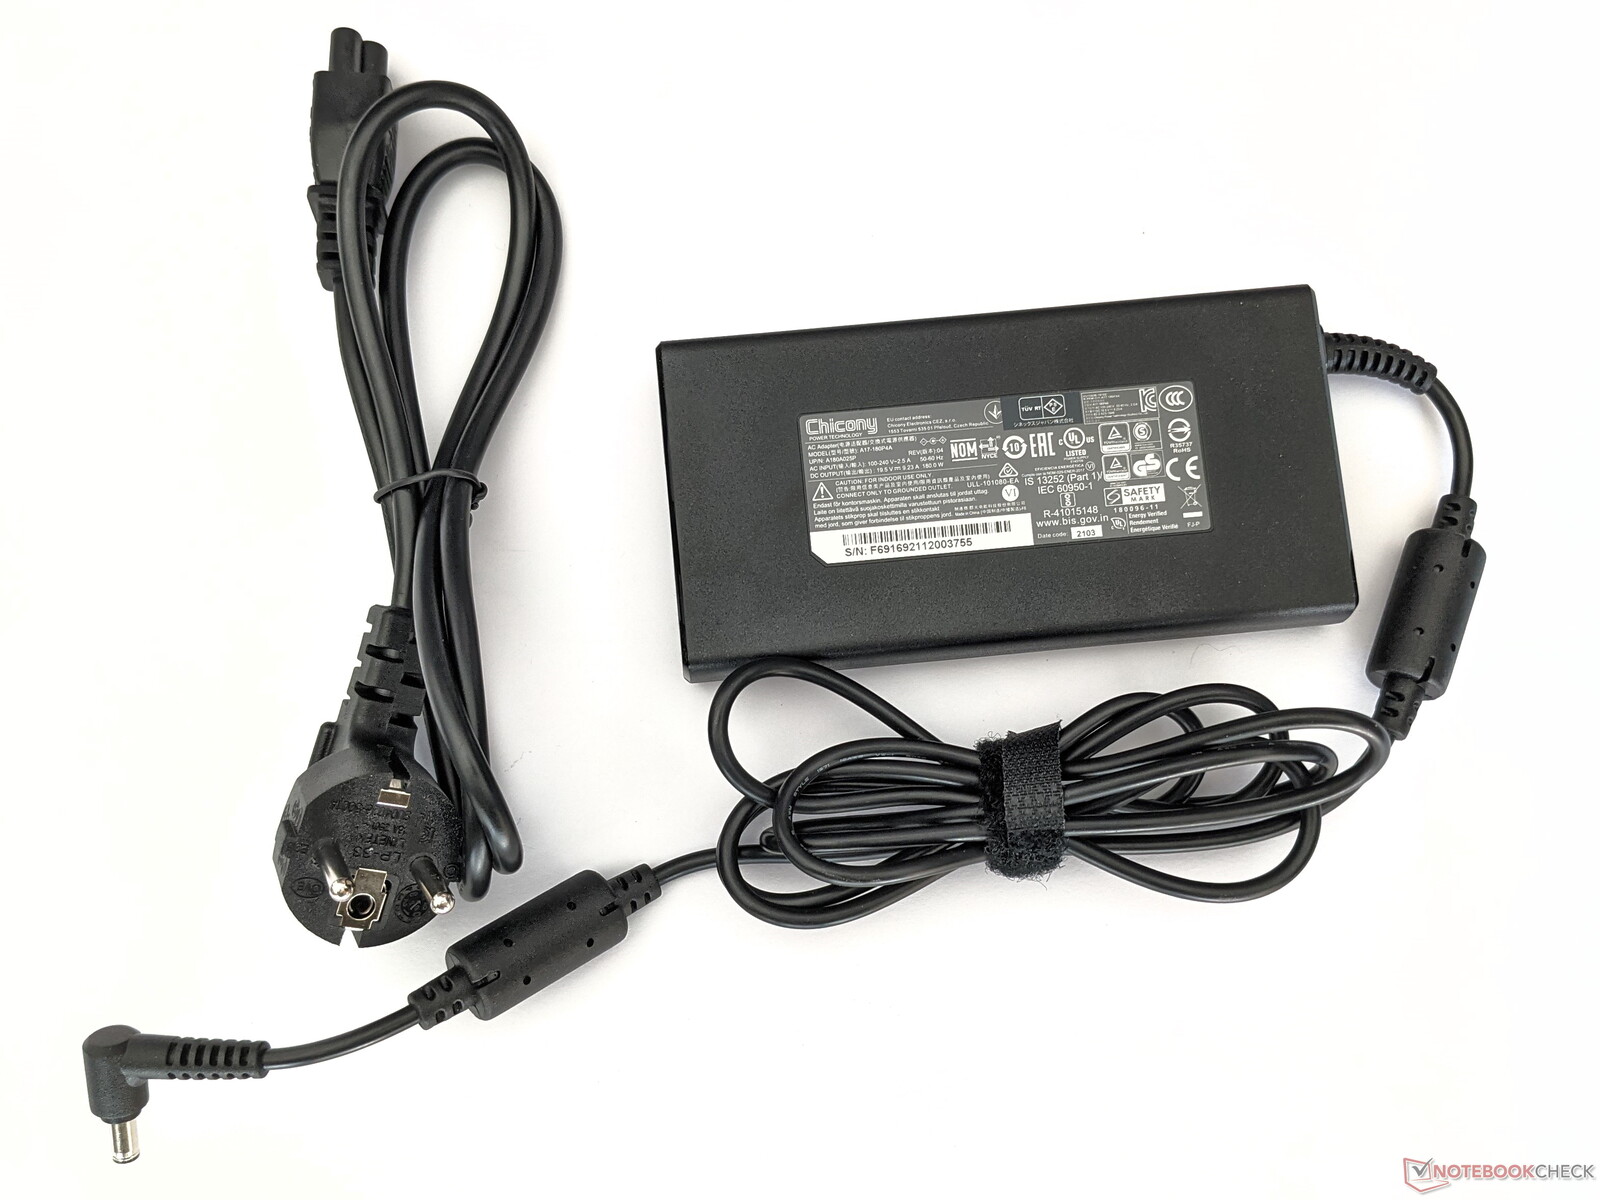
The included power adapter offers an output of 180 watts according to the label; consequently, its capacity is a bit tight when it comes to handling consumption peaks.
| Off / Standby | |
| Idle | |
| Load |
|
Key:
min: | |
| Gigabyte G5 KC i5-10500H, GeForce RTX 3060 Laptop GPU | Acer Nitro 5 AN517-53-54DQ i5-11300H, GeForce RTX 3050 4GB Laptop GPU | MSI GF65 Thin 10UE i7-10750H, GeForce RTX 3060 Laptop GPU | Average NVIDIA GeForce RTX 3060 Laptop GPU | Average of class Gaming | |
|---|---|---|---|---|---|
| Power Consumption | 33% | 18% | -9% | -29% | |
| Idle Minimum * (Watt) | 8 | 4 50% | 5.4 32% | 10.4 ? -30% | 13.2 ? -65% |
| Idle Average * (Watt) | 13 | 9 31% | 12.8 2% | 14.5 ? -12% | 18.9 ? -45% |
| Idle Maximum * (Watt) | 20 | 15 25% | 19.5 2% | 21.4 ? -7% | 24.3 ? -22% |
| Load Average * (Watt) | 98 | 85 13% | 86.6 12% | 109.3 ? -12% | 108 ? -10% |
| Witcher 3 ultra * (Watt) | 166 | 104 37% | 115.7 30% | ||
| Load Maximum * (Watt) | 242 | 135 44% | 175.2 28% | 206 ? 15% | 254 ? -5% |
* ... smaller is better
Energy consumption during The Witcher 3 / Stress test
Battery life
The Gigabyte G5 KC achieves a runtime of 3:35 hours in our real-world Wi-Fi test. This means that it doesn't last as long as the other gaming laptops in our test field. It's followed by the MSI GF65 Thin 10UE, which has a slightly larger battery of 51 Wh (instead of the 49 Wh in the G5 KC), though.
| Gigabyte G5 KC i5-10500H, GeForce RTX 3060 Laptop GPU, 48.96 Wh | Acer Nitro 5 AN517-53-54DQ i5-11300H, GeForce RTX 3050 4GB Laptop GPU, 57 Wh | MSI GF65 Thin 10UE i7-10750H, GeForce RTX 3060 Laptop GPU, 51 Wh | Dell G5 15 5500 09E2 i5-10300H, GeForce GTX 1650 Ti Mobile, 51 Wh | Average of class Gaming | |
|---|---|---|---|---|---|
| Battery runtime | 121% | 47% | 107% | 66% | |
| Reader / Idle (h) | 5.2 | 17.4 235% | 11.1 113% | 12.2 135% | 8.71 ? 68% |
| WiFi v1.3 (h) | 3.6 | 7.2 100% | 4.6 28% | 6.4 78% | 7.02 ? 95% |
| Load (h) | 1.1 | 1.4 27% | 1.1 0% | 1.47 ? 34% | |
| Witcher 3 ultra (h) | 1.2 |
Pros
Cons
Verdict - Good gaming laptop for little money
The Gigabyte G5 KC can primarily do one thing: Bring modern games smoothly onto the screen. The latter shows its good side with rich colors and a 144 Hz refresh rate, and the Intel Core i5-10500H also delivers a stable performance over prolonged periods of time. The built-in Nvidia GeForce RTX 3060 doesn't make use of the maximum possible TGP, but it also delivers good results, especially in comparison with other budget gaming laptops, such as the MSI GF65 Thin 10UE.
Playing the latest titles smoothly is no problem with the affordable Gigabyte G5 KC.
Even higher-priced rivals can take a leaf out of Gigabyte's book when it comes to maintenance options. In addition to the system SSD, there's a second M.2 slot and a free slot for a 2.5-inch drive. You can even replace the battery without the need for tools, although it only provides moderate runtimes.
The gaming laptop's low price is also noticeable in the case's dimensions. But if you're just looking for a budget device with strong hardware, you certainly won't go wrong with the Gigabyte G5 KC.
Price and availability
Gigabyte G5 KC
- 09/02/2021 v7 (old)
Mike Wobker
Price comparison

