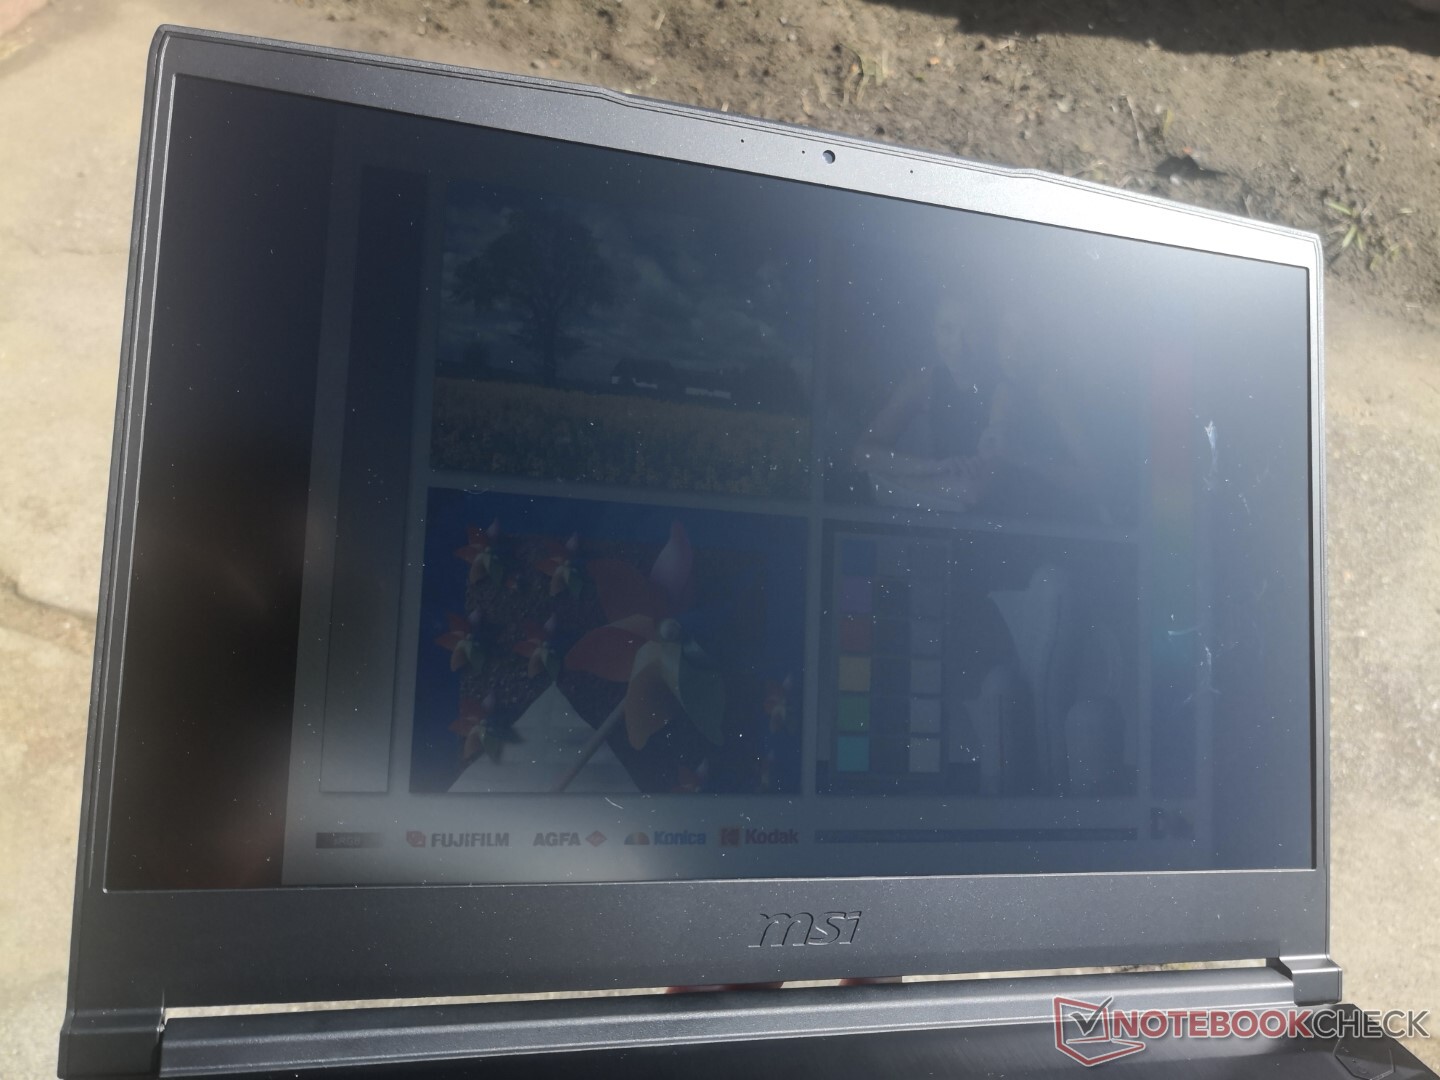
MSI GF65 Thin 10UE Laptop Review: GeForce RTX 3060 on a Budget
The MSI GF65 is one of the least expensive 15.6-inch gaming laptop laptops you can buy with GeForce RTX 3060 graphics. Our review configuration comes with the 10th gen Core i7-10750H, aforementioned RTX 30 GPU, 32 GB of RAM, and 1 TB Samsung SSD for about $1650 USD from CUKUSA. However, lesser RAM, storage and Core i5 options are available for much lower prices starting at $999.
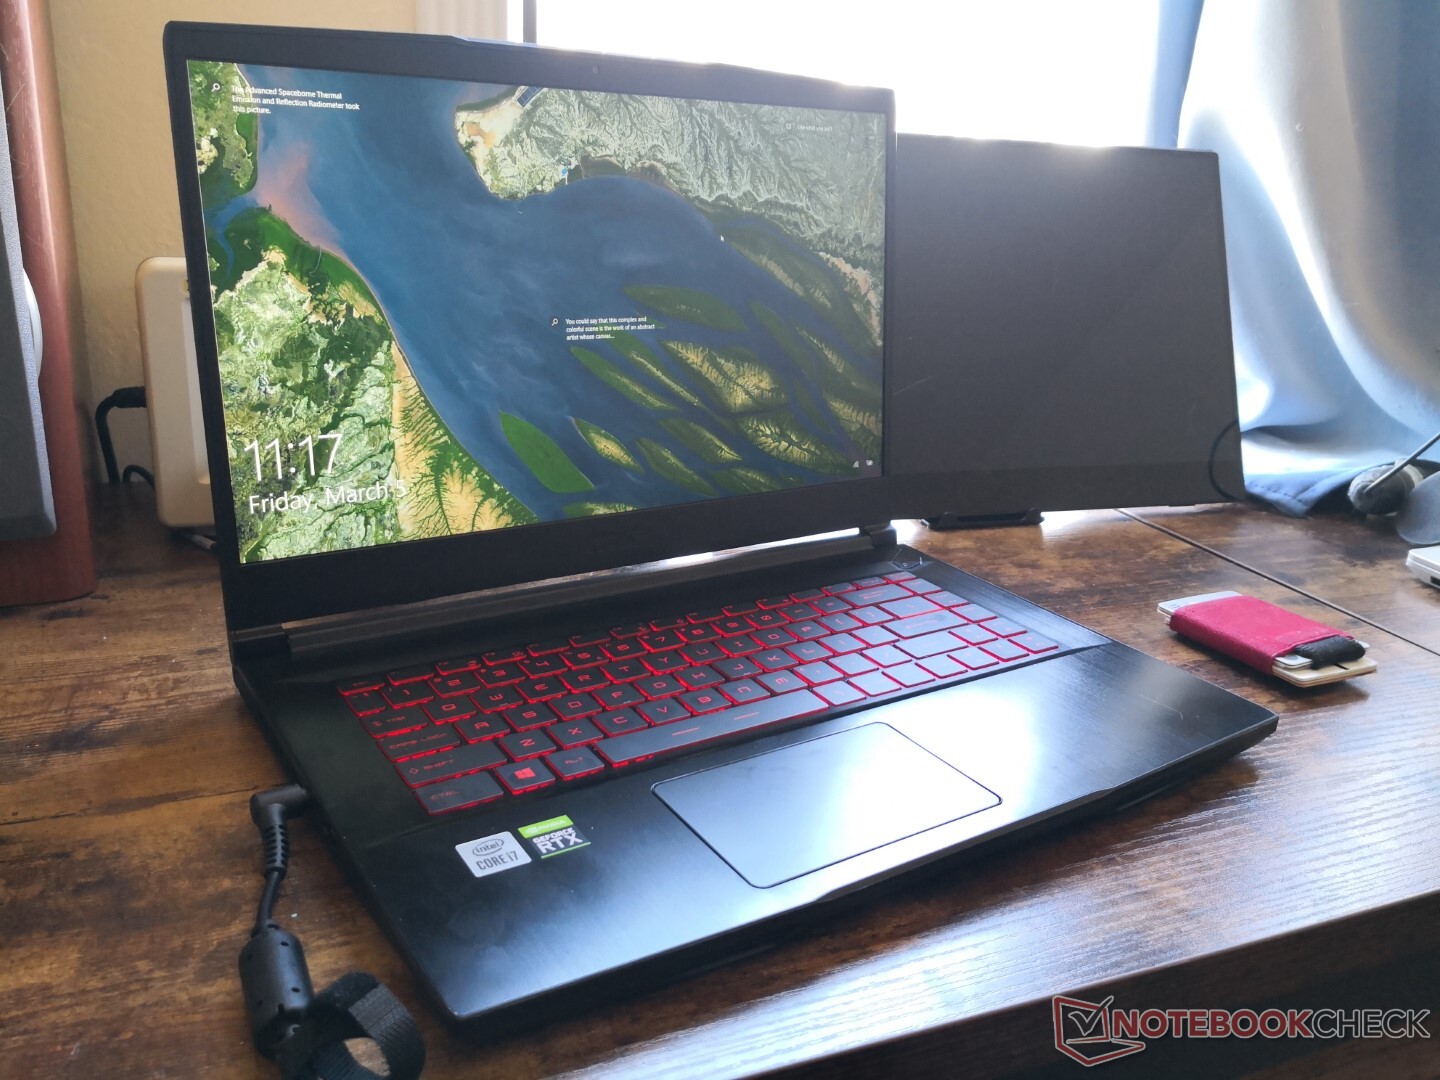
Externally, the GF65 10UE carries the same chassis design as the 2020 GF65 9SD and so many of our existing comments still apply. We recommend checking out our review on the 2020 version to learn more about the physical features of the laptop.
The MSI GF series competes with other budget gaming laptops like the Lenovo Legion 5, Dell G5, Acer Nitro 5, or the Asus TUF series.
More MSI reviews:
potential competitors in comparison
Rating | Date | Model | Weight | Height | Size | Resolution | Price |
|---|---|---|---|---|---|---|---|
| 80.4 % v7 (old) | 03 / 2021 | MSI GF65 Thin 10UE i7-10750H, GeForce RTX 3060 Laptop GPU | 1.9 kg | 21.7 mm | 15.60" | 1920x1080 | |
| 85 % v7 (old) | 02 / 2021 | Asus ROG Strix G15 G513QR R9 5900HX, GeForce RTX 3070 Laptop GPU | 2.3 kg | 27.2 mm | 15.60" | 1920x1080 | |
| 84.9 % v7 (old) | 03 / 2021 | Schenker XMG Core 15 Ampere R7 4800H, GeForce RTX 3060 Laptop GPU | 2 kg | 22.9 mm | 15.60" | 2560x1440 | |
| 84 % v7 (old) | 02 / 2021 | MSI GS66 Stealth 10UG i7-10870H, GeForce RTX 3070 Laptop GPU | 2.1 kg | 19.8 mm | 15.60" | 1920x1080 | |
| 86.4 % v7 (old) | 02 / 2021 | Aorus 15G XC i7-10870H, GeForce RTX 3070 Laptop GPU | 2.1 kg | 23 mm | 15.60" | 1920x1080 | |
| 86.3 % v7 (old) | 12 / 2020 | Lenovo Legion 7 15IMH05-81YT001VGE i9-10980HK, GeForce RTX 2080 Super Max-Q | 2.4 kg | 19.9 mm | 15.60" | 1920x1080 |
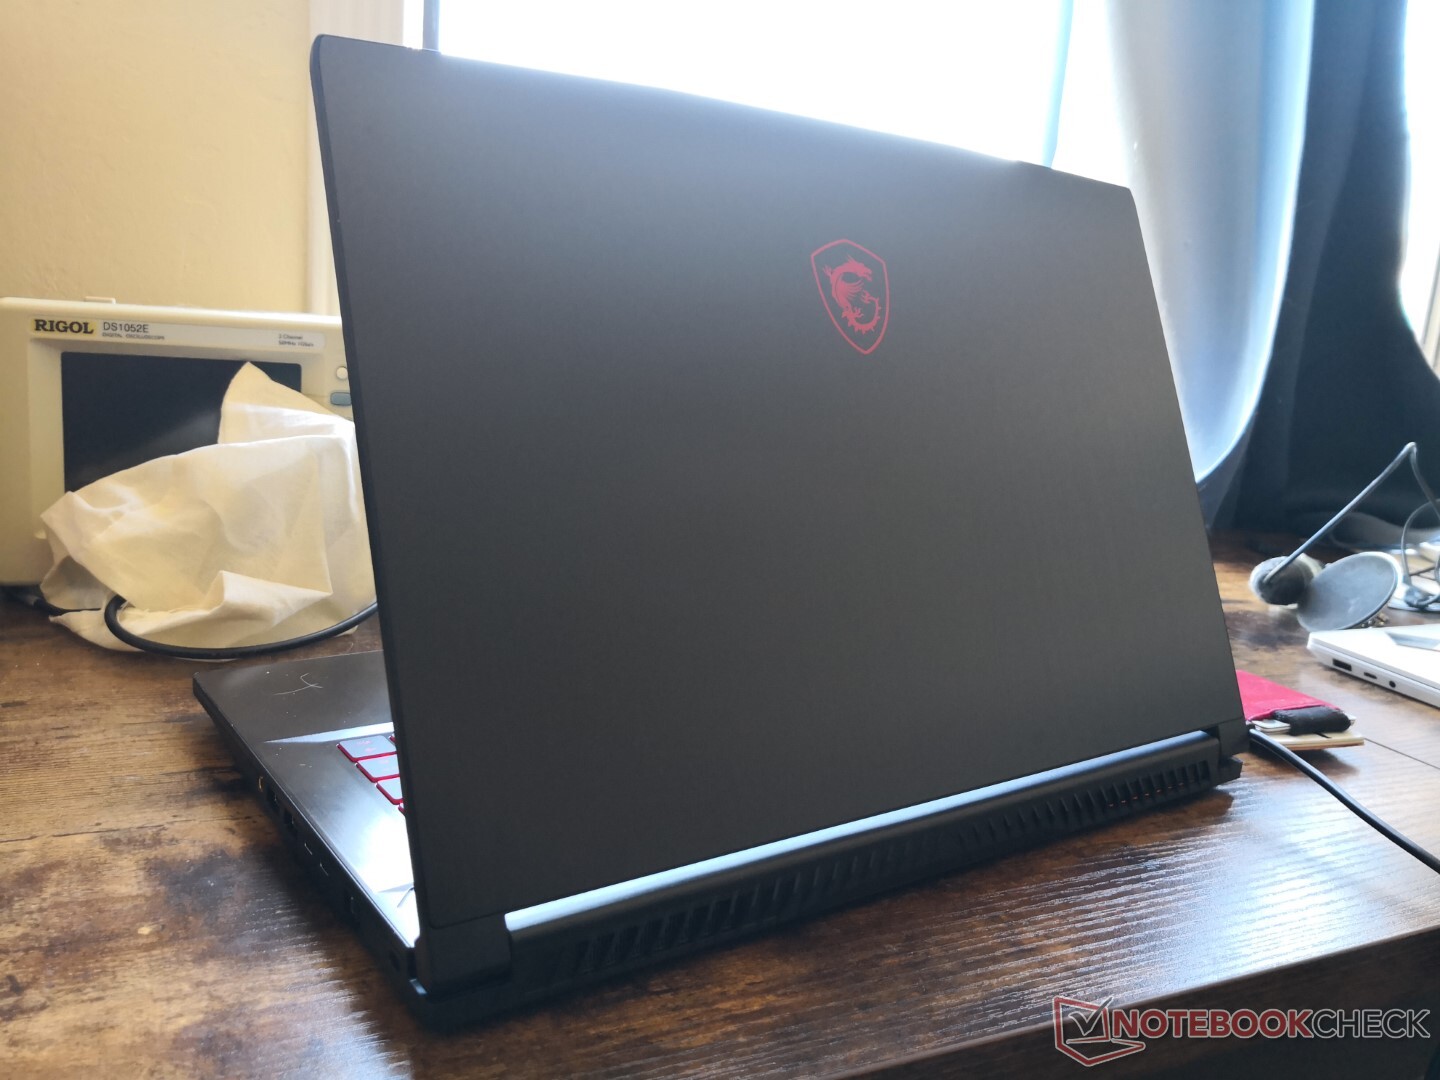
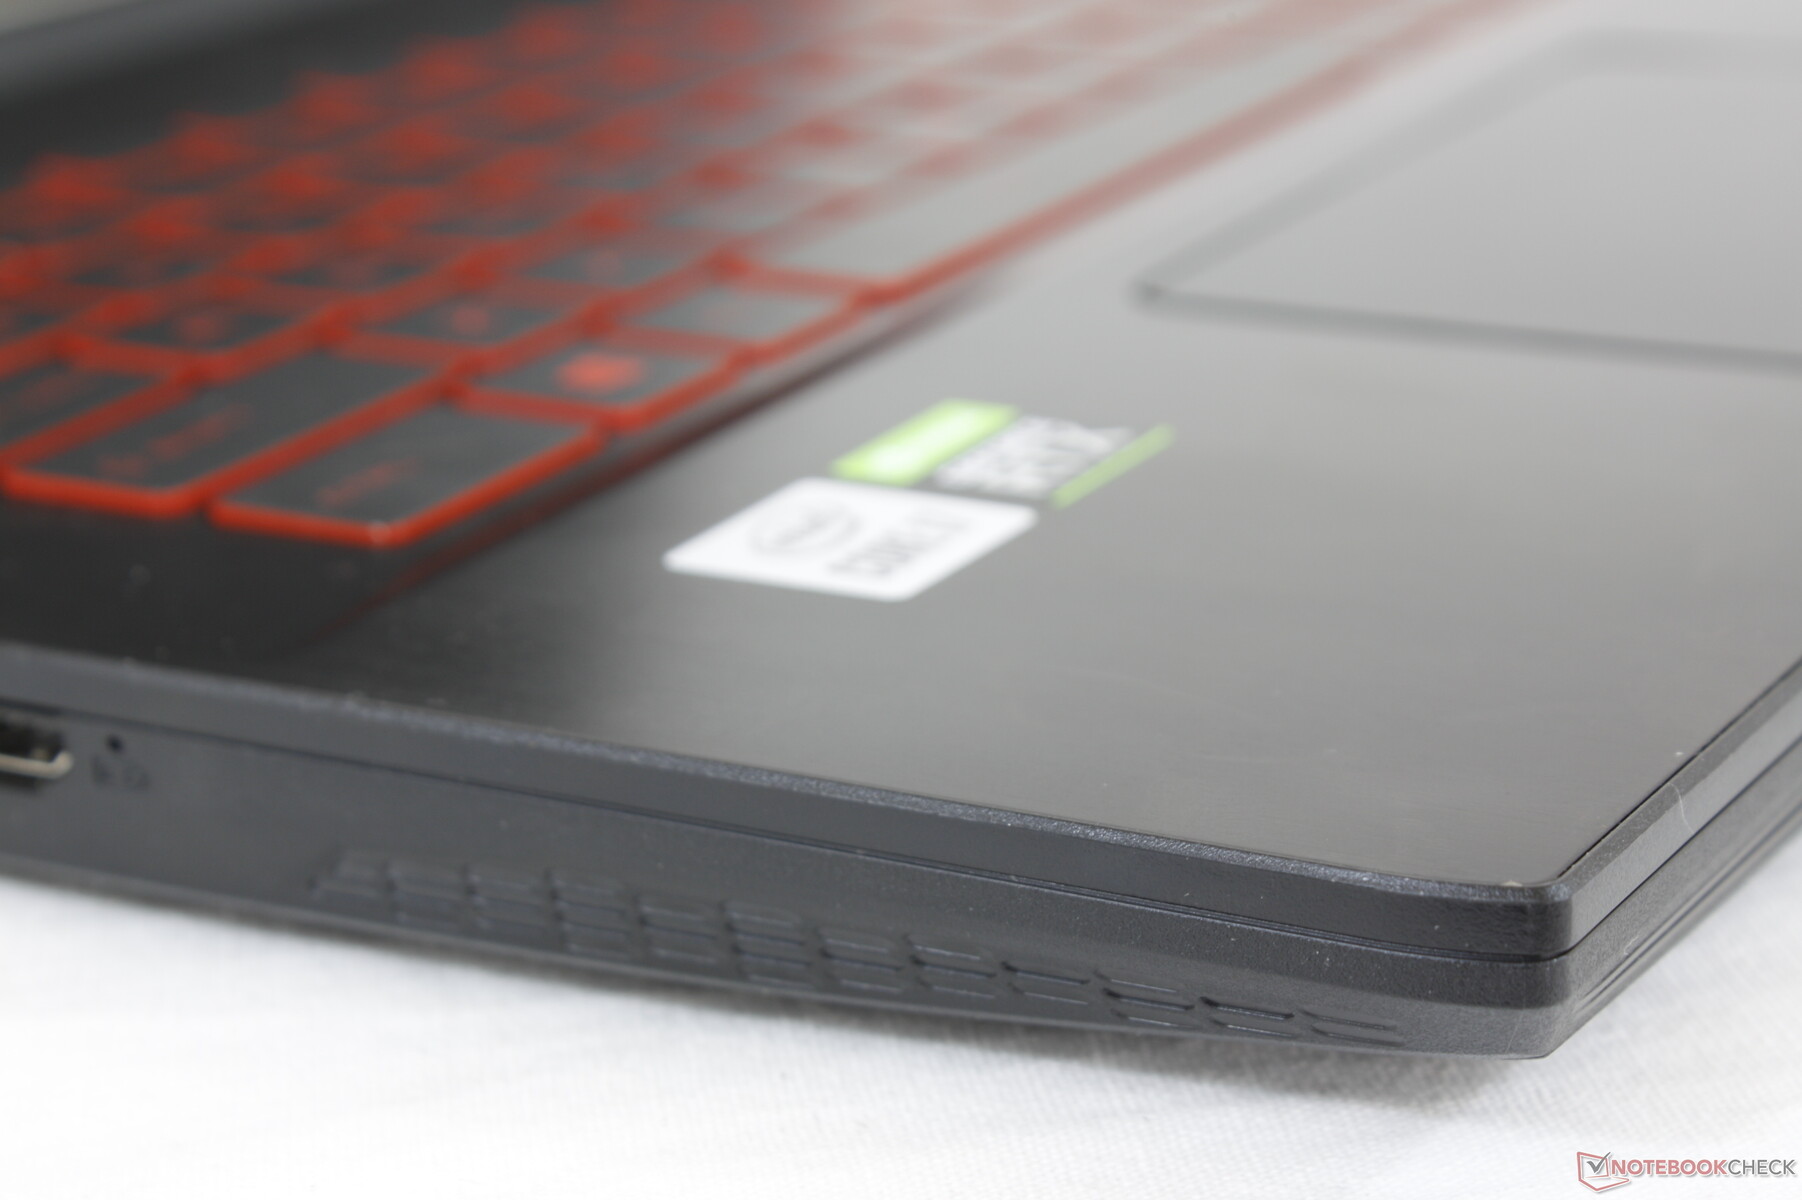
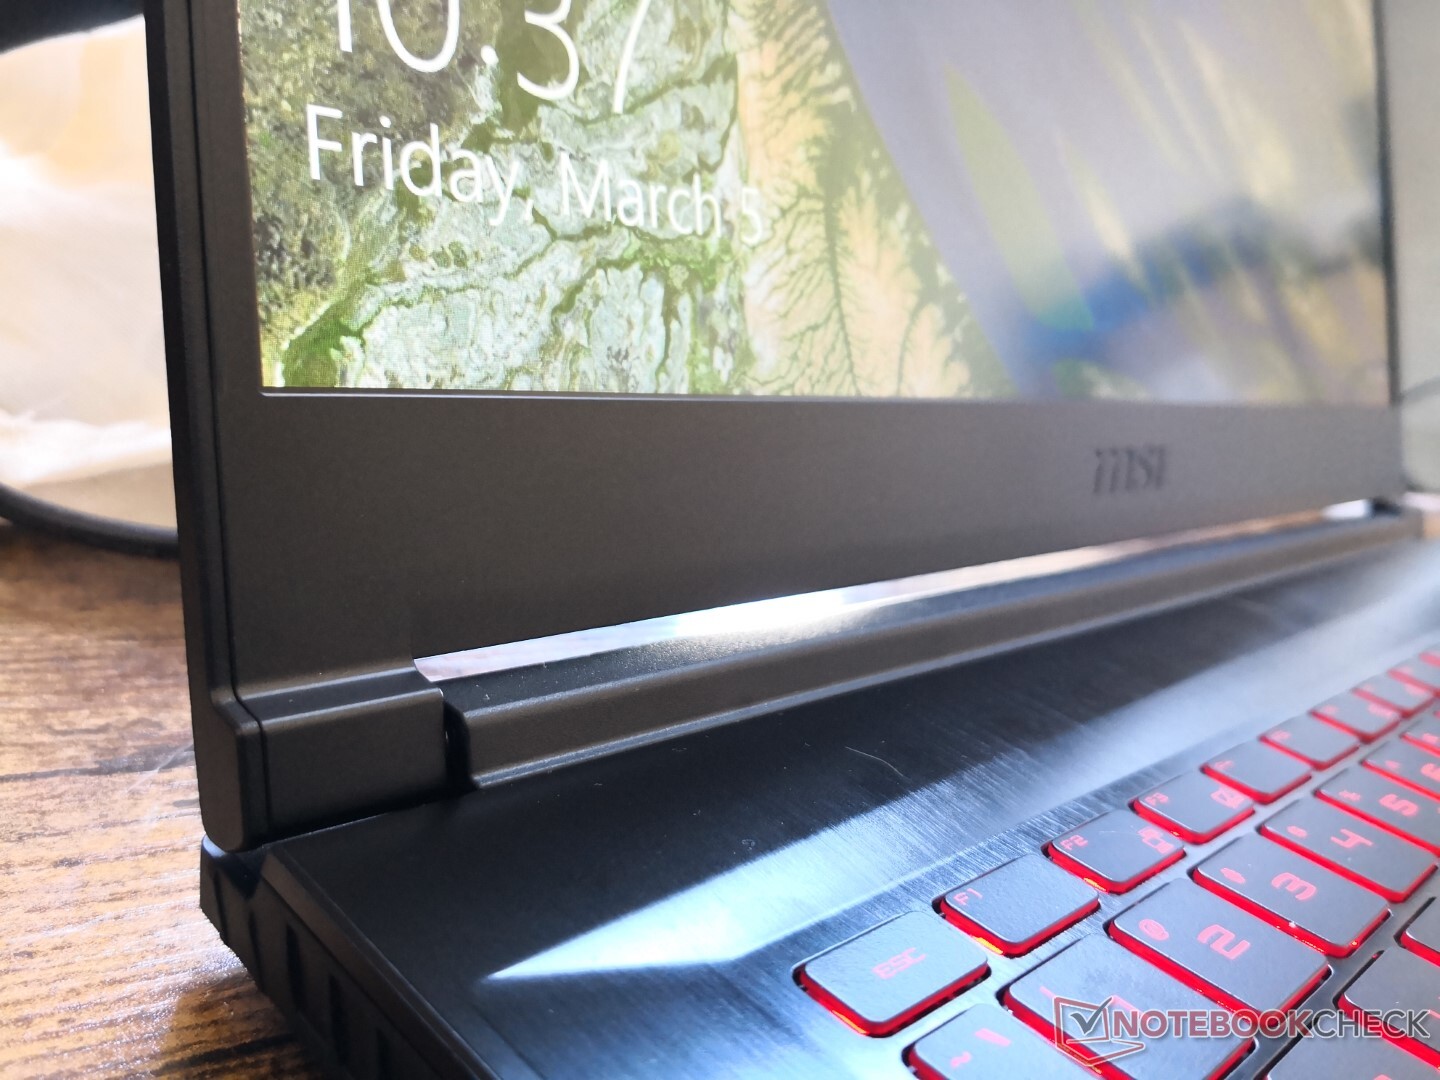
Case
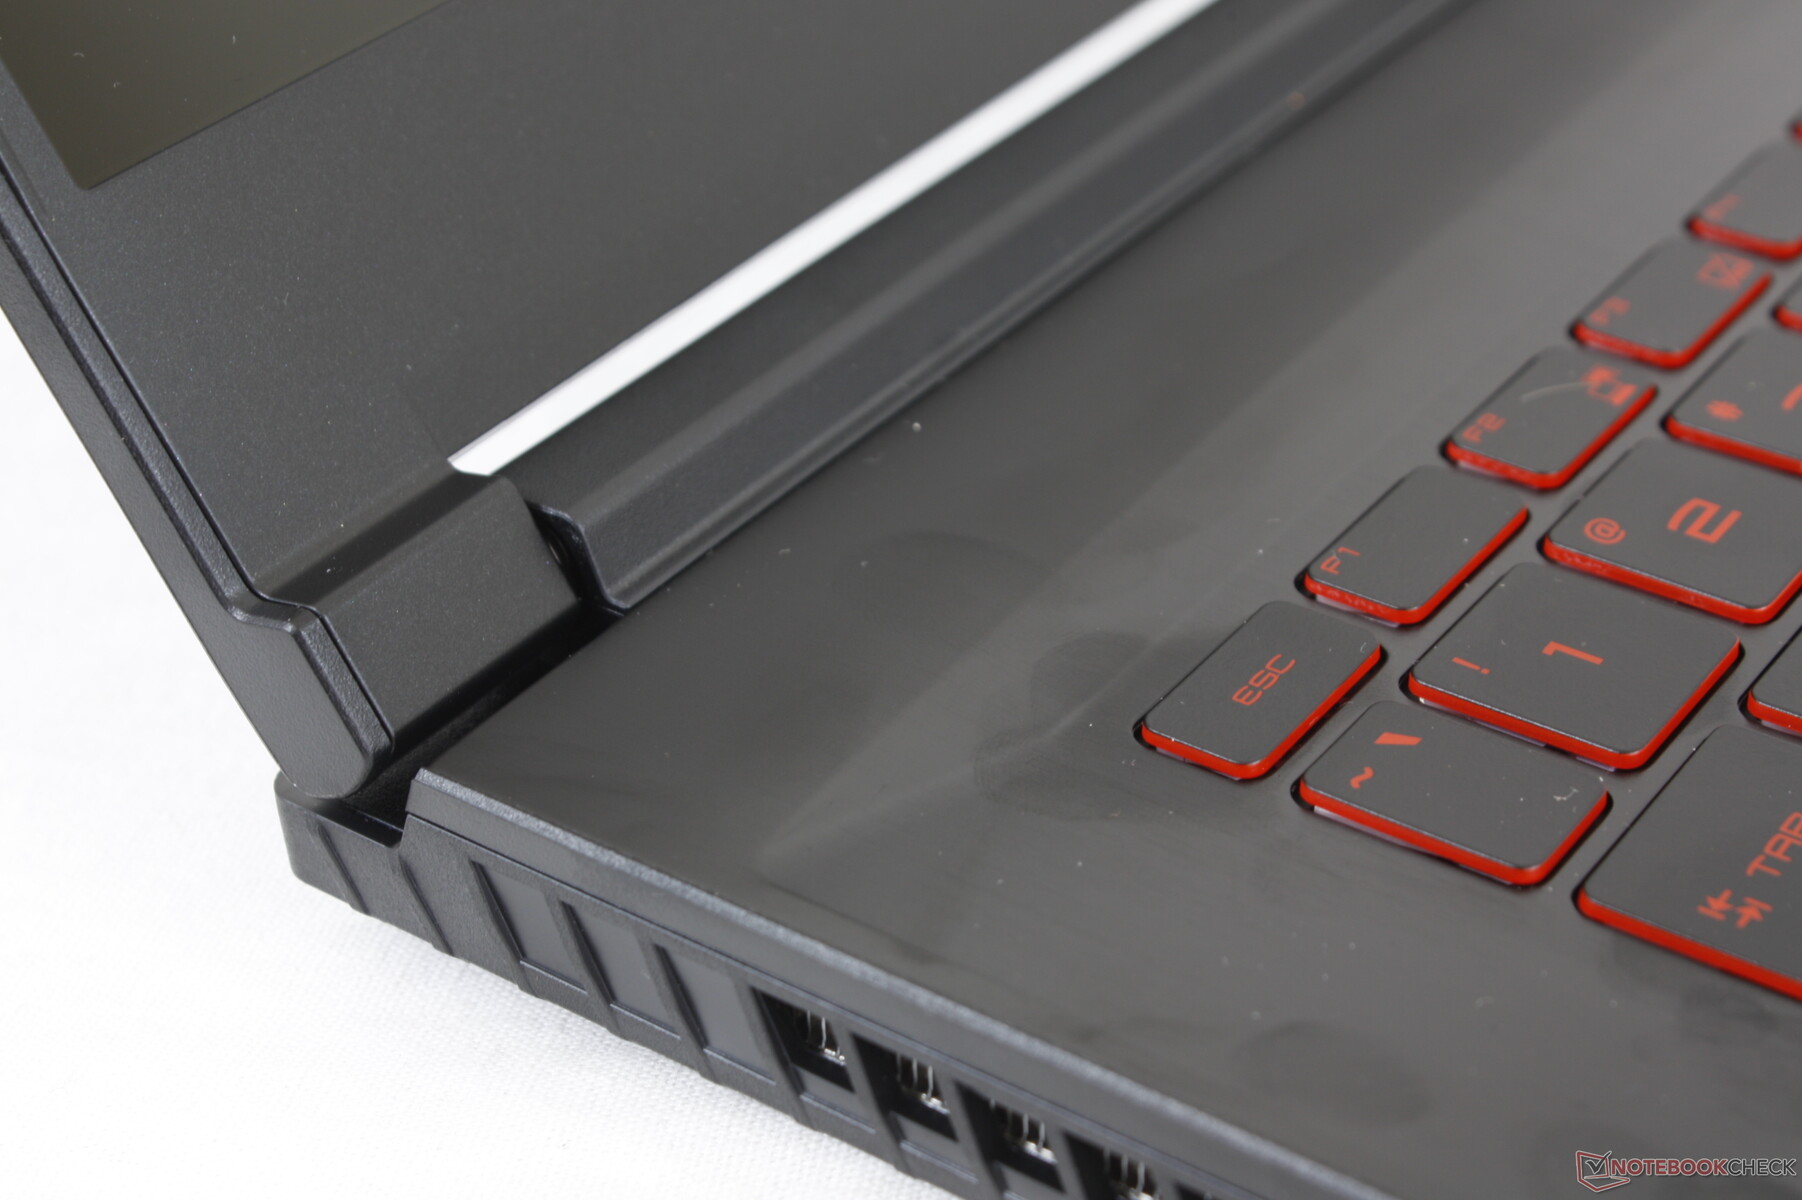
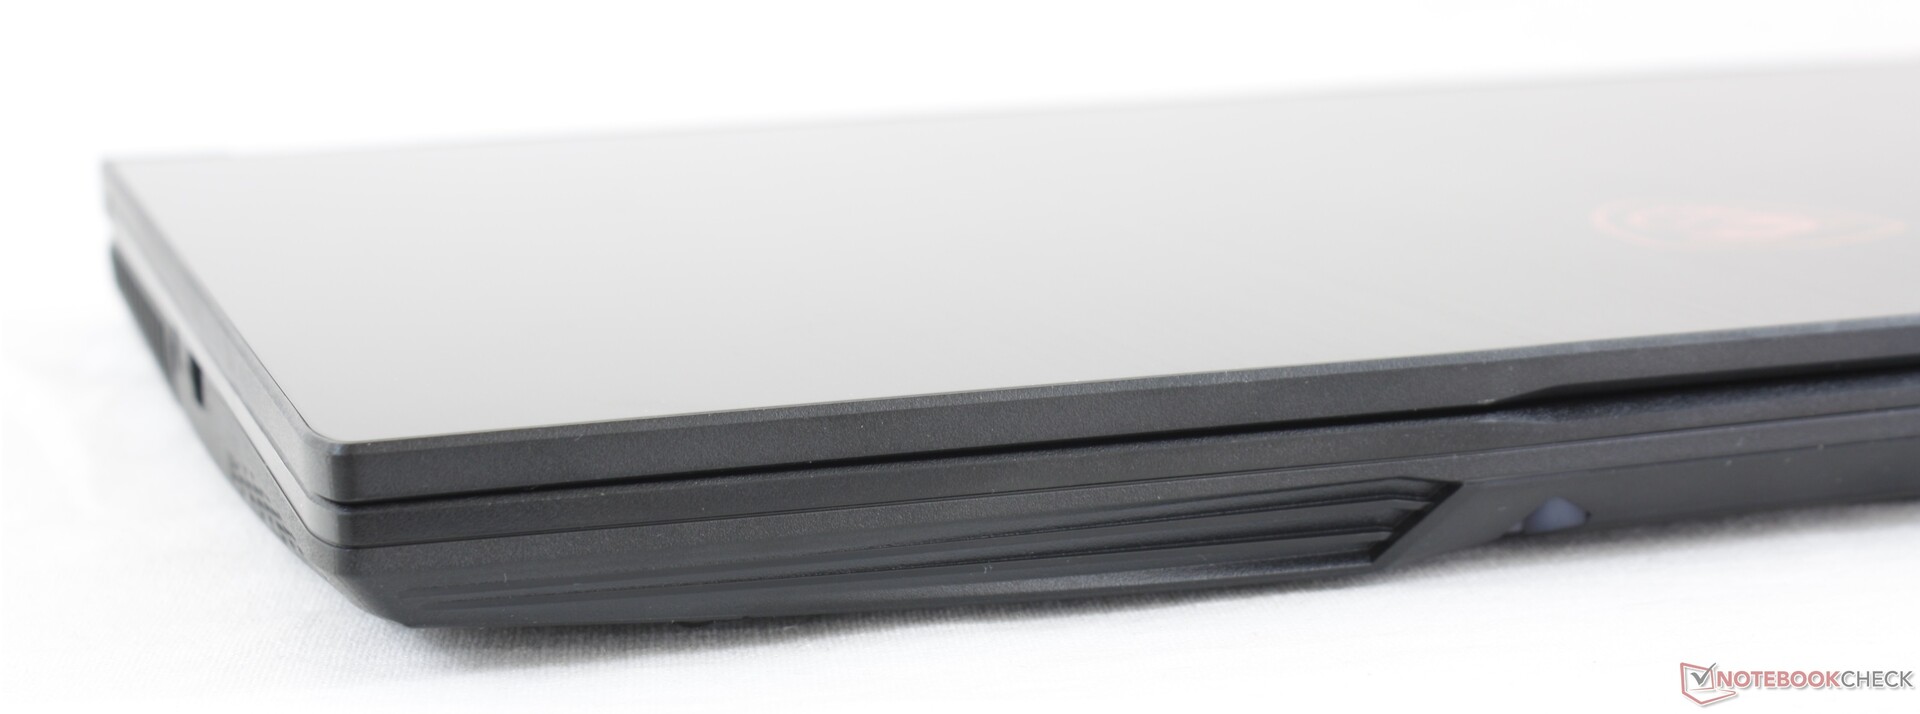
Surfaces feel thin and they warp more readily when compared to MSI's higher-end models from the GE or GT series. The GF65 doesn't feel as luxurious as a result which is to be expected from an entry-level gaming laptop. The competing Asus TUF models, which are slightly heavier, feel sturdier.
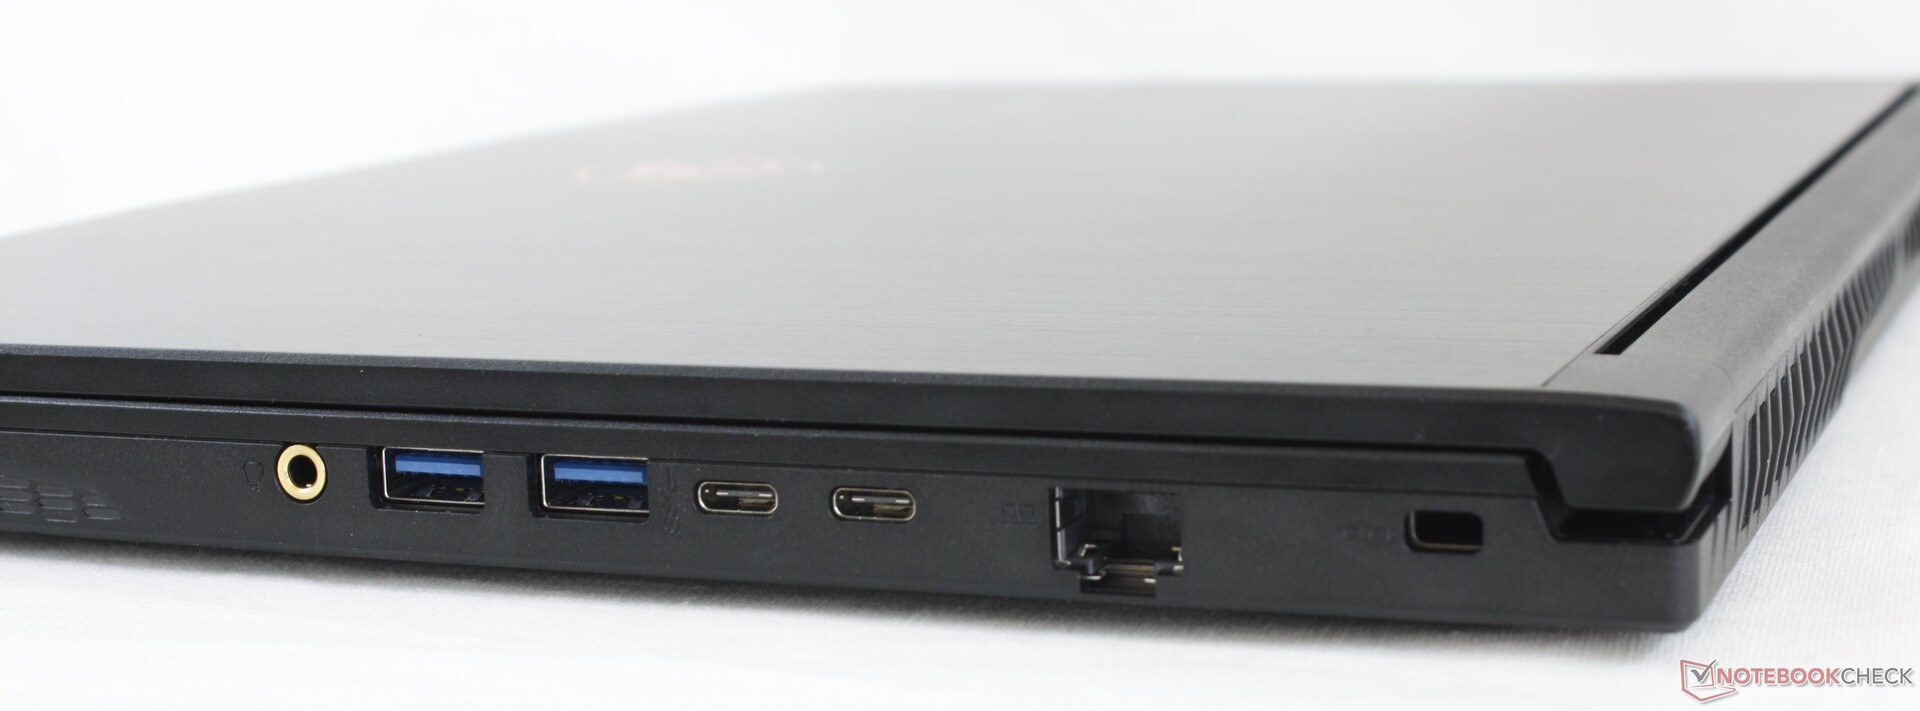
Connectivity
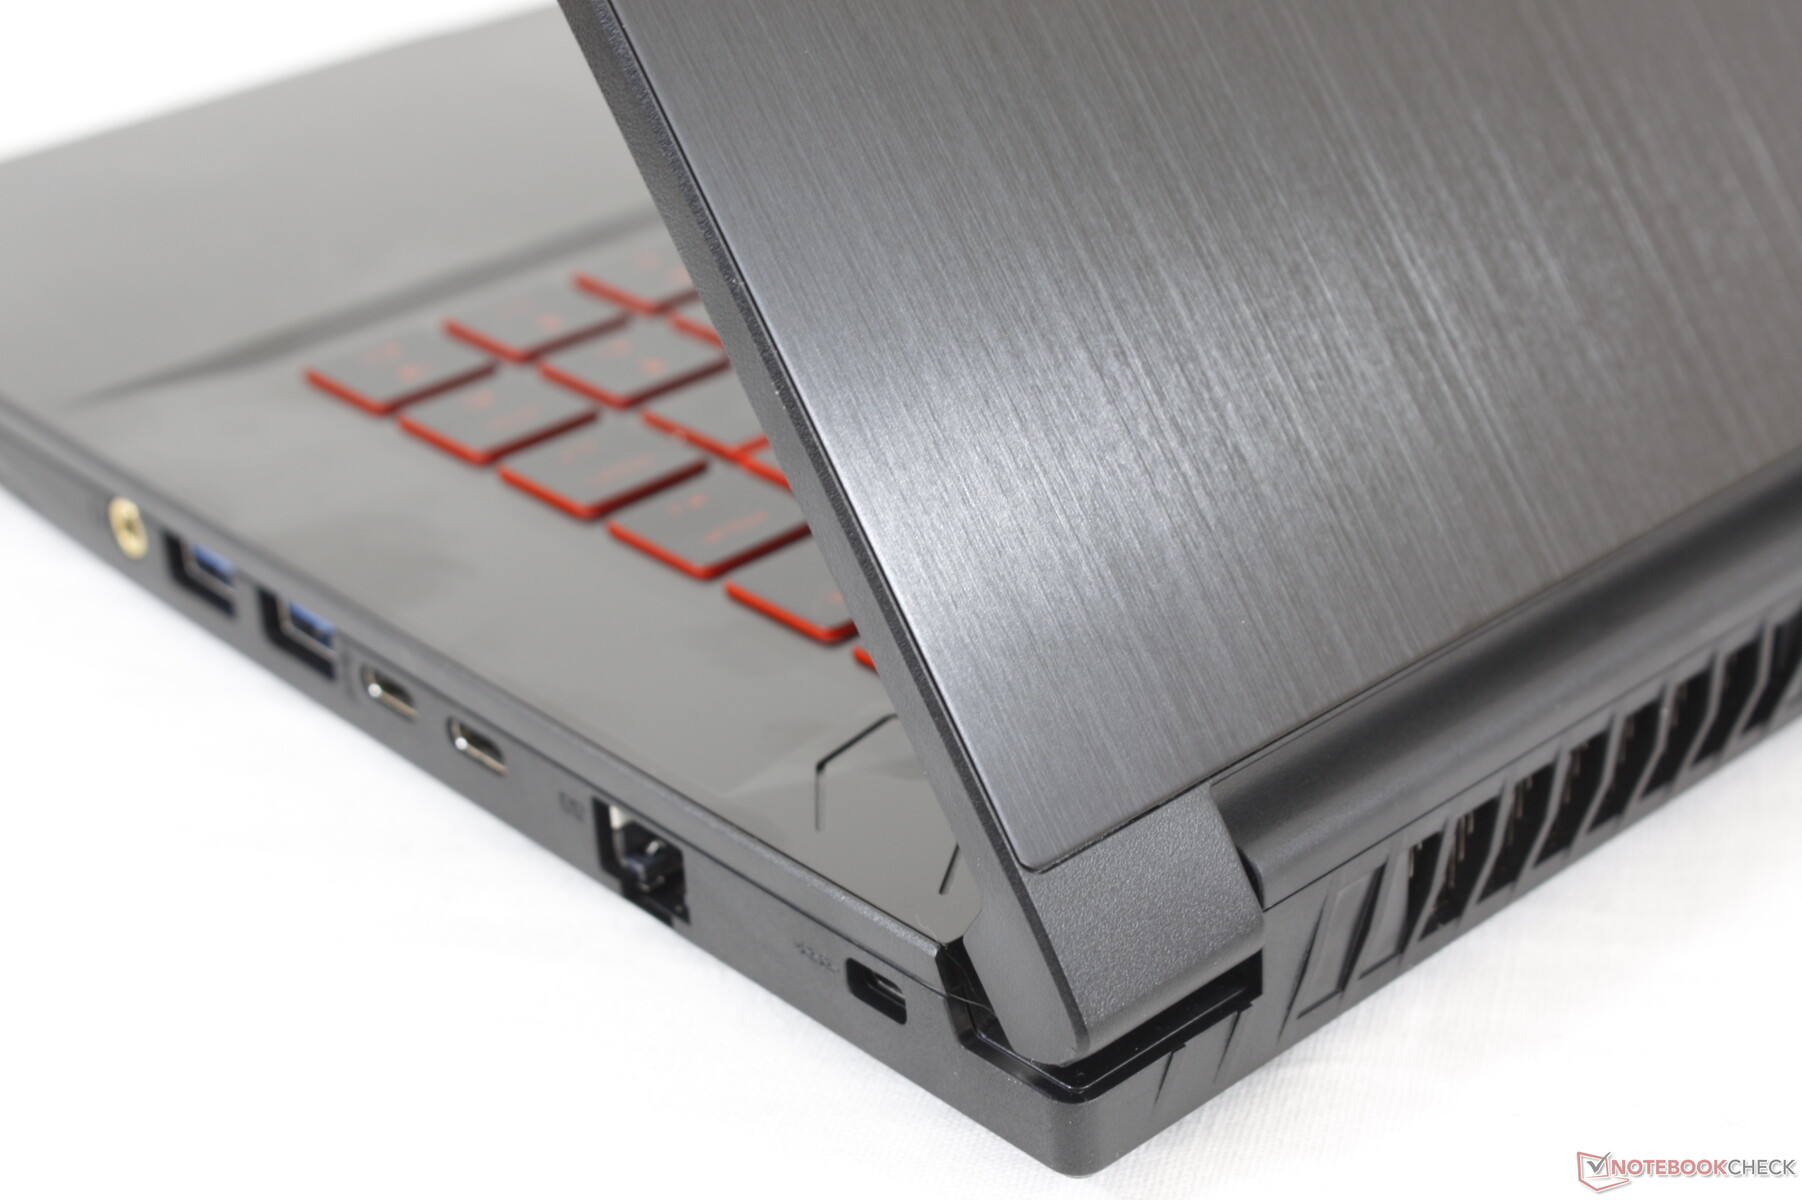
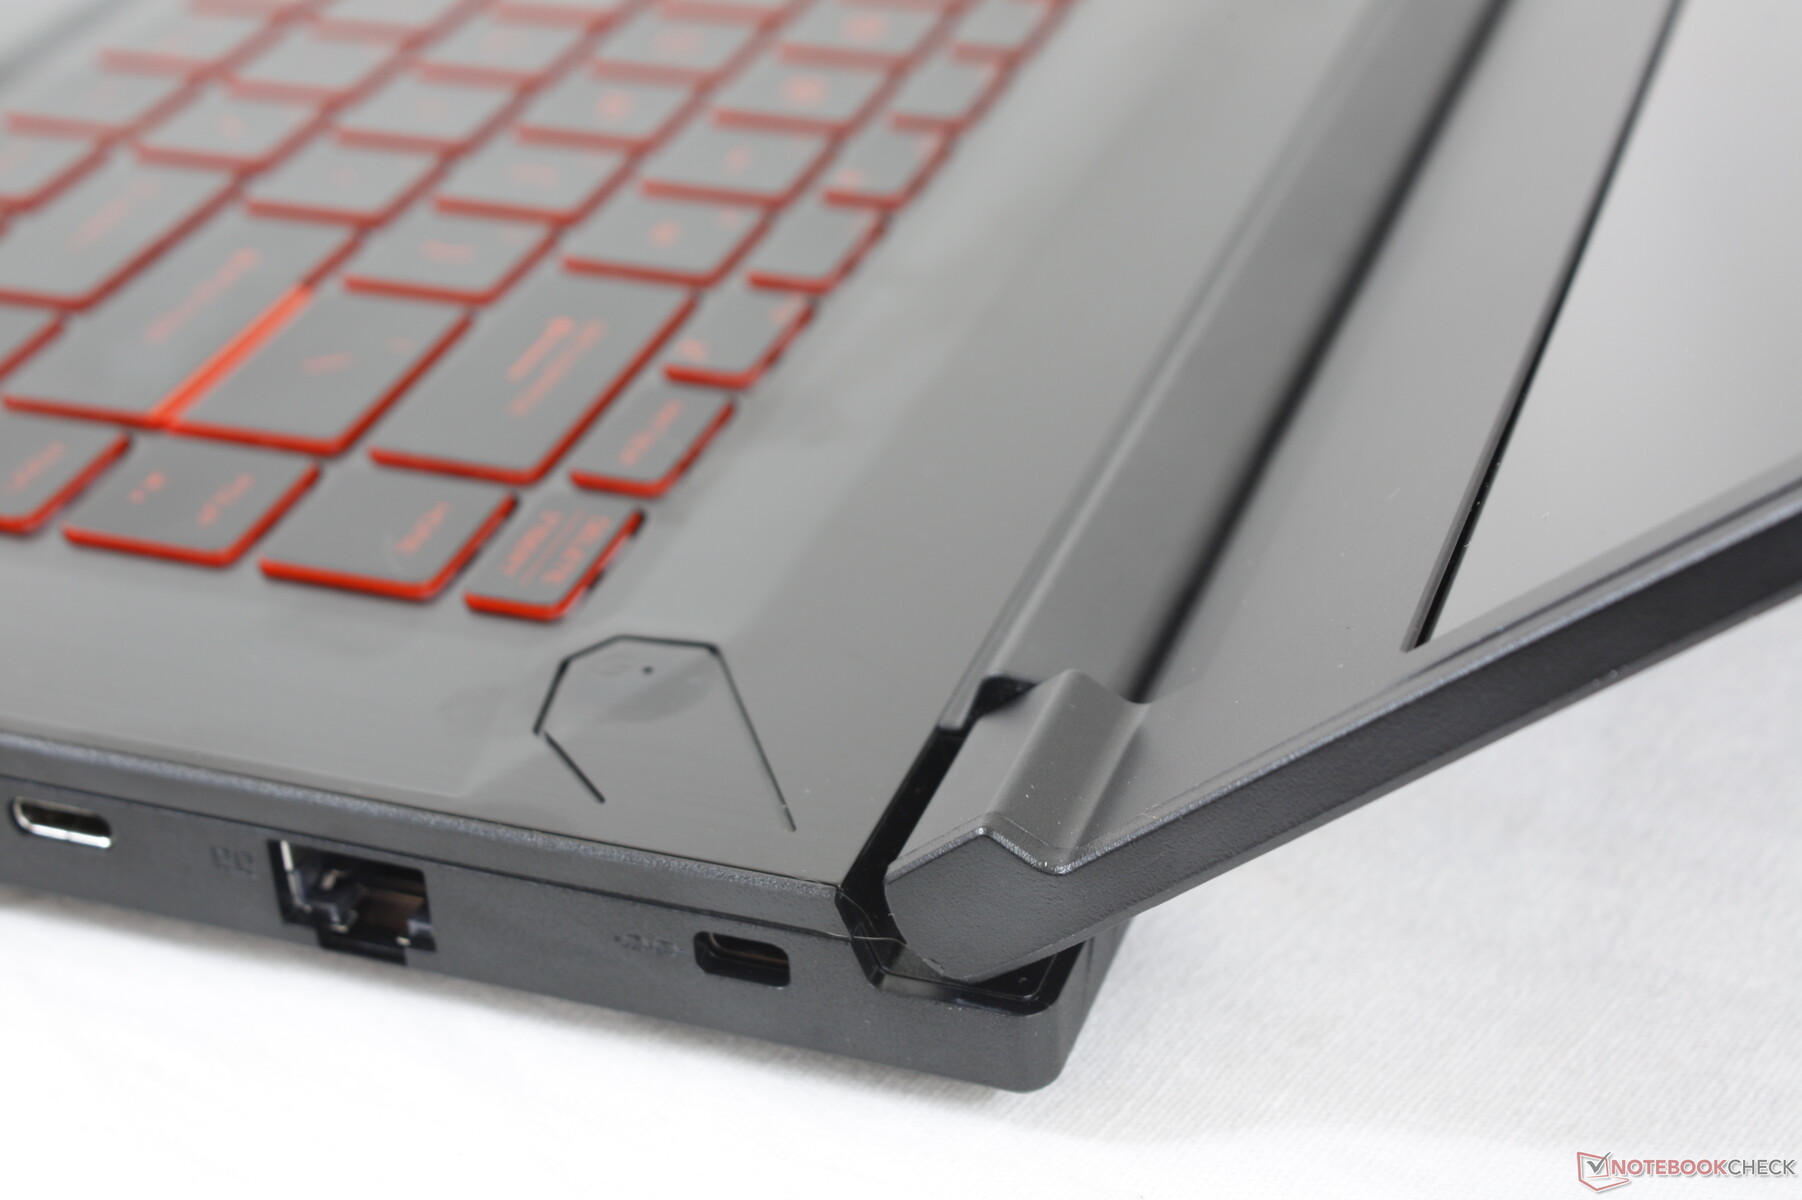
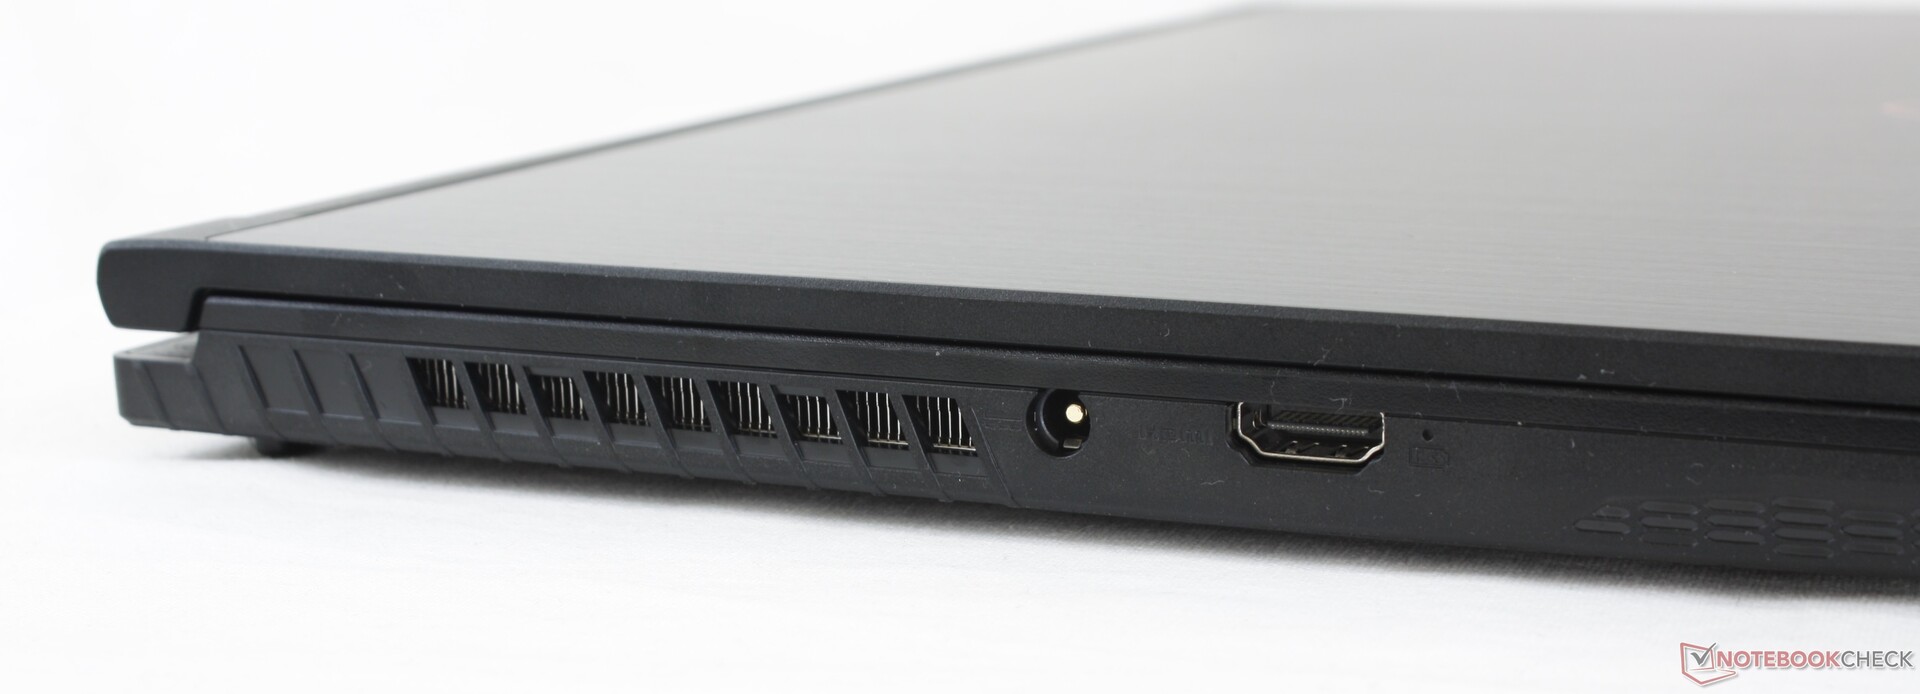
Port options remain identical except for one notable change: the HDMI 1.4 port on last year's GF65 9SD has been updated to HDMI 2.0 for full 4K60 FPS external monitor support. The USB-C ports continue to be incompatible with external monitors, however.
Communication
Built-in wired and wireless communication modules, alternative solutions available (UMTS)?, Irregularities (radio reception)?
Webcam


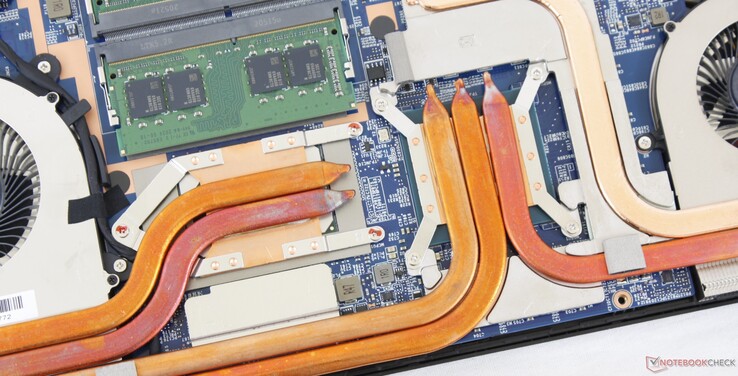
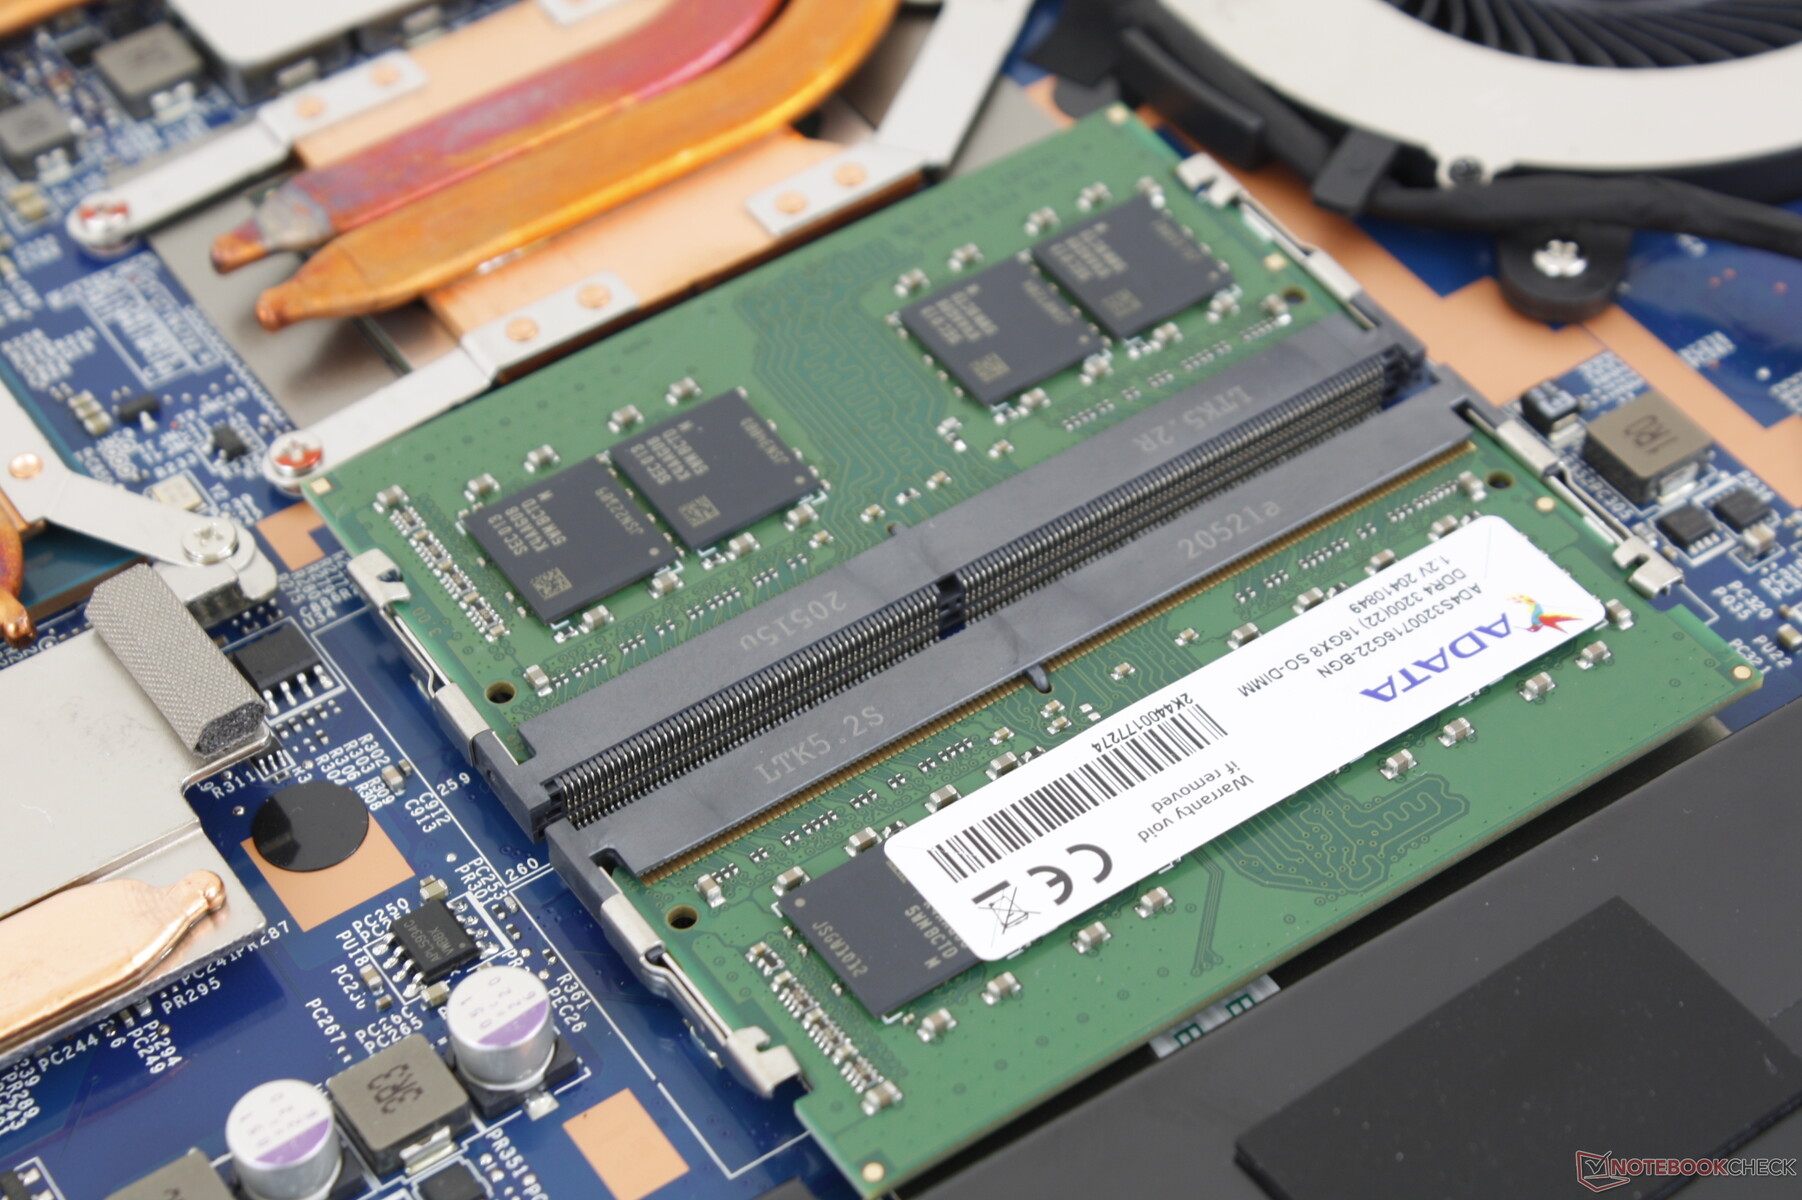
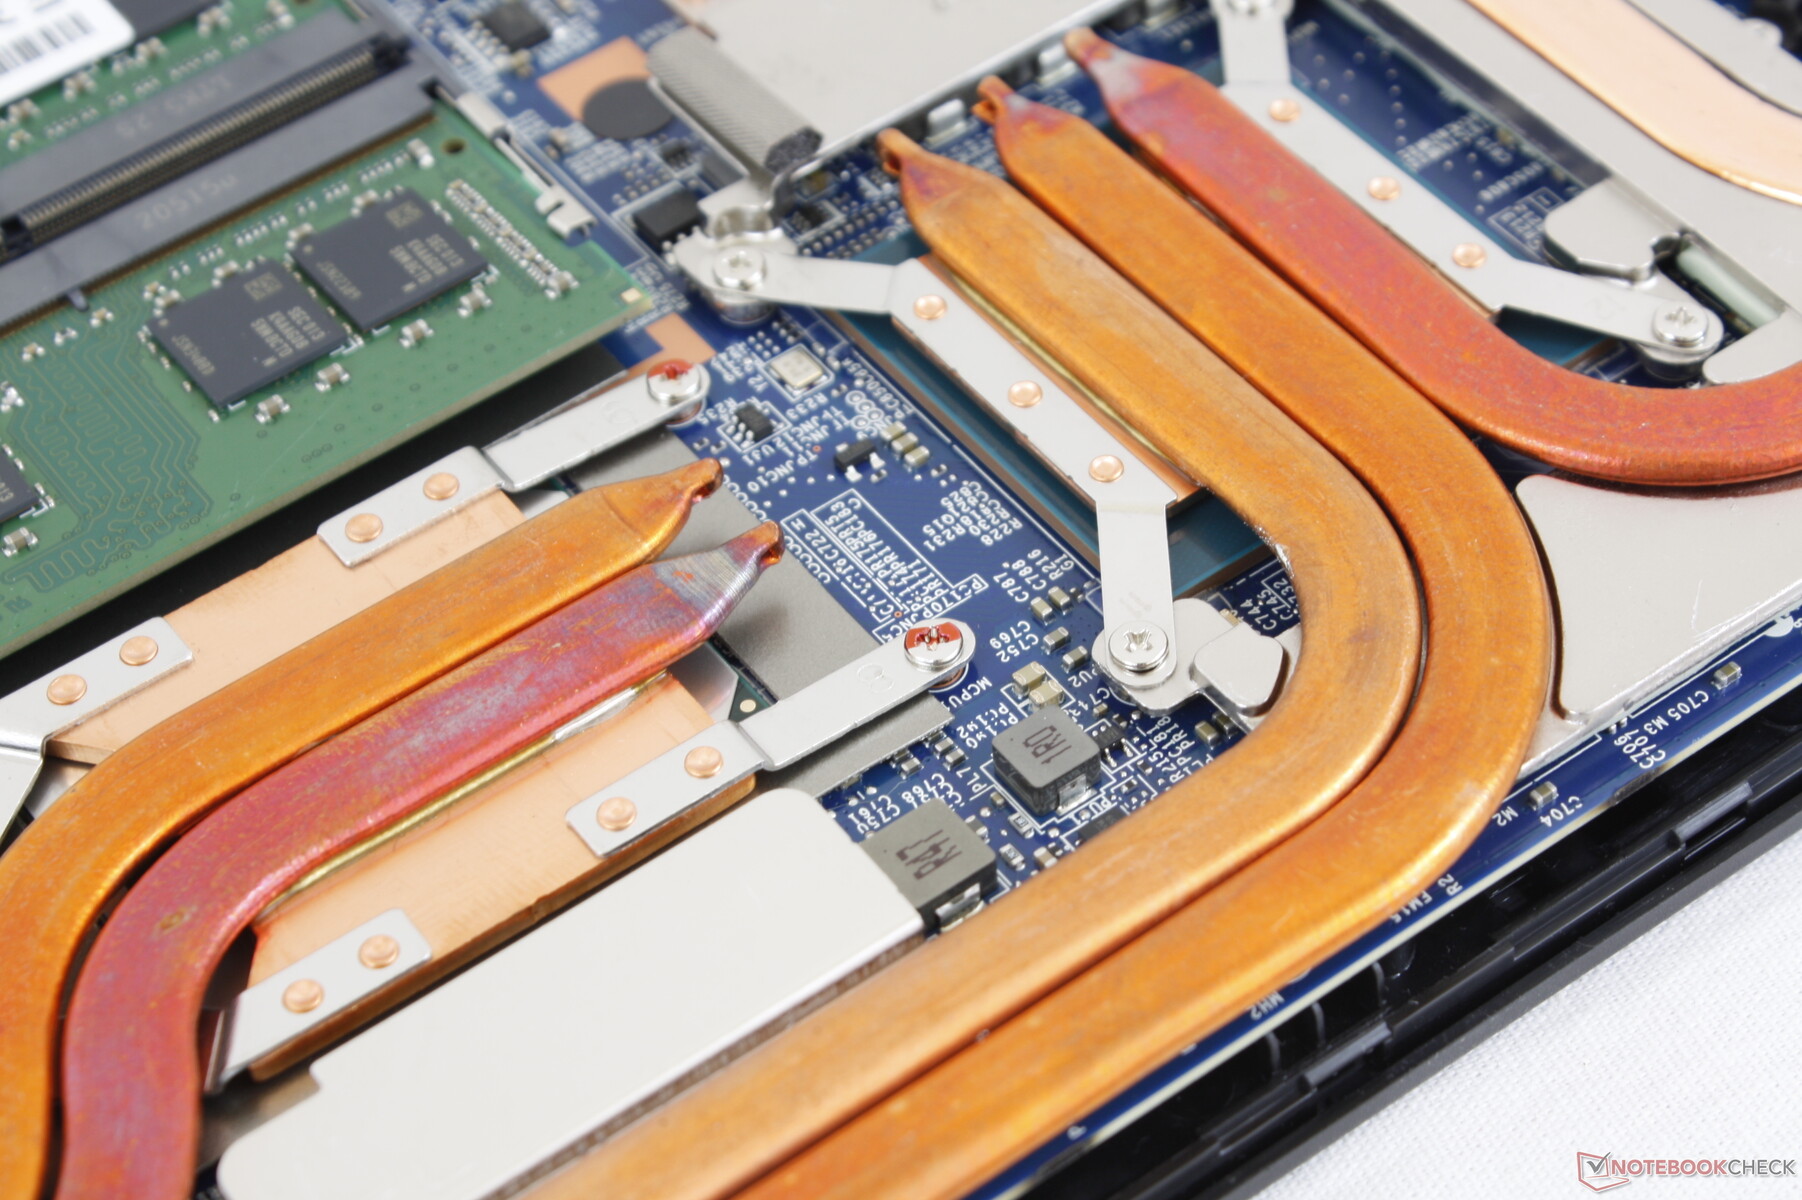
Maintenance
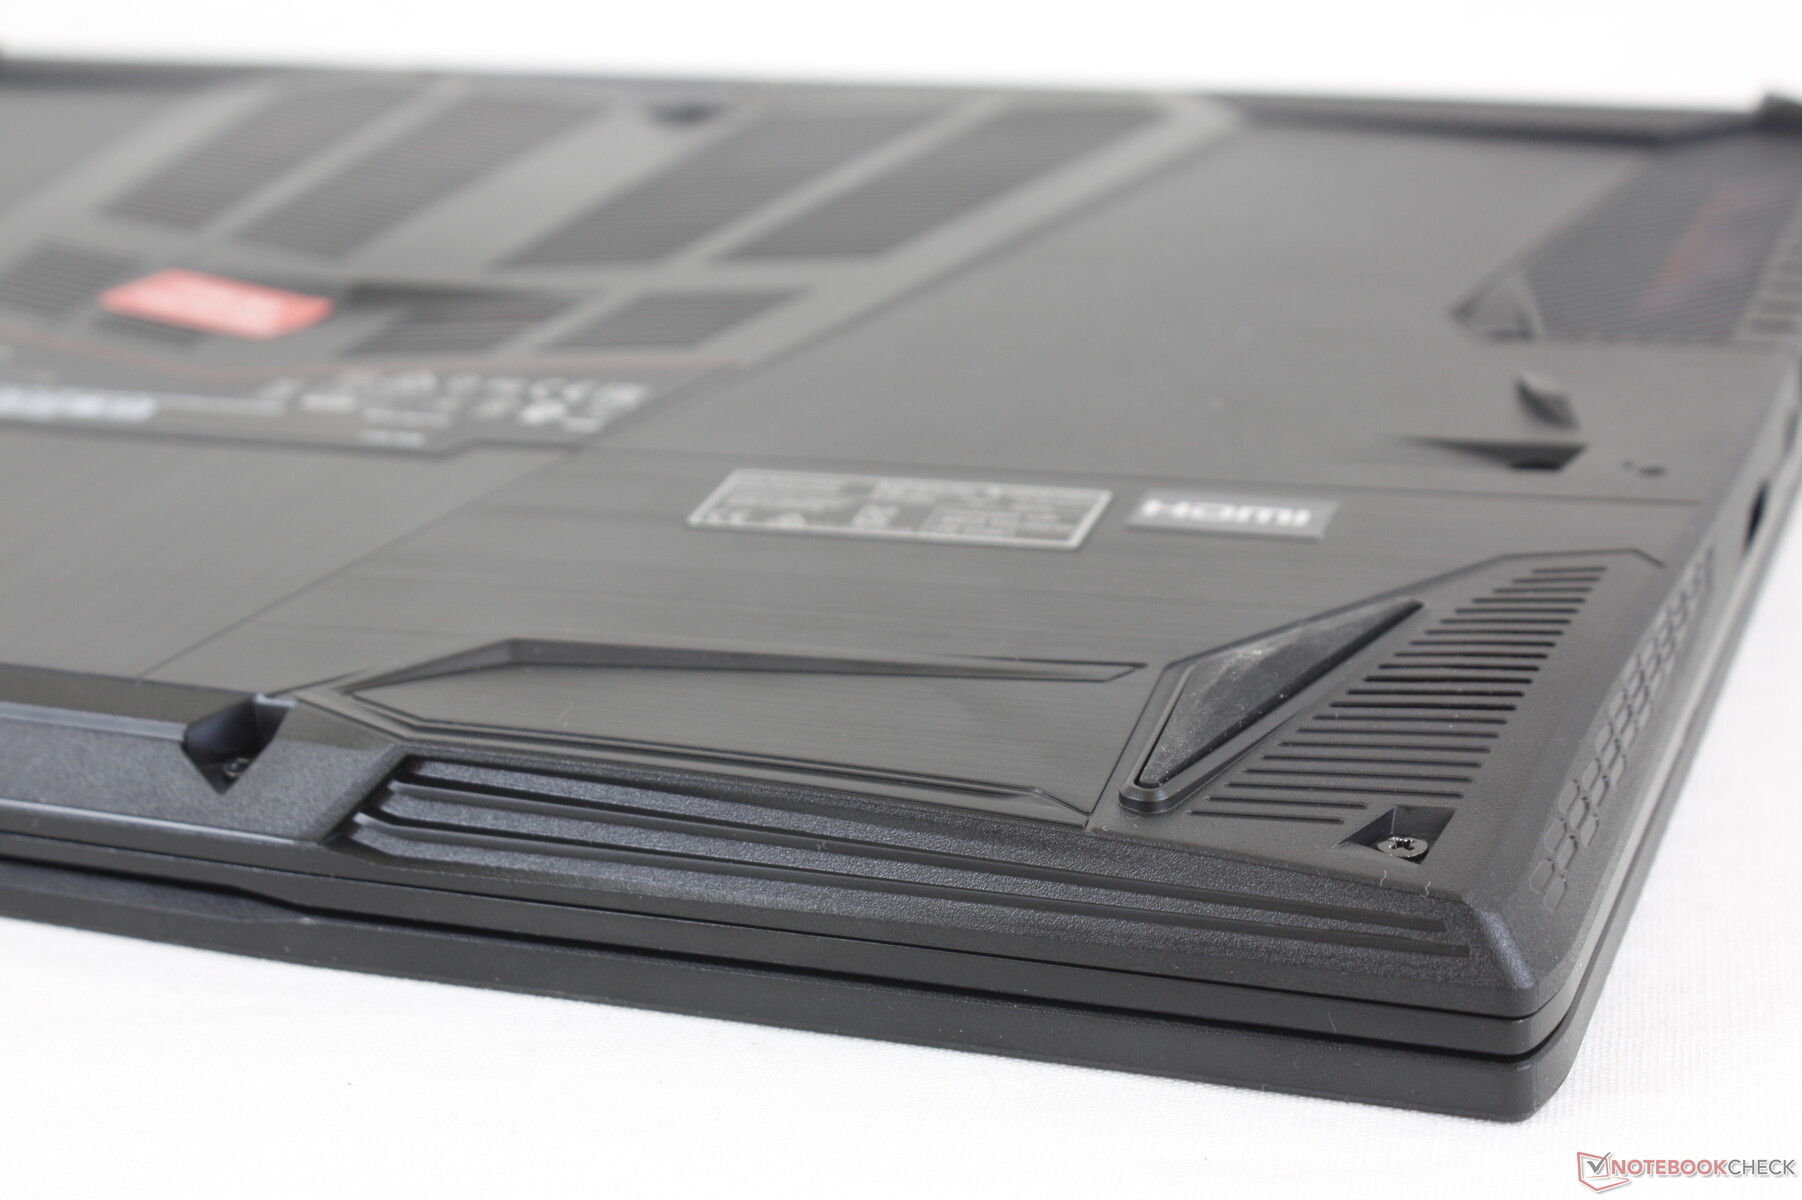
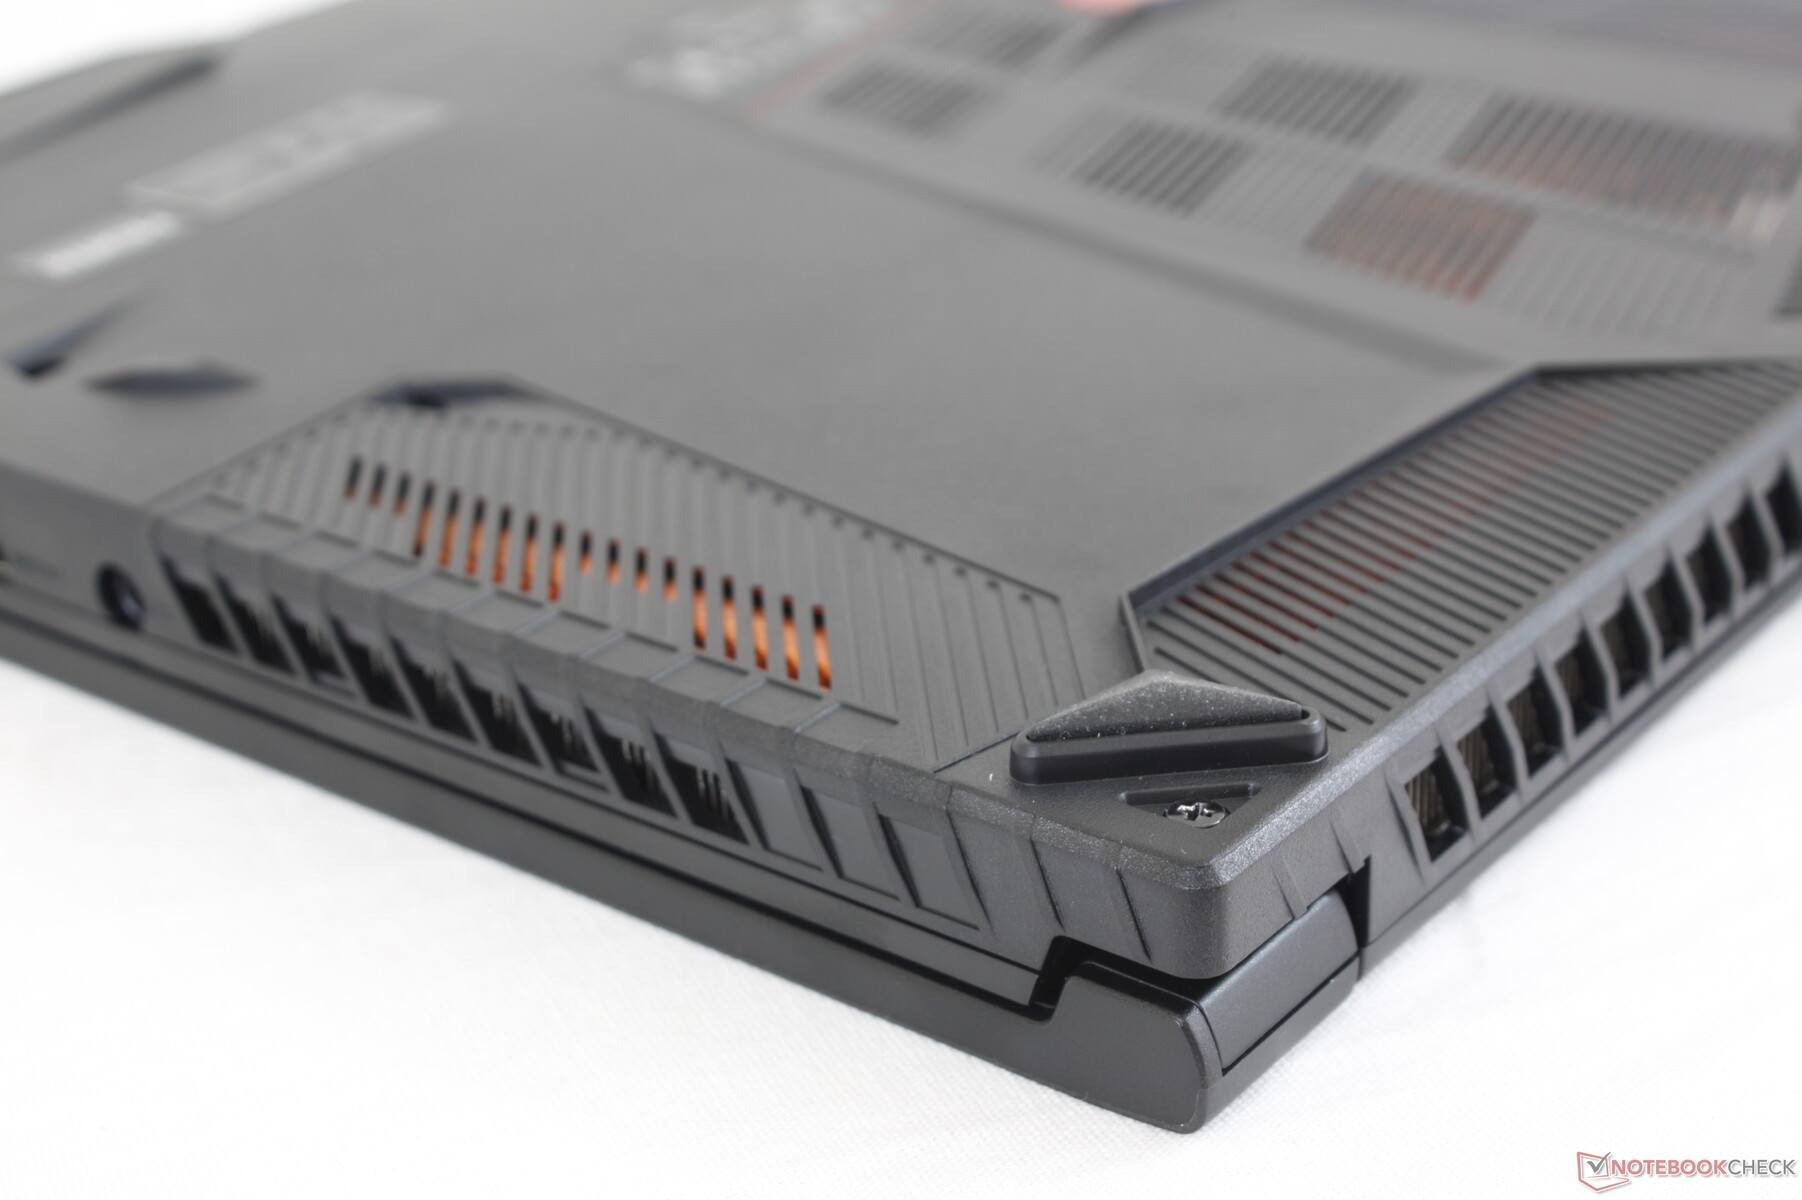
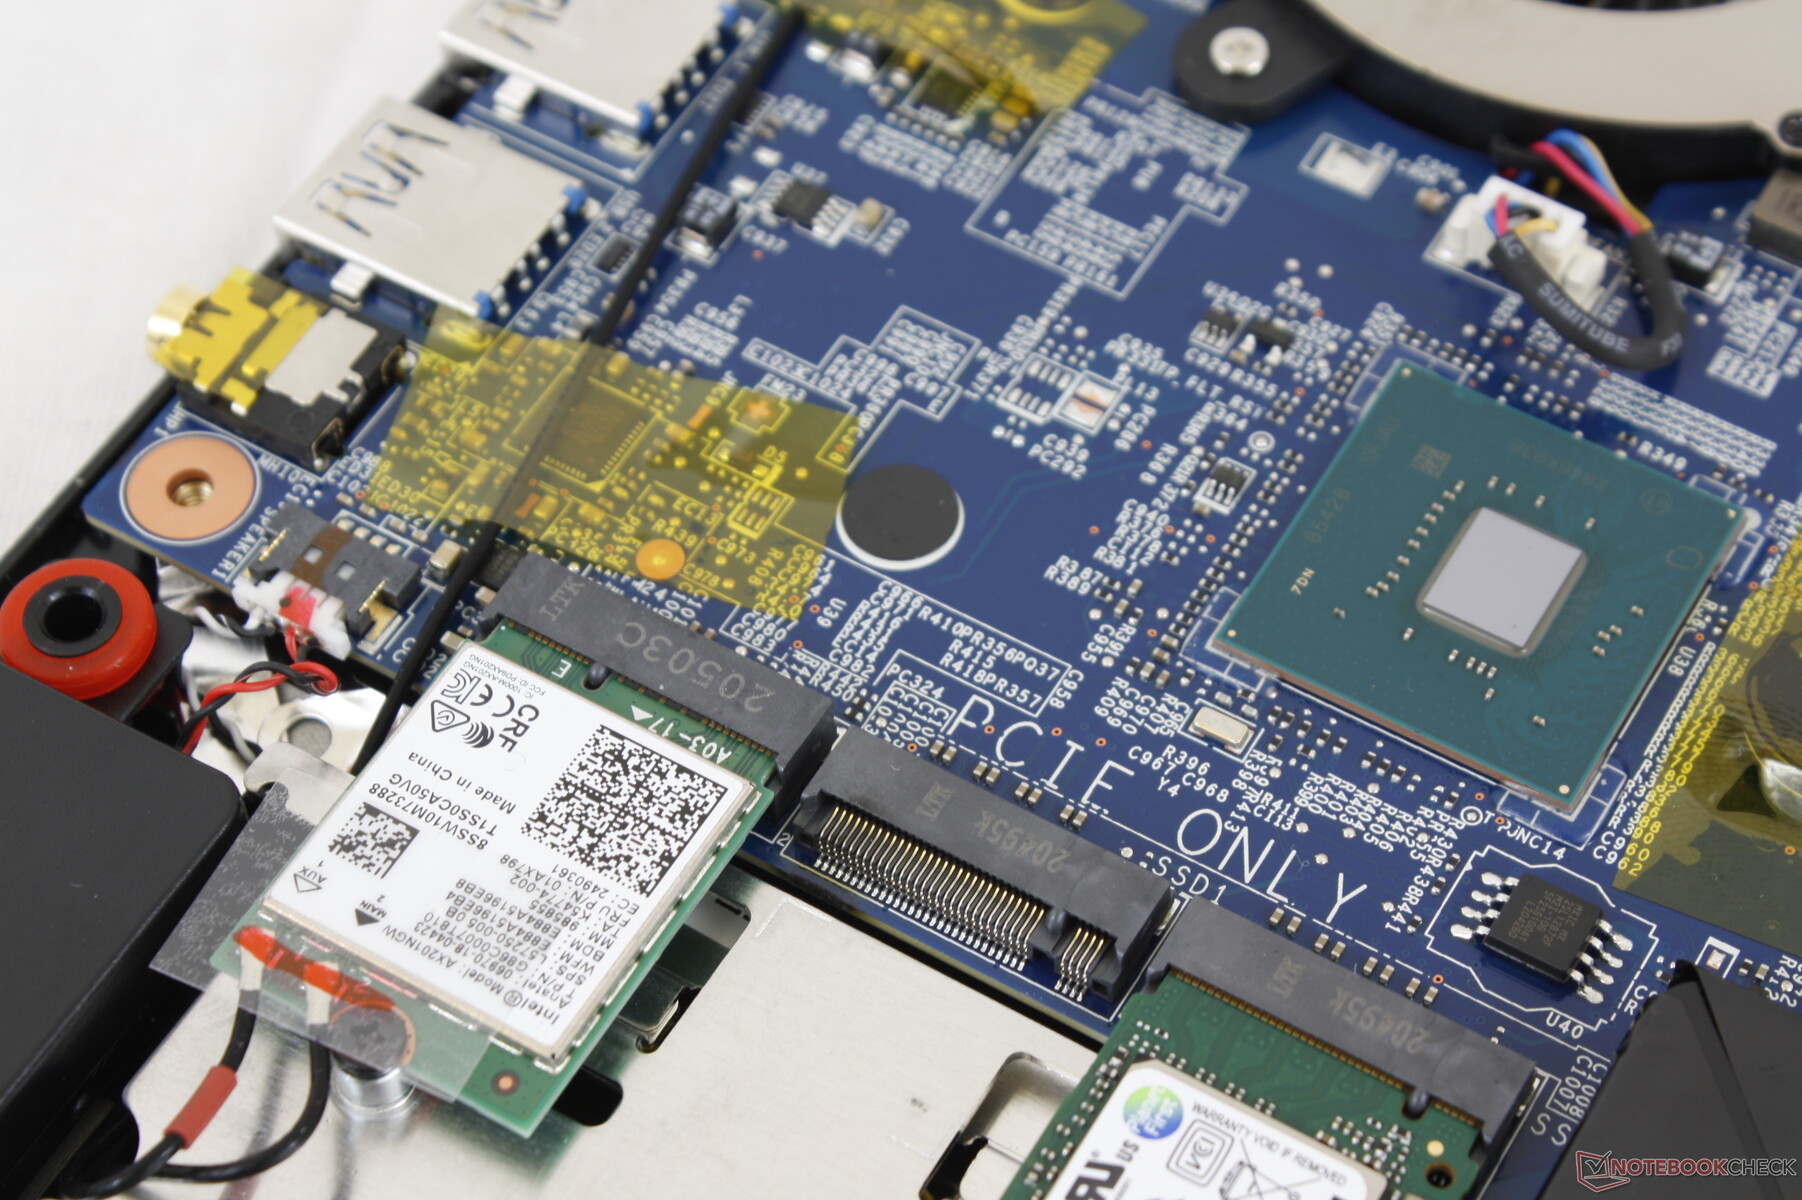
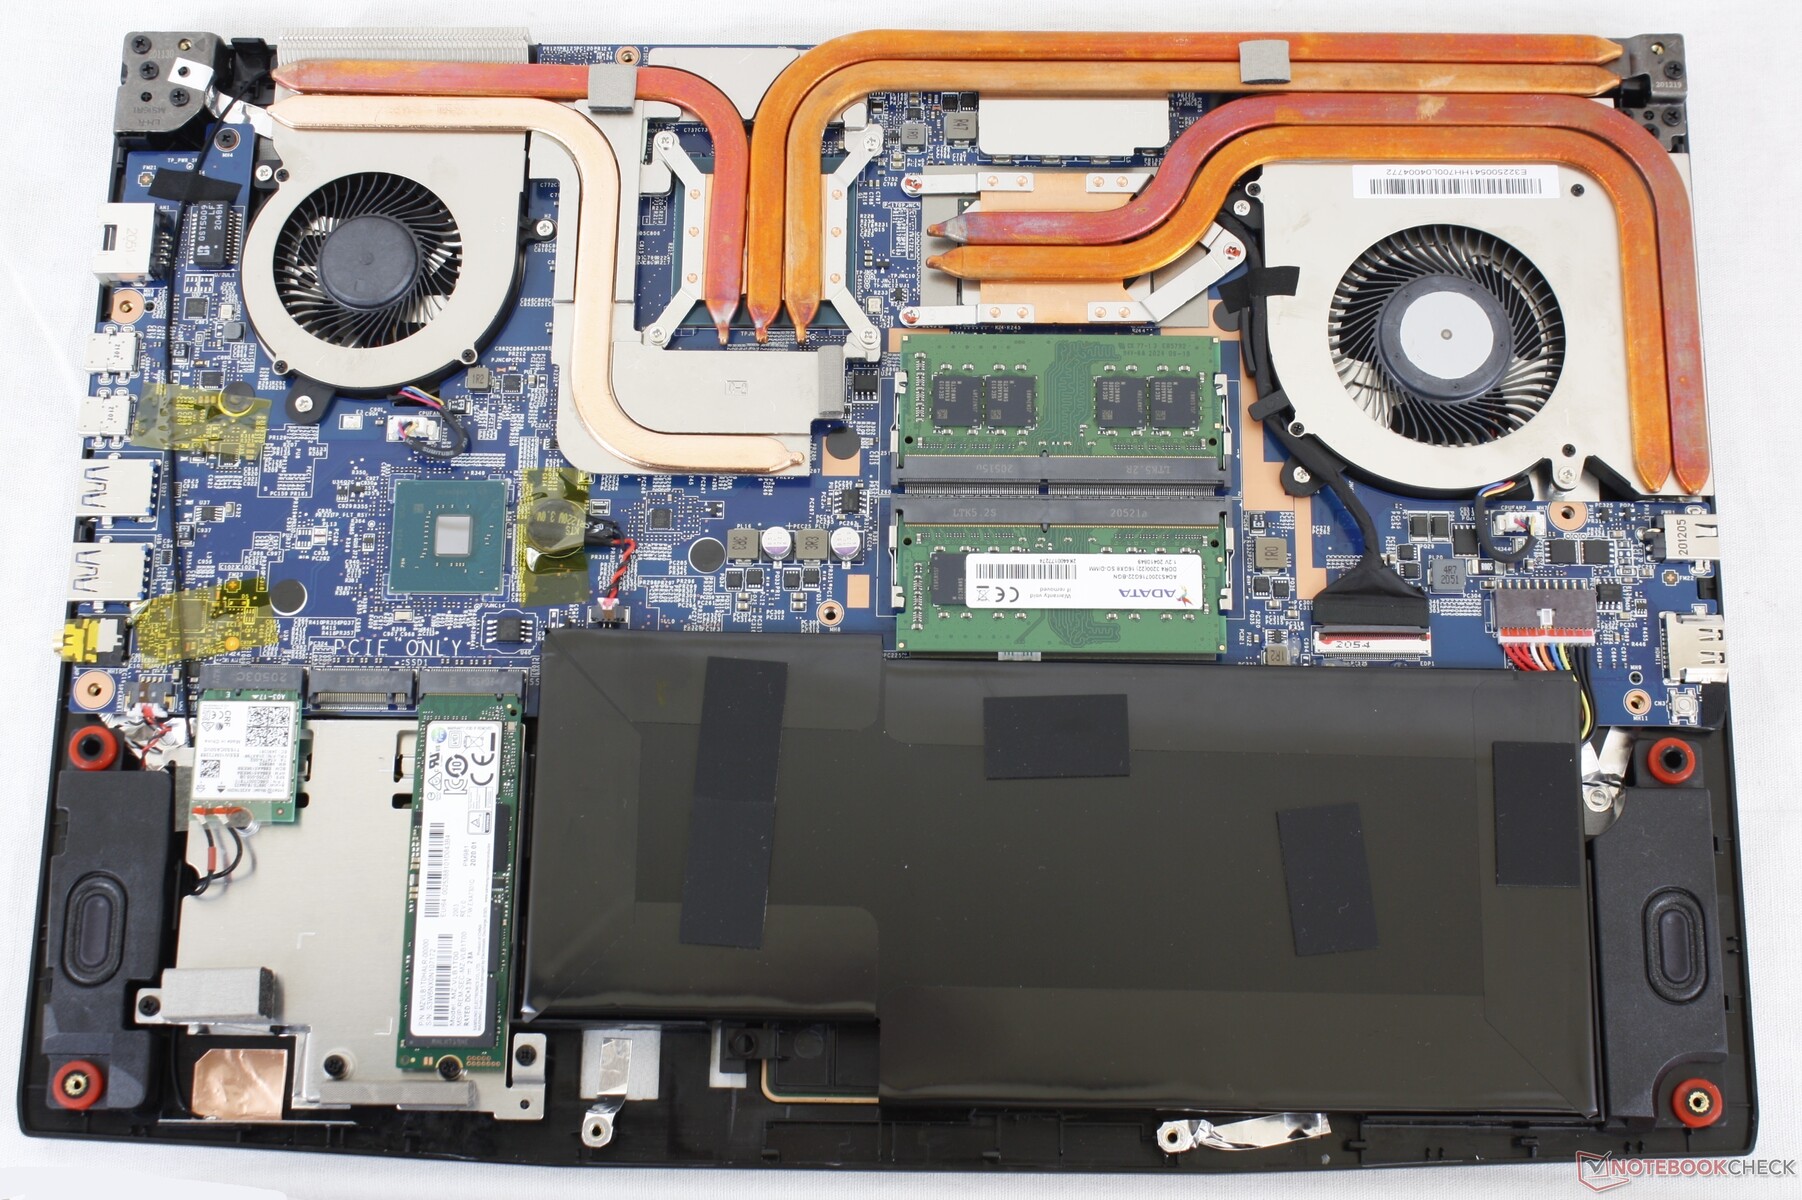
Servicing requires only a Philips screwdriver for relatively easy upgrades. Owners should be careful when removing the bottom panel as the audio jack can get stuck along the edge.
Accessories and Warranty
There are no extras in the box beyond the usual AC adapter and paperwork. The standard one-year limited warranty applies while any components installed by CUKUSA, like RAM or storage, will have three-year coverage instead.
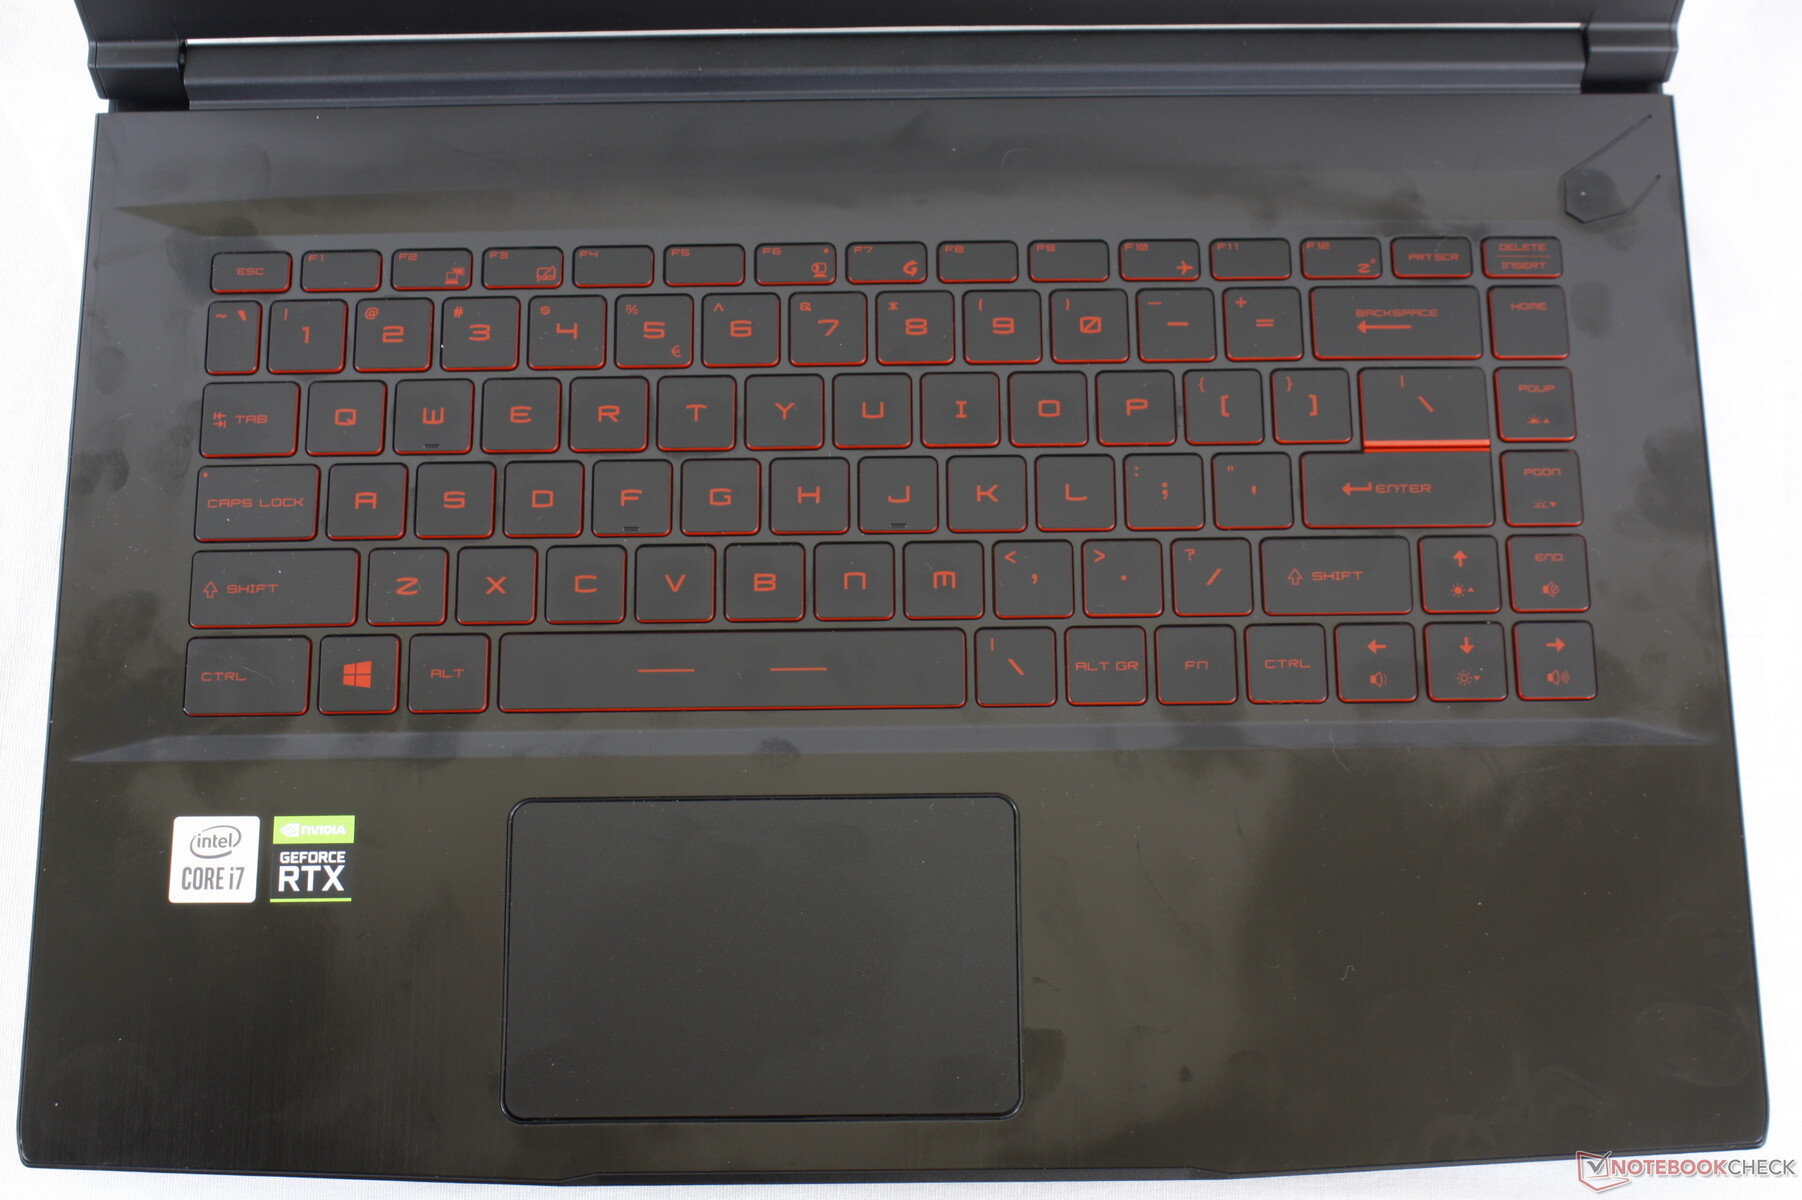
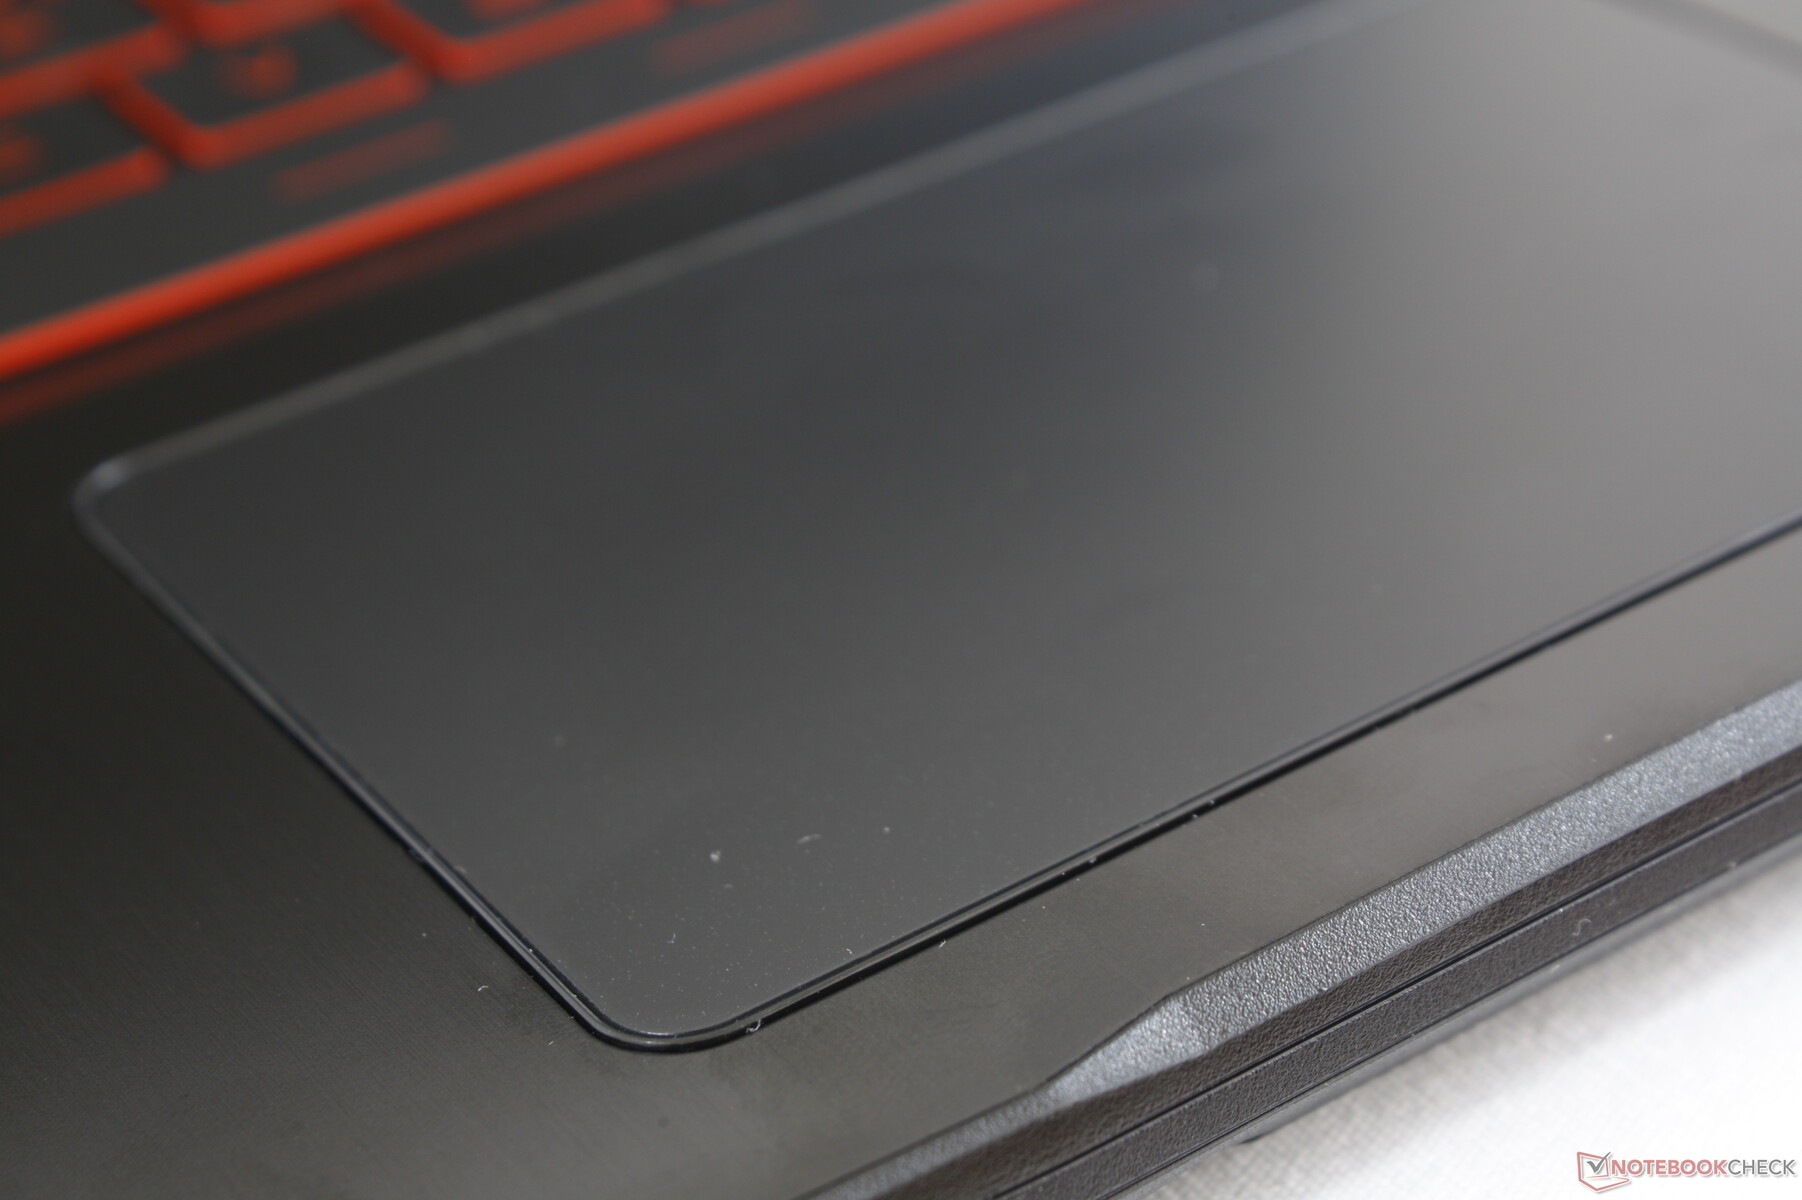
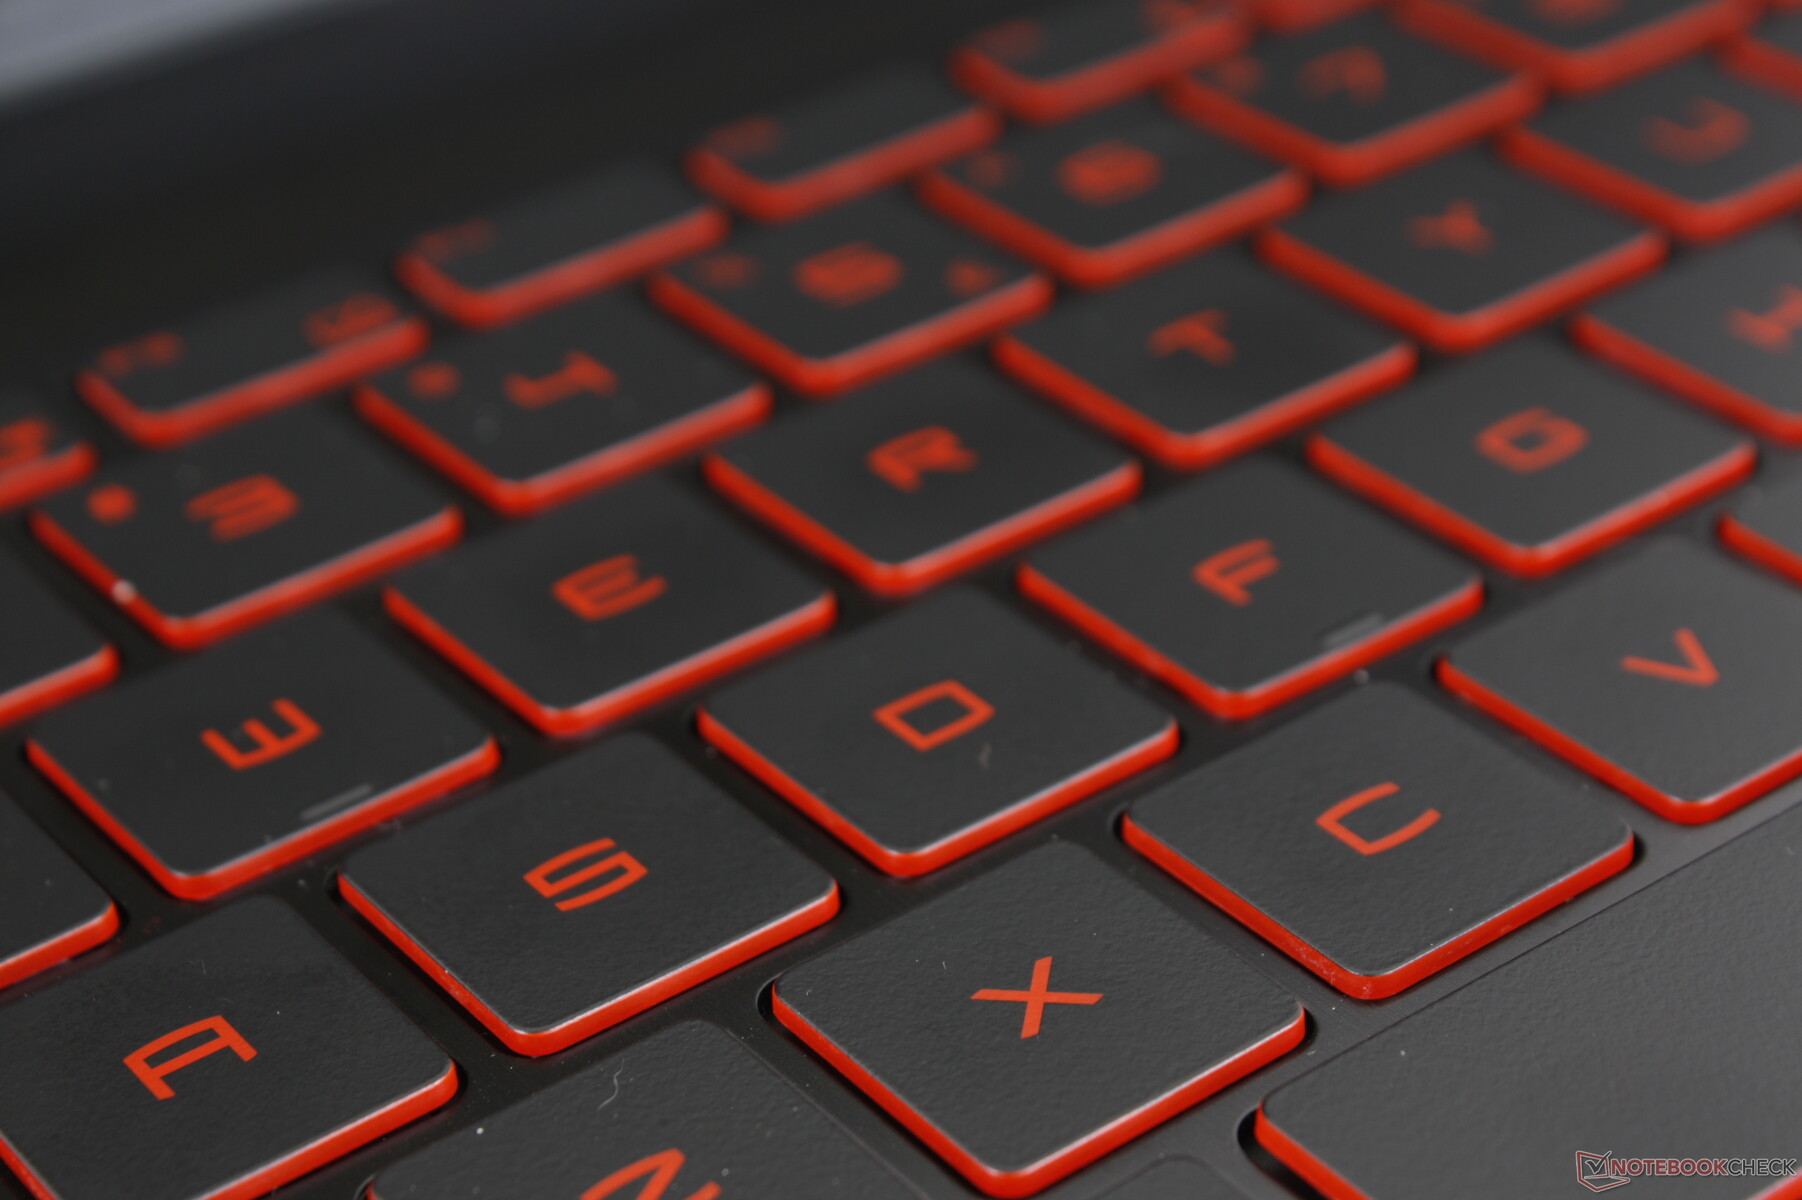
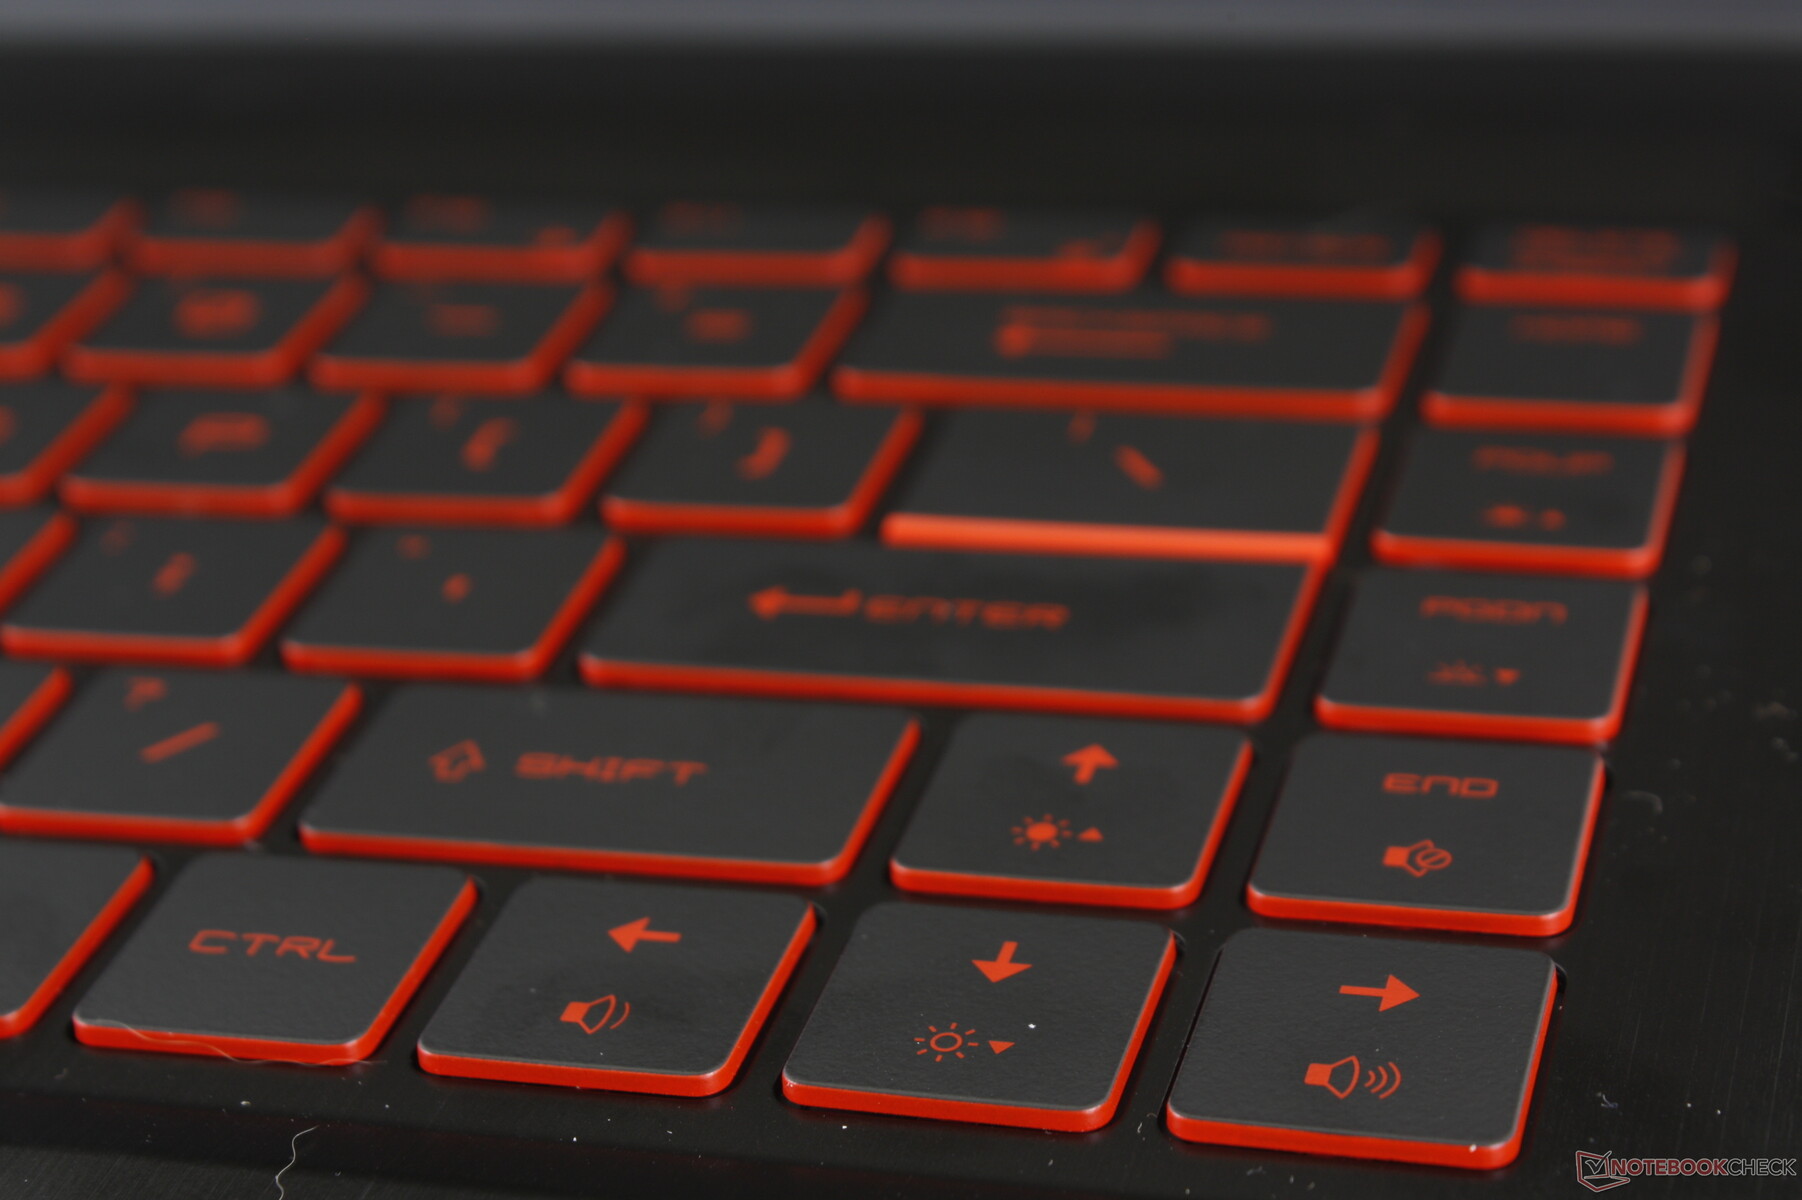
Input Devices
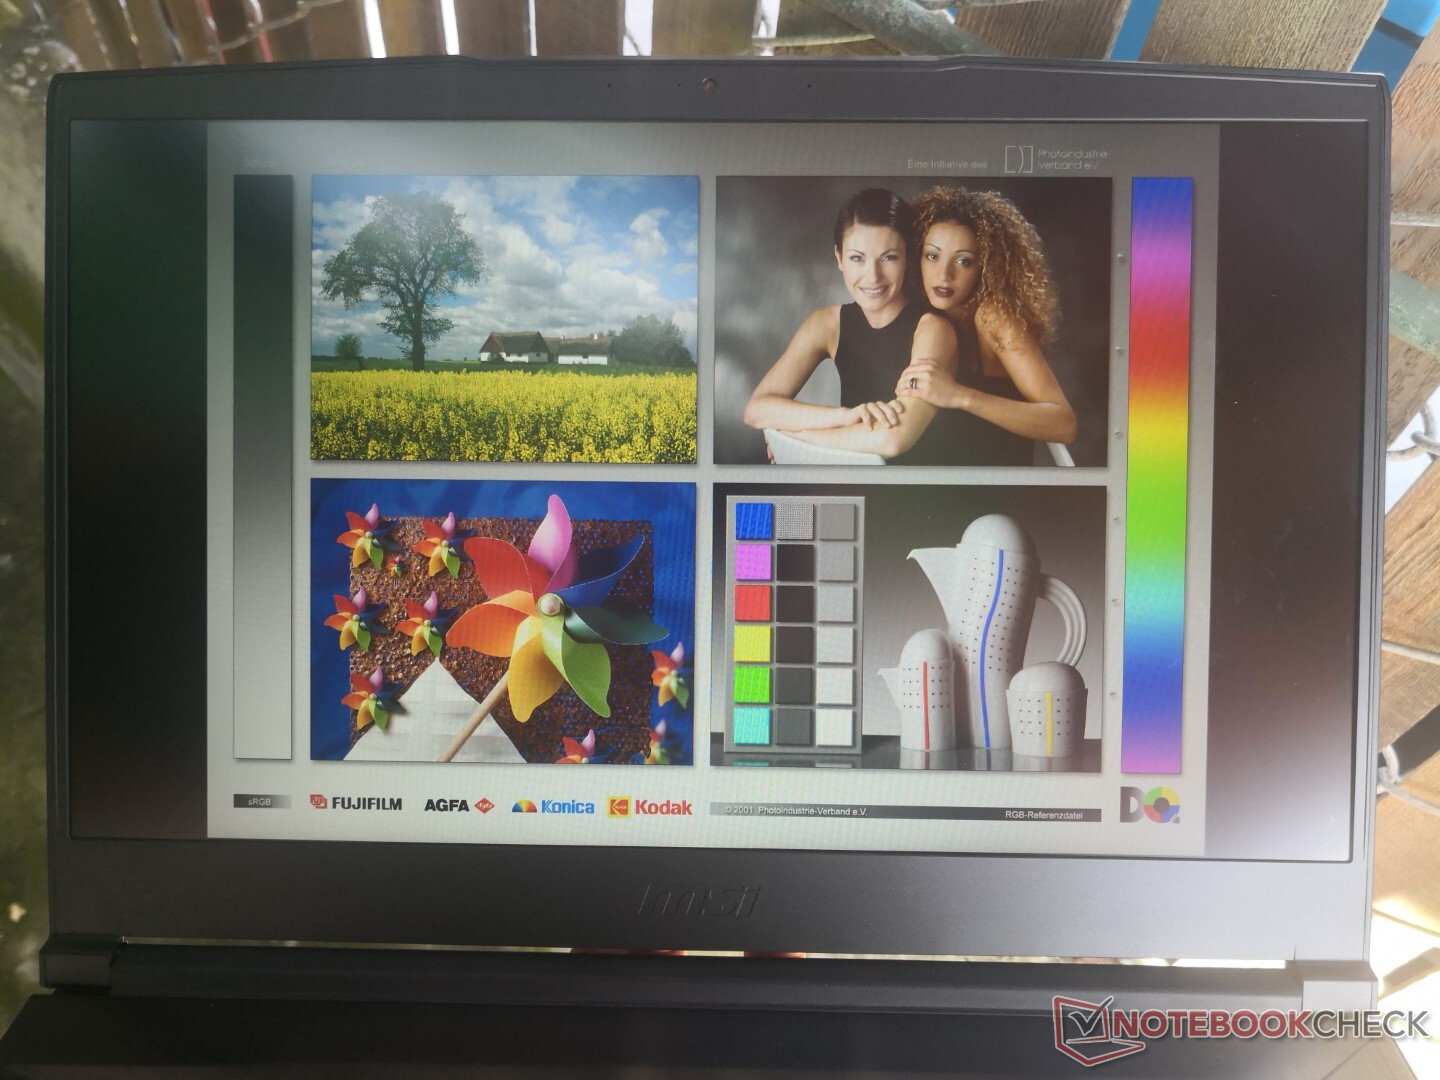
Display
The GF65 10UE uses a different AU Optronics panel from the older GF65 9SD (AUO B156HAN08.4 vs. AUO B156HAN13.0) with the main difference between them being refresh rate (144 Hz vs. 120 Hz). Other than that, the panels are almost identical including their average black-white response times and below-average gamut. Contrast is quite high at over 1000:1, but the limited color reproduction diminishes this advantage.
Subjectively, the display is buttery smooth for gaming and general usage — just be prepared for a little ghosting and don't expect colors to pop.


| |||||||||||||||||||||||||
Brightness Distribution: 91 %
Center on Battery: 266.5 cd/m²
Contrast: 1481:1 (Black: 0.18 cd/m²)
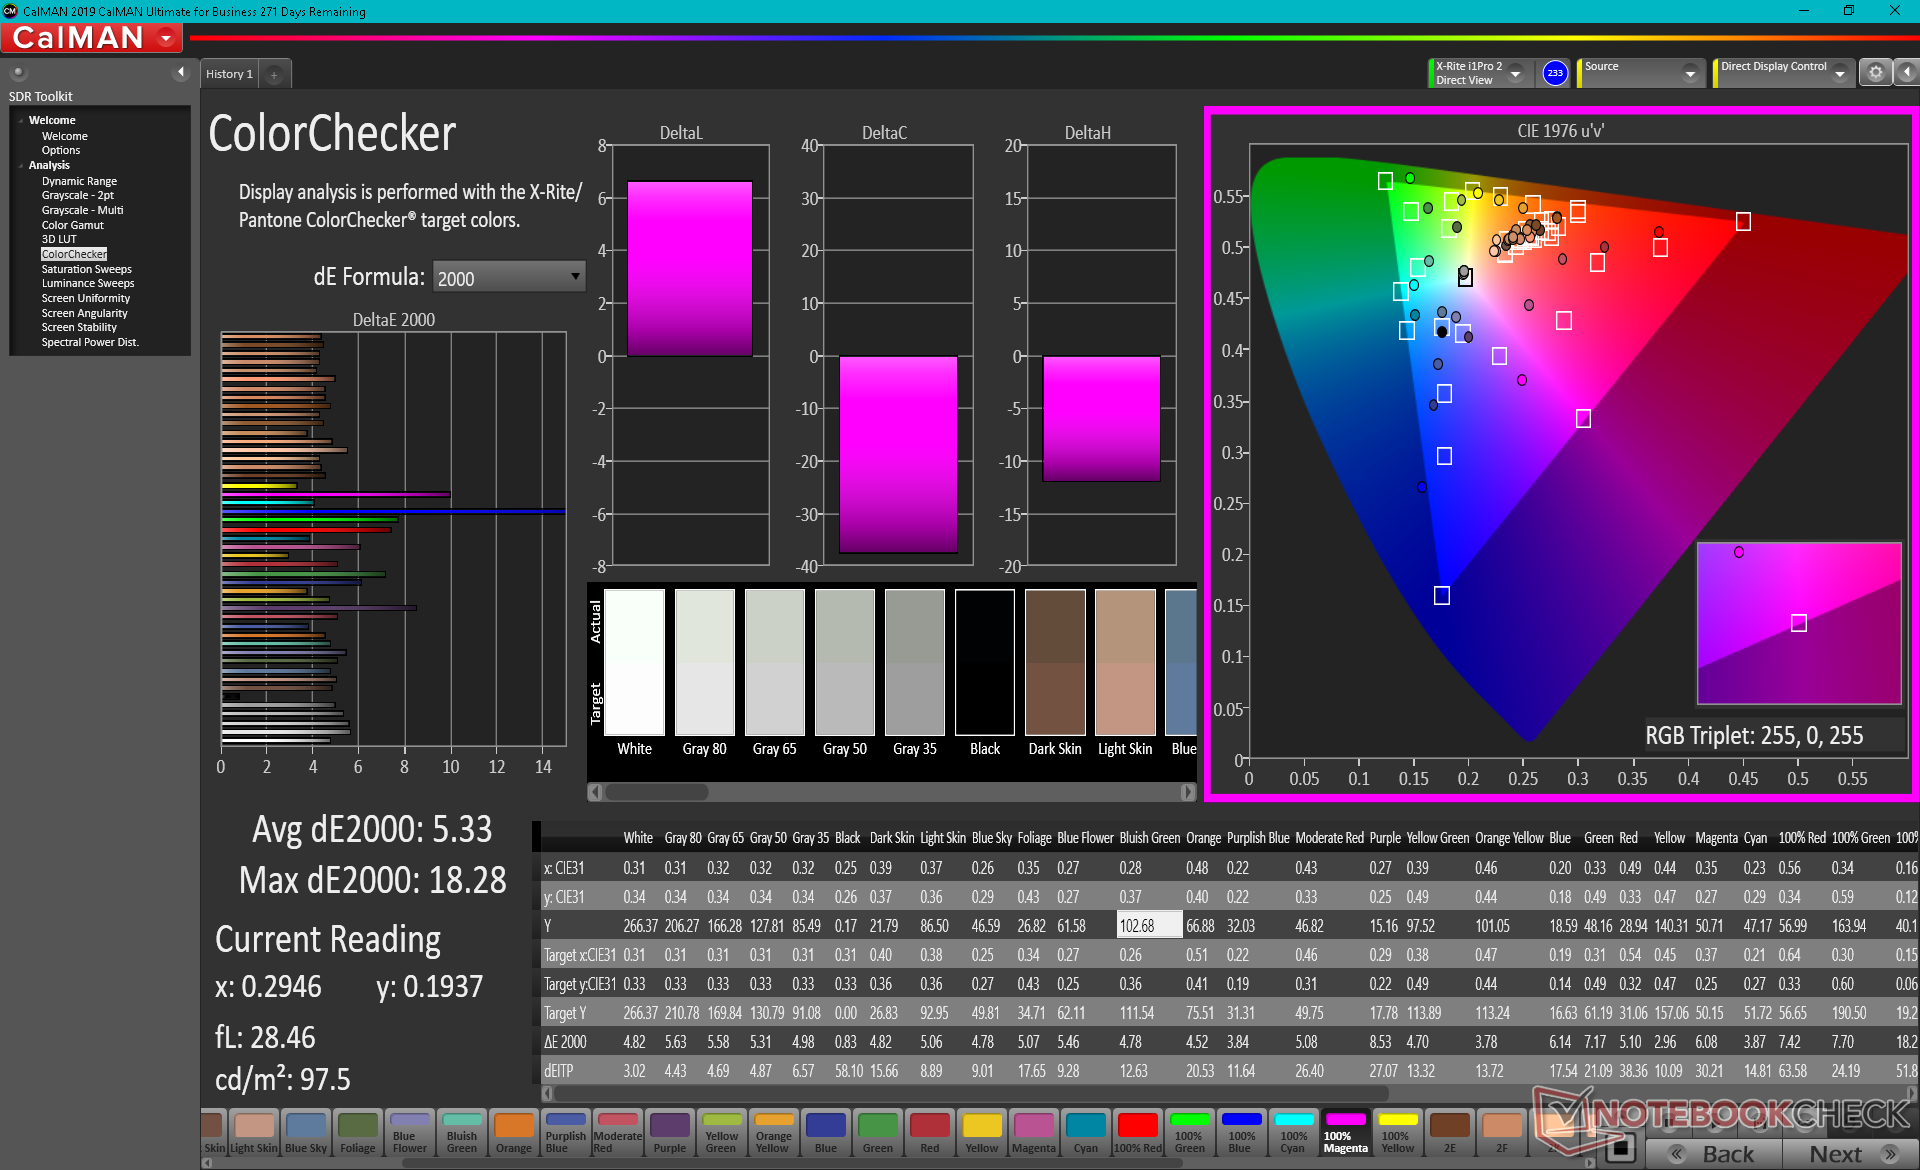
ΔE ColorChecker Calman: 5.33 | ∀{0.5-29.43 Ø4.72}
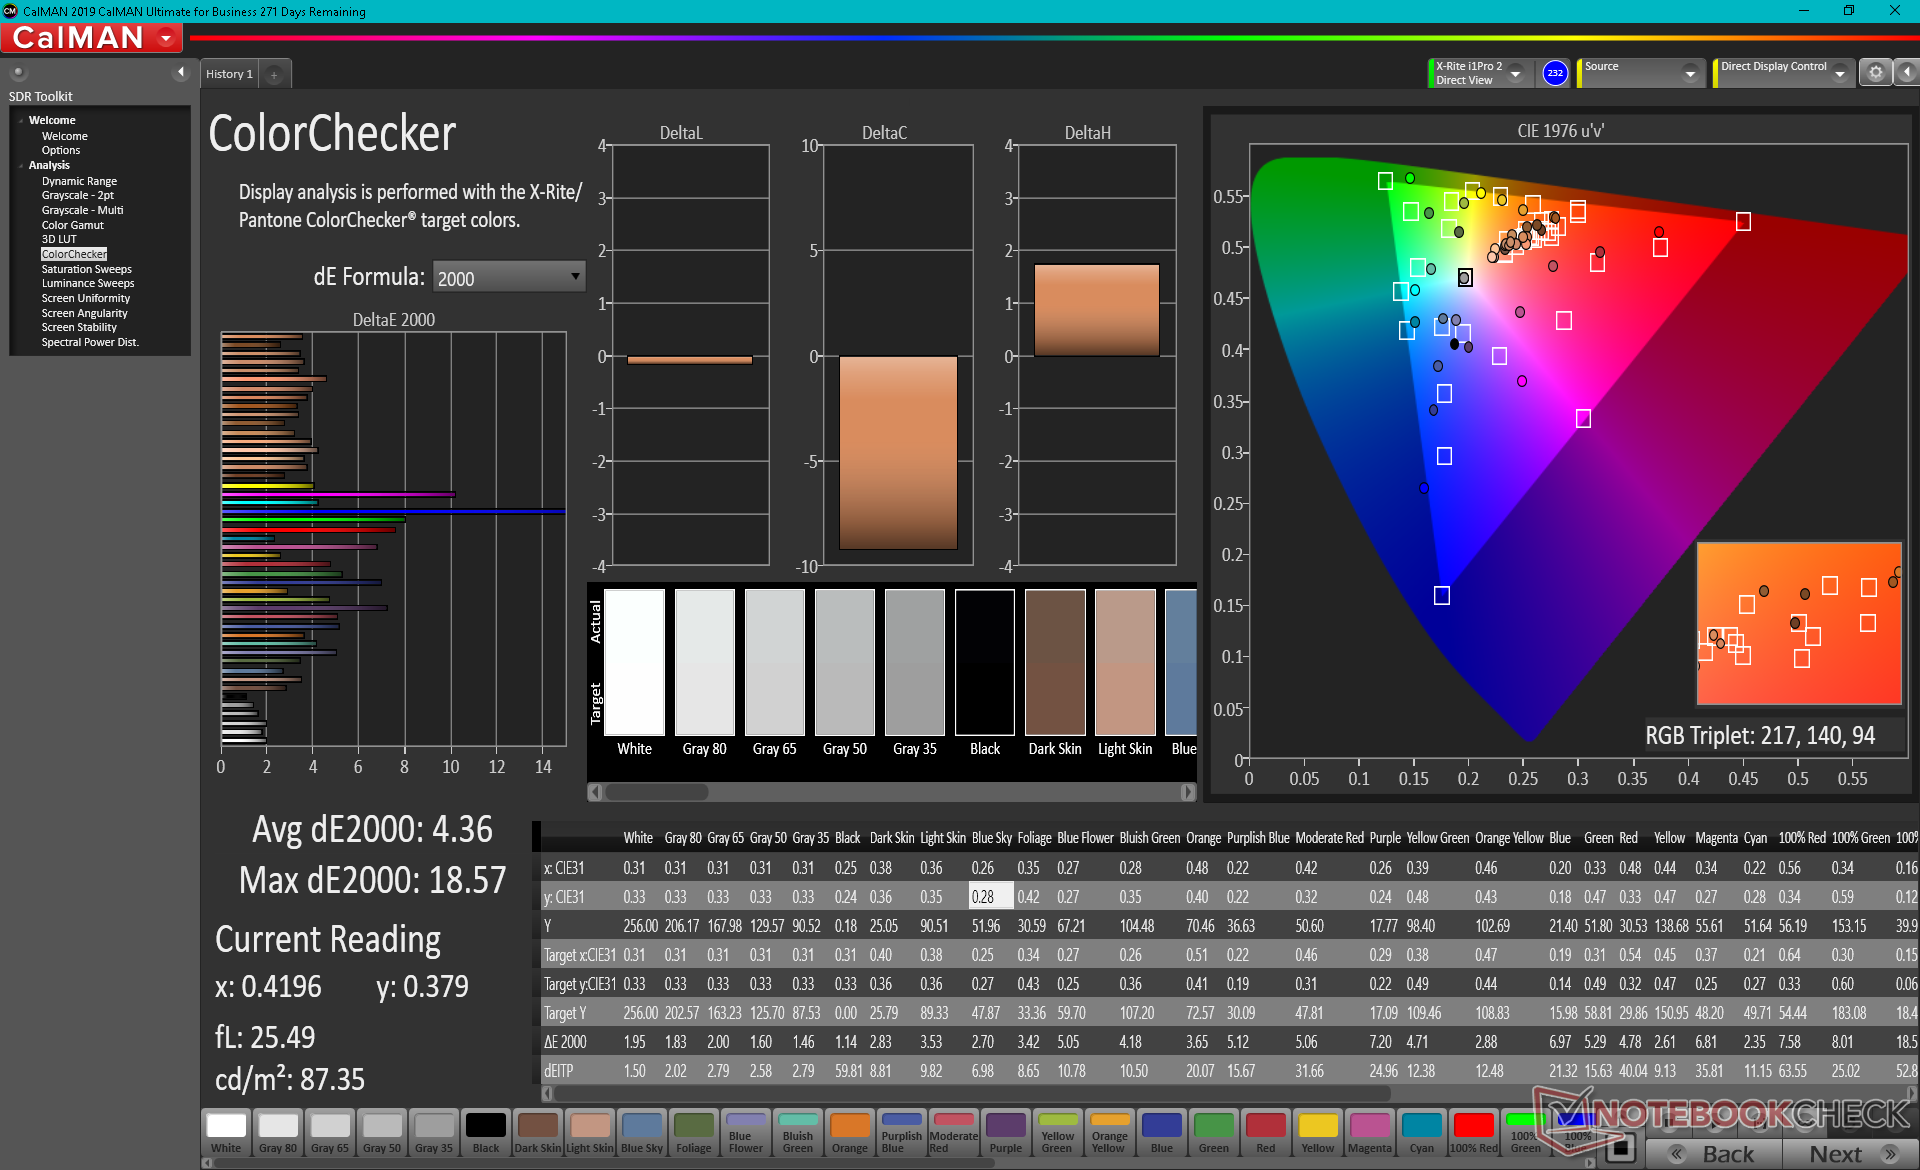
calibrated: 4.36
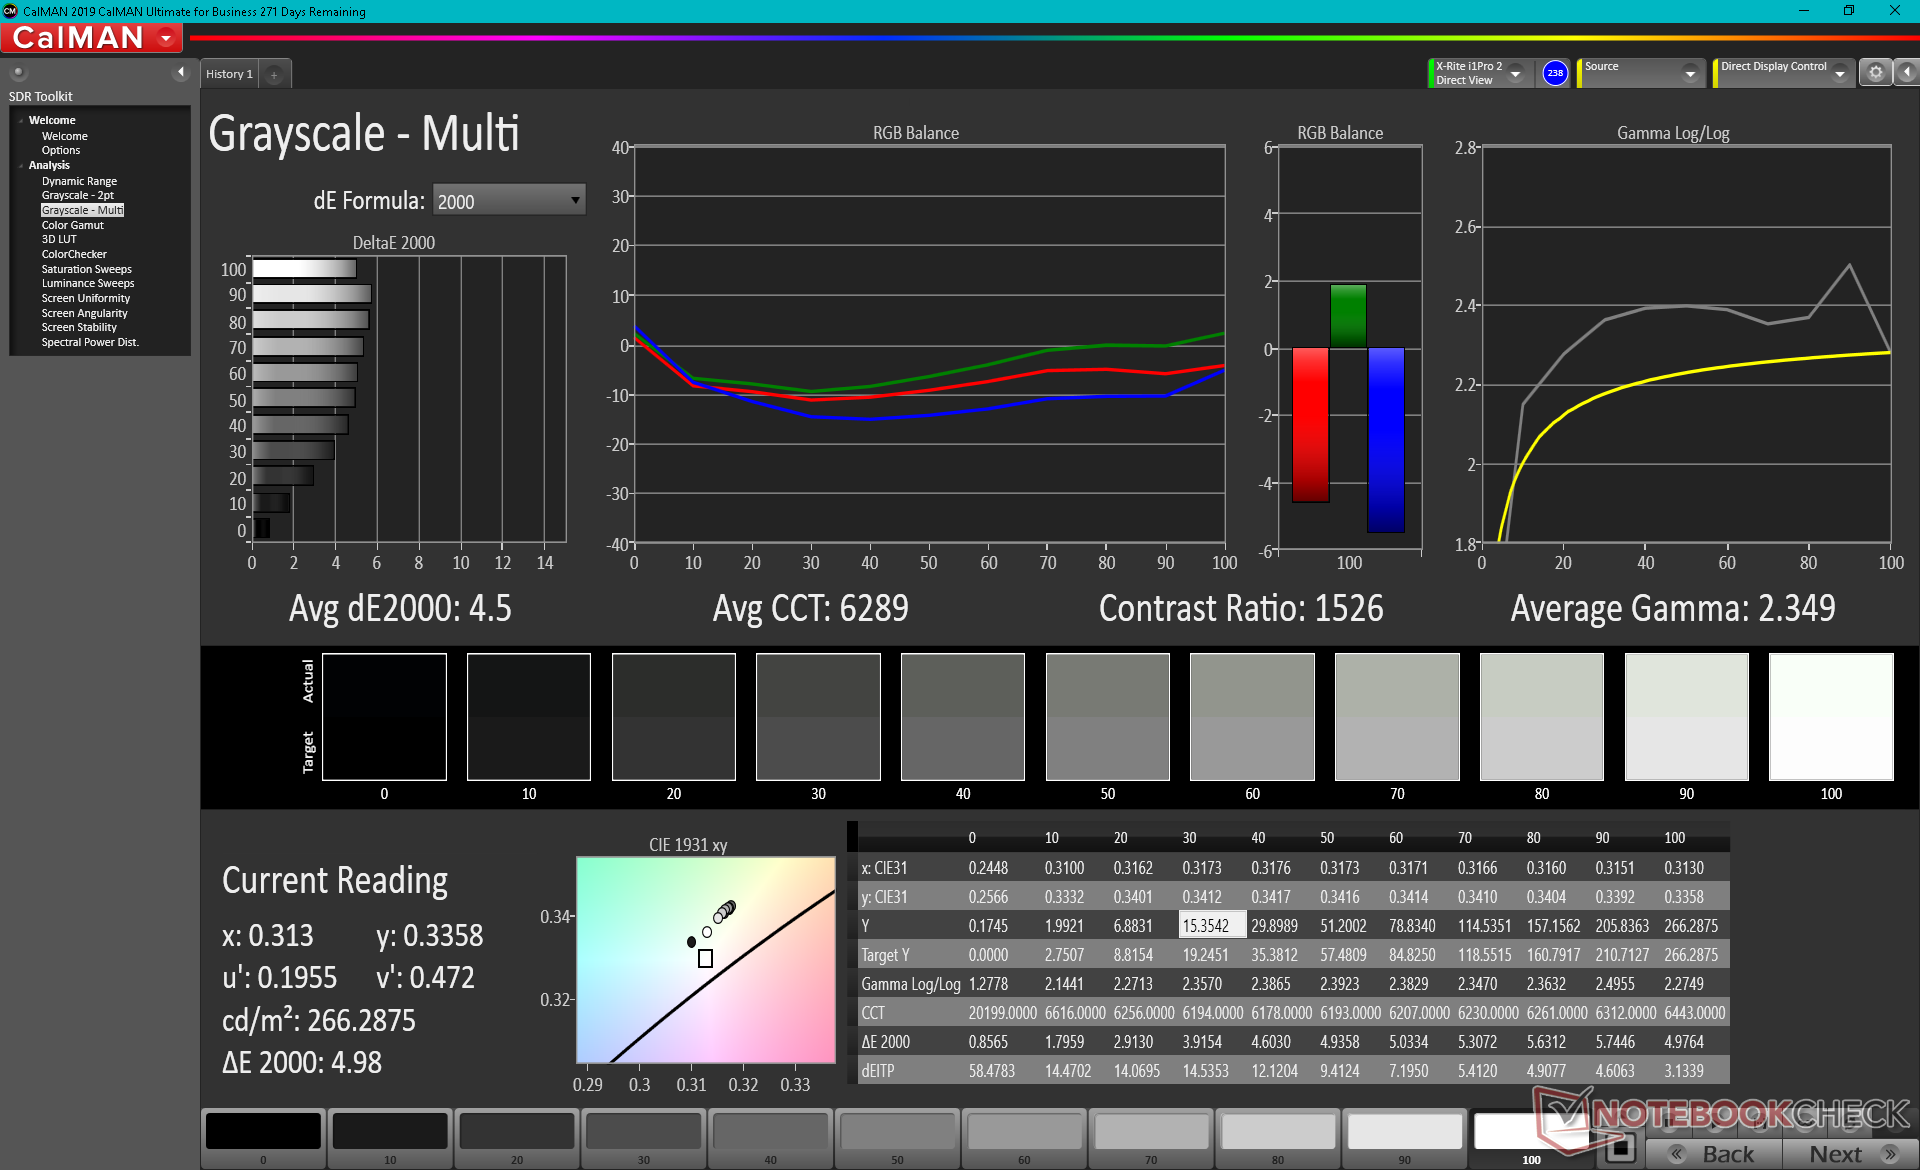
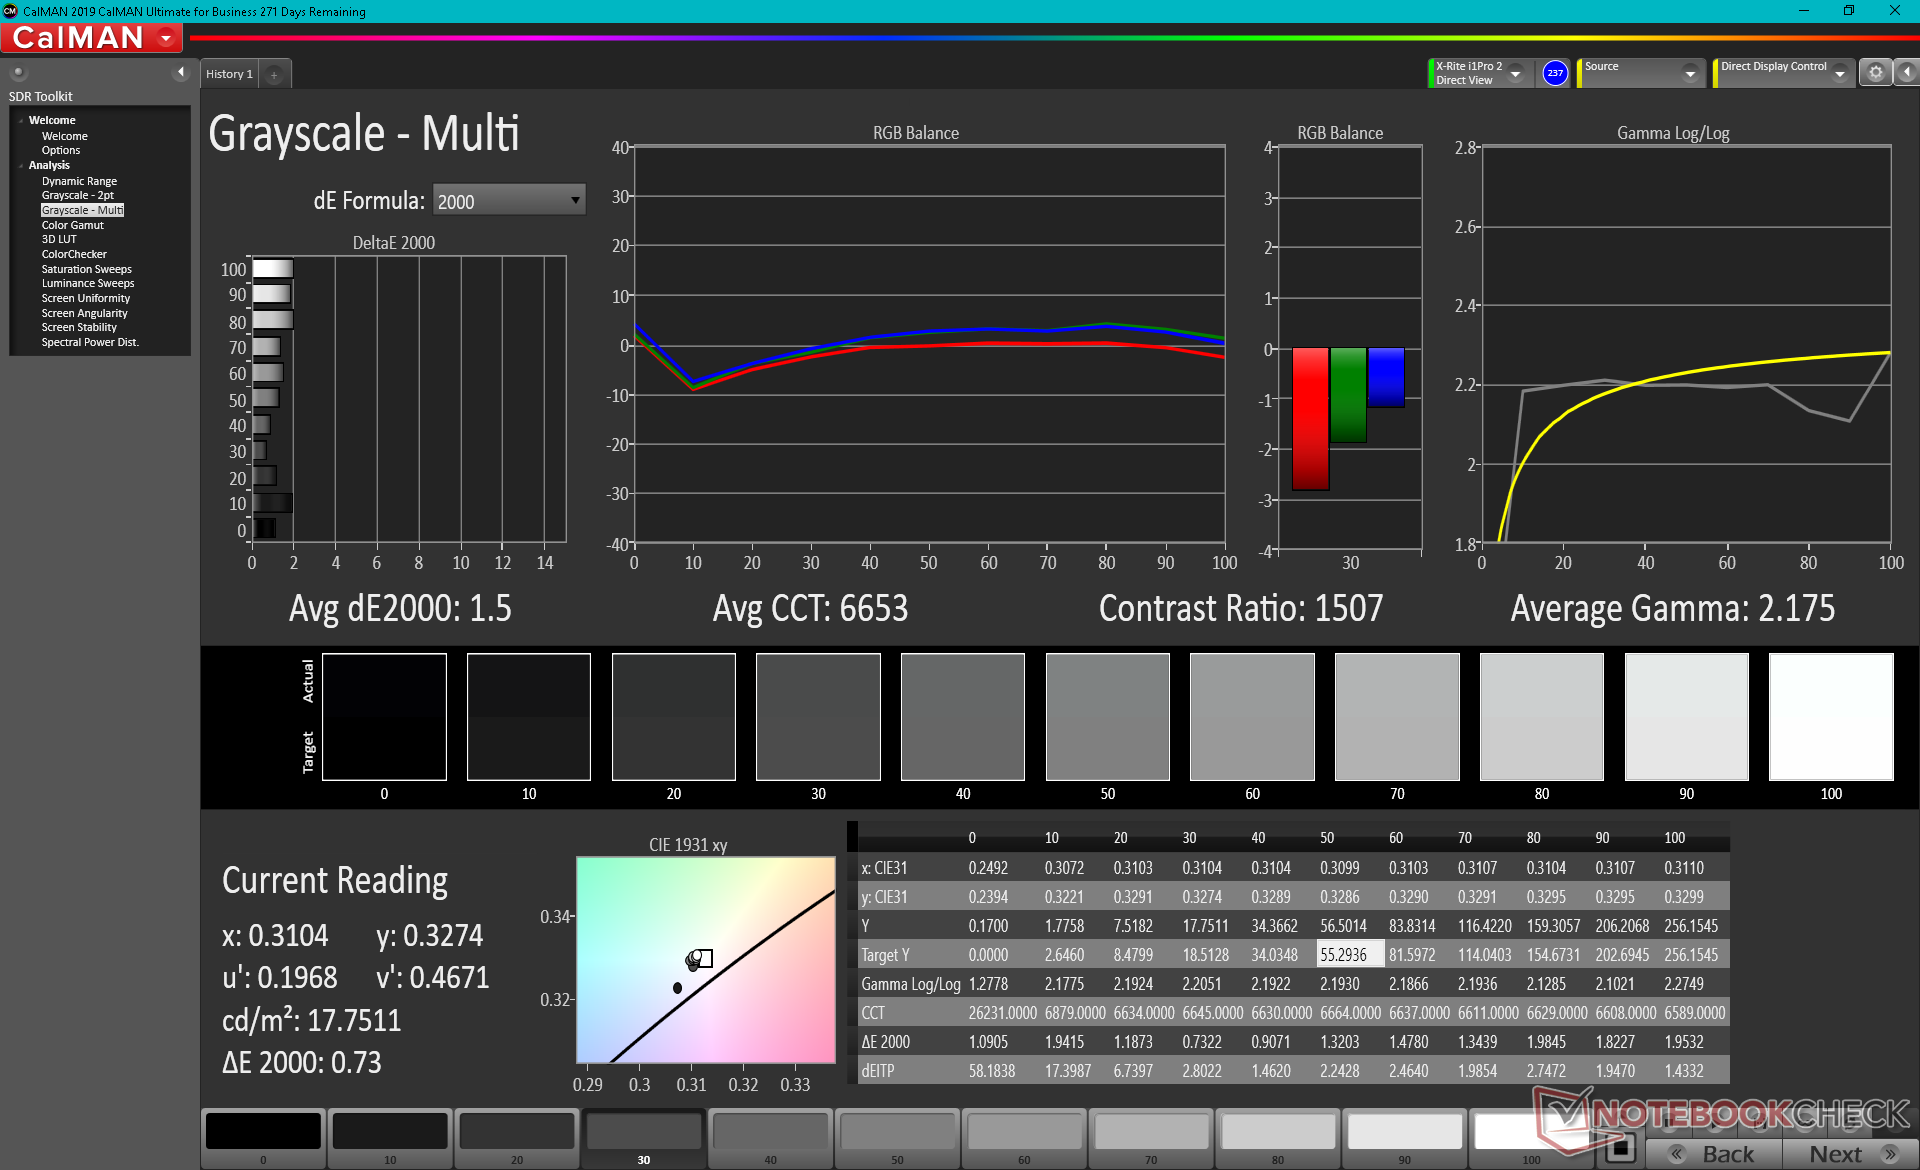
ΔE Greyscale Calman: 4.5 | ∀{0.09-98 Ø4.97}
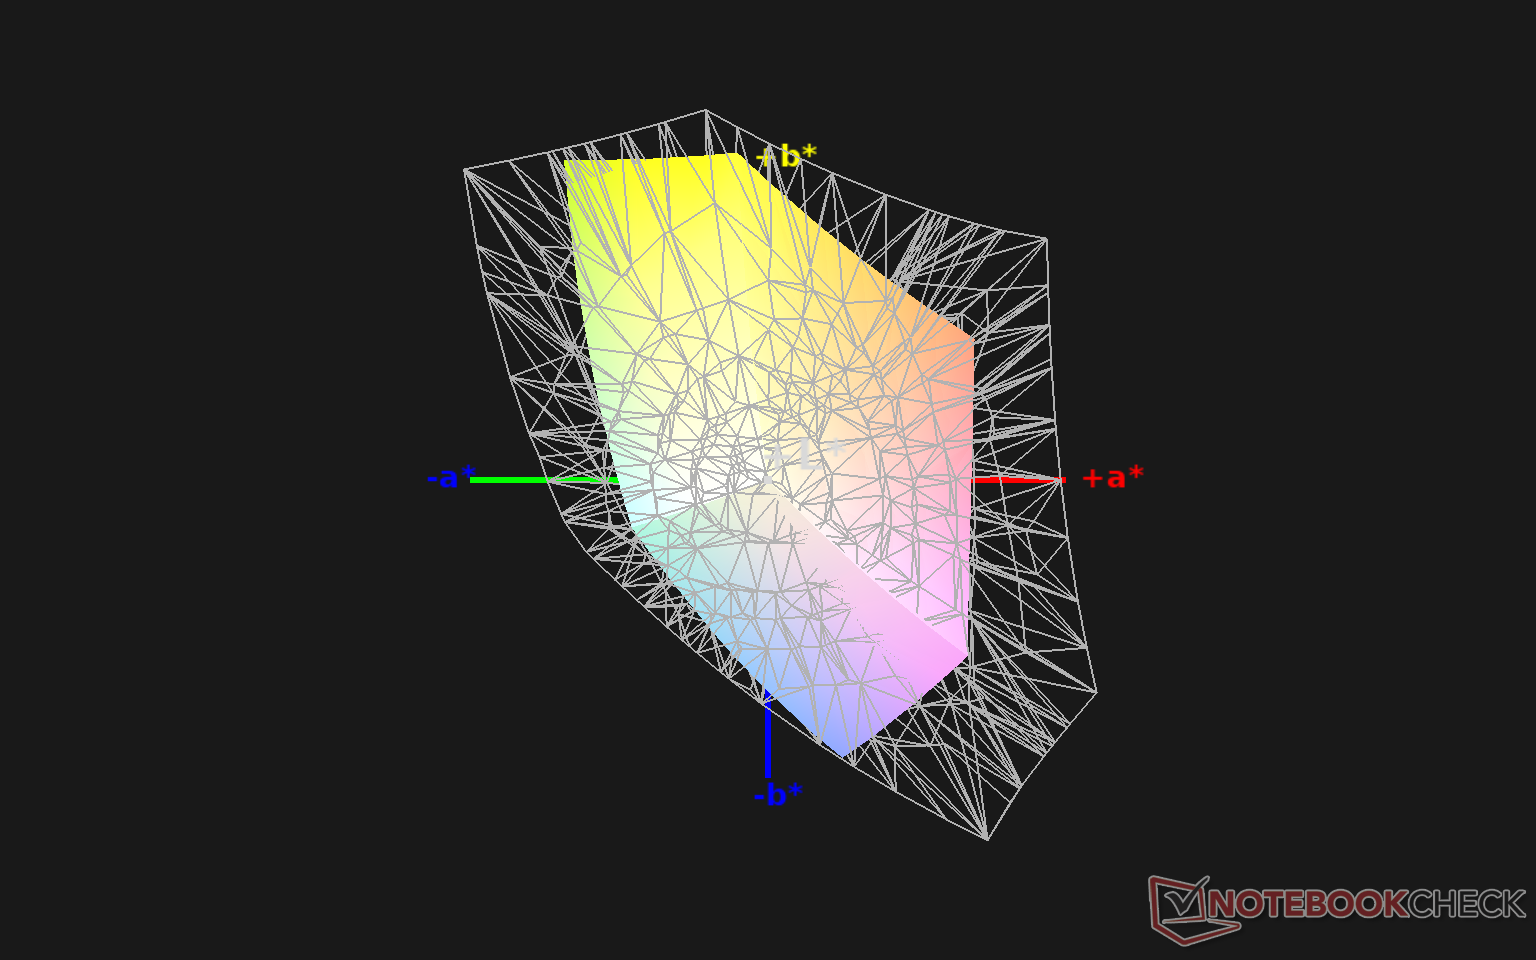
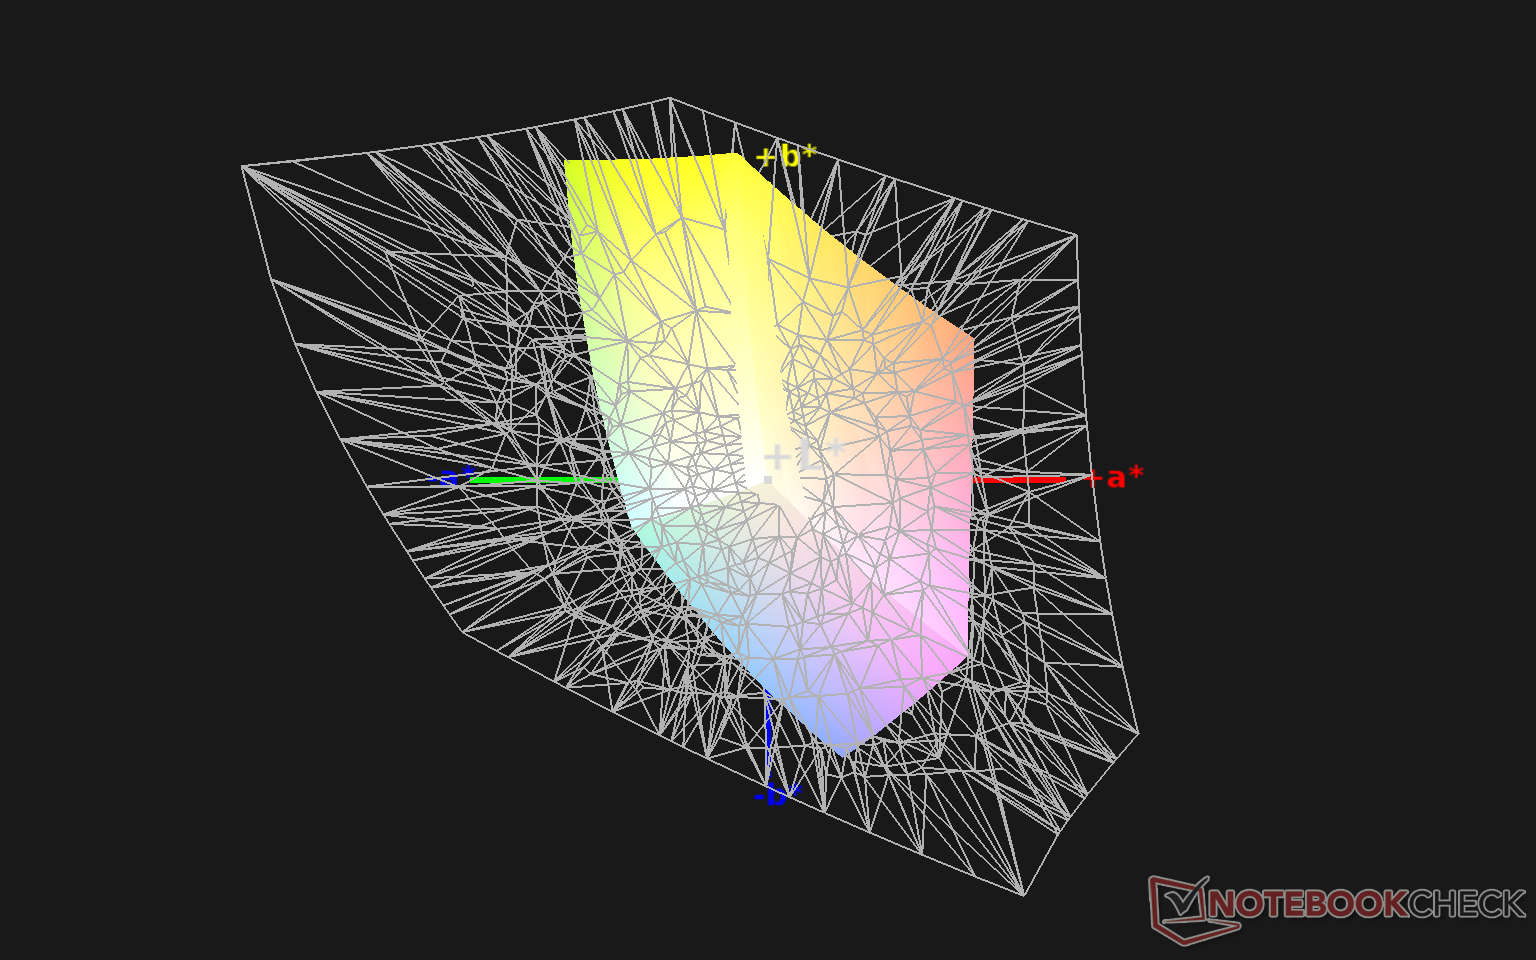
55.8% sRGB (Argyll 1.6.3 3D)
35.6% AdobeRGB 1998 (Argyll 1.6.3 3D)
38.9% AdobeRGB 1998 (Argyll 3D)
56.3% sRGB (Argyll 3D)
37.65% Display P3 (Argyll 3D)
Gamma: 2.35
CCT: 6289 K
| MSI GF65 Thin 10UE AU Optronics B156HAN08.4, IPS, 15.6", 1920x1080 | Asus ROG Strix G15 G513QR LQ156M1JW25, IPS, 15.6", 1920x1080 | Schenker XMG Core 15 Ampere BOE CQ NE156QHM-NY2, IPS, 15.6", 2560x1440 | MSI GS66 Stealth 10UG AU Optronics B156HAN12.0, IPS, 15.6", 1920x1080 | Aorus 15G XC Sharp LQ156M1JW03, IPS, 15.6", 1920x1080 | Lenovo Legion 7 15IMH05-81YT001VGE AUO048E, IPS, 15.6", 1920x1080 | |
|---|---|---|---|---|---|---|
| Display | 74% | 81% | 78% | 73% | 82% | |
| Display P3 Coverage (%) | 37.65 | 67.7 80% | 69.8 85% | 67.7 80% | 65.6 74% | 70.3 87% |
| sRGB Coverage (%) | 56.3 | 94.3 67% | 98.8 75% | 98.4 75% | 97.5 73% | 99.4 77% |
| AdobeRGB 1998 Coverage (%) | 38.9 | 68.2 75% | 70.7 82% | 69.1 78% | 67.1 72% | 71.3 83% |
| Response Times | 75% | 64% | 62% | 72% | 77% | |
| Response Time Grey 50% / Grey 80% * (ms) | 36.8 ? | 8.2 ? 78% | 14.8 ? 60% | 14.4 ? 61% | 9.6 ? 74% | 8 ? 78% |
| Response Time Black / White * (ms) | 31.6 ? | 9.2 ? 71% | 10.4 ? 67% | 11.6 ? 63% | 9.6 ? 70% | 8 ? 75% |
| PWM Frequency (Hz) | 24040 ? | |||||
| Screen | 27% | 40% | 29% | 37% | 47% | |
| Brightness middle (cd/m²) | 266.5 | 308 16% | 347 30% | 259.5 -3% | 288 8% | 470 76% |
| Brightness (cd/m²) | 262 | 288 10% | 328 25% | 264 1% | 270 3% | 468 79% |
| Brightness Distribution (%) | 91 | 86 -5% | 89 -2% | 90 -1% | 89 -2% | 85 -7% |
| Black Level * (cd/m²) | 0.18 | 0.23 -28% | 0.27 -50% | 0.25 -39% | 0.25 -39% | 0.21 -17% |
| Contrast (:1) | 1481 | 1339 -10% | 1285 -13% | 1038 -30% | 1152 -22% | 2238 51% |
| Colorchecker dE 2000 * | 5.33 | 3.28 38% | 1.66 69% | 2.52 53% | 1.19 78% | 3.28 38% |
| Colorchecker dE 2000 max. * | 18.28 | 8.51 53% | 3.03 83% | 5.55 70% | 3.79 79% | 7.31 60% |
| Colorchecker dE 2000 calibrated * | 4.36 | 0.83 81% | 1.23 72% | 1.93 56% | 0.71 84% | 0.8 82% |
| Greyscale dE 2000 * | 4.5 | 5 -11% | 1.6 64% | 1.7 62% | 1.6 64% | 4.49 -0% |
| Gamma | 2.35 94% | 2.057 107% | 2.278 97% | 2.04 108% | 2.229 99% | 2.4 92% |
| CCT | 6289 103% | 7393 88% | 6430 101% | 6414 101% | 6539 99% | 7438 87% |
| Color Space (Percent of AdobeRGB 1998) (%) | 35.6 | 68 91% | 71 99% | 63.3 78% | 67 88% | 65 83% |
| Color Space (Percent of sRGB) (%) | 55.8 | 90 61% | 94 68% | 98.8 77% | 90 61% | 99 77% |
| Total Average (Program / Settings) | 59% /
42% | 62% /
51% | 56% /
43% | 61% /
48% | 69% /
58% |
* ... smaller is better
Color space covers just 56 percent and 36 percent of sRGB and AdobeRGB, respectively, to be indicative of a budget panel despite the high 144 Hz native refresh rate. Most mid-range or better Ultrabooks or gaming laptops cover at least 90 percent of sRGB for deeper colors. The limited colors here aren't an issue when gaming, but graphics editors will want to avoid using this panel.
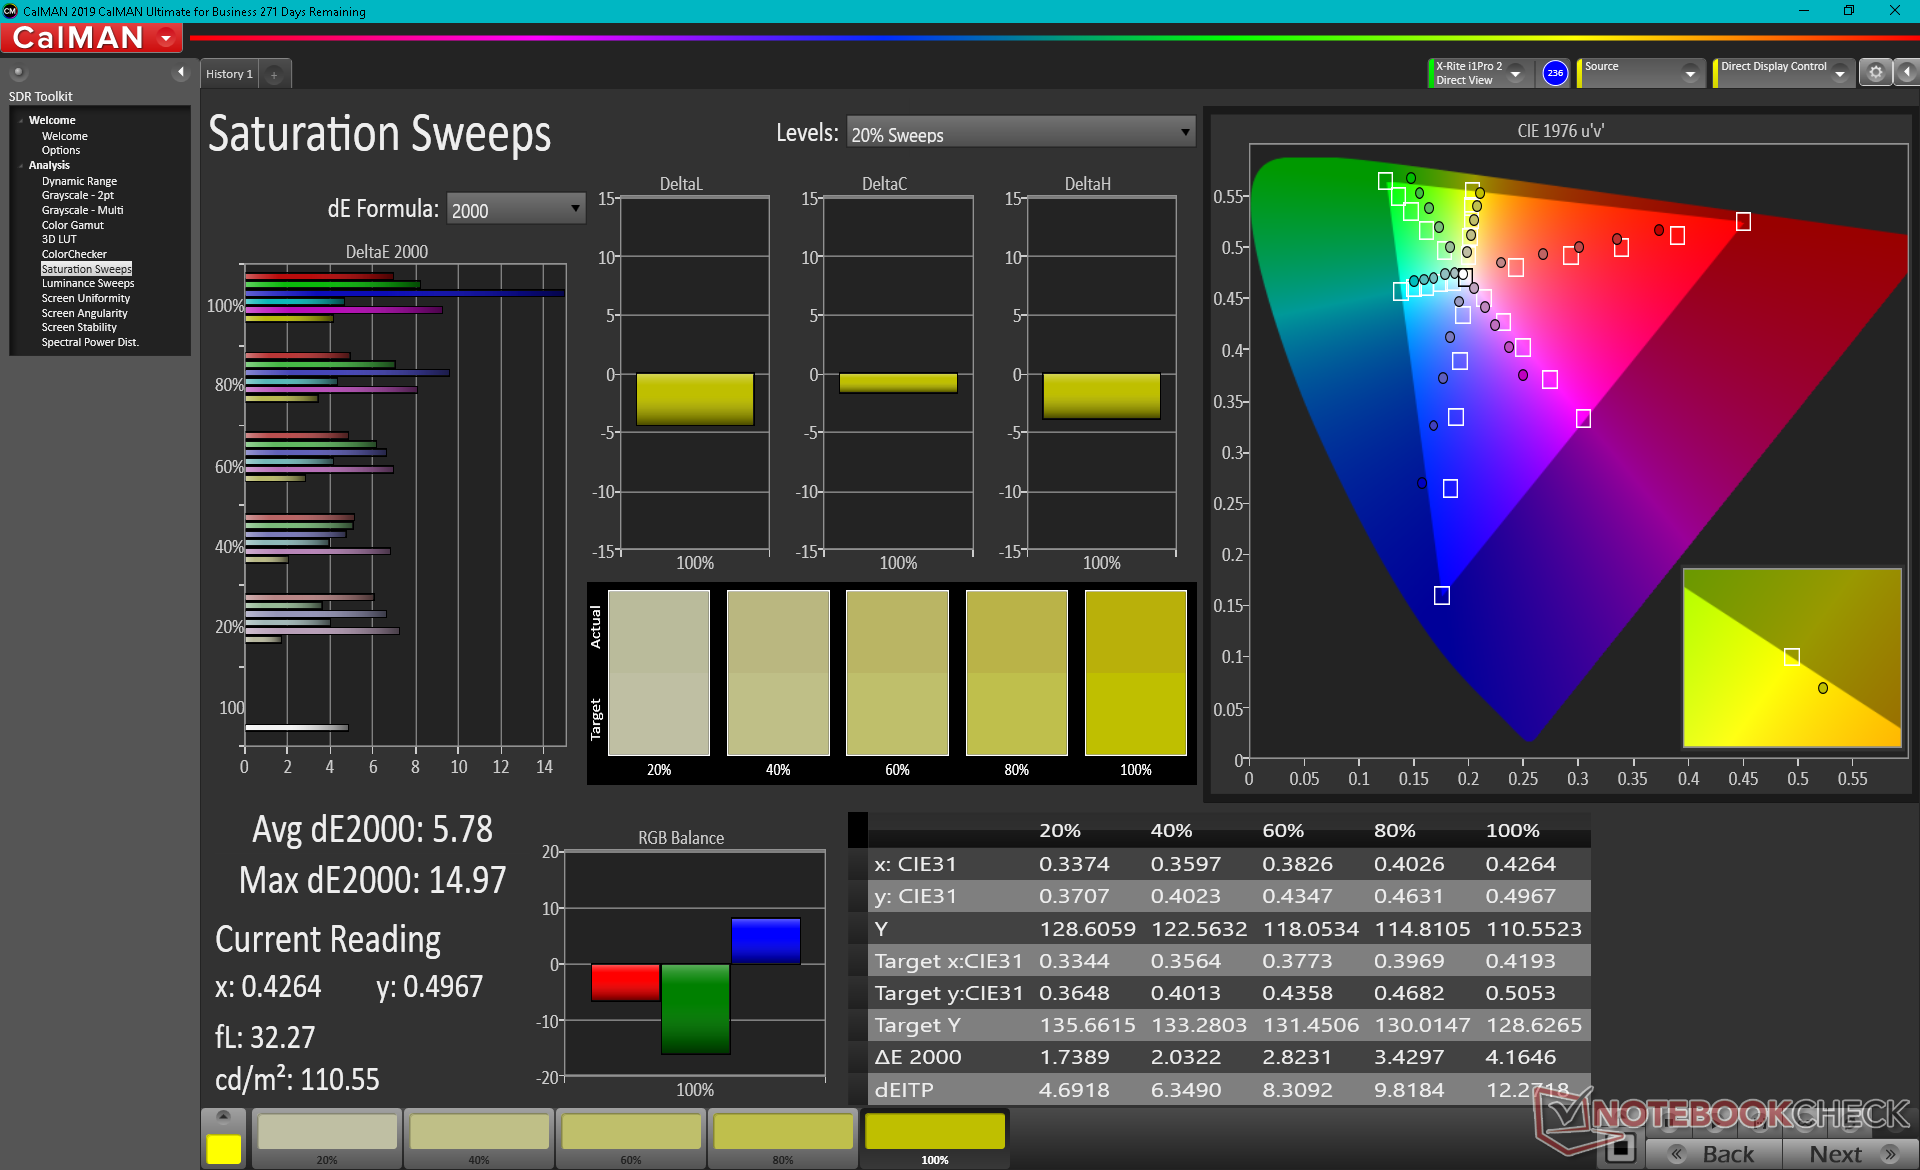
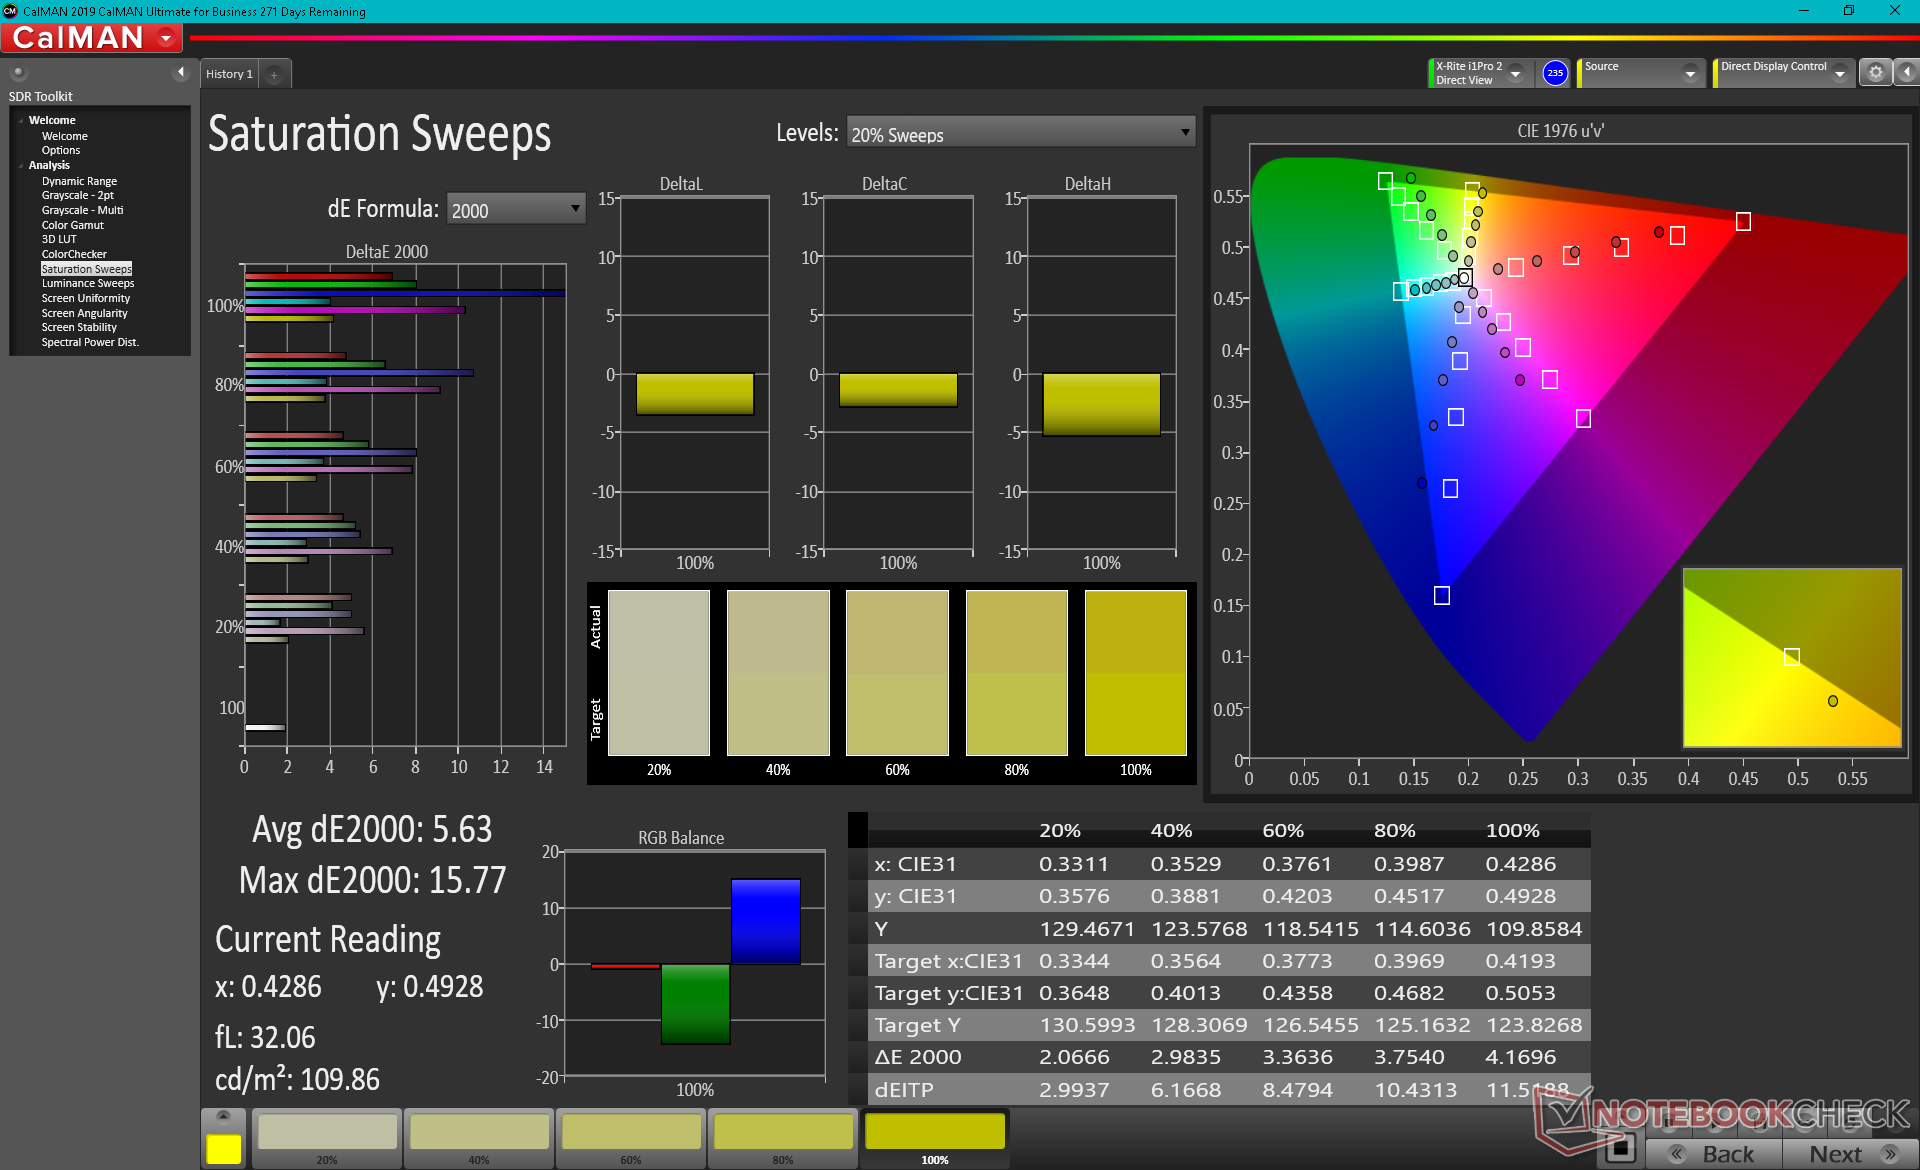
X-Rite colorimeter measurements show an overly warm color temperature out of the box which our own calibration is able to fix for more accurate grayscale levels. Color accuracy, however, remains below average especially when at higher saturation levels due to the narrow color space mentioned above. Blue in particular is represented more inaccurately than every other tested color by a wide margin.
Display Response Times
| ↔ Response Time Black to White | ||
|---|---|---|
| 31.6 ms ... rise ↗ and fall ↘ combined | ↗ 18.4 ms rise | 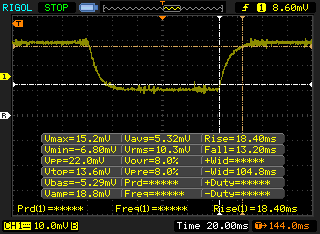 |
| ↘ 13.2 ms fall | ||
| The screen shows slow response rates in our tests and will be unsatisfactory for gamers. In comparison, all tested devices range from 0.1 (minimum) to 240 (maximum) ms. » 85 % of all devices are better. This means that the measured response time is worse than the average of all tested devices (19.8 ms). | ||
| ↔ Response Time 50% Grey to 80% Grey | ||
| 36.8 ms ... rise ↗ and fall ↘ combined | ↗ 19.2 ms rise | 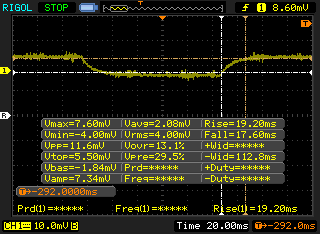 |
| ↘ 17.6 ms fall | ||
| The screen shows slow response rates in our tests and will be unsatisfactory for gamers. In comparison, all tested devices range from 0.165 (minimum) to 636 (maximum) ms. » 53 % of all devices are better. This means that the measured response time is worse than the average of all tested devices (31 ms). | ||
Screen Flickering / PWM (Pulse-Width Modulation)
| Screen flickering / PWM not detected | 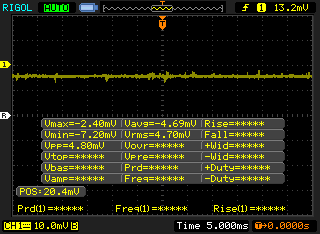 | ||
In comparison: 52 % of all tested devices do not use PWM to dim the display. If PWM was detected, an average of 7763 (minimum: 5 - maximum: 343500) Hz was measured. | |||
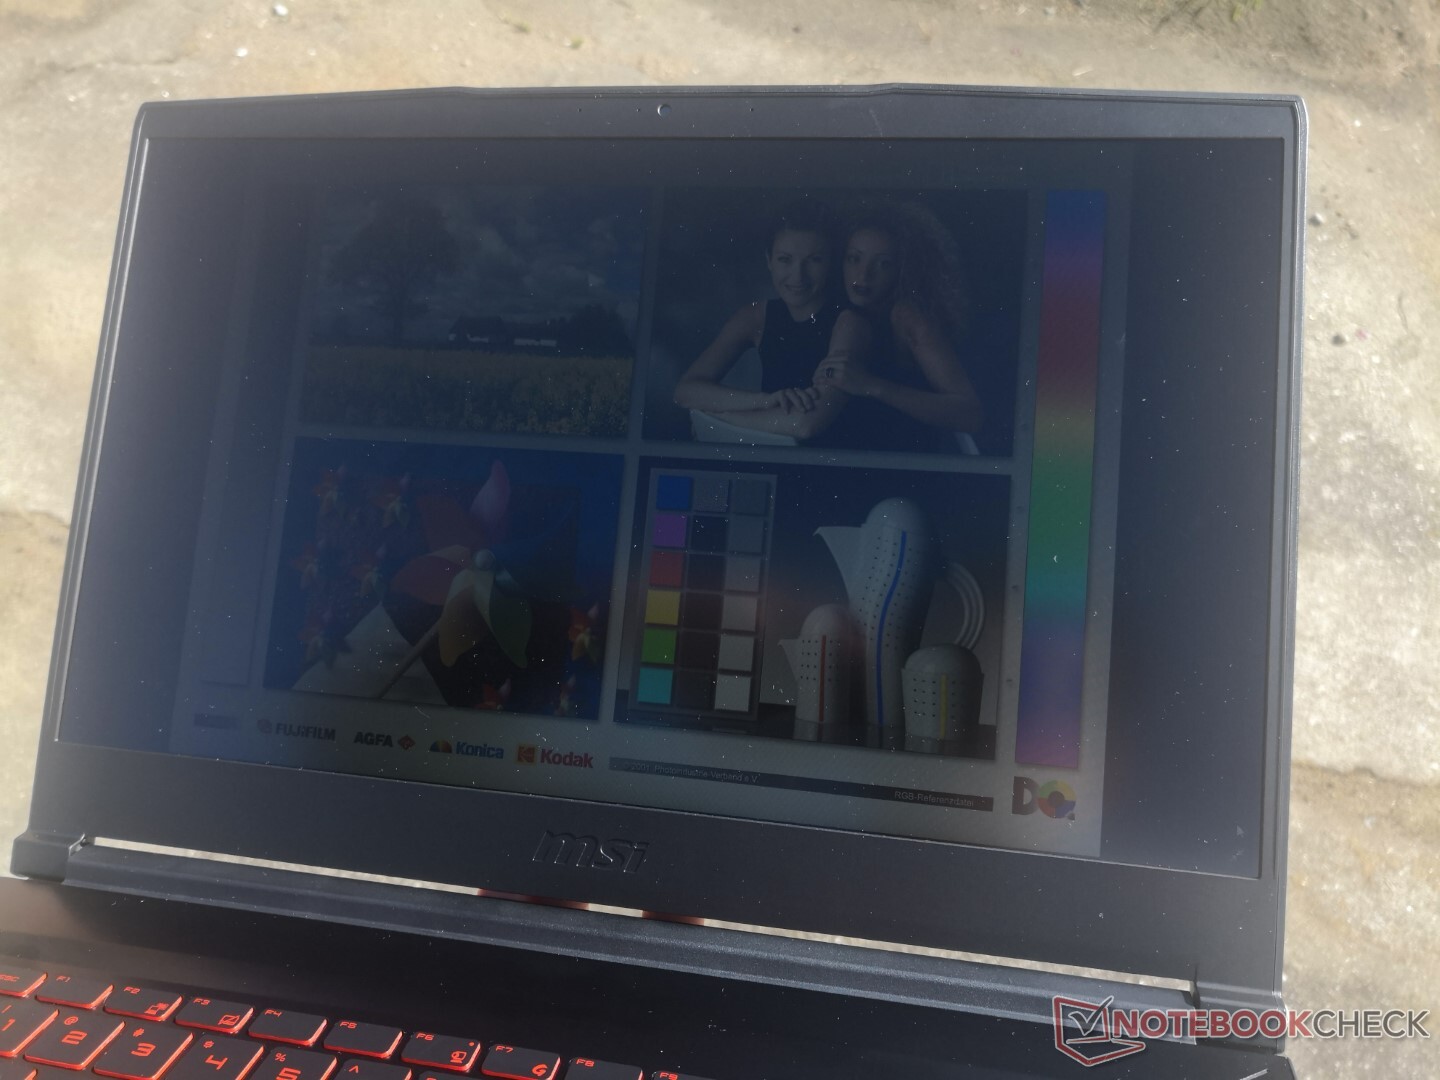
Outdoor visibility is below average as the display isn't any brighter or dimmer than the outgoing GF65 9SD. Maximum brightness is a bit lower than most gaming laptops where 300 nits or greater is more common.

Performance
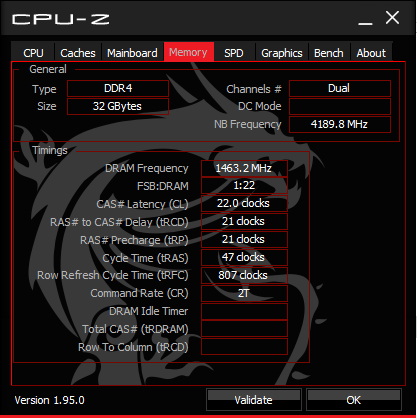
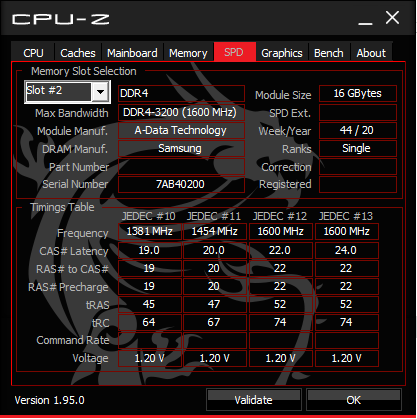
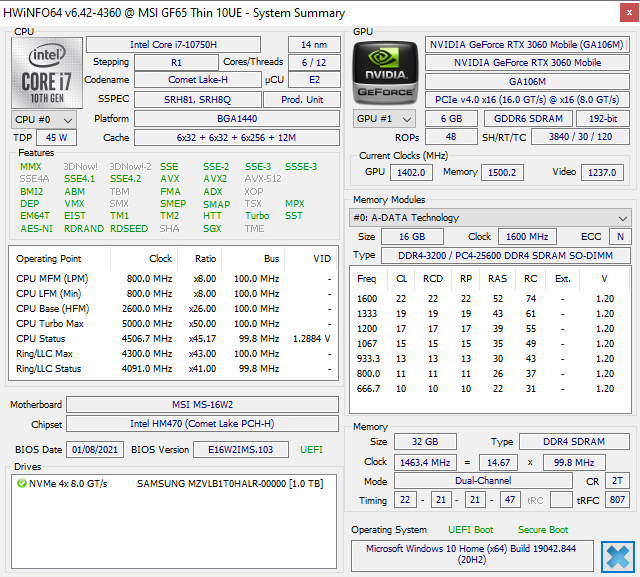
MSI has updated the display (120 Hz to 144 Hz) and RAM (2666 MHz to 3200 MHz) from the older GF65 9SD. The CPU and GPU have been updated from Coffee Lake-H to Comet Lake-H and Nvidia Turing to Ampere, respectively.
Lesser Core i5-10200H and i5-10500H SKUs are also available, but the 144 Hz IPS display and GeForce RTX 3060 remain fixed on all configurations as of this writing.
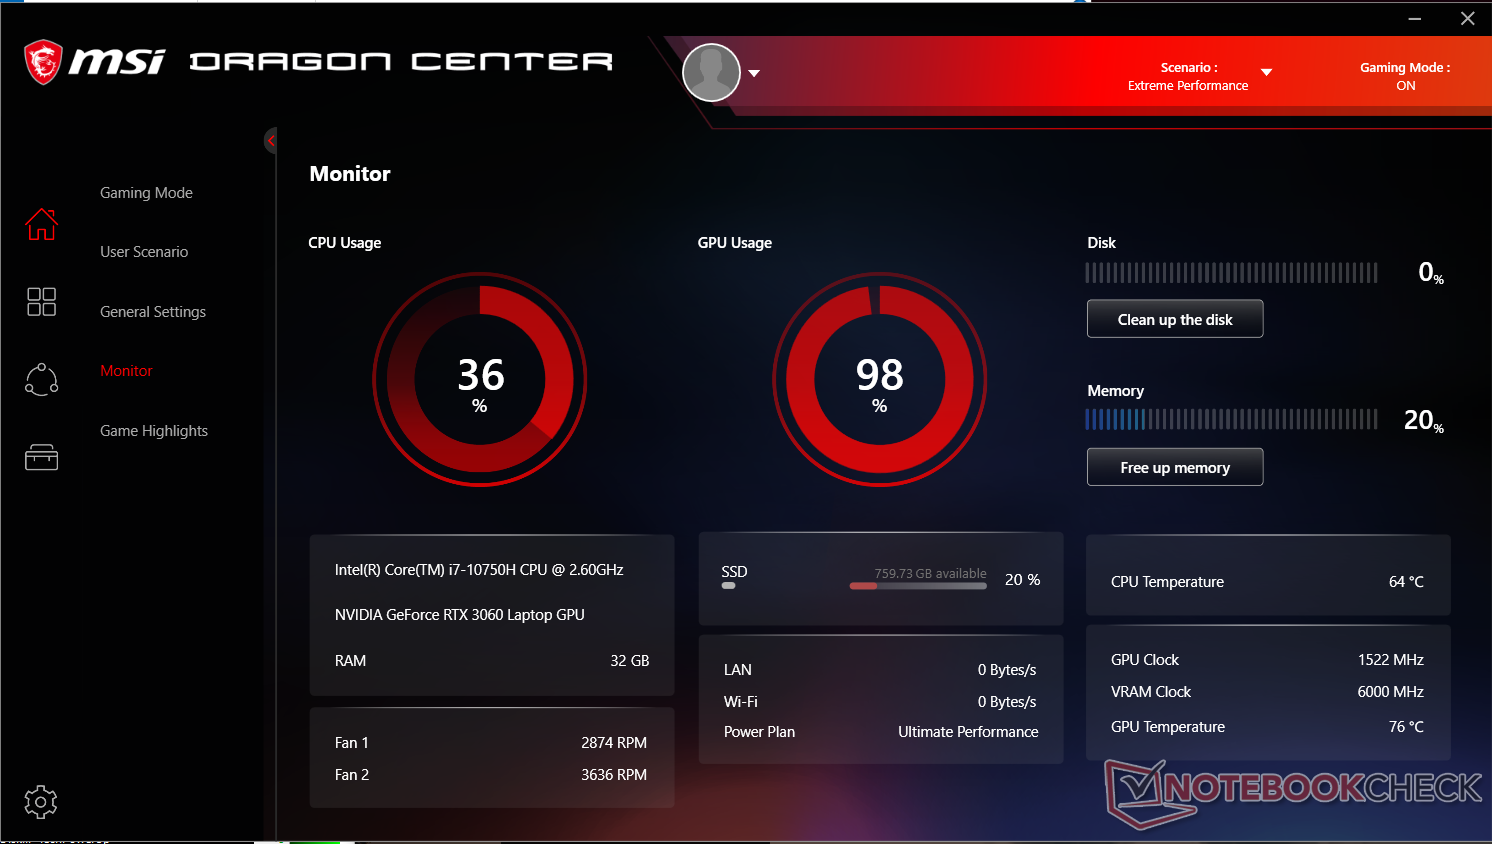
We had set our system to the MSI Extreme Performance mode prior to running any performance benchmarks below.
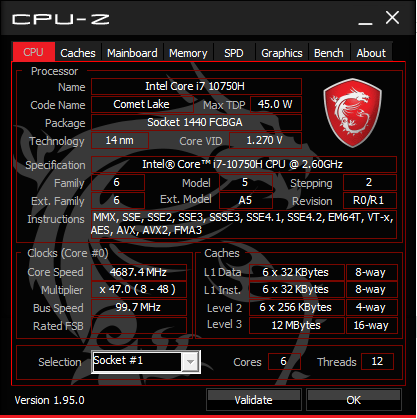
Processor
Multi-thread CPU performance is slower than the average Core i7-10750H in our database by about 10 to 15 percent. In fact, the older Core i7-9750H in the Maingear Vector 15 is able to consistently outperform our MSI by a few percentage points in multi-threaded loads. For higher performance, users should enable Cooler Boost mode (or maximum fan mode) as detailed in our Stress Test section below.
Cinebench R15: CPU Multi 64Bit | CPU Single 64Bit
Blender: v2.79 BMW27 CPU
7-Zip 18.03: 7z b 4 -mmt1 | 7z b 4
Geekbench 5.5: Single-Core | Multi-Core
HWBOT x265 Benchmark v2.2: 4k Preset
LibreOffice : 20 Documents To PDF
R Benchmark 2.5: Overall mean
| Cinebench R20 / CPU (Single Core) | |
| Asus Zephyrus G14 GA401IV | |
| Asus ROG Strix Scar 15 G532LWS | |
| Schenker XMG Core 15 Ampere | |
| MSI GF65 Thin 10UE | |
| MSI GE65 Raider 9SF-049US | |
| Aorus 15P XC | |
| Average Intel Core i7-10750H (431 - 504, n=43) | |
| Gateway Creator Series 15.6 GWTN156-3BK | |
| HP Pavilion Gaming 15-ec1206ng | |
| Maingear Vector 15 | |
| MSI GF63 Thin 9SC | |
| Cinebench R15 / CPU Single 64Bit | |
| Asus ROG Strix Scar 15 G532LWS | |
| MSI GF65 Thin 10UE | |
| Aorus 15P XC | |
| MSI GE65 Raider 9SF-049US | |
| Average Intel Core i7-10750H (184 - 213, n=45) | |
| Asus Zephyrus G14 GA401IV | |
| Schenker XMG Core 15 Ampere | |
| Maingear Vector 15 | |
| Gateway Creator Series 15.6 GWTN156-3BK | |
| HP Pavilion Gaming 15-ec1206ng | |
| MSI GF63 Thin 9SC | |
| Blender / v2.79 BMW27 CPU | |
| Gateway Creator Series 15.6 GWTN156-3BK | |
| MSI GF65 Thin 10UE | |
| Average Intel Core i7-10750H (322 - 587, n=43) | |
| HP Pavilion Gaming 15-ec1206ng | |
| Asus Zephyrus G14 GA401IV | |
| Aorus 15P XC | |
| Asus ROG Strix Scar 15 G532LWS | |
| Schenker XMG Core 15 Ampere | |
| 7-Zip 18.03 / 7z b 4 -mmt1 | |
| Asus ROG Strix Scar 15 G532LWS | |
| Aorus 15P XC | |
| MSI GF65 Thin 10UE | |
| Average Intel Core i7-10750H (4504 - 5470, n=43) | |
| Schenker XMG Core 15 Ampere | |
| Asus Zephyrus G14 GA401IV | |
| Gateway Creator Series 15.6 GWTN156-3BK | |
| HP Pavilion Gaming 15-ec1206ng | |
| 7-Zip 18.03 / 7z b 4 | |
| Schenker XMG Core 15 Ampere | |
| Asus Zephyrus G14 GA401IV | |
| Asus ROG Strix Scar 15 G532LWS | |
| Aorus 15P XC | |
| HP Pavilion Gaming 15-ec1206ng | |
| Average Intel Core i7-10750H (26040 - 37345, n=43) | |
| MSI GF65 Thin 10UE | |
| Gateway Creator Series 15.6 GWTN156-3BK | |
| Geekbench 5.5 / Single-Core | |
| Asus ROG Strix Scar 15 G532LWS | |
| MSI GF65 Thin 10UE | |
| Aorus 15P XC | |
| Average Intel Core i7-10750H (1114 - 1333, n=43) | |
| Asus Zephyrus G14 GA401IV | |
| Schenker XMG Core 15 Ampere | |
| HP Pavilion Gaming 15-ec1206ng | |
| Gateway Creator Series 15.6 GWTN156-3BK | |
| Geekbench 5.5 / Multi-Core | |
| Asus ROG Strix Scar 15 G532LWS | |
| Schenker XMG Core 15 Ampere | |
| Aorus 15P XC | |
| Asus Zephyrus G14 GA401IV | |
| MSI GF65 Thin 10UE | |
| Average Intel Core i7-10750H (4443 - 6674, n=43) | |
| HP Pavilion Gaming 15-ec1206ng | |
| Gateway Creator Series 15.6 GWTN156-3BK | |
| HWBOT x265 Benchmark v2.2 / 4k Preset | |
| Schenker XMG Core 15 Ampere | |
| Asus ROG Strix Scar 15 G532LWS | |
| Aorus 15P XC | |
| Asus Zephyrus G14 GA401IV | |
| HP Pavilion Gaming 15-ec1206ng | |
| Average Intel Core i7-10750H (5.54 - 11.6, n=43) | |
| MSI GF65 Thin 10UE | |
| Gateway Creator Series 15.6 GWTN156-3BK | |
| LibreOffice / 20 Documents To PDF | |
| HP Pavilion Gaming 15-ec1206ng | |
| Schenker XMG Core 15 Ampere | |
| Gateway Creator Series 15.6 GWTN156-3BK | |
| Aorus 15P XC | |
| Average Intel Core i7-10750H (43.1 - 99.2, n=43) | |
| Asus ROG Strix Scar 15 G532LWS | |
| MSI GF65 Thin 10UE | |
| R Benchmark 2.5 / Overall mean | |
| Gateway Creator Series 15.6 GWTN156-3BK | |
| Average Intel Core i7-10750H (0.578 - 0.708, n=42) | |
| HP Pavilion Gaming 15-ec1206ng | |
| MSI GF65 Thin 10UE | |
| Aorus 15P XC | |
| Schenker XMG Core 15 Ampere | |
| Asus ROG Strix Scar 15 G532LWS | |
* ... smaller is better
System Performance
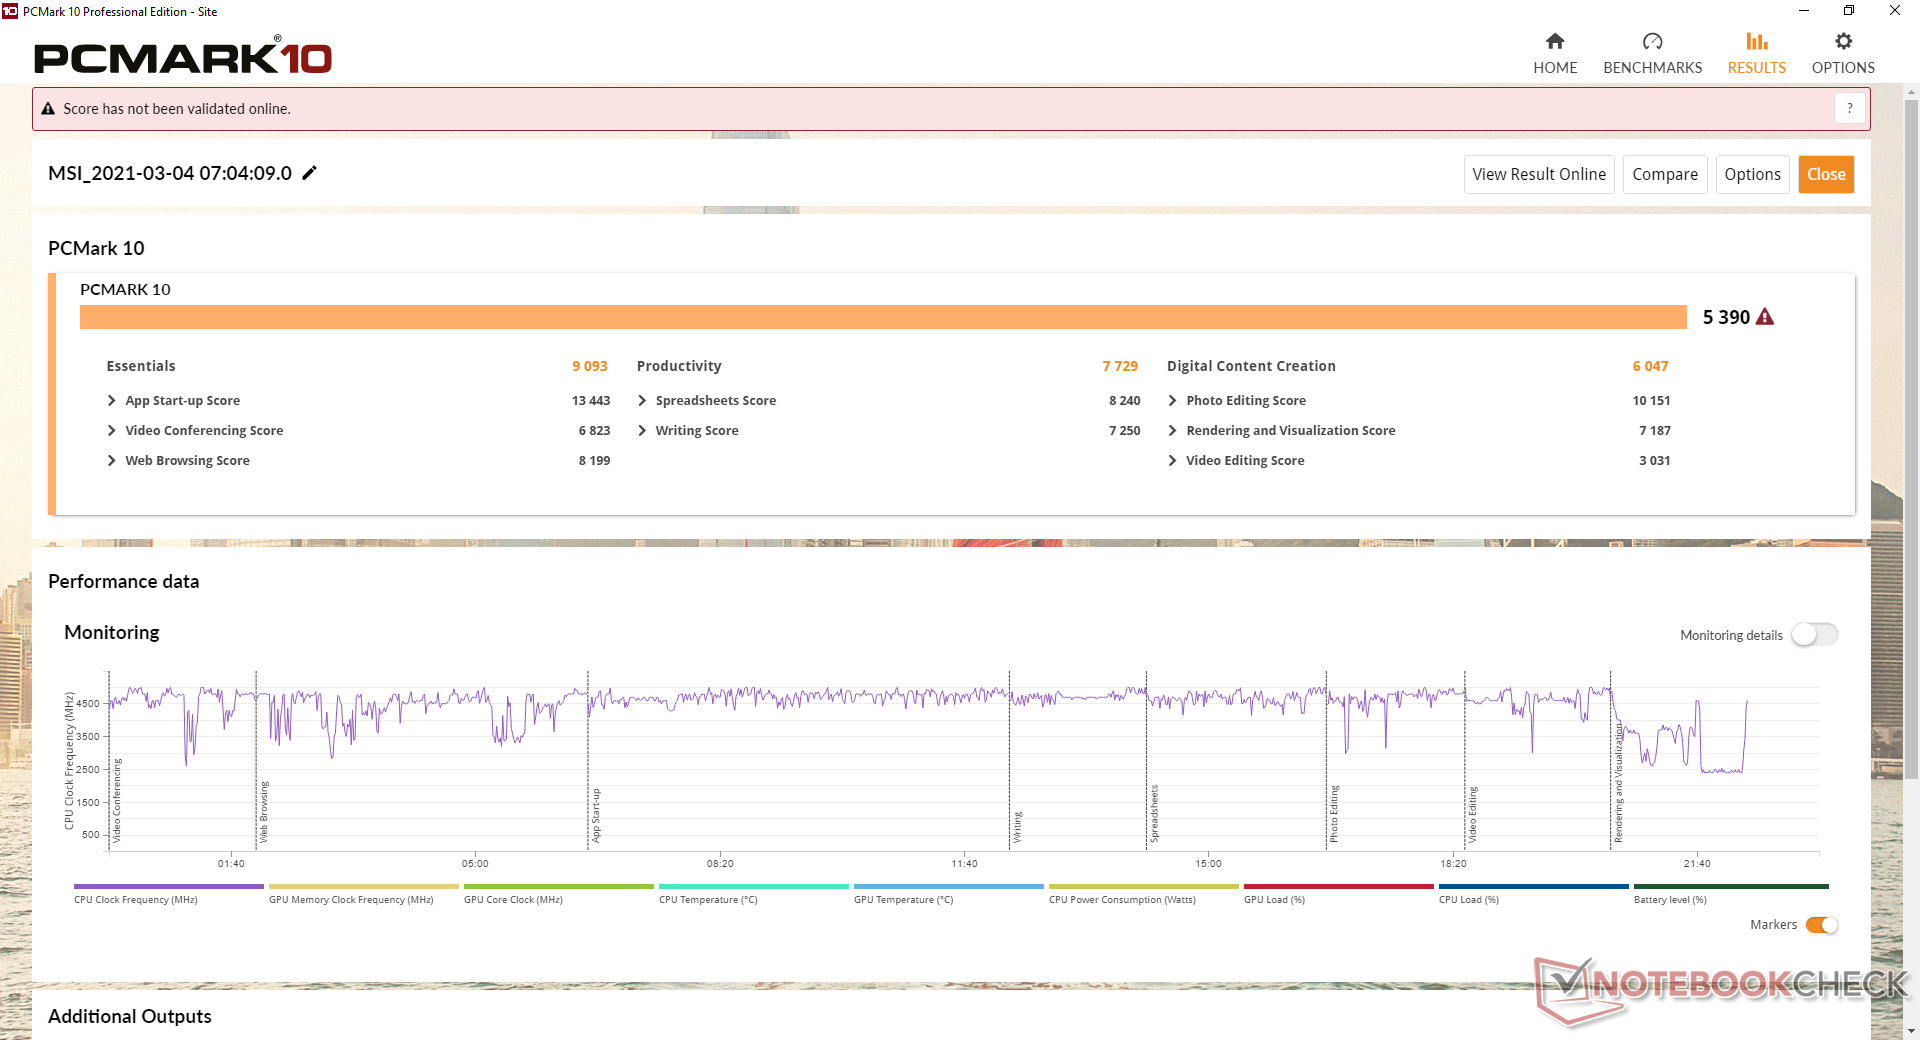
| PCMark 10 Score | 5390 points | |
Help | ||
DPC Latency
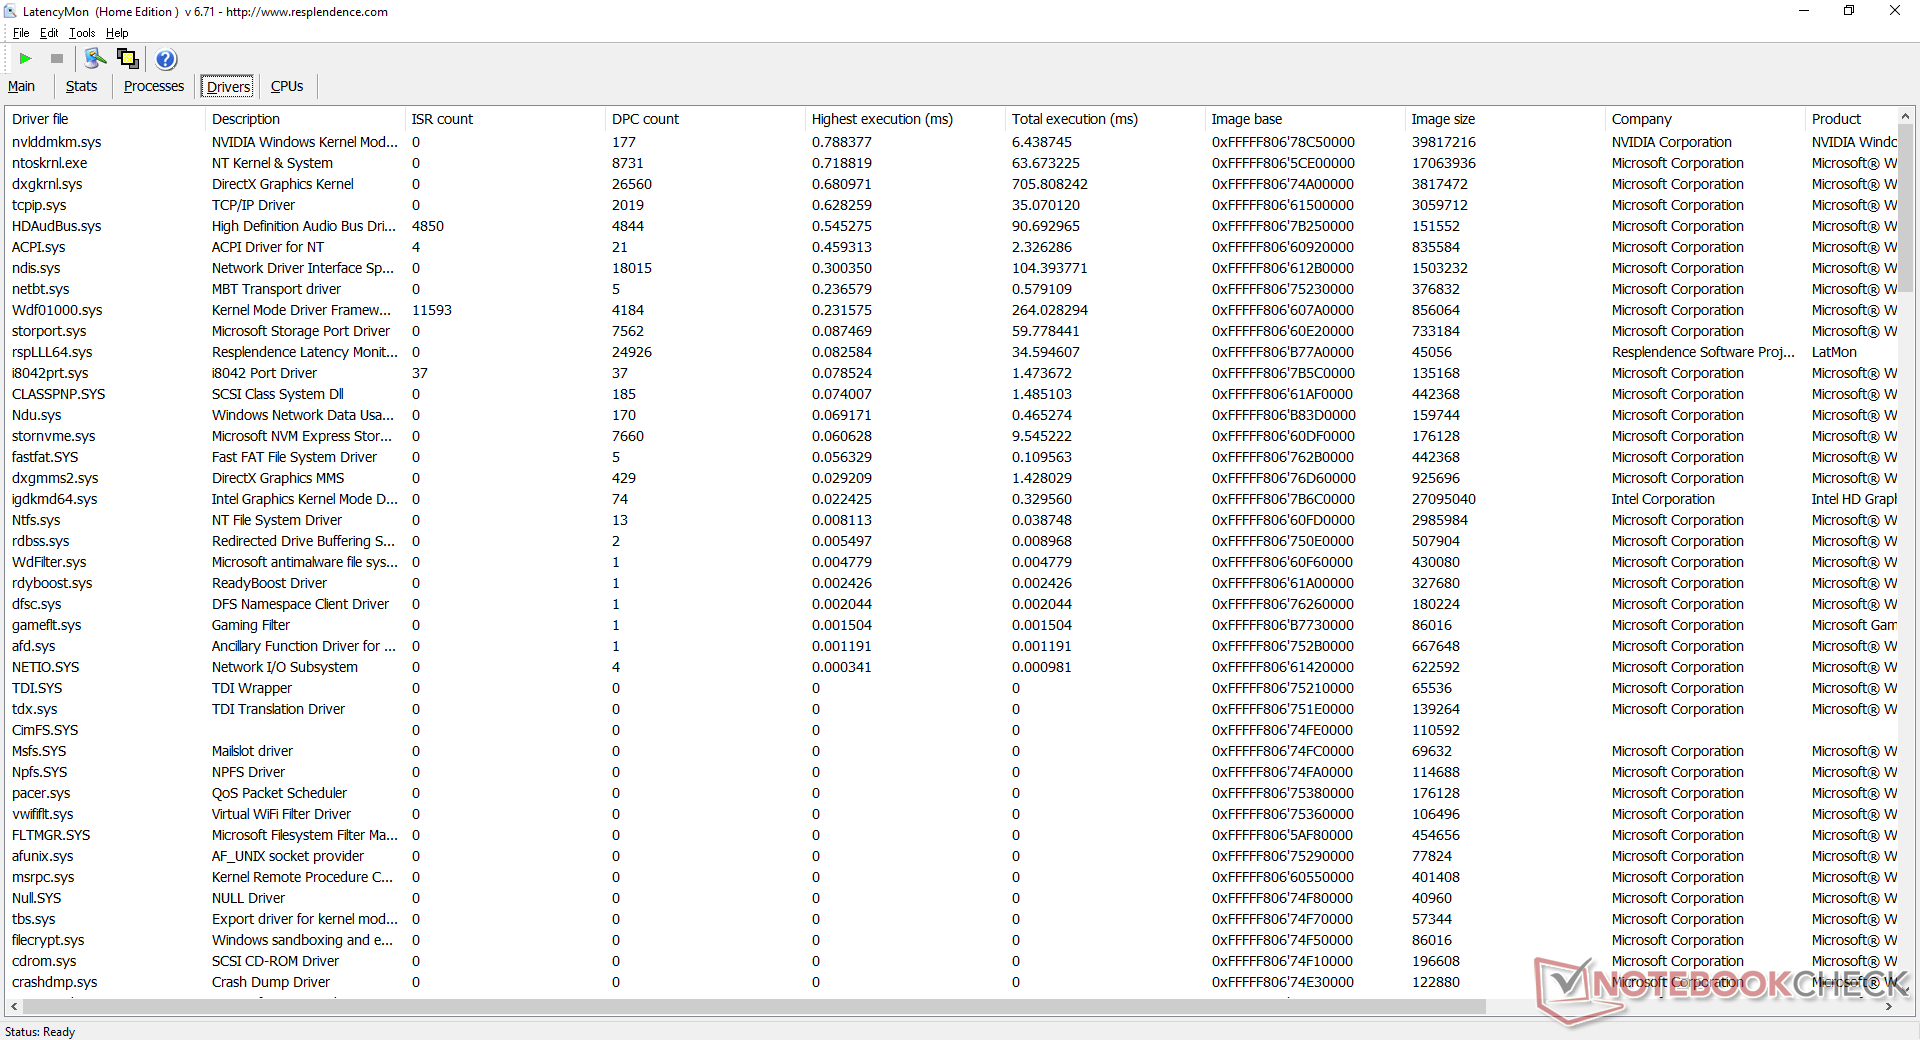
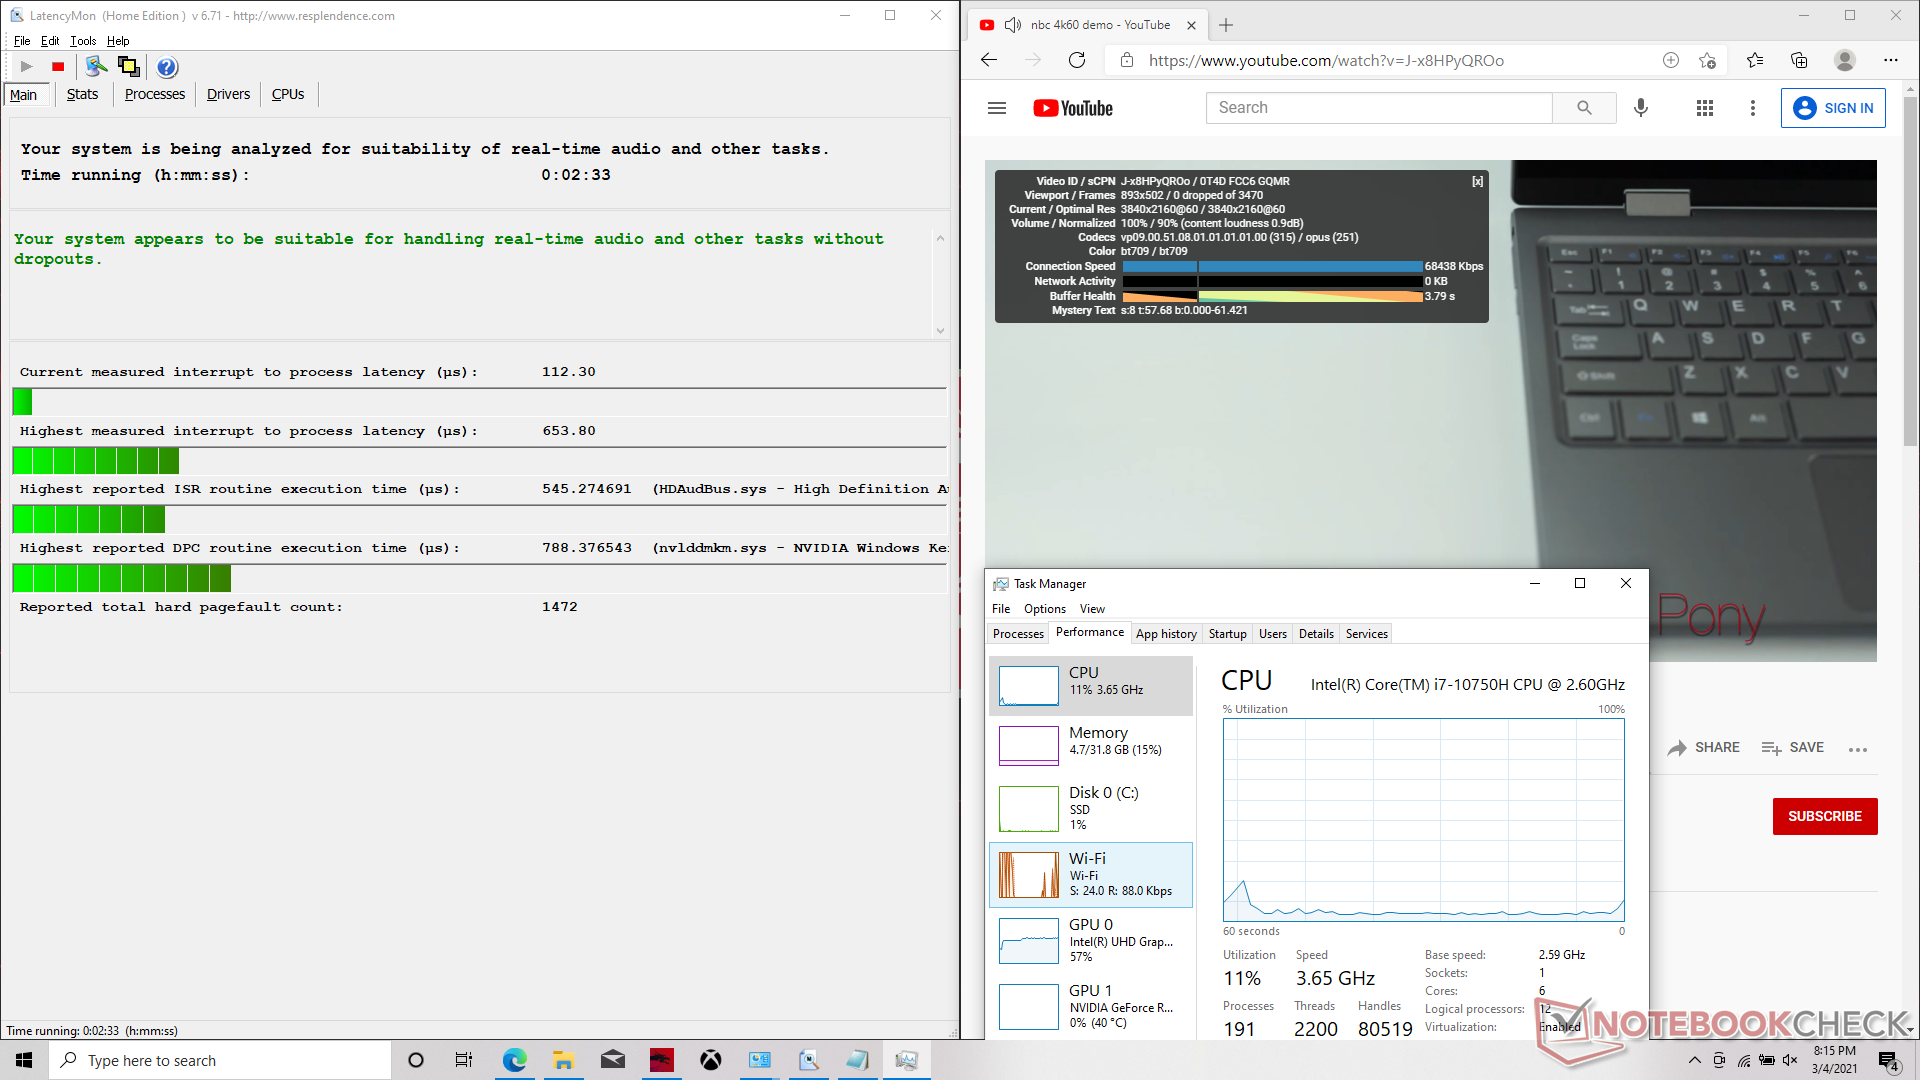
LatencyMon shows no DPC latency issues when opening multiple browser tabs on our homepage and no dropped frames either when playing 4K60 content on YouTube.
| DPC Latencies / LatencyMon - interrupt to process latency (max), Web, Youtube, Prime95 | |
| Aorus 15G XC | |
| Lenovo Legion 7 15IMH05-81YT001VGE | |
| MSI GF65 Thin 10UE | |
| MSI GS66 Stealth 10UG | |
| Schenker XMG Core 15 Ampere | |
| Asus ROG Strix G15 G513QR | |
* ... smaller is better
Storage Devices
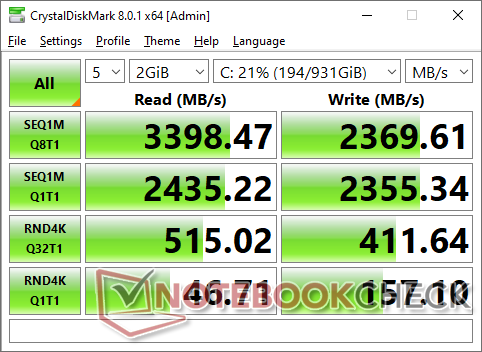
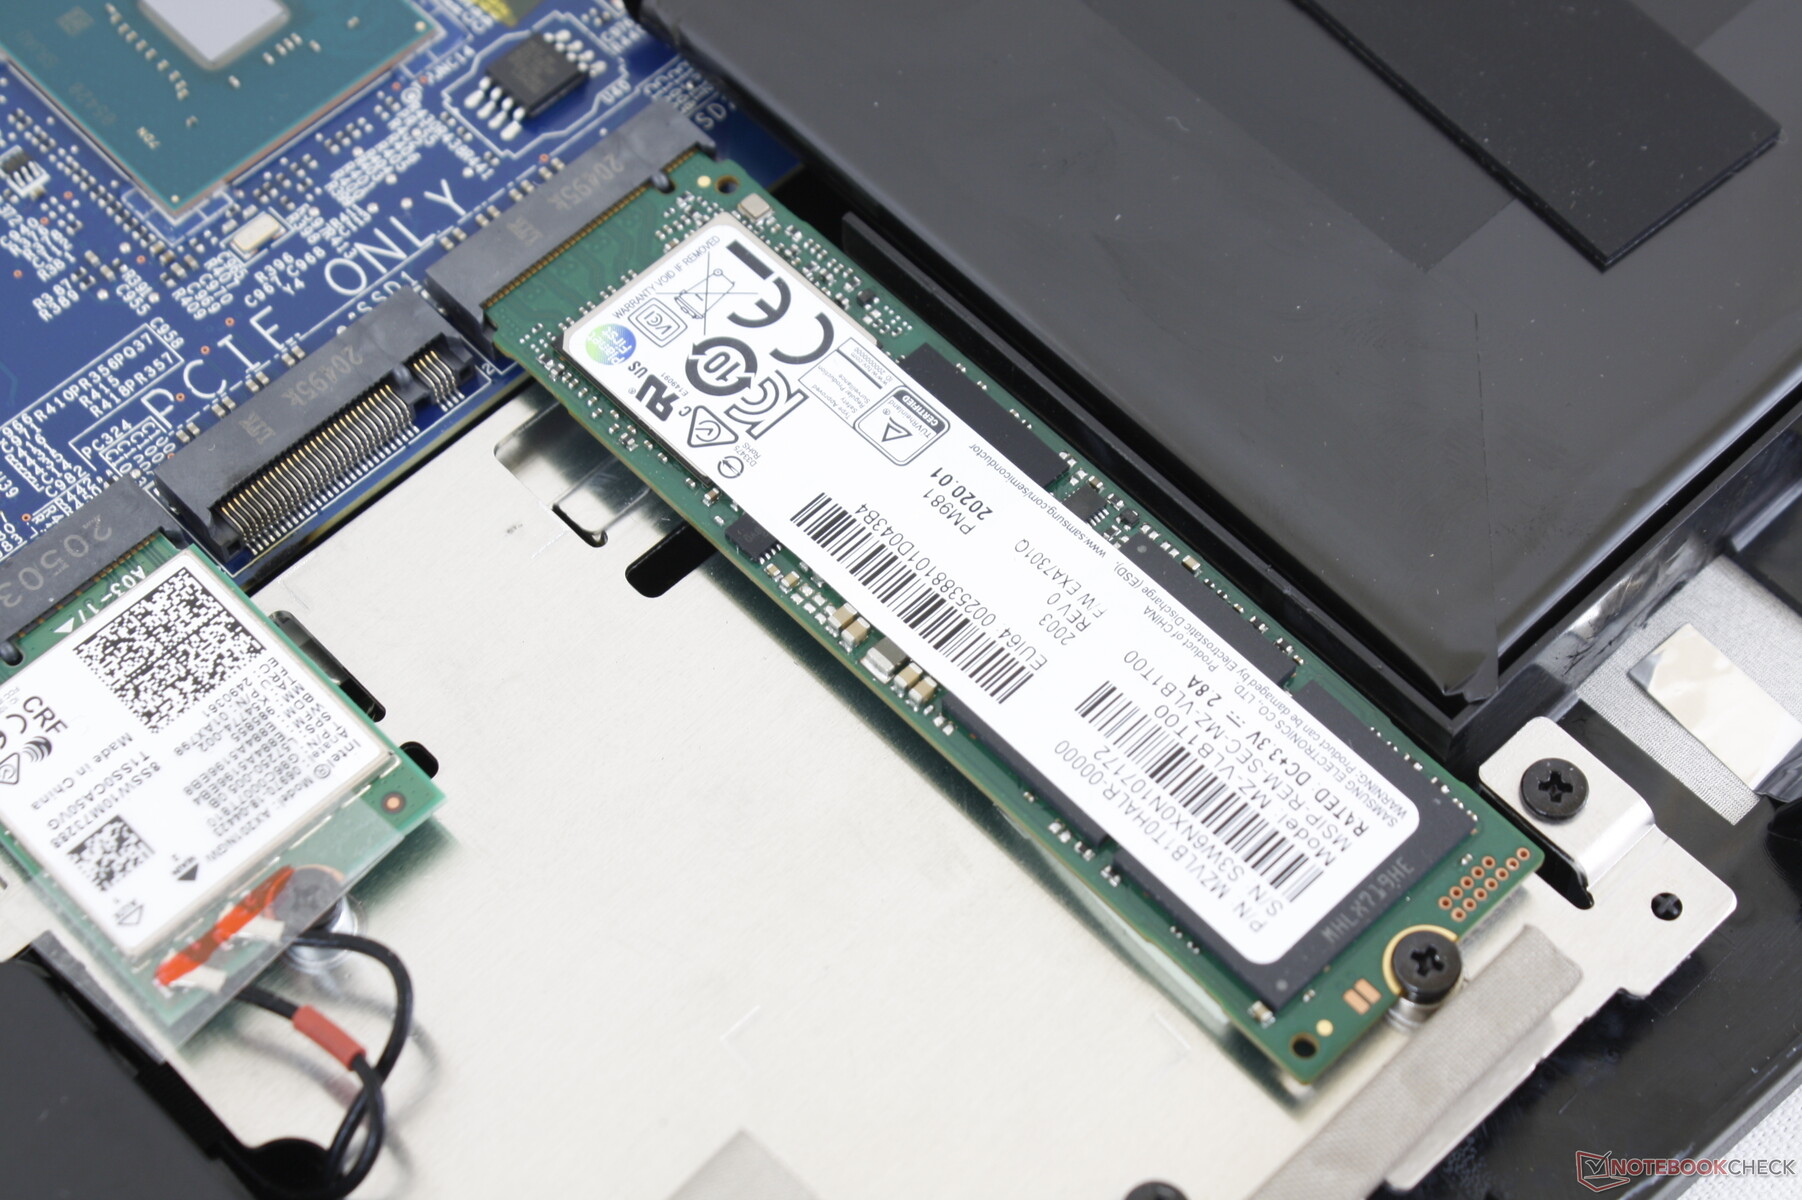
Our unit comes with a 1 TB Samsung PM981 NVMe SSD but other sellers will likely have something different depending on the desired capacity and price. We're able to both reach and maintain the theoretical 3200 MB/s sequential read speed of the drive as shown by our DiskSpd loop test below.
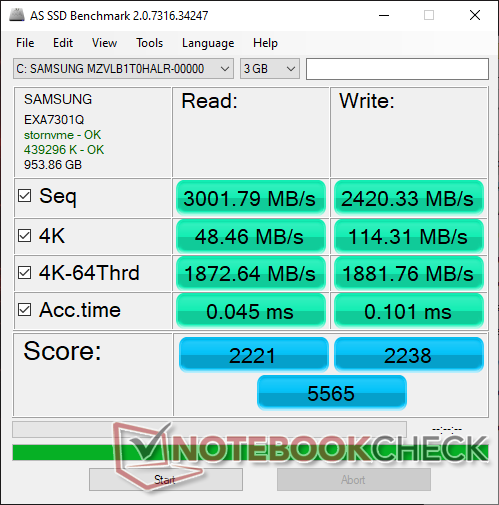
| MSI GF65 Thin 10UE Samsung SSD PM981 MZVLB1T0HALR | Asus ROG Strix G15 G513QR SK Hynix HFM001TD3JX013N | Schenker XMG Core 15 Ampere Samsung SSD 970 EVO Plus 1TB | MSI GS66 Stealth 10UG WDC PC SN730 SDBPNTY-1T00 | Lenovo Legion 7 15IMH05-81YT001VGE 2x Samsung PM981a MZVLB1T0HBLR (RAID 0) | |
|---|---|---|---|---|---|
| AS SSD | -7% | 10% | -4% | -7% | |
| Seq Read (MB/s) | 3002 | 2881 -4% | 2829 -6% | 2198 -27% | 3088 3% |
| Seq Write (MB/s) | 2420 | 1570 -35% | 2646 9% | 2596 7% | 2561 6% |
| 4K Read (MB/s) | 48.46 | 52.4 8% | 54.8 13% | 43.81 -10% | 43.01 -11% |
| 4K Write (MB/s) | 114.3 | 124 8% | 179.1 57% | 115.5 1% | 102 -11% |
| 4K-64 Read (MB/s) | 1873 | 1334 -29% | 1734 -7% | 1692 -10% | 1549 -17% |
| 4K-64 Write (MB/s) | 1882 | 2189 16% | 2396 27% | 2162 15% | 1378 -27% |
| Access Time Read * (ms) | 0.045 | 0.055 -22% | 0.033 27% | 0.056 -24% | 0.051 -13% |
| Access Time Write * (ms) | 0.101 | 0.03 70% | 0.021 79% | 0.098 3% | 0.037 63% |
| Score Read (Points) | 2221 | 1675 -25% | 2072 -7% | 1956 -12% | 1901 -14% |
| Score Write (Points) | 2238 | 2470 10% | 2839 27% | 2537 13% | 1737 -22% |
| Score Total (Points) | 5565 | 4943 -11% | 5965 7% | 5513 -1% | 4583 -18% |
| Copy ISO MB/s (MB/s) | 2421 | 1277 -47% | 2119 -12% | 2236 -8% | 2684 11% |
| Copy Program MB/s (MB/s) | 705 | 575 -18% | 406.1 -42% | 690 -2% | 544 -23% |
| Copy Game MB/s (MB/s) | 1490 | 1272 -15% | 1086 -27% | 1546 4% | 1116 -25% |
| CrystalDiskMark 5.2 / 6 | 14% | 4% | 8% | ||
| Write 4K (MB/s) | 157.3 | 139.1 -12% | 163.1 4% | 110.4 -30% | |
| Read 4K (MB/s) | 46.69 | 47.59 2% | 48.97 5% | 55.1 18% | |
| Write Seq (MB/s) | 2389 | 2917 22% | 2607 9% | ||
| Read Seq (MB/s) | 2196 | 2586 18% | 2316 5% | ||
| Write 4K Q32T1 (MB/s) | 407.6 | 511 25% | 338 -17% | 466.6 14% | |
| Read 4K Q32T1 (MB/s) | 519 | 571 10% | 475.6 -8% | 517 0% | |
| Write Seq Q32T1 (MB/s) | 2401 | 3263 36% | 3090 29% | 3424 43% | |
| Read Seq Q32T1 (MB/s) | 3344 | 3567 7% | 3421 2% | 3519 5% | |
| Write 4K Q8T8 (MB/s) | 1496 | ||||
| Read 4K Q8T8 (MB/s) | 1597 | ||||
| Total Average (Program / Settings) | -7% /
-7% | 12% /
12% | 0% /
-1% | 1% /
-2% |
* ... smaller is better

Disk Throttling: DiskSpd Read Loop, Queue Depth 8
GPU Performance
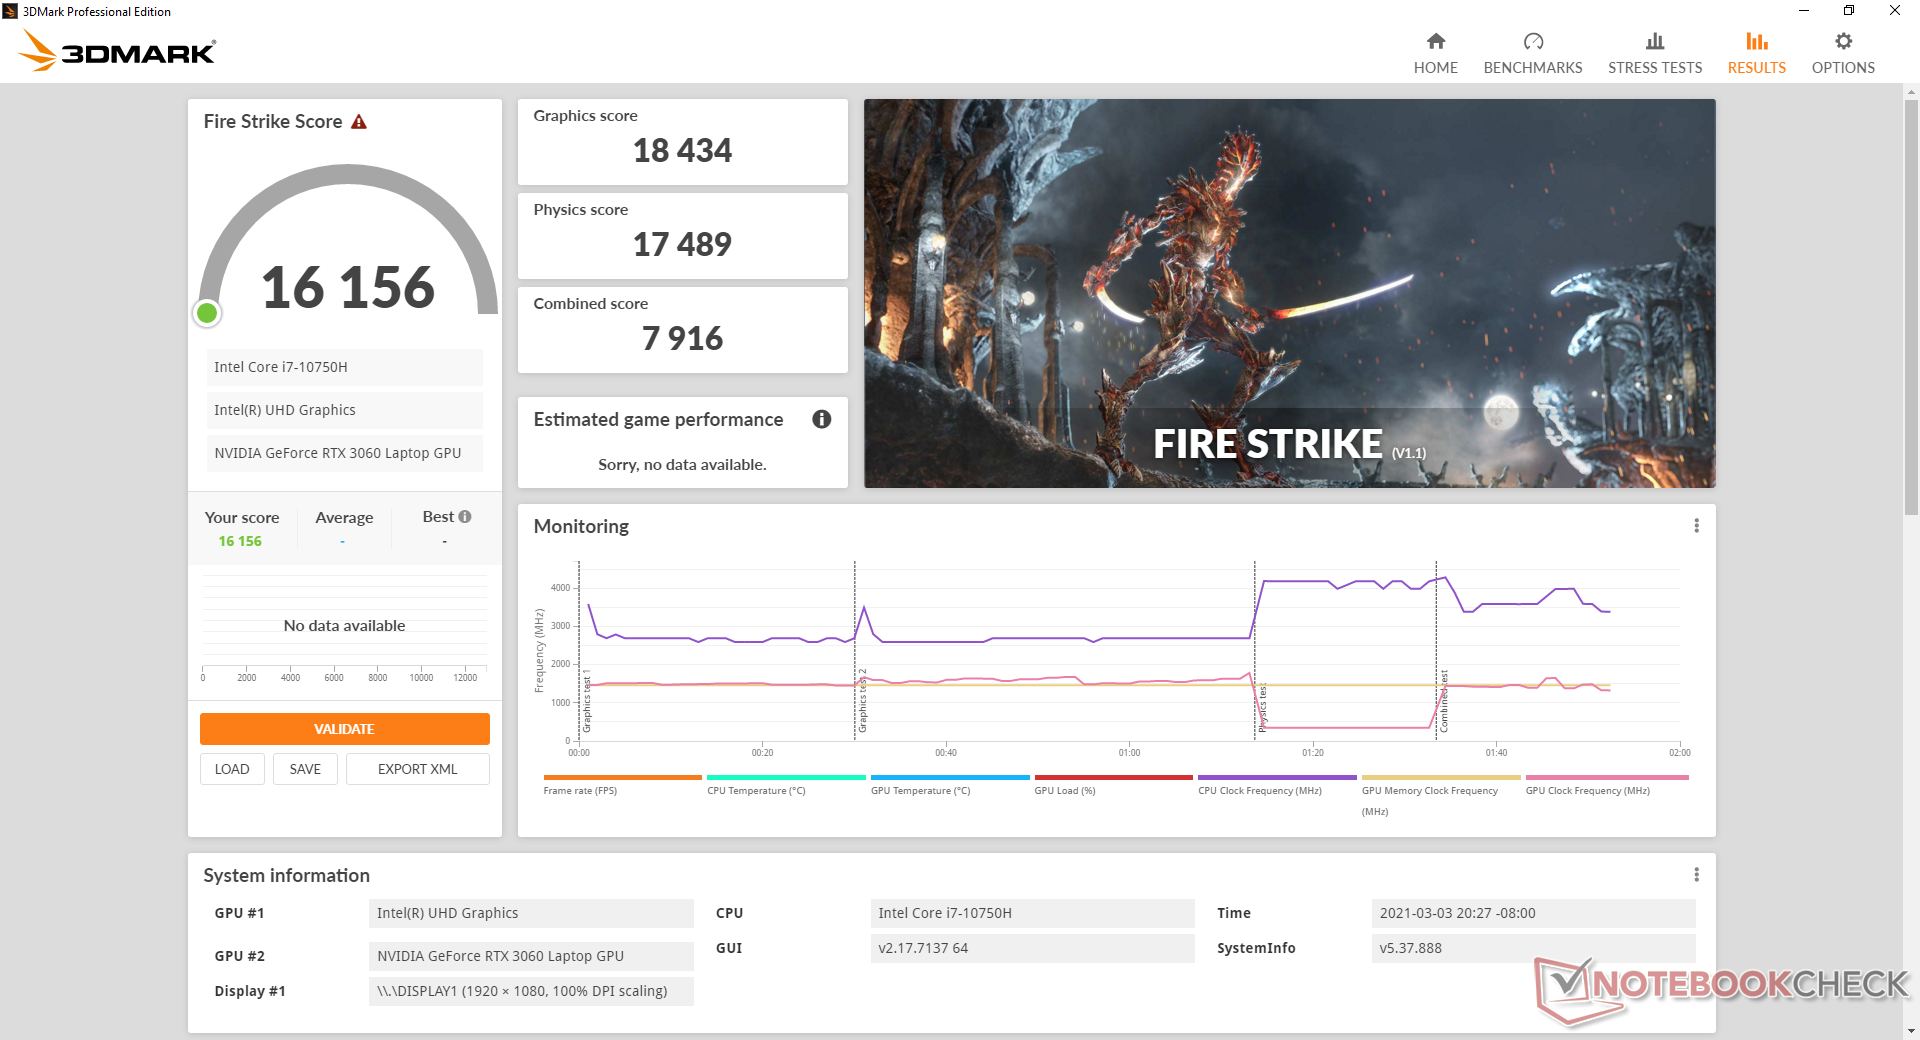
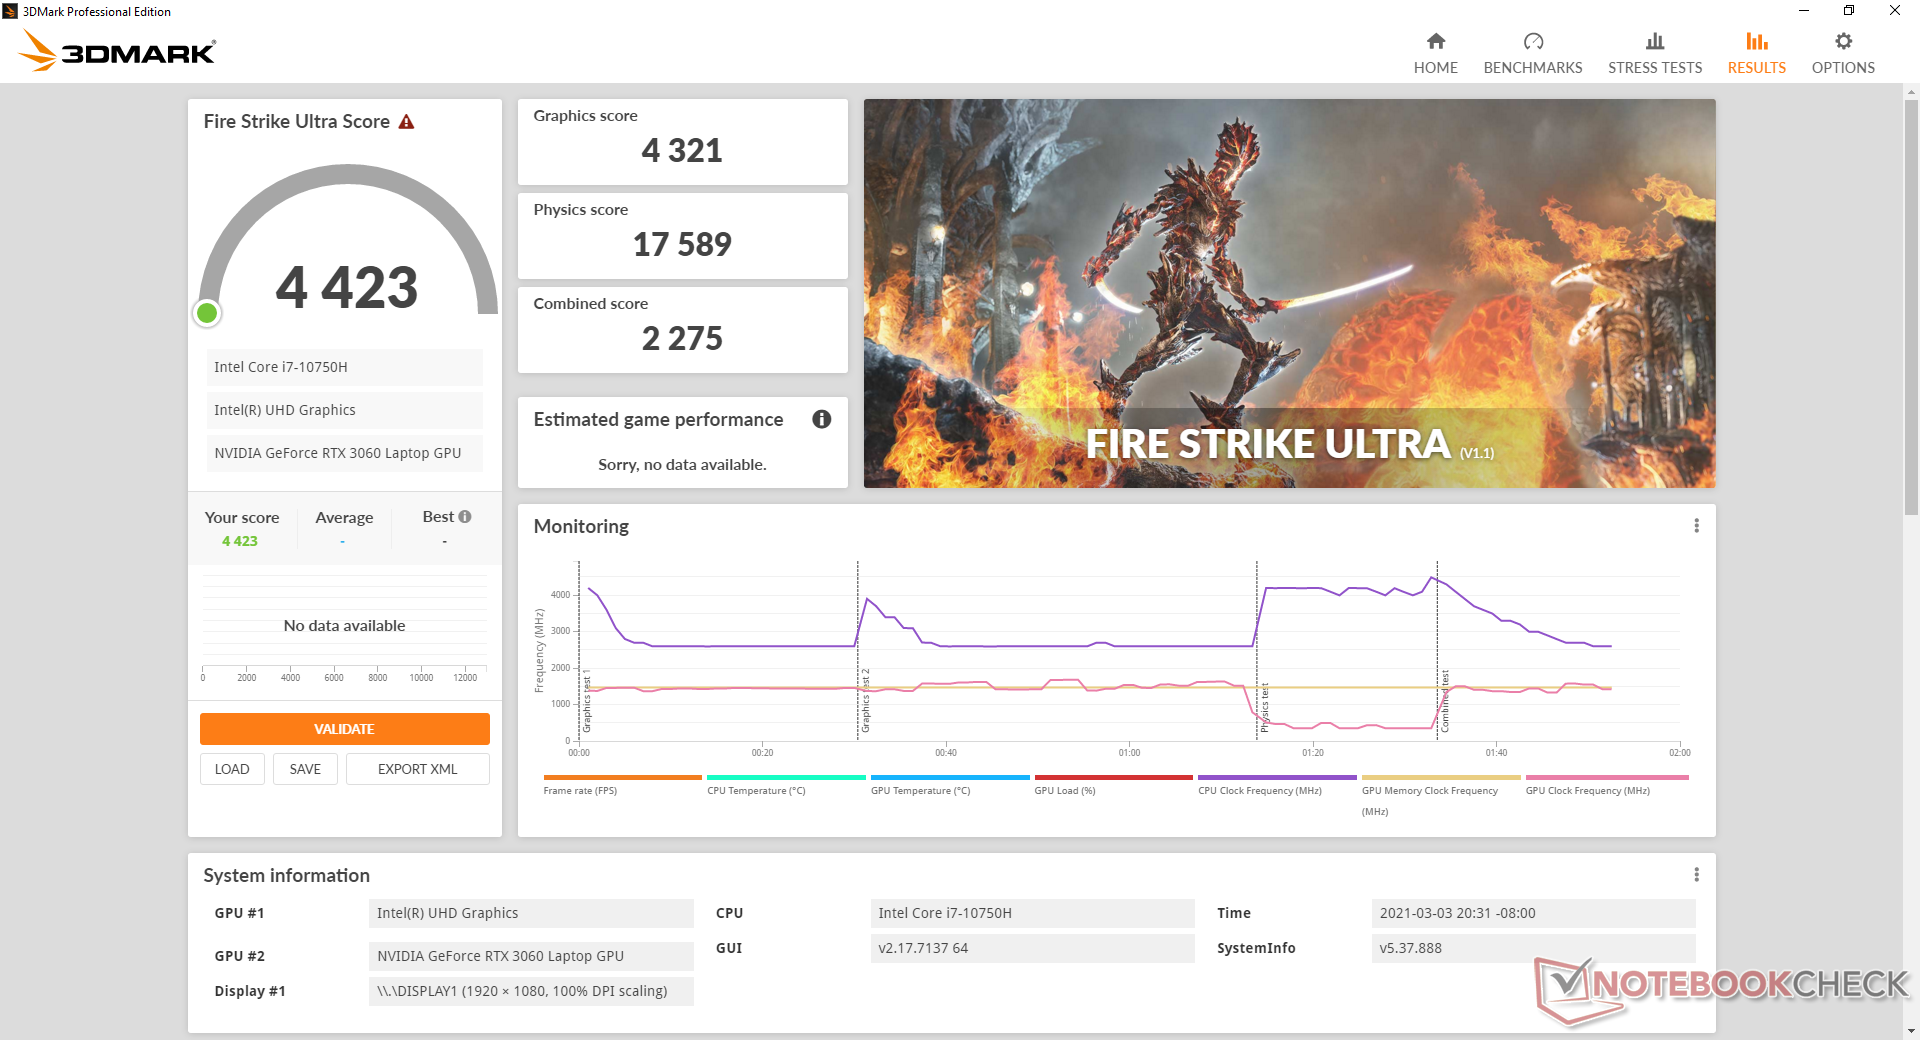
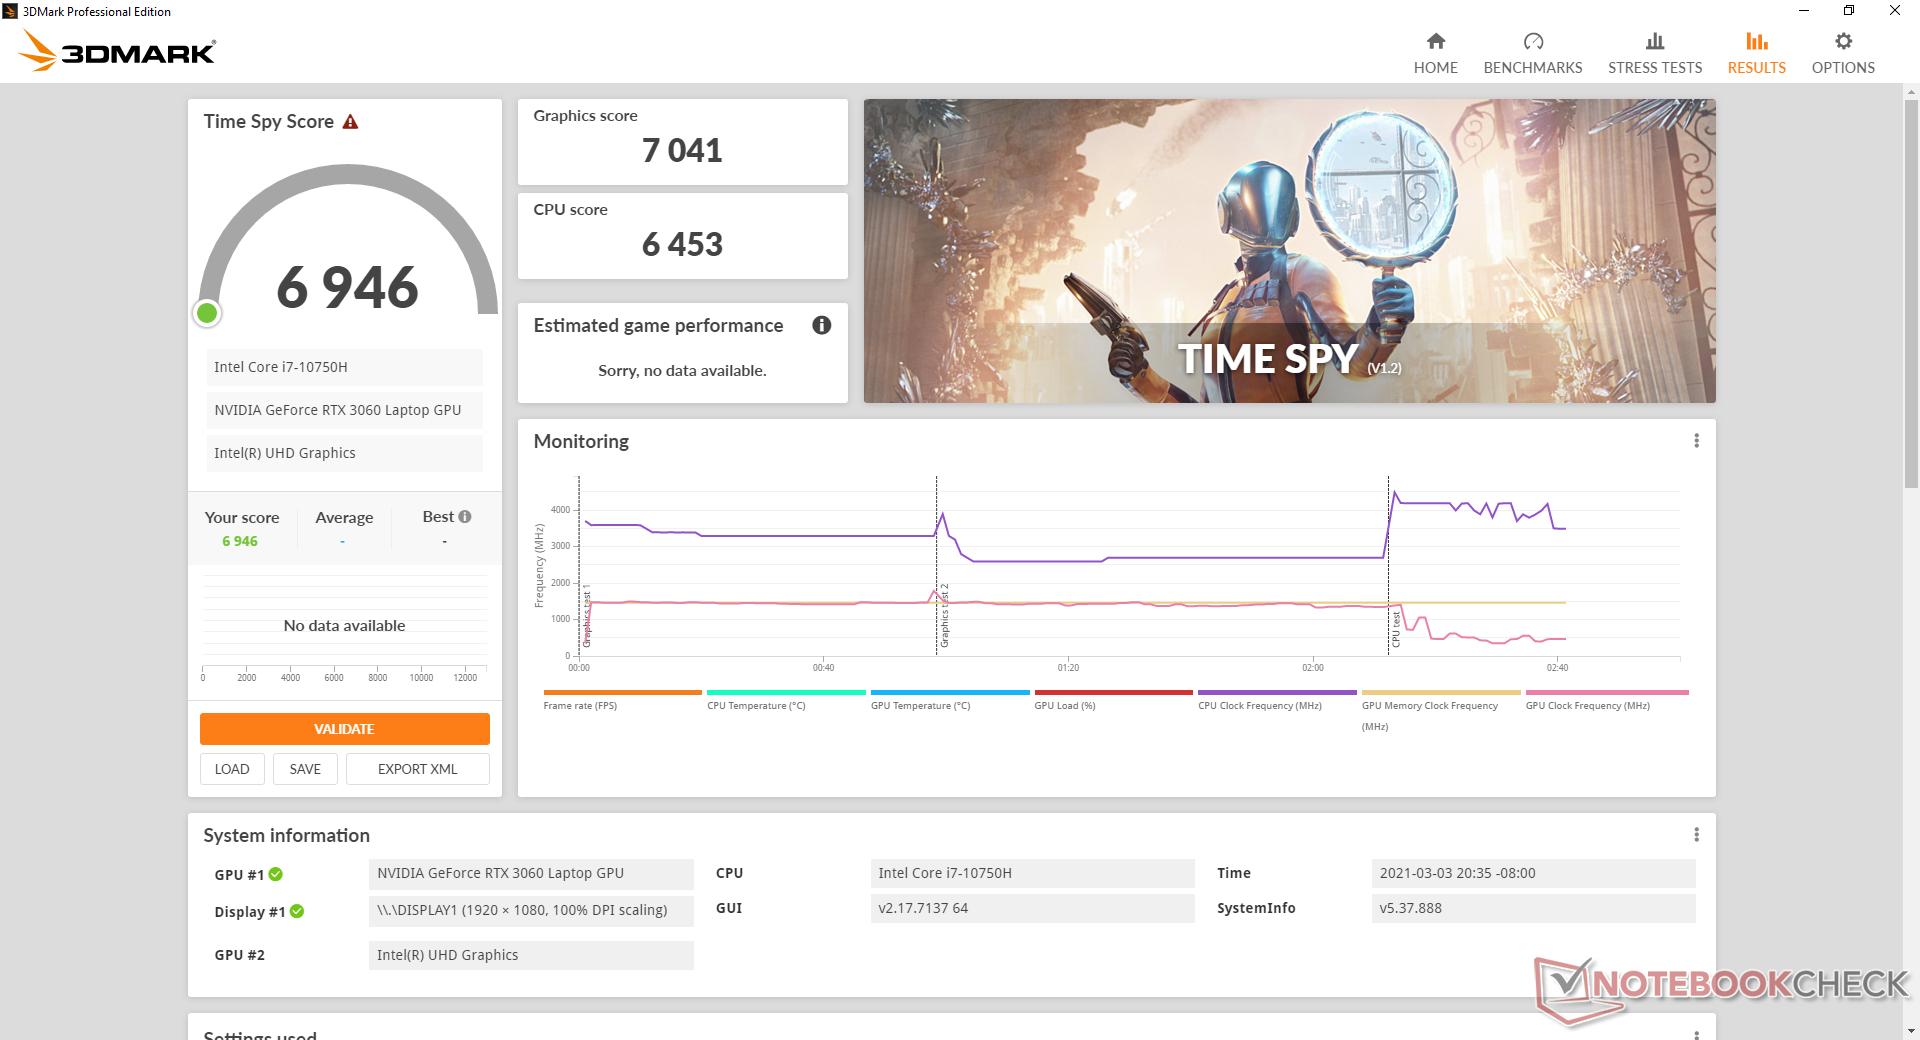
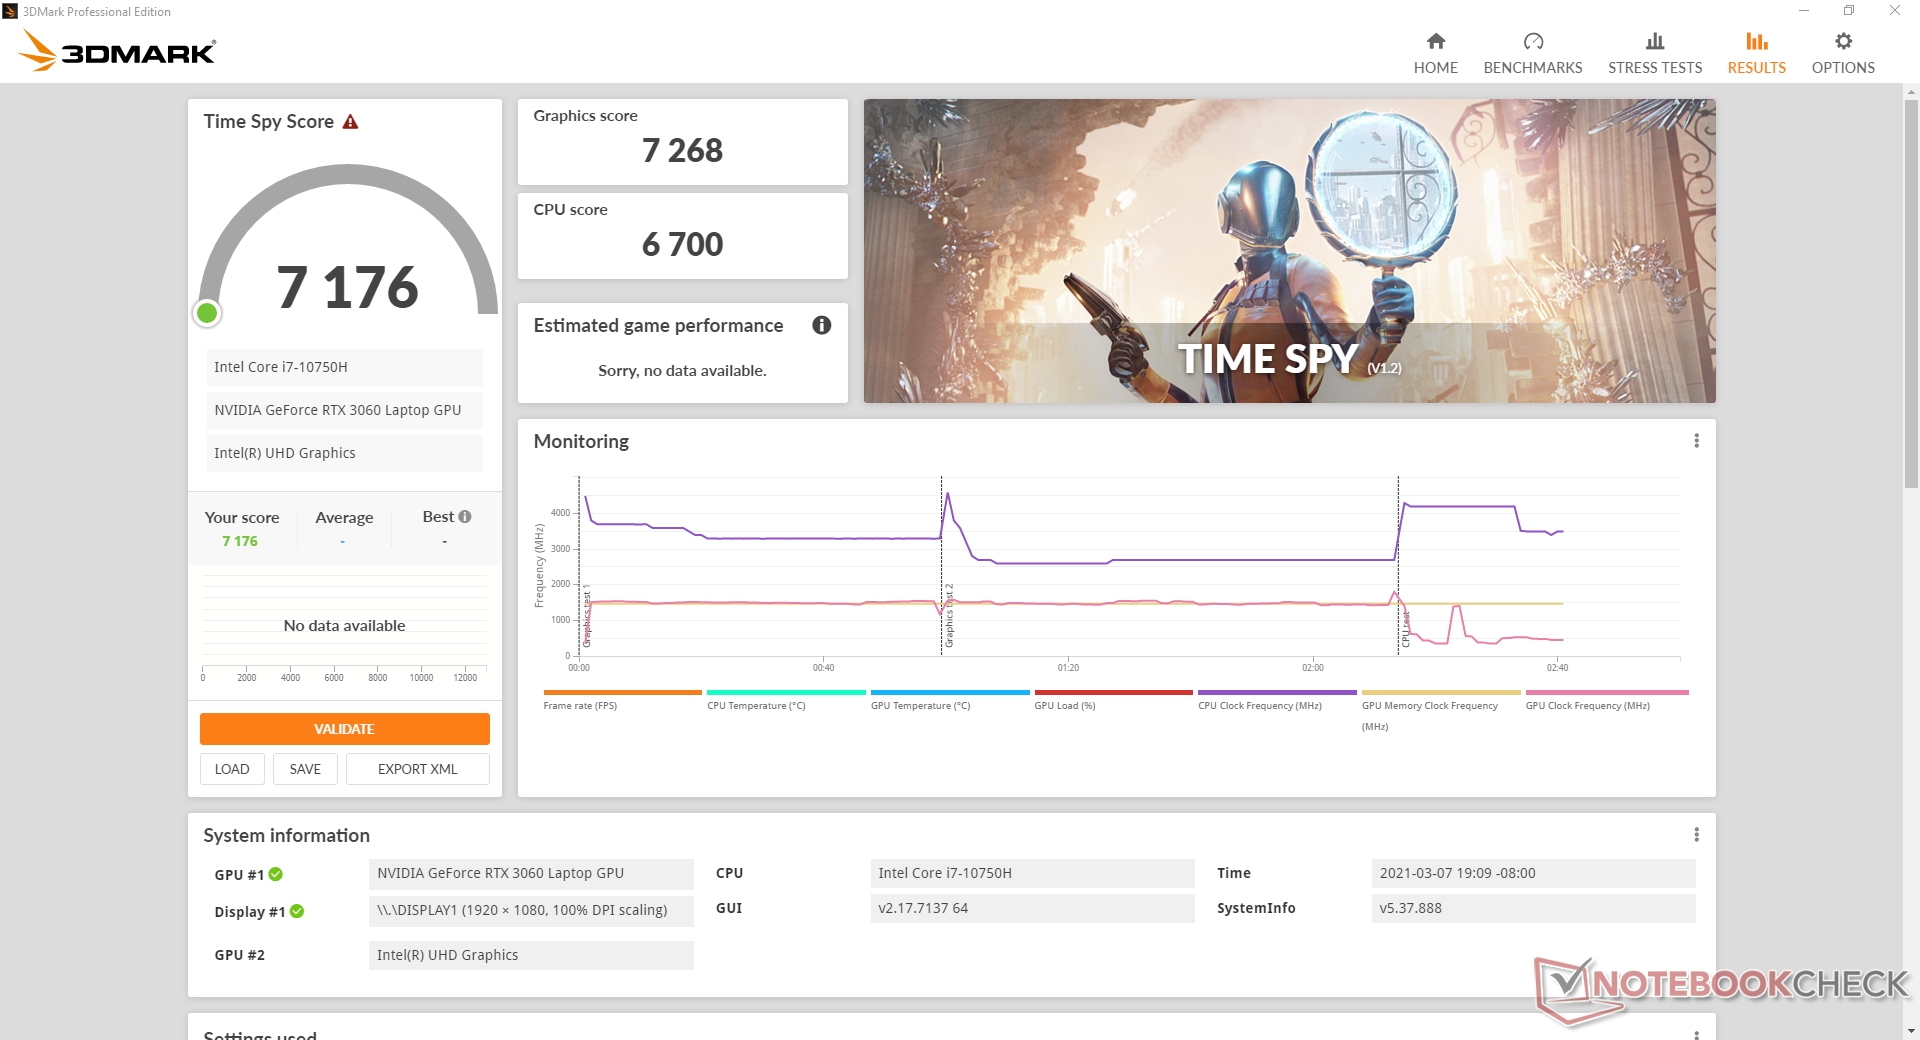
Of the four laptops we've tested thus far with the mobile GeForce RTX 3060, our MSI GF65 is the slowest of the bunch by about 15 percent according to 3DMark benchmarks. Raw performance is still above the mobile RTX 2060 albeit only by about 15 percent. Owners of GeForce RTX 2070 laptops will still enjoy slightly faster graphics performance than this RTX 3060 laptop.
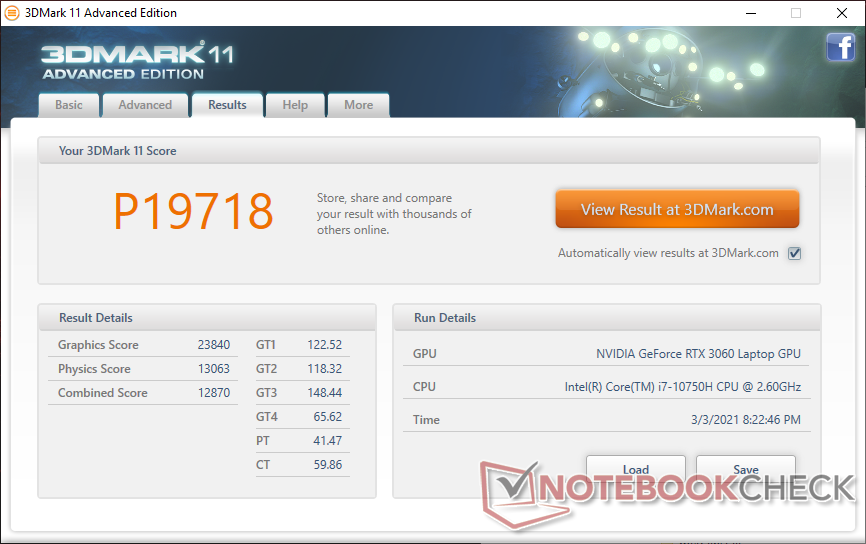
| 3DMark 11 Performance | 19718 points | |
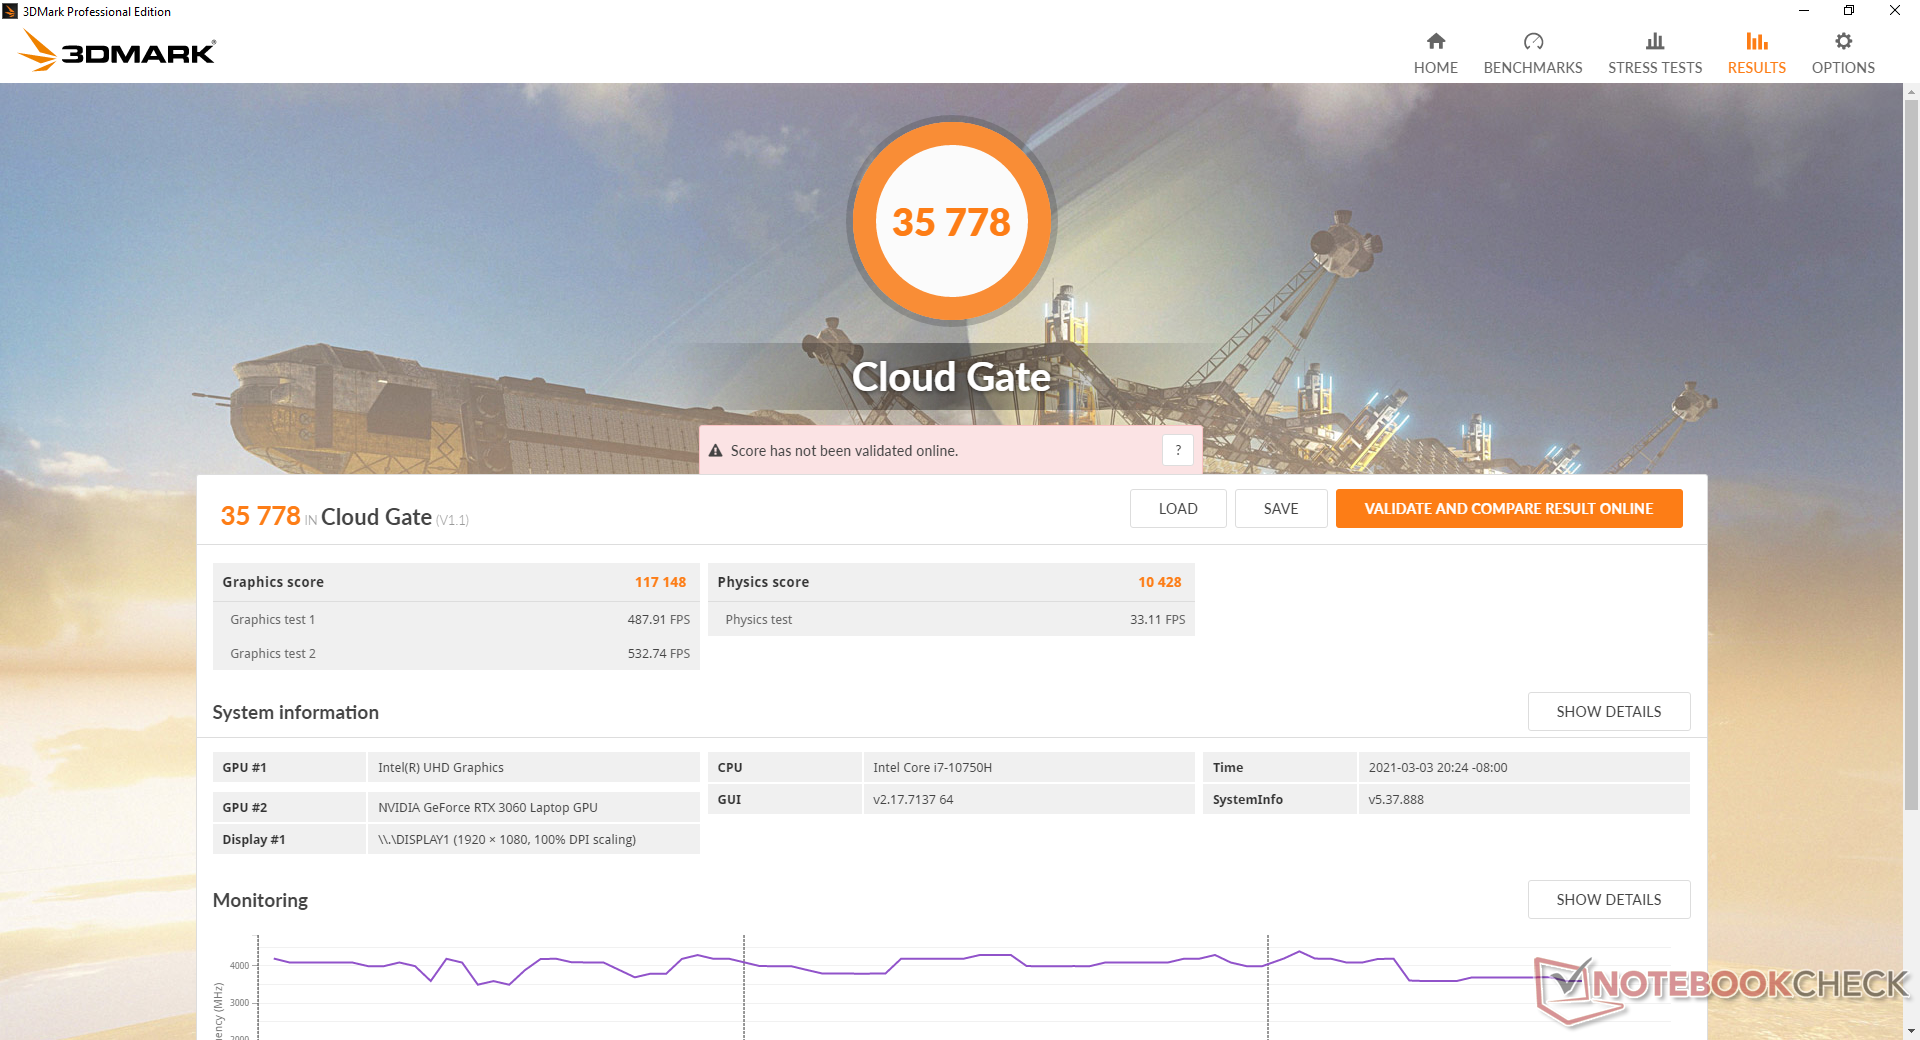
| 3DMark Cloud Gate Standard Score | 35778 points | |
| 3DMark Fire Strike Score | 16156 points | |
| 3DMark Time Spy Score | 6946 points | |
Help | ||
| Dota 2 Reborn - 3840x2160 ultra (3/3) best looking | |
| MSI GF65 Thin 10UE | |
| Average NVIDIA GeForce RTX 3060 Laptop GPU (46.9 - 107, n=11) | |
| low | med. | high | ultra | QHD | 4K | |
|---|---|---|---|---|---|---|
| GTA V (2015) | 164 | 152 | 120 | 69.2 | ||
| The Witcher 3 (2015) | 294 | 223.2 | 134.2 | 68.7 | ||
| Dota 2 Reborn (2015) | 125 | 116 | 109 | 90.7 | 94.9 | |
| Final Fantasy XV Benchmark (2018) | 124 | 89.8 | 70.3 | 53.6 | 30.7 | |
| X-Plane 11.11 (2018) | 83.6 | 73 | 62.2 | 62.3 | ||
| Far Cry 5 (2018) | 131 | 108 | 103 | 97 | ||
| Strange Brigade (2018) | 269 | 172 | 138 | 121 |
Emissions
System Noise
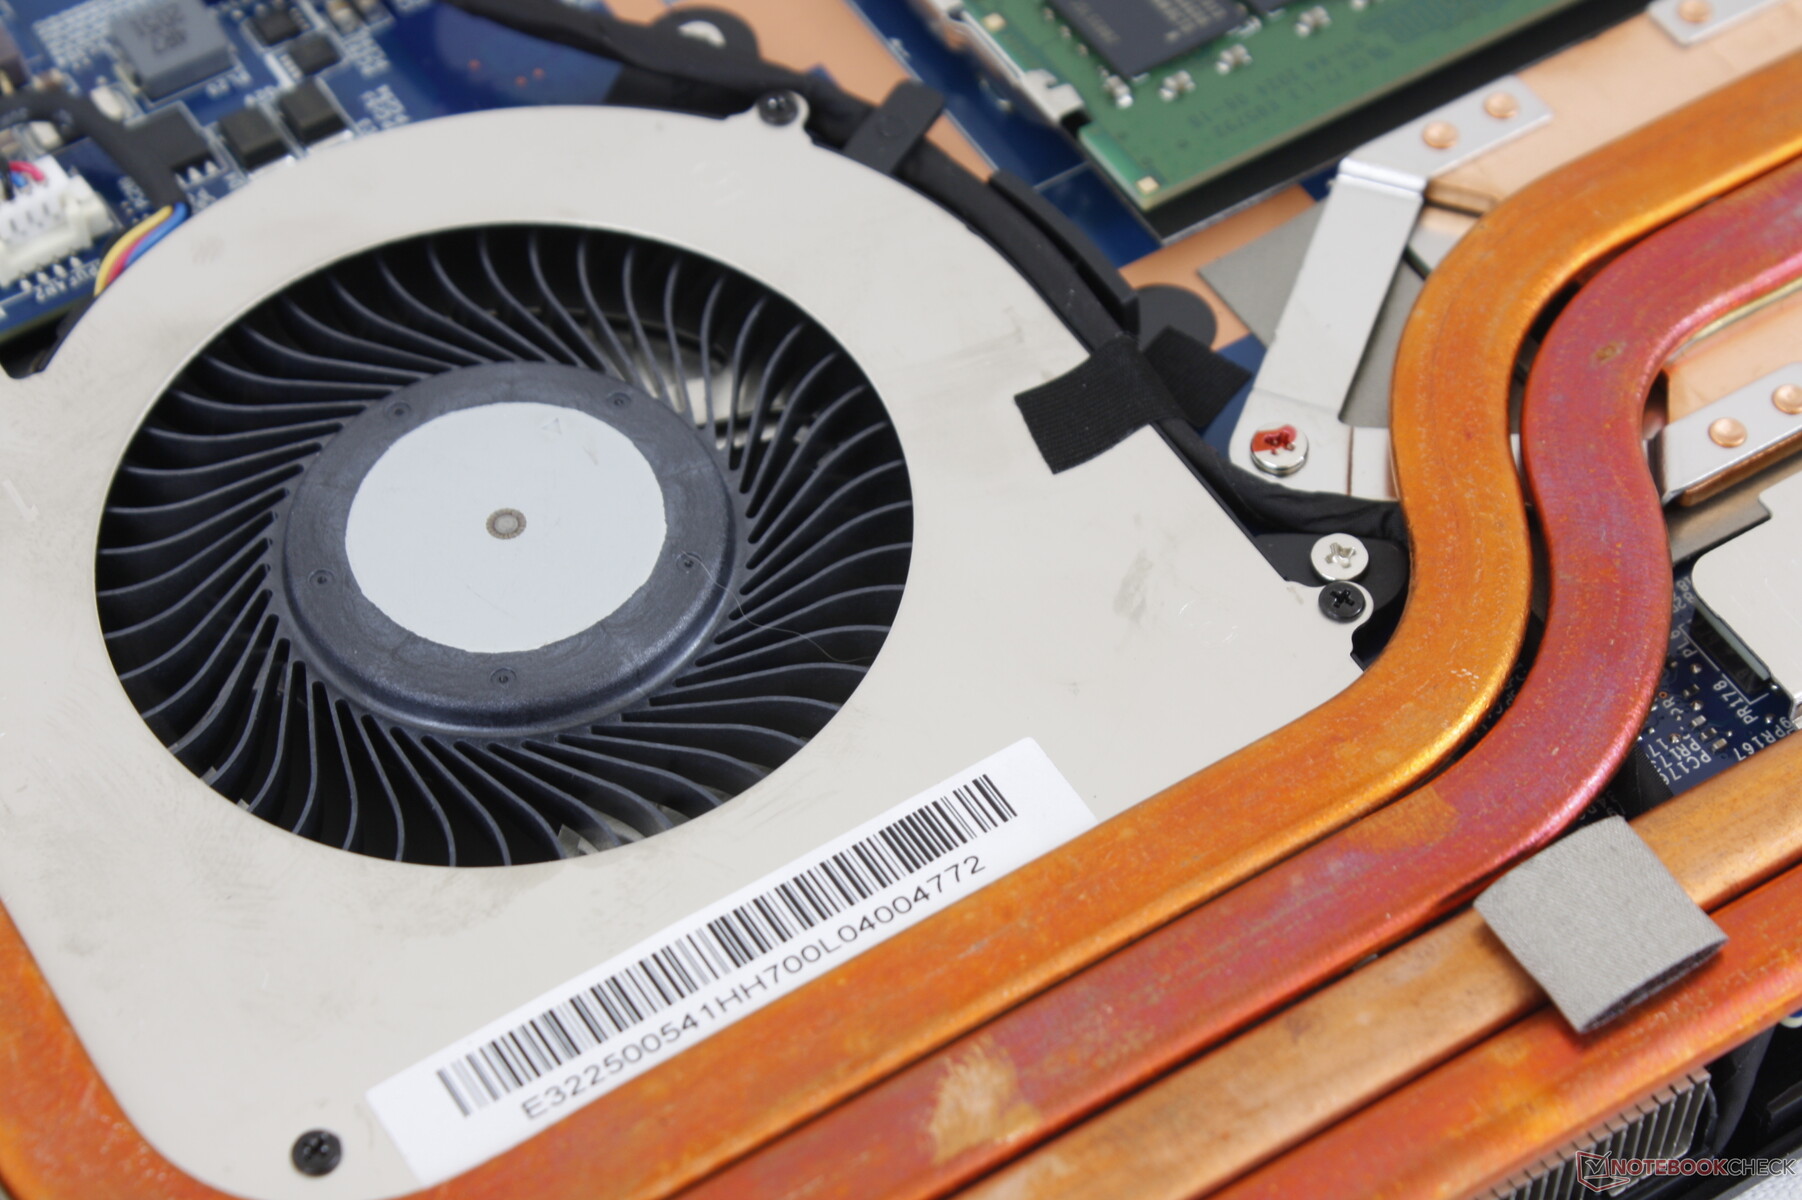
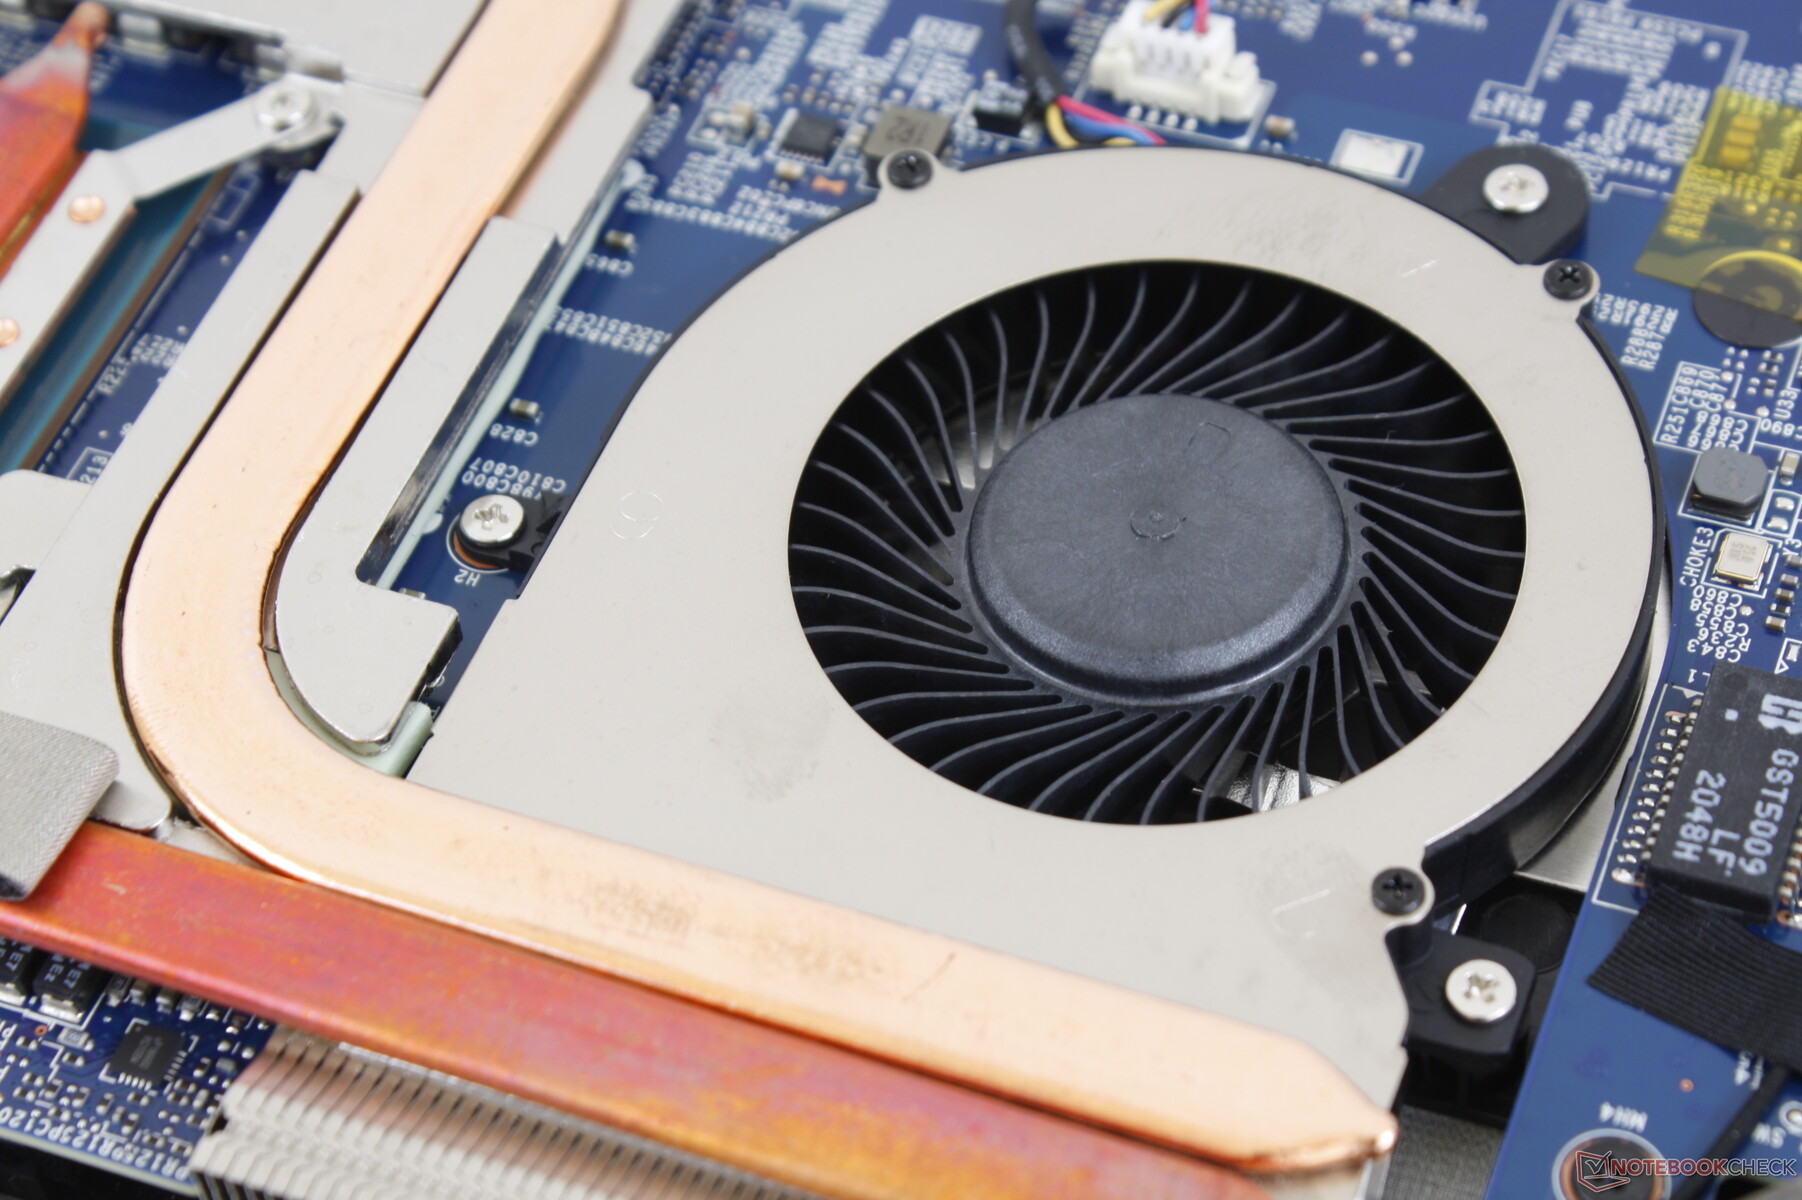
When plugged into an outlet, fan noise will always be present no matter the setting even when set to MSI "Silent" mode. The fans will only truly become silent if running on battery power. Otherwise, the fans will always be audible at 33 dB(A) during low-power activities like web browsing or video streaming which can be a bit annoying.
Fan noise when gaming on Extreme Performance mode will hover around the low 40 dB(A) range to be quieter than what we observed on the GF65 9SD. However, this may ramp up higher during gameplay depending on the CPU load. Enabling Cooler Boost mode mode will bump fan noise up to an ear-screeching 59 dB(A).
| MSI GF65 Thin 10UE GeForce RTX 3060 Laptop GPU, i7-10750H, Samsung SSD PM981 MZVLB1T0HALR | Asus ROG Strix G15 G513QR GeForce RTX 3070 Laptop GPU, R9 5900HX, SK Hynix HFM001TD3JX013N | Schenker XMG Core 15 Ampere GeForce RTX 3060 Laptop GPU, R7 4800H, Samsung SSD 970 EVO Plus 1TB | MSI GS66 Stealth 10UG GeForce RTX 3070 Laptop GPU, i7-10870H, WDC PC SN730 SDBPNTY-1T00 | Aorus 15G XC GeForce RTX 3070 Laptop GPU, i7-10870H, ESR512GTLCG-EAC-4 | Lenovo Legion 7 15IMH05-81YT001VGE GeForce RTX 2080 Super Max-Q, i9-10980HK, 2x Samsung PM981a MZVLB1T0HBLR (RAID 0) | MSI GF65 9SD GeForce GTX 1660 Ti Mobile, i7-9750H, Kingston RBUSNS8154P3512GJ | |
|---|---|---|---|---|---|---|---|
| Noise | 4% | 6% | -5% | 4% | 8% | -6% | |
| off / environment * (dB) | 24.7 | 24 3% | 24 3% | 26.2 -6% | 25 -1% | 24.4 1% | 28.7 -16% |
| Idle Minimum * (dB) | 33.1 | 25 24% | 26 21% | 34 -3% | 29 12% | 24.4 26% | 33.3 -1% |
| Idle Average * (dB) | 33.1 | 31 6% | 28 15% | 34 -3% | 30 9% | 24.4 26% | 33.9 -2% |
| Idle Maximum * (dB) | 33.1 | 33 -0% | 30 9% | 34 -3% | 31 6% | 24.4 26% | 33.9 -2% |
| Load Average * (dB) | 42.7 | 45 -5% | 42 2% | 47.2 -11% | 41 4% | 49.3 -15% | 41 4% |
| Witcher 3 ultra * (dB) | 40.6 | 48 -18% | 50 -23% | 46.3 -14% | 47 -16% | 54 -33% | 49.5 -22% |
| Load Maximum * (dB) | 59.4 | 50 16% | 52 12% | 58.2 2% | 51 14% | 46.6 22% | 59.5 -0% |
* ... smaller is better
Noise level
| Idle |
| 33.1 / 33.1 / 33.1 dB(A) |
| Load |
| 42.7 / 59.4 dB(A) |
 | ||
30 dB silent 40 dB(A) audible 50 dB(A) loud |
||
min: | ||
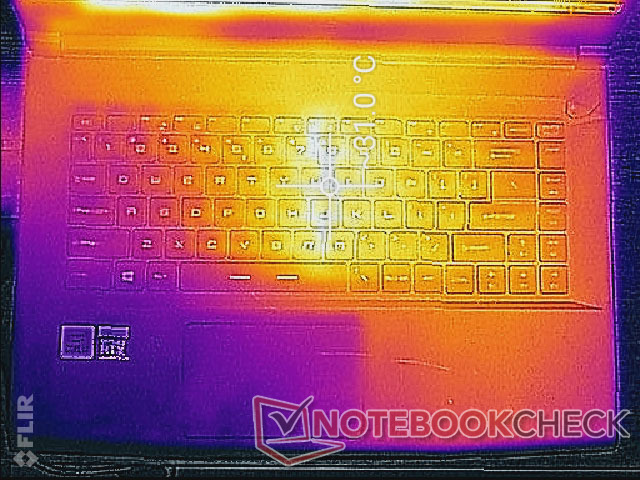
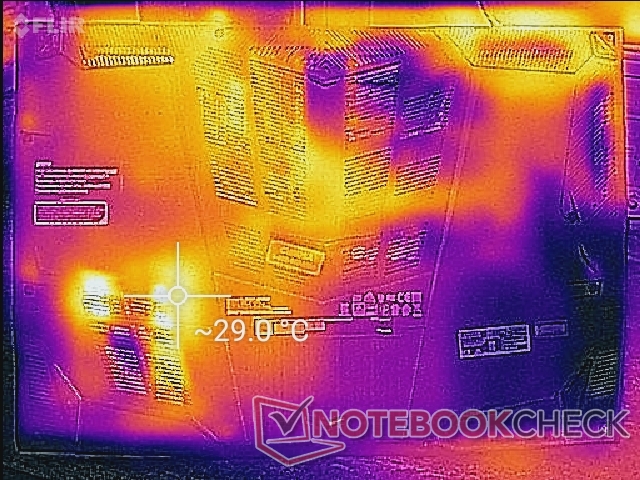
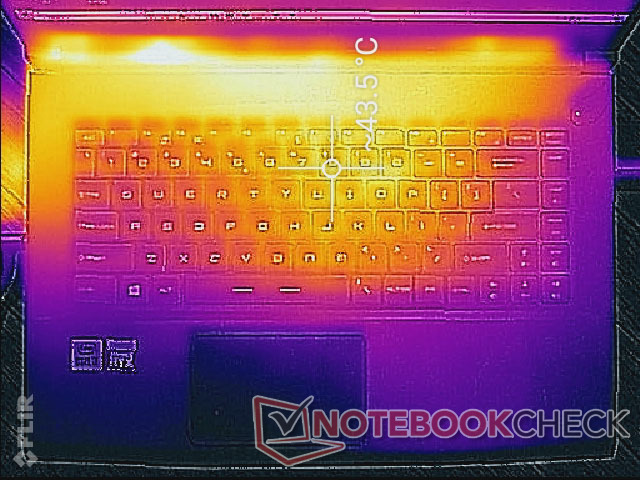
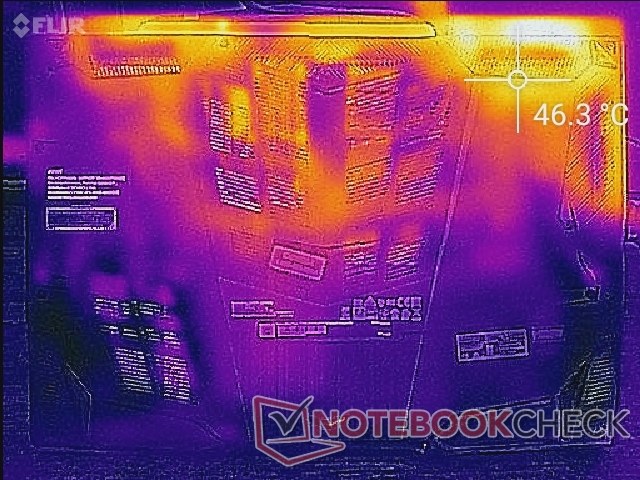
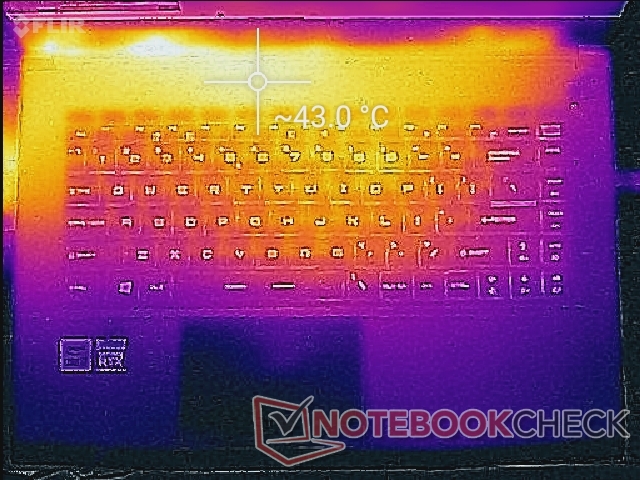
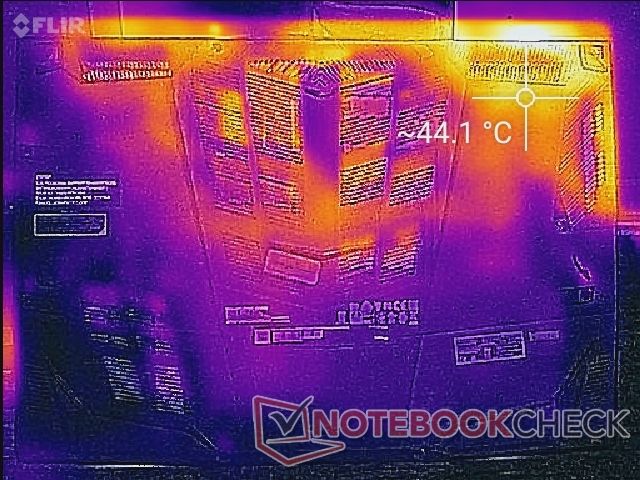
Temperature
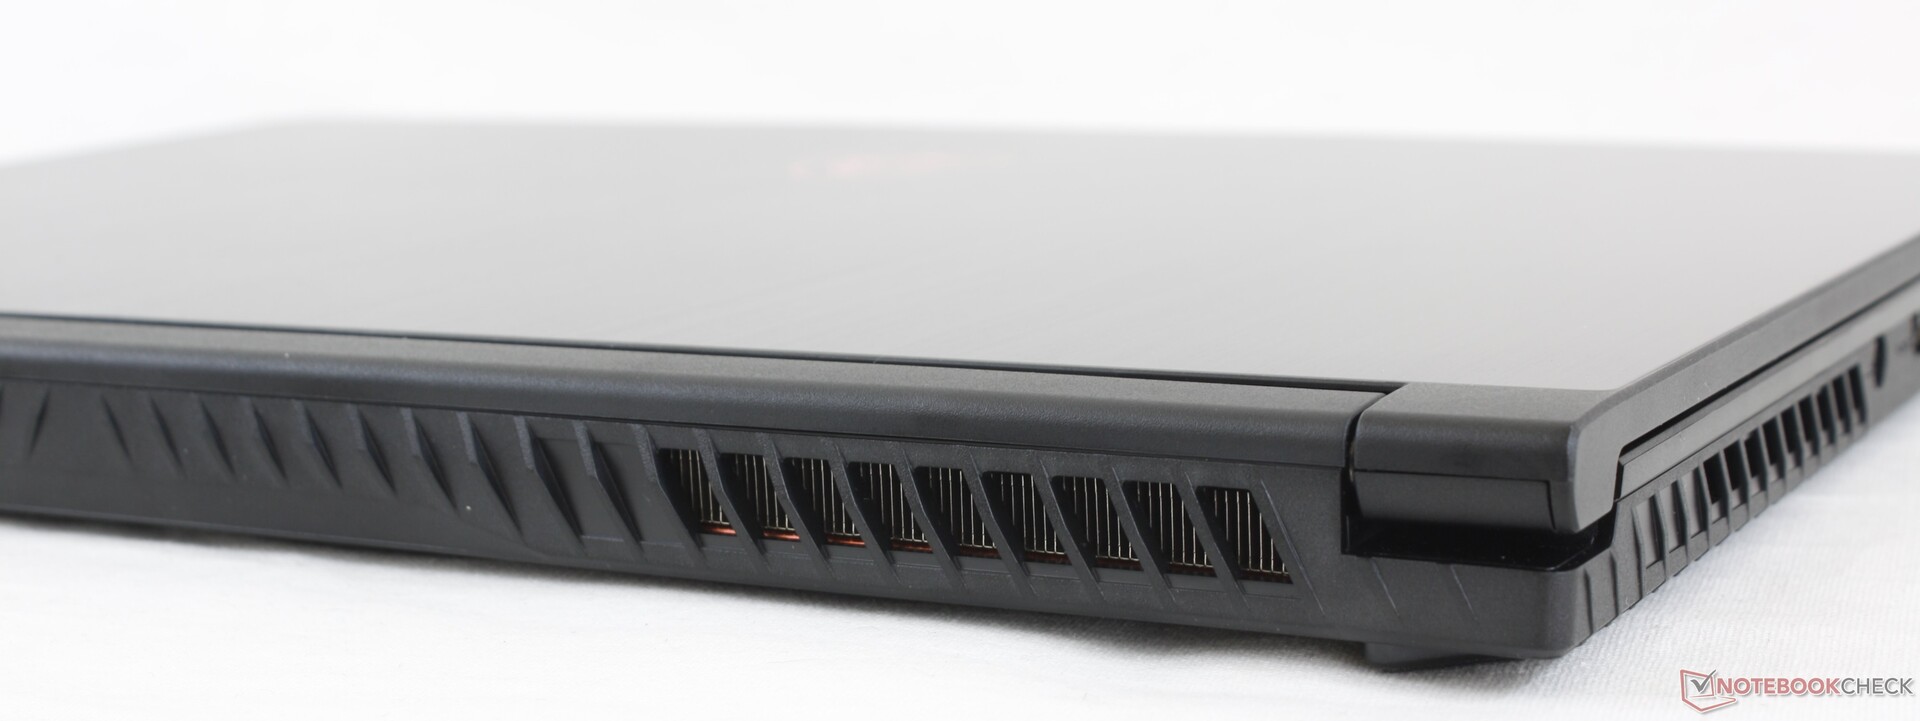
Surface temperatures are warmest toward the rear quadrants away from the WASD keys and arrow keys. Hot spots can be as warm as 44 C when gaming which is very close to what we recorded on the older GF65 9SD. Much of the bottom surface remains relatively cool when gaming.
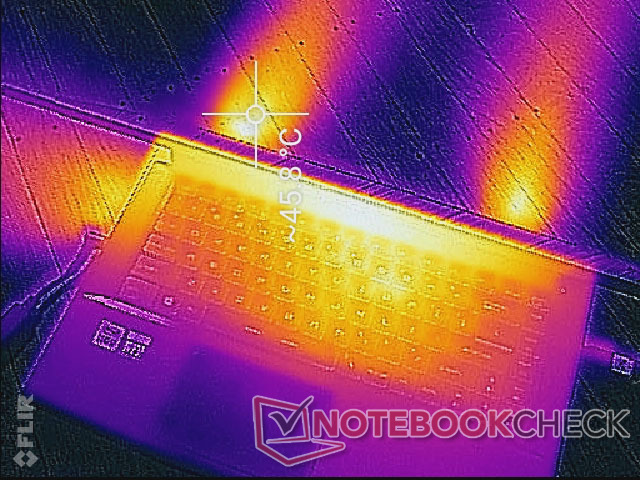
(±) The maximum temperature on the upper side is 43.4 °C / 110 F, compared to the average of 40.4 °C / 105 F, ranging from 21.2 to 68.8 °C for the class Gaming.
(±) The bottom heats up to a maximum of 41.8 °C / 107 F, compared to the average of 43.2 °C / 110 F
(+) In idle usage, the average temperature for the upper side is 27.6 °C / 82 F, compared to the device average of 33.9 °C / 93 F.
(±) Playing The Witcher 3, the average temperature for the upper side is 33.9 °C / 93 F, compared to the device average of 33.9 °C / 93 F.
(+) The palmrests and touchpad are cooler than skin temperature with a maximum of 27.4 °C / 81.3 F and are therefore cool to the touch.
(±) The average temperature of the palmrest area of similar devices was 28.8 °C / 83.8 F (+1.4 °C / 2.5 F).
Stress Test
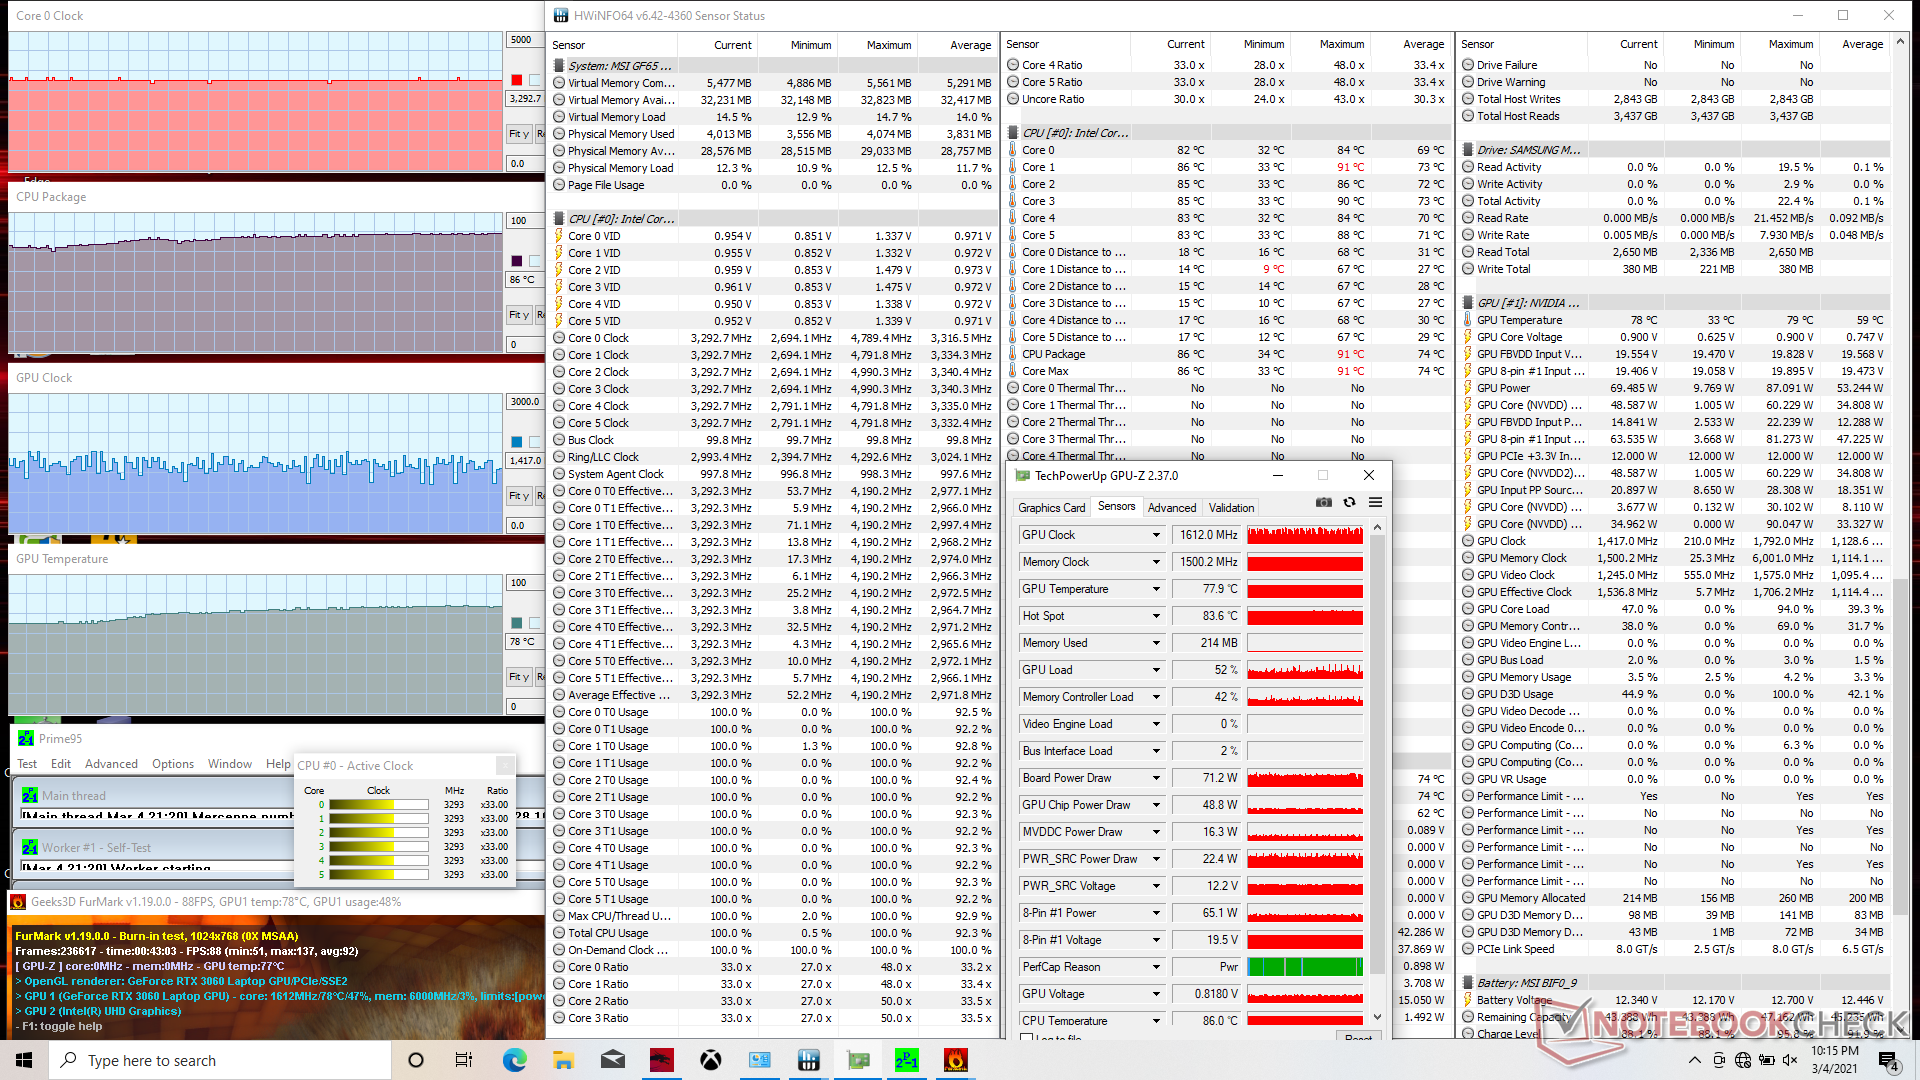
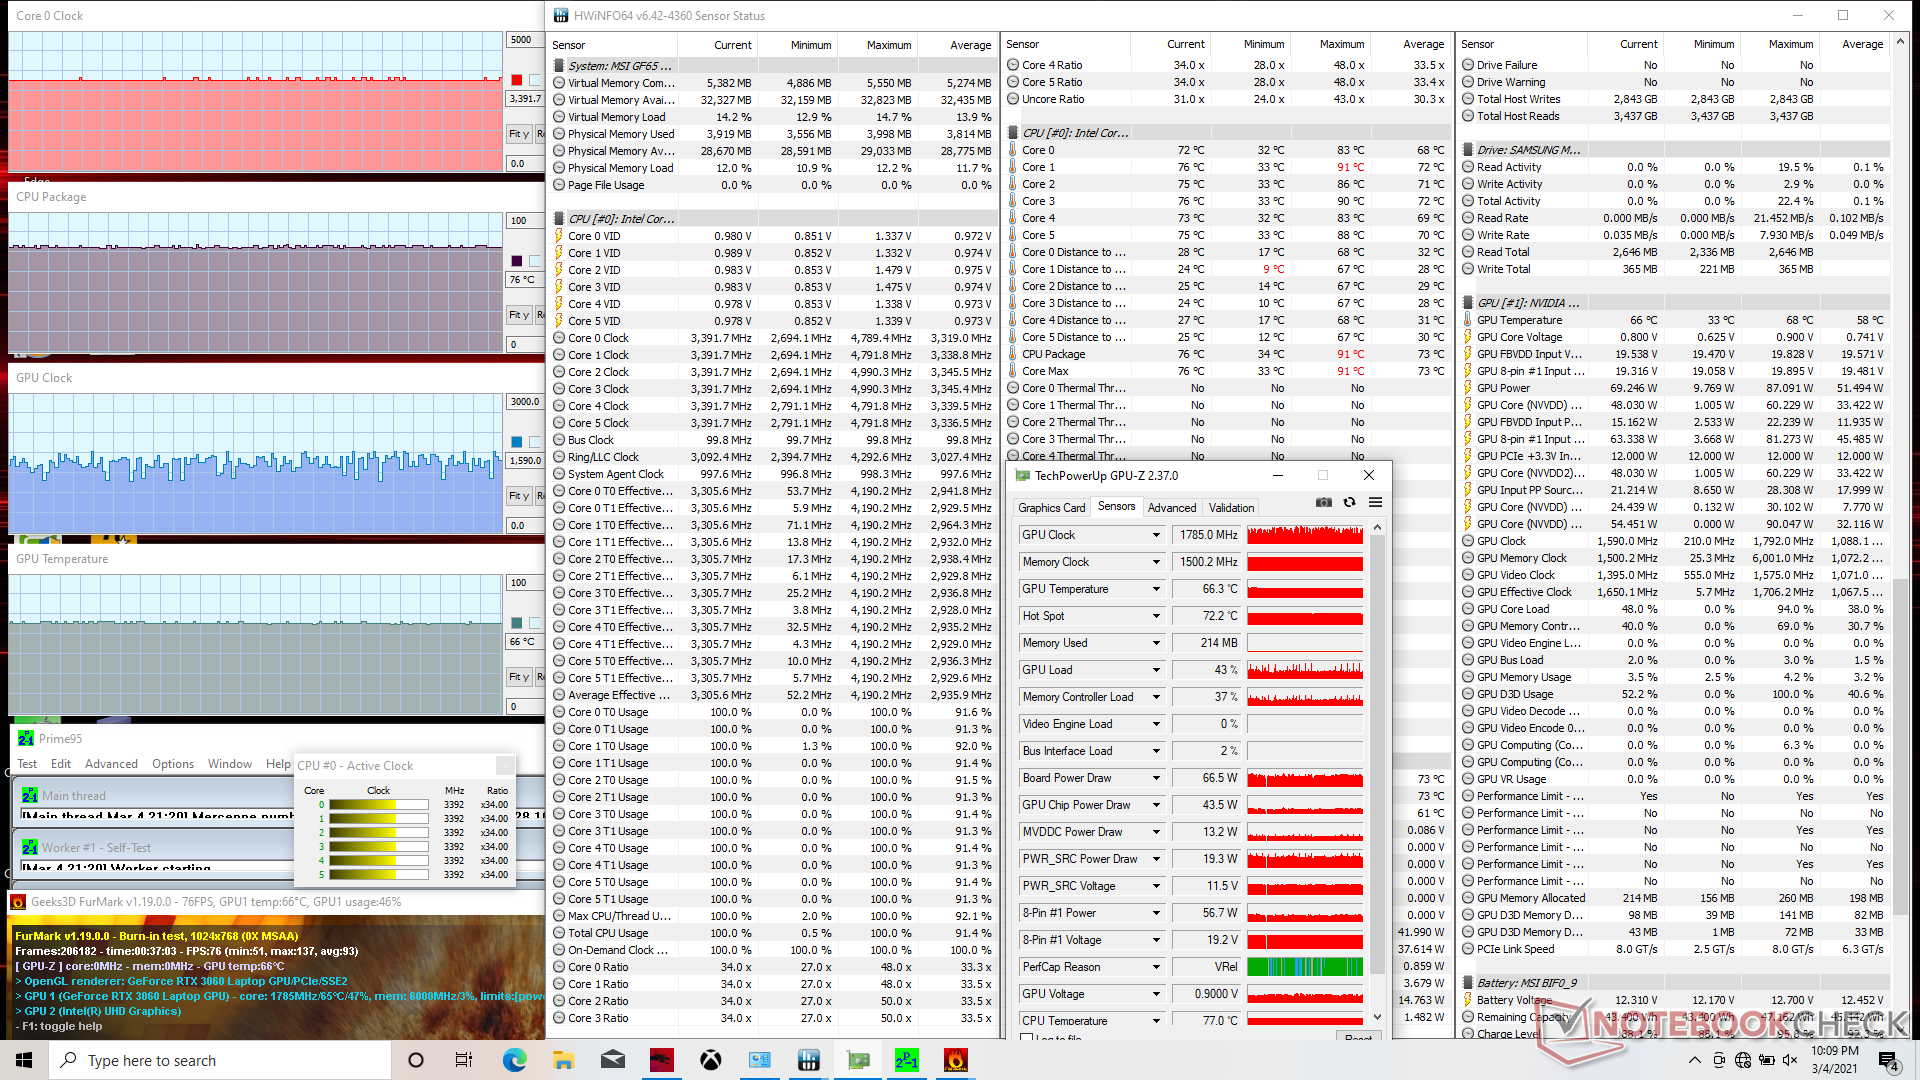
When running Prime95 on Extreme Performance mode, CPU clock rates would reach 4.2 GHz for just the first few seconds until hitting a core temperature of 91 C. Clock rates and temperature would then steadily drop and stabilize at 2.8 GHz and 72 C, respectively. If Cooler Boost is enabled, clock rates and temperature will increase to 3.3 GHz and decrease to 69 C, respectively.
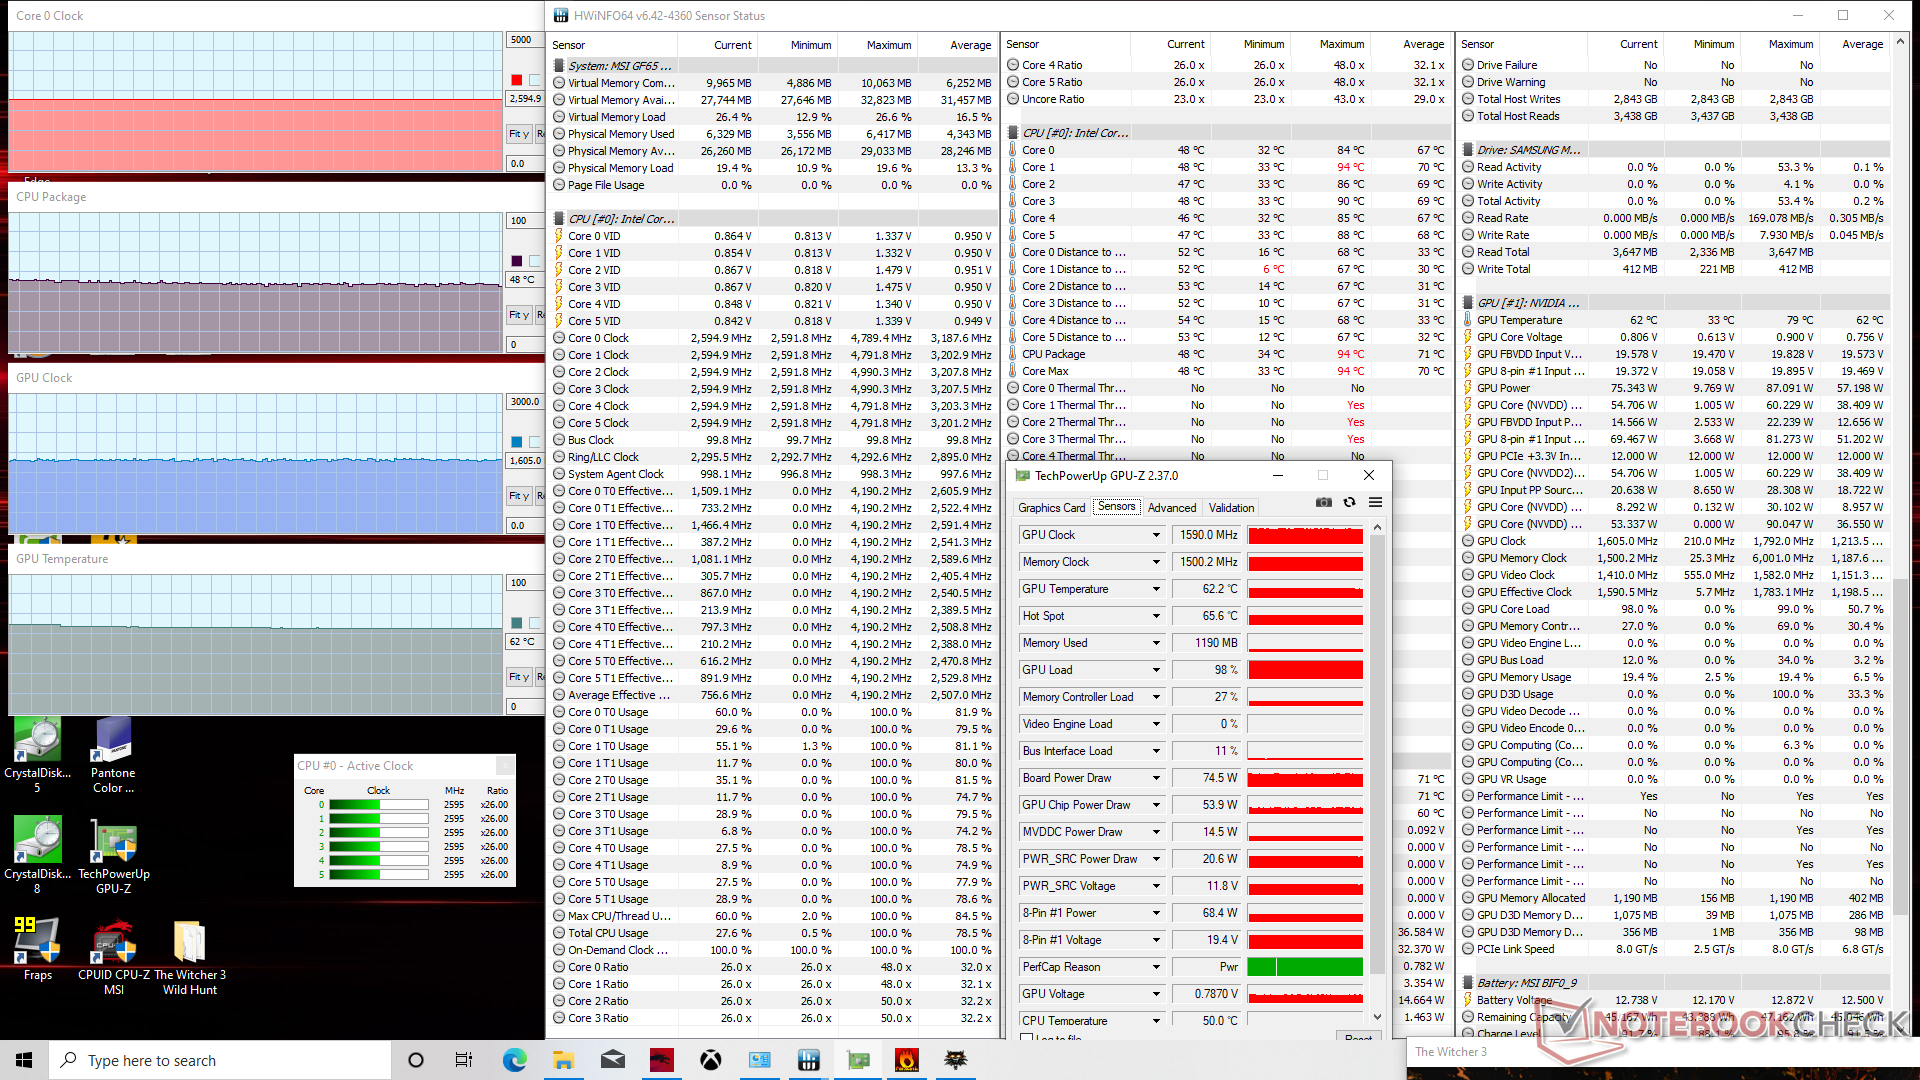
Running Witcher 3 causes the CPU and GPU to stabilize at 65 C and 77 C, respectively, which are relatively cool ranges for a gaming laptop. Enabling Cooler Boost would reduce CPU and GPU temperatures even further to just 48 C and 62 C, respectively, while bumping average GPU clock rates just slightly from 1515 MHz to 1590 MHz. The Cooler Boost feature is therefore not vital for gaming, but it may be useful for those who want maximum CPU Turbo Boost performance out of their GF65 systems.
Running on battery power will limit performance. A Fire Strike run on batteries would return Physics and Graphics scores of 10559 and 12438 points, respectively, compared to 17489 and 18434 points when on mains.
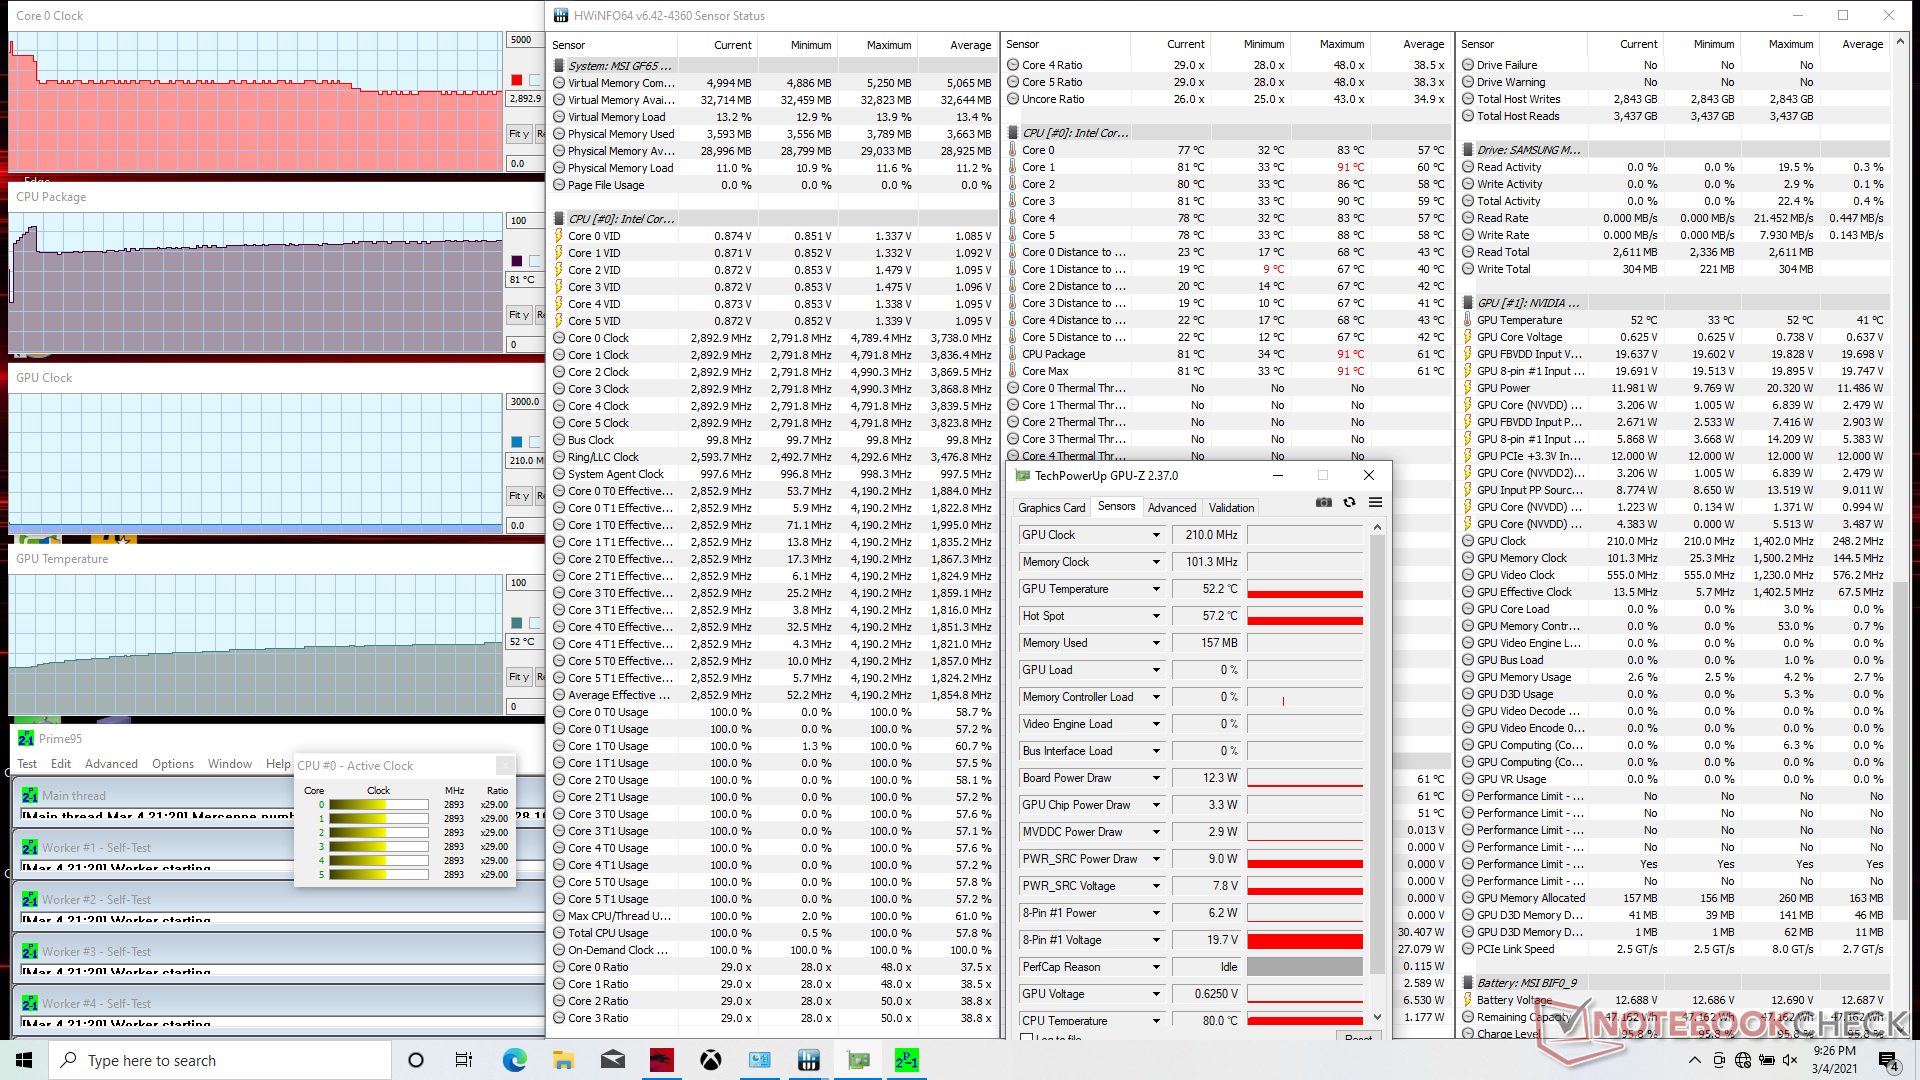
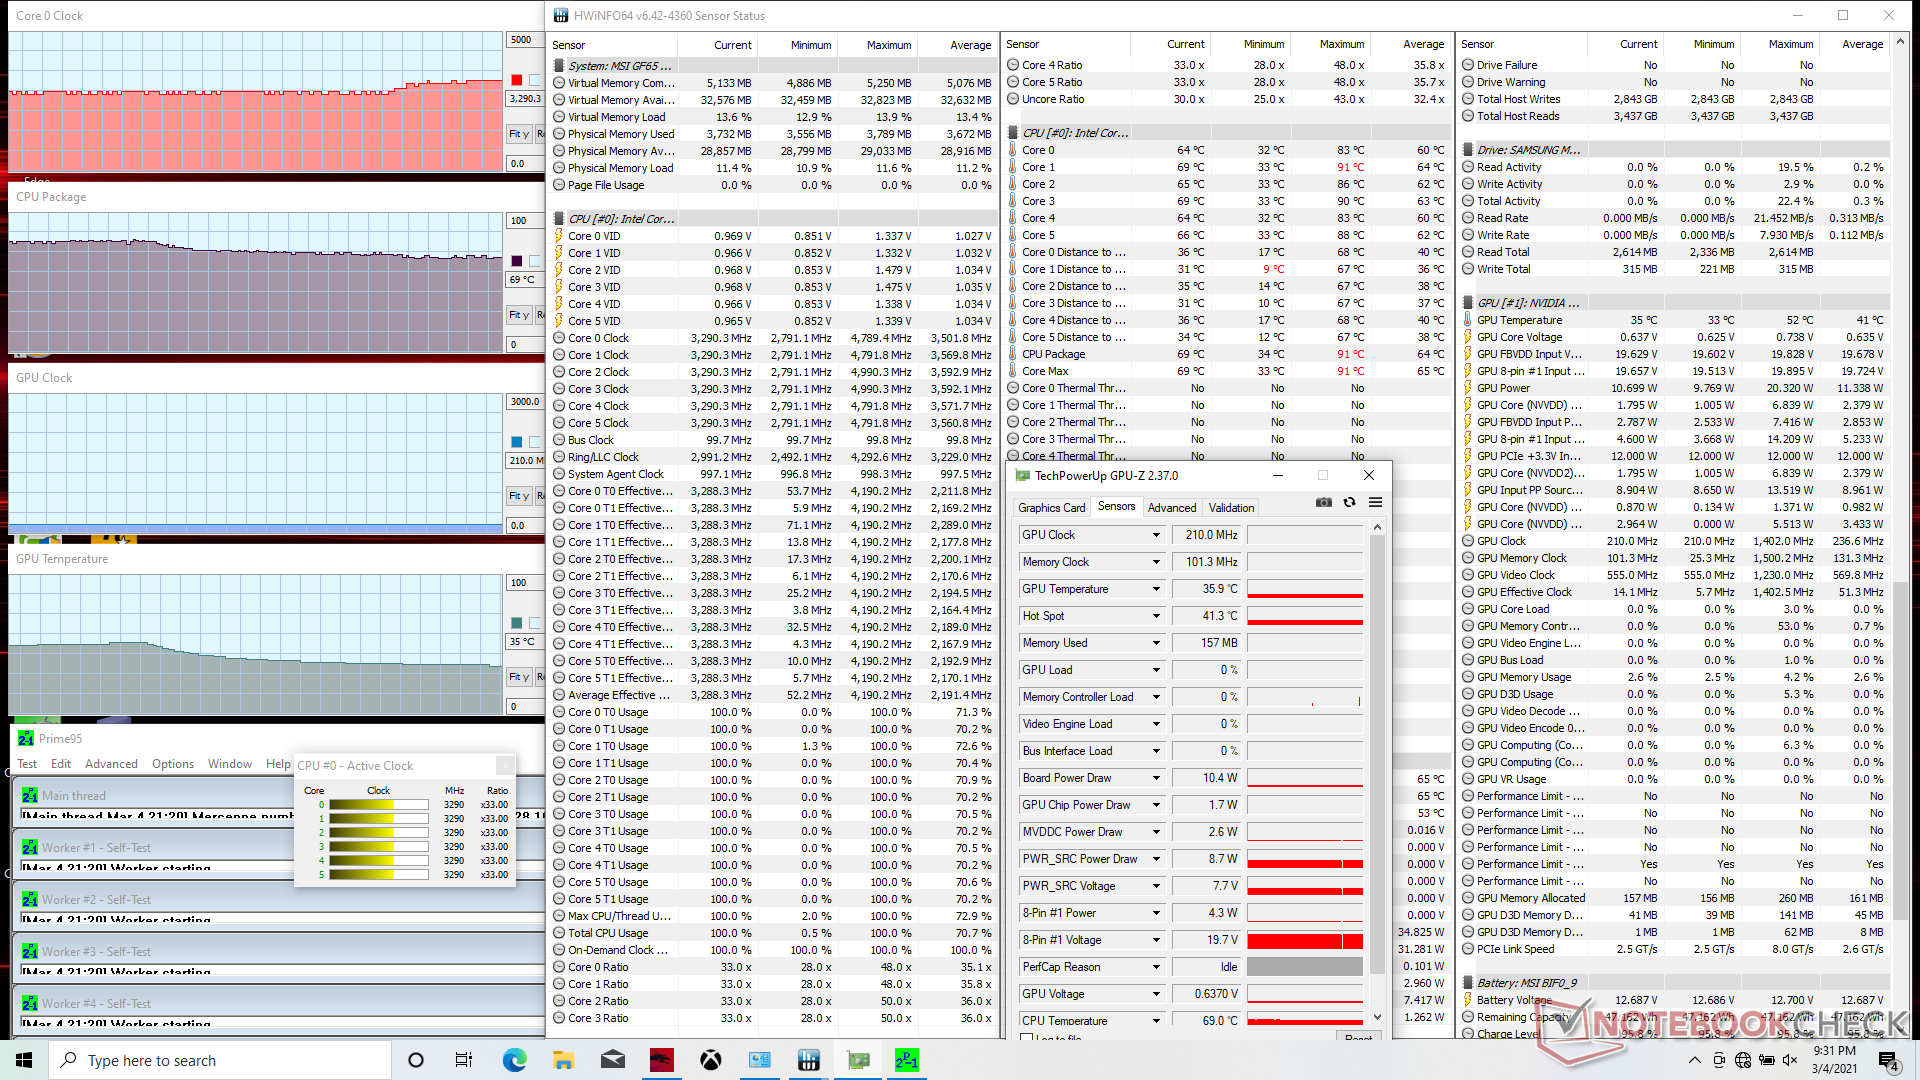
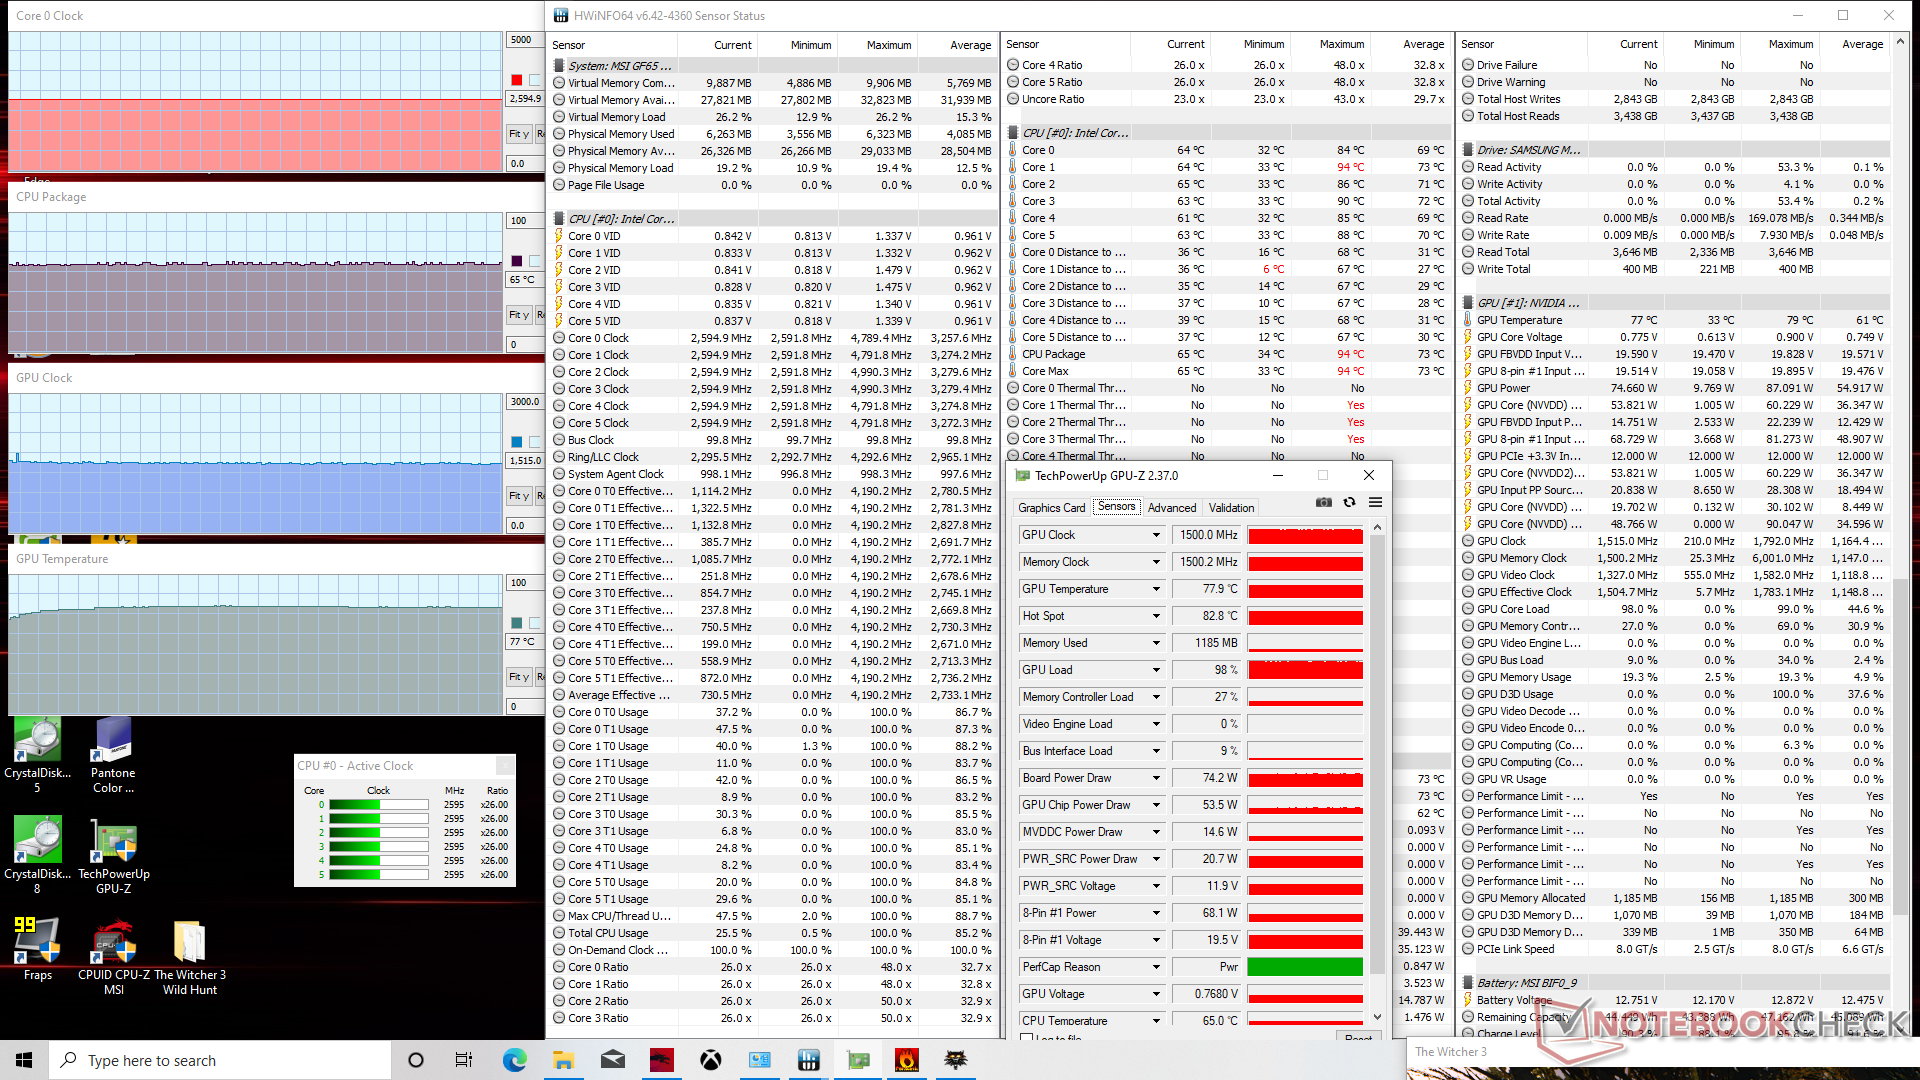

| CPU Clock (GHz) | GPU Clock (MHz) | Average CPU Temperature (°C) | Average GPU Temperature (°C) | |
| System Idle | -- | -- | 34 | 33 |
| Prime95 Stress (Cooler Boost off) | 2.8 - 2.9 | -- | 81 | 52 |
| Prime95 Stress (Cooler Boost on) | 3.3 | -- | 69 | 35 |
| Witcher 3 Stress (Cooler Boost off) | 2.6 | 1515 | 65 | 77 |
| Witcher 3 Stress (Cooler Boost on) | 2.6 | 1590 | 48 | 62 |
| Prime95 + FurMark Stress (Cooler Boost off) | 3.3 | 1612 | 86 | 78 |
| Prime95 + FurMark Stress (Cooler Boost on) | 3.3 | 1785 | 76 | 66 |
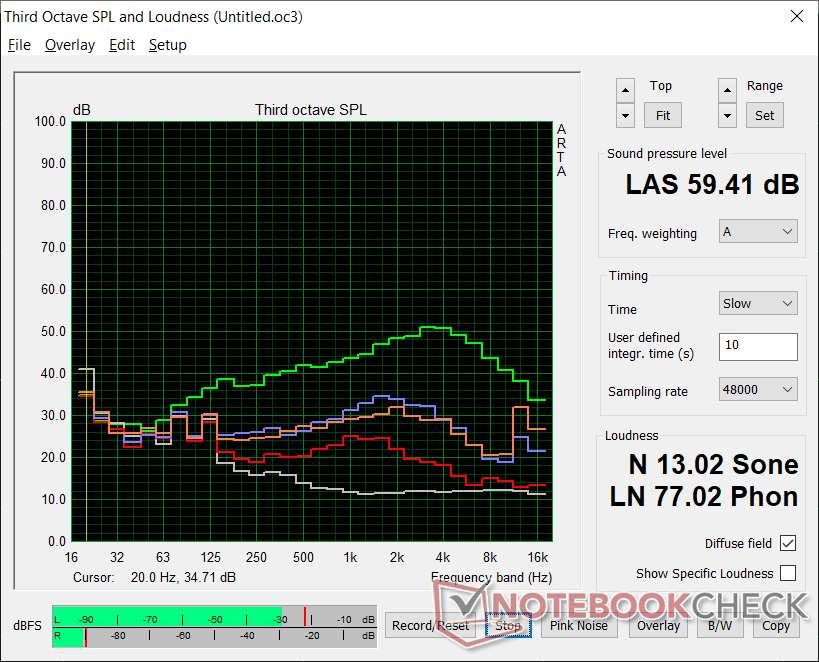
Speakers


MSI GF65 Thin 10UE audio analysis
(±) | speaker loudness is average but good (80.7 dB)
Bass 100 - 315 Hz
(-) | nearly no bass - on average 19.6% lower than median
(-) | bass is not linear (16.1% delta to prev. frequency)
Mids 400 - 2000 Hz
(+) | balanced mids - only 3.2% away from median
(±) | linearity of mids is average (7.6% delta to prev. frequency)
Highs 2 - 16 kHz
(+) | balanced highs - only 3.6% away from median
(±) | linearity of highs is average (8.6% delta to prev. frequency)
Overall 100 - 16.000 Hz
(±) | linearity of overall sound is average (17.9% difference to median)
Compared to same class
» 54% of all tested devices in this class were better, 9% similar, 37% worse
» The best had a delta of 6%, average was 18%, worst was 132%
Compared to all devices tested
» 37% of all tested devices were better, 8% similar, 55% worse
» The best had a delta of 4%, average was 24%, worst was 134%
Apple MacBook 12 (Early 2016) 1.1 GHz audio analysis
(+) | speakers can play relatively loud (83.6 dB)
Bass 100 - 315 Hz
(±) | reduced bass - on average 11.3% lower than median
(±) | linearity of bass is average (14.2% delta to prev. frequency)
Mids 400 - 2000 Hz
(+) | balanced mids - only 2.4% away from median
(+) | mids are linear (5.5% delta to prev. frequency)
Highs 2 - 16 kHz
(+) | balanced highs - only 2% away from median
(+) | highs are linear (4.5% delta to prev. frequency)
Overall 100 - 16.000 Hz
(+) | overall sound is linear (10.2% difference to median)
Compared to same class
» 7% of all tested devices in this class were better, 2% similar, 91% worse
» The best had a delta of 5%, average was 18%, worst was 53%
Compared to all devices tested
» 5% of all tested devices were better, 1% similar, 94% worse
» The best had a delta of 4%, average was 24%, worst was 134%
Energy Management
Power Consumption
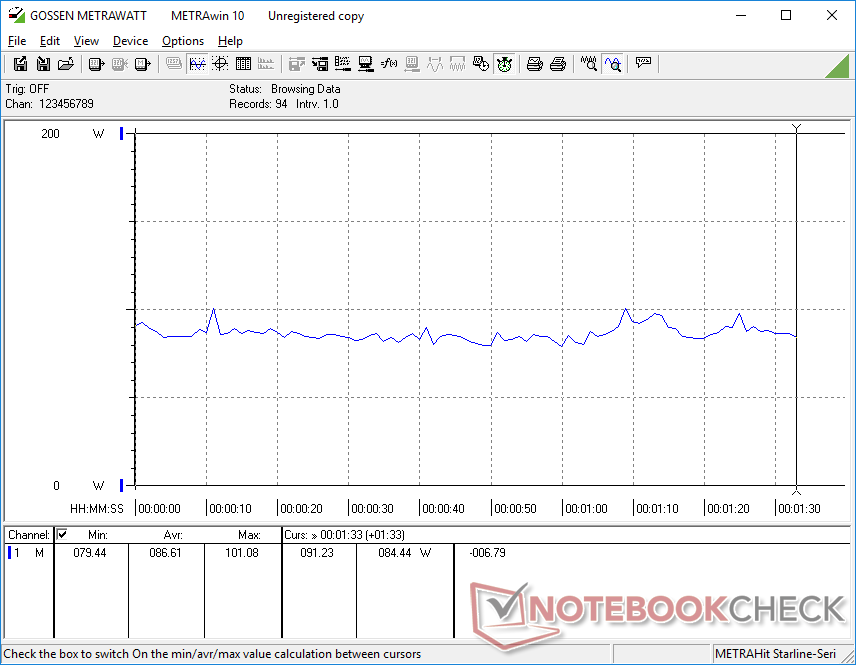
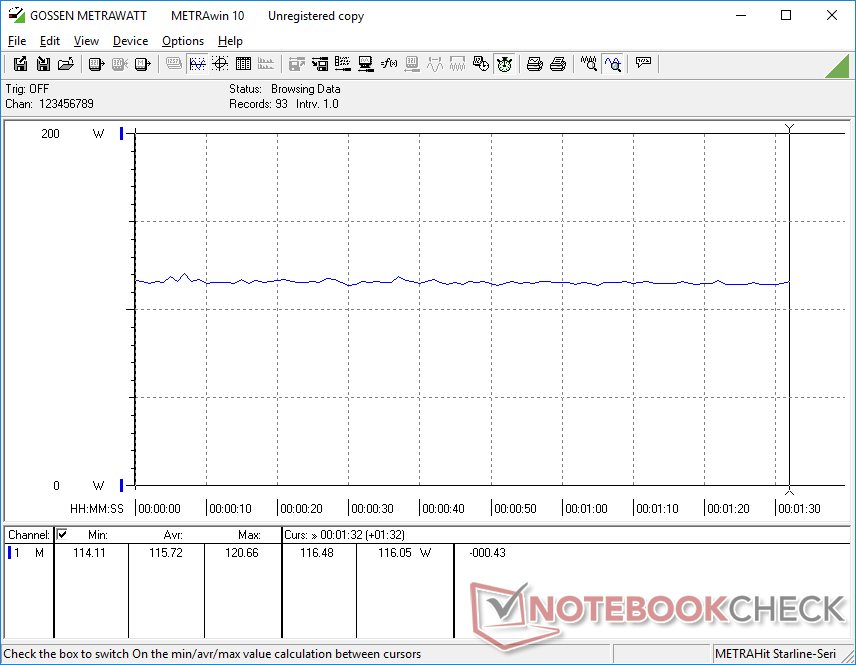
The system consumes slightly less power than on the older GF65 9SD. Running Witcher 3 demands about 116 W compared to 134 W on the older model even though our RTX 3060 is able to provide a 15 percent boost in raw graphics power over the GTX 1660 Ti. The Schenker XMG Core 15 with the same RTX 3060 GPU consumes significantly more power than our MSI likely because it targets higher TGP values and other processor differences.
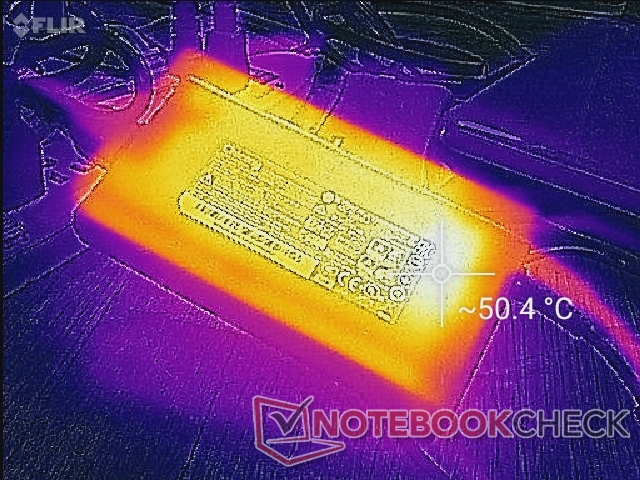
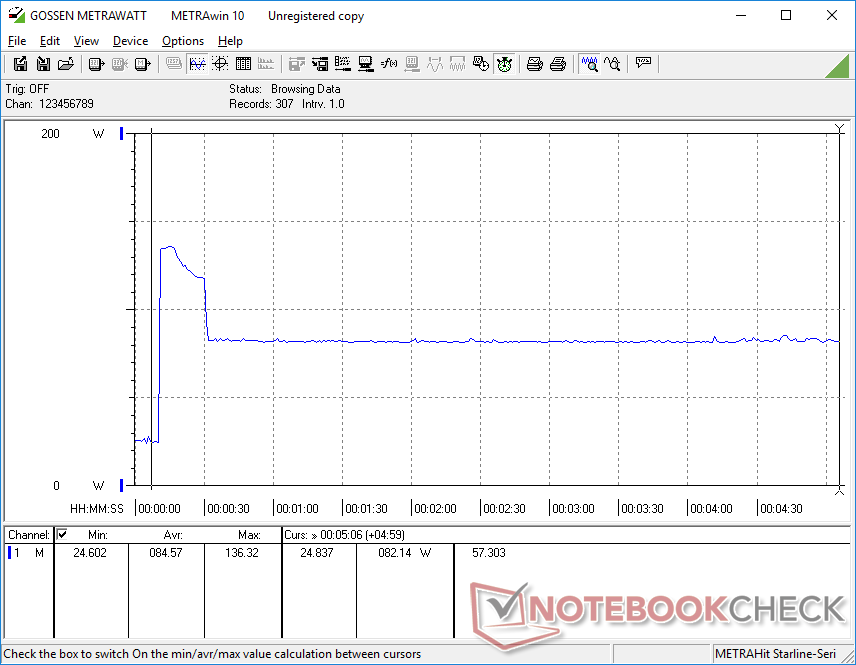
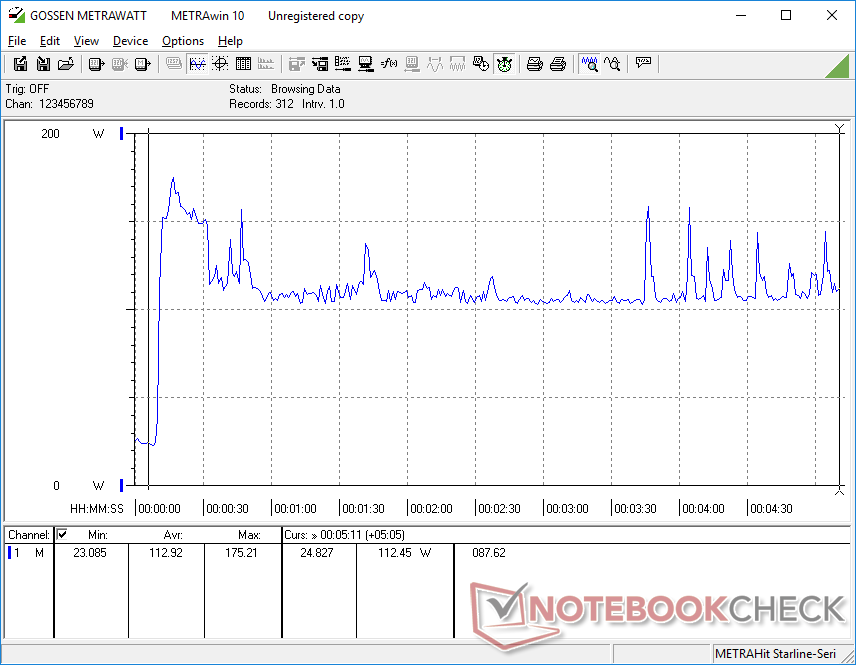
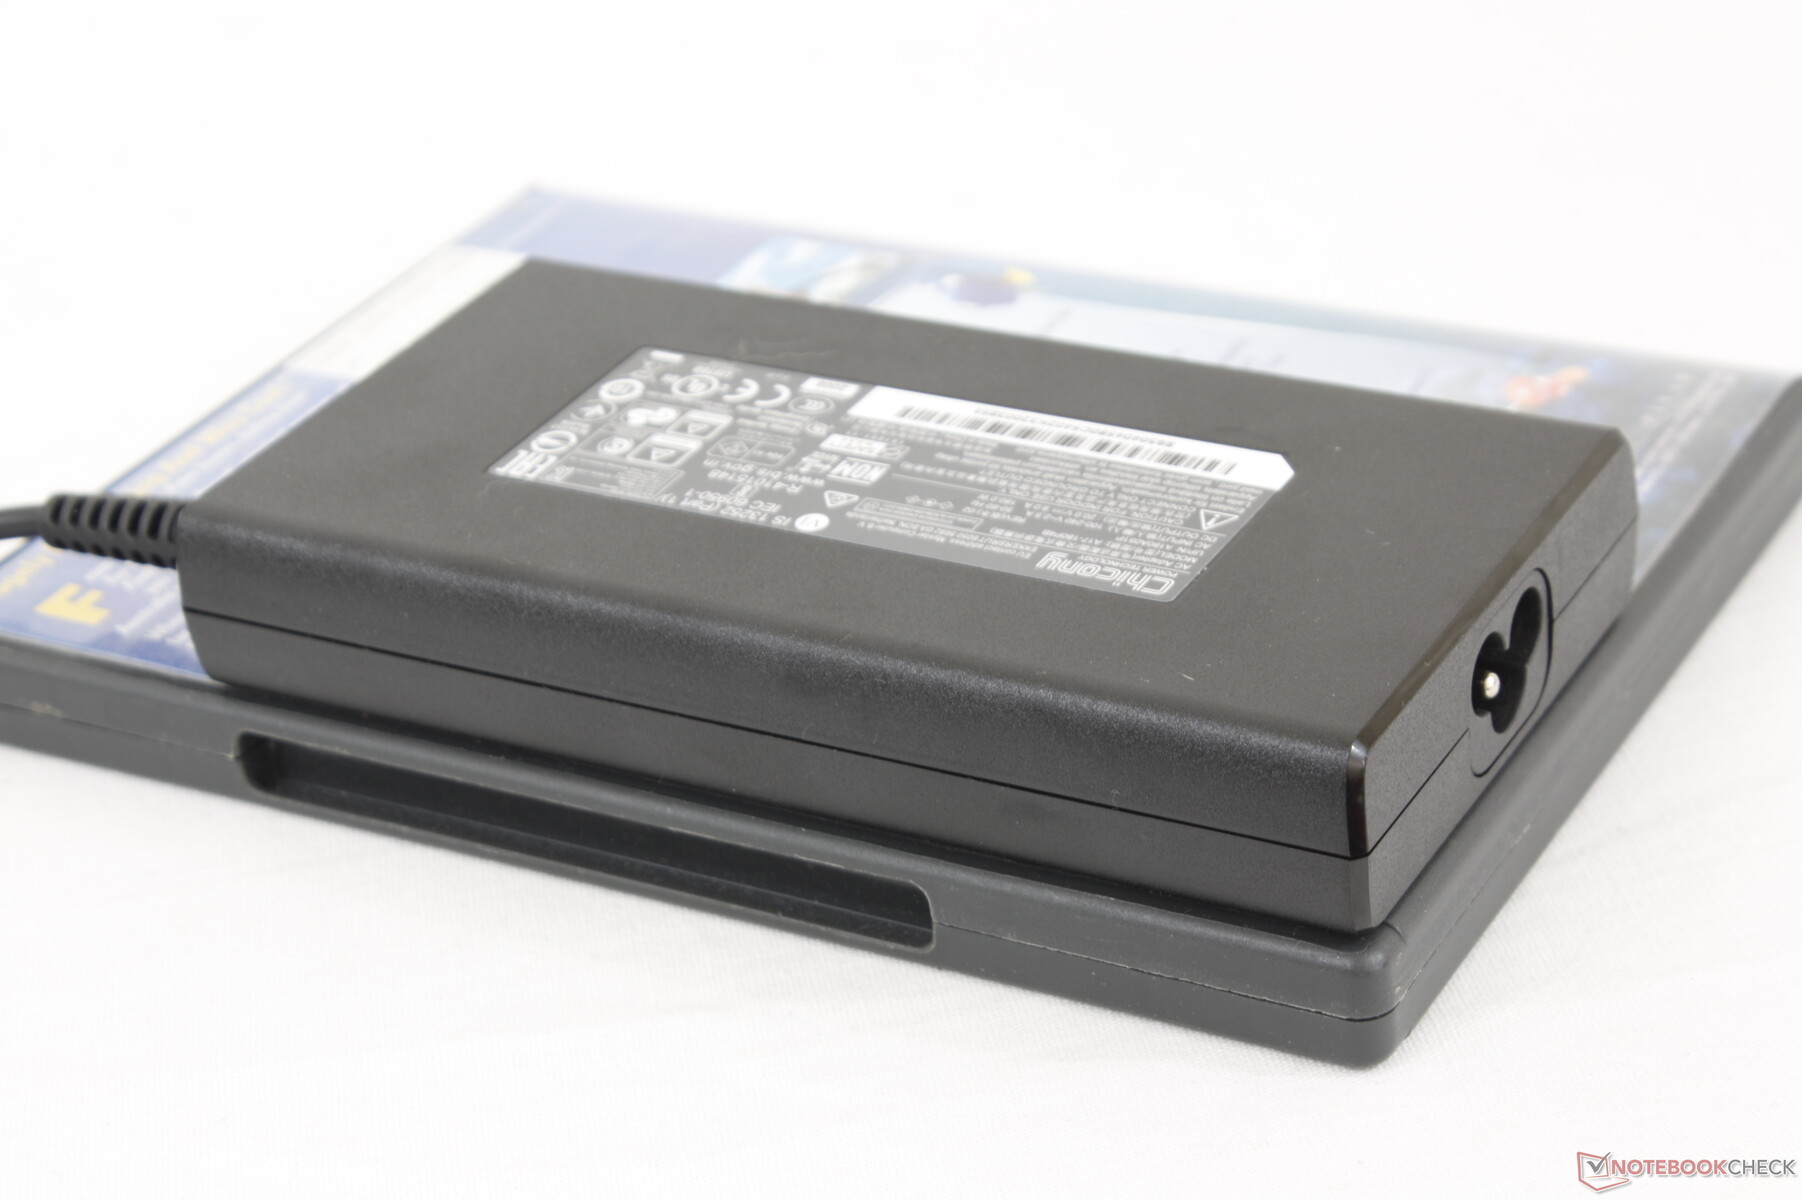
We're able to measure a maximum consumption of 175.2 W W from the small (~14.4 x 7.5 x 2.3 cm) 180 W AC adapter when running Prime95 and FurMark simultaneously. Battery charging slows significantly when running extreme loads and it may even stall which is what we observed during our stress test above.
| Off / Standby | |
| Idle | |
| Load |
|
Key:
min: | |
| MSI GF65 Thin 10UE i7-10750H, GeForce RTX 3060 Laptop GPU, Samsung SSD PM981 MZVLB1T0HALR, IPS, 1920x1080, 15.6" | Asus ROG Strix G15 G513QR R9 5900HX, GeForce RTX 3070 Laptop GPU, SK Hynix HFM001TD3JX013N, IPS, 1920x1080, 15.6" | Schenker XMG Core 15 Ampere R7 4800H, GeForce RTX 3060 Laptop GPU, Samsung SSD 970 EVO Plus 1TB, IPS, 2560x1440, 15.6" | Aorus 15G XC i7-10870H, GeForce RTX 3070 Laptop GPU, ESR512GTLCG-EAC-4, IPS, 1920x1080, 15.6" | Lenovo Legion 7 15IMH05-81YT001VGE i9-10980HK, GeForce RTX 2080 Super Max-Q, 2x Samsung PM981a MZVLB1T0HBLR (RAID 0), IPS, 1920x1080, 15.6" | MSI GF65 9SD i7-9750H, GeForce GTX 1660 Ti Mobile, Kingston RBUSNS8154P3512GJ, IPS, 1920x1080, 15.6" | |
|---|---|---|---|---|---|---|
| Power Consumption | -27% | -35% | -48% | -24% | -17% | |
| Idle Minimum * (Watt) | 5.4 | 4 26% | 11 -104% | 13 -141% | 9 -67% | 9.5 -76% |
| Idle Average * (Watt) | 12.8 | 9 30% | 14 -9% | 16 -25% | 12.6 2% | 12.4 3% |
| Idle Maximum * (Watt) | 19.5 | 36 -85% | 20 -3% | 30 -54% | 17 13% | 22 -13% |
| Load Average * (Watt) | 86.6 | 130 -50% | 94 -9% | 92 -6% | 115 -33% | 80.8 7% |
| Witcher 3 ultra * (Watt) | 115.7 | 174 -50% | 167 -44% | 154 -33% | 159 -37% | 133.9 -16% |
| Load Maximum * (Watt) | 175.2 | 227 -30% | 251 -43% | 223 -27% | 216 -23% | 187.1 -7% |
* ... smaller is better
Battery Life
Runtimes are average at about 4.5 hours of real-world WLAN use when on the Balanced power profile. Results aren't all that different from last year's GF65 as battery capacity hasn't changed.
Charging from empty to full capacity takes a little over two hours. The system cannot be recharged via USB-C.
| MSI GF65 Thin 10UE i7-10750H, GeForce RTX 3060 Laptop GPU, 51 Wh | Asus ROG Strix G15 G513QR R9 5900HX, GeForce RTX 3070 Laptop GPU, 90 Wh | Schenker XMG Core 15 Ampere R7 4800H, GeForce RTX 3060 Laptop GPU, 62 Wh | MSI GS66 Stealth 10UG i7-10870H, GeForce RTX 3070 Laptop GPU, 99.9 Wh | Aorus 15G XC i7-10870H, GeForce RTX 3070 Laptop GPU, 99 Wh | Lenovo Legion 7 15IMH05-81YT001VGE i9-10980HK, GeForce RTX 2080 Super Max-Q, 80 Wh | MSI GF65 9SD i7-9750H, GeForce GTX 1660 Ti Mobile, 51 Wh | |
|---|---|---|---|---|---|---|---|
| Battery runtime | 58% | 2% | 50% | 44% | 1% | 11% | |
| Reader / Idle (h) | 11.1 | 7.8 -30% | 10.8 -3% | 9.6 -14% | |||
| WiFi v1.3 (h) | 4.6 | 7.4 61% | 5.8 26% | 7.1 54% | 6.3 37% | 3.4 -26% | 5.1 11% |
| Load (h) | 1.1 | 1.7 55% | 1.2 9% | 2.2 100% | 2.3 109% | 1.4 27% |
Pros
Cons
Verdict


The mobile GeForce RTX 3060 operates under a wide TGP range between 60 W and 115 W. Laptop makers are free to target whatever TGP values they wish within that range meaning that higher TGP targets will net higher performance. This also means that some laptops with the may prefer marginally slower than others even if they come equipped with the same GPU.
The MSI GF65 10UE is a relatively inexpensive RTX 3060 laptop and, perhaps not coincidentally, it also comes with a slower-than-average RTX 3060 GPU. Other laptops we've tested thus far with the same GPU are about 10 to 15 percent faster. CPU performance is also slightly slower than average unless if users decide to enable Cooler Boost mode. Colors, black-white response times, Thunderbolt, and DisplayPort are either average or completely omitted.
Gamers who want to maximize performance-per-dollar without sacrificing RAM or SSD upgradeability will find the lightweight MSI GF65 attractive. For higher raw performance, most other gaming laptops with the same GeForce RTX 3060 can run it faster.
The easy serviceability, high display refresh rate, and relatively cool core temperatures when gaming are still some of our favorite aspects of the GF65. Even so, potential buyers should be aware of the features they will be missing out on.
Price and availability
Our exact configuration is currently available on Amazon for $1649 USD. A configuration with just 8 GB of RAM and 512 GB of storage is also available for $1299 USD.
MSI GF65 Thin 10UE
- 03/08/2021 v7 (old)
Allen Ngo
Price comparison
