Asus Zephyrus M15 GU502LU vs. GU502LW: What's The Difference?
The 10th gen Intel Asus Zephyrus G15 GU502 series comes in three discrete SKUs: the GU502LW, GU502LV, and GU502LU each distinguished by their different GPU options. We recently checked out the GU502LW with a GeForce RTX 2070 Max-Q and 4K display and now we'll be seeing how it differs from the cheaper GU502LU with a GTX 1660 Ti and FHD display.
More Asus reviews:
Rating | Date | Model | Weight | Height | Size | Resolution | Price |
|---|---|---|---|---|---|---|---|
| 82.1 % v7 (old) | 10 / 2020 | Asus ROG Zephyrus M15 GU502LU-BI7N4 i7-10750H, GeForce GTX 1660 Ti Mobile | 2 kg | 18.9 mm | 15.60" | 1920x1080 | |
| 82.5 % v7 (old) | 09 / 2020 | Asus ROG Zephyrus M15 GU502L i7-10750H, GeForce RTX 2070 Max-Q | 2 kg | 18.9 mm | 15.60" | 3840x2160 | |
| 82.1 % v7 (old) | 09 / 2020 | HP Omen 15-ek0456ng i5-10300H, GeForce GTX 1660 Ti Mobile | 2.1 kg | 32 mm | 15.60" | 1920x1080 | |
| 82.1 % v7 (old) | 10 / 2020 | Gateway Creator Series 15.6 GWTN156-3BK i5-10300H, GeForce RTX 2060 Mobile | 2 kg | 19.9 mm | 15.60" | 1920x1080 | |
| 83.3 % v7 (old) | 07 / 2020 | Lenovo Legion 5 15IMH05H i5-10300H, GeForce RTX 2060 Mobile | 2.5 kg | 26.1 mm | 15.60" | 1920x1080 | |
| 83.2 % v7 (old) | 05 / 2020 | MSI GP65 10SFK-047US i7-10750H, GeForce RTX 2070 Mobile | 2.3 kg | 27.5 mm | 15.60" | 1920x1080 |
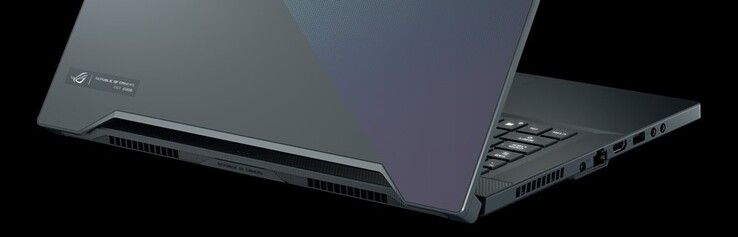
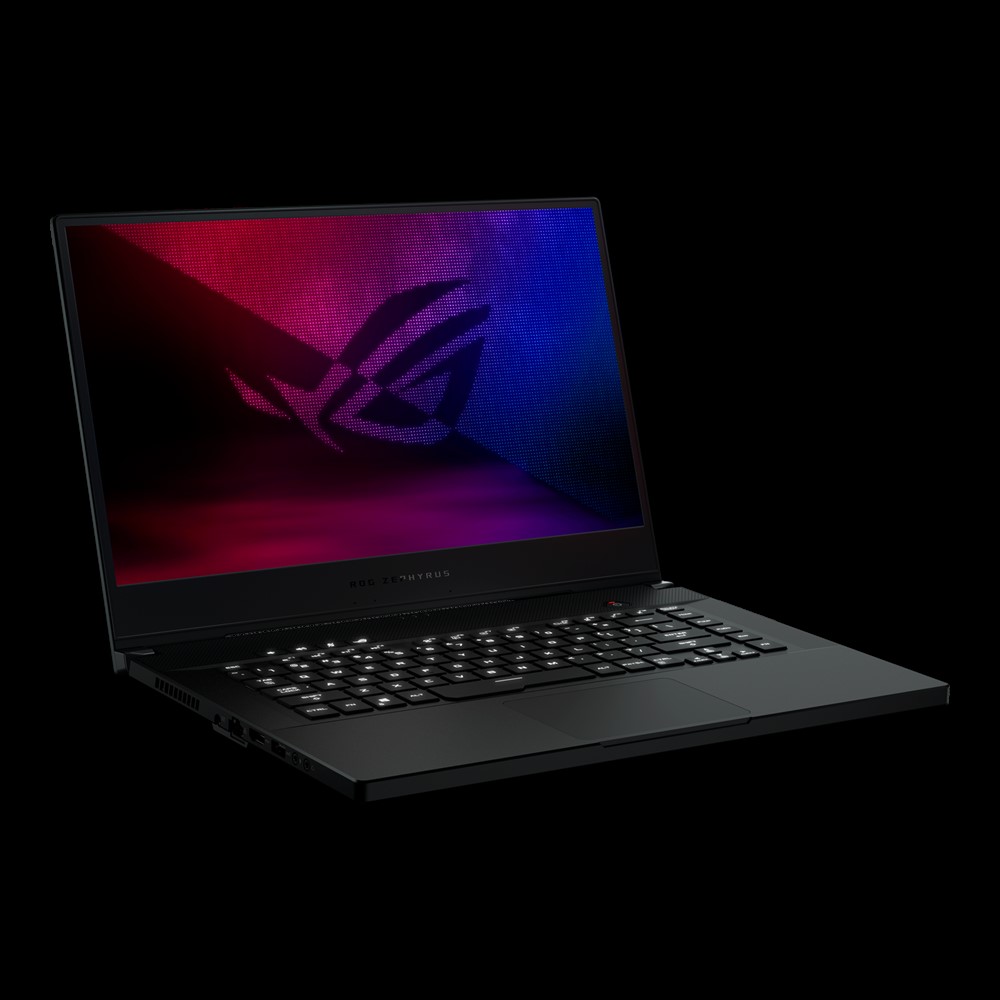
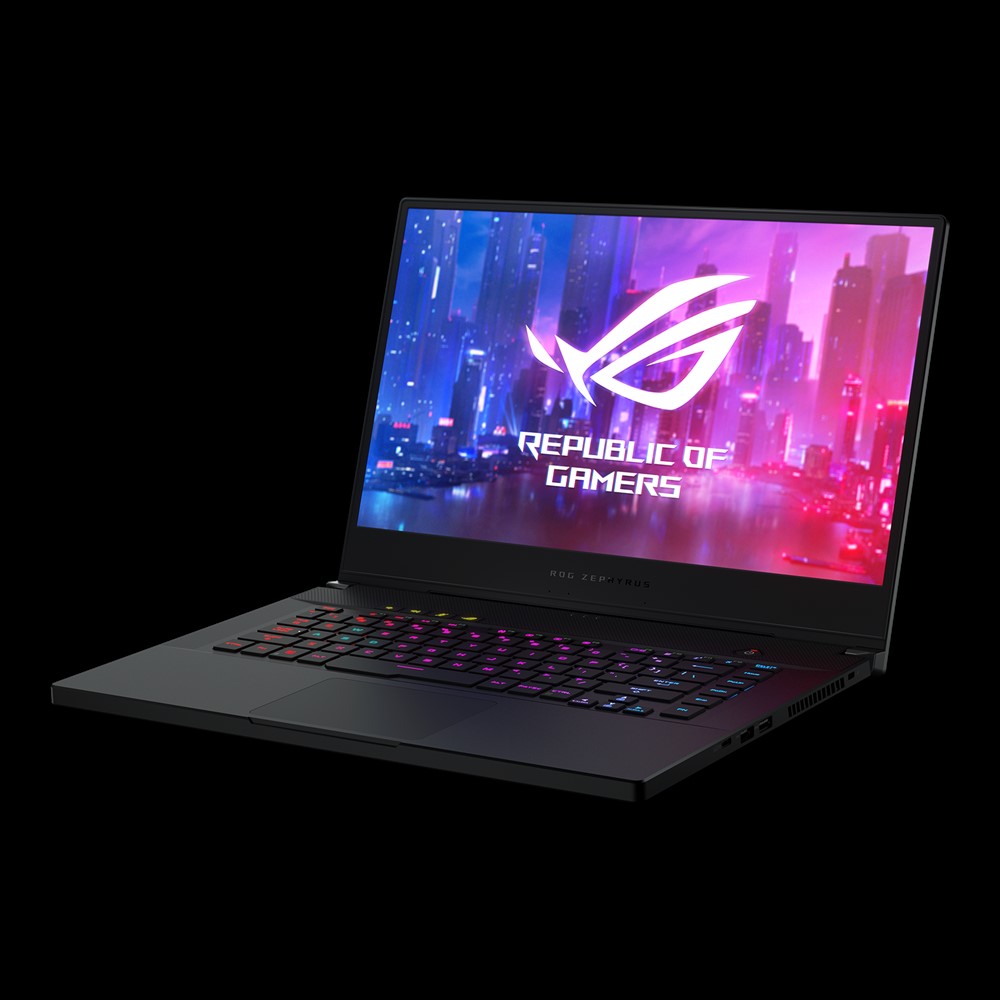
Case
Communication
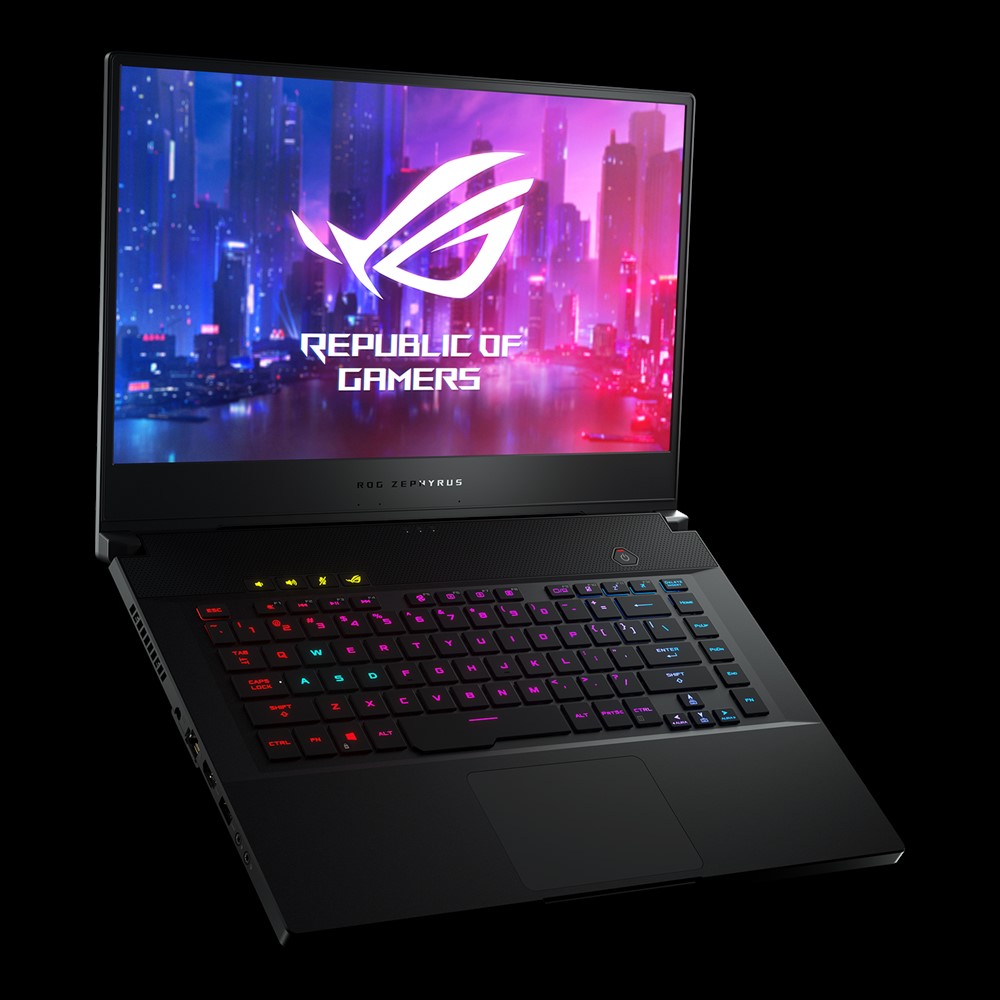
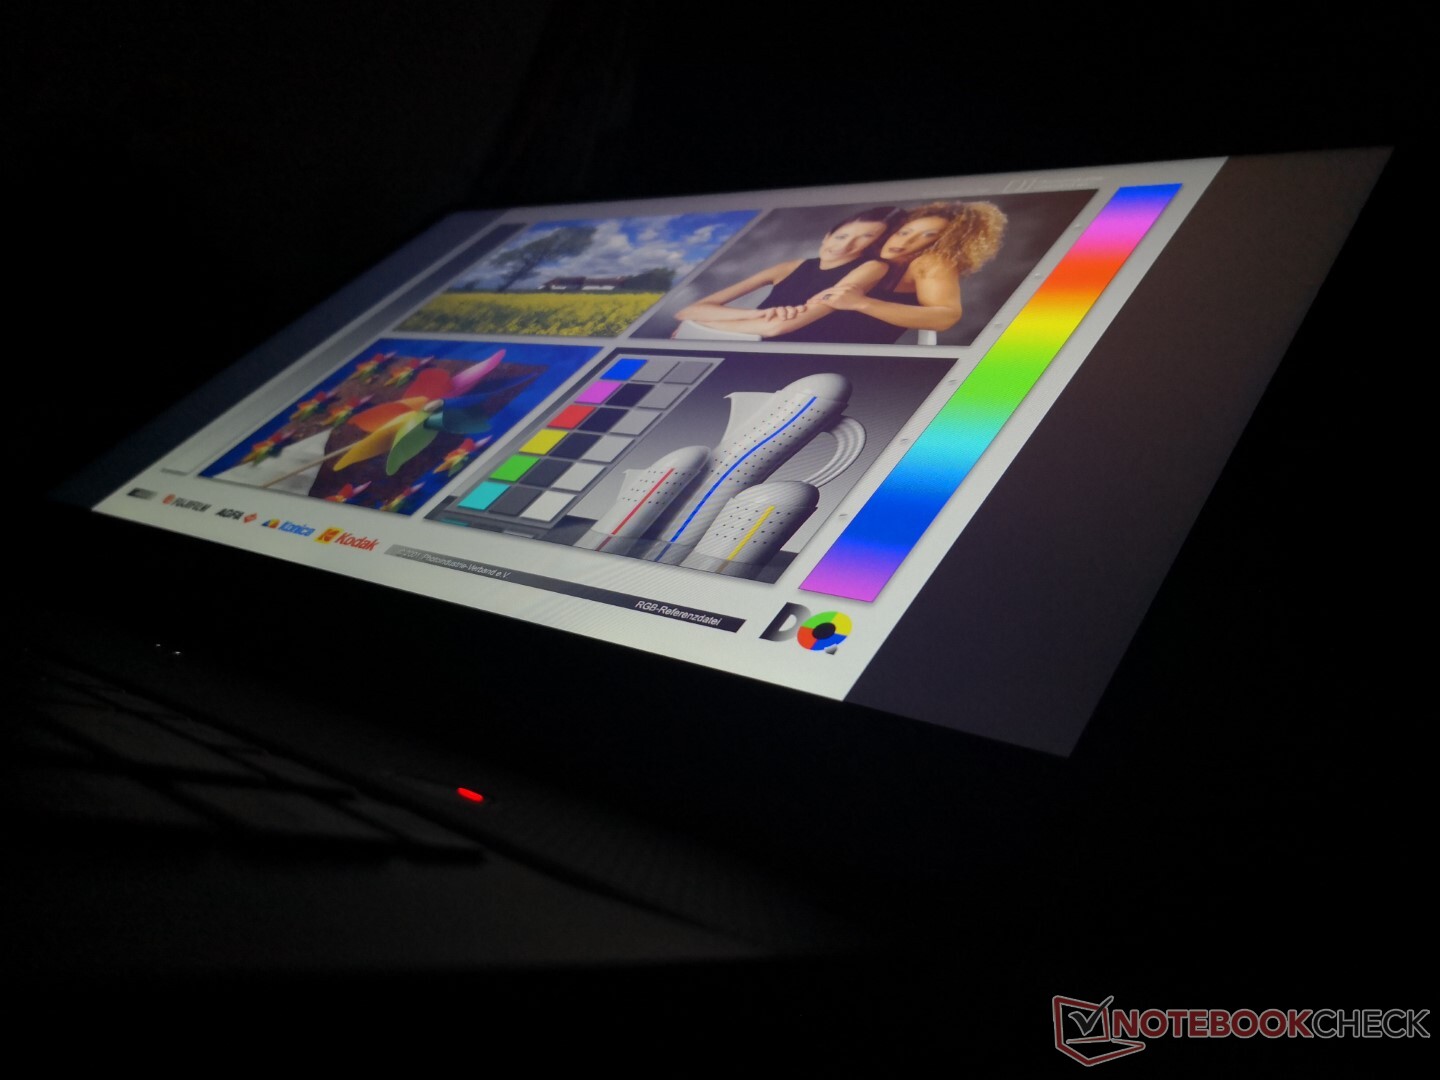
Display
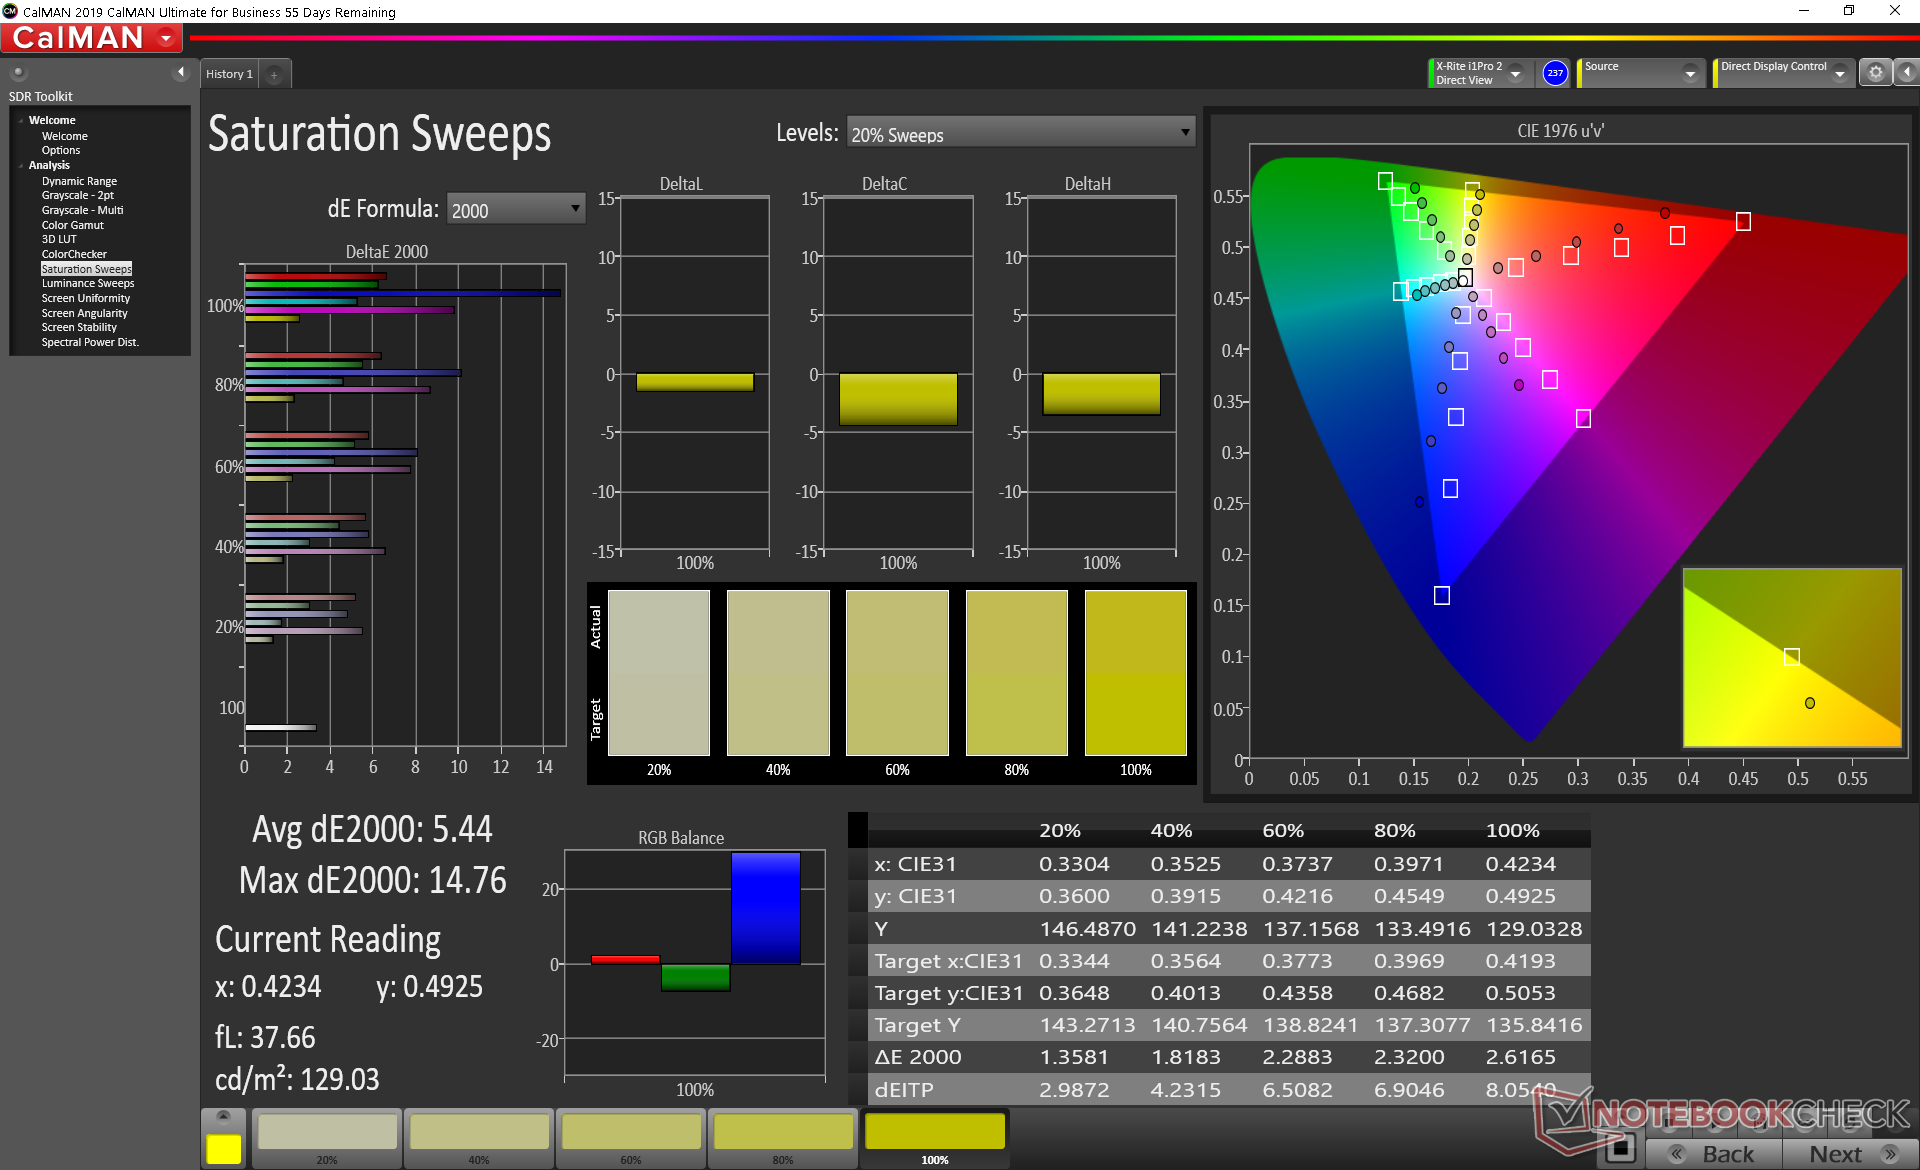
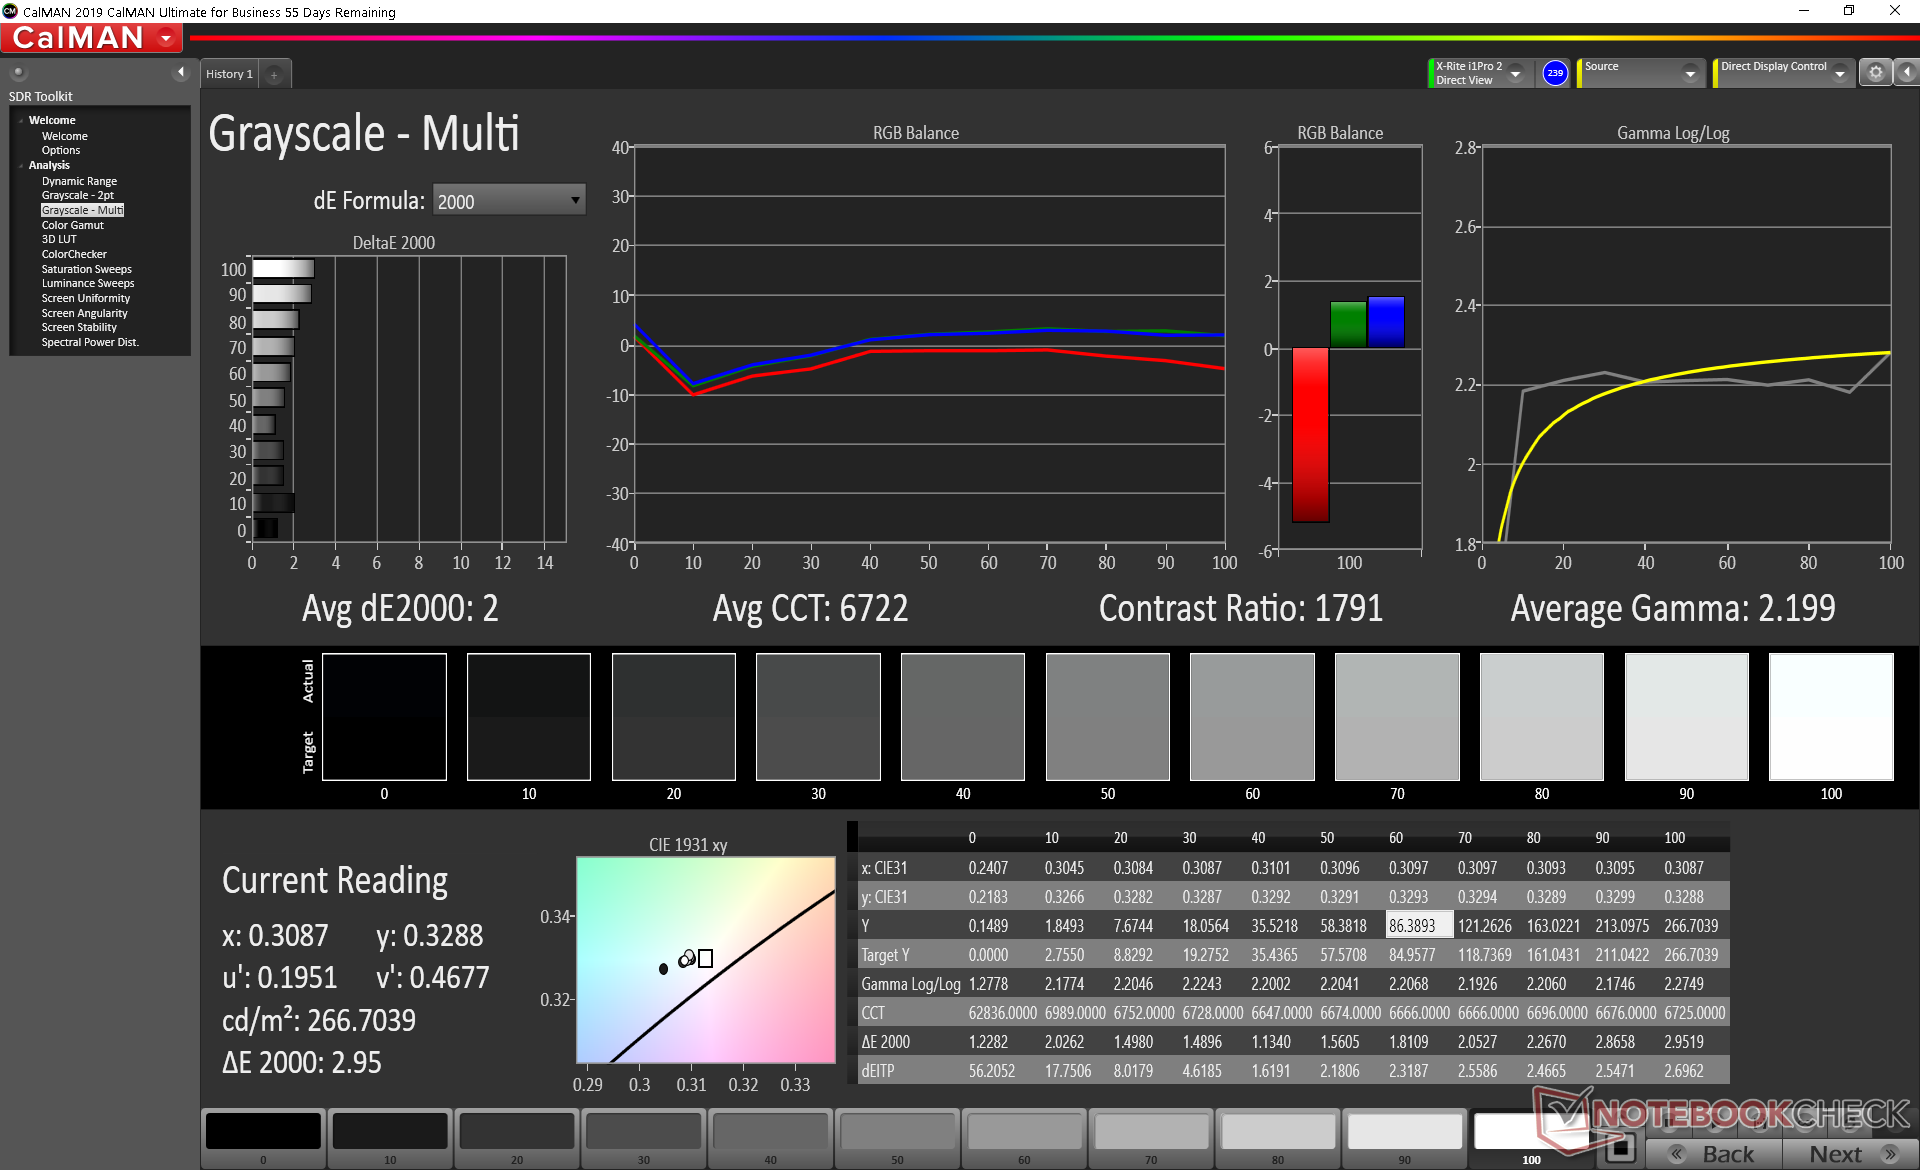
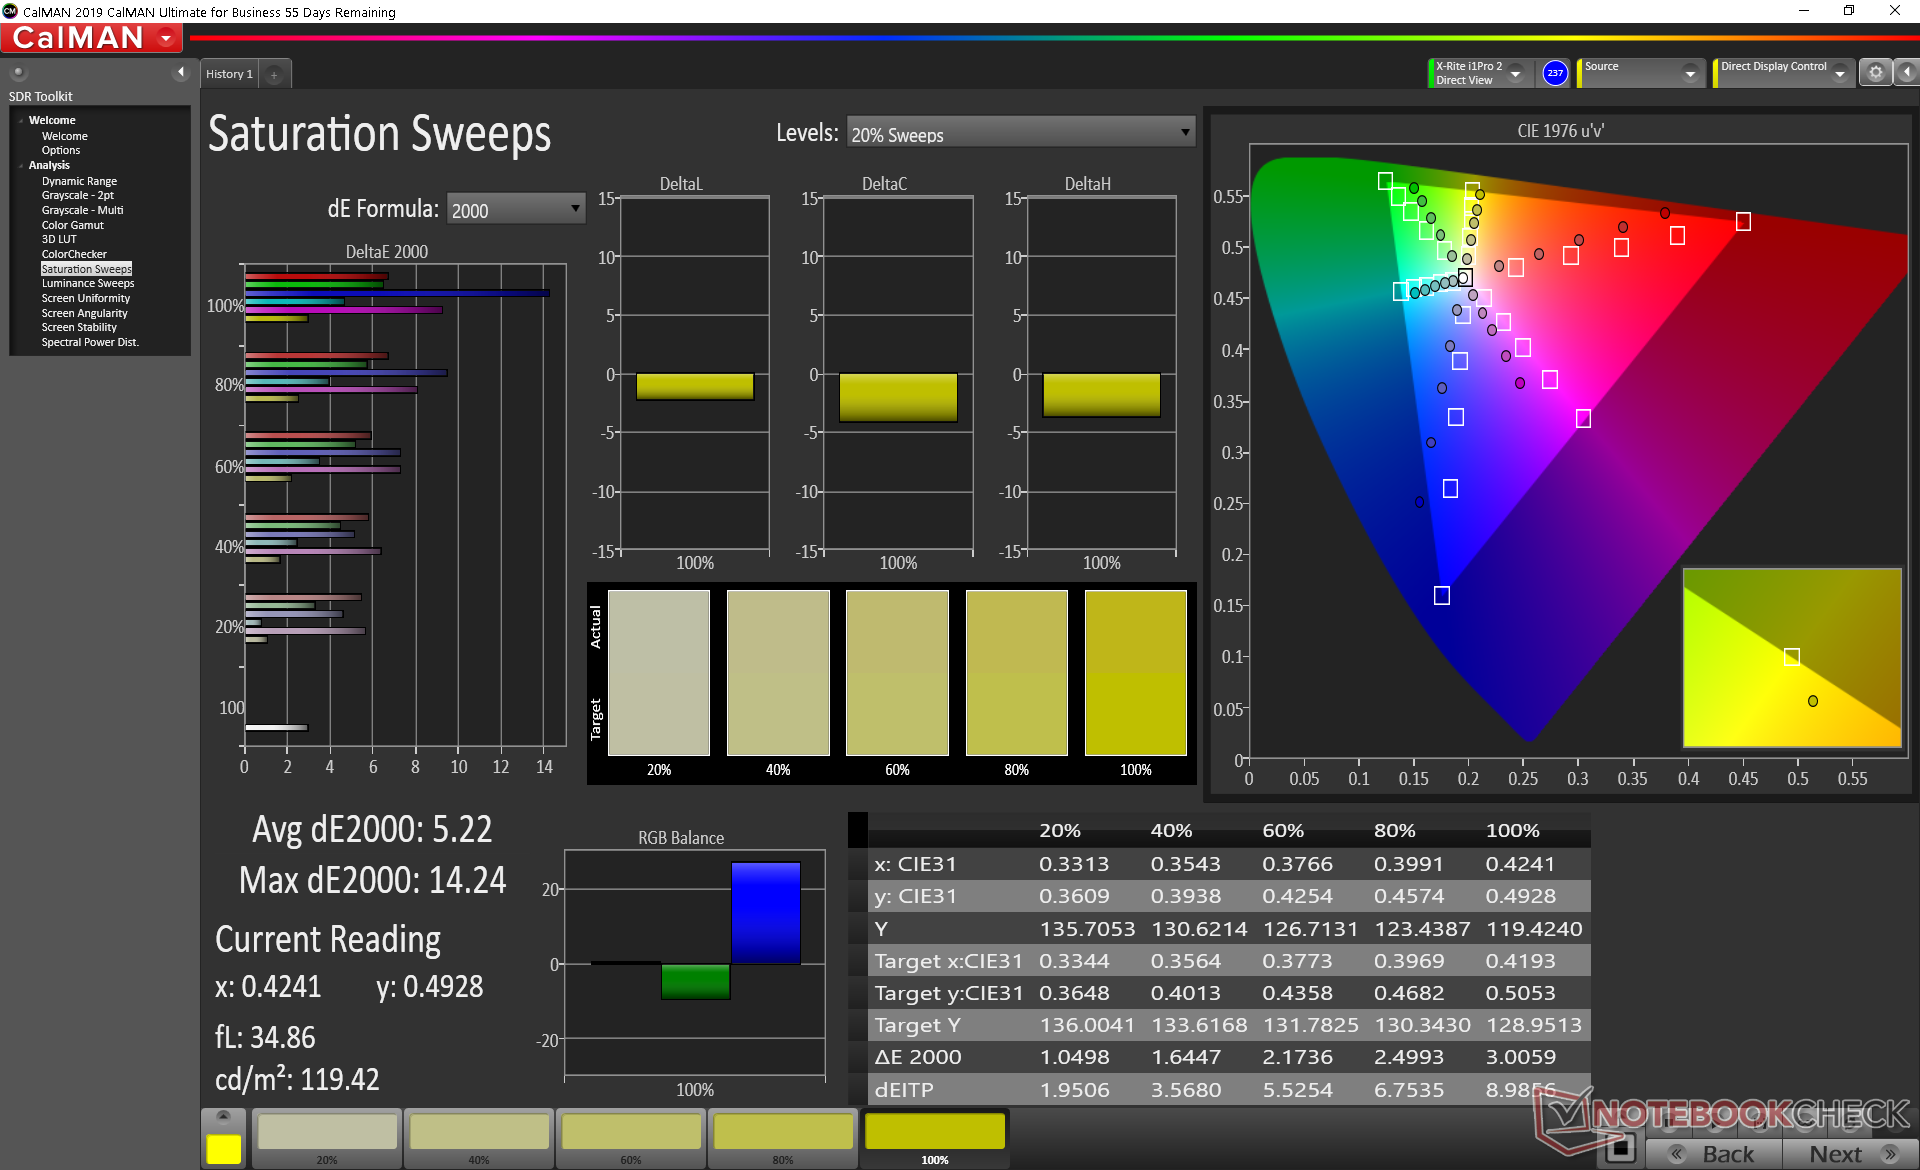
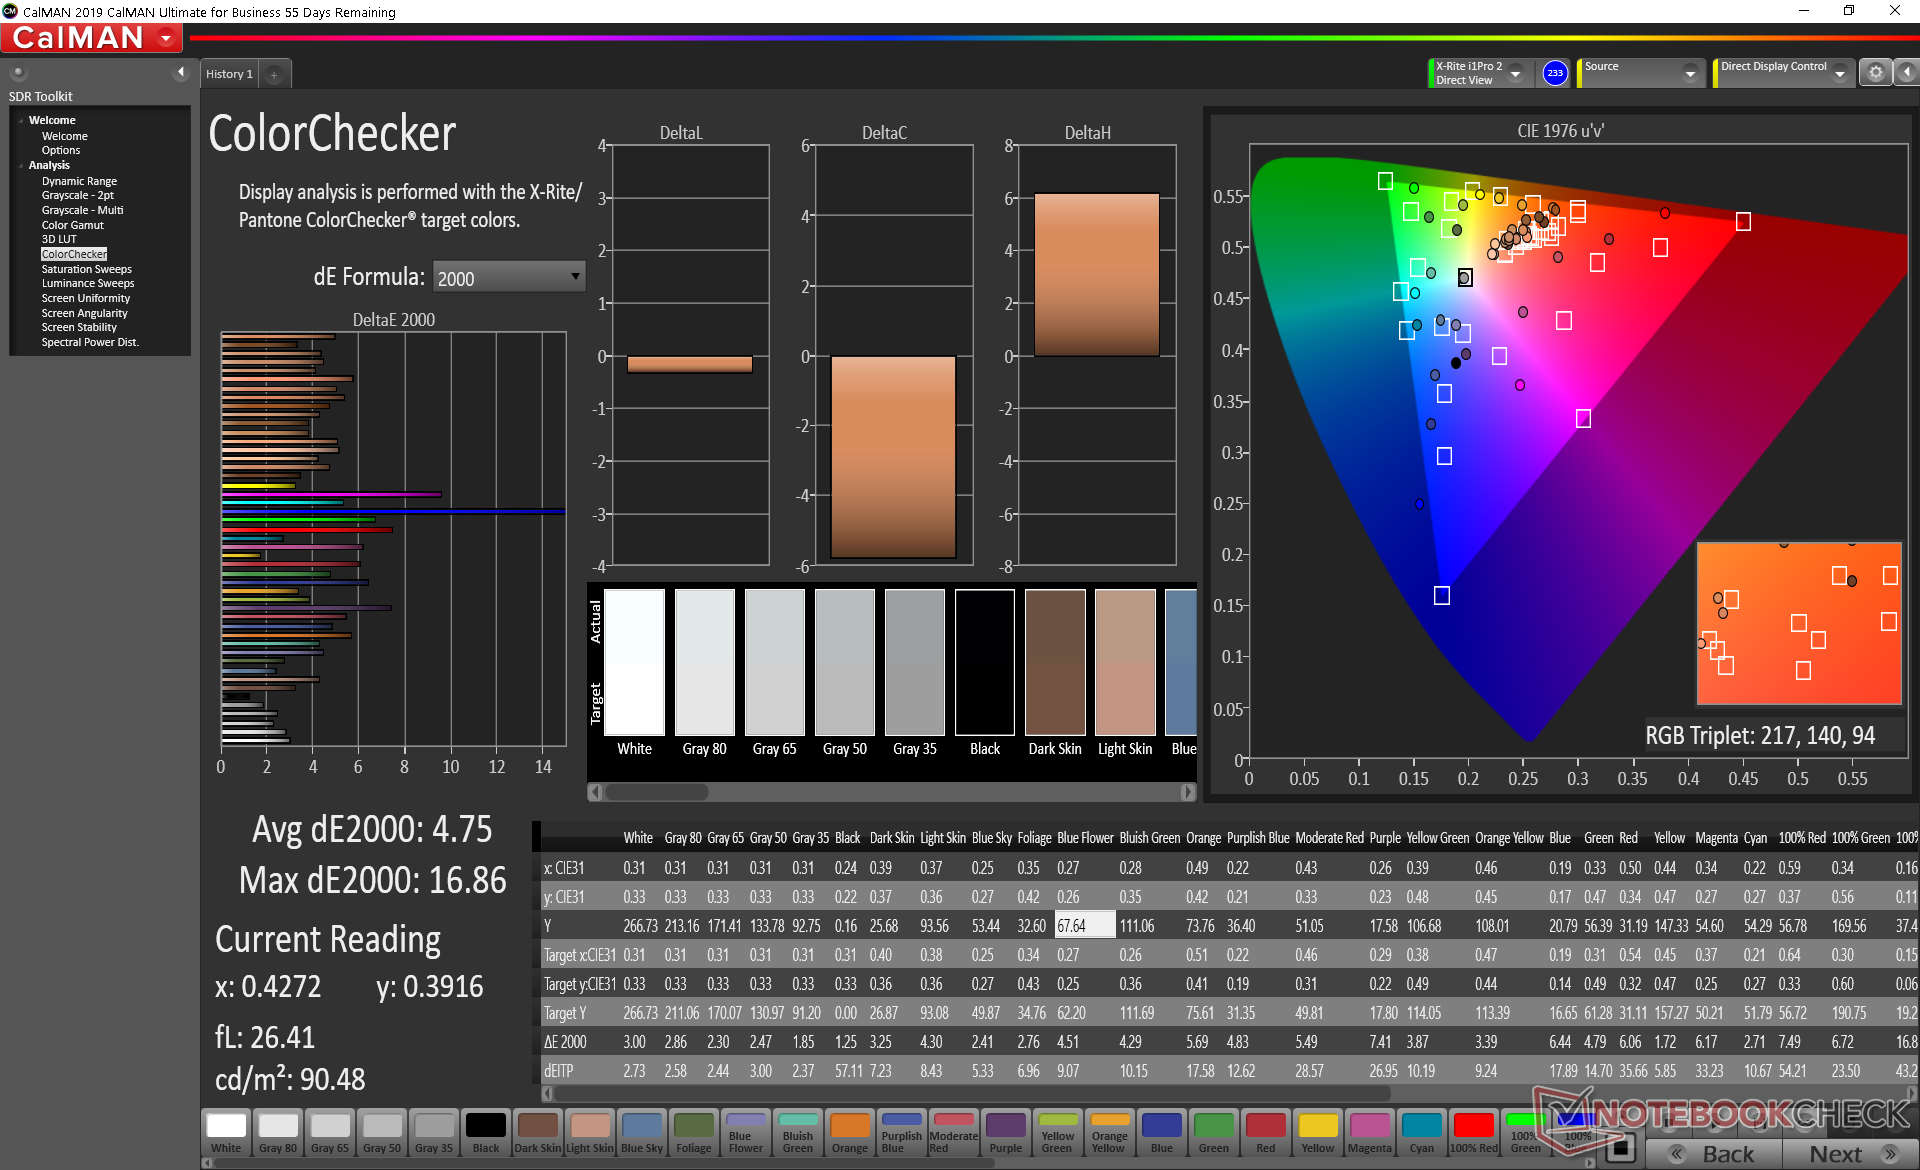
Unlike the GU502LW and its 60 Hz 4K UHD panel, our less expensive GU502LU comes with a 144 Hz 1080p panel instead. The main problem is that this particular Panda LM156LF-2F01 panel exhibits slow response times and noticeable ghosting unfit for fast-paced gaming in contrast to many LG Philips panels that offer 5 ms or better response times. Other qualities like colors, contrast ratio, and brightness are poor to average at best as expected from a Panda panel.


| |||||||||||||||||||||||||
Brightness Distribution: 86 %
Center on Battery: 282.5 cd/m²
Contrast: 831:1 (Black: 0.34 cd/m²)
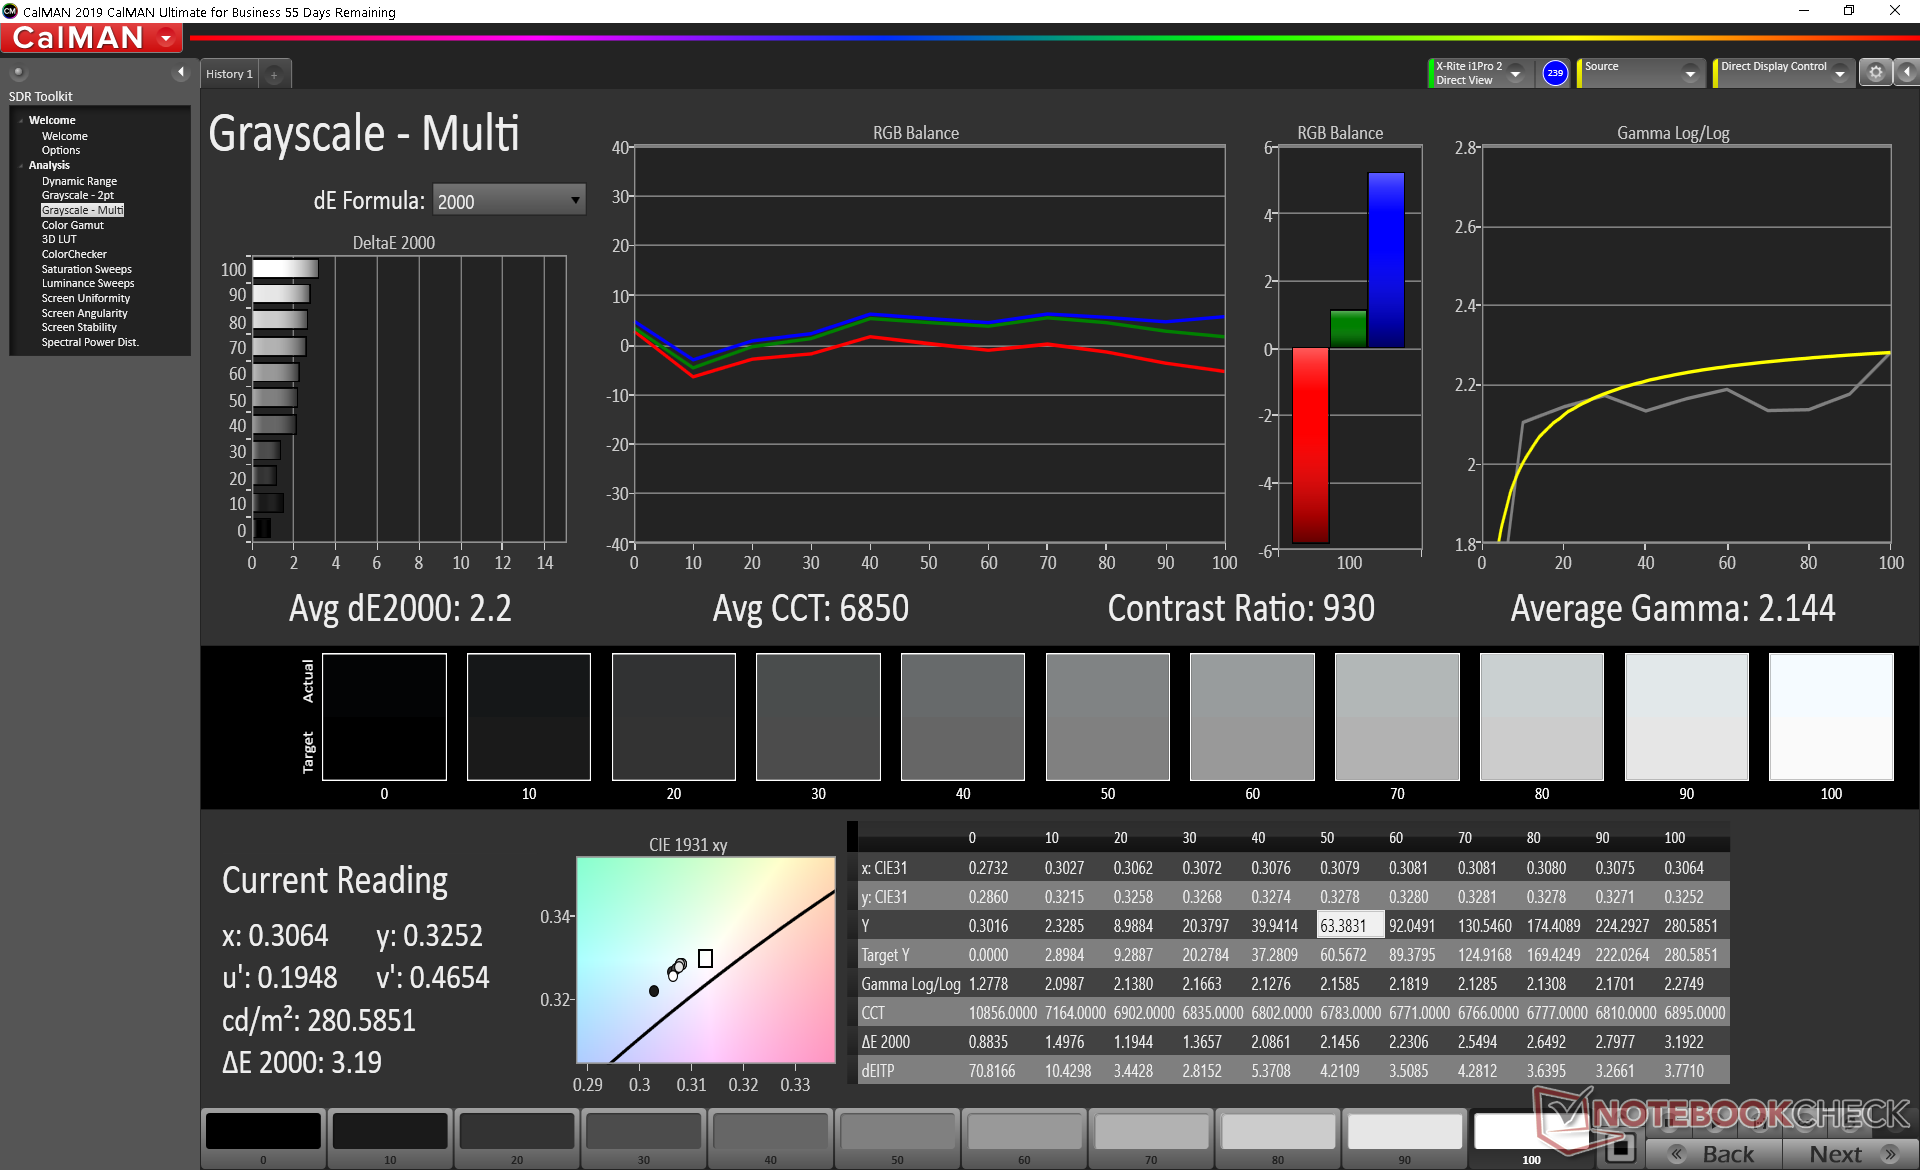
ΔE ColorChecker Calman: 4.89 | ∀{0.5-29.43 Ø4.71}
calibrated: 4.75
ΔE Greyscale Calman: 2.2 | ∀{0.09-98 Ø4.96}
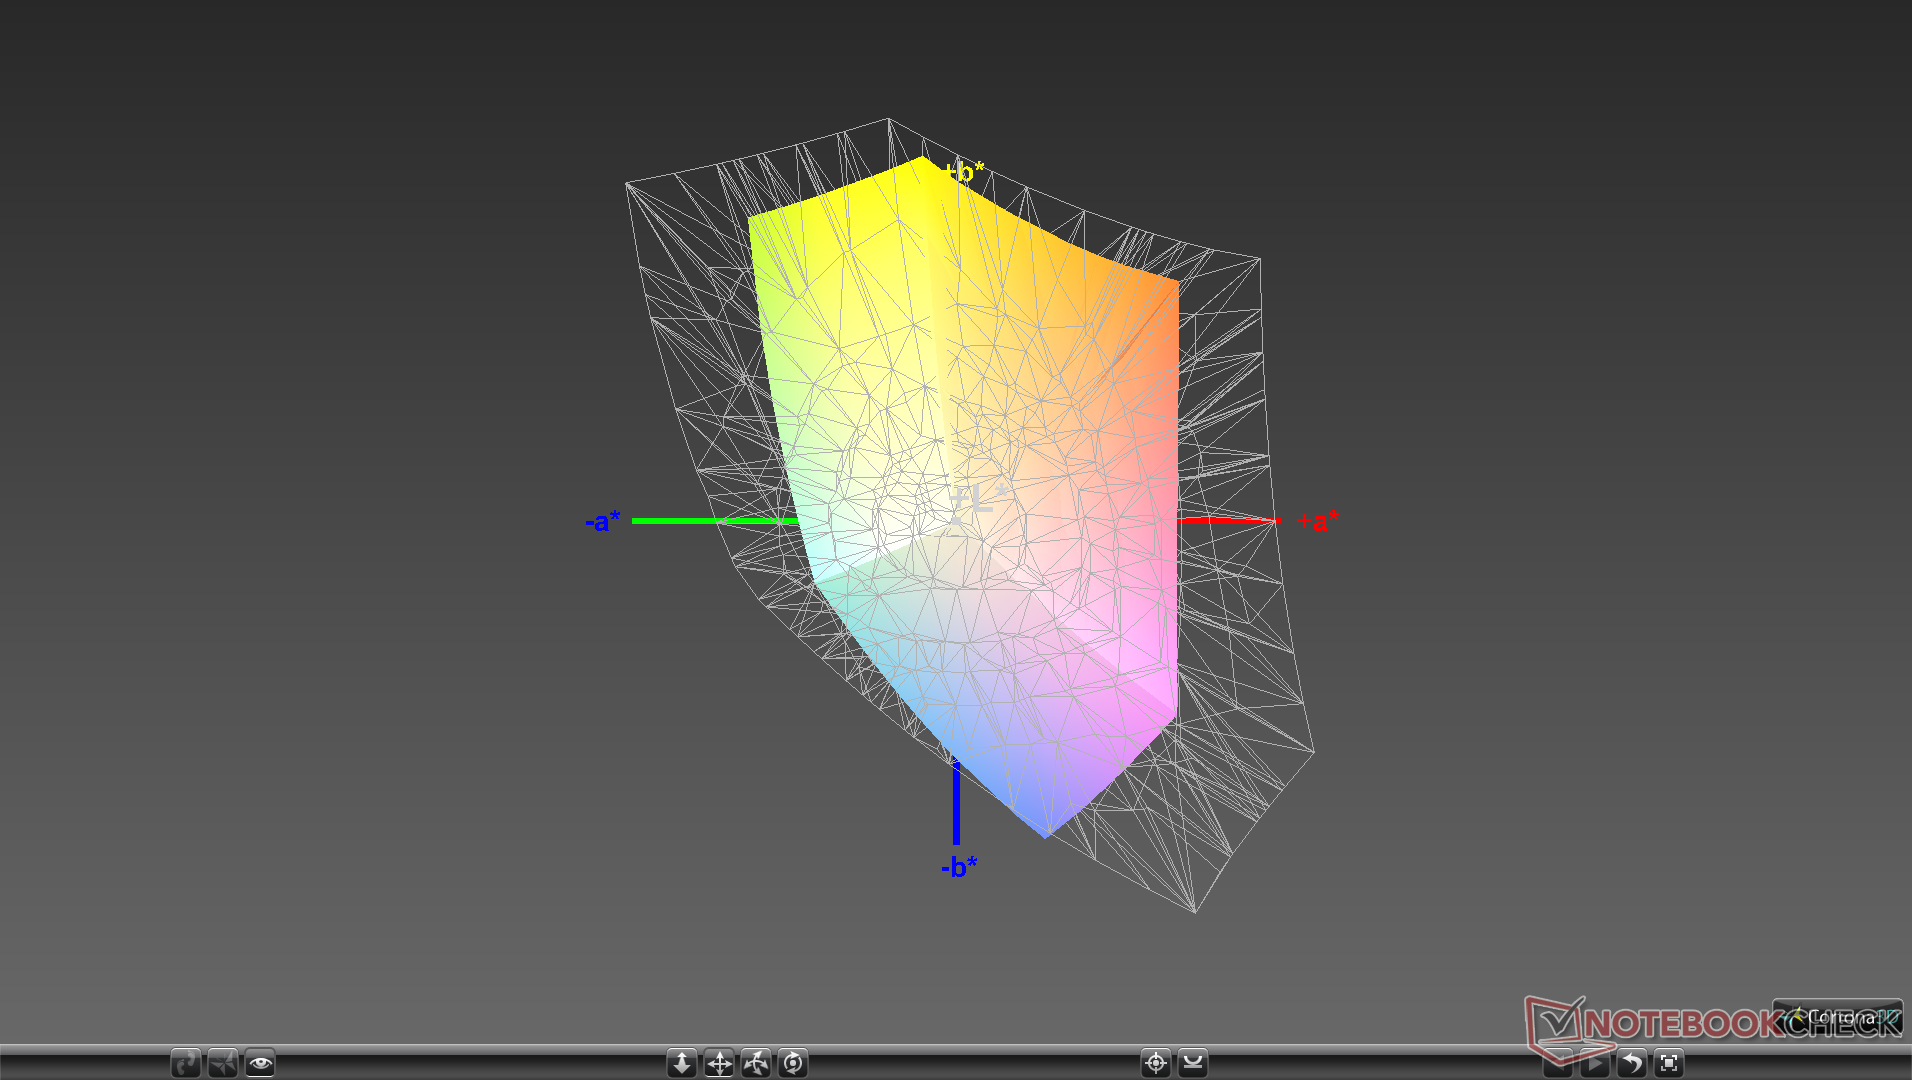
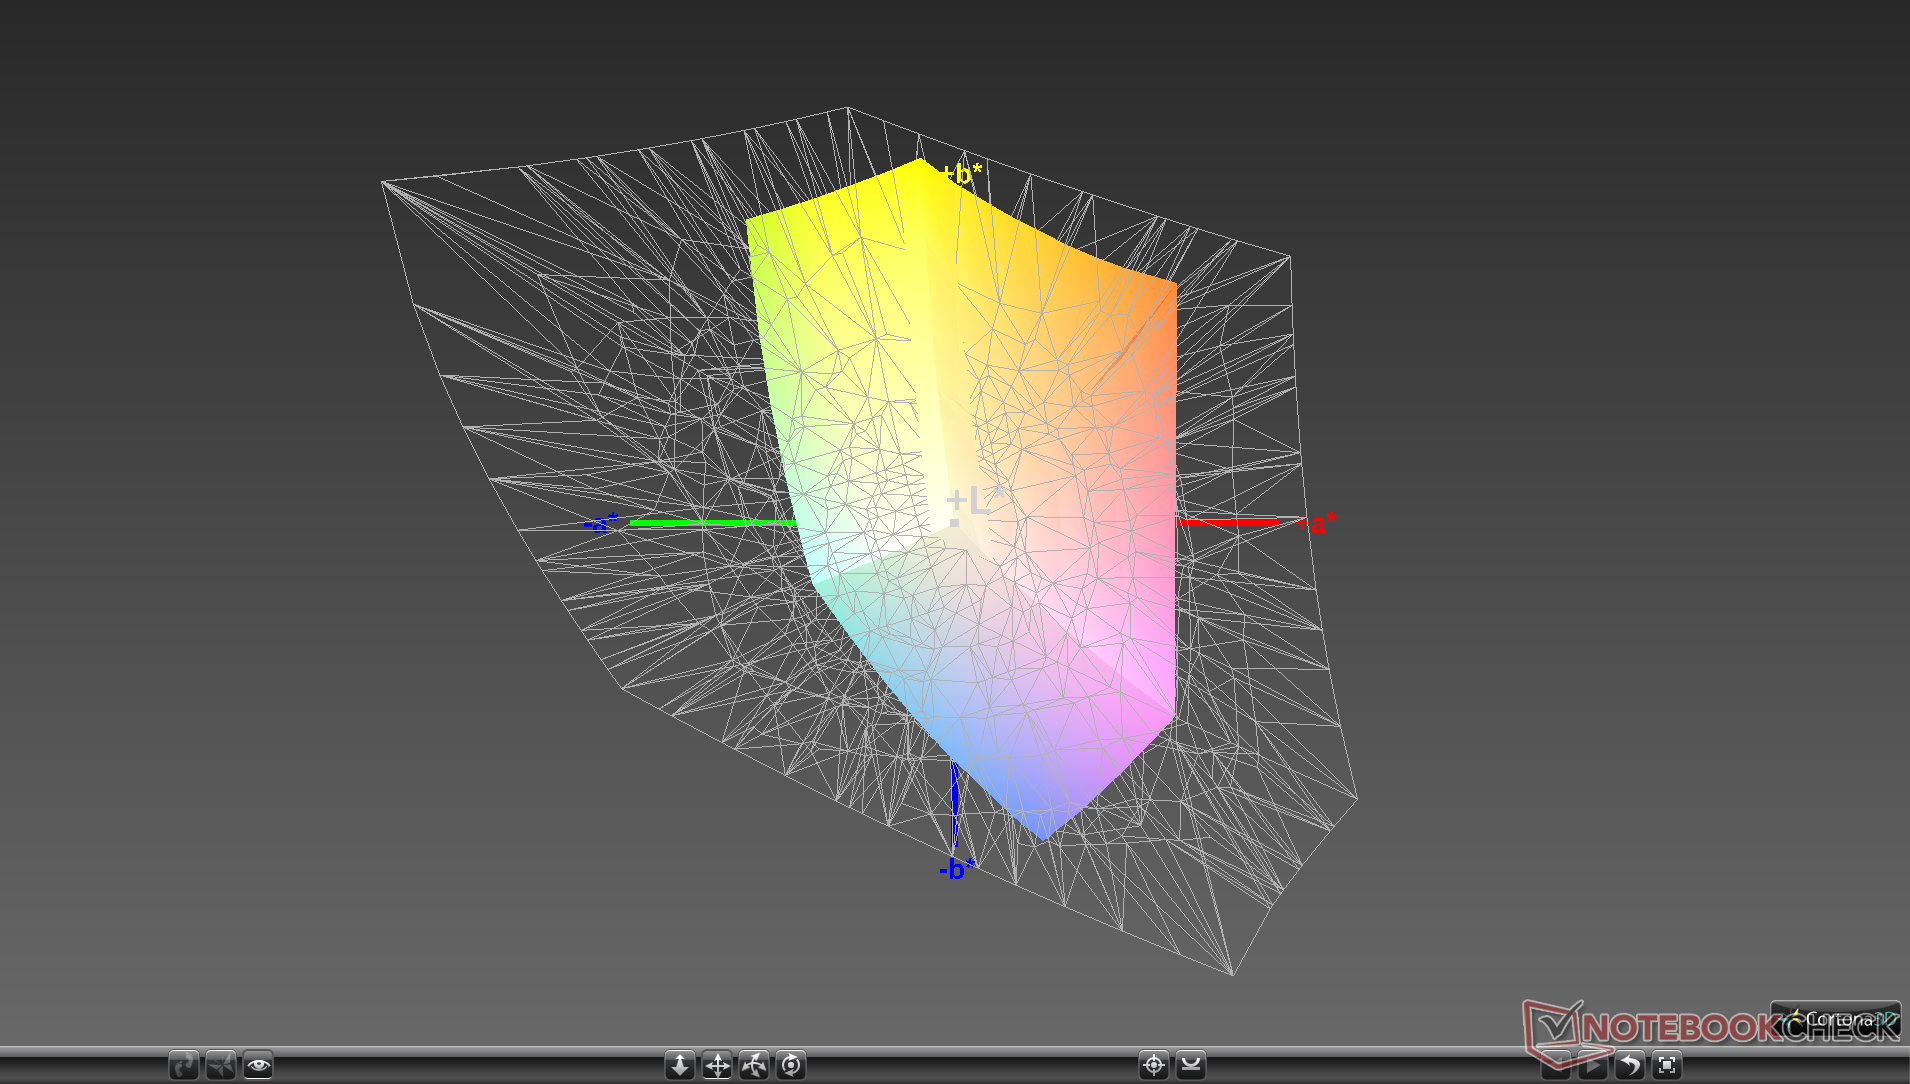
58.5% sRGB (Argyll 1.6.3 3D)
37.2% AdobeRGB 1998 (Argyll 1.6.3 3D)
40.65% AdobeRGB 1998 (Argyll 3D)
59.1% sRGB (Argyll 3D)
39.32% Display P3 (Argyll 3D)
Gamma: 2.14
CCT: 6850 K
| Asus ROG Zephyrus M15 GU502LU-BI7N4 Panda LM156LF-2F01, IPS, 15.6", 1920x1080 | Asus ROG Zephyrus M15 GU502L AU Optronics B156ZAN03.1, IPS, 15.6", 3840x2160 | HP Omen 15-ek0456ng LGD05FE, IPS, 15.6", 1920x1080 | Gateway Creator Series 15.6 GWTN156-3BK BOE NV156FHM-NX1, IPS, 15.6", 1920x1080 | Lenovo Legion 5 15IMH05H BOE CQ NV156FHM-NX1, IPS, 15.6", 1920x1080 | MSI GP65 10SFK-047US LG Philips LP156WFG-SPB3, IPS, 15.6", 1920x1080 | |
|---|---|---|---|---|---|---|
| Display | 73% | 0% | -1% | 60% | ||
| Display P3 Coverage (%) | 39.32 | 69.4 77% | 39.86 1% | 38.8 -1% | 63.5 61% | |
| sRGB Coverage (%) | 59.1 | 99 68% | 58.4 -1% | 57.8 -2% | 94.4 60% | |
| AdobeRGB 1998 Coverage (%) | 40.65 | 70.5 73% | 41.18 1% | 40.09 -1% | 65.1 60% | |
| Response Times | -66% | 46% | -15% | 17% | 57% | |
| Response Time Grey 50% / Grey 80% * (ms) | 26 ? | 60 ? -131% | 17 ? 35% | 38.4 ? -48% | 26 ? -0% | 10.4 ? 60% |
| Response Time Black / White * (ms) | 25.6 ? | 25.6 ? -0% | 11 ? 57% | 20.8 ? 19% | 17 ? 34% | 12 ? 53% |
| PWM Frequency (Hz) | ||||||
| Screen | 59% | 30% | -16% | 4% | 21% | |
| Brightness middle (cd/m²) | 282.5 | 387 37% | 314 11% | 296.3 5% | 301 7% | 384.9 36% |
| Brightness (cd/m²) | 260 | 377 45% | 293 13% | 284 9% | 277 7% | 358 38% |
| Brightness Distribution (%) | 86 | 90 5% | 87 1% | 84 -2% | 77 -10% | 87 1% |
| Black Level * (cd/m²) | 0.34 | 0.23 32% | 0.22 35% | 0.38 -12% | 0.26 24% | 0.67 -97% |
| Contrast (:1) | 831 | 1683 103% | 1427 72% | 780 -6% | 1158 39% | 574 -31% |
| Colorchecker dE 2000 * | 4.89 | 1.8 63% | 2.51 49% | 6.56 -34% | 5.12 -5% | 2.43 50% |
| Colorchecker dE 2000 max. * | 17.46 | 3.94 77% | 4.42 75% | 21.81 -25% | 8.86 49% | 4.58 74% |
| Colorchecker dE 2000 calibrated * | 4.75 | 0.7 85% | 1.71 64% | 5.34 -12% | 4.88 -3% | 2.03 57% |
| Greyscale dE 2000 * | 2.2 | 2.9 -32% | 3.26 -48% | 4.4 -100% | 3.47 -58% | 2.6 -18% |
| Gamma | 2.14 103% | 2.178 101% | 2.42 91% | 2.22 99% | 2.37 93% | 2.2 100% |
| CCT | 6850 95% | 6992 93% | 6150 106% | 6716 97% | 7062 92% | 6981 93% |
| Color Space (Percent of AdobeRGB 1998) (%) | 37.2 | 99 166% | 37.3 0% | 37 -1% | 59.7 60% | |
| Color Space (Percent of sRGB) (%) | 58.5 | 99 69% | 57.6 -2% | 57 -3% | 93.9 61% | |
| Total Average (Program / Settings) | 22% /
46% | 38% /
33% | -10% /
-13% | 7% /
5% | 46% /
33% |
* ... smaller is better
The display is calibrated pretty well out of the box despite the narrow 59 percent sRGB coverage. Even so, color accuracy remains subpar at higher saturation levels.

Display Response Times
| ↔ Response Time Black to White | ||
|---|---|---|
| 25.6 ms ... rise ↗ and fall ↘ combined | ↗ 14.8 ms rise | 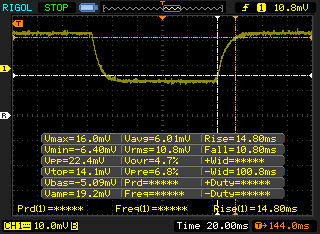 |
| ↘ 10.8 ms fall | ||
| The screen shows relatively slow response rates in our tests and may be too slow for gamers. In comparison, all tested devices range from 0.1 (minimum) to 240 (maximum) ms. » 61 % of all devices are better. This means that the measured response time is worse than the average of all tested devices (19.8 ms). | ||
| ↔ Response Time 50% Grey to 80% Grey | ||
| 26 ms ... rise ↗ and fall ↘ combined | ↗ 11.2 ms rise | 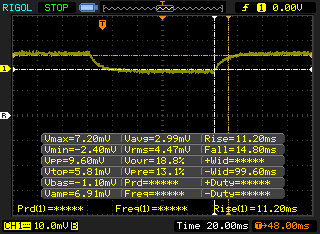 |
| ↘ 14.8 ms fall | ||
| The screen shows relatively slow response rates in our tests and may be too slow for gamers. In comparison, all tested devices range from 0.165 (minimum) to 636 (maximum) ms. » 36 % of all devices are better. This means that the measured response time is better than the average of all tested devices (31 ms). | ||
Screen Flickering / PWM (Pulse-Width Modulation)
| Screen flickering / PWM not detected | 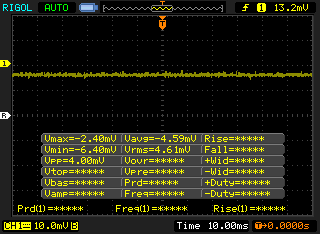 | ||
In comparison: 52 % of all tested devices do not use PWM to dim the display. If PWM was detected, an average of 7754 (minimum: 5 - maximum: 343500) Hz was measured. | |||

Performance
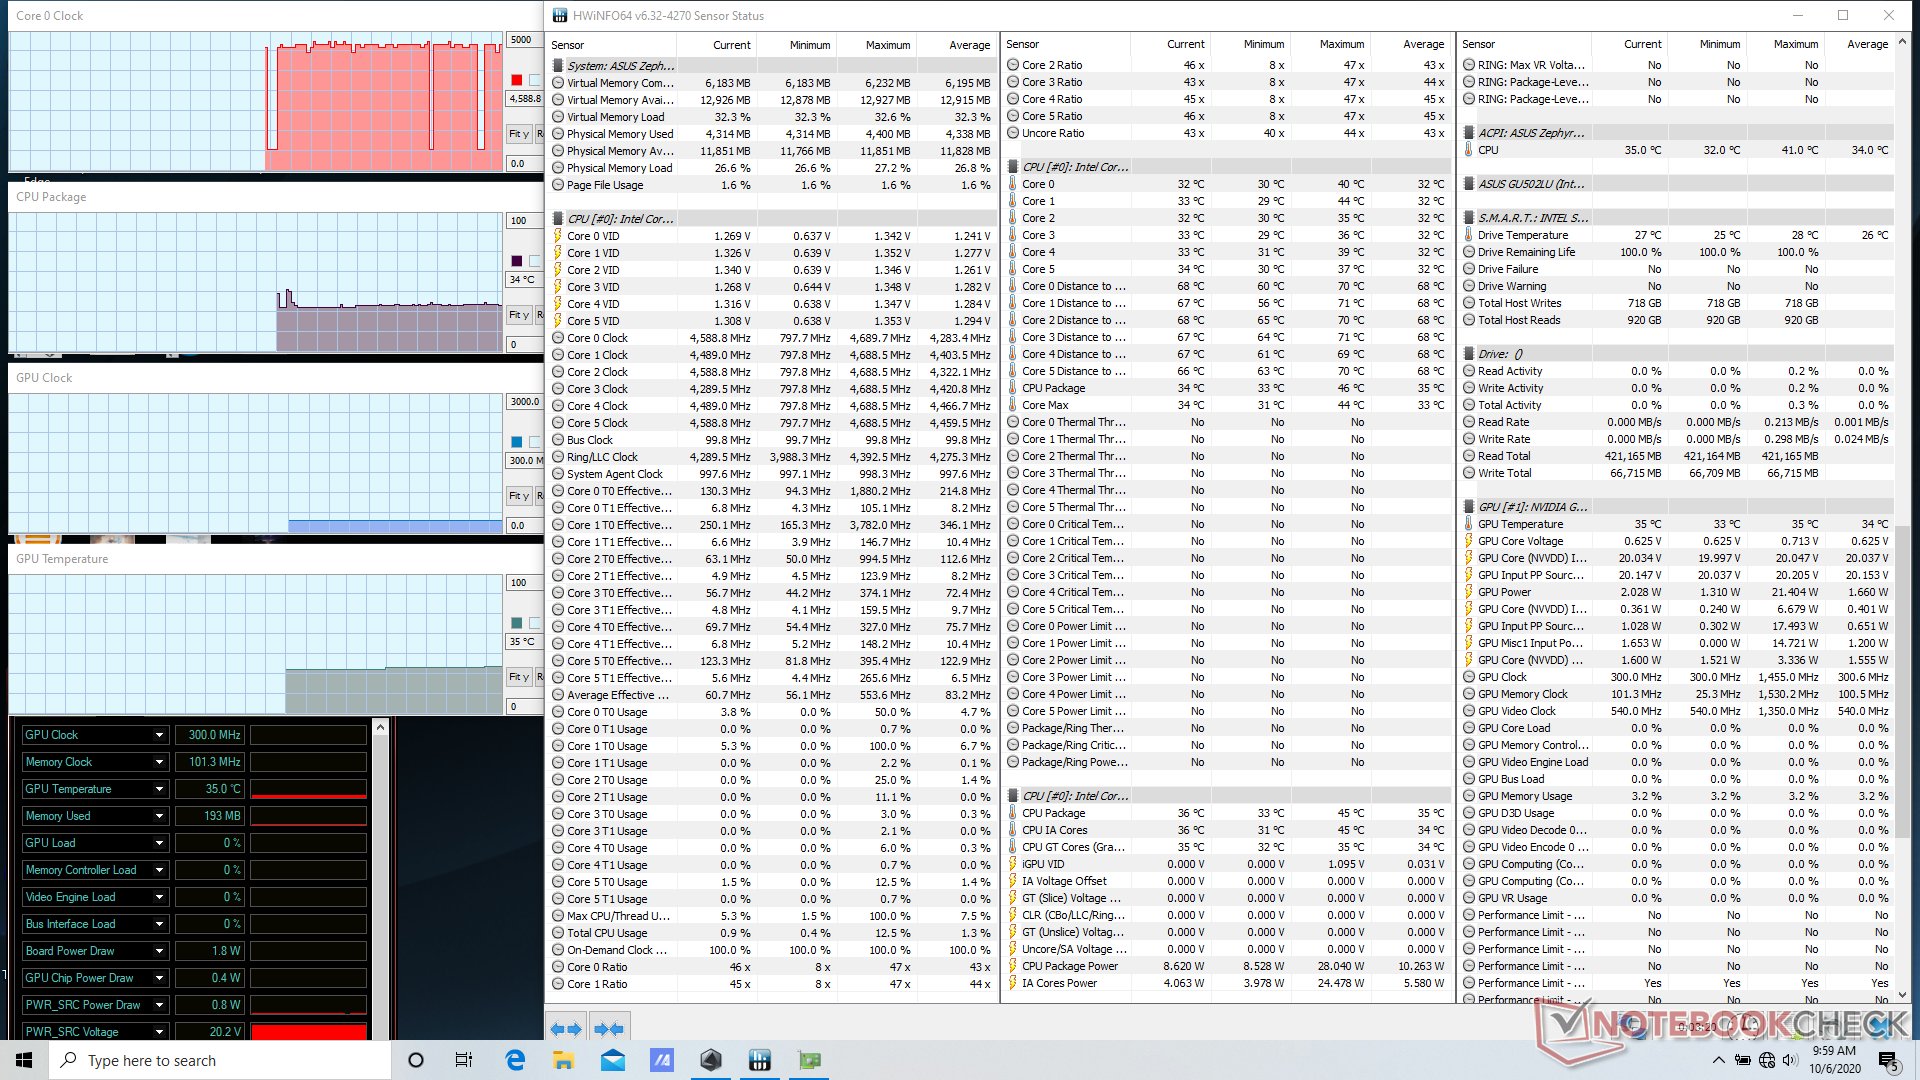
The GU502LU comes with the same Core i7-10750H CPU as our GU502LW even though their GPUs and displays are different. Nonetheless, CPU performance can differ depending on the Armoury Crate power profile. All performance benchmarks below were recorded on Turbo mode unless otherwise stated.
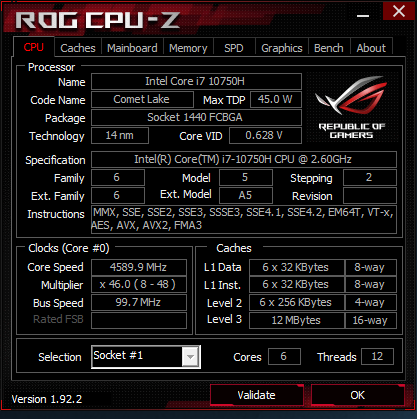
Processor
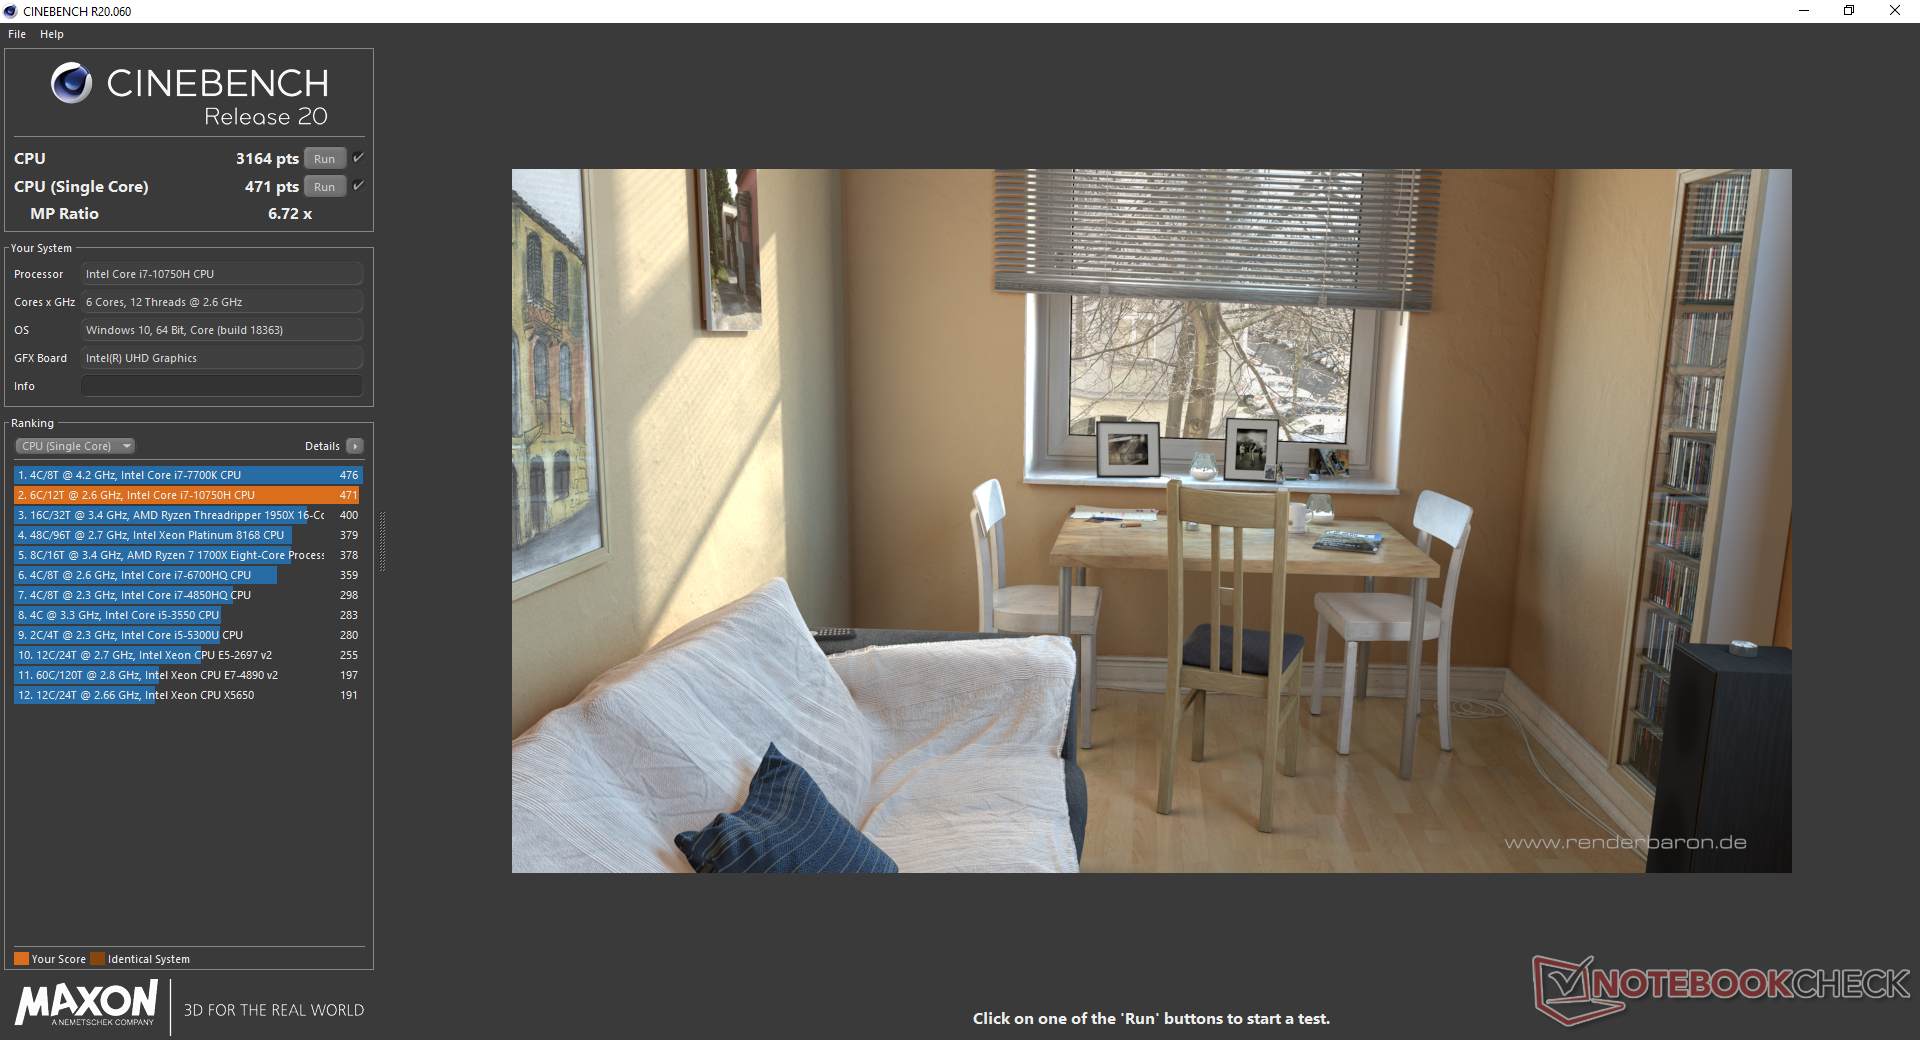
Turbo Boost sustainability is improved if running on Turbo mode as shown by our CineBench R15 Multi-Thread loop results below. If running on Performance mode, CPU performance can drop by about 9 percent over time. Overall raw CPU performance is very close to the less expensive Ryzen 5 4600H.
Processor performance drops even further if running on battery power from 3164 points to 2528 points in CineBench R20. Note that Turbo mode is automatically disabled if the laptop is not connected to an outlet.


Cinebench R15: CPU Multi 64Bit | CPU Single 64Bit
Blender: v2.79 BMW27 CPU
7-Zip 18.03: 7z b 4 -mmt1 | 7z b 4
Geekbench 5.5: Single-Core | Multi-Core
HWBOT x265 Benchmark v2.2: 4k Preset
LibreOffice : 20 Documents To PDF
R Benchmark 2.5: Overall mean
| Geekbench 5.5 / Single-Core | |
| Asus ROG Strix Scar 15 G532LWS | |
| MSI GT76 Titan DT 10SGS | |
| Average Intel Core i7-10750H (1114 - 1333, n=43) | |
| Asus Zephyrus S15 GX502L | |
| Asus ROG Zephyrus M15 GU502LU-BI7N4 | |
| Asus ROG Zephyrus G15 GA502IU-ES76 | |
| MSI Bravo 15 A4DCR | |
| Schenker XMG Pro 15 | |
| HP Pavilion Gaming 15-ec1206ng | |
| Geekbench 5.5 / Multi-Core | |
| MSI GT76 Titan DT 10SGS | |
| Asus ROG Strix Scar 15 G532LWS | |
| Asus ROG Zephyrus G15 GA502IU-ES76 | |
| Asus Zephyrus S15 GX502L | |
| MSI Bravo 15 A4DCR | |
| Asus ROG Zephyrus M15 GU502LU-BI7N4 | |
| Average Intel Core i7-10750H (4443 - 6674, n=43) | |
| Schenker XMG Pro 15 | |
| HP Pavilion Gaming 15-ec1206ng | |
| HWBOT x265 Benchmark v2.2 / 4k Preset | |
| MSI GT76 Titan DT 10SGS | |
| Asus Zephyrus S15 GX502L | |
| Asus ROG Strix Scar 15 G532LWS | |
| Eurocom Nightsky RX15 | |
| Asus ROG Zephyrus G15 GA502IU-ES76 | |
| MSI Bravo 15 A4DCR | |
| Asus ROG Zephyrus M15 GU502LU-BI7N4 | |
| HP Pavilion Gaming 15-ec1206ng | |
| Average Intel Core i7-10750H (5.54 - 11.6, n=43) | |
| Schenker XMG Pro 15 | |
| LibreOffice / 20 Documents To PDF | |
| MSI Bravo 15 A4DCR | |
| HP Pavilion Gaming 15-ec1206ng | |
| Asus ROG Zephyrus G15 GA502IU-ES76 | |
| Average Intel Core i7-10750H (43.1 - 99.2, n=43) | |
| Asus ROG Strix Scar 15 G532LWS | |
| Asus ROG Zephyrus M15 GU502LU-BI7N4 | |
| Asus Zephyrus S15 GX502L | |
| MSI GT76 Titan DT 10SGS | |
| R Benchmark 2.5 / Overall mean | |
| Schenker XMG Pro 15 | |
| Asus ROG Zephyrus M15 GU502LU-BI7N4 | |
| Average Intel Core i7-10750H (0.578 - 0.708, n=42) | |
| HP Pavilion Gaming 15-ec1206ng | |
| MSI Bravo 15 A4DCR | |
| Asus Zephyrus S15 GX502L | |
| Asus ROG Zephyrus G15 GA502IU-ES76 | |
| MSI GT76 Titan DT 10SGS | |
| Asus ROG Strix Scar 15 G532LWS | |
* ... smaller is better
System Performance
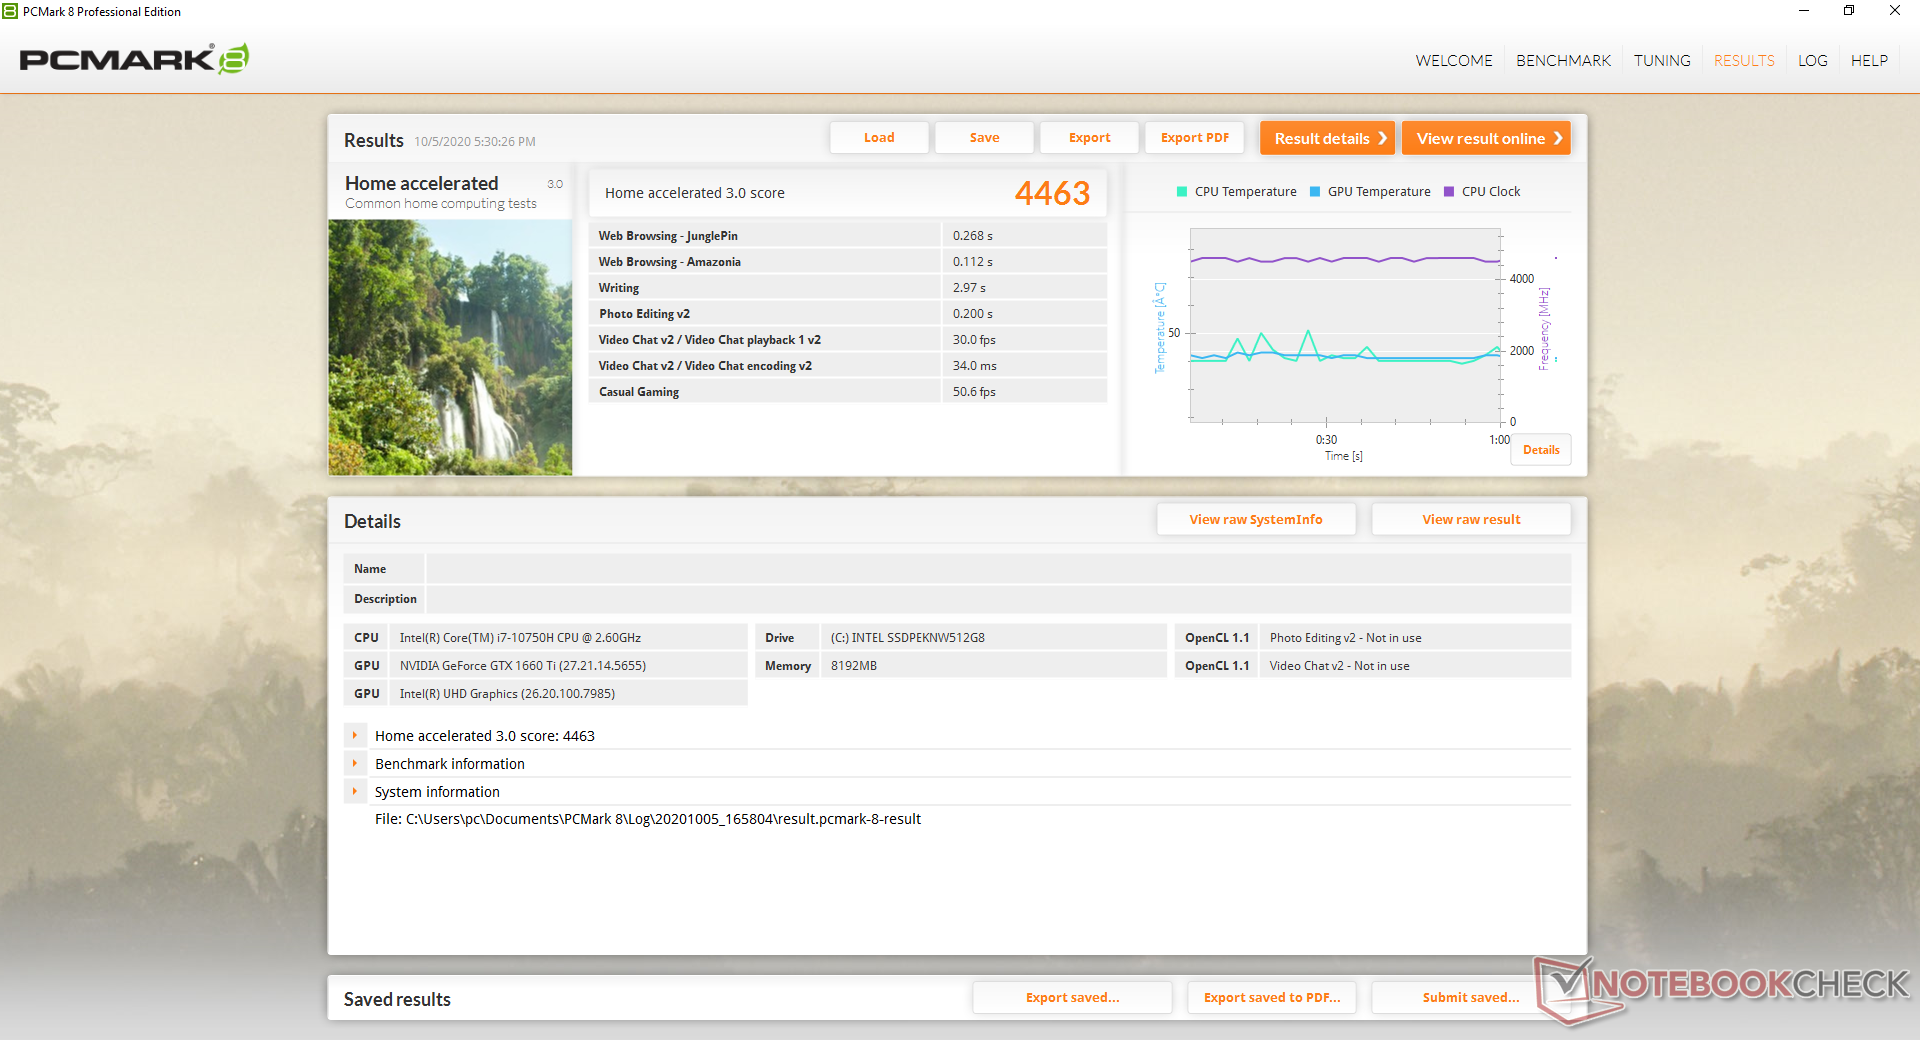
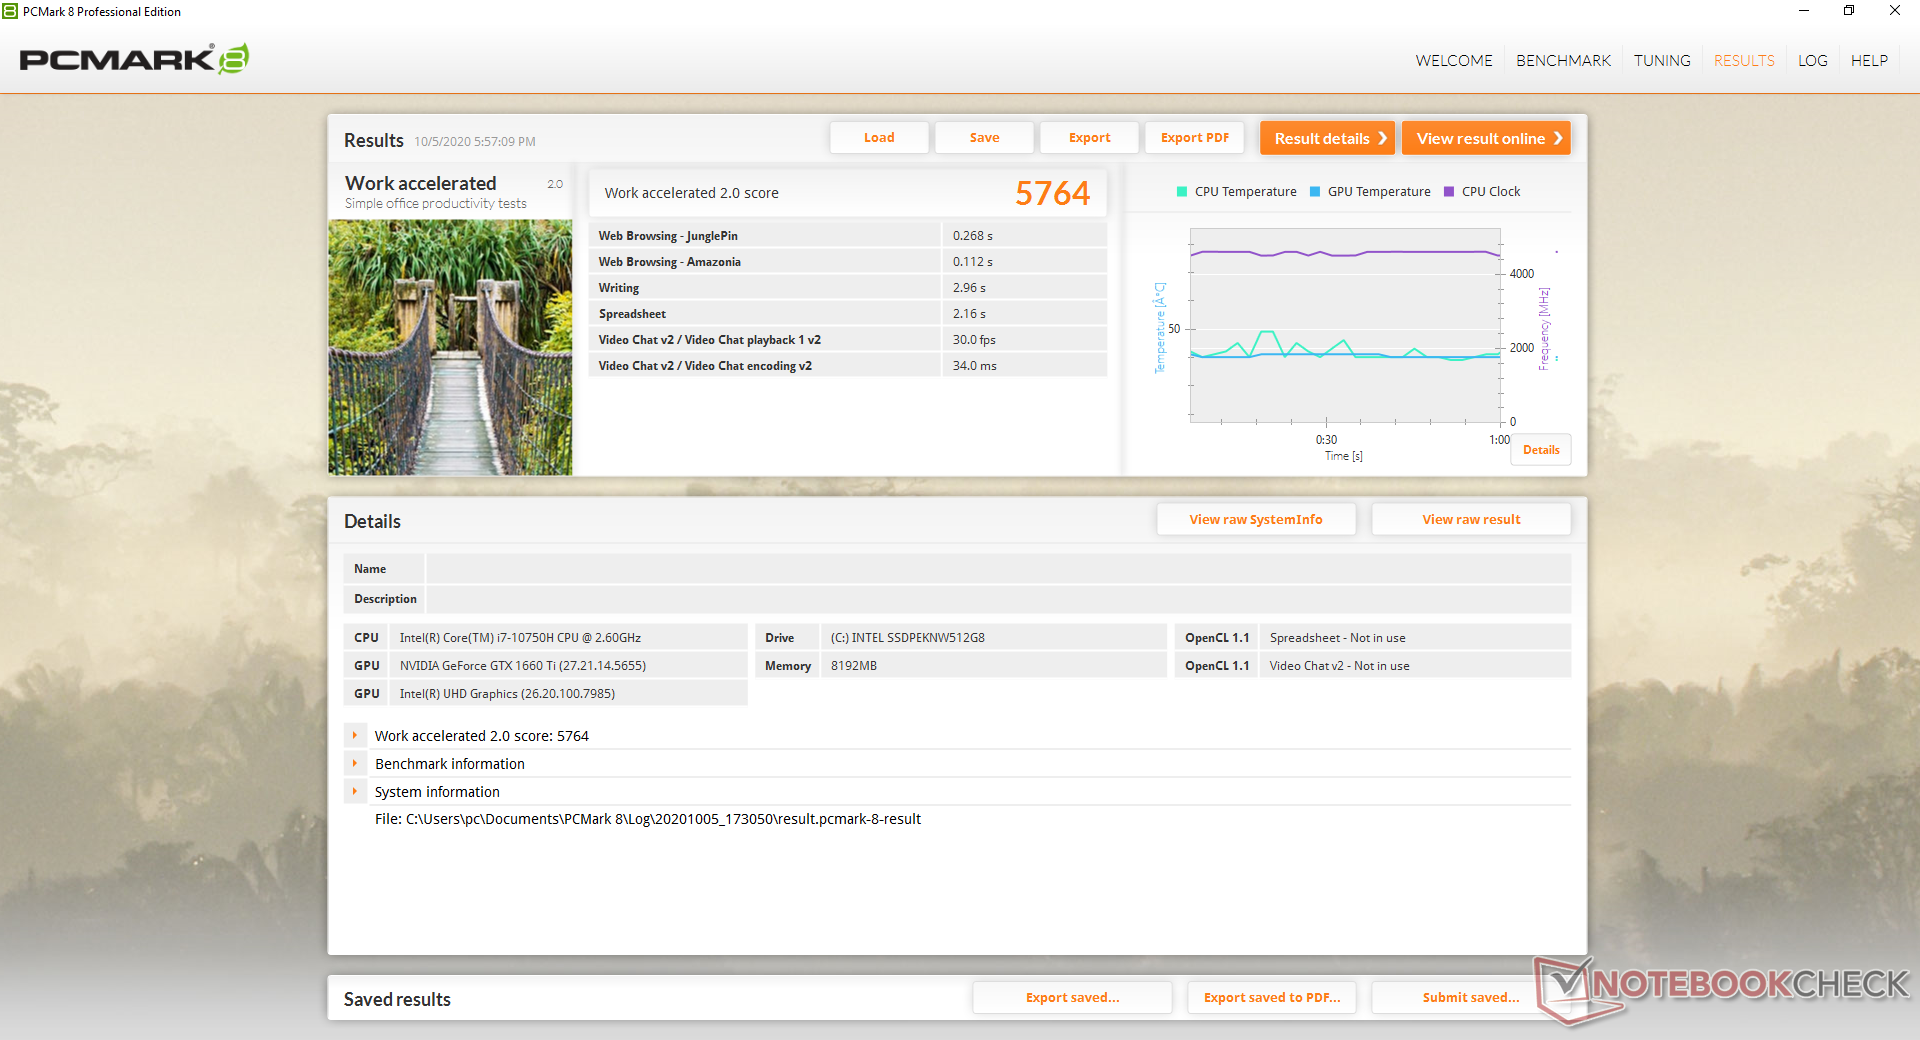
| PCMark 8 Home Score Accelerated v2 | 4463 points | |
| PCMark 8 Work Score Accelerated v2 | 5764 points | |
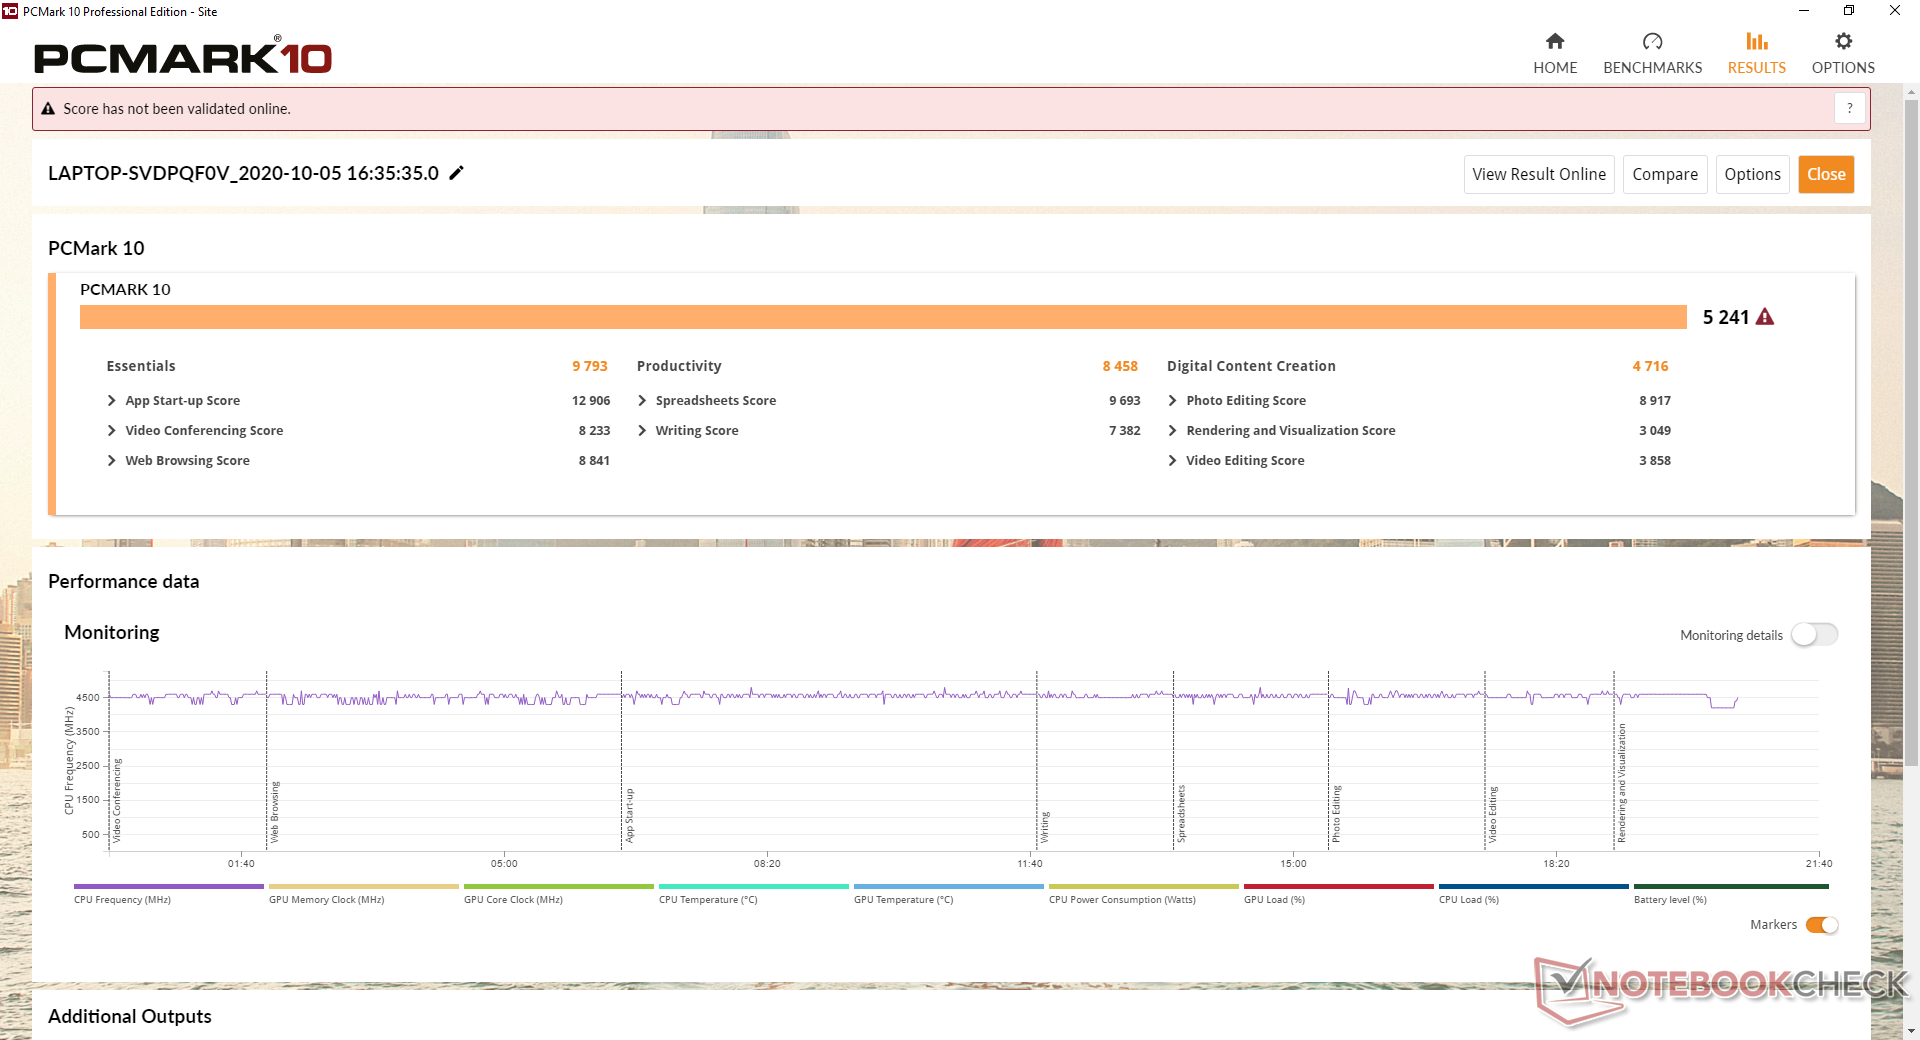
| PCMark 10 Score | 5241 points | |
Help | ||
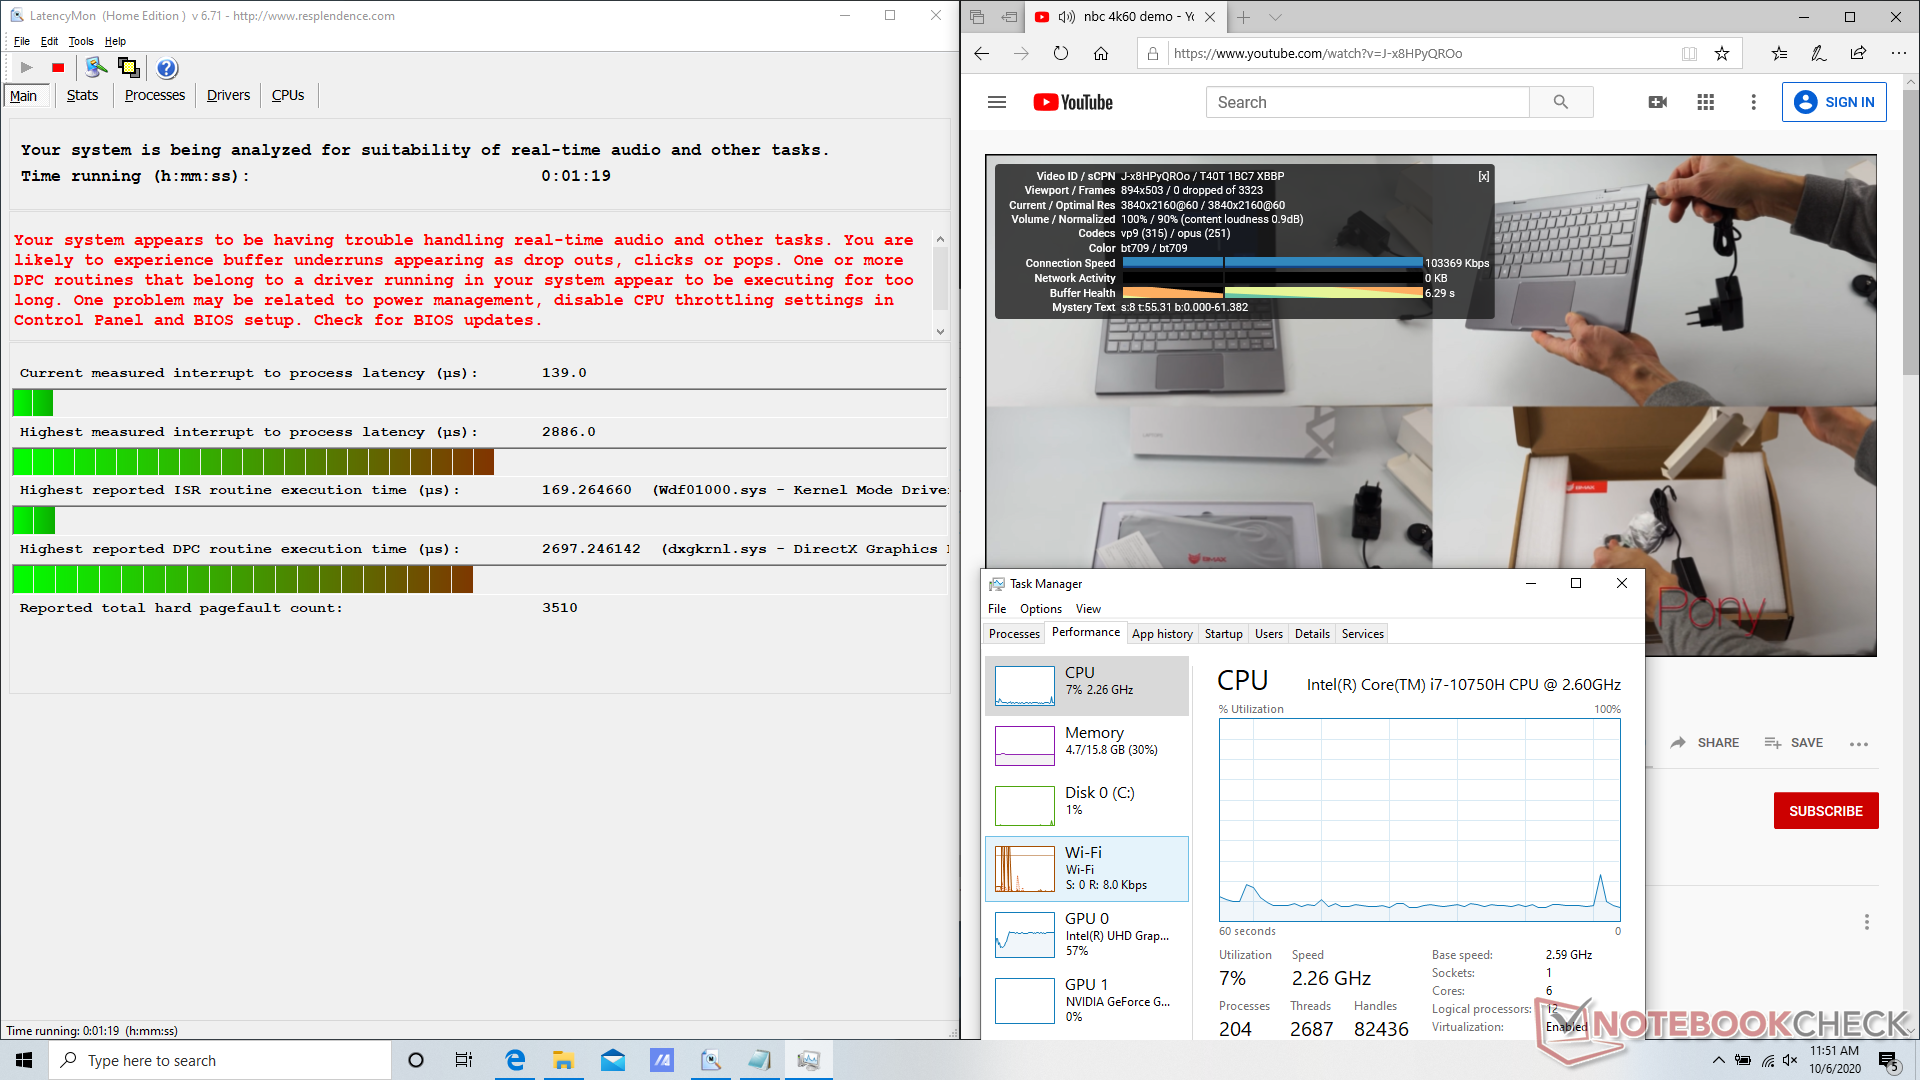
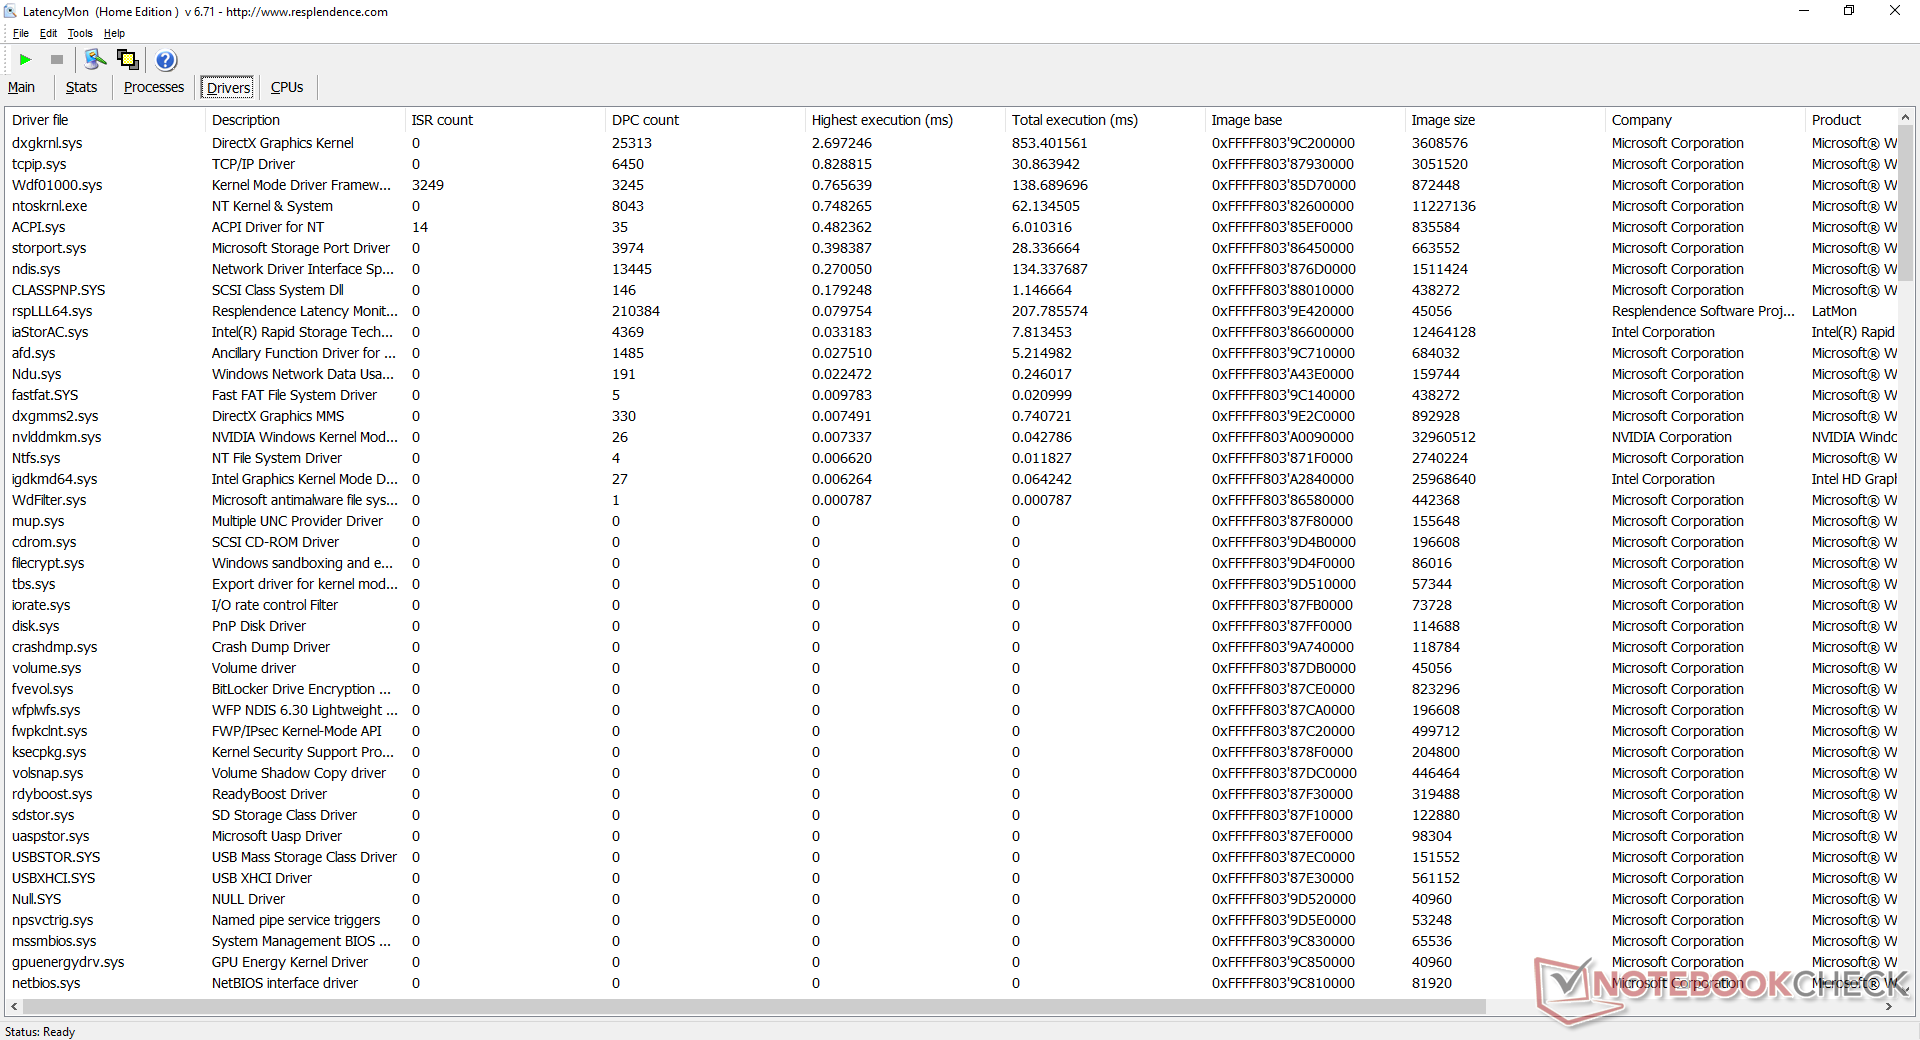
DPC Latency
LatencyMon shows DPC latency issues when opening multiple tabs on our homepage. 4K UHD playback at 60 FPS is otherwise smooth and with no dropped frames.
| DPC Latencies / LatencyMon - interrupt to process latency (max), Web, Youtube, Prime95 | |
| HP Omen 15-ek0456ng | |
| Asus ROG Zephyrus M15 GU502LU-BI7N4 | |
| Gateway Creator Series 15.6 GWTN156-3BK | |
| Asus ROG Zephyrus M15 GU502L | |
| MSI GP65 10SFK-047US | |
| Lenovo Legion 5 15IMH05H | |
* ... smaller is better
Storage Devices
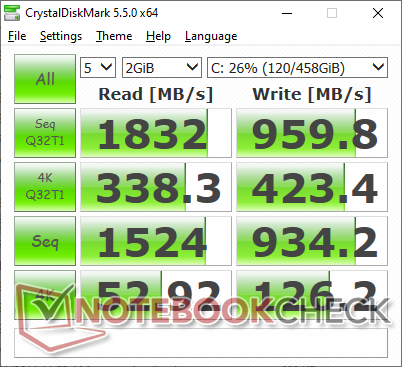
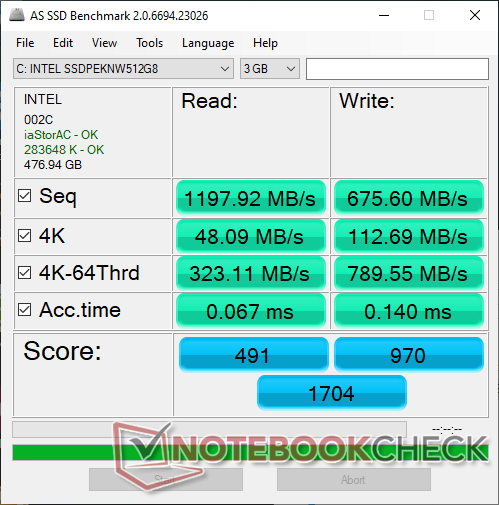
Two internal M.2 PCIe bays are available with no 2.5-inch options. Most Asus gaming laptops ship with the mid-range Intel 660p NVMe SSD and our GU502LU is no exception. The pricier Samsung PM981a or Toshiba XG6 series will offer much faster transfer rates.
| Asus ROG Zephyrus M15 GU502LU-BI7N4 Intel SSD 660p SSDPEKNW512G8 | Asus ROG Zephyrus M15 GU502L 2x Intel SSD 660p SSDPEKNW512G8 (RAID 0) | HP Omen 15-ek0456ng Toshiba XG6 KXG60ZNV512G | Gateway Creator Series 15.6 GWTN156-3BK Phison PS5013 PM8256GPTCB4B8TF | Lenovo Legion 5 15IMH05H Samsung PM991 MZALQ512HALU | MSI GP65 10SFK-047US Samsung SSD PM981 MZVLB1T0HALR | |
|---|---|---|---|---|---|---|
| AS SSD | 53% | 109% | 11% | 37% | 148% | |
| Seq Read (MB/s) | 1198 | 2523 111% | 2053 71% | 1592 33% | 2012 68% | 2066 72% |
| Seq Write (MB/s) | 676 | 1578 133% | 2562 279% | 1057 56% | 1261 87% | 2418 258% |
| 4K Read (MB/s) | 48.09 | 50.4 5% | 42.46 -12% | 34.12 -29% | 43.66 -9% | 54.2 13% |
| 4K Write (MB/s) | 112.7 | 115.6 3% | 97.2 -14% | 120.4 7% | 109.3 -3% | 129 14% |
| 4K-64 Read (MB/s) | 323.1 | 634 96% | 1414 338% | 410.1 27% | 851 163% | 1865 477% |
| 4K-64 Write (MB/s) | 790 | 1114 41% | 1471 86% | 634 -20% | 780 -1% | 1878 138% |
| Access Time Read * (ms) | 0.067 | 0.095 -42% | 0.079 -18% | 0.072 -7% | 0.117 -75% | 0.042 37% |
| Access Time Write * (ms) | 0.14 | 0.038 73% | 0.039 72% | 0.105 25% | 0.036 74% | 0.091 35% |
| Score Read (Points) | 491 | 936 91% | 1662 238% | 613 25% | 1096 123% | 2126 333% |
| Score Write (Points) | 970 | 1388 43% | 1825 88% | 860 -11% | 1016 5% | 2249 132% |
| Score Total (Points) | 1704 | 2770 63% | 4364 156% | 1771 4% | 2643 55% | 5482 222% |
| Copy ISO MB/s (MB/s) | 898 | 2106 135% | 1913 113% | 1255 40% | 1481 65% | 2927 226% |
| Copy Program MB/s (MB/s) | 523 | 549 5% | 833 59% | 508 -3% | 467.5 -11% | 728 39% |
| Copy Game MB/s (MB/s) | 948 | 854 -10% | 1667 76% | 986 4% | 734 -23% | 1614 70% |
| CrystalDiskMark 5.2 / 6 | 43% | 46% | 21% | 17% | 63% | |
| Write 4K (MB/s) | 126.2 | 123 -3% | 120 -5% | 170.2 35% | 145.4 15% | 145 15% |
| Read 4K (MB/s) | 52.9 | 52.5 -1% | 36.09 -32% | 52.5 -1% | 51.6 -2% | 46.84 -11% |
| Write Seq (MB/s) | 934 | 1698 82% | 1778 90% | 1105 18% | 1007 8% | 2377 154% |
| Read Seq (MB/s) | 1524 | 2440 60% | 1362 -11% | 1507 -1% | 1145 -25% | 2185 43% |
| Write 4K Q32T1 (MB/s) | 423.4 | 450.4 6% | 429.1 1% | 380.8 -10% | 468.4 11% | 463.5 9% |
| Read 4K Q32T1 (MB/s) | 338.3 | 550 63% | 493.2 46% | 531 57% | 528 56% | 527 56% |
| Write Seq Q32T1 (MB/s) | 960 | 1794 87% | 2936 206% | 1253 31% | 1381 44% | 2395 149% |
| Read Seq Q32T1 (MB/s) | 1832 | 2812 53% | 3227 76% | 2543 39% | 2291 25% | 3470 89% |
| Write 4K Q8T8 (MB/s) | 1536 | |||||
| Read 4K Q8T8 (MB/s) | 1490 | |||||
| Total Average (Program / Settings) | 48% /
50% | 78% /
87% | 16% /
15% | 27% /
30% | 106% /
117% |
* ... smaller is better

Disk Throttling: DiskSpd Read Loop, Queue Depth 8
GPU Performance
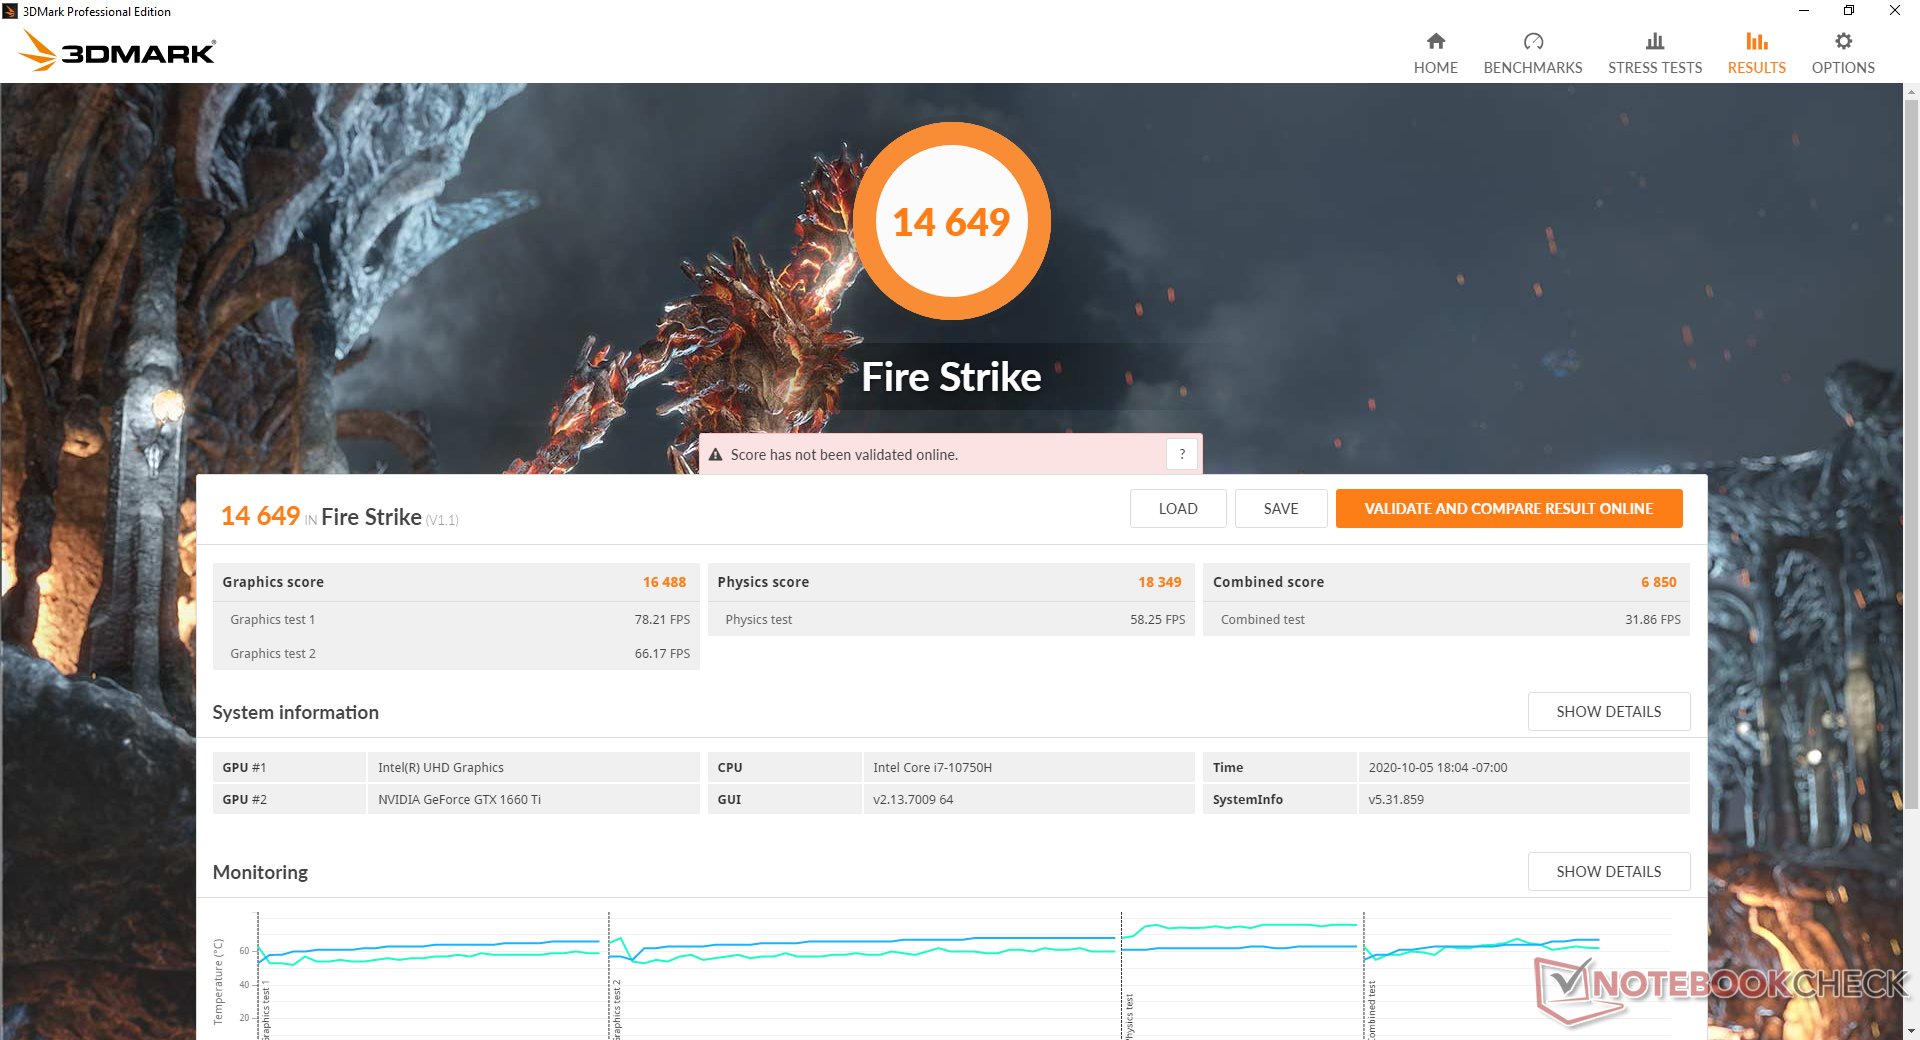
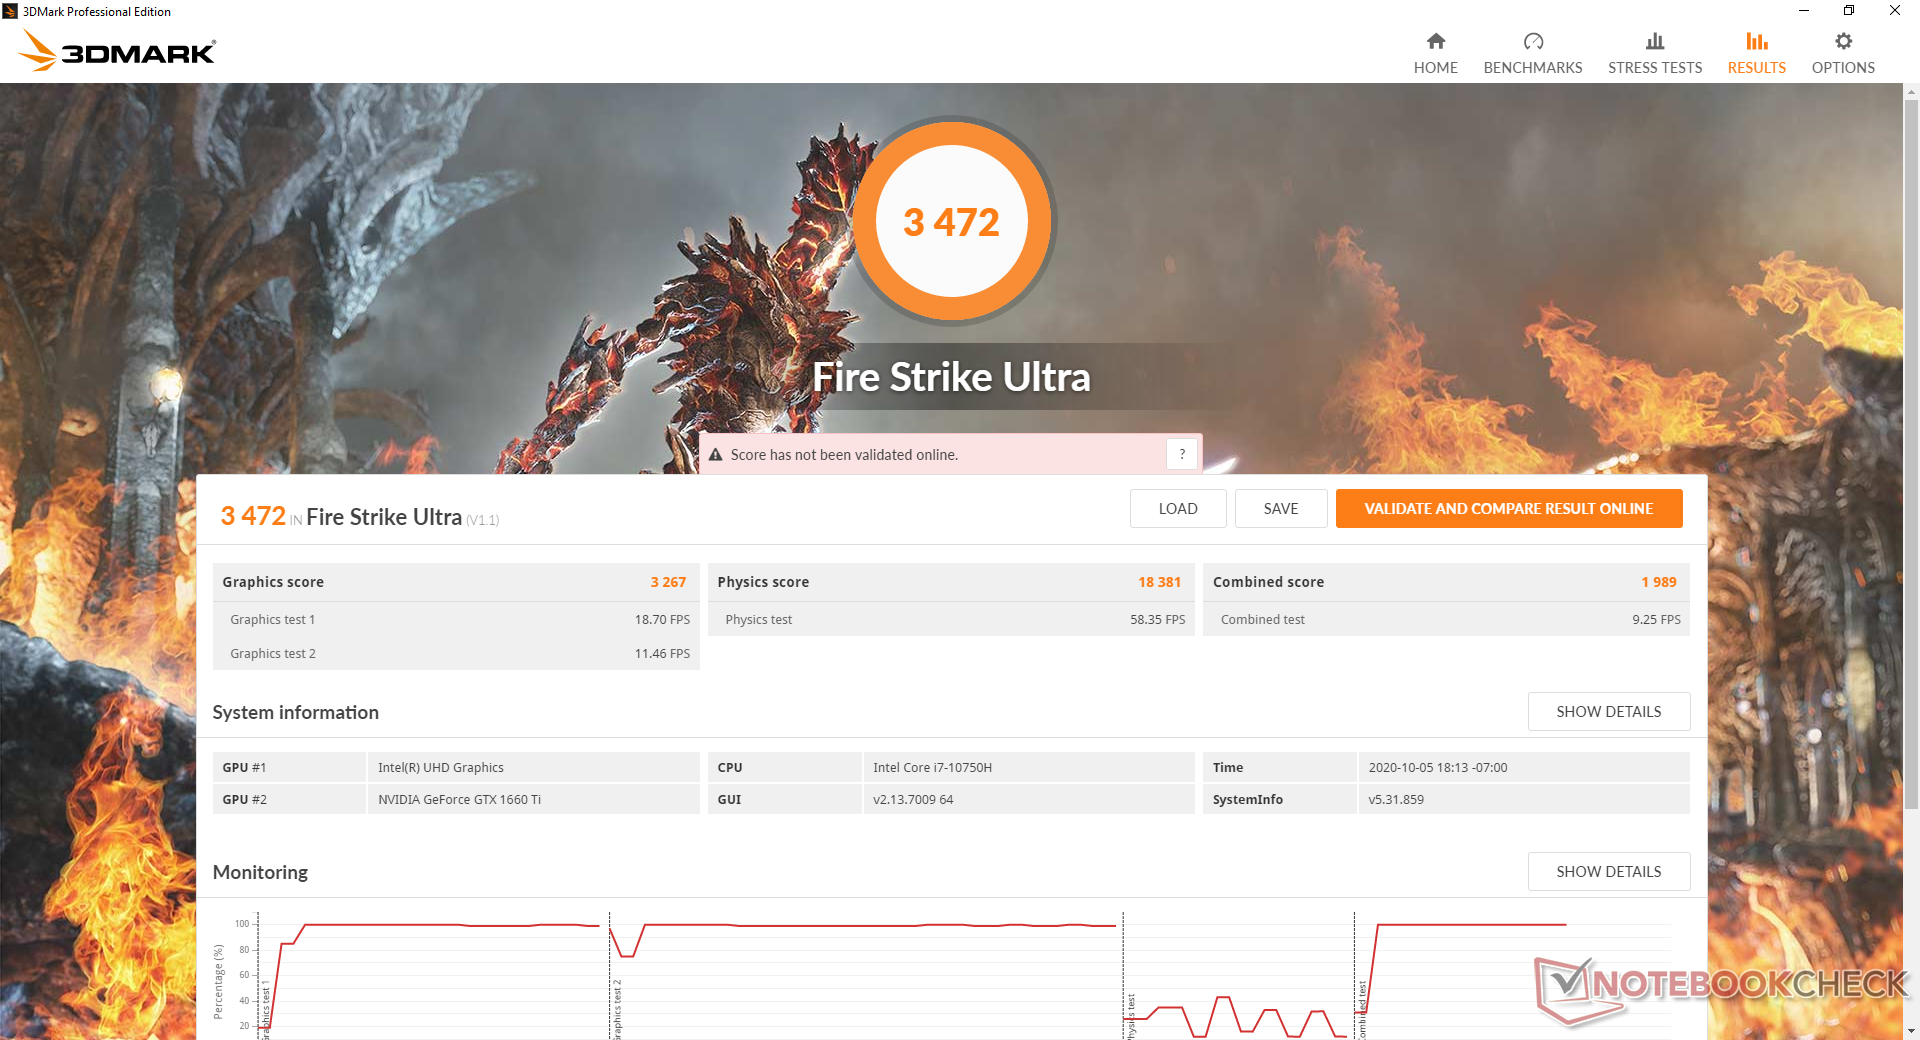
The GTX 1660 Ti on Turbo mode is only about 5 to 8 percent slower than the RTX 2070 Max-Q on Performance mode. When the RTX 2070 Max-Q is set to Turbo mode, the delta increases to about 20 percent. Both CPU and GPU performance will dip even further if running on battery power.
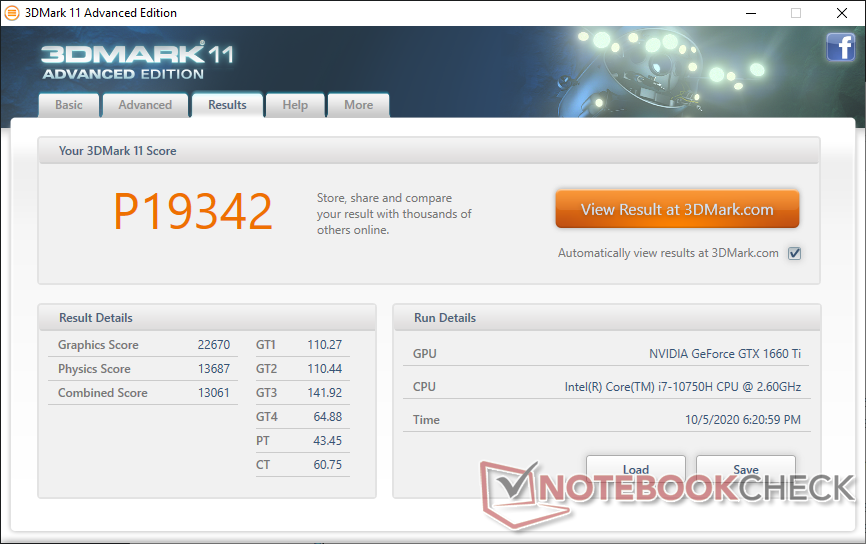

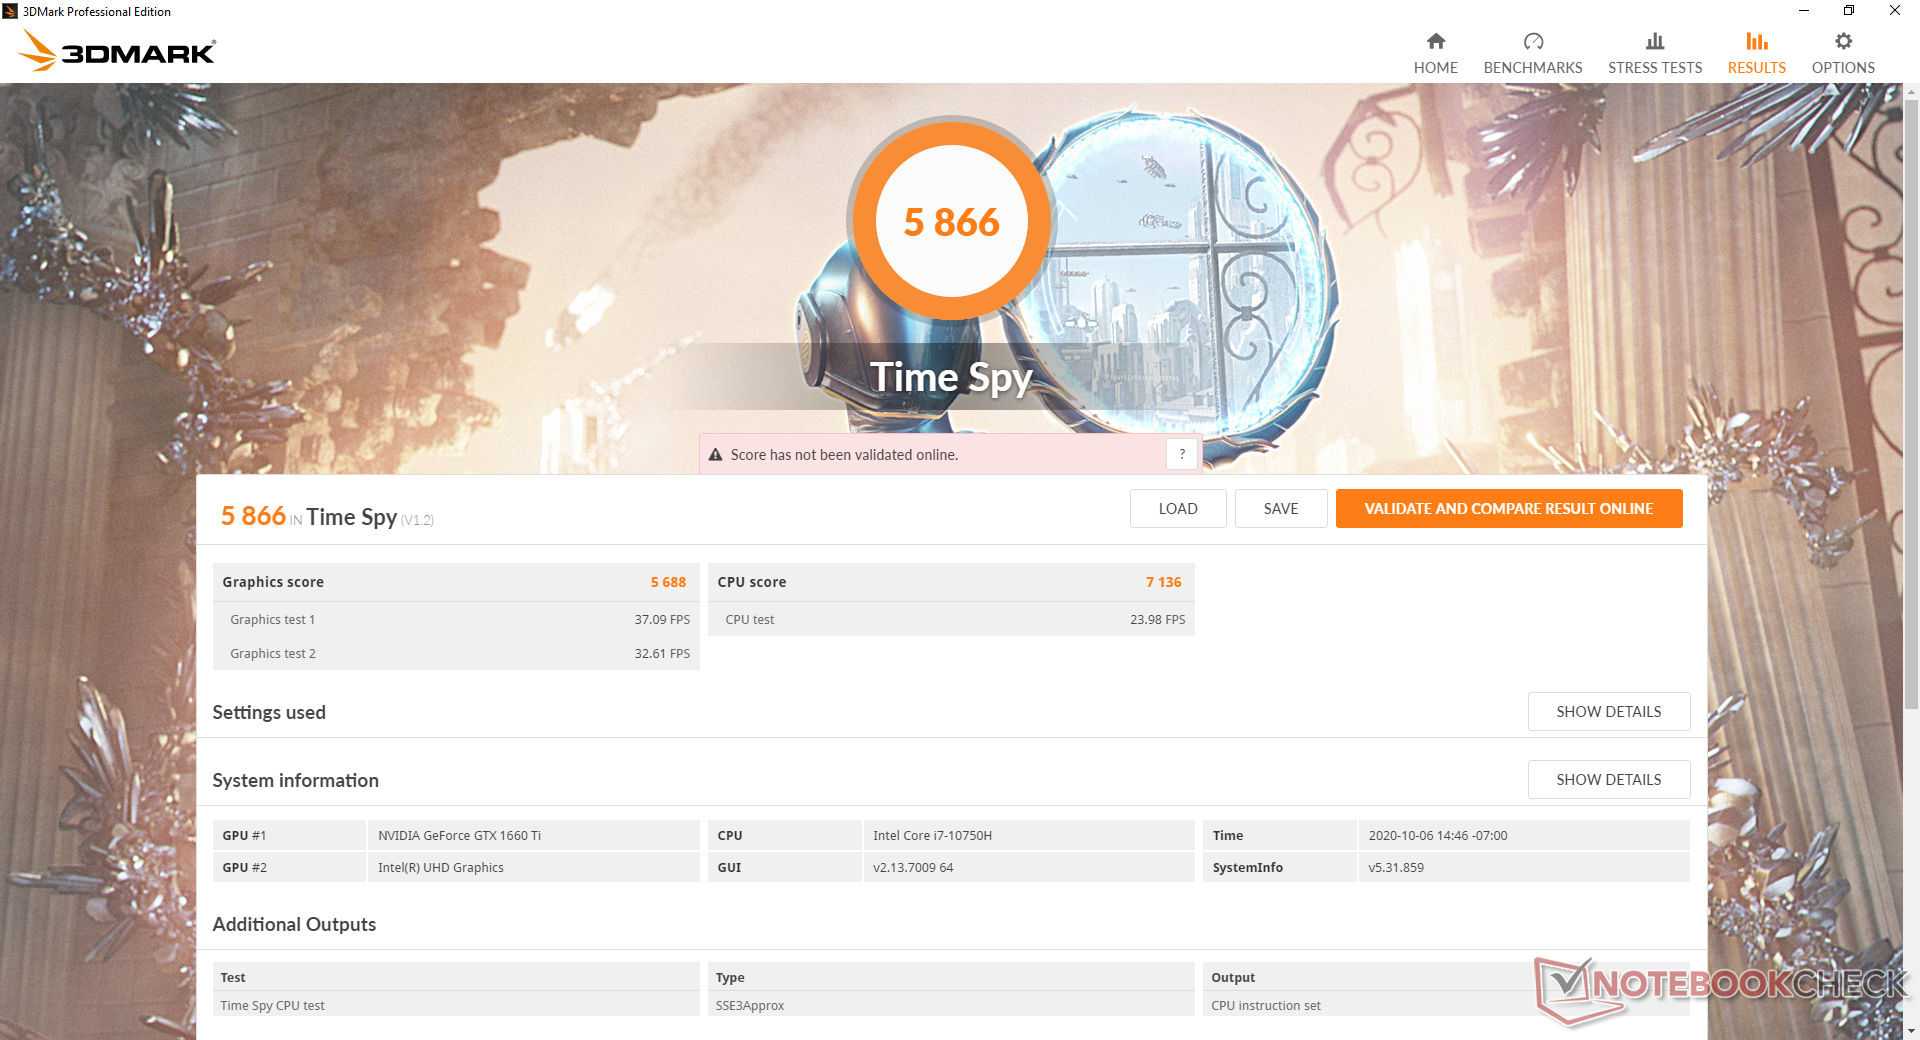

| 3DMark 11 Performance | 19342 points | |
| 3DMark Cloud Gate Standard Score | 38136 points | |
| 3DMark Fire Strike Score | 14649 points | |
| 3DMark Time Spy Score | 6261 points | |
Help | ||
| low | med. | high | ultra | |
|---|---|---|---|---|
| GTA V (2015) | 178 | 171 | 140 | 76 |
| The Witcher 3 (2015) | 288.3 | 193.2 | 117.6 | 65.1 |
| Dota 2 Reborn (2015) | 150 | 135 | 124 | 118 |
| Final Fantasy XV Benchmark (2018) | 137 | 87.6 | 63.9 | |
| X-Plane 11.11 (2018) | 101 | 89 | 75.2 | |
| Strange Brigade (2018) | 311 | 150 | 122 | 104 |
Emissions
System Noise
The fans are almost always active and audible at about 32 dB(A) even when set to Silent mode. Meanwhile, gaming on Performance mode will induce a fan noise of 53 dB(A) compared to almost 61 dB(A) when set to Turbo mode. Turbo mode will squeeze out more performance, but the increase in fan noise is definitely noticeable.

| Asus ROG Zephyrus M15 GU502LU-BI7N4 GeForce GTX 1660 Ti Mobile, i7-10750H, Intel SSD 660p SSDPEKNW512G8 | Asus ROG Zephyrus M15 GU502L GeForce RTX 2070 Max-Q, i7-10750H, 2x Intel SSD 660p SSDPEKNW512G8 (RAID 0) | HP Omen 15-ek0456ng GeForce GTX 1660 Ti Mobile, i5-10300H, Toshiba XG6 KXG60ZNV512G | Gateway Creator Series 15.6 GWTN156-3BK GeForce RTX 2060 Mobile, i5-10300H, Phison PS5013 PM8256GPTCB4B8TF | Lenovo Legion 5 15IMH05H GeForce RTX 2060 Mobile, i5-10300H, Samsung PM991 MZALQ512HALU | MSI GP65 10SFK-047US GeForce RTX 2070 Mobile, i7-10750H, Samsung SSD PM981 MZVLB1T0HALR | |
|---|---|---|---|---|---|---|
| Noise | -7% | 3% | -2% | 3% | -6% | |
| off / environment * (dB) | 25.8 | 25 3% | 27 -5% | 26.5 -3% | 30.7 -19% | 29.3 -14% |
| Idle Minimum * (dB) | 25.8 | 31 -20% | 32.4 -26% | 26.5 -3% | 30.7 -19% | 31.9 -24% |
| Idle Average * (dB) | 33.2 | 32 4% | 32.4 2% | 26.5 20% | 30.7 8% | 31.9 4% |
| Idle Maximum * (dB) | 33.2 | 36 -8% | 32.4 2% | 32.4 2% | 30.7 8% | 33.5 -1% |
| Load Average * (dB) | 37.3 | 55 -47% | 32.5 13% | 55.4 -49% | 36.6 2% | 47 -26% |
| Witcher 3 ultra * (dB) | 60.8 | 53 13% | 47.2 22% | 55.3 9% | 47 23% | 53.8 12% |
| Load Maximum * (dB) | 60.8 | 57 6% | 51.9 15% | 55.3 9% | 50.9 16% | 56.7 7% |
* ... smaller is better
Noise level
| Idle |
| 25.8 / 33.2 / 33.2 dB(A) |
| Load |
| 37.3 / 60.8 dB(A) |
 | ||
30 dB silent 40 dB(A) audible 50 dB(A) loud |
||
min: | ||
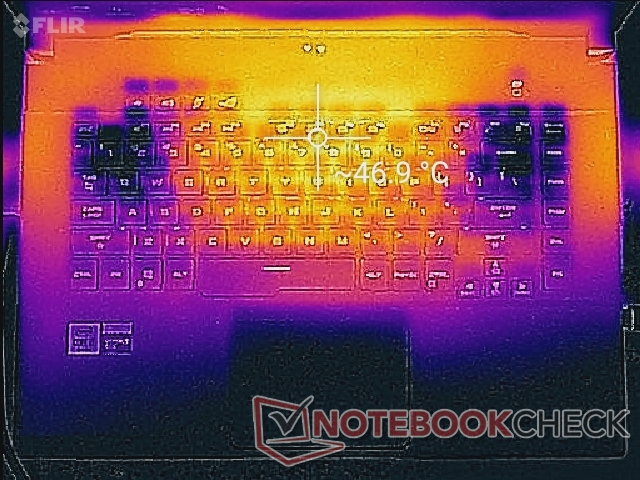
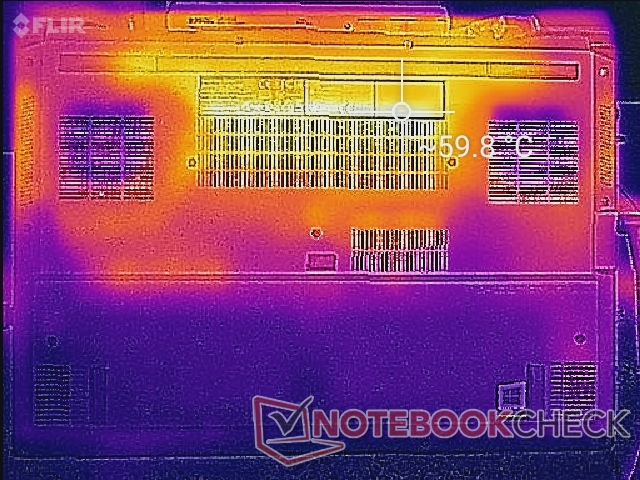
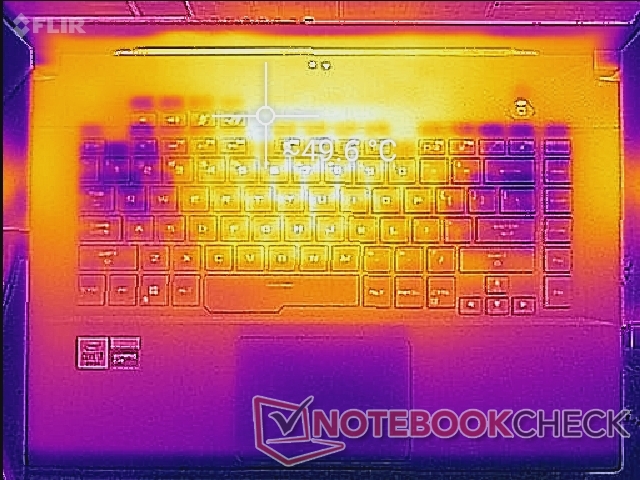
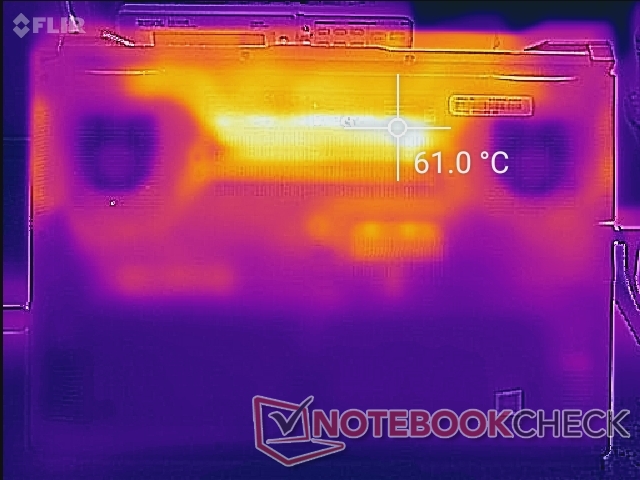
Temperature
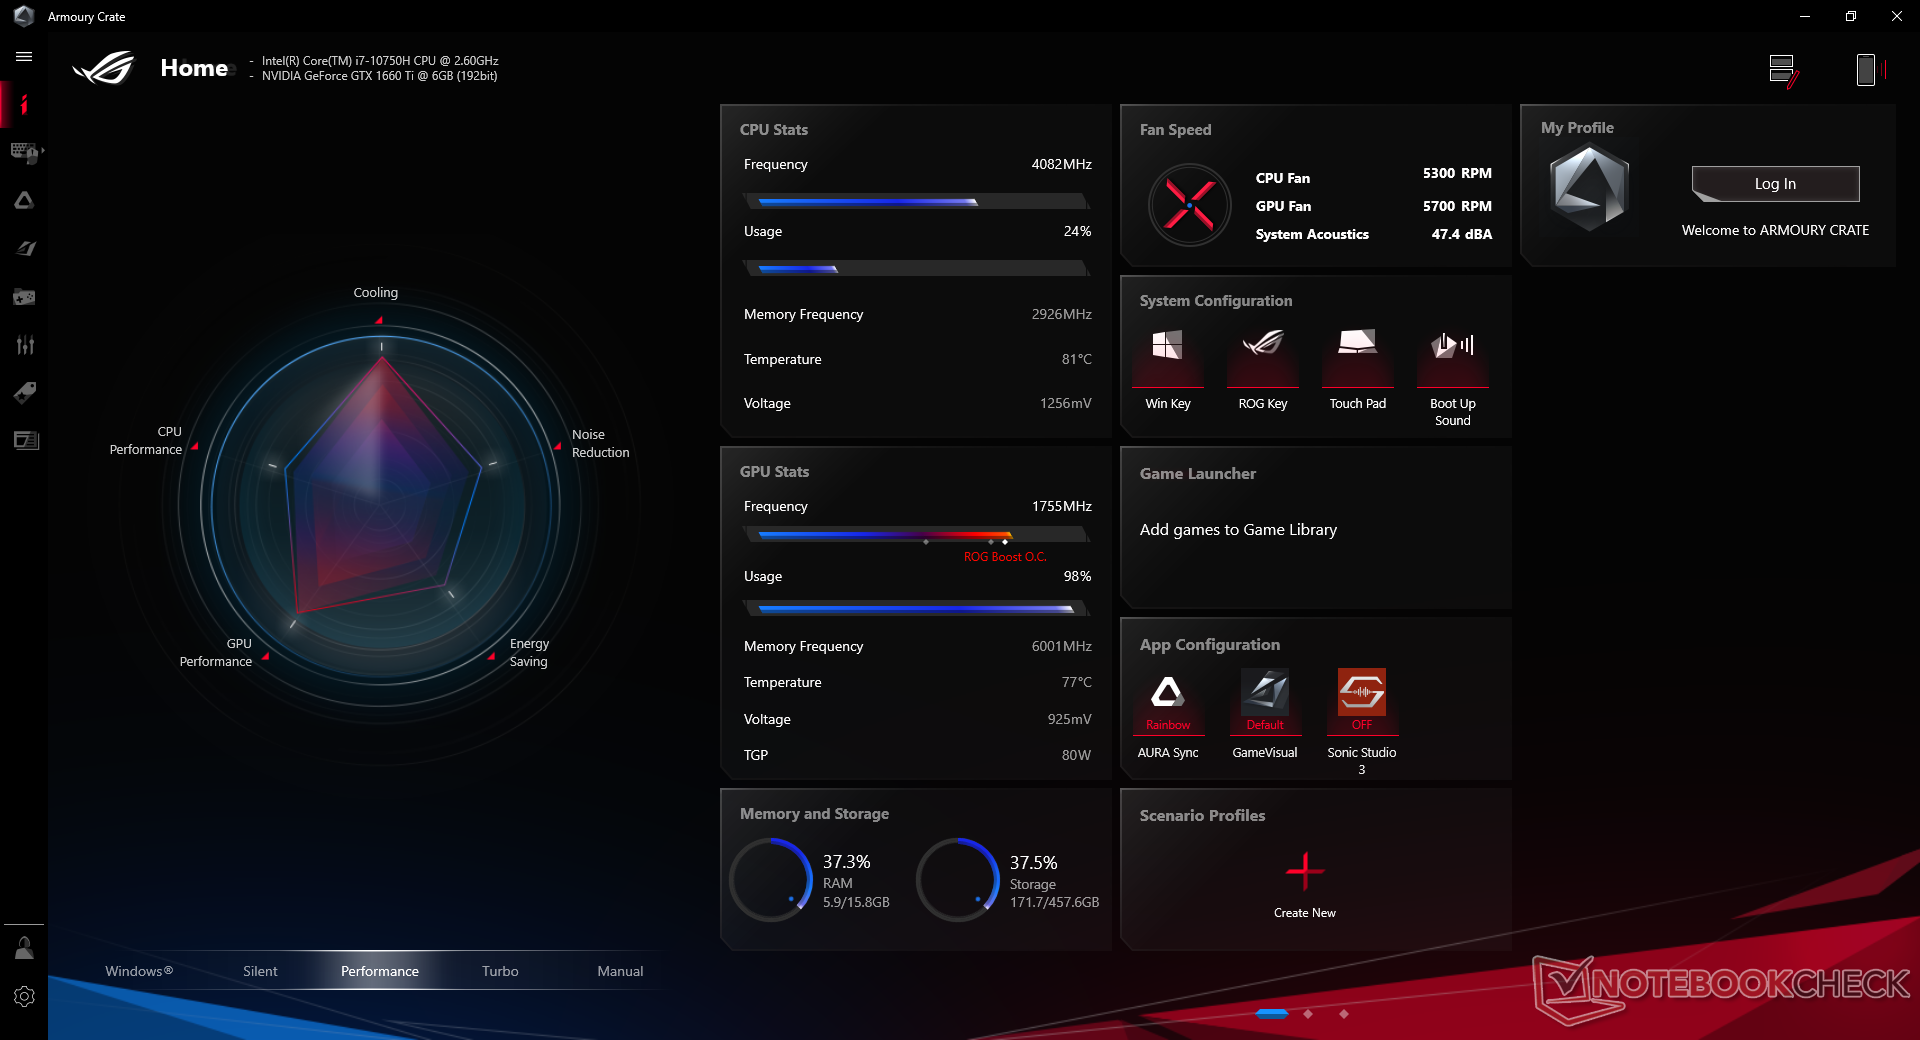
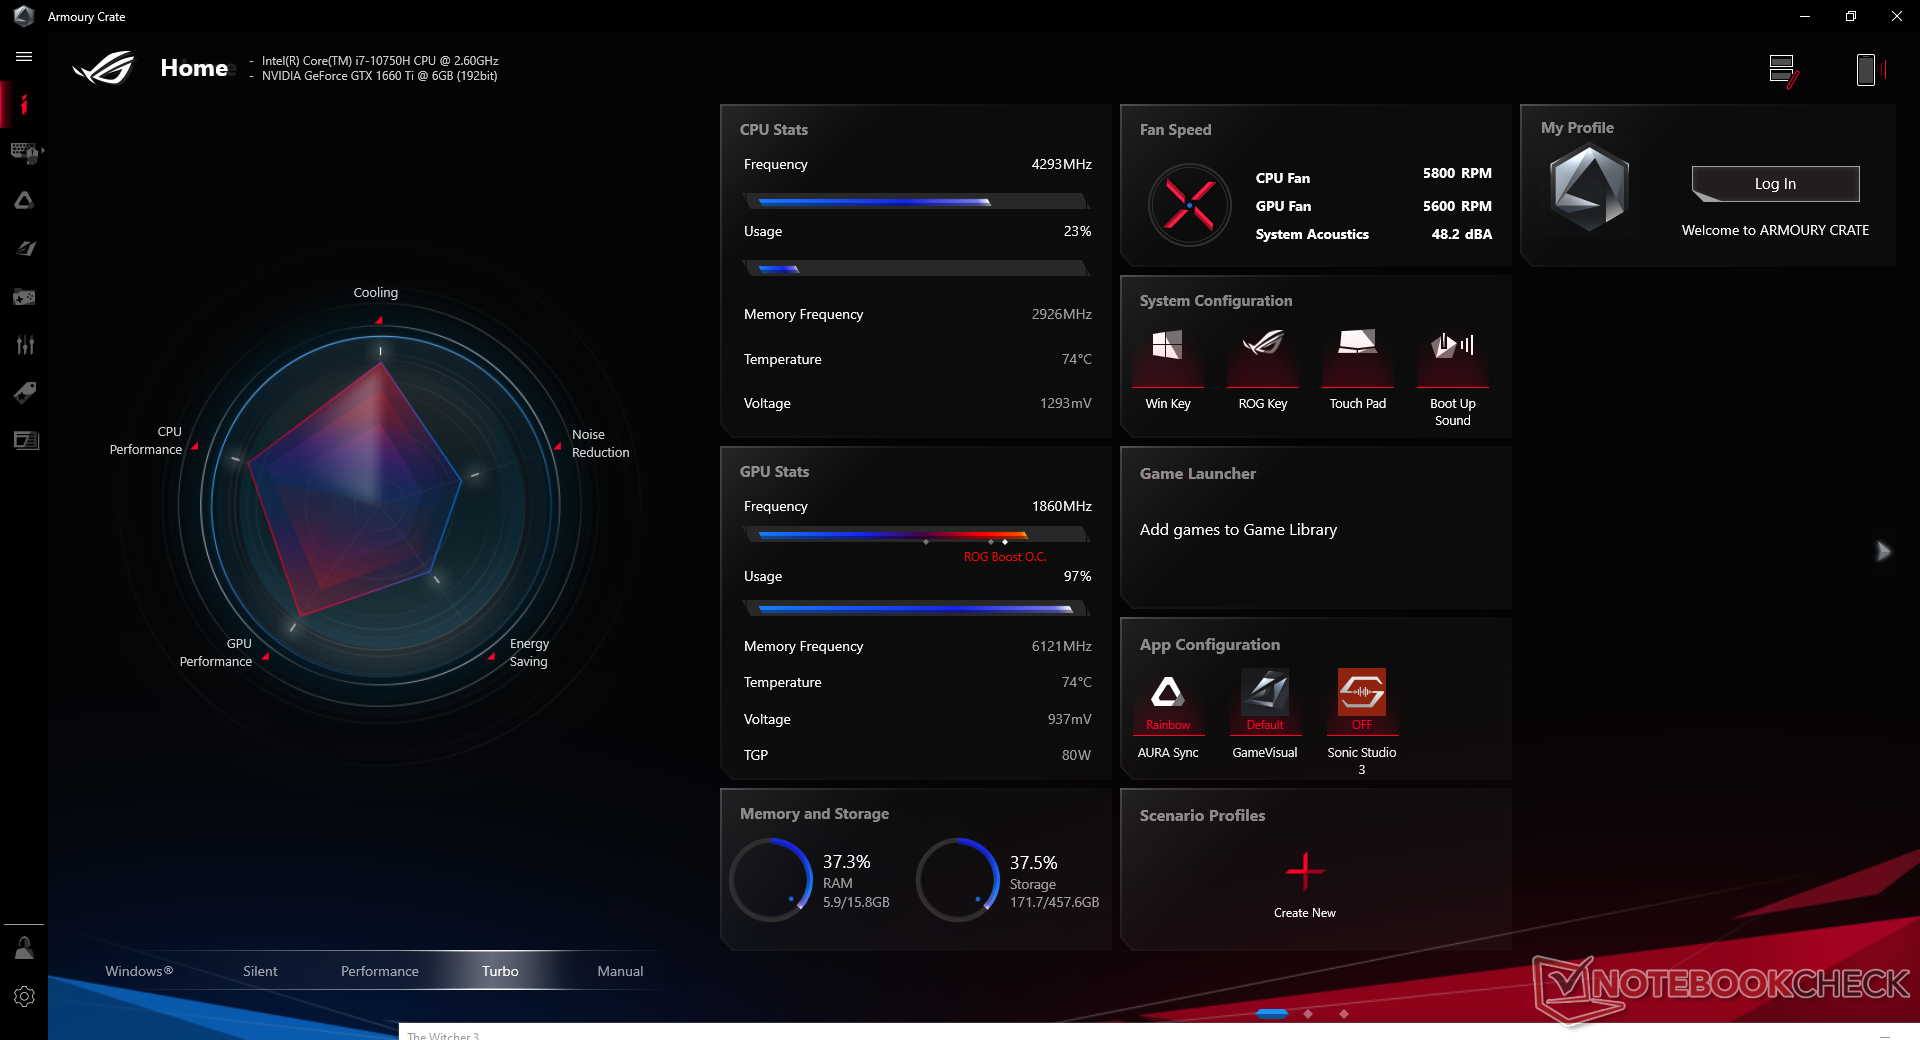
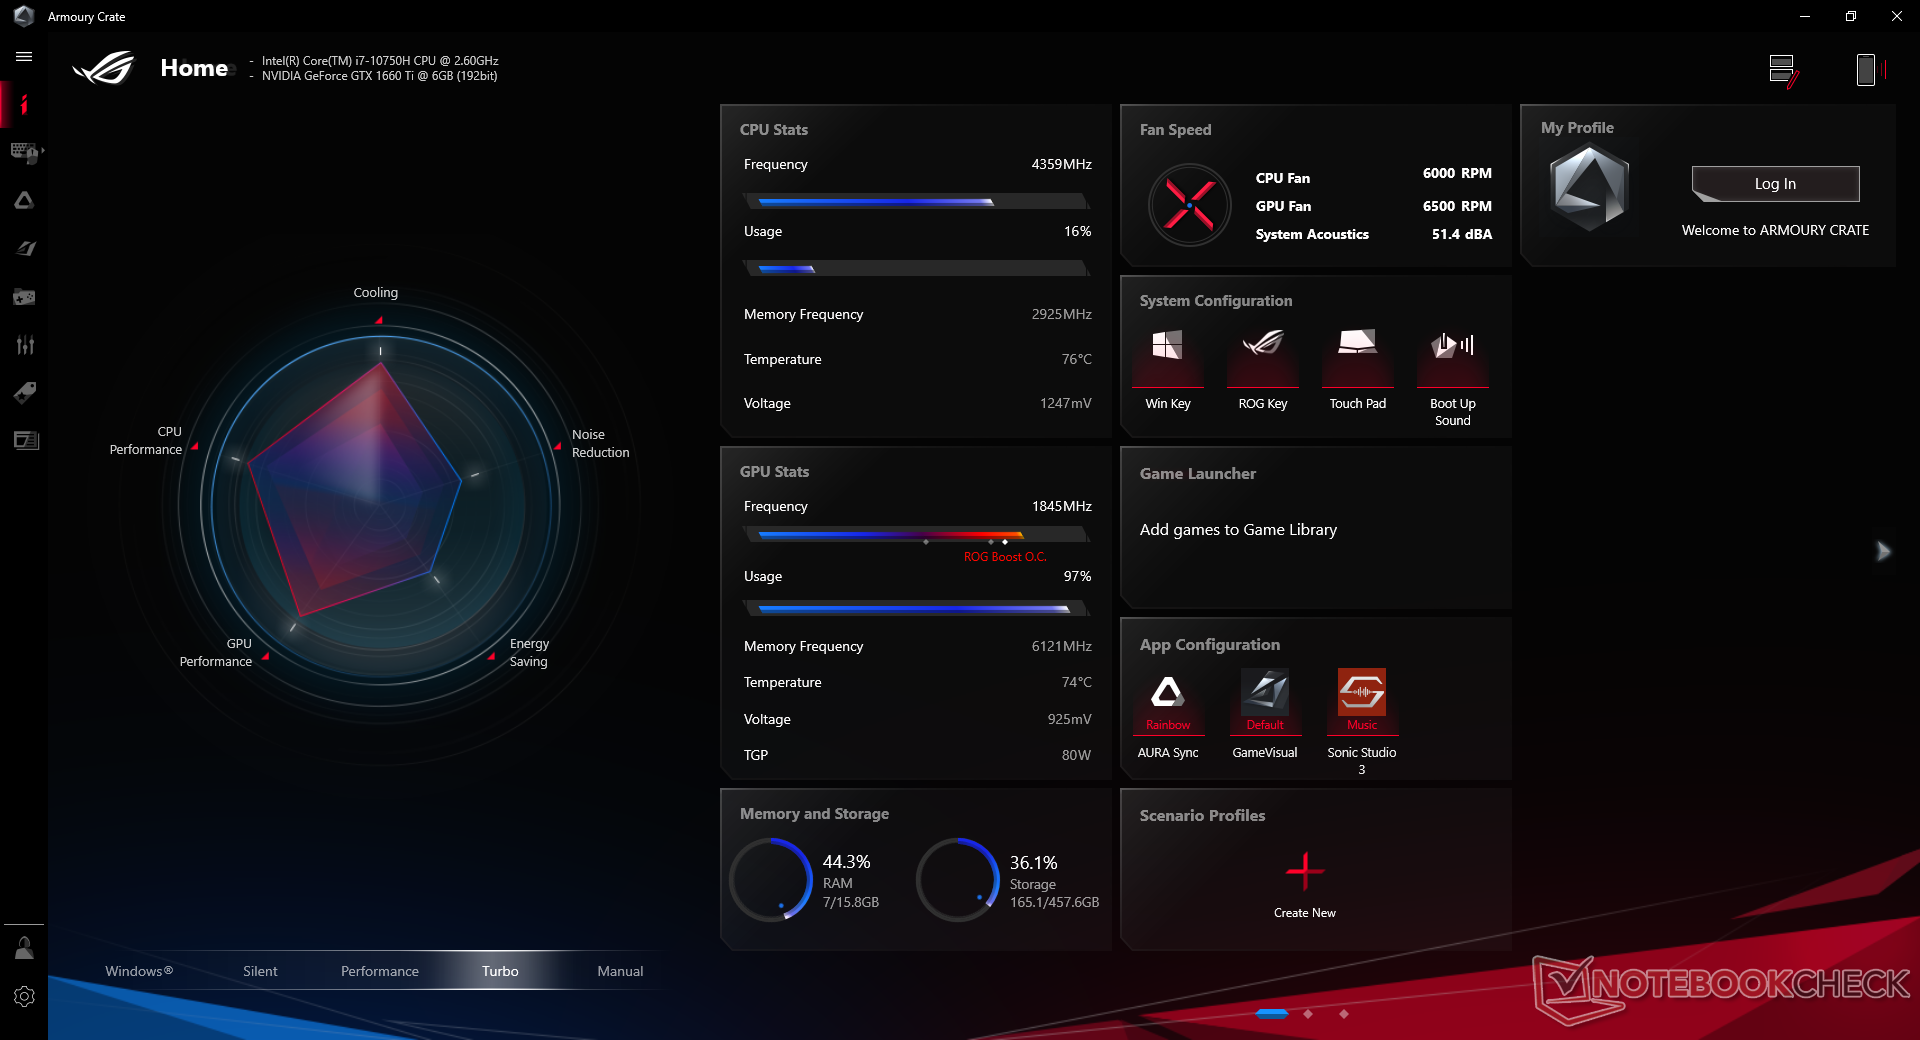
Surface temperatures are cooler when on Turbo mode compared to Performance mode or Balanced mode. The keyboard hot spot, for example, is 47 C on Turbo mode compared to 51 C on Performance/Balanced mode because of the higher fan RPMs.
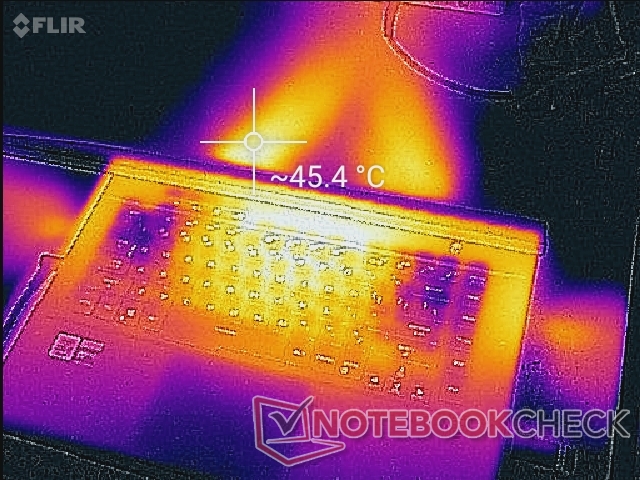
(-) The maximum temperature on the upper side is 49.4 °C / 121 F, compared to the average of 40.4 °C / 105 F, ranging from 21.2 to 68.8 °C for the class Gaming.
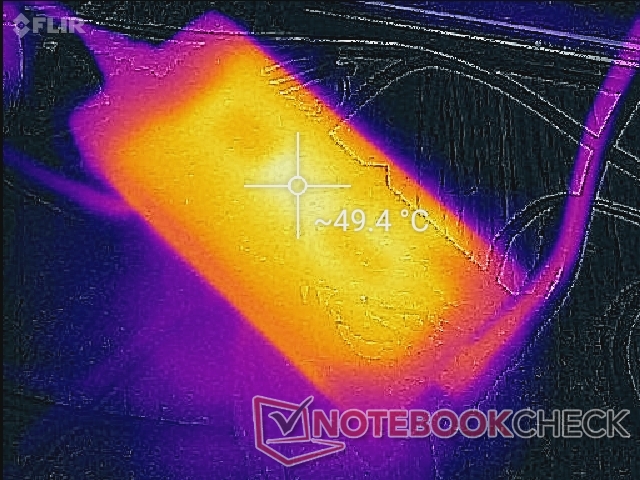
(-) The bottom heats up to a maximum of 60 °C / 140 F, compared to the average of 43.2 °C / 110 F
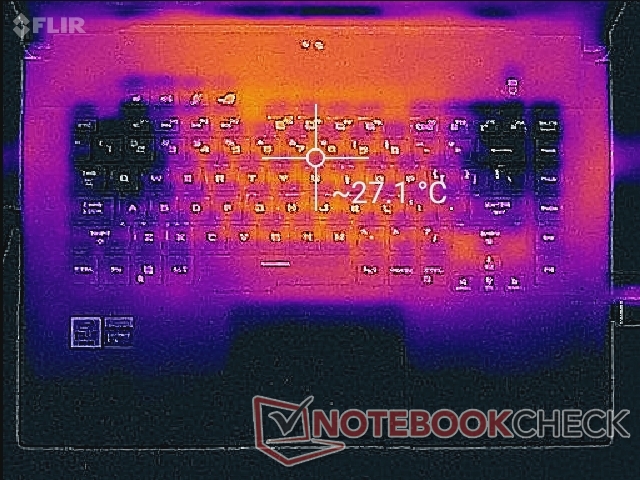
(+) In idle usage, the average temperature for the upper side is 26.2 °C / 79 F, compared to the device average of 33.9 °C / 93 F.
(±) Playing The Witcher 3, the average temperature for the upper side is 36 °C / 97 F, compared to the device average of 33.9 °C / 93 F.
(+) The palmrests and touchpad are cooler than skin temperature with a maximum of 30 °C / 86 F and are therefore cool to the touch.
(±) The average temperature of the palmrest area of similar devices was 28.8 °C / 83.8 F (-1.2 °C / -2.2 F).

Stress Test
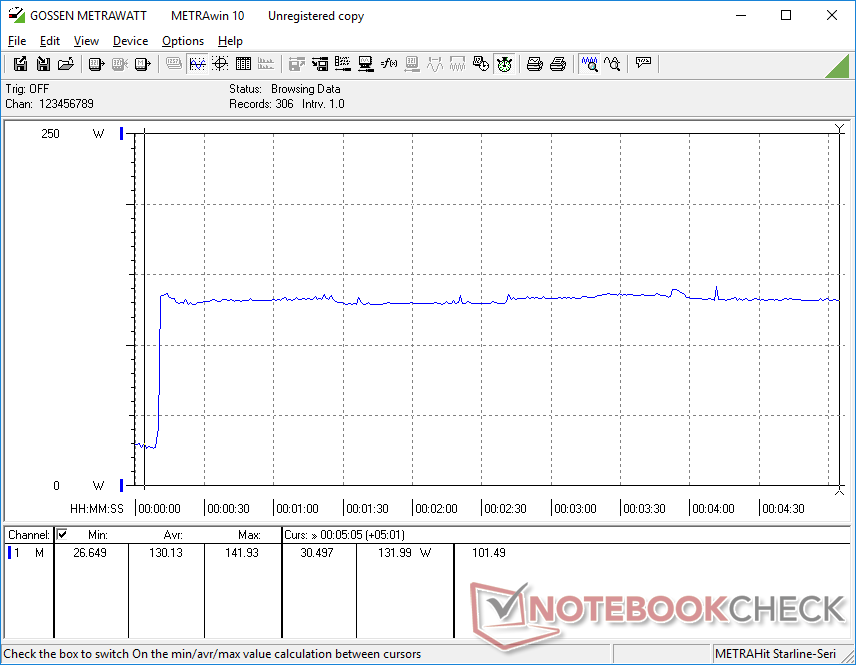
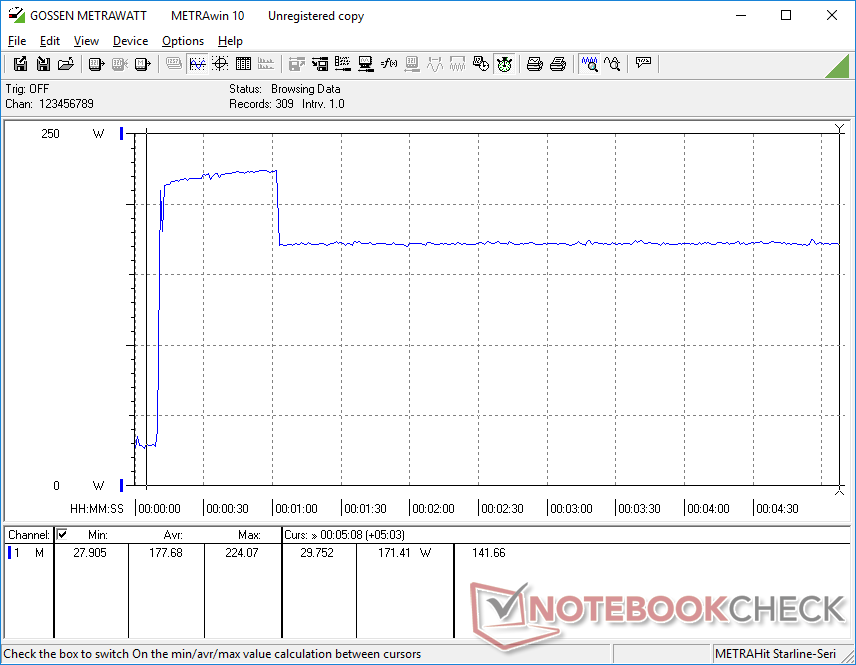
When under Prime95 stress on Turbo mode, the CPU is able to maintain a high Turbo Boost clock rate of 4.2 GHz. If on Performance mode, clock rates would drop and stabilize at 3.7 to 3.8 GHz instead. GPU clock rates and temperature are higher and lower, respectively, when running on Turbo mode compared to Performance mode.
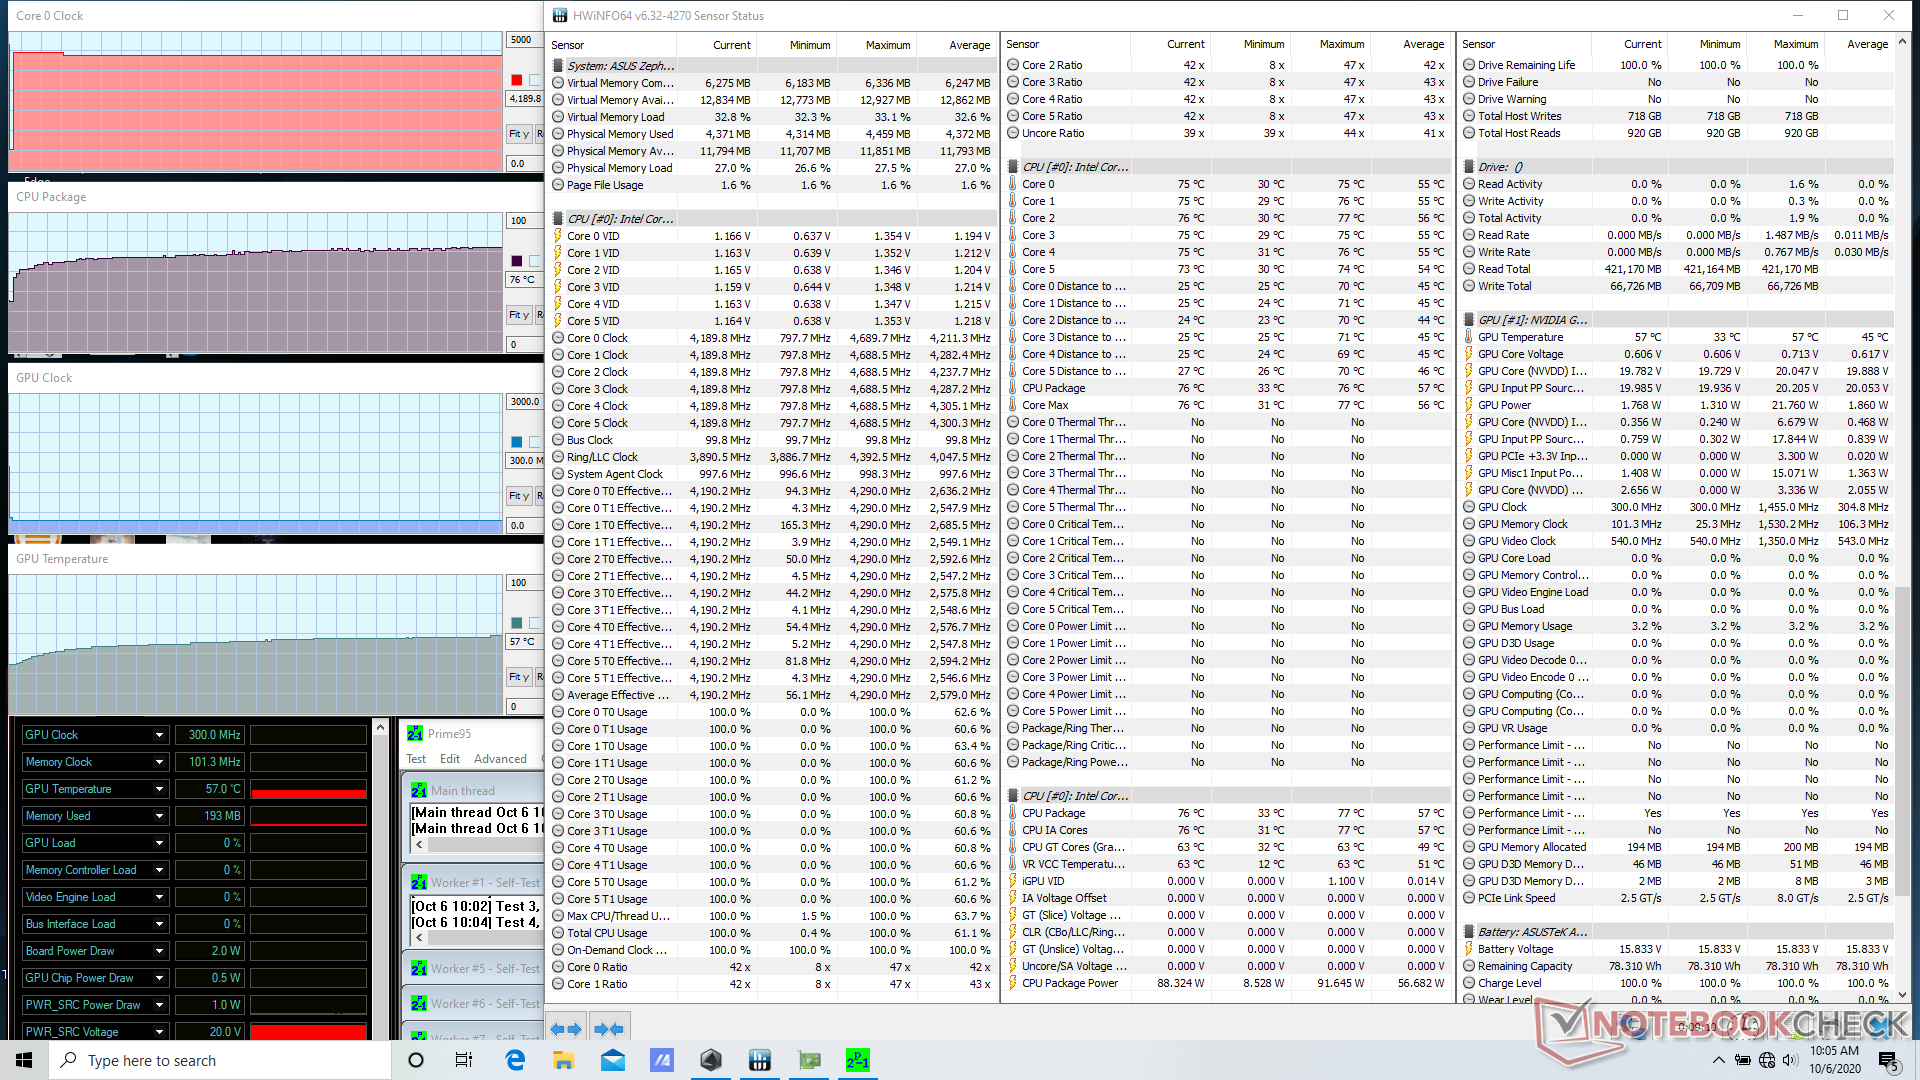
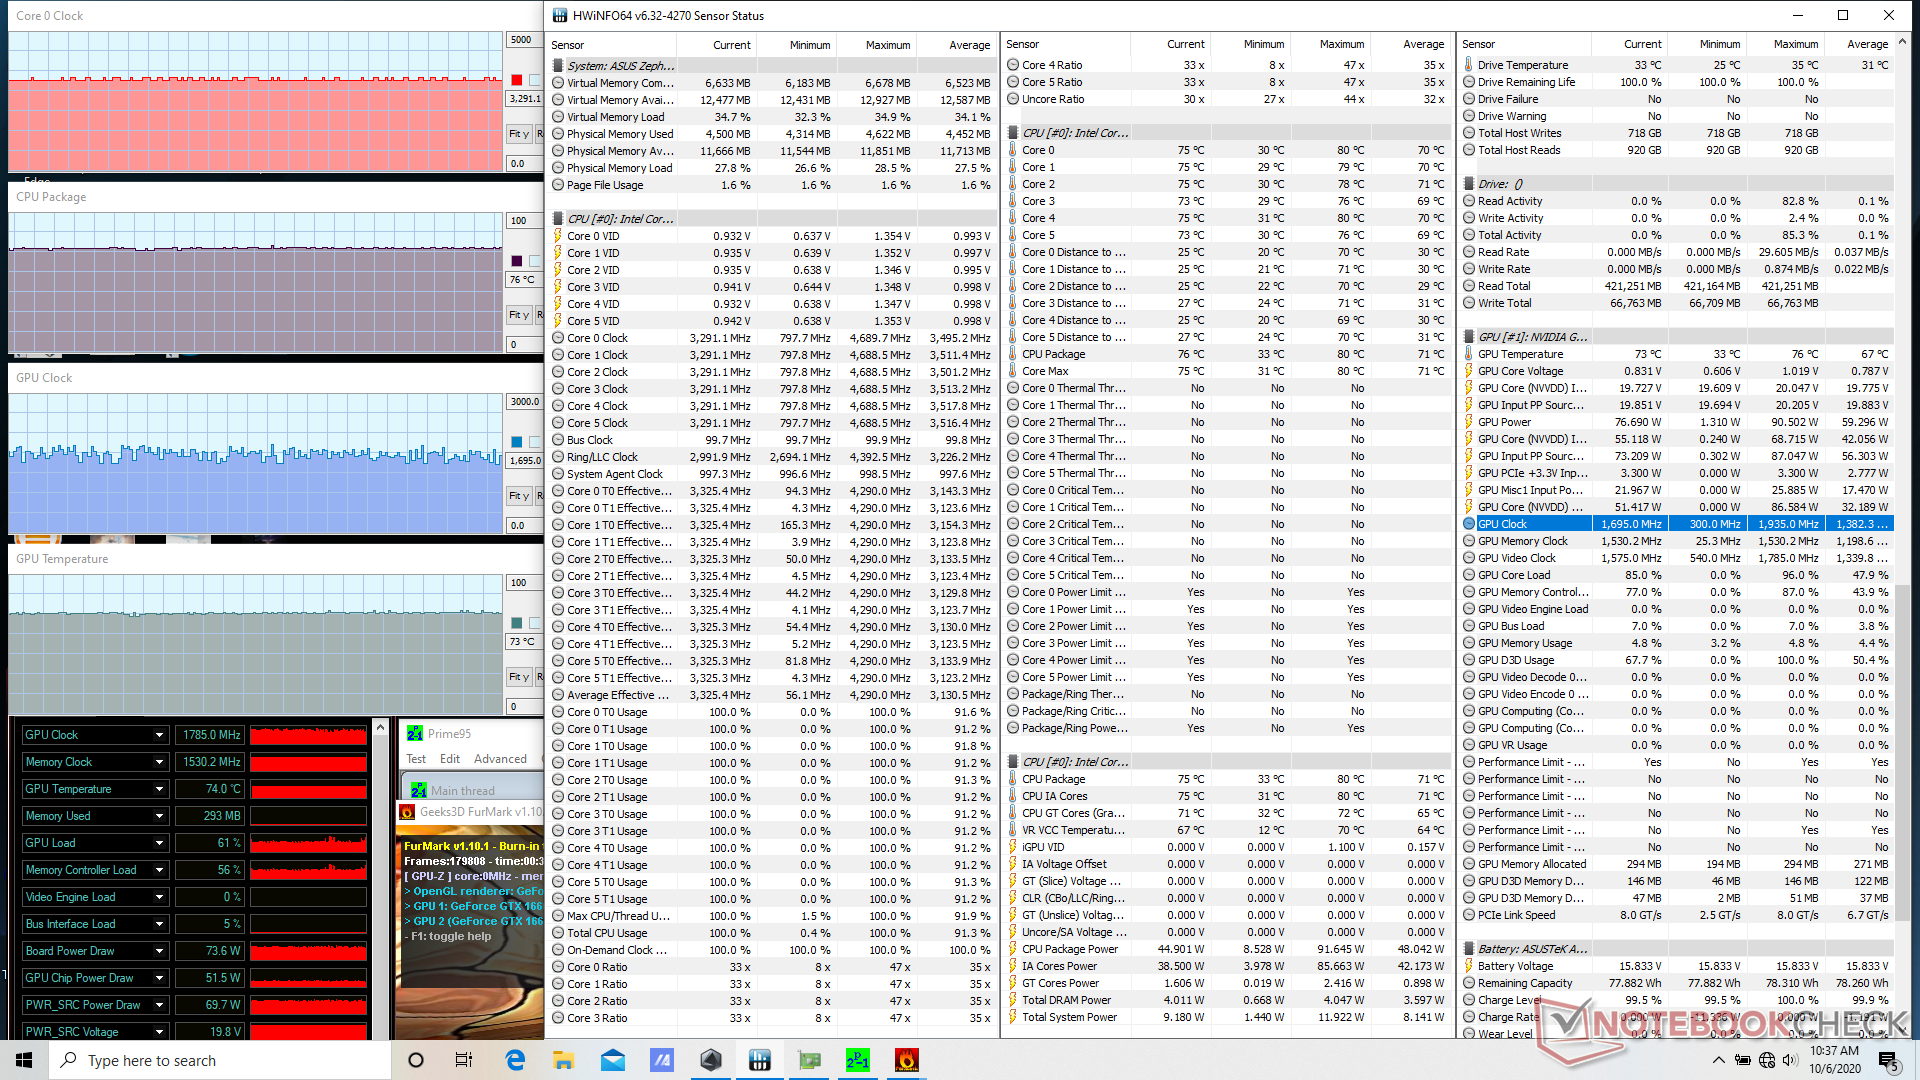
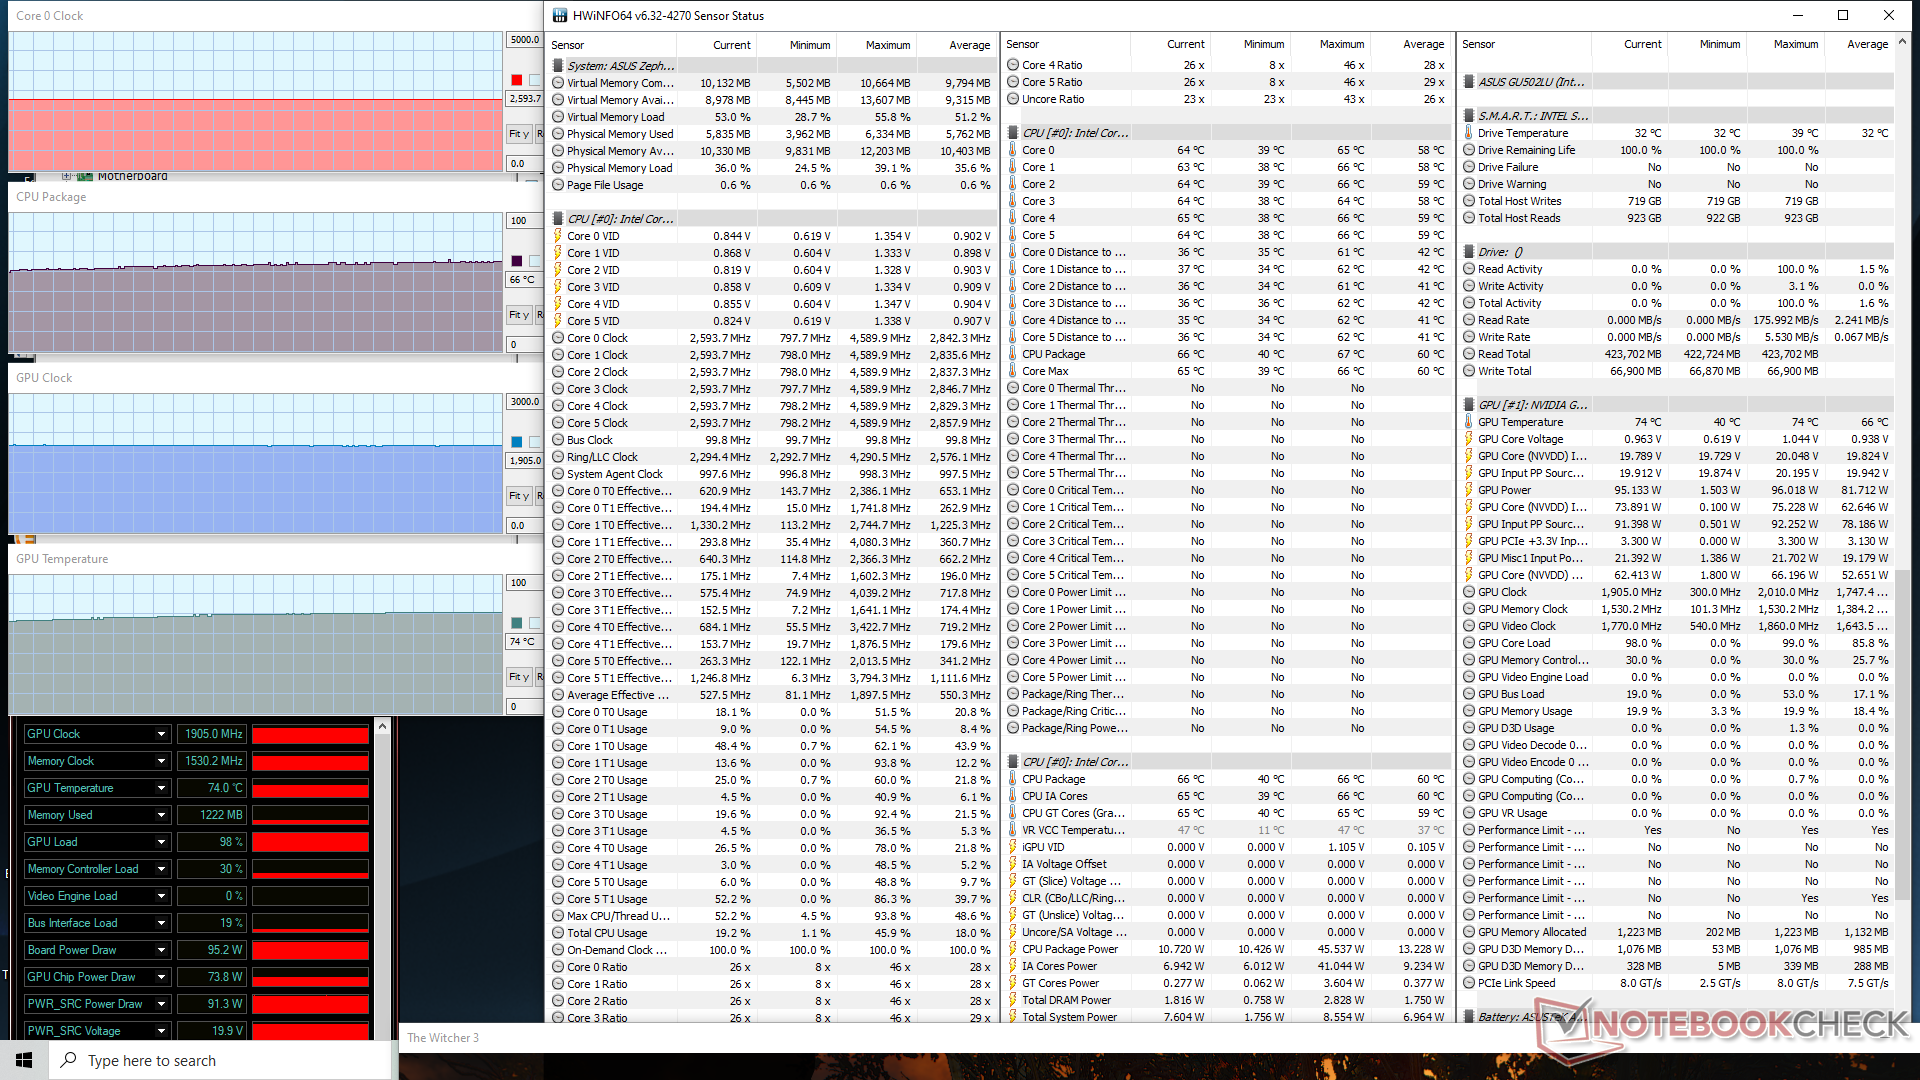
| CPU Clock (GHz) | GPU Clock (MHz) | Average CPU Temperature (°C) | Average GPU Temperature (°C) | |
| System Idle | -- | -- | 34 | 35 |
| Prime95 Stress (Performance mode) | 3.7 - 3.8 | -- | 77 | 63 |
| Prime95 Stress (Turbo mode) | 4.2 | -- | 76 | 57 |
| Prime95 + FurMark Stress (Turbo mode) | 3.3 | 1785 | 76 | 73 |
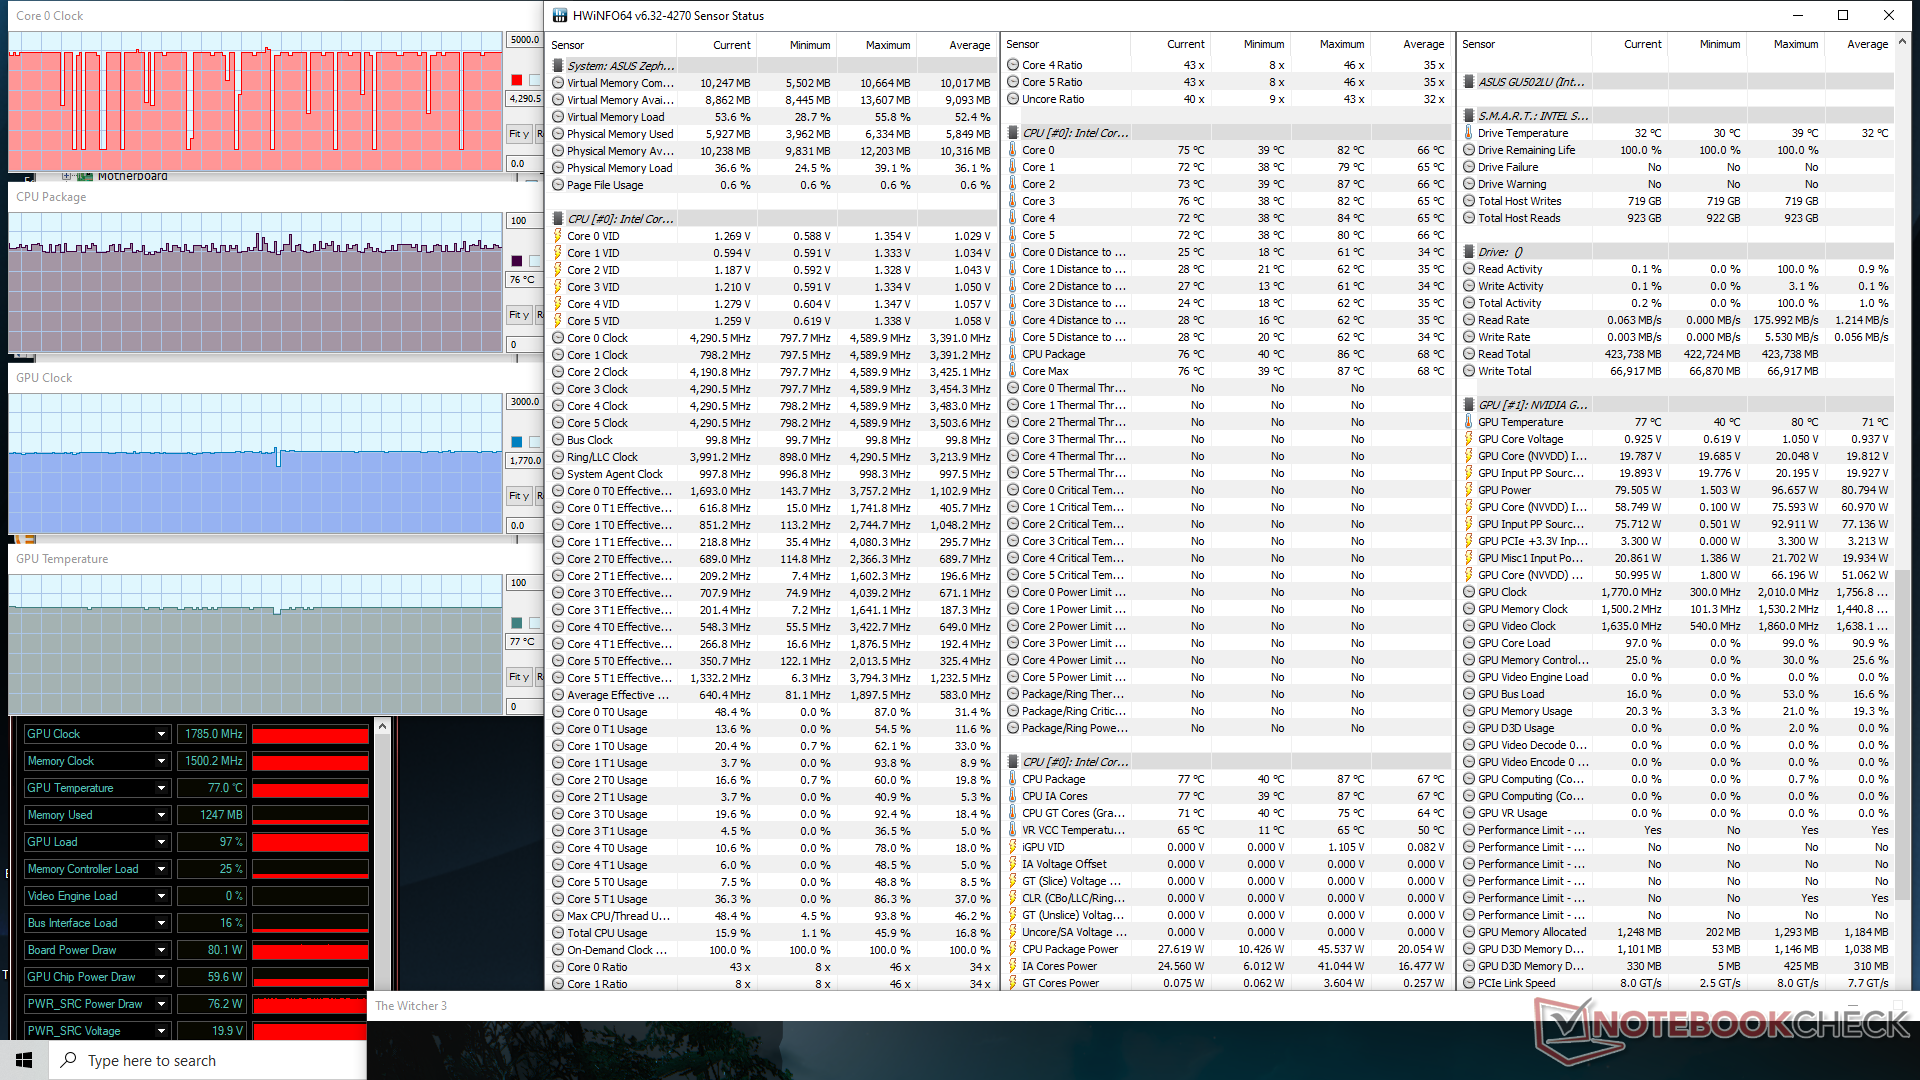
| Witcher 3 Stress (Performance mode) | 0.8 - 4.3 | 1785 | 76 | 77 |
| Witcher 3 stress (Turbo mode) | 2.6 | 1905 | 66 | 74 |
Speakers

Asus ROG Zephyrus M15 GU502LU-BI7N4 audio analysis
(+) | speakers can play relatively loud (83.9 dB)
Bass 100 - 315 Hz
(±) | reduced bass - on average 9.4% lower than median
(±) | linearity of bass is average (10.2% delta to prev. frequency)
Mids 400 - 2000 Hz
(+) | balanced mids - only 2.2% away from median
(+) | mids are linear (5.2% delta to prev. frequency)
Highs 2 - 16 kHz
(+) | balanced highs - only 3.7% away from median
(+) | highs are linear (5.8% delta to prev. frequency)
Overall 100 - 16.000 Hz
(+) | overall sound is linear (9.9% difference to median)
Compared to same class
» 5% of all tested devices in this class were better, 2% similar, 94% worse
» The best had a delta of 6%, average was 18%, worst was 132%
Compared to all devices tested
» 4% of all tested devices were better, 1% similar, 95% worse
» The best had a delta of 4%, average was 23%, worst was 134%
Apple MacBook 12 (Early 2016) 1.1 GHz audio analysis
(+) | speakers can play relatively loud (83.6 dB)
Bass 100 - 315 Hz
(±) | reduced bass - on average 11.3% lower than median
(±) | linearity of bass is average (14.2% delta to prev. frequency)
Mids 400 - 2000 Hz
(+) | balanced mids - only 2.4% away from median
(+) | mids are linear (5.5% delta to prev. frequency)
Highs 2 - 16 kHz
(+) | balanced highs - only 2% away from median
(+) | highs are linear (4.5% delta to prev. frequency)
Overall 100 - 16.000 Hz
(+) | overall sound is linear (10.2% difference to median)
Compared to same class
» 7% of all tested devices in this class were better, 2% similar, 90% worse
» The best had a delta of 5%, average was 18%, worst was 53%
Compared to all devices tested
» 5% of all tested devices were better, 1% similar, 94% worse
» The best had a delta of 4%, average was 23%, worst was 134%
Energy Management
Power Consumption
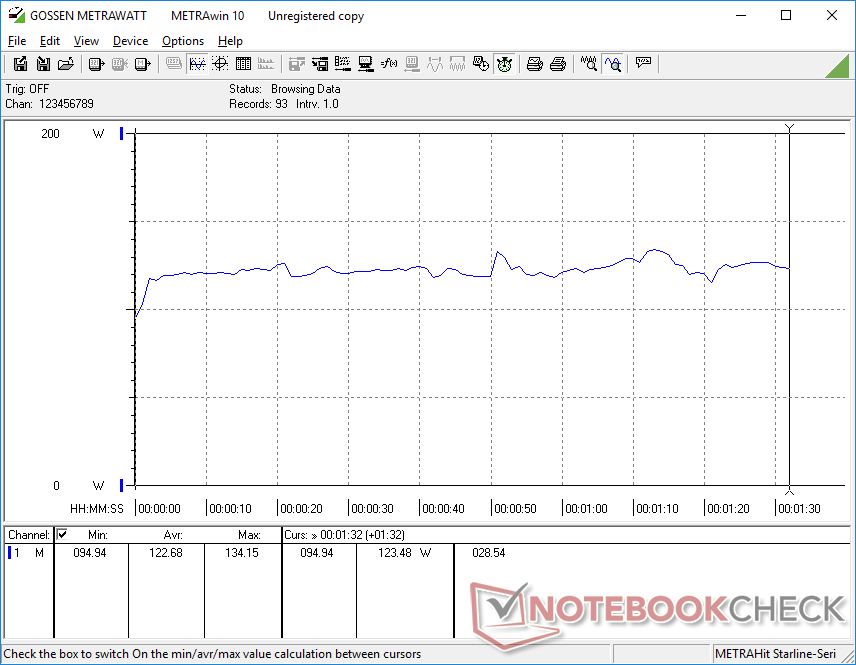
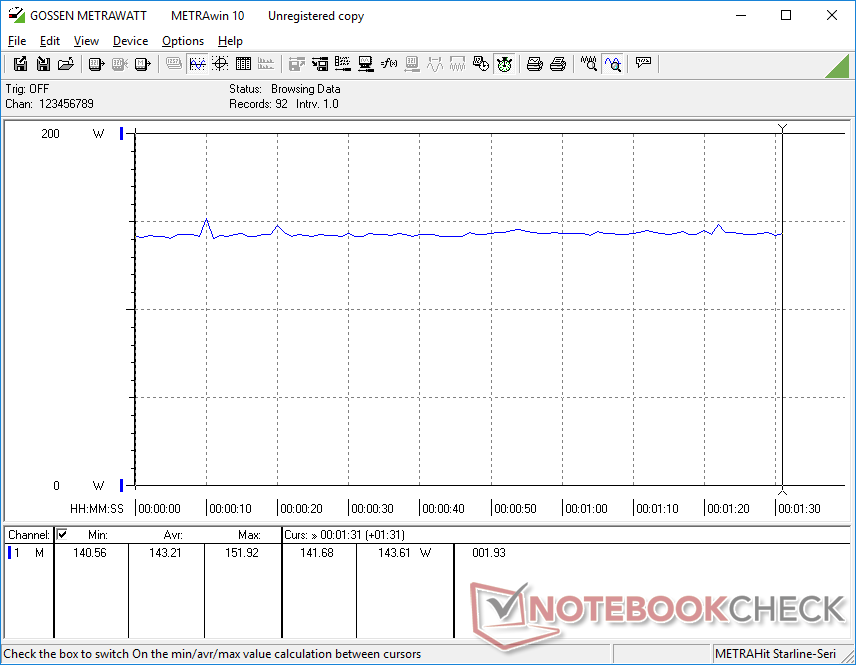
Idling on desktop will draw anywhere between 10 W and 29 W depending on the power profile and display brightness. The takeaway message here is that power consumption when gaming is close to the GU502LW even though the latter comes equipped with the pricier RTX 2070 Max-Q GPU.
The medium-sized (~16.5 x 7.6 x 3.2 cm) 230 W AC adapter allows for recharging while running demanding loads.
| Off / Standby | |
| Idle | |
| Load |
|
Key:
min: | |
| Asus ROG Zephyrus M15 GU502LU-BI7N4 i7-10750H, GeForce GTX 1660 Ti Mobile, Intel SSD 660p SSDPEKNW512G8, IPS, 1920x1080, 15.6" | Asus ROG Zephyrus M15 GU502L i7-10750H, GeForce RTX 2070 Max-Q, 2x Intel SSD 660p SSDPEKNW512G8 (RAID 0), IPS, 3840x2160, 15.6" | HP Omen 15-ek0456ng i5-10300H, GeForce GTX 1660 Ti Mobile, Toshiba XG6 KXG60ZNV512G, IPS, 1920x1080, 15.6" | Gateway Creator Series 15.6 GWTN156-3BK i5-10300H, GeForce RTX 2060 Mobile, Phison PS5013 PM8256GPTCB4B8TF, IPS, 1920x1080, 15.6" | Lenovo Legion 5 15IMH05H i5-10300H, GeForce RTX 2060 Mobile, Samsung PM991 MZALQ512HALU, IPS, 1920x1080, 15.6" | MSI GP65 10SFK-047US i7-10750H, GeForce RTX 2070 Mobile, Samsung SSD PM981 MZVLB1T0HALR, IPS, 1920x1080, 15.6" | |
|---|---|---|---|---|---|---|
| Power Consumption | 6% | 17% | 2% | 38% | -8% | |
| Idle Minimum * (Watt) | 10 | 10 -0% | 9.2 8% | 9.9 1% | 3.2 68% | 14.2 -42% |
| Idle Average * (Watt) | 16.9 | 13 23% | 14.6 14% | 17 -1% | 8.3 51% | 18.8 -11% |
| Idle Maximum * (Watt) | 28.3 | 23 19% | 18.1 36% | 31.9 -13% | 8.7 69% | 23.9 16% |
| Load Average * (Watt) | 122.7 | 137 -12% | 84 32% | 90.5 26% | 82 33% | 96.9 21% |
| Witcher 3 ultra * (Watt) | 143.2 | 140 2% | 142 1% | 162.3 -13% | 151 -5% | 185 -29% |
| Load Maximum * (Watt) | 224.1 | 222 1% | 194 13% | 202.1 10% | 195 13% | 233.4 -4% |
* ... smaller is better
Battery Life
| Asus ROG Zephyrus M15 GU502LU-BI7N4 i7-10750H, GeForce GTX 1660 Ti Mobile, 76 Wh | Asus ROG Zephyrus M15 GU502L i7-10750H, GeForce RTX 2070 Max-Q, 76 Wh | HP Omen 15-ek0456ng i5-10300H, GeForce GTX 1660 Ti Mobile, 70.91 Wh | Gateway Creator Series 15.6 GWTN156-3BK i5-10300H, GeForce RTX 2060 Mobile, 46.74 Wh | Lenovo Legion 5 15IMH05H i5-10300H, GeForce RTX 2060 Mobile, 60 Wh | MSI GP65 10SFK-047US i7-10750H, GeForce RTX 2070 Mobile, 51 Wh | |
|---|---|---|---|---|---|---|
| Battery runtime | -7% | 10% | 37% | 22% | -37% | |
| WiFi v1.3 (h) | 5.9 | 5.5 -7% | 6.5 10% | 8.1 37% | 7.2 22% | 3.7 -37% |
| Reader / Idle (h) | 8.6 | 11.7 | 14.1 | |||
| Load (h) | 1.5 | 1.7 | 1.4 |
Pros
Cons
Verdict

Turbo mode on Asus Zephyrus laptops impacts performance by a larger degree when compared to the Turbo mode on most MSI laptops. Users shouldn't confuse Turbo mode with Performance mode which runs at slower clock rates and at slightly higher temperatures due to the lower fan noise ceiling.
Other than the confusing power profiles and their influences on performance, the GU502LU could be better when considering the $1400 USD asking price. The GTX 1660 Ti GPU, narrow color space, and slow display response times are common on budget gaming laptops retailing for hundreds of dollars cheaper than this Asus. Instead, the price premium here is towards the relatively thin and light chassis design since cheaper alternatives with the same internal specifications are typically thicker, heavier, and arguably less attractive like the Acer Nitro series, HP Pavilion Gaming, MSI GP65, or the Dell G3 series.
Budget gaming performance for a mid-range price. Users will be paying extra for the thinner, sleeker, and more portable chassis. Otherwise, you can find the same CPU, GPU, and display on cheaper and heavier gaming laptops.
Asus ROG Zephyrus M15 GU502LU-BI7N4
- 10/12/2020 v7 (old)
Allen Ngo
Price comparison
