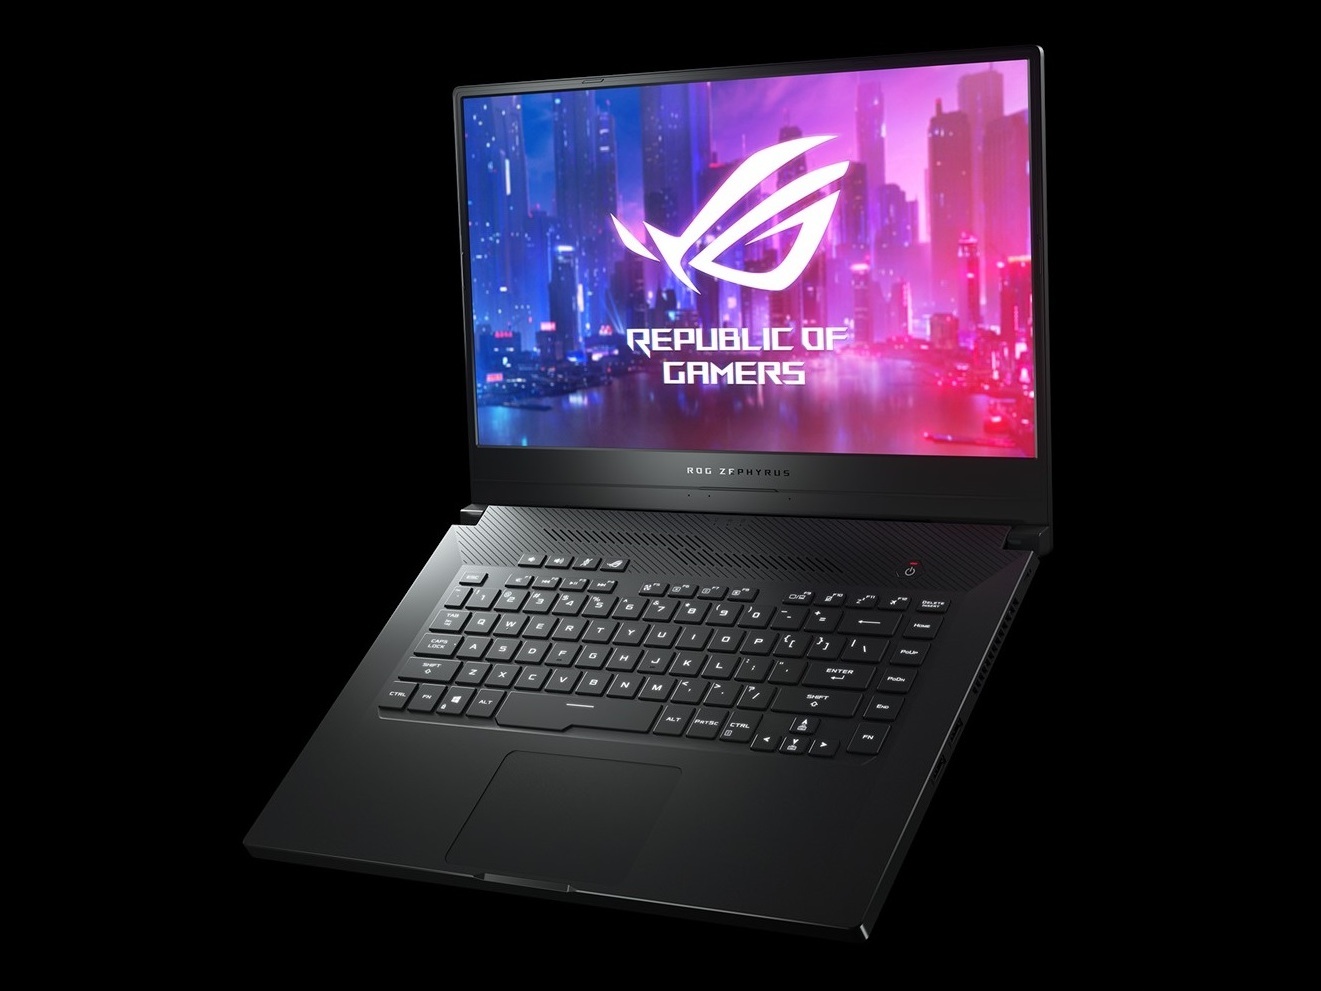
AMD Ryzen 7 4800HS Debut: Asus Zephyrus G15 GA502IU Laptop Review
The Asus Zephyrus G15 GA502IU is an update to last year's GA502DU. It replaces the older 12 nm Zen+ Ryzen 7 3750H with the newer 7 nm Zen 2 Ryzen 7 4800HS while keeping almost everything else the same. Thus, our comments about the chassis and physical features of the GA502DU will apply here on the GA502IU.
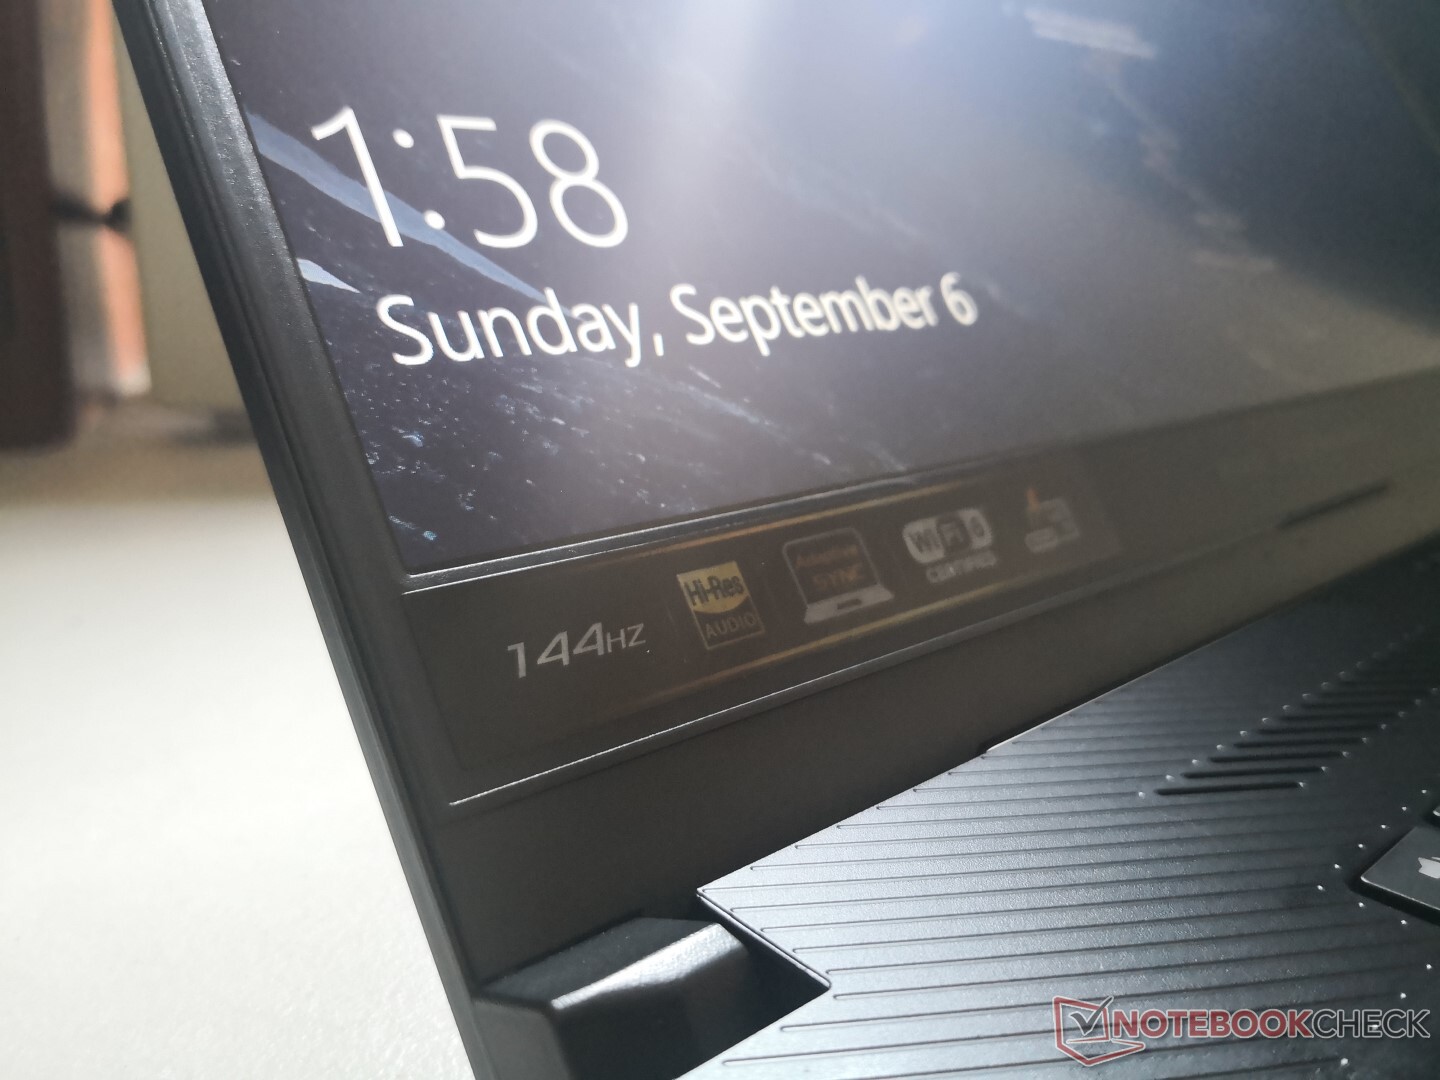
Our test unit retails for about $1300 USD on Xotic PC while the higher-end GeForce RTX 2060 configuration retails for $1400 USD (GA502IV). Though the Ryzen 7 4800HS CPU is fixed, users can choose between a 144 Hz or 240 Hz 1080p matte display each with adaptive sync. Competitors include other budget to mid-range 15.6-inch gaming laptops like the Razer Blade 15 Base Model, Gigabyte Aorus 15, MSI GL65, or the 2020 HP Omen 15.
Gamers willing to spend more may want to consider the higher-end Asus ROG Zephyrus S series or Strix Scar series.
More Asus reviews:
Rating | Date | Model | Weight | Height | Size | Resolution | Price |
|---|---|---|---|---|---|---|---|
| 81.2 % v7 (old) | 09 / 2020 | Asus ROG Zephyrus G15 GA502IU-ES76 R7 4800HS, GeForce GTX 1660 Ti Max-Q | 2.1 kg | 19.9 mm | 15.60" | 1920x1080 | |
| 84.5 % v7 (old) | 07 / 2020 | Asus ROG Zephyrus Duo 15 GX550LXS i9-10980HK, GeForce RTX 2080 Super Max-Q | 2.5 kg | 20 mm | 15.60" | 3840x2160 | |
| 83.3 % v6 (old) | 05 / 2019 | Asus ROG Zephyrus G15 GA502DU R7 3750H, GeForce GTX 1660 Ti Max-Q | 2.1 kg | 20.4 mm | 15.60" | 1920x1080 | |
| 86.9 % v7 (old) | 08 / 2020 | Razer Blade 15 RTX 2070 Super Max-Q i7-10875H, GeForce RTX 2070 Super Max-Q | 2.1 kg | 17.8 mm | 15.60" | 1920x1080 | |
| 83.3 % v7 (old) | 07 / 2020 | Lenovo Legion 5 15IMH05H i5-10300H, GeForce RTX 2060 Mobile | 2.5 kg | 26.1 mm | 15.60" | 1920x1080 | |
| 82.5 % v7 (old) | 08 / 2020 | MSI GS66 Stealth 10SE-045 i7-10750H, GeForce RTX 2060 Mobile | 2.2 kg | 19.8 mm | 15.60" | 1920x1080 | |
| 82.6 % v7 (old) | 05 / 2020 | Eluktronics RP-15 R7 4800H, GeForce RTX 2060 Mobile | 1.9 kg | 20 mm | 15.60" | 1920x1080 |
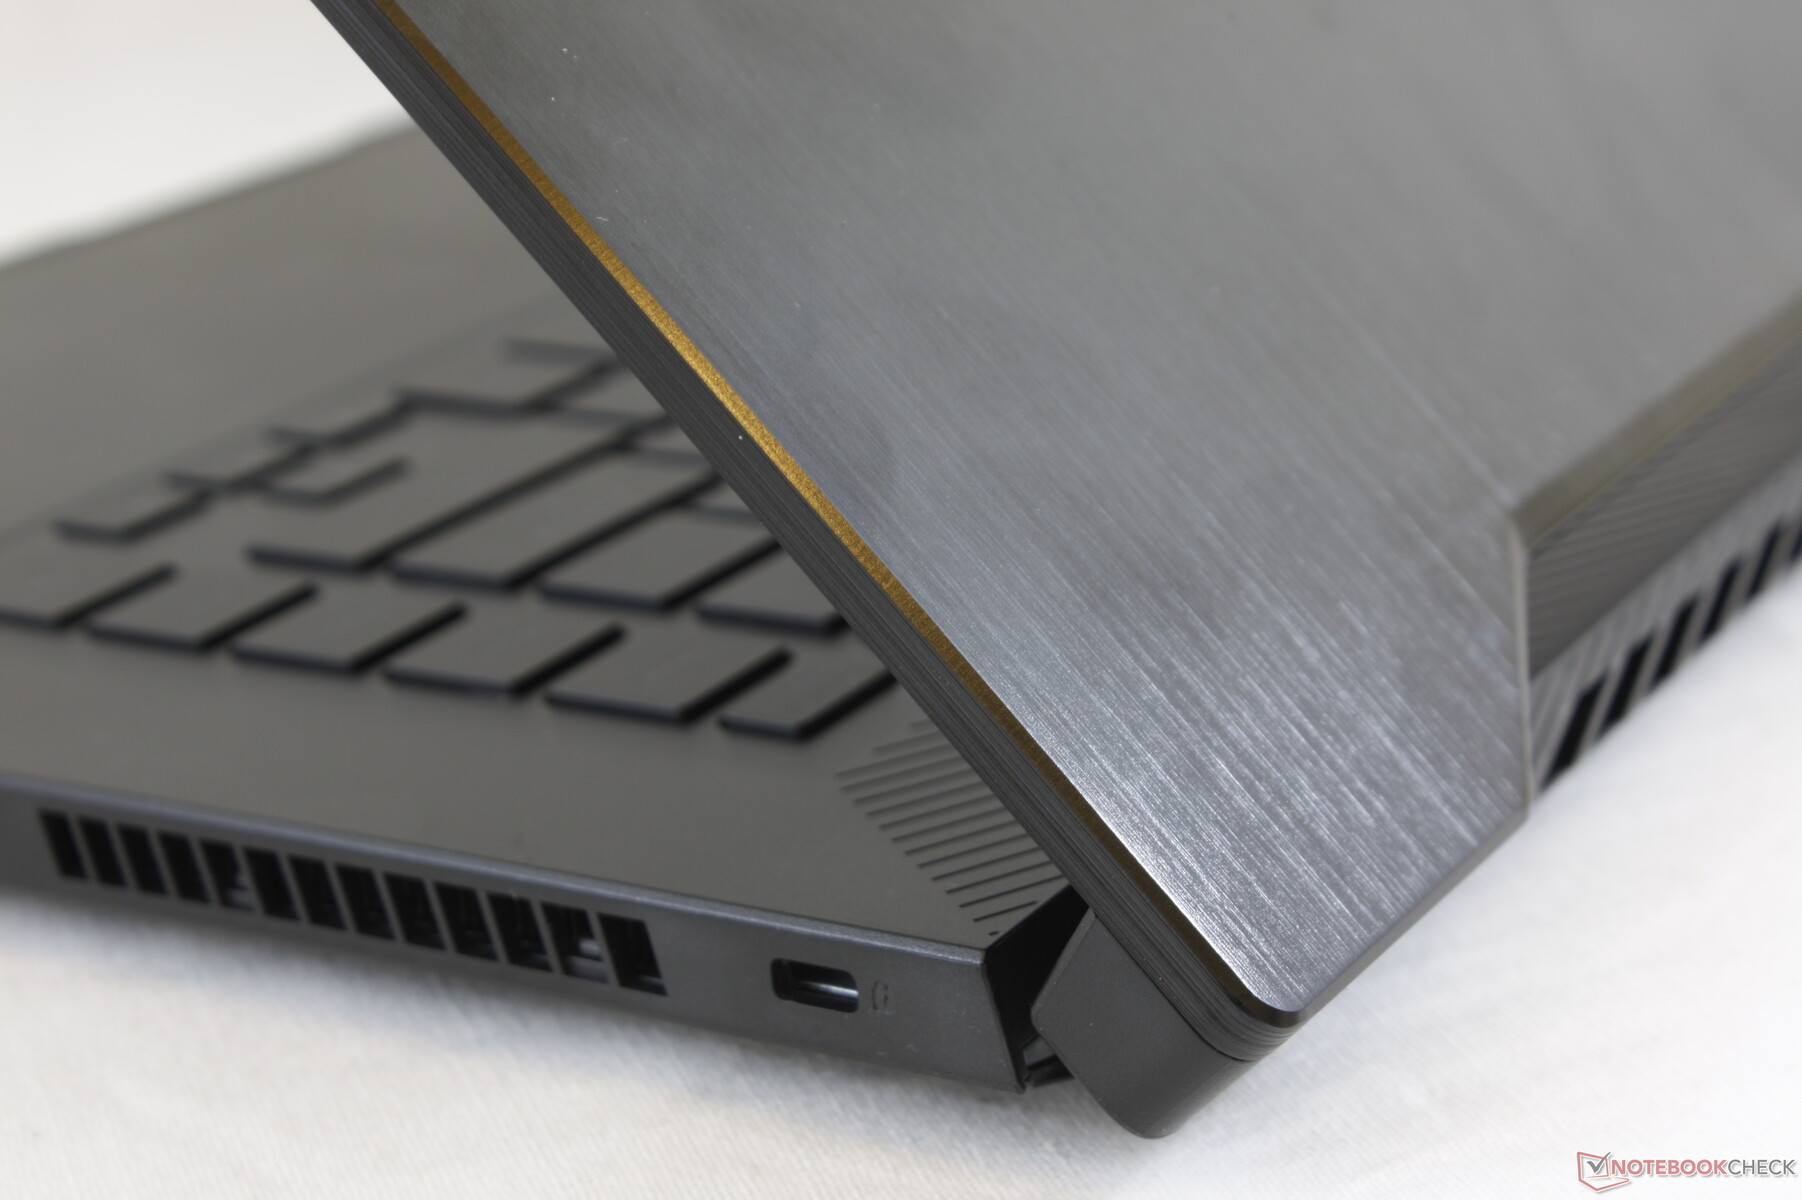
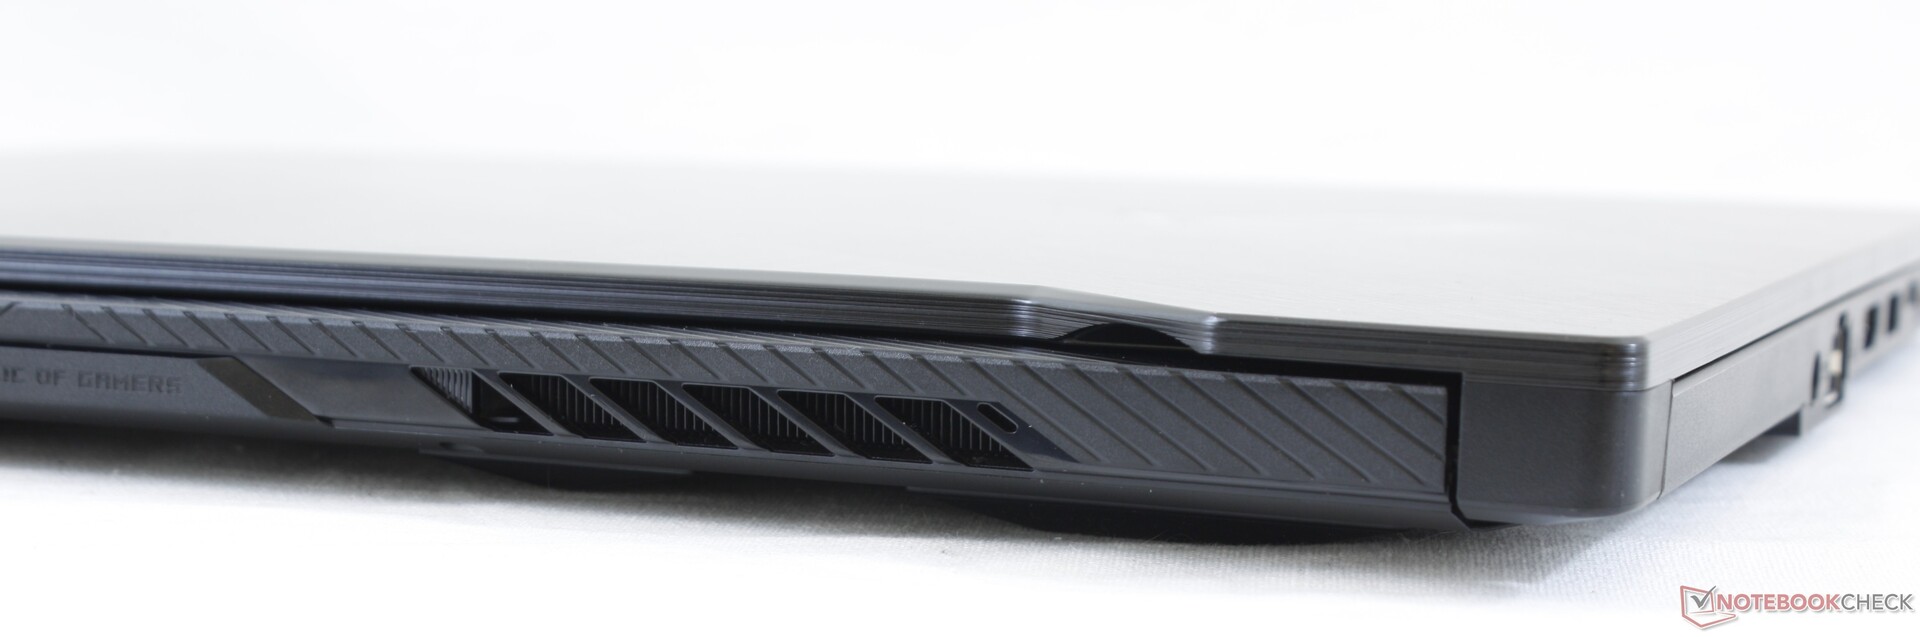
Case
The chassis is sleek, lightweight and very thin when compared to other $1000 gaming laptops that tend to be thicker and heavier. The Acer Nitro 5 and MSI GL series, for example, come with many of the same hardware features as our Asus and yet they are arguably less attractive and more cheaply made. The GA502 series uses similar plastic materials but it is able to better hide the generic plastic look than others in the same price category. In other words, it looks like a high-end gaming machine without needing to resort to costly metal alloys.
Chassis rigidity is still weaker than other thin-and-light gaming laptops like the Razer Blade 15, MSI GS66, or Asus' own Zephyrus S series. The lid and keyboard center, for example, twist and depress more easily with applying pressure.
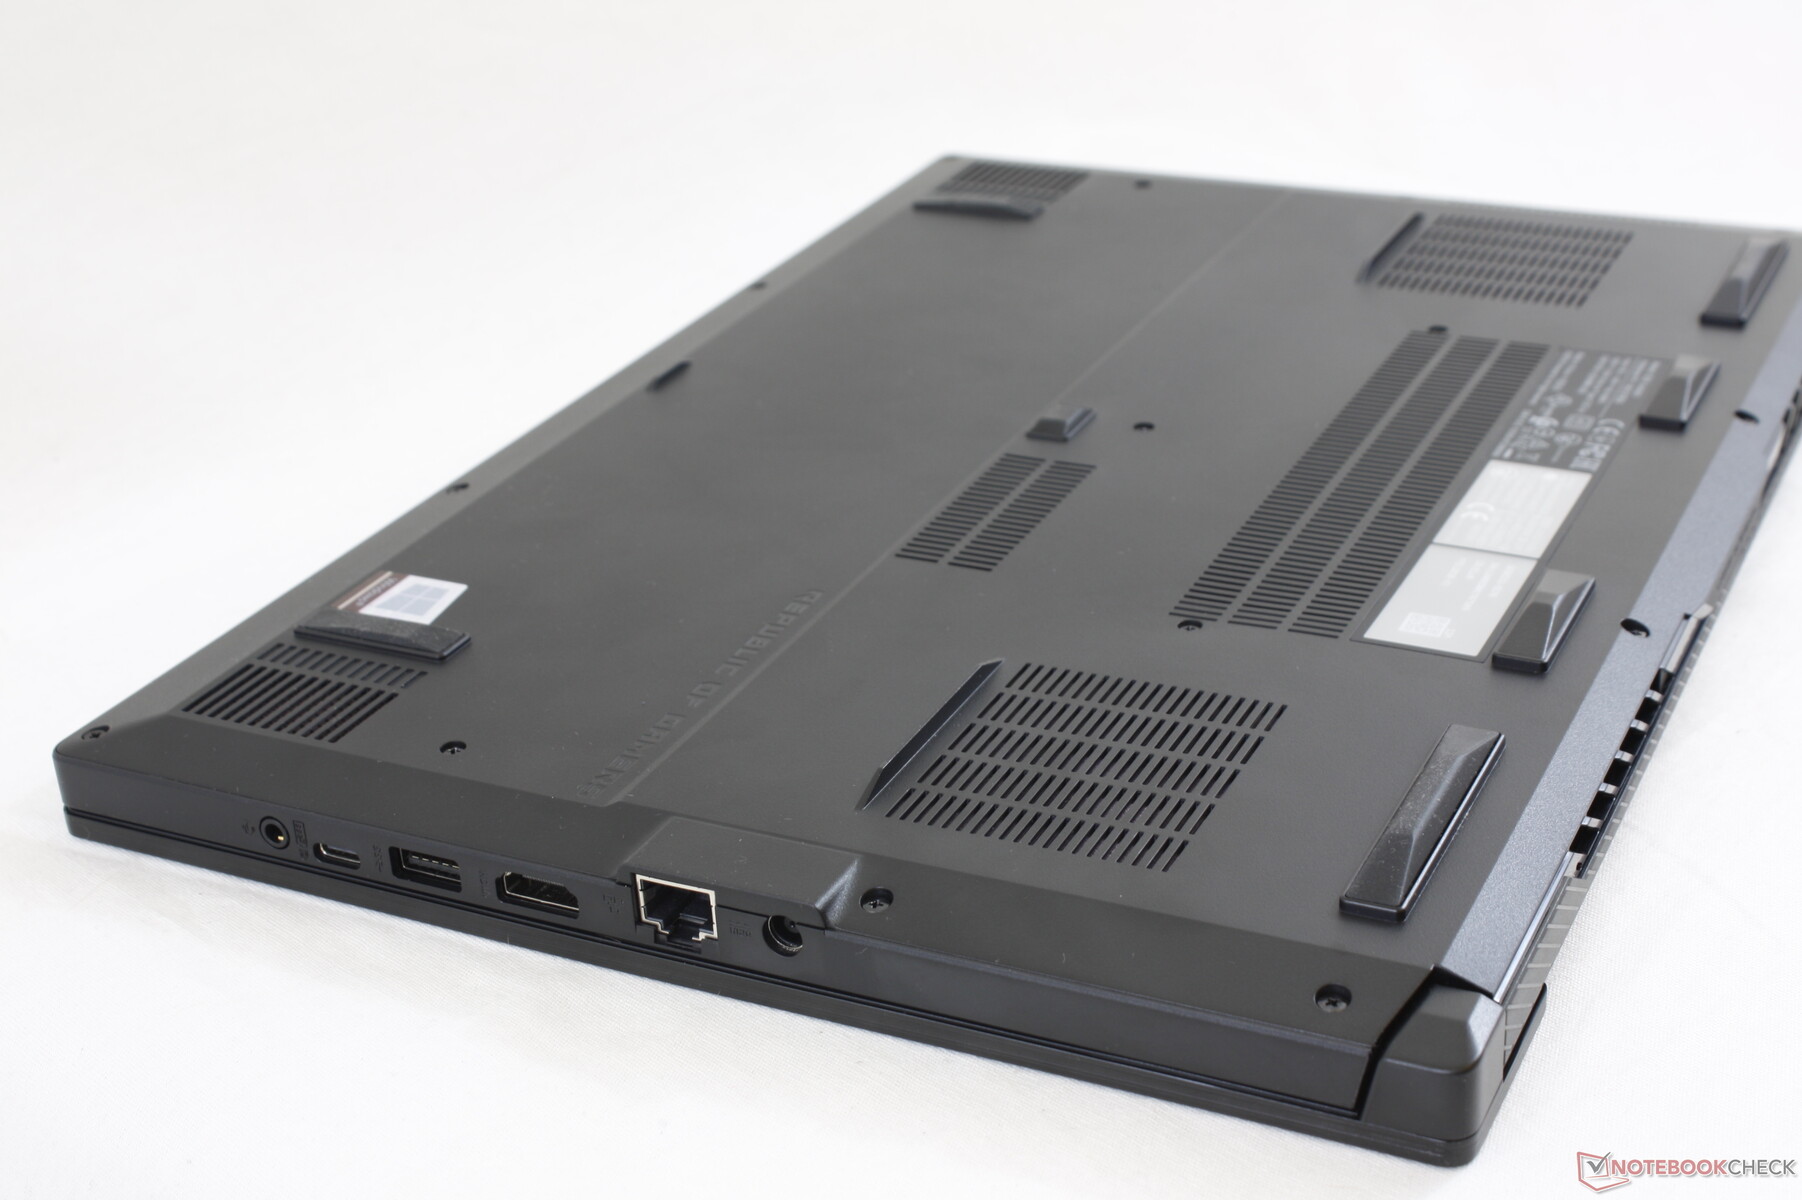
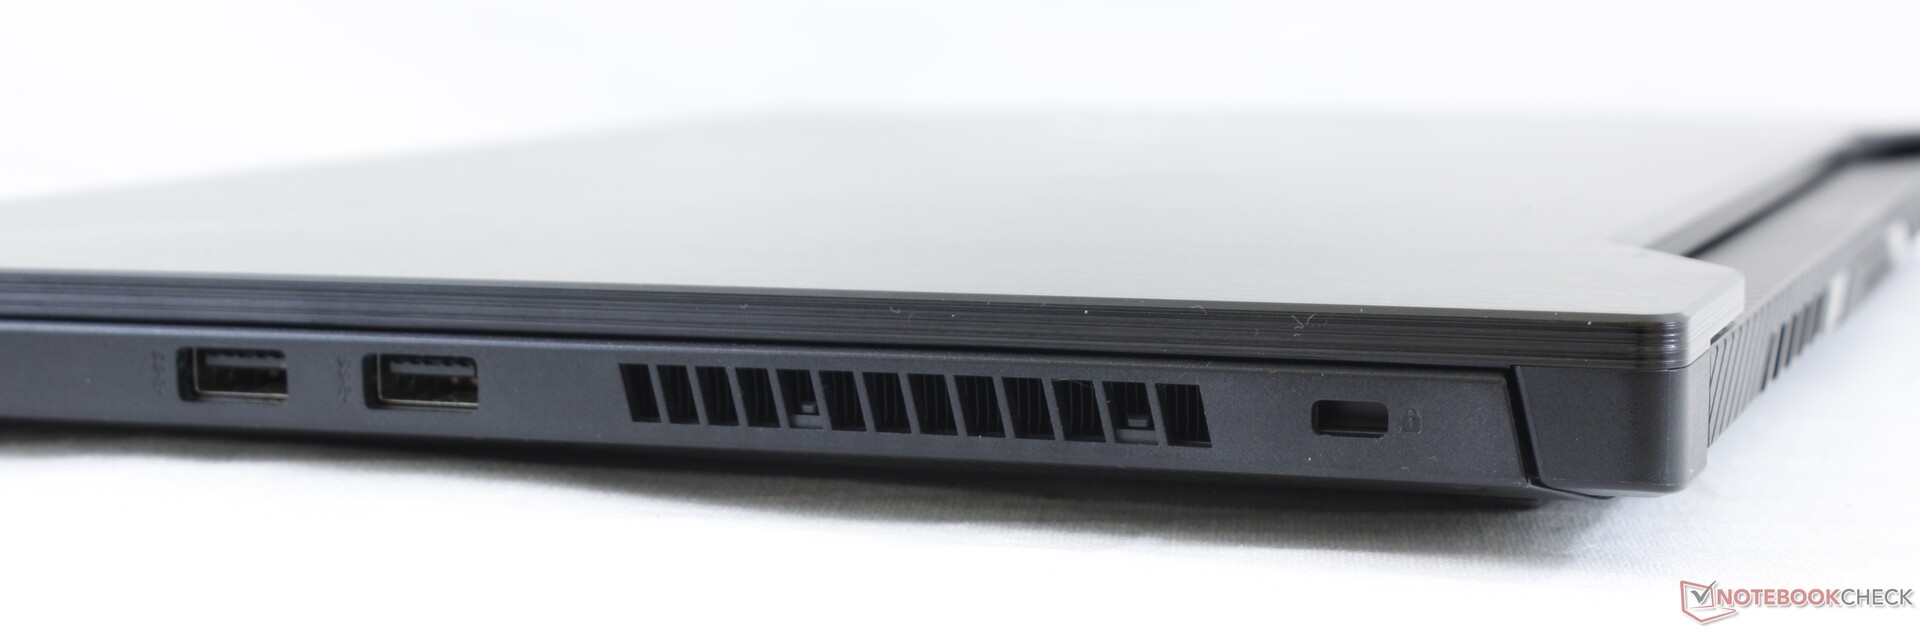
Connectivity
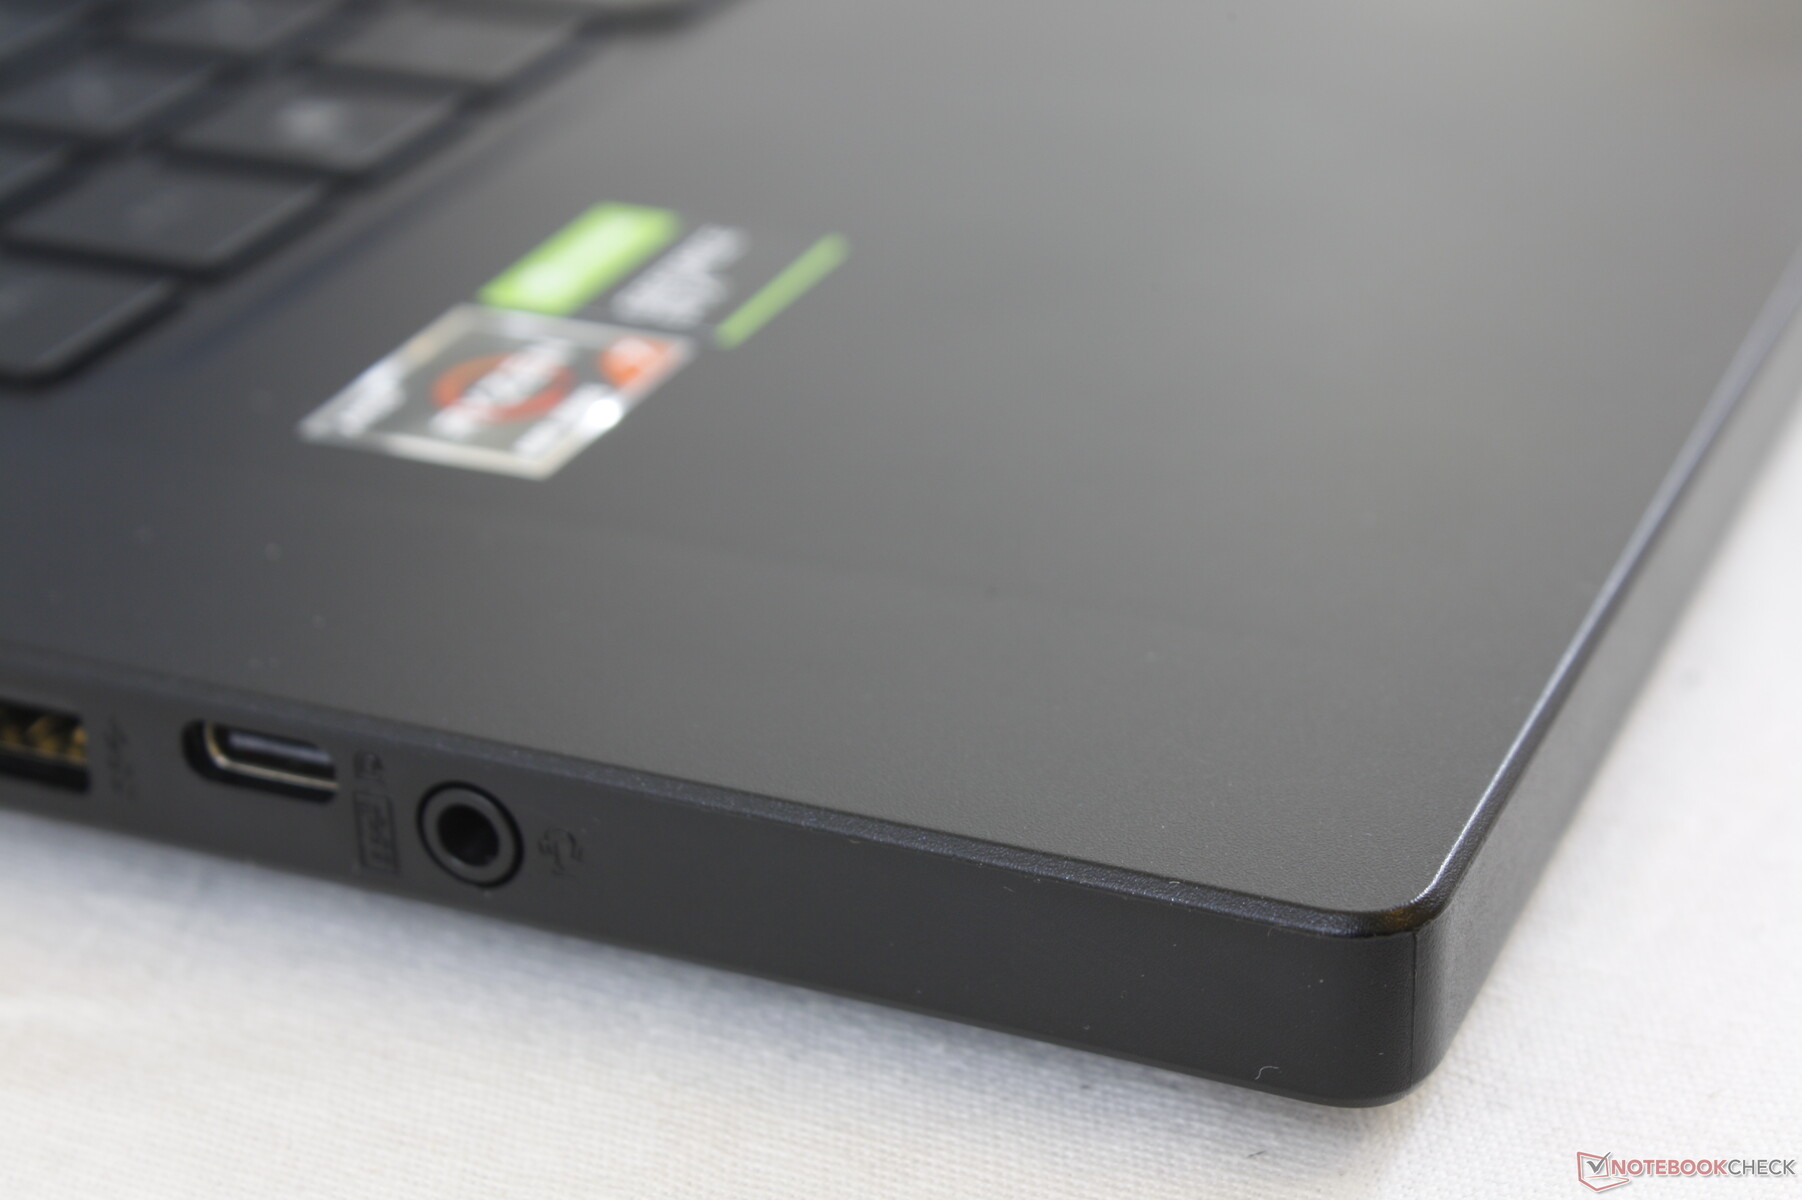
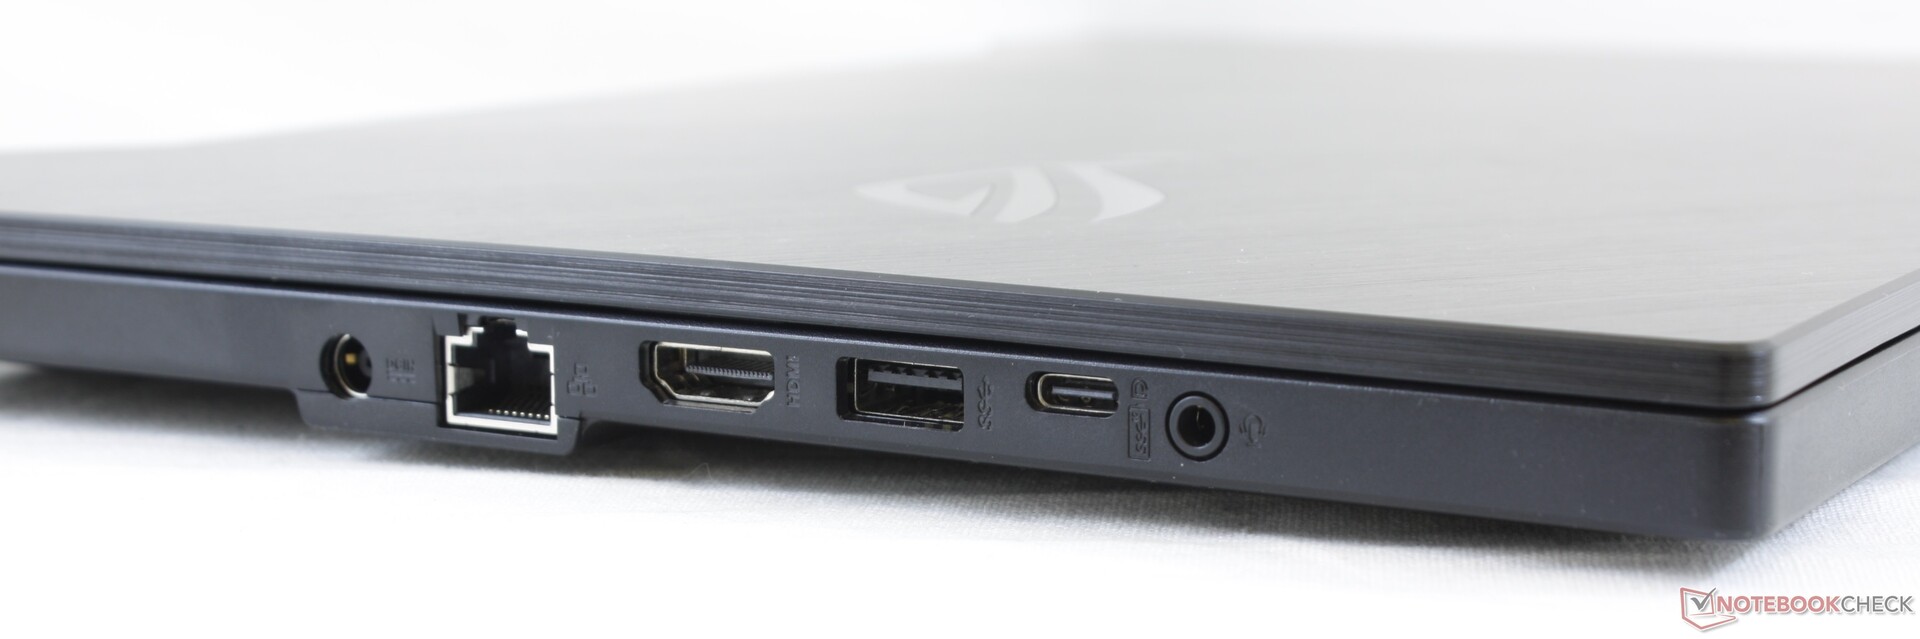
There is a healthy selection of integrated ports including RJ-45, HDMI, and USB-C with DisplayPort support. Thunderbolt 3 is not supported and there is no SD card reader.
Port positioning is unfavorable for left-handed users because the ports are very close upfront.
Communication
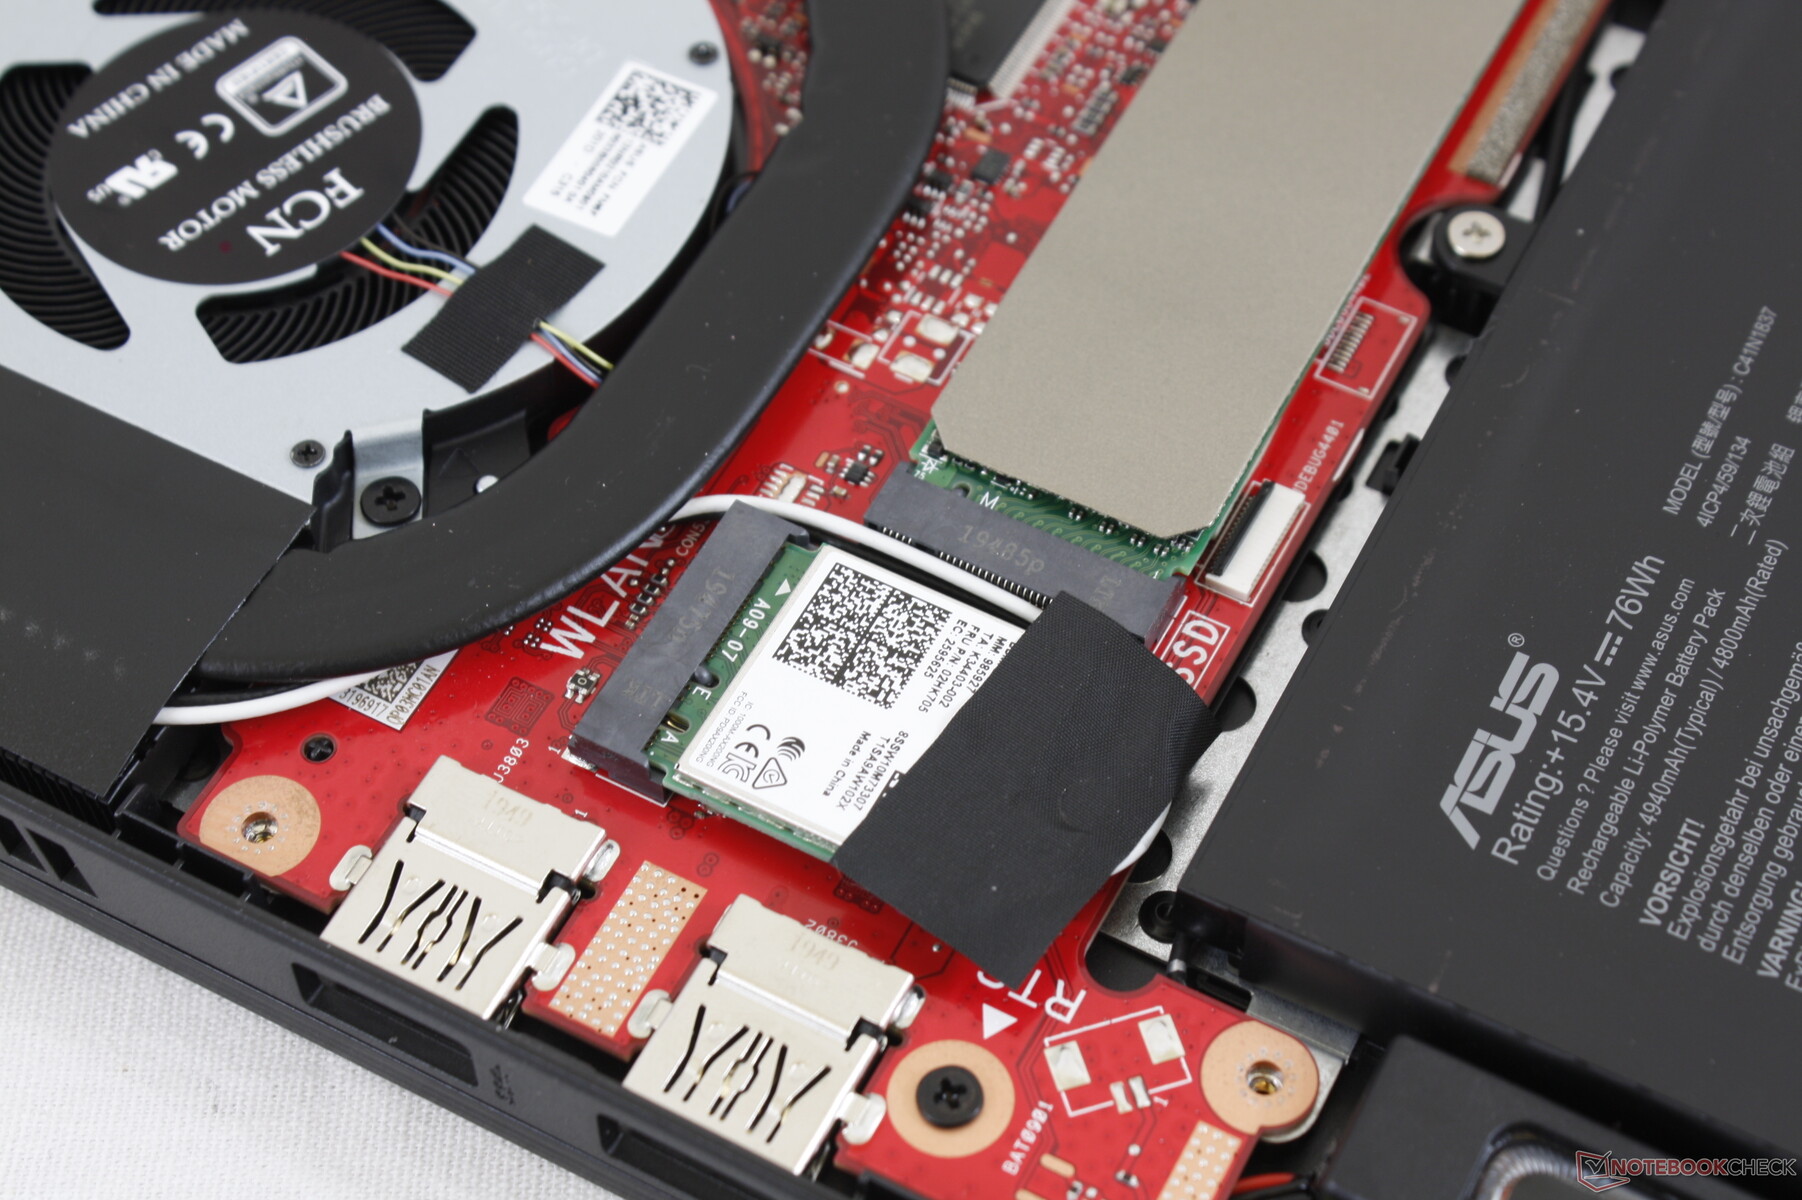
The Intel AX200 comes standard for Wi-Fi 6 and Bluetooth 5.1 connectivity as opposed to the slower RealTek Wi-Fi 5 module on last year's GA502DU. We experienced no issues when paired to our Netgear RAX200 test router.
Webcam
There is no integrated webcam which Asus says is due to the very narrow bezels around the display. However, newer Ultrabooks like the latest XPS 15, XPS 17, or 2020 HP Spectre have proven that it's possible to have an integrated webcam without sacrificing narrow bezels or positioning.
Maintenance
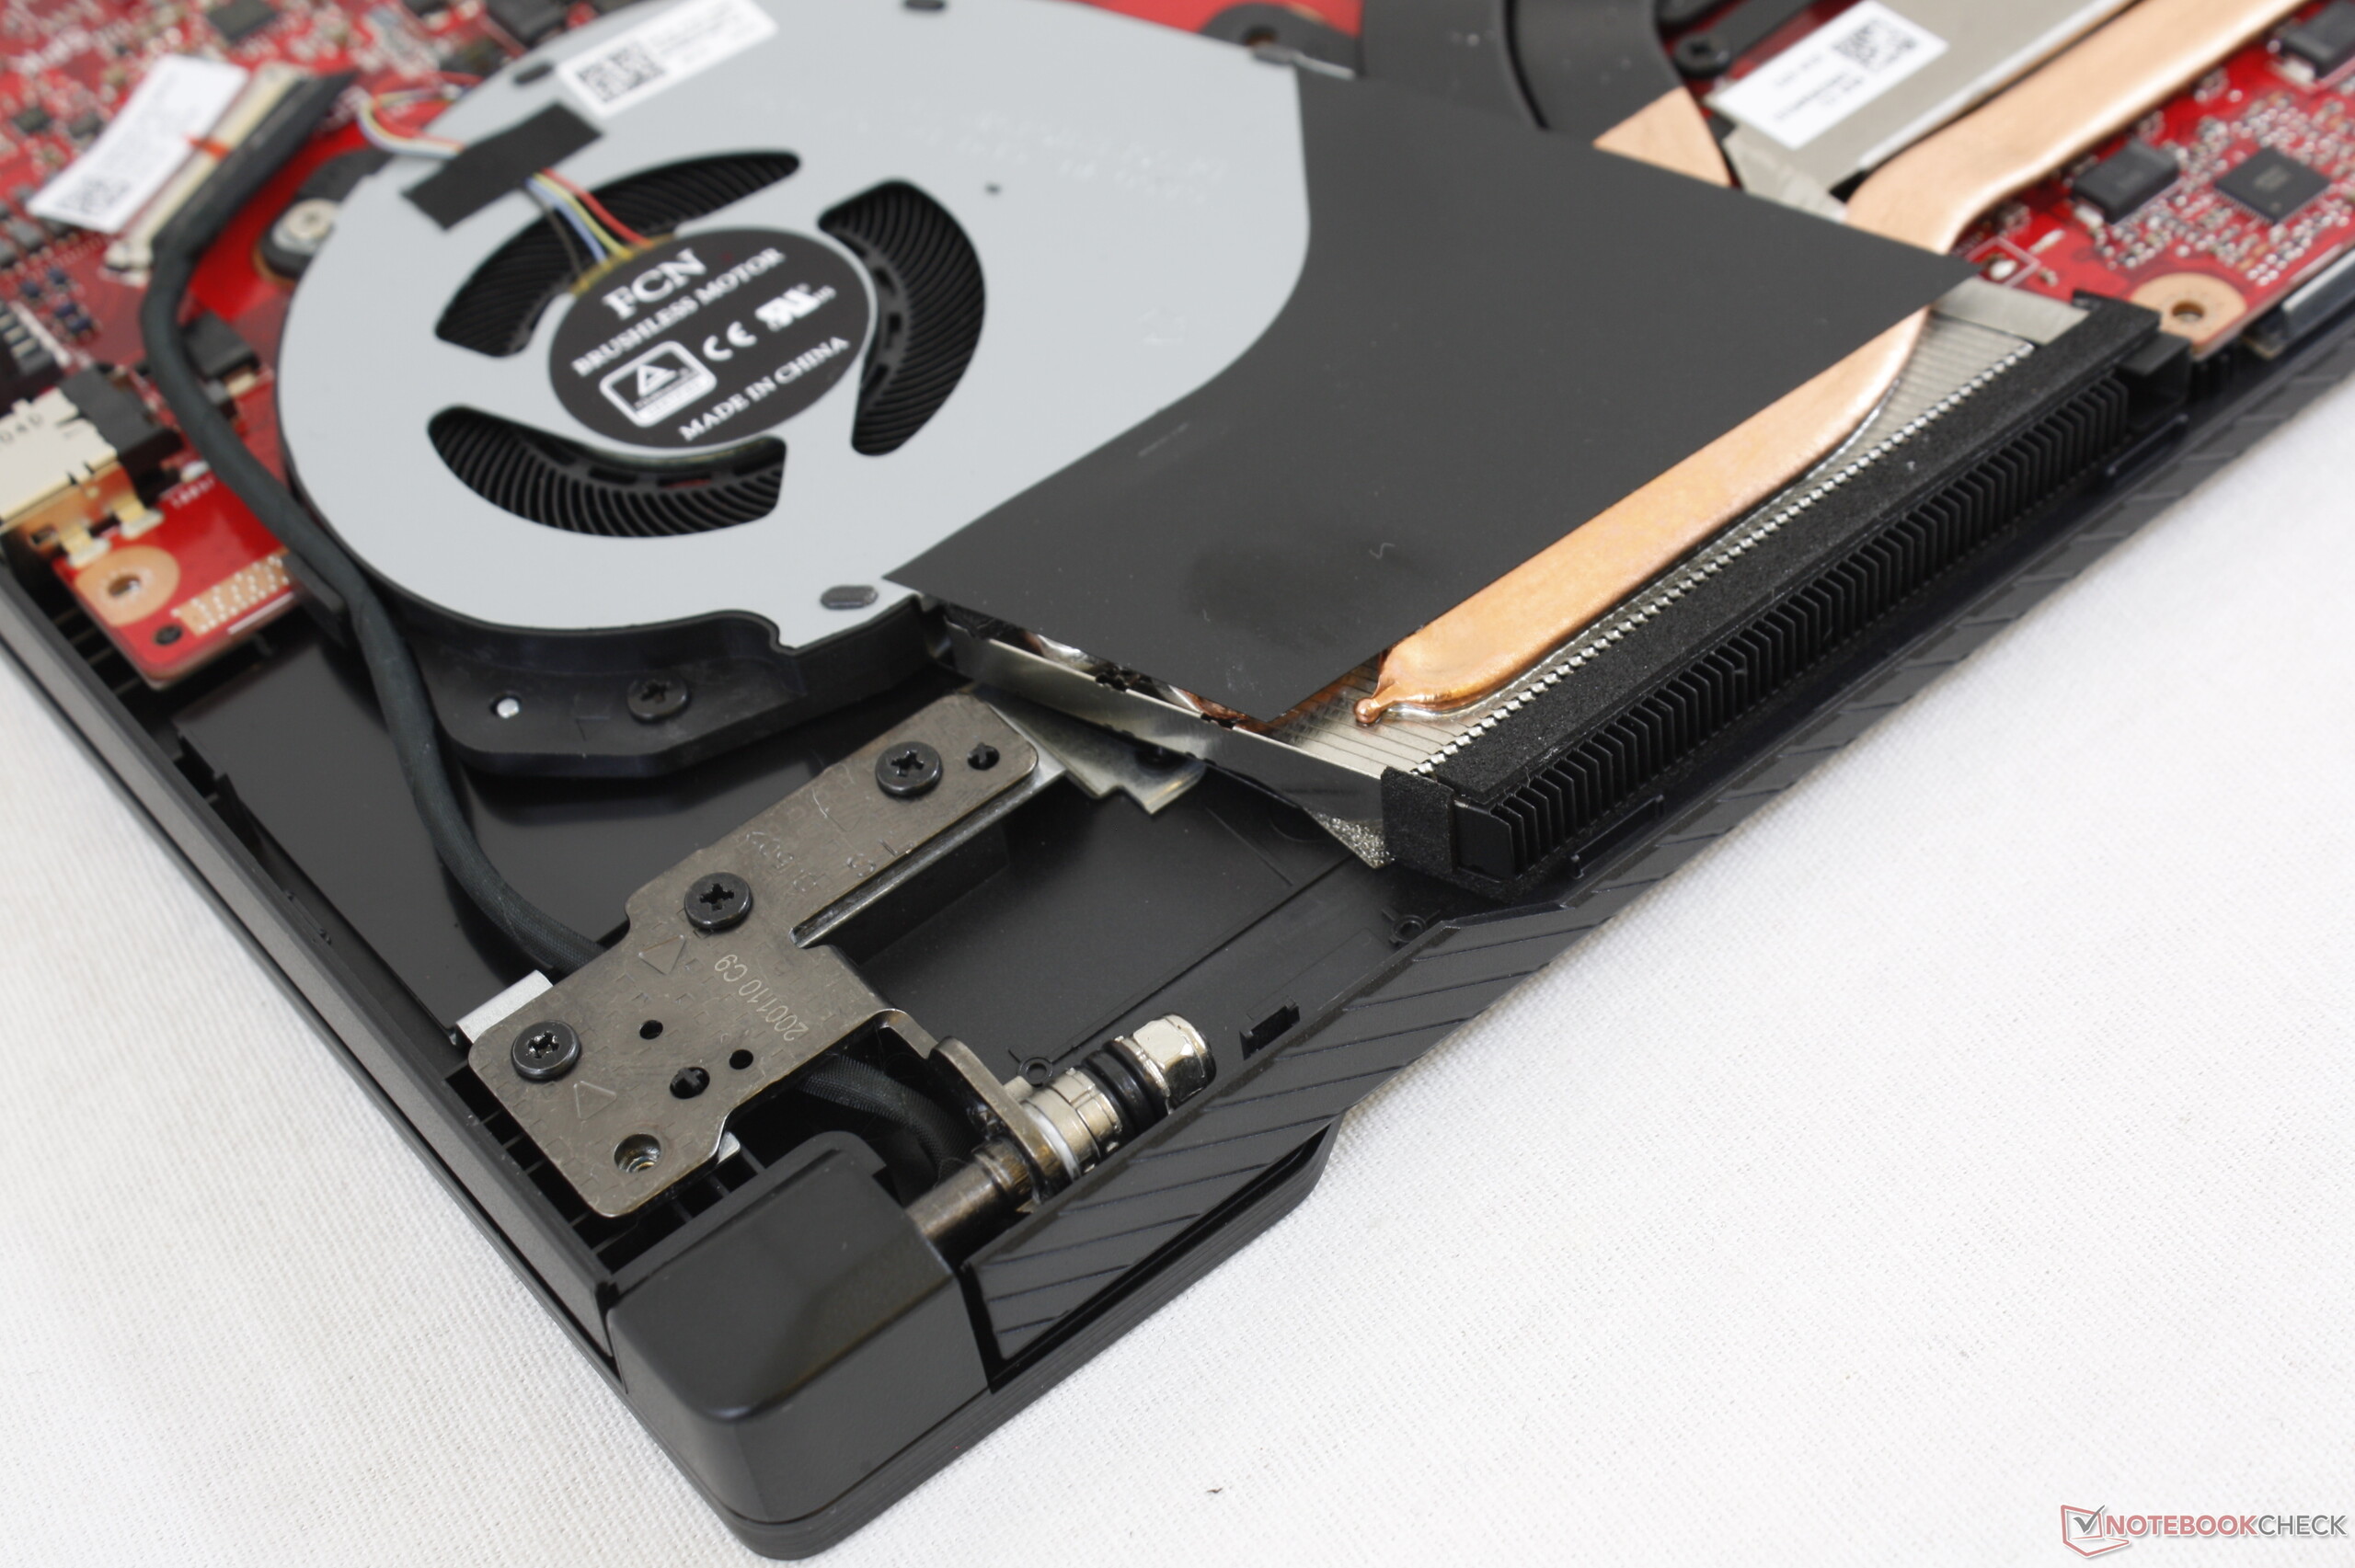
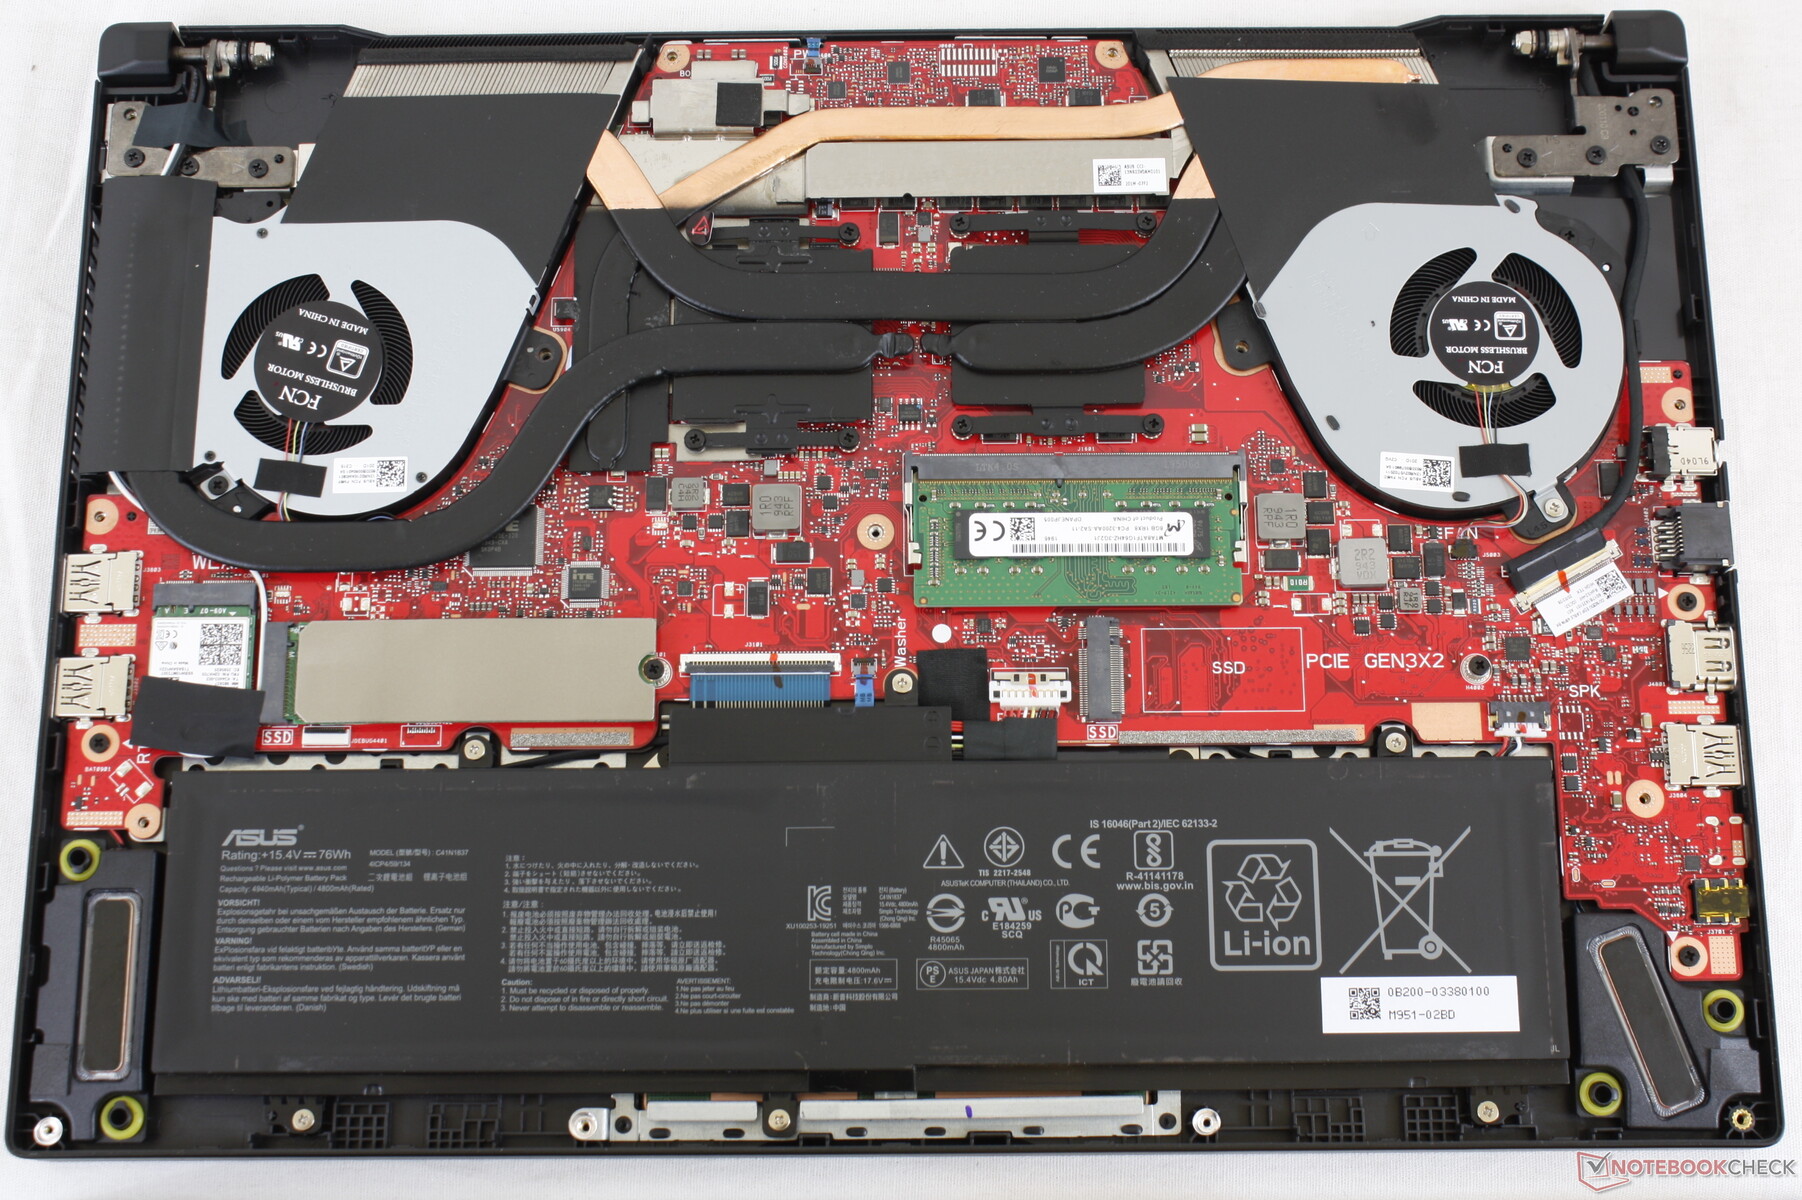
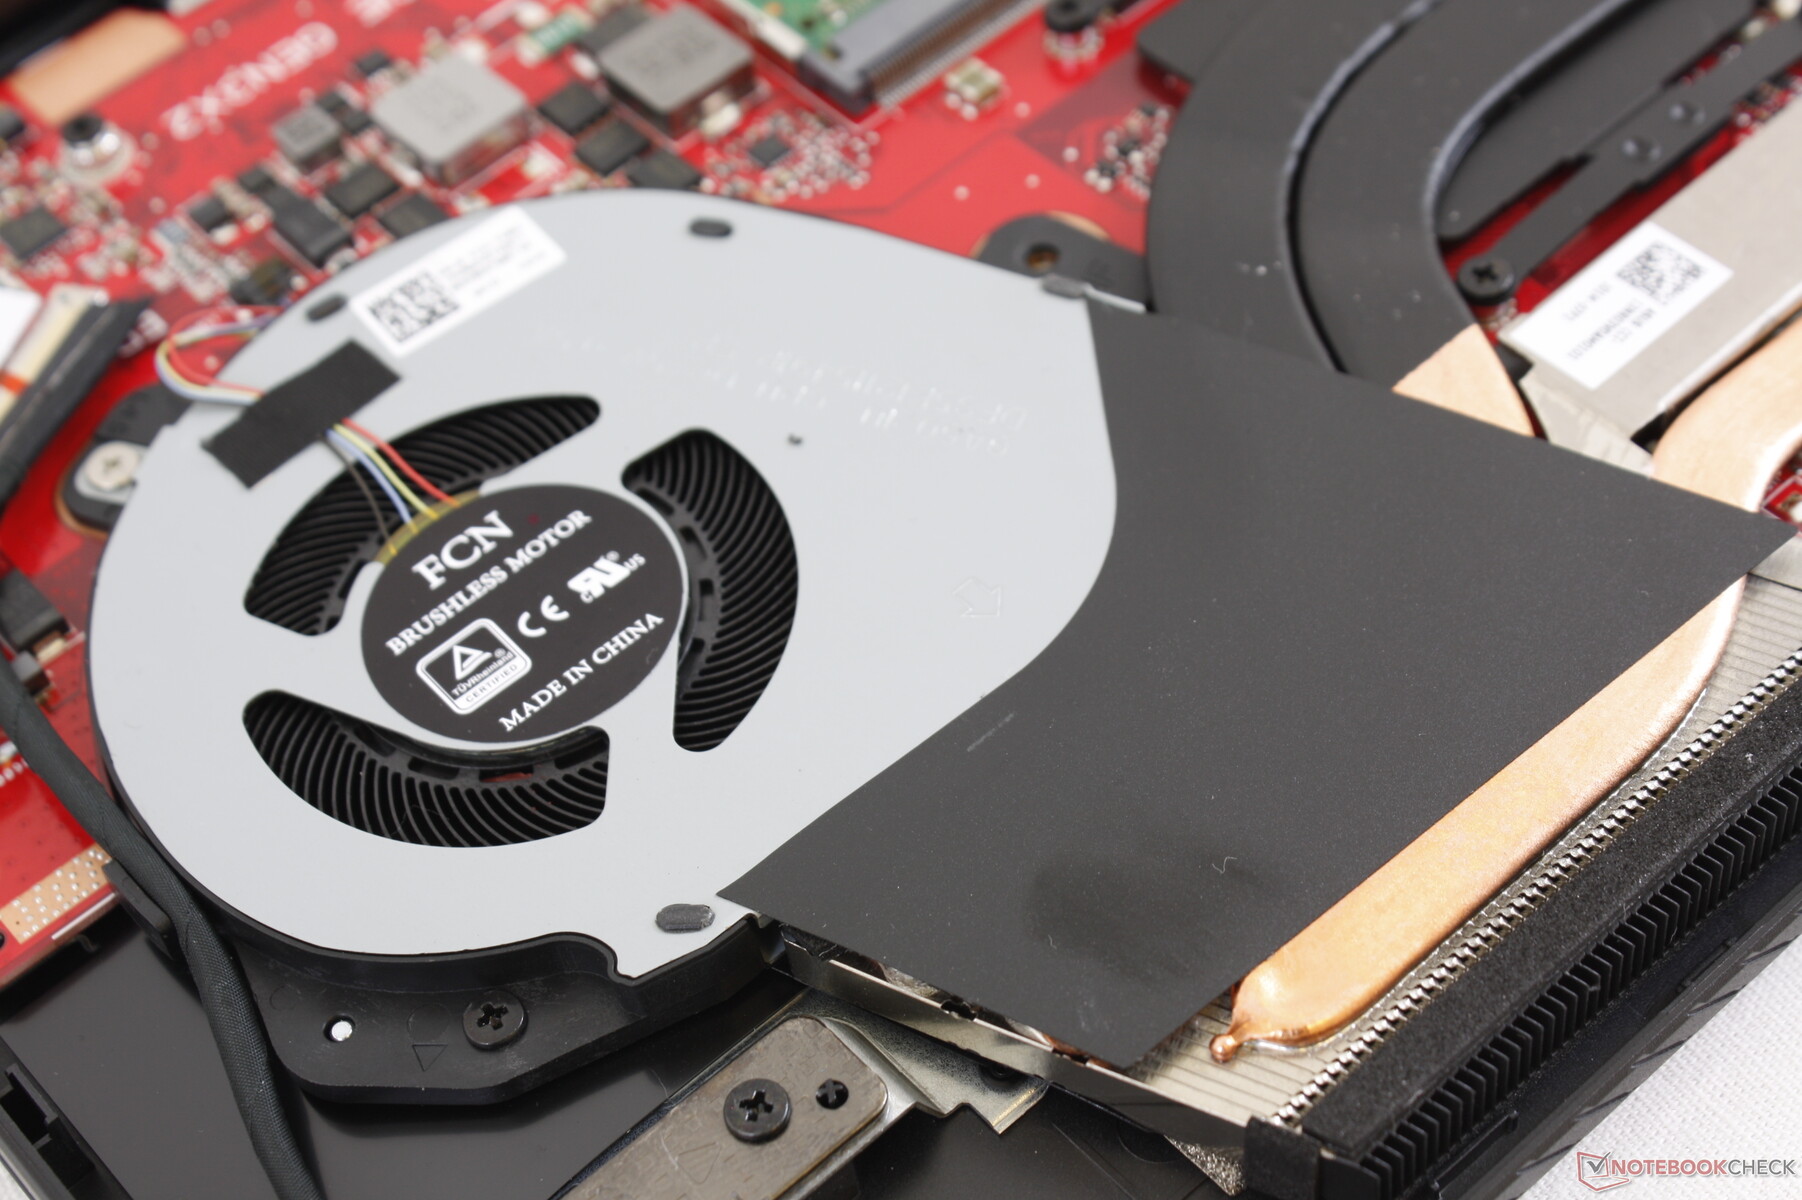
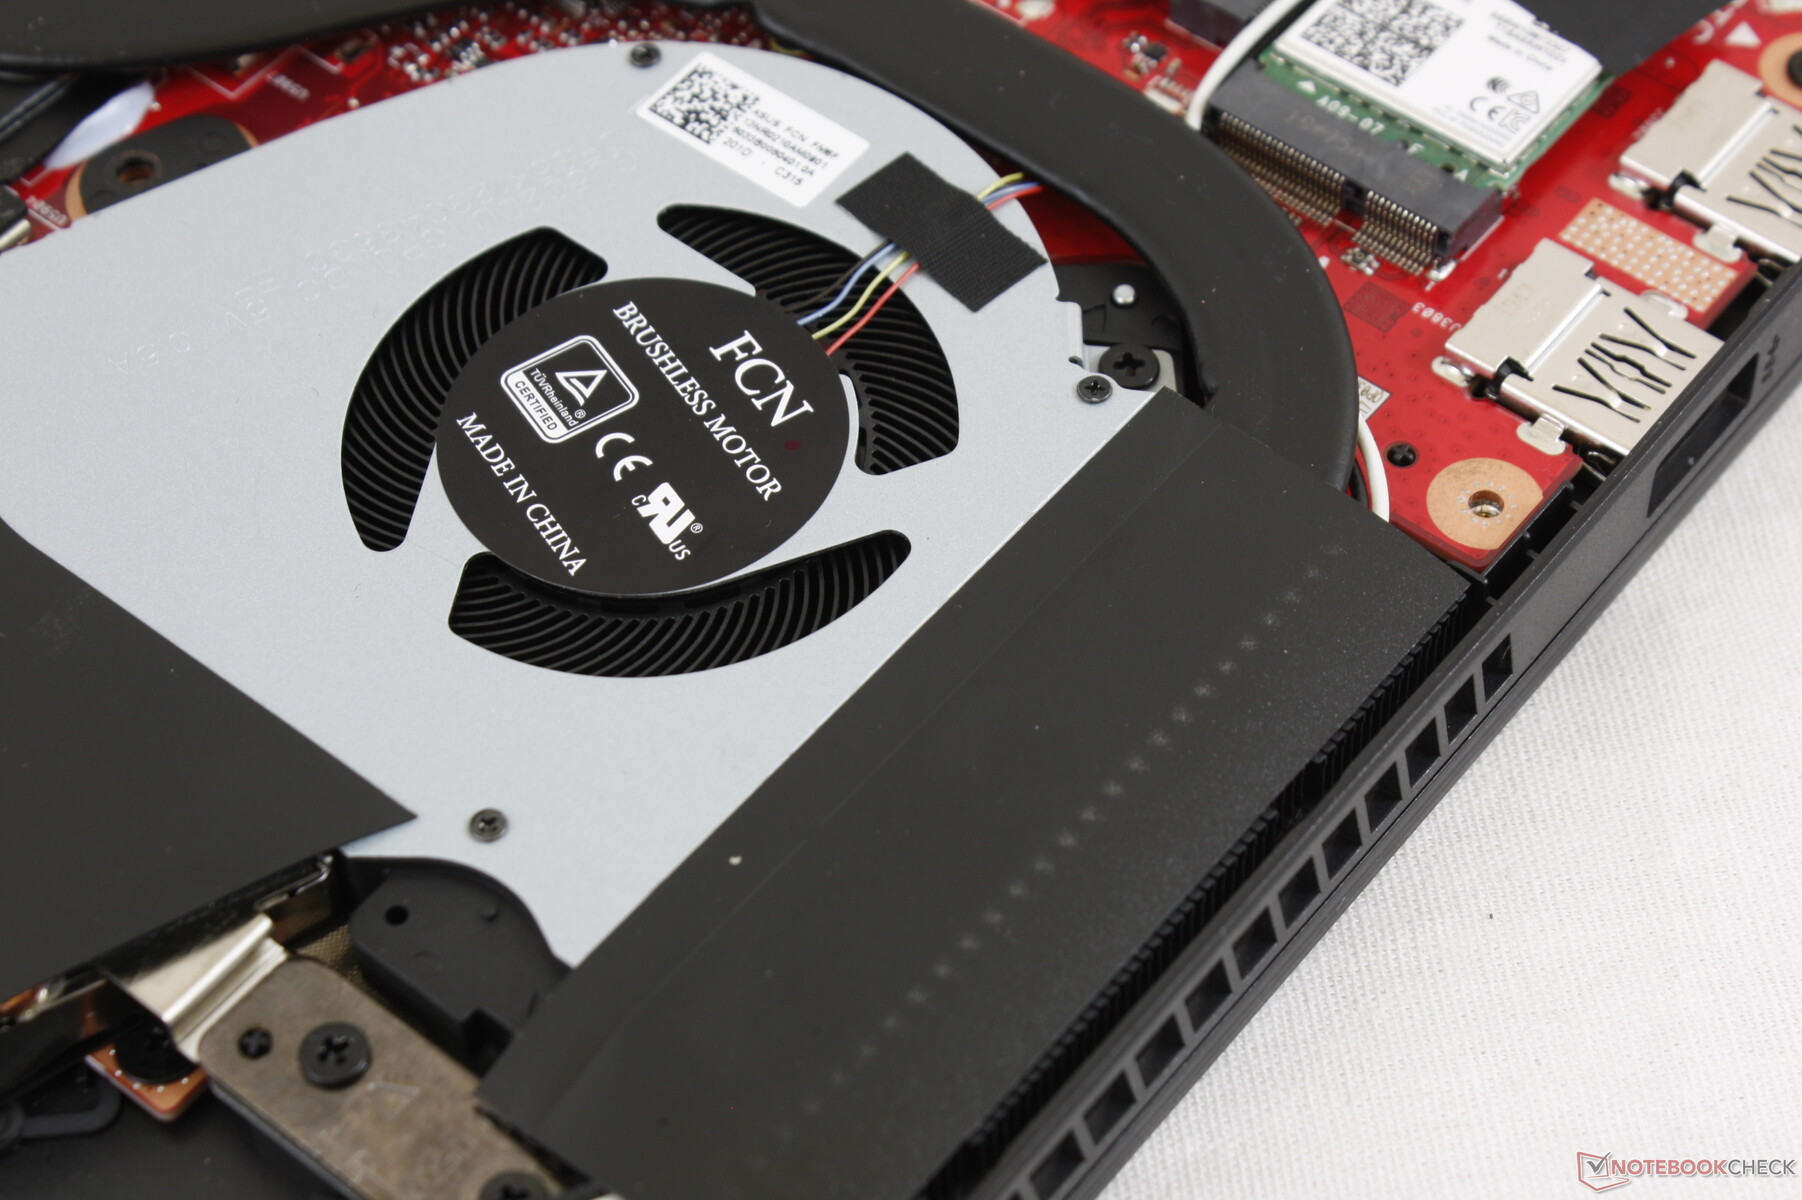
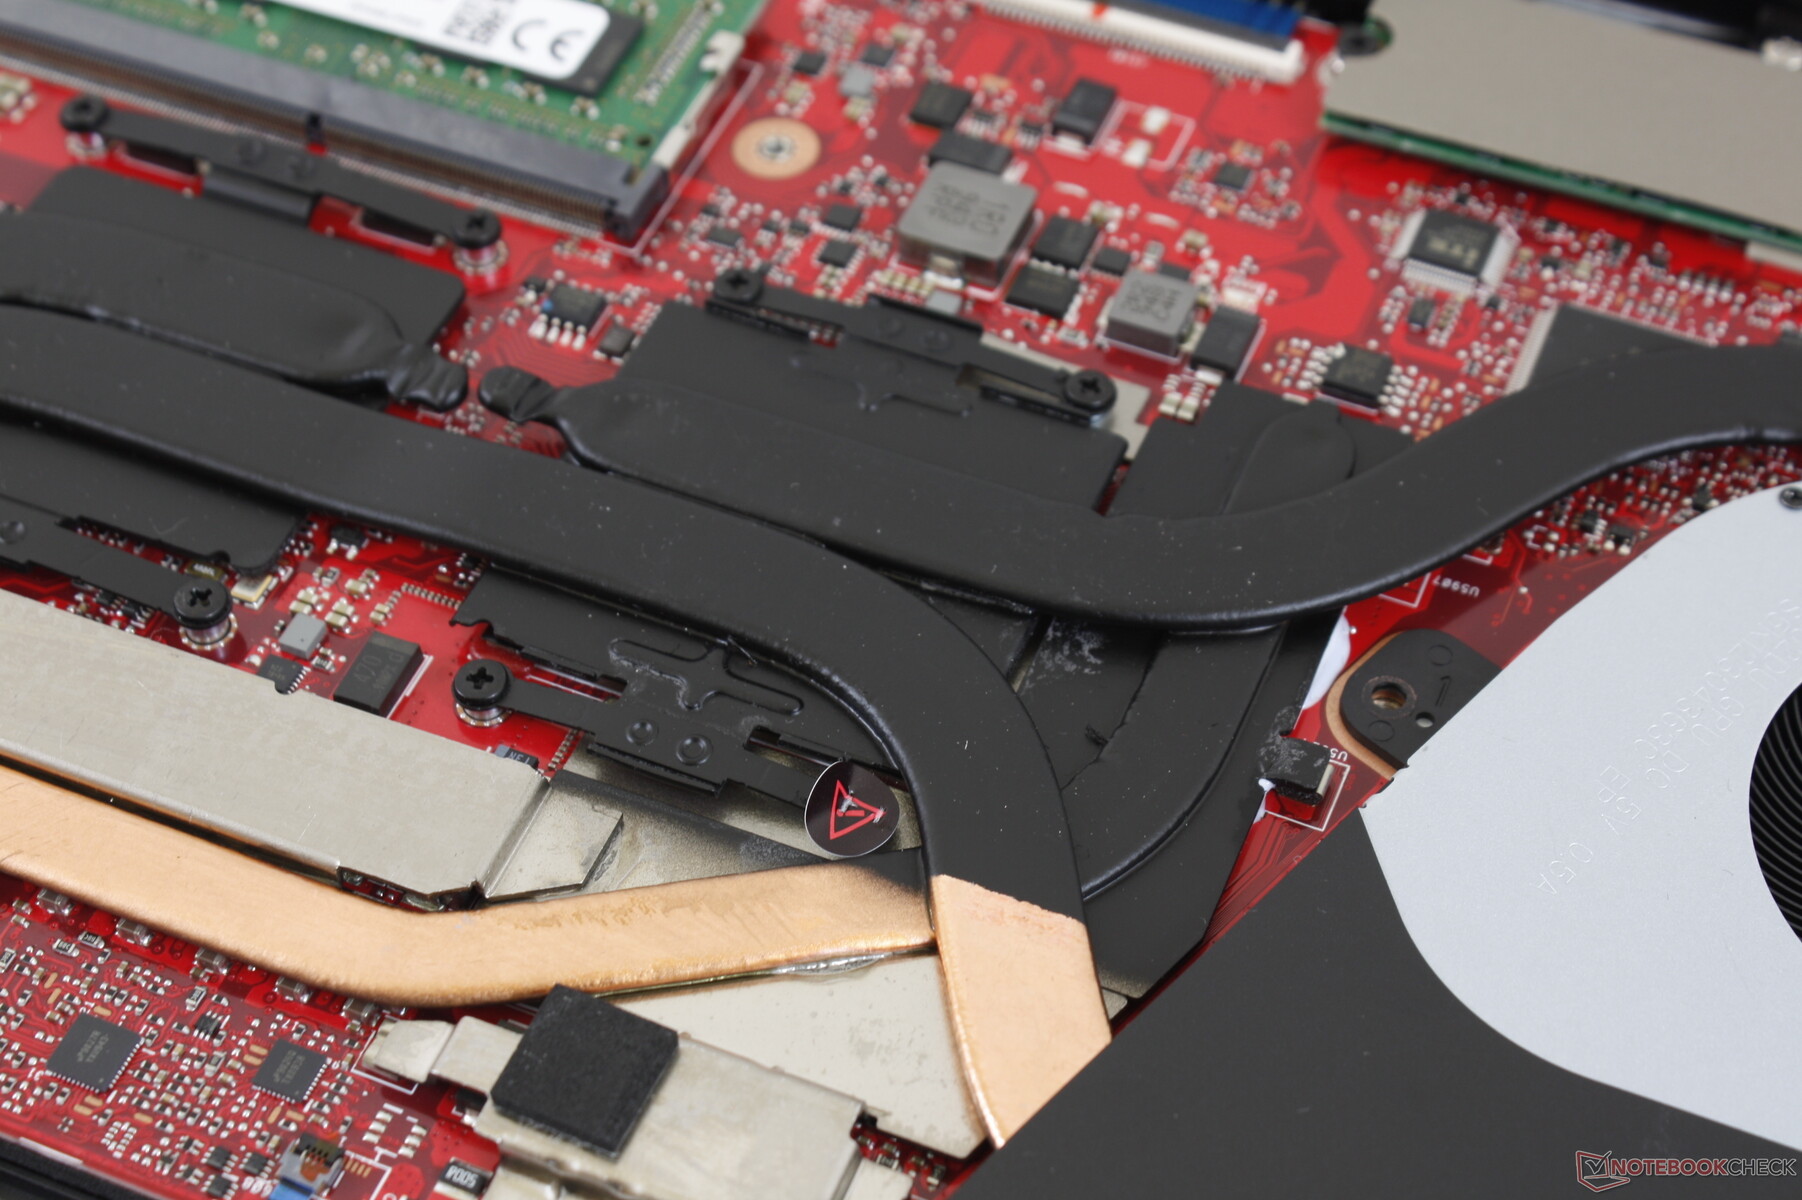
The bottom panel takes patience to remove since there are a total of 15 screws. Internals are otherwise identical to last year's GA502DU save for some slight changes to the heat pipes.
Accessories and Warranty
There are no extras in the box other than the AC adapter and paperwork. The standard one-year limited warranty applies with extension options of up to four years from Xotic PC. Users must register within 60 days of purchase and shipping fees are covered in one direction only.
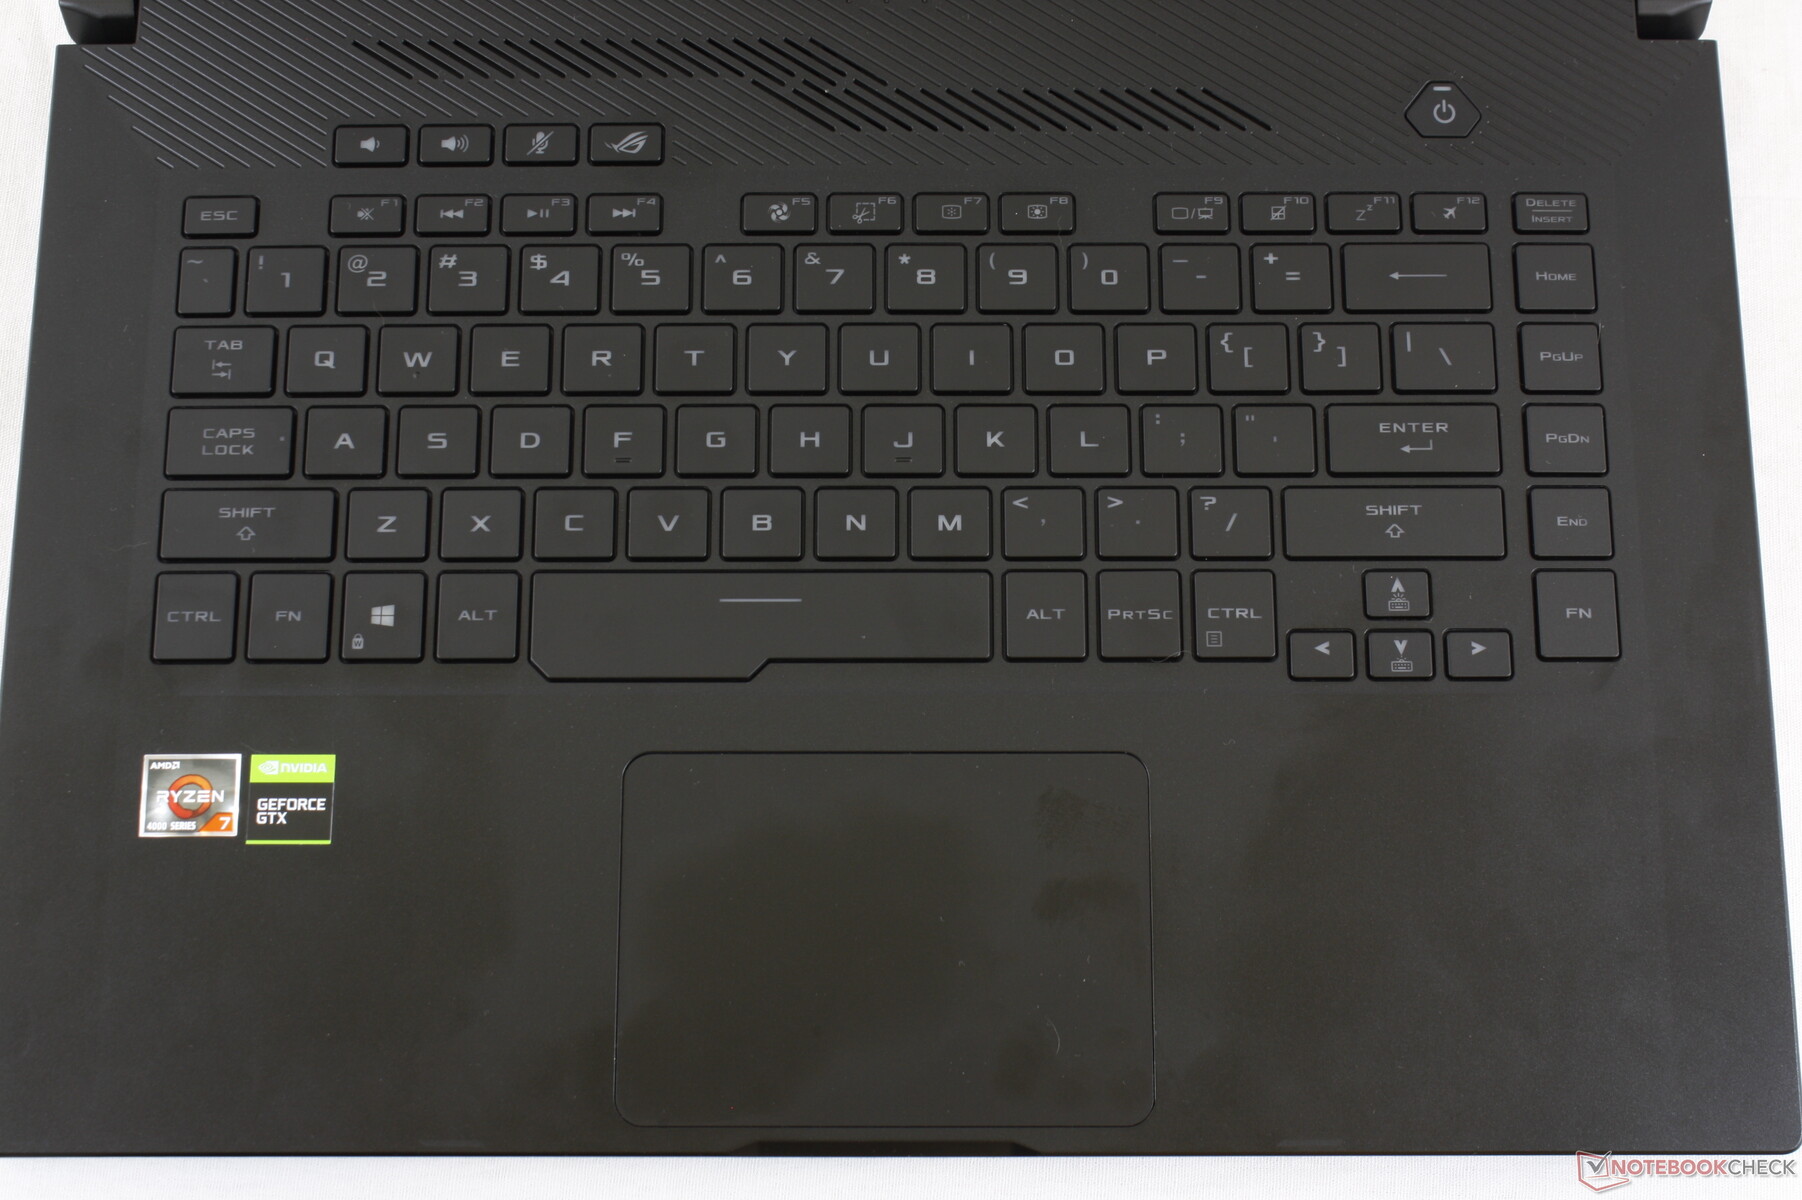
Input Devices
Keyboard and Touchpad
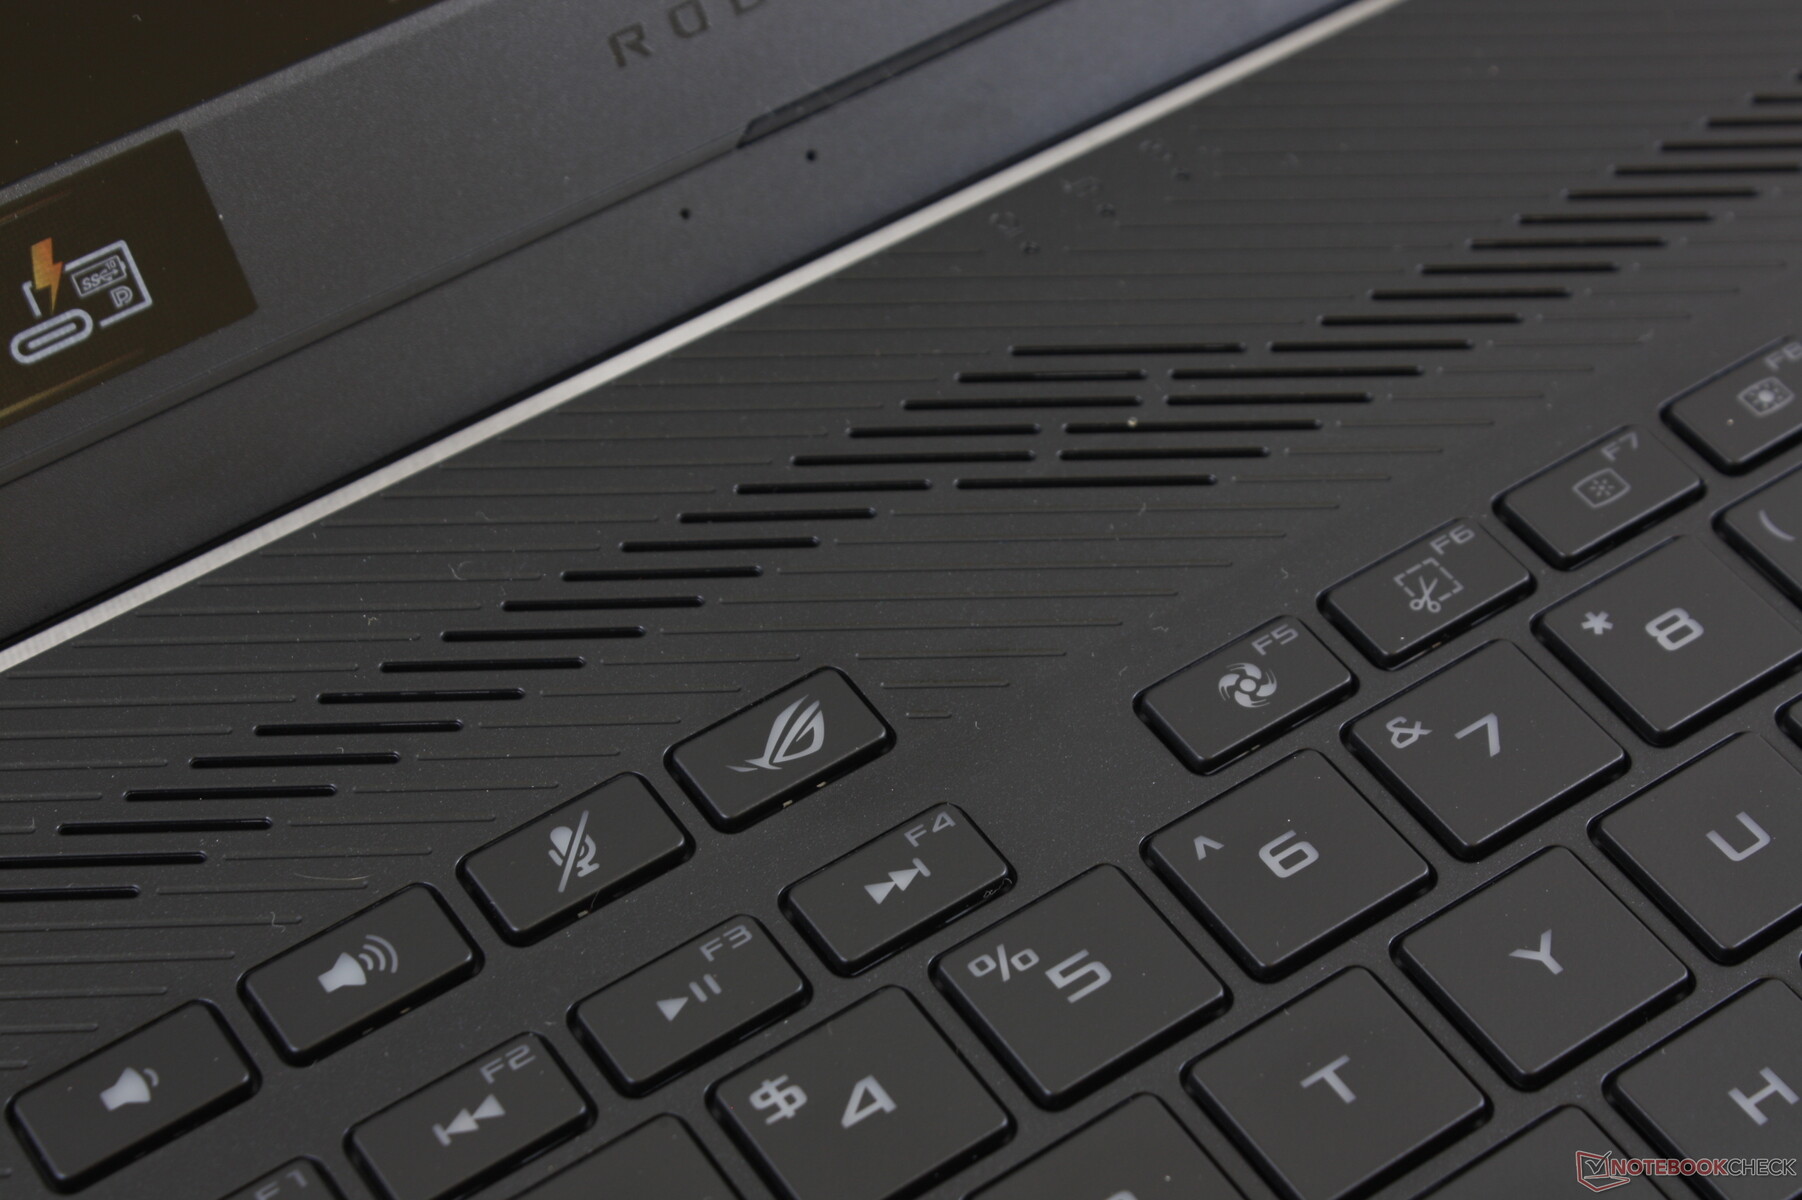
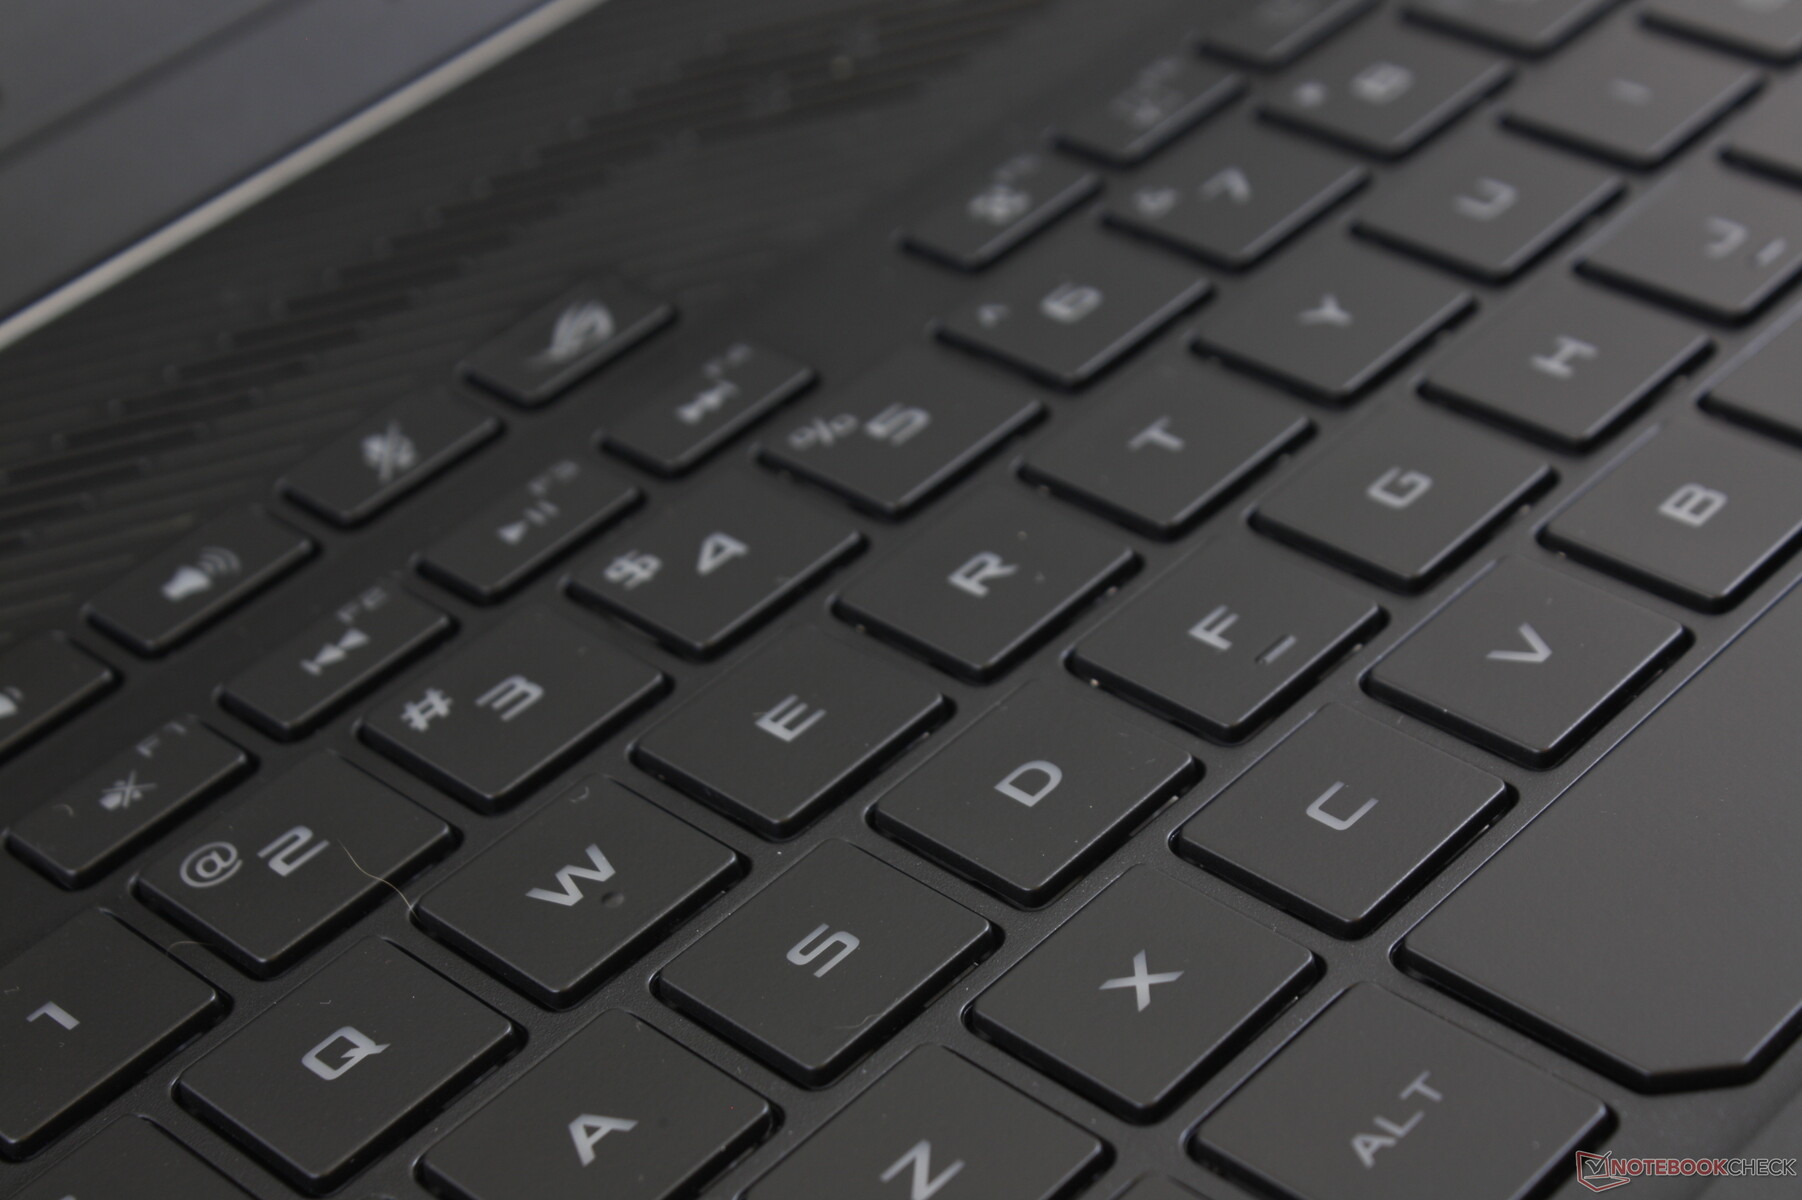
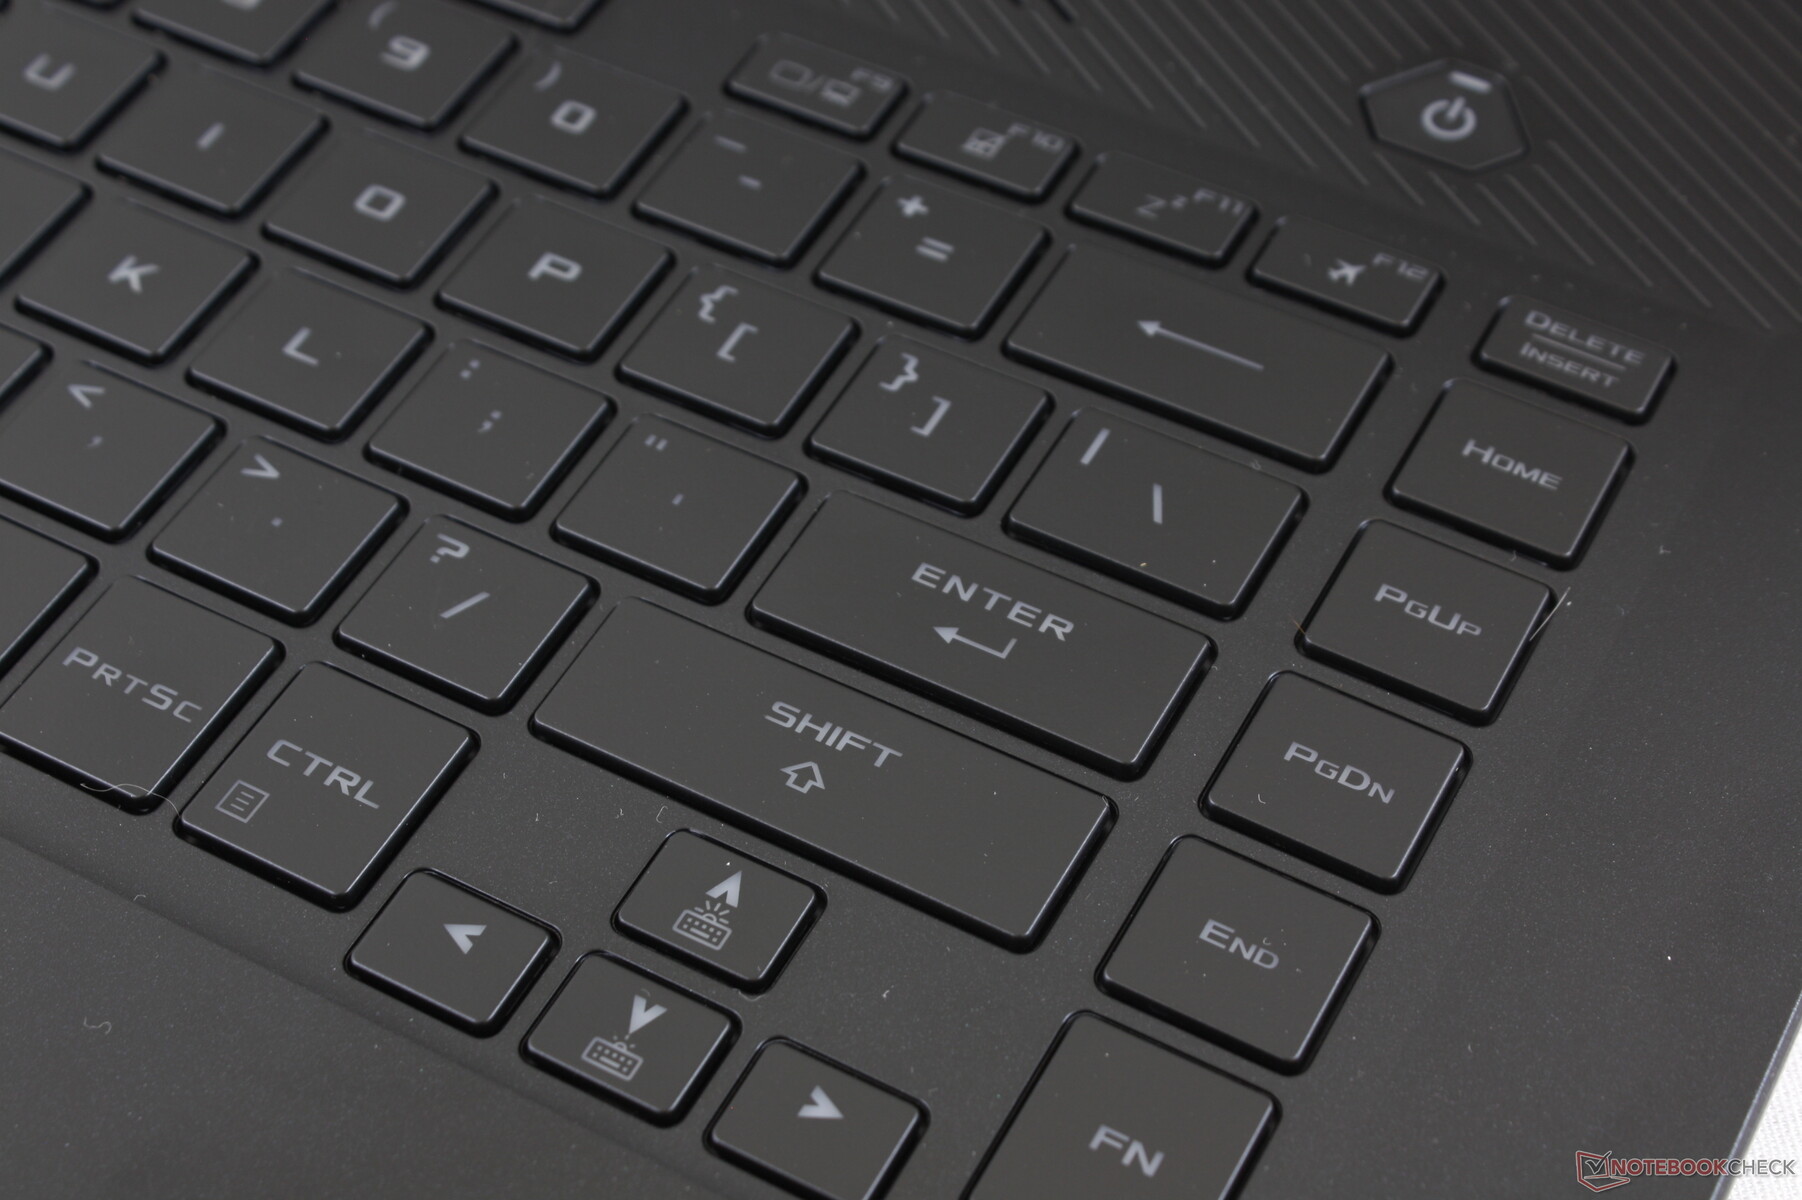
We weren't fans of the keyboard and clickpad on the GA502DU and so it's disappointing to see them unchanged on the GA502IU. Feedback remains spongier and with shallower travel than on the MSI SteelSeries keyboards while the dark gray font contrasts poorly with the dark key caps. We do, however, like the useful row of auxiliary keys along the top and the extra column of keys along the right edge. But for general typing, a ZenBook will do you better.
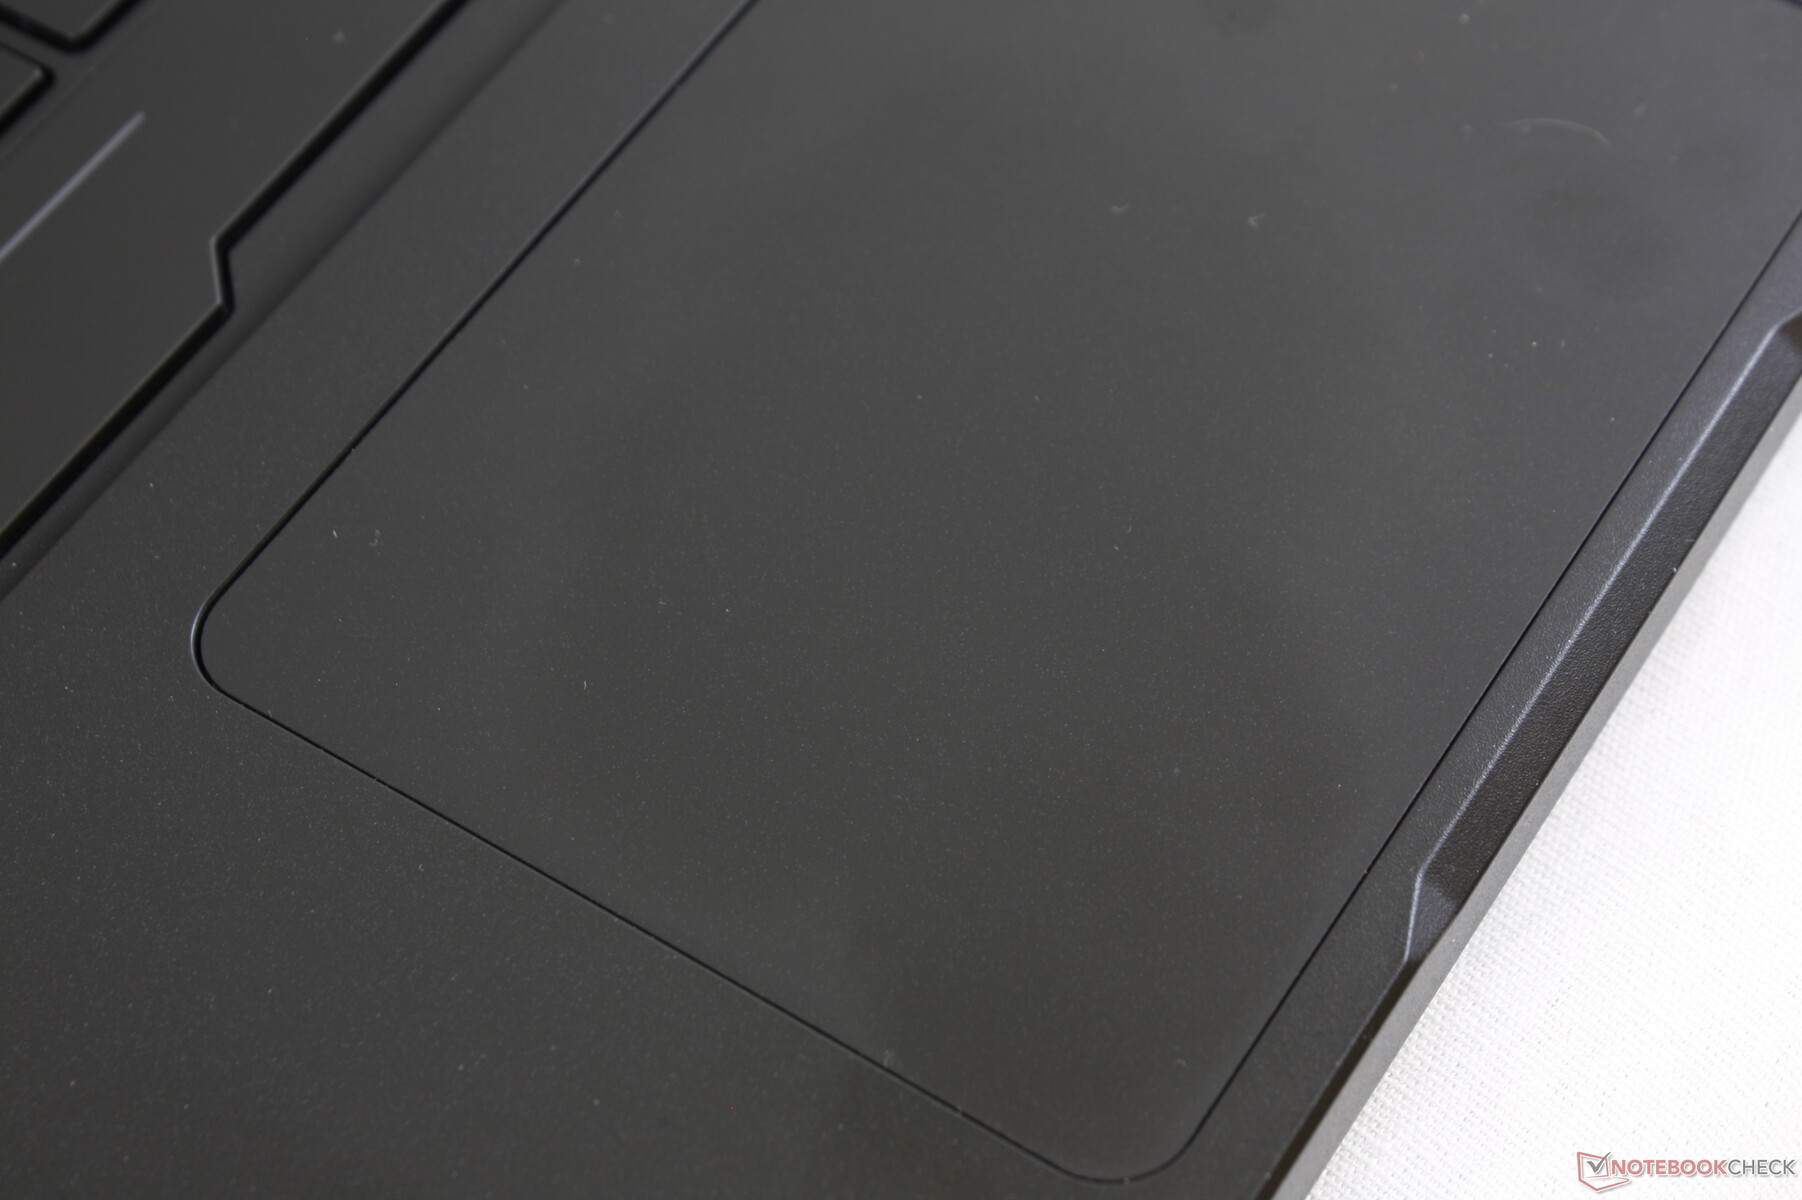
Gliding across the Precision clickpad (10.5 x 7.5 cm) is smooth at medium to high speeds while it tends to stick when gliding at slower speeds. The integrated mouse keys feel unsatisfying to press due to the weak and spongy feedback.
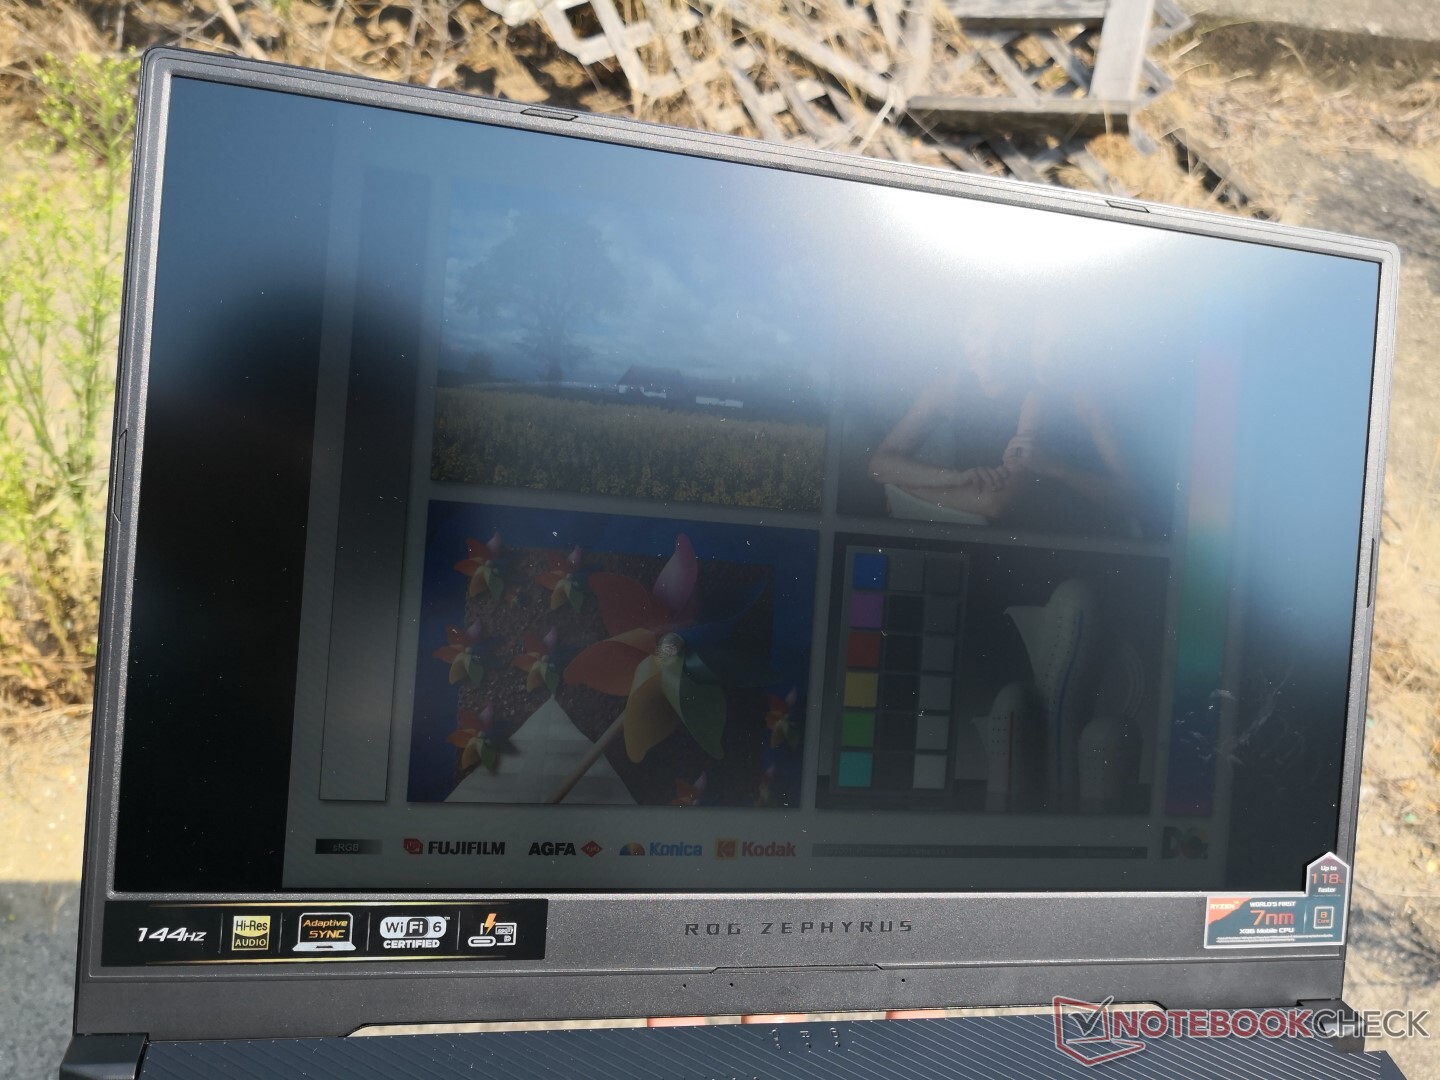
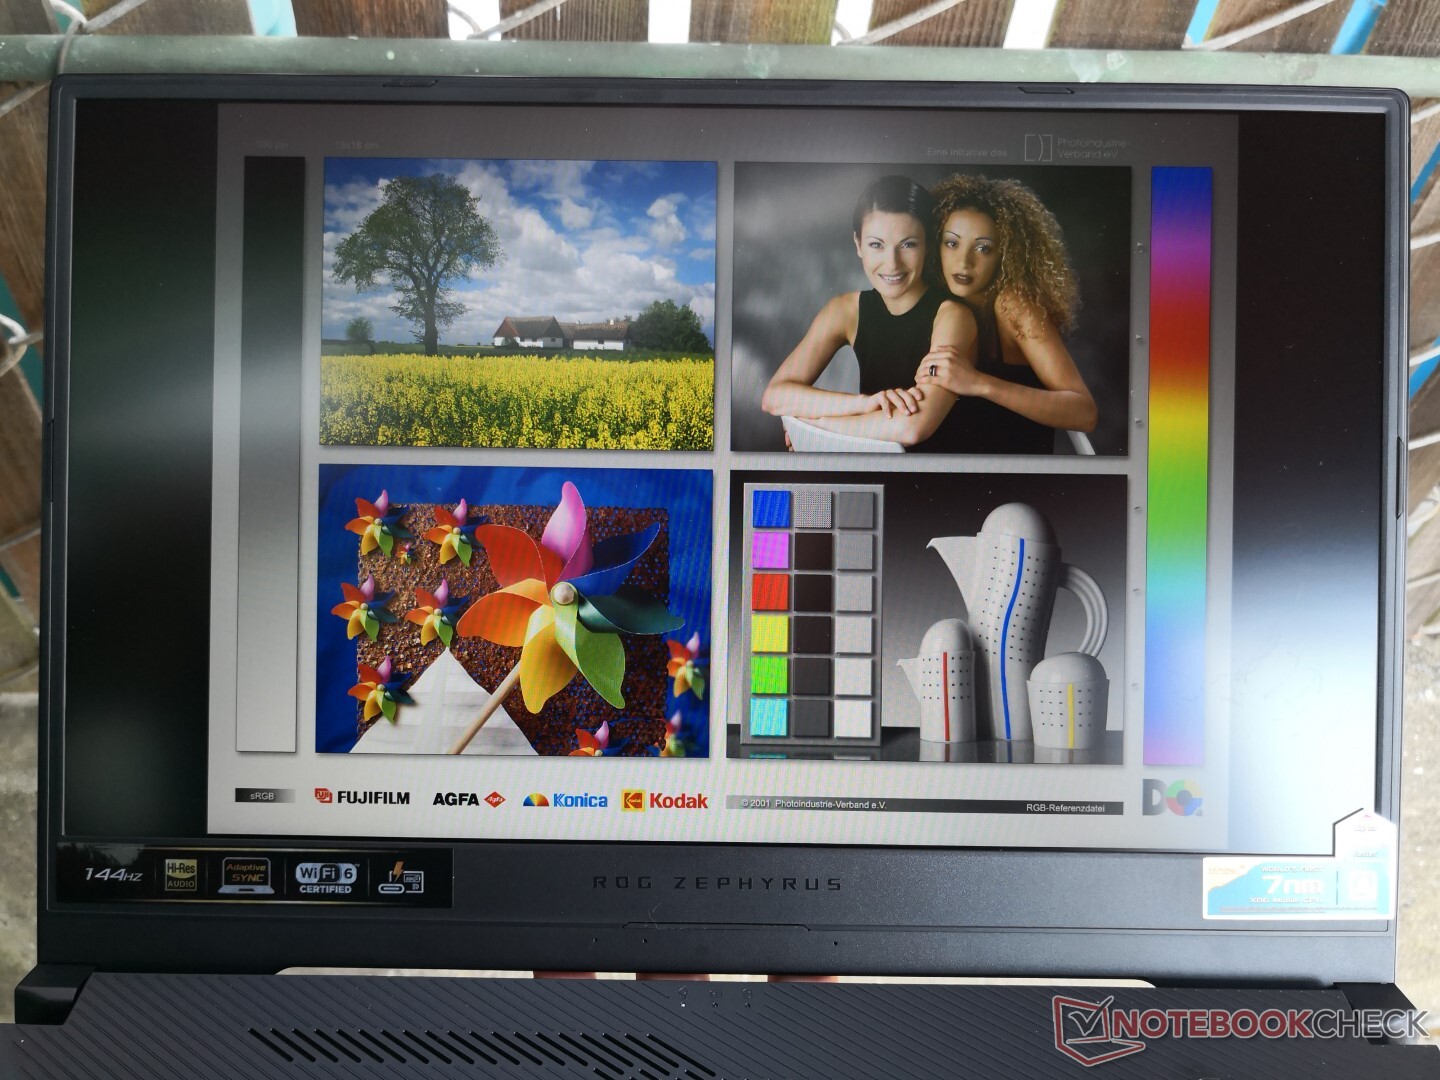
Display
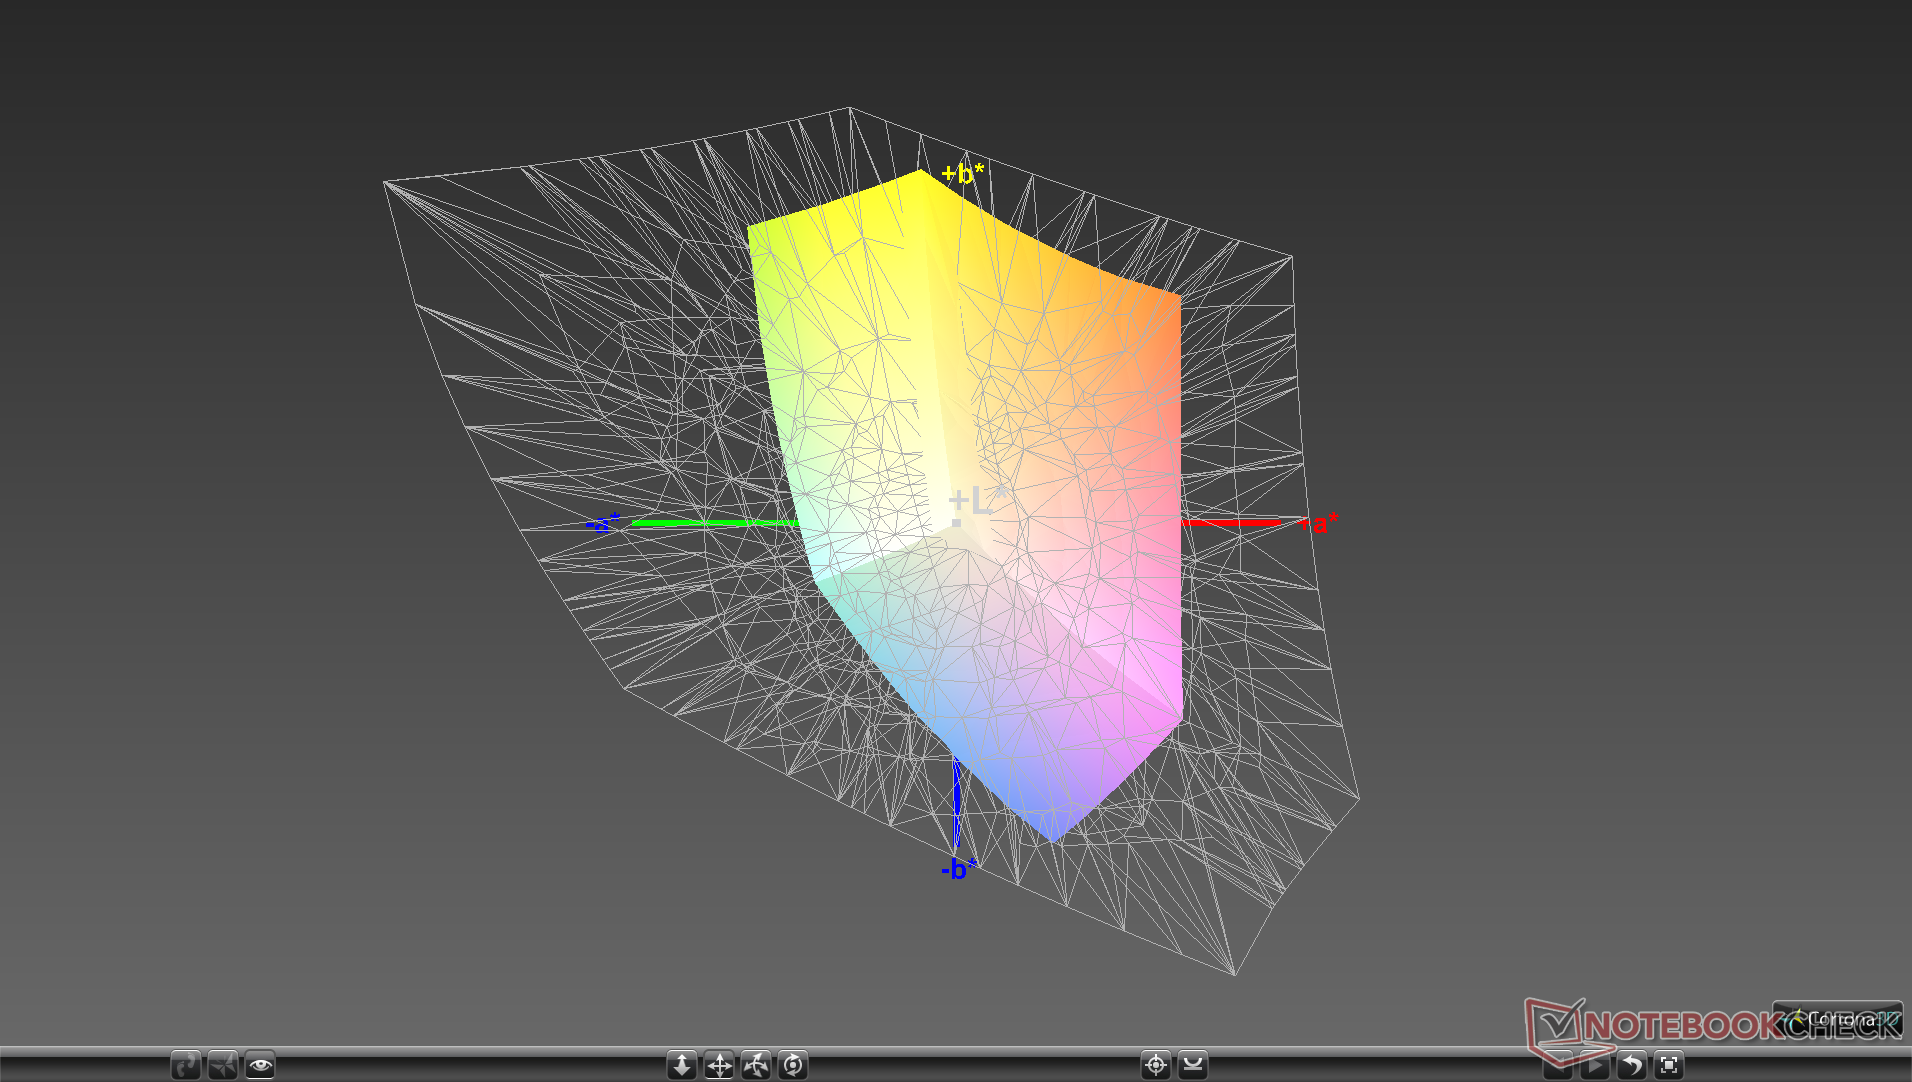
One of our main criticisms about last year's GA502DU was its average 60 Hz display. For this year, Asus has dropped both the 60 Hz and 120 Hz options to make 144 Hz and 240 Hz the new standards. Unfortunately, the 144 Hz panel has both noticeably slower response times and a narrower color space than most other 144 Hz panels for shallower colors and more noticeable ghosting, respectively. This is because the GA502IU is still using IPS panels sourced from Panda instead of superior panels from AU Optronics or Sharp.
The 240 Hz option supposedly addresses the main issues of the 144 Hz panel as Asus is promising both 3 ms response times and 100 percent sRGB coverage compared to 15 ms and 58 percent coverage, respectively, on our 144 Hz unit. Our results below reflect only the 144 Hz panel option.

| |||||||||||||||||||||||||
Brightness Distribution: 89 %
Center on Battery: 255.9 cd/m²
Contrast: 1163:1 (Black: 0.22 cd/m²)
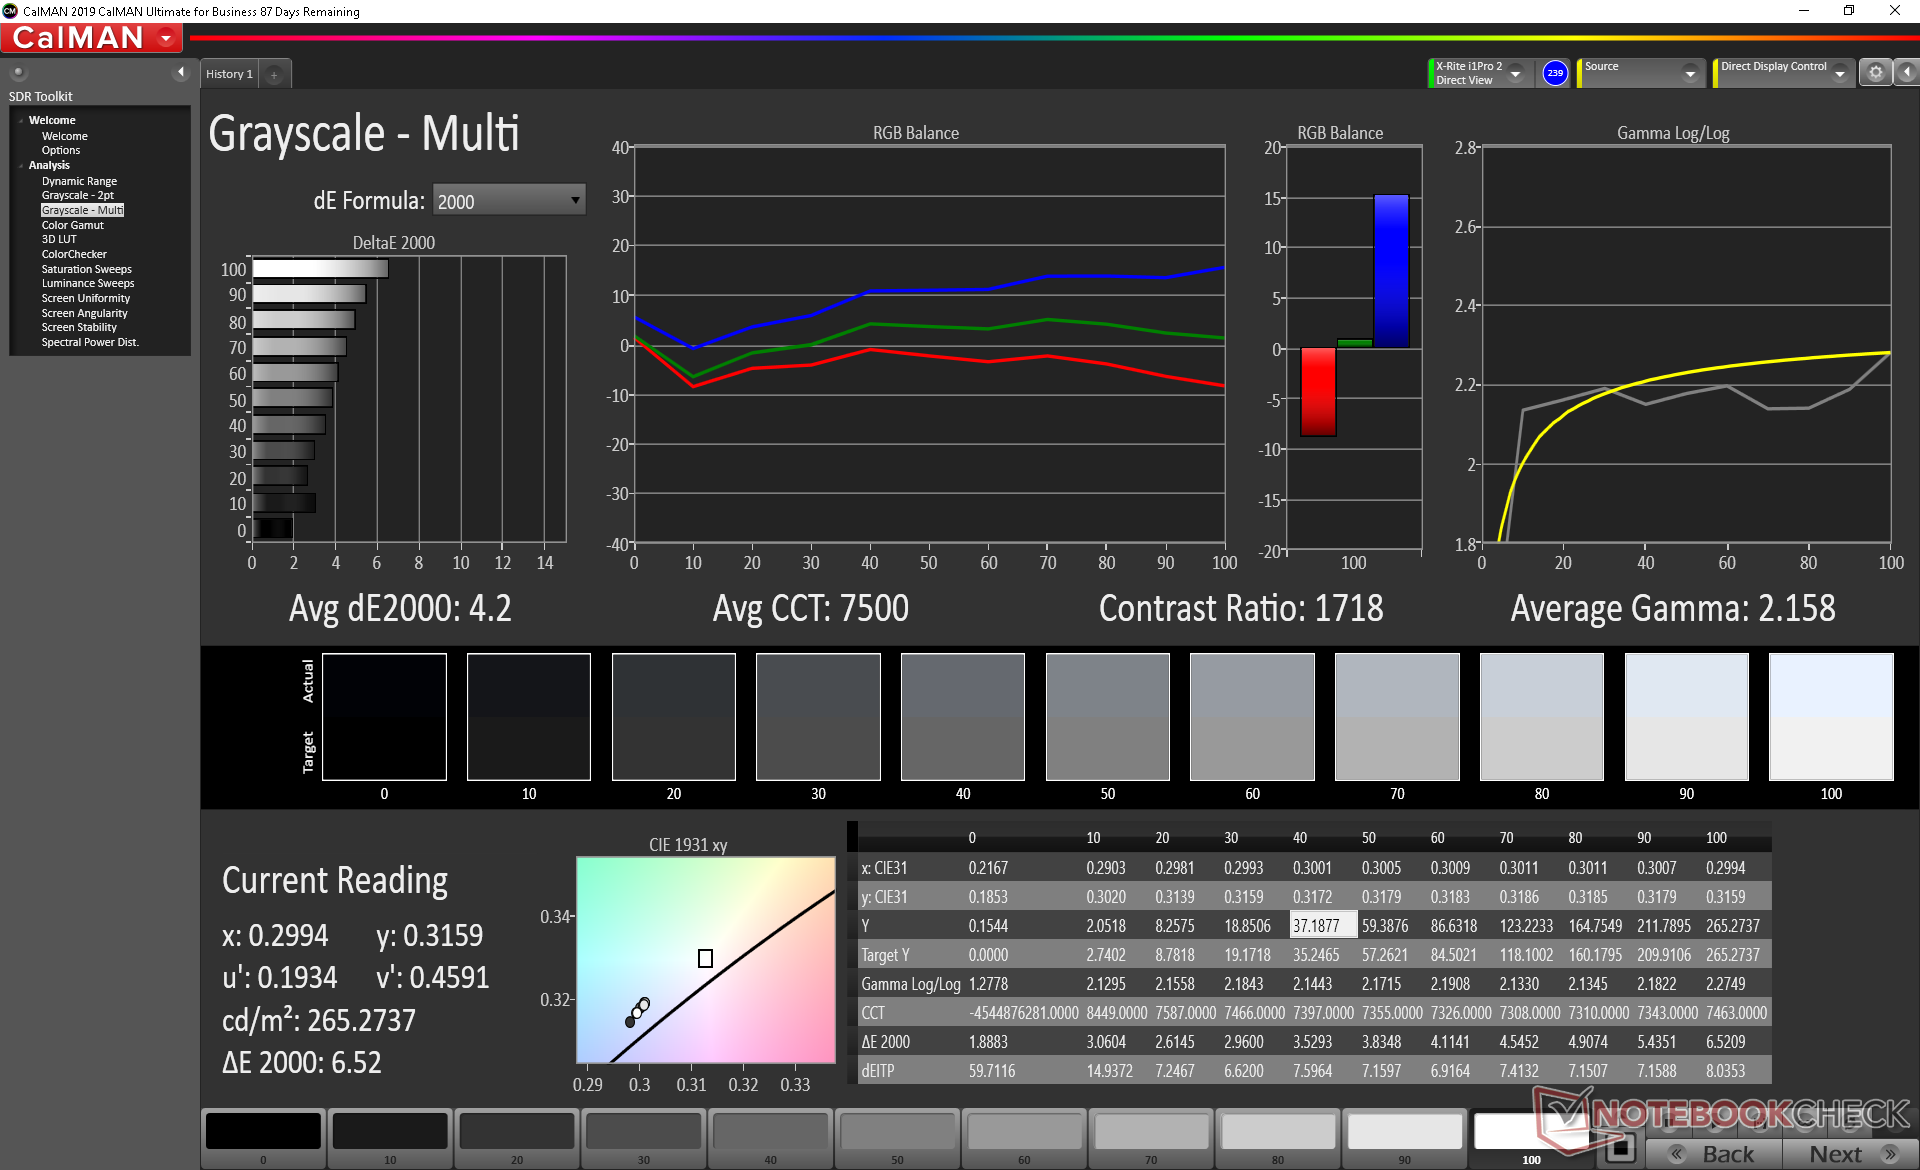
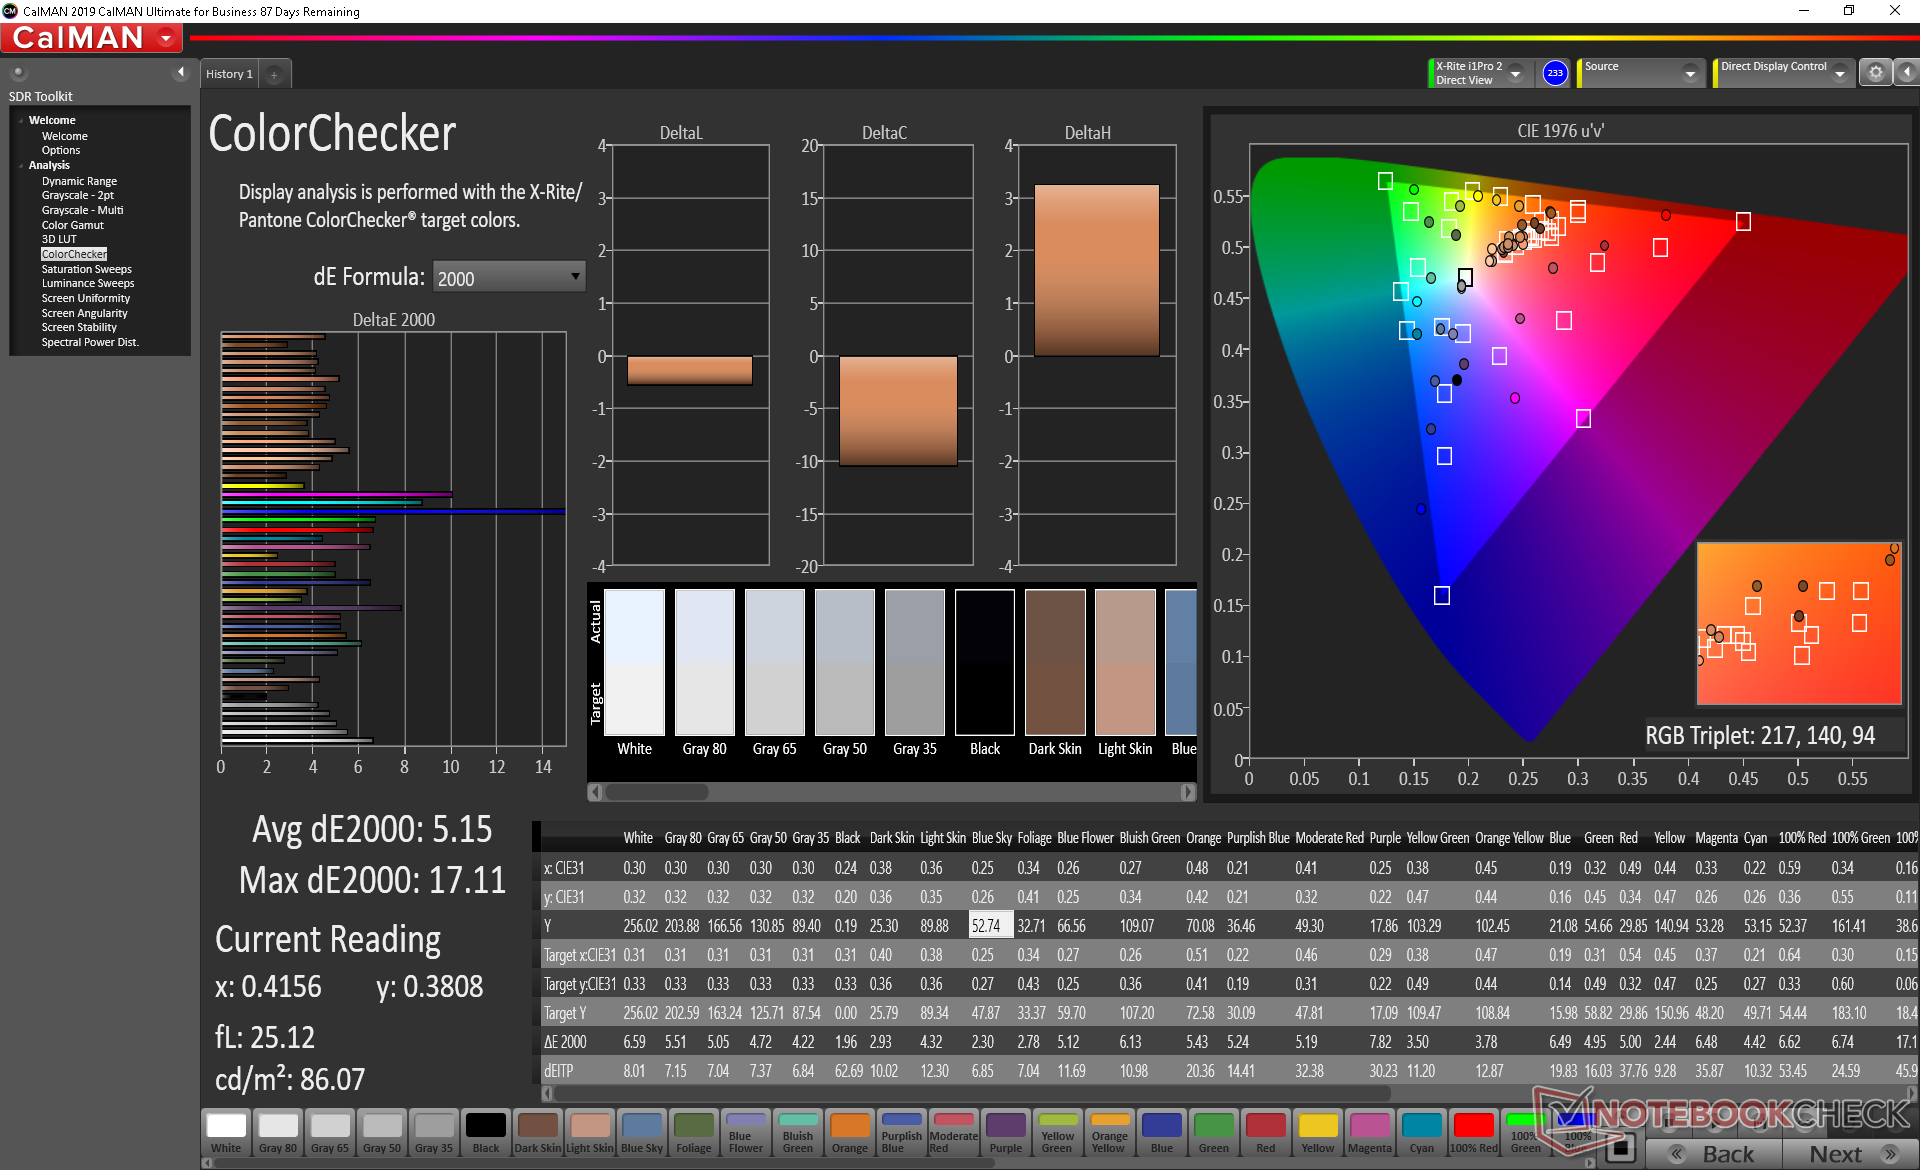
ΔE ColorChecker Calman: 5.15 | ∀{0.5-29.43 Ø4.71}
calibrated: 4.83
ΔE Greyscale Calman: 4.2 | ∀{0.09-98 Ø4.96}
58% sRGB (Argyll 1.6.3 3D)
36.9% AdobeRGB 1998 (Argyll 1.6.3 3D)
40.22% AdobeRGB 1998 (Argyll 3D)
58.5% sRGB (Argyll 3D)
38.9% Display P3 (Argyll 3D)
Gamma: 2.16
CCT: 7500 K
| Asus ROG Zephyrus G15 GA502IU-ES76 Panda LM156LF-2F01, IPS, 15.6", 1920x1080 | Asus ROG Zephyrus Duo 15 GX550LXS AU Optronics B156ZAN03.1, IPS, 15.6", 3840x2160 | Asus ROG Zephyrus G15 GA502DU Panda LM156LF-CL03, IPS, 15.6", 1920x1080 | Razer Blade 15 RTX 2070 Super Max-Q AU Optronics B156HAN12.0, IPS, 15.6", 1920x1080 | Lenovo Legion 5 15IMH05H BOE CQ NV156FHM-NX1, IPS, 15.6", 1920x1080 | MSI GS66 Stealth 10SE-045 Sharp LQ156M1JW03, IPS, 15.6", 1920x1080 | Eluktronics RP-15 BOE NV156FHM-N4G, IPS, 15.6", 1920x1080 | |
|---|---|---|---|---|---|---|---|
| Display | 114% | 4% | 74% | -0% | 71% | 61% | |
| Display P3 Coverage (%) | 38.9 | 87 124% | 40.33 4% | 69.4 78% | 38.8 0% | 67.5 74% | 63.7 64% |
| sRGB Coverage (%) | 58.5 | 100 71% | 60.6 4% | 98.8 69% | 57.8 -1% | 98.3 68% | 92 57% |
| AdobeRGB 1998 Coverage (%) | 40.22 | 99.9 148% | 41.69 4% | 70.5 75% | 40.09 0% | 68.9 71% | 65.2 62% |
| Response Times | -63% | -24% | 78% | 14% | 55% | 45% | |
| Response Time Grey 50% / Grey 80% * (ms) | 24.4 ? | 56.4 ? -131% | 34 ? -39% | 3.2 ? 87% | 26 ? -7% | 12 ? 51% | 17.2 ? 30% |
| Response Time Black / White * (ms) | 25.6 ? | 24.4 ? 5% | 28 ? -9% | 8 ? 69% | 17 ? 34% | 10.4 ? 59% | 10.4 ? 59% |
| PWM Frequency (Hz) | 21280 ? | 23580 ? | |||||
| Screen | 57% | -4% | 30% | 6% | 28% | 13% | |
| Brightness middle (cd/m²) | 255.9 | 398 56% | 240.1 -6% | 345.4 35% | 301 18% | 272 6% | 298.6 17% |
| Brightness (cd/m²) | 246 | 385 57% | 231 -6% | 342 39% | 277 13% | 259 5% | 289 17% |
| Brightness Distribution (%) | 89 | 90 1% | 85 -4% | 90 1% | 77 -13% | 91 2% | 90 1% |
| Black Level * (cd/m²) | 0.22 | 0.28 -27% | 0.34 -55% | 0.34 -55% | 0.26 -18% | 0.27 -23% | 0.35 -59% |
| Contrast (:1) | 1163 | 1421 22% | 706 -39% | 1016 -13% | 1158 0% | 1007 -13% | 853 -27% |
| Colorchecker dE 2000 * | 5.15 | 1.53 70% | 4.2 18% | 3.18 38% | 5.12 1% | 2.42 53% | 5.01 3% |
| Colorchecker dE 2000 max. * | 17.11 | 3.69 78% | 17.8 -4% | 6.57 62% | 8.86 48% | 6.93 59% | 7.06 59% |
| Colorchecker dE 2000 calibrated * | 4.83 | 0.77 84% | 4.09 15% | 1.77 63% | 4.88 -1% | 0.88 82% | 2.52 48% |
| Greyscale dE 2000 * | 4.2 | 2.4 43% | 2.8 33% | 3.8 10% | 3.47 17% | 4.5 -7% | 5.4 -29% |
| Gamma | 2.16 102% | 2.19 100% | 2.2 100% | 2.15 102% | 2.37 93% | 2.188 101% | 2.54 87% |
| CCT | 7500 87% | 6996 93% | 6925 94% | 7109 91% | 7062 92% | 7369 88% | 7461 87% |
| Color Space (Percent of AdobeRGB 1998) (%) | 36.9 | 100 171% | 38.4 4% | 64.3 74% | 37 0% | 69 87% | 59.1 60% |
| Color Space (Percent of sRGB) (%) | 58 | 100 72% | 60.4 4% | 99 71% | 57 -2% | 91 57% | 91.6 58% |
| Total Average (Program / Settings) | 36% /
53% | -8% /
-5% | 61% /
44% | 7% /
6% | 51% /
39% | 40% /
26% |
* ... smaller is better
Color space is narrow for a gaming laptop at just 58 percent of sRGB or 37 percent of AdobeRGB compared to full sRGB coverage on many mid-range to high-end alternatives like the MSI GS66 or Razer Blade 15.
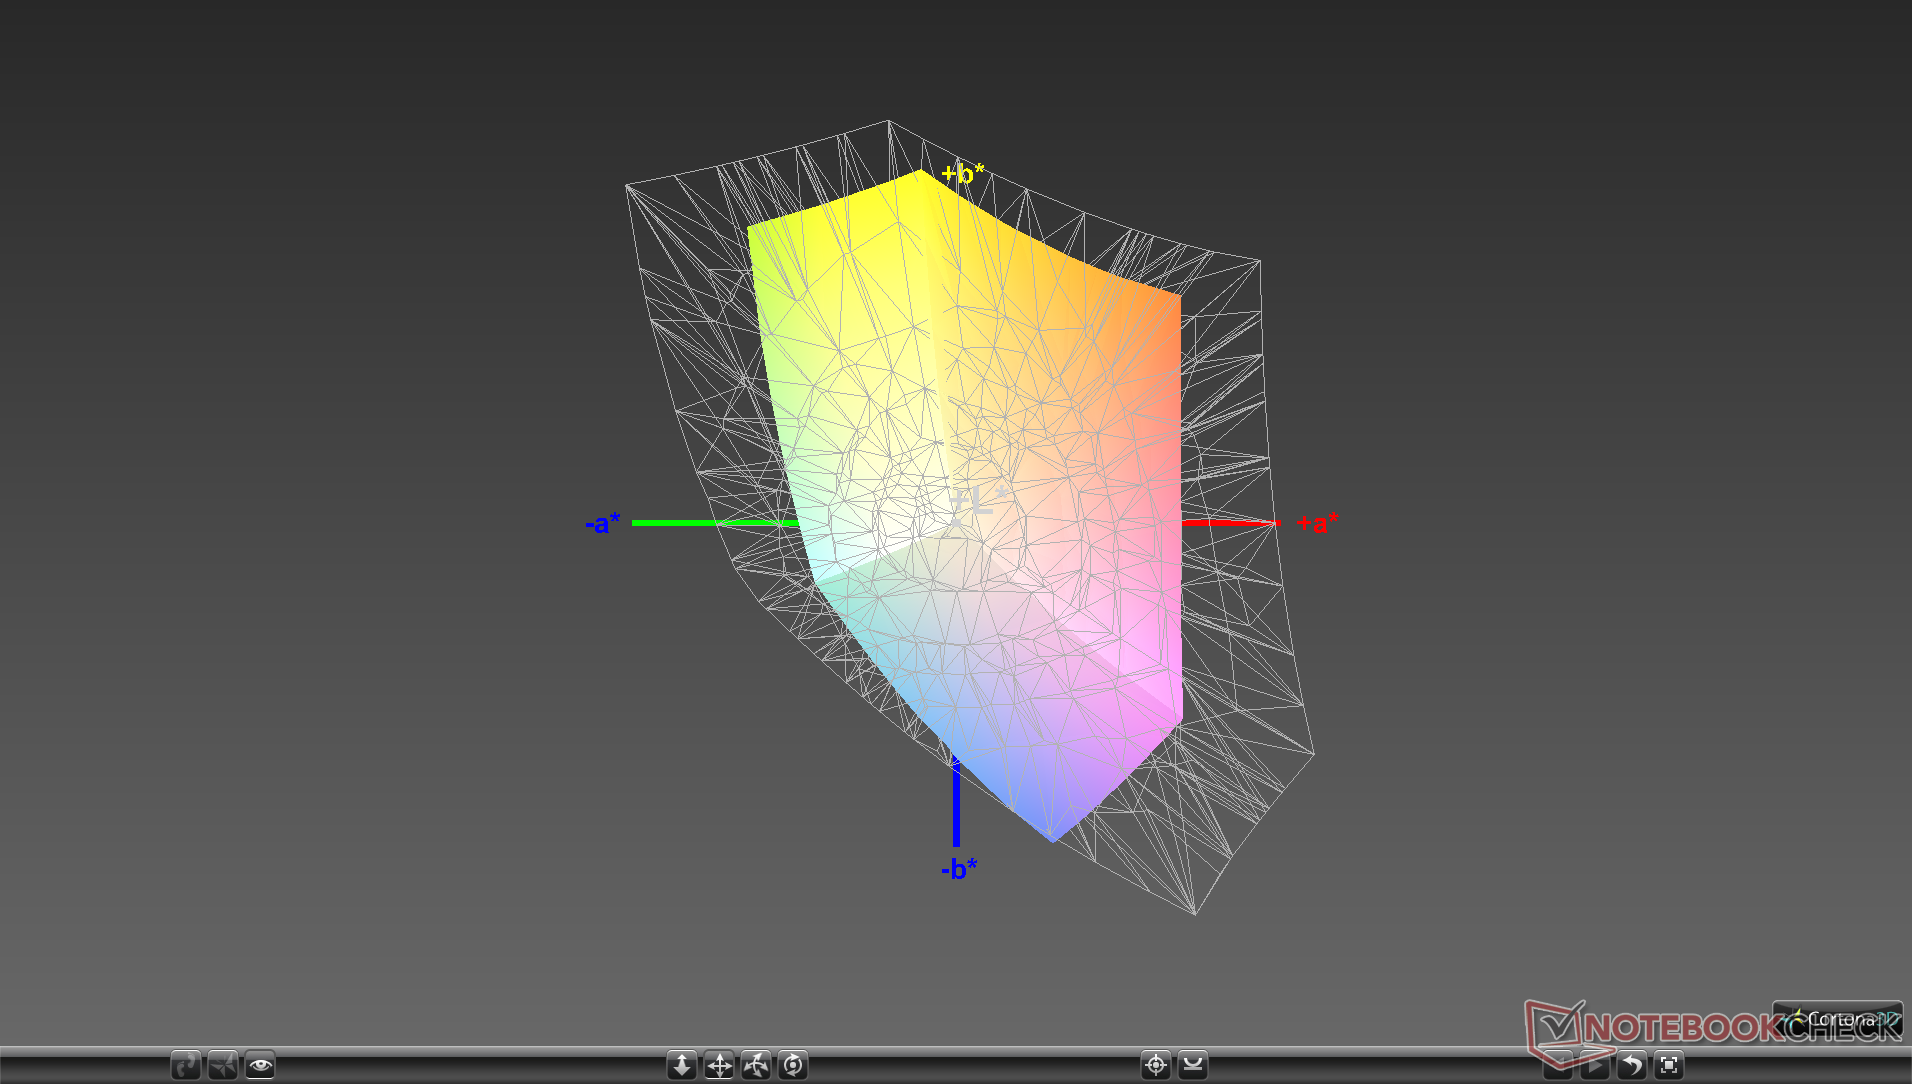
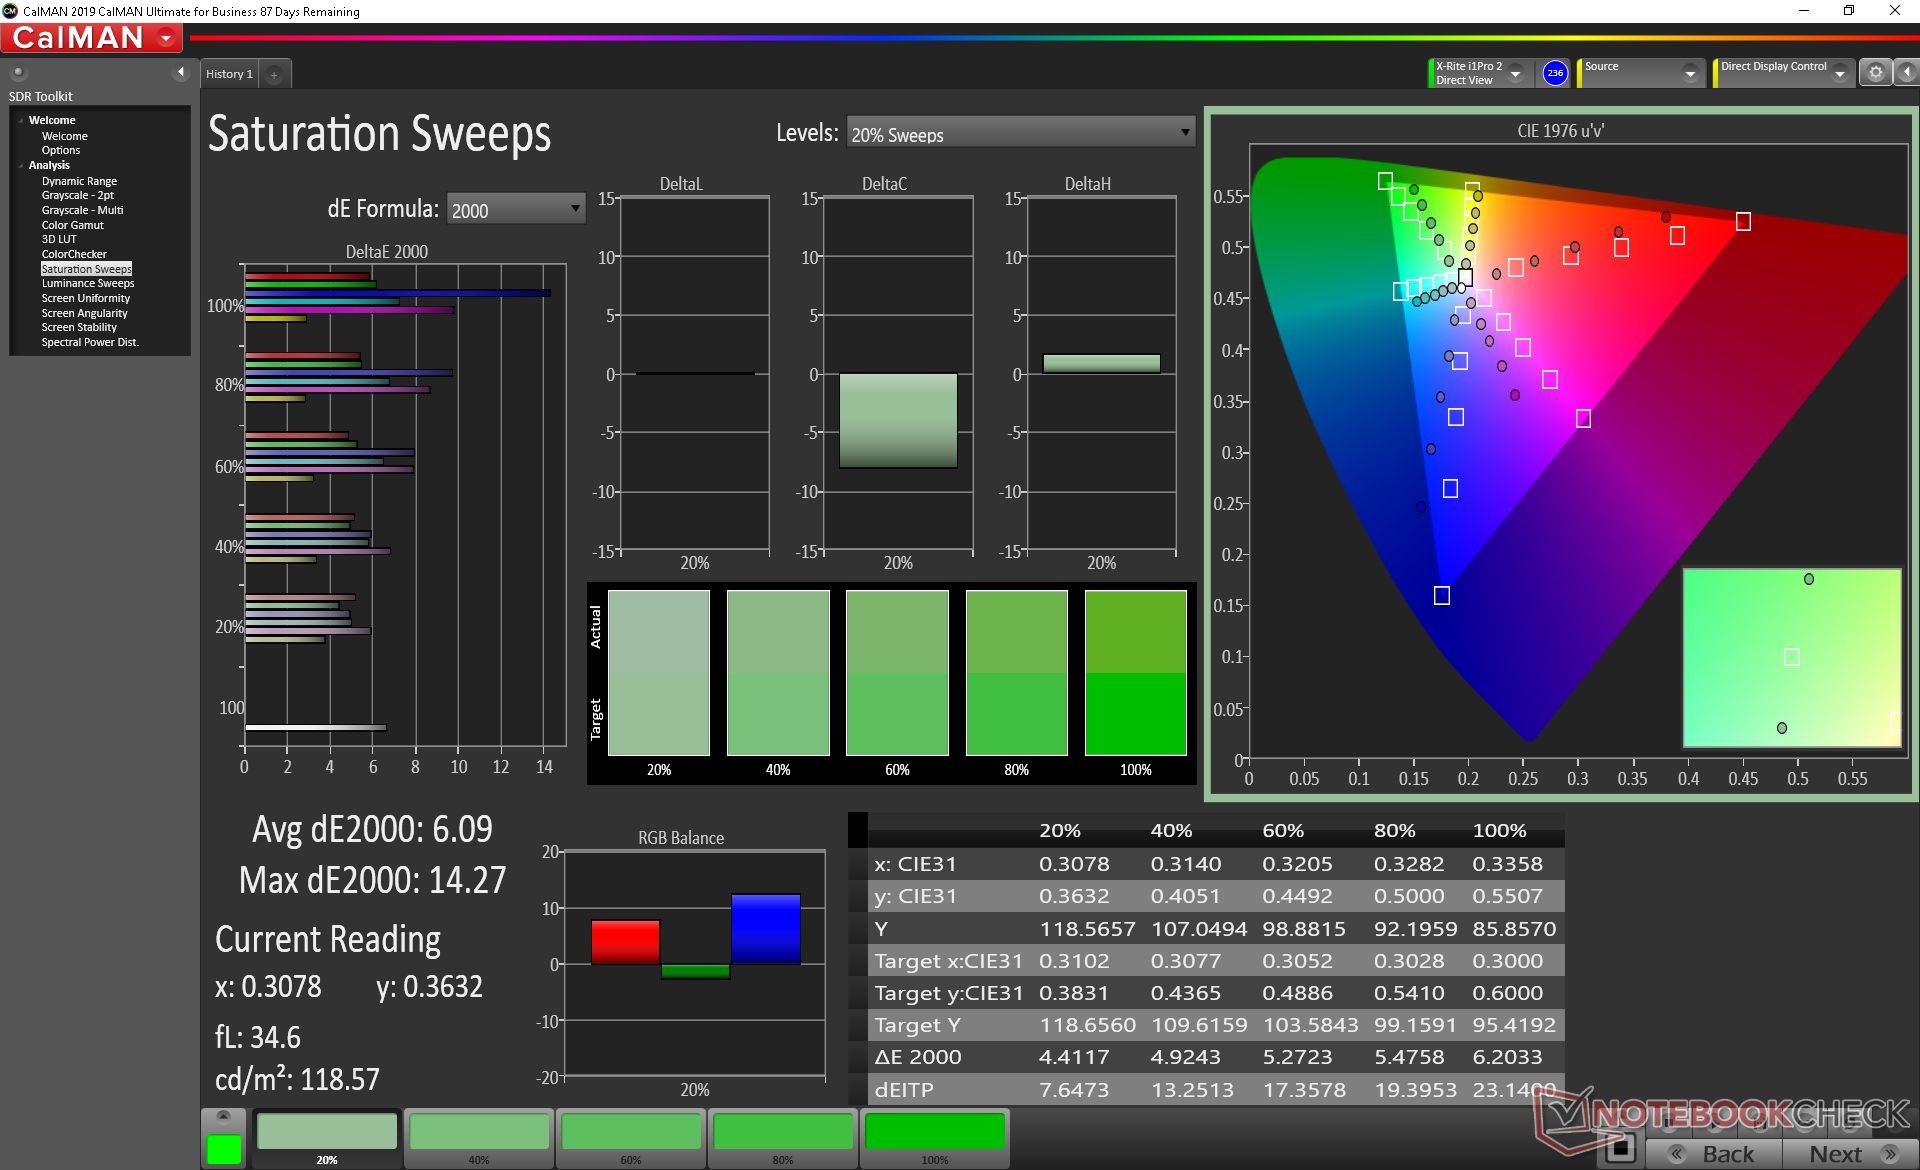
X-Rite measurements show a decently calibrated display out of the box with average grayscale and color DeltaE values of 4.2 and 5.15, respectively. Color temperature, however, is too cool. Calibrating the display ourselves would improve colors and grayscale across the board. Note that colors become increasingly more inaccurate at higher saturation levels even after calibration due to the narrow color space mentioned above.
Display Response Times
| ↔ Response Time Black to White | ||
|---|---|---|
| 25.6 ms ... rise ↗ and fall ↘ combined | ↗ 15.2 ms rise |  |
| ↘ 10.4 ms fall | ||
| The screen shows relatively slow response rates in our tests and may be too slow for gamers. In comparison, all tested devices range from 0.1 (minimum) to 240 (maximum) ms. » 61 % of all devices are better. This means that the measured response time is worse than the average of all tested devices (19.8 ms). | ||
| ↔ Response Time 50% Grey to 80% Grey | ||
| 24.4 ms ... rise ↗ and fall ↘ combined | ↗ 11.6 ms rise | 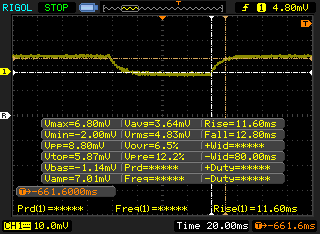 |
| ↘ 12.8 ms fall | ||
| The screen shows good response rates in our tests, but may be too slow for competitive gamers. In comparison, all tested devices range from 0.165 (minimum) to 636 (maximum) ms. » 35 % of all devices are better. This means that the measured response time is better than the average of all tested devices (31 ms). | ||
Screen Flickering / PWM (Pulse-Width Modulation)
| Screen flickering / PWM not detected | 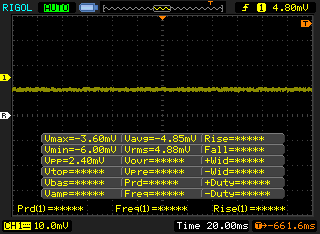 | ||
In comparison: 52 % of all tested devices do not use PWM to dim the display. If PWM was detected, an average of 7757 (minimum: 5 - maximum: 343500) Hz was measured. | |||
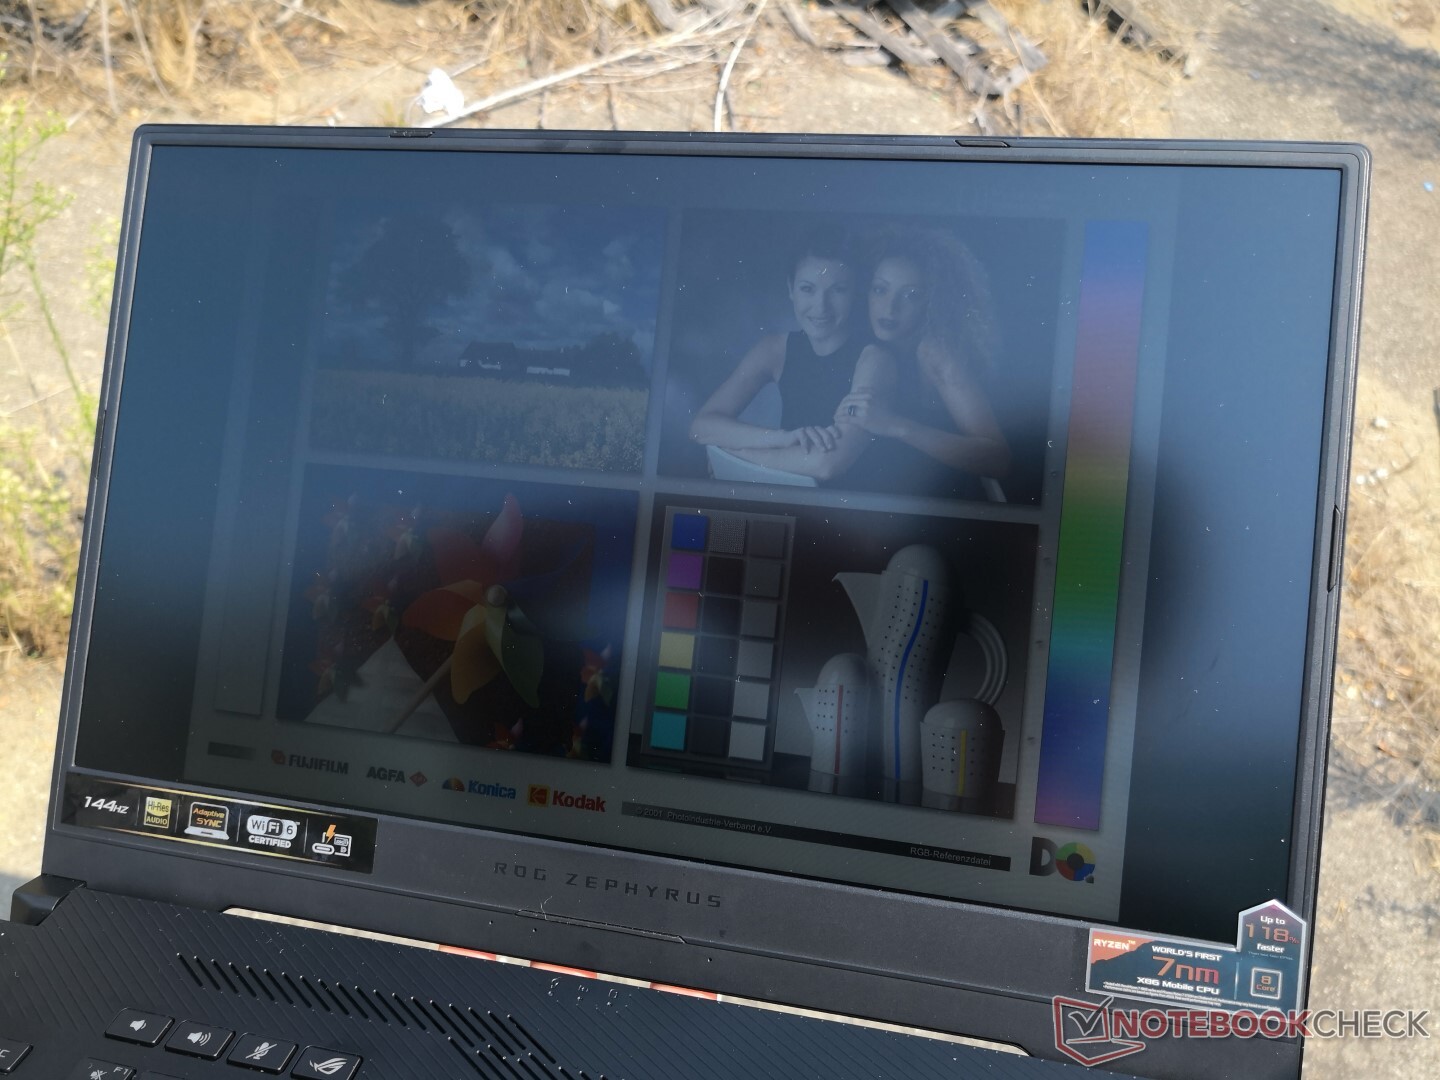
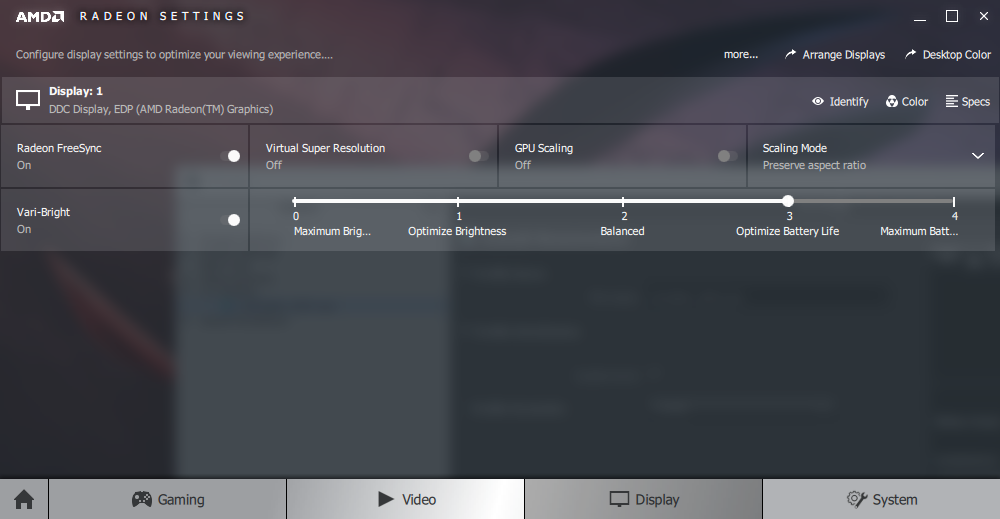
Outdoor visibility is worse than most other 15.6-inch gaming laptops as the maximum display brightness here is only about 250 nits compared to the 300-nit average for the category. Furthermore, users must remember to disable AMD Vari-Bright or else maximum brightness will drop to just 152 nits when running on batteries to impact visibility even more. Dedicated Ultrabooks like the ZenBook Pro 15 or XPS 15 have brighter displays for easier viewing when outdoors.
Performance
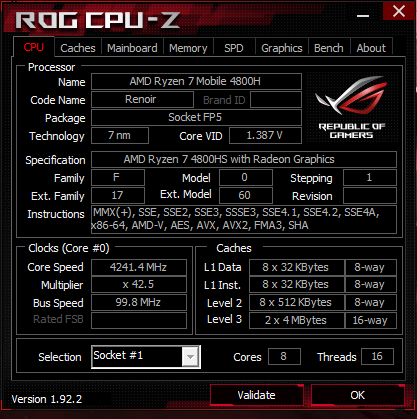
The Asus GA502 series is notable for being one of the first laptops to ship with the 8-core Ryzen 7 4800HS. Unlike the full-power 45 W Ryzen 7 4800H, the 4800HS targets a lower 35 W TDP in order to fit in smaller chassis designs like the GA502. It's still an immense upgrade over the last generation 4-core Ryzen 7 3750H and AMD is still marketing it as a competitor to the popular 8-core Core i9-9880H or i7-10875H.
Graphics options are limited to either the GeForce GTX 1660 Ti Max-Q or RTX 2060. It would have been interesting to see the Radeon RX 5500M or 5600M with AMD SmartShift support instead a la the Dell G5 15 SE, but Nvidia GPUs are arguably "safer" options when it comes to compatibility and drivers. FreeSync comes standard on all SKUs.
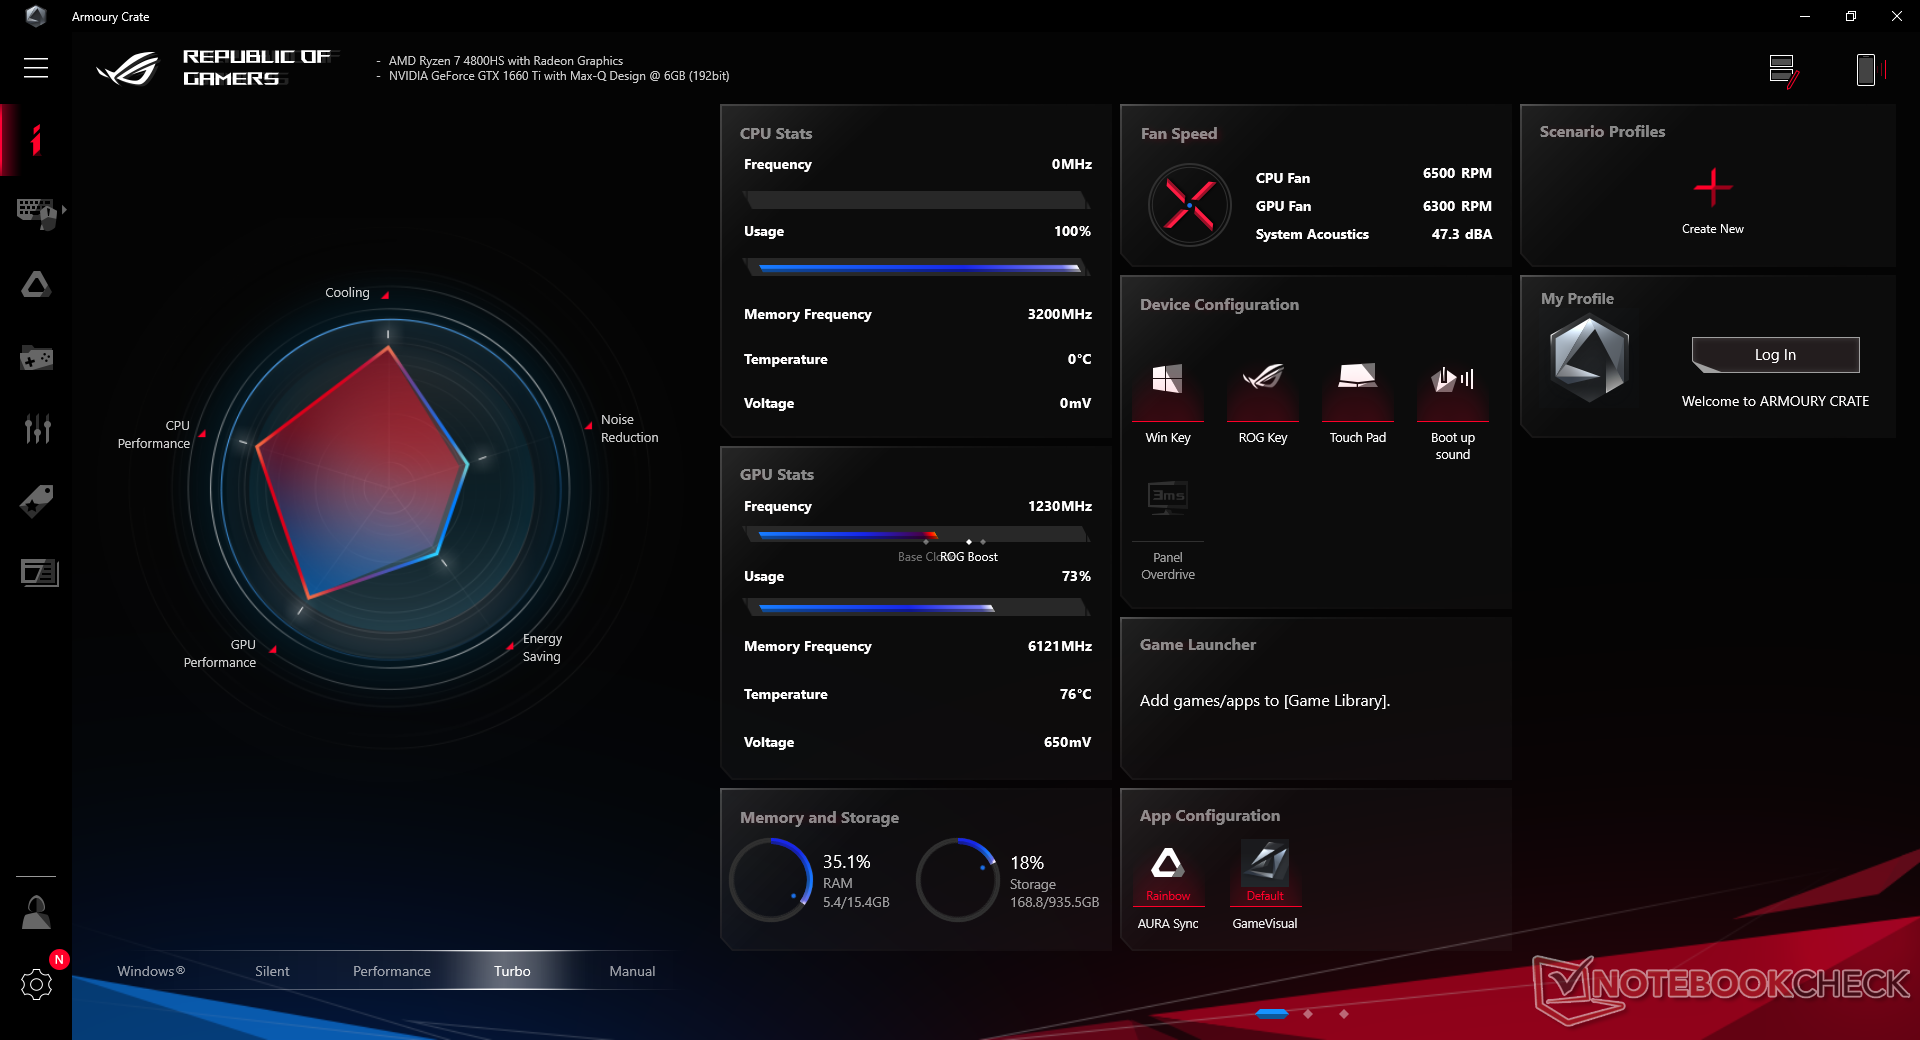
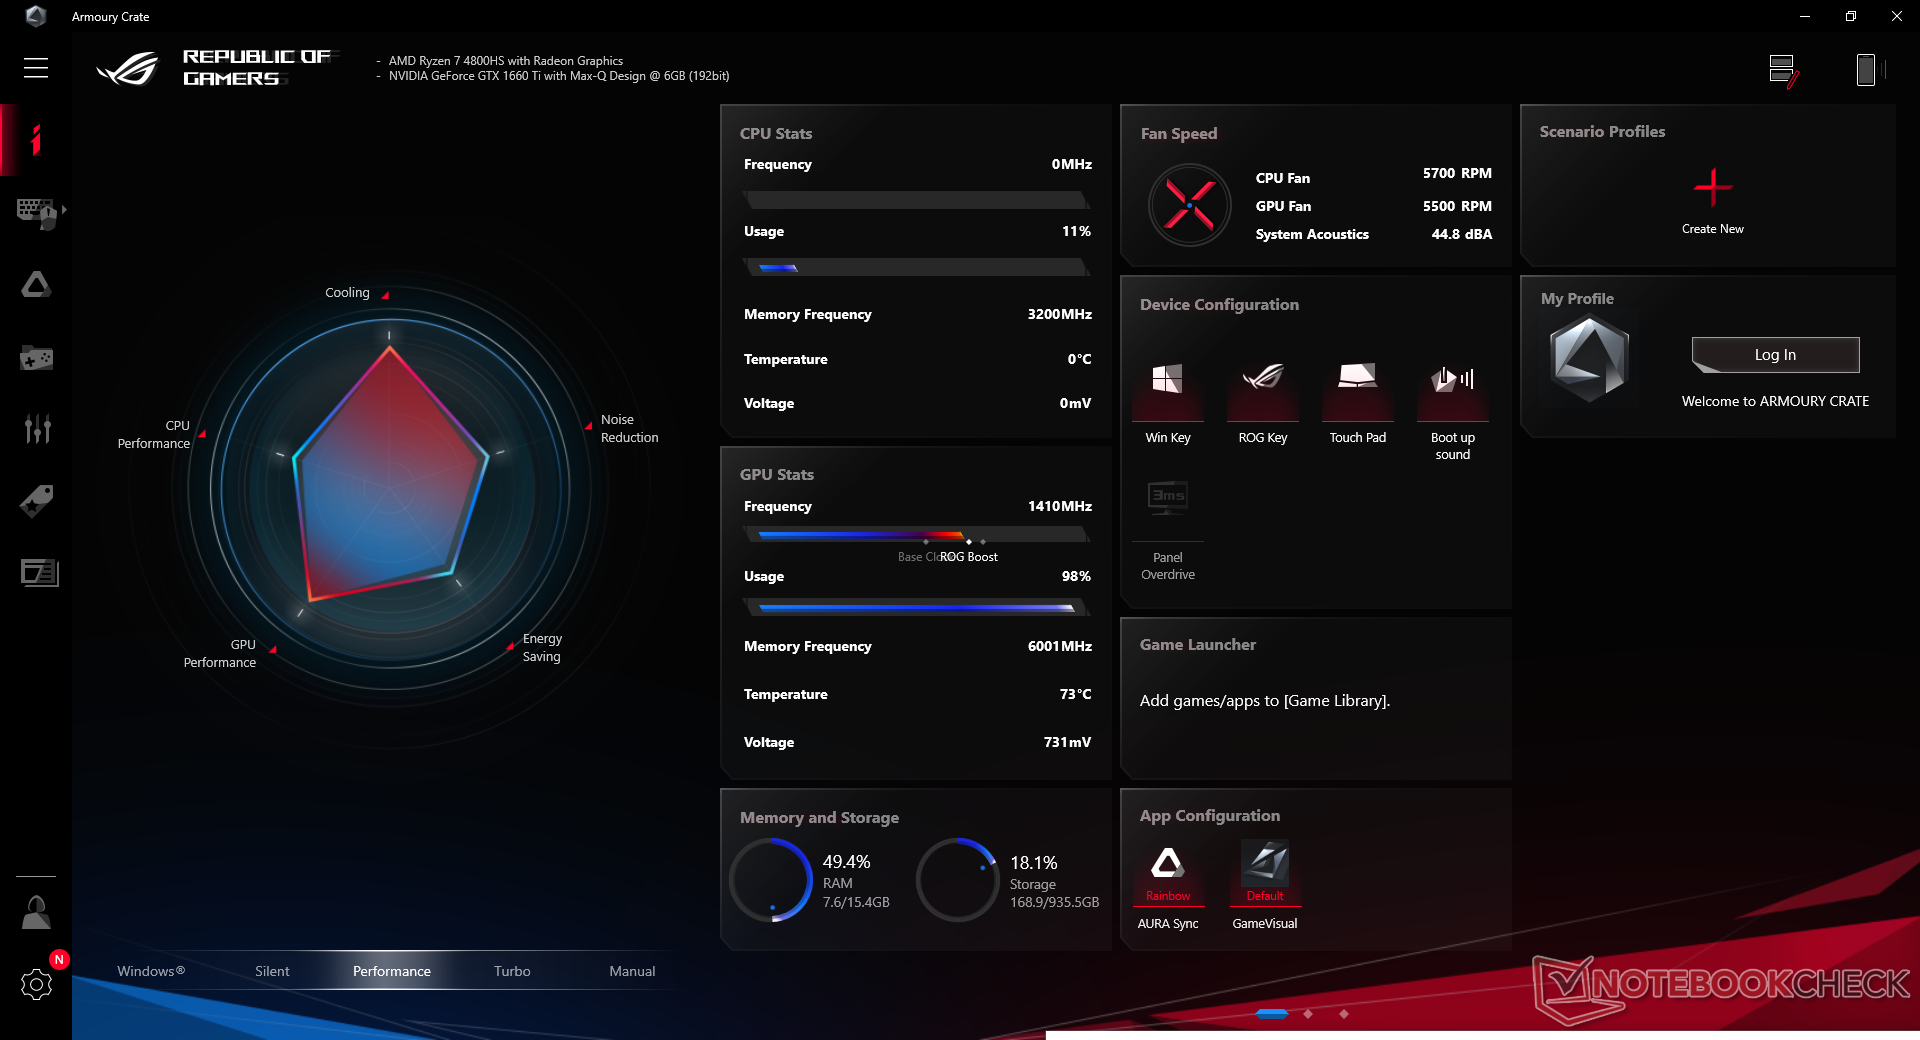
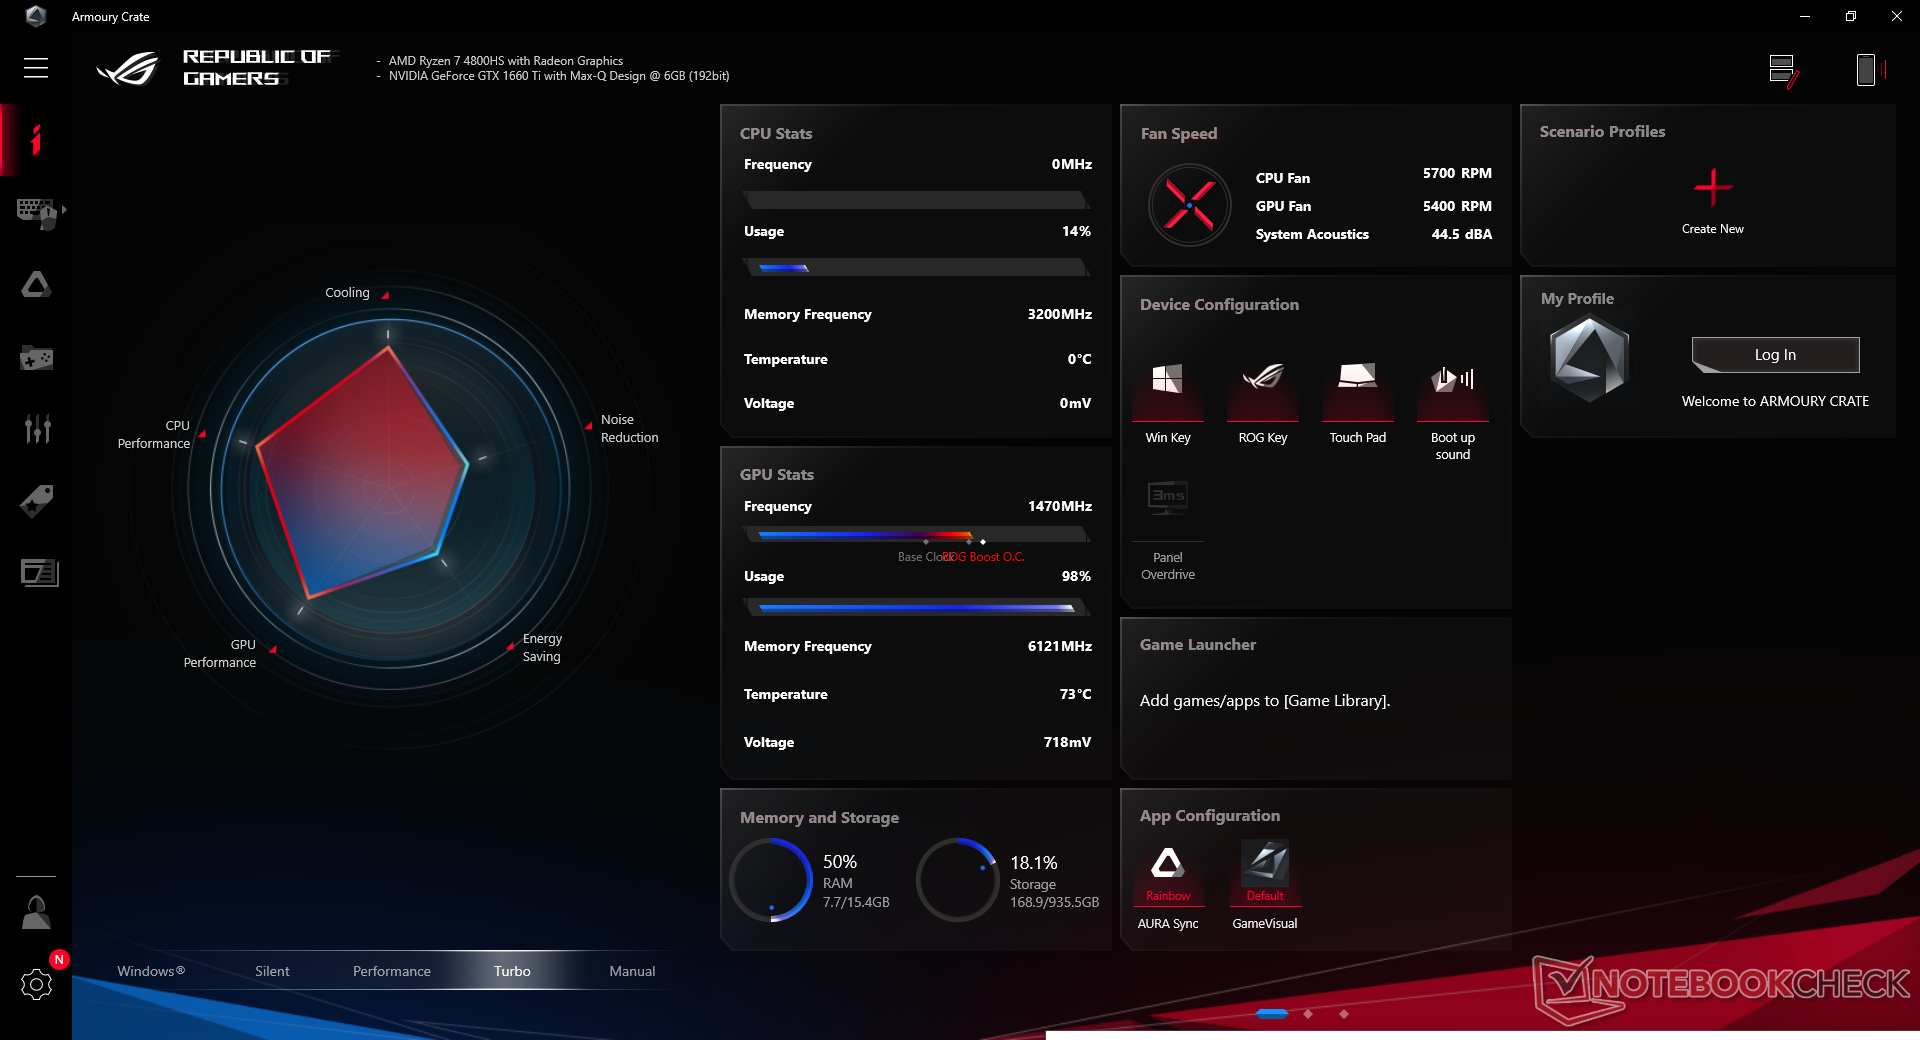
We used Asus' Turbo mode to run all performance benchmarks below for the best possible scores. We suggest becoming familiar with the Asus Armoury Crate software as both fan noise and performance are closely tied to it.
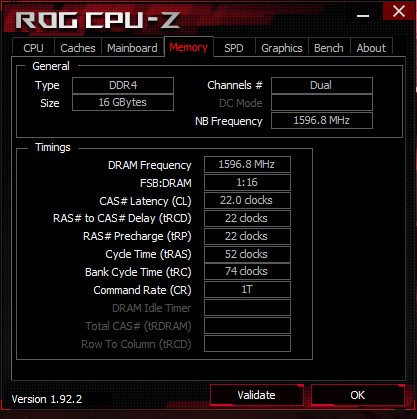
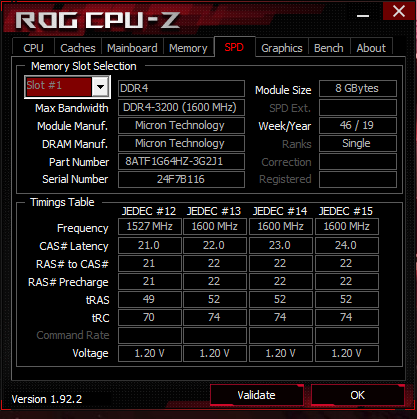
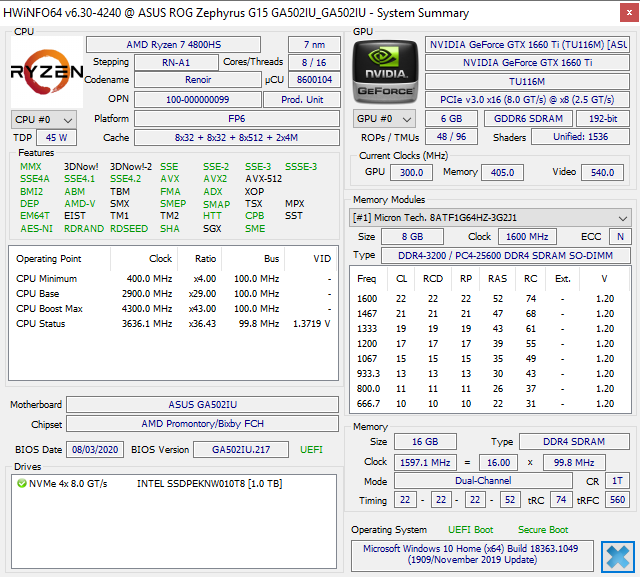
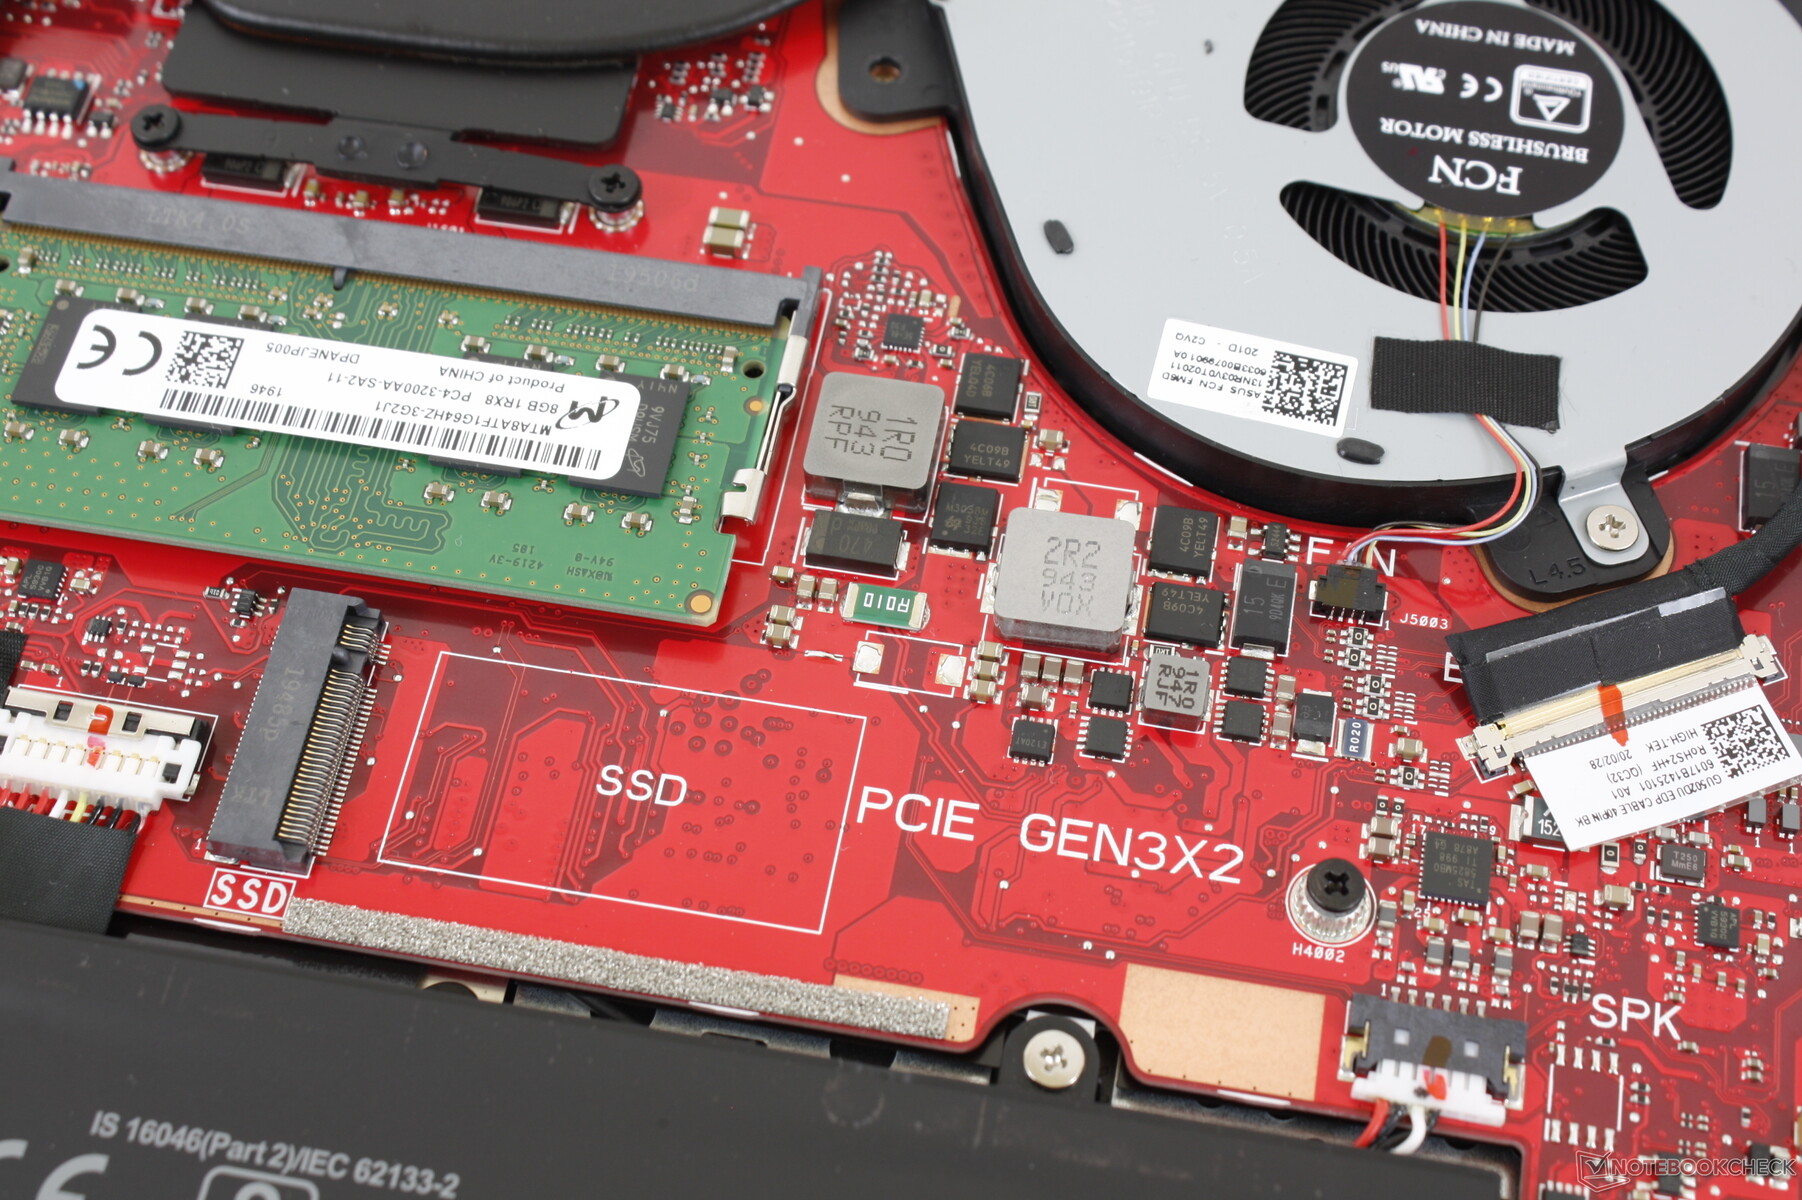
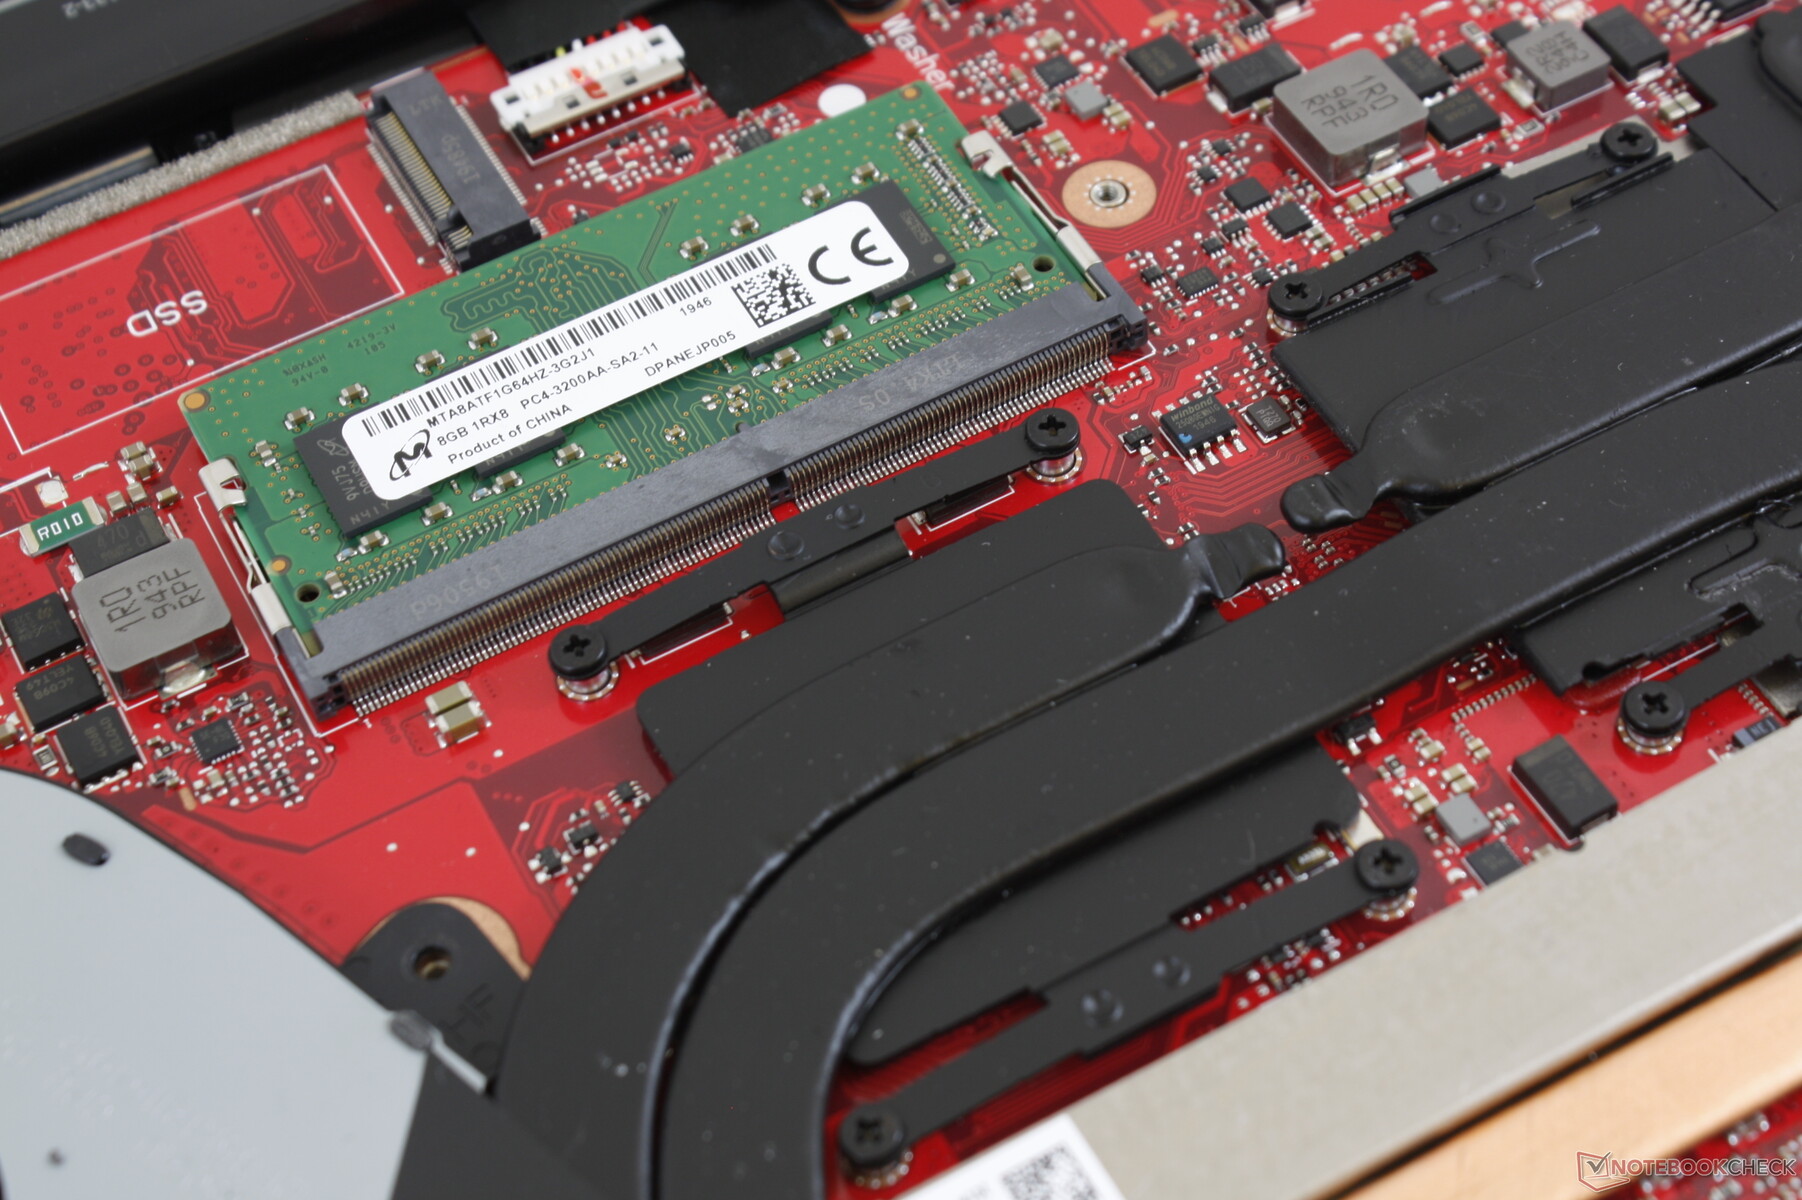
8 GB of RAM is soldered with one SODIMM expansion slot for a total of up to 40 GB.
Processor
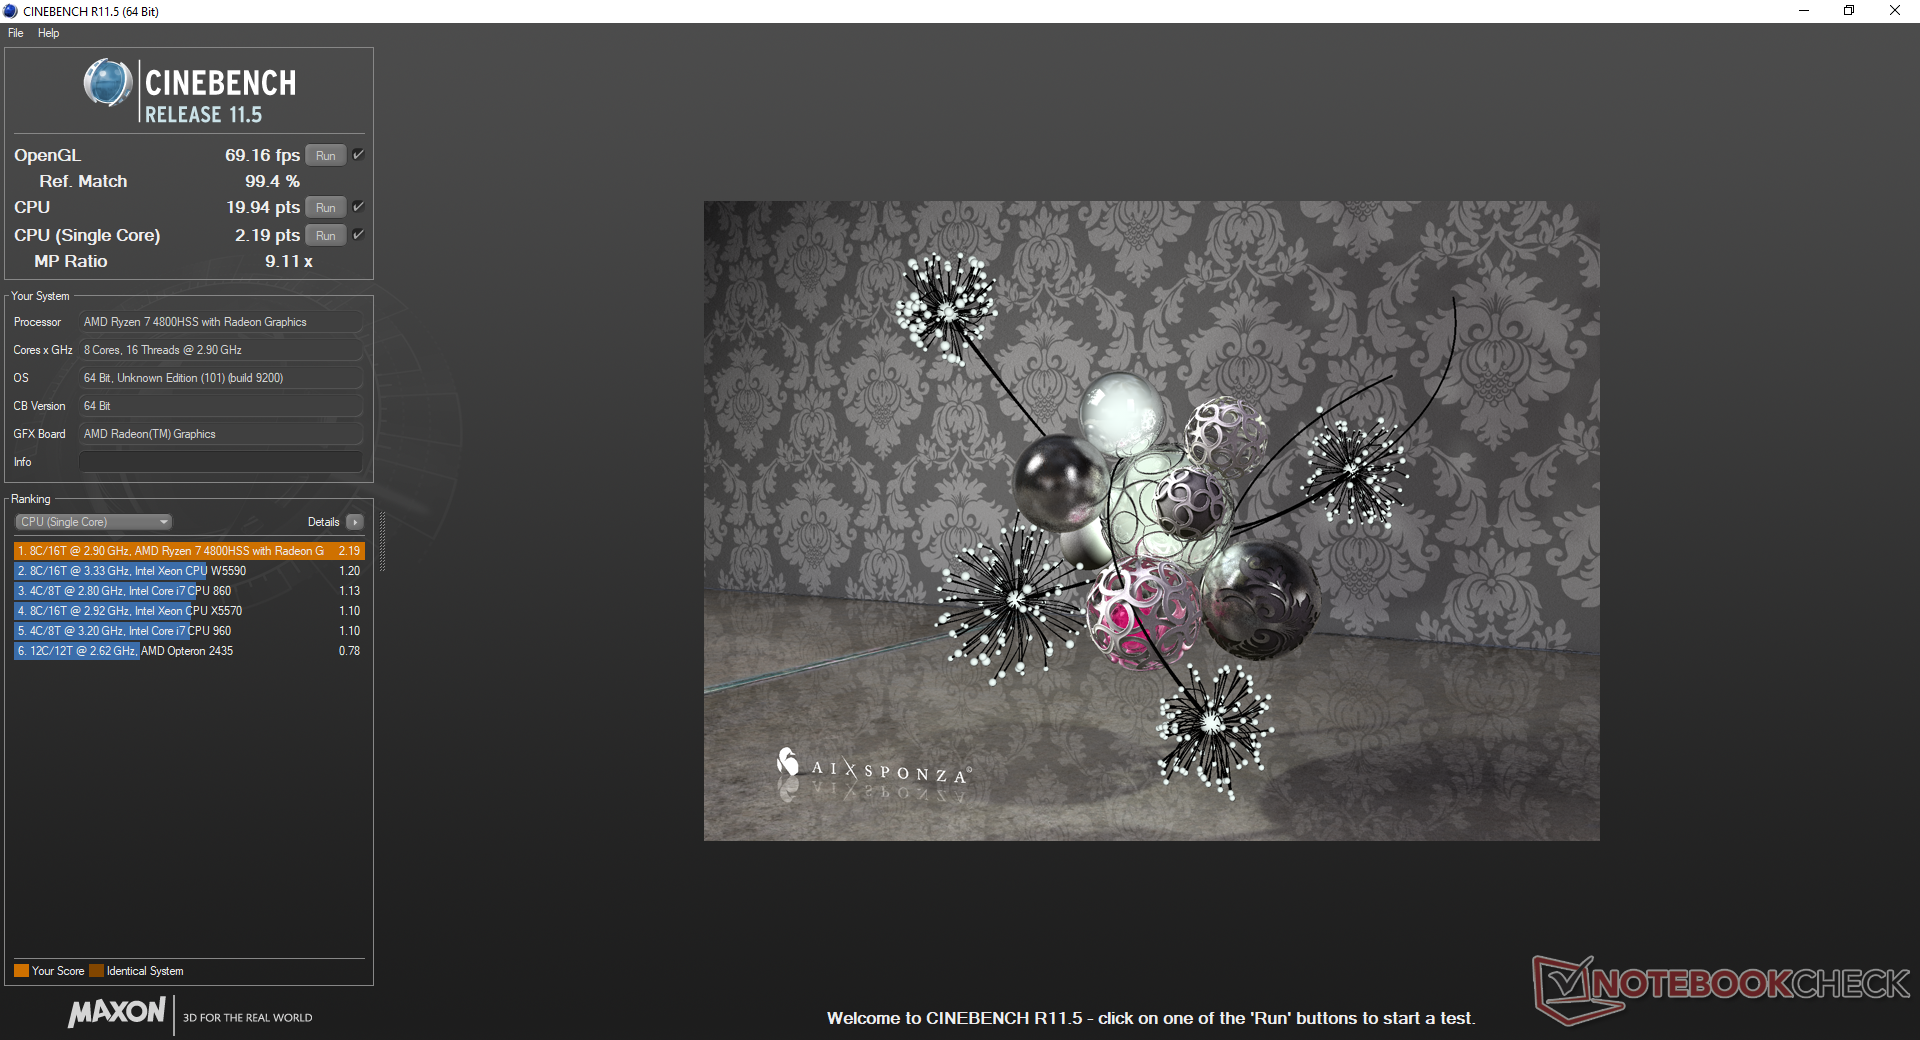
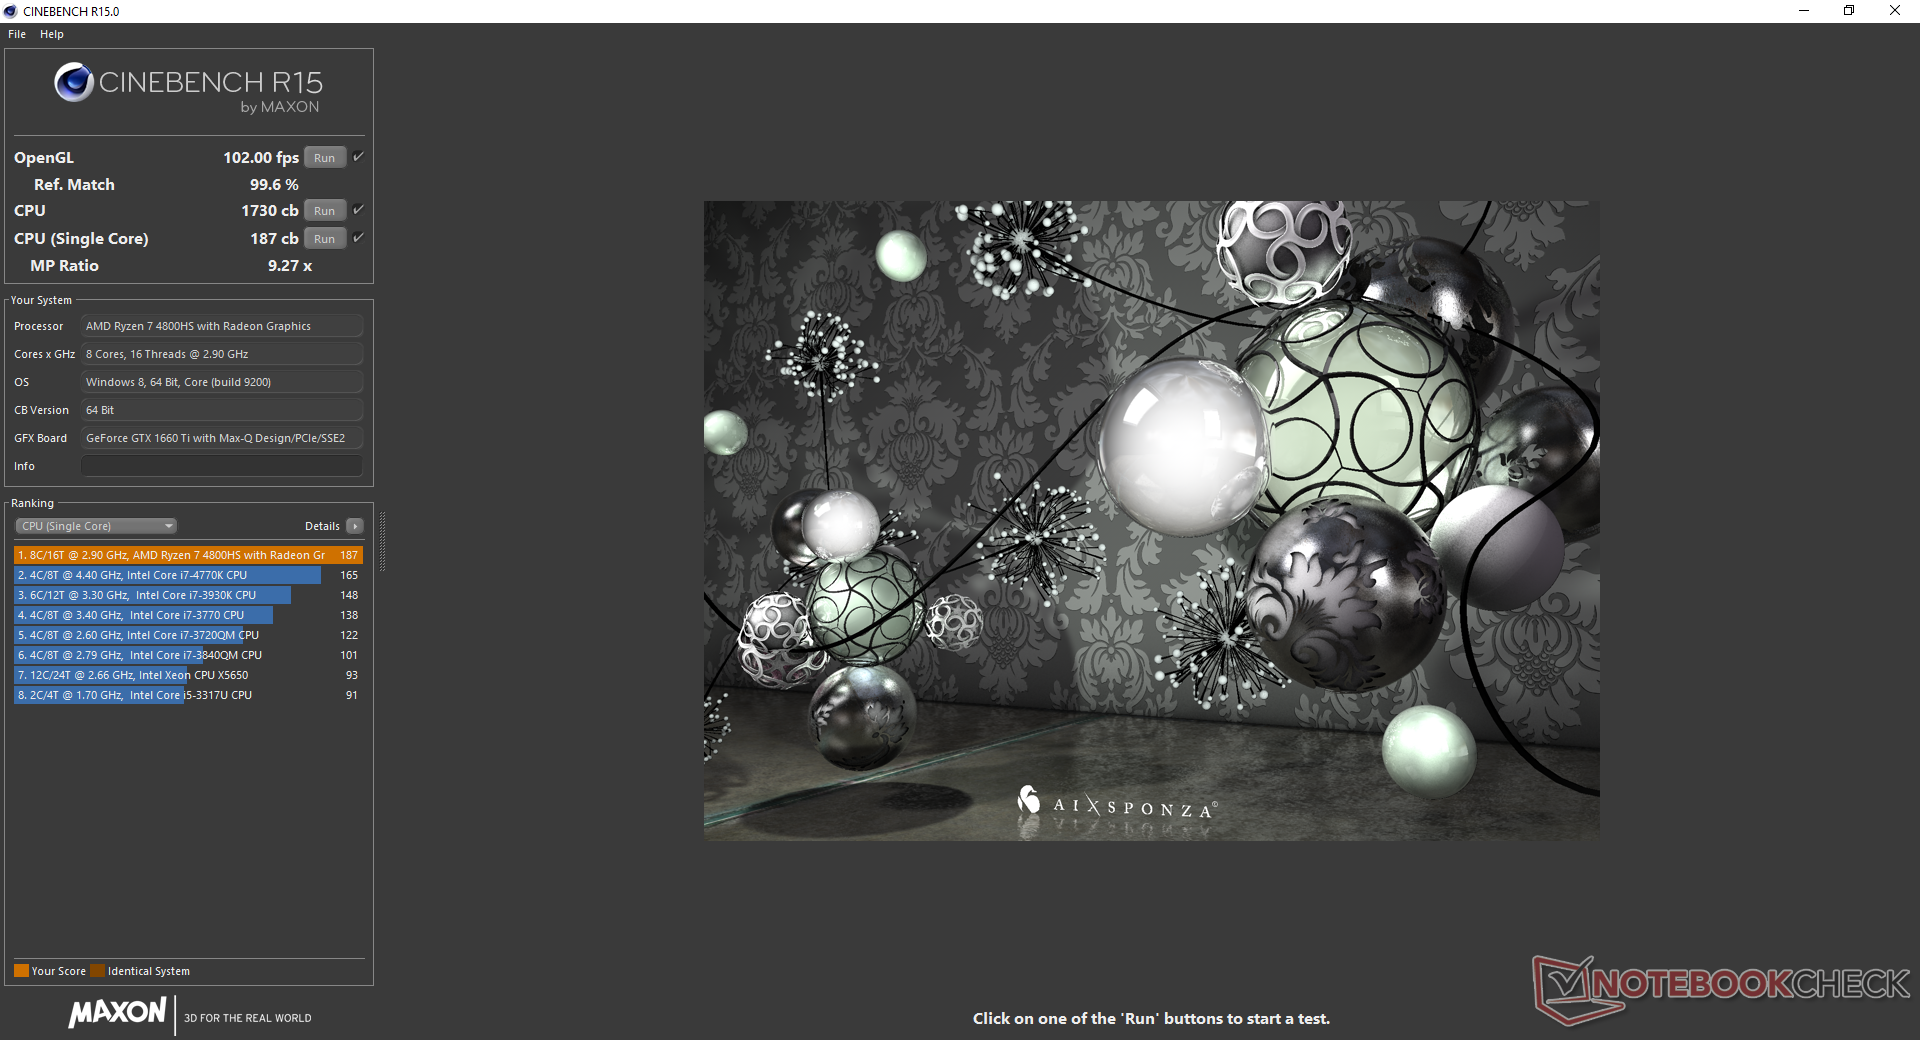
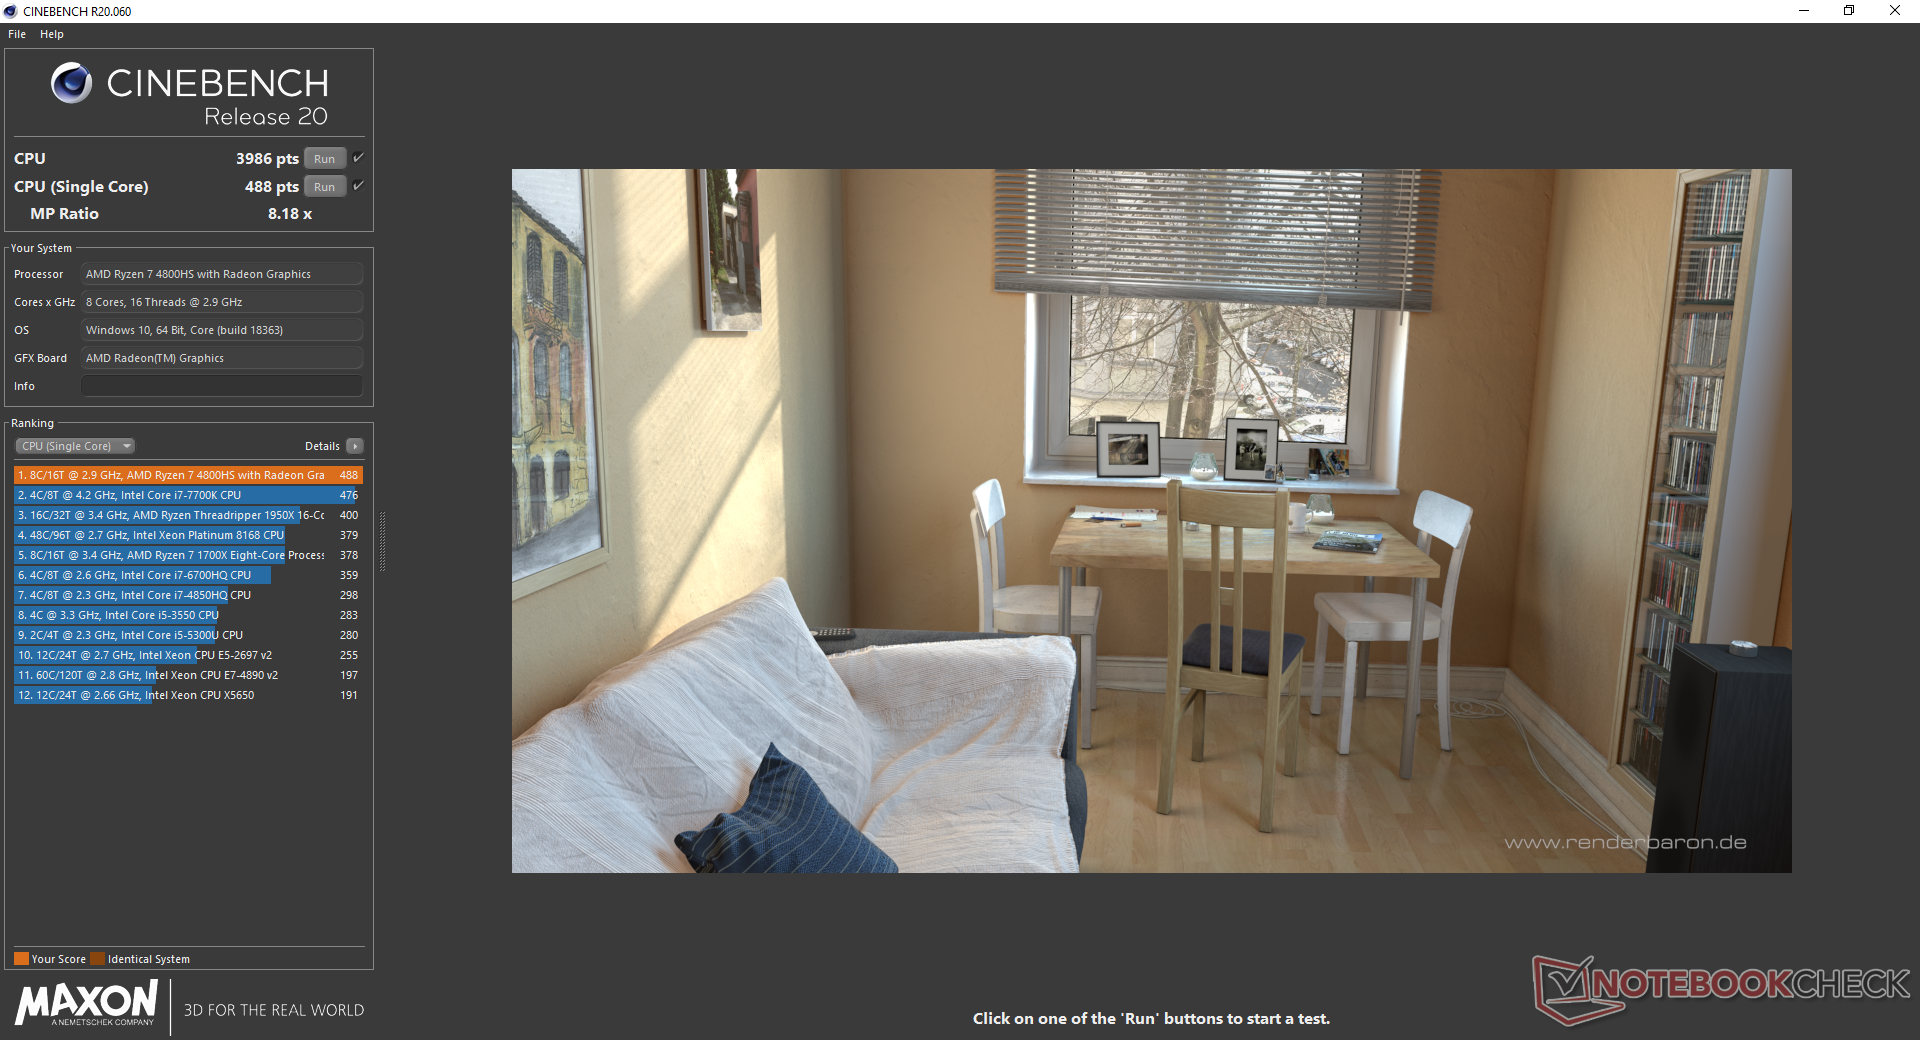
CPU performance is neck-to-neck with the 45 W Core i7-10875H in both single-thread and multi-thread performance even though the Ryzen 7 4800HS is a 35 W part. Performance sustainability is good as well when running CineBench R15 xT in a loop as shown by the graph below. Most notably, the Ryzen 9 4900HS in the Zephyrus G14 is only about 10 percent faster at best even before factoring in any performance throttling.
See our dedicated page on the Ryzen 7 4800HS for more technical information and benchmark comparisons.
Cinebench R15: CPU Multi 64Bit | CPU Single 64Bit
Blender: v2.79 BMW27 CPU
7-Zip 18.03: 7z b 4 -mmt1 | 7z b 4
Geekbench 5.5: Single-Core | Multi-Core
HWBOT x265 Benchmark v2.2: 4k Preset
LibreOffice : 20 Documents To PDF
R Benchmark 2.5: Overall mean
| LibreOffice / 20 Documents To PDF | |
| HP Pavilion Gaming 15-ec1206ng | |
| Alienware m15 R3 P87F | |
| Eluktronics RP-17 | |
| Asus ROG Zephyrus G15 GA502IU-ES76 | |
| MSI GS75 10SF-609US | |
| Alienware m17 R3 P45E | |
| R Benchmark 2.5 / Overall mean | |
| Alienware m15 R3 P87F | |
| HP Pavilion Gaming 15-ec1206ng | |
| MSI GS75 10SF-609US | |
| Eluktronics RP-17 | |
| Asus ROG Zephyrus G15 GA502IU-ES76 | |
| Alienware m17 R3 P45E | |
* ... smaller is better
System Performance
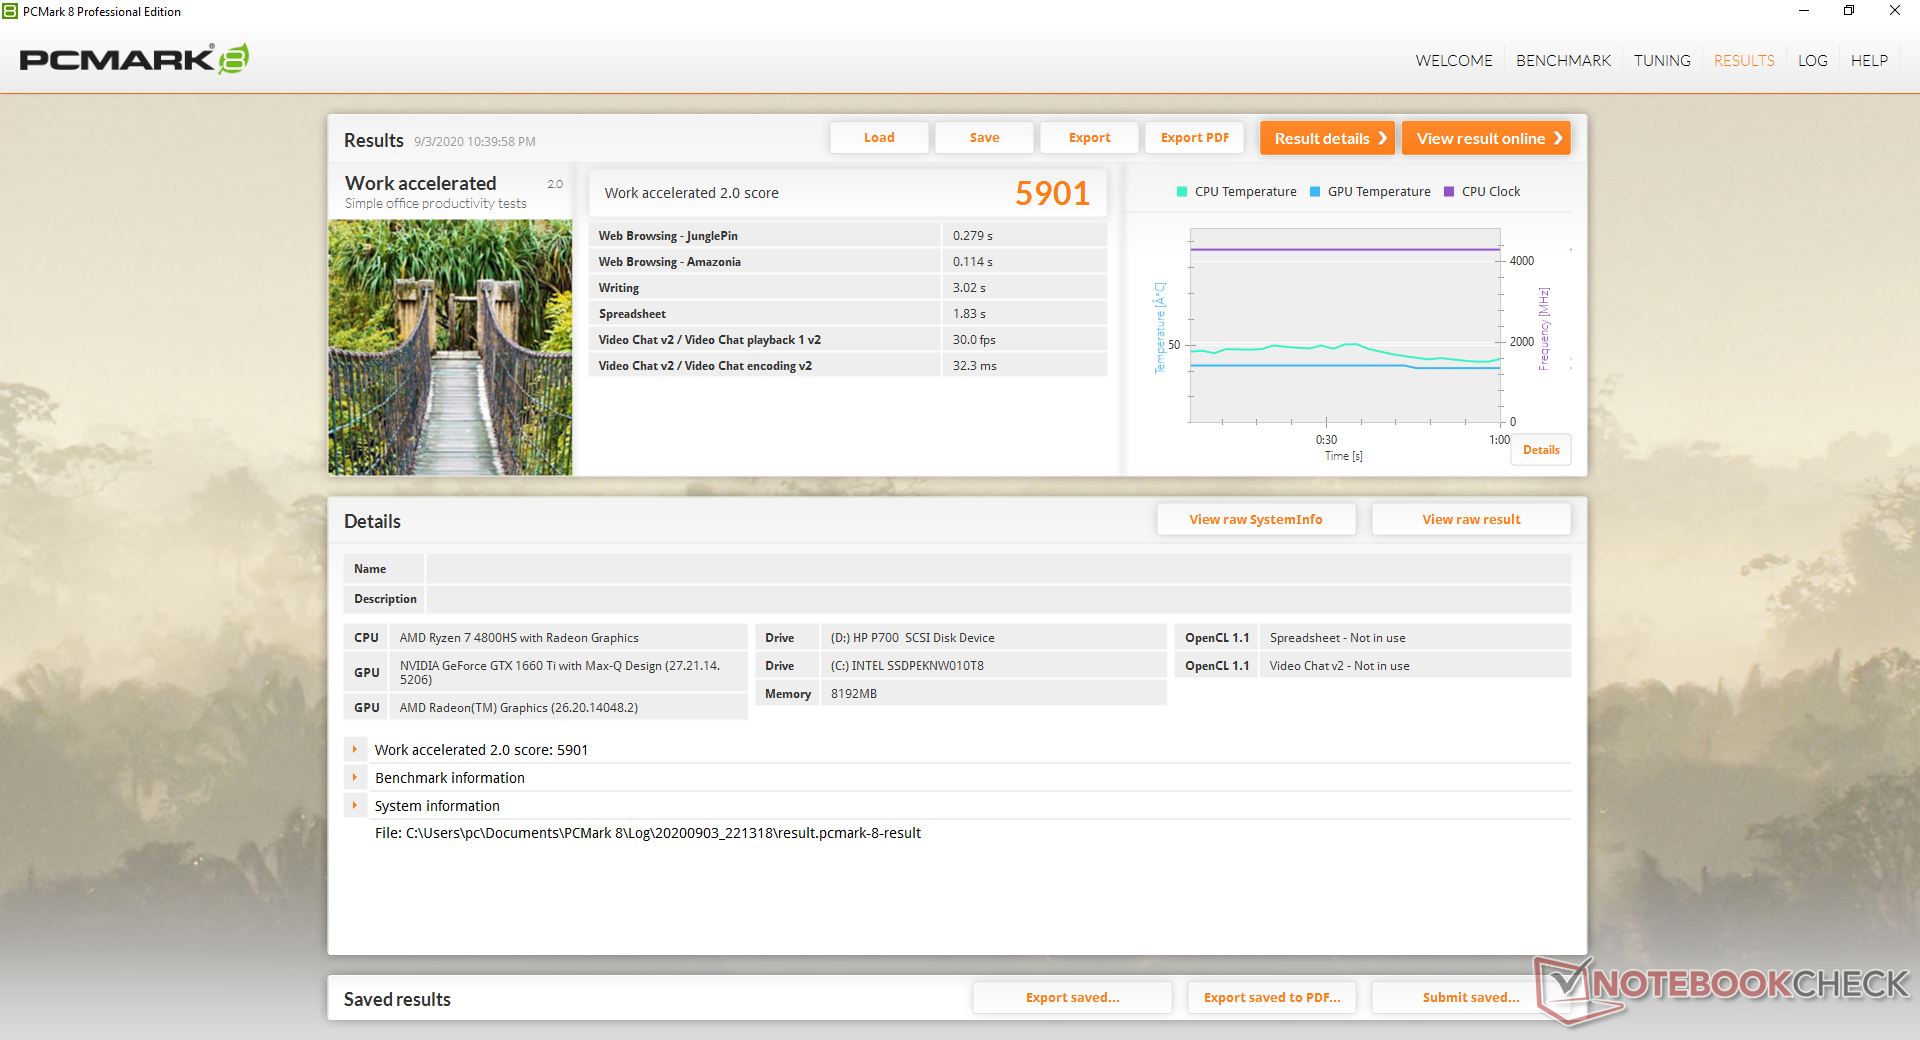
PCMark benchmarks are well above the older GA502DU powered by the last generation Ryzen 7 3750H while being just shy of the Eluktronics RP-15 running on the full-power Ryzen 7 4800H. We experienced no software or hardware issues during our time with the unit even though its Armoury Crate software could use some work.
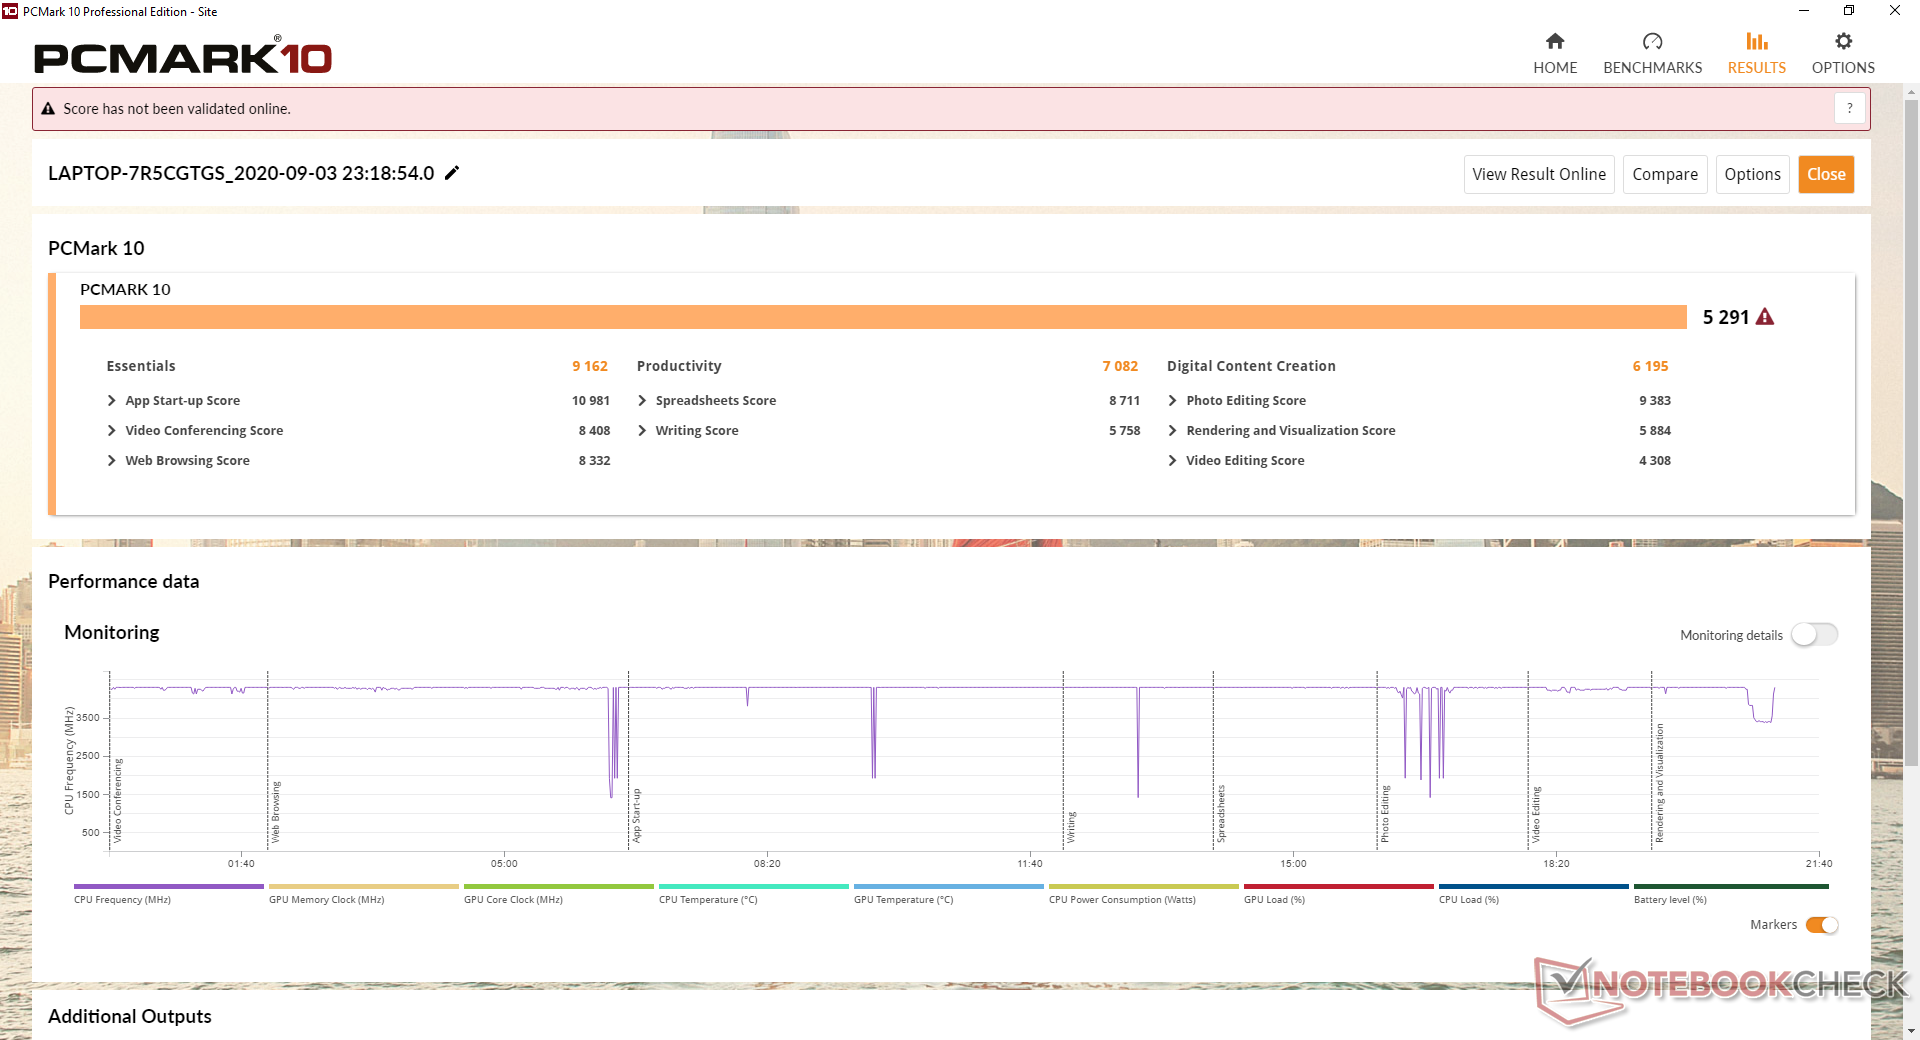
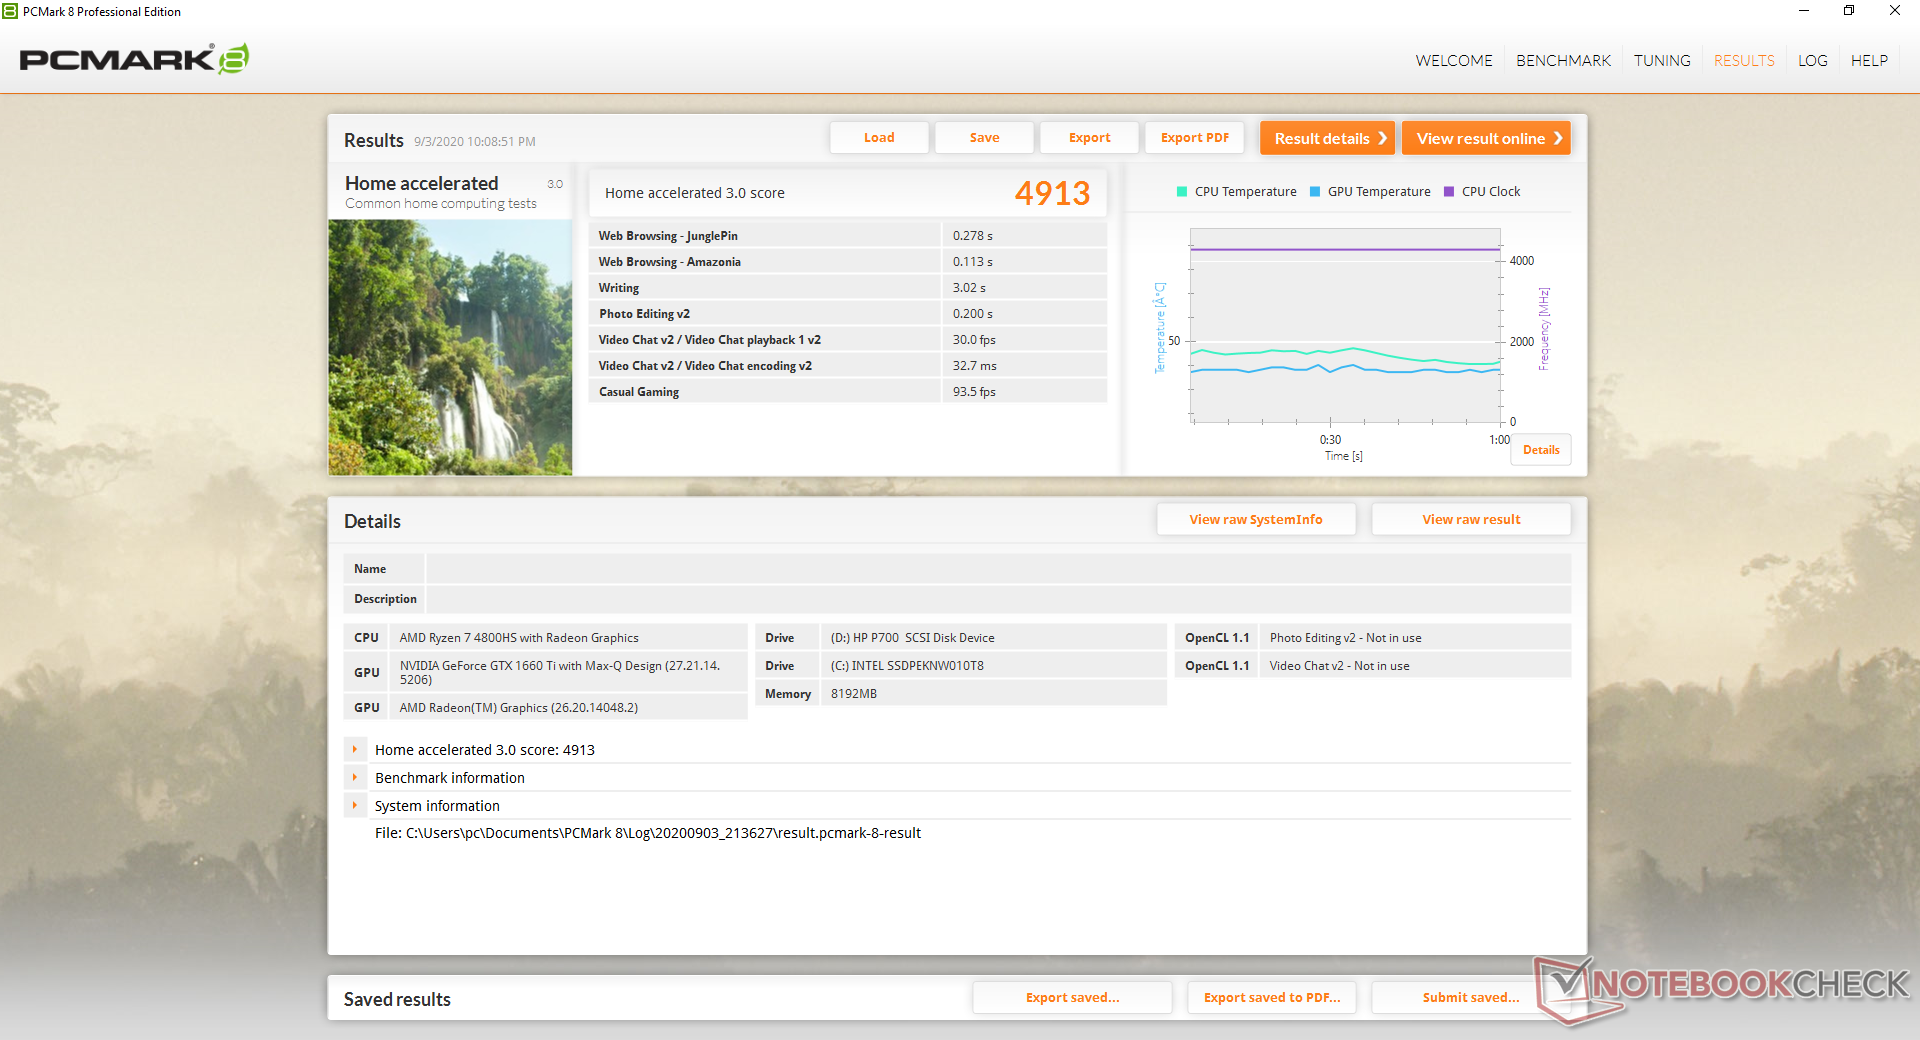
| PCMark 8 Home Score Accelerated v2 | 4913 points | |
| PCMark 8 Work Score Accelerated v2 | 5901 points | |
| PCMark 10 Score | 5291 points | |
Help | ||
DPC Latency
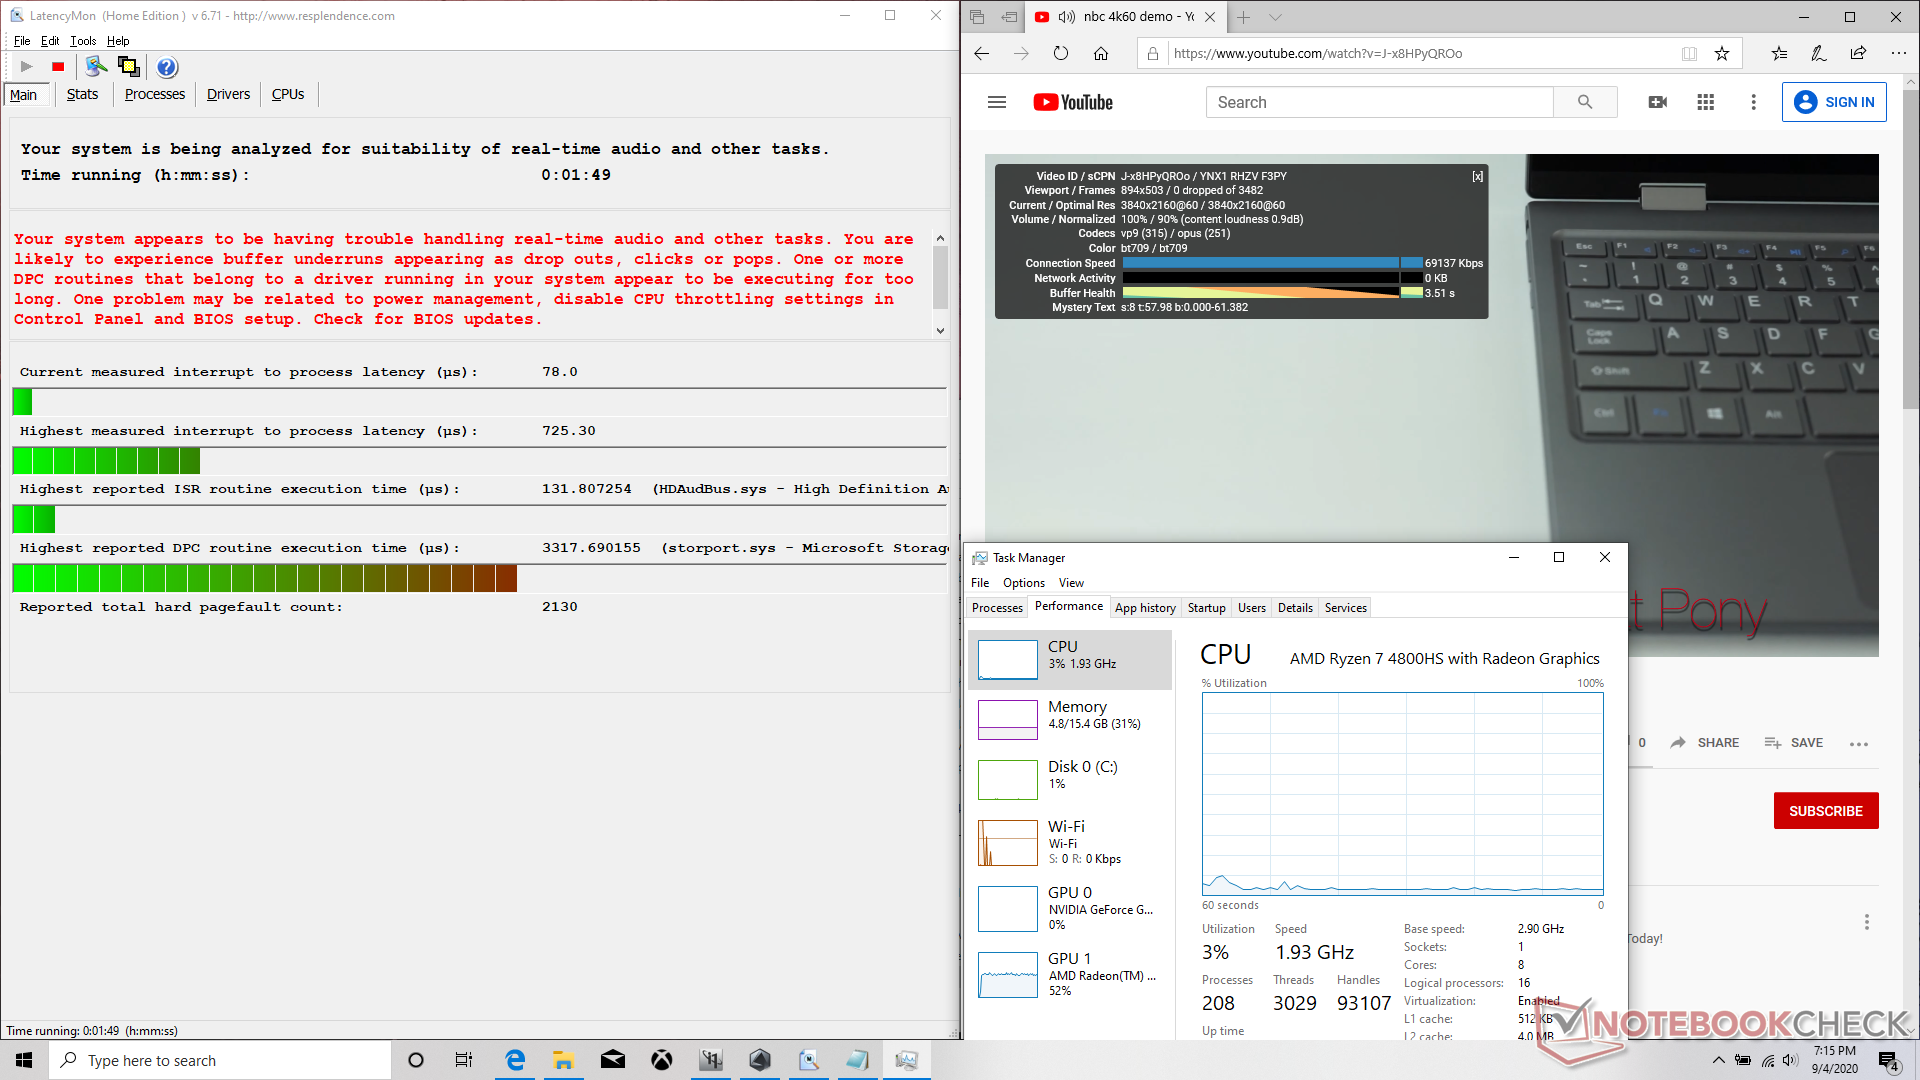
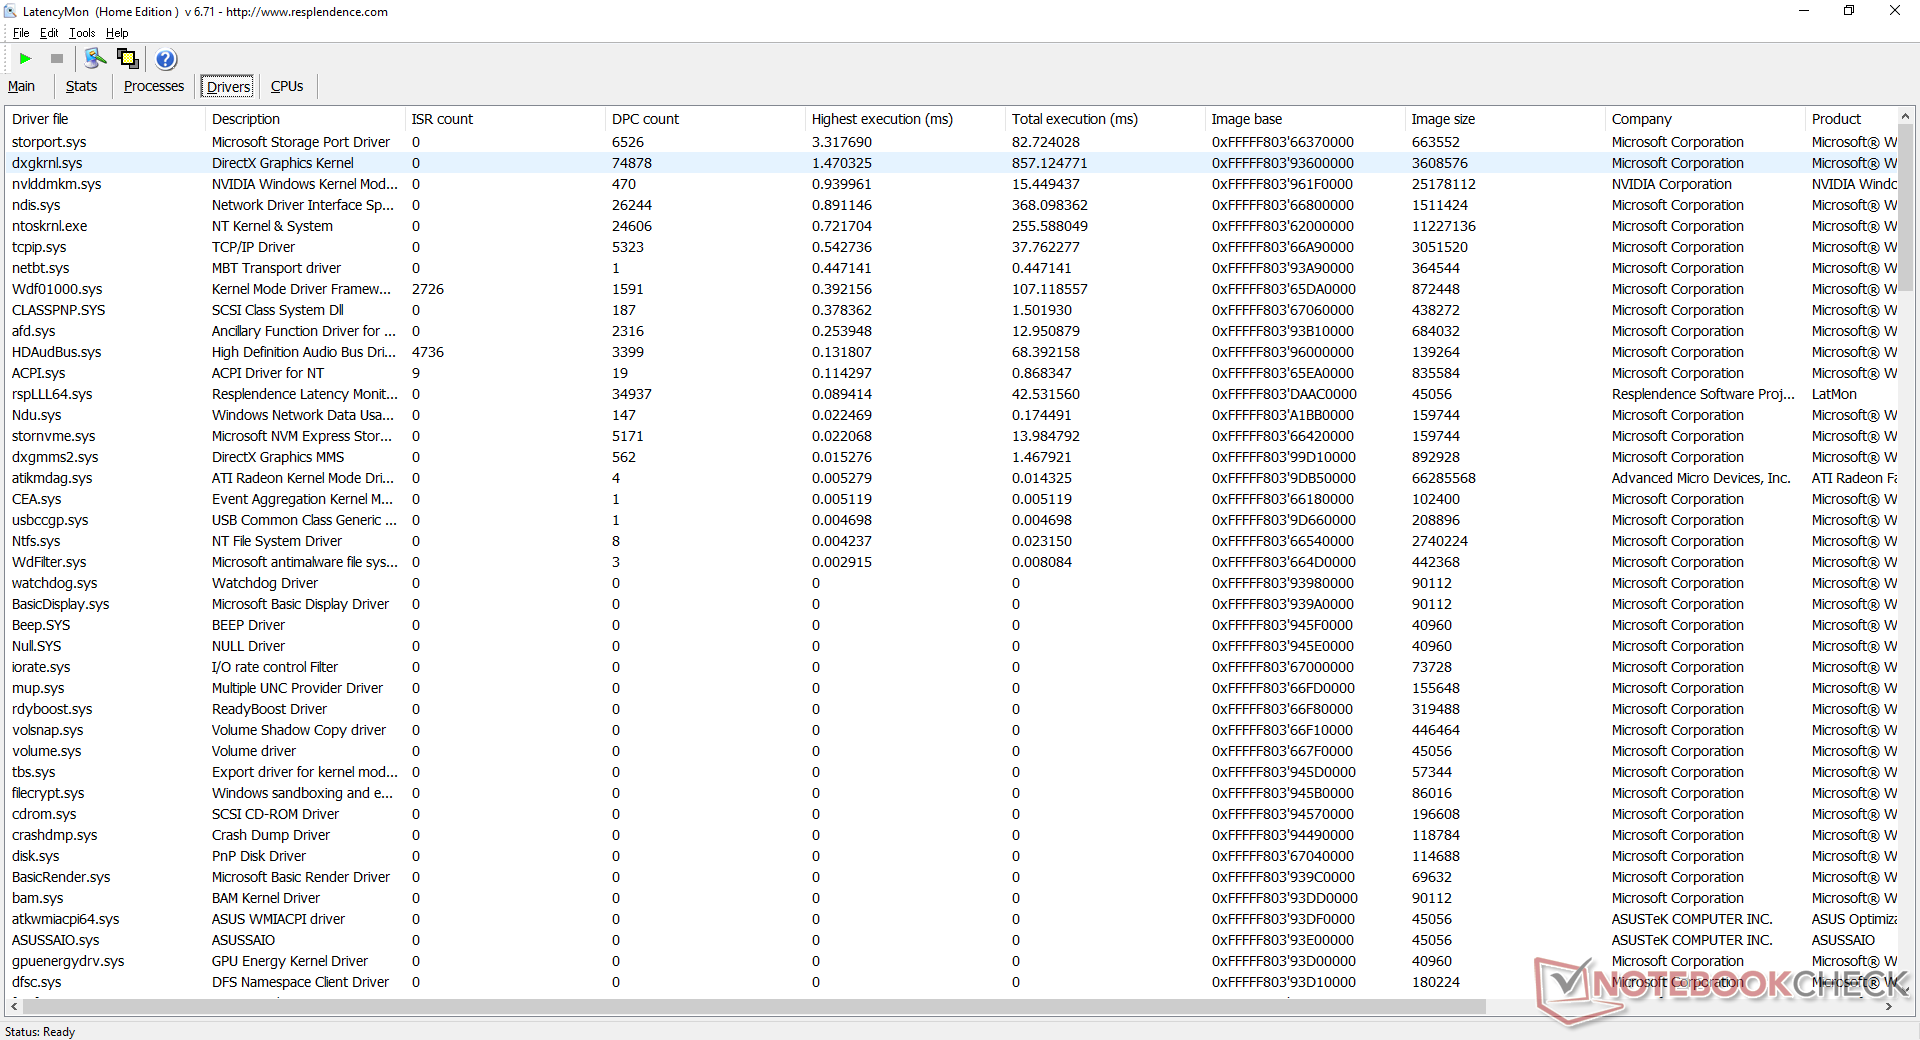
LatencyMon reveals DPC latency issues related to storport.sys. 4K video playback at 60 FPS is otherwise smooth and with no dropped frames.
| DPC Latencies / LatencyMon - interrupt to process latency (max), Web, Youtube, Prime95 | |
| Asus ROG Zephyrus Duo 15 GX550LXS | |
| Razer Blade 15 RTX 2070 Super Max-Q | |
| MSI GS66 Stealth 10SE-045 | |
| Asus ROG Zephyrus G15 GA502IU-ES76 | |
| Lenovo Legion 5 15IMH05H | |
| Eluktronics RP-15 | |
* ... smaller is better
Storage Devices
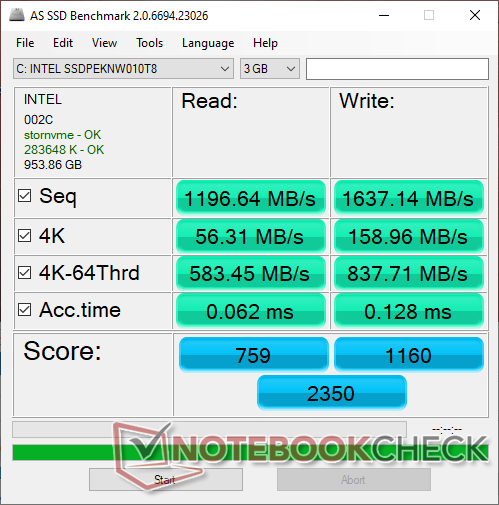
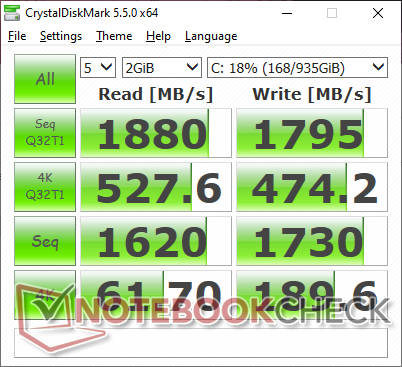
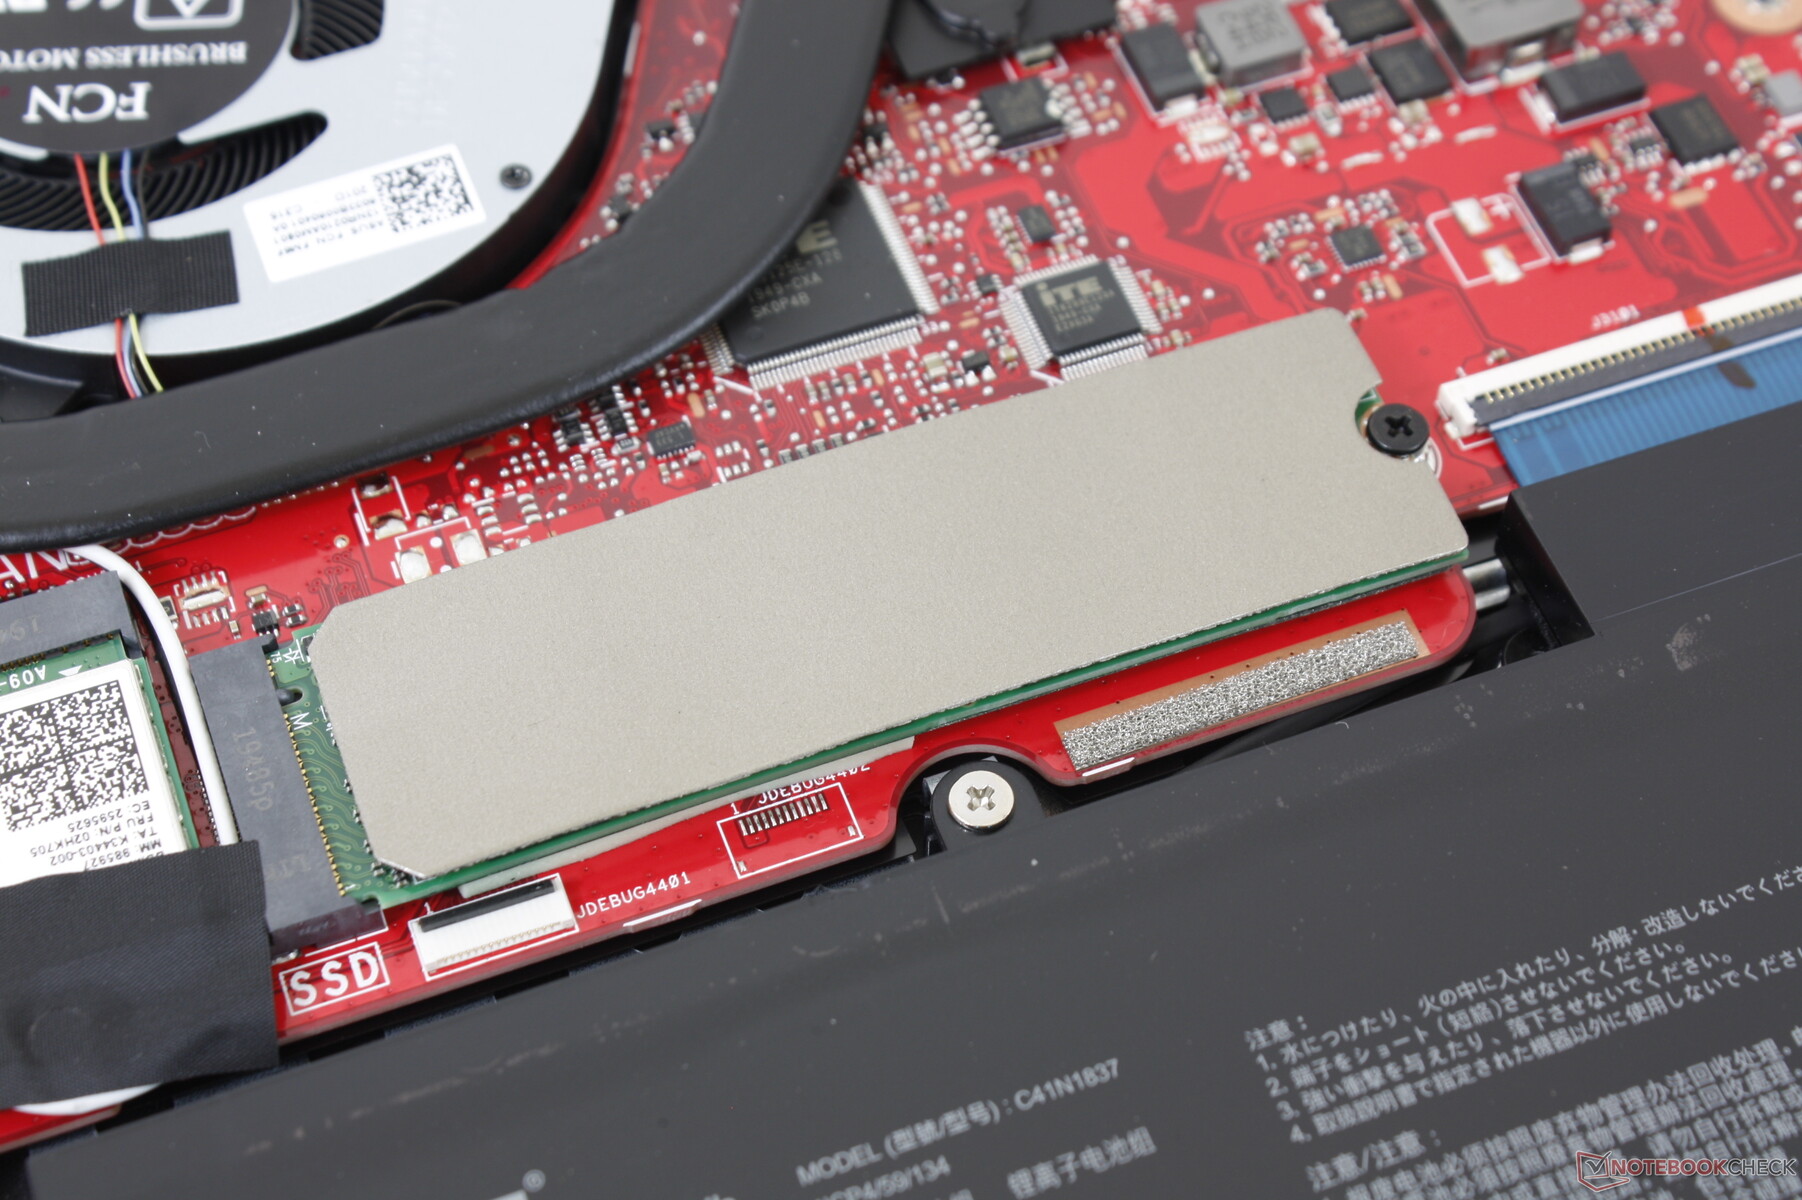
Asus is sticking with mid-range Intel 660p NVMe SSDs for its mid-range GA502 series whereas pricier Asus ROG laptops like the Zephyrus Duo may come with faster Samsung drives instead. The 1 TB Intel SSD in our unit is rated for maximum read and write rates of 1800 MB/s each compared to 3000 MB/s or greater on the Samsung PM981 series.
Users have access to two internal storage bays (M.2 2280 + M.2 2242). Note that the smaller M.2 2242 bay is PCIe x2 only.
| Asus ROG Zephyrus G15 GA502IU-ES76 Intel SSD 660p 1TB SSDPEKNW010T8 | Asus ROG Zephyrus Duo 15 GX550LXS 2x Samsung PM981a MZVLB1T0HBLR (RAID 0) | Asus ROG Zephyrus G15 GA502DU Intel SSD 660p SSDPEKNW512G8 | Razer Blade 15 RTX 2070 Super Max-Q Samsung SSD PM981a MZVLB512HBJQ | Lenovo Legion 5 15IMH05H Samsung PM991 MZALQ512HALU | MSI GS66 Stealth 10SE-045 Samsung SSD PM981 MZVLB1T0HALR | |
|---|---|---|---|---|---|---|
| AS SSD | 60% | -20% | 56% | 1% | 72% | |
| Seq Read (MB/s) | 1197 | 2981 149% | 907 -24% | 1957 63% | 2012 68% | 2612 118% |
| Seq Write (MB/s) | 1637 | 2783 70% | 926 -43% | 2092 28% | 1261 -23% | 2368 45% |
| 4K Read (MB/s) | 56.3 | 43.98 -22% | 47.26 -16% | 50.2 -11% | 43.66 -22% | 51.1 -9% |
| 4K Write (MB/s) | 159 | 113.9 -28% | 98.7 -38% | 96.5 -39% | 109.3 -31% | 135.9 -15% |
| 4K-64 Read (MB/s) | 583 | 1519 161% | 321.5 -45% | 1594 173% | 851 46% | 1635 180% |
| 4K-64 Write (MB/s) | 838 | 1296 55% | 736 -12% | 2005 139% | 780 -7% | 1831 118% |
| Access Time Read * (ms) | 0.062 | 0.062 -0% | 0.064 -3% | 0.057 8% | 0.117 -89% | 0.042 32% |
| Access Time Write * (ms) | 0.128 | 0.033 74% | 0.045 65% | 0.112 12% | 0.036 72% | 0.028 78% |
| Score Read (Points) | 759 | 1861 145% | 459 -40% | 1840 142% | 1096 44% | 1947 157% |
| Score Write (Points) | 1160 | 1688 46% | 927 -20% | 2310 99% | 1016 -12% | 2204 90% |
| Score Total (Points) | 2350 | 4492 91% | 1641 -30% | 5103 117% | 2643 12% | 5138 119% |
| Copy ISO MB/s (MB/s) | 1376 | 2438 77% | 905 -34% | 1793 30% | 1481 8% | 2334 70% |
| Copy Program MB/s (MB/s) | 568 | 604 6% | 496.9 -13% | 573 1% | 467.5 -18% | 569 0% |
| Copy Game MB/s (MB/s) | 1180 | 1404 19% | 819 -31% | 1418 20% | 734 -38% | 1401 19% |
| CrystalDiskMark 5.2 / 6 | 35% | -33% | 21% | -14% | 16% | |
| Write 4K (MB/s) | 189.6 | 127.6 -33% | 132.2 -30% | 139.8 -26% | 145.4 -23% | 156.3 -18% |
| Read 4K (MB/s) | 61.7 | 48.4 -22% | 55.5 -10% | 48.62 -21% | 51.6 -16% | 47.65 -23% |
| Write Seq (MB/s) | 1730 | 2958 71% | 986 -43% | 2260 31% | 1007 -42% | 2374 37% |
| Read Seq (MB/s) | 1620 | 2984 84% | 1318 -19% | 2135 32% | 1145 -29% | 2045 26% |
| Write 4K Q32T1 (MB/s) | 474.2 | 472.7 0% | 220.3 -54% | 499.3 5% | 468.4 -1% | 431.3 -9% |
| Read 4K Q32T1 (MB/s) | 528 | 529 0% | 315.5 -40% | 552 5% | 528 0% | 509 -4% |
| Write Seq Q32T1 (MB/s) | 1795 | 3431 91% | 987 -45% | 2960 65% | 1381 -23% | 2385 33% |
| Read Seq Q32T1 (MB/s) | 1880 | 3536 88% | 1416 -25% | 3269 74% | 2291 22% | 3505 86% |
| Total Average (Program / Settings) | 48% /
51% | -27% /
-25% | 39% /
43% | -7% /
-5% | 44% /
51% |
* ... smaller is better

Disk Throttling: DiskSpd Read Loop, Queue Depth 8
GPU Performance
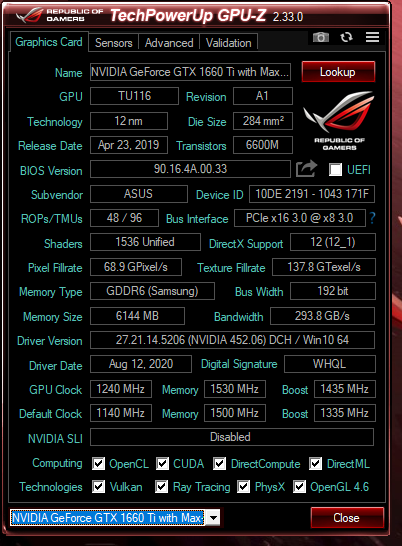
The GTX 1660 Ti Max-Q is only 10 percent slower than the standard mobile GTX 1660 Ti. Upgrading to the mobile RTX 2060 SKU will bring about 15 to 20 percent faster performance before factoring in its native RT benefits.
See our dedicated page on the GeForce GTX 1660 Ti Max-Q for more technical information and benchmark comparisons.
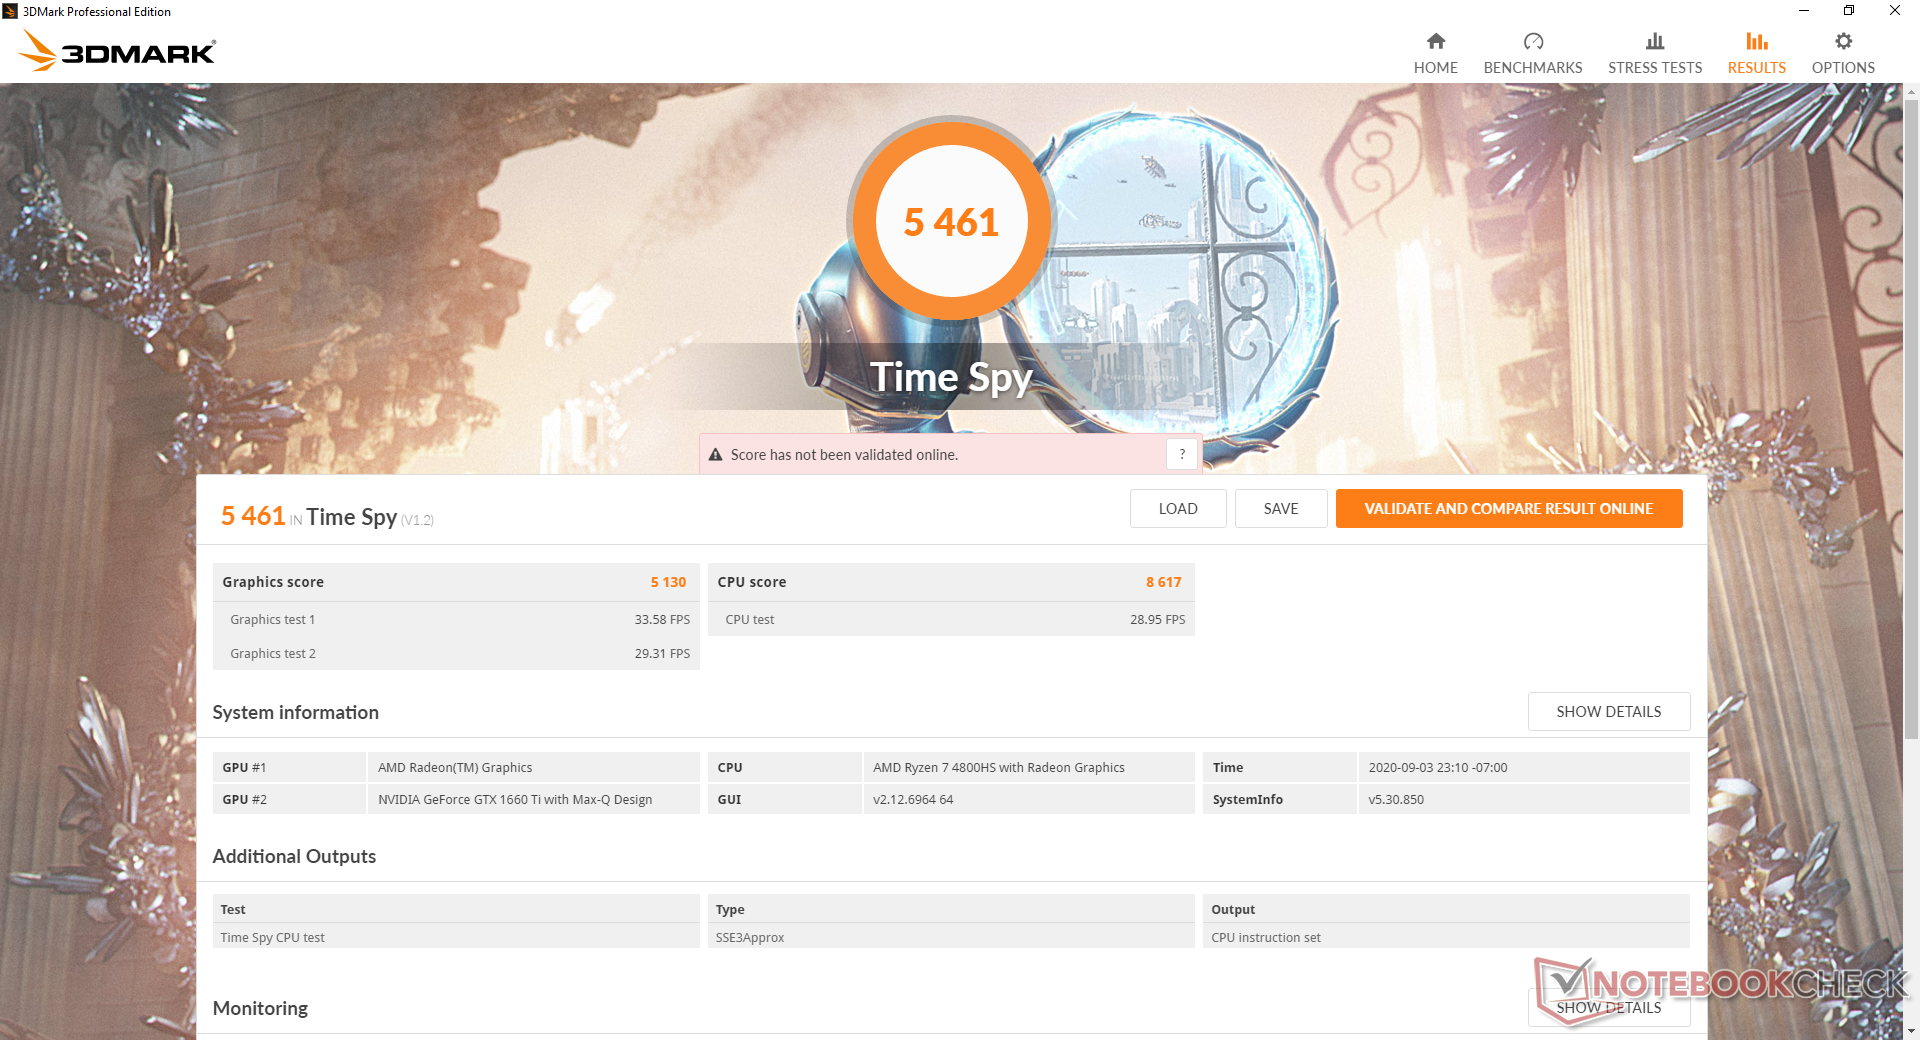
| 3DMark 06 Standard Score | 25384 points | |
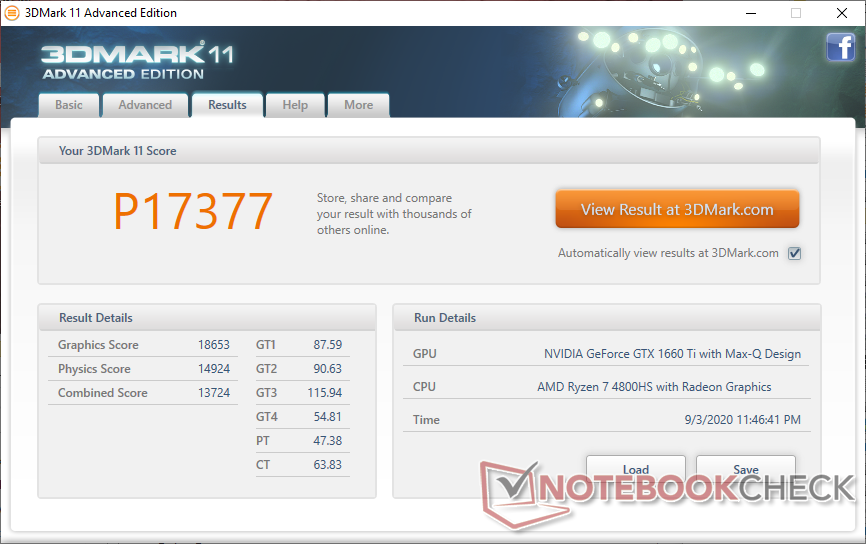
| 3DMark 11 Performance | 17377 points | |
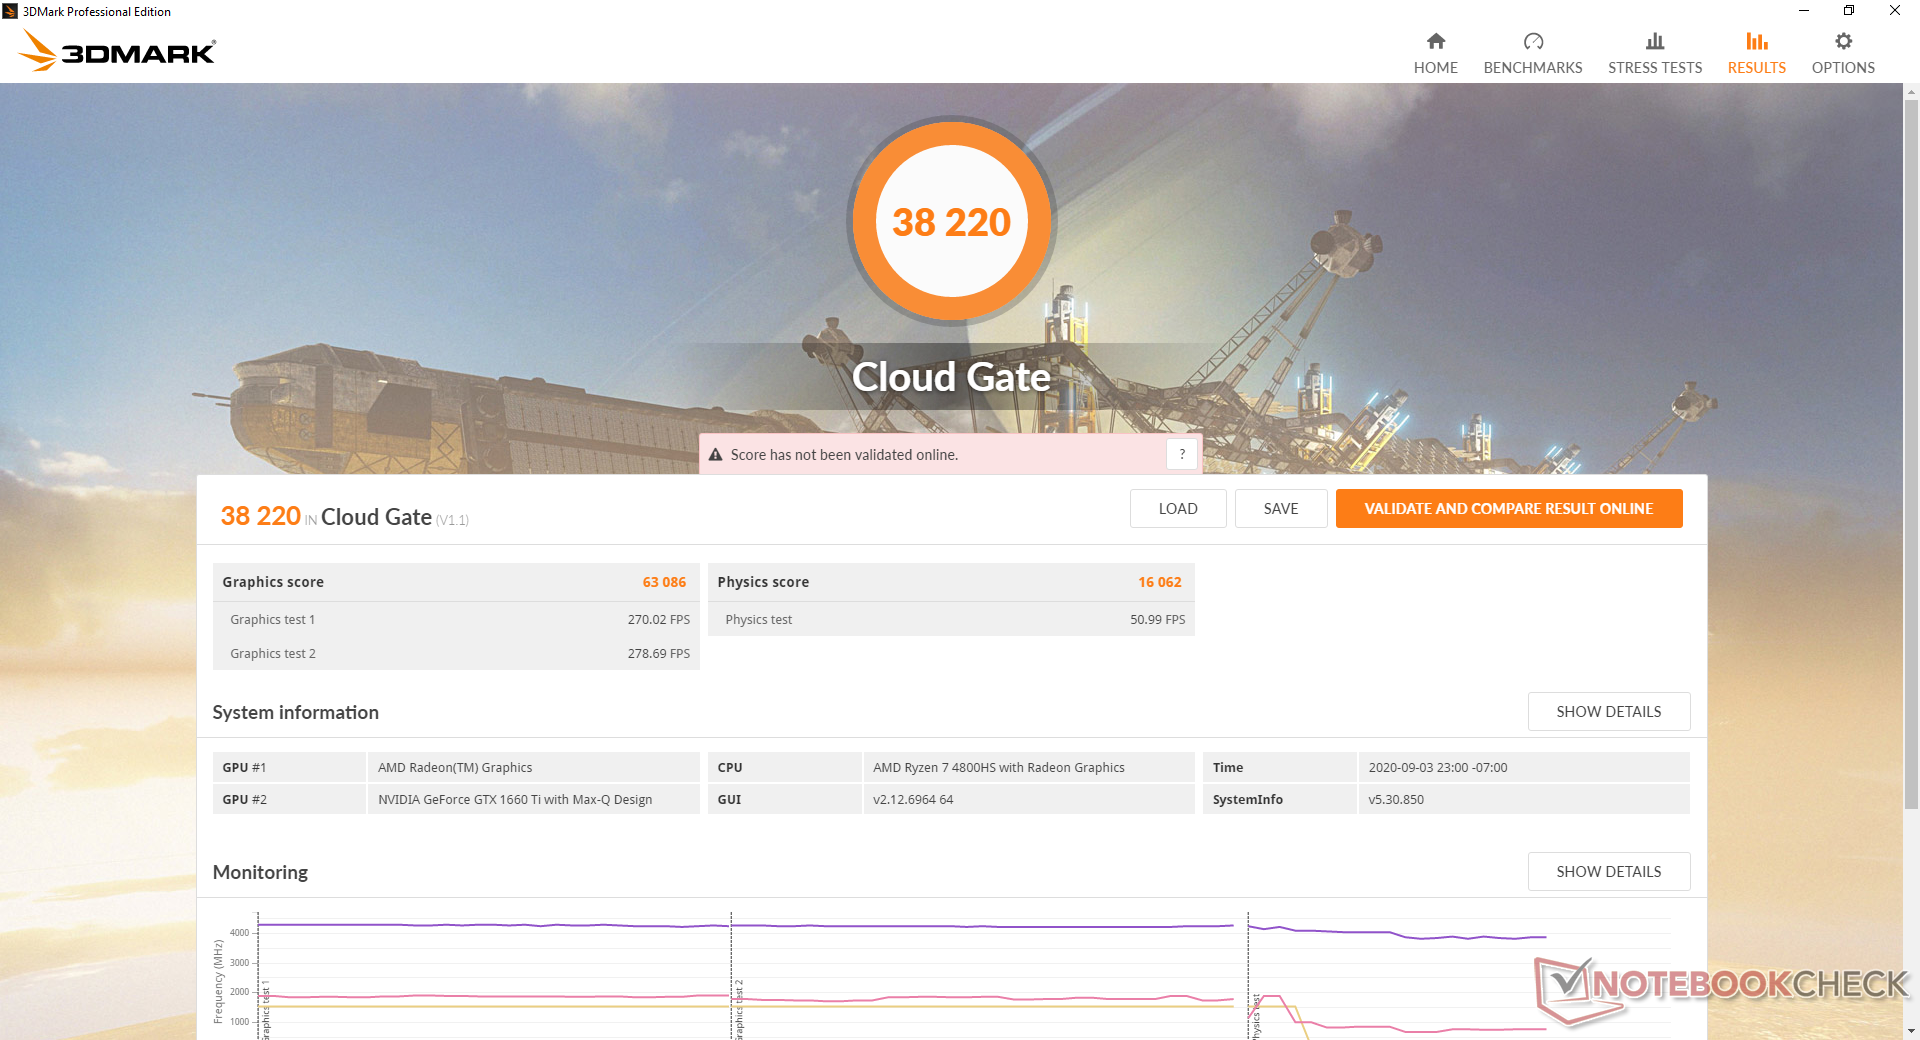
| 3DMark Cloud Gate Standard Score | 38220 points | |
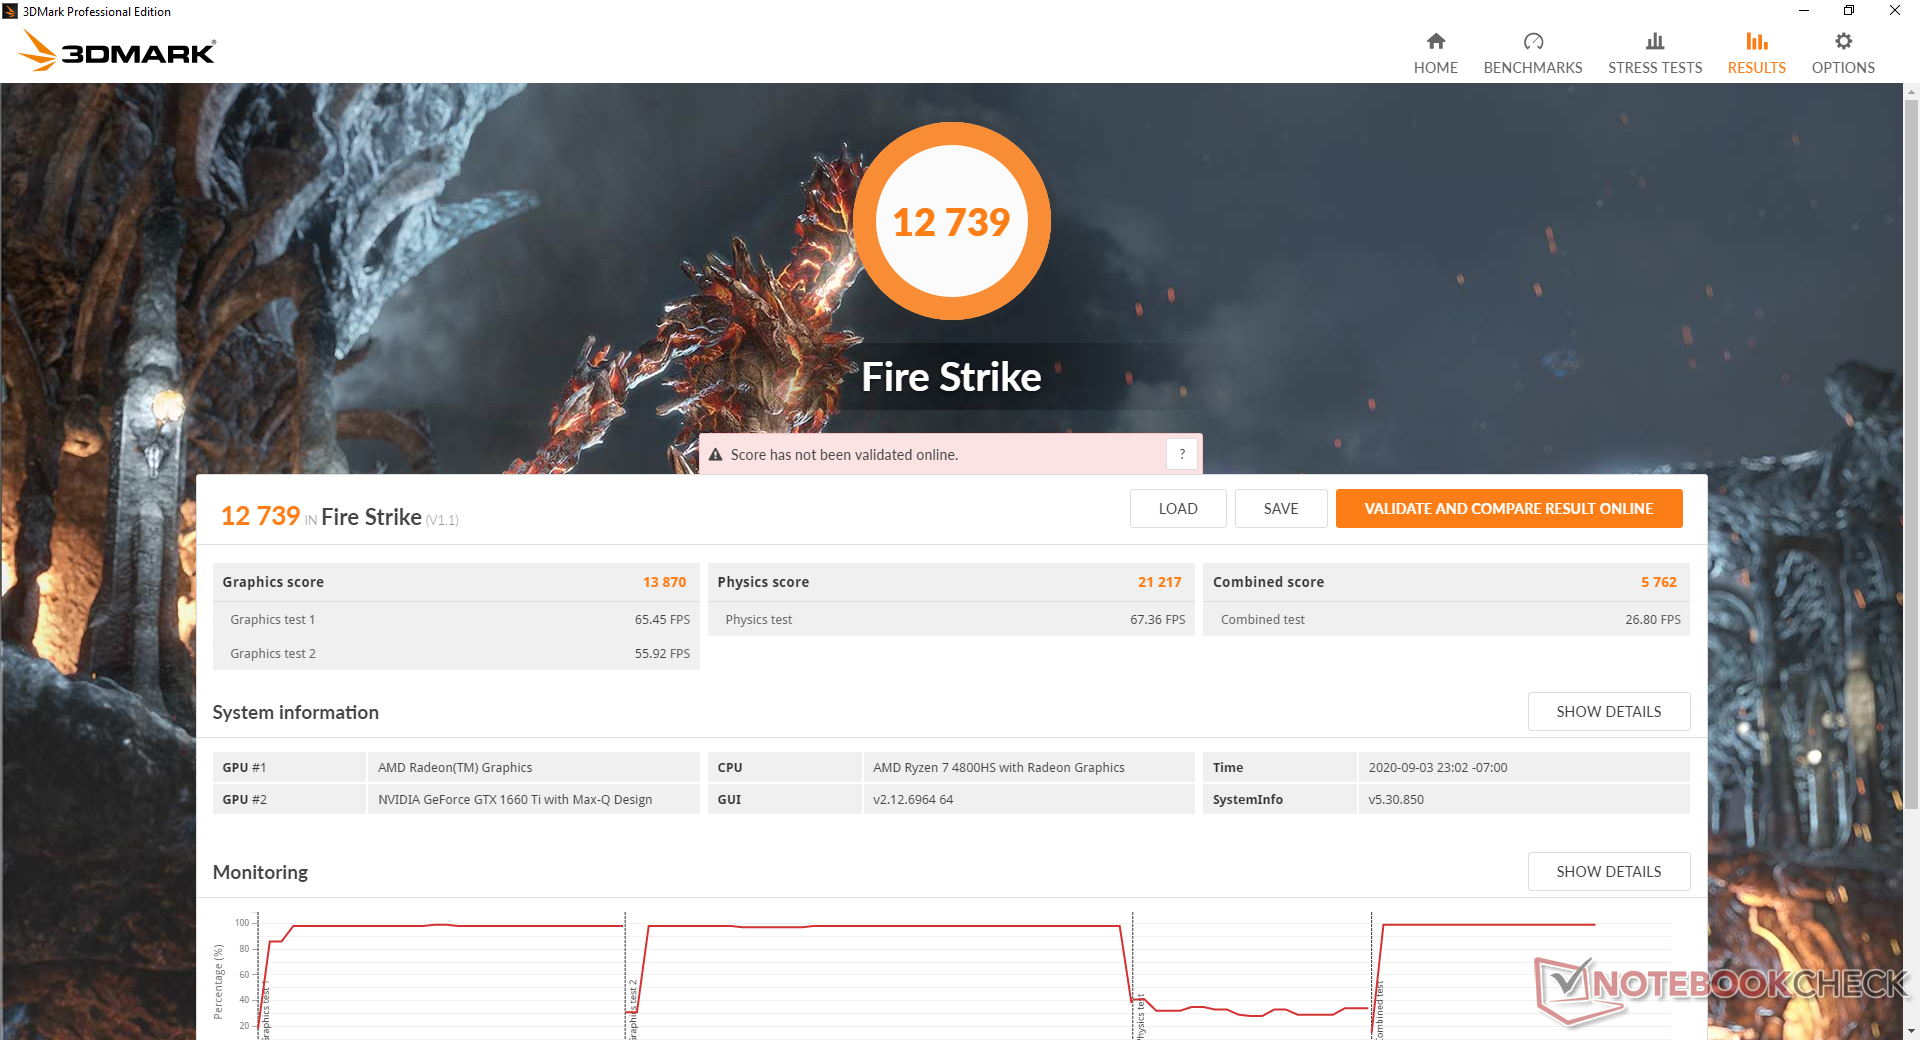
| 3DMark Fire Strike Score | 12739 points | |
| 3DMark Time Spy Score | 5461 points | |
Help | ||
Gaming Performance
The cheaper Dell G5 15 SE with the Radeon RX 5600M is about 10 to 20 percent faster than our Asus when gaming albeit at much higher power consumption levels. Frame rates can be anywhere from 5 to 35 percent faster than the older DA502DU depending on how CPU intensive the game may be even though our DA502IU uses the same GPU. Metro Exodus on low 720p settings, for example, is 26 percent faster on the DA502IU which will certainly help to make the most of the high refresh rate display.
| low | med. | high | ultra | |
|---|---|---|---|---|
| The Witcher 3 (2015) | 257.5 | 166.5 | 94.5 | 51.3 |
| Dota 2 Reborn (2015) | 119 | 112 | 106 | 103 |
| Final Fantasy XV Benchmark (2018) | 131 | 74.1 | 54.6 | |
| X-Plane 11.11 (2018) | 93.7 | 80.4 | 67.8 | |
| Shadow of the Tomb Raider (2018) | 113 | 85 | 75 | 67 |
| Metro Exodus (2019) | 129.5 | 66.5 | 49.1 | 38.3 |
| Borderlands 3 (2019) | 116.5 | 81.5 | 54.9 | 42.3 |
Emissions
System Noise
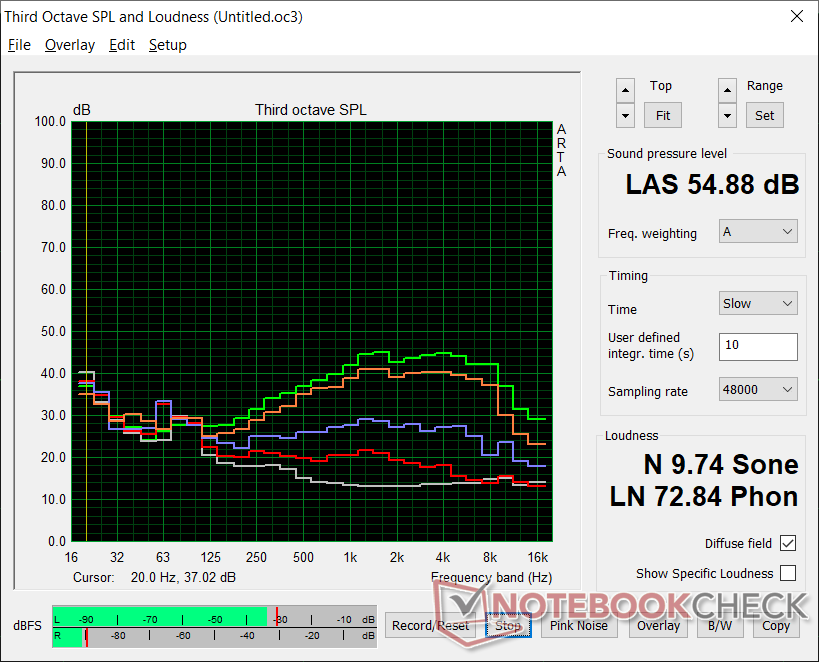
Fan noise is about the same as on the GA502DU even though the CPU is much faster than before. Gaming induces a fan noise of 51 dB(A) if the system is set to Performance mode or Turbo mode which is slightly louder than many other 15.6-inch gaming laptops.
Pulsing is more frequent on this laptop than we would like. If on any power profile other than Power Saver, the fans will sometimes pulse up to 33.3 dB(A) seemingly for no reason. Pulsing occurs when on Power Saver as well albeit not as often or as loudly. In either case, laptops like the Razer Blade 15 handle fan behavior better than our Asus.
| Asus ROG Zephyrus G15 GA502IU-ES76 GeForce GTX 1660 Ti Max-Q, R7 4800HS, Intel SSD 660p 1TB SSDPEKNW010T8 | Asus ROG Zephyrus Duo 15 GX550LXS GeForce RTX 2080 Super Max-Q, i9-10980HK, 2x Samsung PM981a MZVLB1T0HBLR (RAID 0) | Asus ROG Zephyrus G15 GA502DU GeForce GTX 1660 Ti Max-Q, R7 3750H, Intel SSD 660p SSDPEKNW512G8 | Razer Blade 15 RTX 2070 Super Max-Q GeForce RTX 2070 Super Max-Q, i7-10875H, Samsung SSD PM981a MZVLB512HBJQ | Lenovo Legion 5 15IMH05H GeForce RTX 2060 Mobile, i5-10300H, Samsung PM991 MZALQ512HALU | MSI GS66 Stealth 10SE-045 GeForce RTX 2060 Mobile, i7-10750H, Samsung SSD PM981 MZVLB1T0HALR | Eluktronics RP-15 GeForce RTX 2060 Mobile, R7 4800H, Phison PM81000GPMQCN28BTF-E12S4 M.2 NVM SSD | |
|---|---|---|---|---|---|---|---|
| Noise | -12% | -7% | -0% | -3% | -9% | -3% | |
| off / environment * (dB) | 26.3 | 30 -14% | 28 -6% | 27 -3% | 30.7 -17% | 25 5% | 28 -6% |
| Idle Minimum * (dB) | 26.7 | 33 -24% | 29.4 -10% | 27 -1% | 30.7 -15% | 29 -9% | 28 -5% |
| Idle Average * (dB) | 26.7 | 34 -27% | 31.9 -19% | 27 -1% | 30.7 -15% | 30 -12% | 28 -5% |
| Idle Maximum * (dB) | 31.9 | 35 -10% | 33 -3% | 27 15% | 30.7 4% | 40 -25% | 31.5 1% |
| Load Average * (dB) | 38.9 | 48 -23% | 41.2 -6% | 44.7 -15% | 36.6 6% | 51 -31% | 44 -13% |
| Witcher 3 ultra * (dB) | 51 | 48 6% | 53.8 -5% | 51.2 -0% | 47 8% | 48 6% | 48.8 4% |
| Load Maximum * (dB) | 54.9 | 49 11% | 55.7 -1% | 54 2% | 50.9 7% | 54 2% | 54.1 1% |
* ... smaller is better
Noise level
| Idle |
| 26.7 / 26.7 / 31.9 dB(A) |
| Load |
| 38.9 / 54.9 dB(A) |
 | ||
30 dB silent 40 dB(A) audible 50 dB(A) loud |
||
min: | ||
Temperature
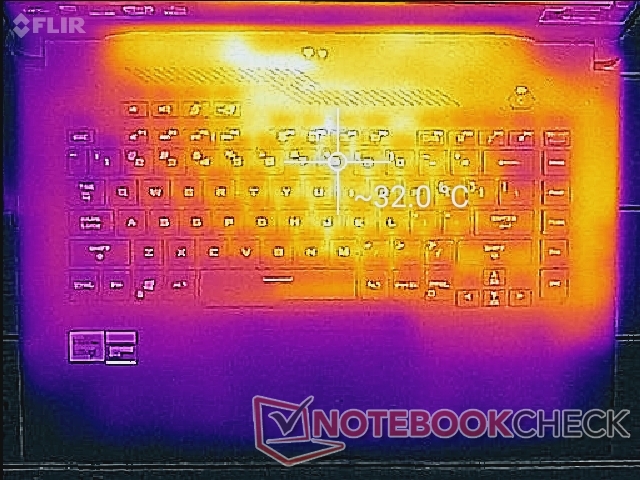
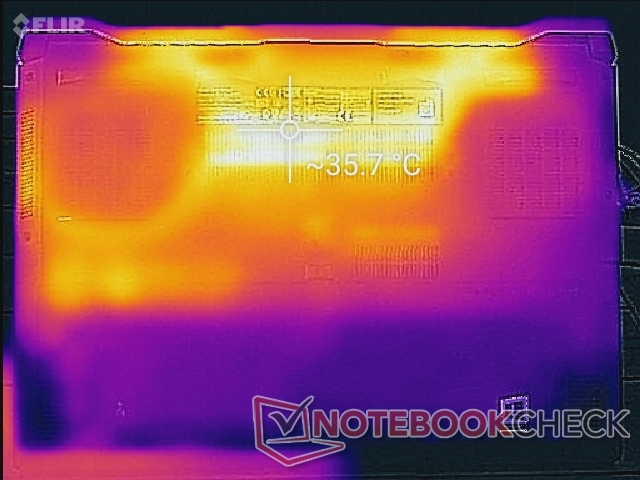
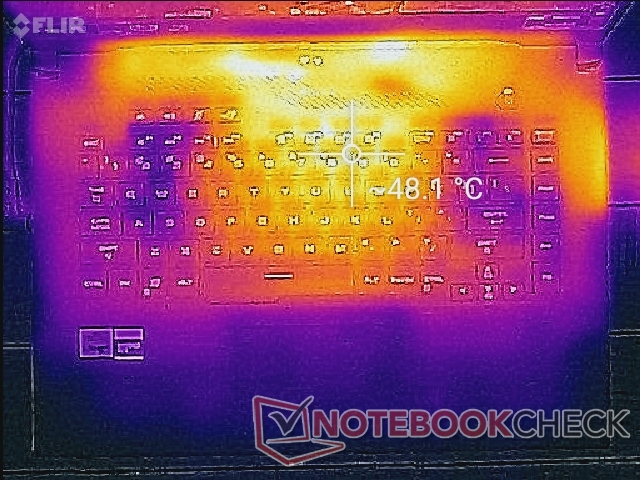
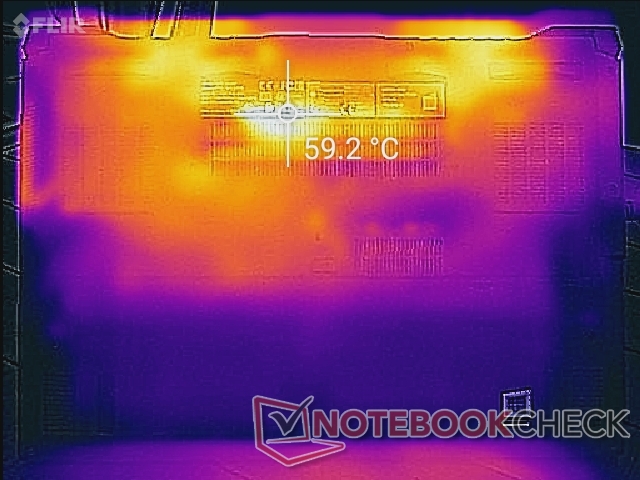
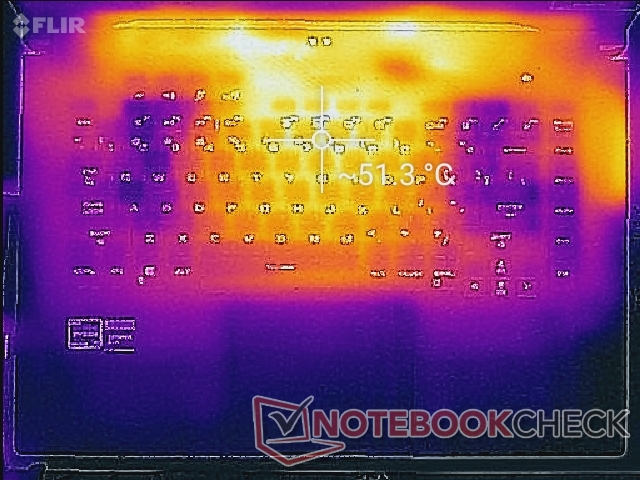
Surface temperatures aren't noticeably warmer than on last year's GA502DU despite the faster and newer generation Ryzen 7 CPU. Users are getting over 2x the multi-thread performance without incurring any significant temperature disadvantages.
When compared to the Razer Blade 15, hot spots are about the same at ~50 C on each laptop when gaming, but the palm rests on the Razer system will become much warmer.
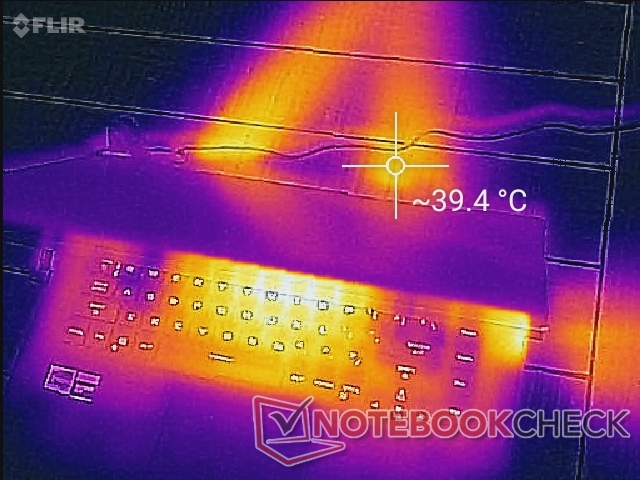
(-) The maximum temperature on the upper side is 52.2 °C / 126 F, compared to the average of 40.4 °C / 105 F, ranging from 21.2 to 68.8 °C for the class Gaming.
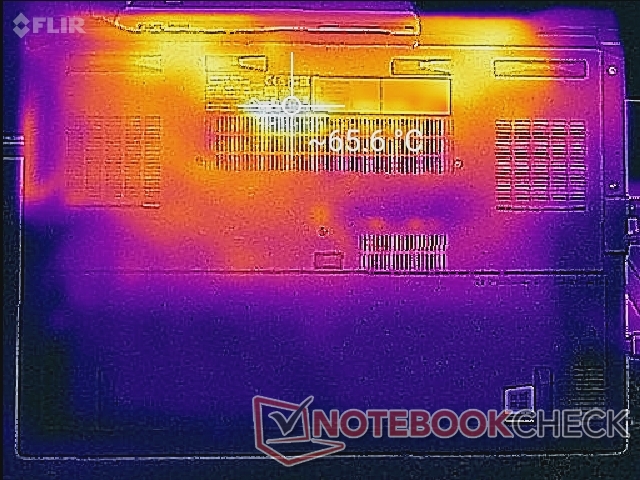
(-) The bottom heats up to a maximum of 65 °C / 149 F, compared to the average of 43.2 °C / 110 F
(+) In idle usage, the average temperature for the upper side is 27.2 °C / 81 F, compared to the device average of 33.9 °C / 93 F.
(±) Playing The Witcher 3, the average temperature for the upper side is 35.8 °C / 96 F, compared to the device average of 33.9 °C / 93 F.
(+) The palmrests and touchpad are cooler than skin temperature with a maximum of 25.4 °C / 77.7 F and are therefore cool to the touch.
(+) The average temperature of the palmrest area of similar devices was 28.8 °C / 83.8 F (+3.4 °C / 6.1 F).
Stress Test
When running Prime95 to stress the CPU, clock rates would boost to 4.1 GHz for just a couple of seconds until stabilizing at 3.7 GHz and 73 C for the next few minutes. Once core temperature reaches 79 C, however, clock rates would dip further to the 3.3 to 3.4 GHz range in order to maintain a core temperature of 74 C. This behavior matches our CineBench loop test results above. CPU temperature maxes out at 88 C when running Prime95 and FurMark simultaneously.
When running Witcher 3, CPU and GPU temperatures stabilize at 77 C and 75 C, respectively, compared to 74 C and 71 C on last year's DA502DU.
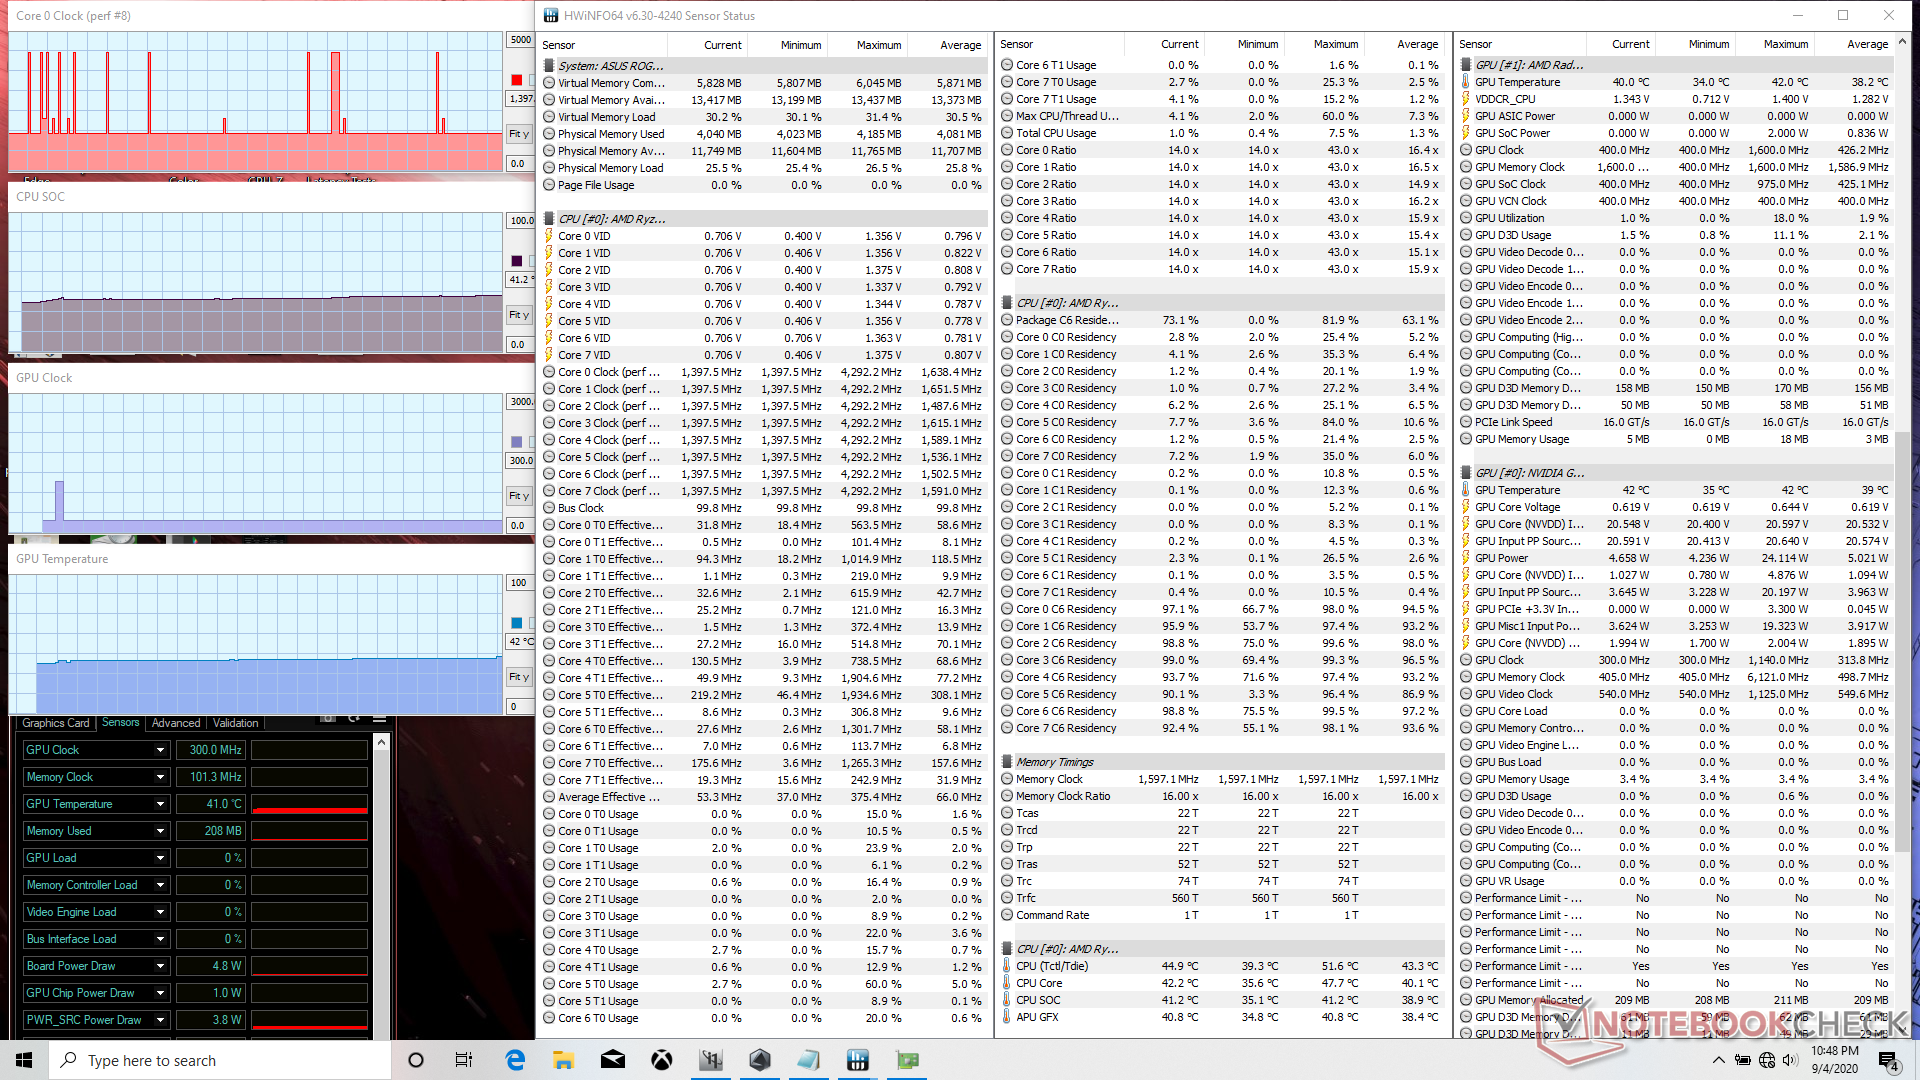
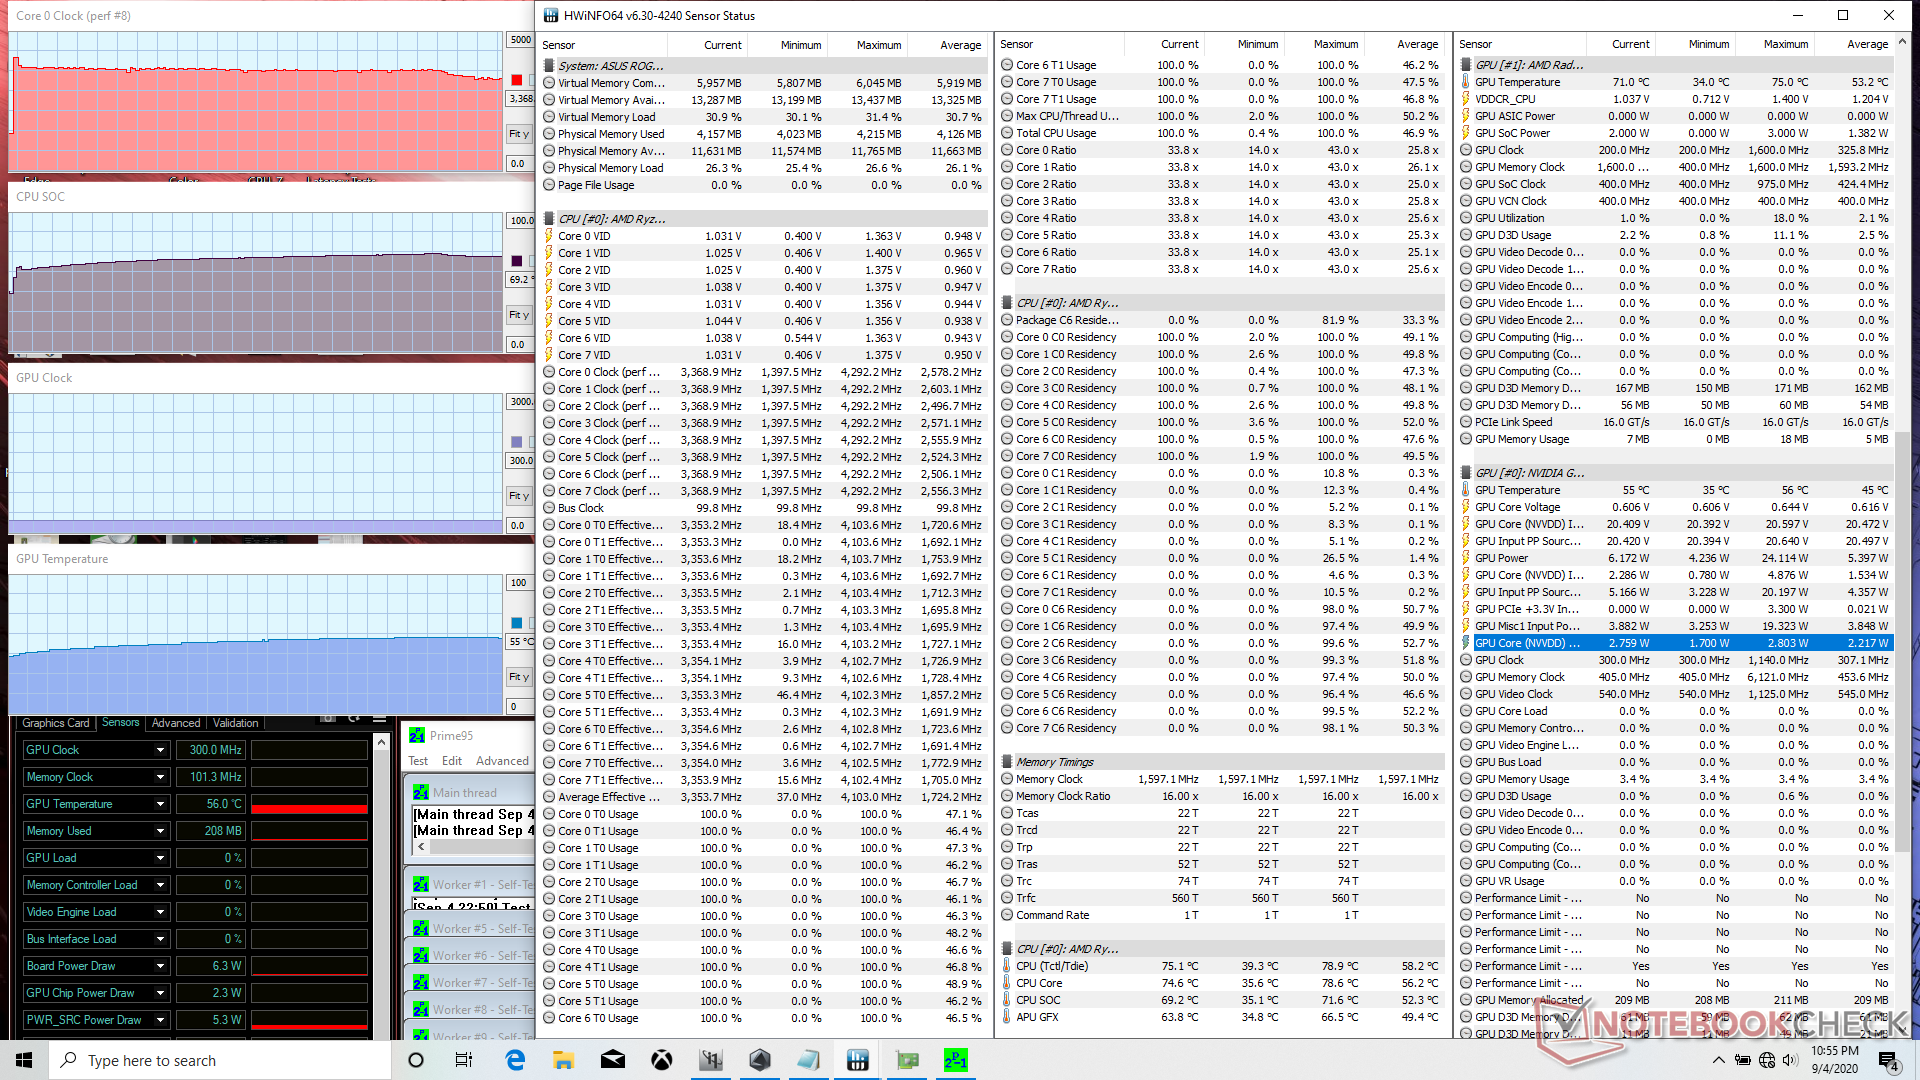
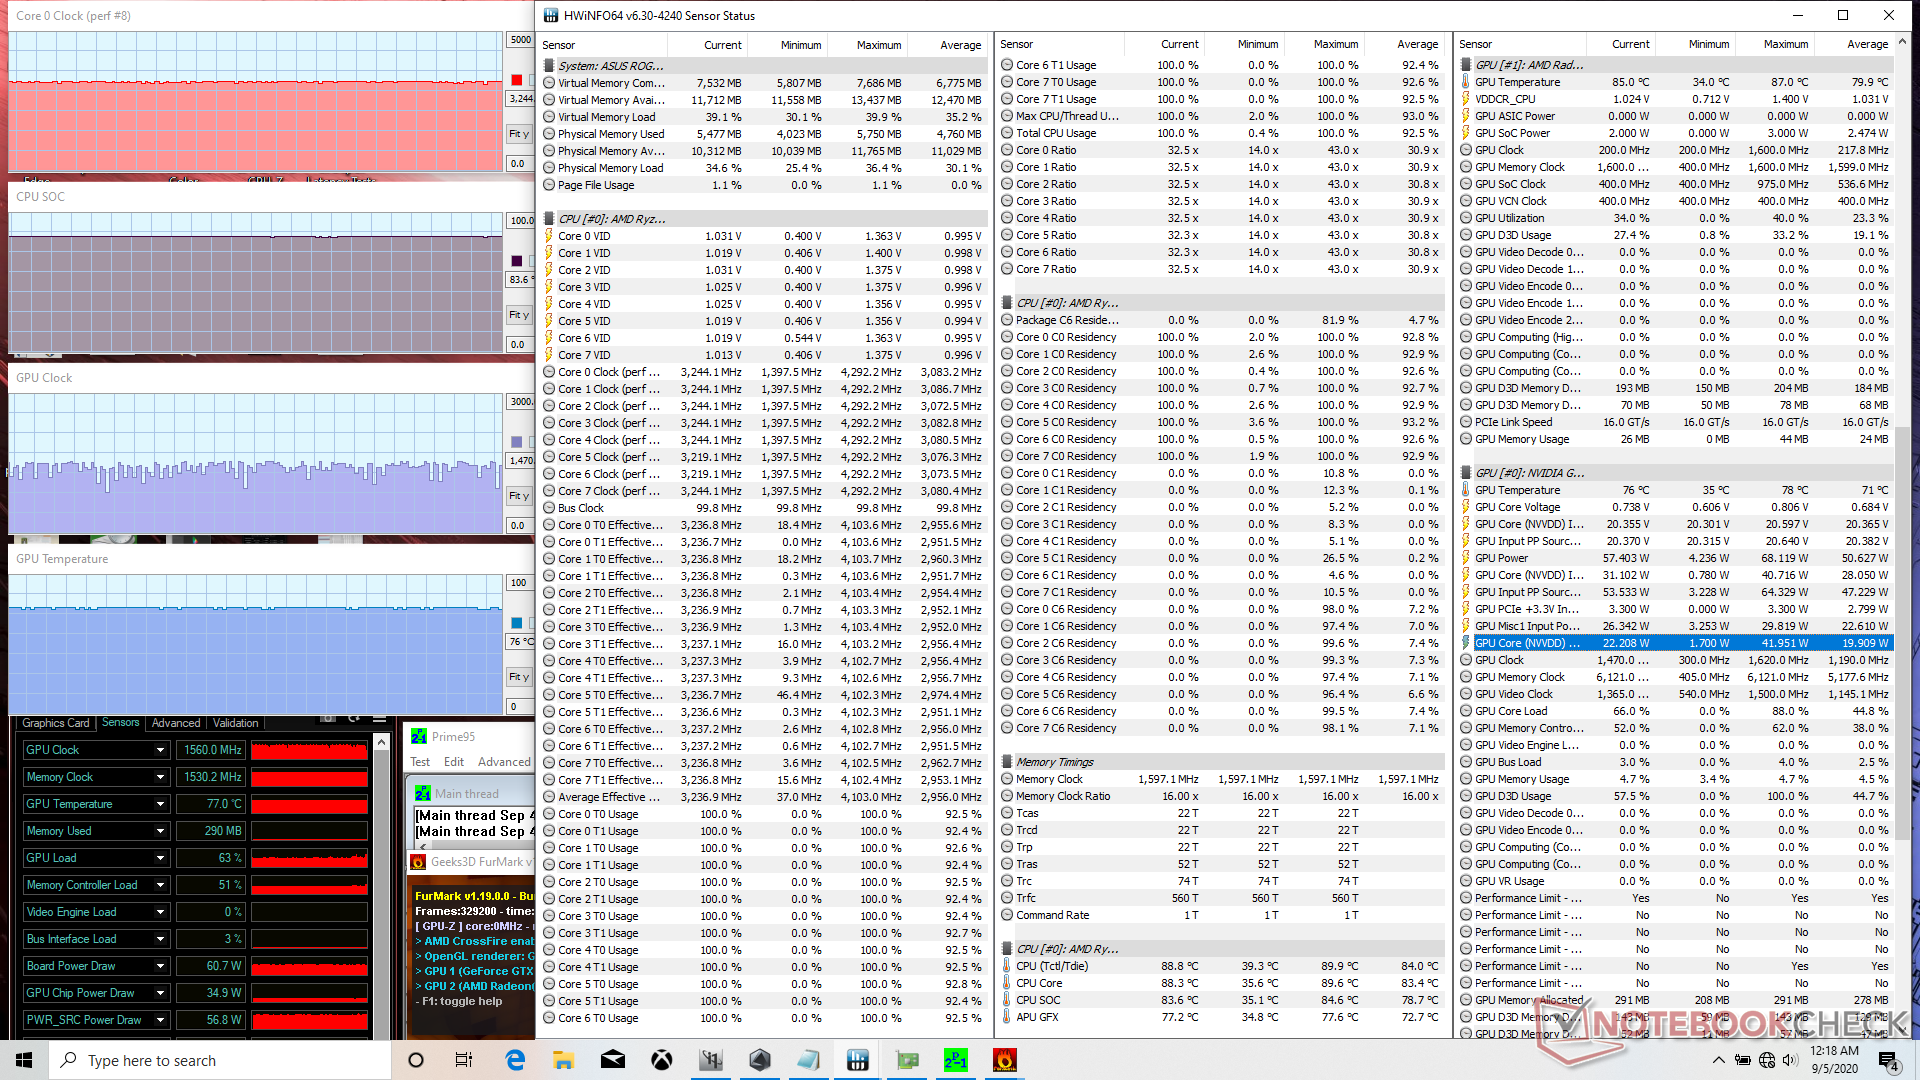

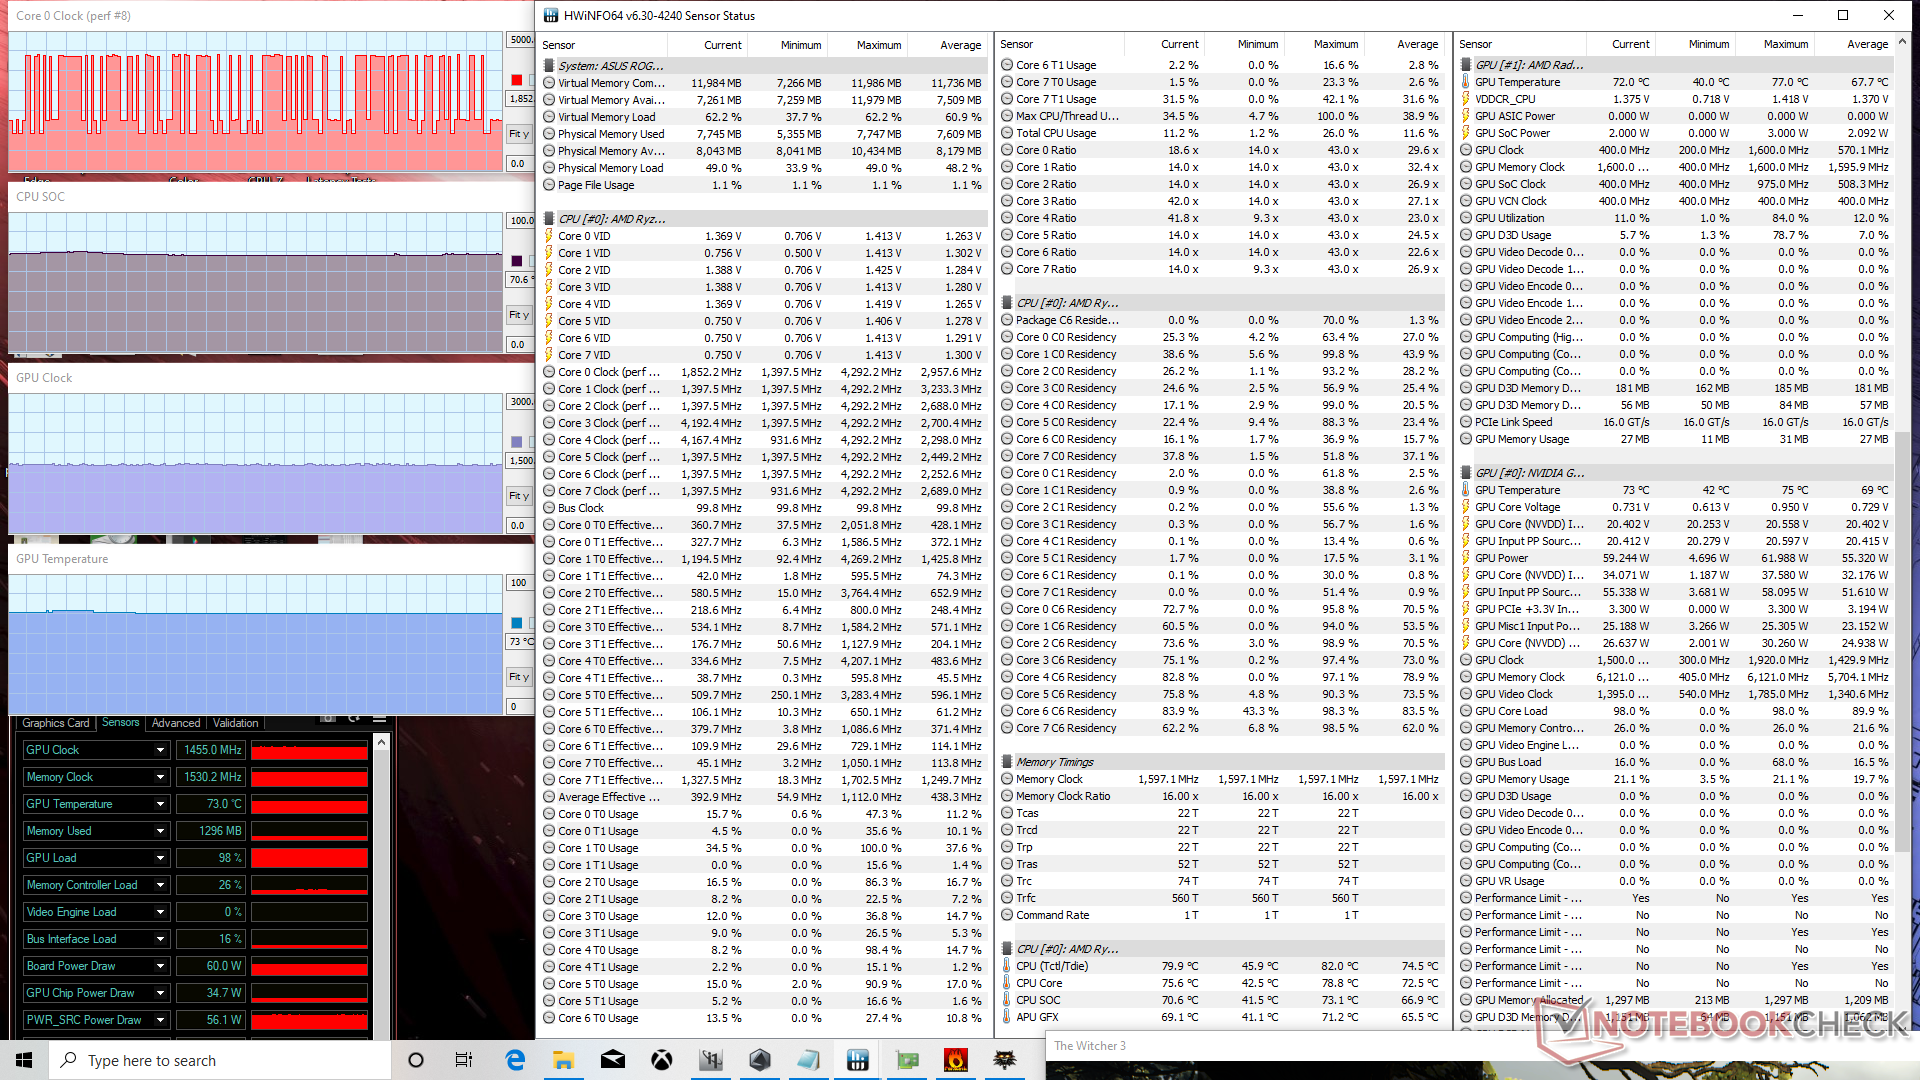
| CPU Clock (GHz) | GPU Clock (MHz) | Average CPU Temperature (°C) | Average GPU Temperature (°C) | |
| System Idle | -- | -- | 42 | 42 |
| Prime95 Stress | 3.3 - 3.4 | -- | 74 | 55 |
| Prime95 + FurMark Stress | 3.2 | 860 - 1560 | 88 | 76 |
| Witcher 3 Stress (Performance mode) | 1.8 - 4.2 | 1410 | 77 | 75 |
| Witcher 3 Stress (Turbo mode) | 1.8 - 4.2 | 1455 | 76 | 73 |
Speakers


Asus ROG Zephyrus G15 GA502IU-ES76 audio analysis
(±) | speaker loudness is average but good (81 dB)
Bass 100 - 315 Hz
(±) | reduced bass - on average 5.9% lower than median
(±) | linearity of bass is average (11.4% delta to prev. frequency)
Mids 400 - 2000 Hz
(+) | balanced mids - only 2.2% away from median
(+) | mids are linear (4% delta to prev. frequency)
Highs 2 - 16 kHz
(±) | higher highs - on average 6.5% higher than median
(+) | highs are linear (6.5% delta to prev. frequency)
Overall 100 - 16.000 Hz
(+) | overall sound is linear (13.1% difference to median)
Compared to same class
» 18% of all tested devices in this class were better, 4% similar, 78% worse
» The best had a delta of 6%, average was 18%, worst was 132%
Compared to all devices tested
» 13% of all tested devices were better, 3% similar, 84% worse
» The best had a delta of 4%, average was 23%, worst was 134%
Apple MacBook 12 (Early 2016) 1.1 GHz audio analysis
(+) | speakers can play relatively loud (83.6 dB)
Bass 100 - 315 Hz
(±) | reduced bass - on average 11.3% lower than median
(±) | linearity of bass is average (14.2% delta to prev. frequency)
Mids 400 - 2000 Hz
(+) | balanced mids - only 2.4% away from median
(+) | mids are linear (5.5% delta to prev. frequency)
Highs 2 - 16 kHz
(+) | balanced highs - only 2% away from median
(+) | highs are linear (4.5% delta to prev. frequency)
Overall 100 - 16.000 Hz
(+) | overall sound is linear (10.2% difference to median)
Compared to same class
» 7% of all tested devices in this class were better, 2% similar, 90% worse
» The best had a delta of 5%, average was 18%, worst was 53%
Compared to all devices tested
» 5% of all tested devices were better, 1% similar, 94% worse
» The best had a delta of 4%, average was 23%, worst was 134%
Energy Management
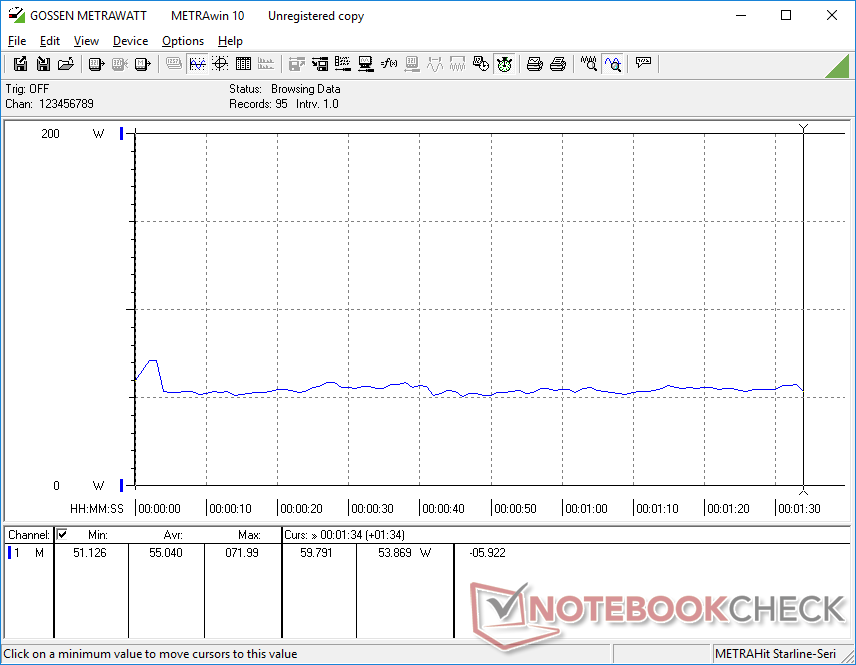
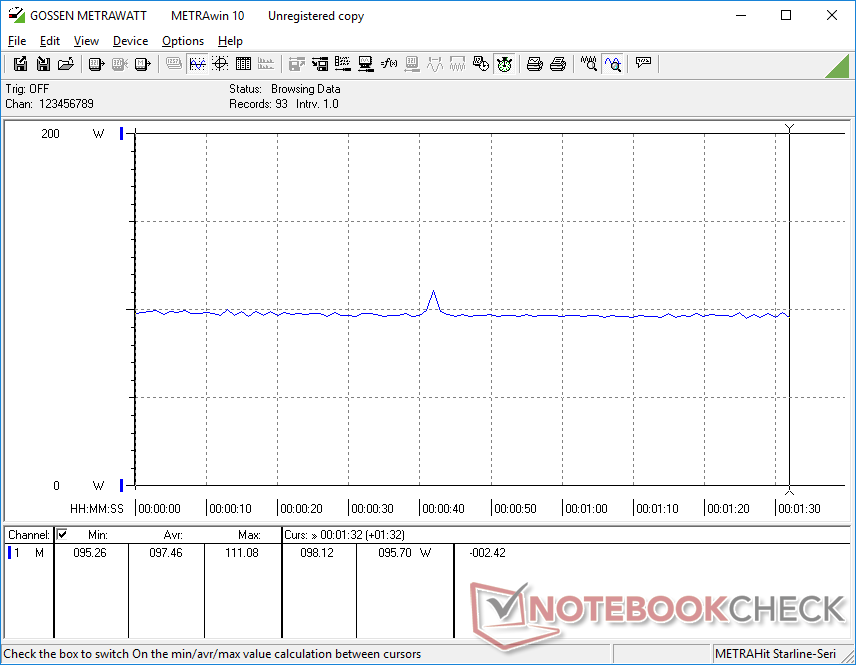
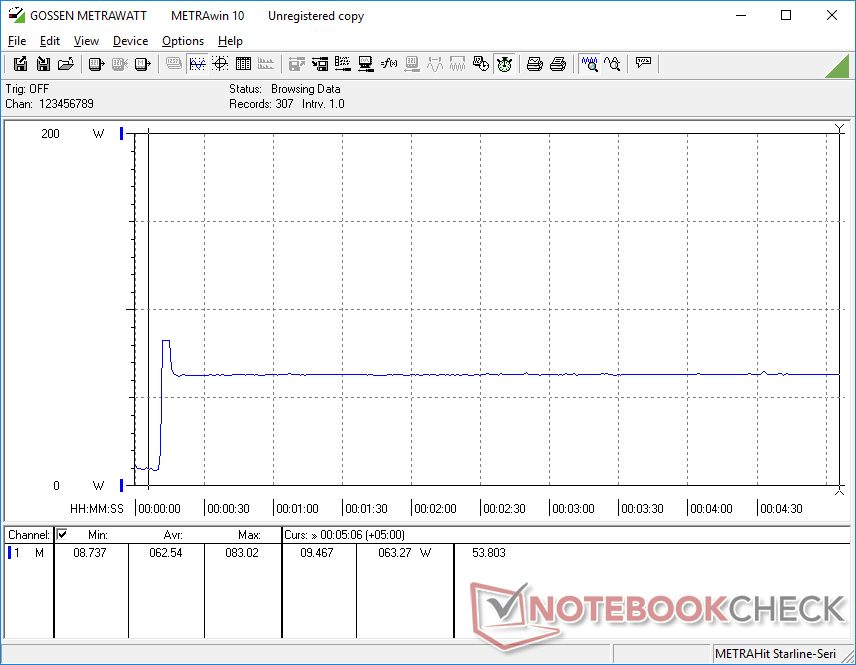
Power Consumption
Idling on desktop consumes only between 5 W and 10 W compared to 7 W and 39 W on the older GA502DU or 21 W to 35 W on the more powerful Eluktronics RP-15. Running Witcher 3 to represent gaming shows how power efficient this system can be as consumption is approximately 8 percent and 27 percent lower than the aforementioned GA502DU and RP-15, respectively. Gaming laptops powered by Core i7 and RTX 2060 graphics typically consume about 140 W to 150 W when gaming meaning than the ~50 W savings on our GA502IU is significant relative to the smaller 15 percent decrease in gaming performance.
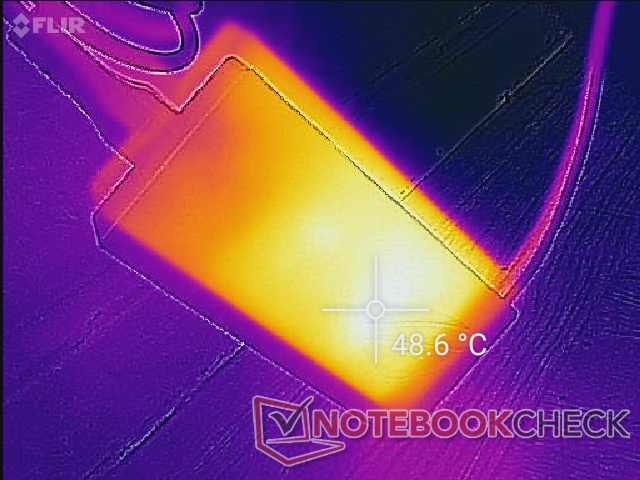
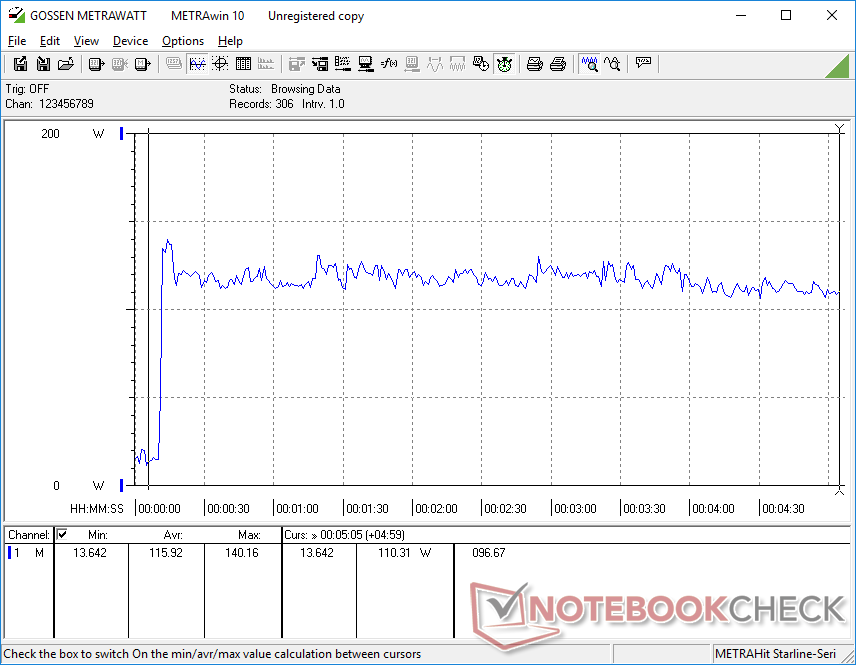
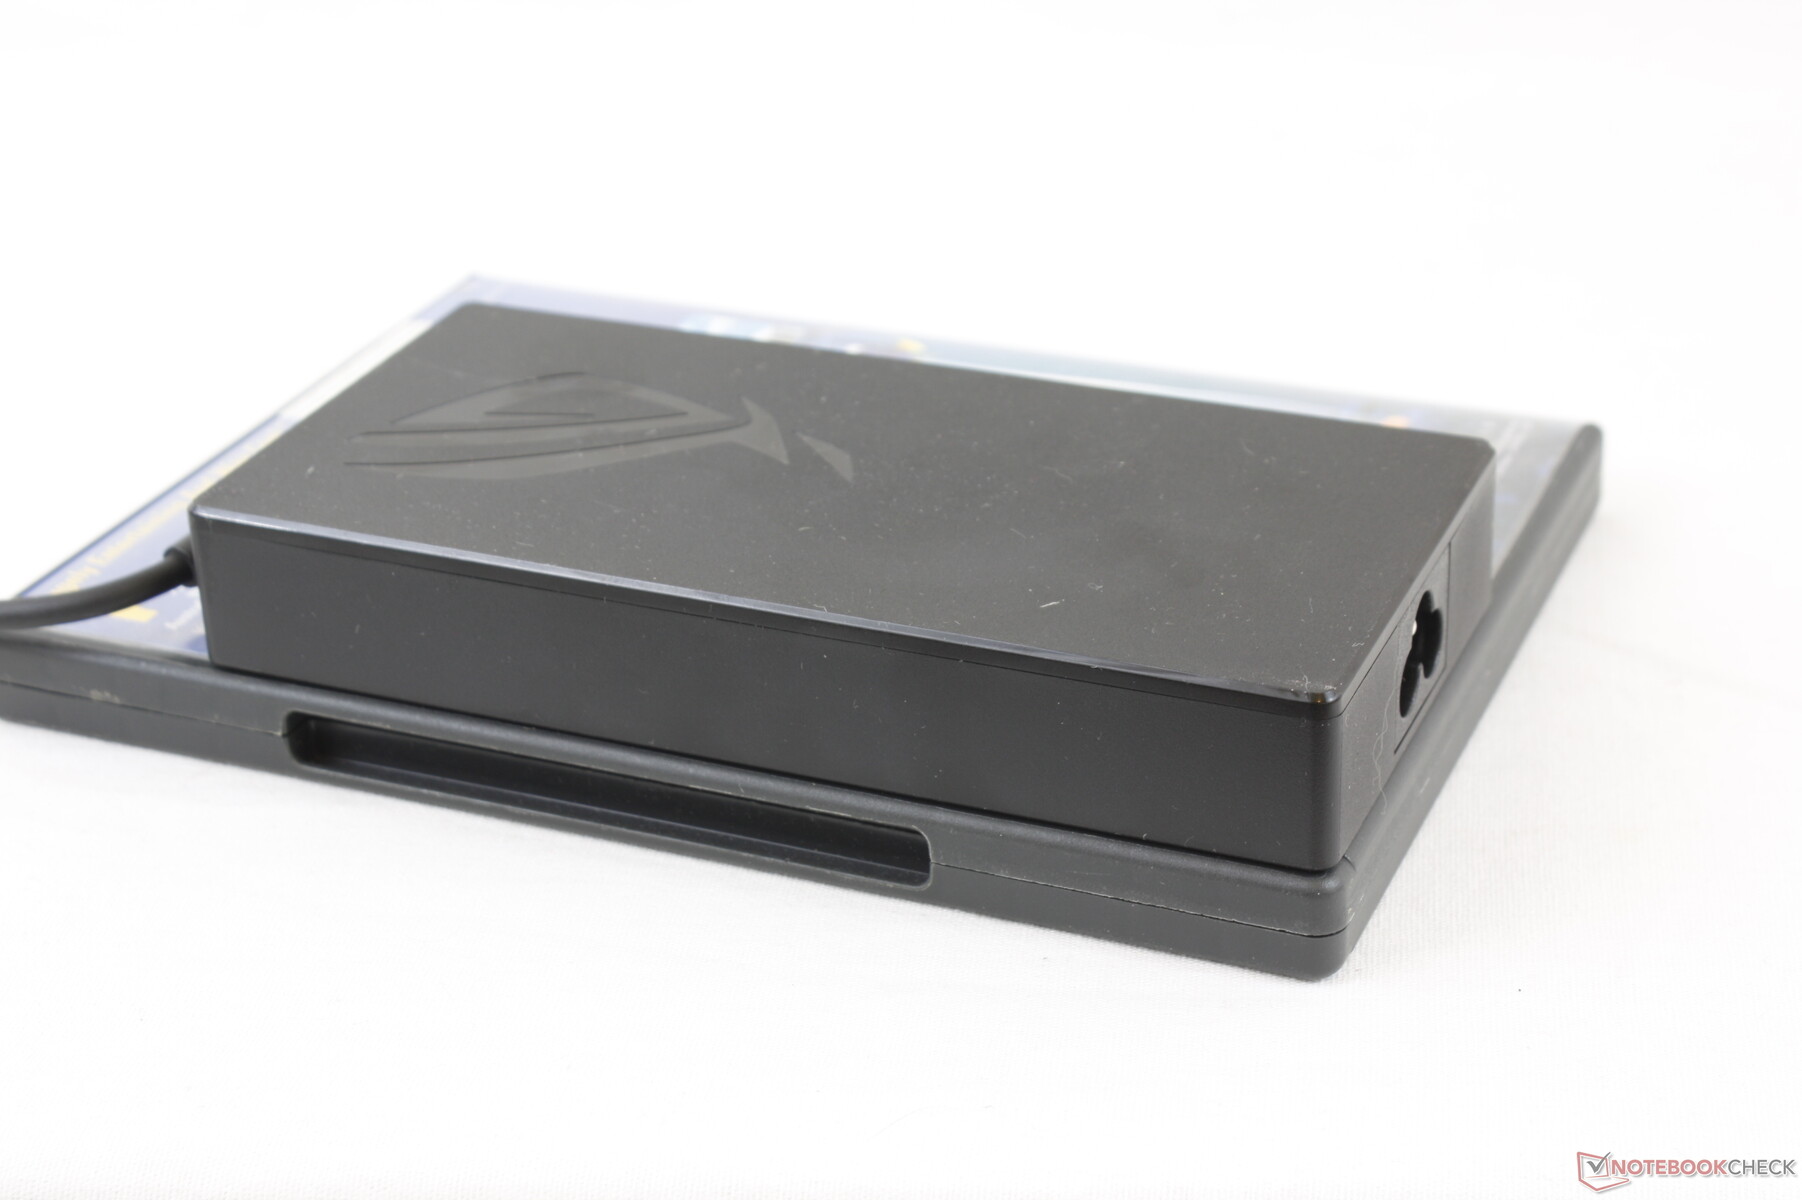
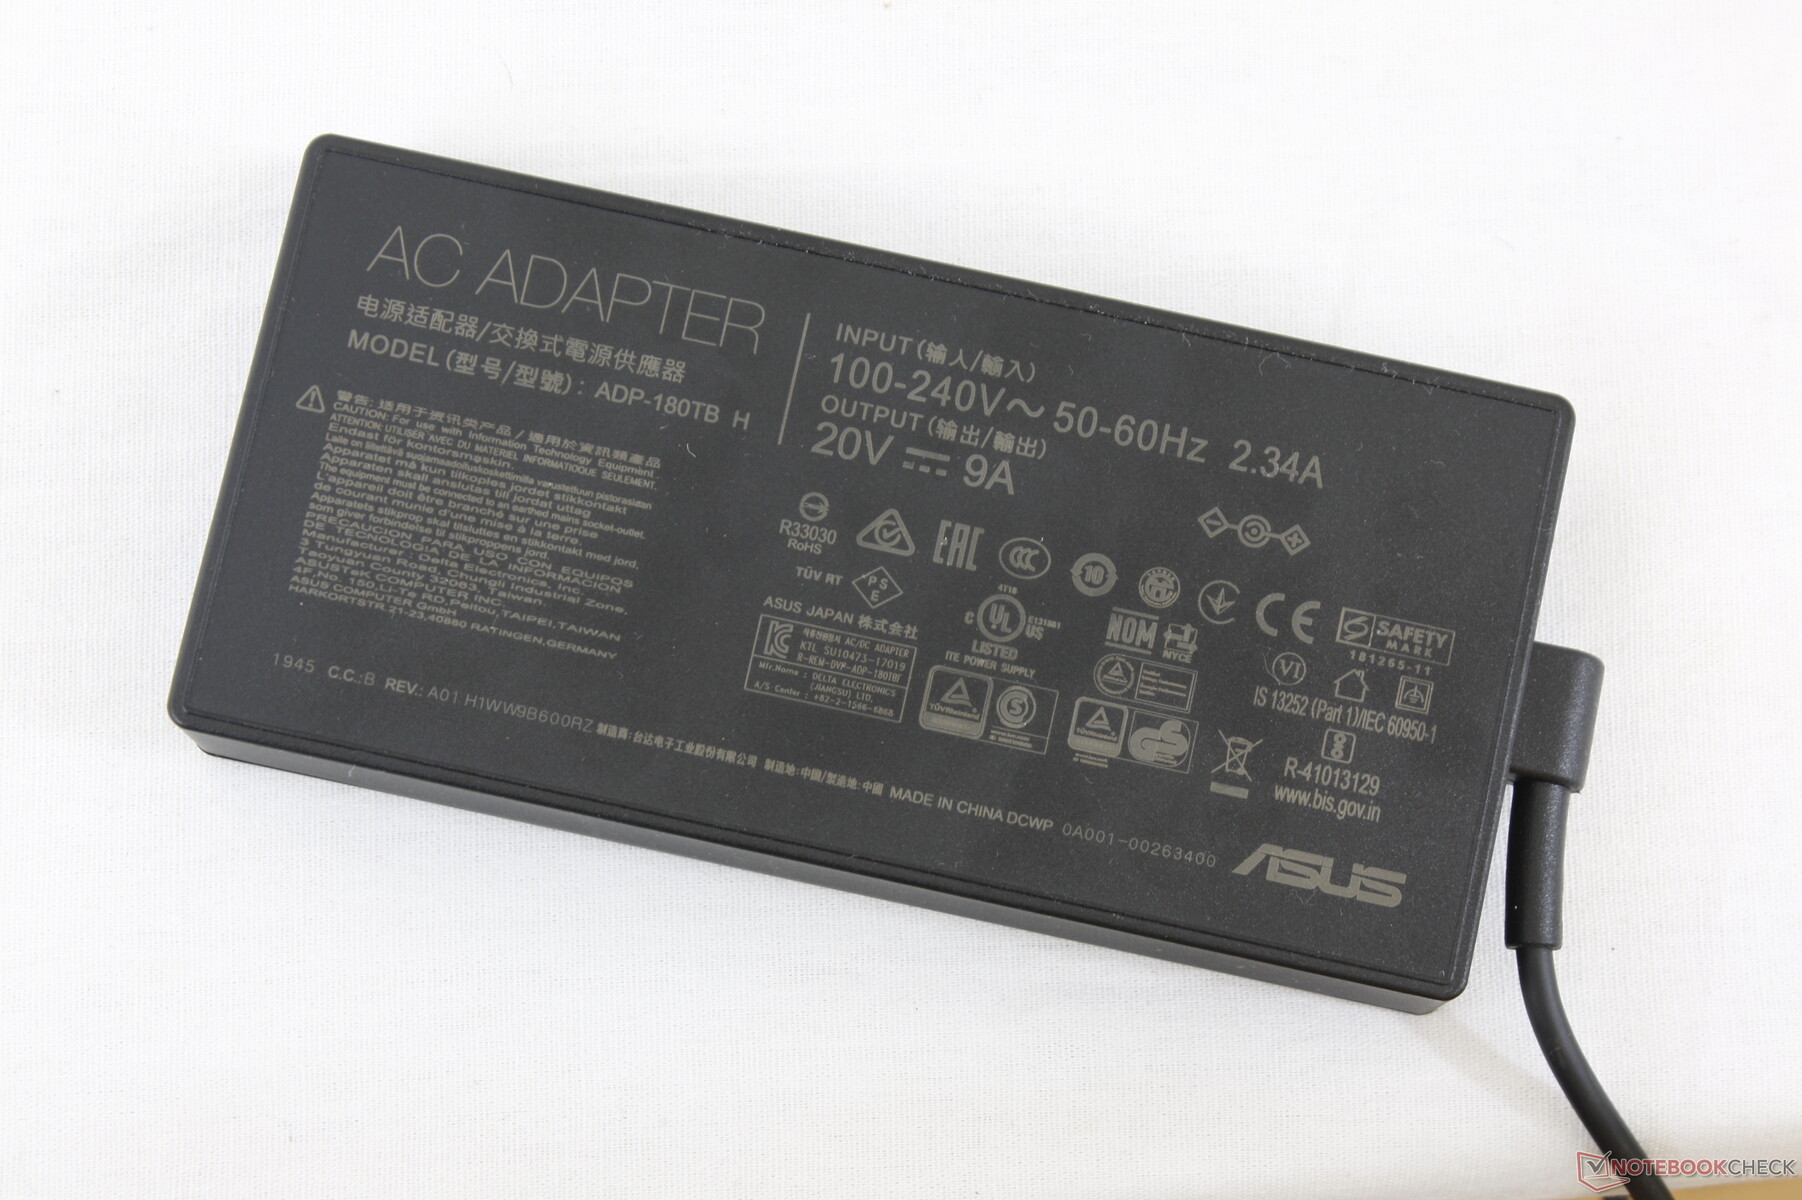
We're able to record a maximum draw of 140.2 W from the small-medium (~15.1 x 7.1 x 2.3 cm) 180 W AC adapter. This maximum drops to about 110 W over time as shown by our graphs below due to thermal limitations. Charge rate is not impacted when gaming.
| Off / Standby | |
| Idle | |
| Load |
|
Key:
min: | |
| Asus ROG Zephyrus G15 GA502IU-ES76 R7 4800HS, GeForce GTX 1660 Ti Max-Q, Intel SSD 660p 1TB SSDPEKNW010T8, IPS, 1920x1080, 15.6" | Asus ROG Zephyrus Duo 15 GX550LXS i9-10980HK, GeForce RTX 2080 Super Max-Q, 2x Samsung PM981a MZVLB1T0HBLR (RAID 0), IPS, 3840x2160, 15.6" | Asus ROG Zephyrus G15 GA502DU R7 3750H, GeForce GTX 1660 Ti Max-Q, Intel SSD 660p SSDPEKNW512G8, IPS, 1920x1080, 15.6" | Razer Blade 15 RTX 2070 Super Max-Q i7-10875H, GeForce RTX 2070 Super Max-Q, Samsung SSD PM981a MZVLB512HBJQ, IPS, 1920x1080, 15.6" | Lenovo Legion 5 15IMH05H i5-10300H, GeForce RTX 2060 Mobile, Samsung PM991 MZALQ512HALU, IPS, 1920x1080, 15.6" | MSI GS66 Stealth 10SE-045 i7-10750H, GeForce RTX 2060 Mobile, Samsung SSD PM981 MZVLB1T0HALR, IPS, 1920x1080, 15.6" | Eluktronics RP-15 R7 4800H, GeForce RTX 2060 Mobile, Phison PM81000GPMQCN28BTF-E12S4 M.2 NVM SSD, IPS, 1920x1080, 15.6" | |
|---|---|---|---|---|---|---|---|
| Power Consumption | -204% | -68% | -147% | -17% | -95% | -176% | |
| Idle Minimum * (Watt) | 5.1 | 23 -351% | 7.4 -45% | 14.3 -180% | 3.2 37% | 7 -37% | 21.7 -325% |
| Idle Average * (Watt) | 8.4 | 30 -257% | 8.6 -2% | 22.3 -165% | 8.3 1% | 18 -114% | 30.1 -258% |
| Idle Maximum * (Watt) | 9.1 | 39 -329% | 39.1 -330% | 36.9 -305% | 8.7 4% | 31 -241% | 35 -285% |
| Load Average * (Watt) | 55.1 | 156 -183% | 65.9 -20% | 118.4 -115% | 82 -49% | 107 -94% | 112.6 -104% |
| Witcher 3 ultra * (Watt) | 97.5 | 152 -56% | 106.9 -10% | 153.7 -58% | 151 -55% | 146 -50% | 134.4 -38% |
| Load Maximum * (Watt) | 140.2 | 208 -48% | 141.3 -1% | 220.8 -57% | 195 -39% | 186 -33% | 201.5 -44% |
* ... smaller is better
Battery Life
Runtimes are worse than what we recorded on last year's GA502DU despite the higher power efficiency mentioned above. Users can expect just over 5 hours of real-world WLAN use when on the Balanced power profile with Optimus enabled for the iGPU. We're not sure why the results aren't what we were expecting them to be, but we want to put the blame on the confusing Asus power profiles which can clash with the preset Windows power profiles.
Recharging from empty to full capacity takes about 2 hours. The system can be recharged via USB-C as well.
| Asus ROG Zephyrus G15 GA502IU-ES76 R7 4800HS, GeForce GTX 1660 Ti Max-Q, 76 Wh | Asus ROG Zephyrus Duo 15 GX550LXS i9-10980HK, GeForce RTX 2080 Super Max-Q, 90 Wh | Asus ROG Zephyrus G15 GA502DU R7 3750H, GeForce GTX 1660 Ti Max-Q, 76 Wh | Razer Blade 15 RTX 2070 Super Max-Q i7-10875H, GeForce RTX 2070 Super Max-Q, 80 Wh | Lenovo Legion 5 15IMH05H i5-10300H, GeForce RTX 2060 Mobile, 60 Wh | MSI GS66 Stealth 10SE-045 i7-10750H, GeForce RTX 2060 Mobile, 99.9 Wh | Eluktronics RP-15 R7 4800H, GeForce RTX 2060 Mobile, 46.7 Wh | |
|---|---|---|---|---|---|---|---|
| Battery runtime | -22% | 59% | 19% | 36% | 4% | -32% | |
| Reader / Idle (h) | 7.1 | 8 13% | 15.3 115% | 14.1 99% | 9 27% | ||
| WiFi v1.3 (h) | 5.3 | 3.1 -42% | 8 51% | 6.3 19% | 7.2 36% | 6.4 21% | 3.6 -32% |
| Load (h) | 1.9 | 1.2 -37% | 2.1 11% | 1.4 -26% | 1.2 -37% |
Pros
Cons
Verdict

There's no doubt that the Zephyrus G15 GA502IU is a huge improvement over the GA502DU in terms of processor horsepower. Performance-per-watt is amazing due to the combination of a 7 nm Ryzen CPU and GeForce Max-Q GPU while the chassis is both small and attractive for the price. When up against budget competitors like the Acer Nitro 5, MSI GL/GF series, Dell G series, or Aorus G series, the Zephyrus G15 is definitely going to standout.
The main drawbacks to the GA502IU are its price and display. For $1300 USD, the system is more expensive than most other alternatives out there with the same GeForce GTX 1660 Ti GPU. You're essentially paying extra for the new AMD CPU and sleek chassis design that many budget gaming laptops don't have. Meanwhile, the average color space and response times from the 144 Hz panel are somewhat disappointing. The higher-end 240 Hz configuration supposedly addresses these concerns, but such an option will require more from your wallet. This is still a great budget mid-range gaming laptop especially if you can find one on sale.
The Asus Zephyrus G15 GA502IU offers excellent processor performance in an attractive chassis design that's hard to beat for the price. Graphics horsepower, keyboard feedback, display response times and color accuracy, however, are a bit underwhelming. It's a shame that such a great processor isn't more widely available on other models at the moment.
Asus ROG Zephyrus G15 GA502IU-ES76
- 09/10/2020 v7 (old)
Allen Ngo
Price comparison
