Dell XPS 15 9500 Core i7 GeForce GTX 1650 Ti Laptop Review: No Core i9 Nonsense
(June 11 update: Right after we finished this review, Dell announced an even faster Core i9-10885H option for the XPS 15 9500. Our original text below remains unchanged.)
Last week, we checked out the least expensive Dell XPS 15 9500 configuration equipped with the quad-core Core i5-10300H CPU, integrated UHD Graphics 630 GPU, and matte FHD+ display for $1300 USD. This week, we're here to see how the system looks from the other side of the spectrum for users willing to spend $2400 on the highest-end octa-core Core i7-10875H, GeForce GTX 1650 Ti, and 4K UHD touchscreen configuration.
For more information on the new chassis and physical features of the 2020 XPS 15, please see our existing review on the XPS 15 9500 Core i5. This review will focus on the performance of the Core i7 configuration and how it differs from the base Core i5 option and the older XPS 15 7590 series.
More Dell reviews:
Rating | Date | Model | Weight | Height | Size | Resolution | Price |
|---|---|---|---|---|---|---|---|
| 90.1 % v7 (old) | 06 / 2020 | Dell XPS 15 9500 Core i7 4K UHD i7-10875H, GeForce GTX 1650 Ti Mobile | 2 kg | 18 mm | 15.60" | 3840x2400 | |
| 86 % v7 (old) | 12 / 2019 | Lenovo Yoga C940-15IRH i7-9750H, GeForce GTX 1650 Max-Q | 2 kg | 19.7 mm | 15.60" | 1920x1080 | |
| 85.2 % v7 (old) | 03 / 2020 | Asus ZenBook 15 UX534FTC-A8190T i7-10510U, GeForce GTX 1650 Max-Q | 1.6 kg | 18.9 mm | 15.60" | 1920x1080 | |
| 85.2 % v7 (old) | 11 / 2019 | MSI Prestige 15 A10SC i7-10710U, GeForce GTX 1650 Max-Q | 1.7 kg | 16 mm | 15.60" | 3840x2160 | |
| 86.8 % v7 (old) | 05 / 2020 | Dell XPS 15 9500 Core i5 i5-10300H, UHD Graphics 630 | 1.8 kg | 18 mm | 15.60" | 1920x1200 | |
| 89.7 % v7 (old) | 12 / 2019 | Apple MacBook Pro 16 2019 i9 5500M i9-9880H, Radeon Pro 5500M | 2 kg | 16.2 mm | 16.00" | 3072x1920 |
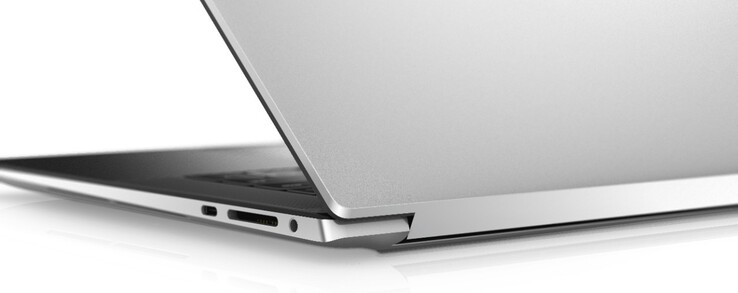
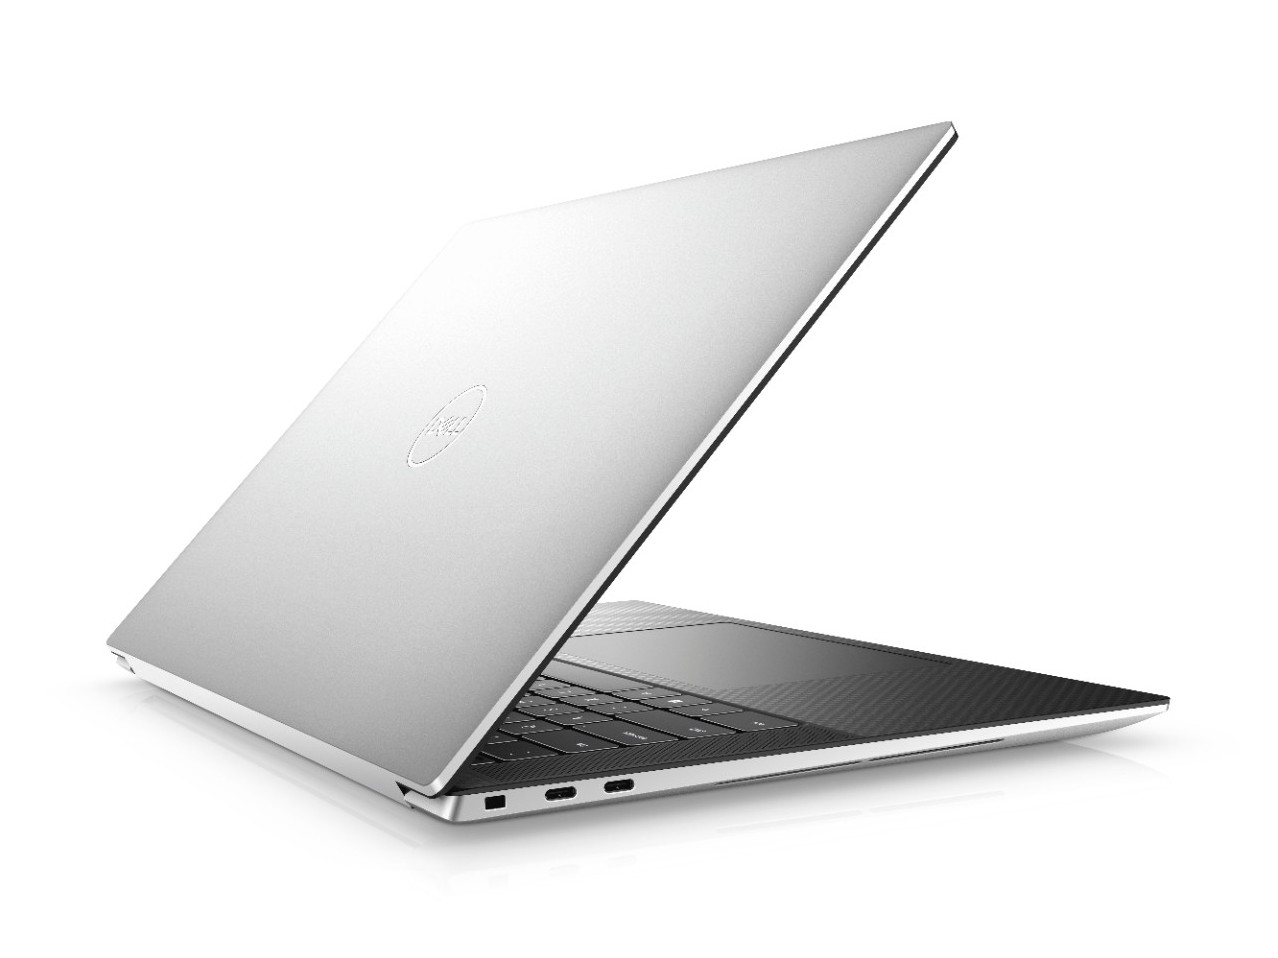
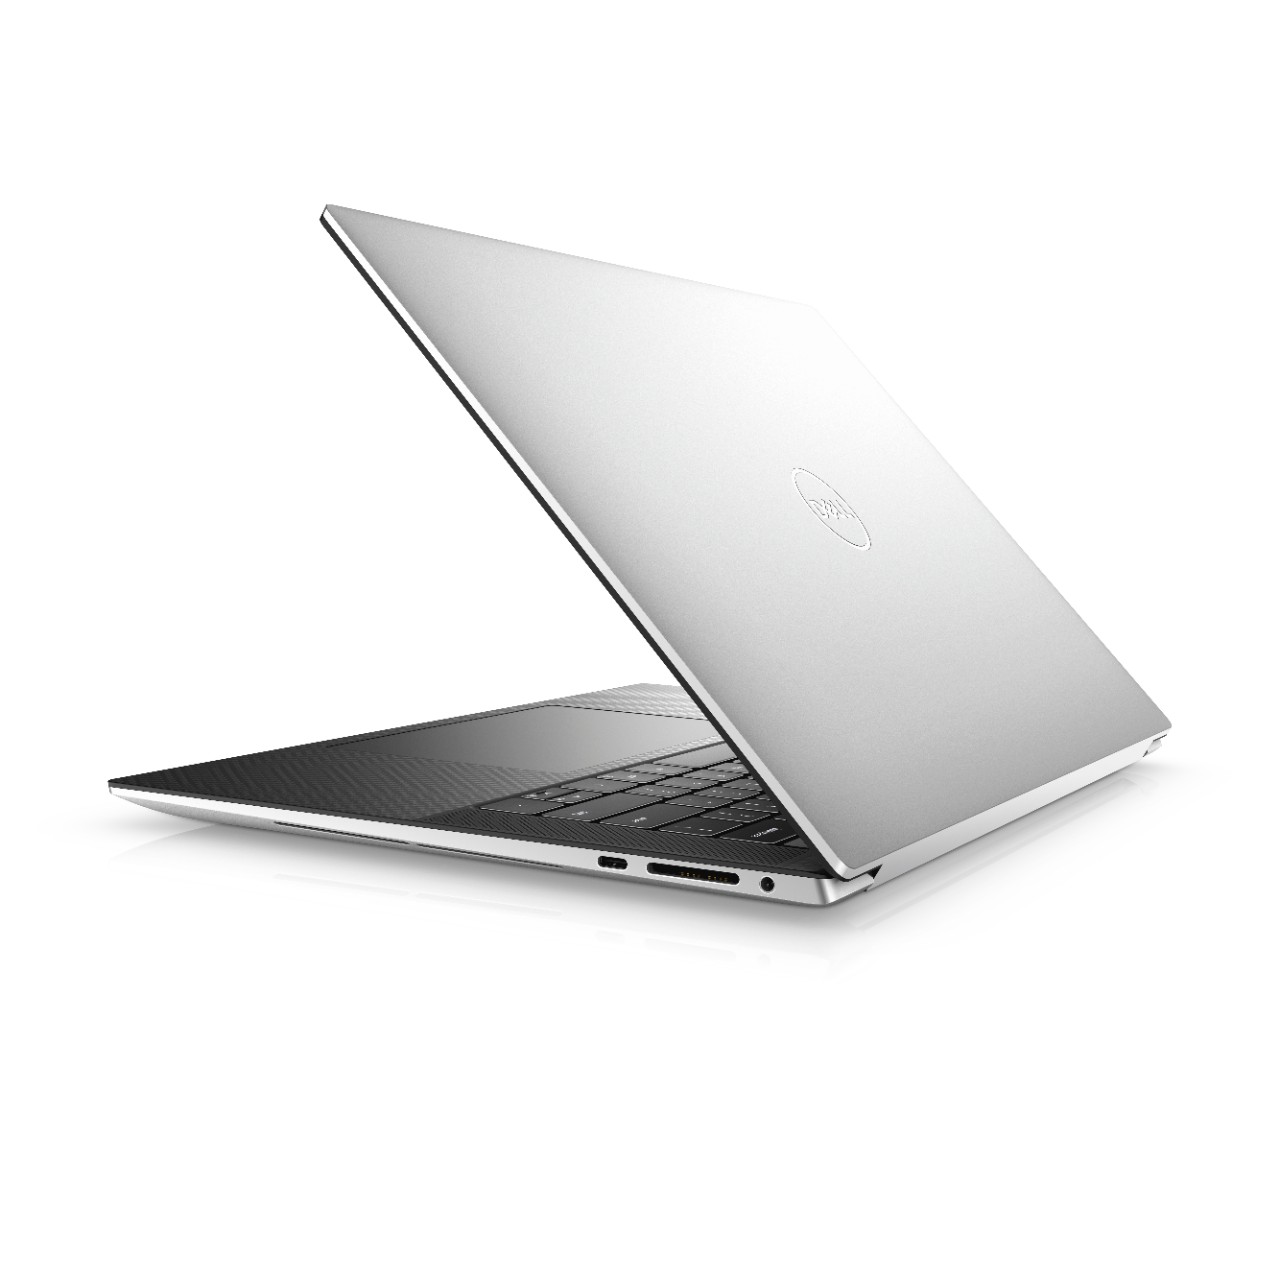
Case

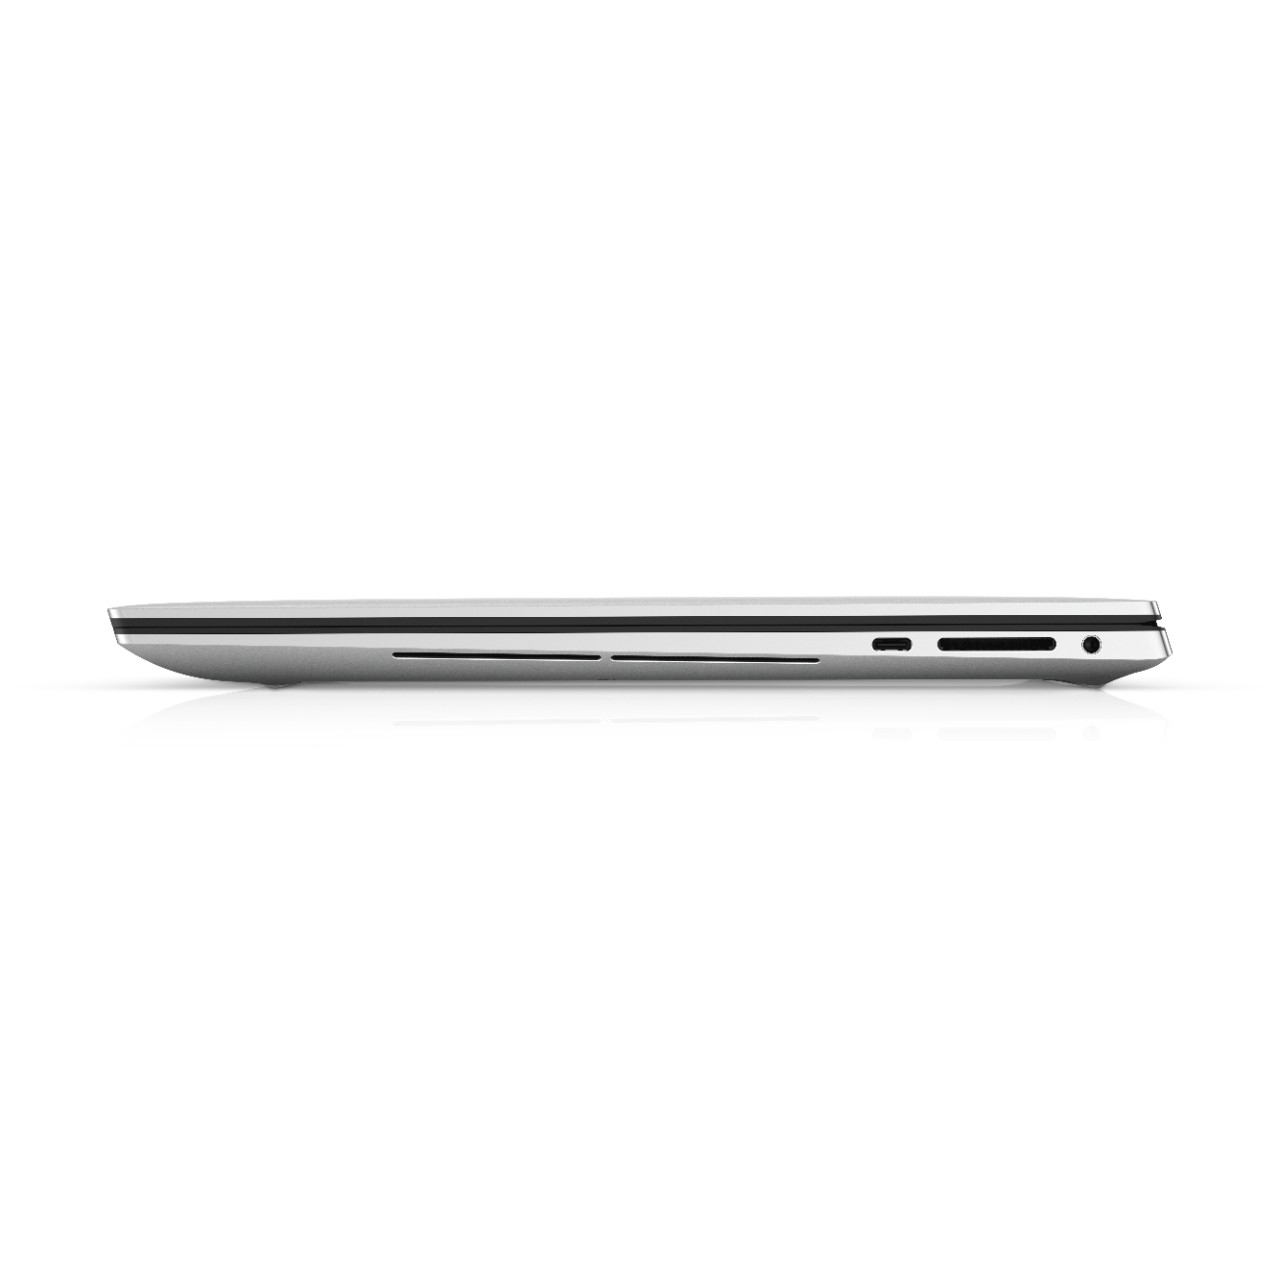
Connectivity
SD Card Reader
| SD Card Reader | |
| average JPG Copy Test (av. of 3 runs) | |
| Dell XPS 15 9500 Core i7 4K UHD (Toshiba Exceria Pro SDXC 64 GB UHS-II) | |
| Dell XPS 15 7590 9980HK GTX 1650 (Toshiba Exceria Pro SDXC 64 GB UHS-II) | |
| MSI Prestige 15 A10SC (Toshiba Exceria Pro M501 UHS-II) | |
| Dell XPS 15 9575 i5-8305G (Toshiba Exceria Pro M501 UHS-II) | |
| maximum AS SSD Seq Read Test (1GB) | |
| Dell XPS 15 9575 i5-8305G (Toshiba Exceria Pro M501 UHS-II) | |
| Dell XPS 15 9500 Core i7 4K UHD (Toshiba Exceria Pro SDXC 64 GB UHS-II) | |
| MSI Prestige 15 A10SC (Toshiba Exceria Pro M501 UHS-II) | |
| Dell XPS 15 7590 9980HK GTX 1650 (Toshiba Exceria Pro SDXC 64 GB UHS-II) | |
Communication
All SKUs integrate the Killer 1650s for Wi-Fi 6 connectivity. We experienced no issues when connected to our Netgear RAX200 router.
Webcam


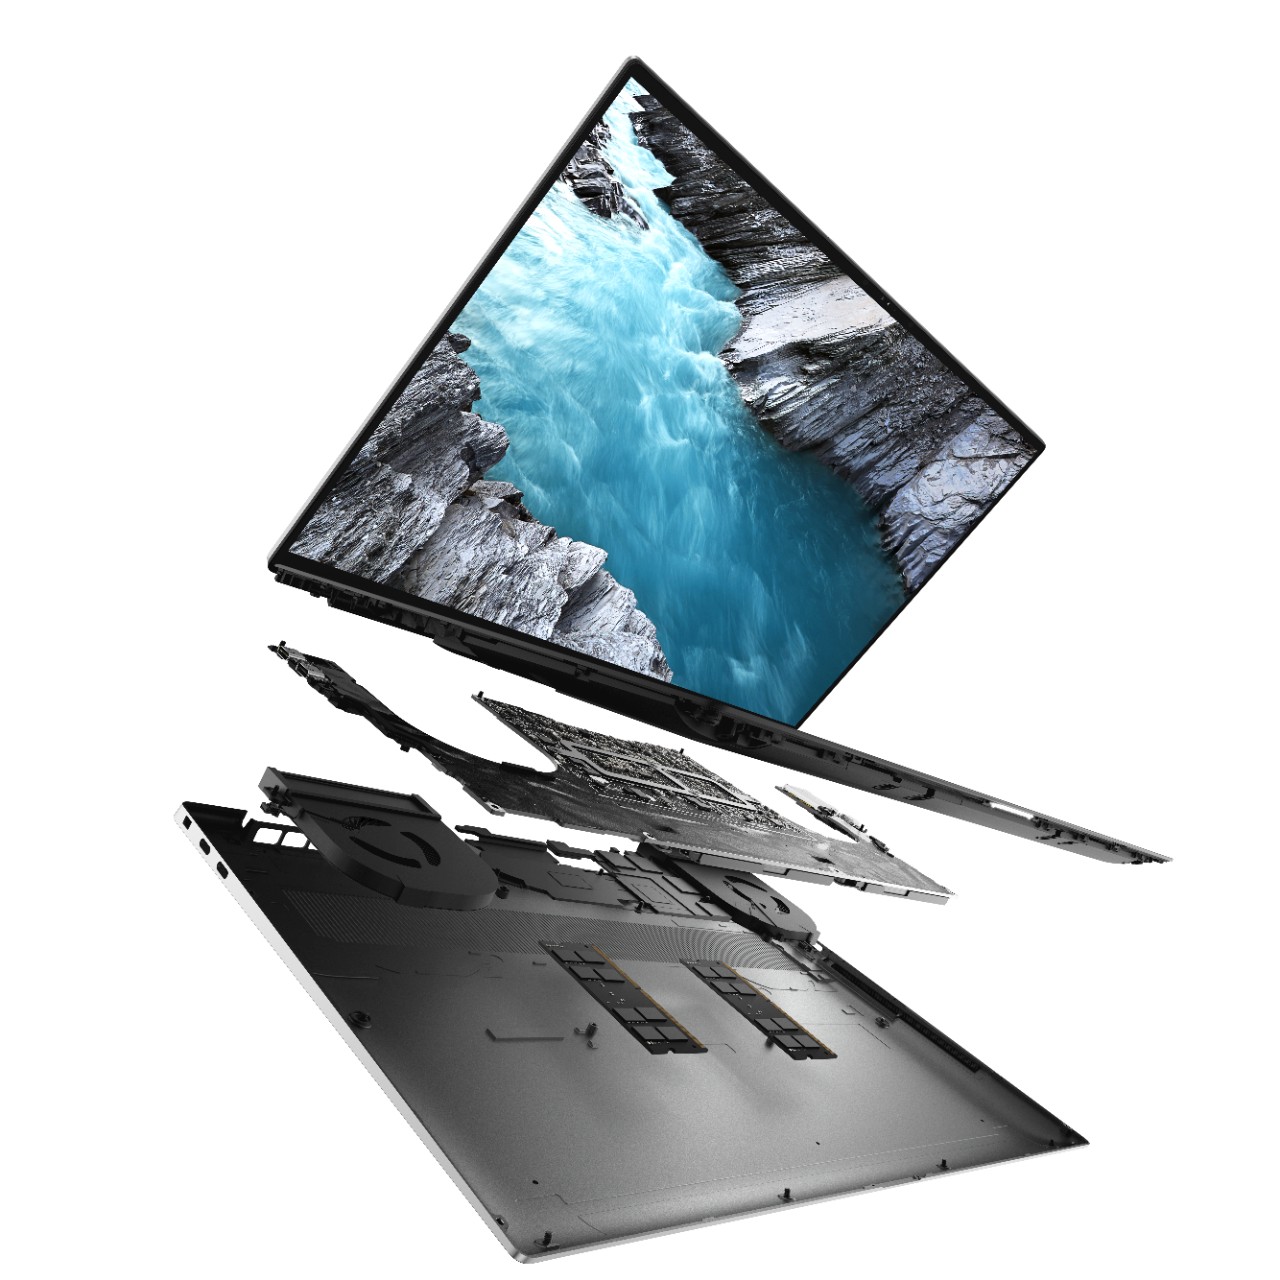
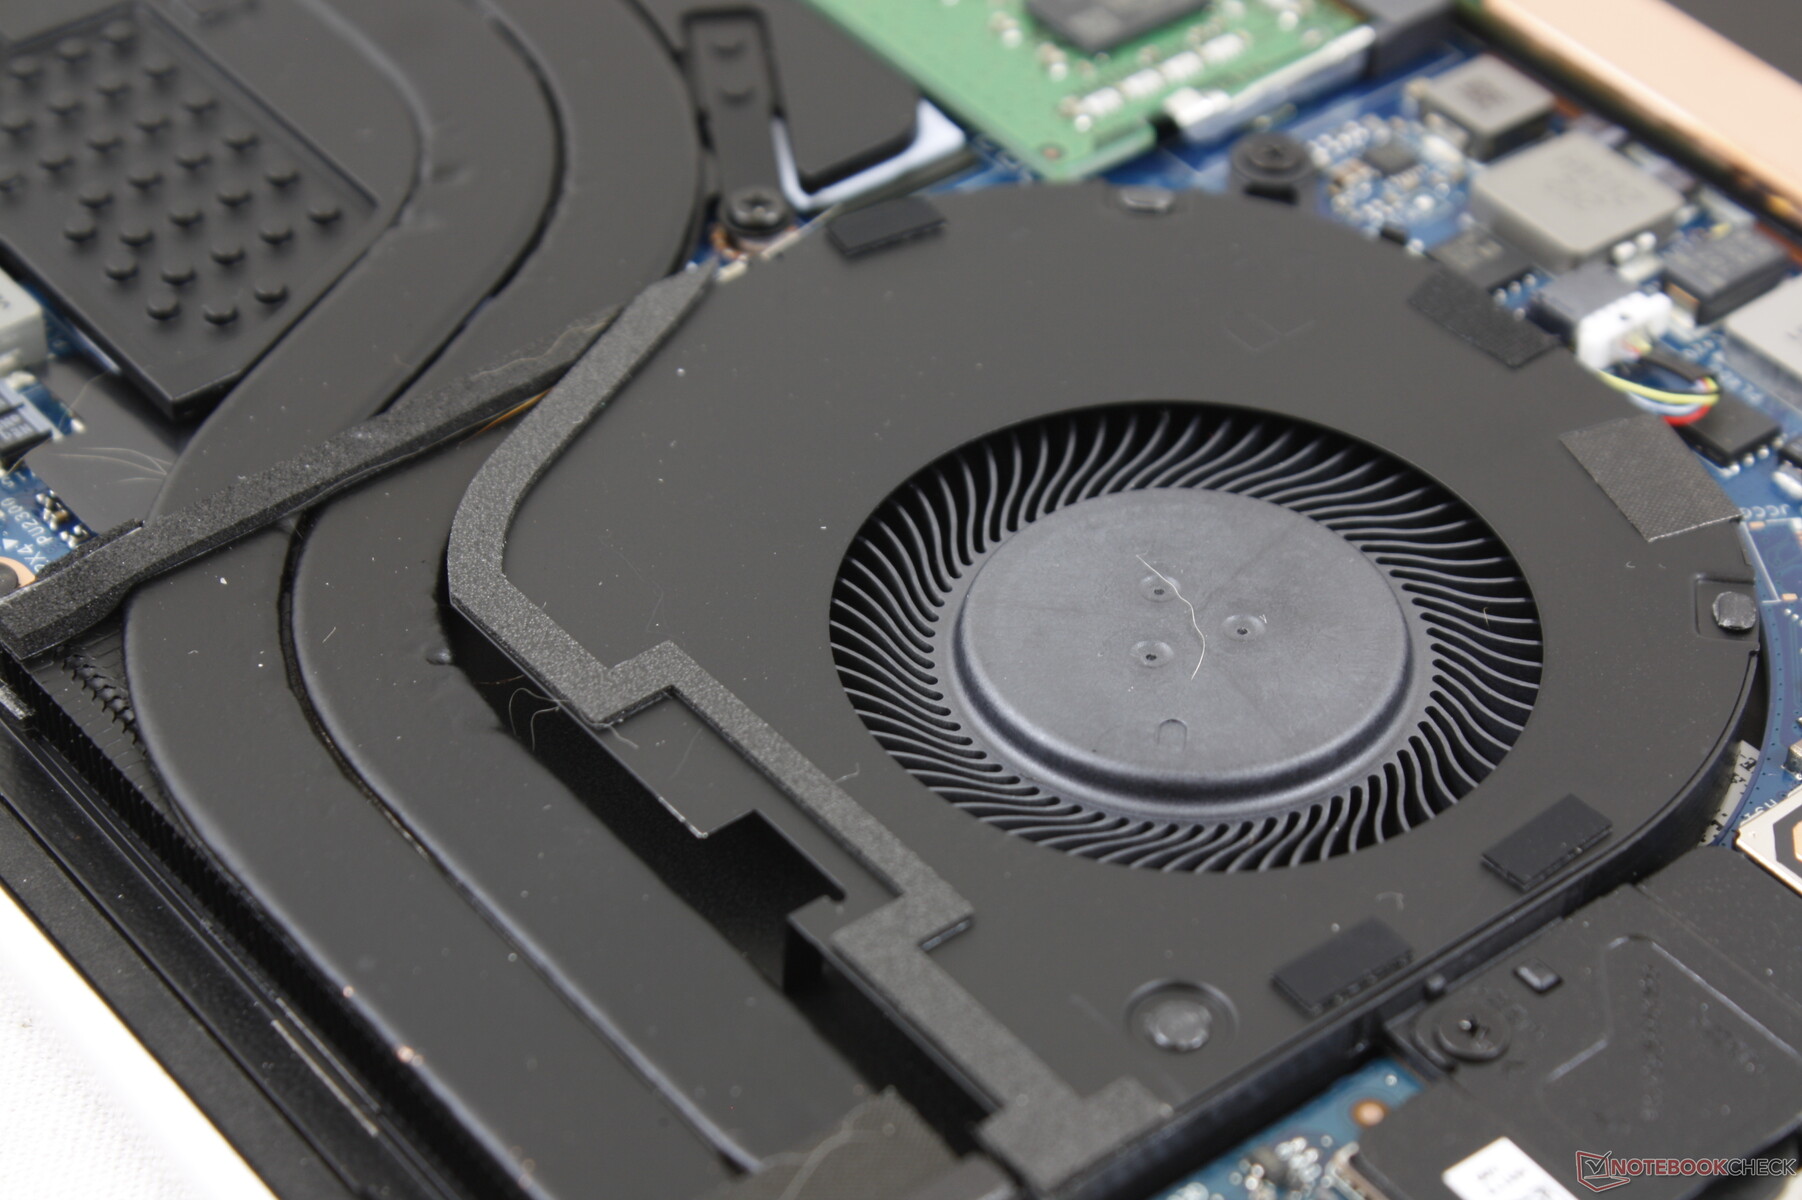
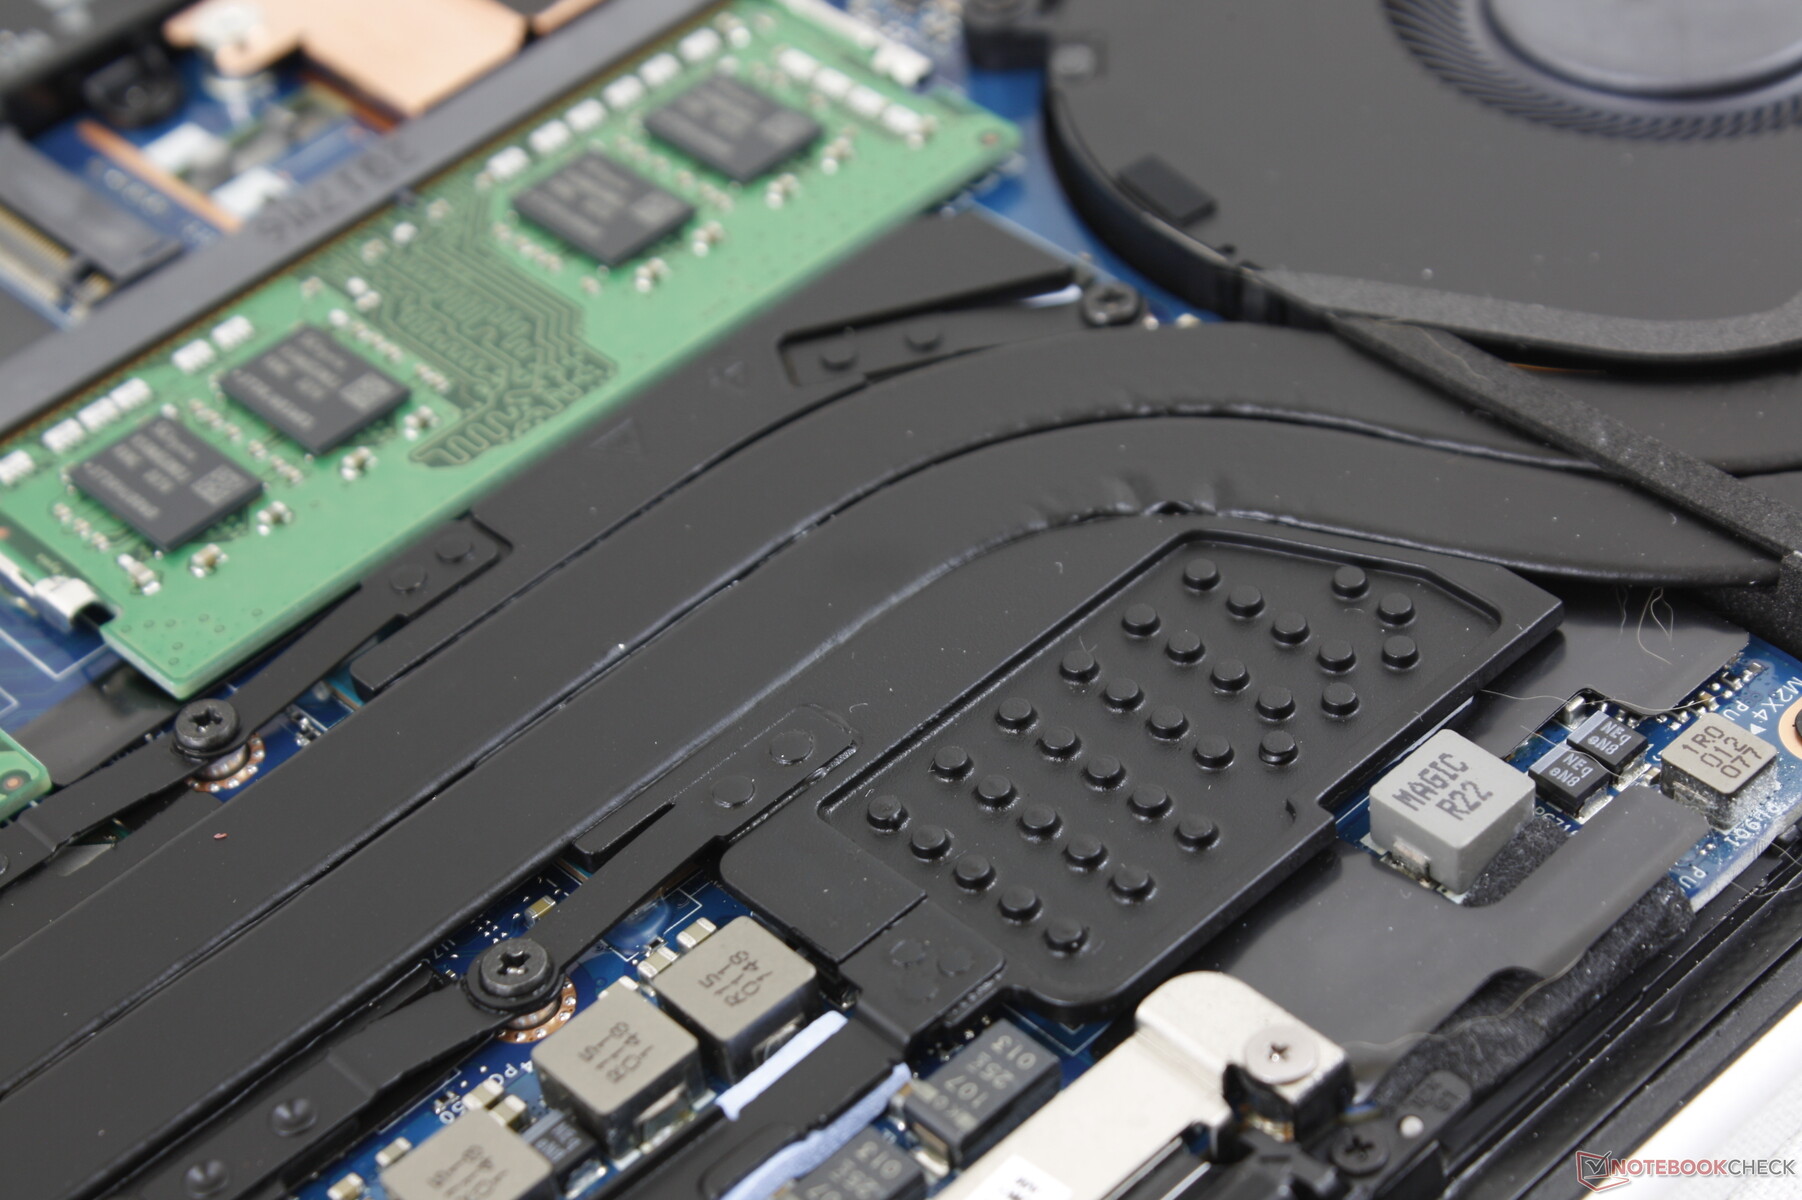
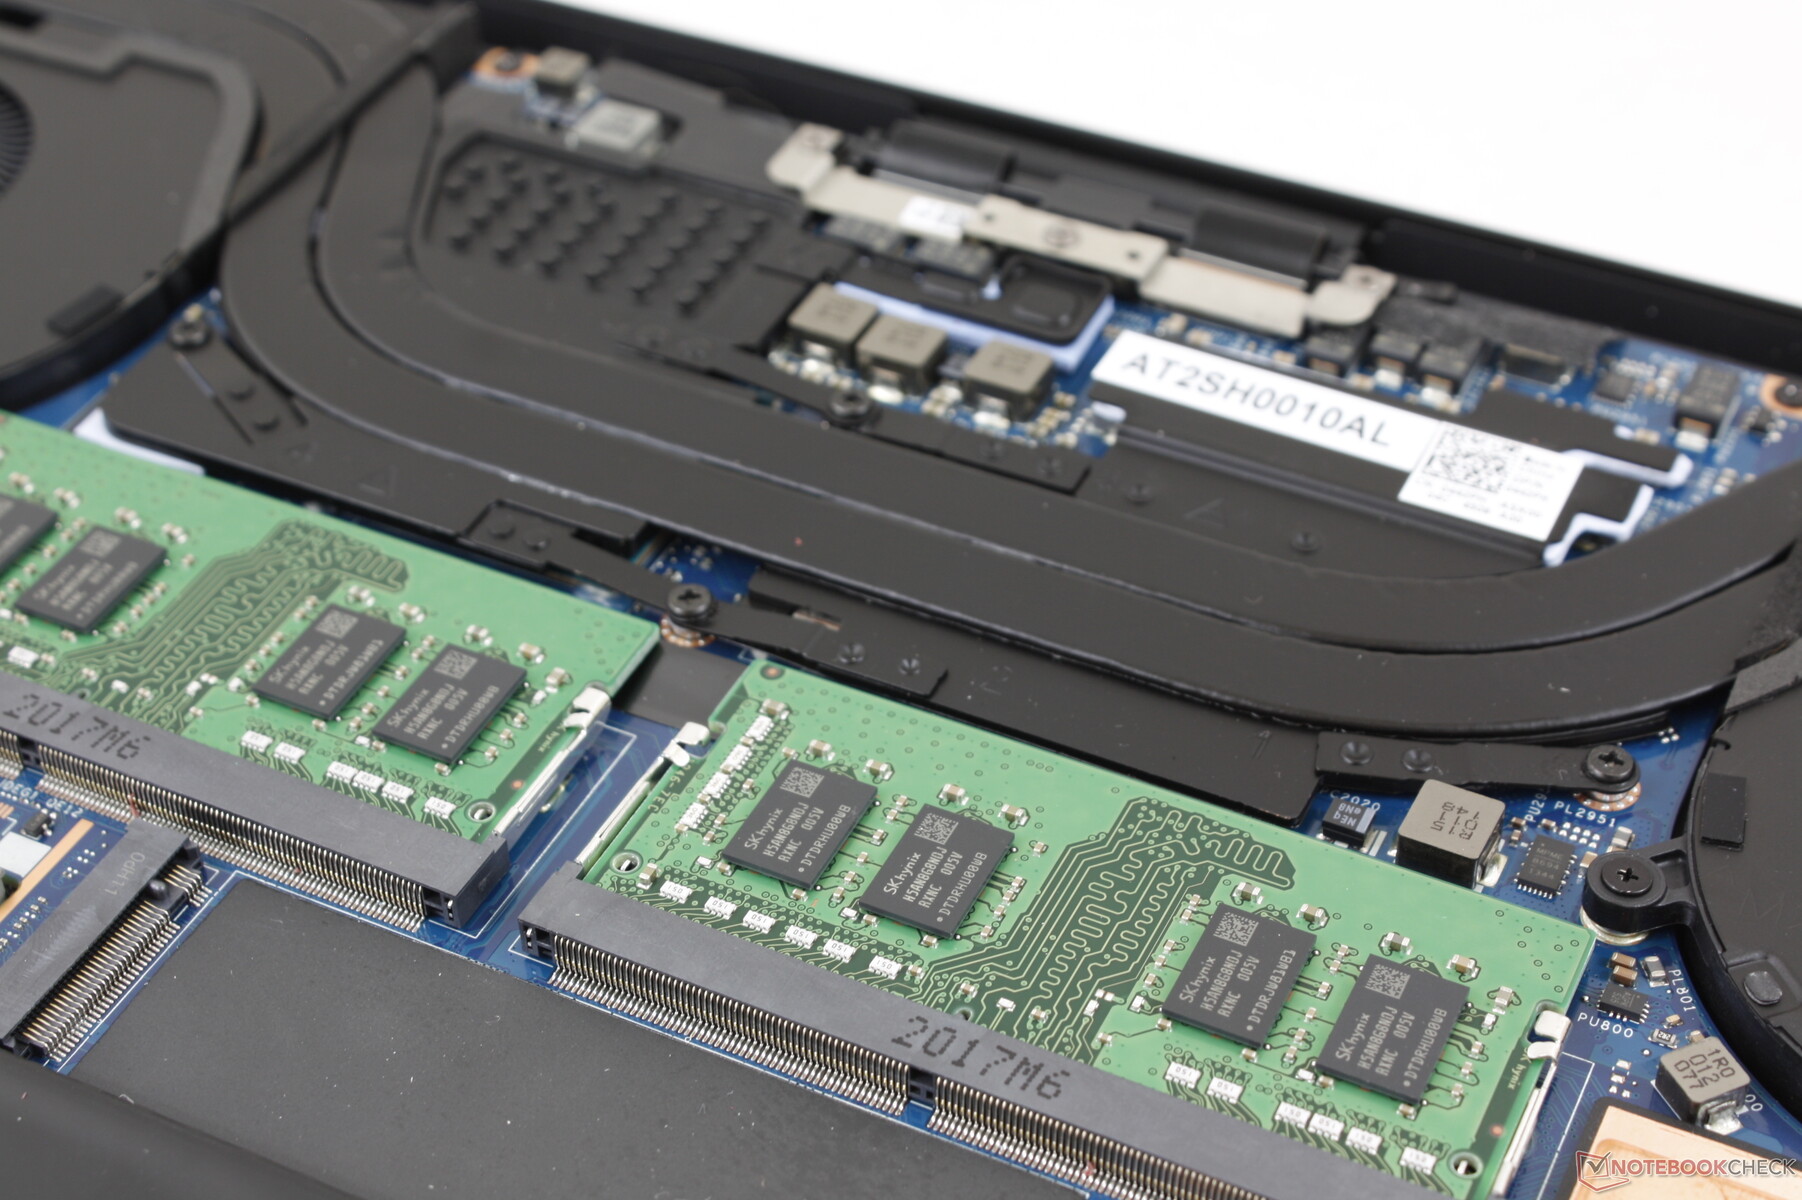
Maintenance
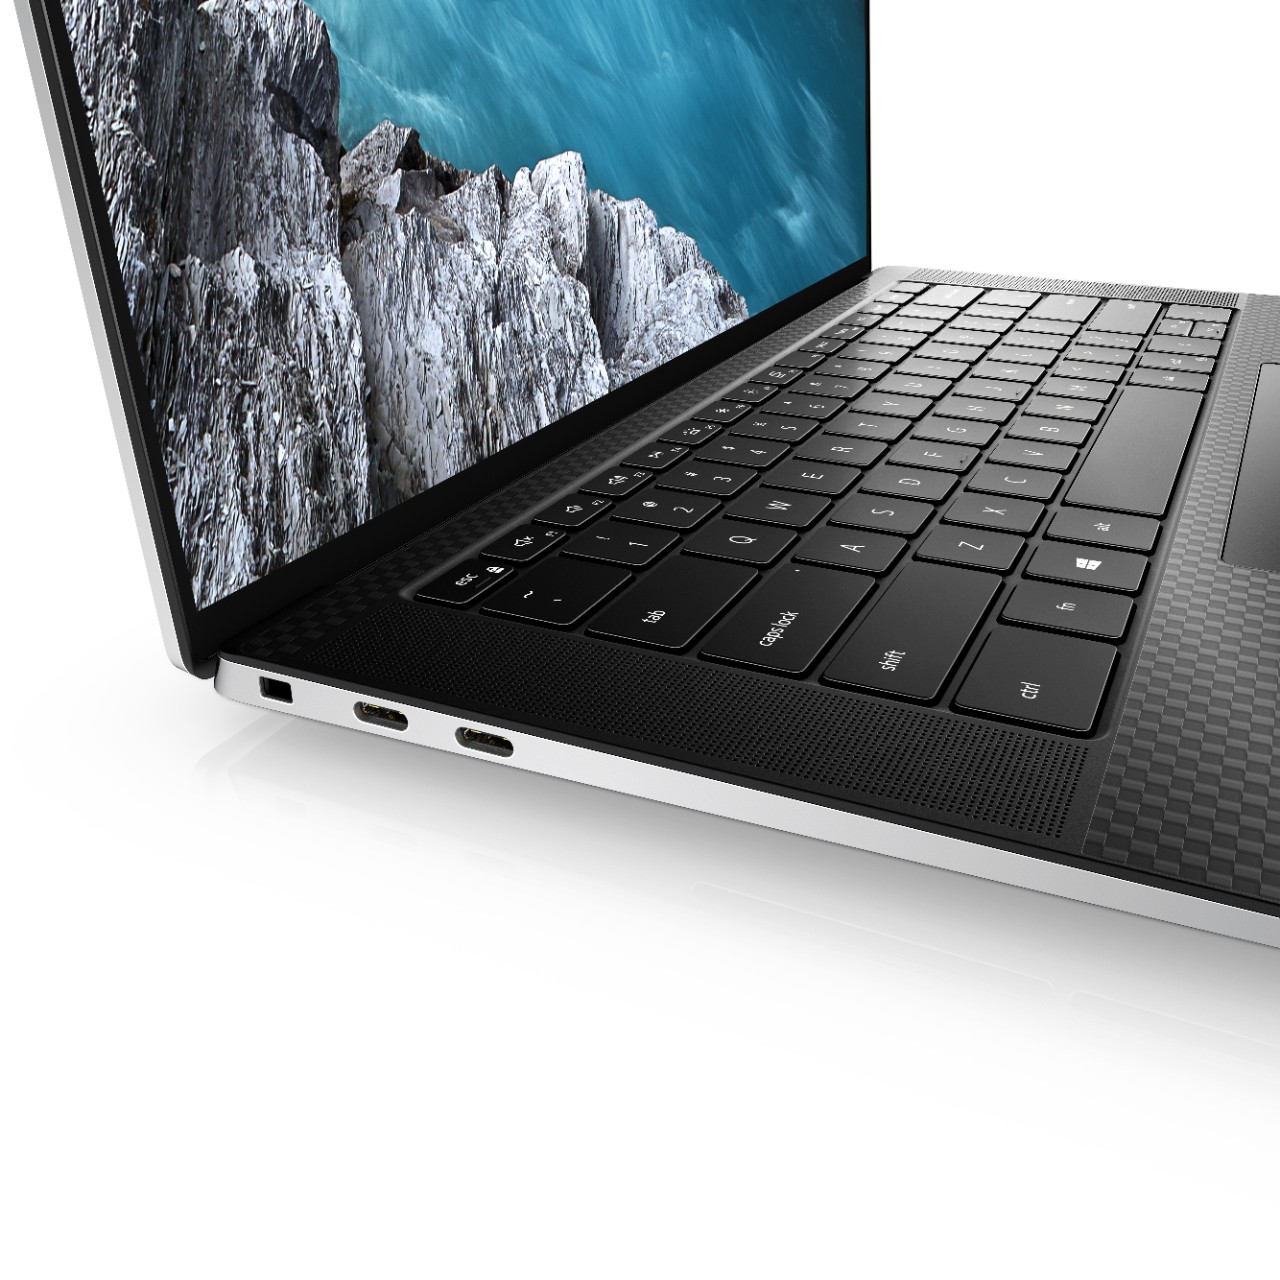
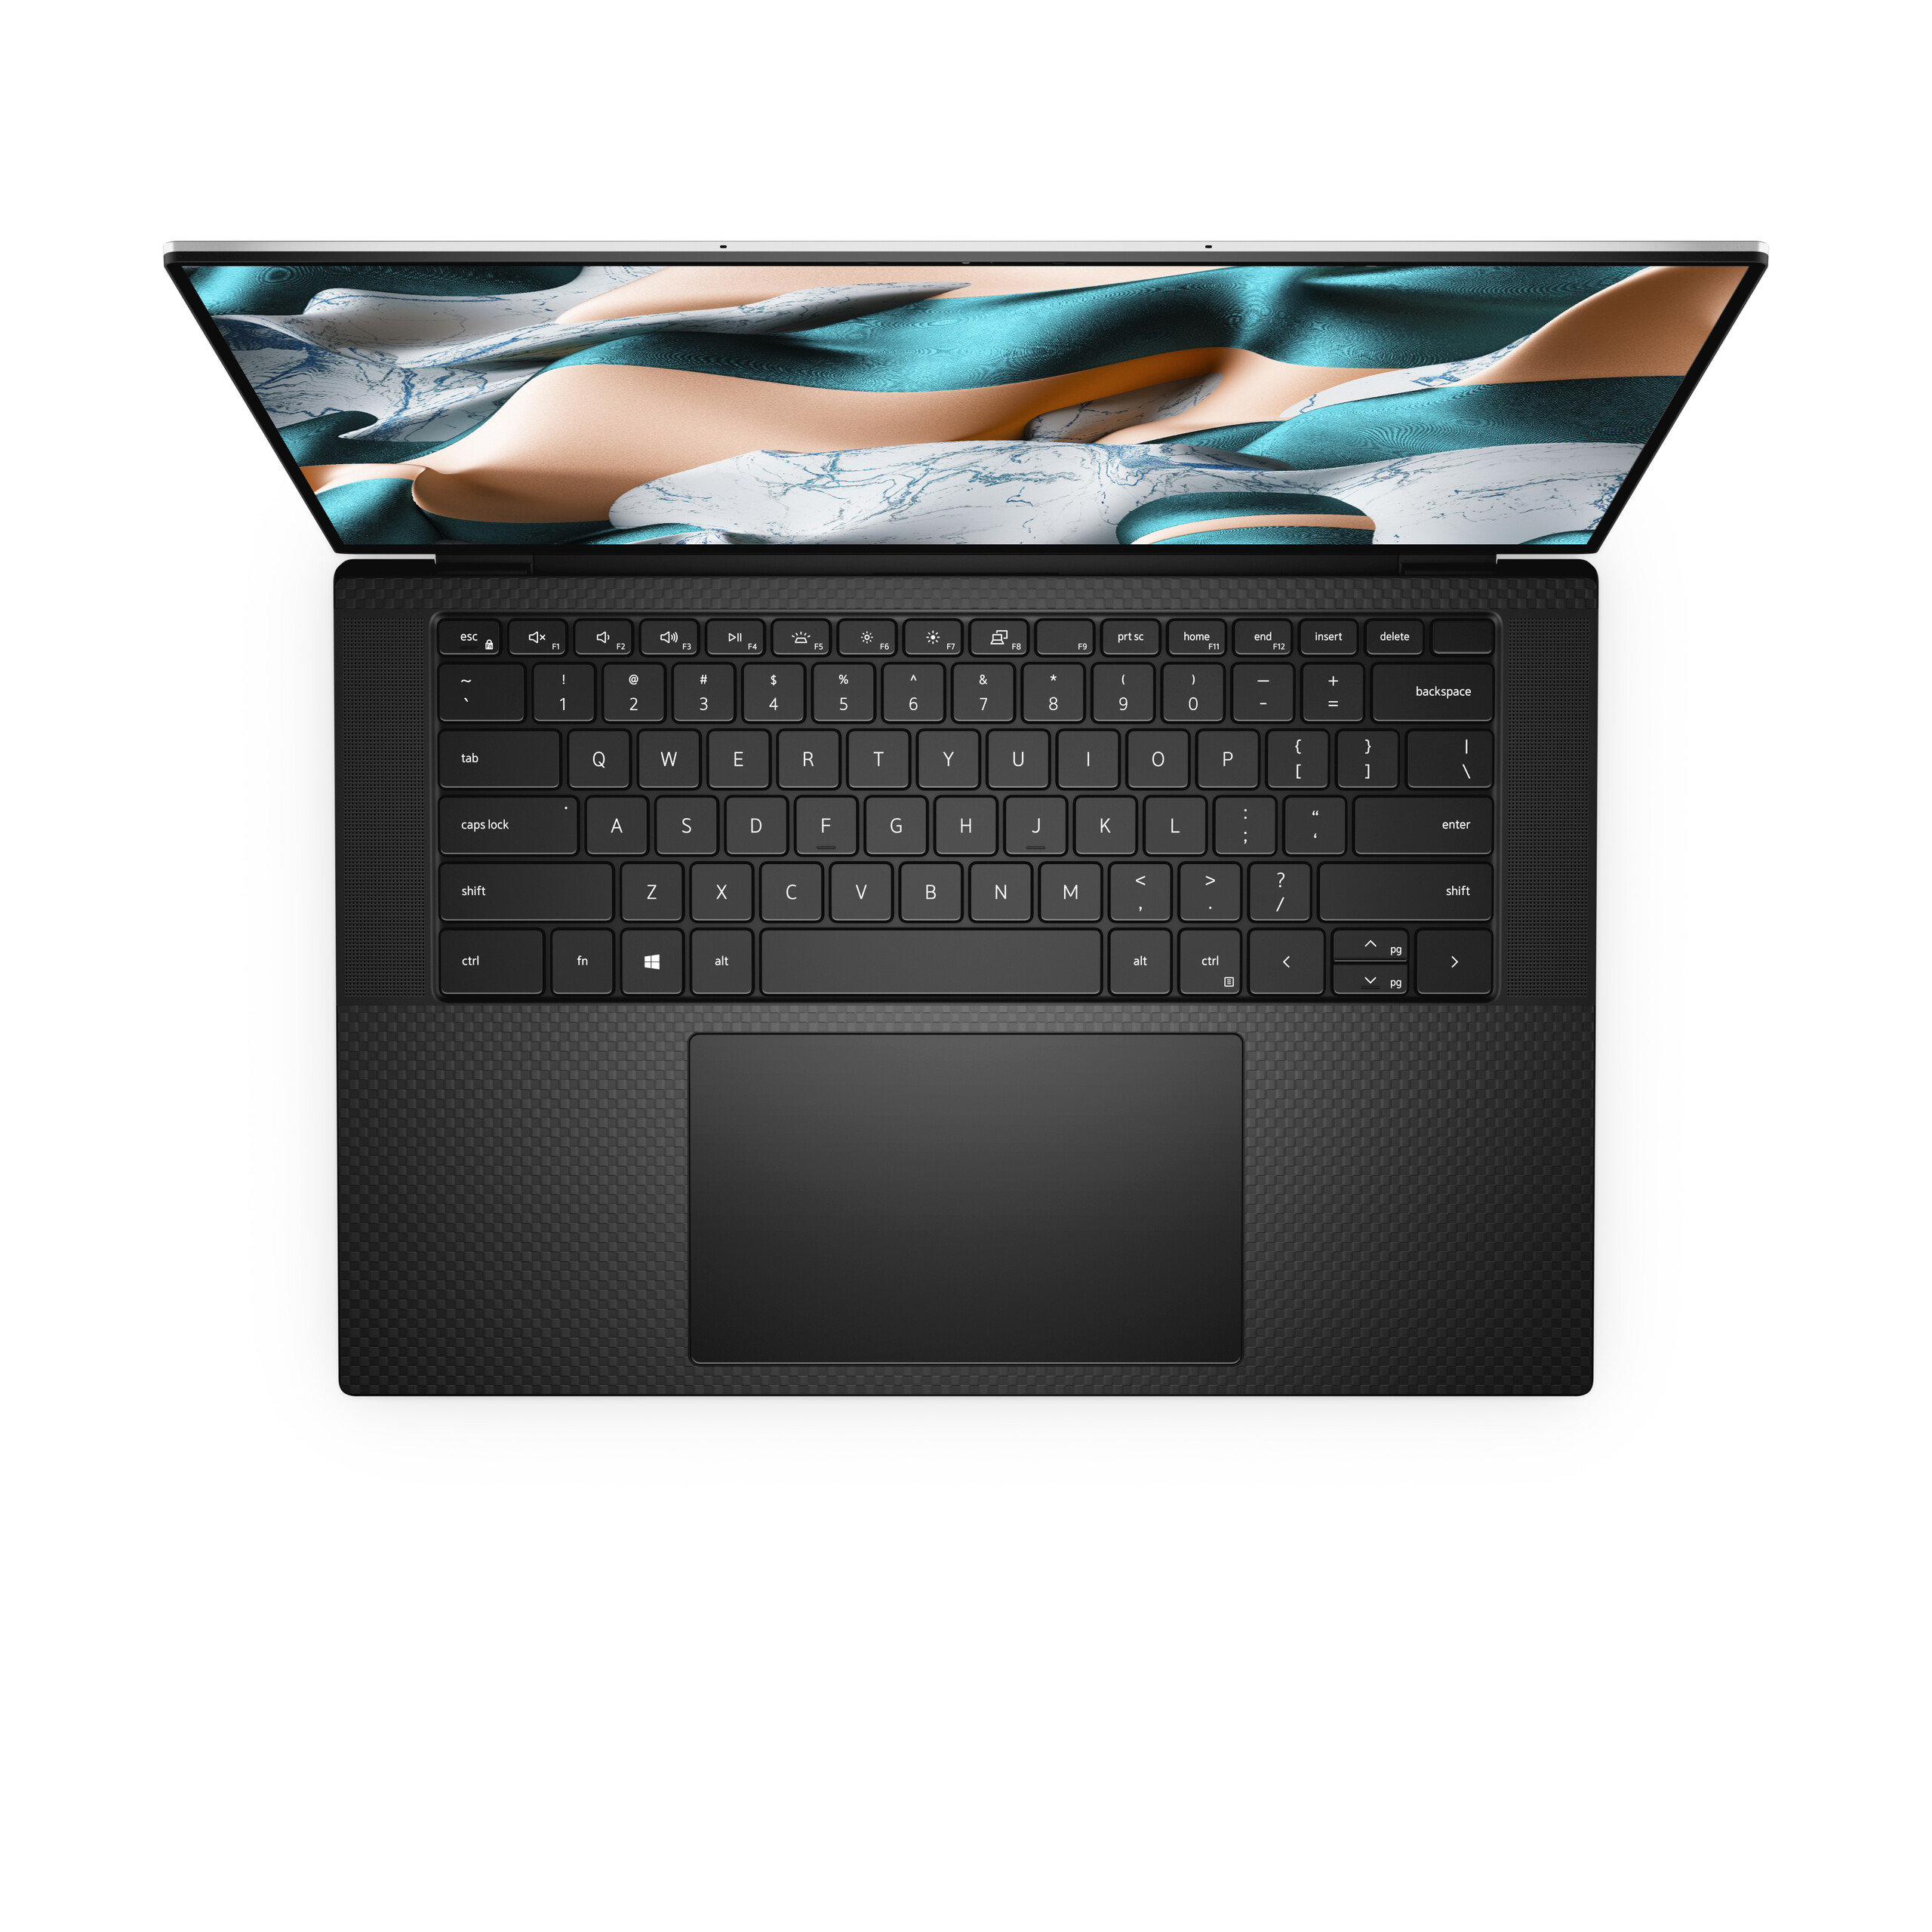
Input Devices
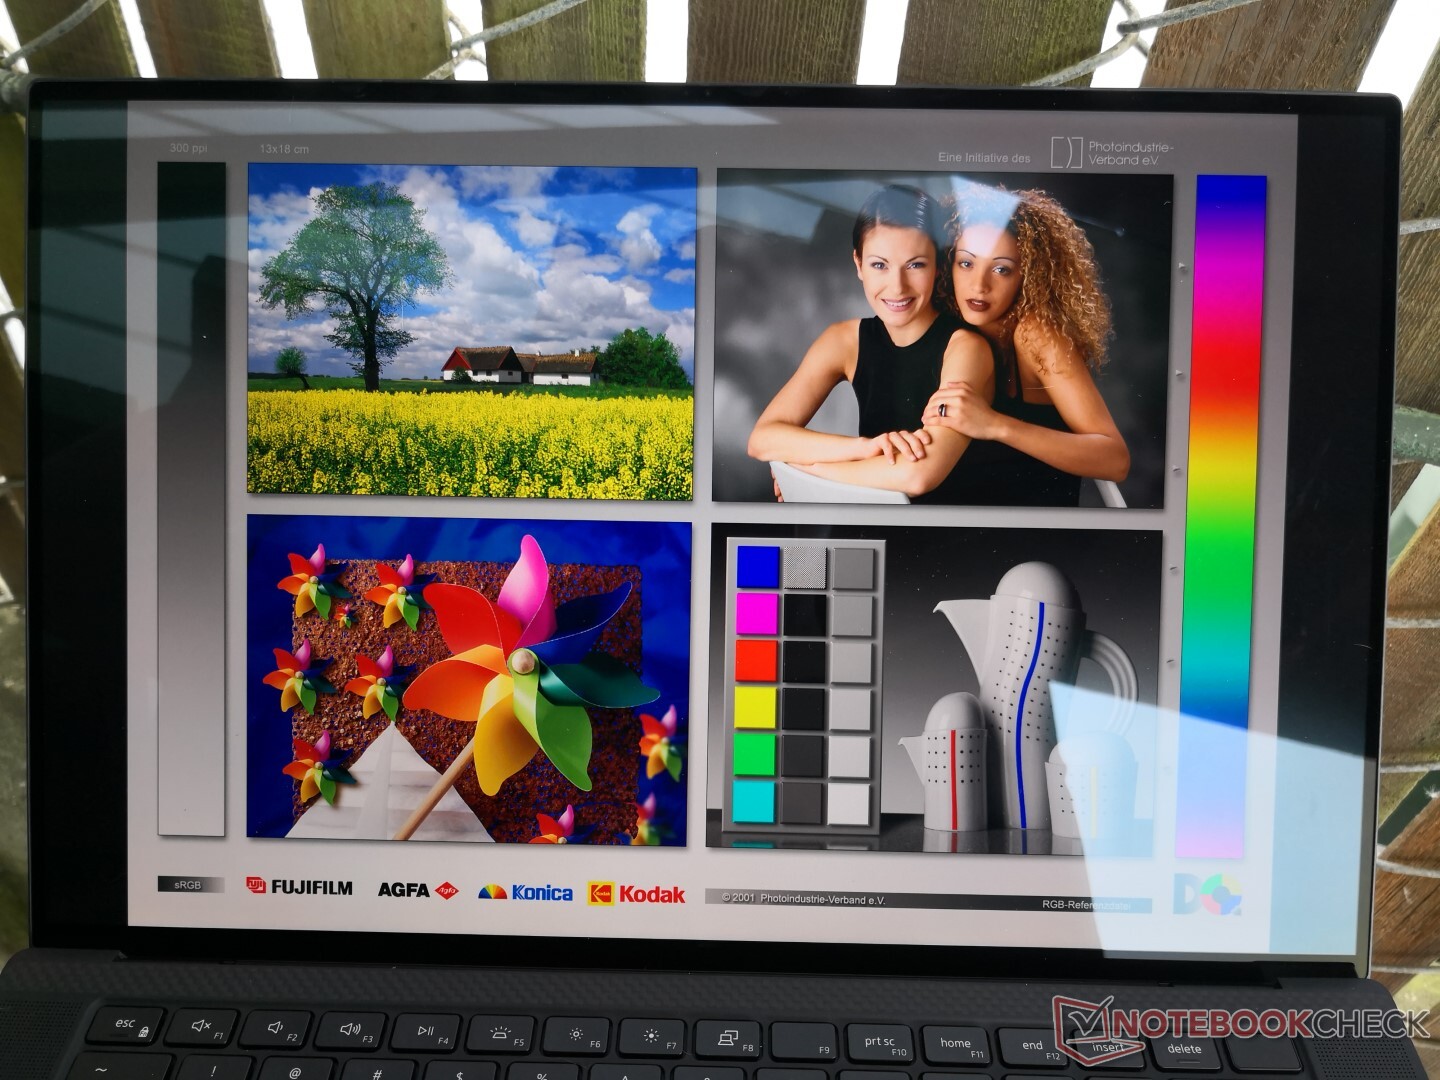
Display
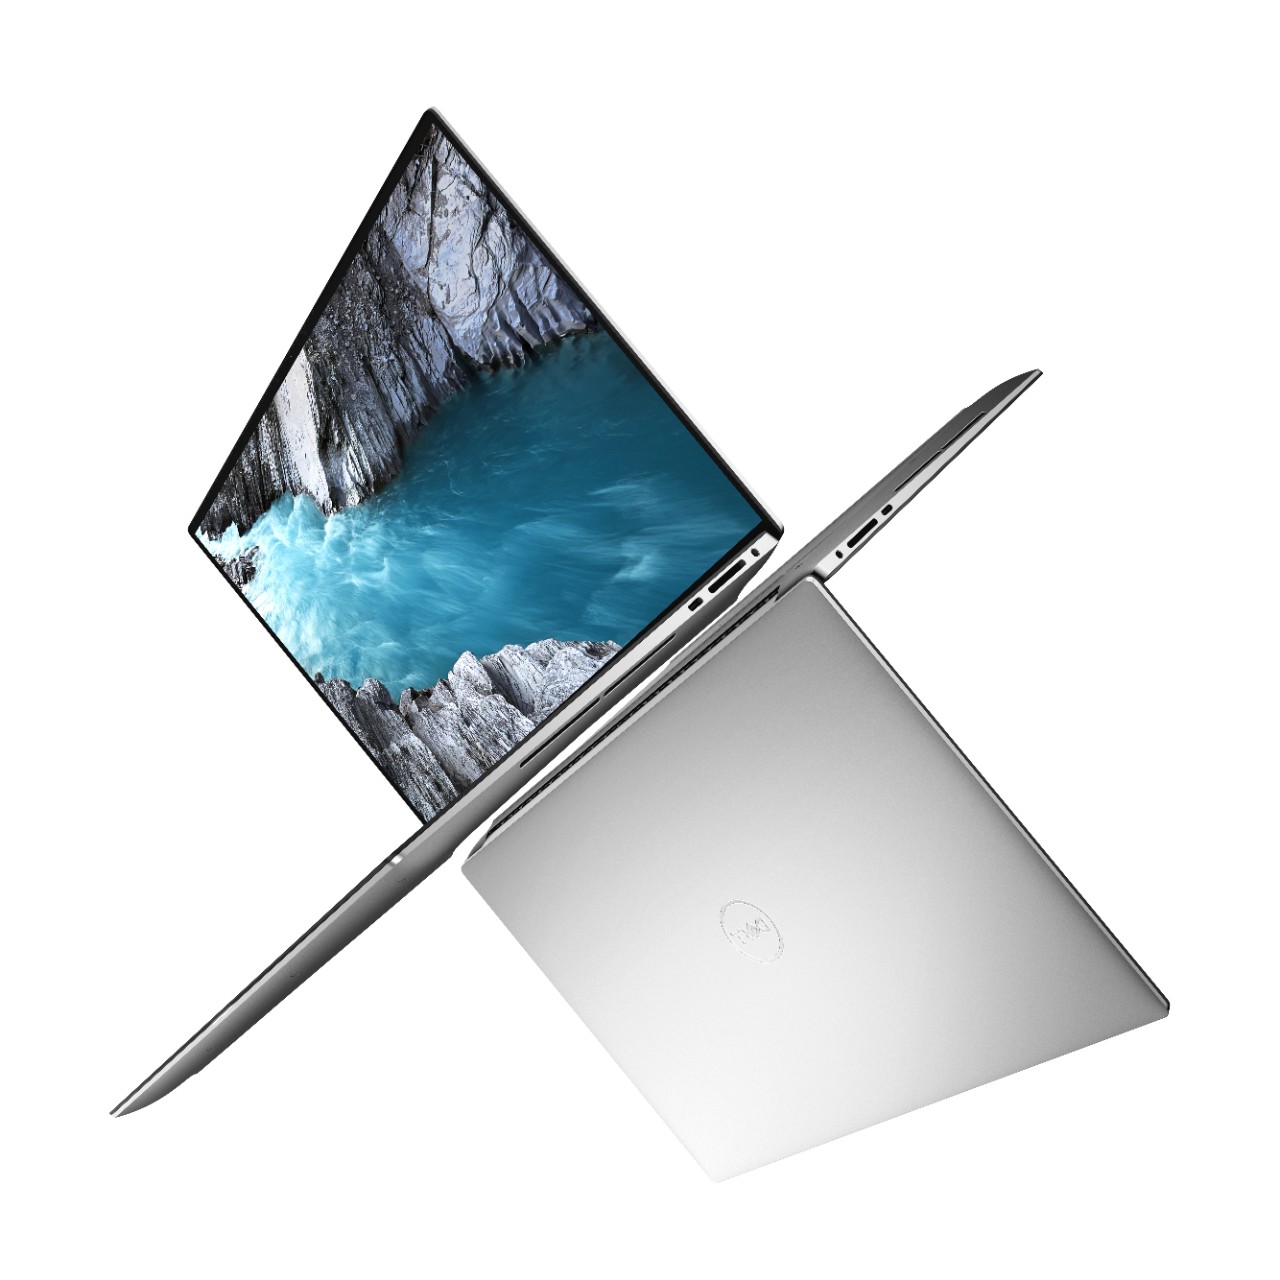
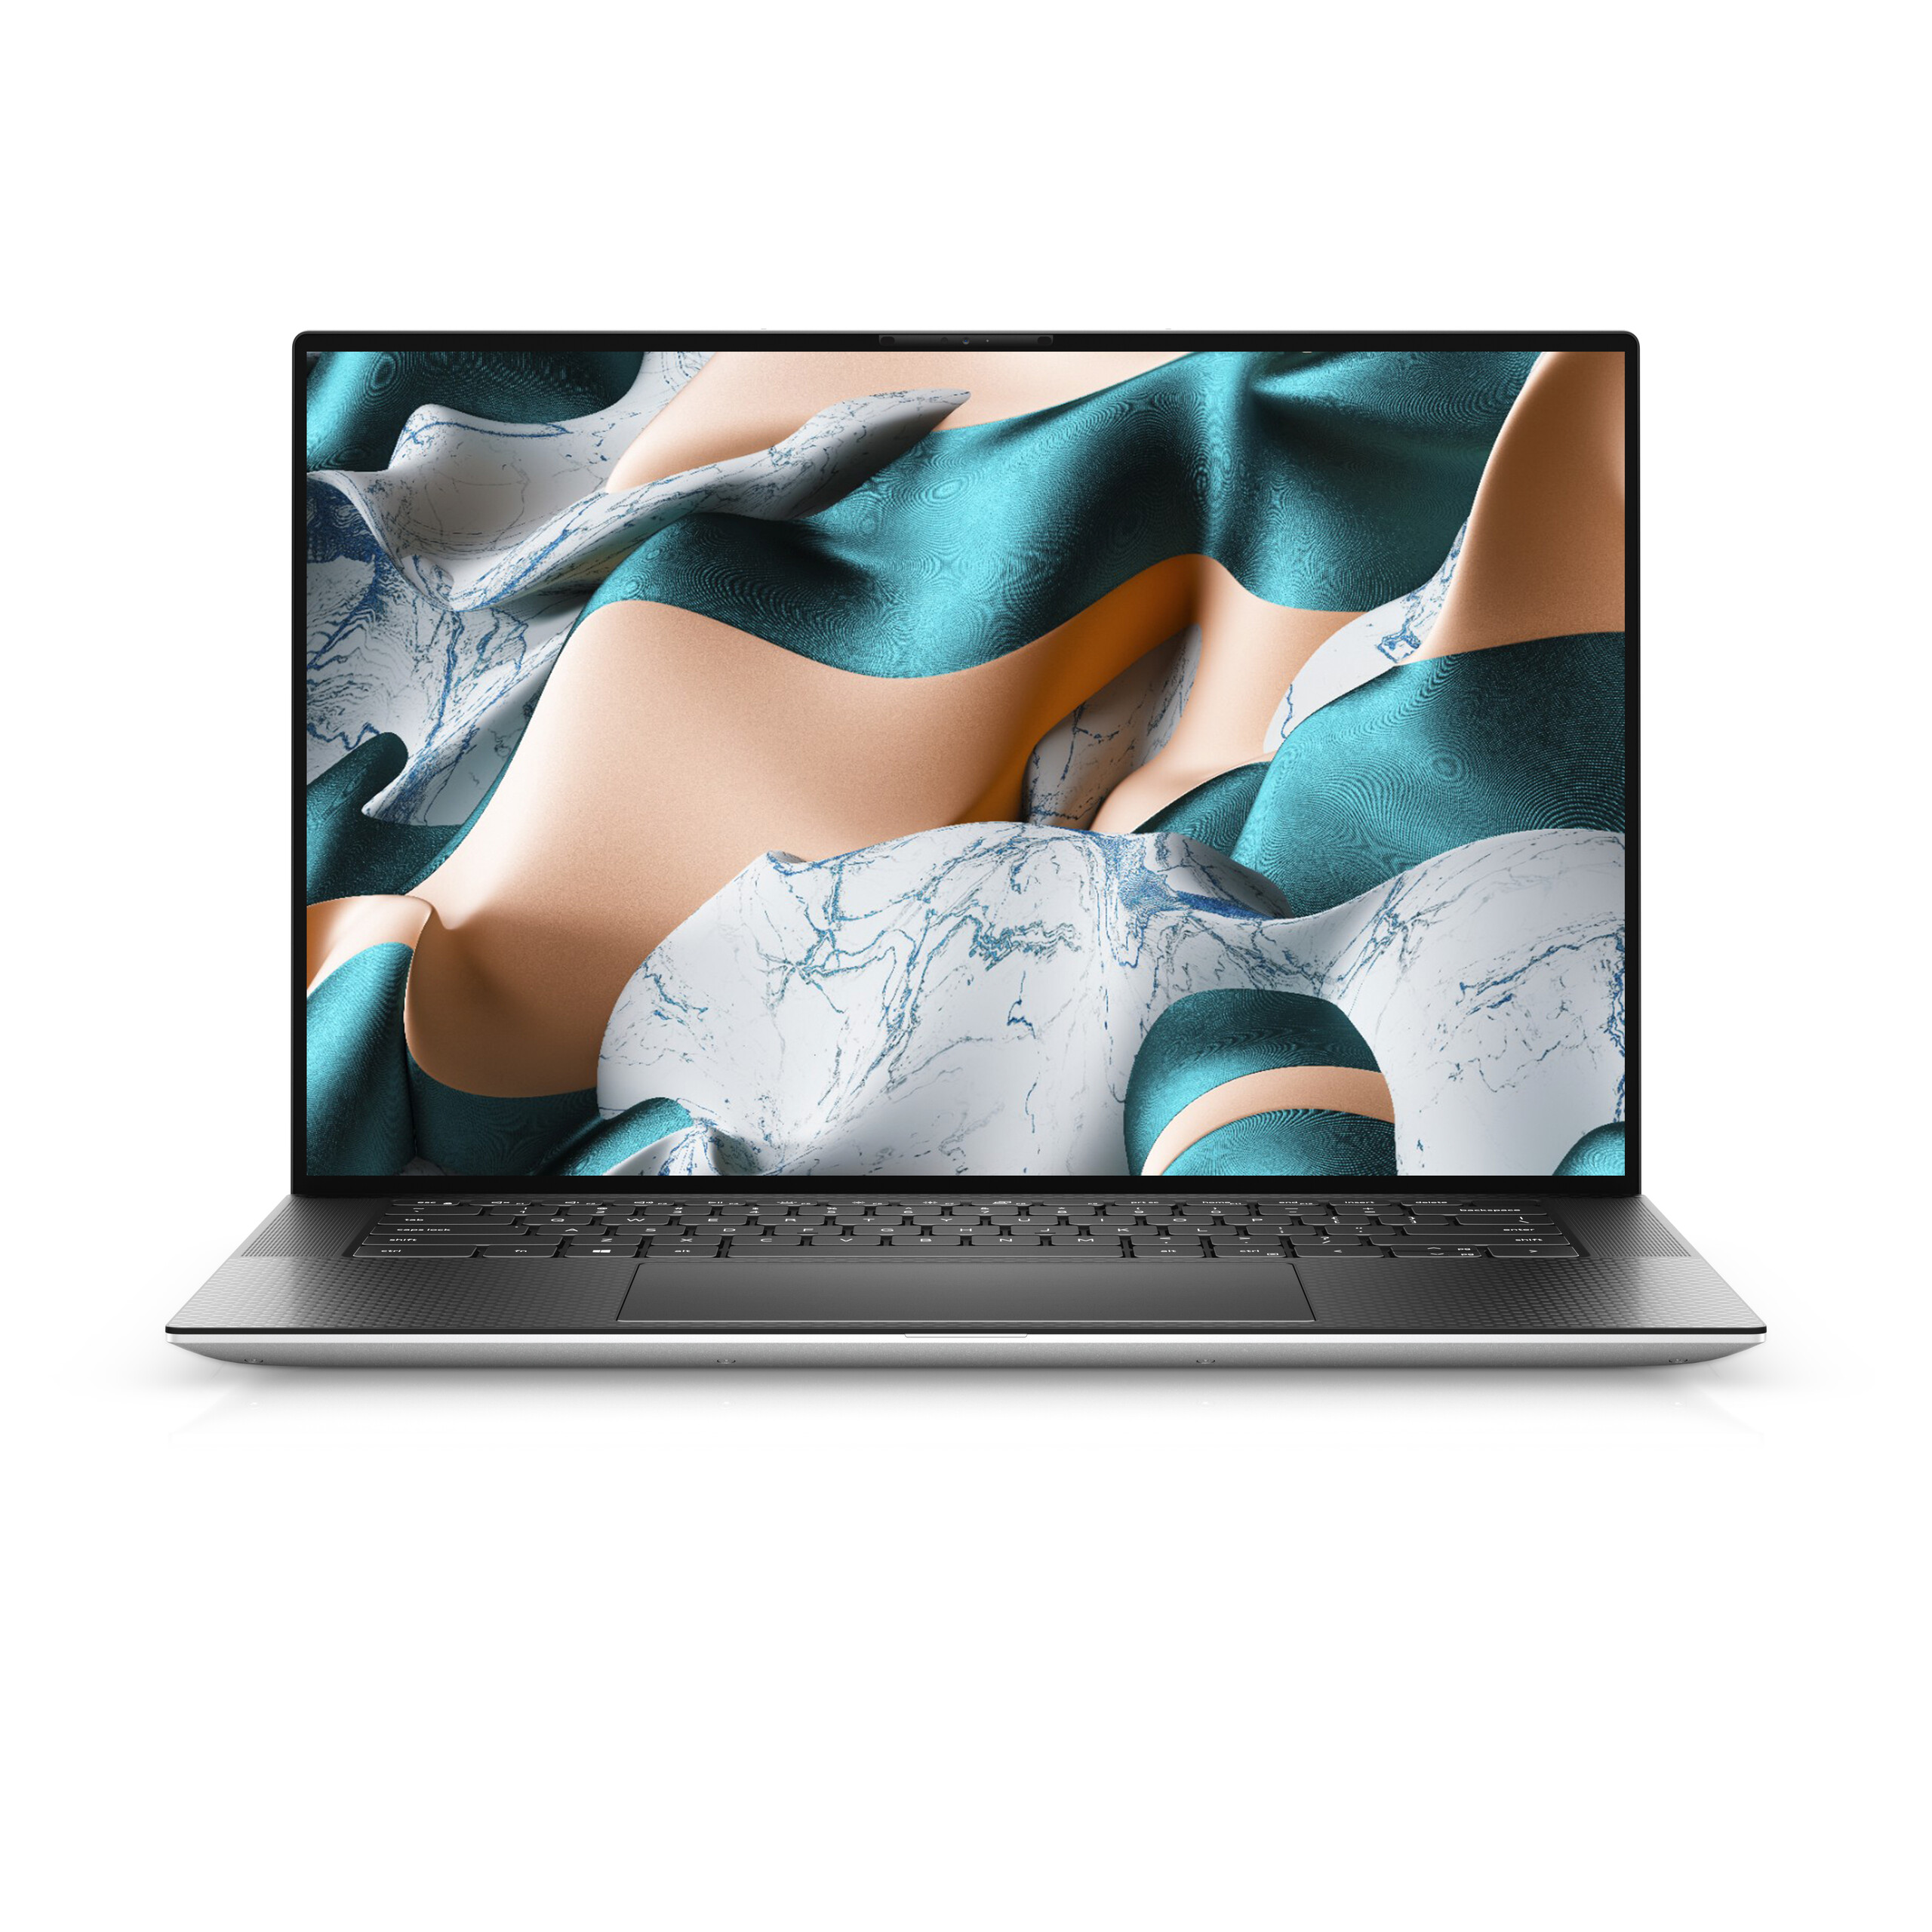
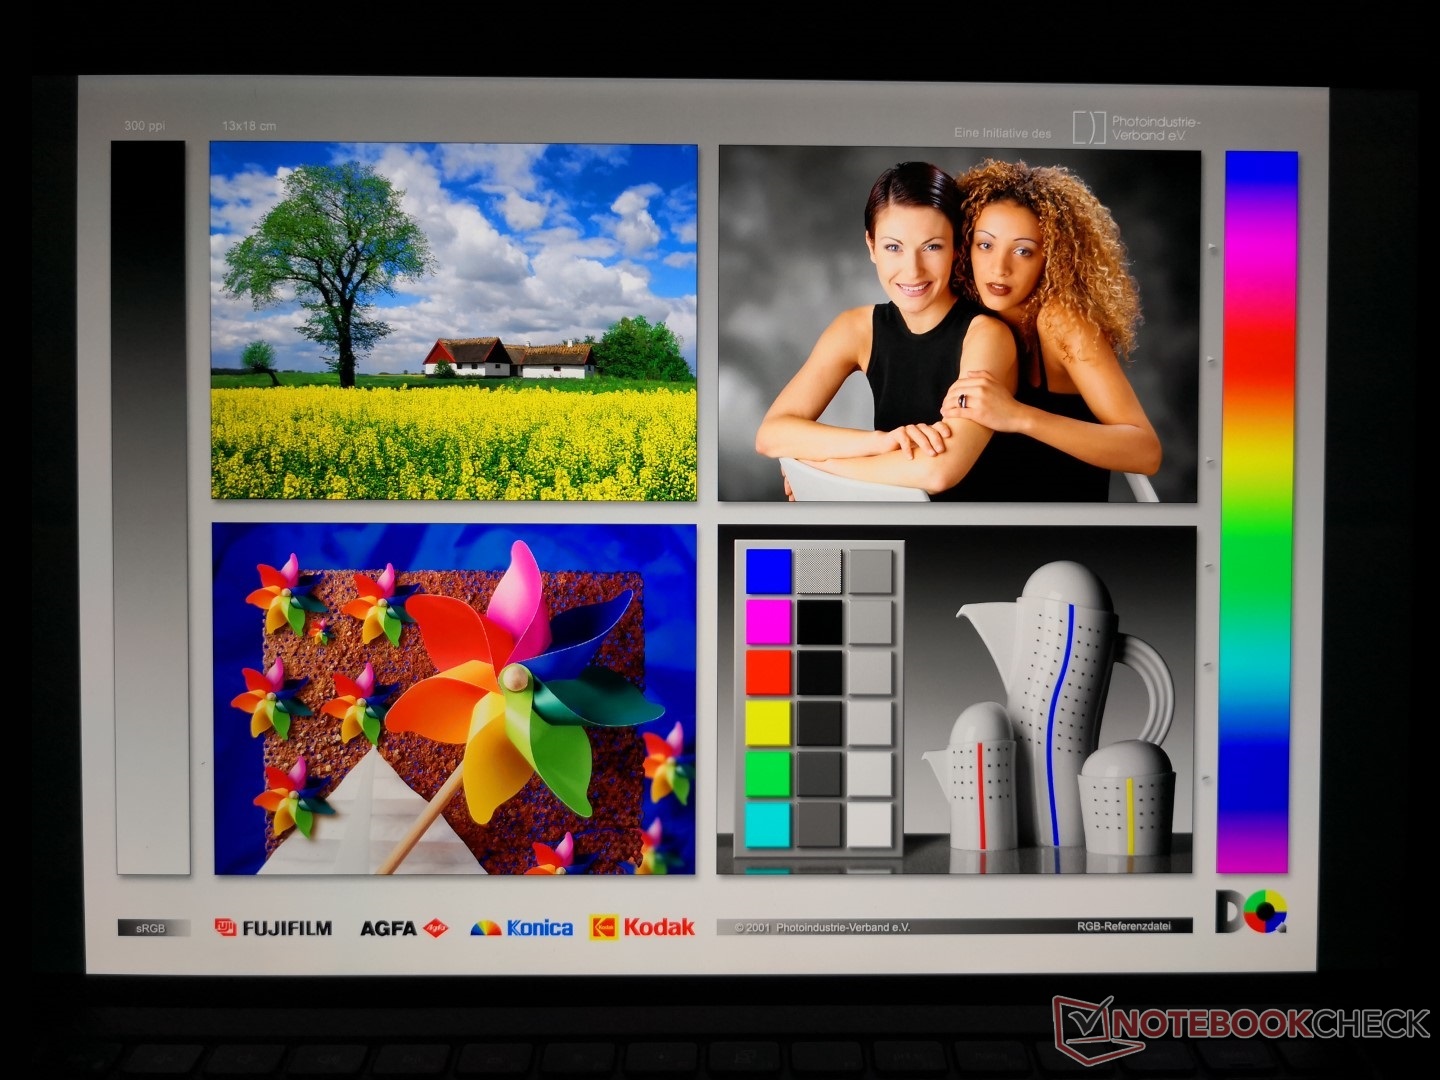
Whereas the matte FHD XPS 15 9500 uses the Sharp LQ156N1 IPS panel, our glossy 4K SKU uses the Sharp LQ156R1. The higher resolution and deeper colors are immediately noticeable, but this comes at the cost of slightly slower response times and a slightly dimmer backlight than the FHD version as shown by our comparison table below. The small disadvantages do little to detract from the fact that this is still both a unique and high quality 16:10 panel found on no other consumer Ultrabook at the moment. The additional height becomes invaluable for almost all applications similar to the displays on Apple MacBook Pro models.
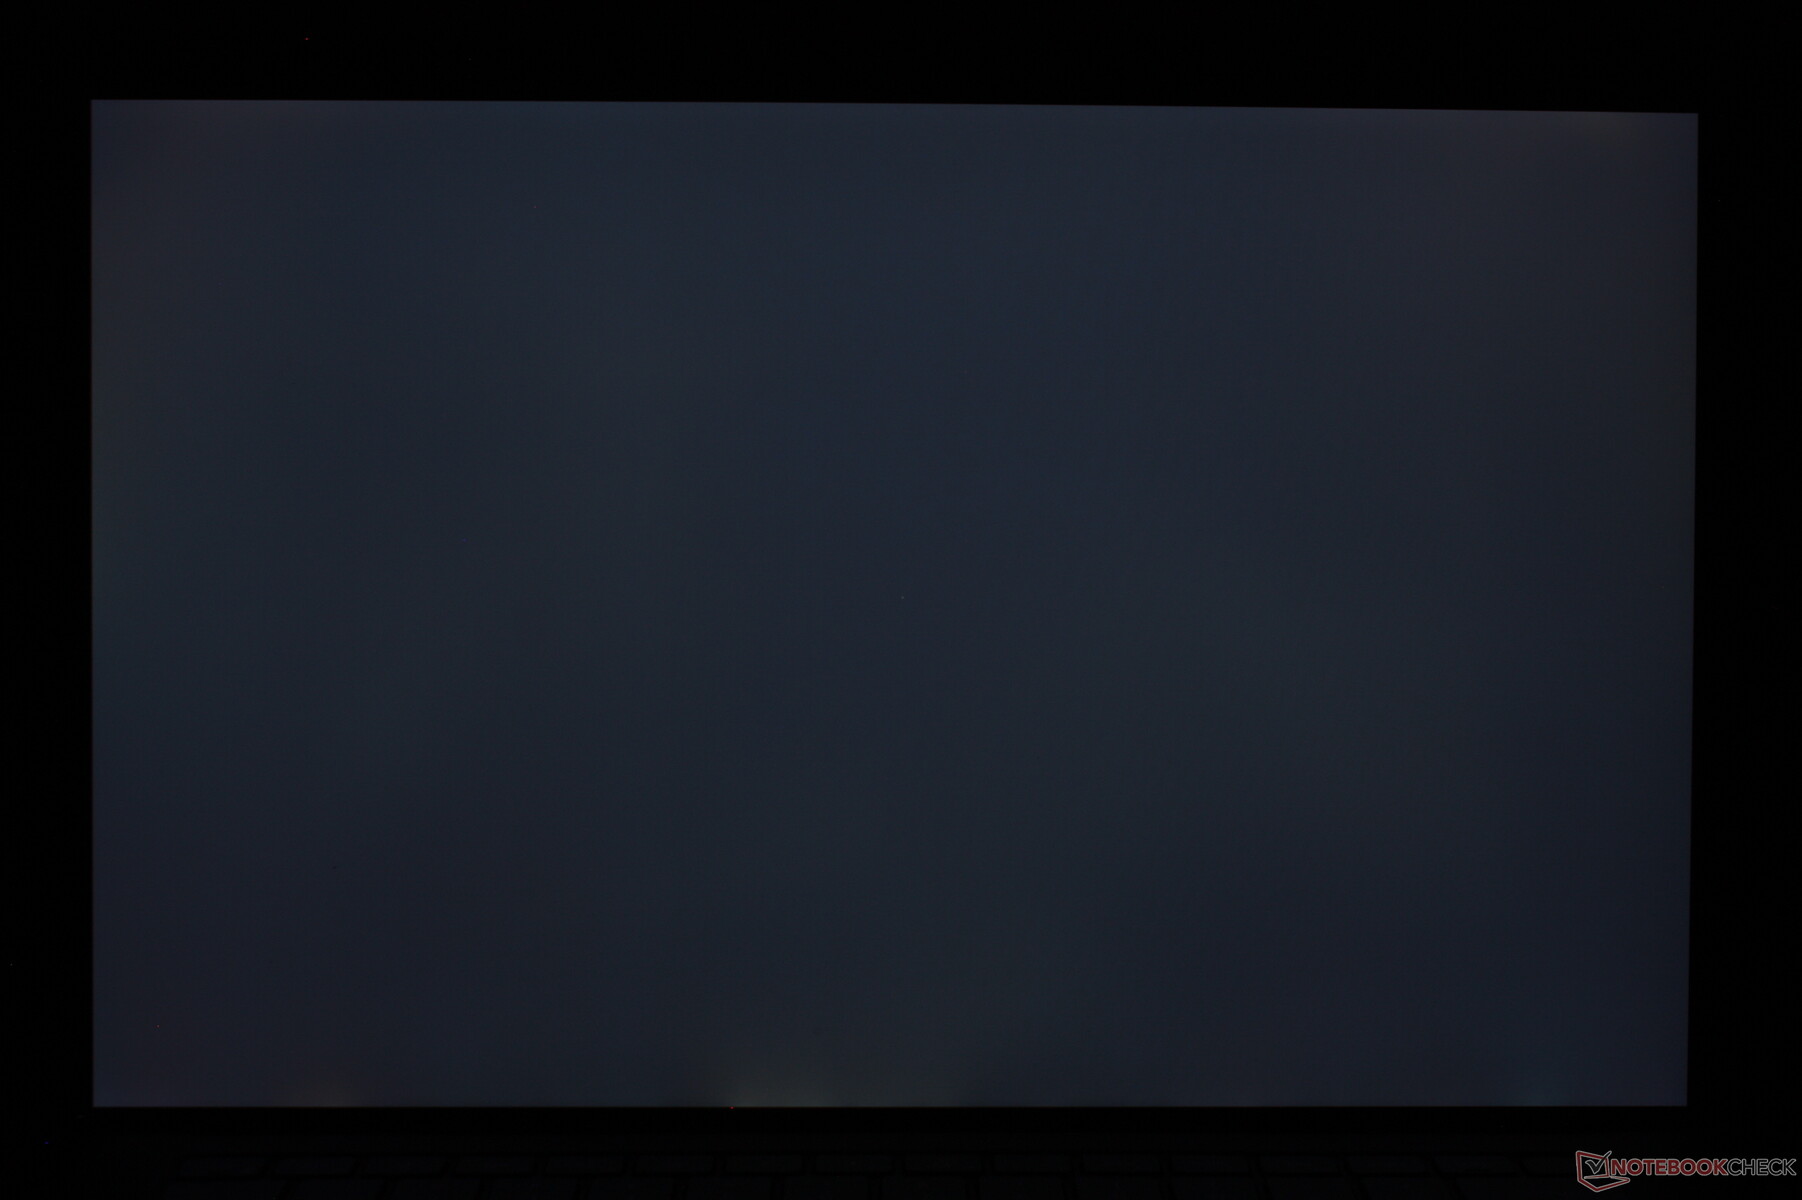
Another less obvious upgrade from the 2019 XPS 15 is the complete absence of pulse-width modulation on both the FHD and 4K UHD XPS 15 9500 SKUs. Users who have been holding out on the XPS 15 series due to sensitivity to flickering screens will no longer have to worry on the 2020 model.

| |||||||||||||||||||||||||
Brightness Distribution: 91 %
Center on Battery: 557.9 cd/m²
Contrast: 1431:1 (Black: 0.39 cd/m²)
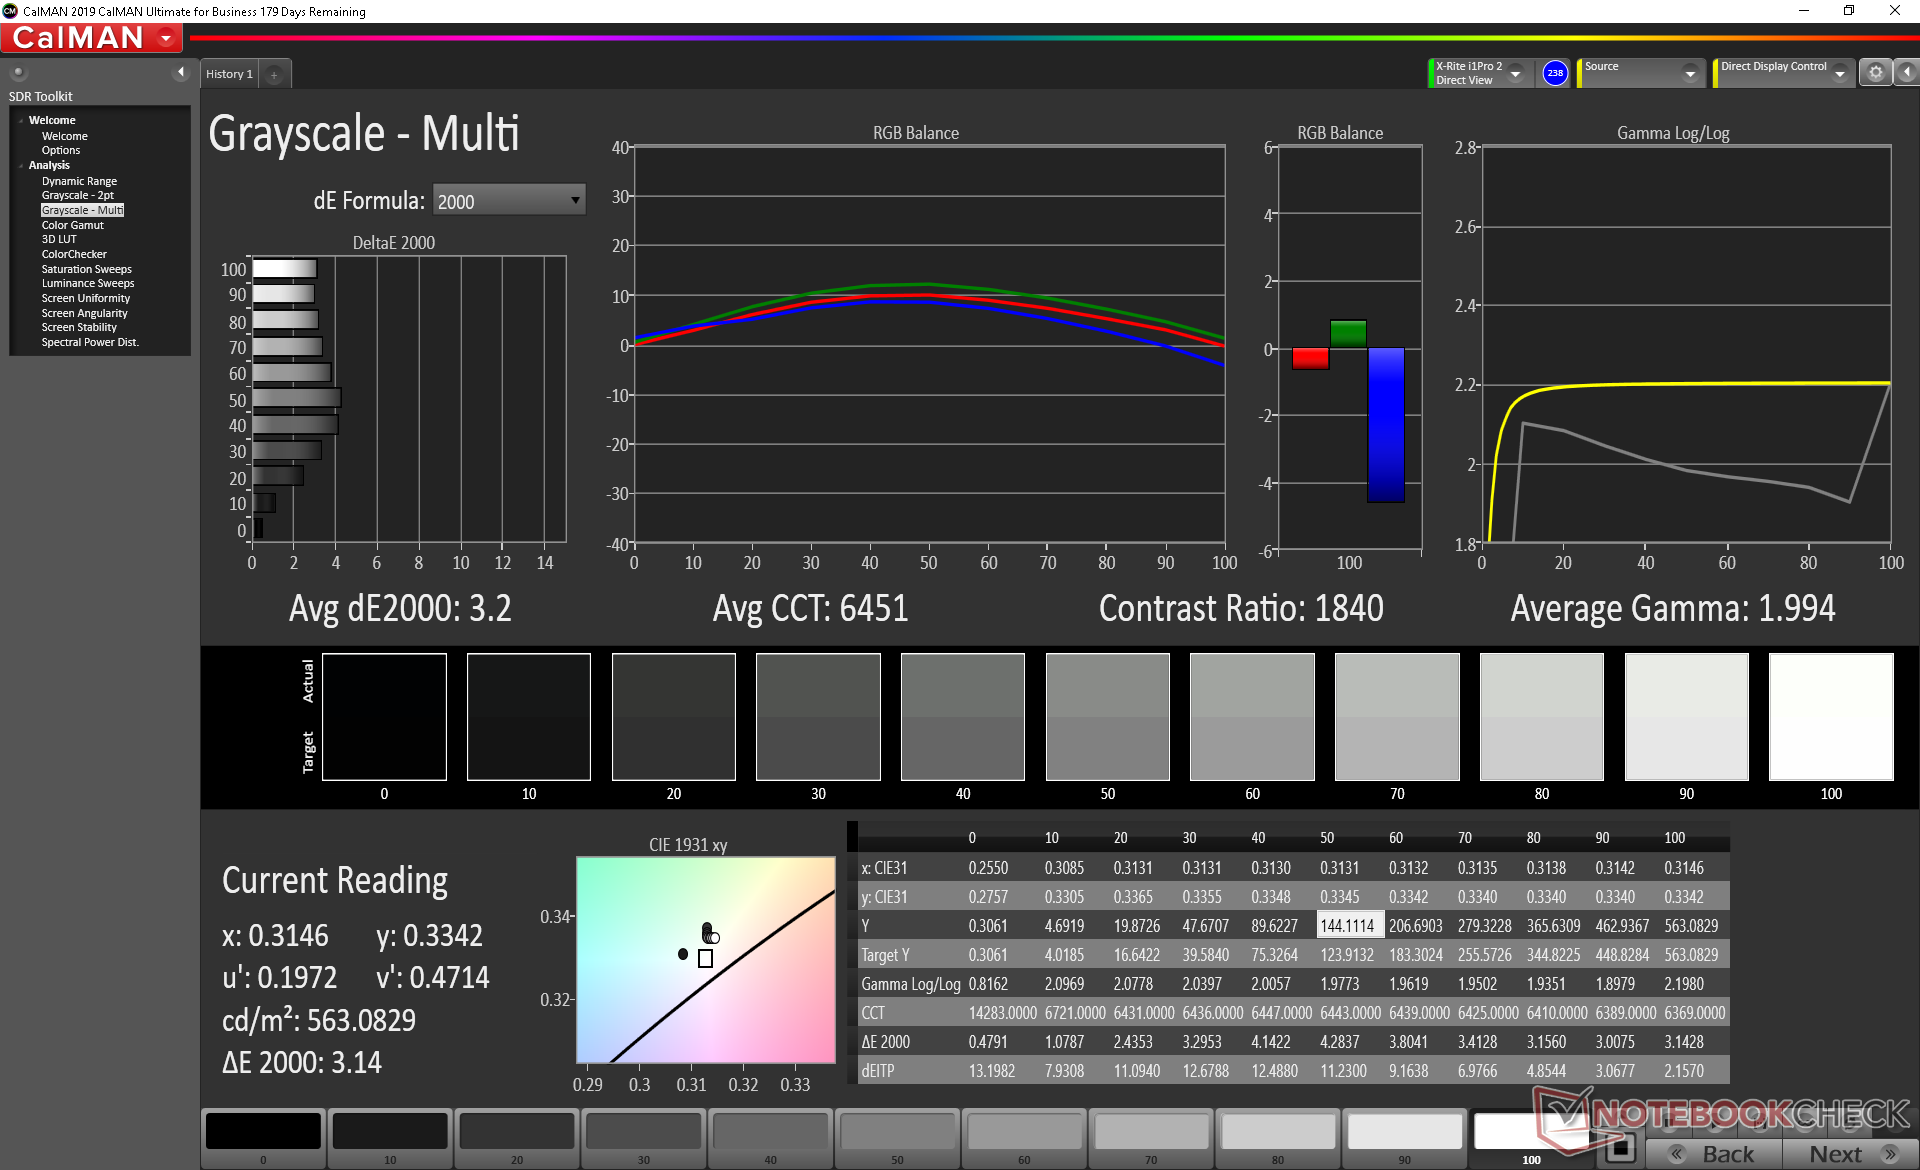
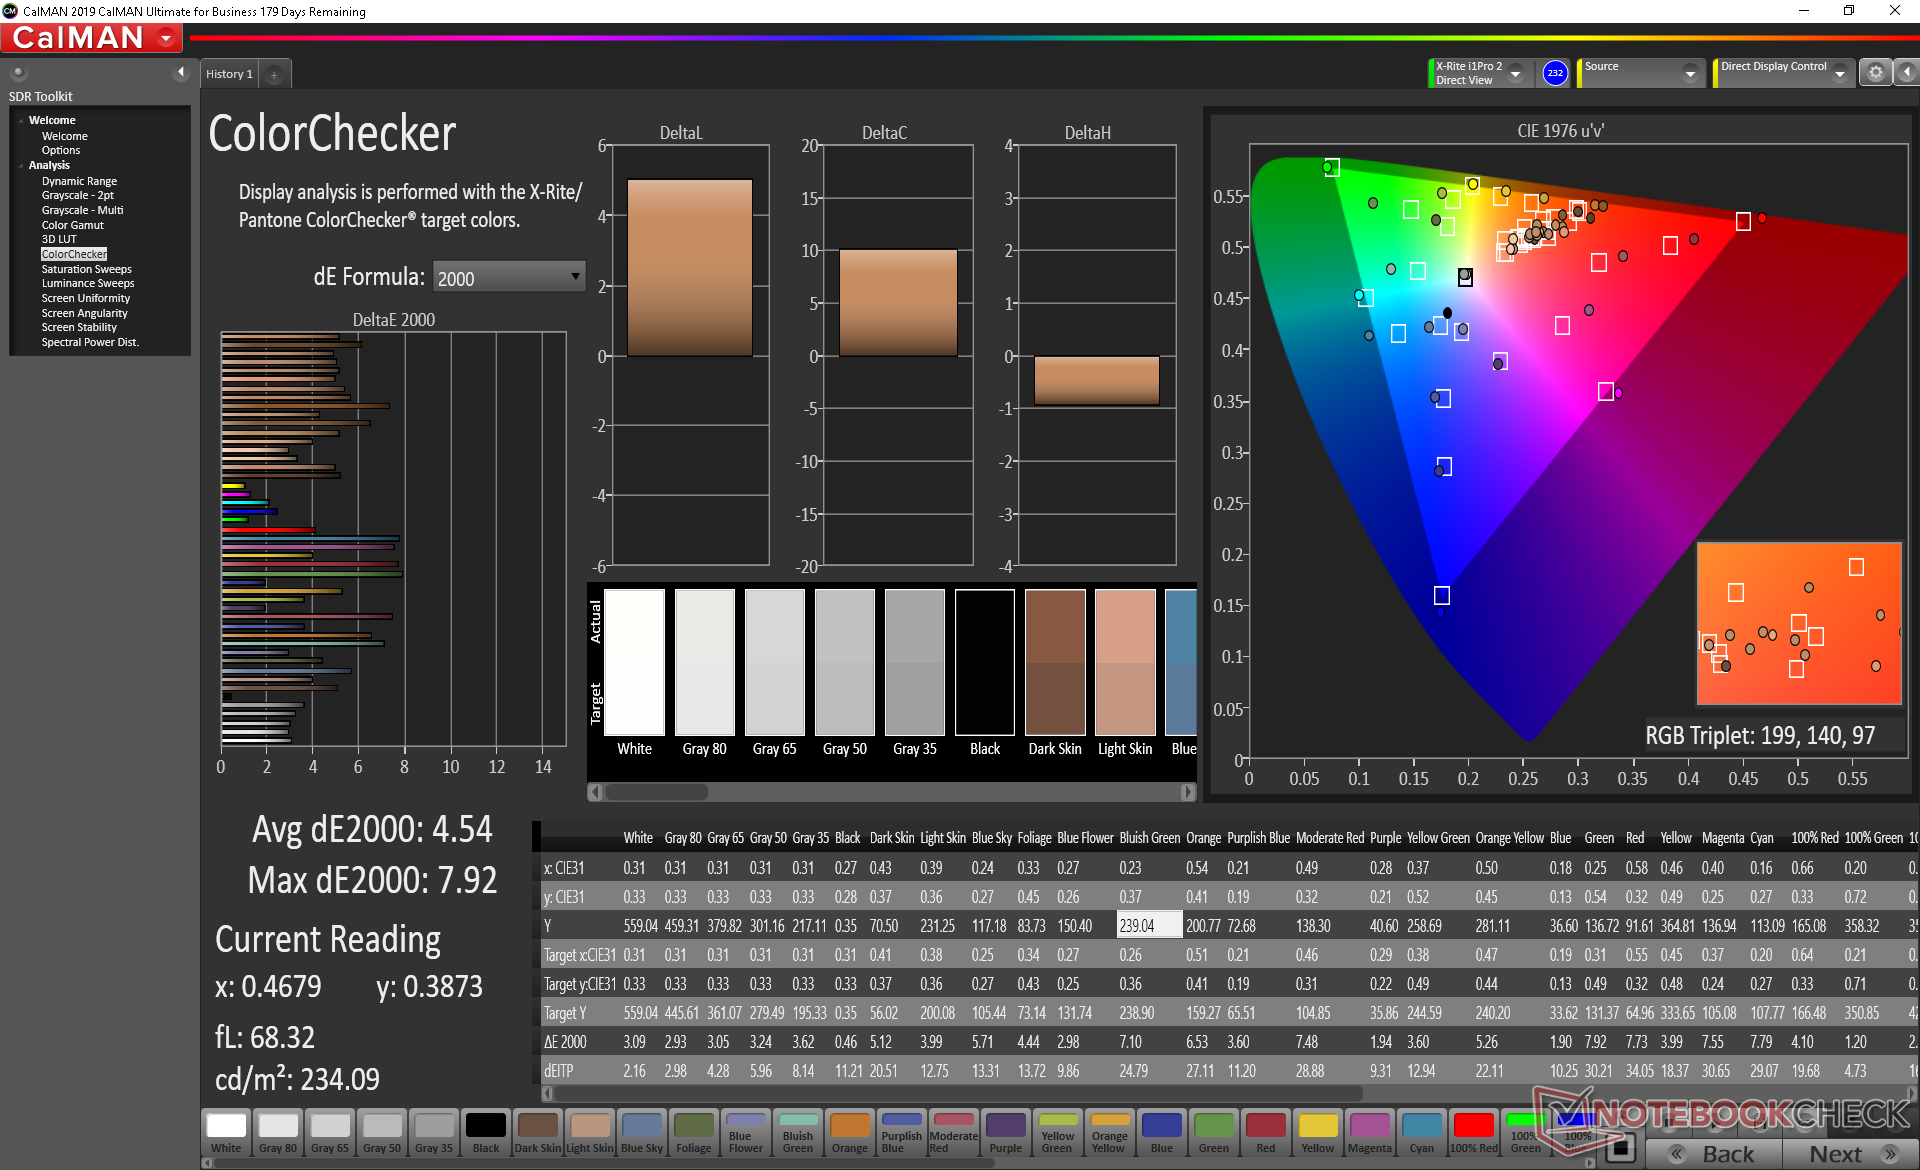
ΔE ColorChecker Calman: 4.54 | ∀{0.5-29.43 Ø4.72}
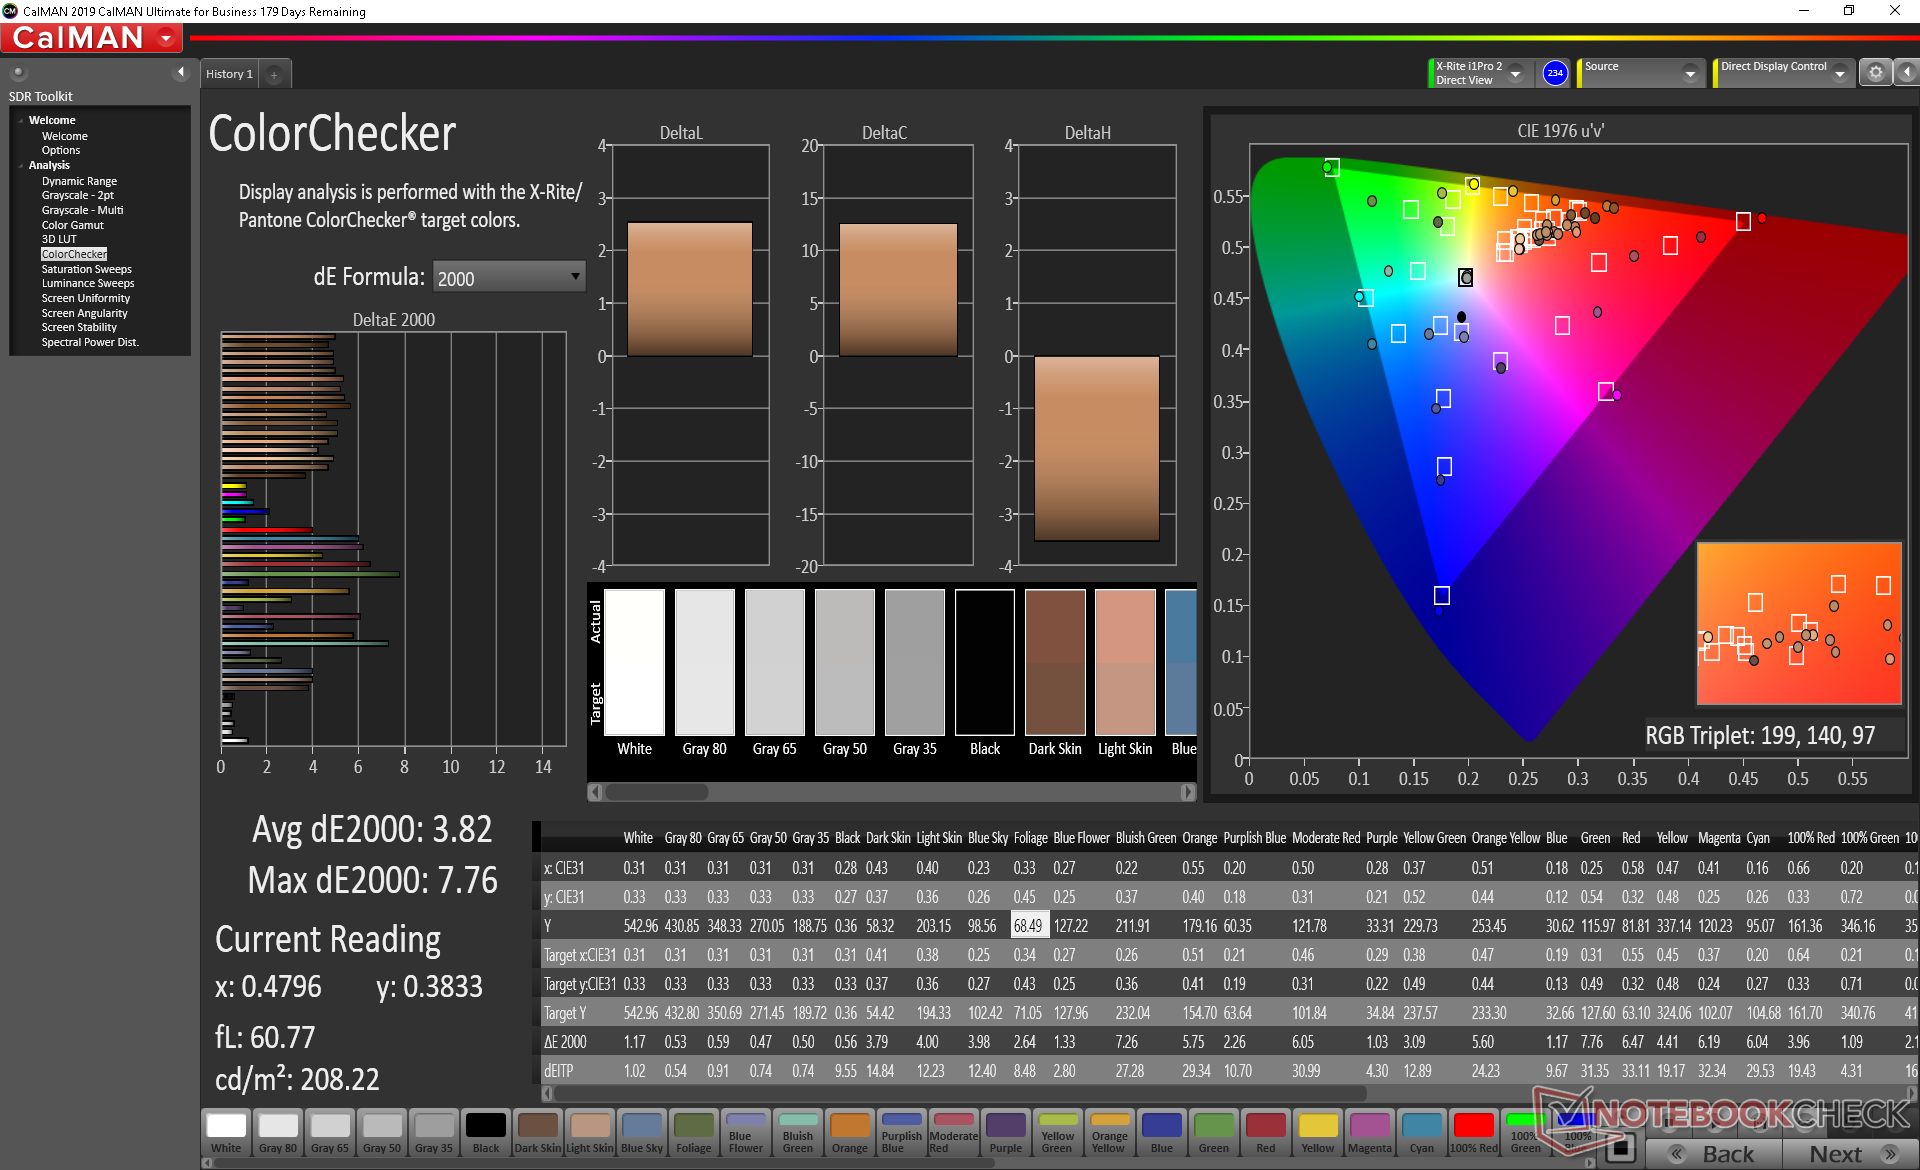
calibrated: 3.82
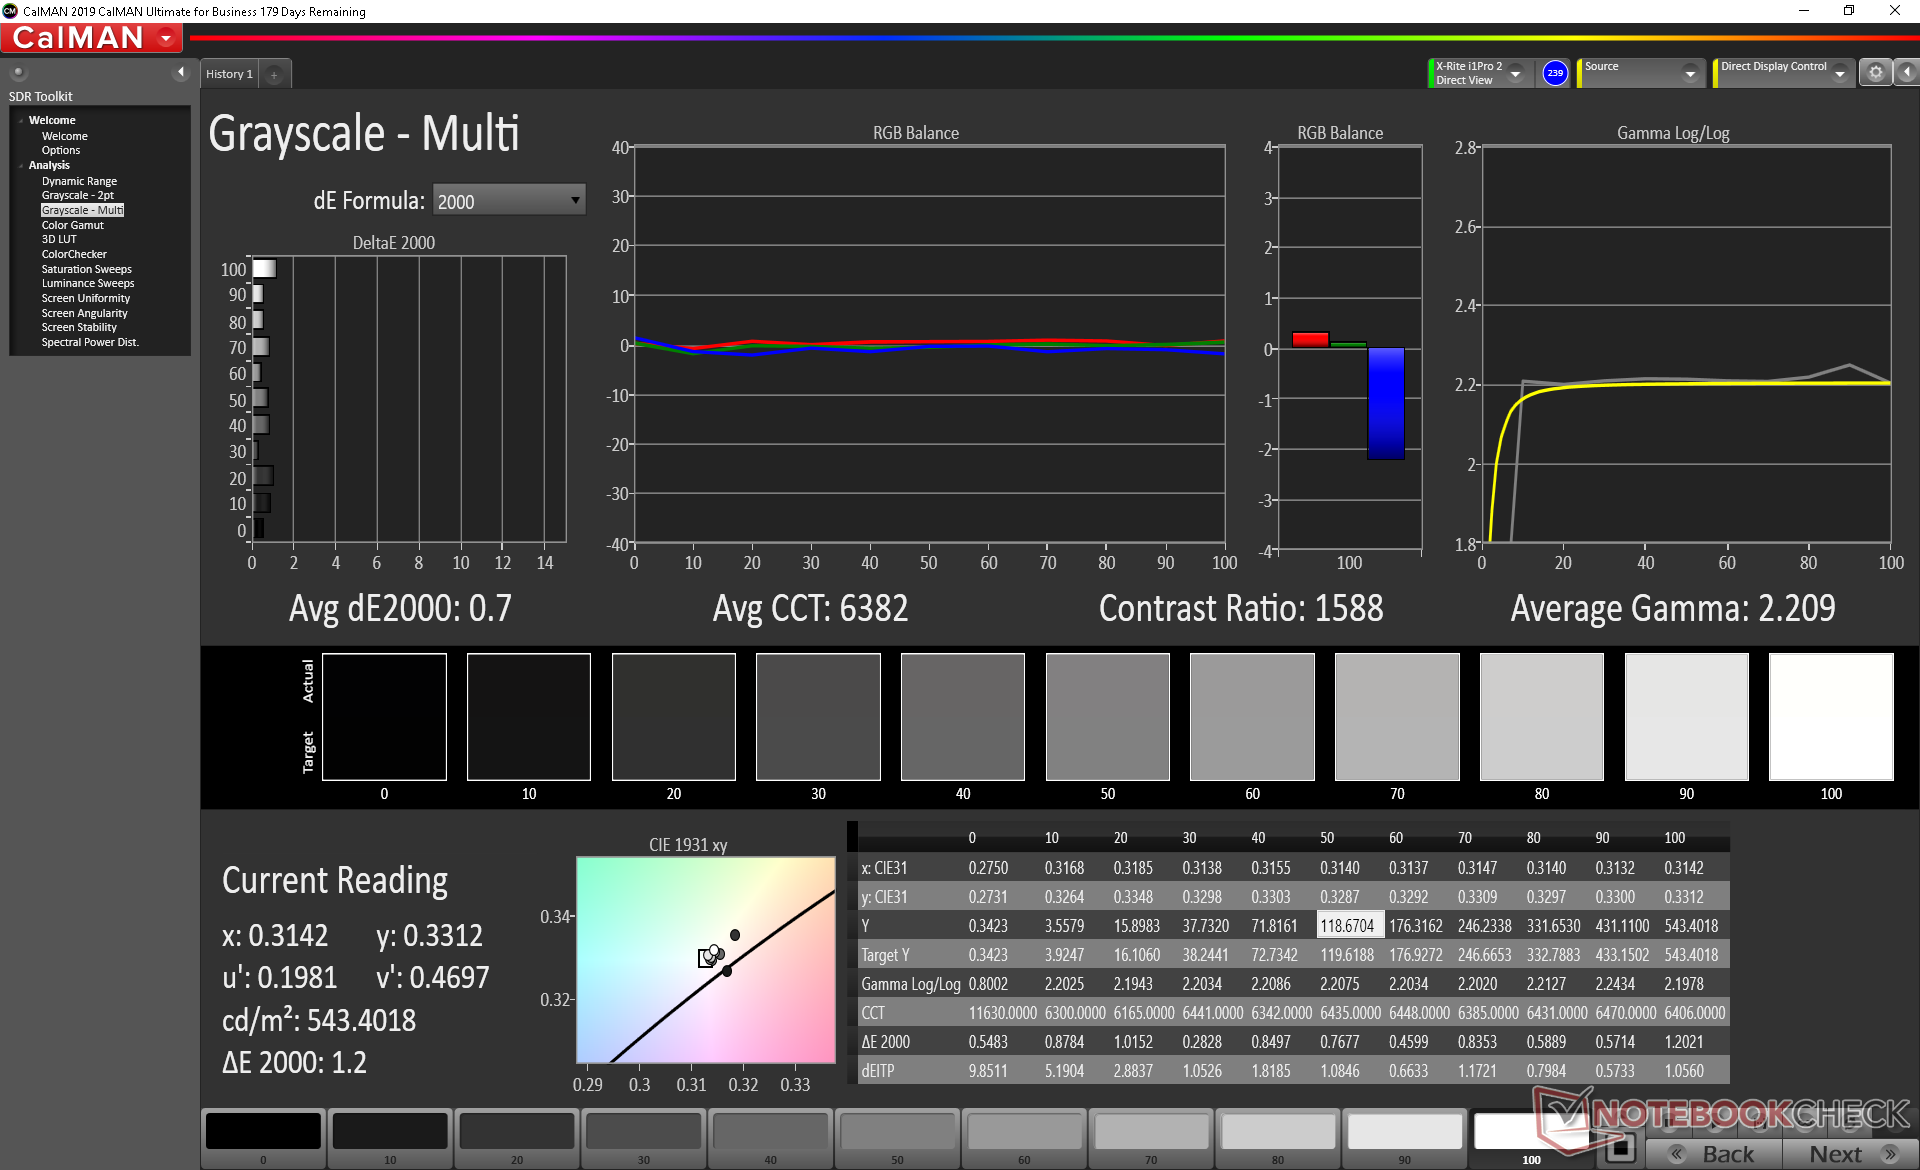
ΔE Greyscale Calman: 3.2 | ∀{0.09-98 Ø4.97}
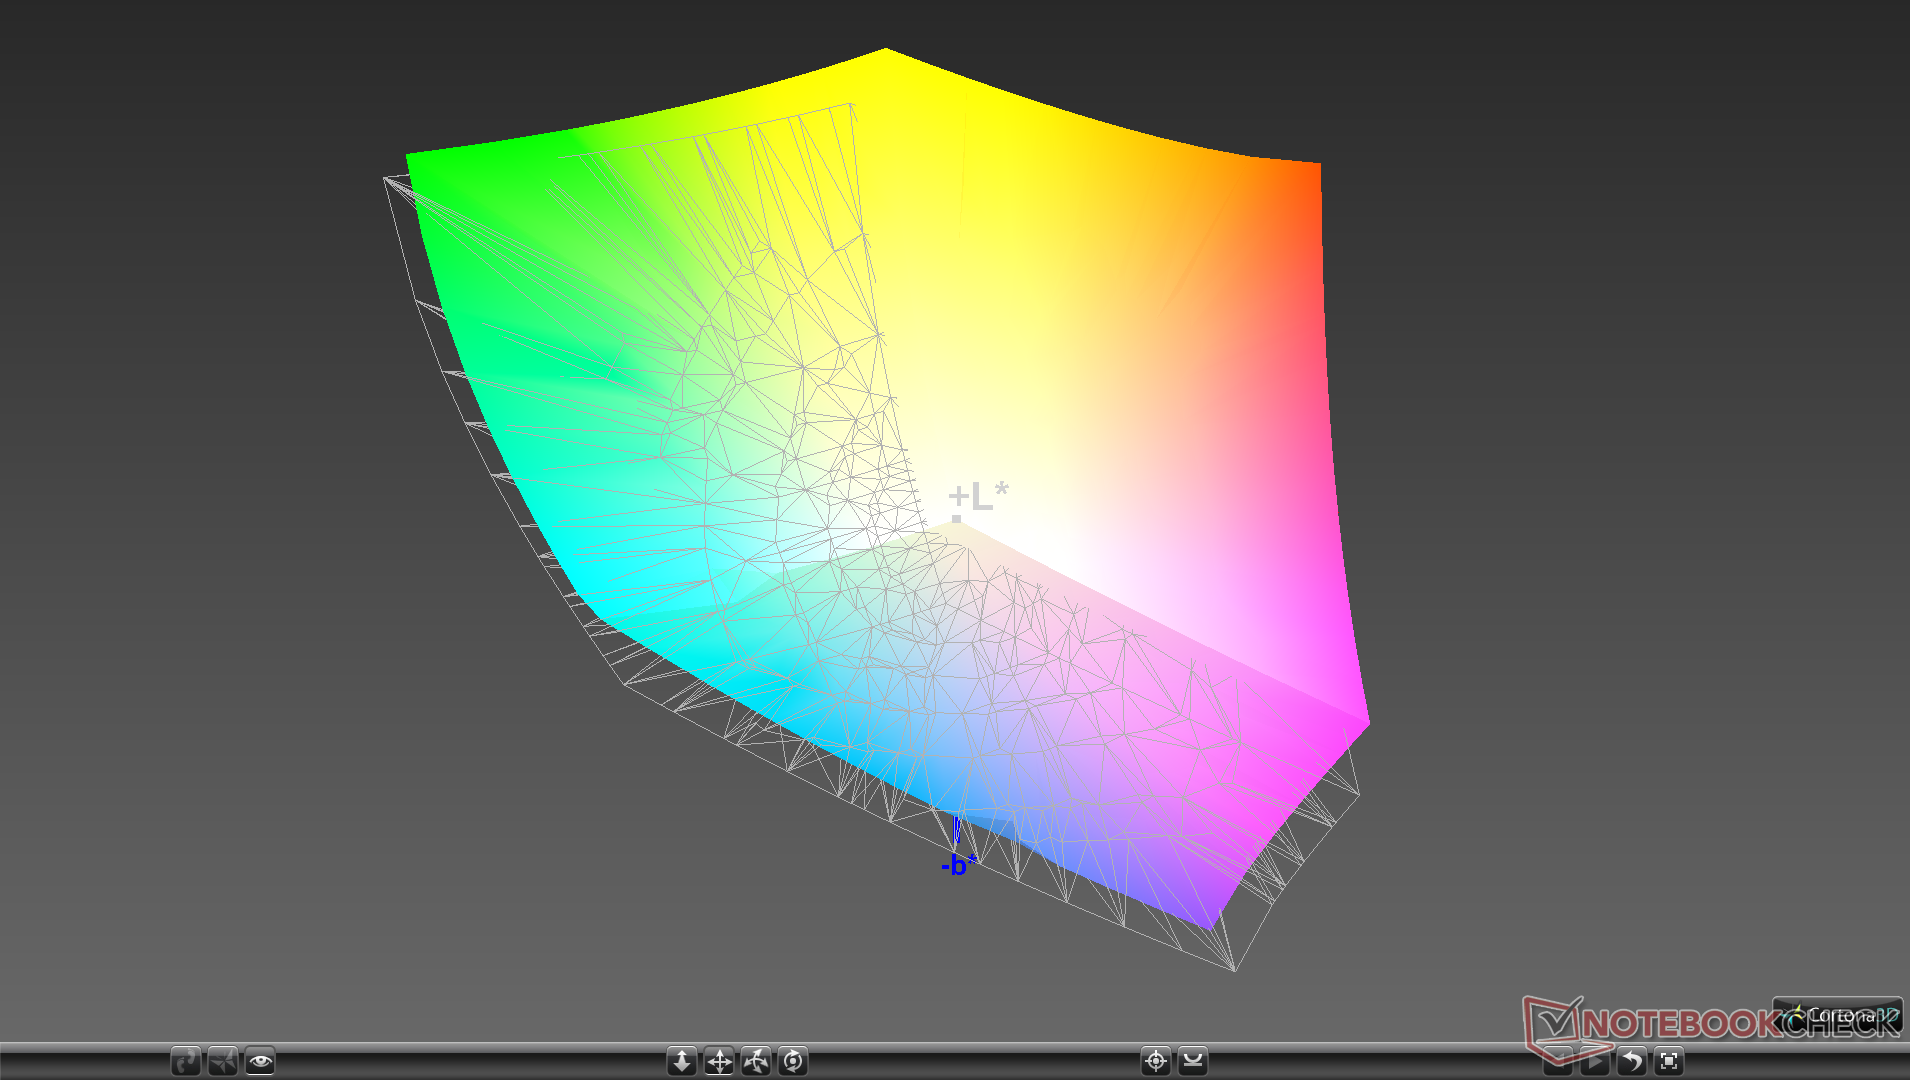
100% sRGB (Argyll 1.6.3 3D)
89.5% AdobeRGB 1998 (Argyll 1.6.3 3D)
99.8% AdobeRGB 1998 (Argyll 3D)
100% sRGB (Argyll 3D)
89.7% Display P3 (Argyll 3D)
Gamma: 1.99
CCT: 6451 K
| Dell XPS 15 9500 Core i7 4K UHD Sharp LQ156R1, IPS, 15.6", 3840x2400 | Dell XPS 15 9500 Core i5 Sharp LQ156N1, IPS, 15.6", 1920x1200 | Lenovo Yoga C940-15IRH LG Philips LP156WFC-SPU1, IPS, 15.6", 1920x1080 | Asus ZenBook 15 UX534FTC-A8190T BOE CQ NV156FHM-N63, IPS, 15.6", 1920x1080 | MSI Prestige 15 A10SC Sharp LQ156D1JW42, IPS, 15.6", 3840x2160 | Apple MacBook Pro 16 2019 i9 5500M APPA044, IPS, 16", 3072x1920 | |
|---|---|---|---|---|---|---|
| Display | -10% | -25% | -26% | -5% | ||
| Display P3 Coverage (%) | 89.7 | 81.5 -9% | 61.5 -31% | 65 -28% | 82 -9% | |
| sRGB Coverage (%) | 100 | 100 0% | 92.7 -7% | 86.2 -14% | 98.3 -2% | |
| AdobeRGB 1998 Coverage (%) | 99.8 | 79.6 -20% | 63.6 -36% | 62.9 -37% | 96.2 -4% | |
| Response Times | 18% | 0% | 11% | -18% | -1% | |
| Response Time Grey 50% / Grey 80% * (ms) | 54 ? | 42 ? 22% | 48.4 ? 10% | 45 ? 17% | 60 ? -11% | 52.4 ? 3% |
| Response Time Black / White * (ms) | 33.2 ? | 28.8 ? 13% | 36.4 ? -10% | 32 ? 4% | 41.2 ? -24% | 34.9 ? -5% |
| PWM Frequency (Hz) | 26040 ? | 131700 | ||||
| Screen | 4% | -2% | -13% | 0% | 17% | |
| Brightness middle (cd/m²) | 557.9 | 592 6% | 484.8 -13% | 299 -46% | 464.5 -17% | 519 -7% |
| Brightness (cd/m²) | 541 | 565 4% | 463 -14% | 280 -48% | 451 -17% | 477 -12% |
| Brightness Distribution (%) | 91 | 85 -7% | 82 -10% | 89 -2% | 92 1% | 86 -5% |
| Black Level * (cd/m²) | 0.39 | 0.46 -18% | 0.26 33% | 0.21 46% | 0.5 -28% | 0.39 -0% |
| Contrast (:1) | 1431 | 1287 -10% | 1865 30% | 1424 0% | 929 -35% | 1331 -7% |
| Colorchecker dE 2000 * | 4.54 | 3.19 30% | 4.5 1% | 4.76 -5% | 3.36 26% | 2.28 50% |
| Colorchecker dE 2000 max. * | 7.92 | 5.45 31% | 7.55 5% | 9 -14% | 7.06 11% | 6.54 17% |
| Colorchecker dE 2000 calibrated * | 3.82 | 2.03 47% | 1.19 69% | 3.42 10% | 0.86 77% | |
| Greyscale dE 2000 * | 3.2 | 3.9 -22% | 5.7 -78% | 3.53 -10% | 1.3 59% | 0.9 72% |
| Gamma | 1.99 111% | 2.25 98% | 2.45 90% | 2.3 96% | 2.14 103% | 2145 0% |
| CCT | 6451 101% | 6522 100% | 6101 107% | 7228 90% | 6596 99% | 6572 99% |
| Color Space (Percent of AdobeRGB 1998) (%) | 89.5 | 71.6 -20% | 58.7 -34% | 56 -37% | 84.8 -5% | 78 -13% |
| Color Space (Percent of sRGB) (%) | 100 | 100 0% | 92.8 -7% | 86 -14% | 98.3 -2% | |
| Total Average (Program / Settings) | 4% /
3% | -9% /
-6% | -9% /
-13% | -8% /
-3% | 8% /
14% |
* ... smaller is better
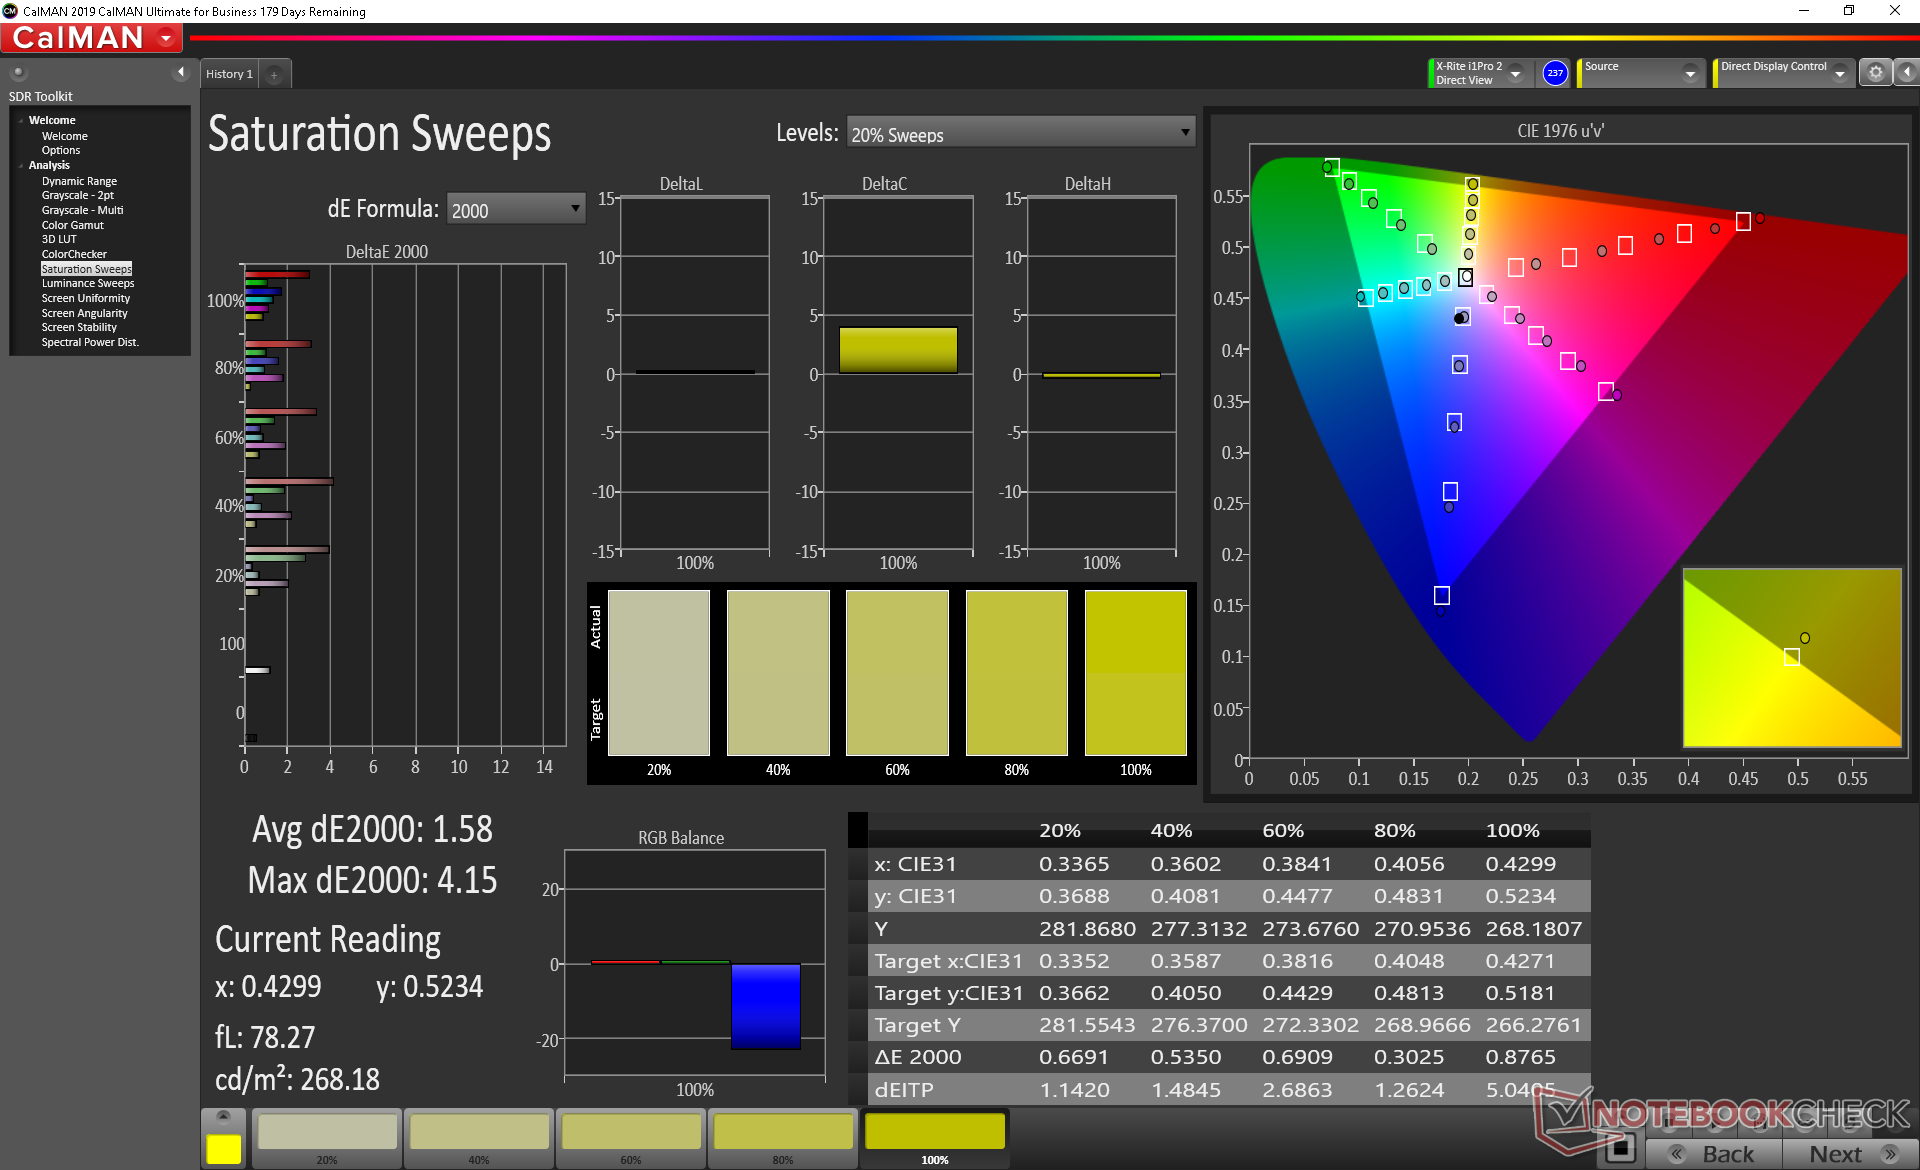
Whereas the base FHD version covers all of sRGB, our 4K UHD version covers all of sRGB and nearly all of AdobeRGB for deeper and potentially more accurate colors.

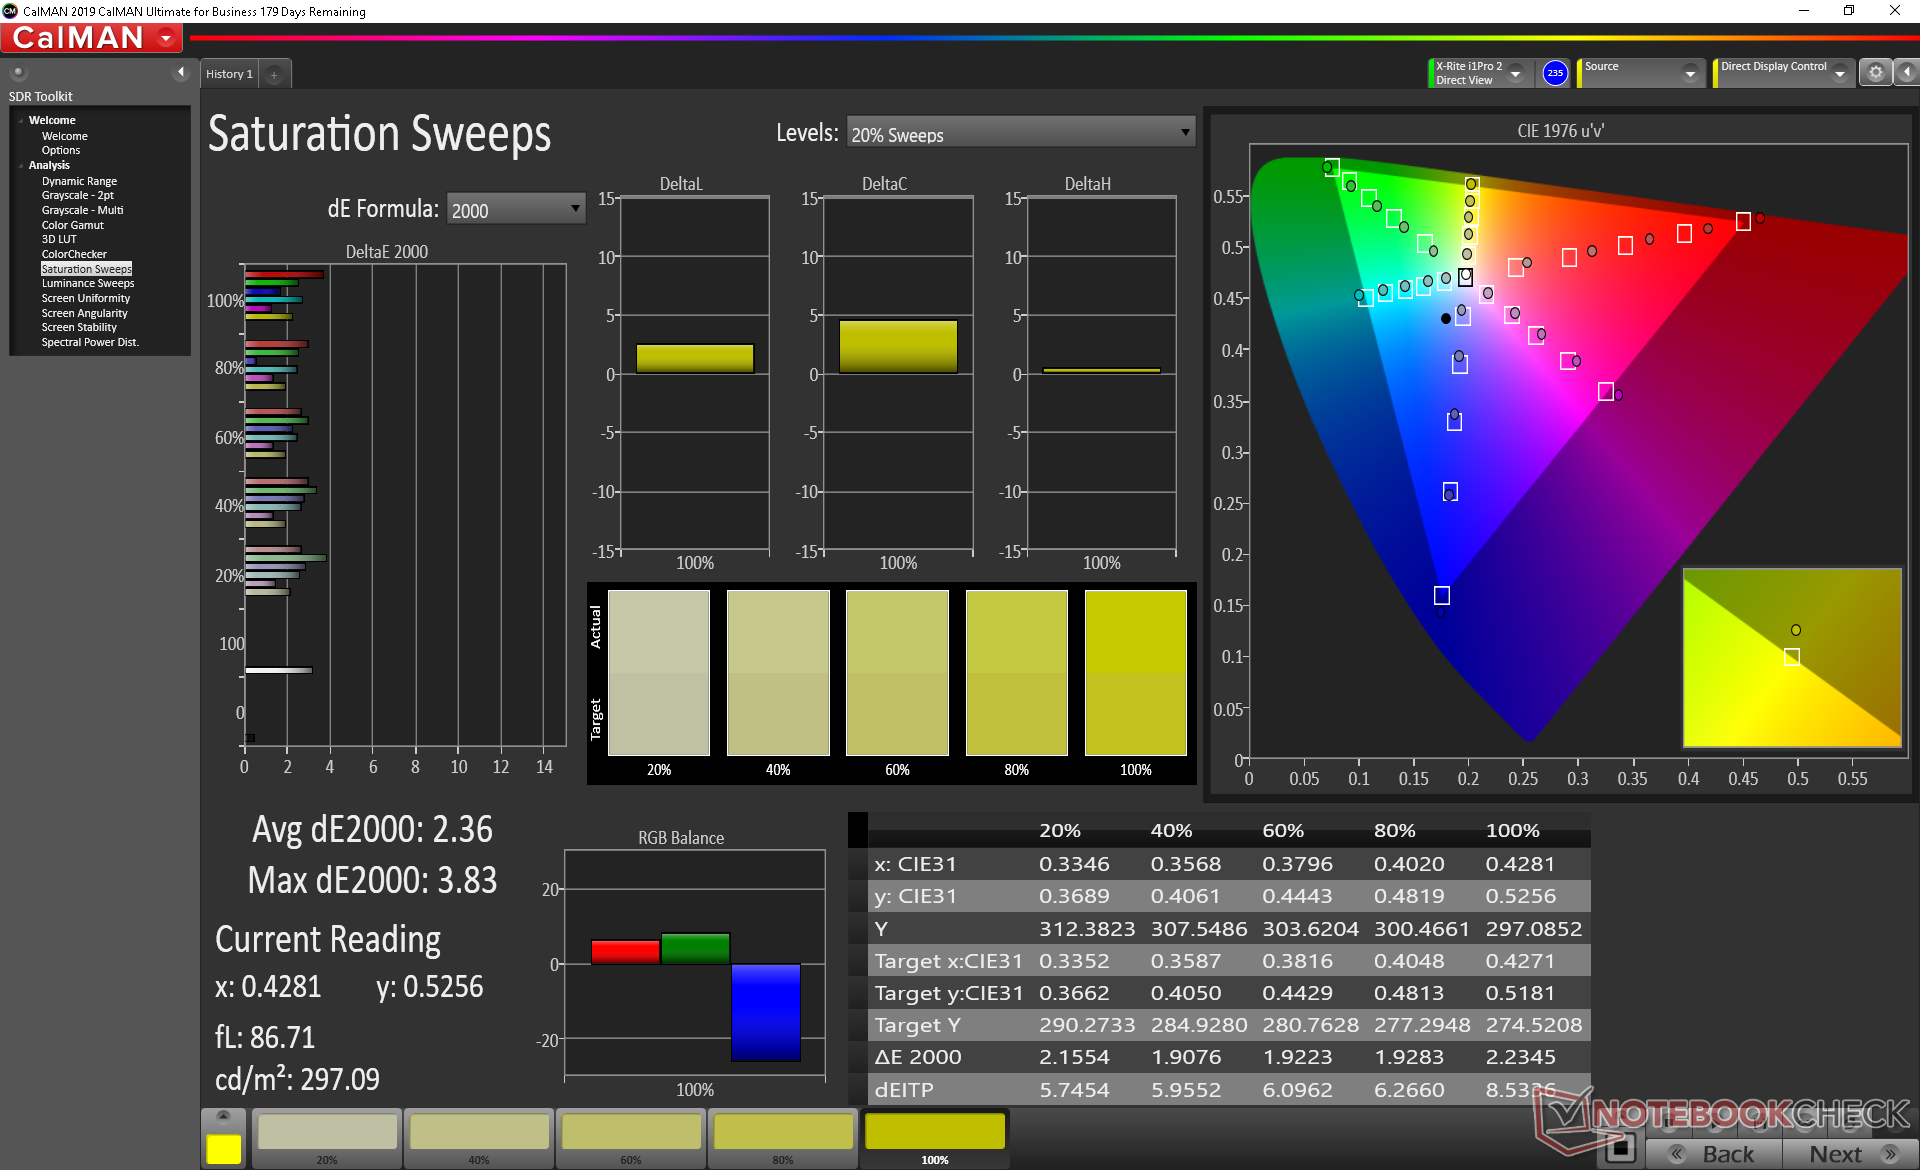
Further measurements with an X-Rite colorimeter show a decently calibrated display out of the box. Calibrating the panel ourselves would improve both grayscale and color deltaE values, albeit only marginally.
Display Response Times
| ↔ Response Time Black to White | ||
|---|---|---|
| 33.2 ms ... rise ↗ and fall ↘ combined | ↗ 19.2 ms rise | 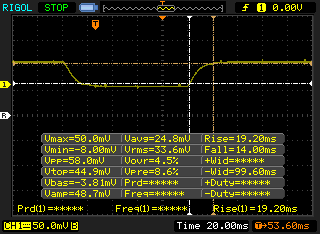 |
| ↘ 14 ms fall | ||
| The screen shows slow response rates in our tests and will be unsatisfactory for gamers. In comparison, all tested devices range from 0.1 (minimum) to 240 (maximum) ms. » 90 % of all devices are better. This means that the measured response time is worse than the average of all tested devices (19.8 ms). | ||
| ↔ Response Time 50% Grey to 80% Grey | ||
| 54 ms ... rise ↗ and fall ↘ combined | ↗ 26.4 ms rise | 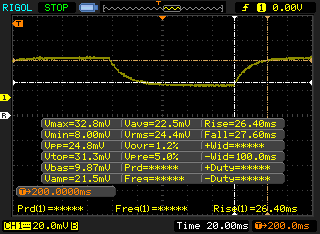 |
| ↘ 27.6 ms fall | ||
| The screen shows slow response rates in our tests and will be unsatisfactory for gamers. In comparison, all tested devices range from 0.165 (minimum) to 636 (maximum) ms. » 91 % of all devices are better. This means that the measured response time is worse than the average of all tested devices (31 ms). | ||
Screen Flickering / PWM (Pulse-Width Modulation)
| Screen flickering / PWM not detected | 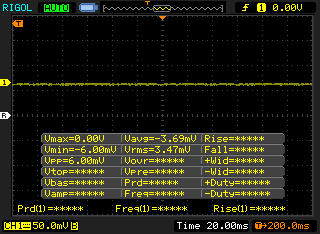 | ||
In comparison: 52 % of all tested devices do not use PWM to dim the display. If PWM was detected, an average of 7747 (minimum: 5 - maximum: 343500) Hz was measured. | |||
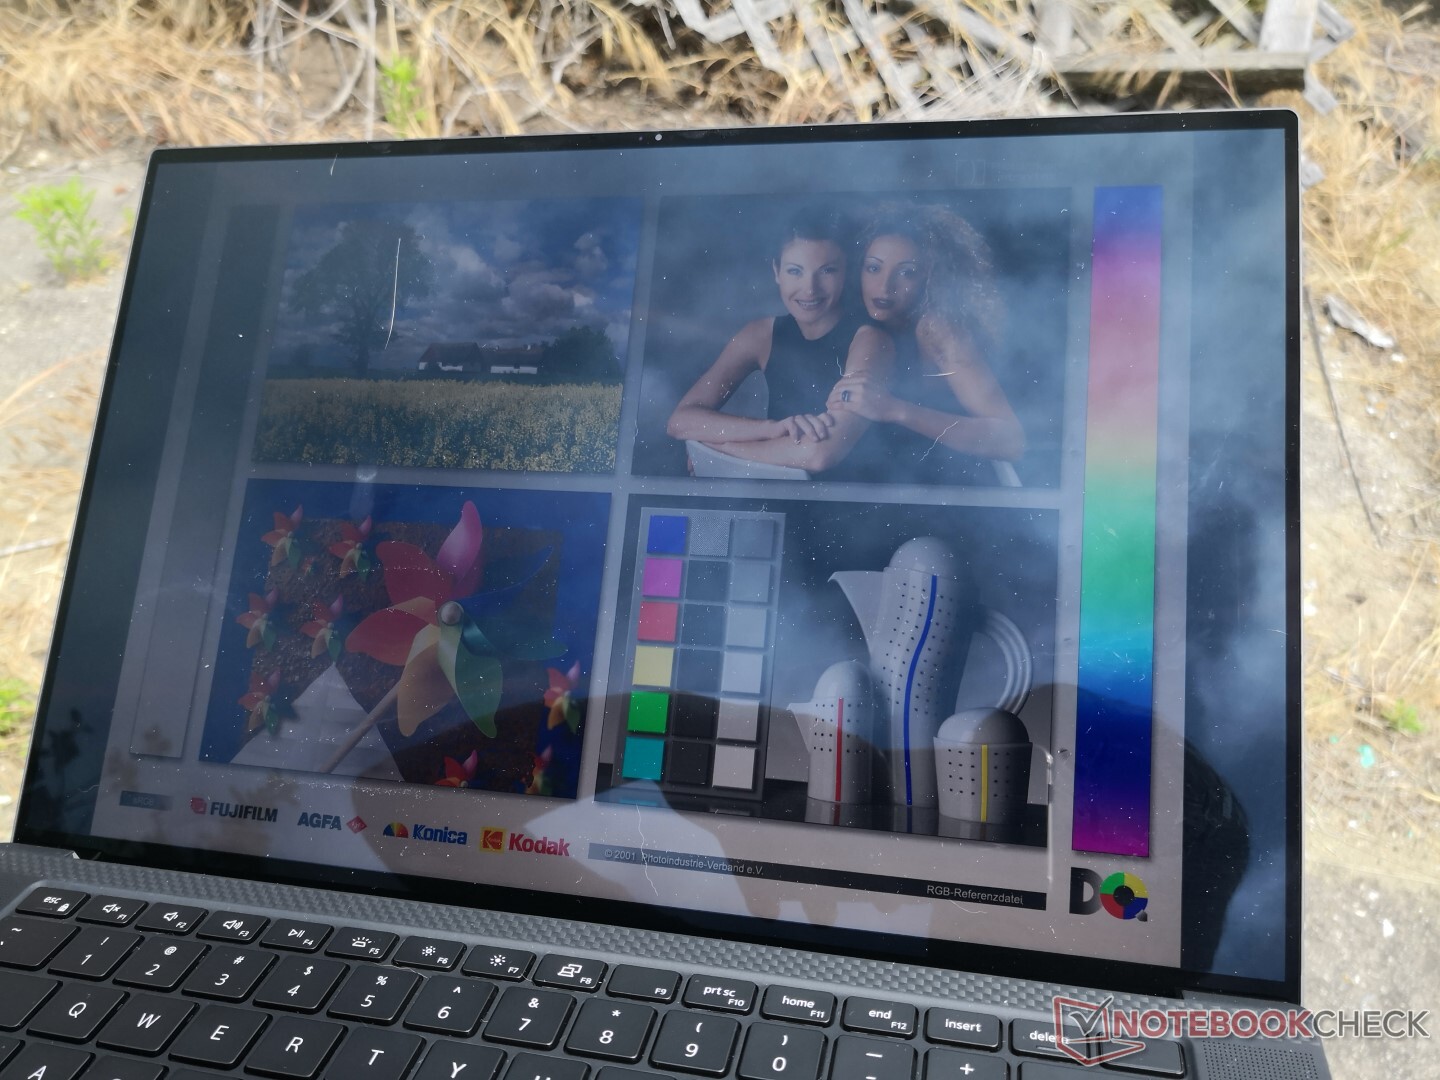
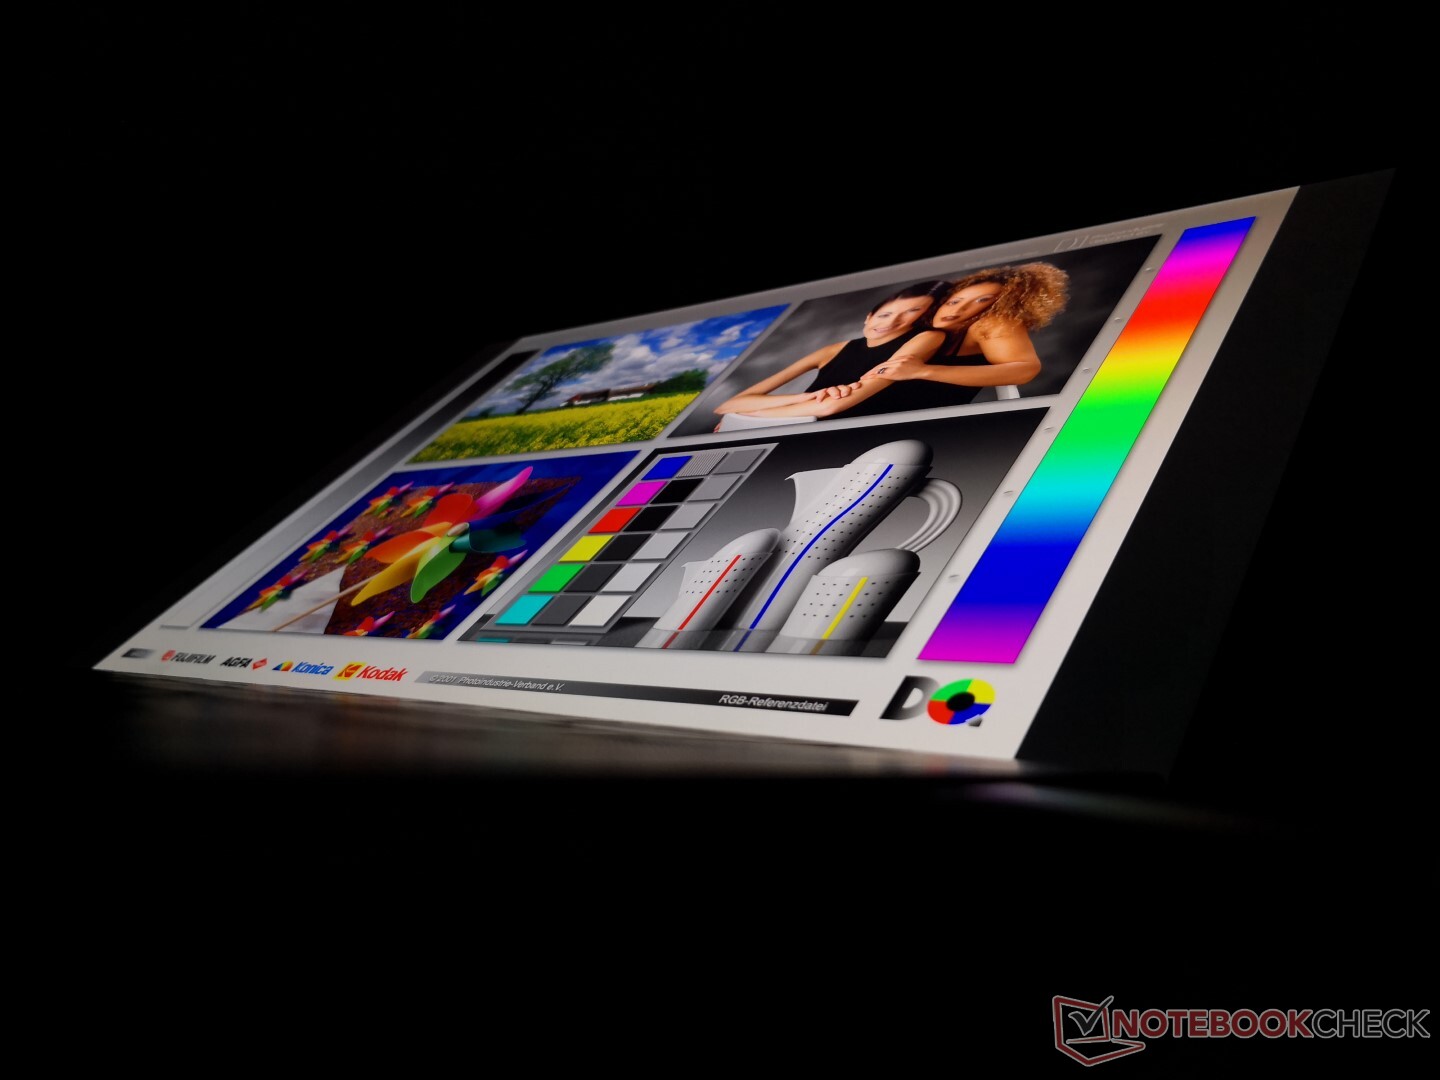
If there's any reason to prefer the matte FHD version over the glossy 4K version, then it would be for outdoor visibility. Glare is heavier here and the backlight isn't as bright as the FHD version as mentioned above. Nonetheless, the XPS is still better than most other Ultrabooks when outdoors since the backlight is brighter than average. Keep in mind that additional settings via the Intel Graphics Command Center app must be toggled or else maximum brightness will drop from 559 nits to 474 nits when running on battery power. This phenomenon would occur on the XPS 13 9300 series as well.


Performance
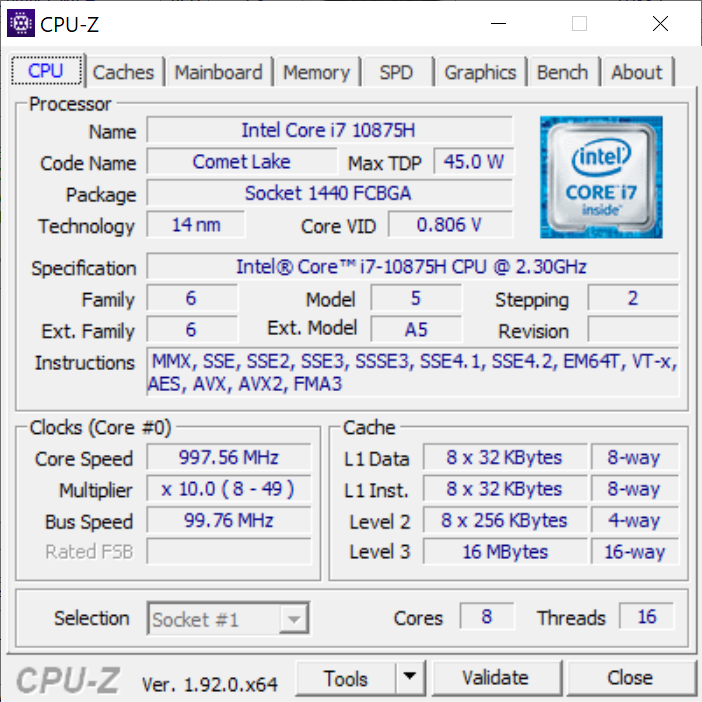
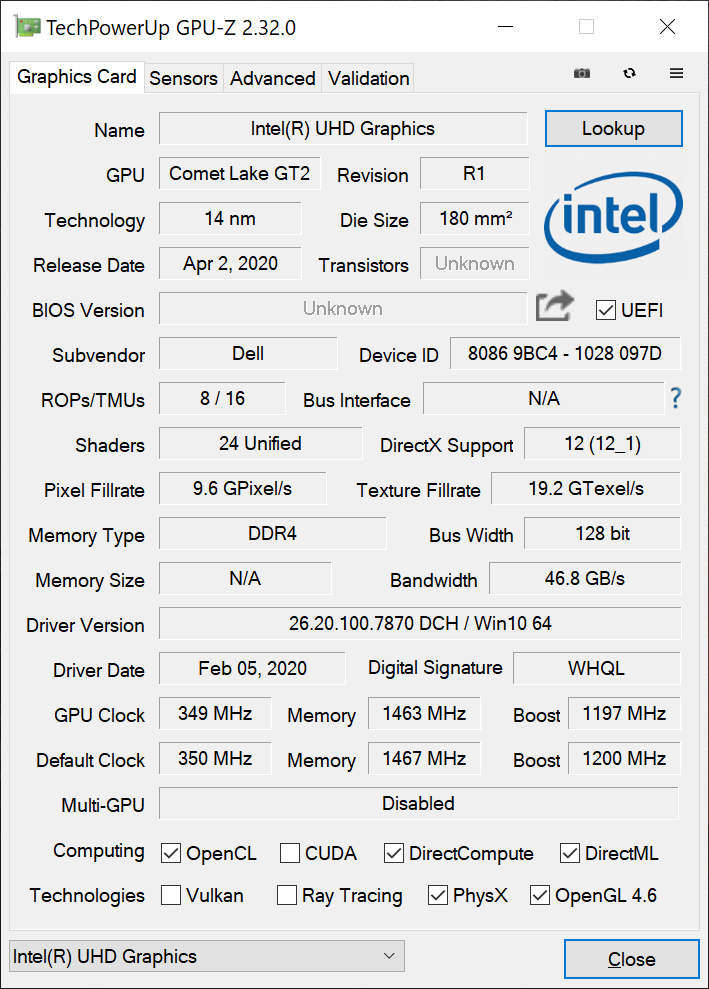
The highest-end CPU option for the XPS 15 9500 at the moment is the Comet Lake-H Core i7-10875H we have here. Thus, there are no Core i9 options to speak of unlike on the XPS 15 7590 — at least for now. This is probably for the best considering that the Core i9-9980HK would perform so closely to the Core i7-9750H that it was difficult to recommend the Core i9 SKU over the Core i7 SKU.
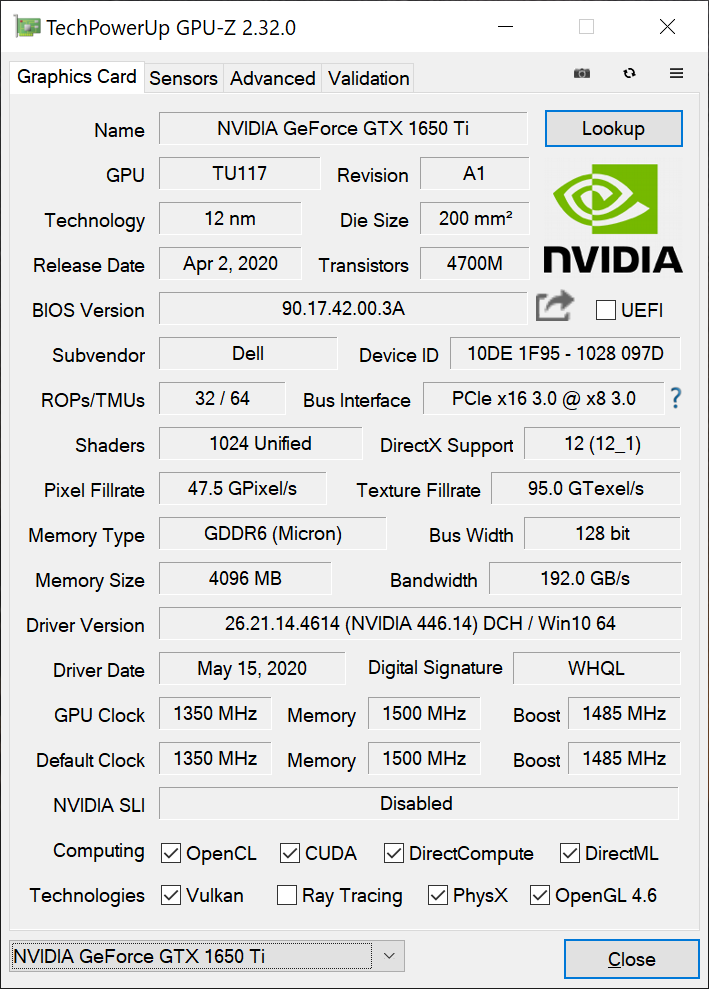
As for the GPU, the XPS 15 9500 is one of the first to carry the GeForce GTX 1650 Ti to replace last year's GTX 1650. We suspect that Dell couldn't offer the even faster GTX 1660 Ti due to thermal limitations. Users will have to consider alternatives like the Gigabyte Aero 15, Razer Blade 15, or Eluktronics RP-15 where higher-end GPUs are available.
All performance benchmark tests below were performed on Dell's Ultra Performance mode unless otherwise stated. Optimus comes standard.
Processor
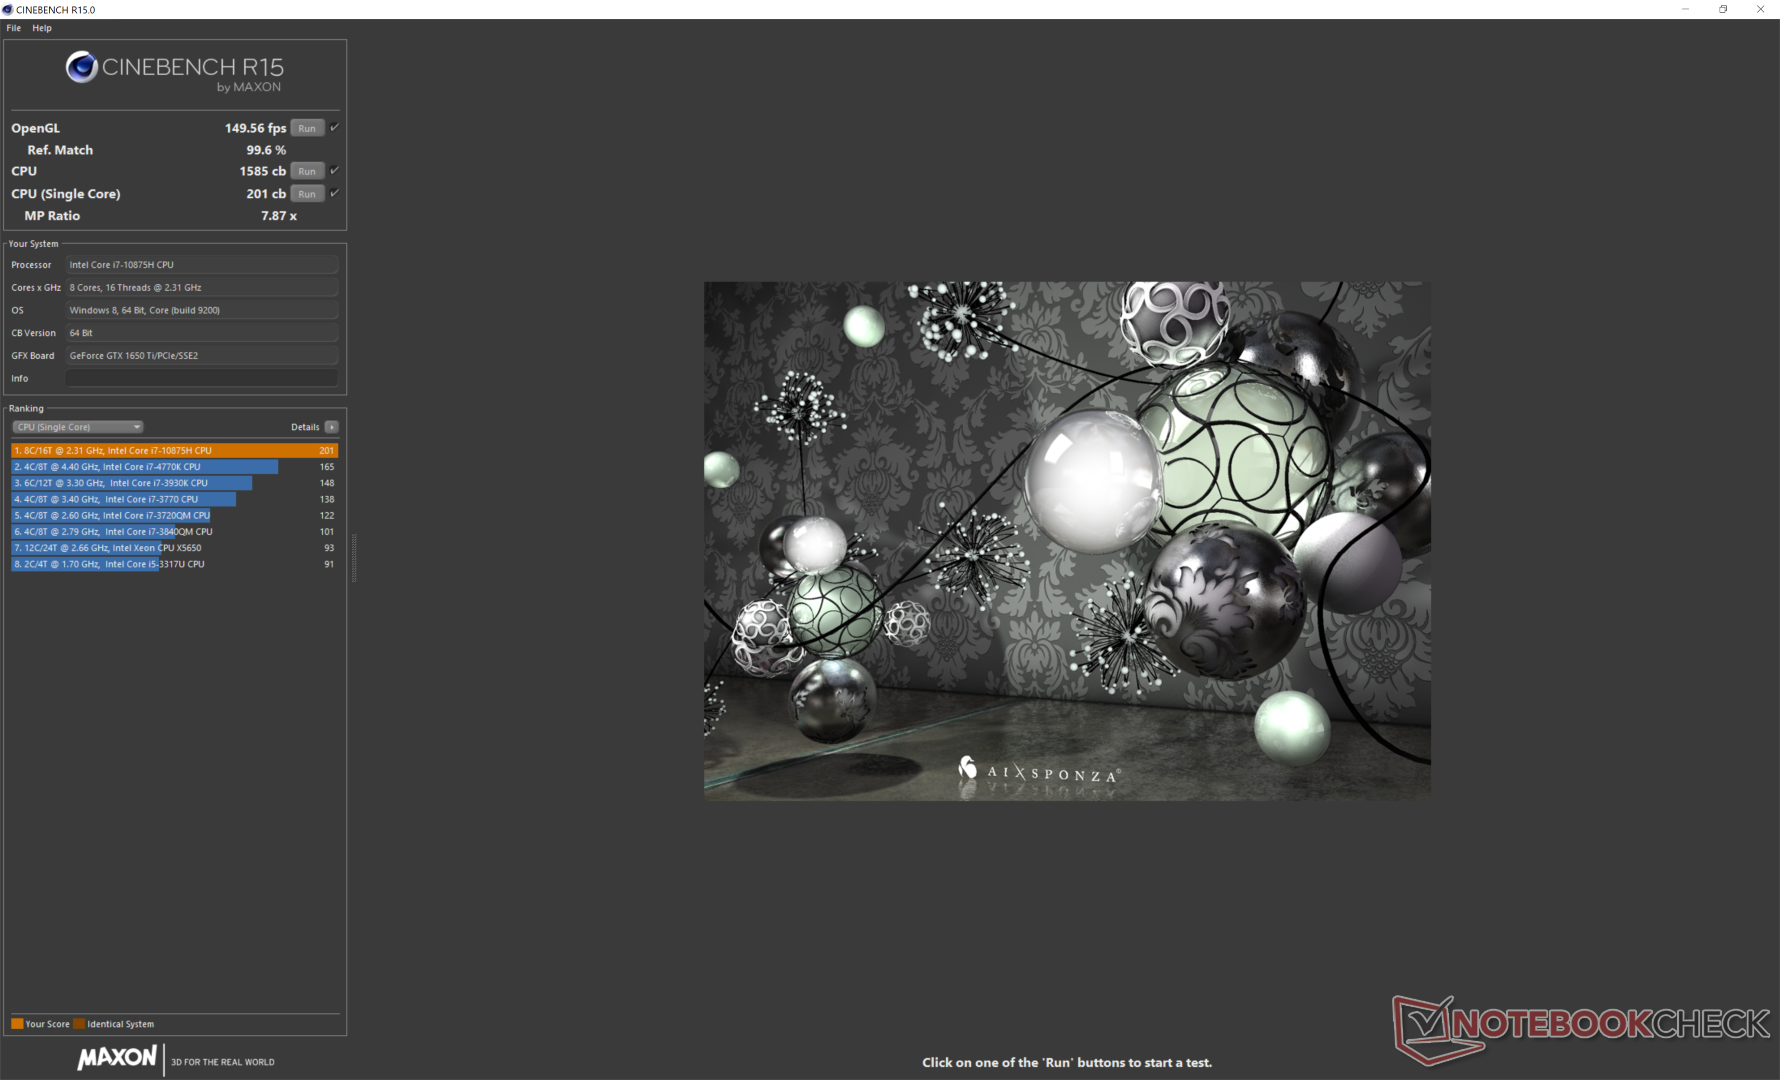
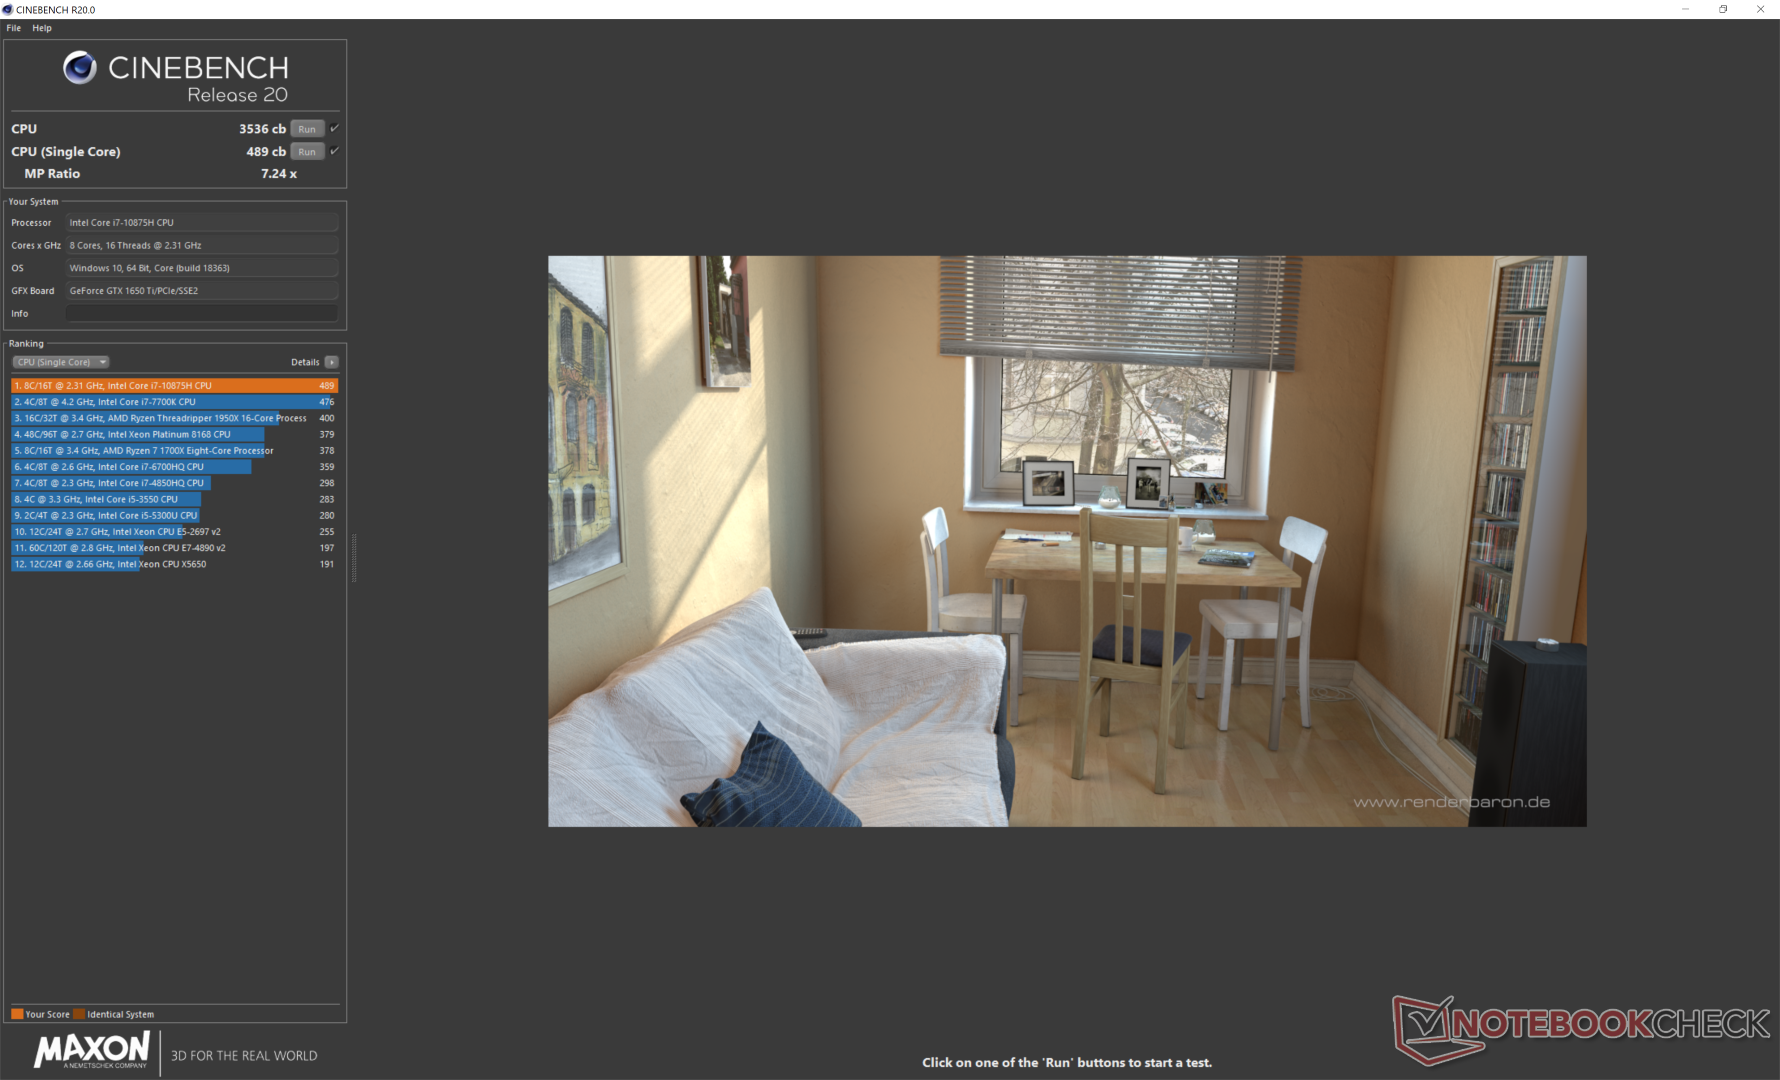
Though it's a Core i7 by name, the 10th gen Core i7-10875H can be seen more as a successor to the 9th gen Core i9-9880H or Core i9-9980HK than to the Core i7-9750H since it is an octa-core CPU. In fact, performance is already very close to the Core i9-9980HK in last year's XPS 15 7590 according to CineBench benchmarks. Users upgrading from the base quad-core Core i5-10300H or mid-range Core i7-10750H will see multi-thread performance gains of roughly 50 percent and 25 percent, respectively.
Running CineBench R15 in a loop shows better performance sustainability than previous generation models. The initial score of 1390 points would drop and stabilize to about 1290 points to represent a performance dip of only 7 percent.
It's too bad that there are still no AMD Ryzen options for the Dell XPS series. The Ryzen 7 4800H, for example, is able to handily outperform any mobile Intel 10th gen Core i7 model and even many Core i9 models as well.
Cinebench R15: CPU Multi 64Bit | CPU Single 64Bit
Blender: v2.79 BMW27 CPU
7-Zip 18.03: 7z b 4 -mmt1 | 7z b 4
Geekbench 5.5: Single-Core | Multi-Core
HWBOT x265 Benchmark v2.2: 4k Preset
LibreOffice : 20 Documents To PDF
R Benchmark 2.5: Overall mean
| Blender / v2.79 BMW27 CPU | |
| Dell XPS 15 9500 Core i5 | |
| Schenker Work 15 | |
| Schenker Work 15 | |
| Razer Blade 15 RZ09-0328 | |
| Apple MacBook Pro 15 2019 i9 Vega 16 | |
| Dell XPS 15 9500 Core i7 4K UHD | |
| Average Intel Core i7-10875H (259 - 535, n=30) | |
| MSI GS66 Stealth 10SFS | |
| Eluktronics RP-15 | |
| 7-Zip 18.03 / 7z b 4 -mmt1 | |
| Average Intel Core i7-10875H (5071 - 5780, n=31) | |
| Dell XPS 15 9500 Core i7 4K UHD | |
| MSI GS66 Stealth 10SFS | |
| Razer Blade 15 RZ09-0328 | |
| Dell XPS 15 9500 Core i5 | |
| Eluktronics RP-15 | |
| Schenker Work 15 | |
| Schenker Work 15 | |
| 7-Zip 18.03 / 7z b 4 | |
| Eluktronics RP-15 | |
| MSI GS66 Stealth 10SFS | |
| Average Intel Core i7-10875H (29844 - 49562, n=31) | |
| Dell XPS 15 9500 Core i7 4K UHD | |
| Razer Blade 15 RZ09-0328 | |
| Schenker Work 15 | |
| Schenker Work 15 | |
| Dell XPS 15 9500 Core i5 | |
| Geekbench 5.5 / Single-Core | |
| Dell XPS 15 9500 Core i7 4K UHD | |
| Average Intel Core i7-10875H (1233 - 1371, n=29) | |
| MSI GS66 Stealth 10SFS | |
| Eluktronics RP-15 | |
| Dell XPS 15 9500 Core i5 | |
| Razer Blade 15 RZ09-0328 | |
| MSI Alpha 15 A3DDK-034 | |
| Geekbench 5.5 / Multi-Core | |
| Eluktronics RP-15 | |
| Dell XPS 15 9500 Core i7 4K UHD | |
| Average Intel Core i7-10875H (5715 - 8620, n=29) | |
| MSI GS66 Stealth 10SFS | |
| Razer Blade 15 RZ09-0328 | |
| Dell XPS 15 9500 Core i5 | |
| MSI Alpha 15 A3DDK-034 | |
| HWBOT x265 Benchmark v2.2 / 4k Preset | |
| Eluktronics RP-15 | |
| MSI GS66 Stealth 10SFS | |
| Average Intel Core i7-10875H (7.27 - 14.1, n=27) | |
| Dell XPS 15 9500 Core i7 4K UHD | |
| Razer Blade 15 RZ09-0328 | |
| Schenker Work 15 | |
| Schenker Work 15 | |
| Dell XPS 15 9500 Core i5 | |
| LibreOffice / 20 Documents To PDF | |
| Dell XPS 15 9500 Core i5 | |
| Eluktronics RP-15 | |
| Razer Blade 15 RZ09-0328 | |
| Dell XPS 15 9500 Core i7 4K UHD | |
| MSI GS66 Stealth 10SFS | |
| Average Intel Core i7-10875H (30.2 - 84.3, n=30) | |
| R Benchmark 2.5 / Overall mean | |
| Dell XPS 15 9500 Core i5 | |
| MSI GS66 Stealth 10SFS | |
| Dell XPS 15 9500 Core i7 4K UHD | |
| Average Intel Core i7-10875H (0.546 - 0.662, n=29) | |
| Eluktronics RP-15 | |
* ... smaller is better
System Performance
PCMark benchmarks are consistently ahead of the base Core i5 XPS 15 9500 configuration while being behind last year's XPS 15 7590 in the Digital Creation benchmark. This particular sub-test has never been very reliable and so it can be disregarded in most cases.
We experienced no software or hardware issues during our time with the test unit. Additionally, we were unable to reproduce the strange USB behavior that we saw on our XPS 15 9500 Core i5 unit.
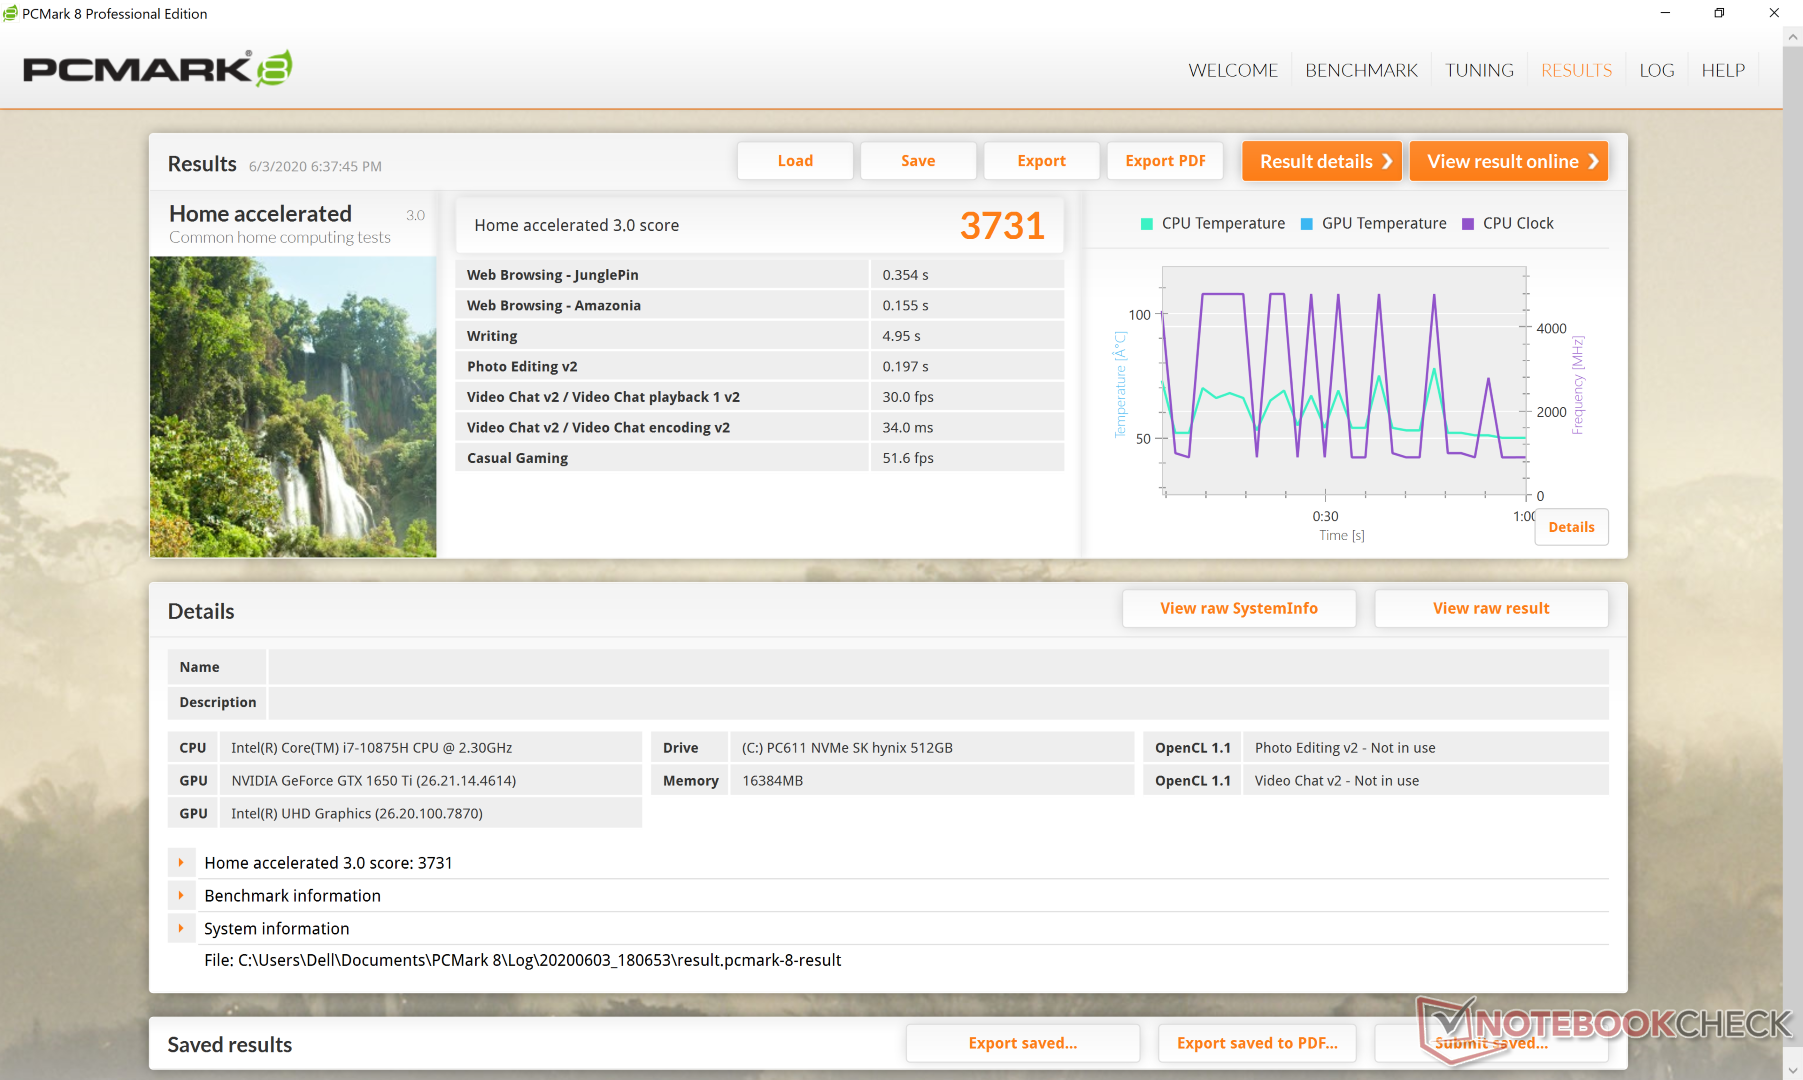
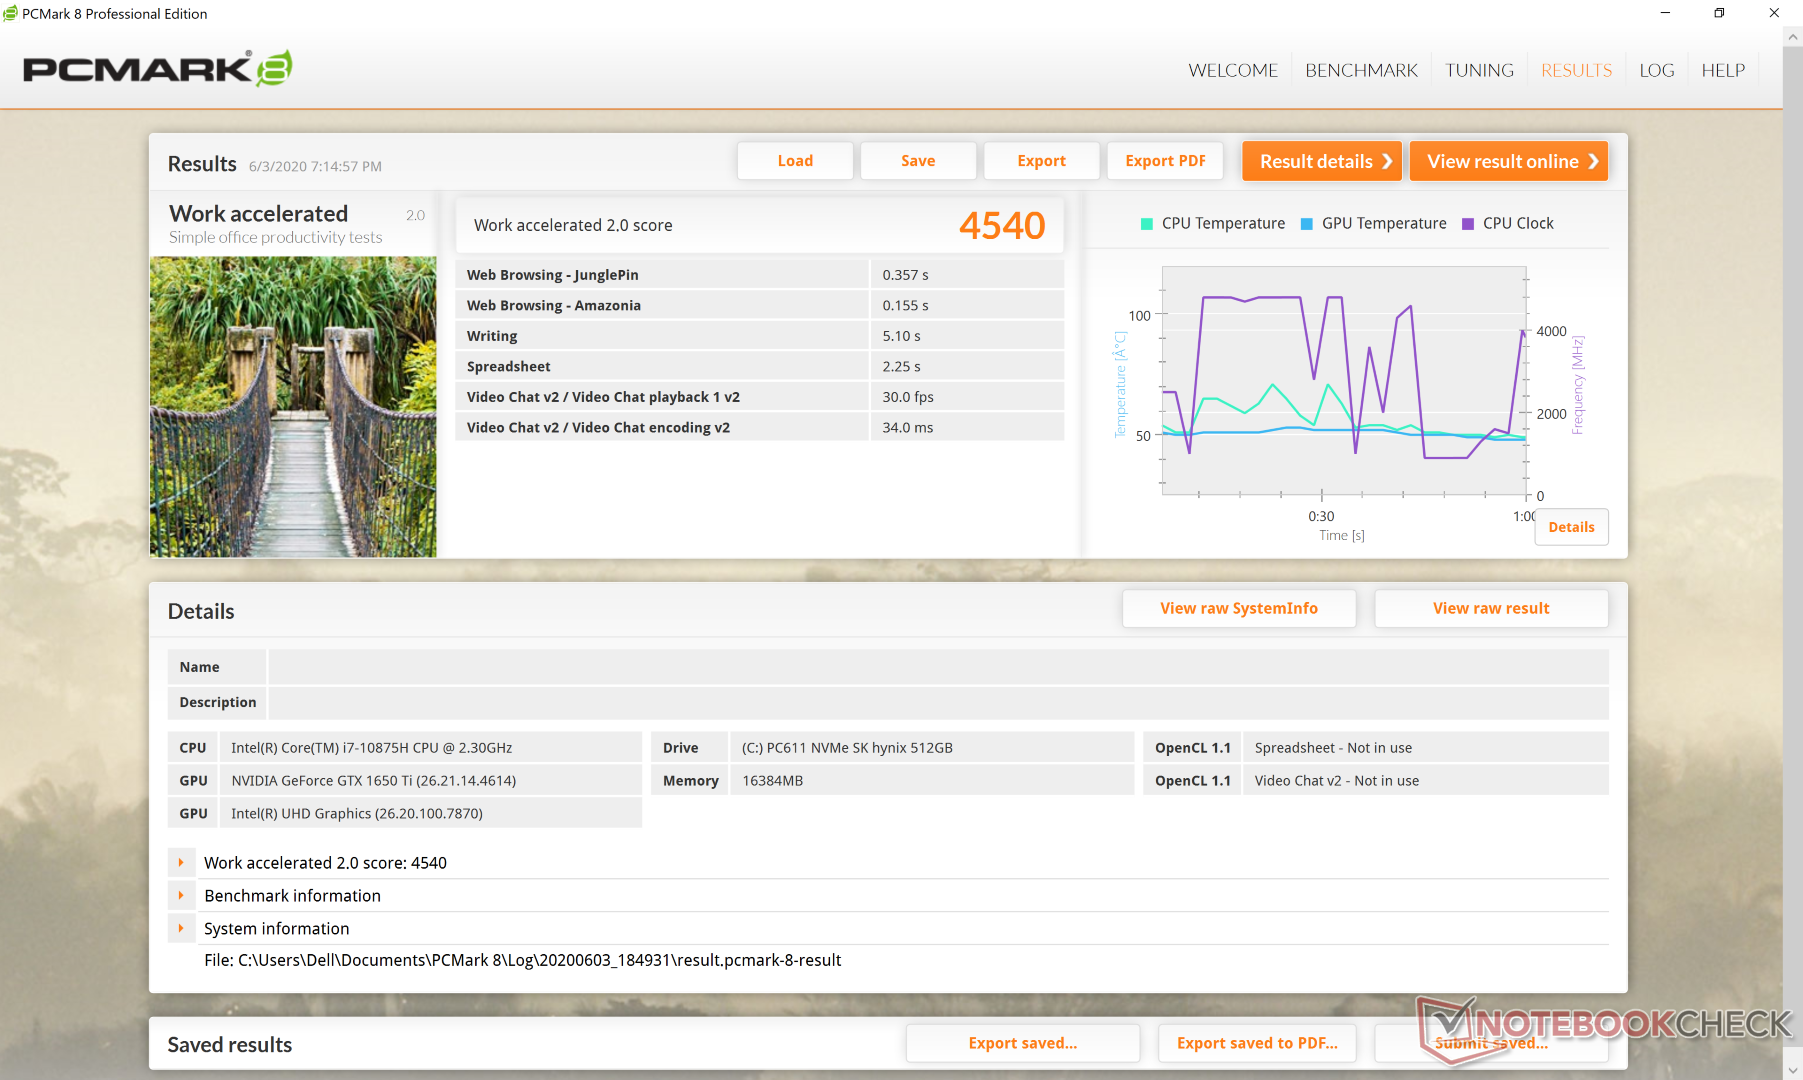
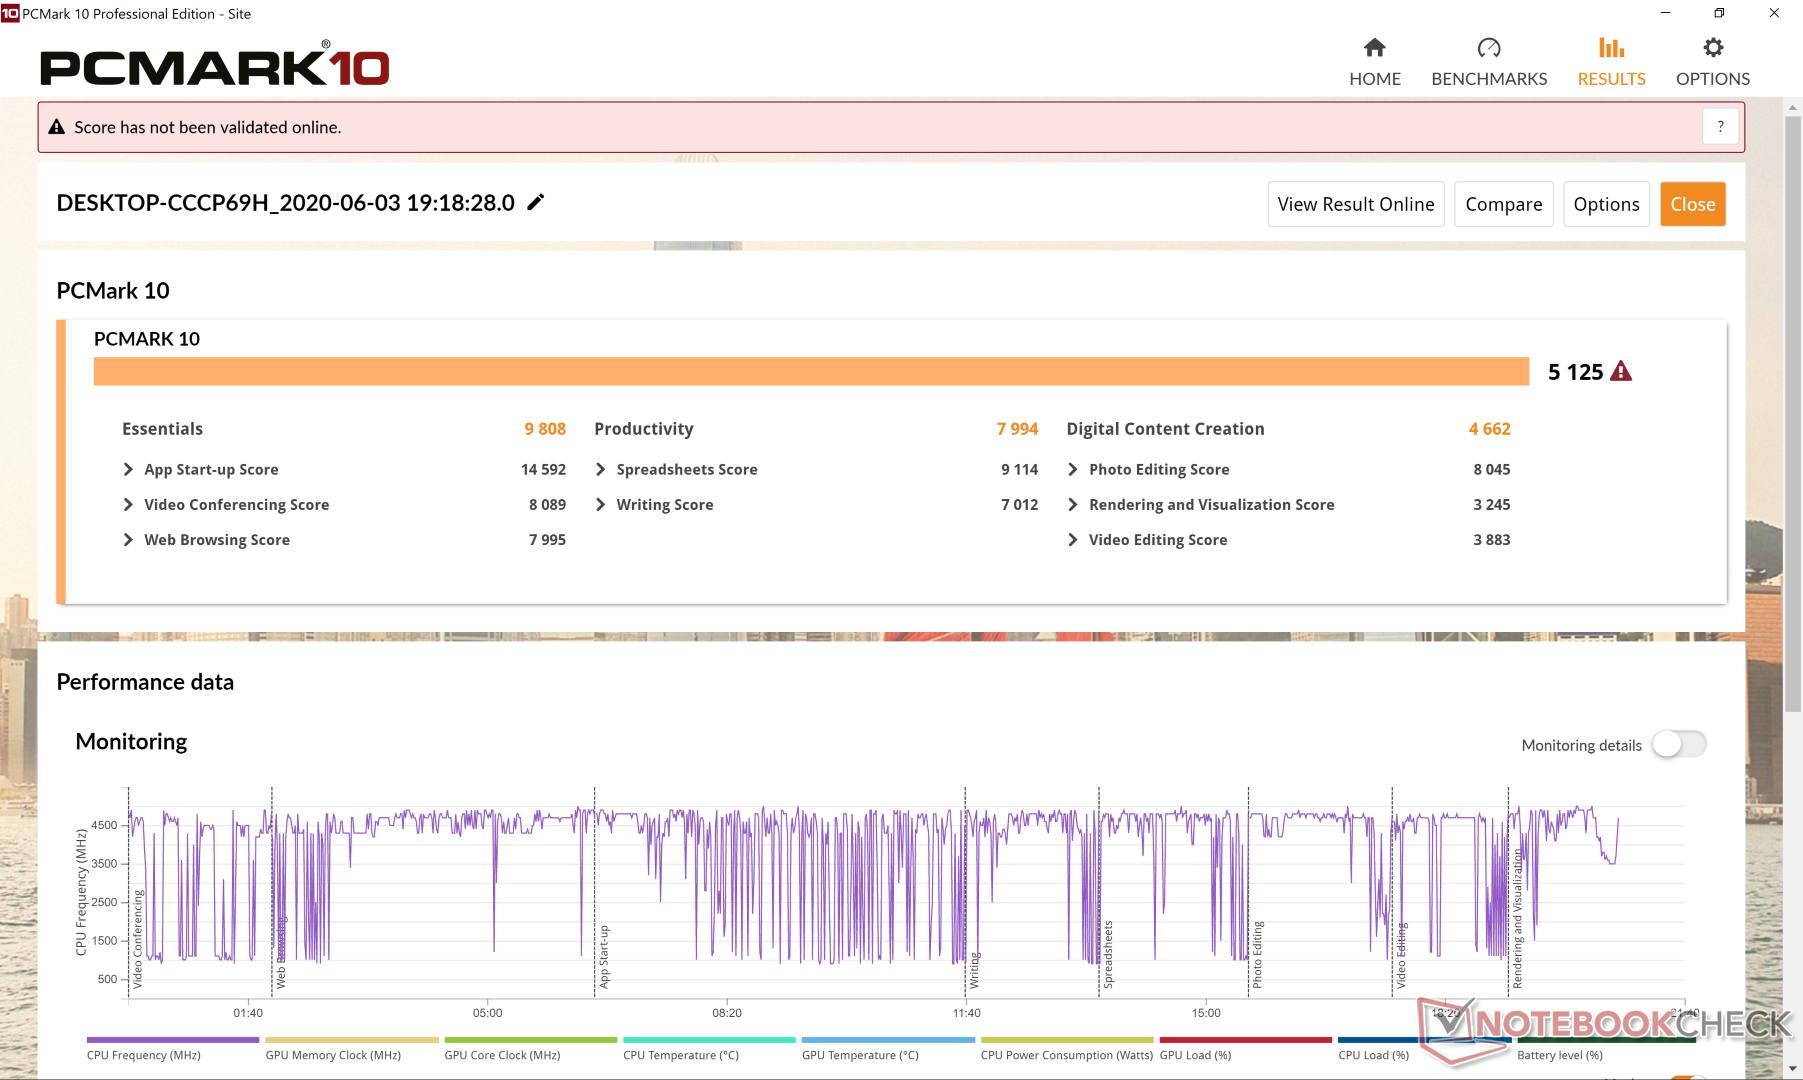
| PCMark 8 Home Score Accelerated v2 | 3731 points | |
| PCMark 8 Work Score Accelerated v2 | 4540 points | |
| PCMark 10 Score | 5125 points | |
Help | ||
DPC Latency
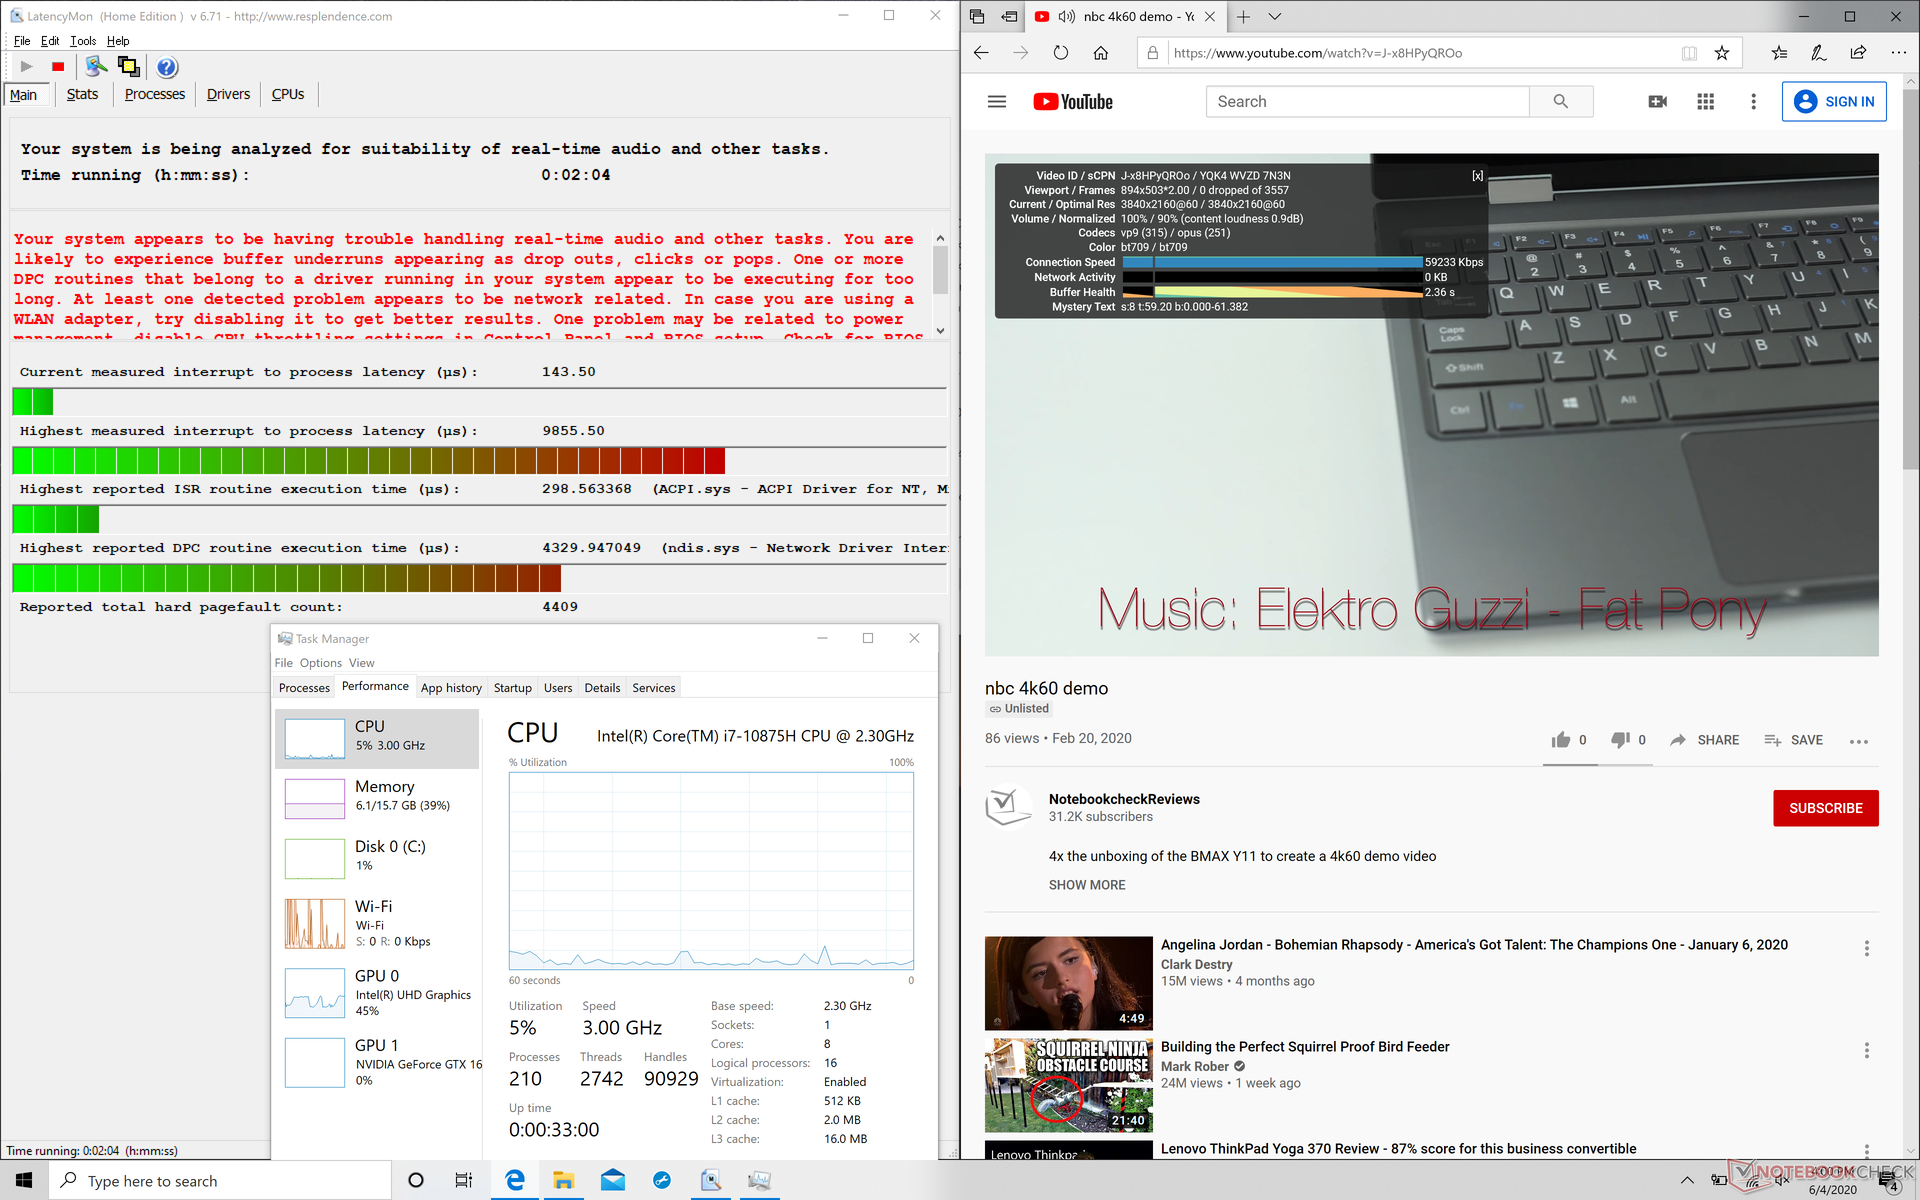
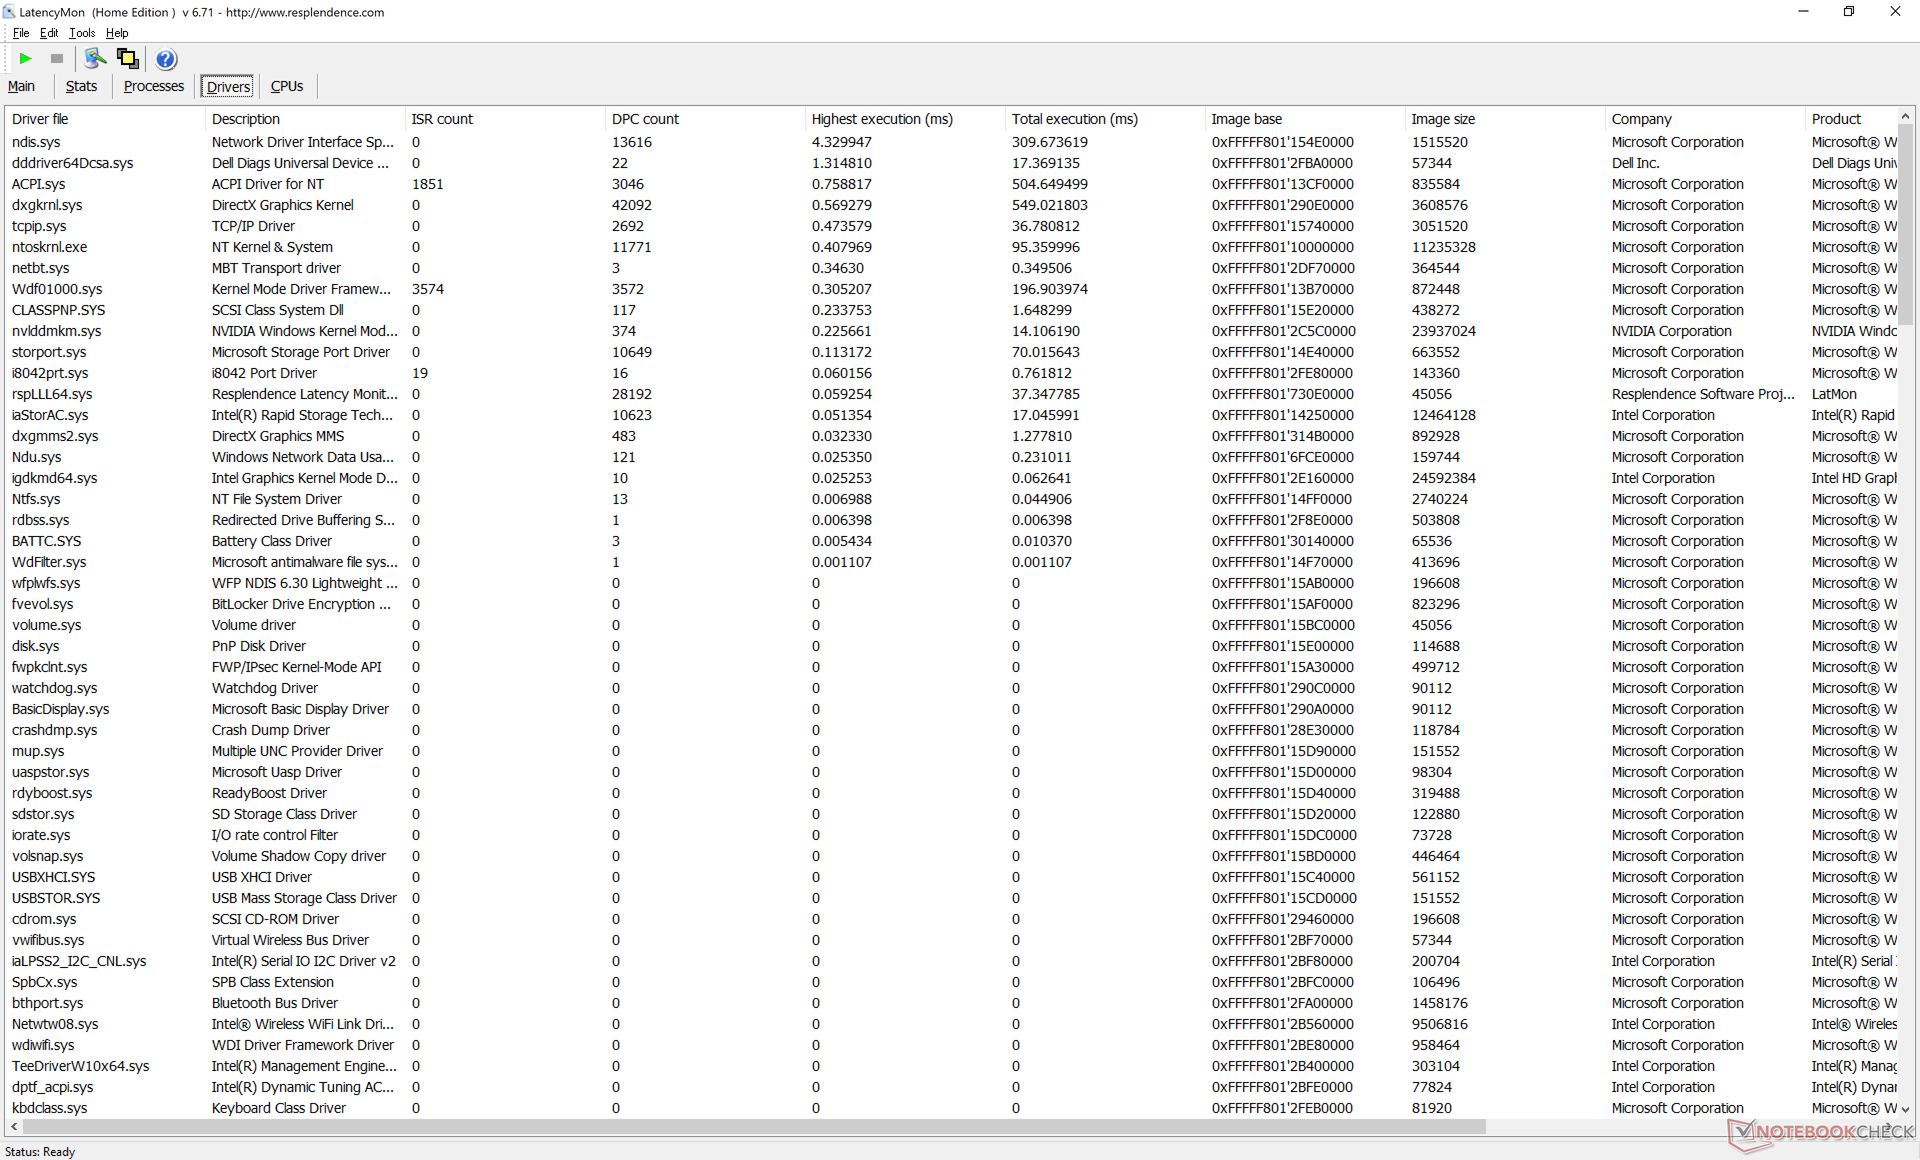
LatencyMon shows steeper DPC latency issues when opening multiple browser tabs on our homepage when compared to the base XPS 15 9500 Core i5 option. Thankfully, 4K UHD video playback remains smooth.
| DPC Latencies / LatencyMon - interrupt to process latency (max), Web, Youtube, Prime95 | |
| Dell XPS 15 9500 Core i7 4K UHD | |
| MSI GS66 Stealth 10SFS | |
| Dell XPS 15 9500 Core i5 | |
| Eluktronics RP-15 | |
* ... smaller is better
Storage Devices
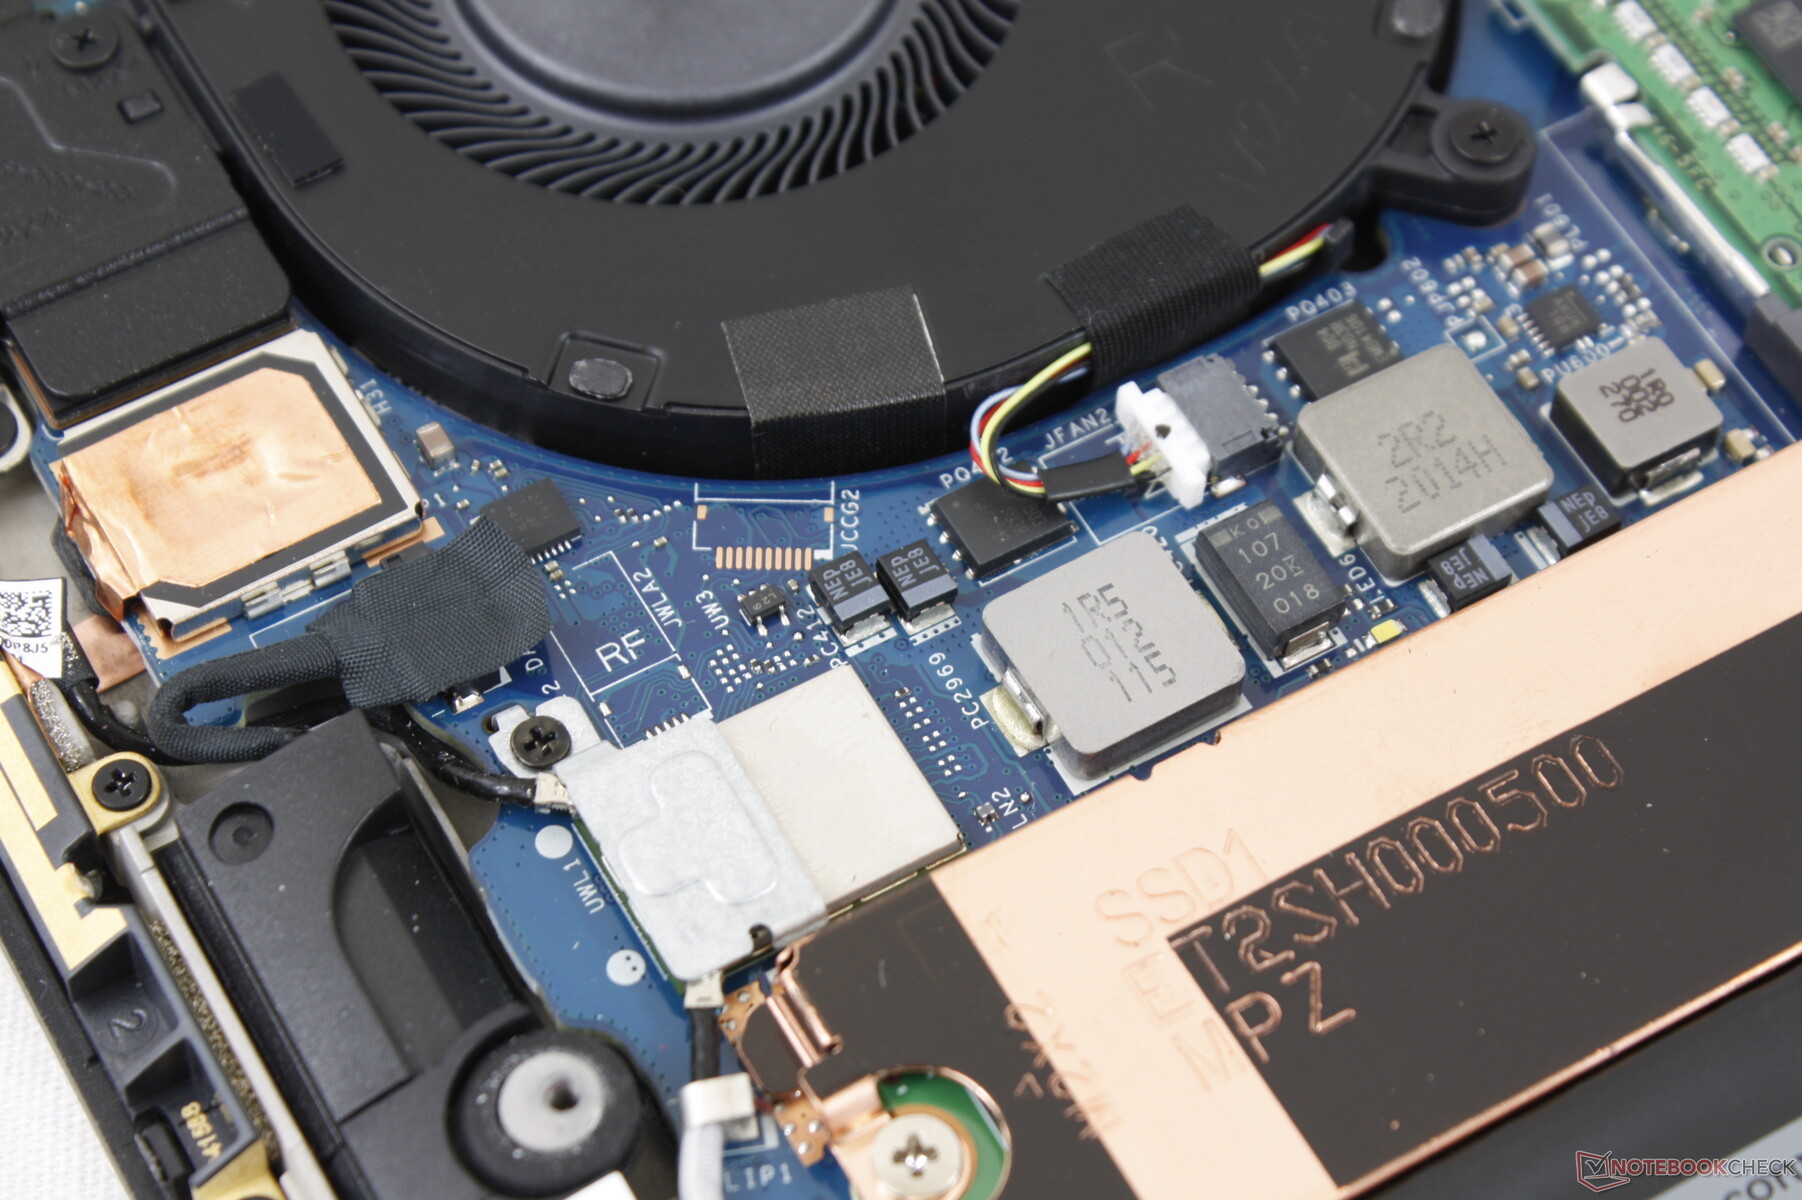
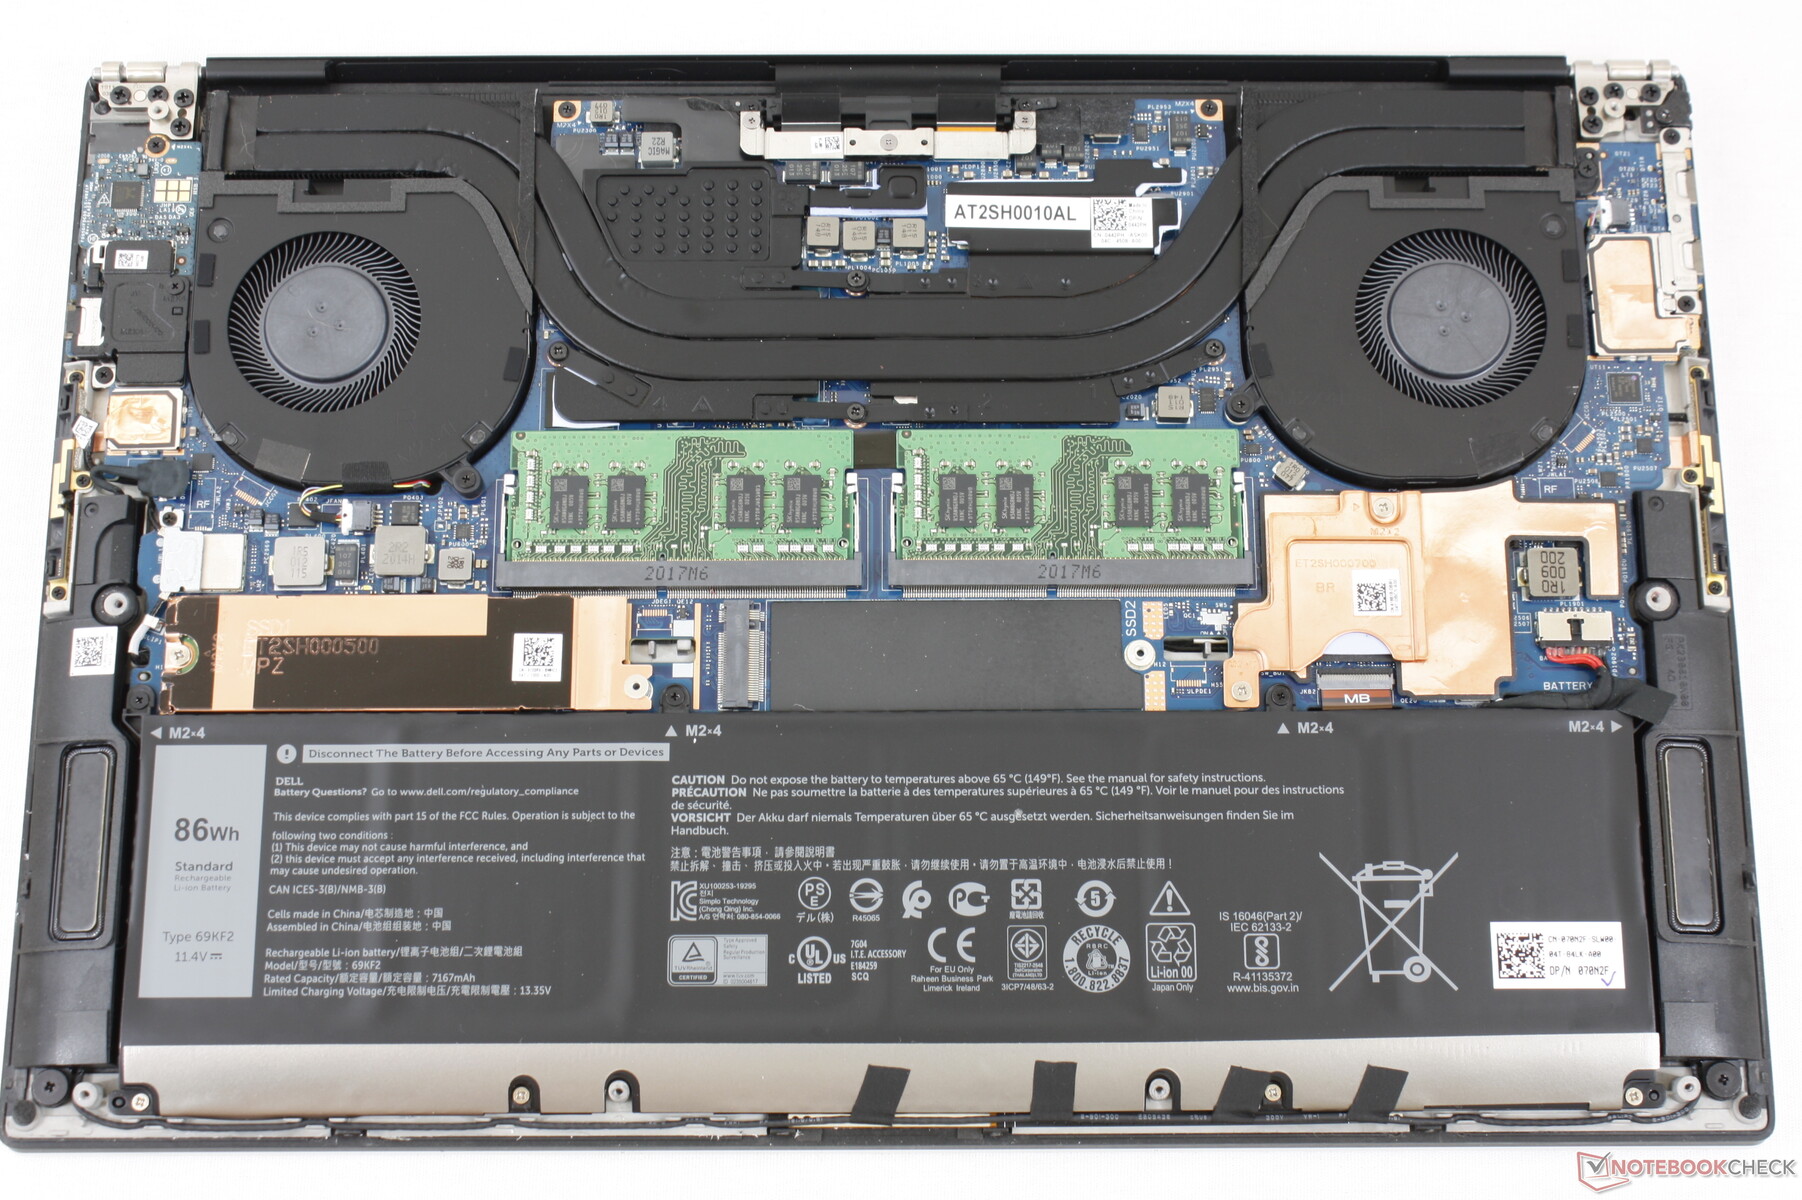
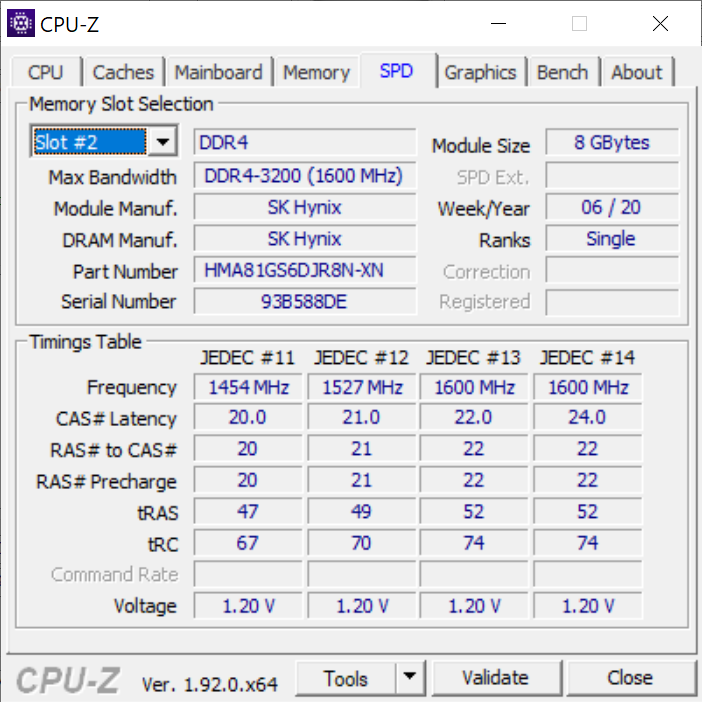
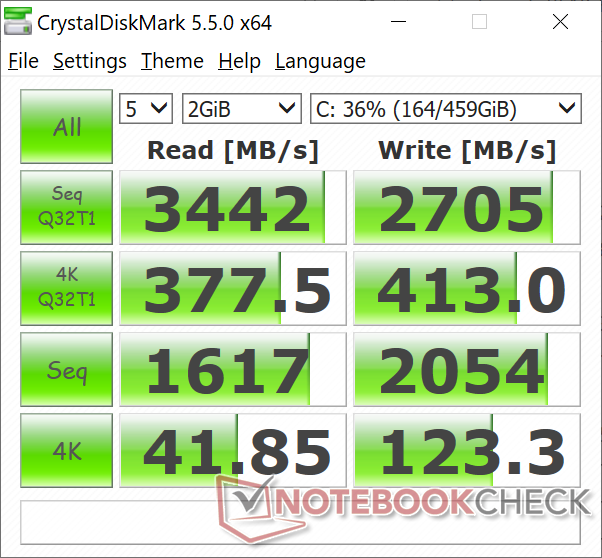
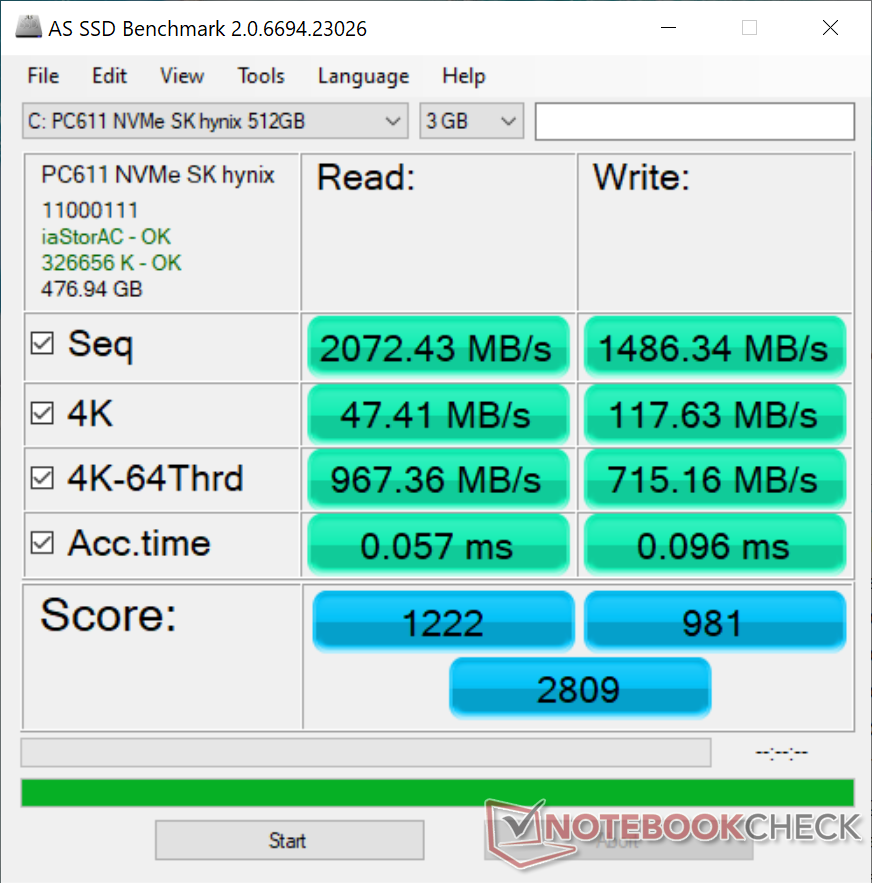
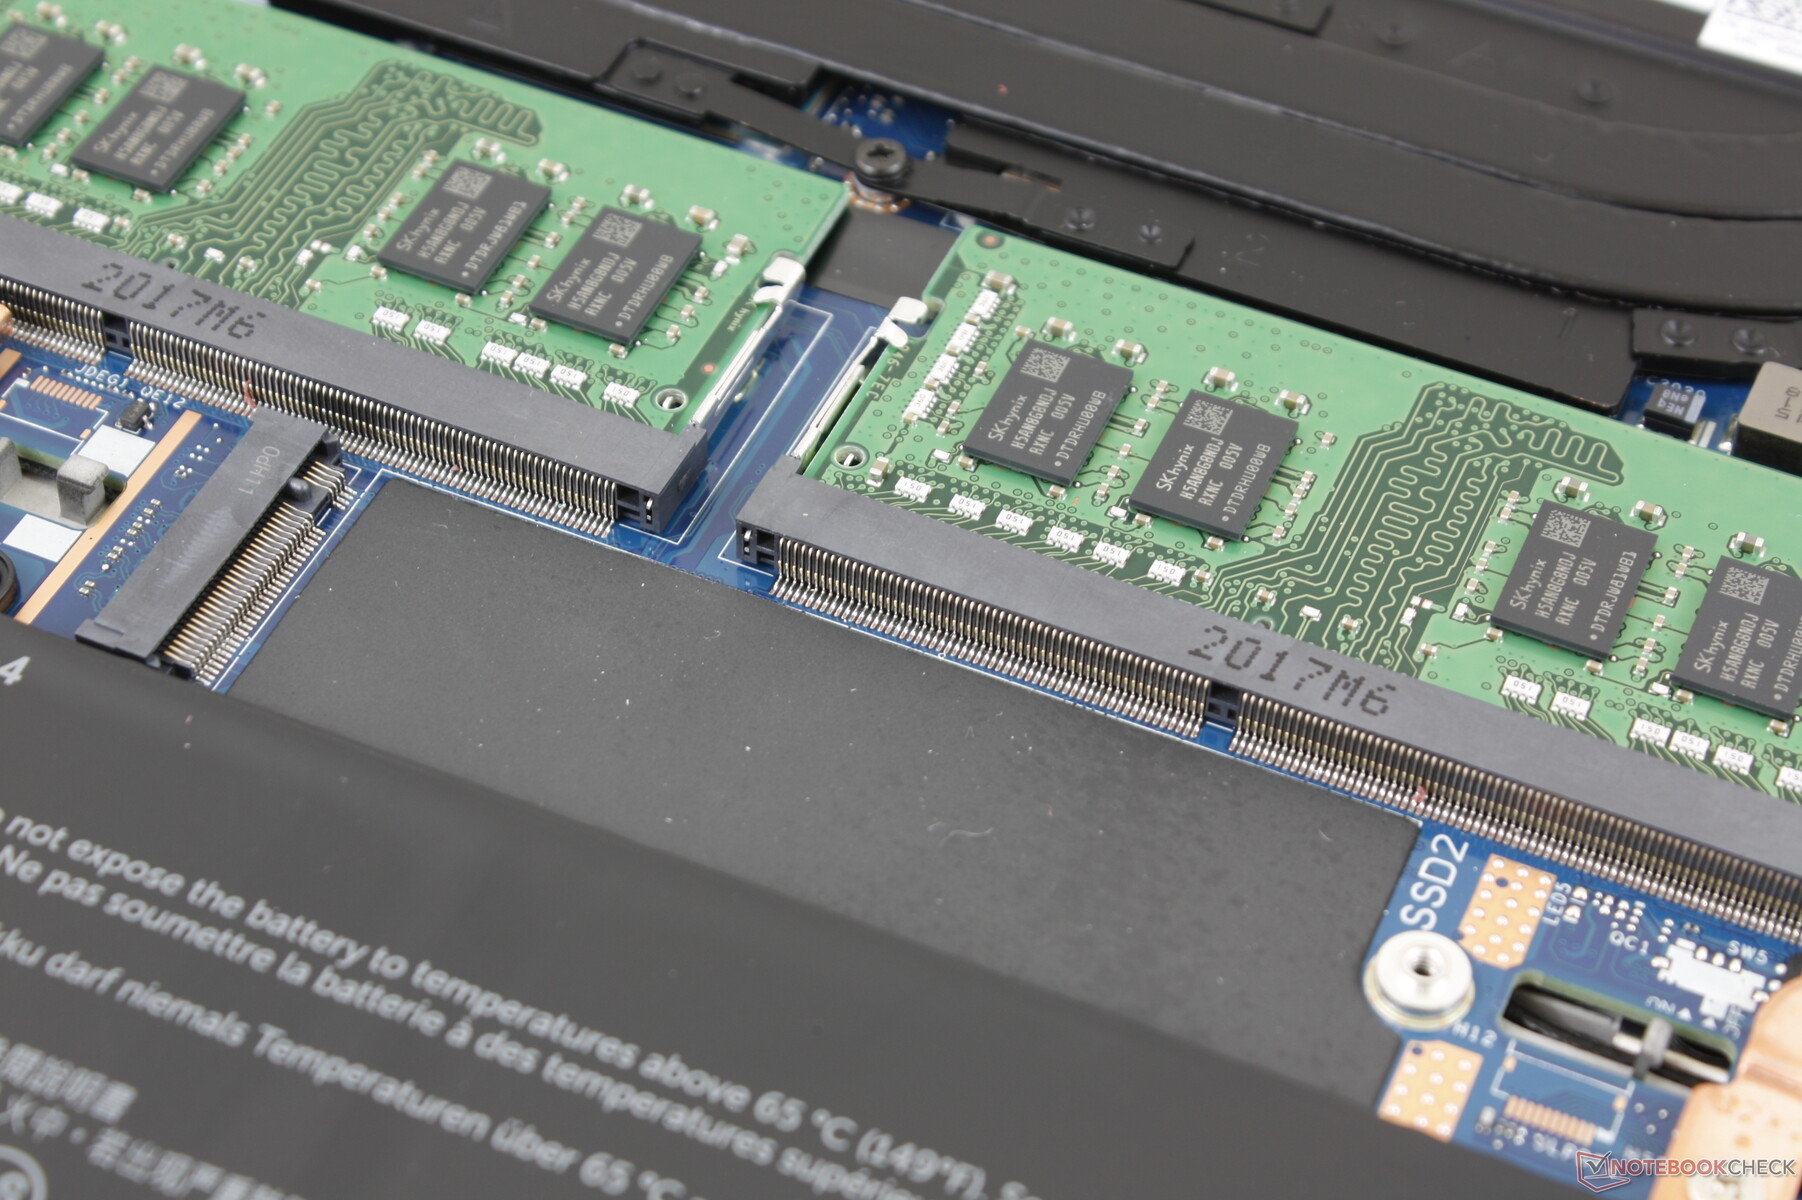
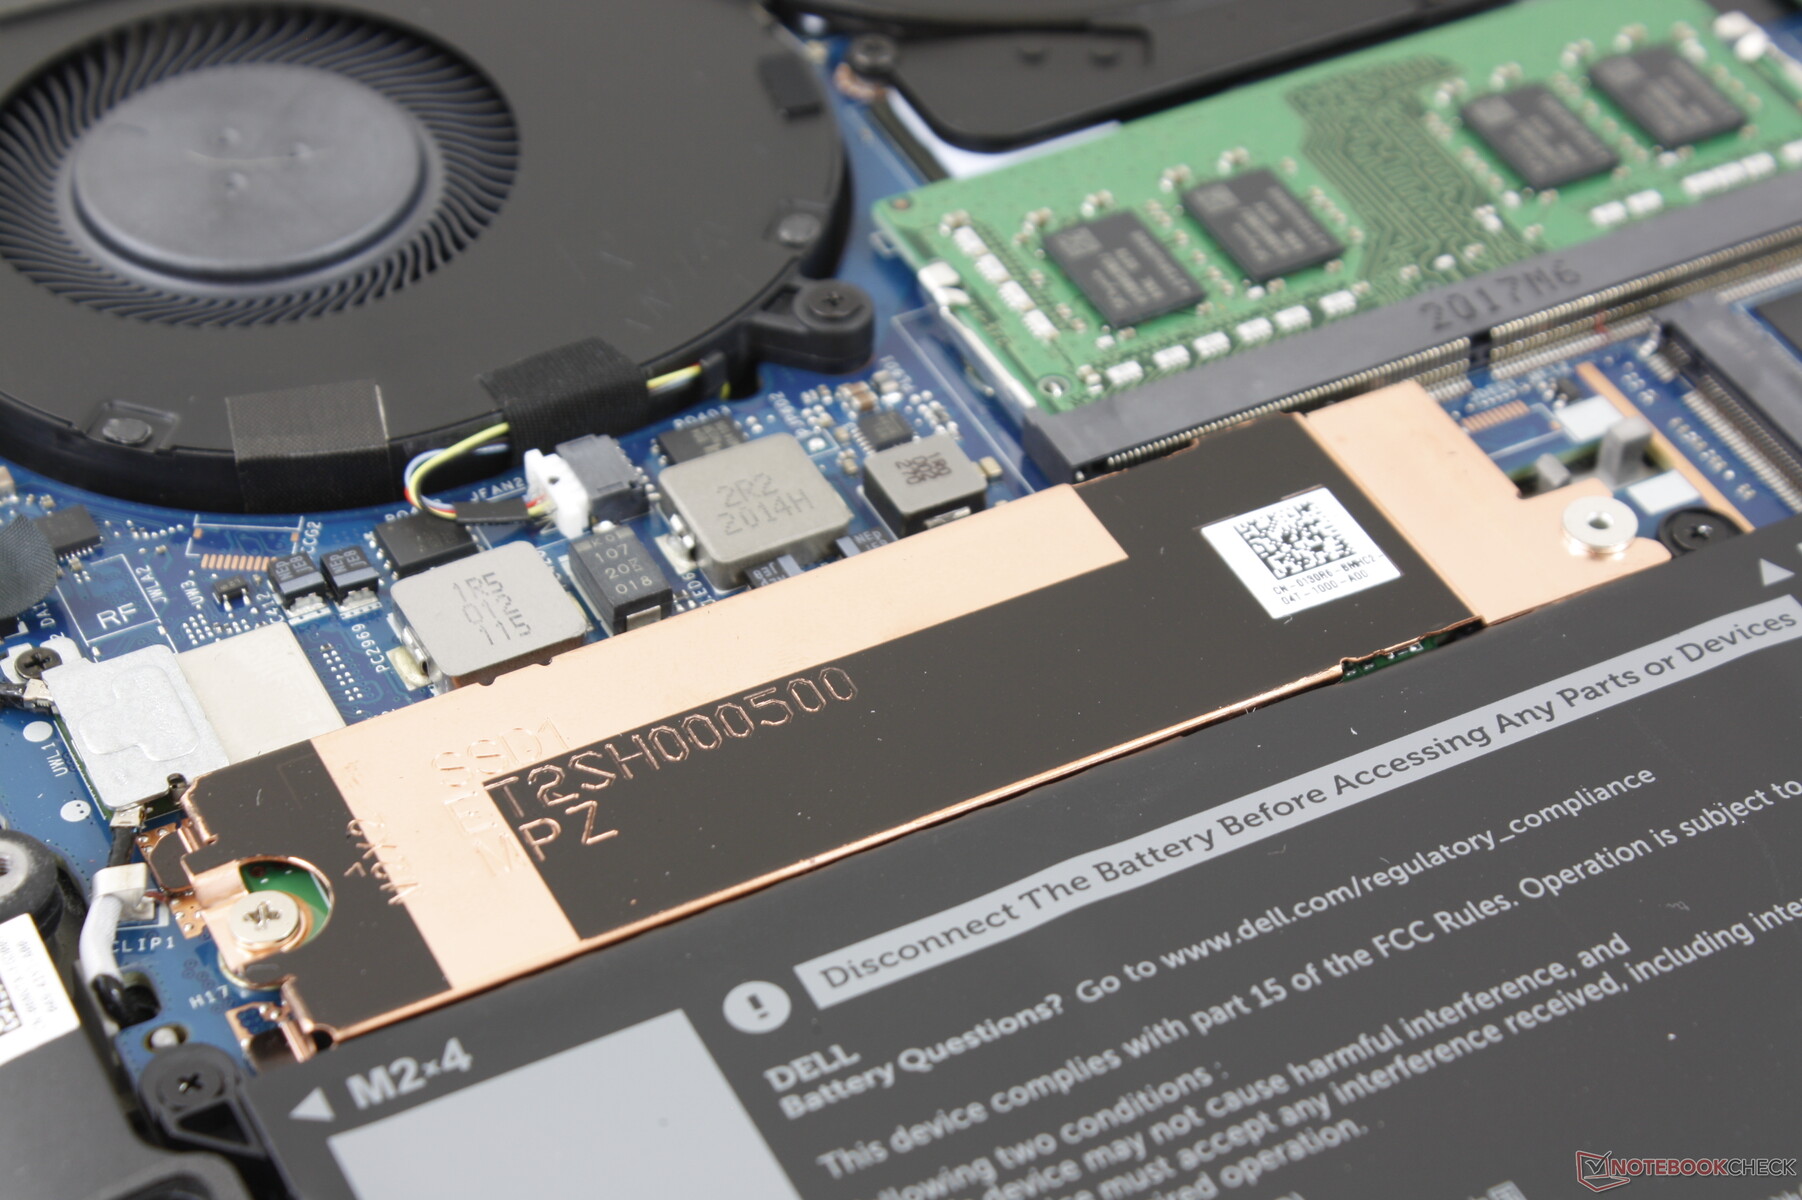
Our test unit comes with a 512 GB SK Hynix PC611 NVMe SSD with options to configure up to 2x 2 TB M.2 PCIe SSDs. Though it's not a Samsung or Toshiba drive, performance is still roughly on par with their respective high-end models. Historically, XPS systems have carried SSDs from SK Hynix, Toshiba, Samsung, and Lite-On and so it's not always easy to know which one of the four you may be getting.
See our table of SSDs and HDDs for more benchmark comparisons.
| Dell XPS 15 9500 Core i7 4K UHD SK Hynix PC611 512GB | Dell XPS 15 7590 9980HK GTX 1650 Toshiba XG6 KXG60ZNV1T02 | Lenovo Yoga C940-15IRH Intel Optane Memory H10 with Solid State Storage 32GB + 512GB HBRPEKNX0202A(L/H) | Asus ZenBook 15 UX534FTC-A8190T Samsung SSD PM981 MZVLB1T0HALR | MSI Prestige 15 A10SC Samsung SSD PM981 MZVLB1T0HALR | Dell XPS 15 9500 Core i5 Toshiba KBG40ZNS256G NVMe | |
|---|---|---|---|---|---|---|
| AS SSD | 32% | -25% | 27% | 30% | -69% | |
| Seq Read (MB/s) | 2072 | 1723 -17% | 769 -63% | 2643 28% | 1274 -39% | 1423 -31% |
| Seq Write (MB/s) | 1486 | 1386 -7% | 351.1 -76% | 1533 3% | 1395 -6% | 766 -48% |
| 4K Read (MB/s) | 47.41 | 43.25 -9% | 69.1 46% | 49.12 4% | 50.3 6% | 42.21 -11% |
| 4K Write (MB/s) | 117.6 | 98.3 -16% | 100.9 -14% | 134.7 15% | 119.8 2% | 74.8 -36% |
| 4K-64 Read (MB/s) | 967 | 1078 11% | 472 -51% | 1028 6% | 1599 65% | 973 1% |
| 4K-64 Write (MB/s) | 715 | 1456 104% | 948 33% | 1353 89% | 1455 103% | 218.8 -69% |
| Access Time Read * (ms) | 0.057 | 0.05 12% | 0.071 -25% | 0.033 42% | 0.044 23% | 0.125 -119% |
| Access Time Write * (ms) | 0.096 | 0.039 59% | 0.137 -43% | 0.028 71% | 0.092 4% | 0.552 -475% |
| Score Read (Points) | 1222 | 1294 6% | 618 -49% | 1342 10% | 1777 45% | 1157 -5% |
| Score Write (Points) | 981 | 1693 73% | 1084 10% | 1641 67% | 1714 75% | 370 -62% |
| Score Total (Points) | 2809 | 3638 30% | 2024 -28% | 3622 29% | 4411 57% | 2094 -25% |
| Copy ISO MB/s (MB/s) | 1999 | 3182 59% | 839 -58% | 2226 11% | 2830 42% | 1151 -42% |
| Copy Program MB/s (MB/s) | 627 | 984 57% | 455.8 -27% | 506 -19% | 609 -3% | 499.4 -20% |
| Copy Game MB/s (MB/s) | 1001 | 1824 82% | 969 -3% | 1230 23% | 1424 42% | 733 -27% |
| CrystalDiskMark 5.2 / 6 | 1% | 2% | 8% | -13% | -23% | |
| Write 4K (MB/s) | 123.3 | 104.3 -15% | 102.2 -17% | 138.1 12% | 150.8 22% | 93.3 -24% |
| Read 4K (MB/s) | 41.85 | 45.23 8% | 114.3 173% | 45.89 10% | 47.3 13% | 45.9 10% |
| Write Seq (MB/s) | 2054 | 1729 -16% | 468.3 -77% | 2147 5% | 981 -52% | 1211 -41% |
| Read Seq (MB/s) | 1617 | 1861 15% | 1236 -24% | 2188 35% | 976 -40% | 1633 1% |
| Write 4K Q32T1 (MB/s) | 413 | 509 23% | 556 35% | 427.8 4% | 442.7 7% | 273.1 -34% |
| Read 4K Q32T1 (MB/s) | 377.5 | 388.5 3% | 421.6 12% | 404 7% | 499.7 32% | 356 -6% |
| Write Seq Q32T1 (MB/s) | 2705 | 2813 4% | 1264 -53% | 2396 -11% | 1706 -37% | 1198 -56% |
| Read Seq Q32T1 (MB/s) | 3442 | 2906 -16% | 2239 -35% | 3454 0% | 1758 -49% | 2269 -34% |
| Total Average (Program / Settings) | 17% /
20% | -12% /
-15% | 18% /
20% | 9% /
14% | -46% /
-52% |
* ... smaller is better

Disk Throttling: DiskSpd Read Loop, Queue Depth 8
GPU Performance
The jump in performance from last year's GTX 1650 to the GTX 1650 Ti is relatively minor at just 7 to 16 percent, but it's measurable nonetheless. The difference is not large enough to be noticeable when running graphically demanding applications or games.
See our dedicated page on the GTX 1650 Ti for more technical information and benchmark comparisons. Overall, users can expect performance to be neck-to-neck with the older GTX 1060 mobile.
| 3DMark | |
| 1920x1080 Fire Strike Graphics | |
| Eluktronics RP-15 | |
| Maingear Vector 15 | |
| MSI P65 8RF-451 - Creator | |
| Asus Zephyrus S GX531GM | |
| Dell XPS 15 9500 Core i7 4K UHD | |
| Gainward GeForce GTX 1650 4 GB | |
| Dell XPS 15 7590 9980HK GTX 1650 | |
| Lenovo IdeaPad S740-15IRH | |
| Dell XPS 15 9570 i7 UHD | |
| Dell XPS 15 9500 Core i5 | |
| 2560x1440 Time Spy Graphics | |
| Eluktronics RP-15 | |
| Maingear Vector 15 | |
| MSI P65 8RF-451 - Creator | |
| Asus Zephyrus S GX531GM | |
| Dell XPS 15 9500 Core i7 4K UHD | |
| Gainward GeForce GTX 1650 4 GB | |
| Dell XPS 15 7590 9980HK GTX 1650 | |
| Lenovo IdeaPad S740-15IRH | |
| Dell XPS 15 9570 i7 UHD | |
| Dell XPS 15 9500 Core i5 | |
| 2560x1440 Time Spy Score | |
| Eluktronics RP-15 | |
| Maingear Vector 15 | |
| MSI P65 8RF-451 - Creator | |
| Gainward GeForce GTX 1650 4 GB | |
| Asus Zephyrus S GX531GM | |
| Dell XPS 15 9500 Core i7 4K UHD | |
| Dell XPS 15 7590 9980HK GTX 1650 | |
| Lenovo IdeaPad S740-15IRH | |
| Dell XPS 15 9570 i7 UHD | |
| Dell XPS 15 9500 Core i5 | |
| 3DMark 11 | |
| 1280x720 Performance GPU | |
| Eluktronics RP-15 | |
| Maingear Vector 15 | |
| MSI P65 8RF-451 - Creator | |
| Gainward GeForce GTX 1650 4 GB | |
| Dell XPS 15 9500 Core i7 4K UHD | |
| Asus Zephyrus S GX531GM | |
| Dell XPS 15 7590 9980HK GTX 1650 | |
| Lenovo IdeaPad S740-15IRH | |
| Dell XPS 15 9570 i7 UHD | |
| Dell XPS 15 9500 Core i5 | |
| 1280x720 Performance Combined | |
| Eluktronics RP-15 | |
| Dell XPS 15 9500 Core i7 4K UHD | |
| Maingear Vector 15 | |
| Gainward GeForce GTX 1650 4 GB | |
| Lenovo IdeaPad S740-15IRH | |
| Dell XPS 15 9570 i7 UHD | |
| MSI P65 8RF-451 - Creator | |
| Dell XPS 15 7590 9980HK GTX 1650 | |
| Asus Zephyrus S GX531GM | |
| Dell XPS 15 9500 Core i5 | |
| 3DMark 06 Standard Score | 39720 points | |
| 3DMark Vantage P Result | 43517 points | |
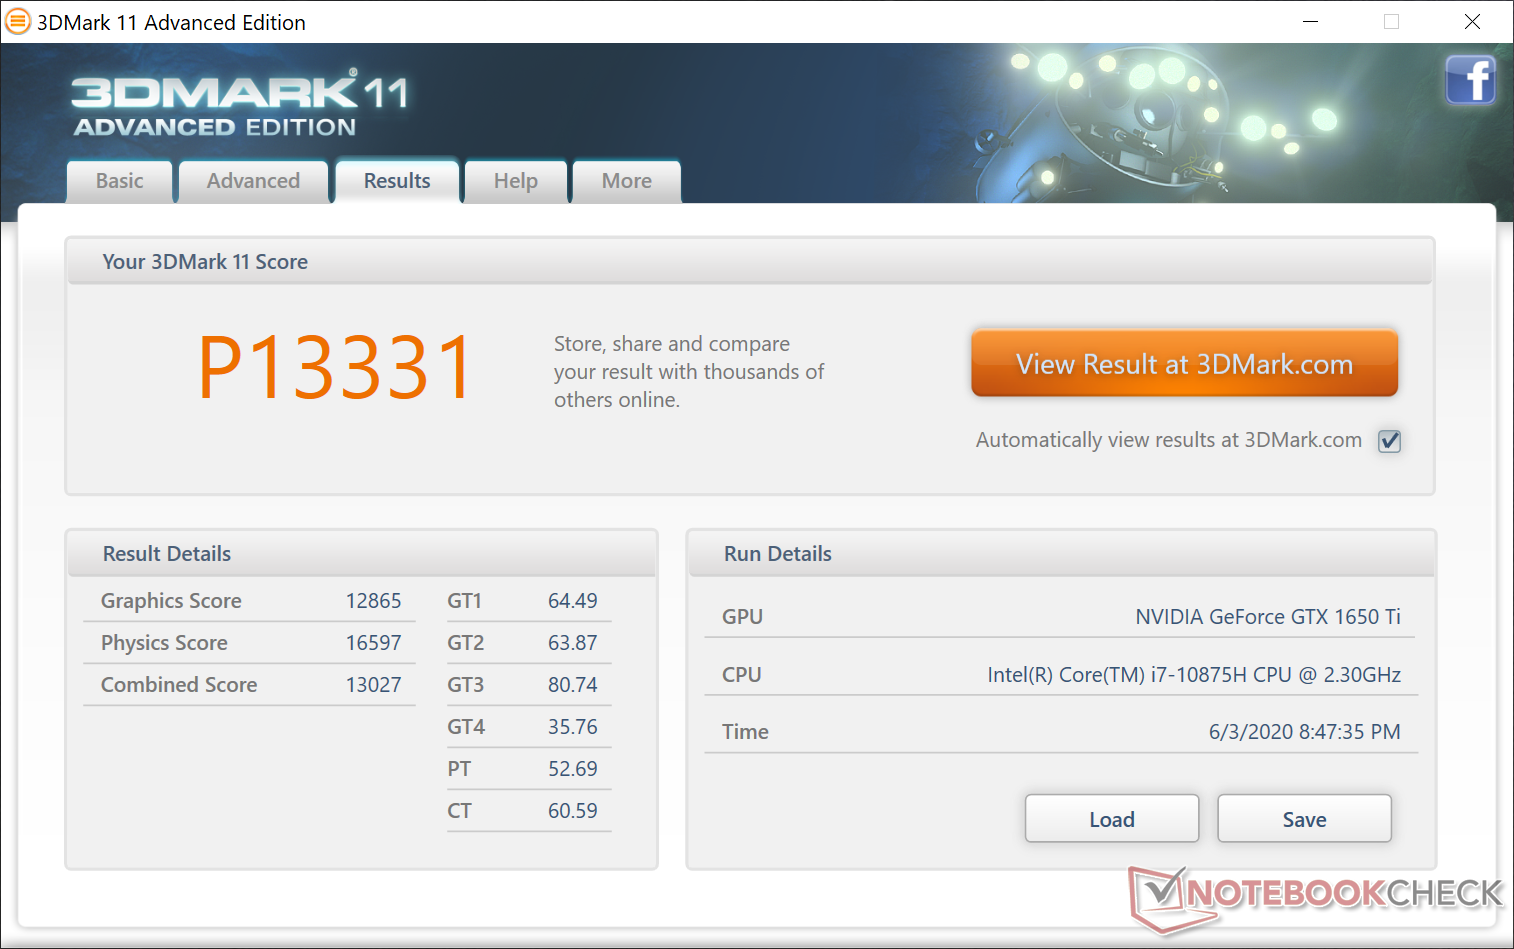
| 3DMark 11 Performance | 13331 points | |
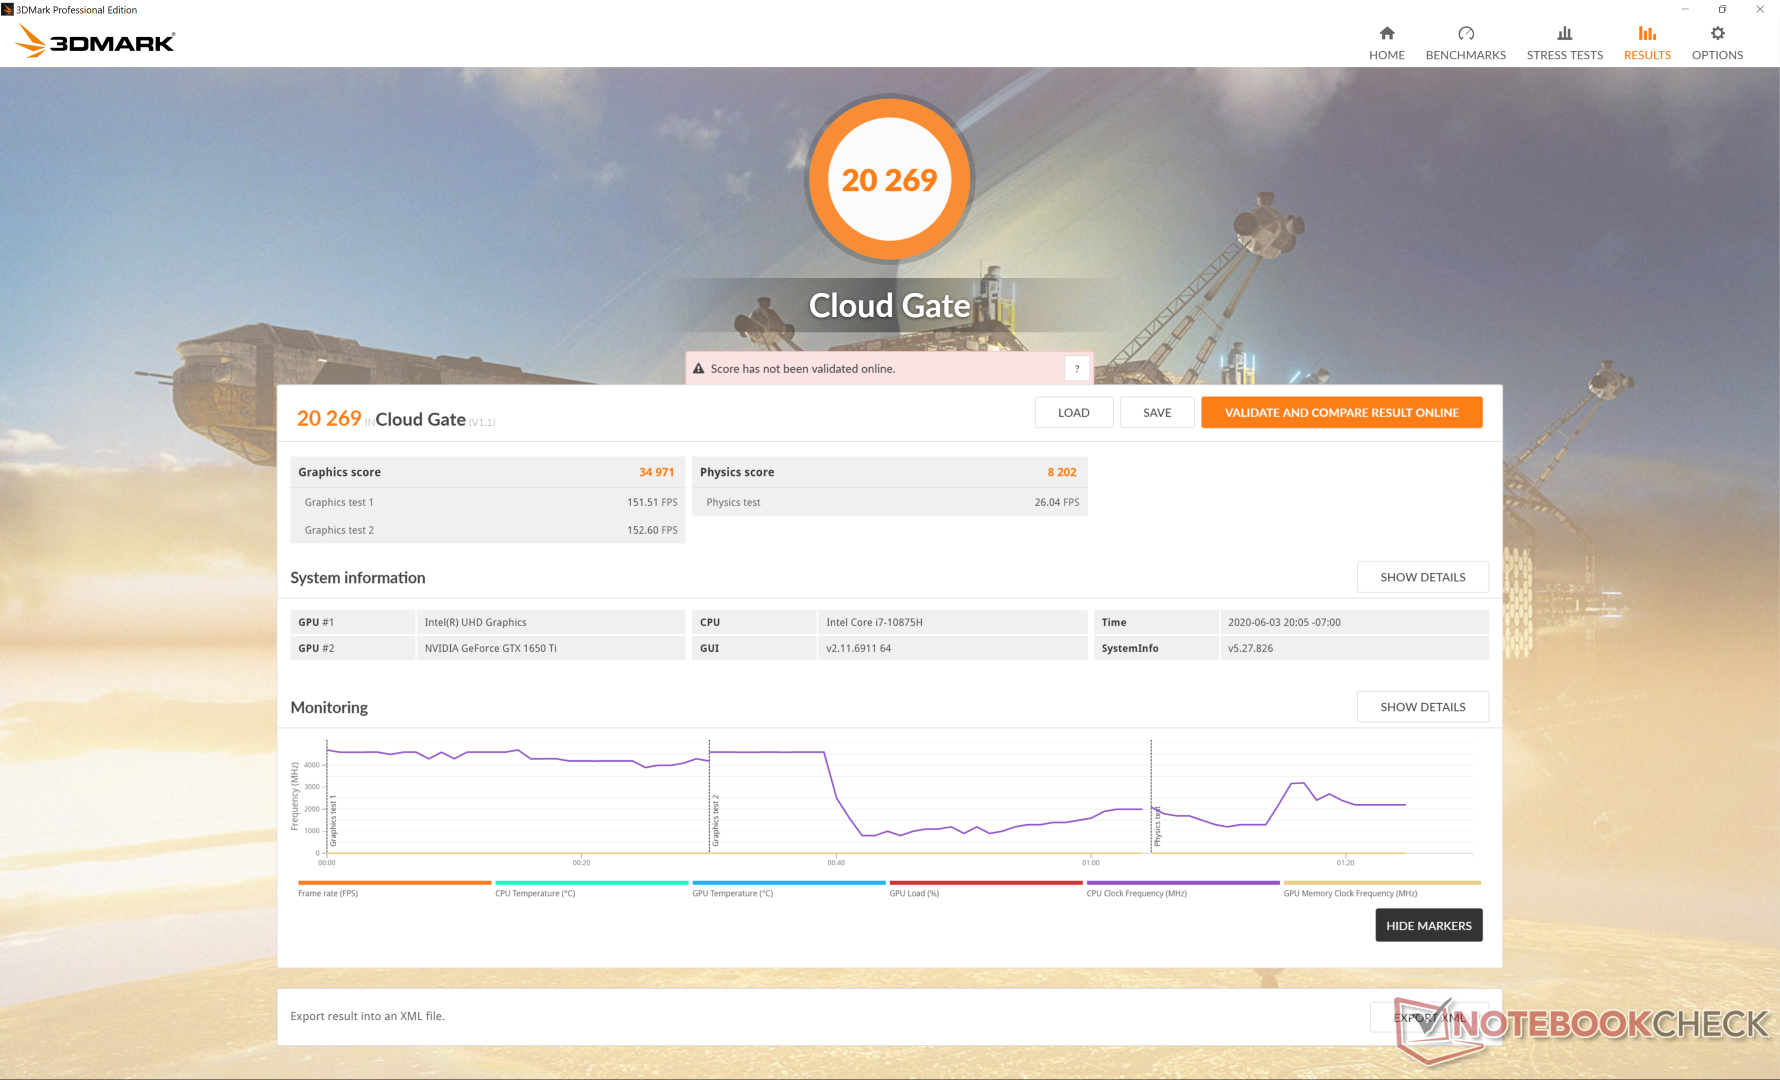
| 3DMark Cloud Gate Standard Score | 20269 points | |
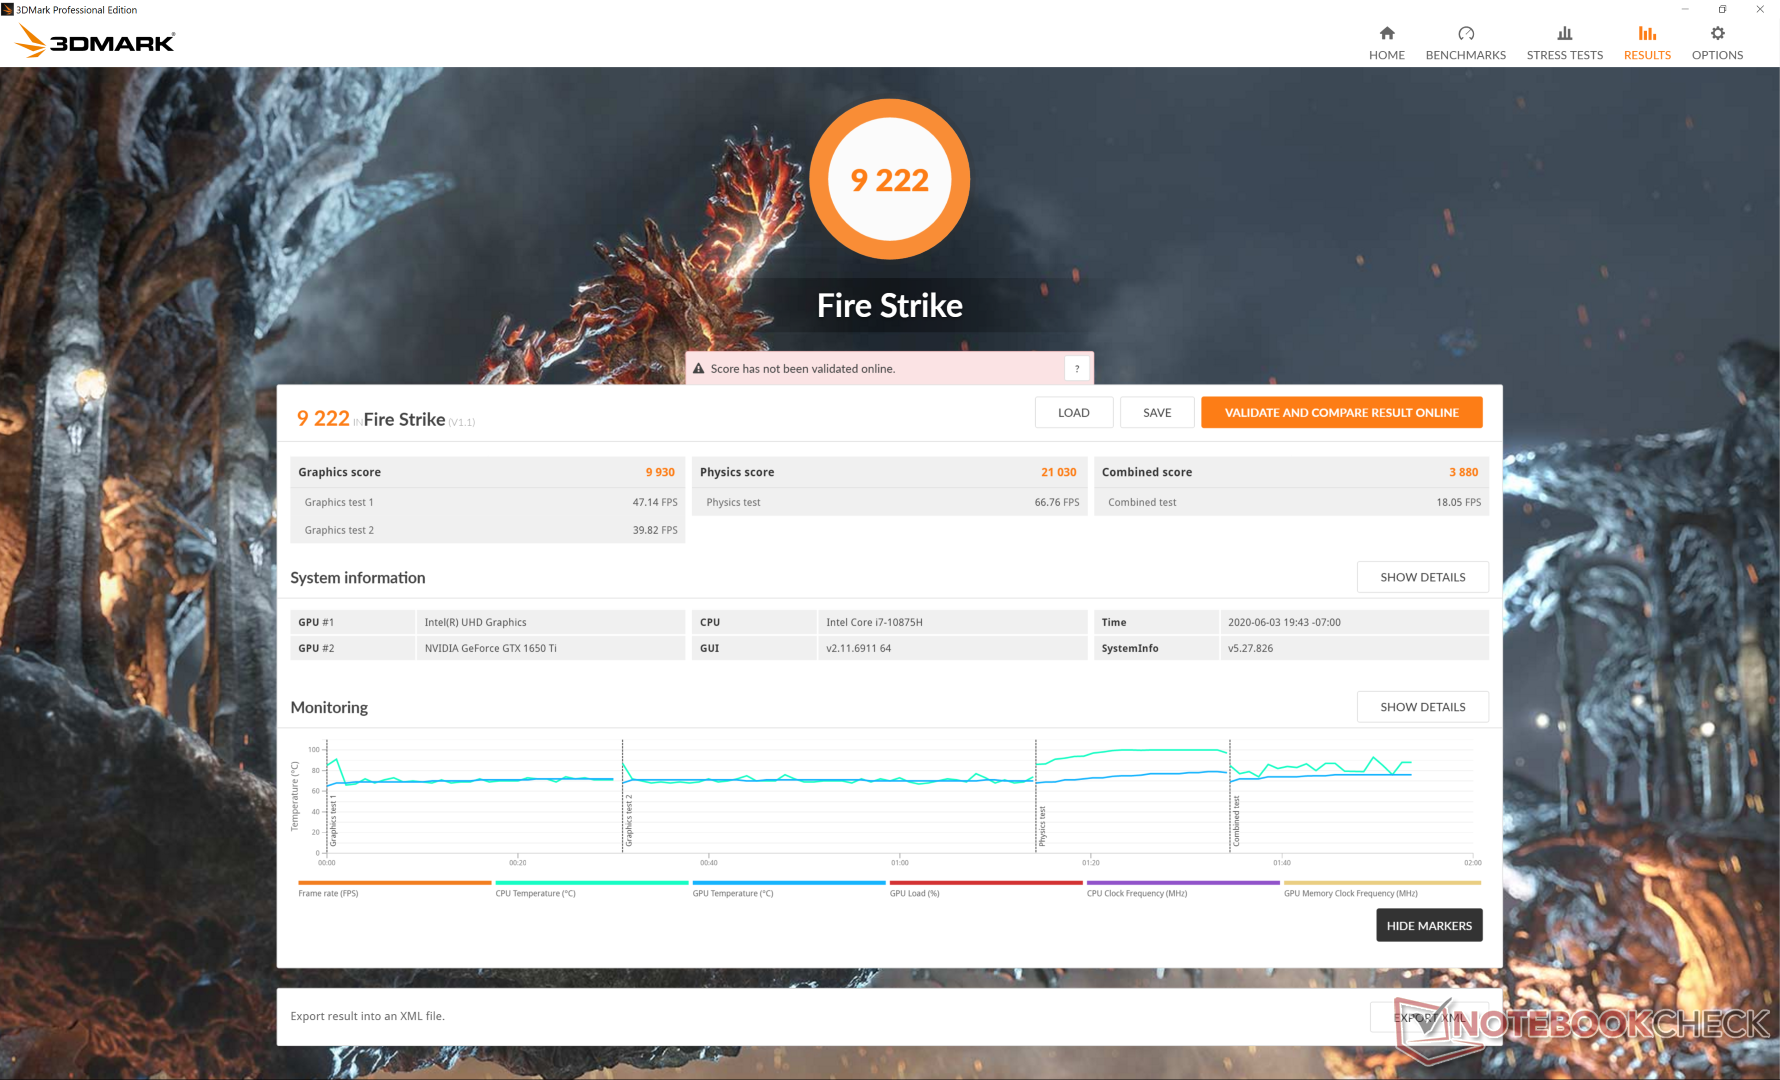
| 3DMark Fire Strike Score | 9222 points | |
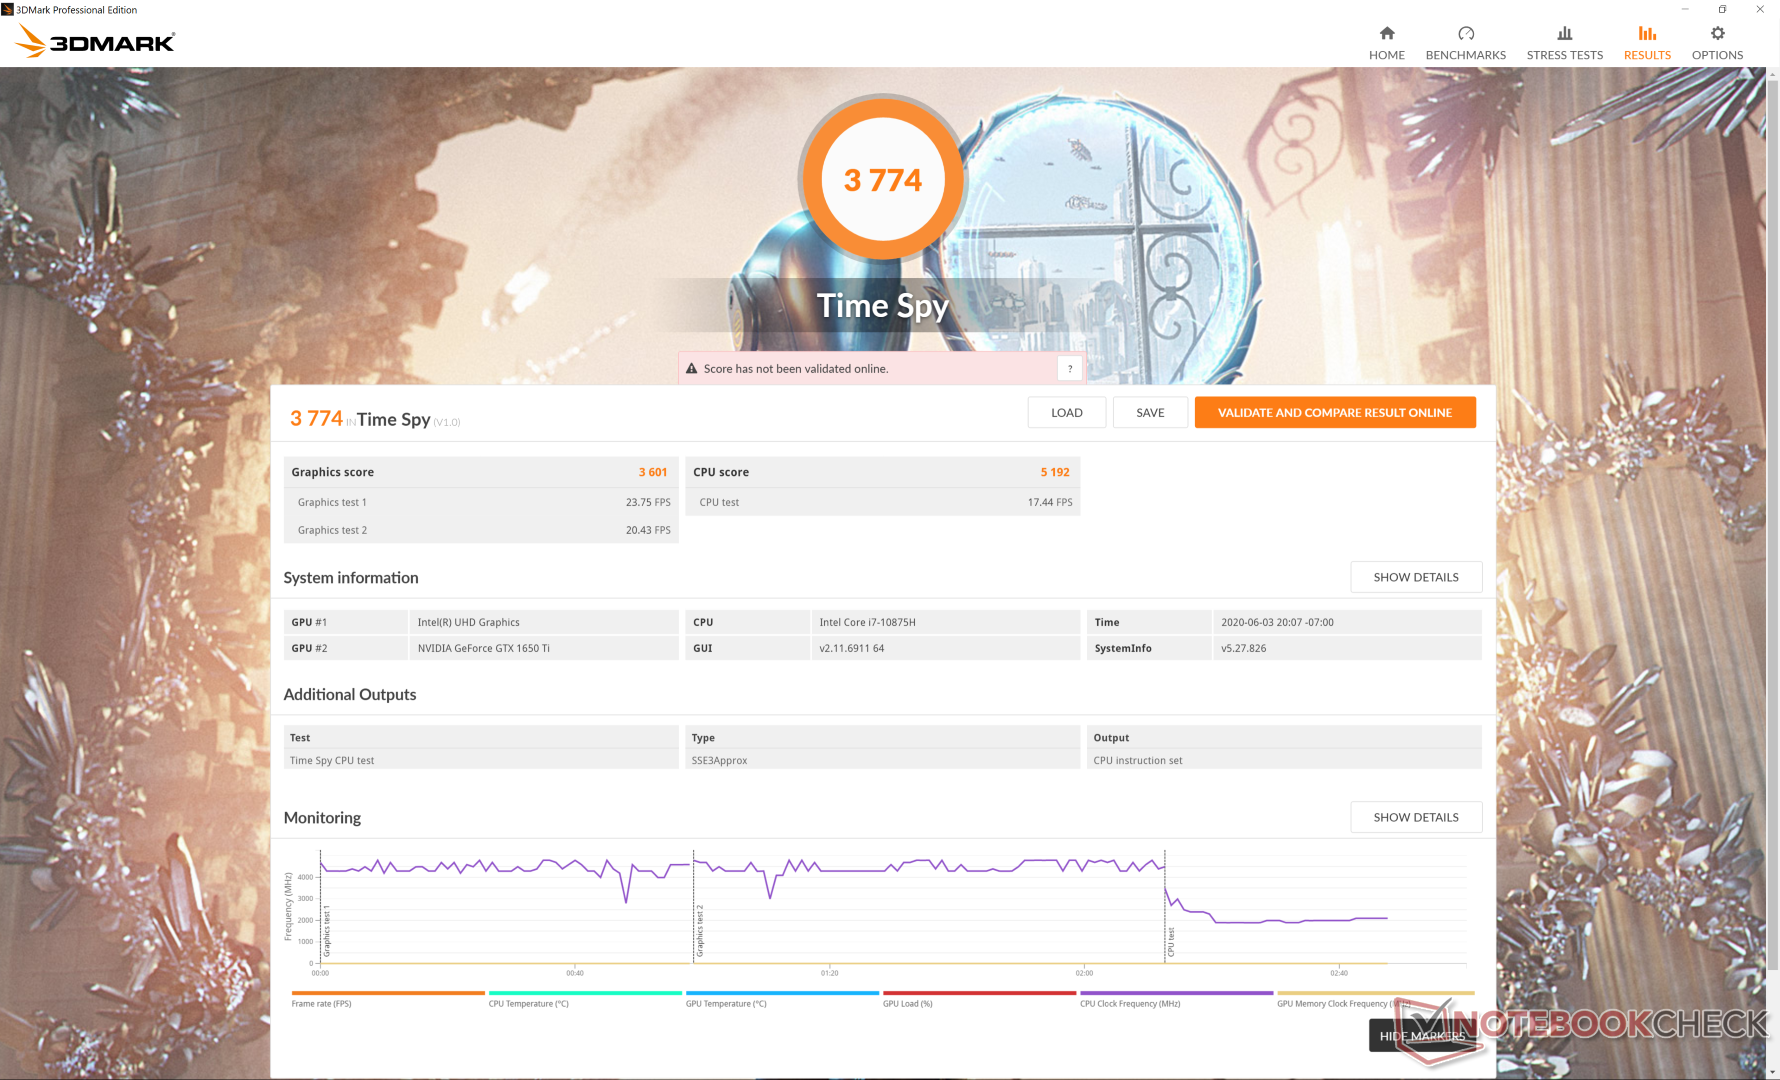
| 3DMark Time Spy Score | 3774 points | |
Help | ||
Frame rates when idling on Witcher 3 at 1080p High settings are not consistent as shown by the graph below. There are recurring small bumps to ~70 FPS from ~62 FPS for no apparent reason even when on the Ultra Performance profiile. Ideally, frame rates should be steady throughout the hour-long test with no sudden bumps or dips. The XPS 15 isn't a gaming machine so this isn't a huge problem, but it's still less than ideal for a PC with GeForce GTX graphics.
| low | med. | high | ultra | 4K | |
|---|---|---|---|---|---|
| The Witcher 3 (2015) | 209.9 | 100.8 | 65.6 | 38.1 | |
| Dota 2 Reborn (2015) | 150 | 139 | 130 | 120 | 51.8 |
| X-Plane 11.11 (2018) | 109 | 78.2 | 63.3 | 45.8 | |
| Shadow of the Tomb Raider (2018) | 139 | 62 | 57 | 48 | |
| Assassin´s Creed Odyssey (2018) | 86 | 60 | 42 | 25 | |
| Apex Legends (2019) | 144 | 91 | 84 | 74 | |
| Far Cry New Dawn (2019) | 73 | 57 | 58 | 51 | |
| Metro Exodus (2019) | 91.6 | 48.7 | 35.9 | 27.9 | |
| Dirt Rally 2.0 (2019) | 247.3 | 92.7 | 74.6 | 44.8 | |
| The Division 2 (2019) | 115 | 56 | 47 | 35 | |
| Anno 1800 (2019) | 68.4 | 64.5 | 49.1 | 27.6 | |
| Total War: Three Kingdoms (2019) | 190.2 | 59.1 | 40.8 | 27.2 | |
| F1 2019 (2019) | 206 | 105 | 89 | 76 | |
| Borderlands 3 (2019) | 128.3 | 59.9 | 38.5 | 29.3 | |
| Ghost Recon Breakpoint (2019) | 72 | 53 | 47 | 31 | |
| GRID 2019 (2019) | 103.8 | 70.7 | 64.1 | 27.3 | |
| Need for Speed Heat (2019) | 60.4 | 43.3 | 39 | 37.3 | |
| Star Wars Jedi Fallen Order (2019) | 44.1 | 41.5 | 40.7 | ||
| Escape from Tarkov (2020) | 120.5 | 89.7 | 60.4 | 73 | |
| Hunt Showdown (2020) | 150 | 58.5 | 47.5 | ||
| Doom Eternal (2020) | 149.5 | 90.7 | 66.6 |
Emissions
System Noise
In our Core i5 review, we mentioned that the system would remain silent even through the first benchmark scene of 3DMark 06. For the Core i7 GeForce configuration, however, fan noise would slowly build up until hitting 46 dB(A) at the end of the same benchmark scene. It should surprise no one that the faster configuration runs louder sooner than the base Core i5 option.
When gaming, users can expect a fan noise between 42 dB(A) and 46 dB(A) depending on the processing load. We're able to record a maximum of 47.1 dB(A) compared to "only" 41.9 dB(A) on the Core i5 option.
Thankfully, the Core i7 system can be as quiet as the Core i5 system when running very low loads like browsing, word processing, or video streaming when set to Dell Optimized mode or Quiet mode. In this case, fan noise tends to top out at only 31.4 dB(A) to be just barely audible in most environments.
| Dell XPS 15 9500 Core i7 4K UHD GeForce GTX 1650 Ti Mobile, i7-10875H, SK Hynix PC611 512GB | Dell XPS 15 7590 9980HK GTX 1650 GeForce GTX 1650 Mobile, i9-9980HK, Toshiba XG6 KXG60ZNV1T02 | Lenovo Yoga C940-15IRH GeForce GTX 1650 Max-Q, i7-9750H, Intel Optane Memory H10 with Solid State Storage 32GB + 512GB HBRPEKNX0202A(L/H) | Asus ZenBook 15 UX534FTC-A8190T GeForce GTX 1650 Max-Q, i7-10510U, Samsung SSD PM981 MZVLB1T0HALR | MSI Prestige 15 A10SC GeForce GTX 1650 Max-Q, i7-10710U, Samsung SSD PM981 MZVLB1T0HALR | Dell XPS 15 9500 Core i5 UHD Graphics 630, i5-10300H, Toshiba KBG40ZNS256G NVMe | |
|---|---|---|---|---|---|---|
| Noise | -2% | -0% | 4% | 3% | 9% | |
| off / environment * (dB) | 28.4 | 28.2 1% | 28.7 -1% | 30.3 -7% | 29.3 -3% | 28 1% |
| Idle Minimum * (dB) | 28.4 | 28.2 1% | 28.7 -1% | 30.3 -7% | 30.1 -6% | 28 1% |
| Idle Average * (dB) | 28.4 | 28.2 1% | 28.8 -1% | 30.3 -7% | 30.2 -6% | 28 1% |
| Idle Maximum * (dB) | 28.4 | 30.4 -7% | 28.8 -1% | 30.9 -9% | 30.2 -6% | 28 1% |
| Load Average * (dB) | 46 | 43.8 5% | 45 2% | 31.3 32% | 31.5 32% | 28 39% |
| Witcher 3 ultra * (dB) | 42 | 47.2 -12% | 44.7 -6% | 38.1 9% | 37 12% | |
| Load Maximum * (dB) | 47.1 | 47.2 -0% | 44.7 5% | 38.2 19% | 47 -0% | 41.9 11% |
* ... smaller is better
Noise level
| Idle |
| 28.4 / 28.4 / 28.4 dB(A) |
| Load |
| 46 / 47.1 dB(A) |
 | ||
30 dB silent 40 dB(A) audible 50 dB(A) loud |
||
min: | ||
Temperature
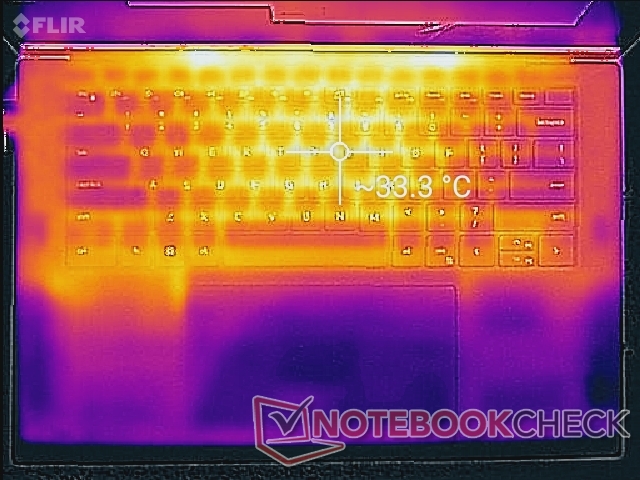
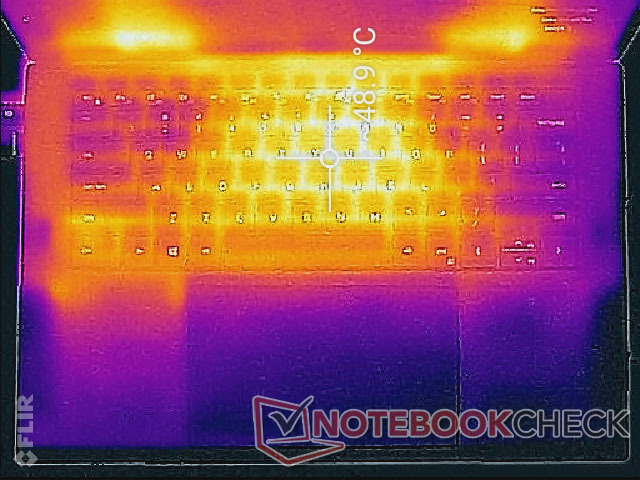
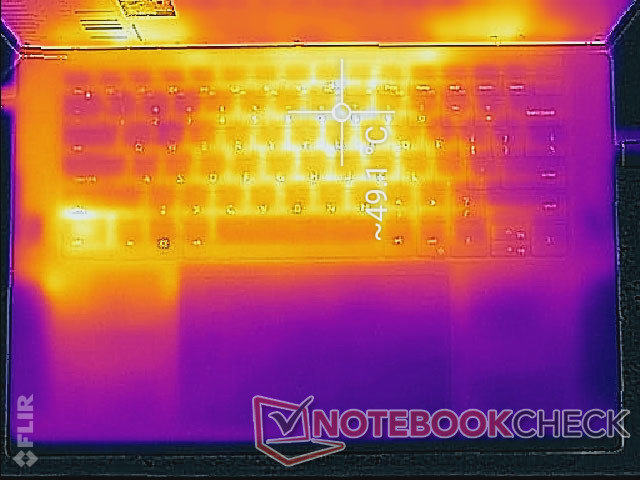
Surface temperatures are noticeably warmer across the board than on the base Core i5 configuration. Even when idling on desktop, for example, the surface hot spots can be as warm as 33 C compared to just 26 C on the Core i5 SKU. When gaming, the keyboard center can reach almost 50 C whereas the Core i5 SKU tops out at about 43 C.
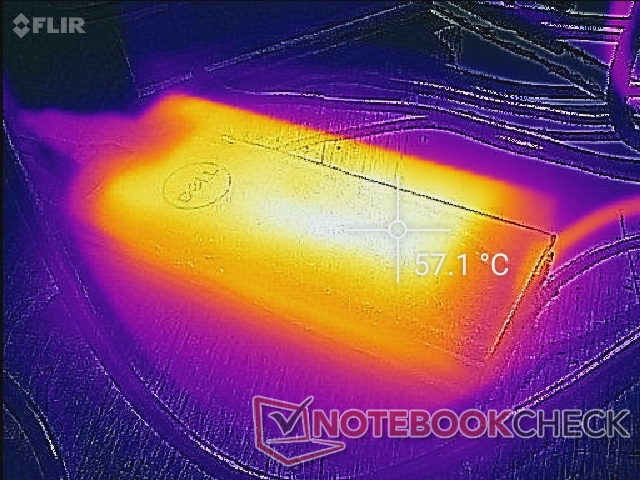
The good news are that the palm rests, clickpad, and WASD keys never become uncomfortably warm and that the AC adapter isn't any warmer than the adapter for the Core i5 option. Dell ships the same 130 W AC adapter no matter the XPS 15 9500 configuration.
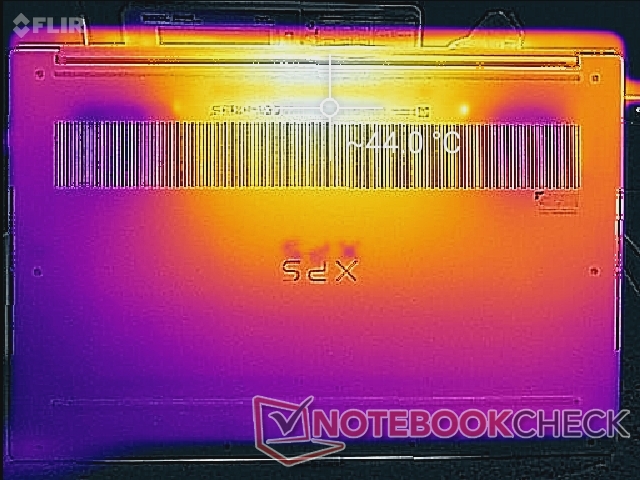
Note that the spot nearest the bottom left corner of the keyboard can become very warm at over 40 C since the primary NVMe SSD is installed directly underneath. Of course, this would only occur if the SSD is being accessed continuously.
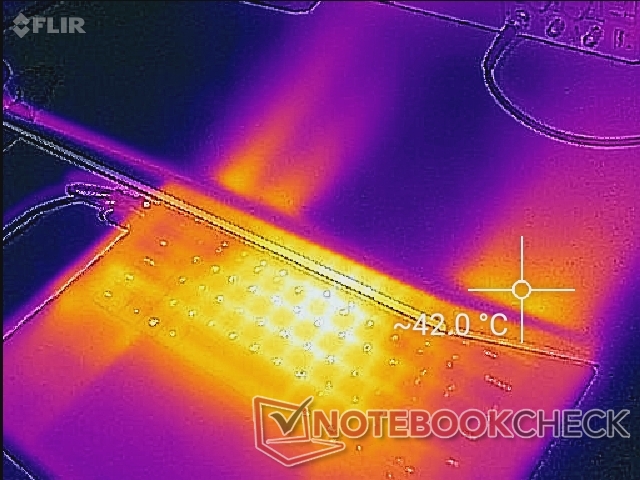
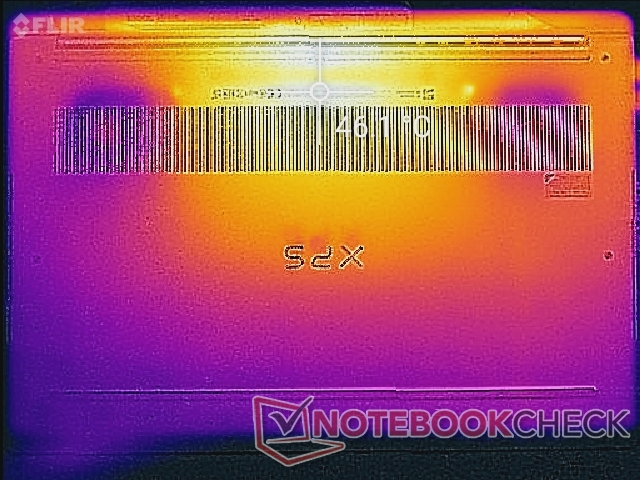
(±) The maximum temperature on the upper side is 44 °C / 111 F, compared to the average of 36.8 °C / 98 F, ranging from 21 to 71 °C for the class Multimedia.
(-) The bottom heats up to a maximum of 48.8 °C / 120 F, compared to the average of 39.1 °C / 102 F
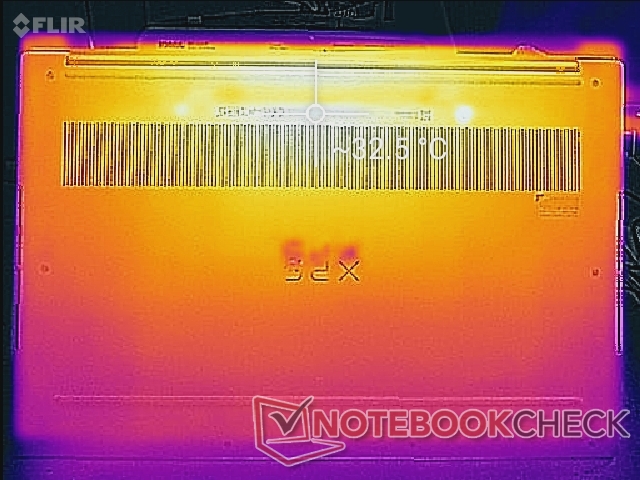
(+) In idle usage, the average temperature for the upper side is 30.5 °C / 87 F, compared to the device average of 31.3 °C / 88 F.
(-) Playing The Witcher 3, the average temperature for the upper side is 38.9 °C / 102 F, compared to the device average of 31.3 °C / 88 F.
(+) The palmrests and touchpad are reaching skin temperature as a maximum (34.4 °C / 93.9 F) and are therefore not hot.
(-) The average temperature of the palmrest area of similar devices was 28.7 °C / 83.7 F (-5.7 °C / -10.2 F).
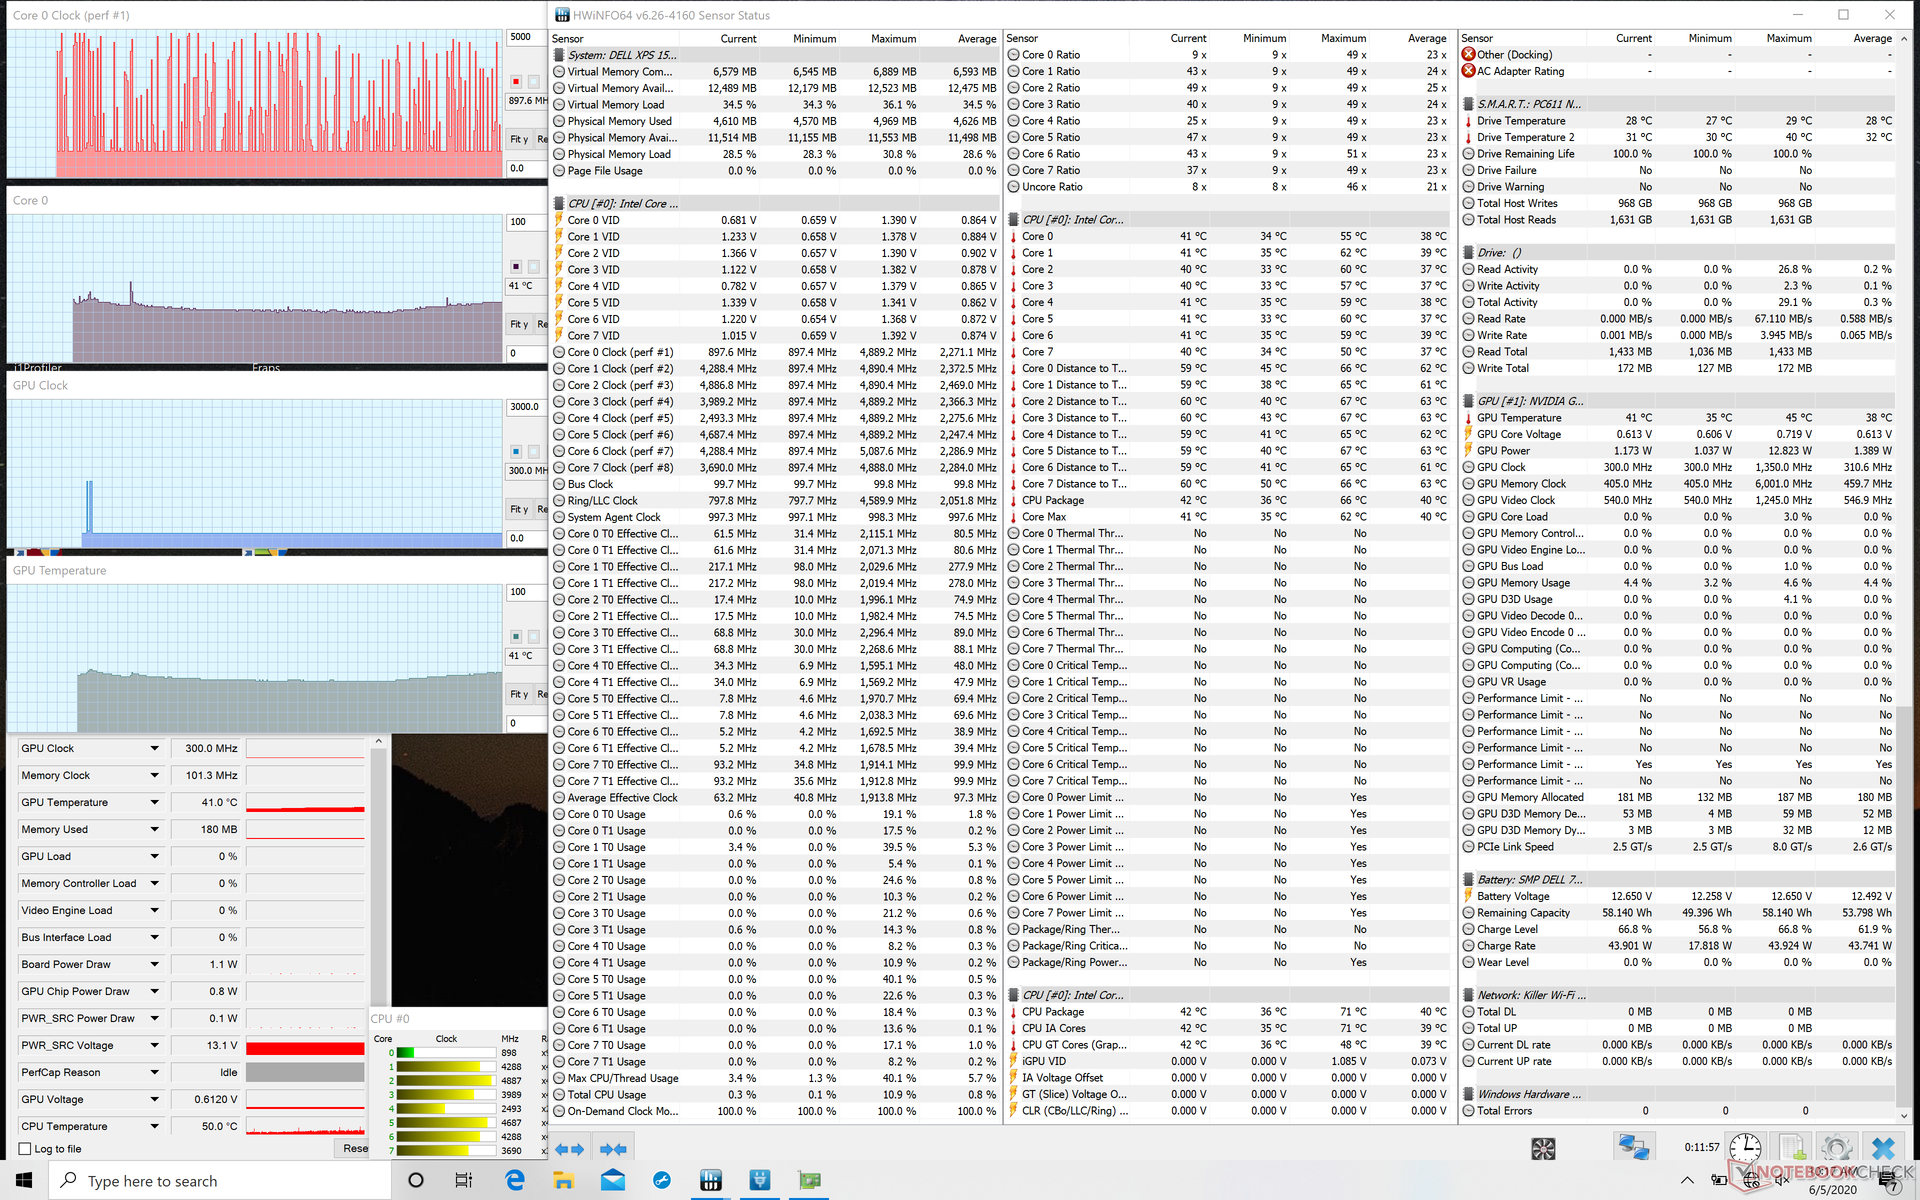
Stress Test
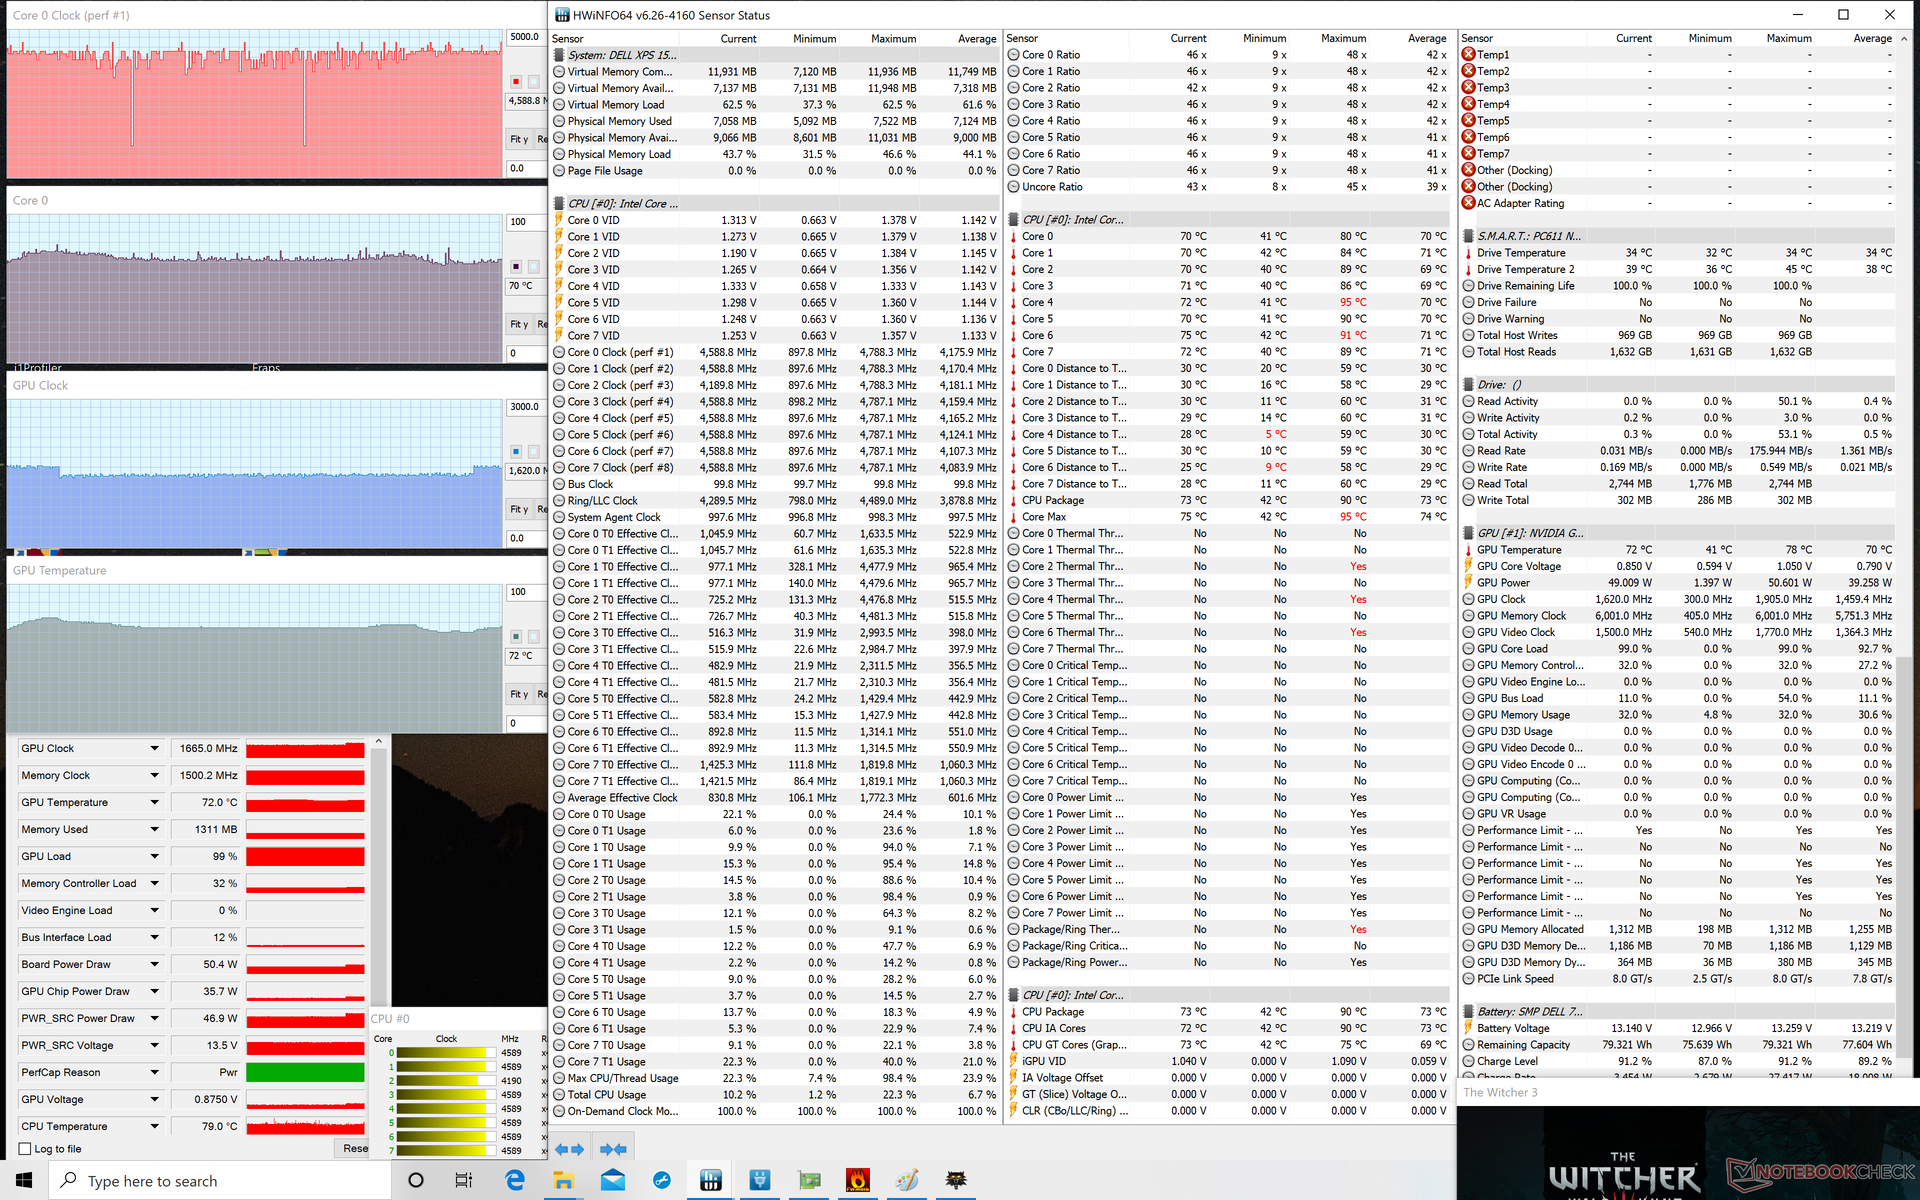
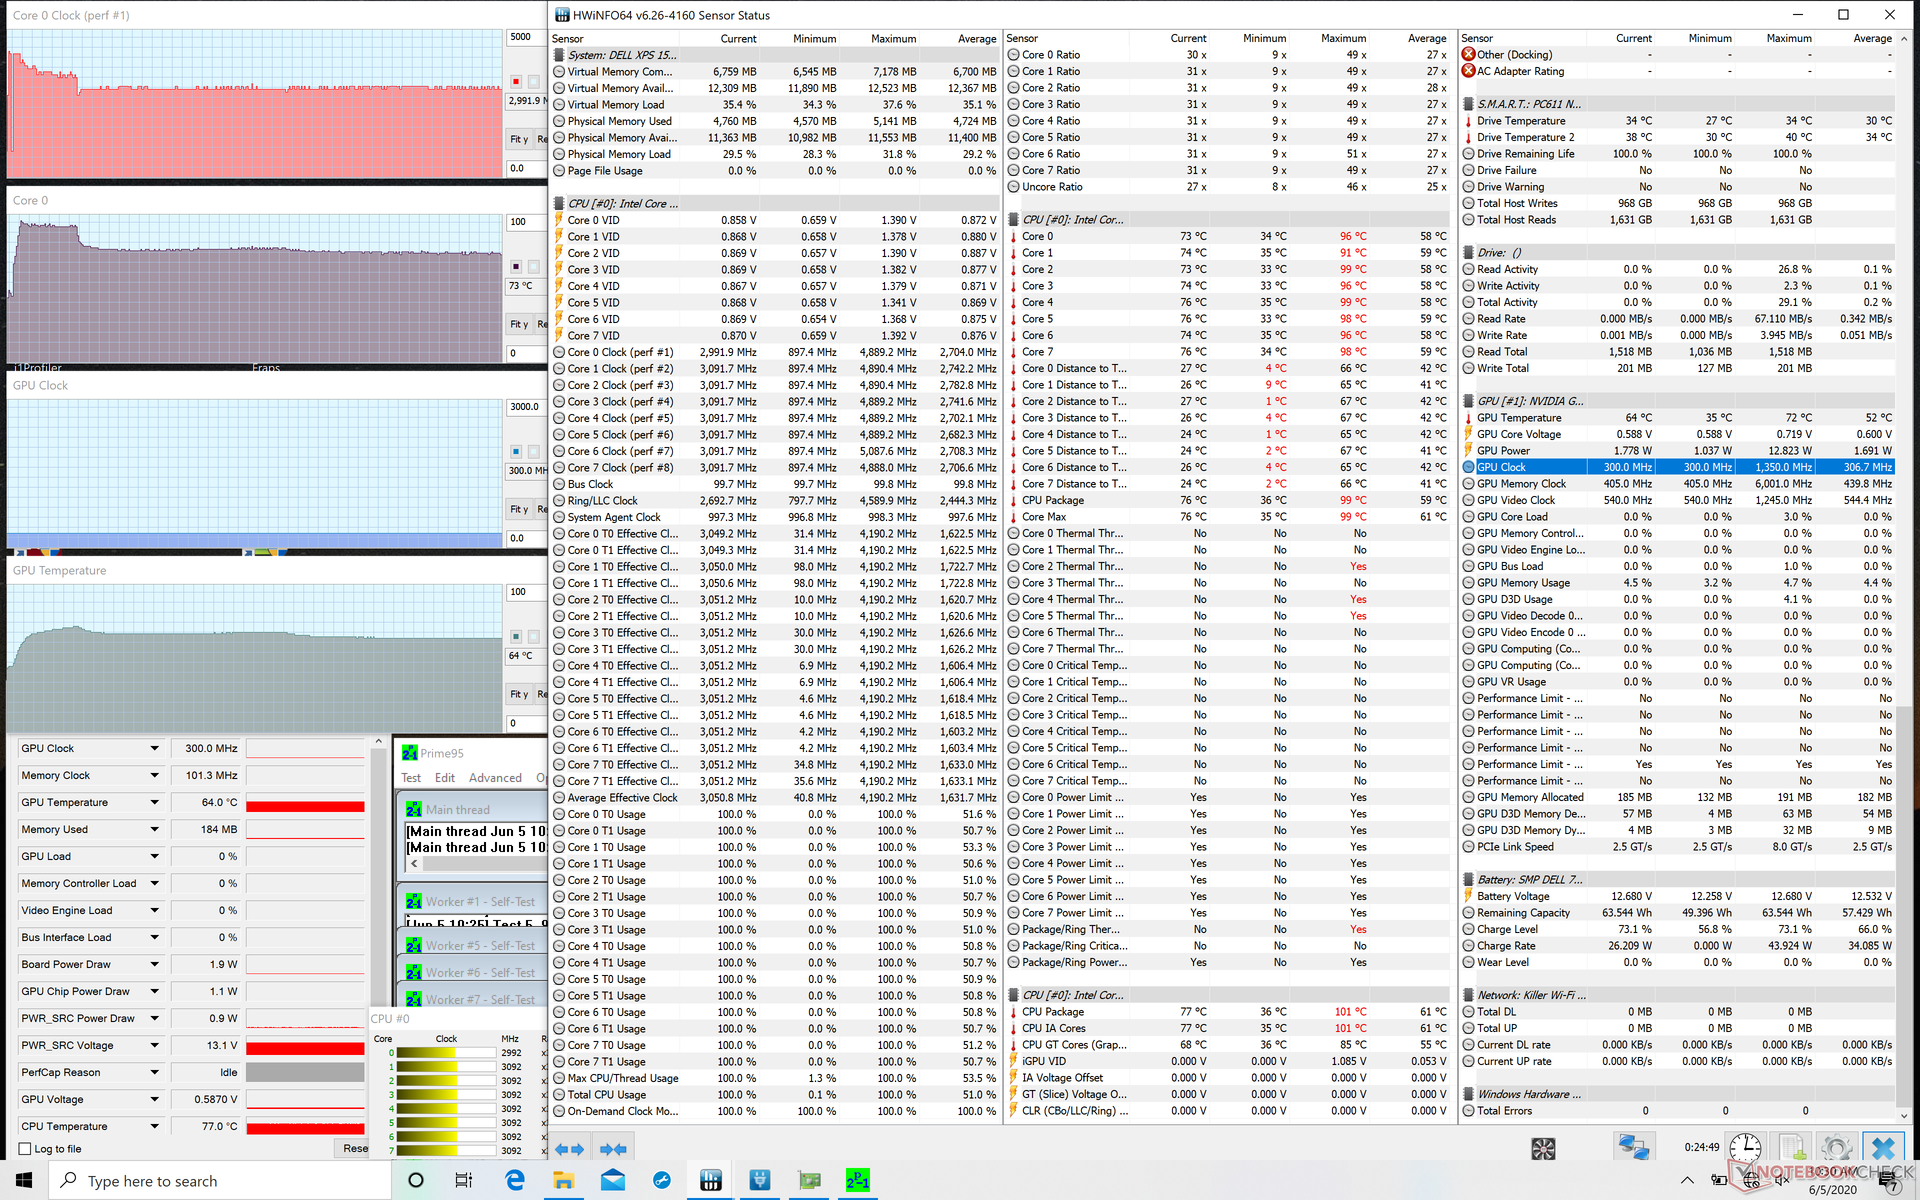
We stress the laptop to identify for any potential throttling or stability issues. When running Prime95, clock rates would boost up to 4.2 GHz for about 15 seconds until hitting a core temperature of 99 C. Thereafter, clock rates would fall to the 3.4 to 3.5 GHz range in order to maintain a slightly cooler core temperature of 90 C. After a minute, however, clock rates and temperature would fall even further to 2.9 GHz and 73 C, respectively, as shown by our screenshots below. This would occur even when running on Dell's Ultra Performance mode. Keep in mind that the Core i7-10875H is rated for a maximum Turbo Boost clock rate of 4.3 GHz for all eight cores meaning that the steady-state 2.9 GHz Turbo Boost on the XPS 15 is likely thermally limited.
When running Witcher 3, both the CPU and GPU would each stabilize in the low 70 C range to be nearly identical to what we recorded on last year's XPS 15 7590 with the Core i9 CPU and GTX 1650 GPU. From what we can tell, it looks like Dell was aiming to keep temperatures relatively consistent gen-to-gen meaning that users shouldn't expect the XPS 15 9500 to run all that much cooler or warmer than previous generation models despite the significant chassis redesign.
Interestingly, GPU clock rates would alternative between ~1470 MHz and ~1650 MHz every few minutes when idling on Witcher 3 instead of remaining constant like on most other laptops. The cycling clock rates are likely responsible for the undesirable frame rate behavior mentioned in our Witcher 3 graph above.
Running on battery power will limit performance. A Fire Strike run on batteries returns Physics and Graphics scores of 17354 and 7956 points, respectively, compared to 21030 and 9930 points when on mains.
| CPU Clock (GHz) | GPU Clock (MHz) | Average CPU Temperature (°C) | Average GPU Temperature (°C) | |
| System Idle | -- | -- | ~40 | ~40 |
| Prime95 Stress | 2.8 - 3.0 | -- | 73 | 64 |
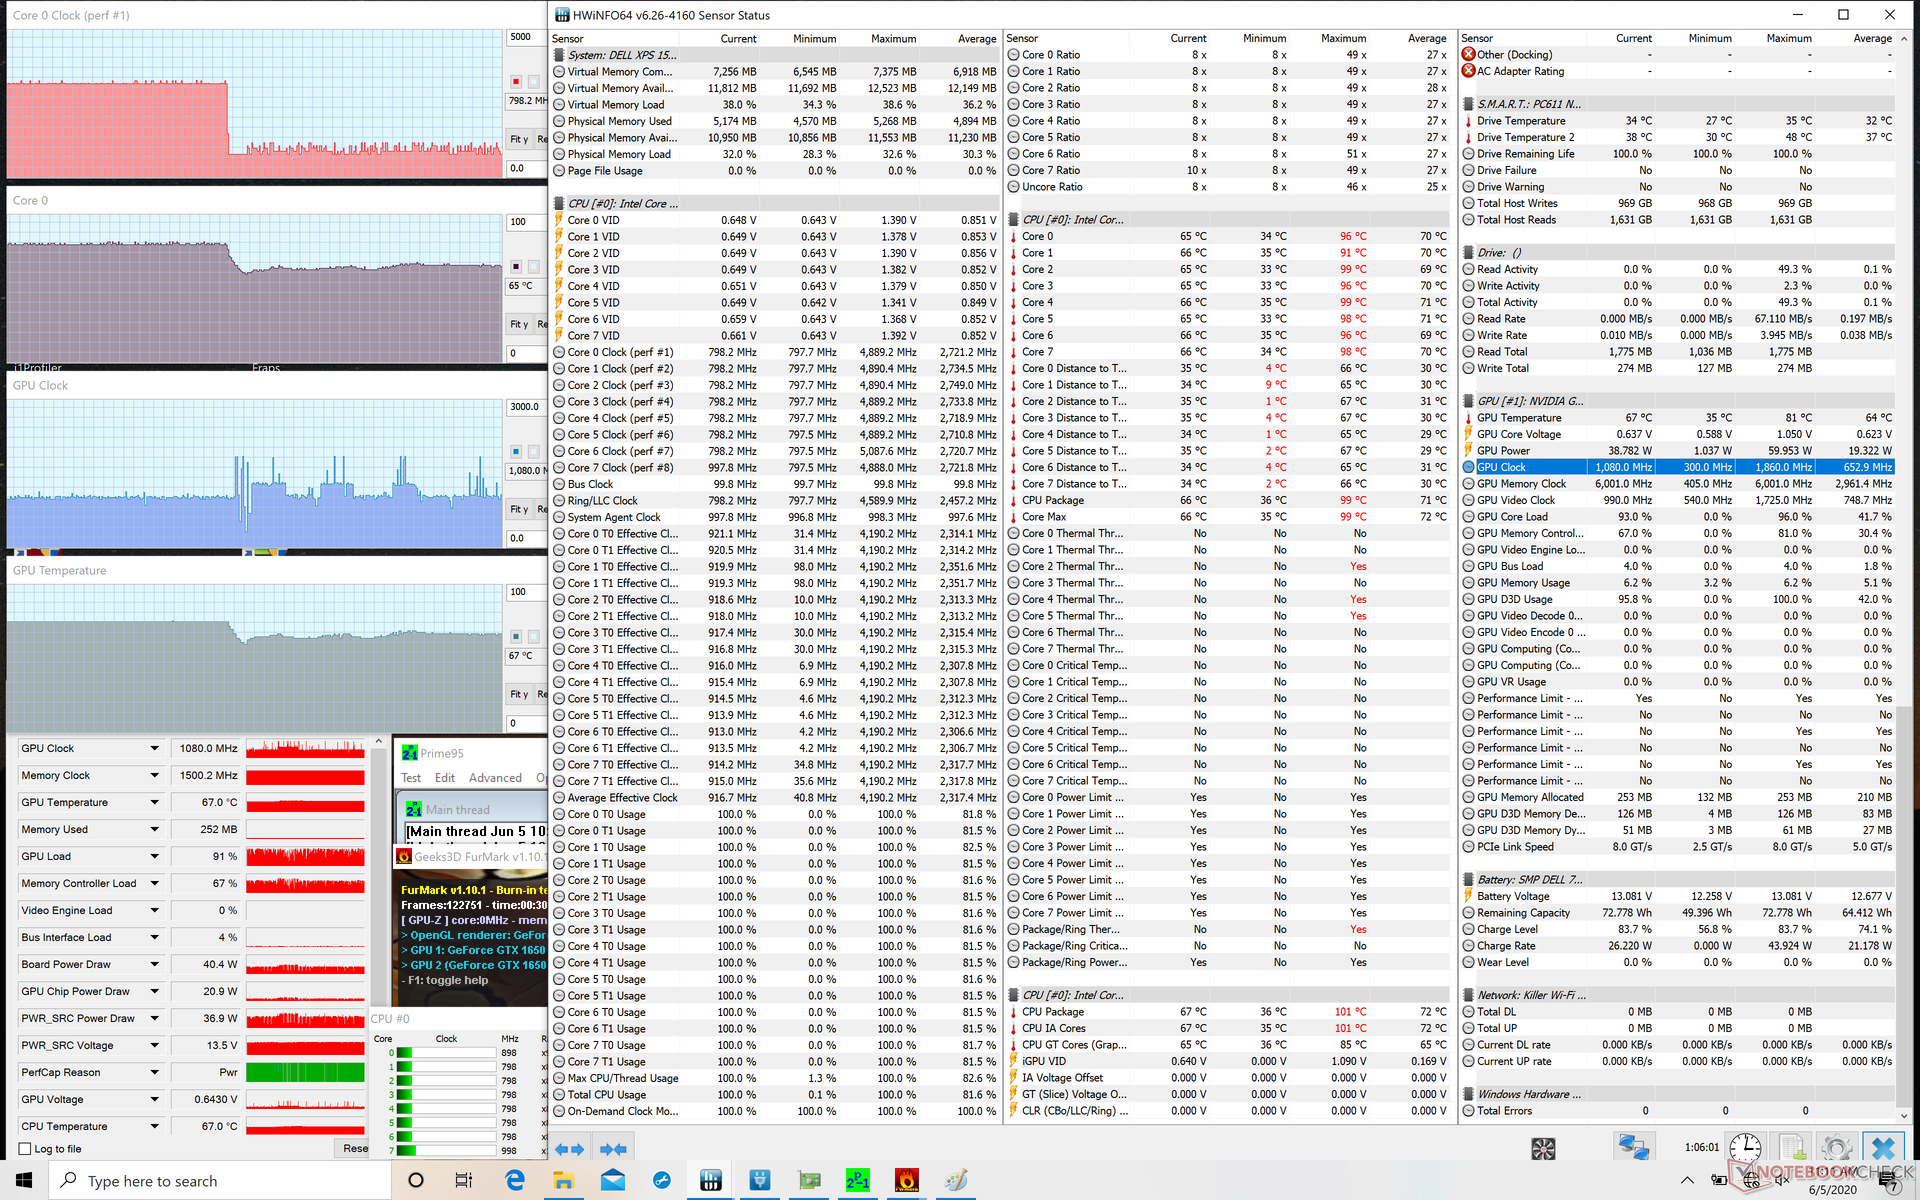
| Prime95 + FurMark Stress | 800 - 1100 | 1.0 - 1.3 | 65 | 67 |
| Witcher 3 Stress | ~4.4 | ~1470 - 1650 | ~70 | ~72 |
Speakers


Energy Management
Power Consumption
Our Core i7 configuration draws significantly more power than the base Core i5 configuration by over 2x when gaming or under other high loads. Performance-per-watt, however, is still very much in favor of the Core i7 SKU especially in terms of graphics power. Average rates are very close to what we recorded on the 2019 XPS 15 7590 Core i9 SKU which aligns with our temperature observations above.
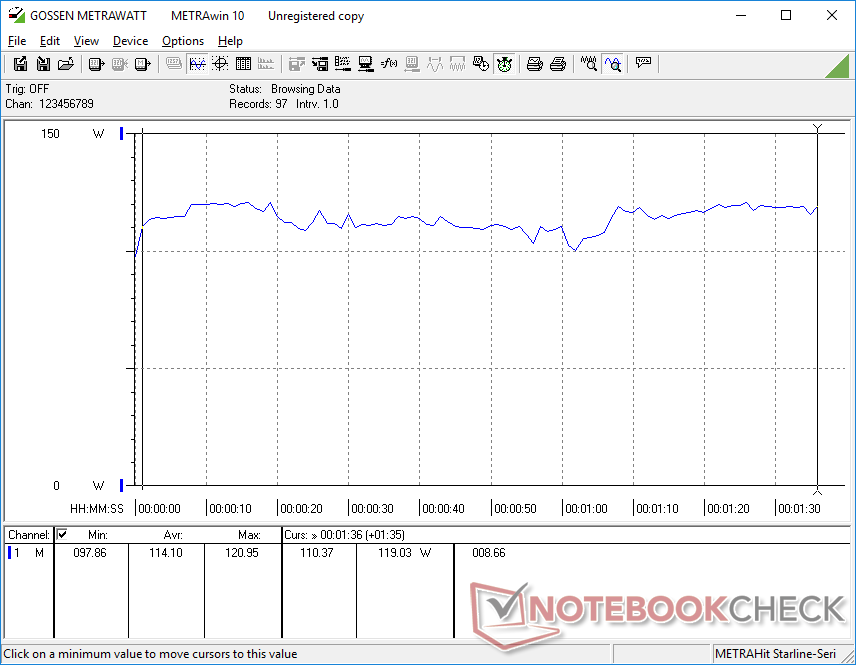
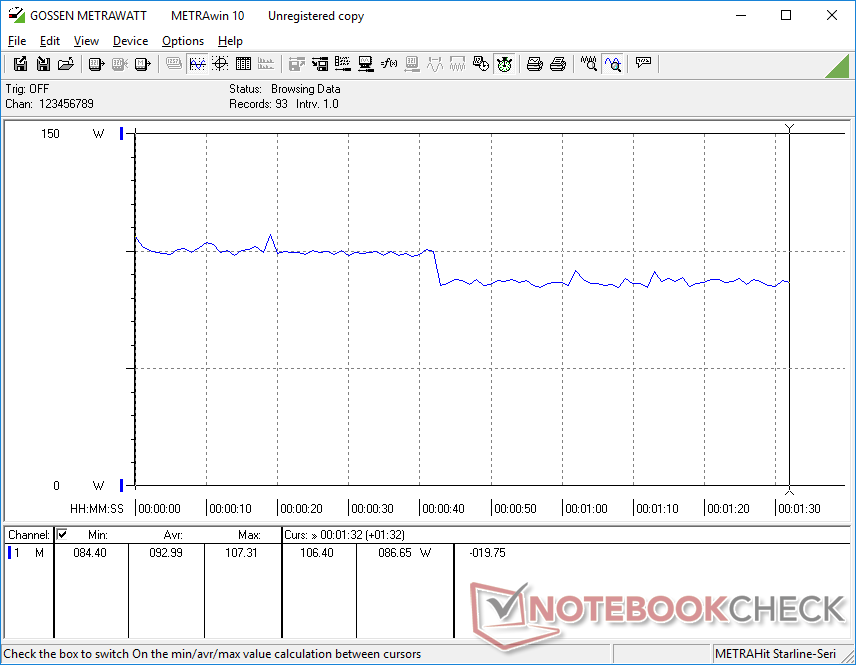
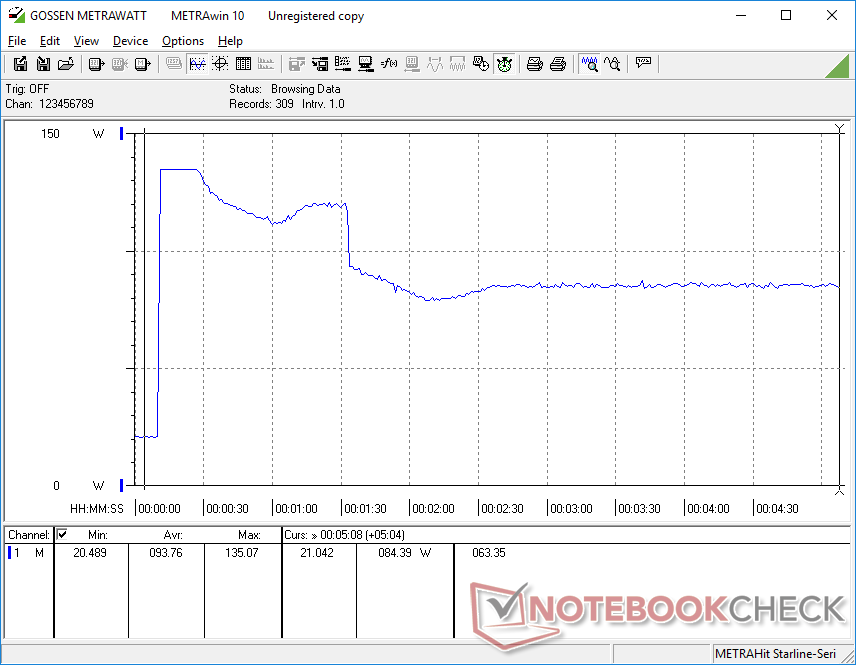
When running Prime95, consumption would spike to 135 W for about 15 seconds before falling to ~120 W for about a minute thereafter. Consumption eventually stabilizes at 84.4 W for a behavior similar to what we observed during our Stress Test clock rate observations.
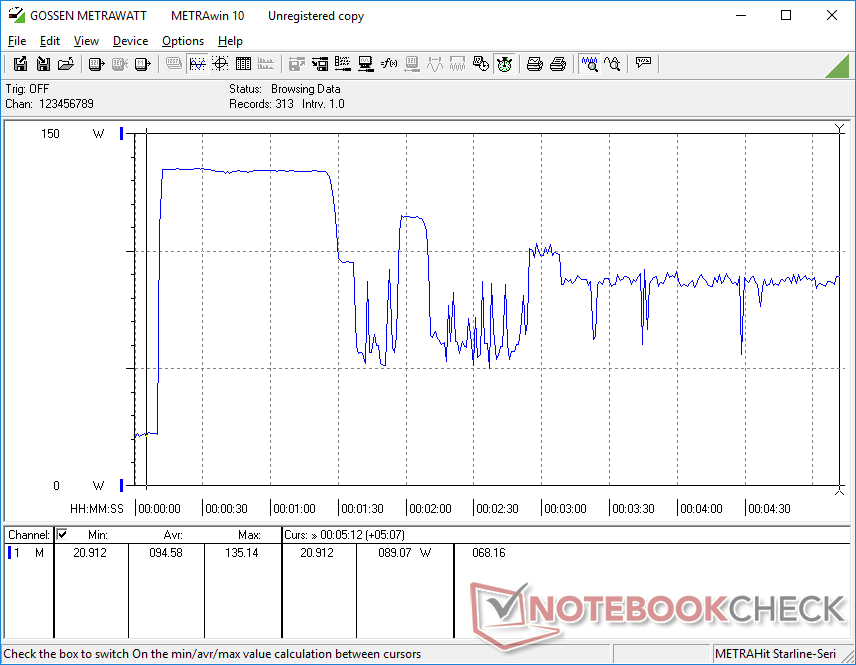
We're able to record a maximum consumption of 135.2 W when running both Prime95 and FurMark simultaneously. This would eventually drop and fluctuate before finally stabilizing at about 89 W.
| Off / Standby | |
| Idle | |
| Load |
|
Key:
min: | |
| Dell XPS 15 9500 Core i7 4K UHD i7-10875H, GeForce GTX 1650 Ti Mobile, SK Hynix PC611 512GB, IPS, 3840x2400, 15.6" | Dell XPS 15 7590 9980HK GTX 1650 i9-9980HK, GeForce GTX 1650 Mobile, Toshiba XG6 KXG60ZNV1T02, OLED, 3840x2160, 15.6" | Lenovo Yoga C940-15IRH i7-9750H, GeForce GTX 1650 Max-Q, Intel Optane Memory H10 with Solid State Storage 32GB + 512GB HBRPEKNX0202A(L/H), IPS, 1920x1080, 15.6" | Asus ZenBook 15 UX534FTC-A8190T i7-10510U, GeForce GTX 1650 Max-Q, Samsung SSD PM981 MZVLB1T0HALR, IPS, 1920x1080, 15.6" | MSI Prestige 15 A10SC i7-10710U, GeForce GTX 1650 Max-Q, Samsung SSD PM981 MZVLB1T0HALR, IPS, 3840x2160, 15.6" | Dell XPS 15 9500 Core i5 i5-10300H, UHD Graphics 630, Toshiba KBG40ZNS256G NVMe, IPS, 1920x1200, 15.6" | |
|---|---|---|---|---|---|---|
| Power Consumption | 4% | 6% | 41% | 14% | 49% | |
| Idle Minimum * (Watt) | 5.7 | 6.2 -9% | 5.2 9% | 2.8 51% | 6.1 -7% | 2.9 49% |
| Idle Average * (Watt) | 13.5 | 9.6 29% | 10.7 21% | 7.7 43% | 13.2 2% | 7.6 44% |
| Idle Maximum * (Watt) | 19.6 | 21.2 -8% | 24.3 -24% | 9.4 52% | 19.2 2% | 8 59% |
| Load Average * (Watt) | 114.1 | 104.3 9% | 84.4 26% | 57 50% | 75 34% | 41.7 63% |
| Witcher 3 ultra * (Watt) | 93 | 91.7 1% | 83.9 10% | 62 33% | 74 20% | |
| Load Maximum * (Watt) | 135.2 | 135.3 -0% | 142.8 -6% | 116 14% | 89.7 34% | 94.8 30% |
* ... smaller is better
Battery Life
Higher-end XPS 15 9500 configurations come with an 86 Wh battery compared to the smaller 56 Wh battery on SKUs without the GeForce GPU. The larger capacity balances out the more demanding hardware quite well as runtimes between our Core i5 and Core i7 SKUs are very close to one another. When both systems are set to the same WLAN conditions, we're able to reach just over 9 hours of constant use before automatic shutdown on each unit.
Charging, on the other hand, will take noticeably longer on the 86 Wh battery. Whereas the 56 Wh module would charge in just 1.5 hours, the 86 Wh battery would take a little over two hours from empty to full capacity.
The 86 Wh battery occupies the same volume as the lesser 56 Wh battery. It's technically possible to swap out one battery for another regardless of SKU.
| Dell XPS 15 9500 Core i7 4K UHD i7-10875H, GeForce GTX 1650 Ti Mobile, 86 Wh | Dell XPS 15 7590 9980HK GTX 1650 i9-9980HK, GeForce GTX 1650 Mobile, 97 Wh | Lenovo Yoga C940-15IRH i7-9750H, GeForce GTX 1650 Max-Q, 69 Wh | Asus ZenBook 15 UX534FTC-A8190T i7-10510U, GeForce GTX 1650 Max-Q, 71 Wh | MSI Prestige 15 A10SC i7-10710U, GeForce GTX 1650 Max-Q, 82 Wh | Dell XPS 15 9575 i5-8305G i5-8305G, Vega M GL / 870, 75 Wh | Dell XPS 15 9500 Core i5 i5-10300H, UHD Graphics 630, 56 Wh | |
|---|---|---|---|---|---|---|---|
| Battery runtime | 6% | -21% | 25% | -9% | -28% | -1% | |
| Reader / Idle (h) | 23 | 15.2 -34% | 18.2 -21% | 27.2 18% | 19.1 -17% | 11.1 -52% | 26.4 15% |
| WiFi v1.3 (h) | 9.1 | 7.8 -14% | 9.7 7% | 12.4 36% | 7.6 -16% | 9.4 3% | 9.3 2% |
| Load (h) | 2 | 3.3 65% | 1 -50% | 2.4 20% | 2.1 5% | 1.3 -35% | 1.6 -20% |
Pros
Cons
Verdict
The XPS 15 9500 with Core i7-10875H and GTX 1650 Ti graphics serves to directly replace last year's XPS 15 with Core i9-9980HK and GTX 1650 graphics. Performance-wise, the newer model is marginally faster without needing to run any warmer or louder. Users who were hoping for a quieter or cooler experience will have to mend their original expectations as power consumption and noise have remained steady gen-over-gen.
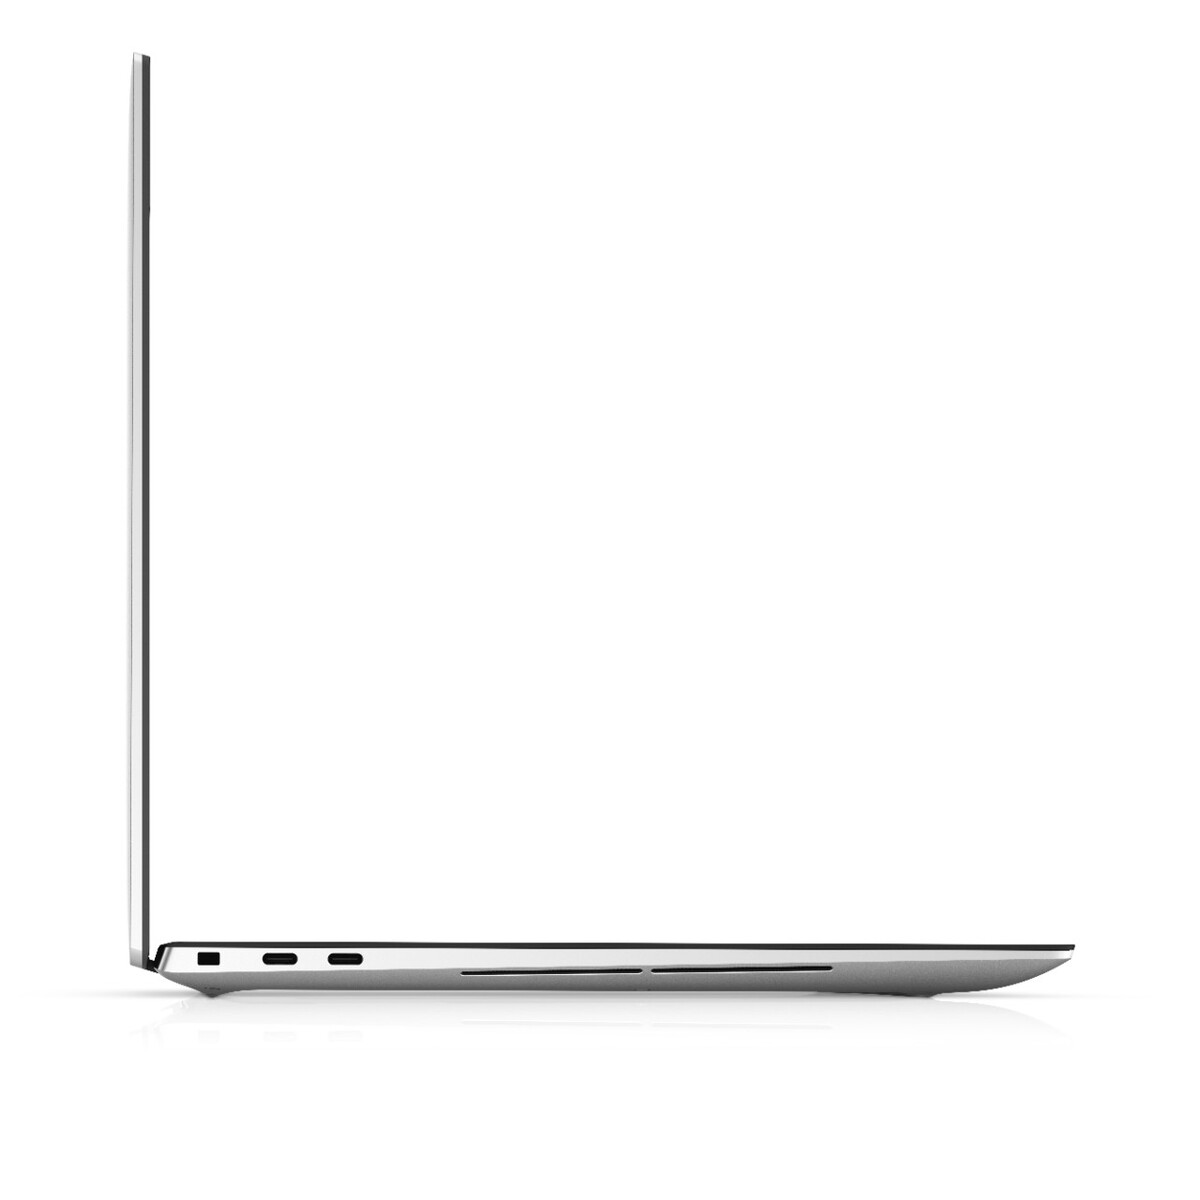
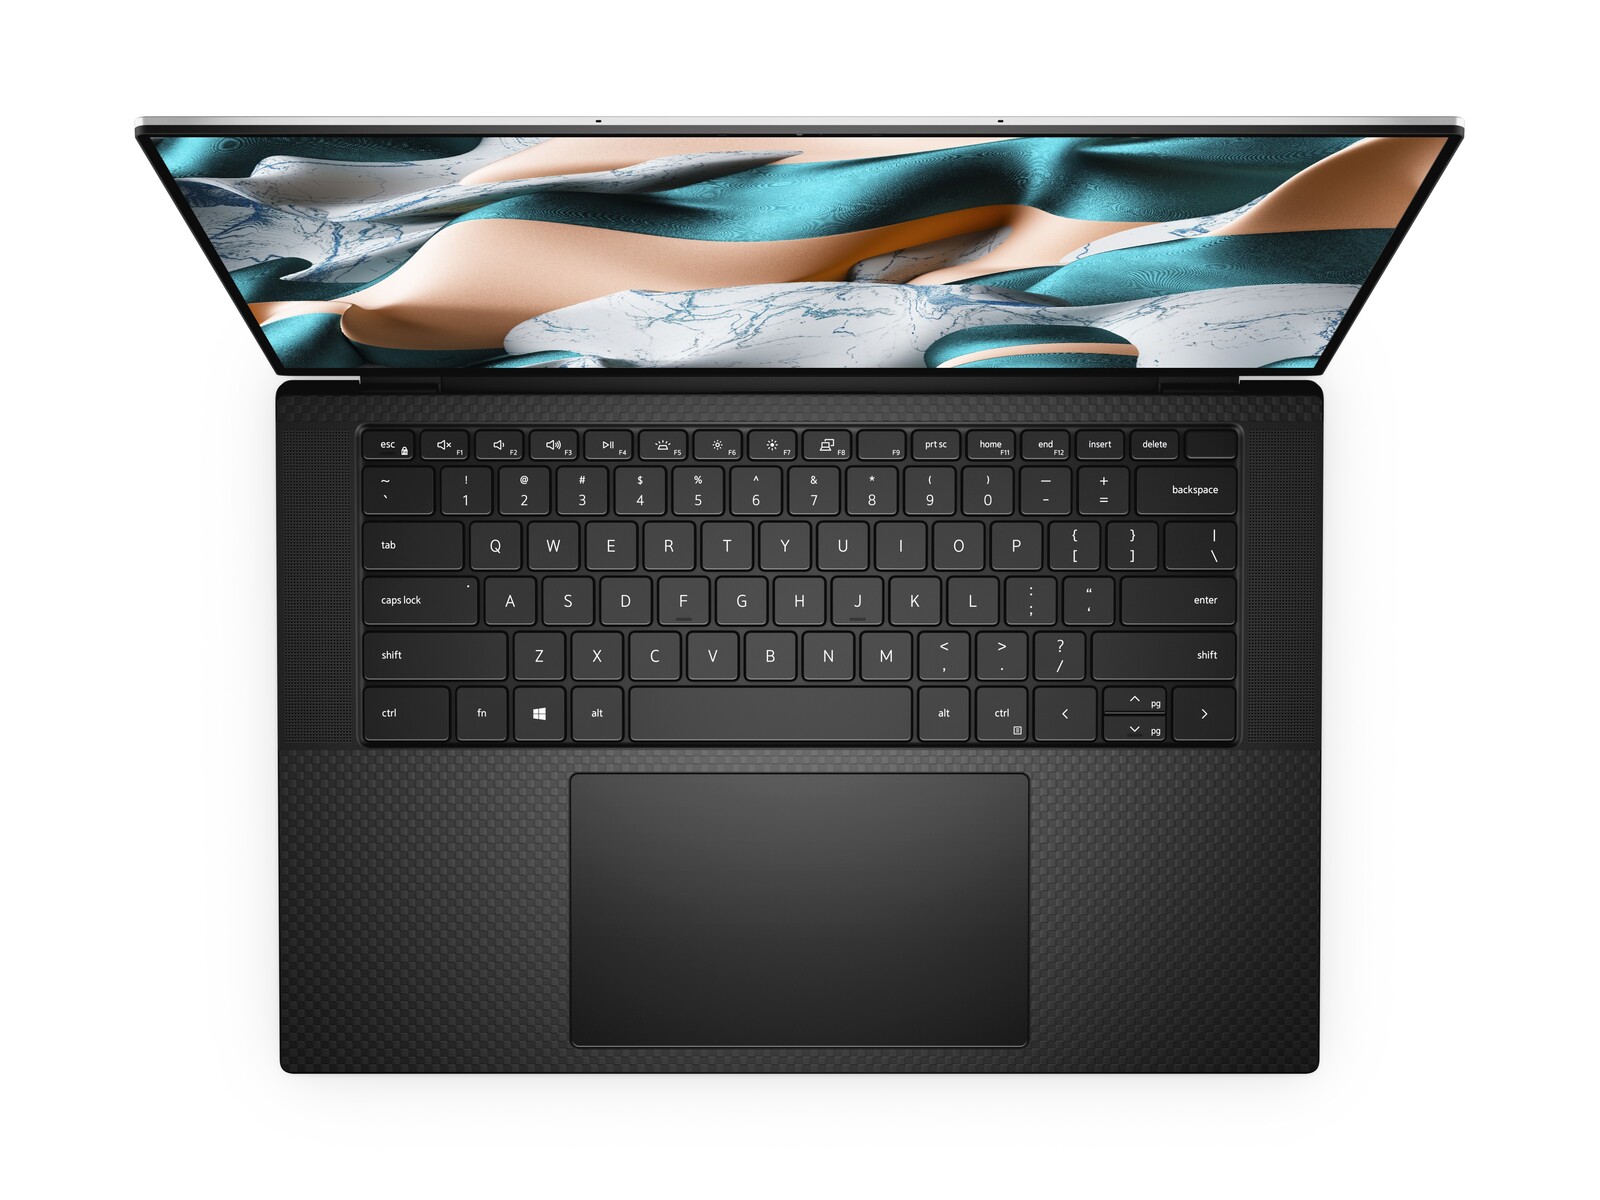
The best reason for choosing the XPS 15 9500 over the older XPS 15 7590 is still for its 16:10 display because this change will be immediately noticeable and beneficial to the end-user in relation to the minor CPU or GPU performance upgrades. Other physical changes like the smaller dimensions, larger clickpad, improved audio, and better keyboard feedback help to make the newer model that much better to use than the 2019 model. Our main gripes with the system relate mostly to the over-reliance of USB Type-C and the average performance sustainability of the GPU when gaming. Fortunately, the former can be addressed with adapters while anyone bothered by the latter can choose from plenty of other options ranging from Alienware to MSI where GPU performance is both steadier and oftentimes faster.
The 2016 XPS 15 was a catalyst for narrow-bezel Ultrabook designs and the 2020 XPS 15 will likely do the same for 16:10 displays. This alone separates the XPS 15 9500 from other Core-H-powered Ultrabooks much more so than any processor differences you can find.
Dell XPS 15 9500 Core i7 4K UHD
- 06/09/2020 v7 (old)
Allen Ngo
Price comparison
