MSI GS66 Stealth 10SFS Laptop Review: Visually subdued, acoustically conspicuous

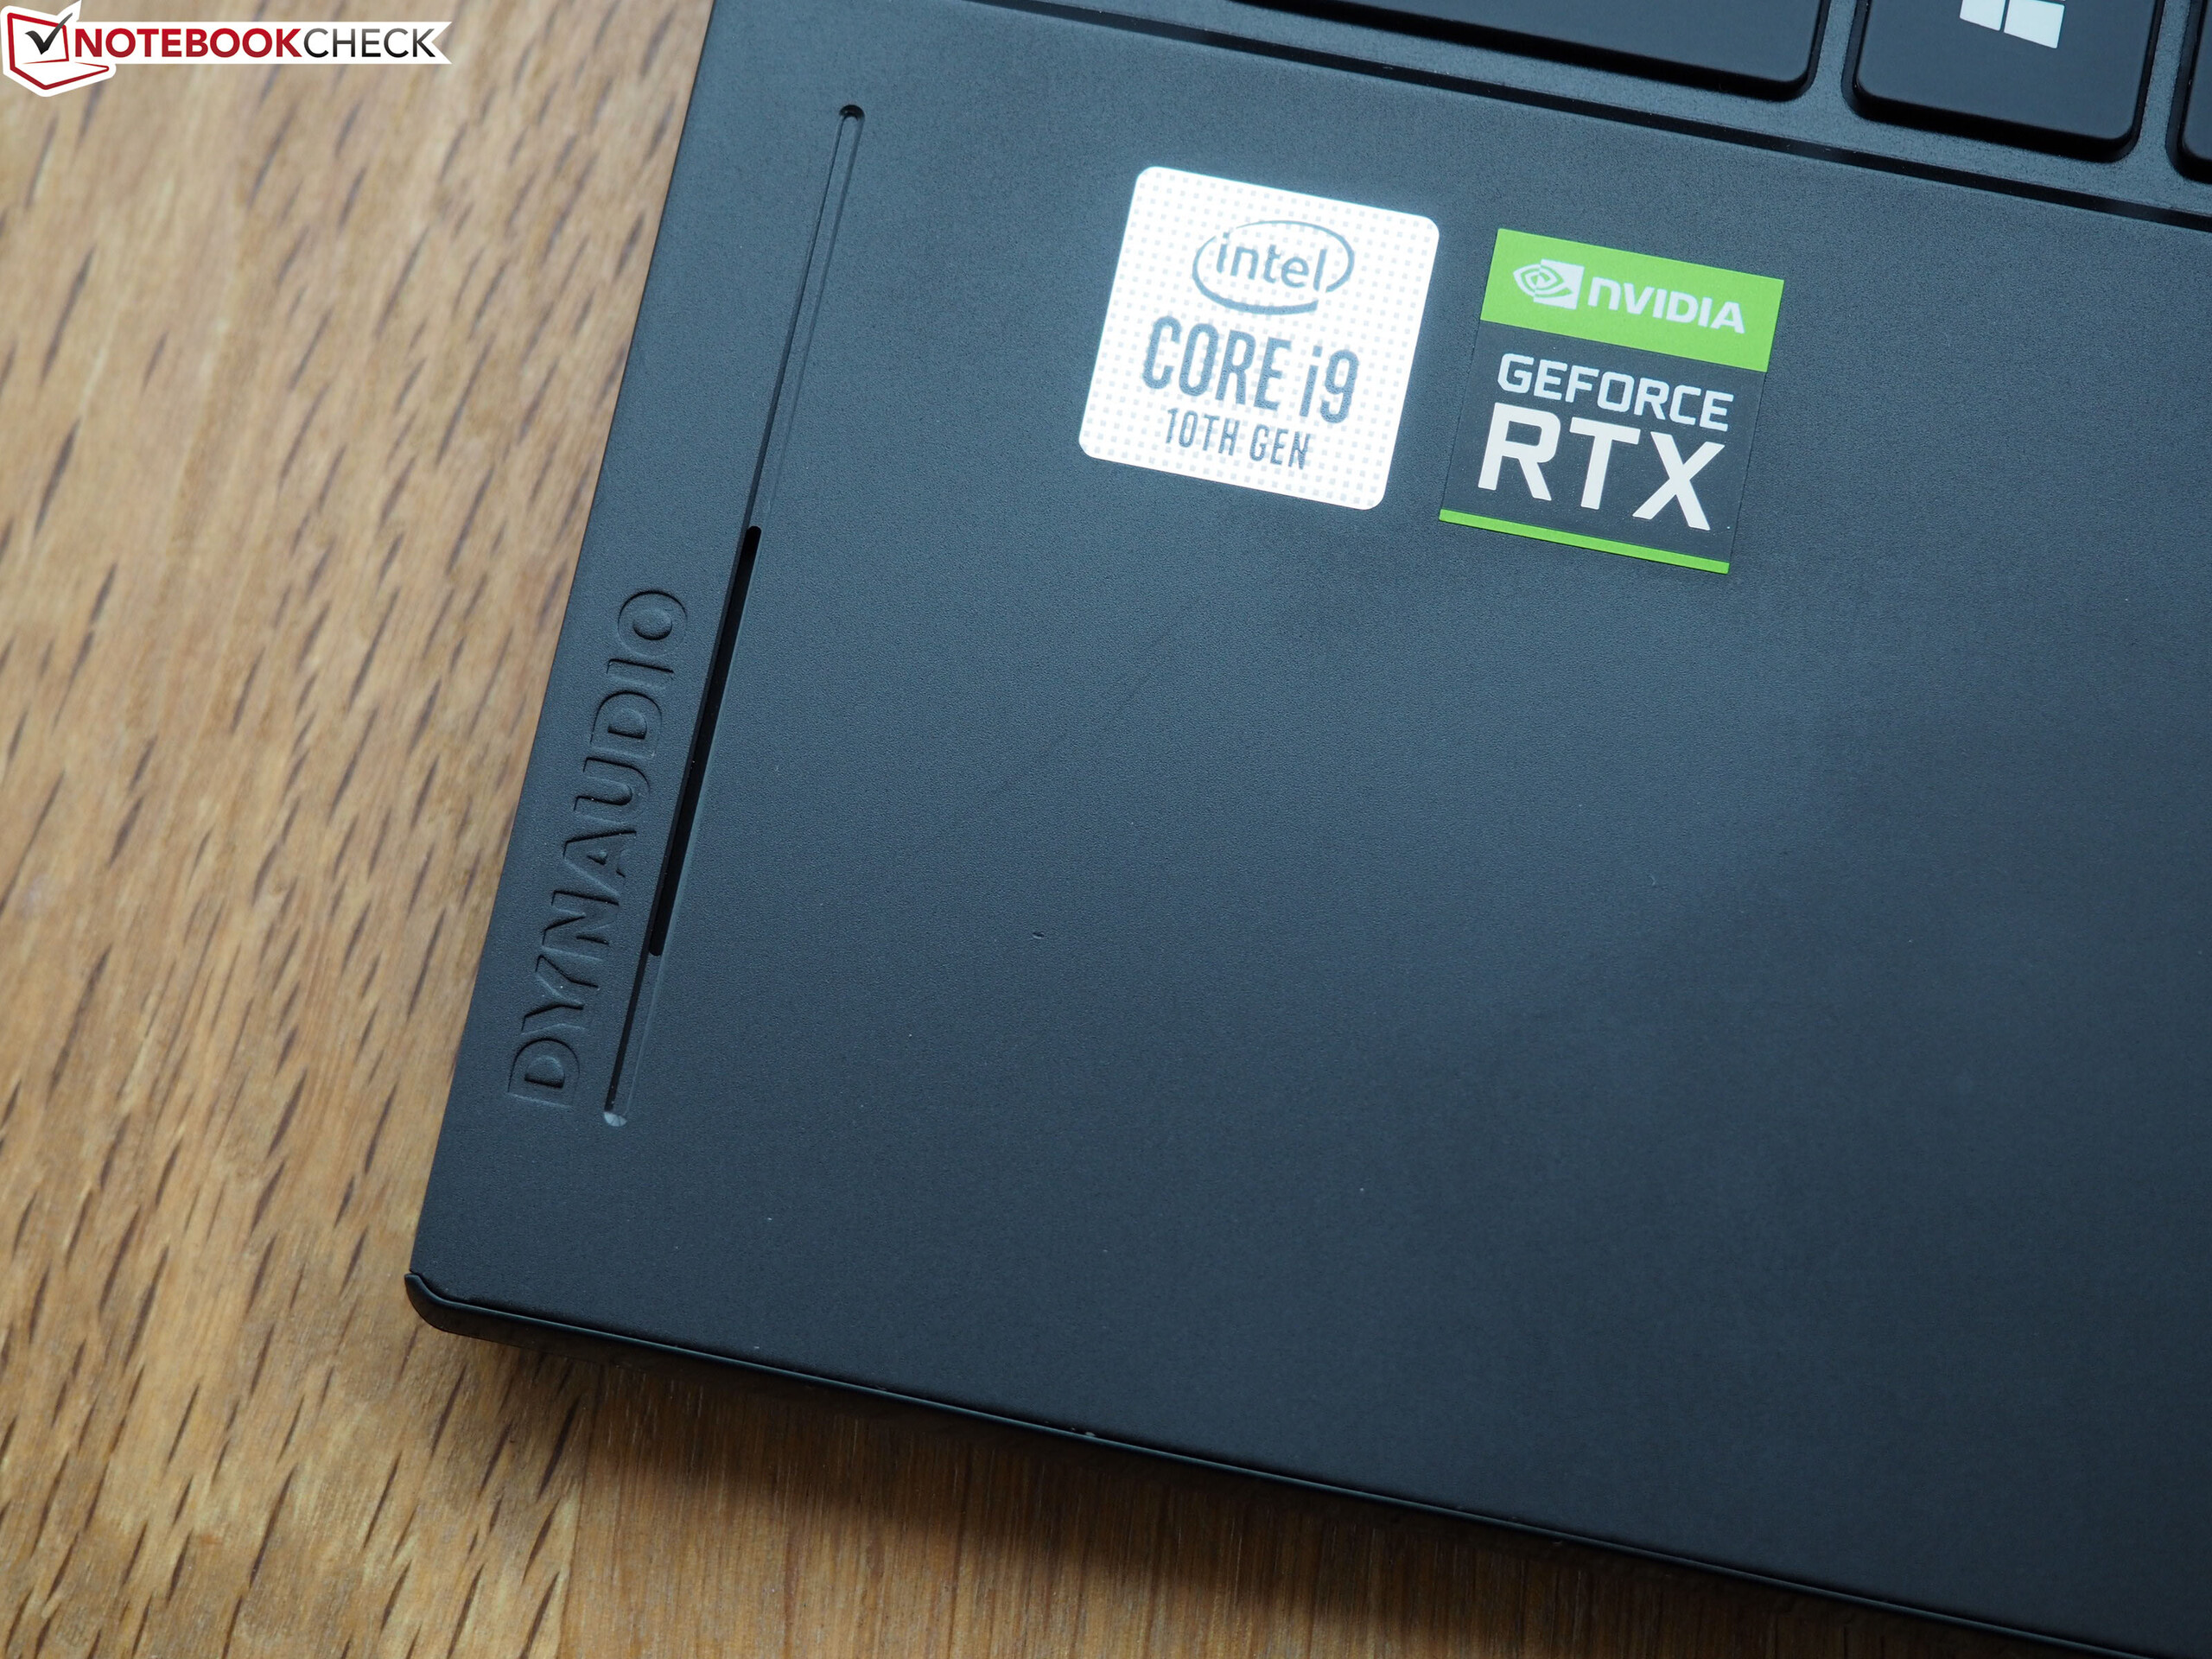
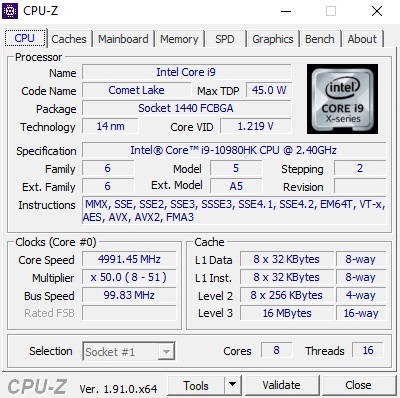
In order to attract as many buyers as possible, MSI offers the GS66 Stealth in several configuration variants. The processor is either a hexa-core or an octa-core model from Intel's current Comet Lake generation. In contrast to the Core i9-10980HK, the Core i7-10750H has to make do without an open multiplier.
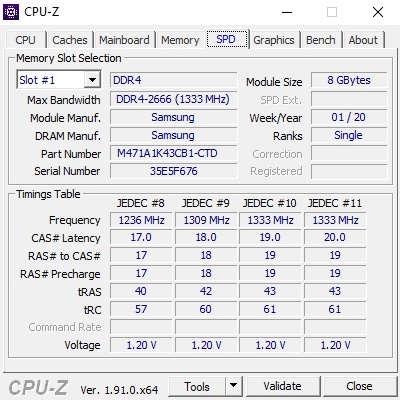
Corresponding to the high-end CPU, there is also a high-end GPU on board. Besides the GeForce RTX 2060, the GeForce RTX 2070 Super Max-Q and the GeForce RTX 2080 Super Max-Q are also available. The whole package is rounded by 16 to 32 GB DDR4-RAM (always dual channel) and a 1 to 2 TB M.2 SSD. The images are displayed by a matte Full HD panel with 240 or 300 Hz.
For our test configuration with the label 10SFS and equipped with the Core i9-10980HK, the GeForce RTX 2070 Super Max-Q, 16 GB of RAM, and a 1-TB SSD, you have to pay about 2850 Euros (~$3133), which is fairly expensive for laptop with a 2070.
The competitors of the GS66 Stealth include other 15-inch slim gaming notebooks with a similar graphics performance such as the Acer Predator Triton 500, the Gigabyte Aero 15 Classic, the HP Omen X 2S, and the Schenker XMG Neo 15. Those notebooks are listed as the comparison devices in the charts below.
Rating | Date | Model | Weight | Height | Size | Resolution | Price |
|---|---|---|---|---|---|---|---|
| 82.8 % v7 (old) | 05 / 2020 | MSI GS66 Stealth 10SFS i9-10980HK, GeForce RTX 2070 Super Max-Q | 2.2 kg | 20 mm | 15.60" | 1920x1080 | |
| 84 % v7 (old) | 08 / 2019 | Acer Predator Triton 500 PT515-51-71PZ i7-9750H, GeForce RTX 2070 Max-Q | 2.1 kg | 18 mm | 15.60" | 1920x1080 | |
| 84 % v7 (old) | 05 / 2019 | Gigabyte Aero 15 Classic-XA i7-9750H, GeForce RTX 2070 Max-Q | 2.1 kg | 19 mm | 15.60" | 1920x1080 | |
| 82.3 % v7 (old) | 09 / 2019 | HP Omen X 2S 15-dg0075cl i7-9750H, GeForce RTX 2070 Max-Q | 2.4 kg | 19.8 mm | 15.60" | 1920x1080 | |
| 82.8 % v7 (old) | 11 / 2019 | Schenker XMG Neo 15 XNE15M19 i7-9750H, GeForce RTX 2070 Max-Q | 2.1 kg | 22 mm | 15.60" | 1920x1080 |
Case
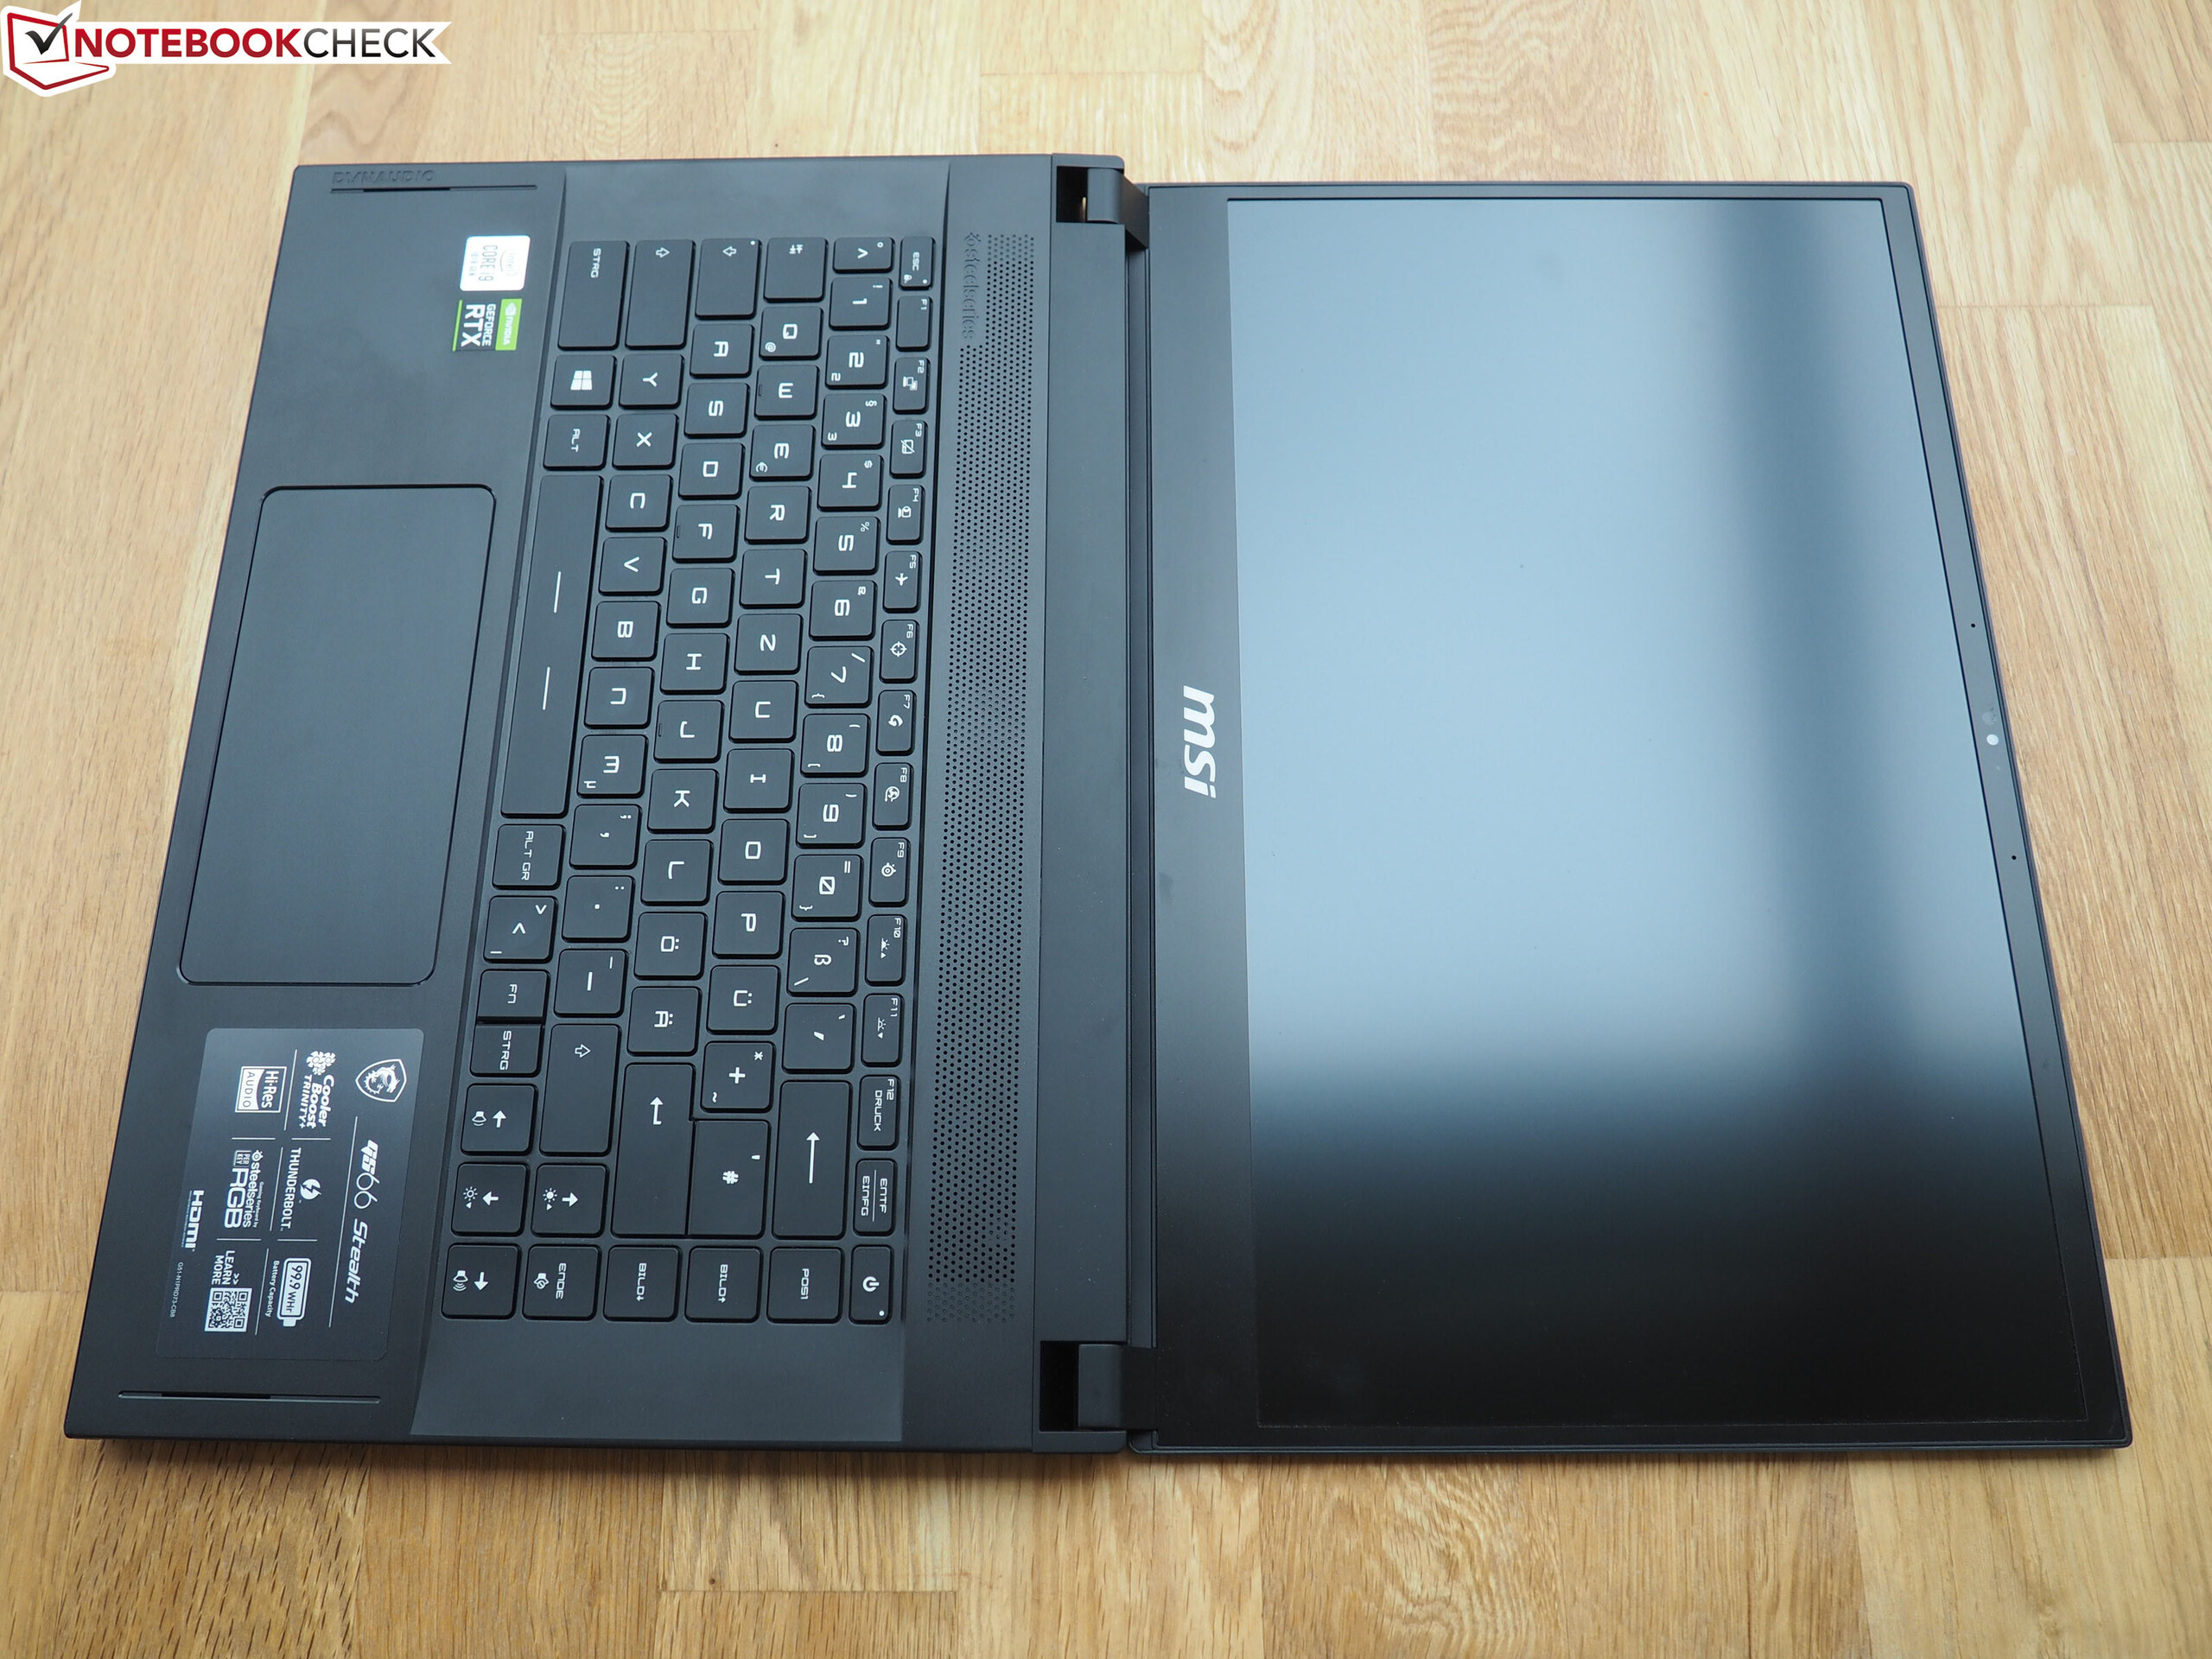
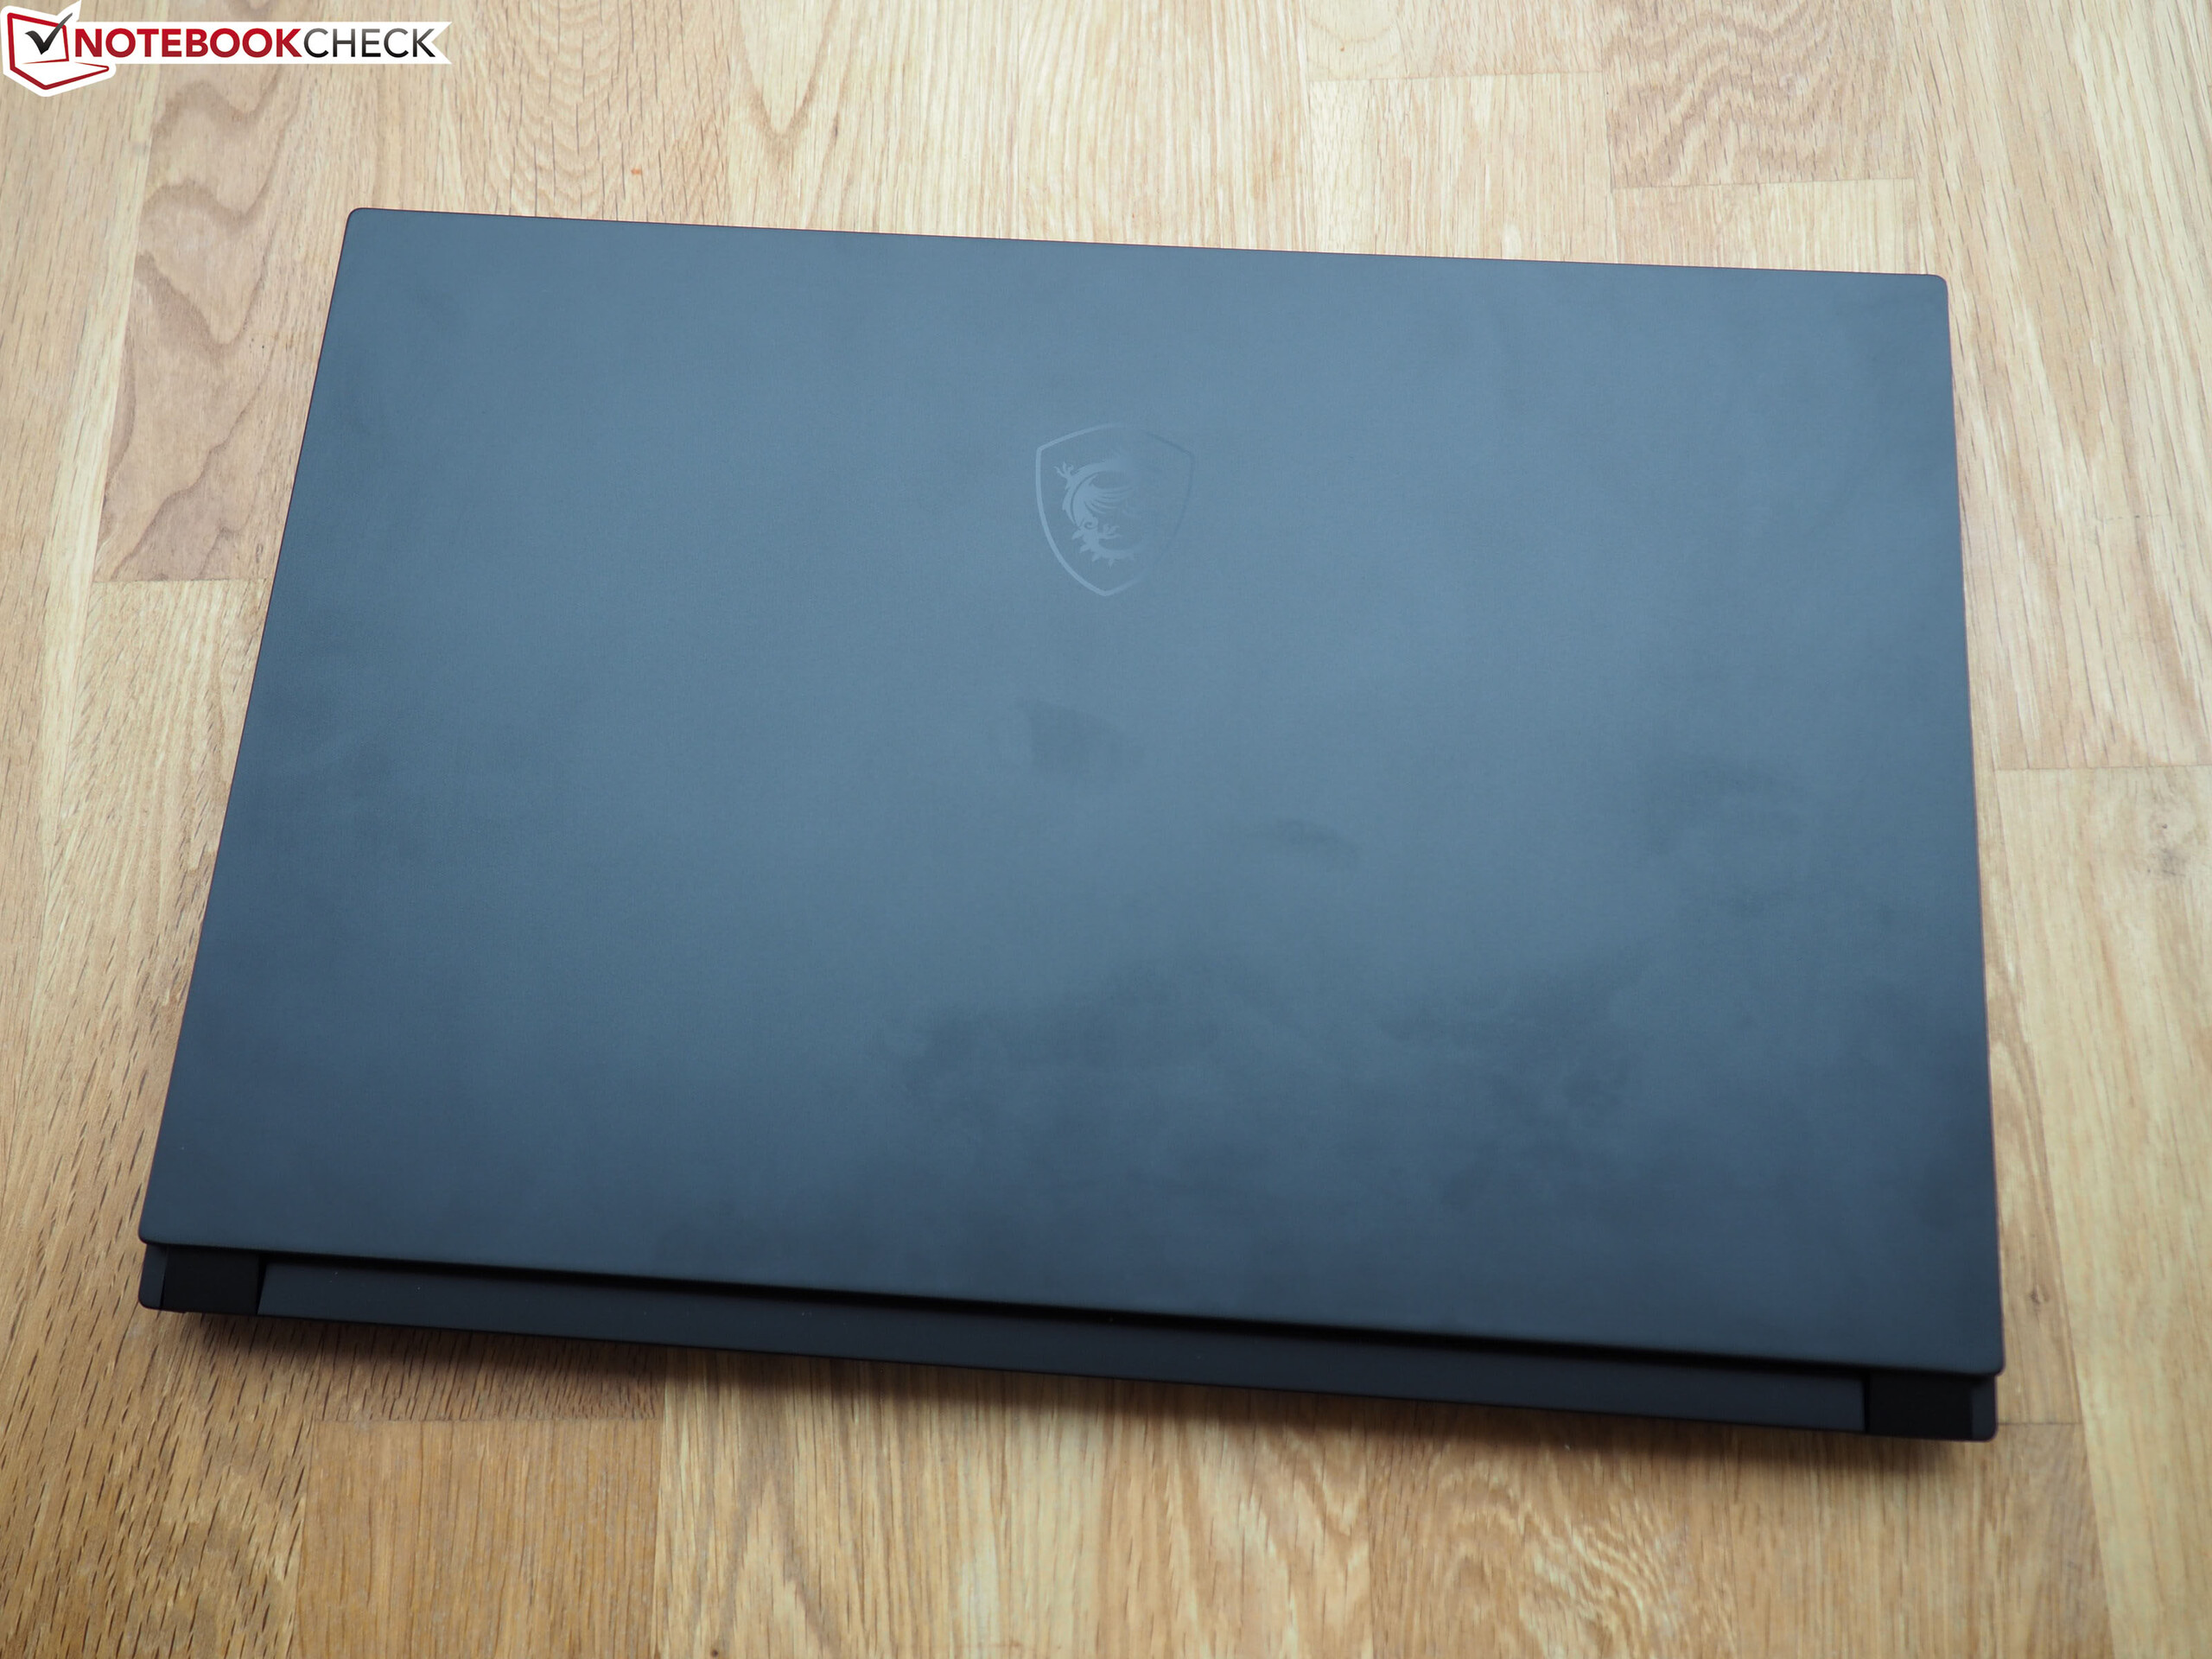
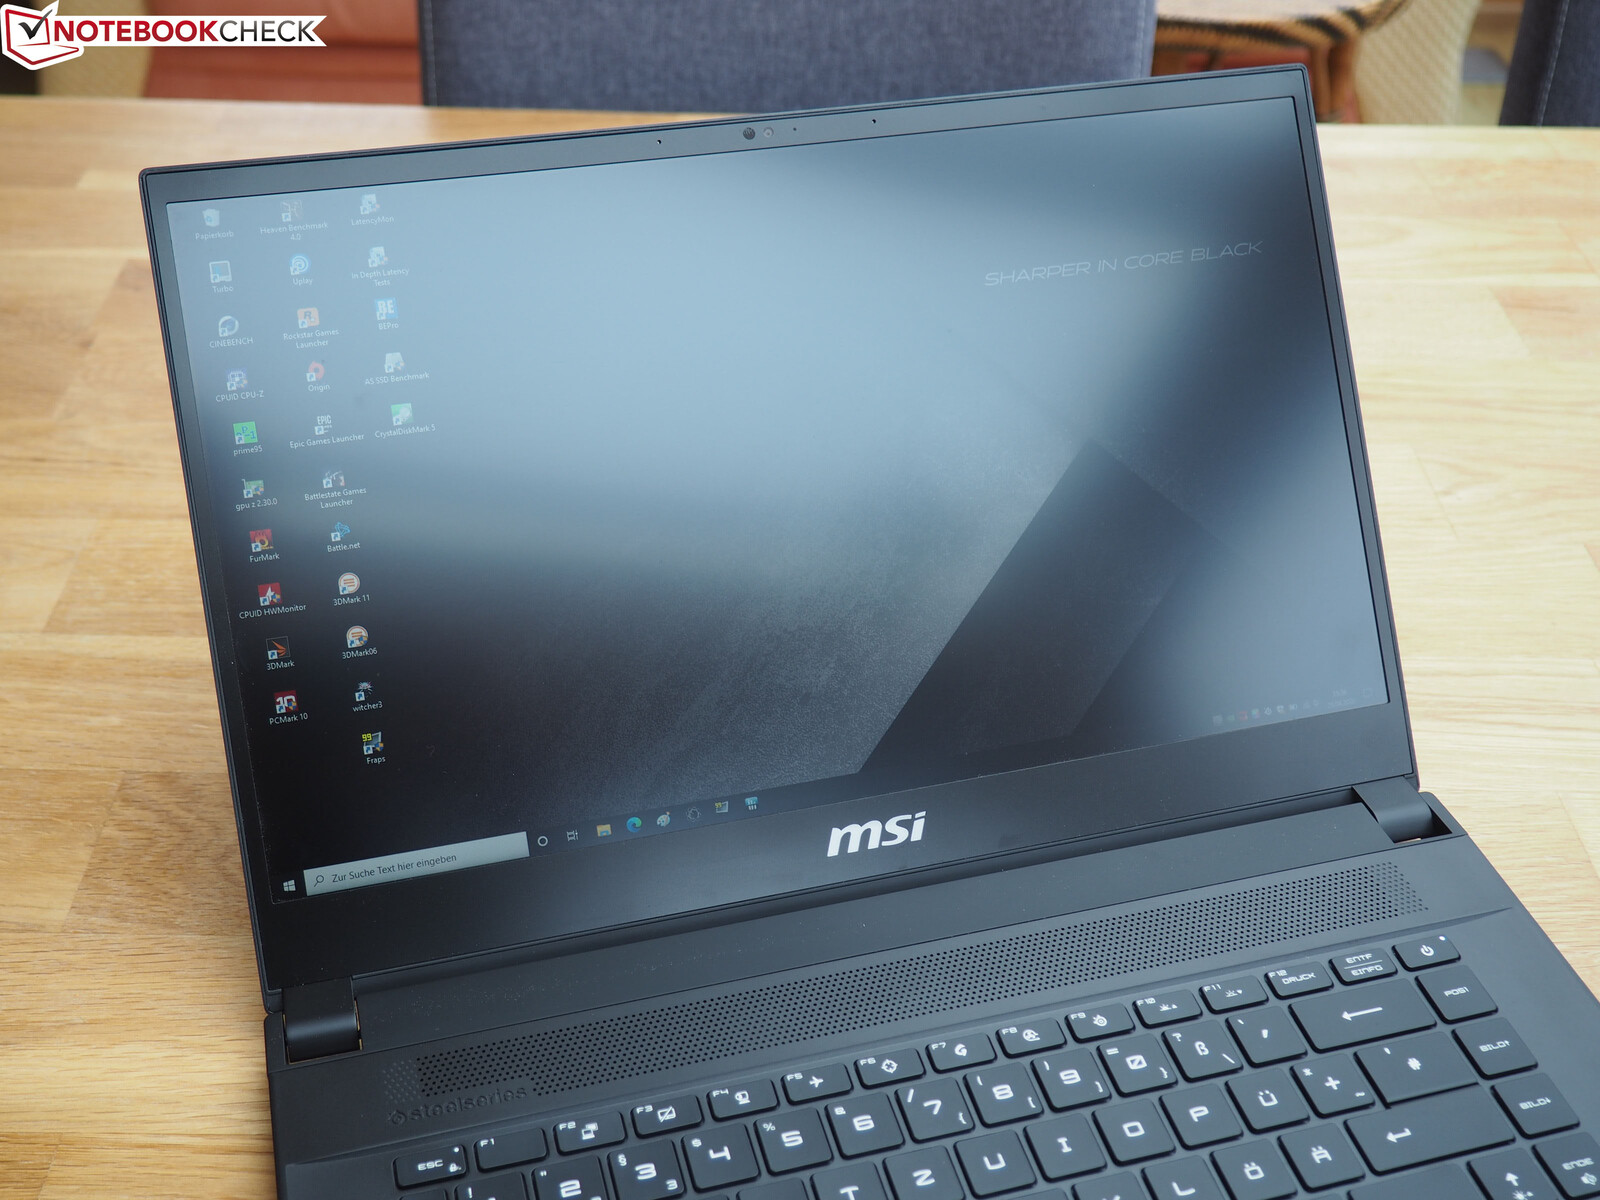
Looking at the case, you can really see that MSI took the complaints about the predecessor to heart. Where we still complained about the mediocre resistance to warping in the GS65, the GS66 is now among the most robust representatives of the thin and light category. The case only shows some slight give in response to more forceful pressure.
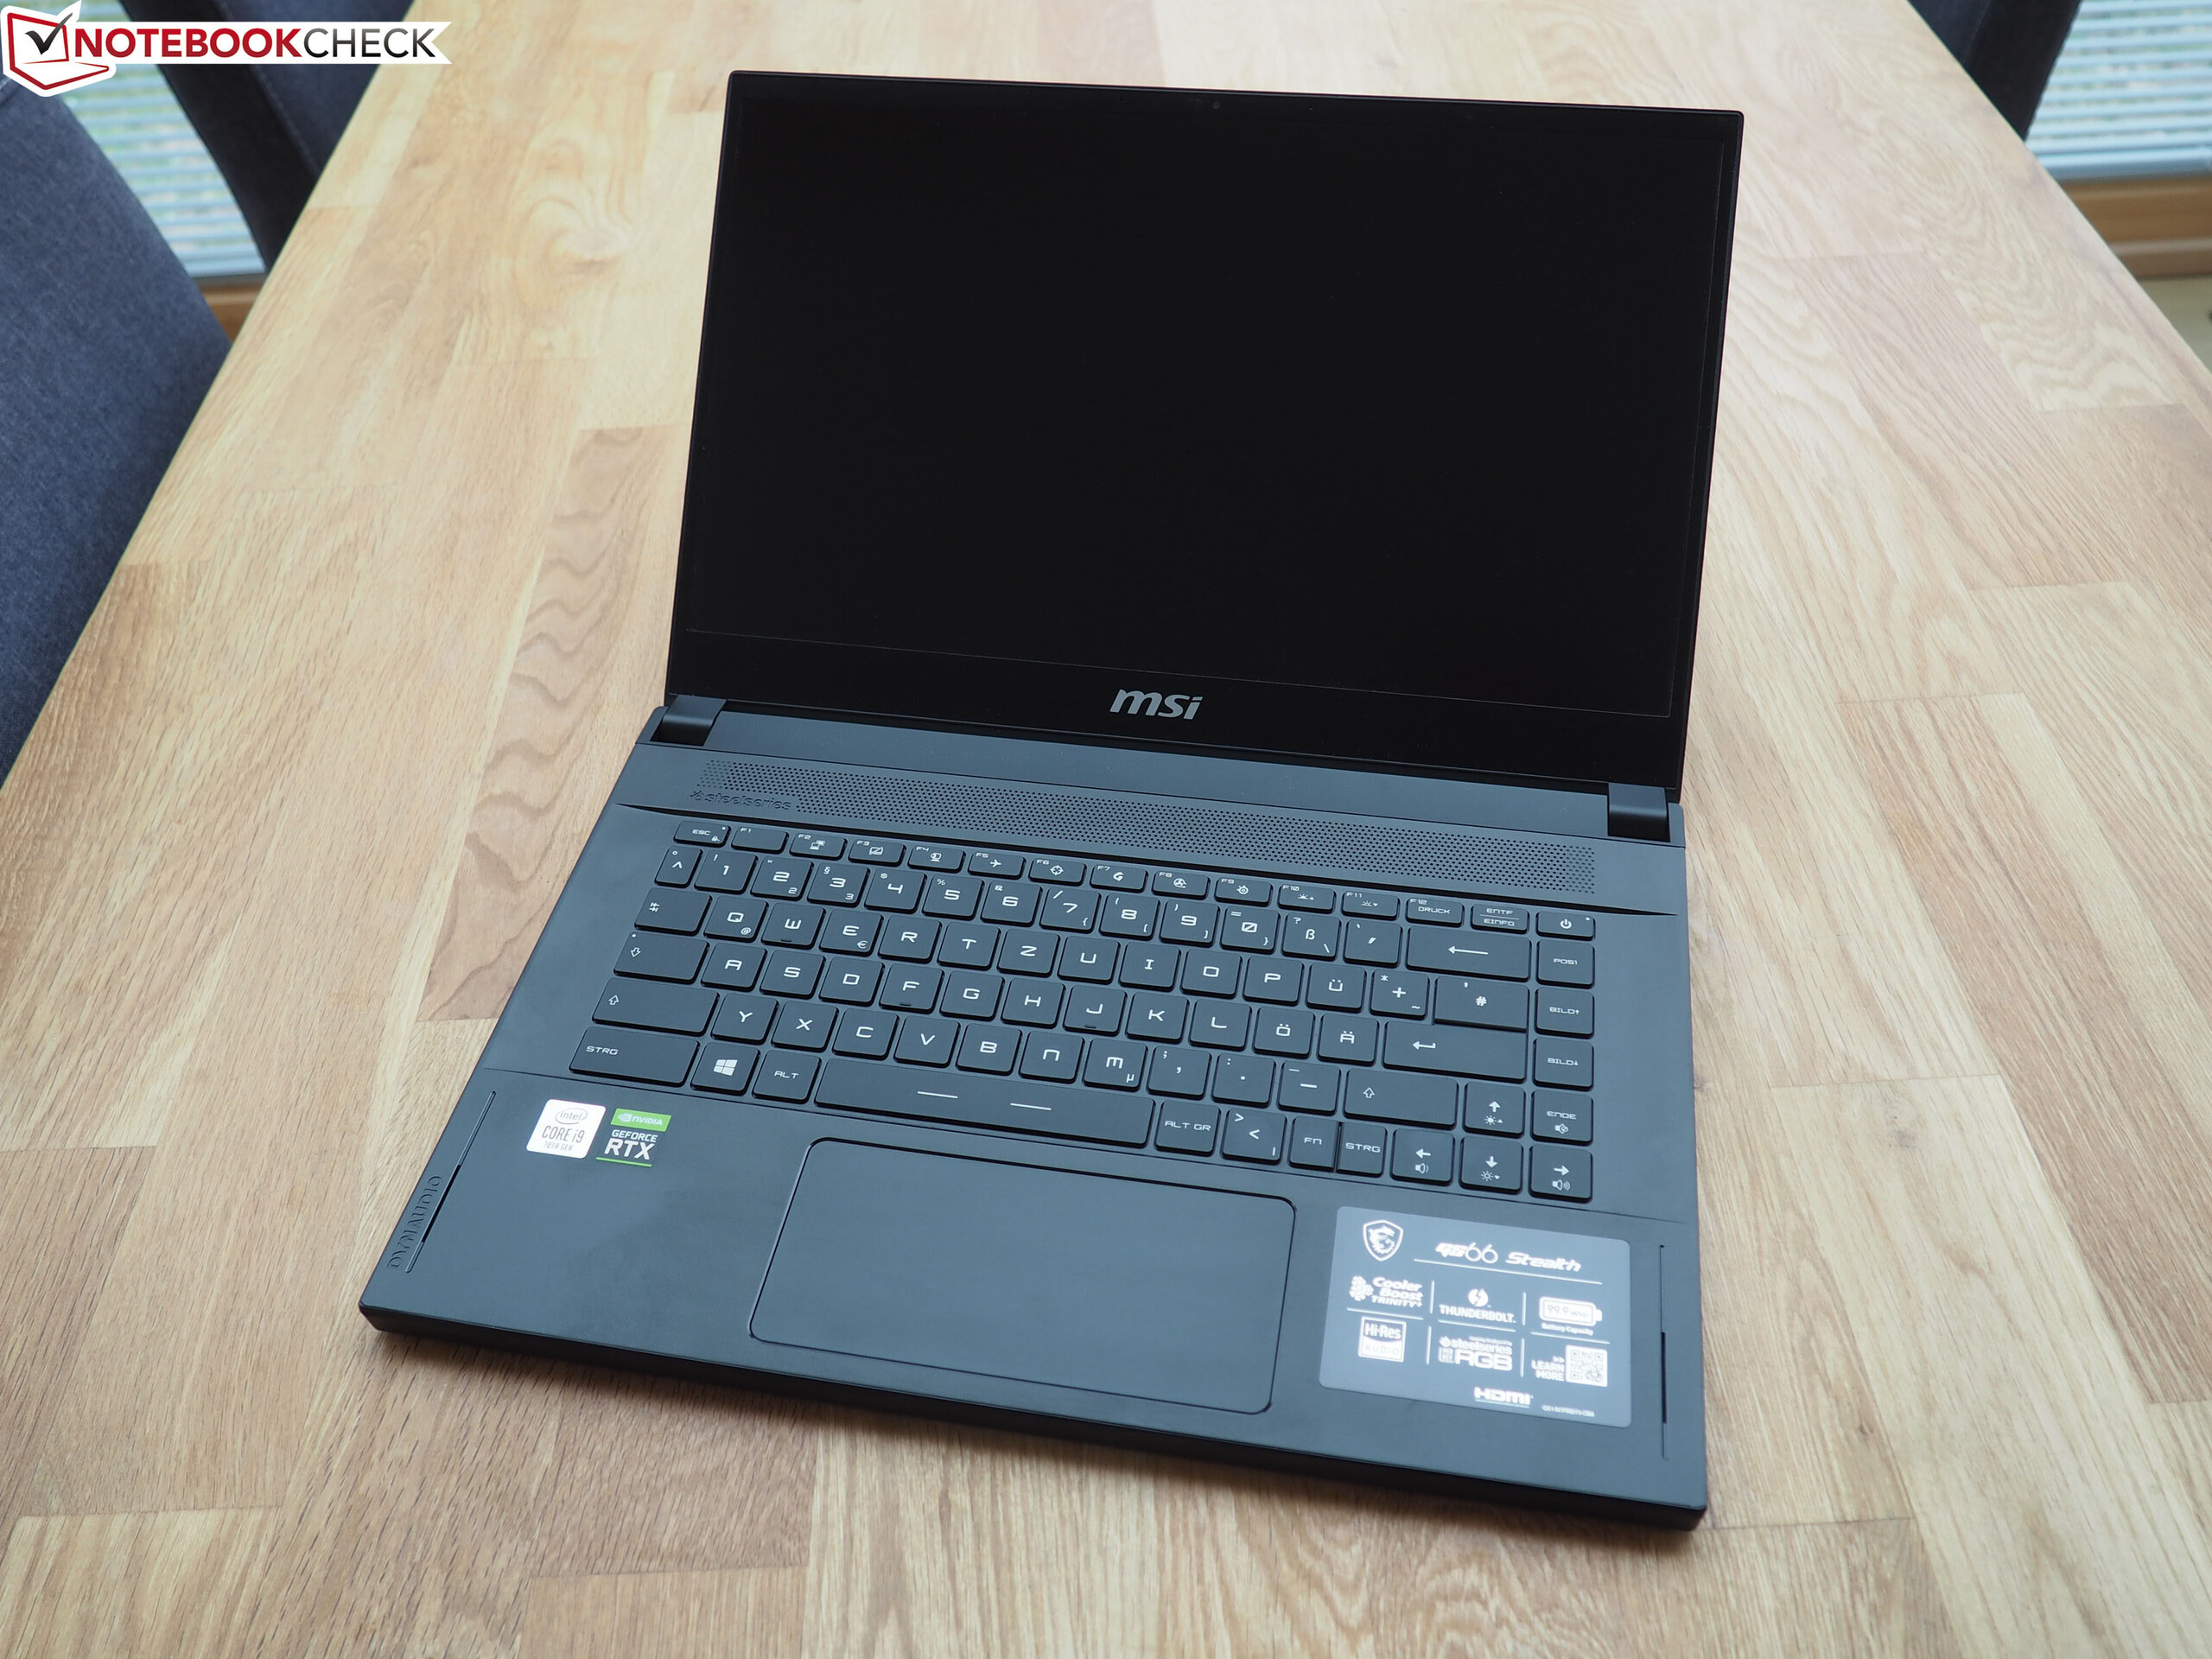

The fact that due to the more robust material, the thickness has increased from 1.8 to 2.0 cm (0.7 to 0.8 in) and the weight from 1.9 to 2.1 kg (~4.2 lb to 4.6 lb), is completely understandable in our opinion. However, there is some slight room for improvement for MSI in terms of the workmanship, which turns out slightly weaker compared to most competitors, and the transitions between some elements are not quite clean.
But from a pure quality stand point, there is no reason for complaint. The metal surfaces of the lid and base unit offer a high-quality impression, even though - also due to their dark color - they quickly tend to look messy (keyword: fingerprints). A singular characteristic of the case is the abundant opening angle: we hardly ever see 180° in a gaming notebook. MSI also deserves some praise for the simple design, which doesn't immediately make you think about a gaming platform and strikes a good figure in any situation.
Equipment
Connections
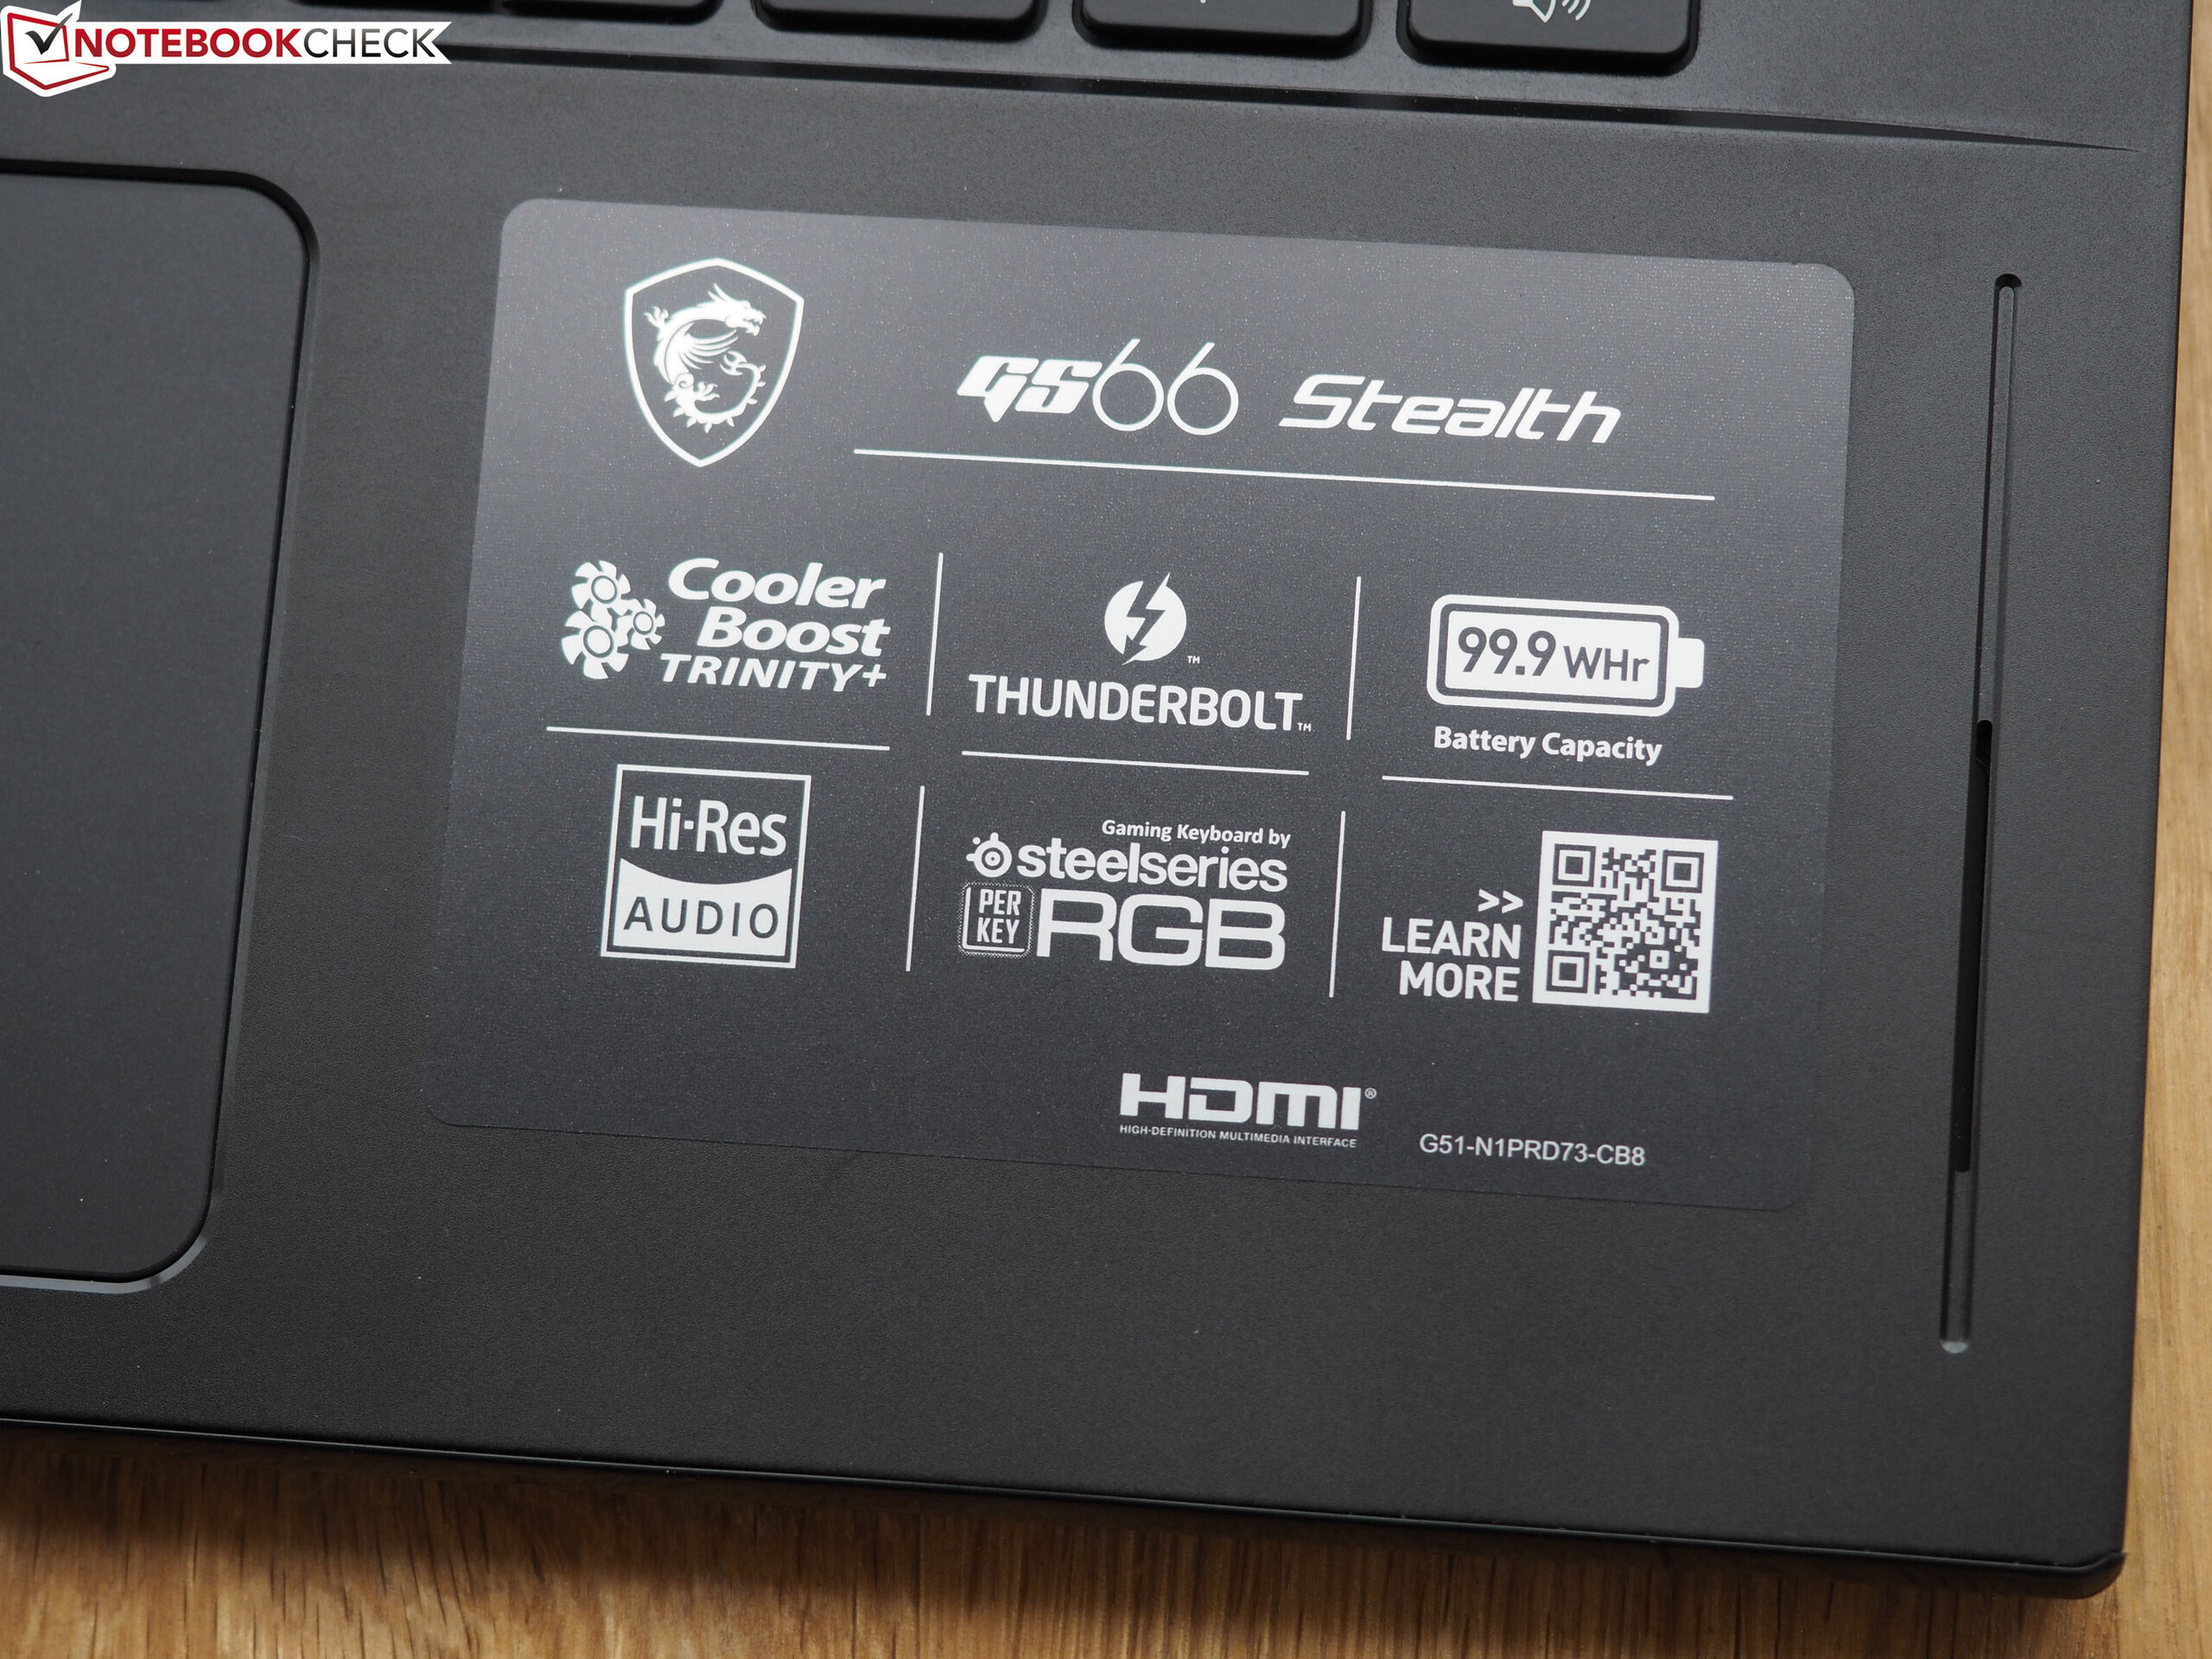
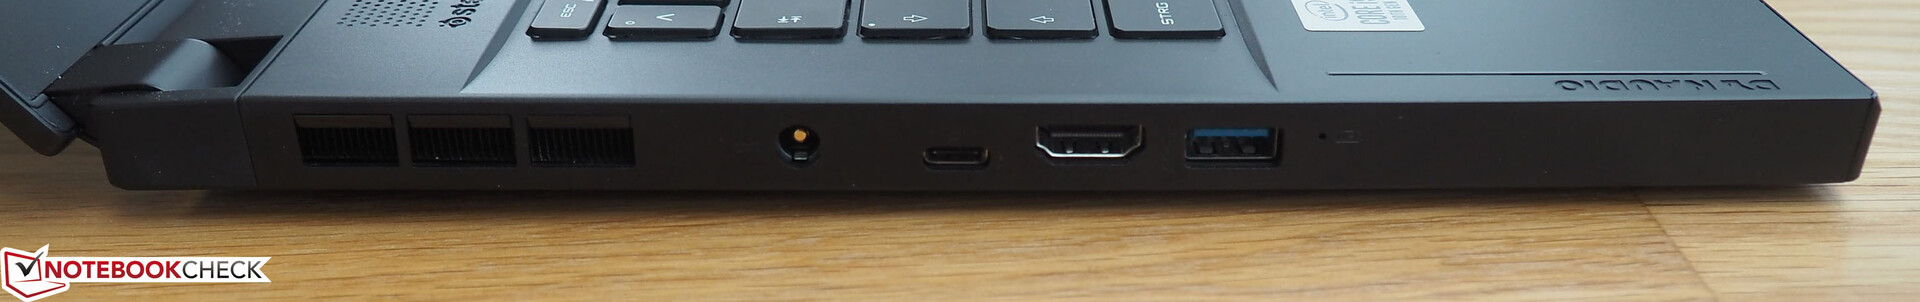
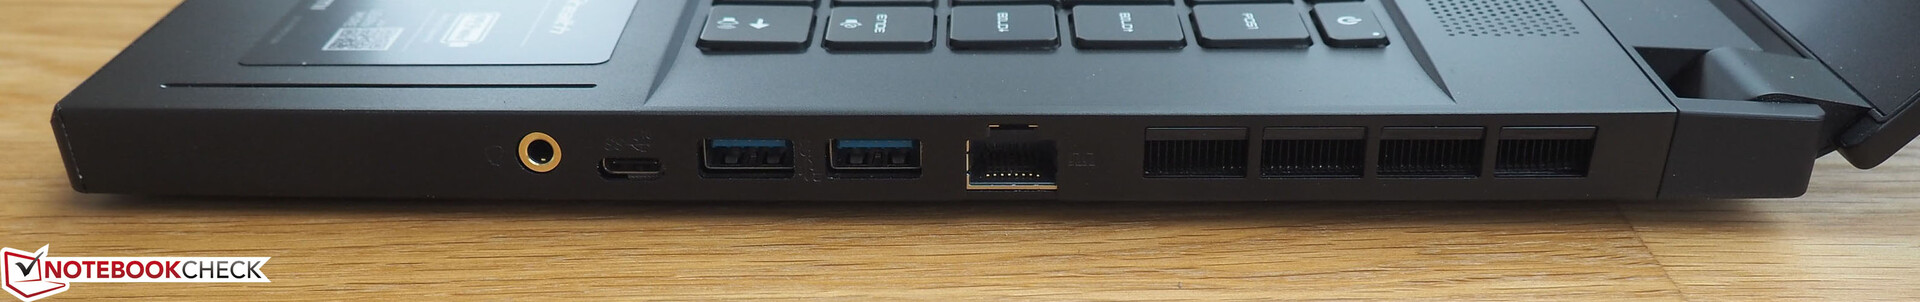
As it should be for a current high-end notebook, the GS66 includes a Thunderbolt 3 port. This is accompanied by a "regular" USB Type-C port and three classic USB Type-A ports. While other manufacturers still use the USB-3.0 technology, MSI only uses USB 3.1 Gen2, which deserves some respect. In addition, there is an HDMI-2.0 port, an audio port, and – despite the slim build – a RJ45 LAN port. However, buyers have to make do without a card reader or a Kensington Lock.
We would call the positioning of the connections mediocre. Since the back half of the case is reserved for the fan vents and the connections are correspondingly placed towards the front, you can run into some space problems and cable collisions when using an external mouse.
Communication
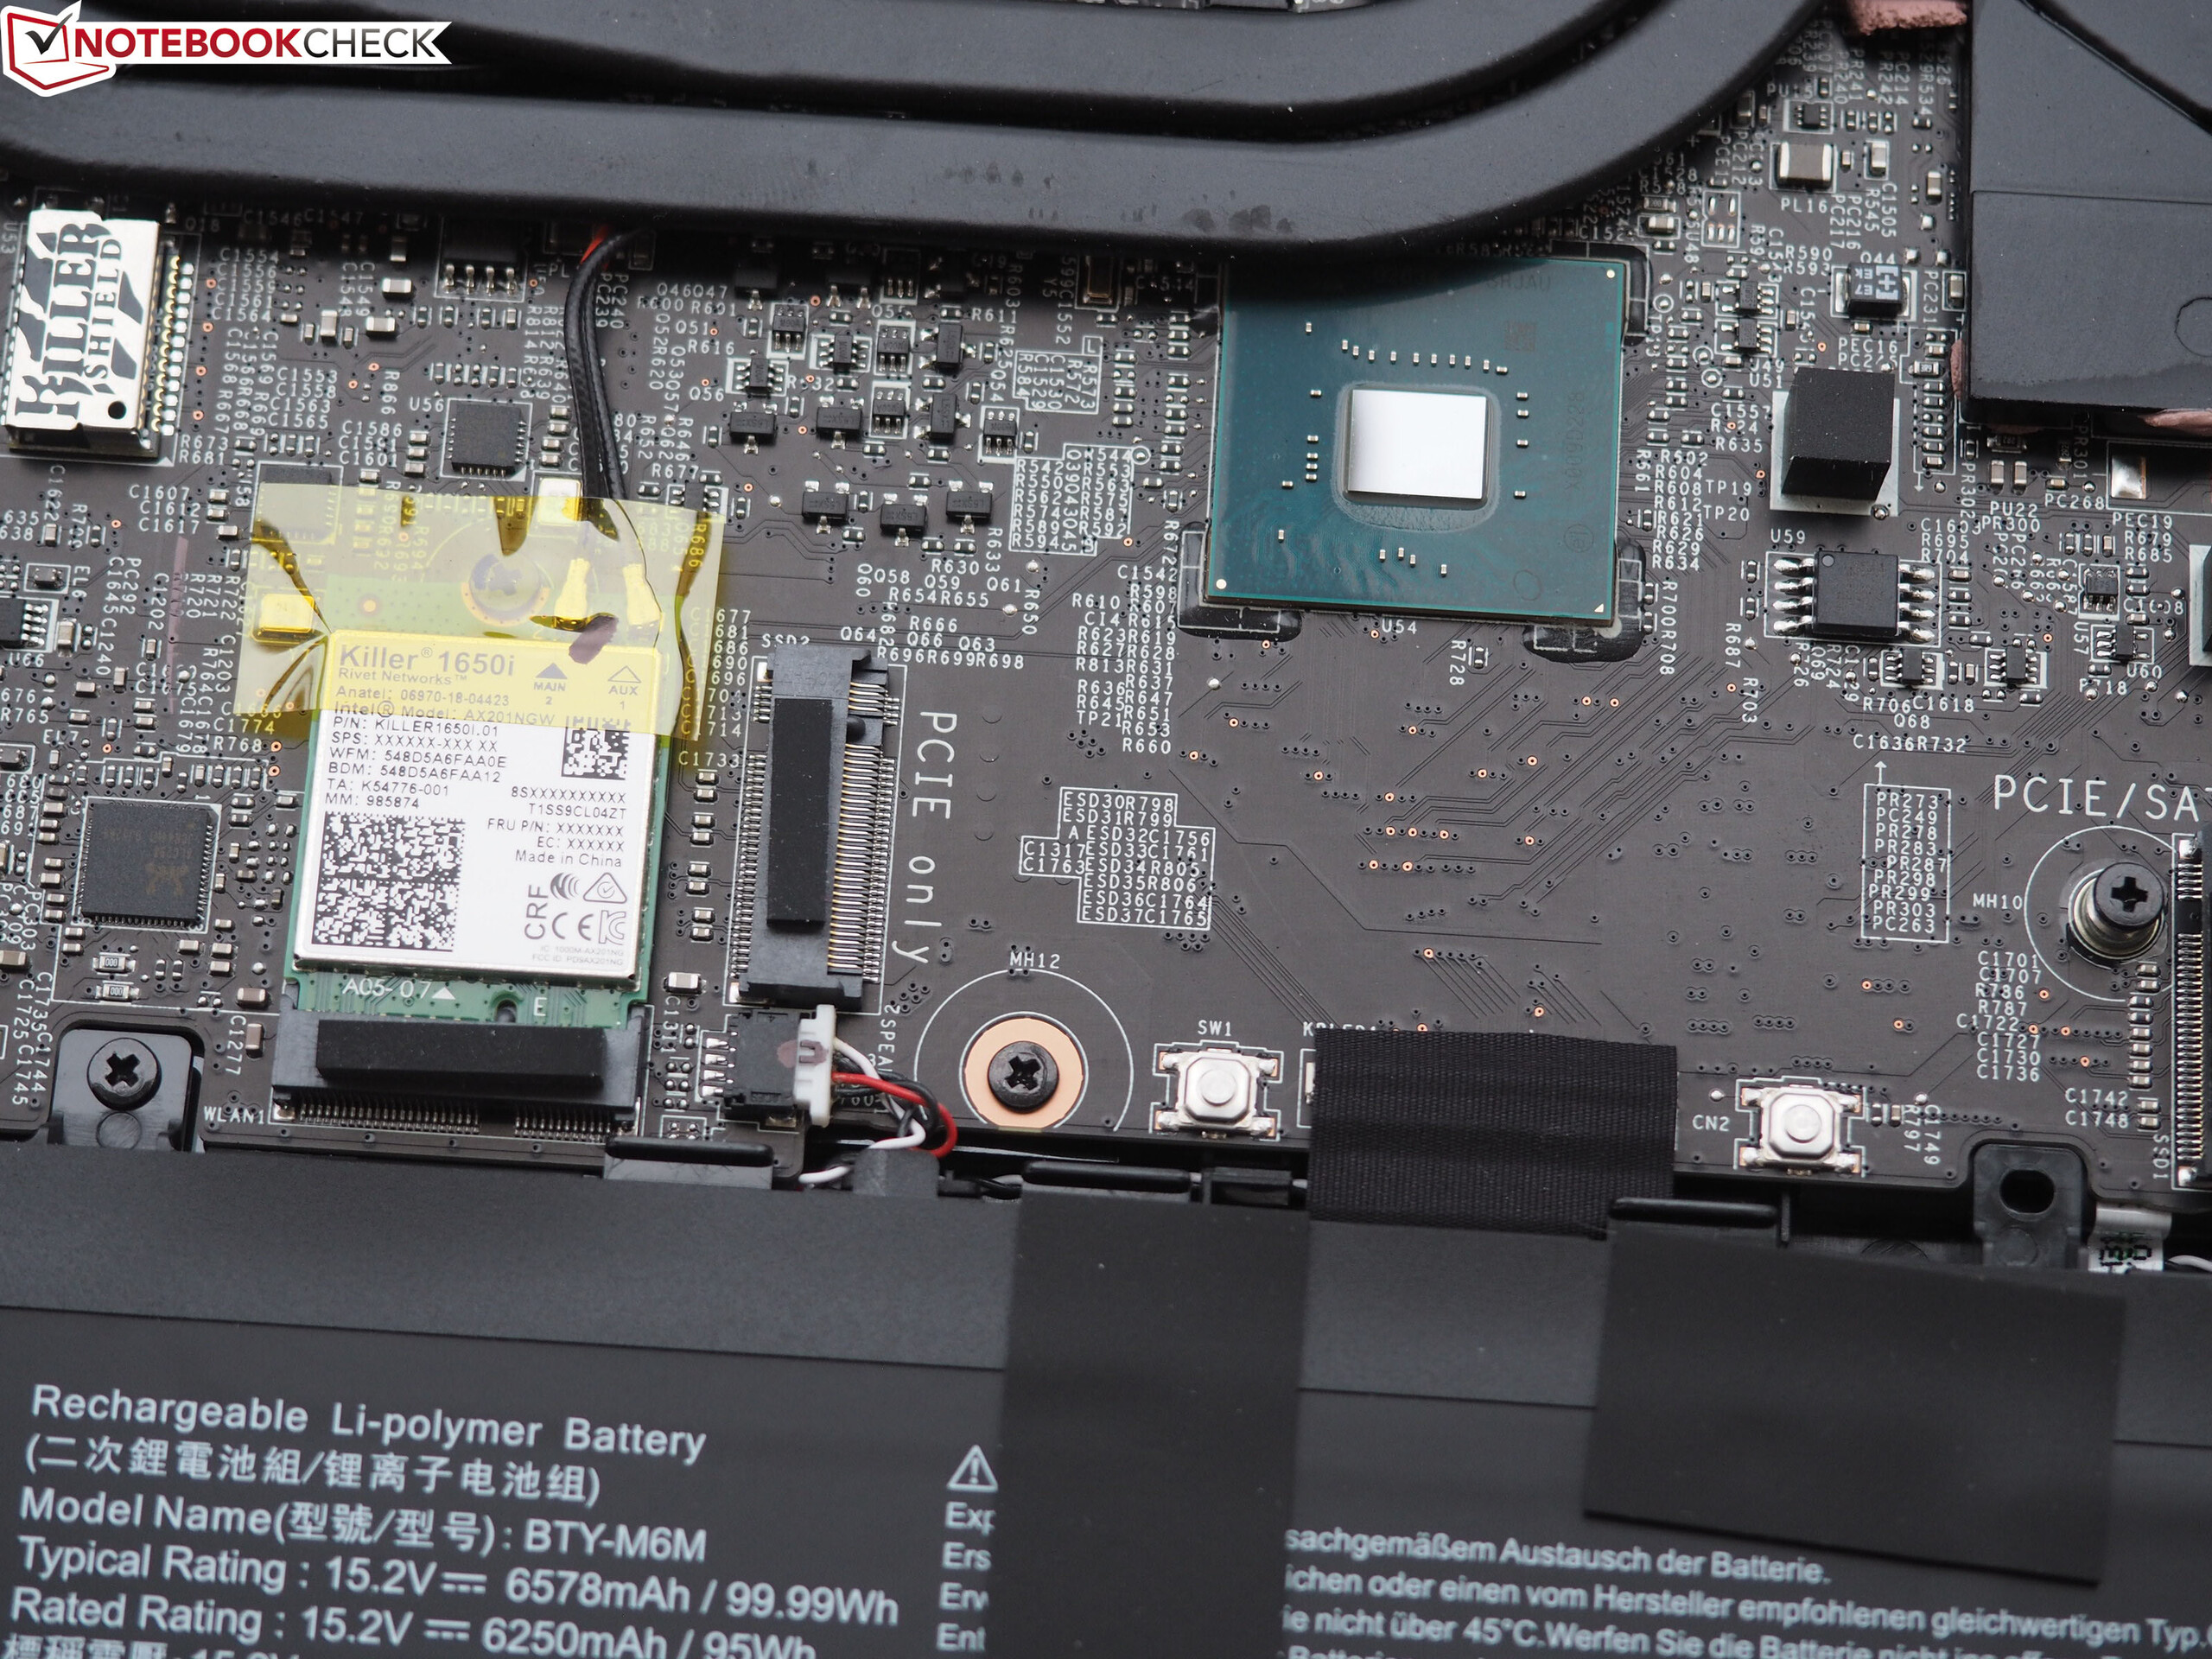
MSI does not make any compromises in terms of the communication. While the 2.5-Gbit Killer E3100G controller handles the wired communication, the Killer Wi-Fi 6 AX1650i WLAN adapter, which brings all the features that you could expect from a gaming notebook in 2020, is responsible for wireless communication. Since we recently updated our router (Netgear Nighthawk AX12 instead of Linksys EA8500), the results in our WLAN test, which at more than 1300 Mb/s all turn our first-rate, are only comparable with those from the Schenker XMG Neo 15, which was also measured at a 1-meter (~3 ft.) distance.
Webcam


Accessories
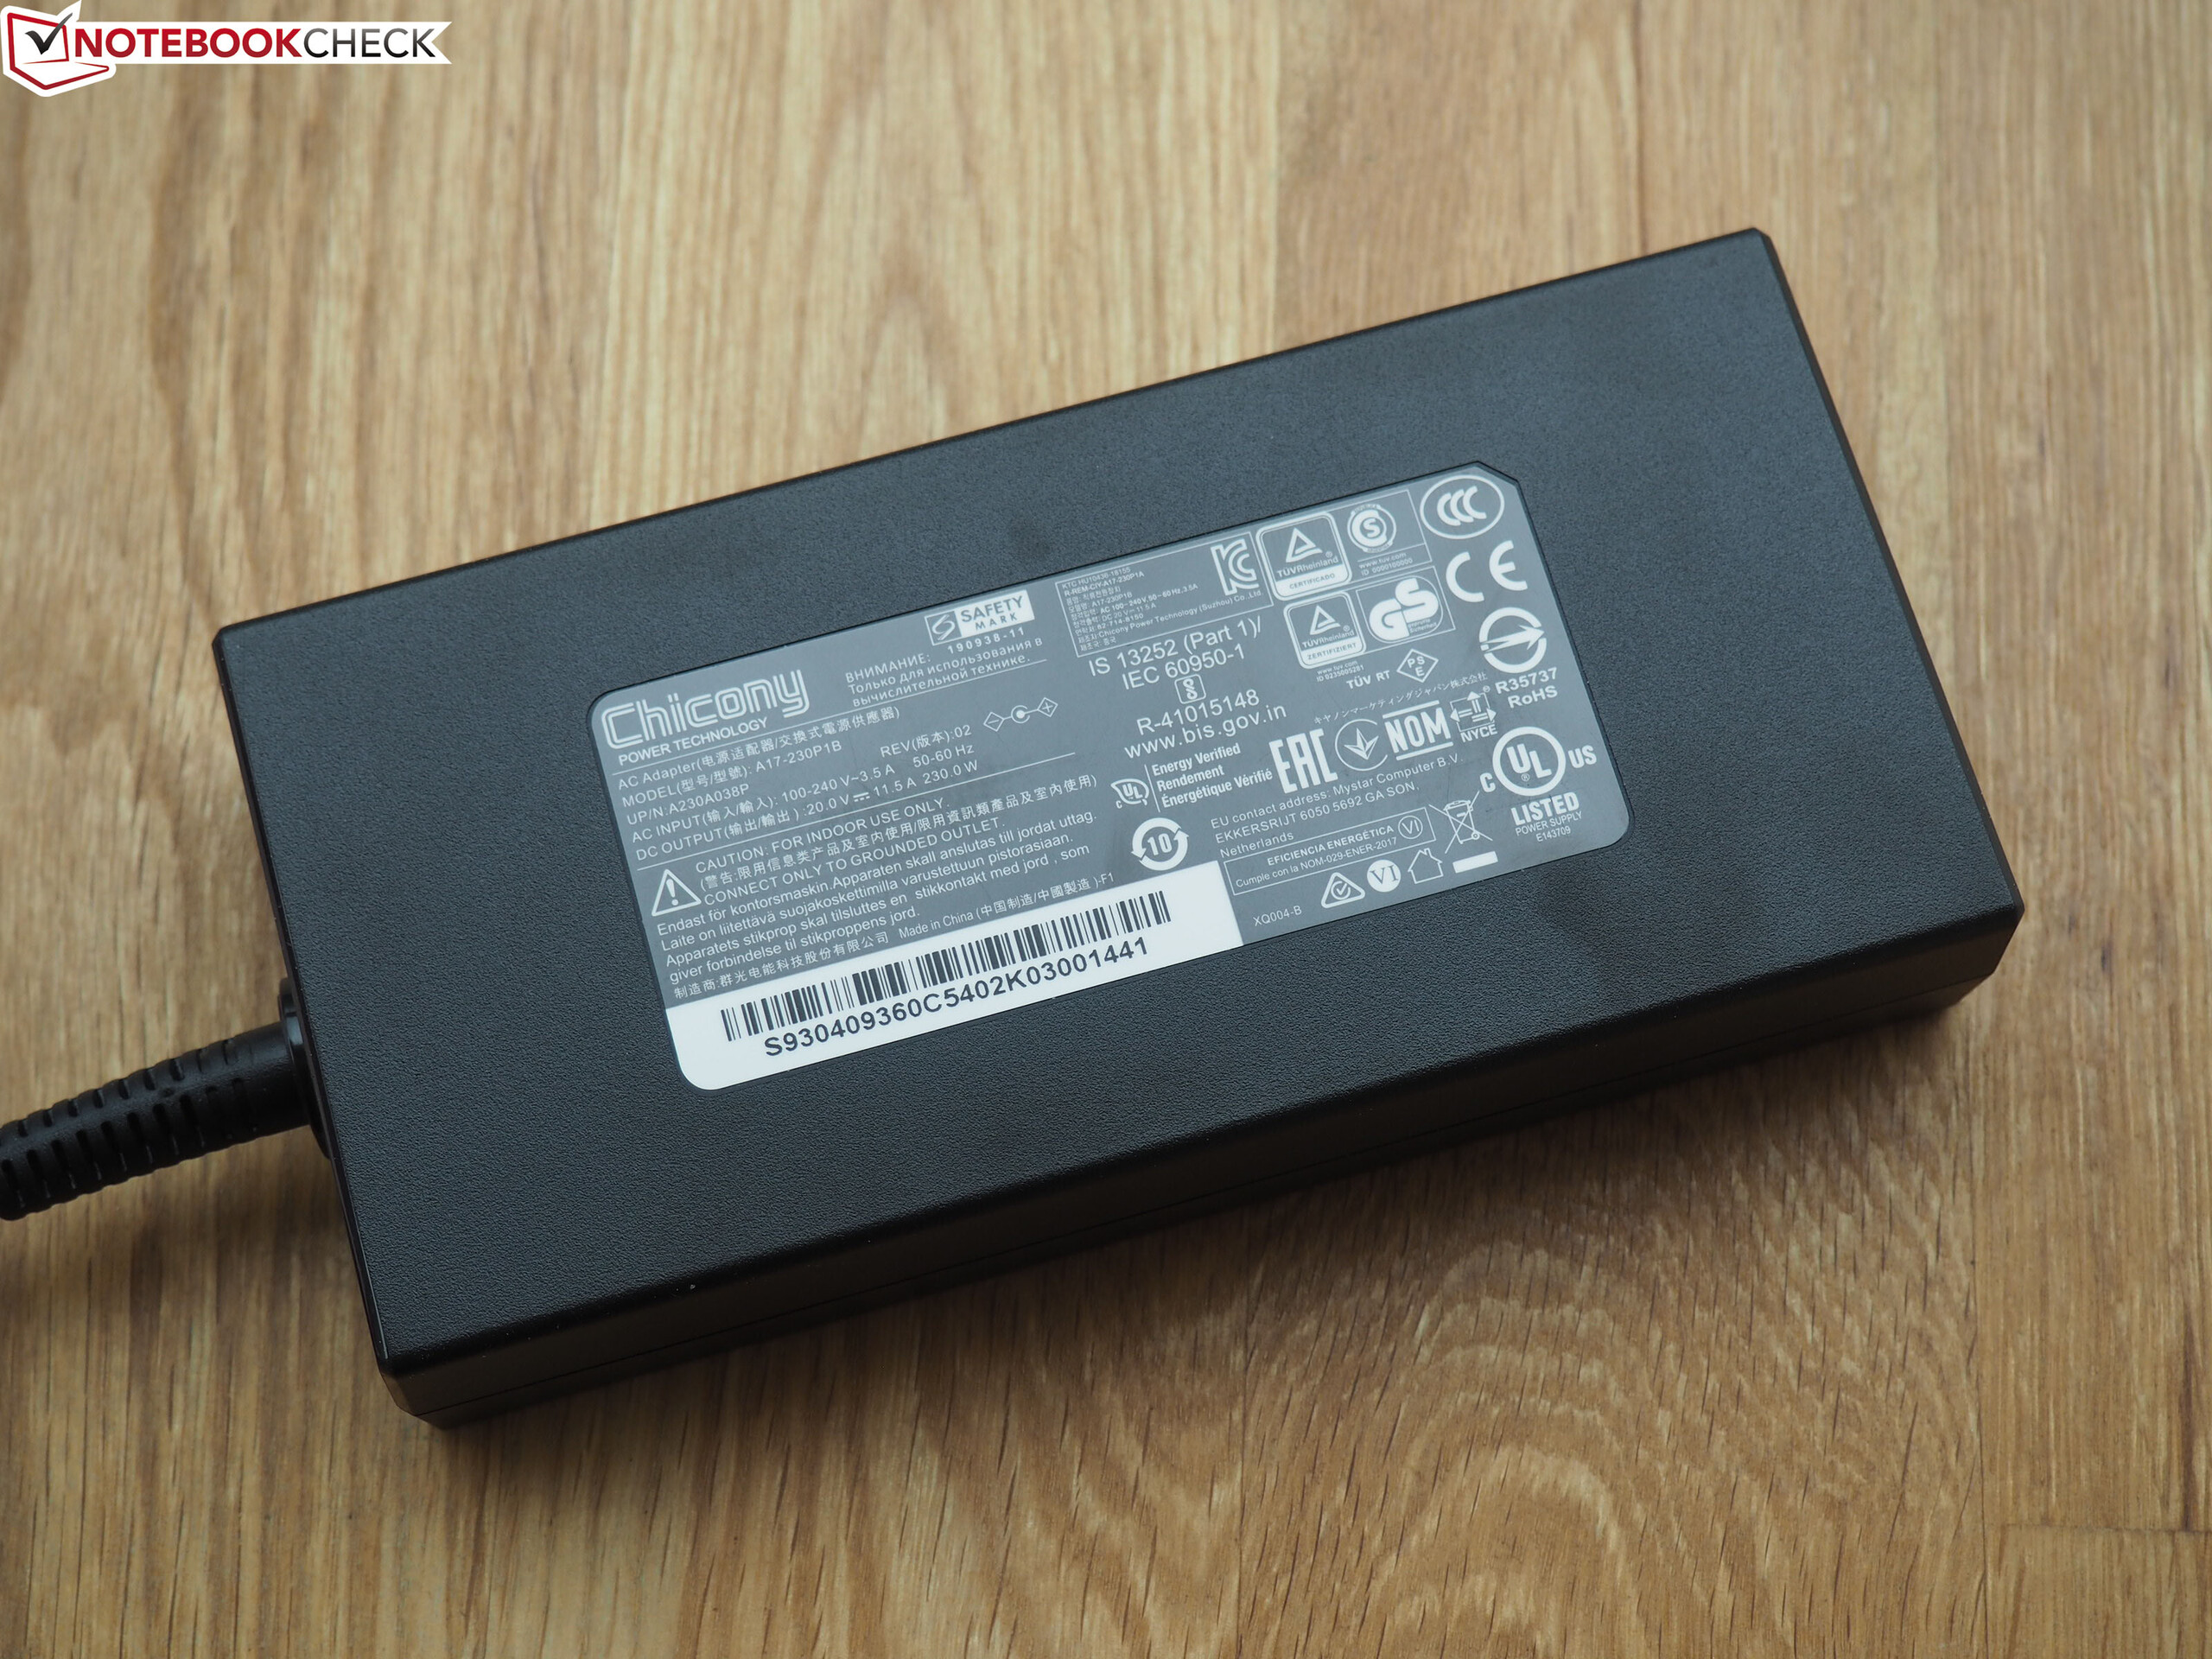
In terms of accessories, MSI only includes a few info booklets (quick start guide, etc.) with the notebook. The size and power of the power supply depend on the graphics card used. Starting from the RTX 2070 Super Max-Q, a 230-Watt model is used (180 Watt @RTX 2060).
Maintenance
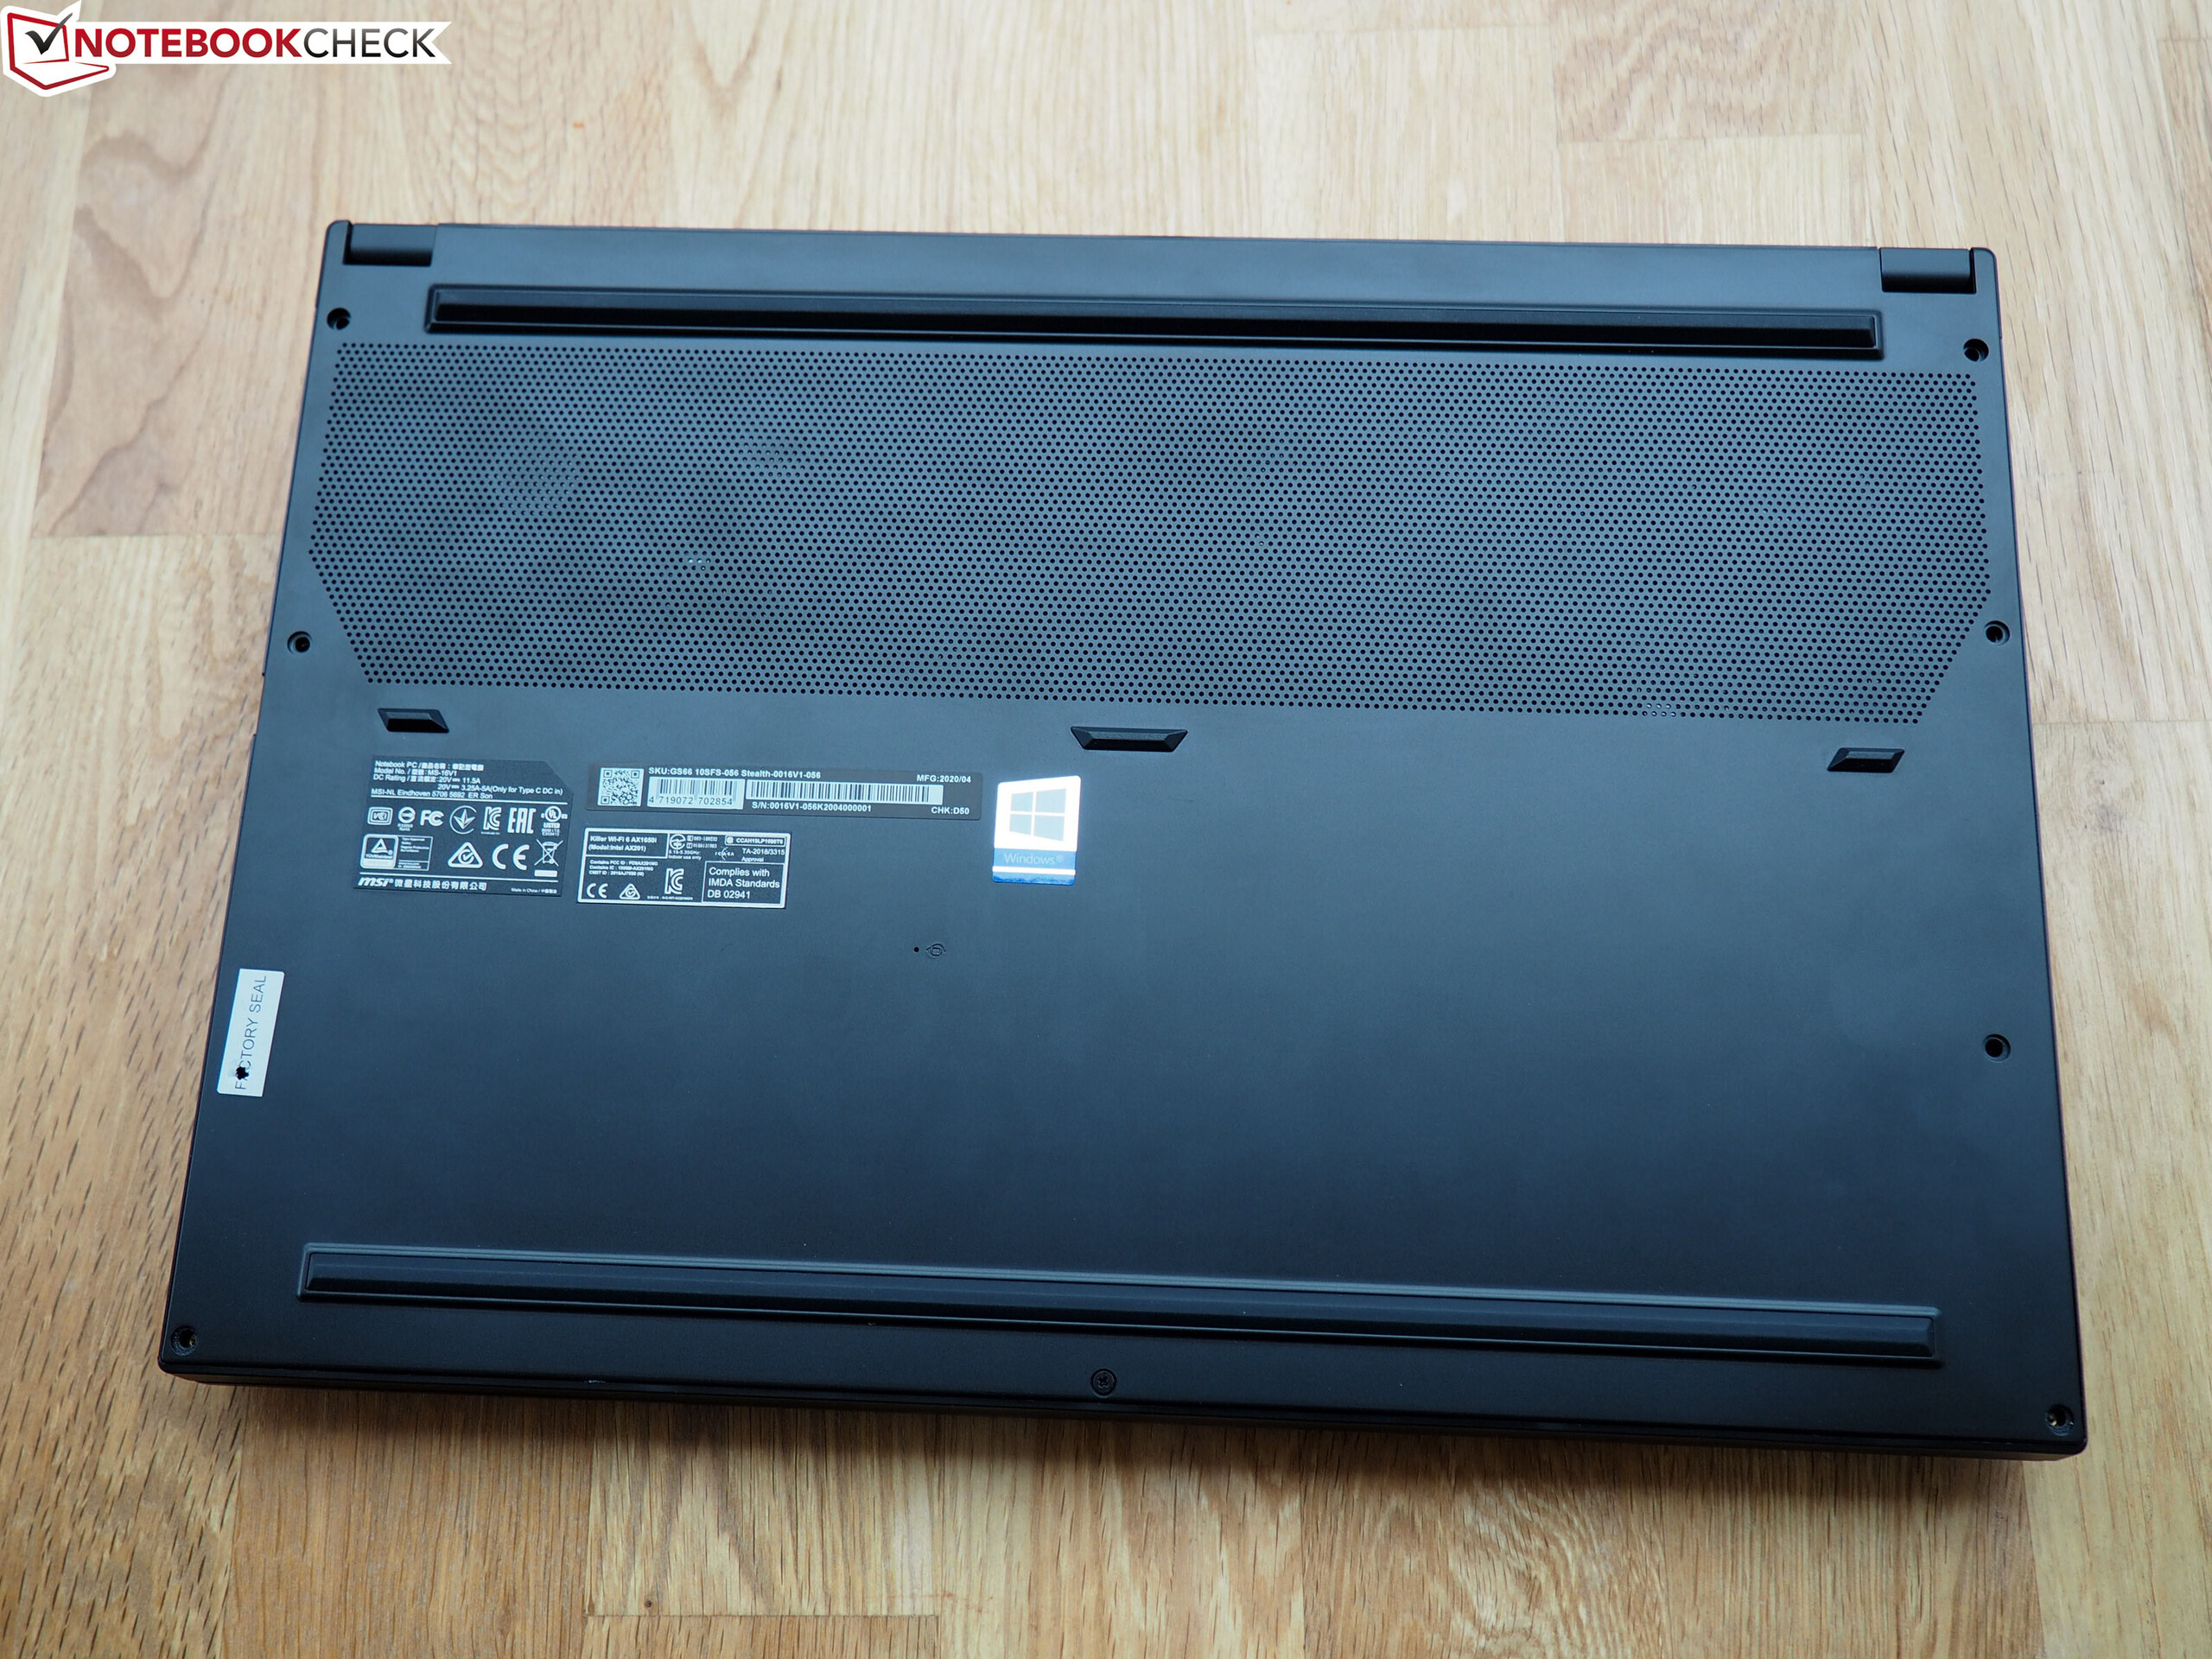
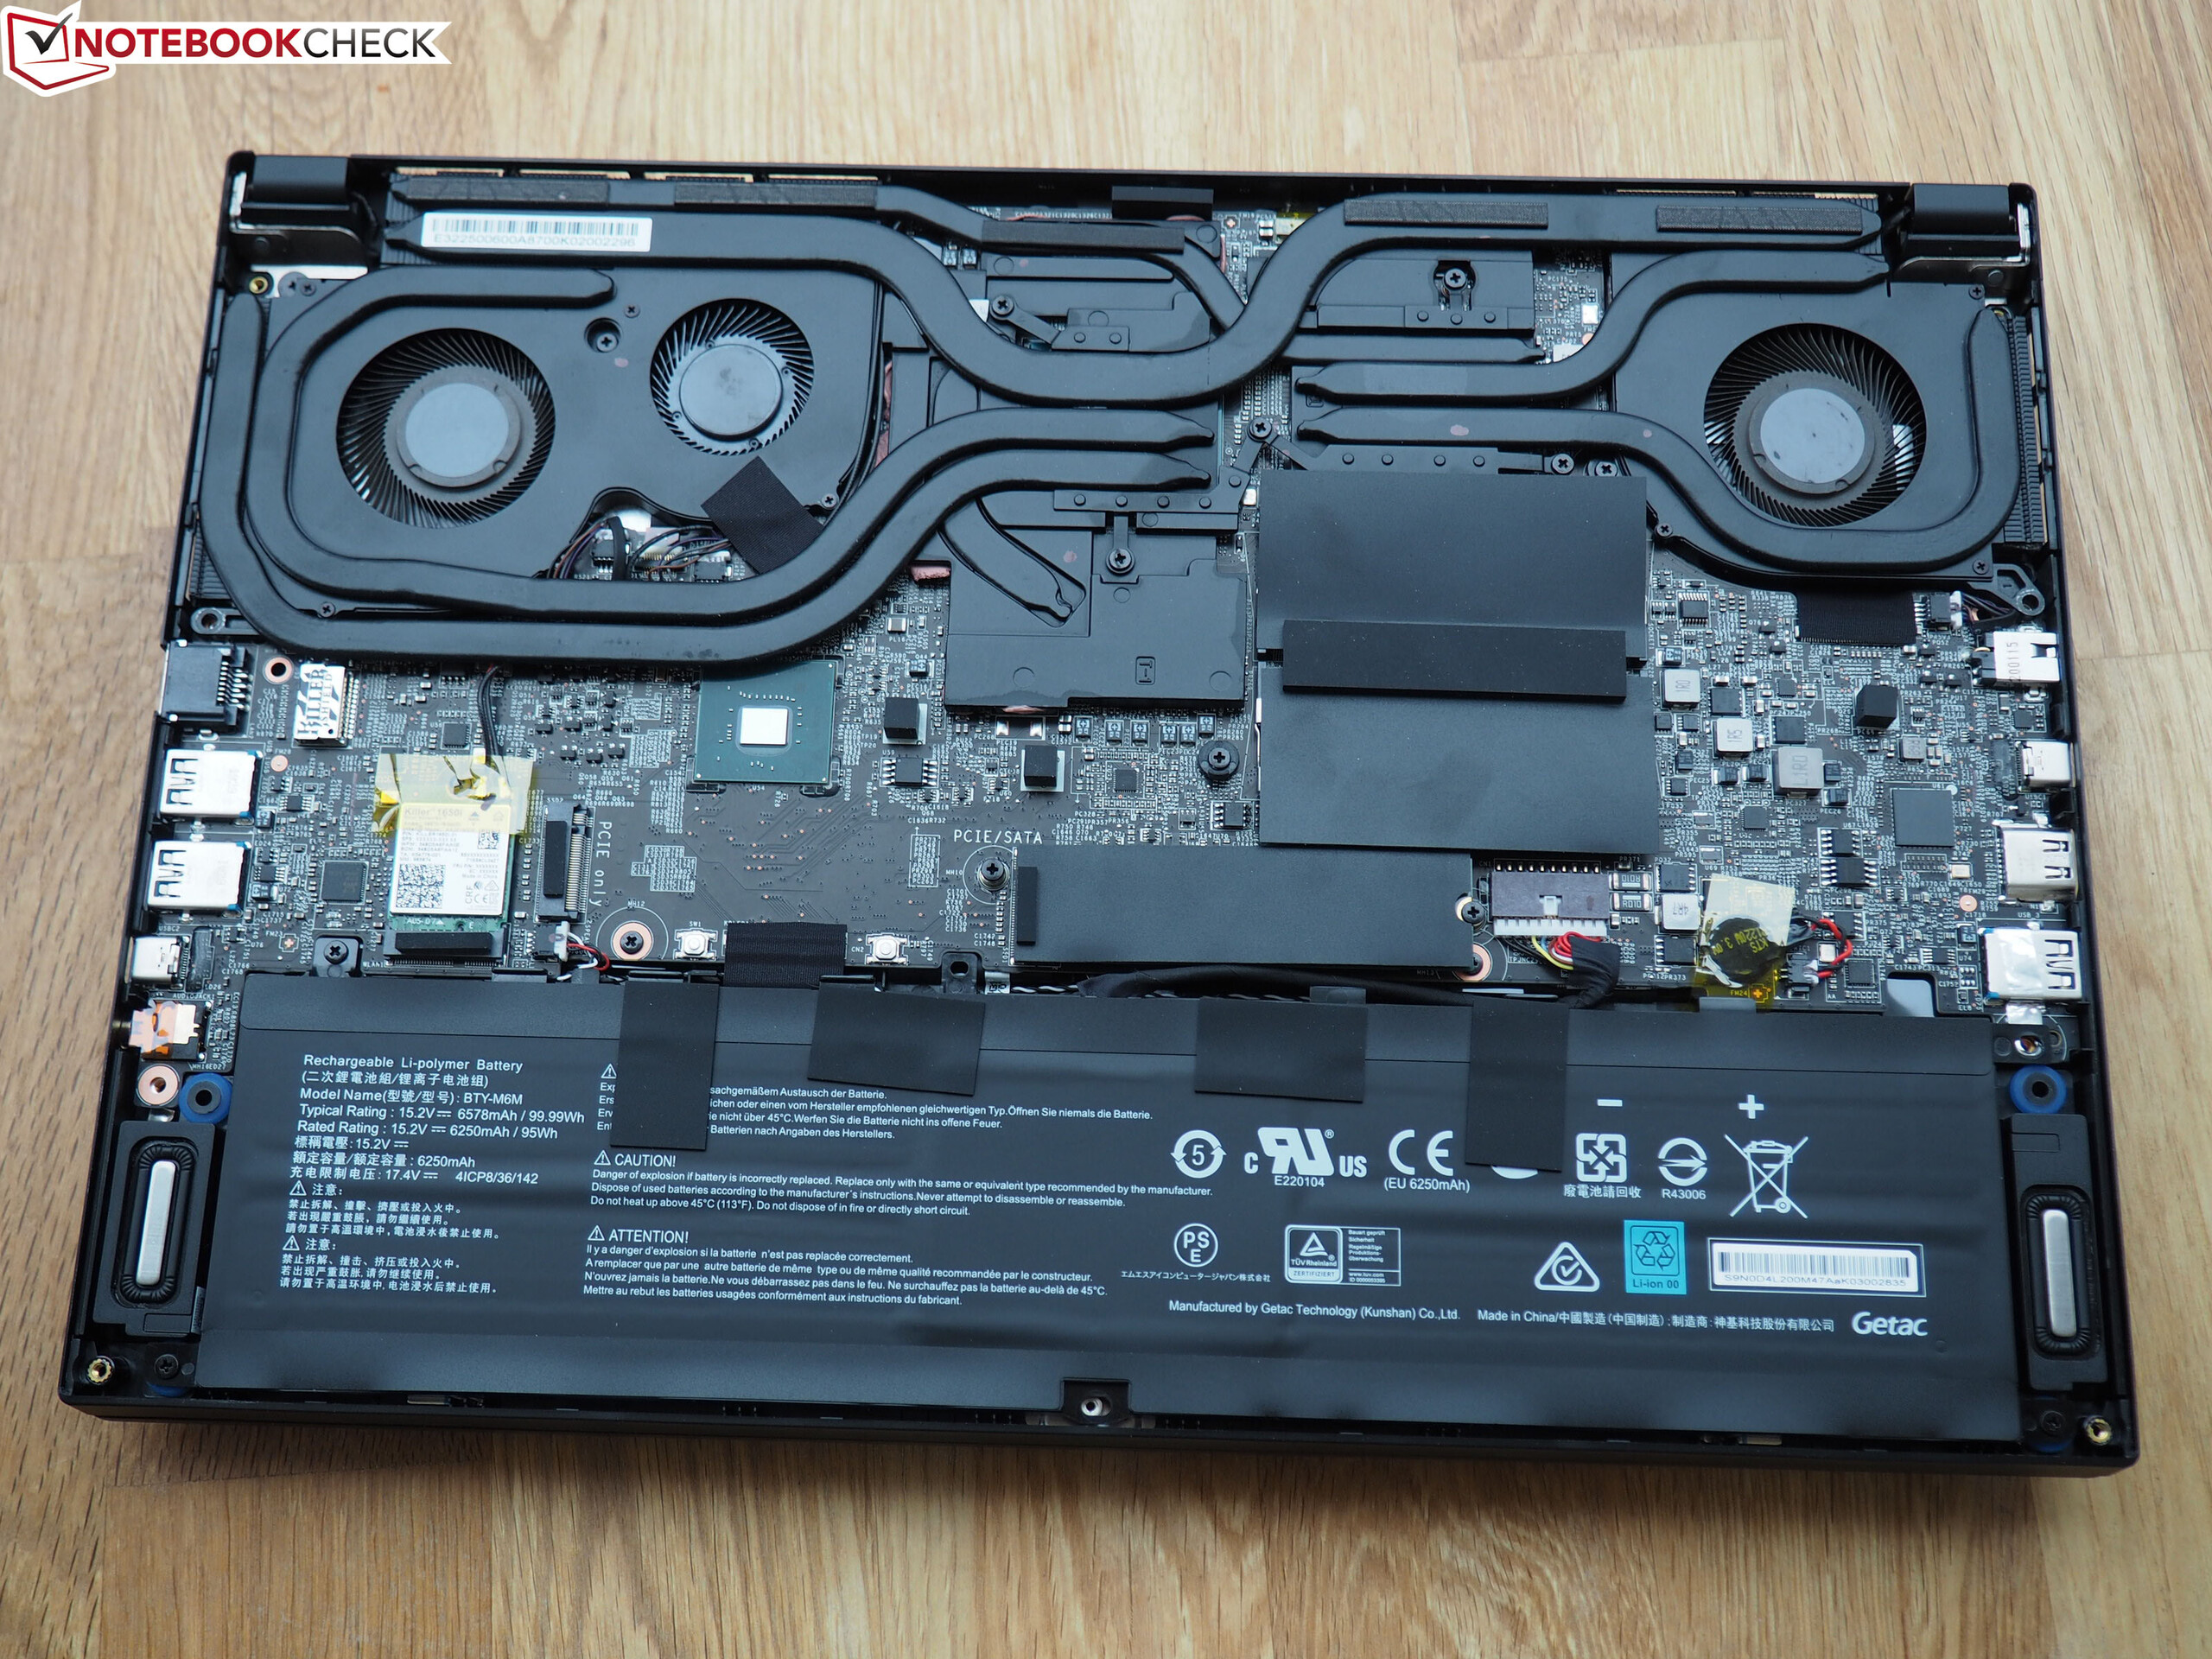
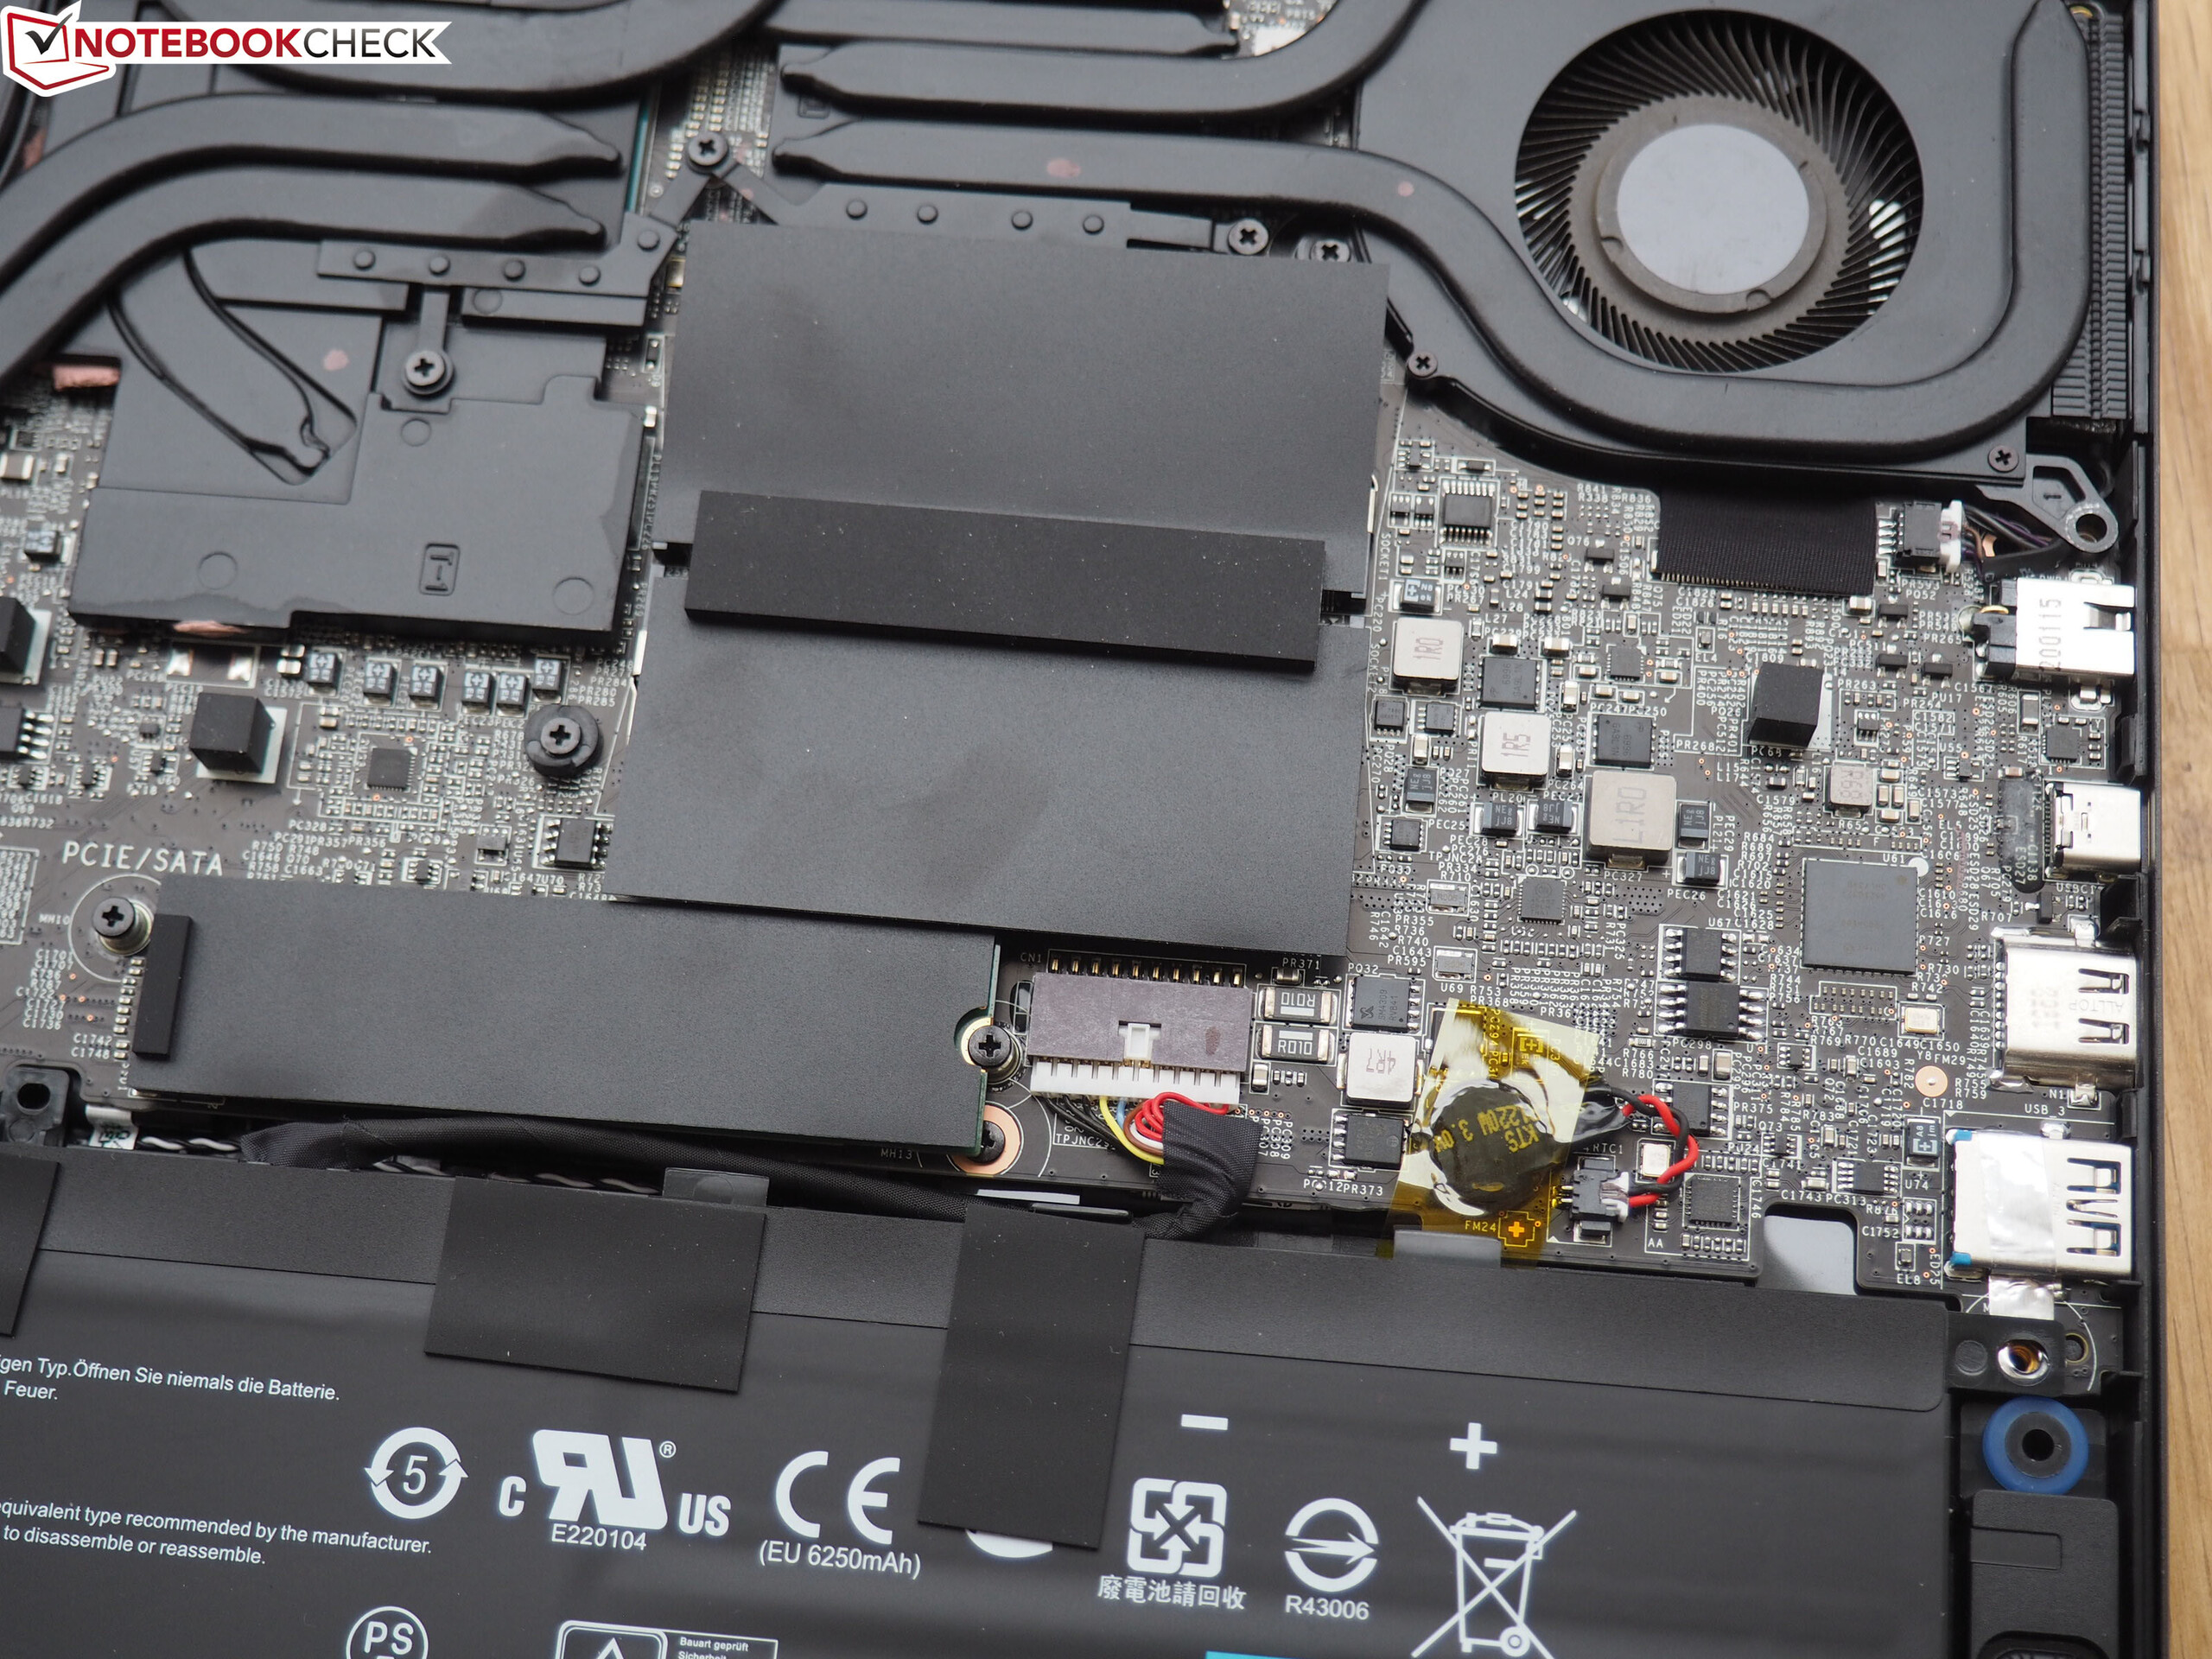
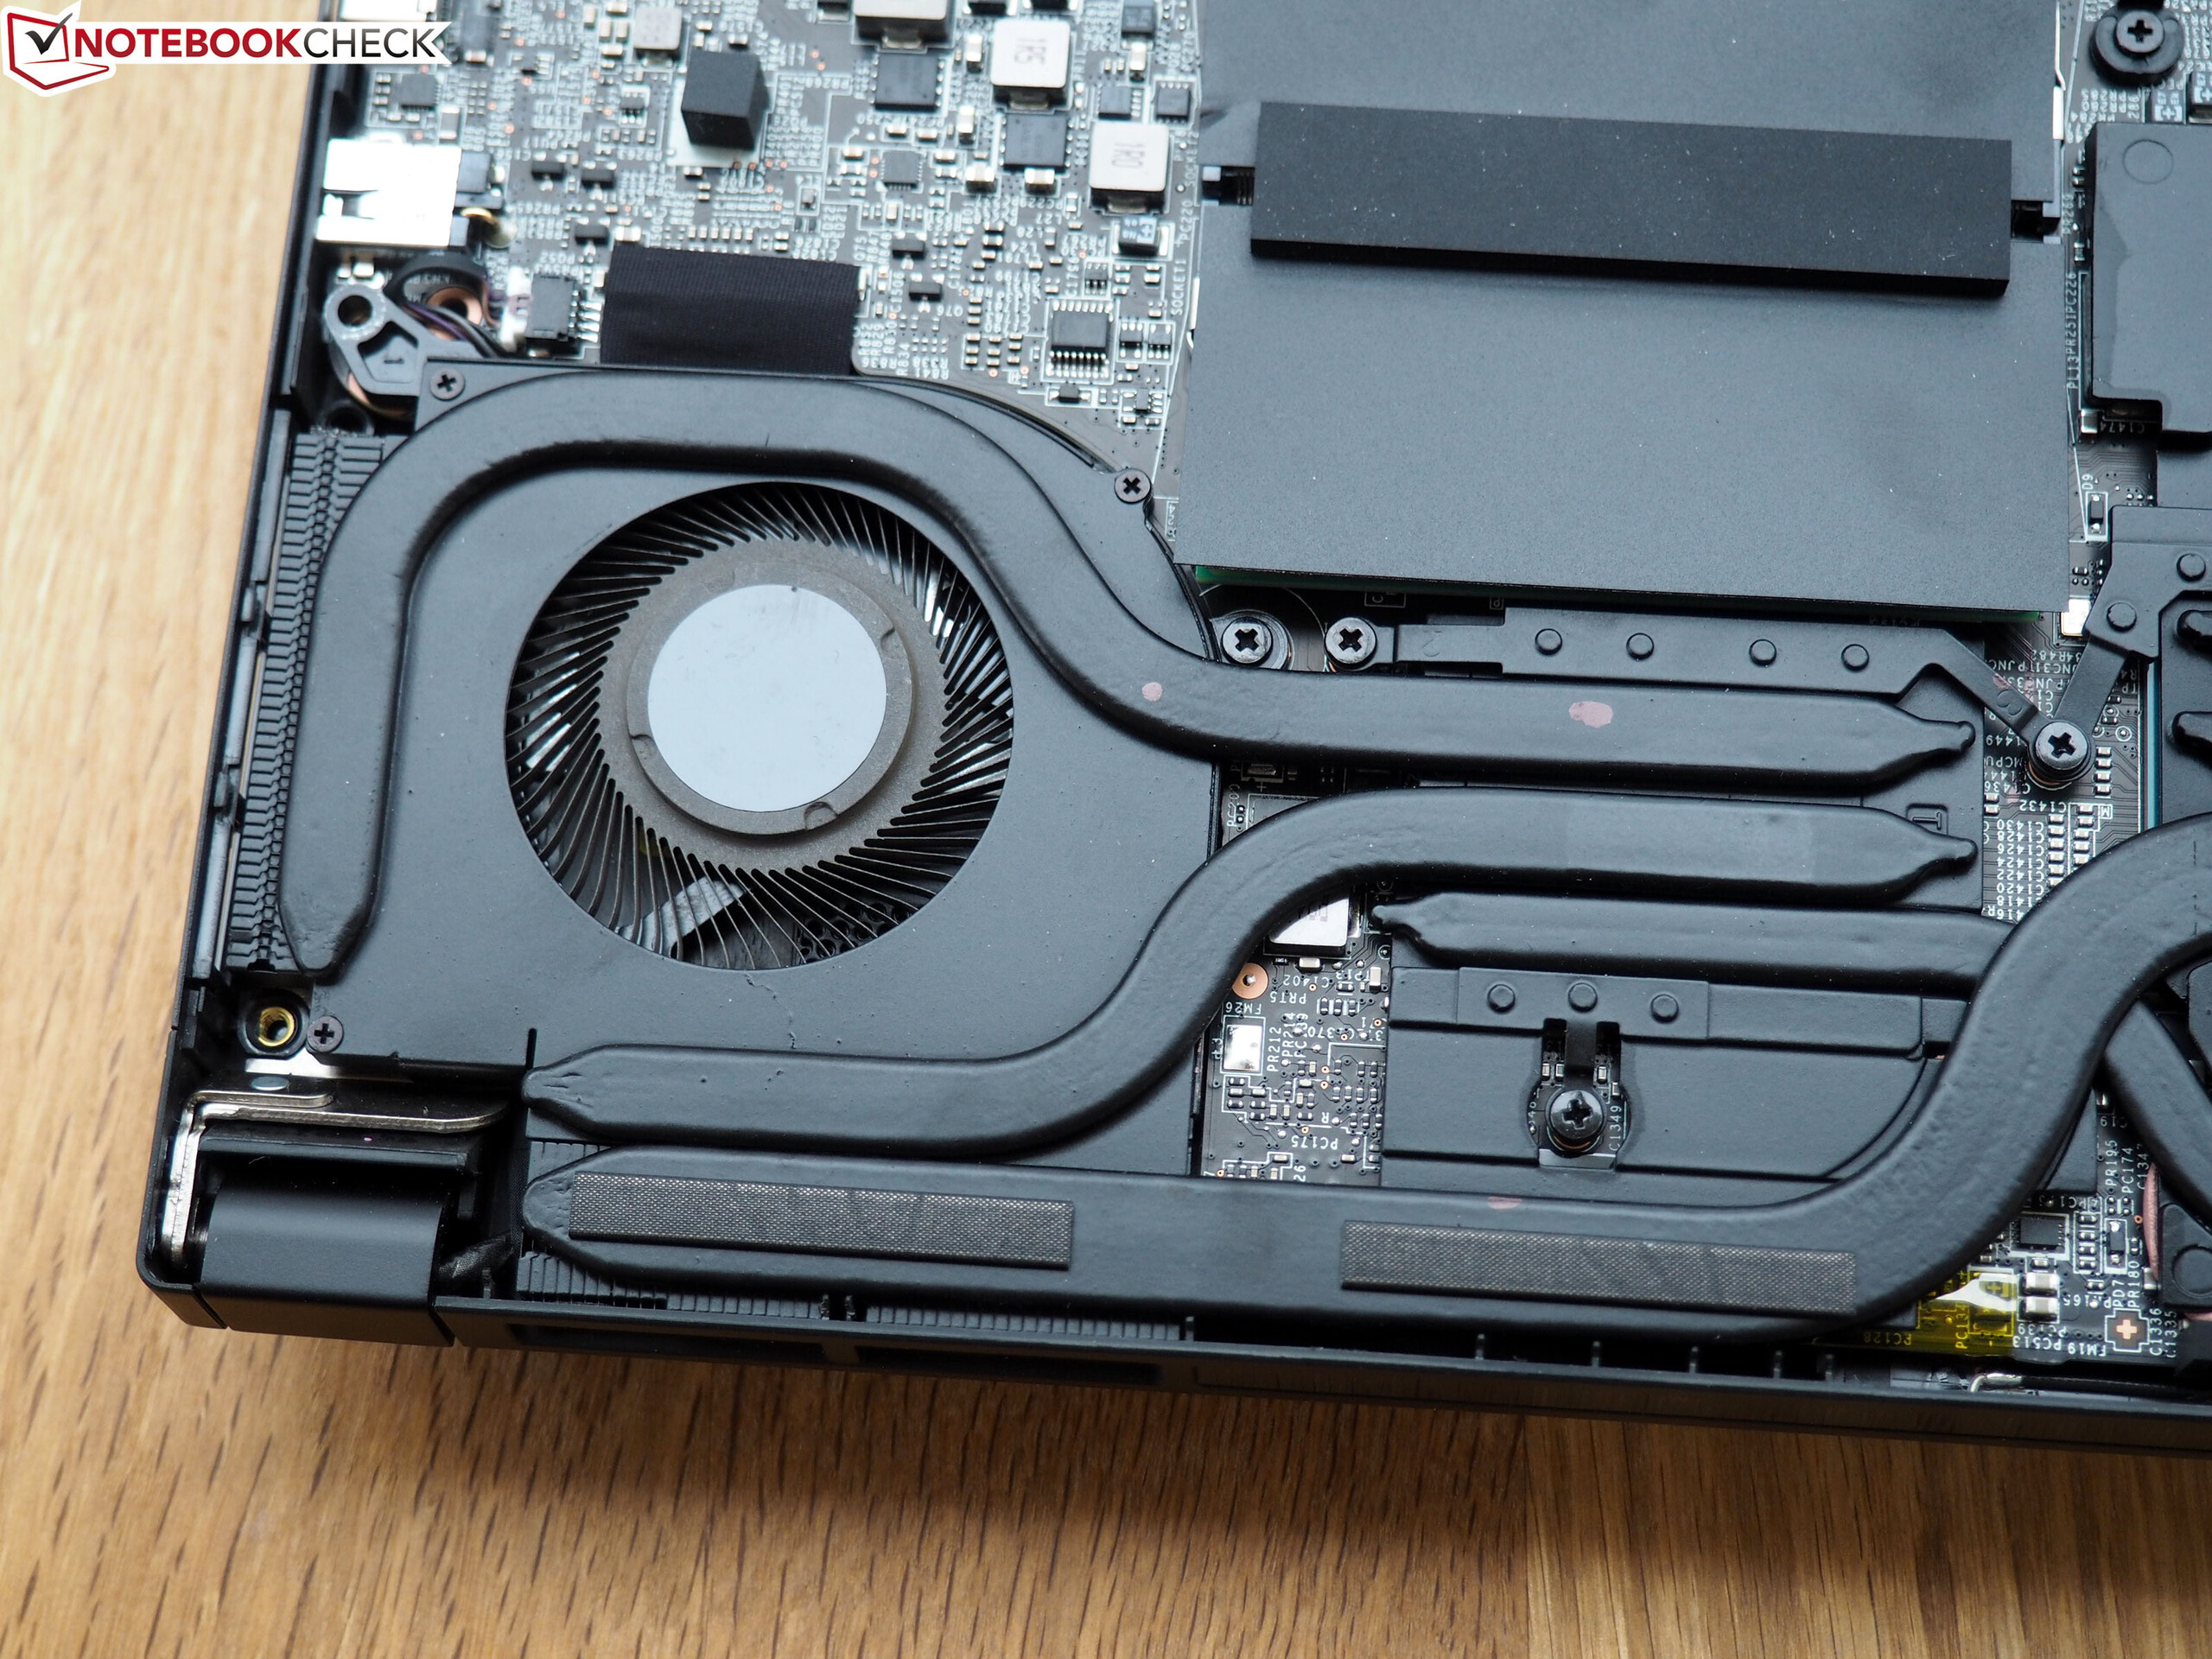
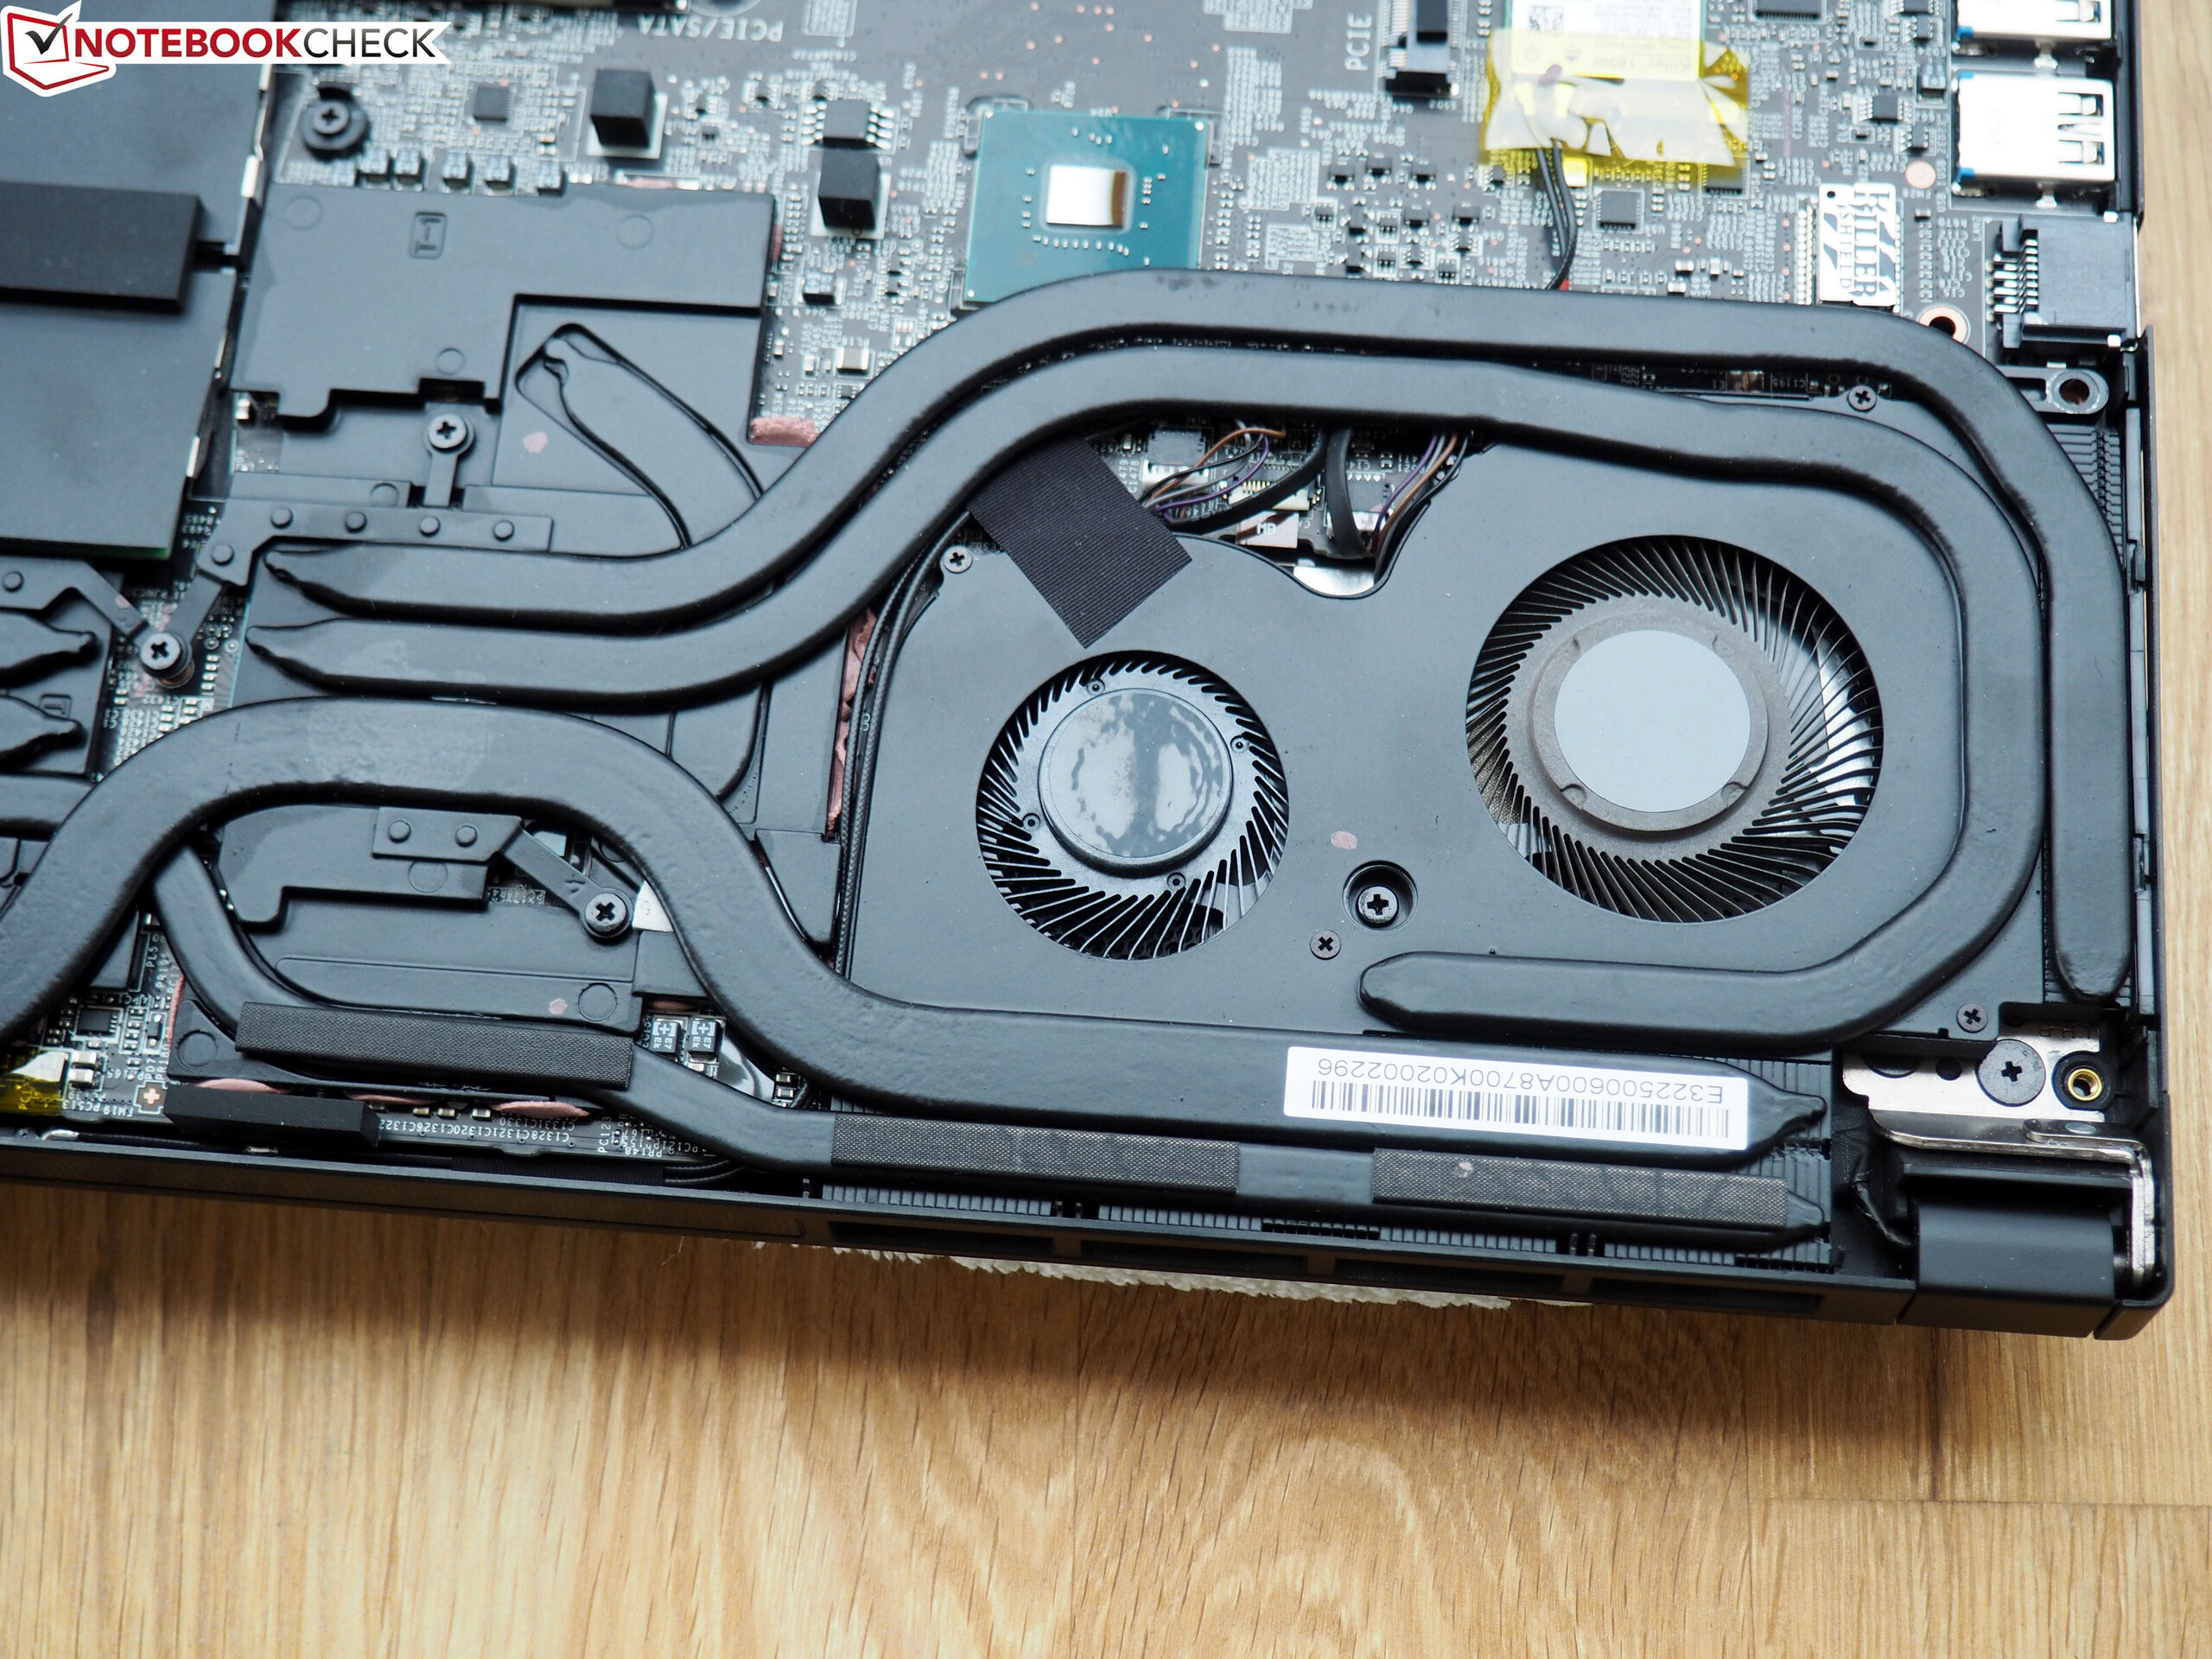
In addition to the stability of the case, the maintenance options have also improved significantly. Where in the GS65 only the fans, the Wi-Fi chip, and the battery were accessible, in the GS66 you can now also access the storage slots (2x M.2), the RAM slots (2x SO-DIMM), and the cooling system. The latter consists of one fan for the CPU and two fans for the GPU, with some heat pipes going across both components, so the cooling is not completely separated.
However, in order to remove the bottom of the case, a certain amount of skill and force is necessary. After you have removed 9 Philips screws from the bottom of the case, you have to pry it off its moorings with a fine tool such as a spatula, which might deter some non-professionals.
Input Devices
Keyboard
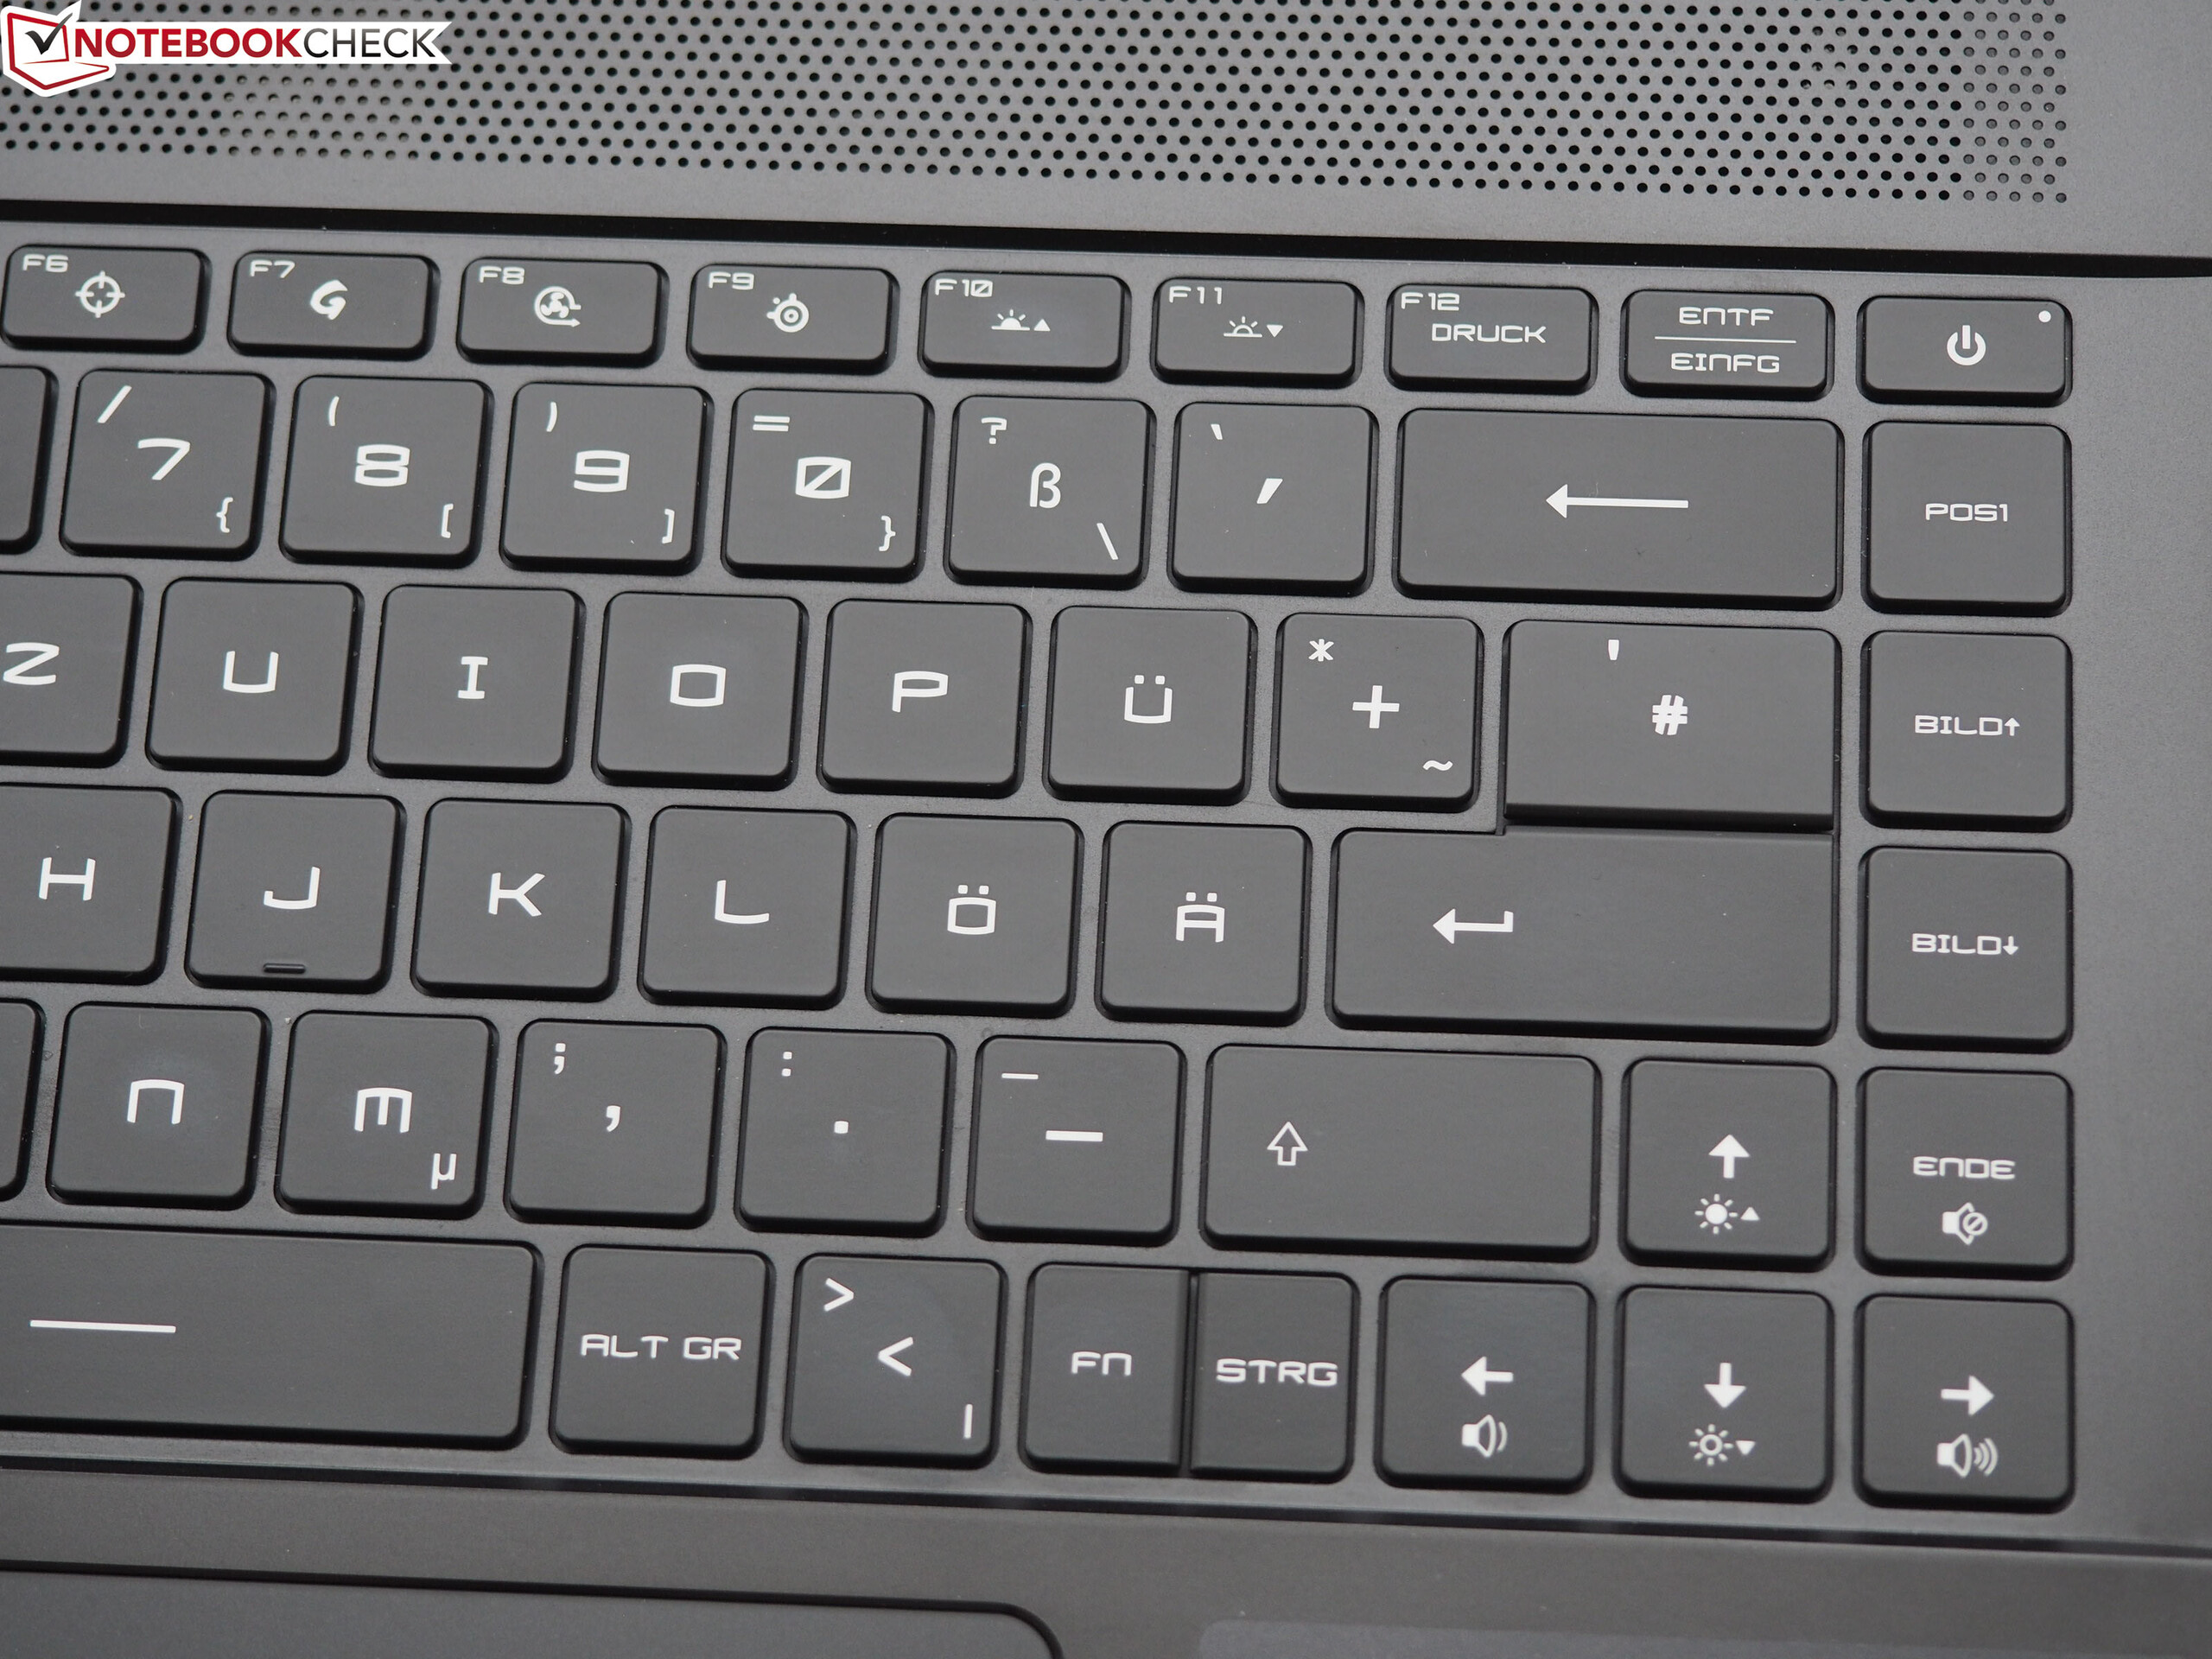
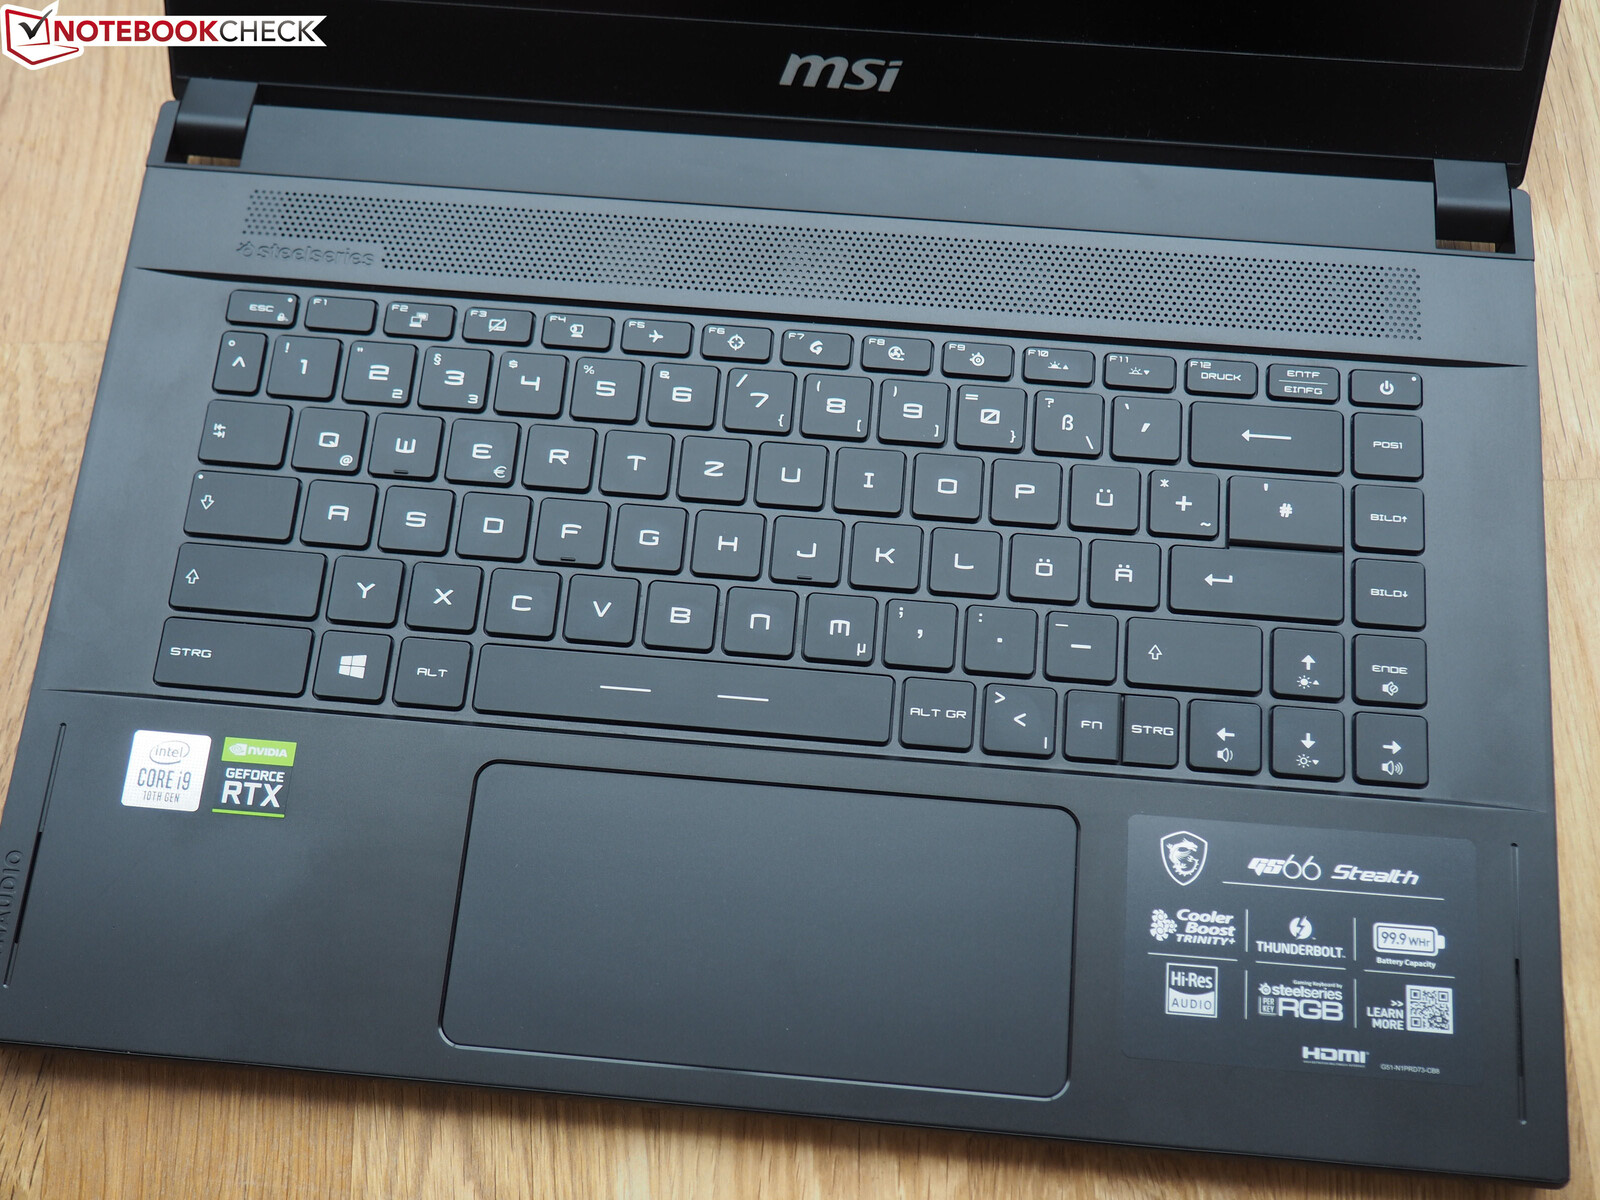
The keyboard produced some mixed feelings in the tester. As we know from MSI, the layout does not follow the German standard, but was optimized for gaming. For example, the "<>|" key is in an unusual place. The fact that Insert and Delete share a key is also less than optimal. It is also questionable that compared to the predecessor, the space key was moved slightly to the right, which leads to uncomfortably small and connected Fn and Ctrl keys (see pictures). These peculiarities require quite some time to get used to.
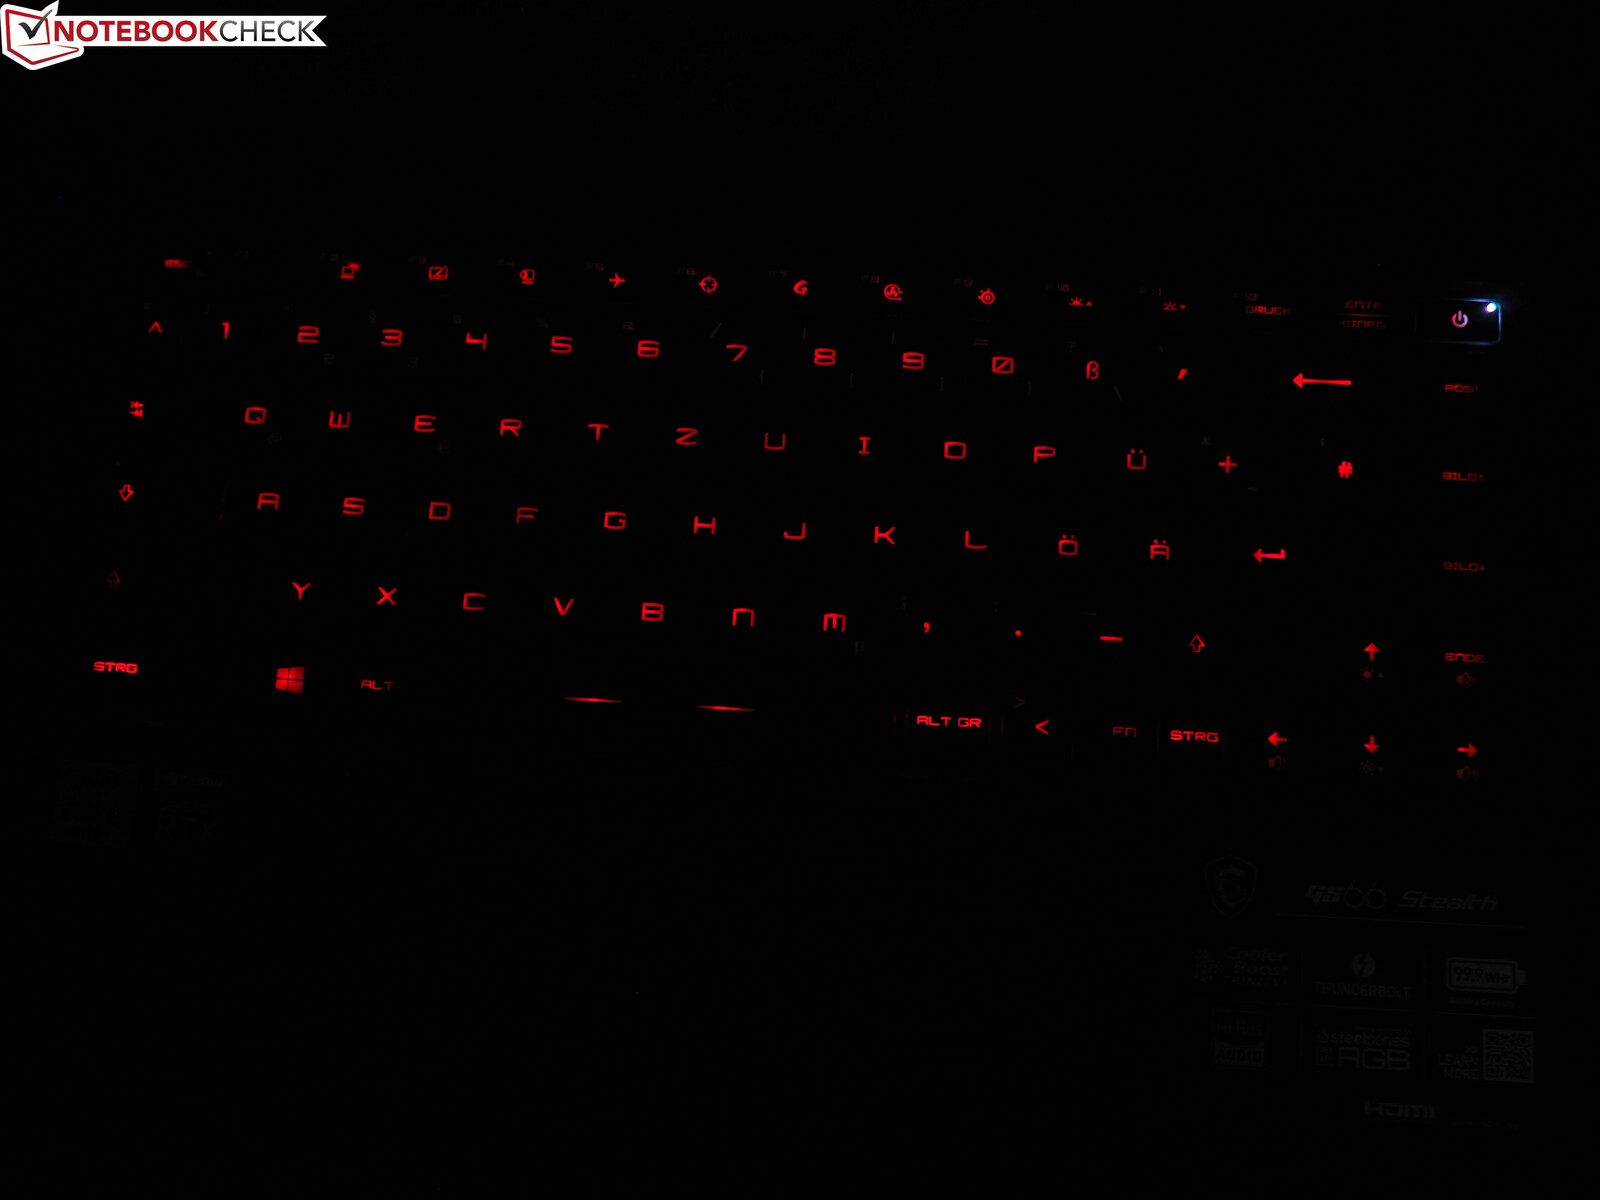
On the other hand, we liked the typing experience, where a comfortable pressure is combined with sufficient feedback. Since the keyboard and touchpad are not very quiet while inputting, the GS66 is only suited to a limited extent for quiet surroundings such as libraries. The greatest highlights of the keyboard include the multi-step RGB illumination. However, it could have been a tad brighter for our taste. Those who don't like a light show (various modes are available) can simply choose a color.
Touchpad
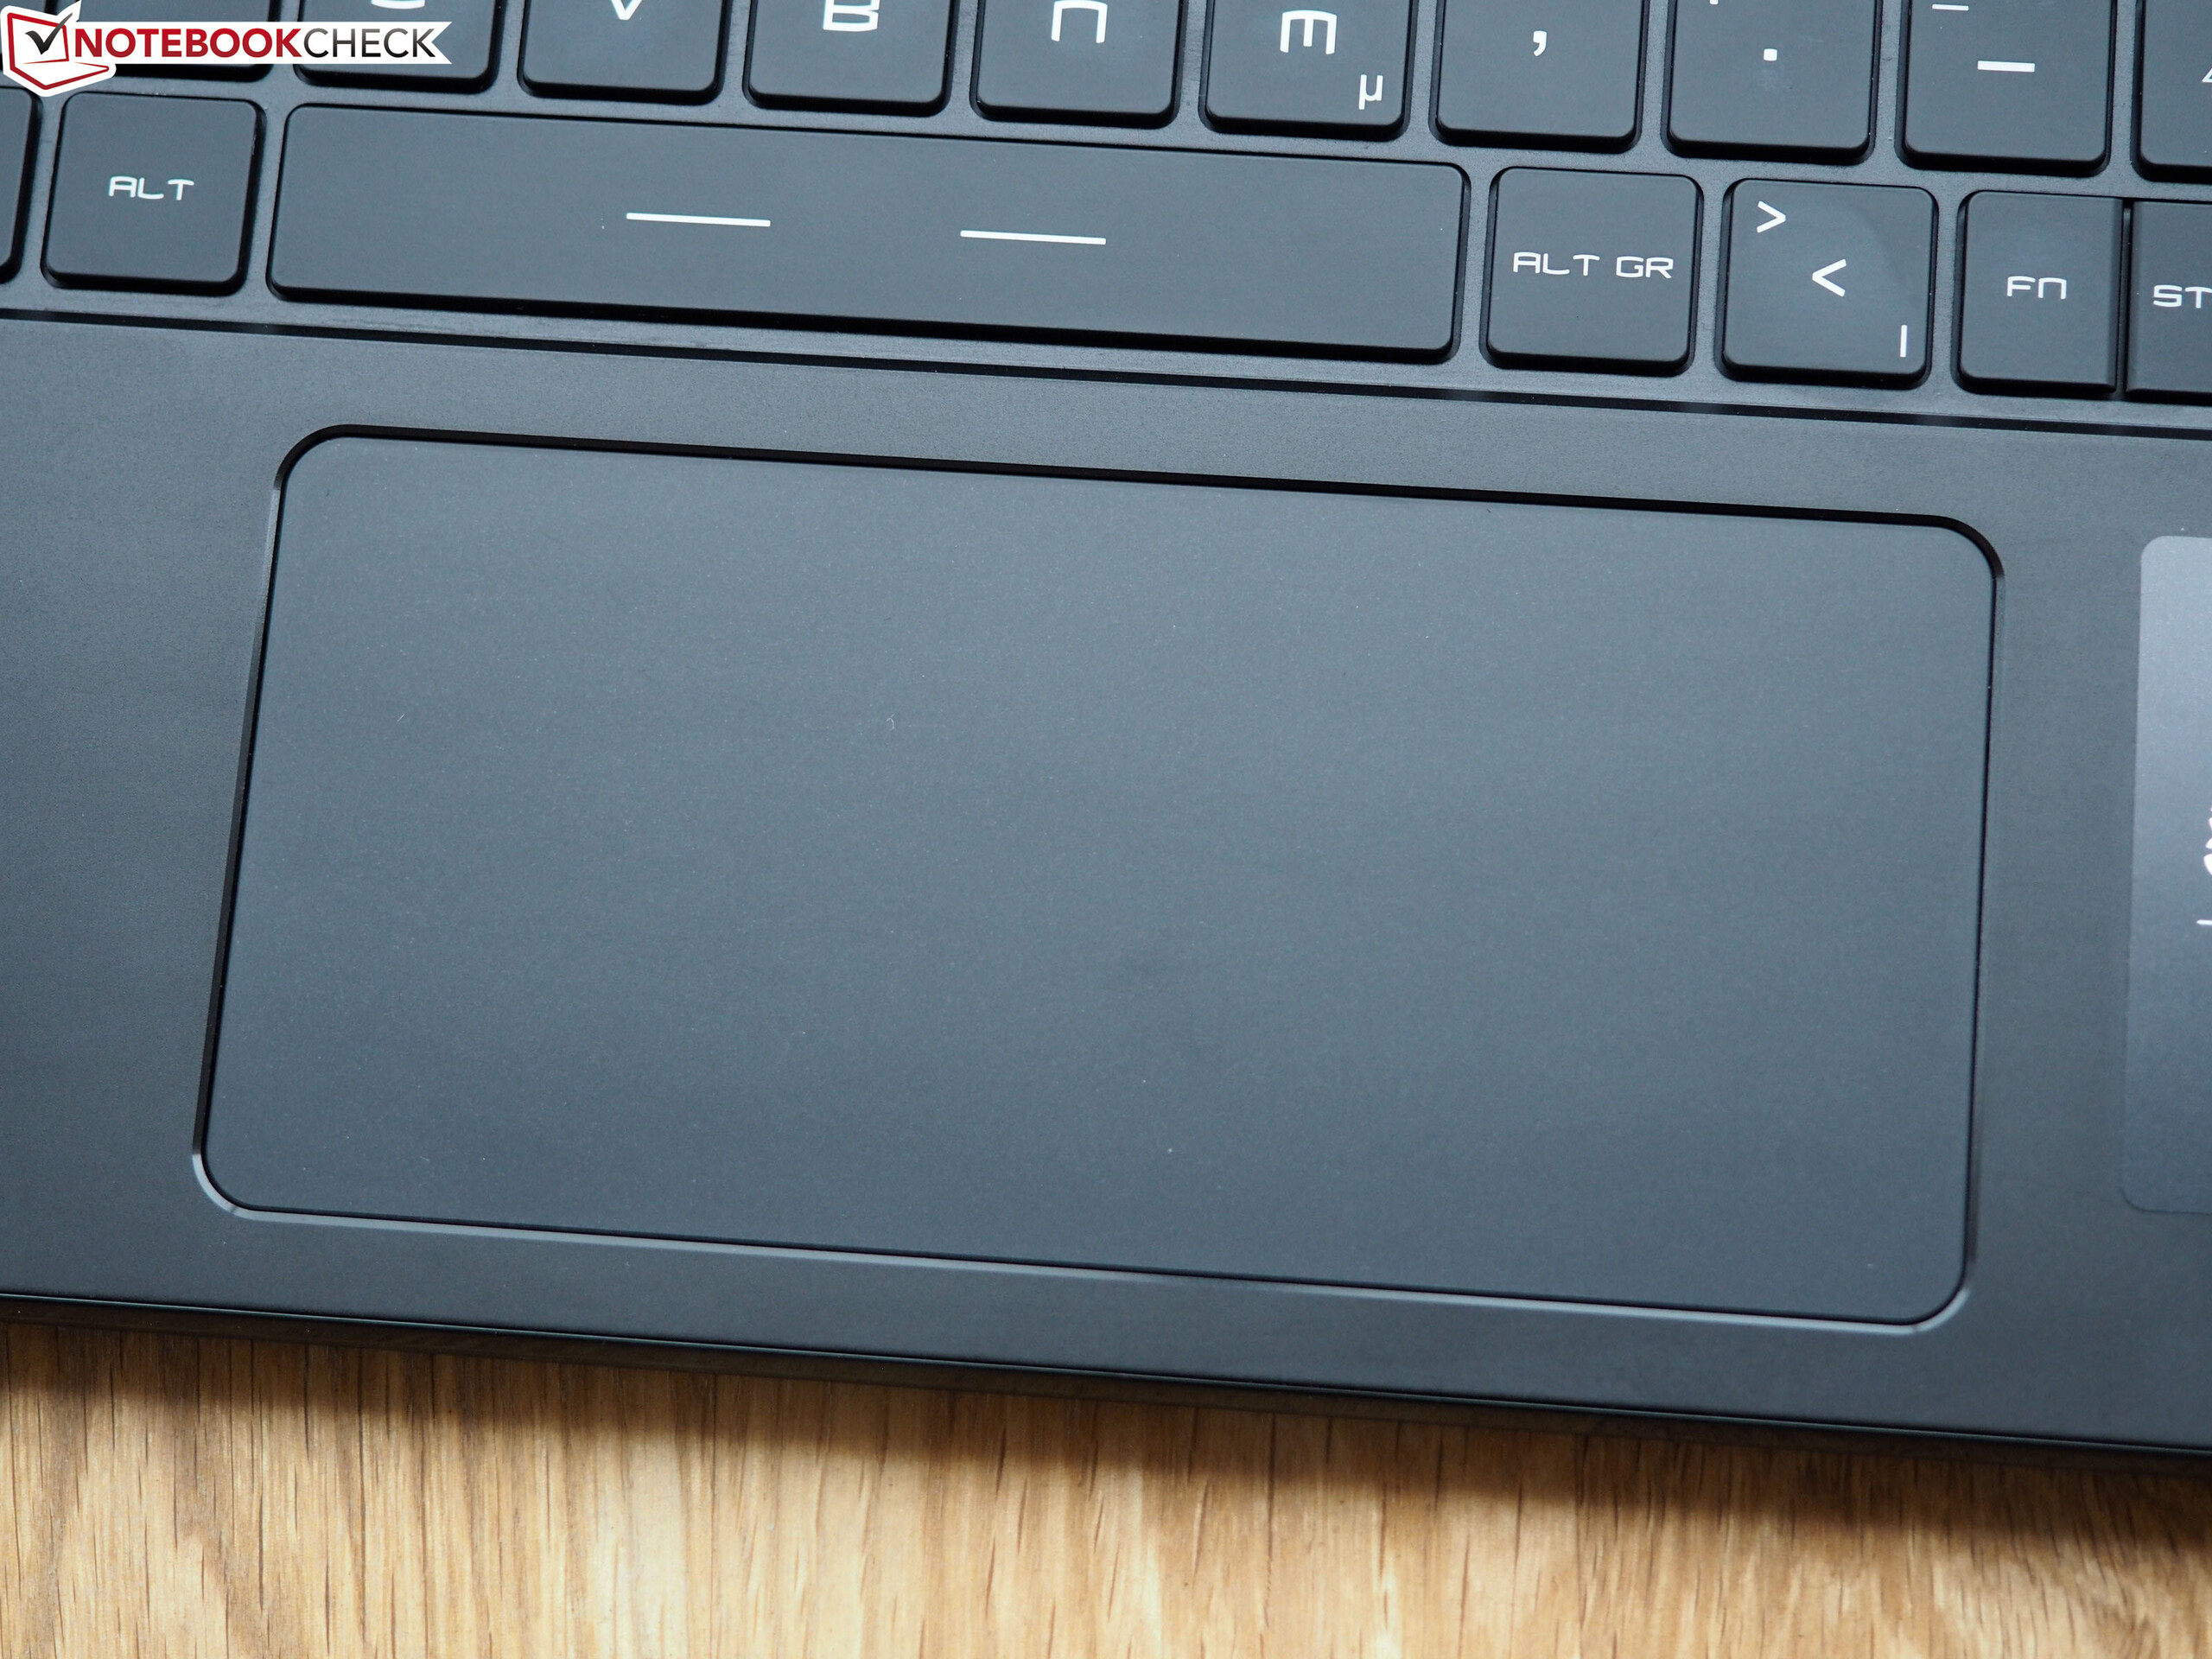
With the touchpad, MSI also stands out from the crowd. A width of 14 cm (~5.5 in) is extremely generous for a 15-inch device. This allows also longer traces across the display to succeed without having to re-position the finger. In terms of its height, the mouse replacement only measures 6.5 cm (~2.6 in), which is a bit meager. Since the touchpad offers a decent stability and accepts inputs relatively accurately (except for the edge areas), the lack of the dedicated mouse keys is not too grave. There was also nothing too conspicuous in terms of the multi-touch support. 2-finger gestures such as zooming and scrolling were mostly recognized reliably during the test.
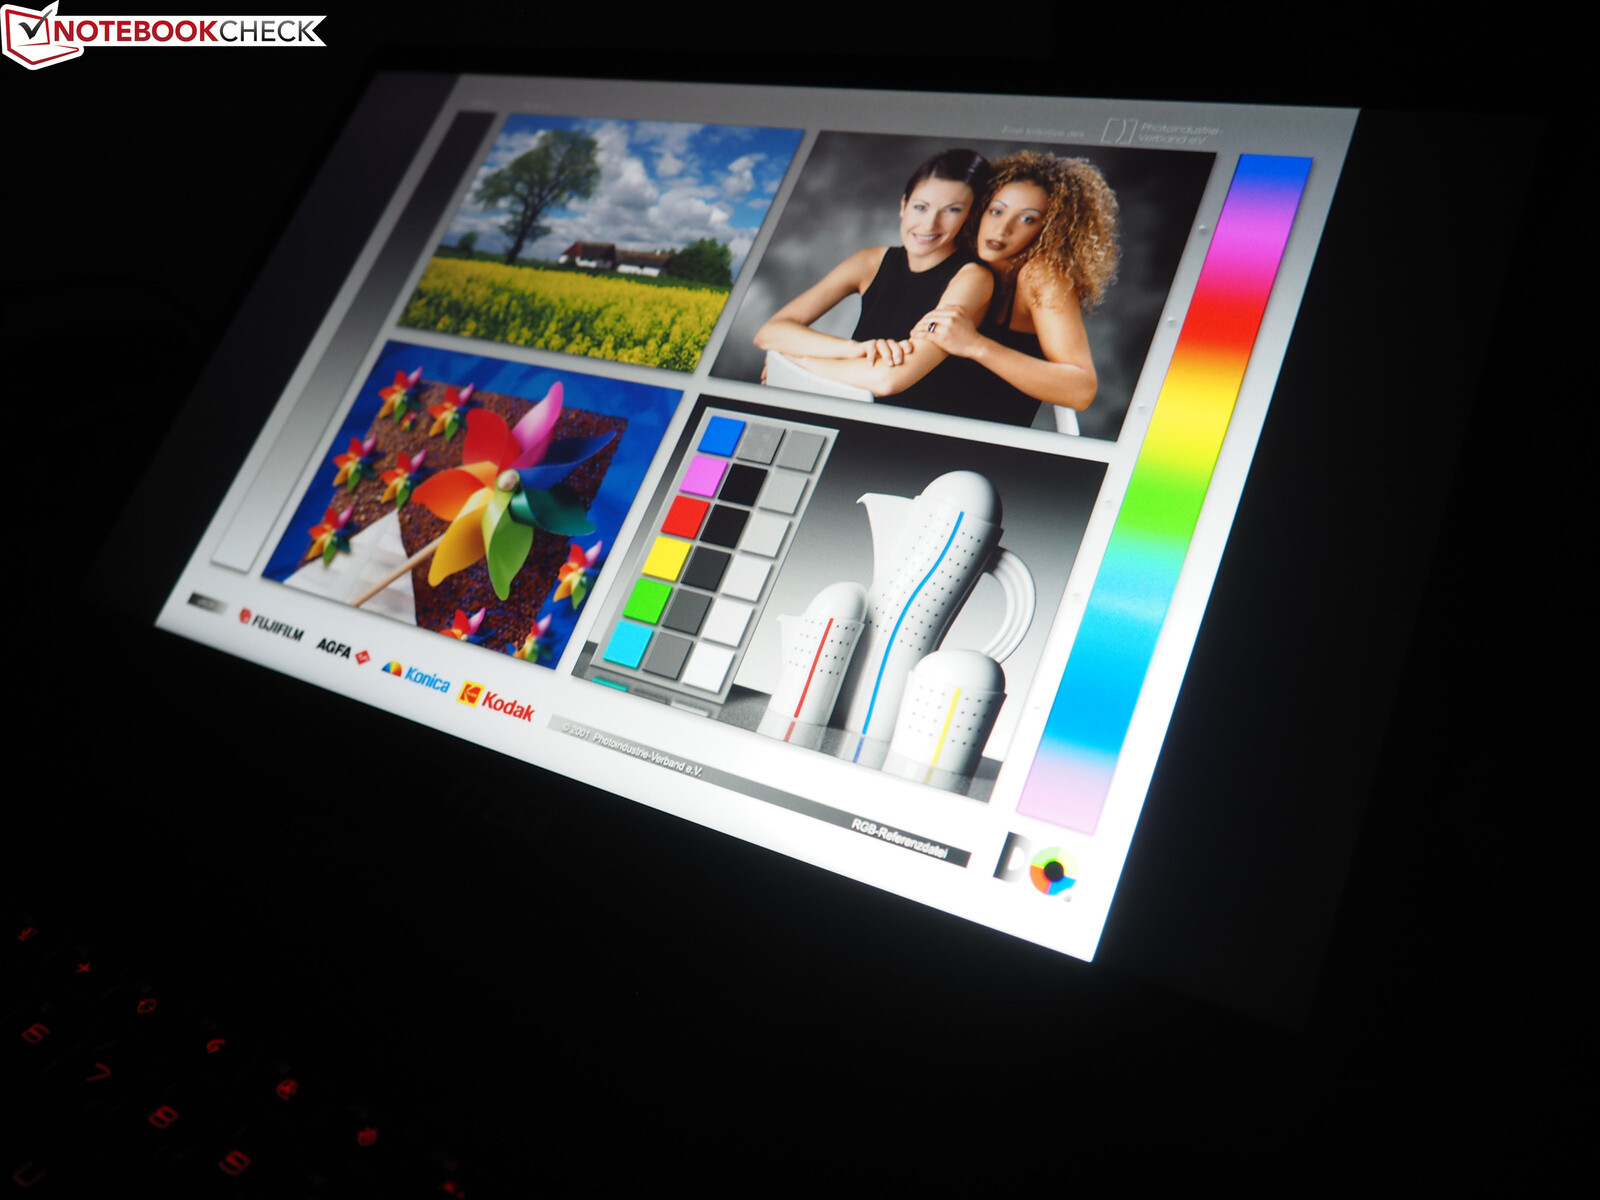
Display
After 144-Hz panels have dominated in gaming notebooks in 2019, the year 2020 is reigned by 240 and 300-Hz technology. Even though subjectively, these new frequency jumps are becoming less and less noticeable (the change from a 60-Hz to a 144-Hz display has a much more noticeable effect) and the graphics cards can only rarely supply the corresponding fps numbers, the 300-Hz screen of our test configuration still is some sort of purchase argument.
| |||||||||||||||||||||||||
Brightness Distribution: 92 %
Center on Battery: 316 cd/m²
Contrast: 1505:1 (Black: 0.21 cd/m²)
ΔE ColorChecker Calman: 3.03 | ∀{0.5-29.43 Ø4.72}
calibrated: 1.1
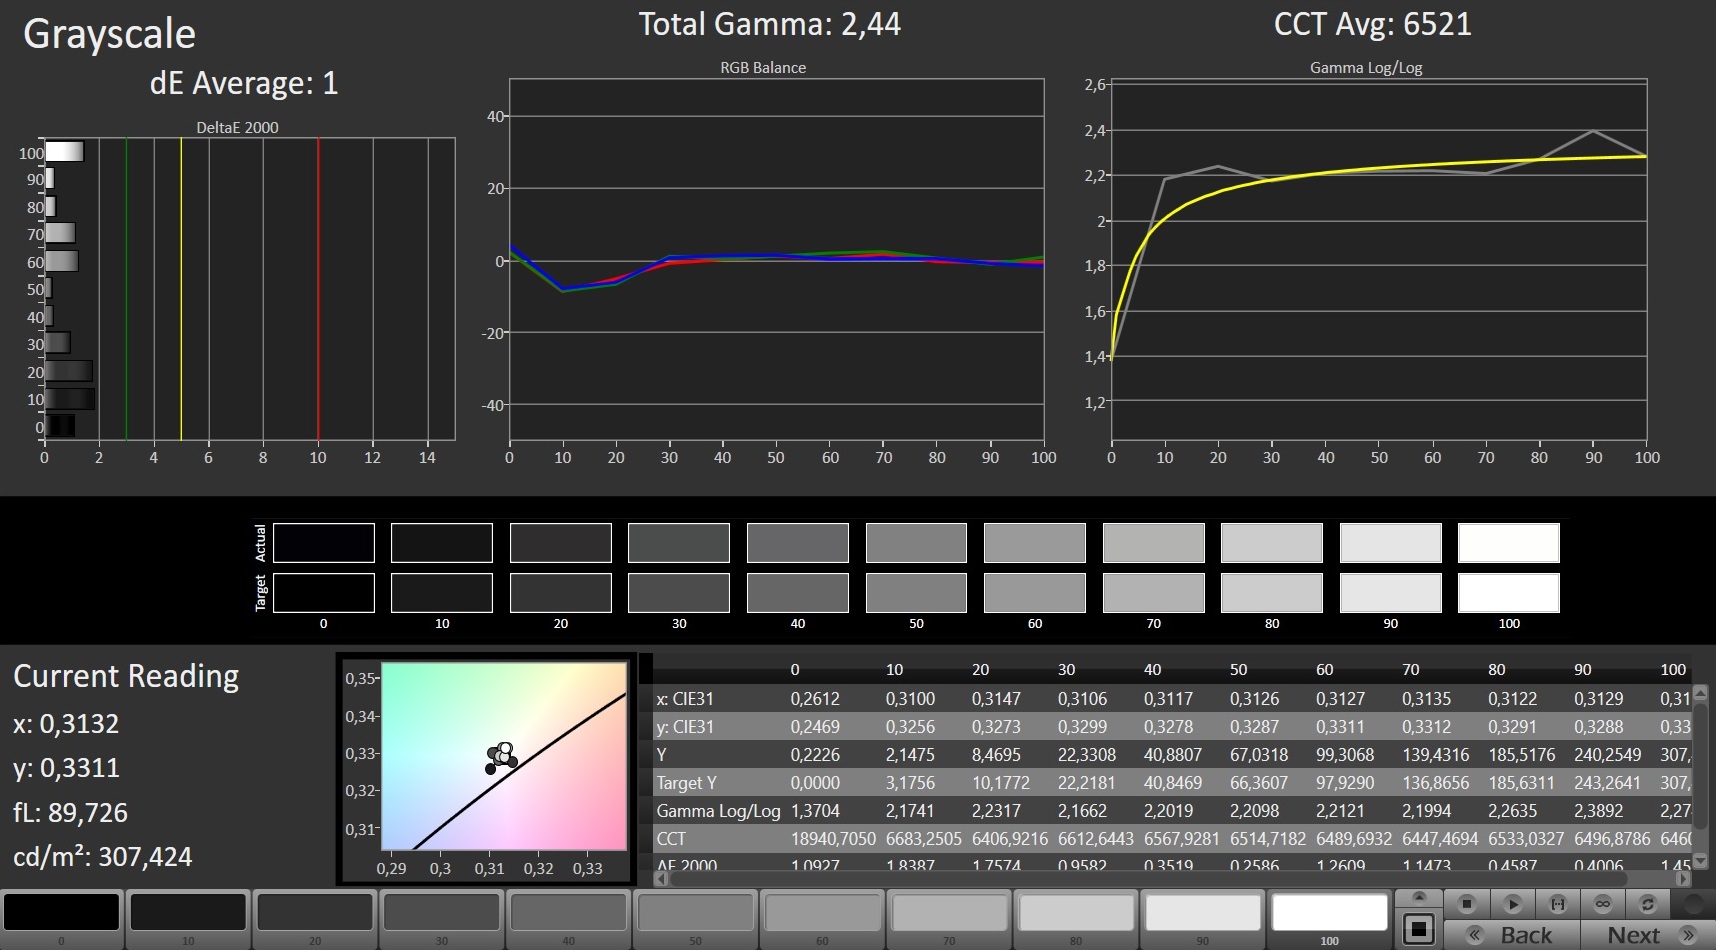
ΔE Greyscale Calman: 3.9 | ∀{0.09-98 Ø4.97}
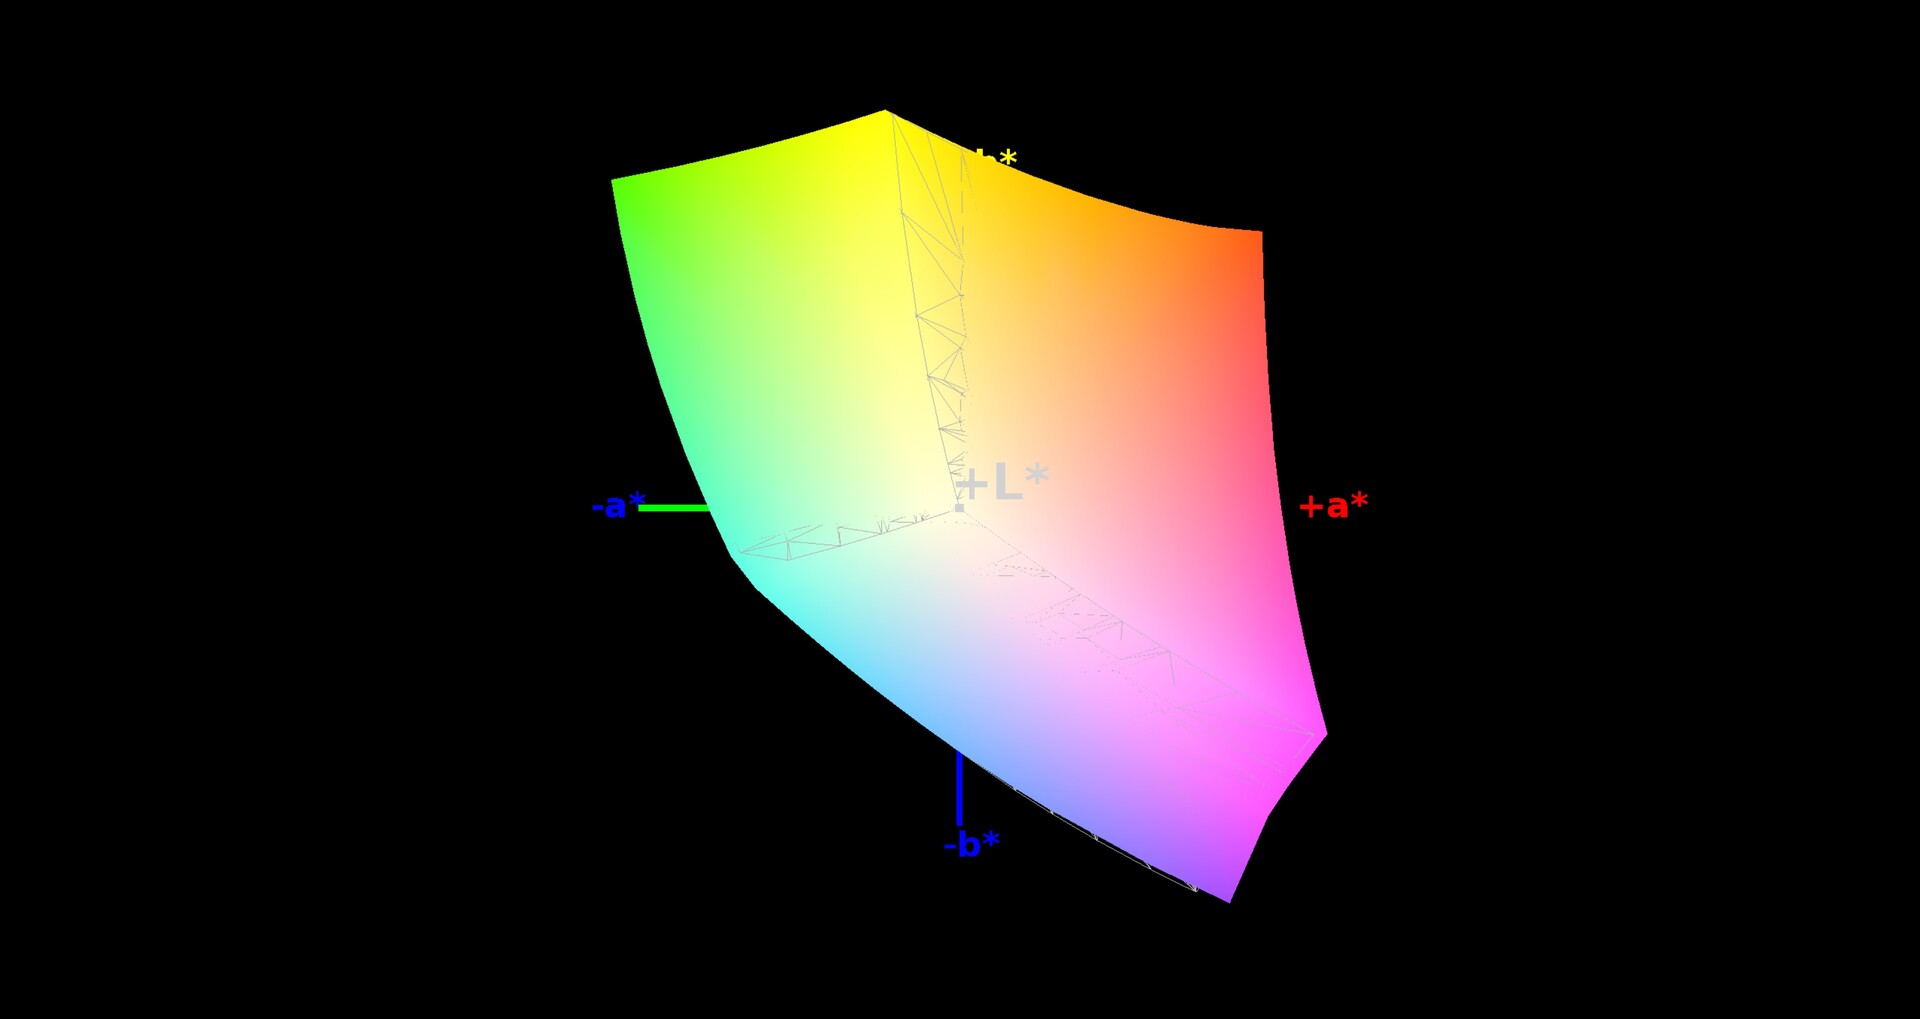
100% sRGB (Argyll 1.6.3 3D)
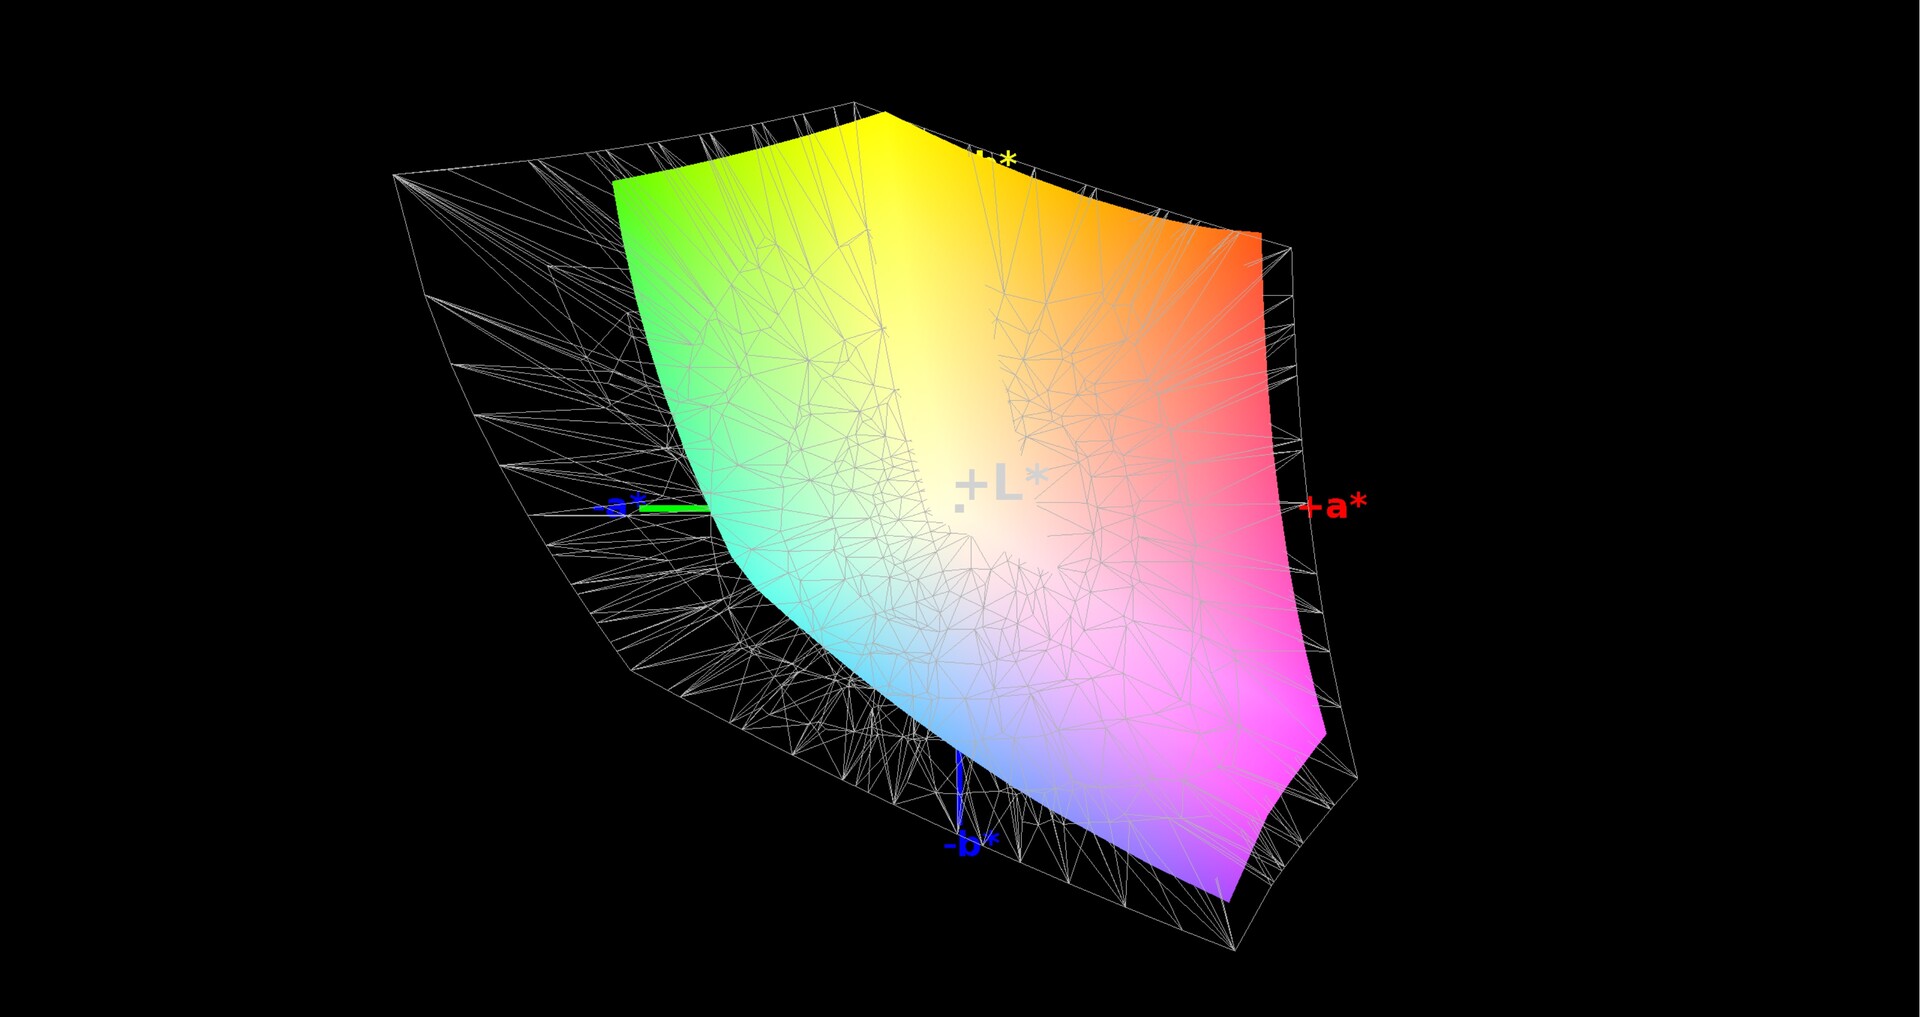
65% AdobeRGB 1998 (Argyll 1.6.3 3D)
70.8% AdobeRGB 1998 (Argyll 3D)
99.6% sRGB (Argyll 3D)
69.5% Display P3 (Argyll 3D)
Gamma: 2.42
CCT: 7439 K
| MSI GS66 Stealth 10SFS AUO B156HAN12.0 (AUO328E), IPS, 1920x1080, 15.6" | Acer Predator Triton 500 PT515-51-71PZ NV156FHM-N4K (BOE082A), IPS, 1920x1080, 15.6" | Gigabyte Aero 15 Classic-XA Sharp LQ156M1JW03 (SHP14C5), IGZO, 1920x1080, 15.6" | HP Omen X 2S 15-dg0075cl AU Optronics AUO82ED, IPS, 1920x1080, 15.6" | Schenker XMG Neo 15 XNE15M19 NV156FHM-N4G (BOE084D), IPS, 1920x1080, 15.6" | |
|---|---|---|---|---|---|
| Display | -7% | -5% | -6% | -8% | |
| Display P3 Coverage (%) | 69.5 | 64.6 -7% | 65.3 -6% | 66.2 -5% | 64 -8% |
| sRGB Coverage (%) | 99.6 | 92.6 -7% | 95.5 -4% | 92.3 -7% | 90.3 -9% |
| AdobeRGB 1998 Coverage (%) | 70.8 | 66 -7% | 66.5 -6% | 67.2 -5% | 65.4 -8% |
| Response Times | 23% | -13% | -11% | 3% | |
| Response Time Grey 50% / Grey 80% * (ms) | 14 ? | 5.2 ? 63% | 15.2 ? -9% | 15.2 ? -9% | 9.6 ? 31% |
| Response Time Black / White * (ms) | 9.6 ? | 11.2 ? -17% | 11.2 ? -17% | 10.8 ? -13% | 12 ? -25% |
| PWM Frequency (Hz) | 23580 ? | ||||
| Screen | -7% | -8% | -34% | -12% | |
| Brightness middle (cd/m²) | 316 | 288 -9% | 266 -16% | 324.8 3% | 313 -1% |
| Brightness (cd/m²) | 311 | 265 -15% | 248 -20% | 316 2% | 295 -5% |
| Brightness Distribution (%) | 92 | 84 -9% | 89 -3% | 84 -9% | 89 -3% |
| Black Level * (cd/m²) | 0.21 | 0.22 -5% | 0.31 -48% | 0.26 -24% | 0.3 -43% |
| Contrast (:1) | 1505 | 1309 -13% | 858 -43% | 1249 -17% | 1043 -31% |
| Colorchecker dE 2000 * | 3.03 | 3.22 -6% | 2.78 8% | 4.96 -64% | 3.33 -10% |
| Colorchecker dE 2000 max. * | 7.32 | 6.26 14% | 5.96 19% | 8.95 -22% | 6.25 15% |
| Colorchecker dE 2000 calibrated * | 1.1 | 1.5 -36% | 0.91 17% | 3.23 -194% | 1.77 -61% |
| Greyscale dE 2000 * | 3.9 | 3.43 12% | 3.58 8% | 5 -28% | 3.1 21% |
| Gamma | 2.42 91% | 2.41 91% | 2.46 89% | 2.21 100% | 2.51 88% |
| CCT | 7439 87% | 7290 89% | 7186 90% | 7742 84% | 6930 94% |
| Color Space (Percent of AdobeRGB 1998) (%) | 65 | 60 -8% | 62 -5% | 59.8 -8% | 59 -9% |
| Color Space (Percent of sRGB) (%) | 100 | 93 -7% | 96 -4% | 91.8 -8% | 90 -10% |
| Total Average (Program / Settings) | 3% /
-4% | -9% /
-8% | -17% /
-26% | -6% /
-10% |
* ... smaller is better
With the AU Optronics B156HAN12.0, MSI uses a non-glare panel (IPS level) with a resolution of 1920 x 1080 pixels. In our measurements, it often turns out noticeably better than the 240-Hz display of the predecessor (Sharp LQ156M1JW03). While the black value has dropped from 0.32 to 0.21 cd/m², the brightness has increased from about 282 to 311 cd/m², making the GS66 slightly more suitable for outdoor usage (more than 400 cd/m² would be optimal). The contrast is now around 1500:1 instead of the earlier 900:1.
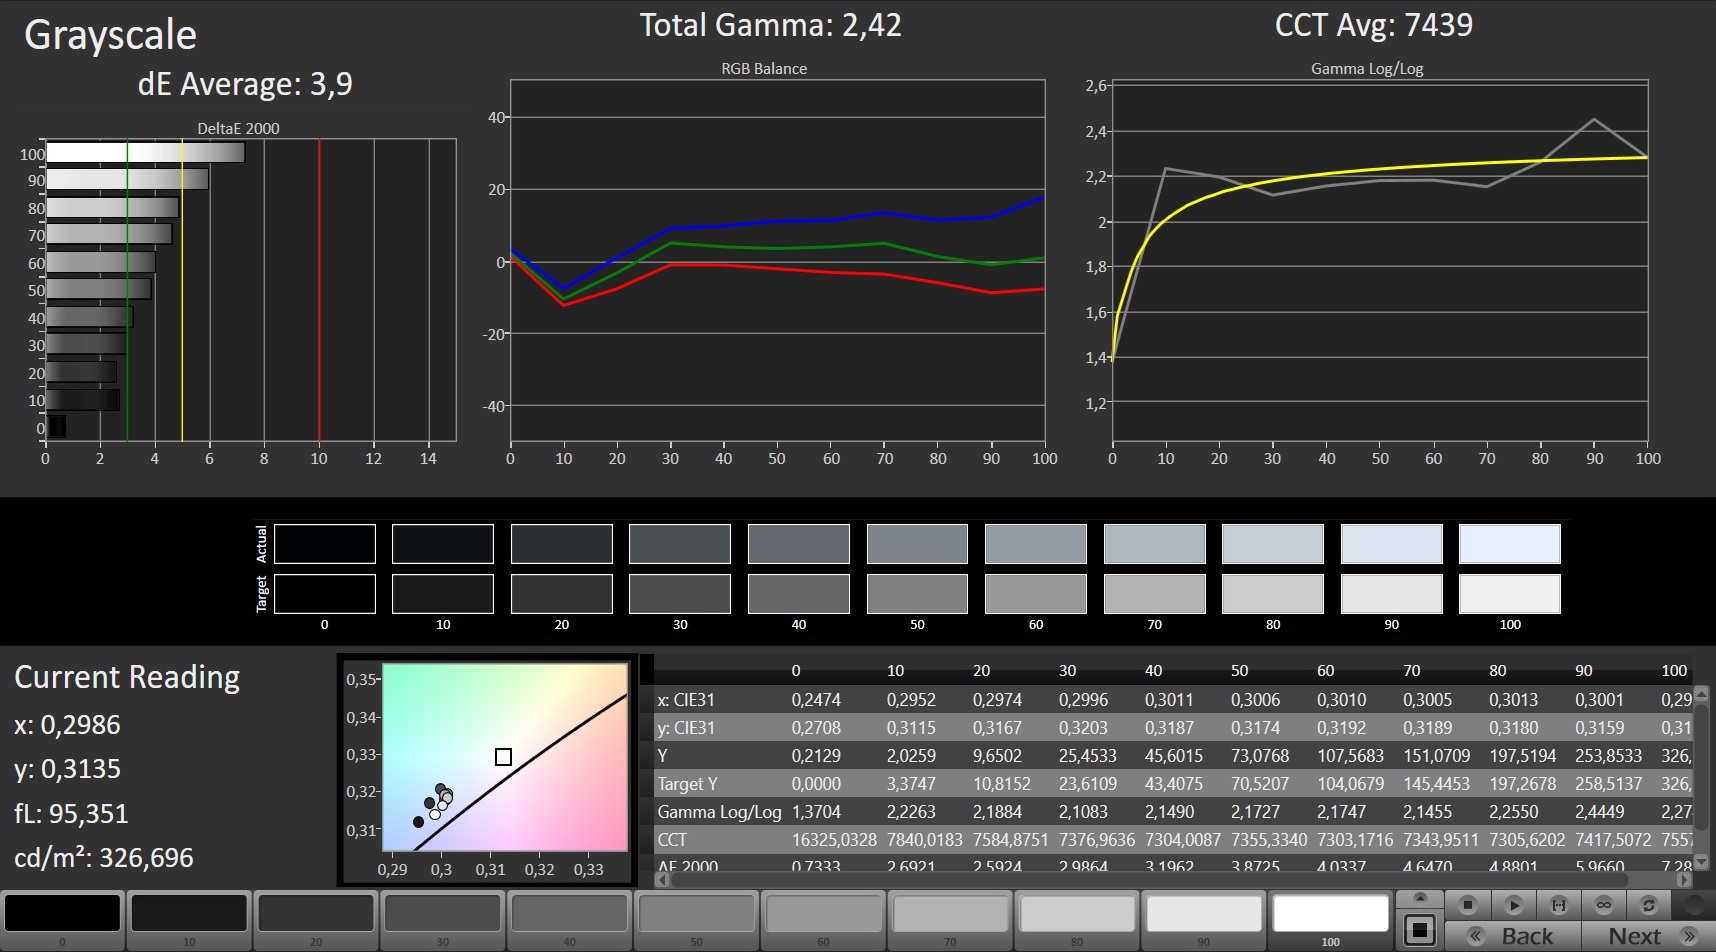
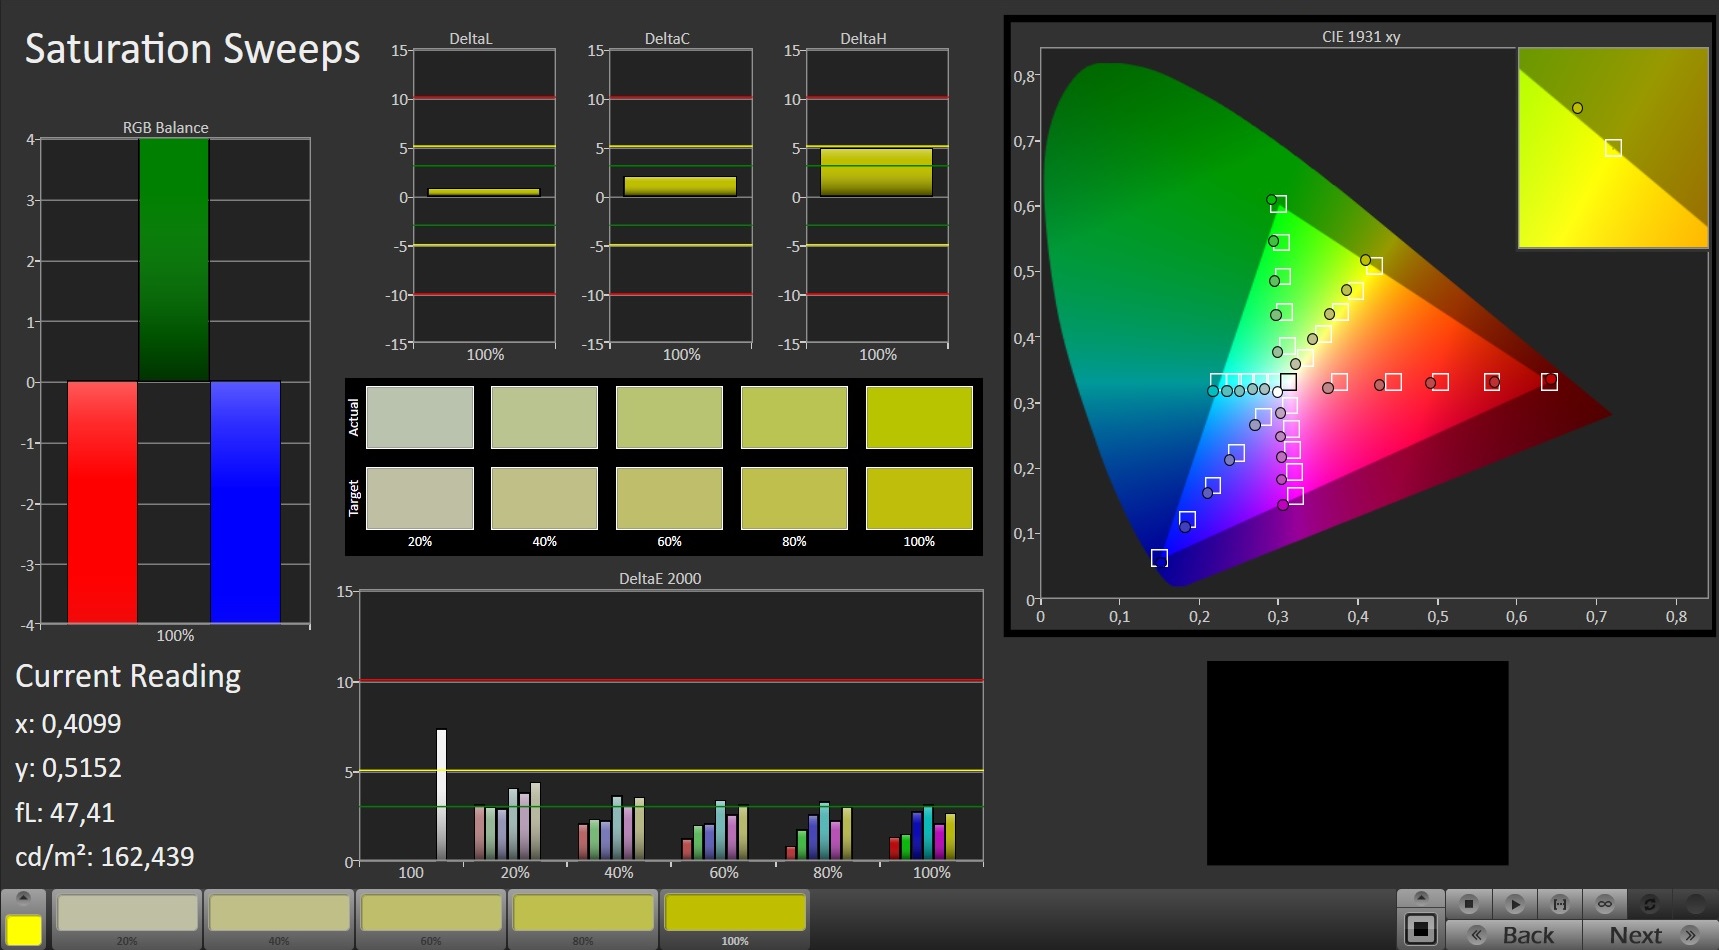
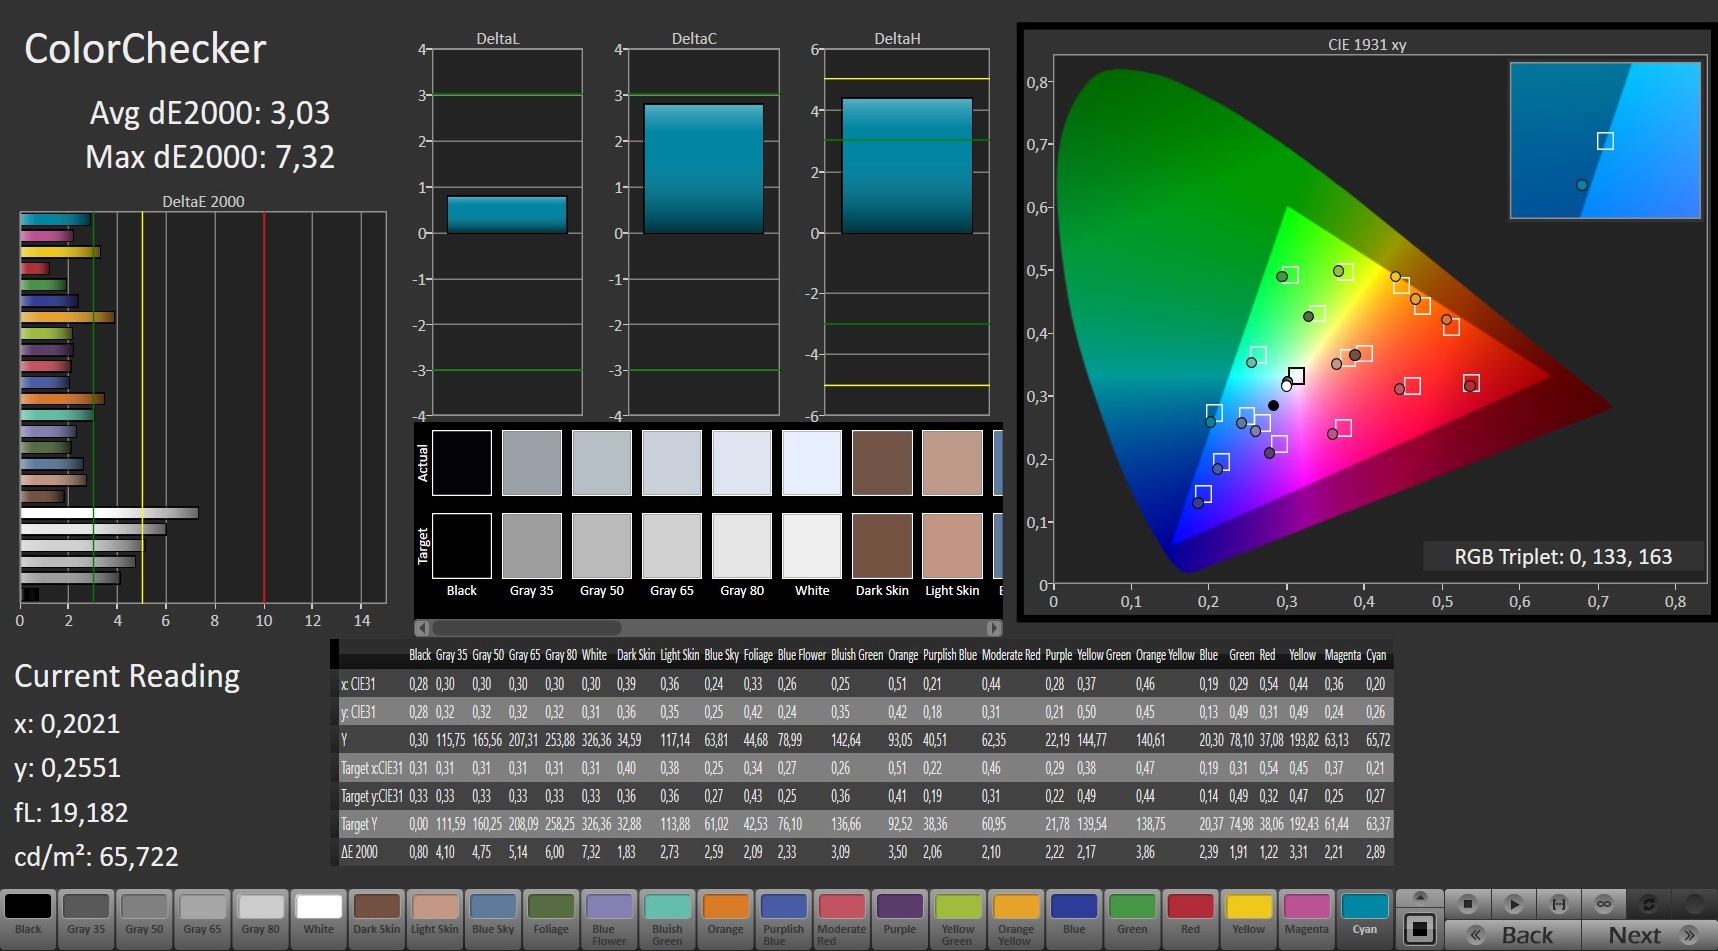
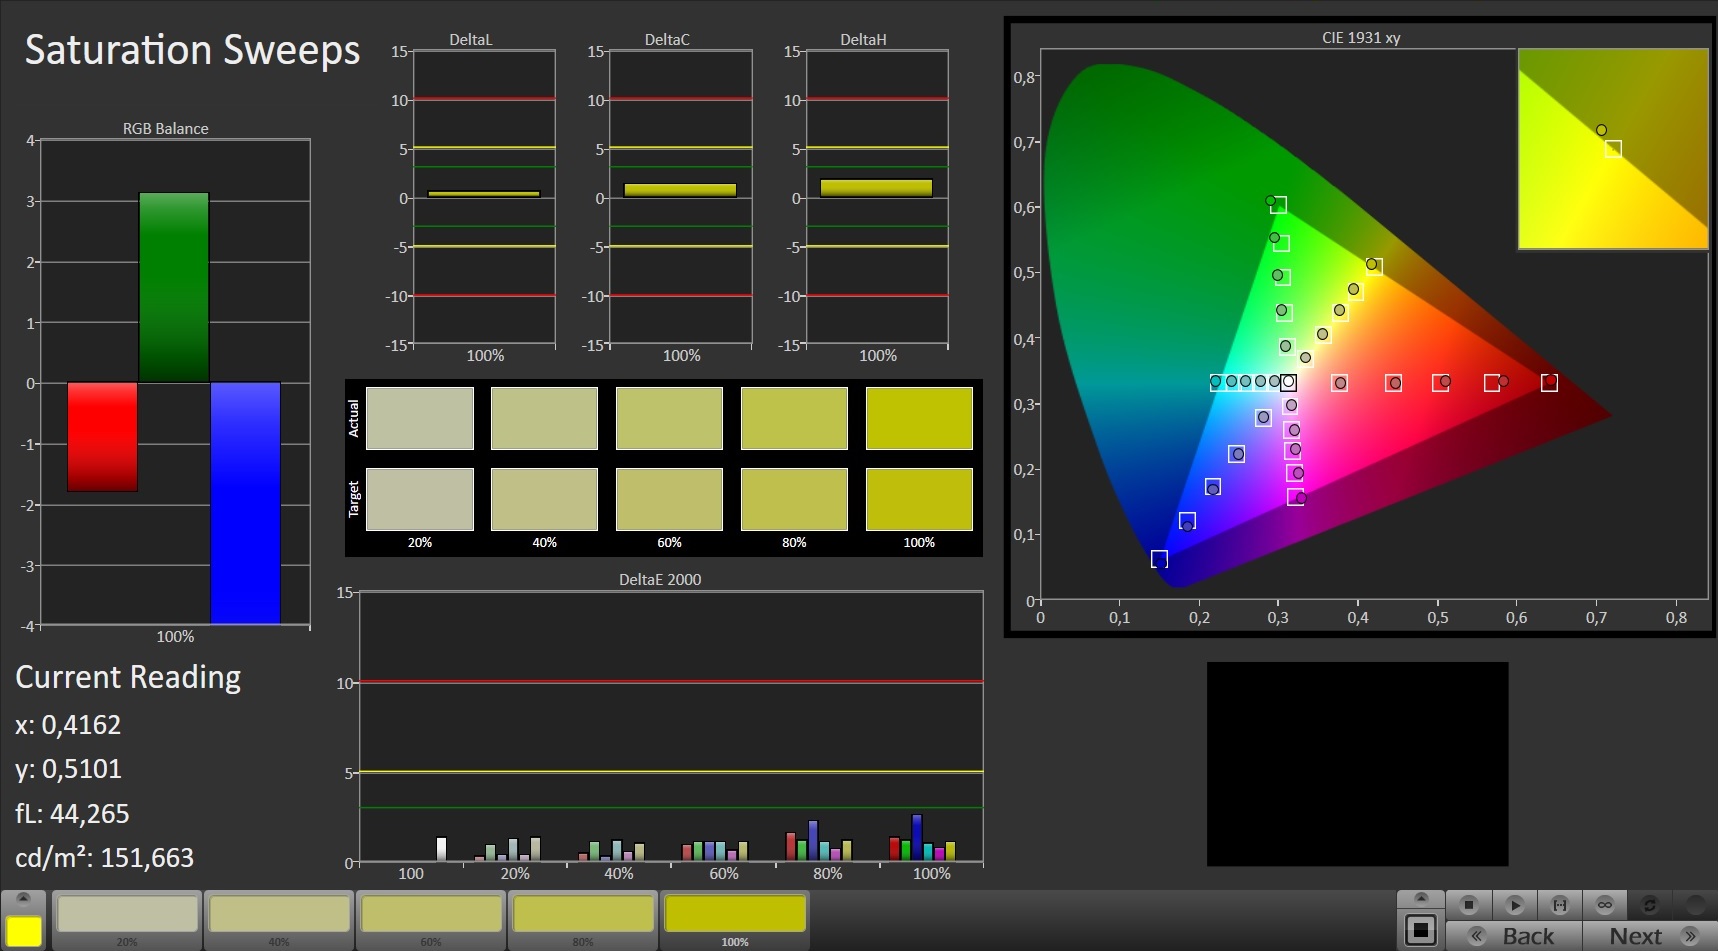
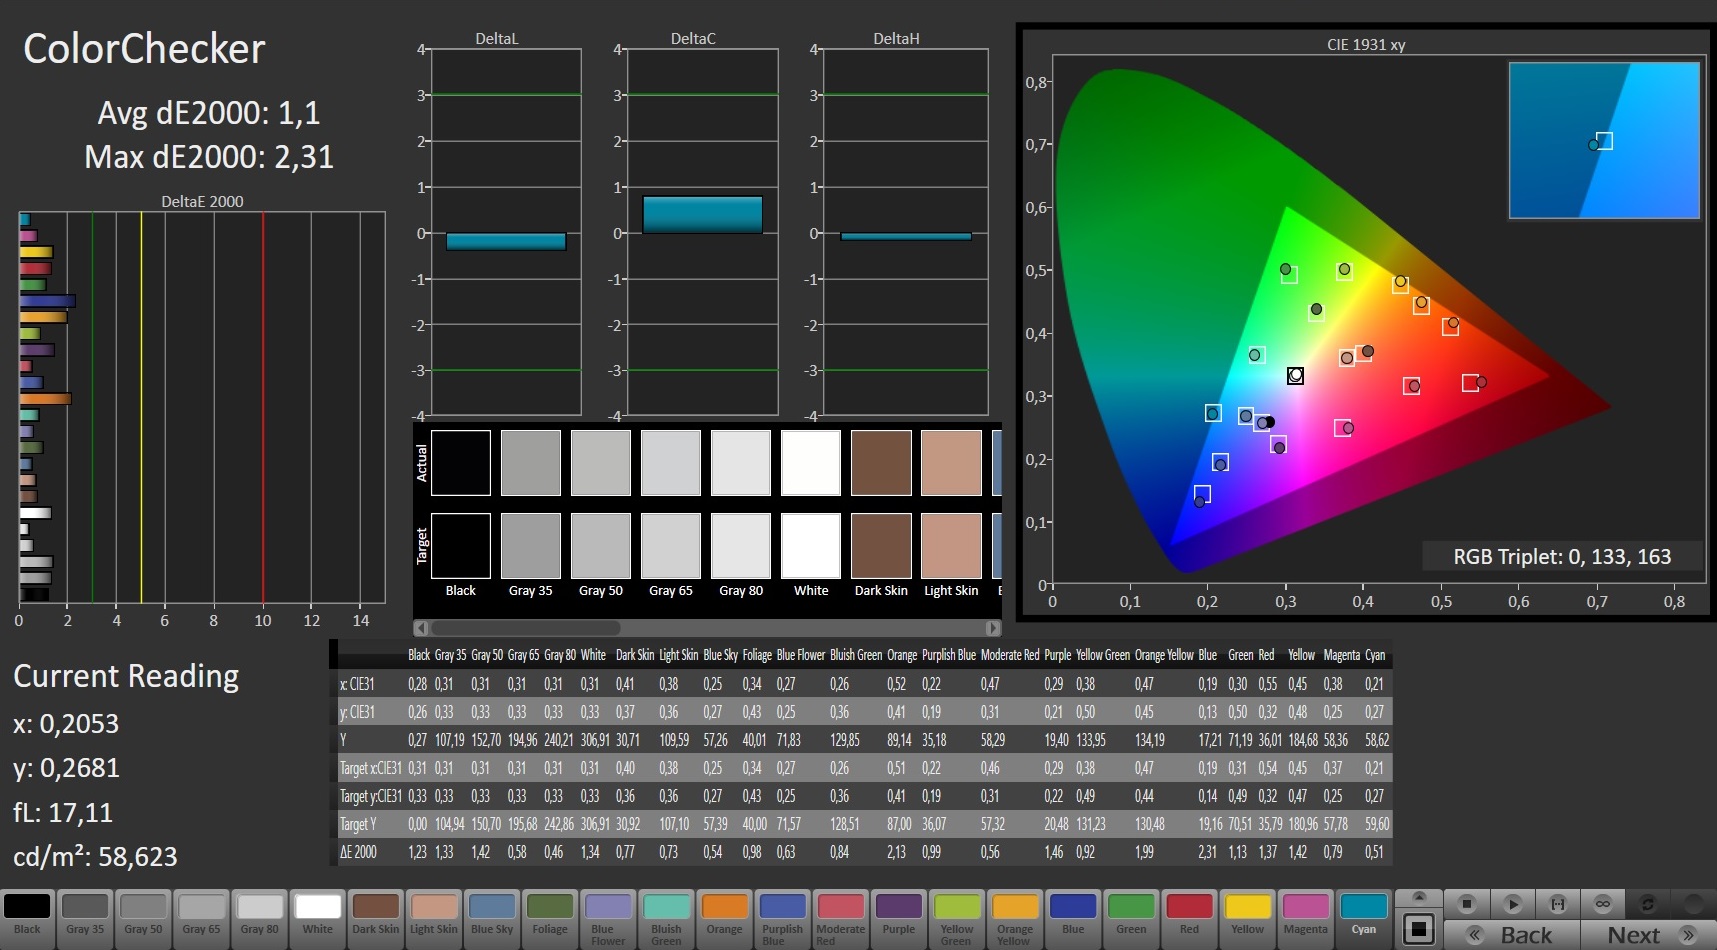
At 100% sRGB and 65% AdobeRGB, the color space ranges at a similar level. On the other hand, the colors of the new panel are not quite as accurate, as our measurements with the CalMAN tool show, with the values mostly still remaining within the target area (dE < 3).
As the GS65 before, the GS66 also scores with low response times. 9.6 ms black-to-white and 14 ms gray-to-gray should satisfy most gamers. There was no screen flickering during the test.
Display Response Times
| ↔ Response Time Black to White | ||
|---|---|---|
| 9.6 ms ... rise ↗ and fall ↘ combined | ↗ 5.2 ms rise | 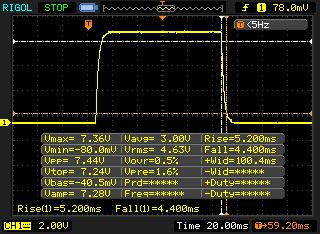 |
| ↘ 4.4 ms fall | ||
| The screen shows fast response rates in our tests and should be suited for gaming. In comparison, all tested devices range from 0.1 (minimum) to 240 (maximum) ms. » 26 % of all devices are better. This means that the measured response time is better than the average of all tested devices (19.8 ms). | ||
| ↔ Response Time 50% Grey to 80% Grey | ||
| 14 ms ... rise ↗ and fall ↘ combined | ↗ 6.8 ms rise | 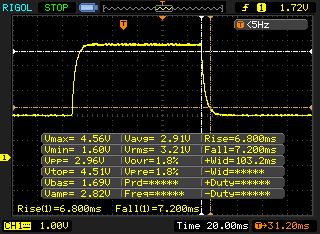 |
| ↘ 7.2 ms fall | ||
| The screen shows good response rates in our tests, but may be too slow for competitive gamers. In comparison, all tested devices range from 0.165 (minimum) to 636 (maximum) ms. » 28 % of all devices are better. This means that the measured response time is better than the average of all tested devices (31 ms). | ||
Screen Flickering / PWM (Pulse-Width Modulation)
| Screen flickering / PWM not detected | 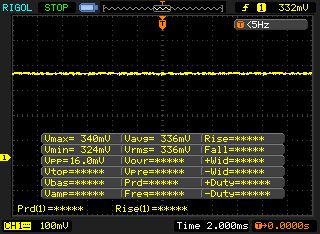 | ||
In comparison: 52 % of all tested devices do not use PWM to dim the display. If PWM was detected, an average of 7772 (minimum: 5 - maximum: 343500) Hz was measured. | |||
Test Conditions
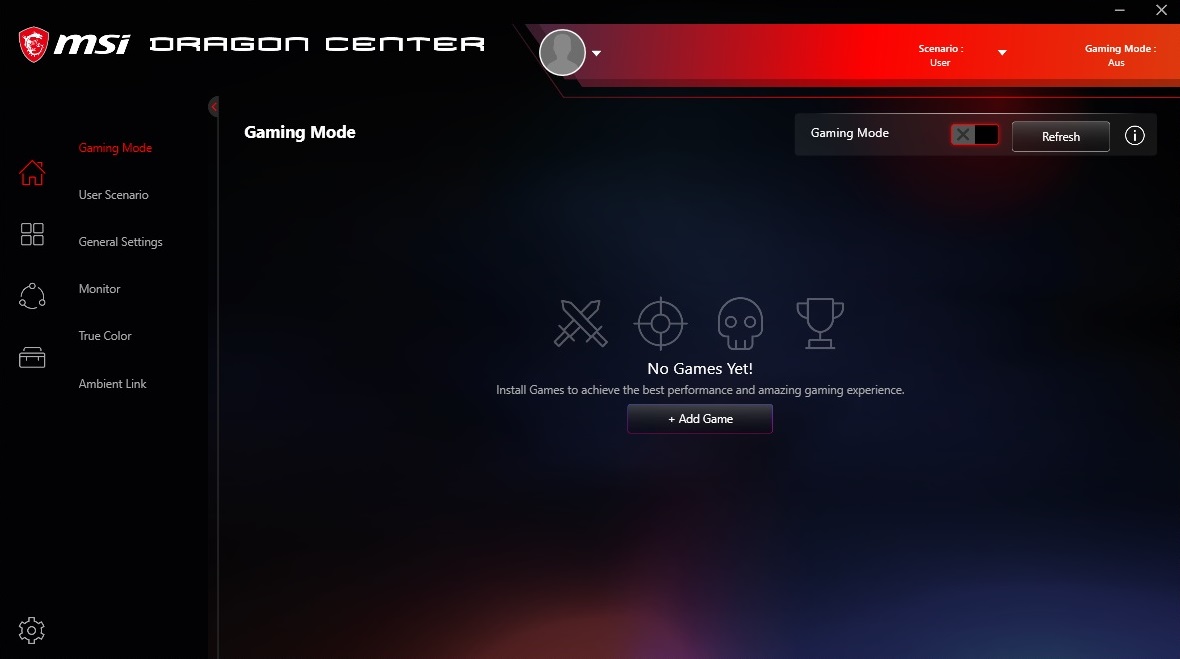
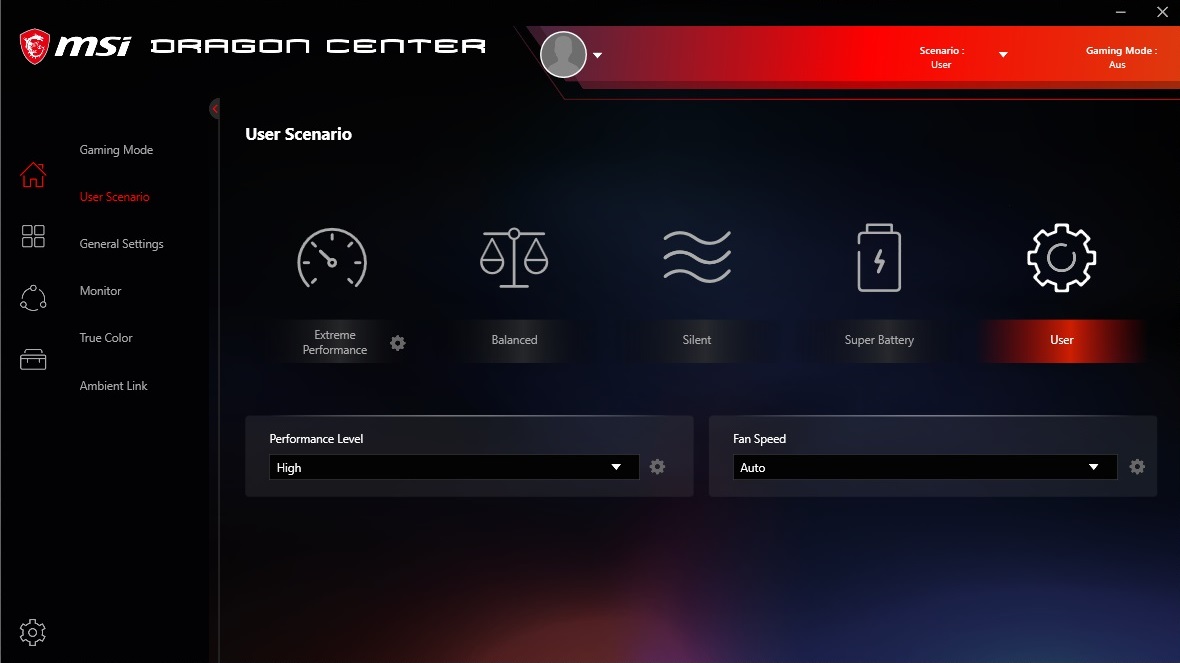
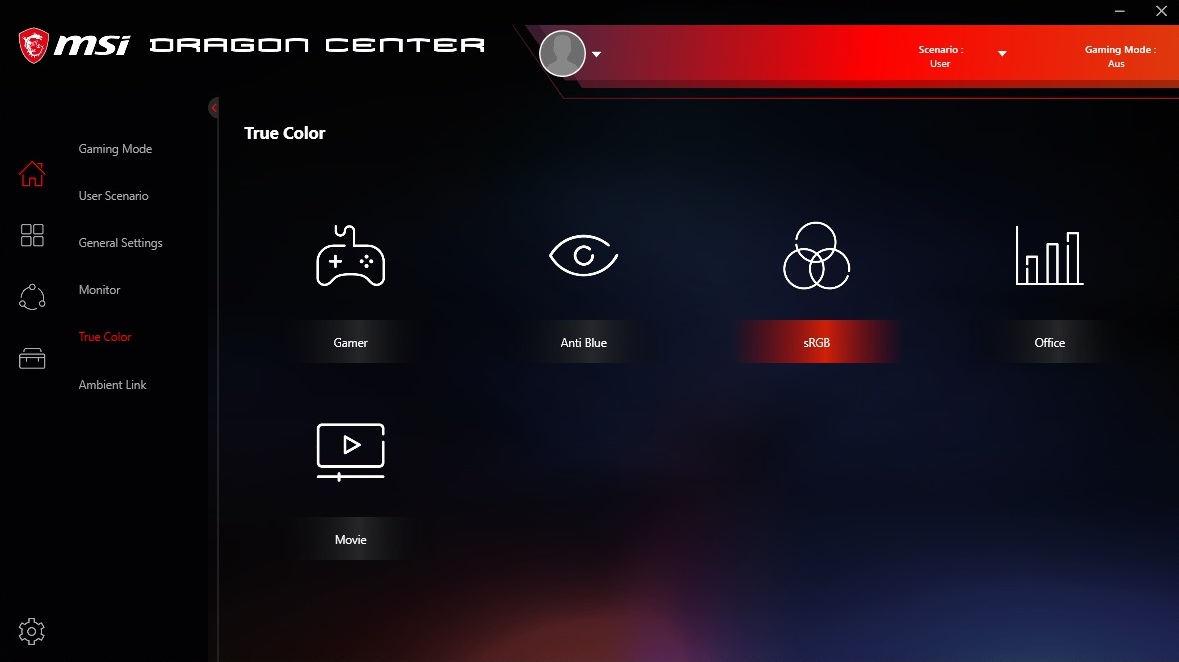
Buyers can fiddle to their heart's content in the preinstalled Dragon Center. Not only will tuning fans find several image profiles, but there are also several performance and fan settings and a special Gaming mode. We ran our measurements with the "sRGB" true-color mode and the "User" scenario (Performance Level "High," Fan Speed "Auto"), which already had been activated in this way in the state of delivery.
Performance
Regardless of whether it uses the RTX 2060, RTX 2070, or RTX 2080, the GS66 Stealth is part of the high-end segment. All three graphics cards bring more than sufficient power for the native Full HD resolution. A 1000 to 2000 GB SSD and 16 to 32 GB of RAM are also up to date. Not to mention the powerful hexa or octa-core processor.
Processor
Whether the Core i9-10980HK makes sense is a matter of debate. While on one hand, the octa-core offers brute performance, because of its hefty demands on the cooling system, we currently see the most powerful model from Intel's Comet Lake generation more in heavy desktop replacements.
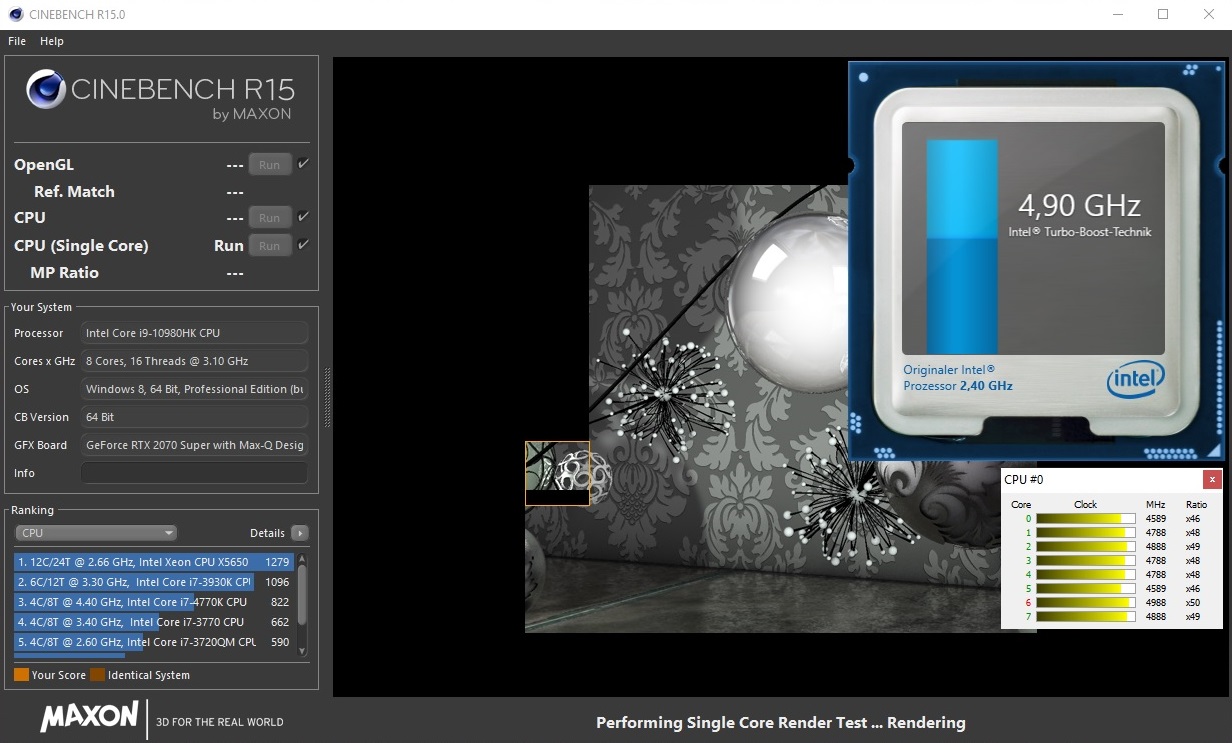
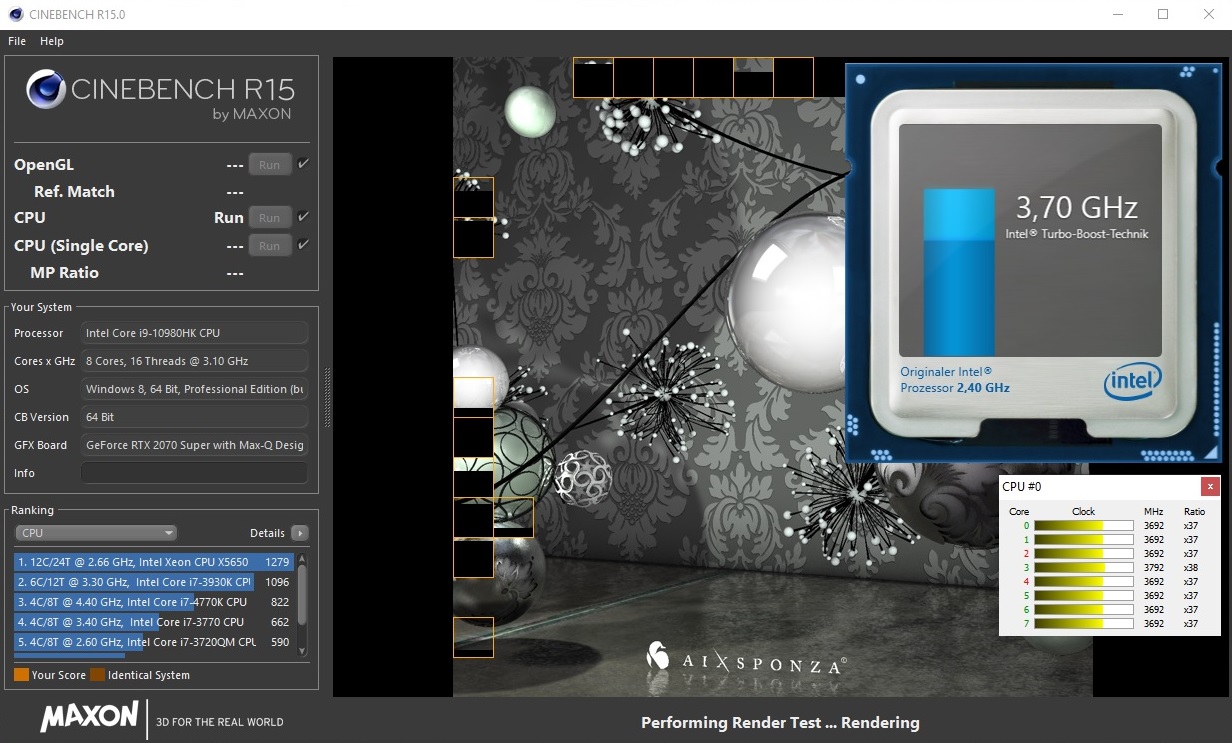
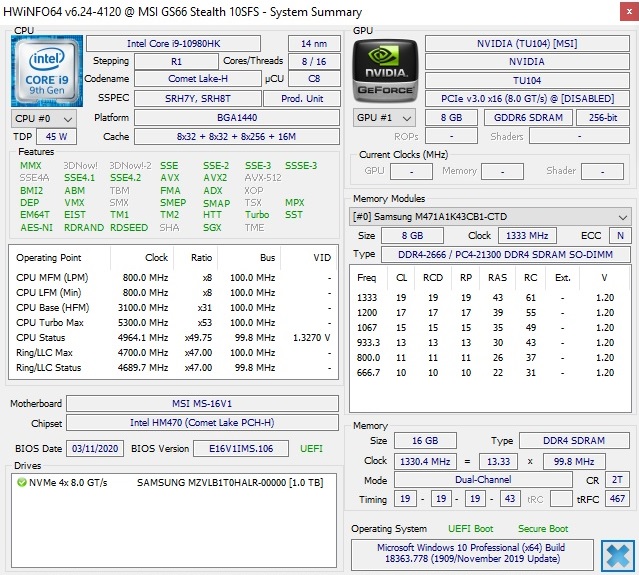
So it is hardly surprising that the 10980HK only uses its Turbo to a limited degree. From the theoretically possible 5.3 GHz, only 4.3 to 4.9 GHz remain during single-core load. When all the cores are loaded, the clock speed drops to 3.6 - 3.9 GHz, which is not bad at all, but still falls behind the potential of the CPU. This makes the already meager price-performance ratio even more questionable, particularly since the performance in our Cinebench-R15 loop drops even further after the second run - like that of other notebooks. For this reason, we would recommend the also very fast but less demanding Core i7-10750H when buying the GS66.
Compared to the old Core i7-9750H, which offers 6 cores and runs all the listed competitors, the performance plus of the i9-10980HK is still considerable. In the multi-core test of Cinebench R20, the advantage is between 52 and 62%.
| Blender - v2.79 BMW27 CPU | |
| MSI GS66 Stealth 10SFS | |
| Average of class Gaming (80 - 330, n=108, last 2 years) | |
| 7-Zip 18.03 | |
| 7z b 4 -mmt1 | |
| Average of class Gaming (4199 - 7436, n=109, last 2 years) | |
| MSI GS66 Stealth 10SFS | |
| 7z b 4 | |
| Average of class Gaming (33491 - 148086, n=109, last 2 years) | |
| MSI GS66 Stealth 10SFS | |
| Geekbench 5.5 | |
| Single-Core | |
| Average of class Gaming (986 - 2474, n=109, last 2 years) | |
| MSI GS66 Stealth 10SFS | |
| Multi-Core | |
| Average of class Gaming (6460 - 27010, n=109, last 2 years) | |
| MSI GS66 Stealth 10SFS | |
| HWBOT x265 Benchmark v2.2 - 4k Preset | |
| Average of class Gaming (11.5 - 44.3, n=109, last 2 years) | |
| MSI GS66 Stealth 10SFS | |
| LibreOffice - 20 Documents To PDF | |
| MSI GS66 Stealth 10SFS | |
| Average of class Gaming (19 - 88.8, n=109, last 2 years) | |
| R Benchmark 2.5 - Overall mean | |
| MSI GS66 Stealth 10SFS | |
| Average of class Gaming (0.3439 - 0.759, n=110, last 2 years) | |
* ... smaller is better
System Performance
Not the least because of the powerful processor, the GS66 leaves the competitors behind in the application performance. With 6490 points, the overall score in PCMark 10 is between 8 and 18% above that of the competitors. The operating system boots up fairly quickly and otherwise also responds comfortably fast (load times, installations, etc.).
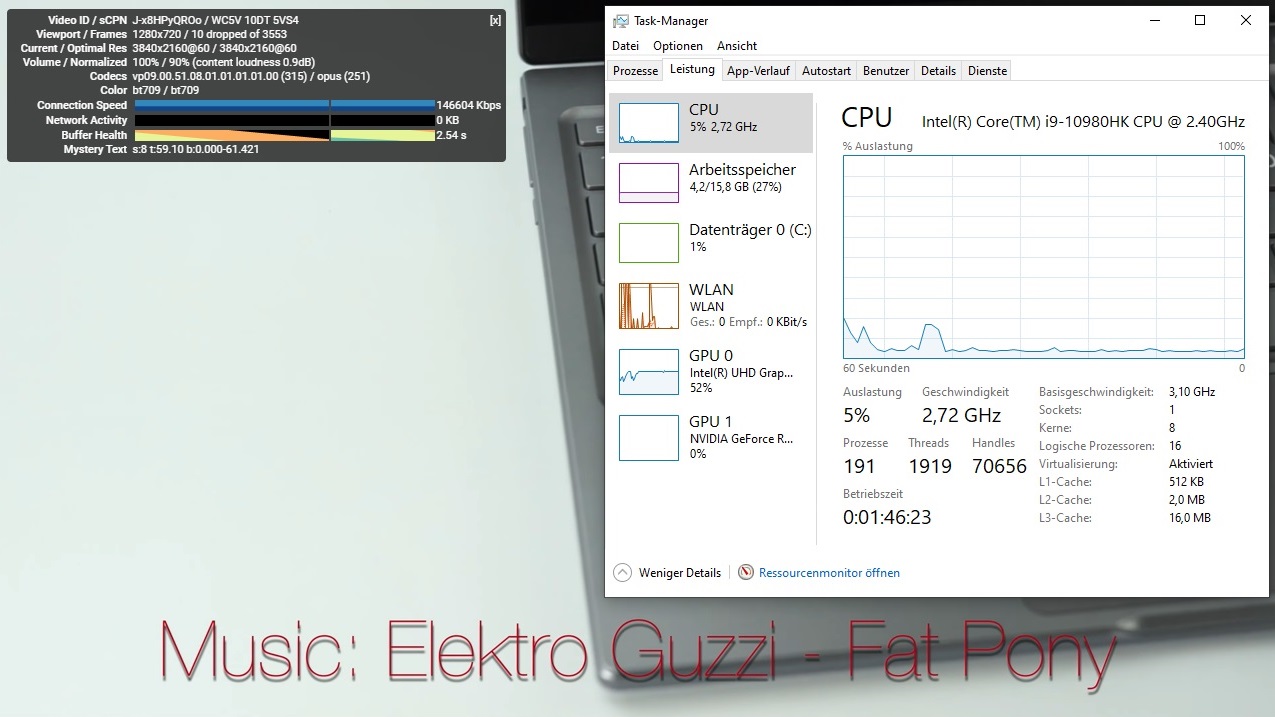
DPC Latencies
Upon the request from several readers, we recently expanded our latency test significantly. It now also includes web browsing and playing video, among other things. If you look at the results of the LatencyMon tool, the MSI GS66 still has some room for optimizations in this regard.
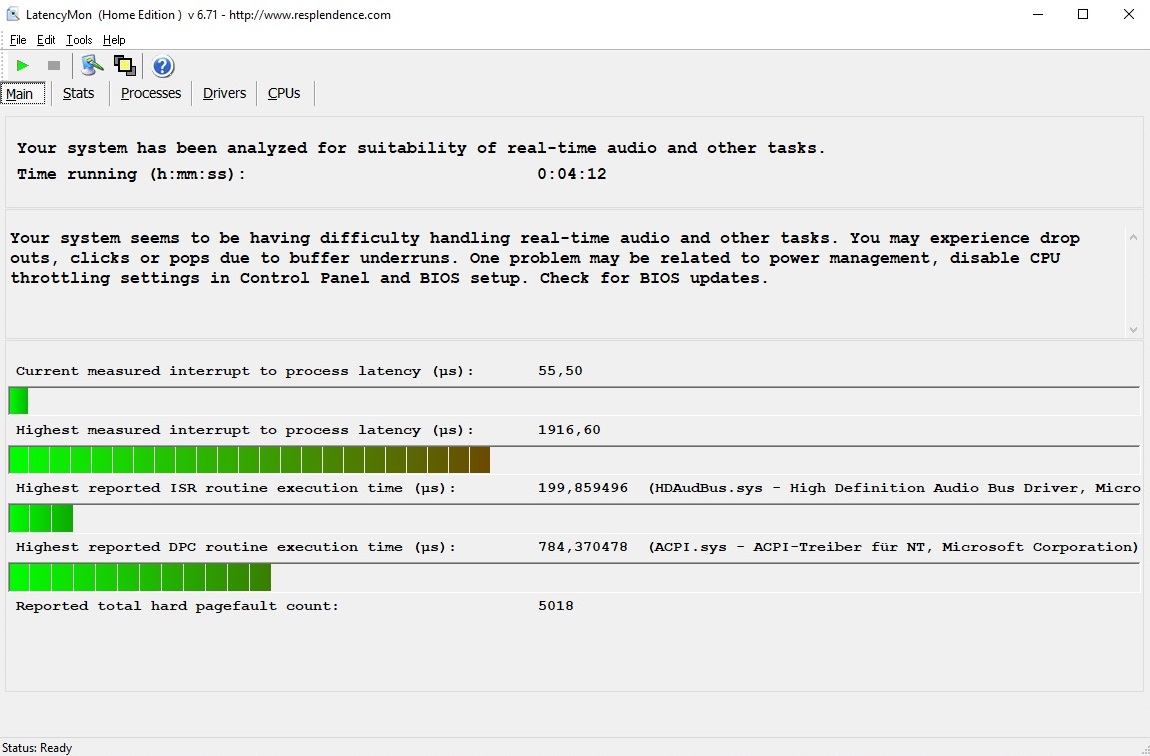
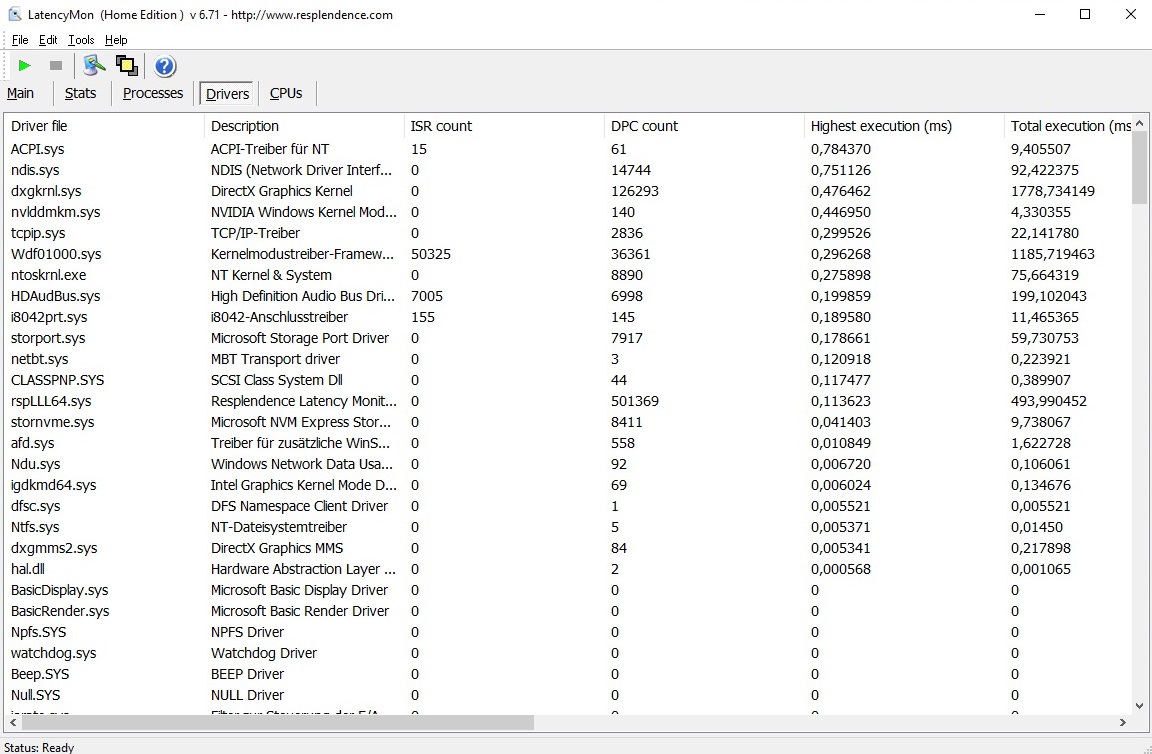
| DPC Latencies / LatencyMon - interrupt to process latency (max), Web, Youtube, Prime95 | |
| MSI GS66 Stealth 10SFS | |
* ... smaller is better
Storage Solution
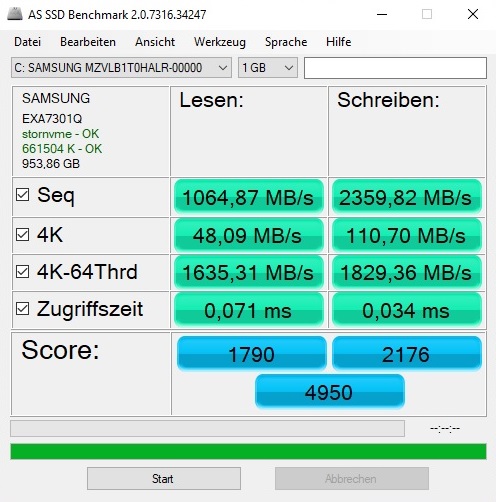
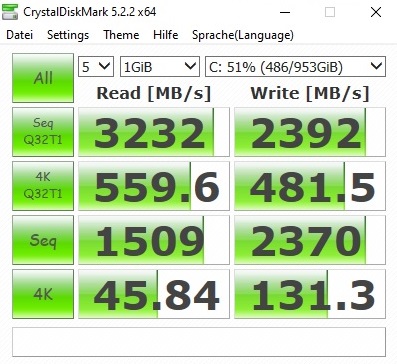
For storage, there is an NVMe model from Samsung, or to be exact, the PM981 MZVLB1T0HARL. This M.2 drive definitely does not need to hide behind the competitors from Intel (Aero 15 Classic), Seagate (Schenker XMG Neo 15), and WDC (Predator Triton 500 & HP Omen X 2S) during reading as well as writing. Those who want to expand the storage space will find an empty M.2 slot under the hood.
| MSI GS66 Stealth 10SFS Samsung SSD PM981 MZVLB1T0HALR | Acer Predator Triton 500 PT515-51-71PZ WDC PC SN720 SDAPNTW-512G | Gigabyte Aero 15 Classic-XA Intel SSD 760p SSDPEKKW512G8 | HP Omen X 2S 15-dg0075cl WDC PC SN720 SDAPNTW-1T00 | Schenker XMG Neo 15 XNE15M19 Seagate FireCuda 510 SSD ZP1000GM30001 | |
|---|---|---|---|---|---|
| CrystalDiskMark 5.2 / 6 | -4% | -4% | 2% | -12% | |
| Write 4K (MB/s) | 131.3 | 108.8 -17% | 115.5 -12% | 137.4 5% | 108.7 -17% |
| Read 4K (MB/s) | 45.84 | 40.31 -12% | 58 27% | 41.37 -10% | 41.4 -10% |
| Write Seq (MB/s) | 2370 | 2488 5% | 1555 -34% | 2500 5% | 1083 -54% |
| Read Seq (MB/s) | 1509 | 1916 27% | 2590 72% | 1576 4% | 917 -39% |
| Write 4K Q32T1 (MB/s) | 481.5 | 382.4 -21% | 369.3 -23% | 446.7 -7% | 468.5 -3% |
| Read 4K Q32T1 (MB/s) | 560 | 421.8 -25% | 441.7 -21% | 522 -7% | 530 -5% |
| Write Seq Q32T1 (MB/s) | 2392 | 2542 6% | 1547 -35% | 2796 17% | 3057 28% |
| Read Seq Q32T1 (MB/s) | 3232 | 3320 3% | 2969 -8% | 3415 6% | 3422 6% |

Graphics Card
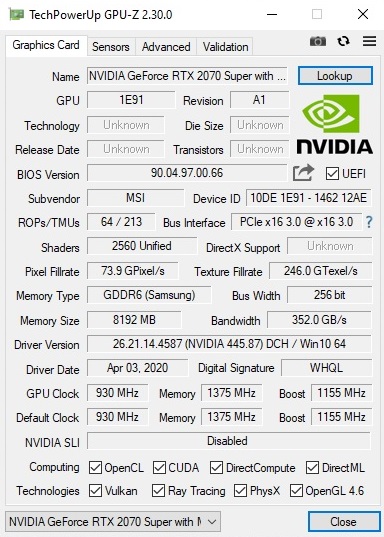
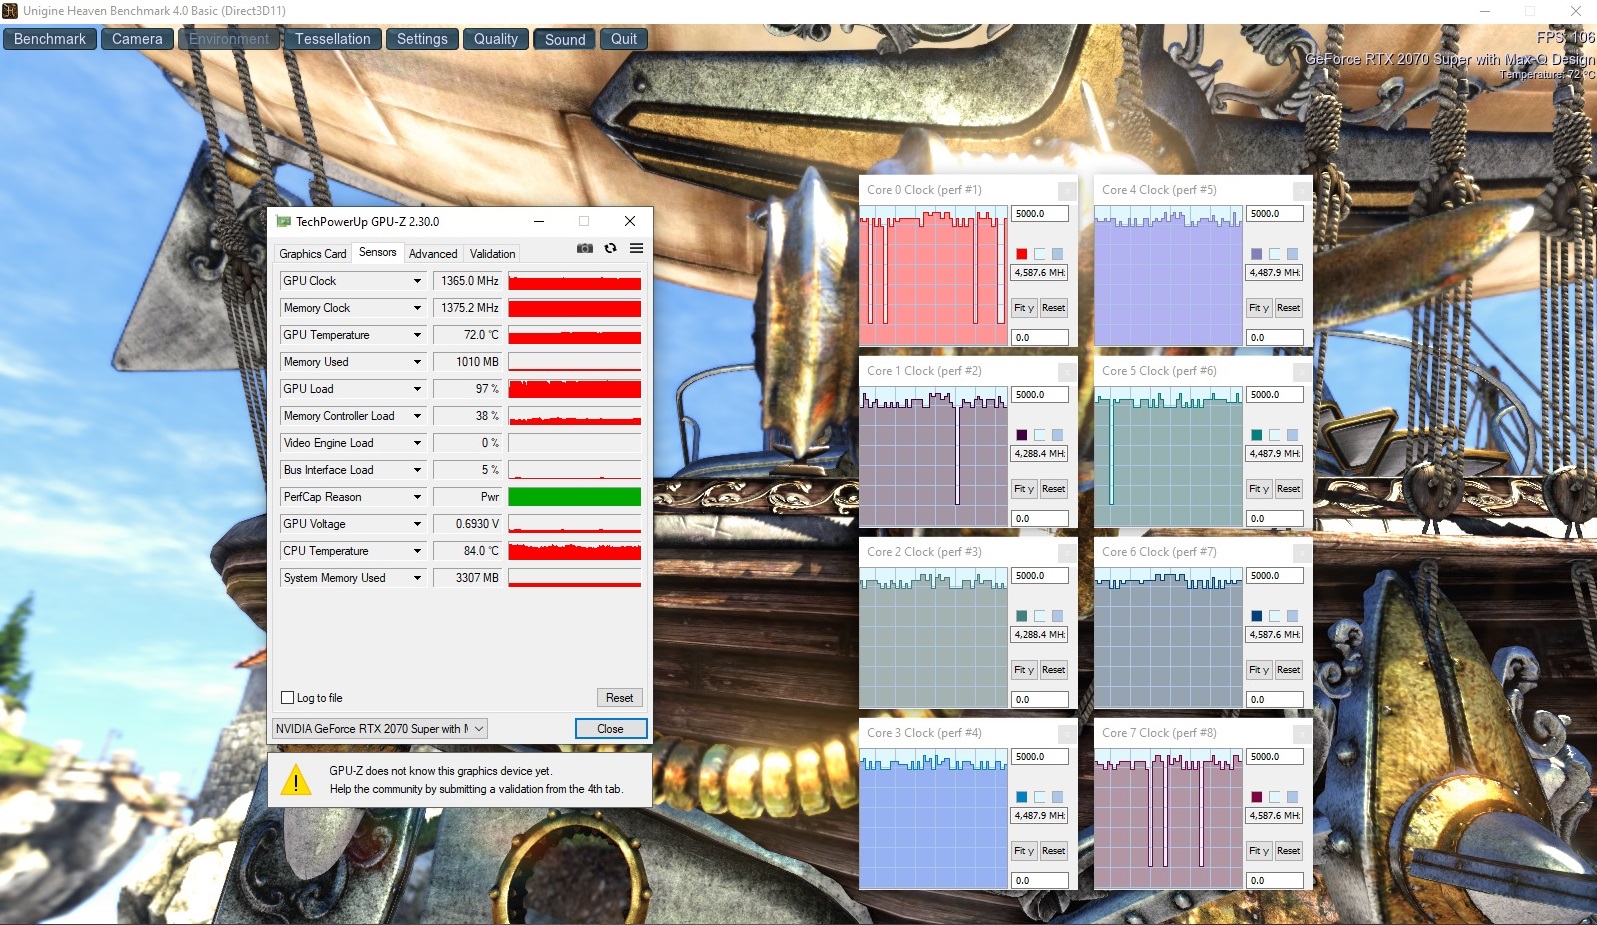
The GeForce RTX 2070 Super Max-Q is a slightly tuned version of the old 2070 Max-Q (also Turing architecture). For example, Nvidia has increased the number of shaders from 2304 to 2560. The amount of GDDR6 video storage is 8 GB again and connected via 256-bit interface. The basic clock speed is specified by the manufacturer as 930 MHz, with significantly higher values achievable via automatic GPU boost. We evaluated how the clock speed behaves under load using the Ungine Heaven 4.0 benchmark and the role-playing game "The Witcher 3." Around 1300 to 1400 MHz are a decent value.
| 3DMark 11 Performance | 21934 points | |
| 3DMark Cloud Gate Standard Score | 45202 points | |
| 3DMark Fire Strike Score | 17312 points | |
| 3DMark Time Spy Score | 7272 points | |
Help | ||
Apropos "The Witcher 3": In contrast to the processor performance, the graphics performance remains relatively constant. The 60-minute endurance test did not reveal any fps drops or anything like that. You only have to watch out during battery operation. As in most other laptops, the frame rate drops massively without the charger (-85% @ GS66), since the CPU and GPU are throttled significantly.
Connected to the power supply, the RTX 2070 Super Max-Q is able to make use of its power quite well, as our GPU benchmarks also confirm. Although the performance in 3DMark 11 and 3DMark 13 is slightly worse than that of the Aero 17 HDR XB we recently tested, the GS66 still sprints ahead of the competing laptops with the "regular" RTX 2070 Max-Q by several percentage points.
Gaming Performance
As long as you don't connect a QHD or UHD monitor, the RTX 2070 Super Max-Q displays all the current games smoothly at maximum details. It only drops below the 60-fps mark in very computing-intensive and/or less-optimized games such as "Borderlands 3." Well optimized and/or less demanding games (FIFA 20, Apex Legends, Doom Eternal, etc.), however, run at more than 100 fps on average.
| The Witcher 3 - 1920x1080 Ultra Graphics & Postprocessing (HBAO+) | |
| Average of class Gaming (95 - 240, n=8, last 2 years) | |
| MSI GS66 Stealth 10SFS | |
| HP Omen X 2S 15-dg0075cl | |
| Acer Predator Triton 500 PT515-51-71PZ | |
| Gigabyte Aero 15 Classic-XA | |
| Schenker XMG Neo 15 XNE15M19 | |
| low | med. | high | ultra | |
|---|---|---|---|---|
| GTA V (2015) | 182 | 174 | 153 | 83.4 |
| The Witcher 3 (2015) | 131 | 70.5 | ||
| Dota 2 Reborn (2015) | 153 | 138 | 128 | 120 |
| X-Plane 11.11 (2018) | 113 | 97.4 | 82.3 | |
| Shadow of the Tomb Raider (2018) | 102 | 91 | ||
| Battlefield V (2018) | 121 | 113 | ||
| Apex Legends (2019) | 140 | 139 | ||
| Borderlands 3 (2019) | 76.3 | 58.9 | ||
| FIFA 20 (2019) | 196 | 190 | ||
| Need for Speed Heat (2019) | 88.2 | 80.7 | ||
| Star Wars Jedi Fallen Order (2019) | 95 | 88.8 | ||
| Escape from Tarkov (2020) | 121 | 119 | ||
| Hunt Showdown (2020) | 91.6 | |||
| Doom Eternal (2020) | 141 | 137 | ||
| Gears Tactics (2020) | 116 | 90.6 |
Emissions
Noise Emissions
The noise development is not really a strong suite of the GS66, to say it gently. MSI takes the bad example from the competitors, letting the fans run at a very high speed under load. 48 to 53 dB(A) are annoyingly loud without a headset and should deter some interested buyers from the purchase.
Even though the GS66 does better during idle mode, we weren't really satisfied with the performance here either. The fact that the fans are never turned off in the Dragon Center settings we tested isn't even the real problem. What turns out much more annoying in practice is the intermittent revving up of the fan, the cause of which often remained a mystery to us. Supposedly simple tasks such as video, web, and installations/updates also tend to force the fans to produce their sudden noise.
A solution would be to use Silent mode, but according to our experience with other MSI laptops, this will only help to a limited degree with some problems and will also limit the performance by a lot (stuttering Youtube videos). By the way, the fan noise of the MSI GS66 is not one of the more pleasant fan noises, regardless of the fan speed.
Noise level
| Idle |
| 32 / 34 / 39 dB(A) |
| Load |
| 53 / 53 dB(A) |
 | ||
30 dB silent 40 dB(A) audible 50 dB(A) loud |
||
min: | ||
| MSI GS66 Stealth 10SFS i9-10980HK, GeForce RTX 2070 Super Max-Q | Acer Predator Triton 500 PT515-51-71PZ i7-9750H, GeForce RTX 2070 Max-Q | Gigabyte Aero 15 Classic-XA i7-9750H, GeForce RTX 2070 Max-Q | HP Omen X 2S 15-dg0075cl i7-9750H, GeForce RTX 2070 Max-Q | Schenker XMG Neo 15 XNE15M19 i7-9750H, GeForce RTX 2070 Max-Q | |
|---|---|---|---|---|---|
| Noise | 4% | 0% | 8% | 1% | |
| off / environment * (dB) | 30 | 30 -0% | 30 -0% | 29 3% | 31 -3% |
| Idle Minimum * (dB) | 32 | 30 6% | 31 3% | 30.5 5% | 31 3% |
| Idle Average * (dB) | 34 | 33 3% | 34 -0% | 31.5 7% | 34 -0% |
| Idle Maximum * (dB) | 39 | 39 -0% | 39 -0% | 31.5 19% | 37 5% |
| Load Average * (dB) | 53 | 45 15% | 46 13% | 40.6 23% | 47 11% |
| Witcher 3 ultra * (dB) | 48 | 49 -2% | 53 -10% | 49.5 -3% | 50 -4% |
| Load Maximum * (dB) | 53 | 51 4% | 55 -4% | 53.4 -1% | 54 -2% |
* ... smaller is better
Temperature
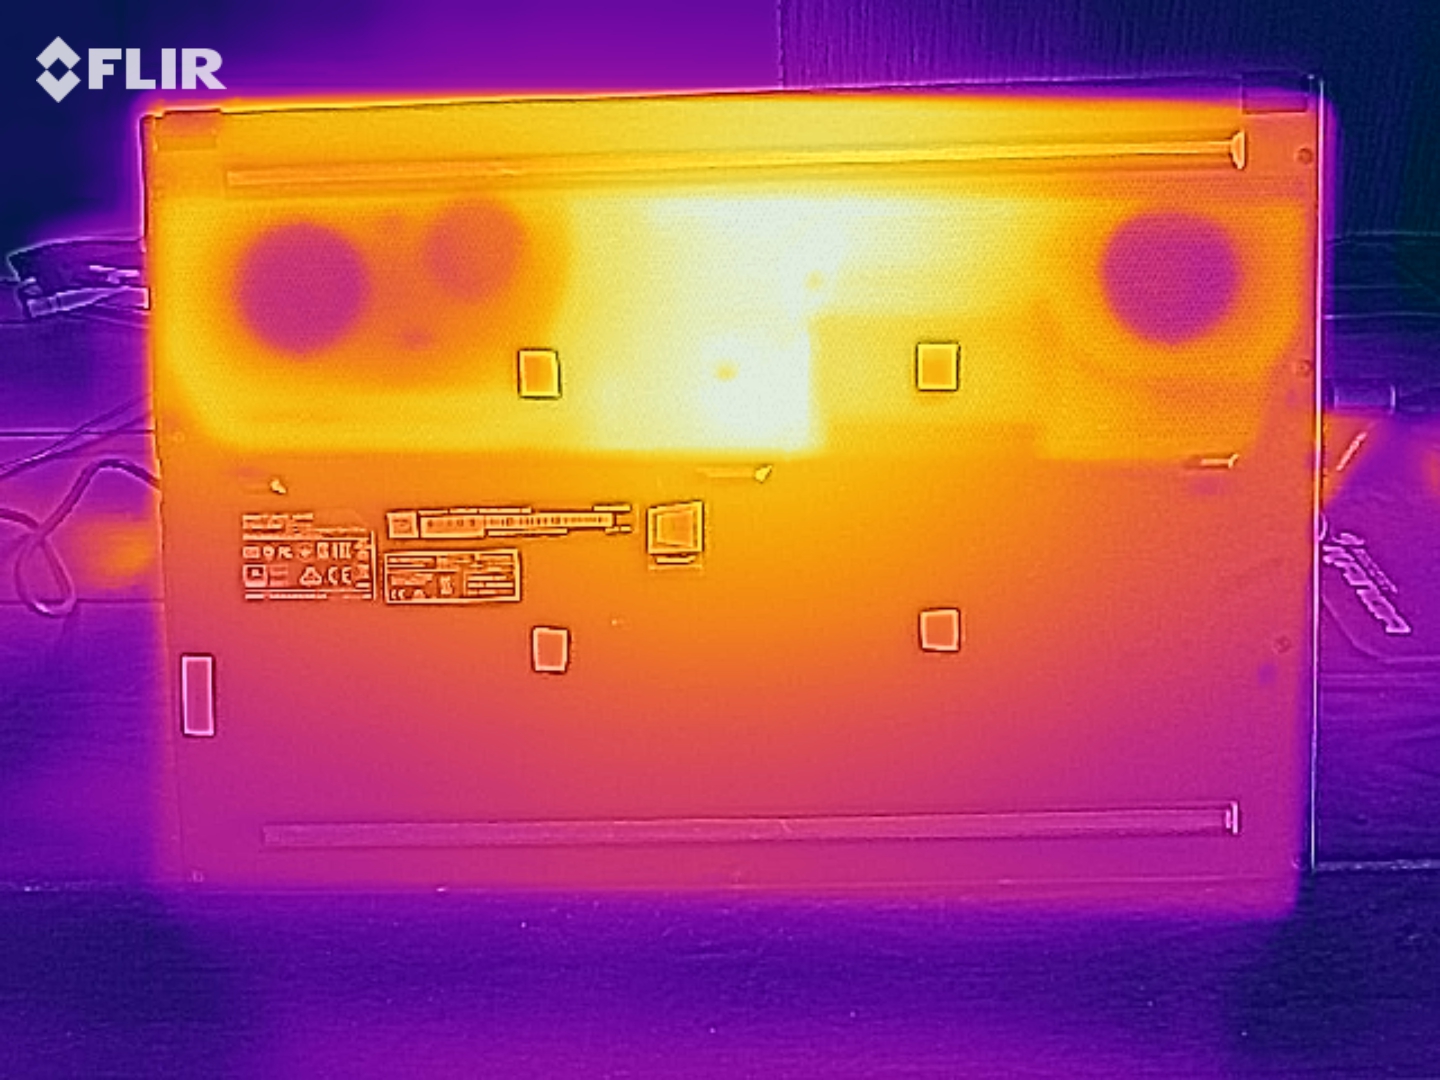
The temperatures are typical for such a slim high-end notebook. While the base unit reaches up to 53 °C (127 °F) on top and 55 °C (131 °F) on the bottom in 3D operation, the case remains cooler than 30 °C (86 °F) during idle operation. The verdict on the components is mixed. On the positive side, we should mention the RTX 2070 Super Max-Q, which only reaches a maximum of 75 °C (167 °F) even under full load (FurMark & Prime95).
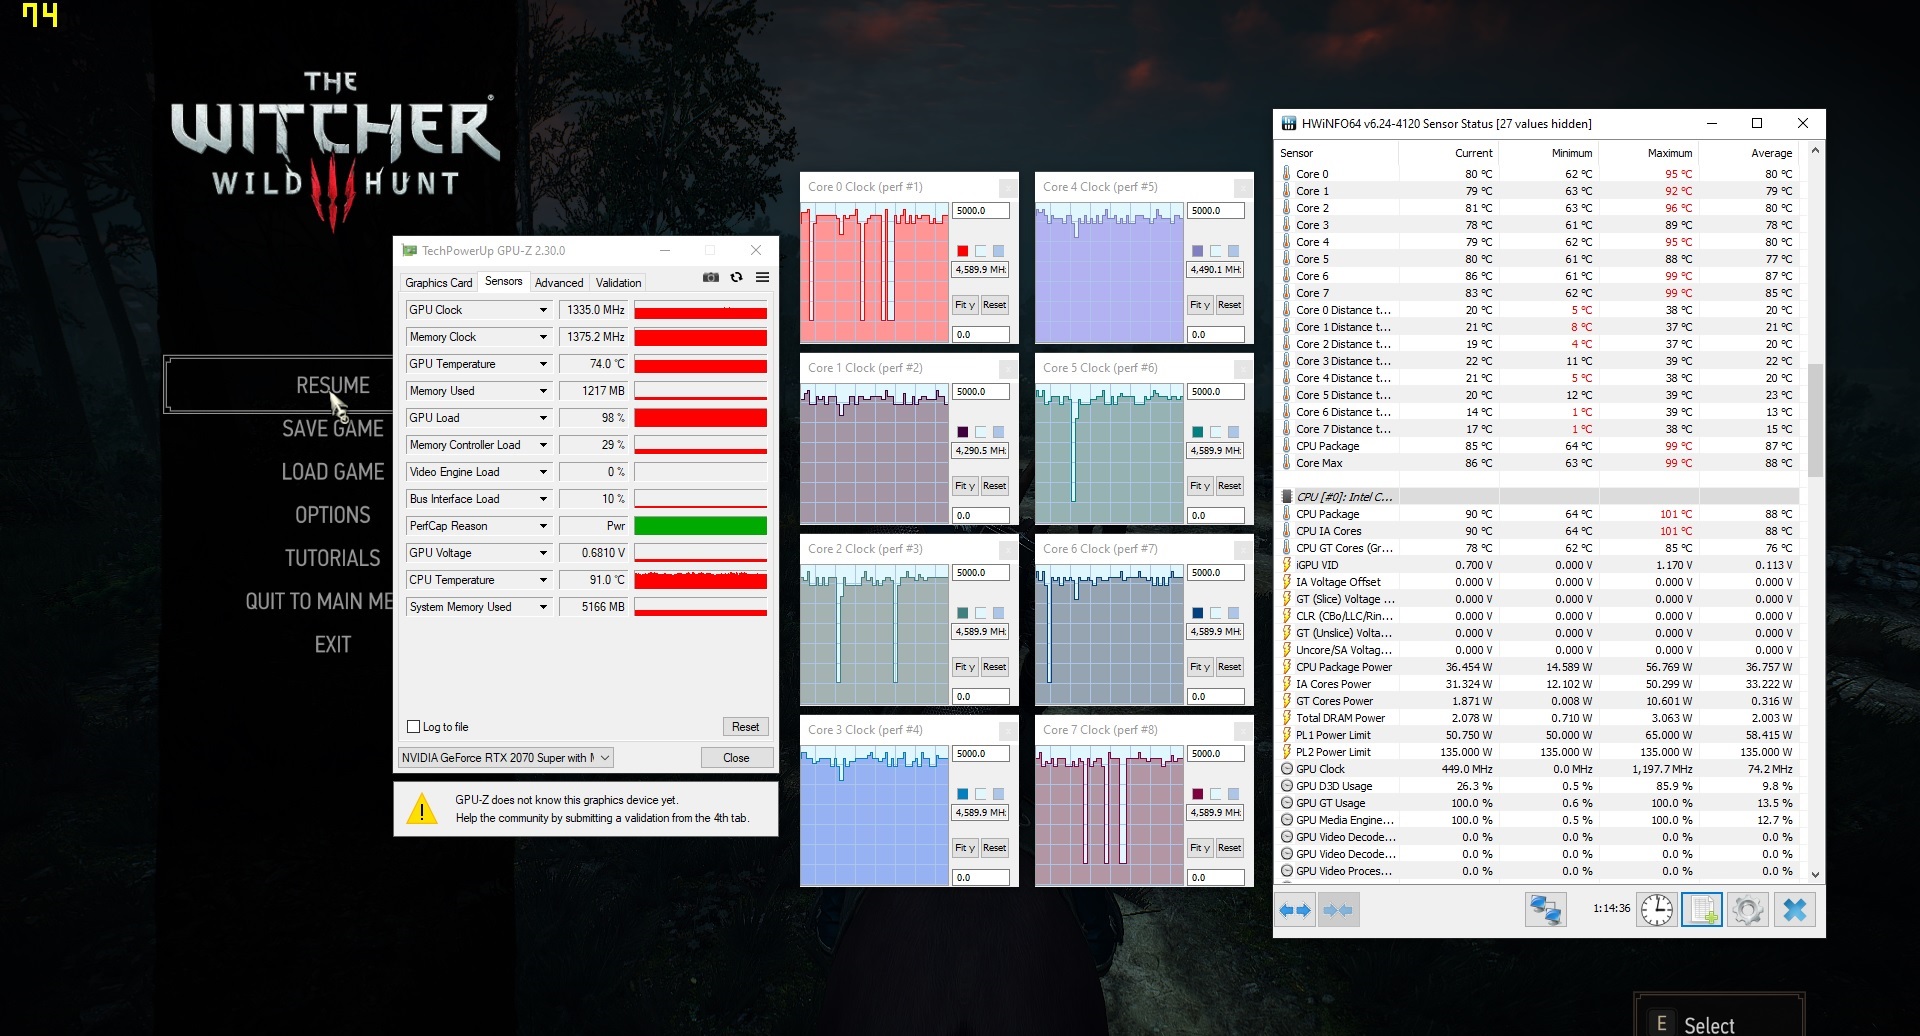
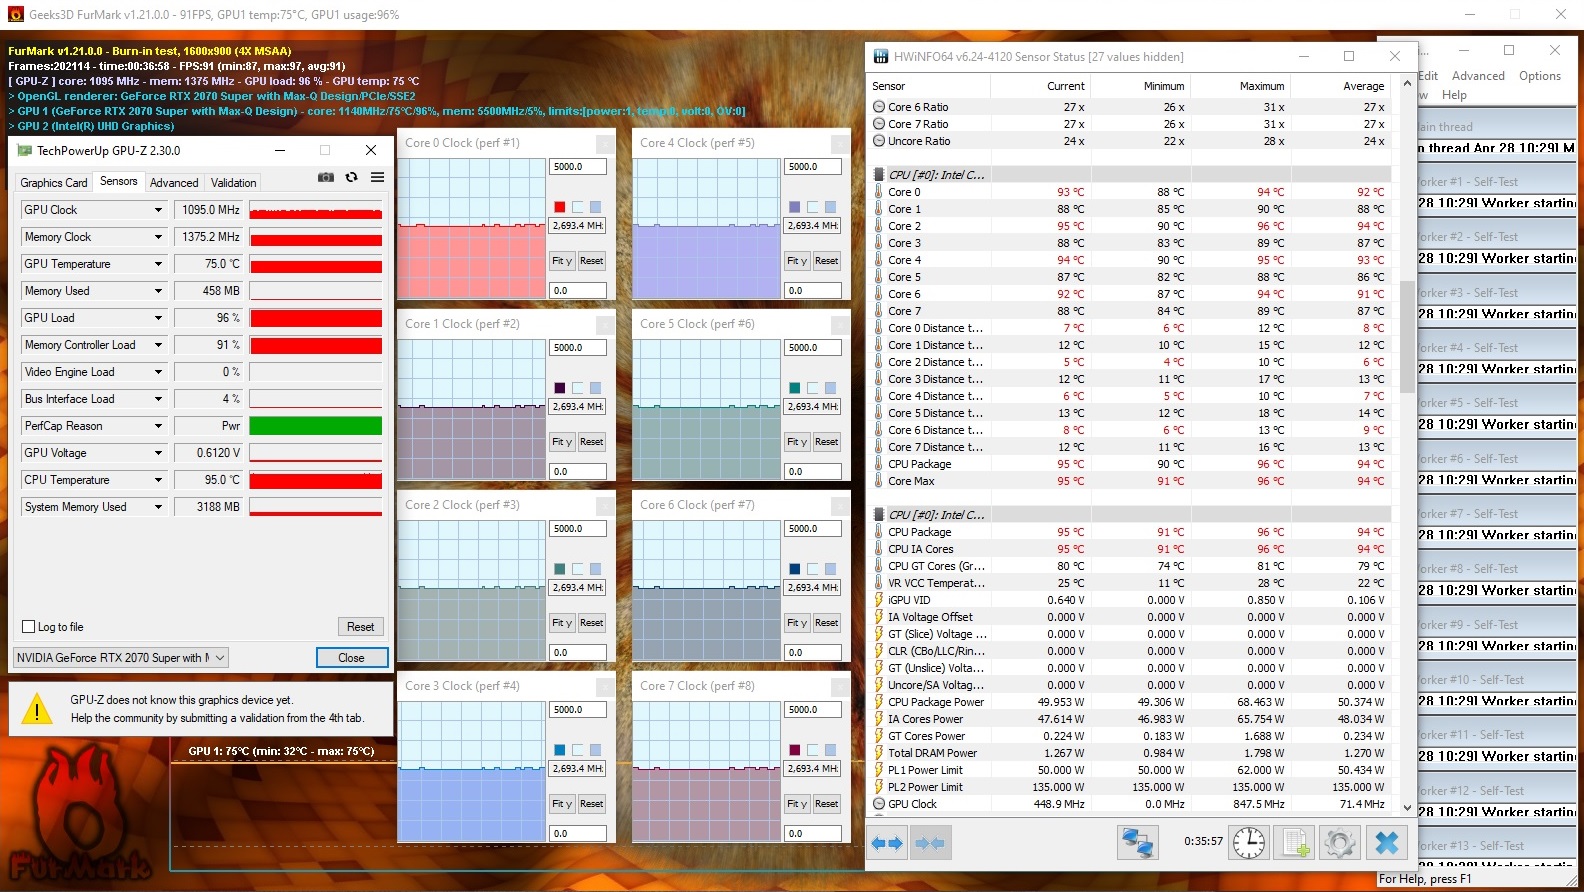
Things look worse for the processor. Although the Turbo hardly gets to do its work, the Core i9-10980HK settles at around 90 °C (194 °F) in the stress test. This is another indication that the CPU is not quite suitable for the case – particularly if you also consider the noise development, which is primarily due to the 10980HK in our experience.
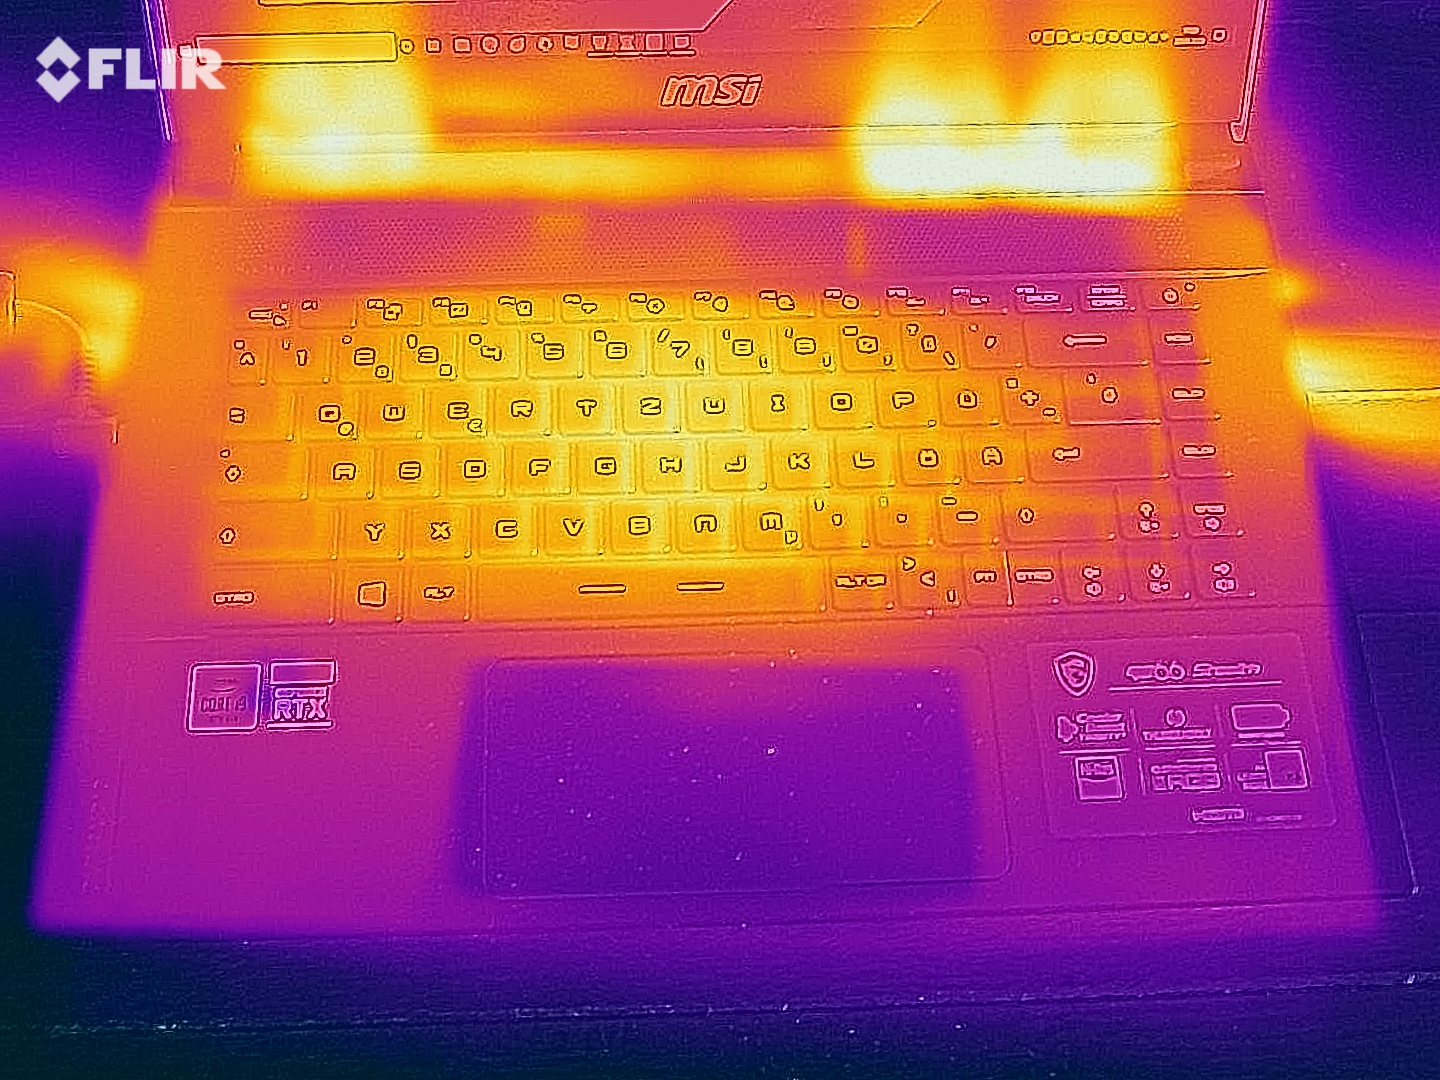
(-) The maximum temperature on the upper side is 53 °C / 127 F, compared to the average of 40.4 °C / 105 F, ranging from 21.2 to 68.8 °C for the class Gaming.
(-) The bottom heats up to a maximum of 55 °C / 131 F, compared to the average of 43.2 °C / 110 F
(+) In idle usage, the average temperature for the upper side is 26.8 °C / 80 F, compared to the device average of 33.9 °C / 93 F.
(-) Playing The Witcher 3, the average temperature for the upper side is 44 °C / 111 F, compared to the device average of 33.9 °C / 93 F.
(±) The palmrests and touchpad can get very hot to the touch with a maximum of 37 °C / 98.6 F.
(-) The average temperature of the palmrest area of similar devices was 28.8 °C / 83.8 F (-8.2 °C / -14.8 F).
| MSI GS66 Stealth 10SFS i9-10980HK, GeForce RTX 2070 Super Max-Q | Acer Predator Triton 500 PT515-51-71PZ i7-9750H, GeForce RTX 2070 Max-Q | Gigabyte Aero 15 Classic-XA i7-9750H, GeForce RTX 2070 Max-Q | HP Omen X 2S 15-dg0075cl i7-9750H, GeForce RTX 2070 Max-Q | Schenker XMG Neo 15 XNE15M19 i7-9750H, GeForce RTX 2070 Max-Q | |
|---|---|---|---|---|---|
| Heat | 0% | -10% | -24% | -13% | |
| Maximum Upper Side * (°C) | 53 | 49 8% | 58 -9% | 48.8 8% | 60 -13% |
| Maximum Bottom * (°C) | 55 | 59 -7% | 64 -16% | 55 -0% | 66 -20% |
| Idle Upper Side * (°C) | 28 | 28 -0% | 30 -7% | 41 -46% | 30 -7% |
| Idle Bottom * (°C) | 29 | 29 -0% | 31 -7% | 45.6 -57% | 32 -10% |
* ... smaller is better
Speakers
The 2.0 system of the GS66 is positioned on the left and right edge of the palm rest and offers a loud maximum volume (91 dB(A)). According to our audio analysis and subjective impressions, the sound leaves something to be desired. As typical for notebooks, it mainly lacks the bass. But the sound did not really impress us in other areas as well (dull, muddy sound spectrum). So for music, movies, and games, headphones are recommended.
MSI GS66 Stealth 10SFS audio analysis
(+) | speakers can play relatively loud (91 dB)
Bass 100 - 315 Hz
(-) | nearly no bass - on average 25.3% lower than median
(+) | bass is linear (6.8% delta to prev. frequency)
Mids 400 - 2000 Hz
(±) | higher mids - on average 9.2% higher than median
(±) | linearity of mids is average (8.3% delta to prev. frequency)
Highs 2 - 16 kHz
(+) | balanced highs - only 2.9% away from median
(+) | highs are linear (5.8% delta to prev. frequency)
Overall 100 - 16.000 Hz
(±) | linearity of overall sound is average (23.5% difference to median)
Compared to same class
» 85% of all tested devices in this class were better, 5% similar, 10% worse
» The best had a delta of 6%, average was 18%, worst was 132%
Compared to all devices tested
» 70% of all tested devices were better, 6% similar, 24% worse
» The best had a delta of 4%, average was 24%, worst was 134%
Acer Predator Triton 500 PT515-51-71PZ audio analysis
(±) | speaker loudness is average but good (80 dB)
Bass 100 - 315 Hz
(±) | reduced bass - on average 12.2% lower than median
(±) | linearity of bass is average (12.6% delta to prev. frequency)
Mids 400 - 2000 Hz
(+) | balanced mids - only 4.5% away from median
(+) | mids are linear (4.7% delta to prev. frequency)
Highs 2 - 16 kHz
(+) | balanced highs - only 2.2% away from median
(+) | highs are linear (3.2% delta to prev. frequency)
Overall 100 - 16.000 Hz
(+) | overall sound is linear (14.8% difference to median)
Compared to same class
» 29% of all tested devices in this class were better, 7% similar, 64% worse
» The best had a delta of 6%, average was 18%, worst was 132%
Compared to all devices tested
» 20% of all tested devices were better, 4% similar, 76% worse
» The best had a delta of 4%, average was 24%, worst was 134%
Power Management
Power Consumption
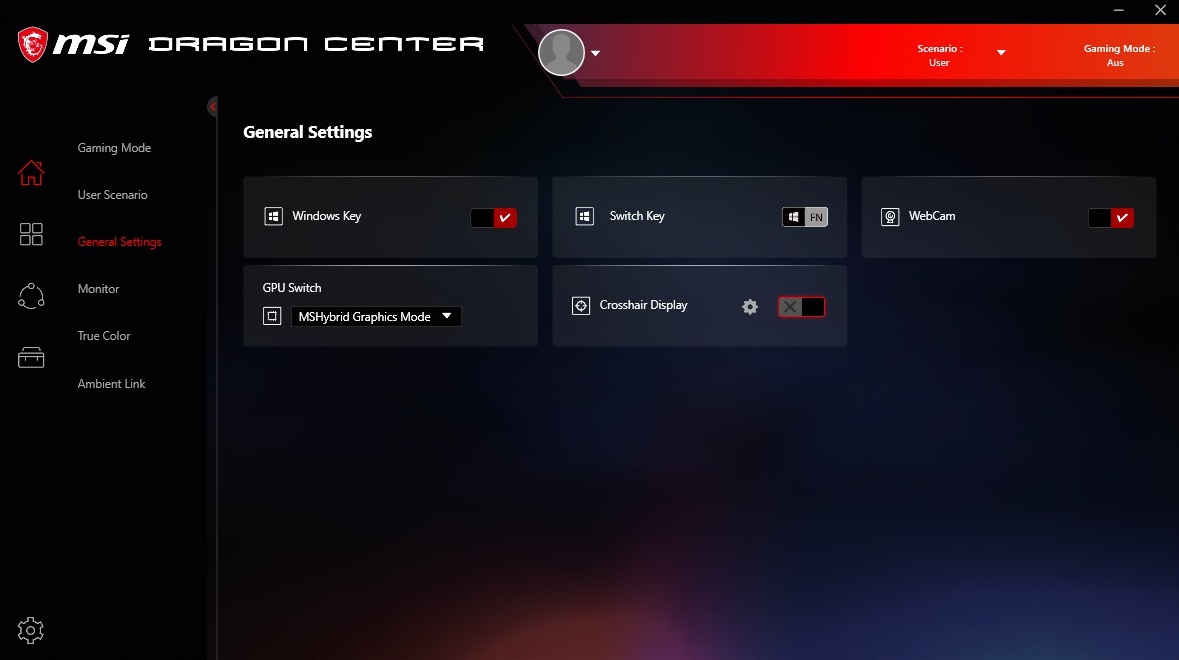
In order to keep the power consumption as low as possible, you should use graphics switching, which is activated by default (MSHybrid Graphics Mode @Dragon Center). Depending on the demands, Nvidia's Optimus technology switches between the dedicated GeForce GPU and the graphics unit integrated in the processor (Intel UHD Graphics 630). Thanks to these power savings, the GS66 only uses 13 to 27 watts during idle operation. Under load, our measurements showed between 109 and 236 watts, which is also acceptable for a high-end notebook.
| Off / Standby | |
| Idle | |
| Load |
|
Key:
min: | |
| MSI GS66 Stealth 10SFS i9-10980HK, GeForce RTX 2070 Super Max-Q | Acer Predator Triton 500 PT515-51-71PZ i7-9750H, GeForce RTX 2070 Max-Q | Gigabyte Aero 15 Classic-XA i7-9750H, GeForce RTX 2070 Max-Q | HP Omen X 2S 15-dg0075cl i7-9750H, GeForce RTX 2070 Max-Q | Schenker XMG Neo 15 XNE15M19 i7-9750H, GeForce RTX 2070 Max-Q | |
|---|---|---|---|---|---|
| Power Consumption | 24% | -17% | -109% | 15% | |
| Idle Minimum * (Watt) | 13 | 7 46% | 21 -62% | 46 -254% | 11 15% |
| Idle Average * (Watt) | 16 | 12 25% | 23 -44% | 59 -269% | 15 6% |
| Idle Maximum * (Watt) | 27 | 22 19% | 32 -19% | 65.5 -143% | 21 22% |
| Load Average * (Watt) | 109 | 86 21% | 97 11% | 99.8 8% | 94 14% |
| Witcher 3 ultra * (Watt) | 155 | 144 7% | 148 5% | 154.1 1% | 143 8% |
| Load Maximum * (Watt) | 236 | 177 25% | 213 10% | 222.7 6% | 173 27% |
* ... smaller is better
Battery Life
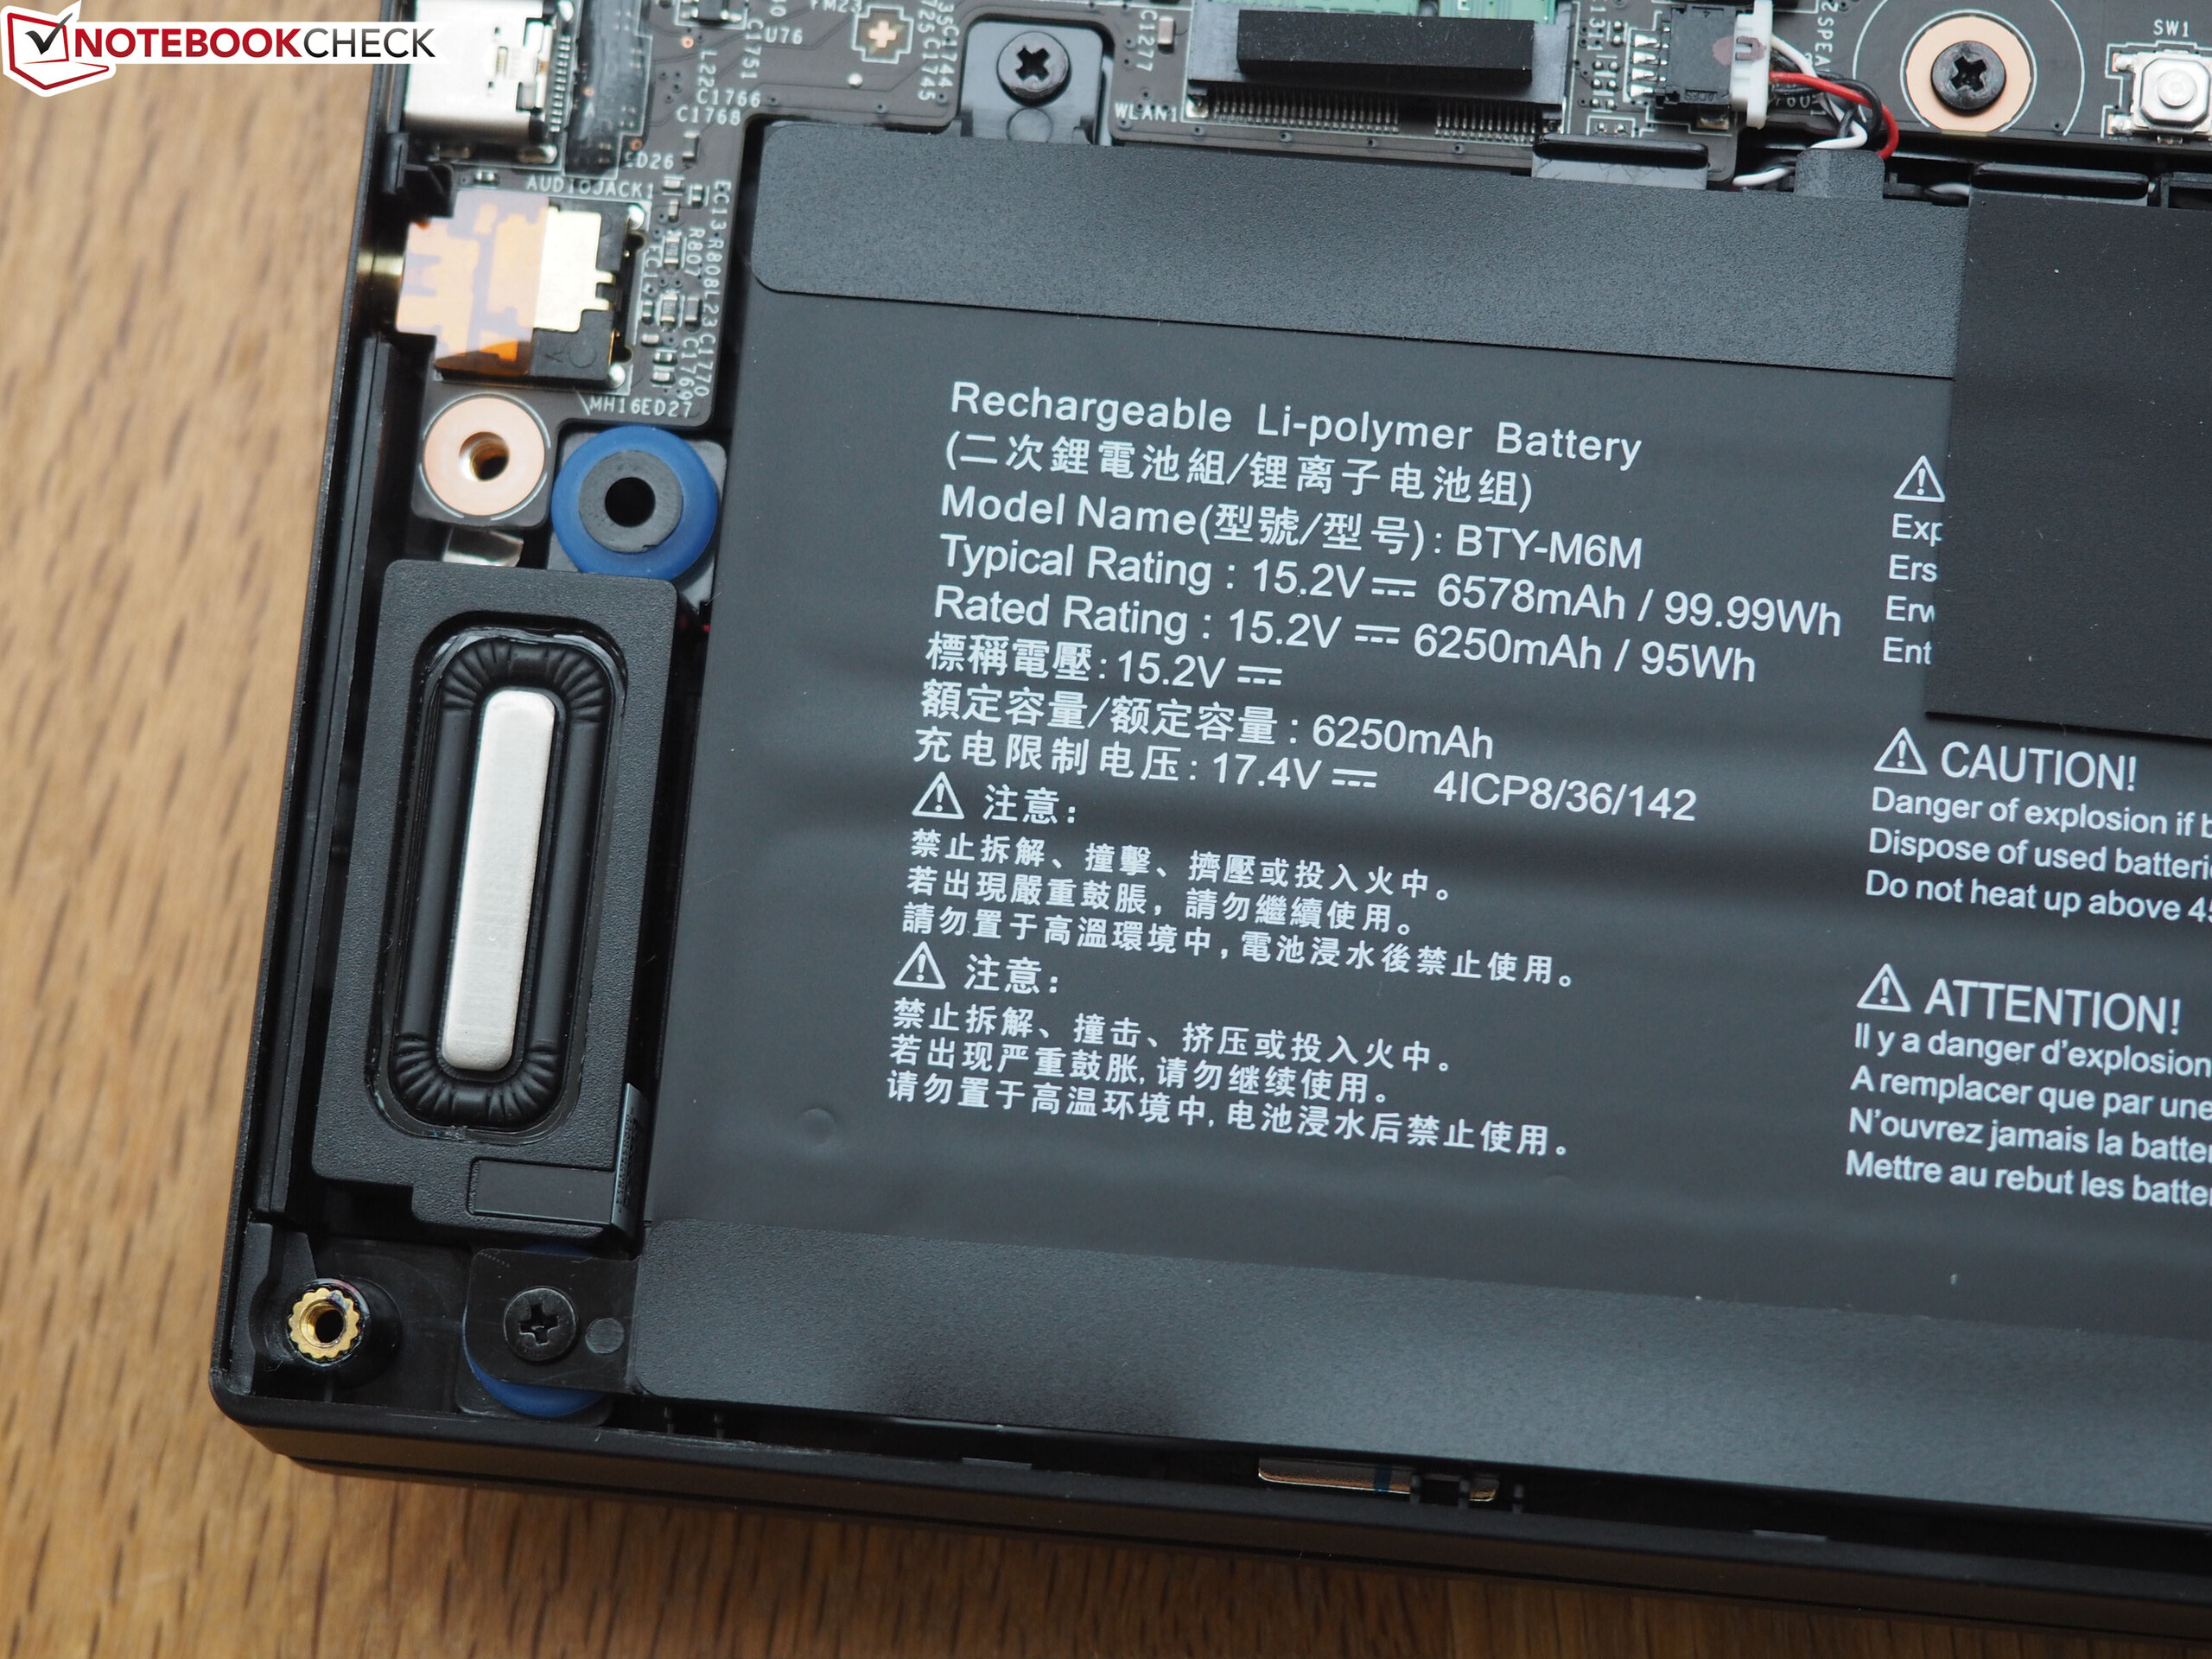
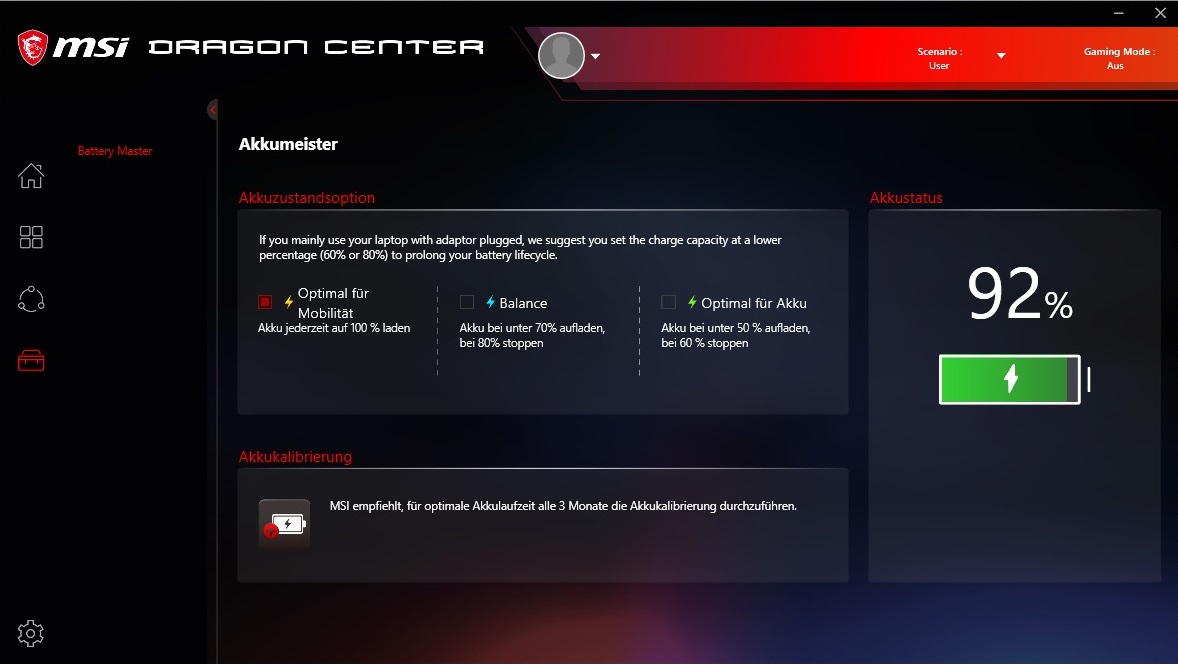
Where the GS65 still had to be content with an 82-Wh battery, the successor offers a huge 99.99 Wh. Even the Gigabyte Aero 15 Classic, which has been trimmed for mobility, is unable to reach this value (94 Wh). Most of the gaming laptops are only accompanied by 80 Wh. However, considering the ample capacity, the battery life is a bit disappointing. Okay, up to 8.5 hours under ideal conditions (no load, minimum display brightness) and about 6 hours of Internet surfing via WLAN at medium brightness level are still respectable for a high-end notebook, but the competitors achieve similar or in parts even better values with weaker batteries. So apparently the power management of the GS66 isn't quite optimal.
| MSI GS66 Stealth 10SFS i9-10980HK, GeForce RTX 2070 Super Max-Q, 99.99 Wh | Acer Predator Triton 500 PT515-51-71PZ i7-9750H, GeForce RTX 2070 Max-Q, Wh | Gigabyte Aero 15 Classic-XA i7-9750H, GeForce RTX 2070 Max-Q, 94.24 Wh | HP Omen X 2S 15-dg0075cl i7-9750H, GeForce RTX 2070 Max-Q, 72 Wh | Schenker XMG Neo 15 XNE15M19 i7-9750H, GeForce RTX 2070 Max-Q, 62 Wh | Average of class Gaming | |
|---|---|---|---|---|---|---|
| Battery runtime | 19% | 33% | -48% | -15% | 1% | |
| Reader / Idle (h) | 8.4 | 11.1 32% | 9.1 8% | 3.7 -56% | 7.3 -13% | 8.71 ? 4% |
| WiFi v1.3 (h) | 6.1 | 8 31% | 7 15% | 2.2 -64% | 5.7 -7% | 6.98 ? 14% |
| Load (h) | 1.7 | 1.6 -6% | 3 76% | 1.3 -24% | 1.3 -24% | 1.47 ? -14% |
| H.264 (h) | 6.8 | 8.26 ? |
Pros
Cons
Verdict
The GS66 represents clear progress compared to the GS65.
MSI has taken care of the most important complaints and provided more stability and maintenance options to the compact case. It also deserves some praise for the up-to-date connection equipment (Thunderbolt 3), the fast and contrast-rich 300-Hz panel, as well as the huge battery, even though that isn't quite able to live up to its potential.
We find the choice of the processor a bit hard to understand. While the Core i9-10980HK is of course very attractive from a marketing point of view and in terms of the gains, if the customer has to deal more with the disadvantages (very high temperature and noise development) than the advantages (higher performance potential) and the notebook is generally designed for mobility, we would not offer this option in the first place.
MSI GS66 Stealth 10SFS
- 05/17/2020 v7 (old)
Florian Glaser
Price comparison

