Notebook reviews with NVIDIA GeForce RTX 2080 Super Max-Q graphics card
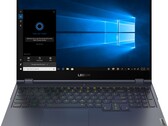
Lenovo Legion 7 15IMH05 (Legion 7i) Laptop Review: Top performance and display
With a GeForce RTX 2080 Super, an Intel Core i9-10980HK, and a 240-Hz display, the Legion 7 is clearly targeted toward gamers that don't want to make any compromises in terms of performance even on the road. We find out in our test, whether the compact 15-inch laptop is able to control the heat development.
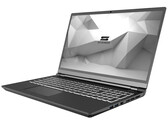
Intel Core i9-10980HK, NVIDIA GeForce RTX 2080 Super Max-Q, 15.6", 2.4 kgSchenker Key 15 (Clevo PC50DN2) in review: A lot of performance in a slim, compact case
Thanks to its powerful hardware, the soberly designed Schenker Key 15 brings all the latest computer games smoothly onto the matte 15.6-inch screen (Full HD, IPS, 144 Hz). The device can be individually customized to your own needs. In addition, the BIOS enables the undervolting of the CPU and iGPU.
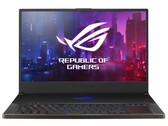
Intel Core i7-10875H, NVIDIA GeForce RTX 2080 Super Max-Q, 15.6", 2 kgAsus ROG Zephyrus S17 Laptop Review: Slim Gigantic Gaming Notebook with 300-Hz Panel
Asus wants to combine those characteristics in the Zephyrus S17. With Nvidia's RTX 2080 Super in the Max-Q design and a powerful Intel Core i7-10875H, the basic requirements are fulfilled, and using various tricks, sufficient cooling is supposed to be ensured. Our review clarifies whether this concept also really works in practice.
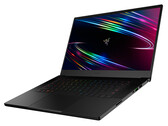
Intel Core i7-10875H, NVIDIA GeForce RTX 2080 Super Max-Q, 17.3", 2.6 kgRazer Blade 15 Advanced Model (2020) in review: Detail improvements pay off
Razer's compact 15.6-incher is packed with powerful hardware that brings all the latest games smoothly onto the matte Full HD screen (300 Hz, IPS). There's also an NVMe SSD, 16 GB of RAM, and a Thunderbolt 3 port.
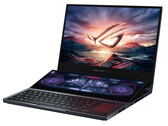
Intel Core i7-10875H, NVIDIA GeForce RTX 2080 Super Max-Q, 15.6", 2.2 kgAsus ROG Zephyrus Duo 15 GX550LXS in Review: Unique Gaming Laptop with Lots of Performance Below the Hood
With its powerful hardware, the Zephyrus Duo manages to display the latest games smoothly on its matte 4K screen (IPS, Pantone-validated, 100% AdobeRGB, G-Sync). There are other great features as well: 2x NVMe SSD (RAID 0), 32 GB of RAM (in dual-channel mode), Thunderbolt 3. Additionally, the laptop comes with many accessories.
Intel Core i9-10980HK, NVIDIA GeForce RTX 2080 Super Max-Q, 15.6", 2.5 kgMSI Creator 17 A10SGS: Intel Core i7-10875H, 17.30", 2.4 kg
Review » MSI Creator 17 A10SGS Laptop Review: Winning with a Mini LED
MSI GS66 10SGS: Intel Core i7-10750H, 15.60", 2.2 kg
Review » MSI GS66 Stealth 10SGS Laptop Review: Core i7 or Core i9?
Acer Predator Triton 500 PT515-52-70N3: Intel Core i7-10750H, 15.60", 2.1 kg
Review » Acer Predator Triton 500 laptop review: Superstar
Lenovo Legion 7 15IMH05-81YT001VGE: Intel Core i9-10980HK, 15.60", 2.4 kg
External Review » Lenovo Legion 7 15IMH05-81YT001VGE
Asus Zephyrus S15 GX502LXS-XS79: Intel Core i7-10875H, 15.60", 2 kg
External Review » Asus Zephyrus S15 GX502LXS-XS79
Lenovo Legion 7 15IMHG05-81YU0007FR: Intel Core i7-10875H, 15.60", 2.3 kg
External Review » Lenovo Legion 7 15IMHG05-81YU0007FR
MSI GS66 10SGS-084NL: Intel Core i9-10980HK, 15.60", 2.1 kg
External Review » MSI GS66 10SGS-084NL
Acer ConceptD 7 Ezel CC715-71-7163: Intel Core i7-10750H, 15.60", 2.5 kg
External Review » Acer ConceptD 7 Ezel CC715-71-7163
Asus ROG Zephyrus Duo 15 GX550LXS-HC060T: Intel Core i9-10980HK, 15.60", 2.4 kg
External Review » Asus ROG Zephyrus Duo 15 GX550LXS-HC060T
Asus ROG Zephyrus S15 GX502LXS-HF012T: Intel Core i7-10750H, 15.60", 1.9 kg
External Review » Asus ROG Zephyrus S15 GX502LXS-HF012T
Lenovo Legion 7 15IMH05-81YT001UGE: Intel Core i7-10750H, 15.60", 2.3 kg
External Review » Lenovo Legion 7 15IMH05-81YT001UGE
MSI GE66 Raider 10SGS-062RU: Intel Core i9-10980HK, 15.60", 2.4 kg
External Review » MSI GE66 Raider 10SGS-062RU
MSI GE66 Raider 10SGS-498XES: Intel Core i7-10875H, 15.60", 2.4 kg
External Review » MSI GE66 Raider 10SGS-498XES
MSI Creator 17 A10SGS: Intel Core i7-10875H, 17.30", 2.4 kg
External Review » MSI Creator 17 A10SGS
Alienware m15 R3, 10980HK RTX 2080 Super Max Q: Intel Core i9-10980HK, 15.60", 2.5 kg
External Review » Alienware m15 R3, 10980HK RTX 2080 Super Max Q
Origin PC EVO15-S 2020: Intel Core i7-10875H, 15.60", 2 kg
External Review » Origin PC EVO15-S 2020
Lenovo Legion 7i-81YU0035SB: Intel Core i7-10875H, 15.60", 2.3 kg
External Review » Lenovo Legion 7i-81YU0035SB
Razer Blade 15 Advanced Edition, i7-10875H, RTX 2080 Super Max-Q: Intel Core i7-10875H, 15.60", 2.2 kg
External Review » Razer Blade 15 Advanced Edition, i7-10875H, RTX 2080 Super Max-Q
Asus ROG Zephyrus S GX701L: Intel Core i7-10875H, 17.30", 2.6 kg
External Review » Asus ROG Zephyrus S GX701L
Asus Zephyrus S17 GX701LXS: Intel Core i7-10875H, 17.30", 2.6 kg
External Review » Asus Zephyrus S17 GX701LXS
Razer Blade 15 RTX 2080 Super Max-Q: Intel Core i7-10875H, 15.60", 2.2 kg
External Review » Razer Blade 15 RTX 2080 Super Max-Q
Asus Strix Scar 17 G732LXS-XS99: Intel Core i9-10980HK, 17.30", 2.9 kg
External Review » Asus Strix Scar 17 G732LXS-XS99
MSI GE66 10SGS-074: Intel Core i9-10980HK, 15.60", 2.3 kg
External Review » MSI GE66 10SGS-074
Aorus 17X YB-9UK2452MP: Intel Core i9-10980HK, 17.30", 3.8 kg
External Review » Aorus 17X YB-9UK2452MP
MSI GS66 10SGS-205: Intel Core i9-10980HK, 15.60", 2.1 kg
External Review » MSI GS66 10SGS-205
Lenovo Legion 7 15IMH05-81YT000UGE: Intel Core i7-10750H, 15.60", 2.3 kg
External Review » Lenovo Legion 7 15IMH05-81YT000UGE
Razer Blade Pro 17 RTX 2080 Super Max-Q: Intel Core i7-10875H, 17.30", 2.8 kg
External Review » Razer Blade Pro 17 RTX 2080 Super Max-Q
Asus ROG Zephyrus Duo 15 GX550LXS: Intel Core i9-10980HK, 15.60", 2.5 kg
External Review » Asus ROG Zephyrus Duo 15 GX550LXS
Asus Zephyrus S15 GX502LXS-HF038T: Intel Core i7-10875H, 15.60", 2 kg
External Review » Asus Zephyrus S15 GX502LXS-HF038T
Aorus 15G YB-8DE2130MH: Intel Core i7-10875H, 15.60", 2.2 kg
External Review » Aorus 15G YB-8DE2130MH
Acer Predator Triton 500 PT515-52-70N3: Intel Core i7-10750H, 15.60", 2.1 kg
External Review » Acer Predator Triton 500 PT515-52-70N3
Lenovo Legion 7i: Intel Core i9-10980HK, 15.60", 2.2 kg
External Review » Lenovo Legion 7i
MSI GS66 10SGS: Intel Core i7-10750H, 15.60", 2.2 kg
External Review » MSI GS66 10SGS
Article » Staying secure in the new normal: How AMD Ryzen Pro processors ensure 24x7 protection for your critical data
Article » MSI laptops are the ideal Holiday season gifts for the avid gamer or content producer in your life
Lenovo Legion 7 15IMH05-81YT001VGE: Intel Core i9-10980HK, 15.60", 2.4 kg
» The Lenovo Legion 7 is equipped with a breathtaking 240-Hz display
Schenker Key 15 Comet Lake: Intel Core i7-10875H, 15.60", 2 kg
» The Schenker Key 15 gaming laptop weighs just under 2 kg
Asus Zephyrus S17 GX701LXS: Intel Core i7-10875H, 17.30", 2.6 kg
» Asus ROG Zephyrus S17: A Large Gamer with the RTX 2080 Super Max-Q
Razer Blade 15 RTX 2080 Super Max-Q: Intel Core i7-10875H, 15.60", 2.2 kg
» A 300 Hz display for the Razer Blade 15 Advanced Model (2020)
Asus ROG Zephyrus Duo 15 GX550LXS: Intel Core i9-10980HK, 15.60", 2.5 kg
» Asus' high-tech Zephyrus Duo 15 GX550LXS comes with many accessories
MSI Creator 17 A10SGS: Intel Core i7-10875H, 17.30", 2.4 kg
» MSI Creator 17: A great display in a weak case
MSI GS66 10SGS: Intel Core i7-10750H, 15.60", 2.2 kg
» The MSI GS66 has an annoying counterintuitive feature that we can't wrap our heads around
Acer Predator Triton 500 PT515-52-70N3: Intel Core i7-10750H, 15.60", 2.1 kg
» Acer Predator Triton 500: Opening night for the RTX 2080 Super Max-Q