Schenker Key 15 (Clevo PC50DN2) in review: A lot of performance in a slim, compact case

With the Key 15, Schenker has a compact, lightweight 15.6-inch gaming laptop in its range that is equipped with powerful hardware. The test device provided to us is powered by a Core i7-10875H octa-core processor and a GeForce RTX 2080 Super Max-Q GPU. The computer is based on the PC50DN2 barebone from Clevo. Its competitors include devices like the MSI GS66 10SGS, the Aorus 15G XB, the Razer Blade 15 Advanced Model (2020), the Gigabyte Aero 15 XB, and the Acer Predator Triton 500.
Rating | Date | Model | Weight | Height | Size | Resolution | Price |
|---|---|---|---|---|---|---|---|
| 84.5 % v7 (old) | 09 / 2020 | Schenker Key 15 Comet Lake i7-10875H, GeForce RTX 2080 Super Max-Q | 2 kg | 19.8 mm | 15.60" | 1920x1080 | |
| 84 % v7 (old) | 05 / 2020 | MSI GS66 10SGS i7-10750H, GeForce RTX 2080 Super Max-Q | 2.2 kg | 20 mm | 15.60" | 1920x1080 | |
| 86.5 % v7 (old) | 08 / 2020 | Aorus 15G XB i7-10875H, GeForce RTX 2070 Super Max-Q | 2.3 kg | 25 mm | 15.60" | 1920x1080 | |
| 85.9 % v7 (old) | 08 / 2020 | Razer Blade 15 RTX 2080 Super Max-Q i7-10875H, GeForce RTX 2080 Super Max-Q | 2.2 kg | 17.8 mm | 15.60" | 1920x1080 | |
| 85.8 % v7 (old) | 05 / 2020 | Gigabyte Aero 15 OLED XB-8DE51B0SP i7-10875H, GeForce RTX 2070 Super Max-Q | 2.2 kg | 20 mm | 15.60" | 3840x2160 | |
v (old) | 04 / 2020 | Acer Predator Triton 500 PT515-52-70N3 i7-10750H, GeForce RTX 2080 Super Max-Q | 2.1 kg | 18 mm | 15.60" | 1920x1080 |
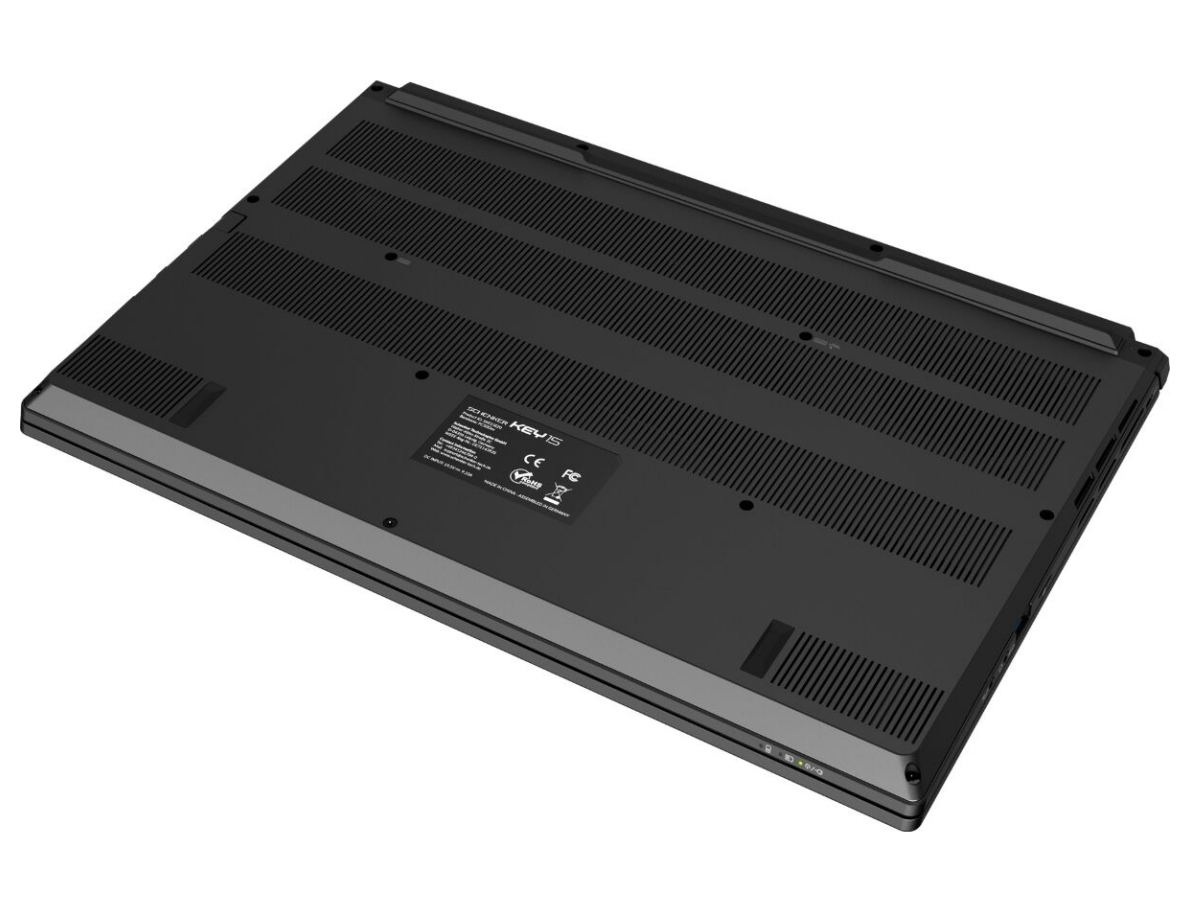
Case - The Key 15 features a metal chassis
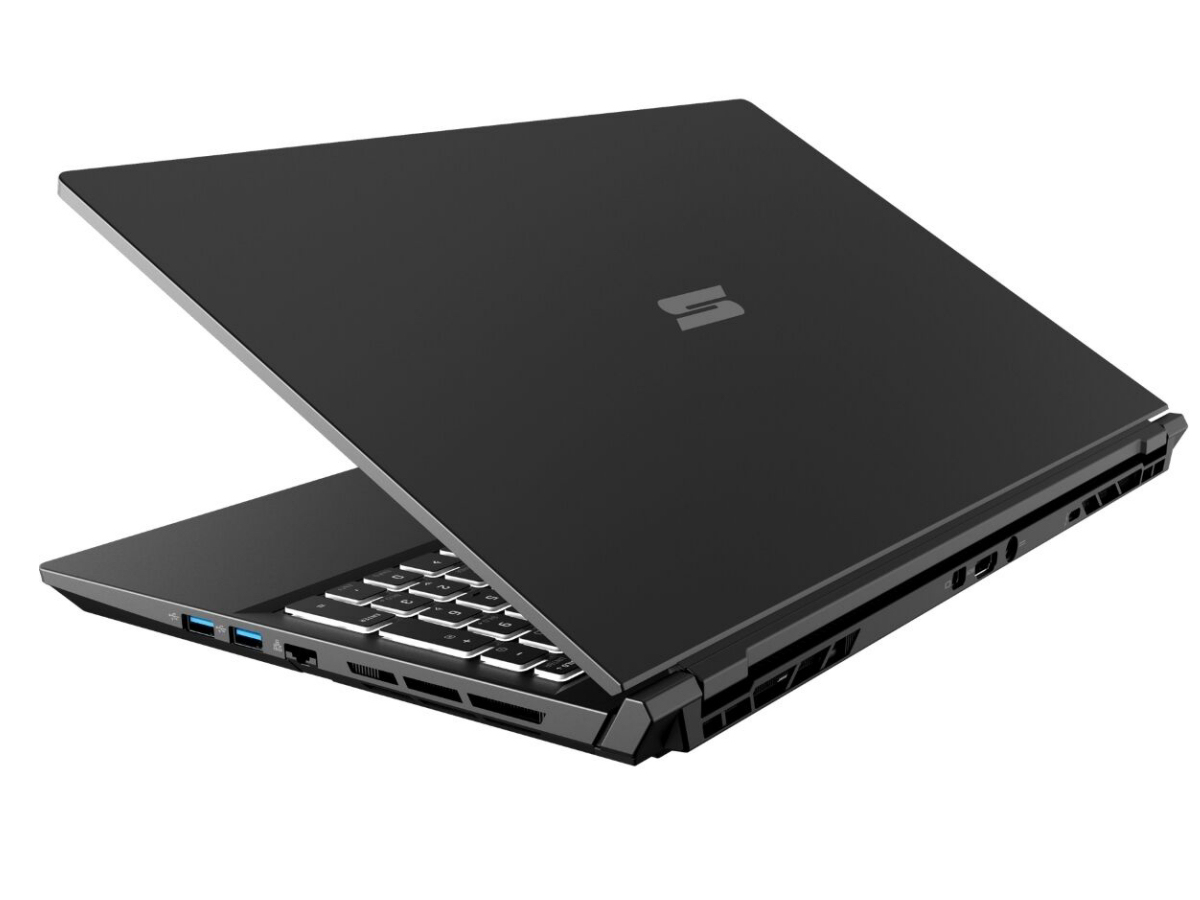
The term "inconspicuous" describes the Key 15 quite well. Schenker has chosen a sober look without any frills here. The device's appearance doesn't correspond to the typical gaming-laptop scheme but rather to a dapper business laptop. It wouldn't attract attention in any office in the world. Furthermore, the matte black chassis is made of metal. Only the display bezel is made of plastic. In addition, the battery is firmly installed, and there is no maintenance hatch.
The case shows good workmanship. The gap dimensions are in order, and sharp edges aren't noticeable. The base unit and the lid in particular can be twisted a bit too much. A higher degree of rigidity would be appropriate here. Moreover, exerting pressure on the backside of the lid doesn't lead to changes in the image. The hinges hold the lid firmly in position, but they do let it wobble a bit. The maximum aperture angle is about 130°, and opening the lid with one hand is possible.
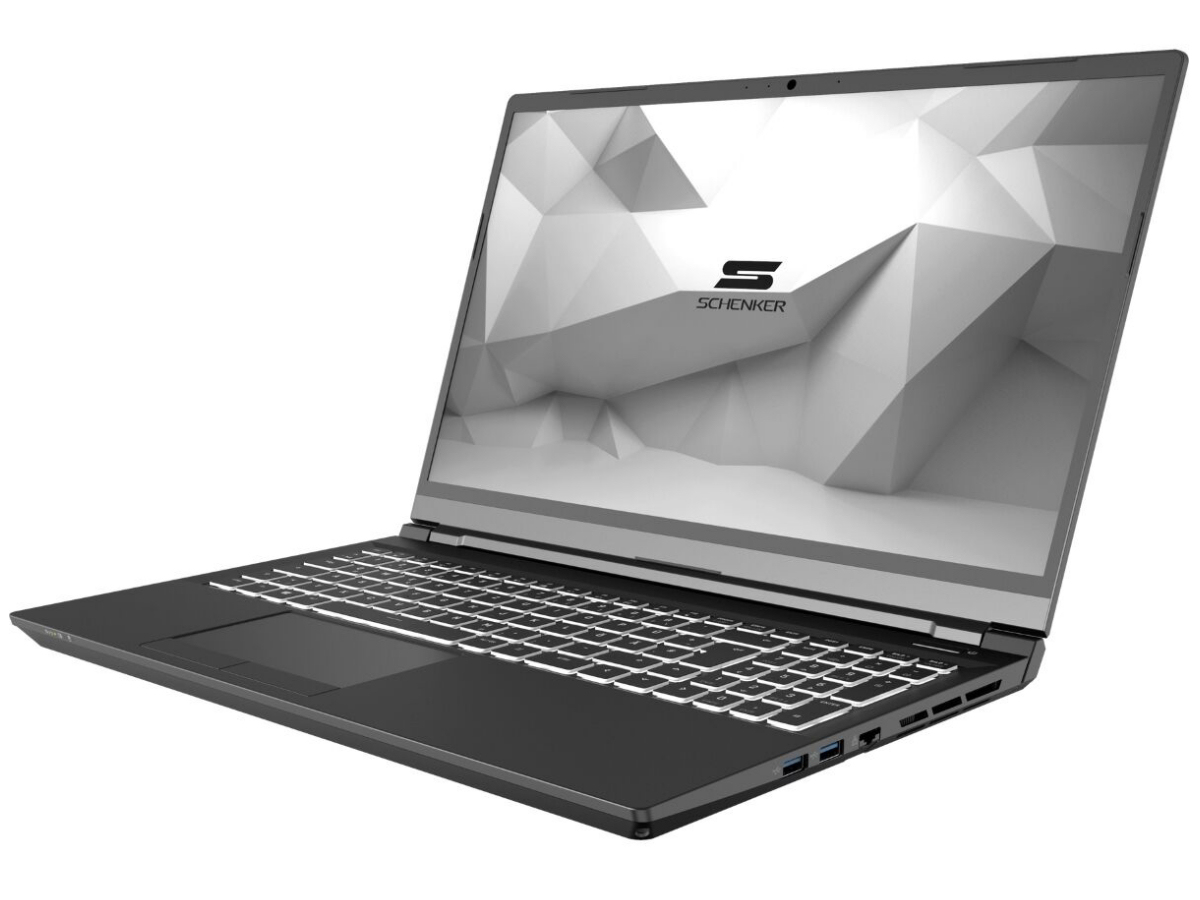

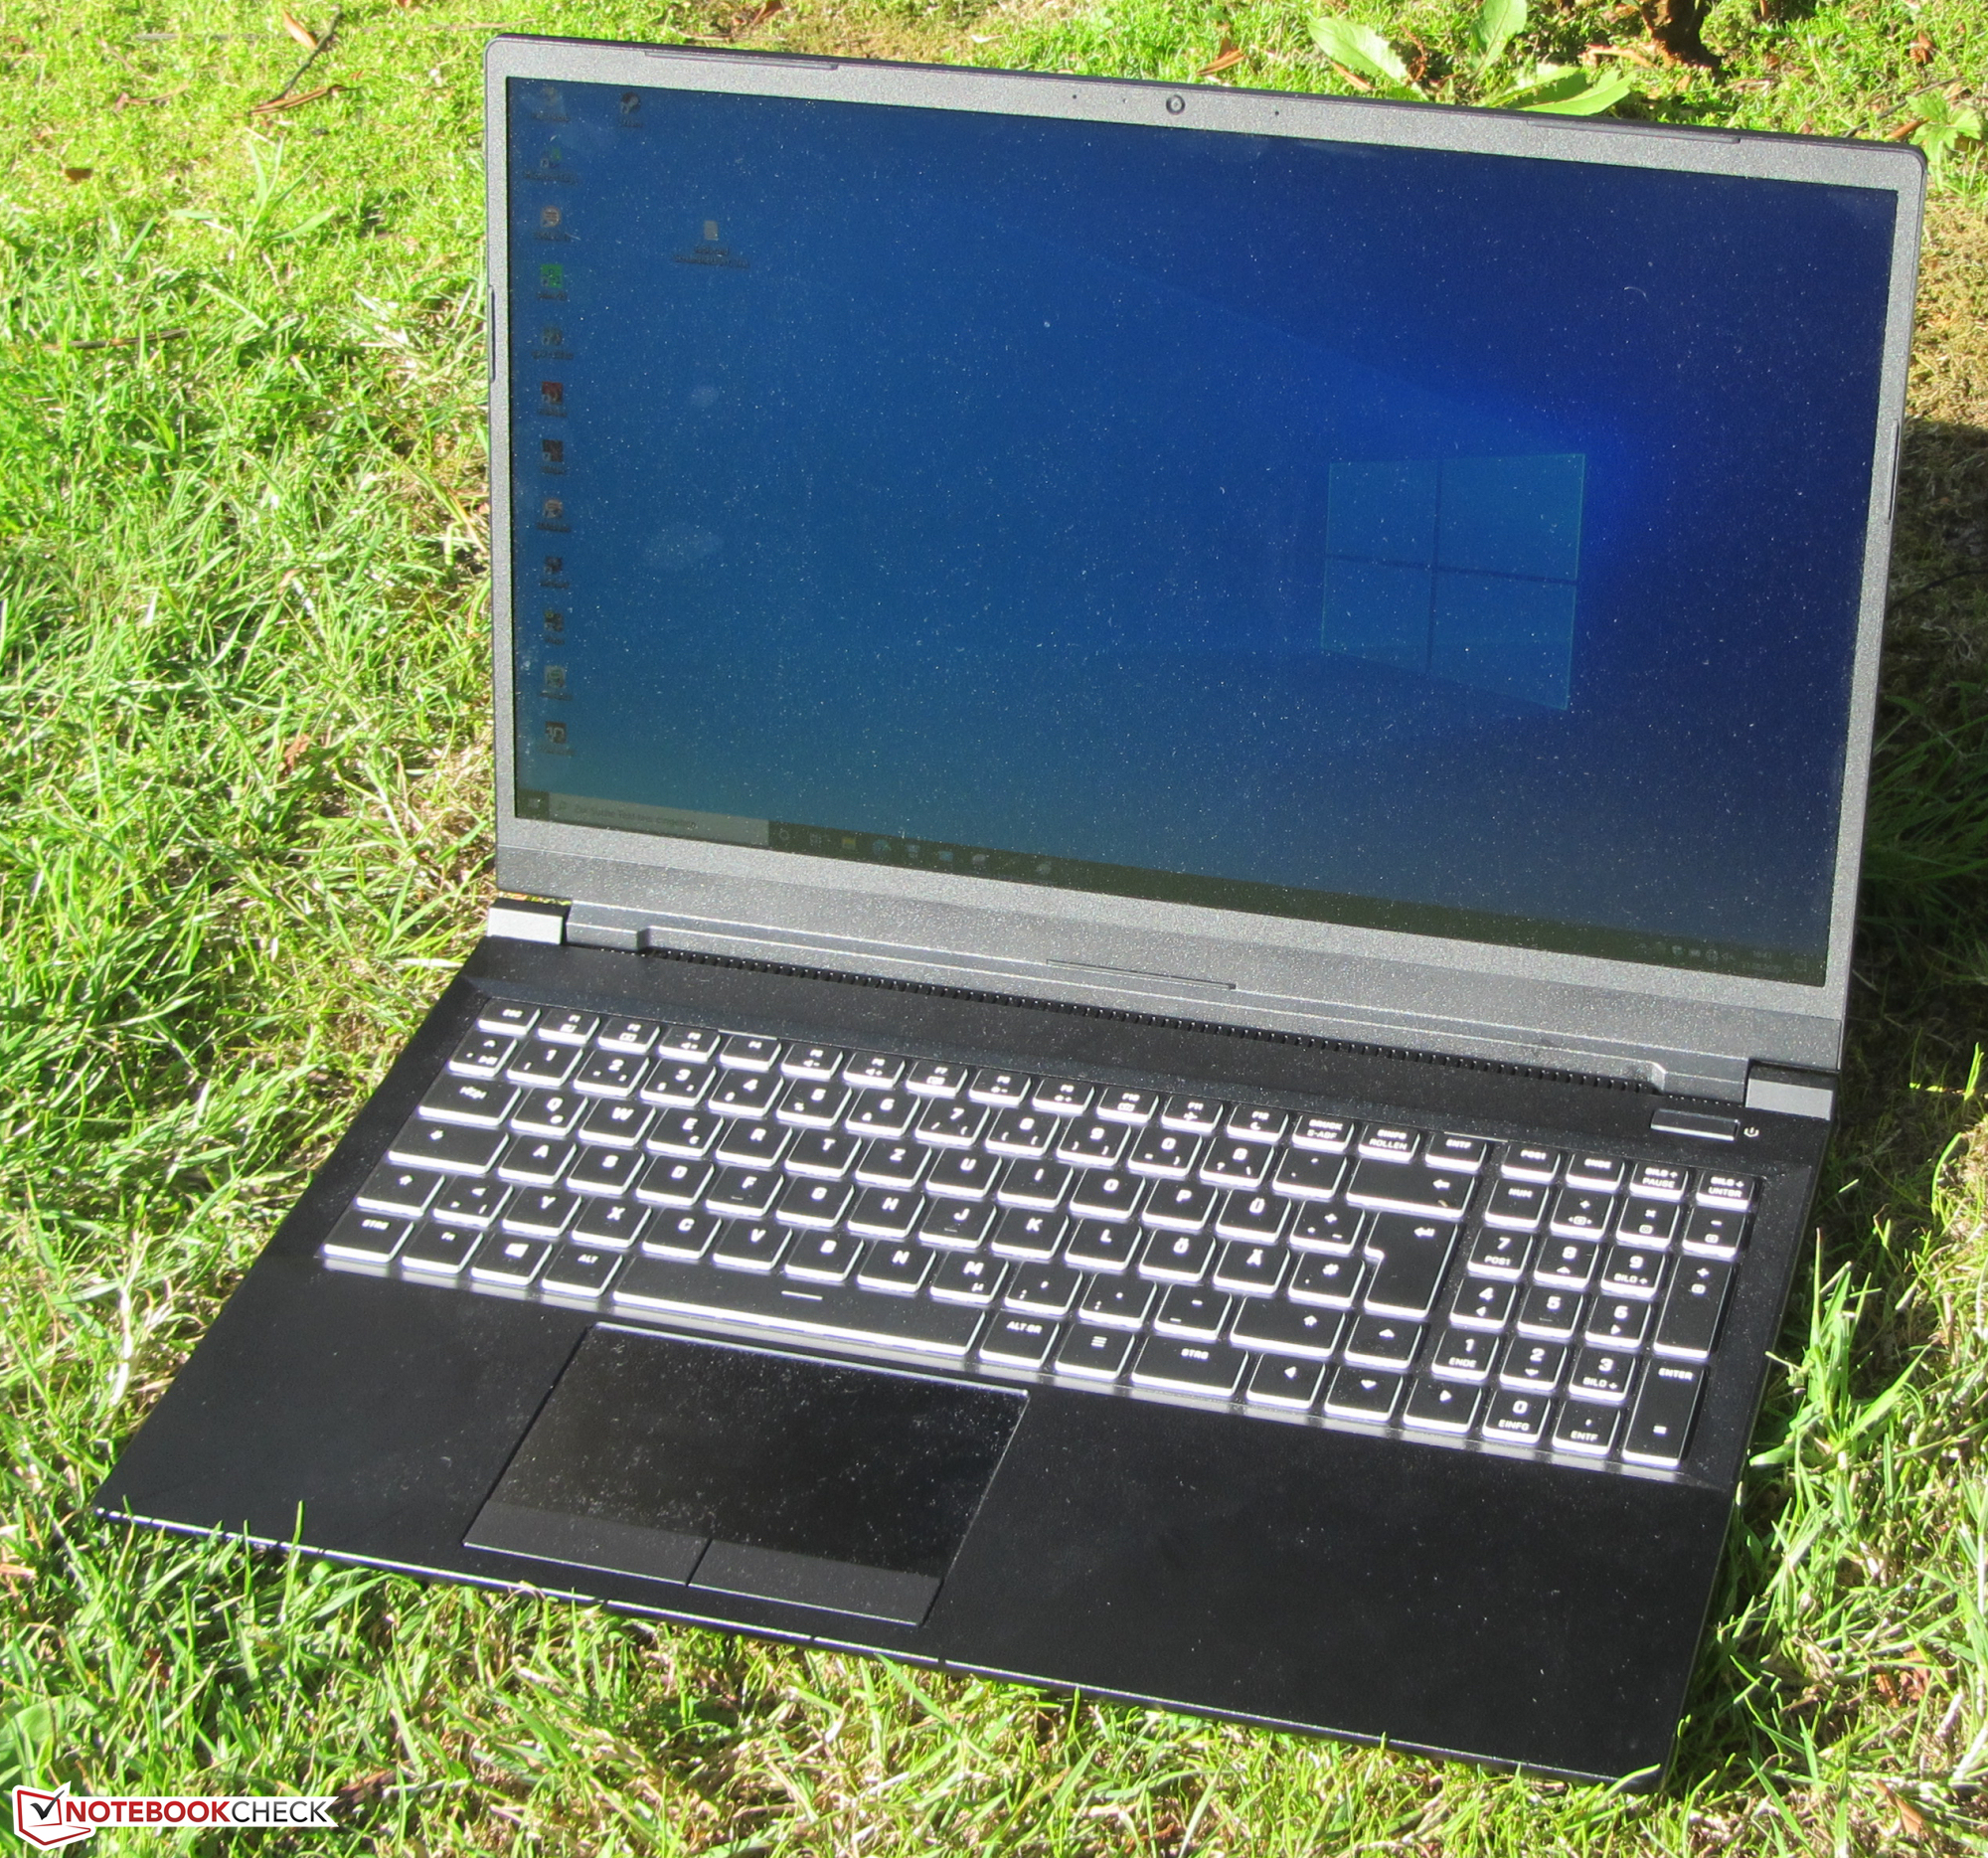
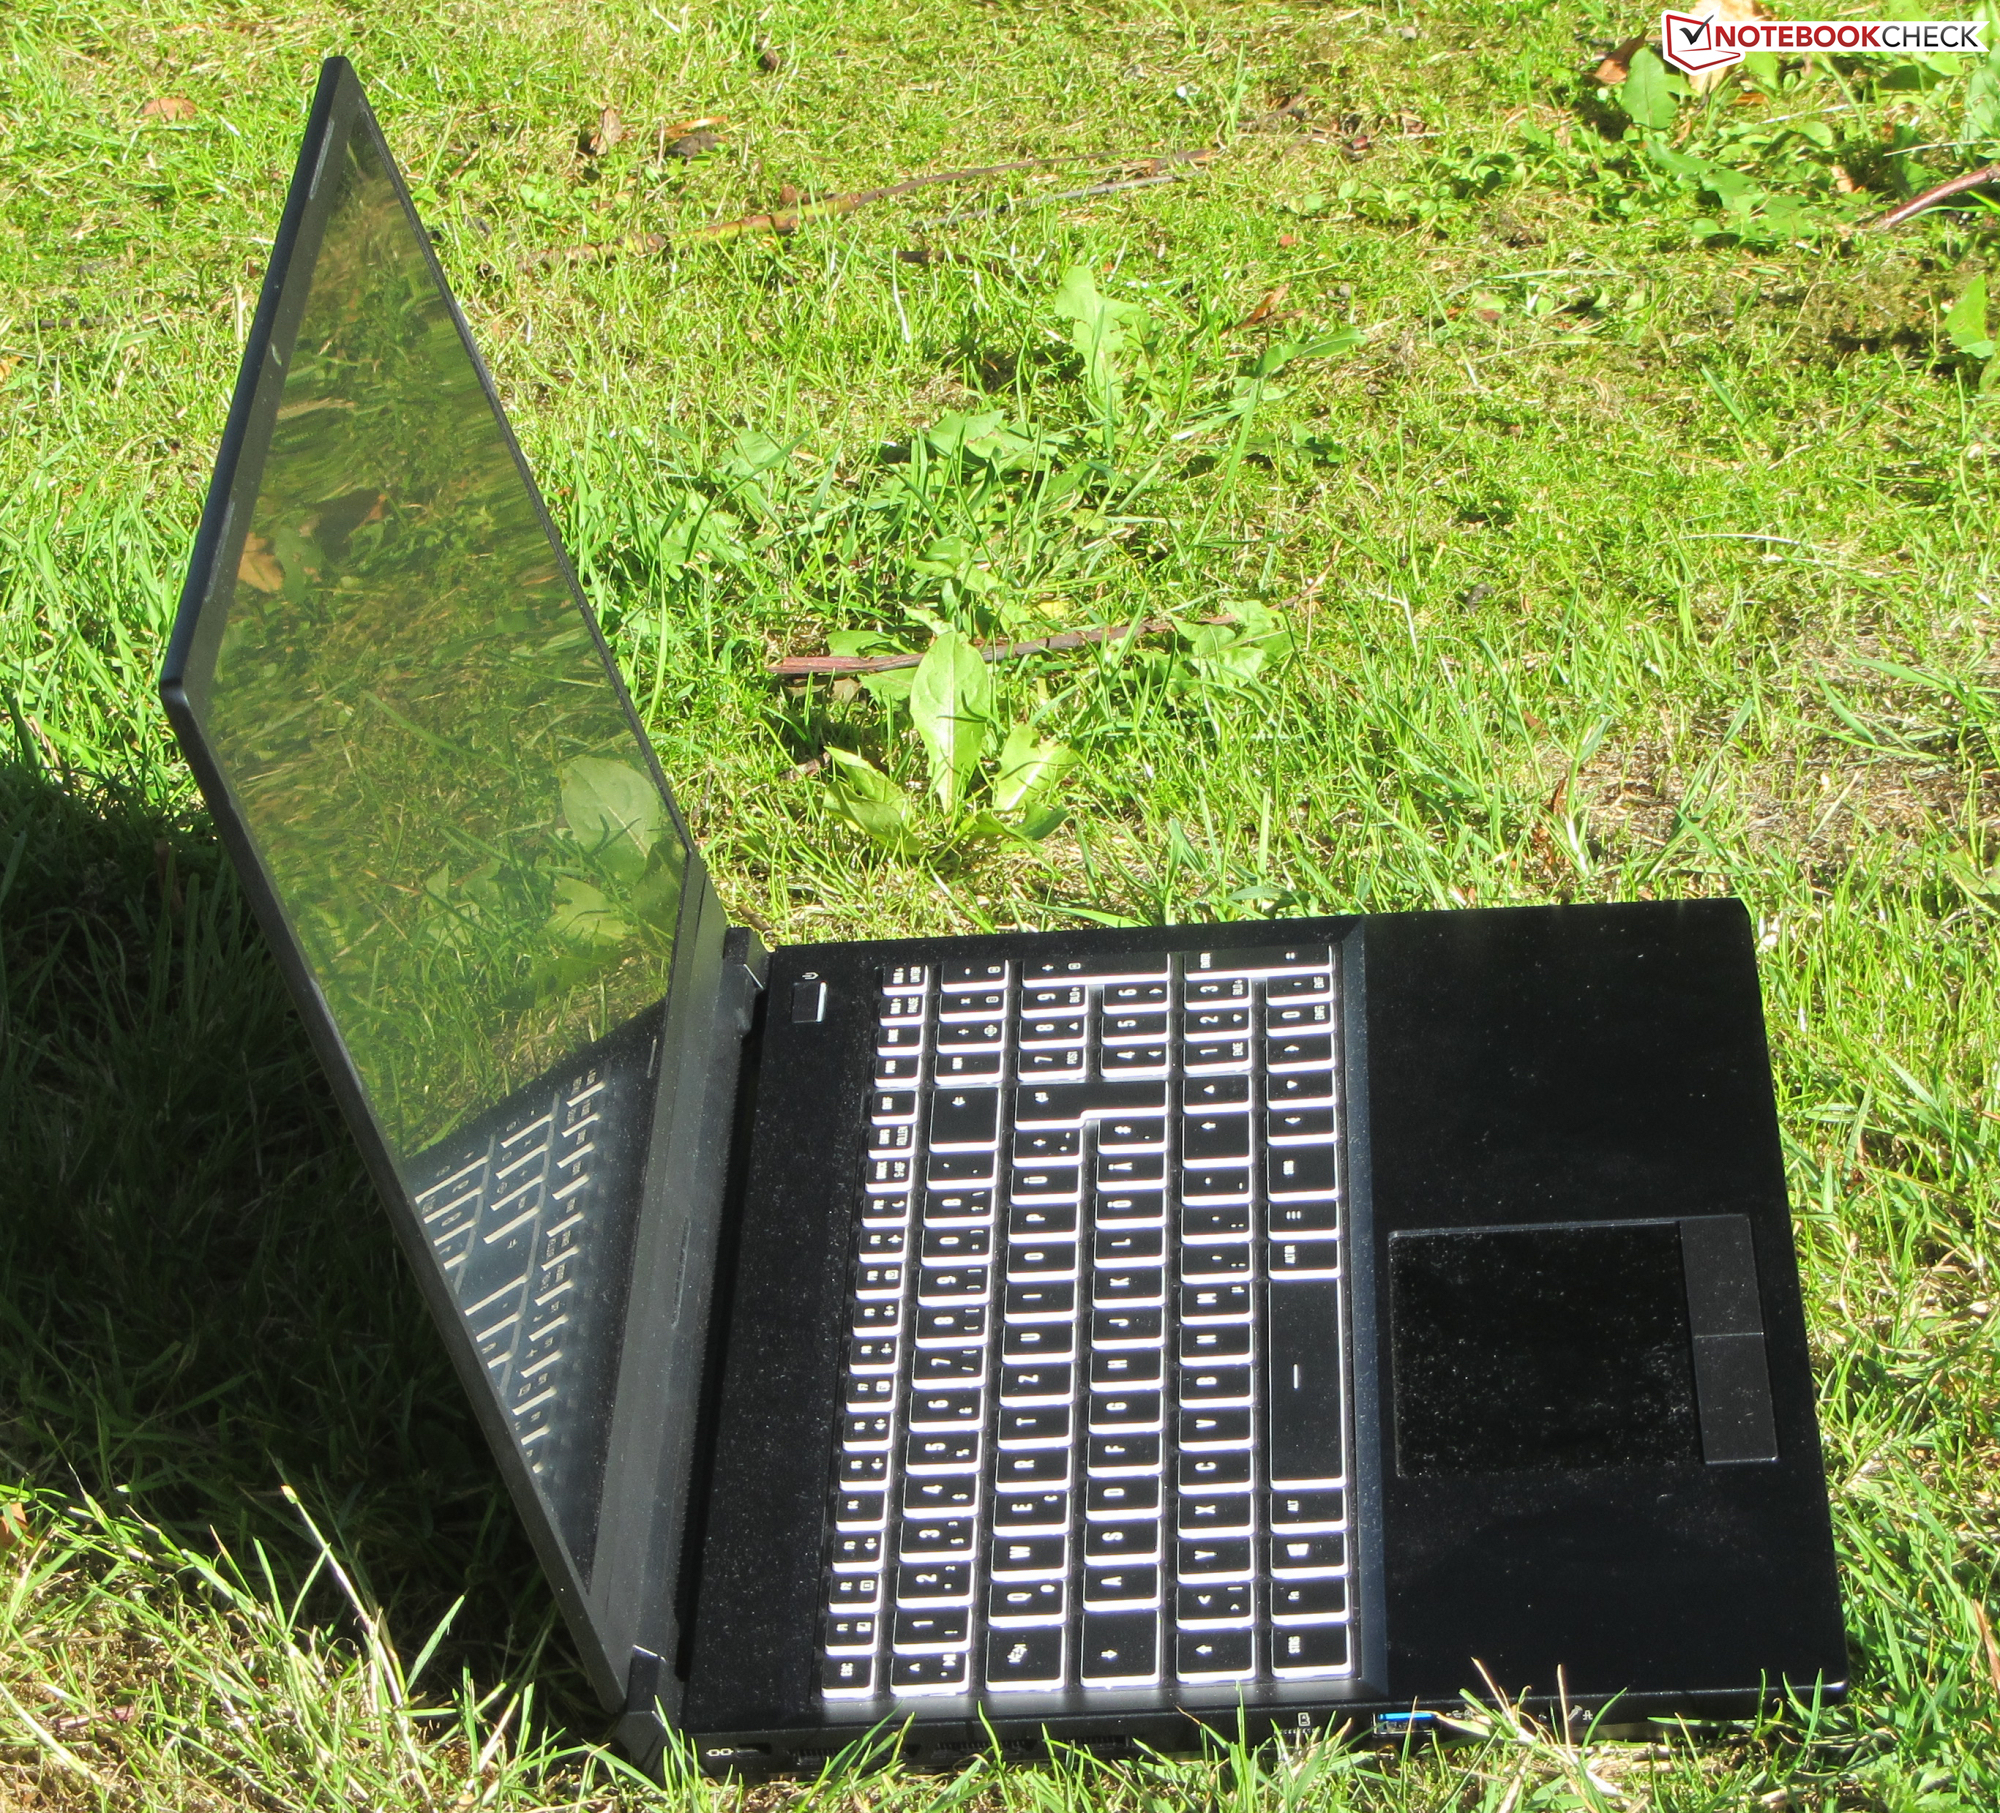
Within our comparison field, the Key is one of the most compact devices. Only the Razer Blade 15 is a little bit smaller. At a weight of about 2 kg, it's the lightest laptop.
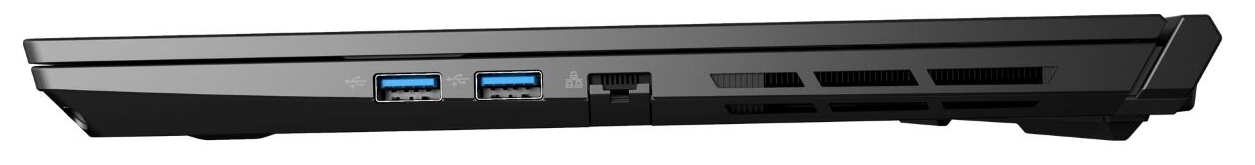
Connectivity - Thunderbolt 3 on board
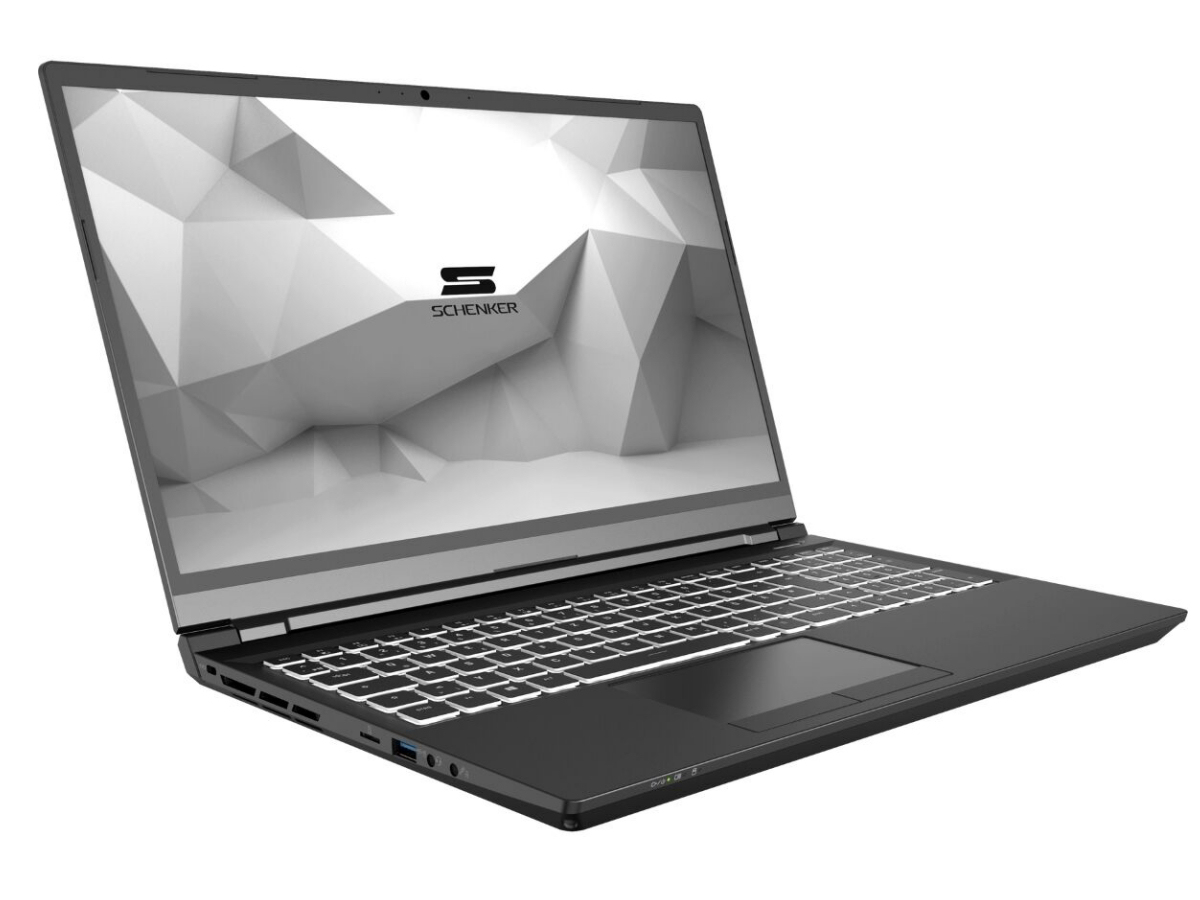
The Key 15 comes with a total of three USB Type-A ports (USB 3.2 Gen 1). In addition, there's a Thunderbolt 3 port that supports DisplayPort via USB-C. Together with the HDMI port (version 2.0) and the Mini DisplayPort (version 1.4), the laptop has three video outputs. Both DisplayPorts are G-Sync compatible. Alternatively, the Thunderbolt 3 port offers the possibility to connect a docking solution or an external GPU. The port configuration is rounded off with a Gigabit Ethernet connection and two audio ports.

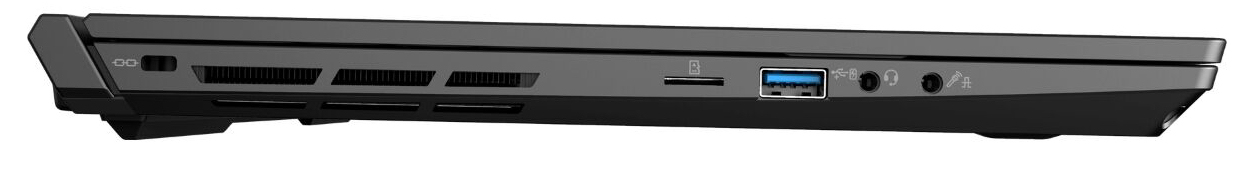
SD card reader
The Key doesn't offer a full-fledged SD memory card reader. A MicroSD model is used.
Communication
The WLAN module uses an Intel chip (Wi-Fi 6 AX200) that supports the 802.11a/b/g/h/n/ac/ax WLAN standards. The transmission speeds determined under optimal conditions (no other WLAN devices nearby, short distance between laptop and server PC) range from good to very good. Wired network connections are handled by a Gigabit Ethernet chip from Realtek's well-known RTL8168/8111 family.
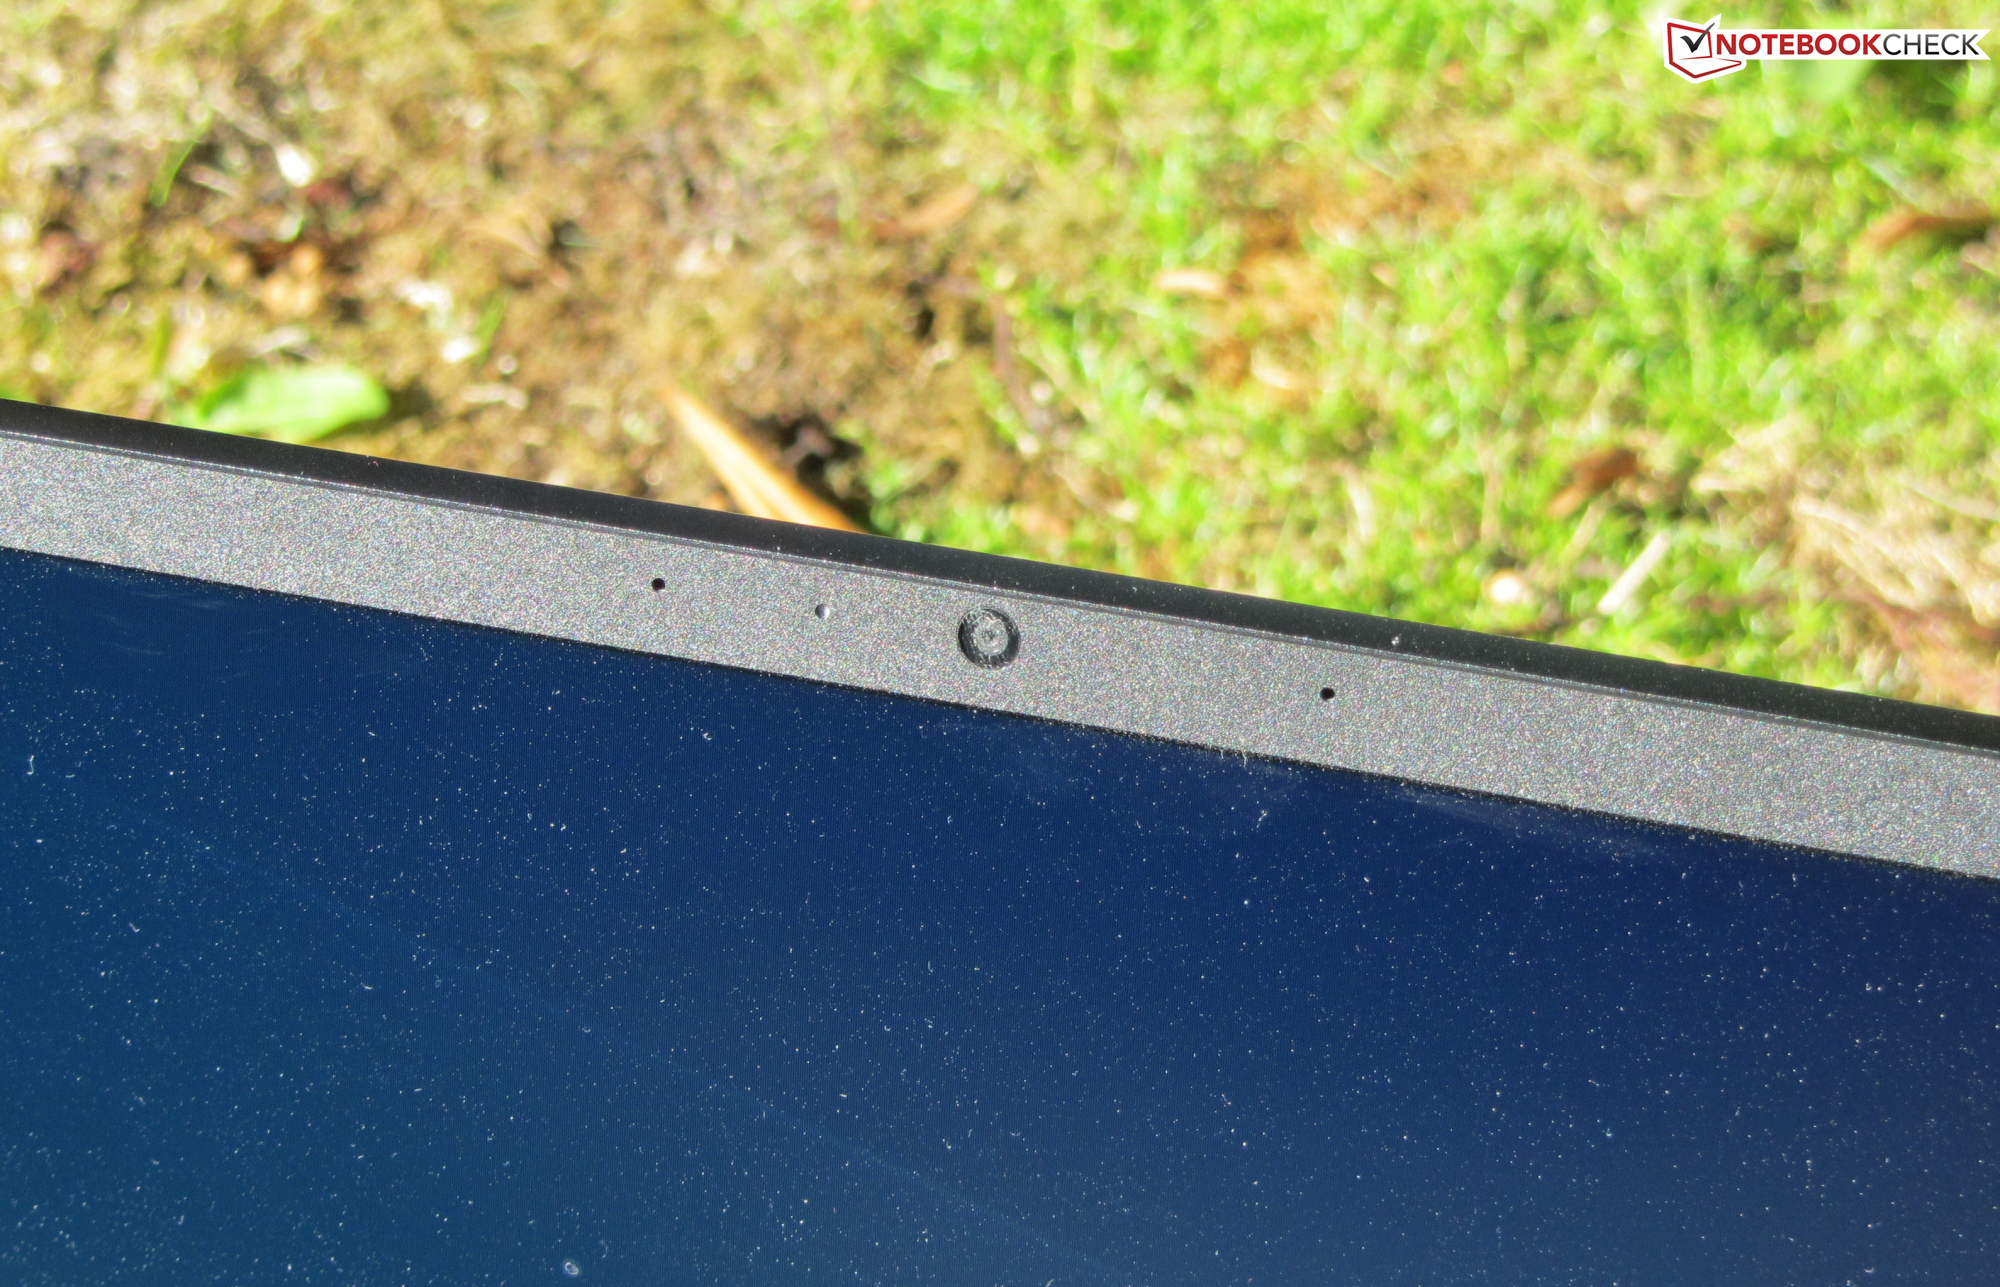
Webcam
The built-in webcam (0.9 MP) produces images with a maximum resolution of 1280x720 pixels. In addition, there are issues with color accuracy. With a Delta E 2000 color deviation of almost 15, the target (Delta E less than 3) is clearly missed.


")
")


Accessories
Besides the usual documents (quick-start guide, warranty information) the laptop comes with a driver DVD, a set of screws, a retaining screw for a second SSD, a thermal pad, and a microfiber cloth.
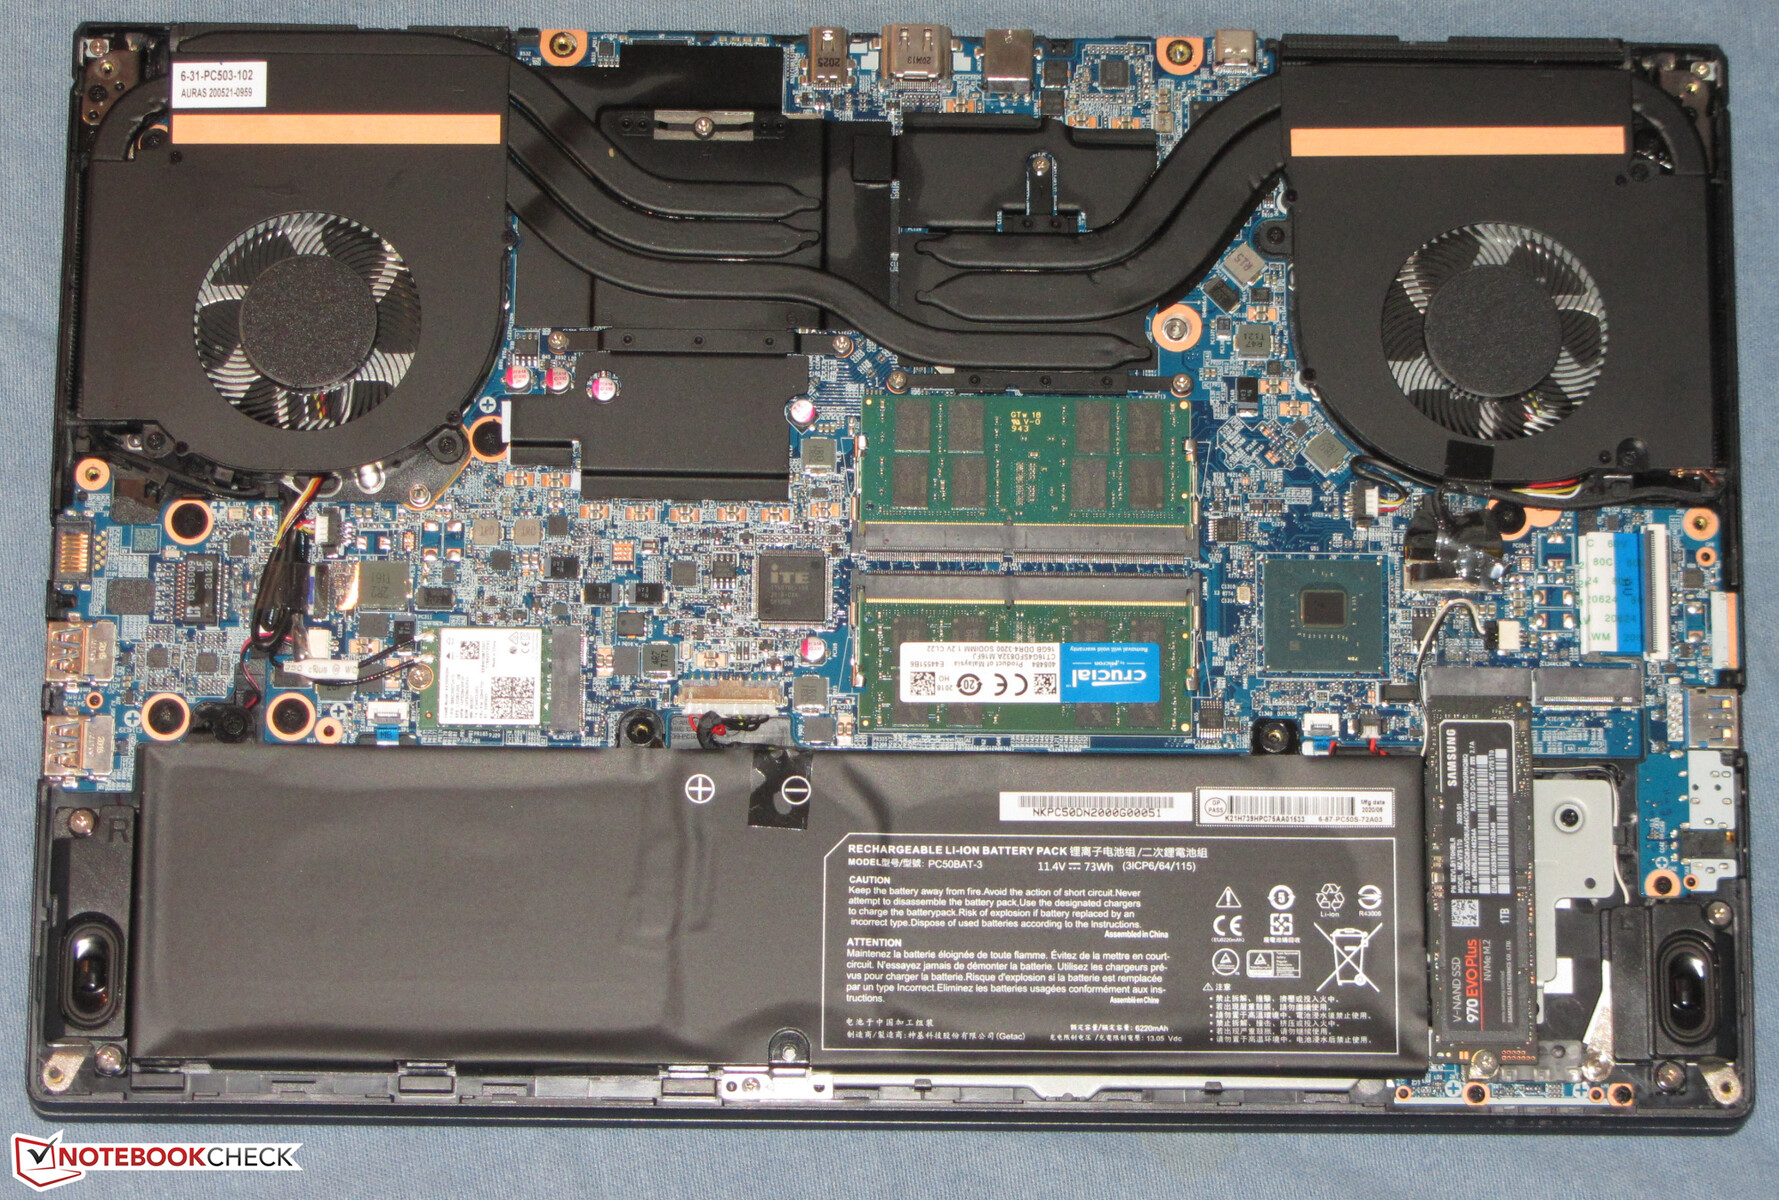
Maintenance
The Schenker laptop doesn't have a maintenance hatch. To get to the inside, the bottom cover has to be detached. To do this, all the screws on the underside of the device need to be removed. The bottom cover can then be lifted. It doesn't sit excessively tight in its place.
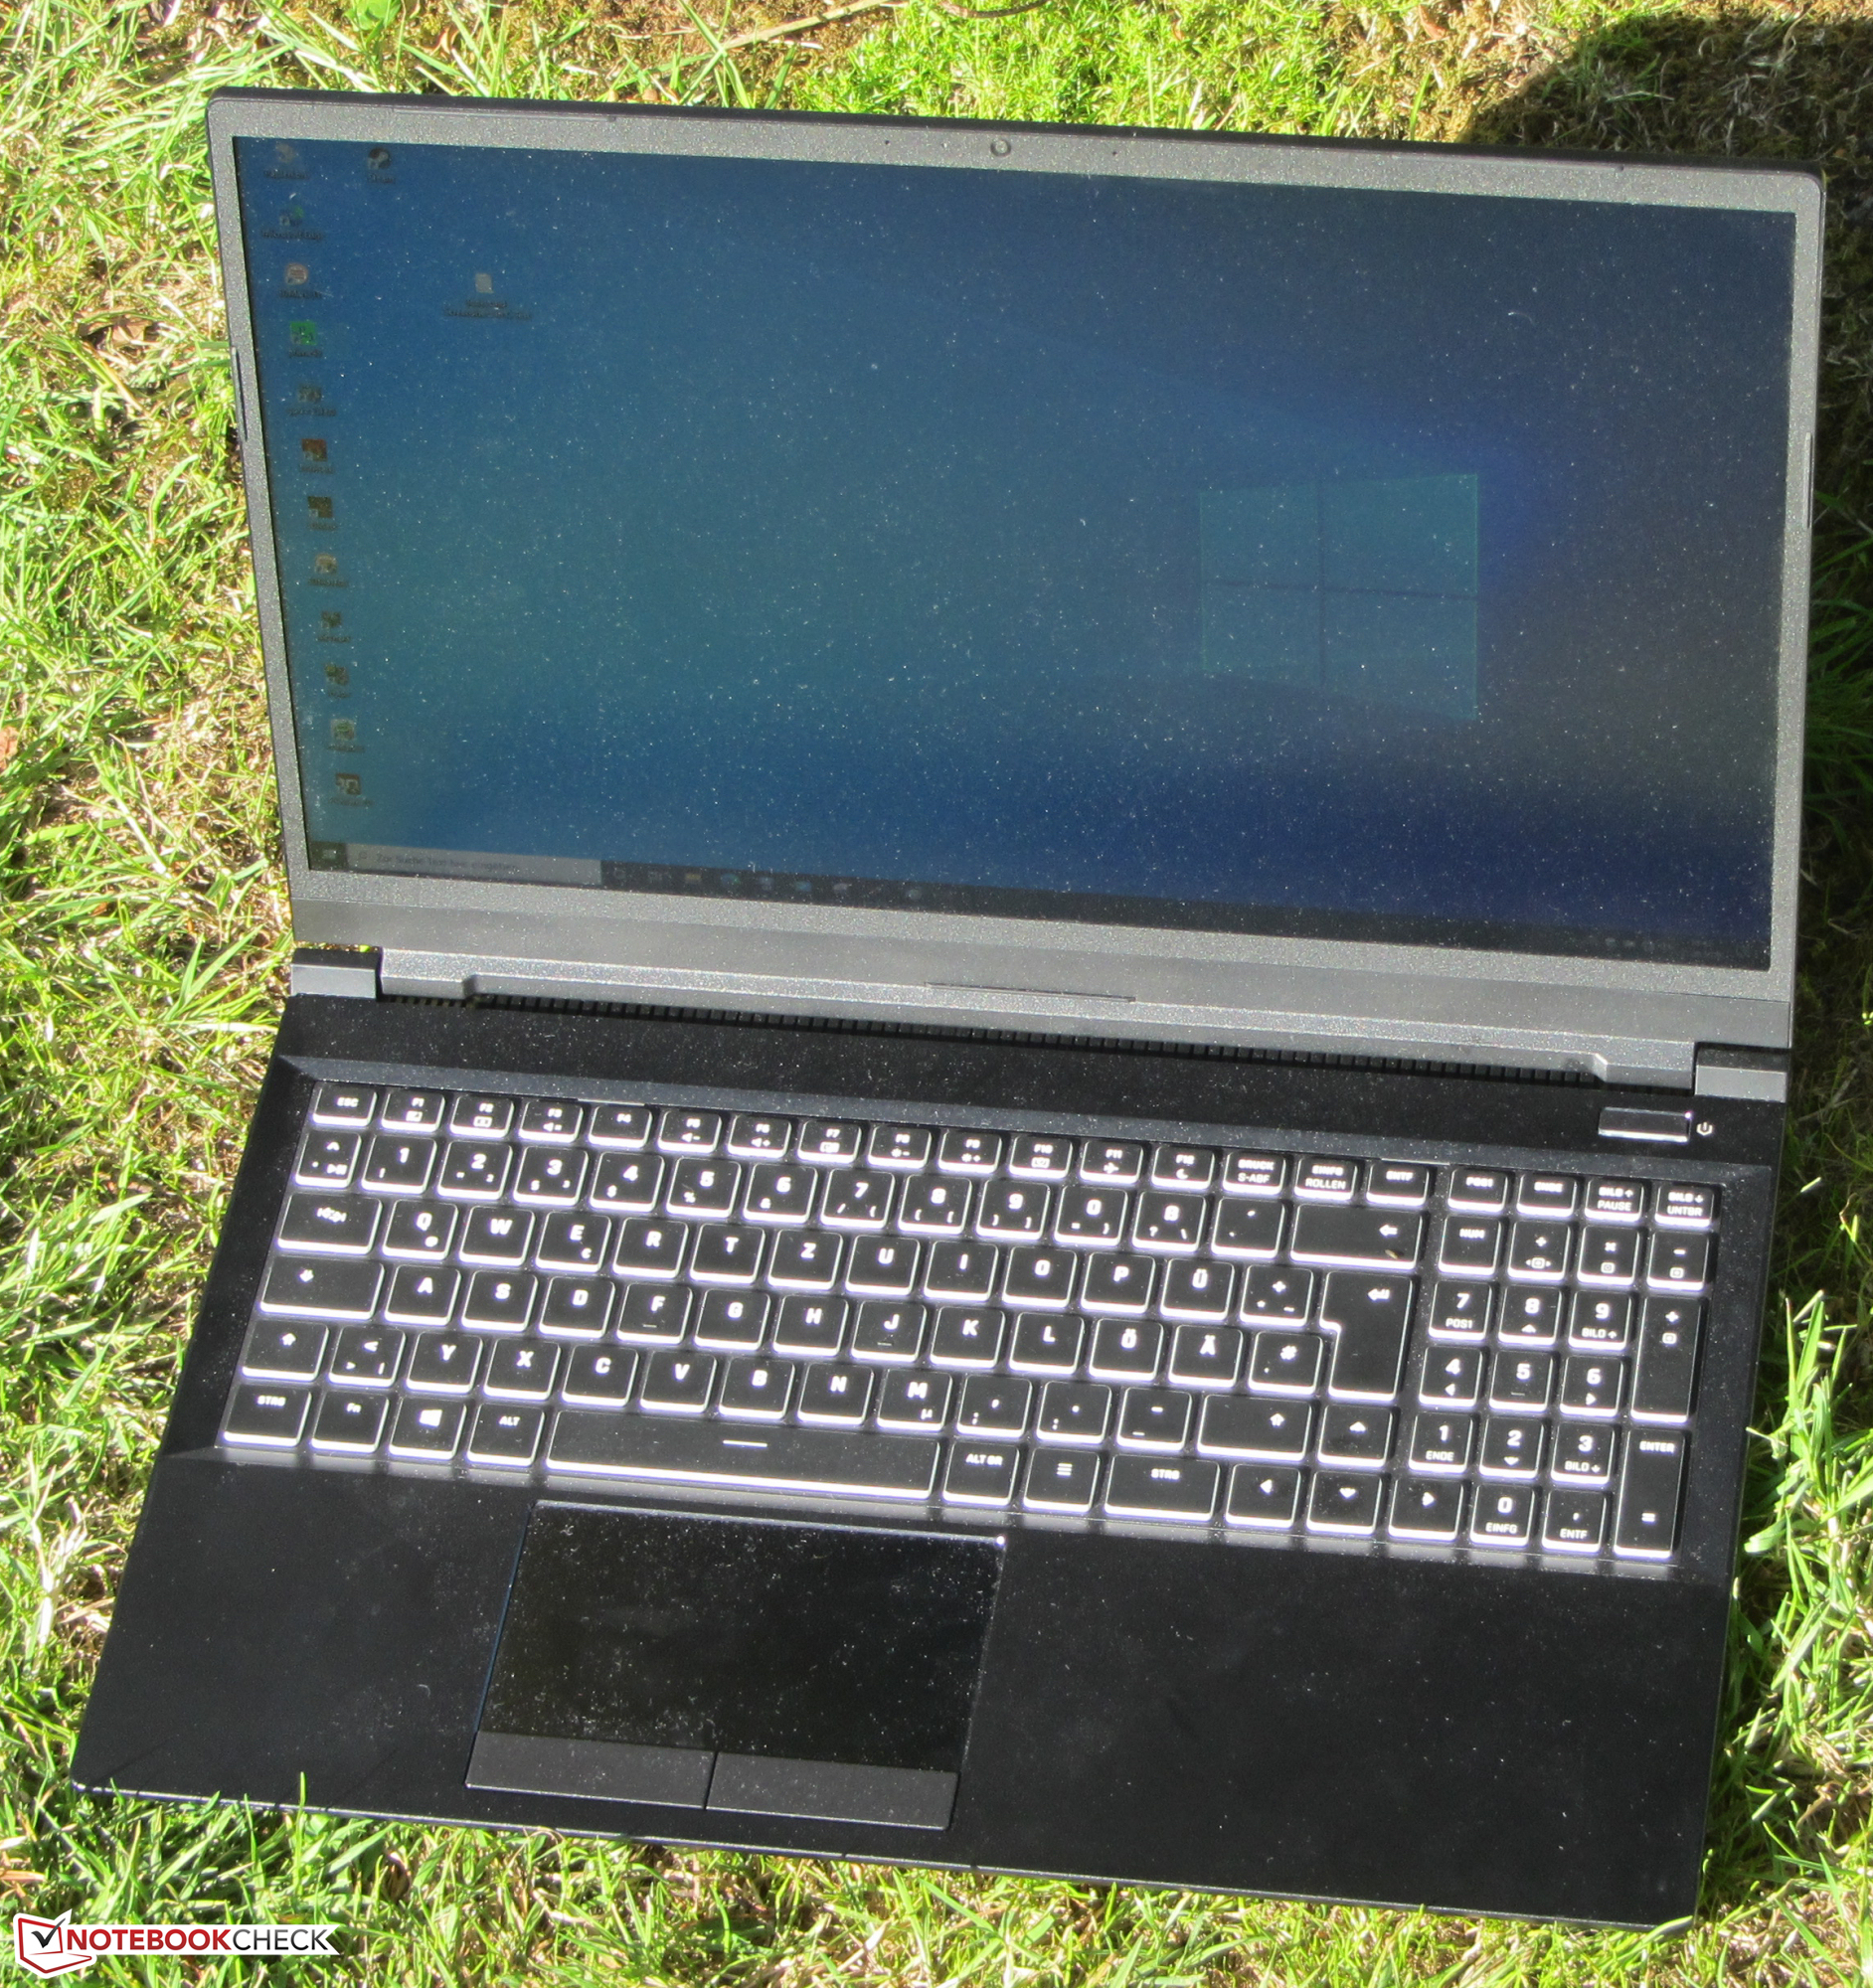
Input devices - Suitable for everyday use
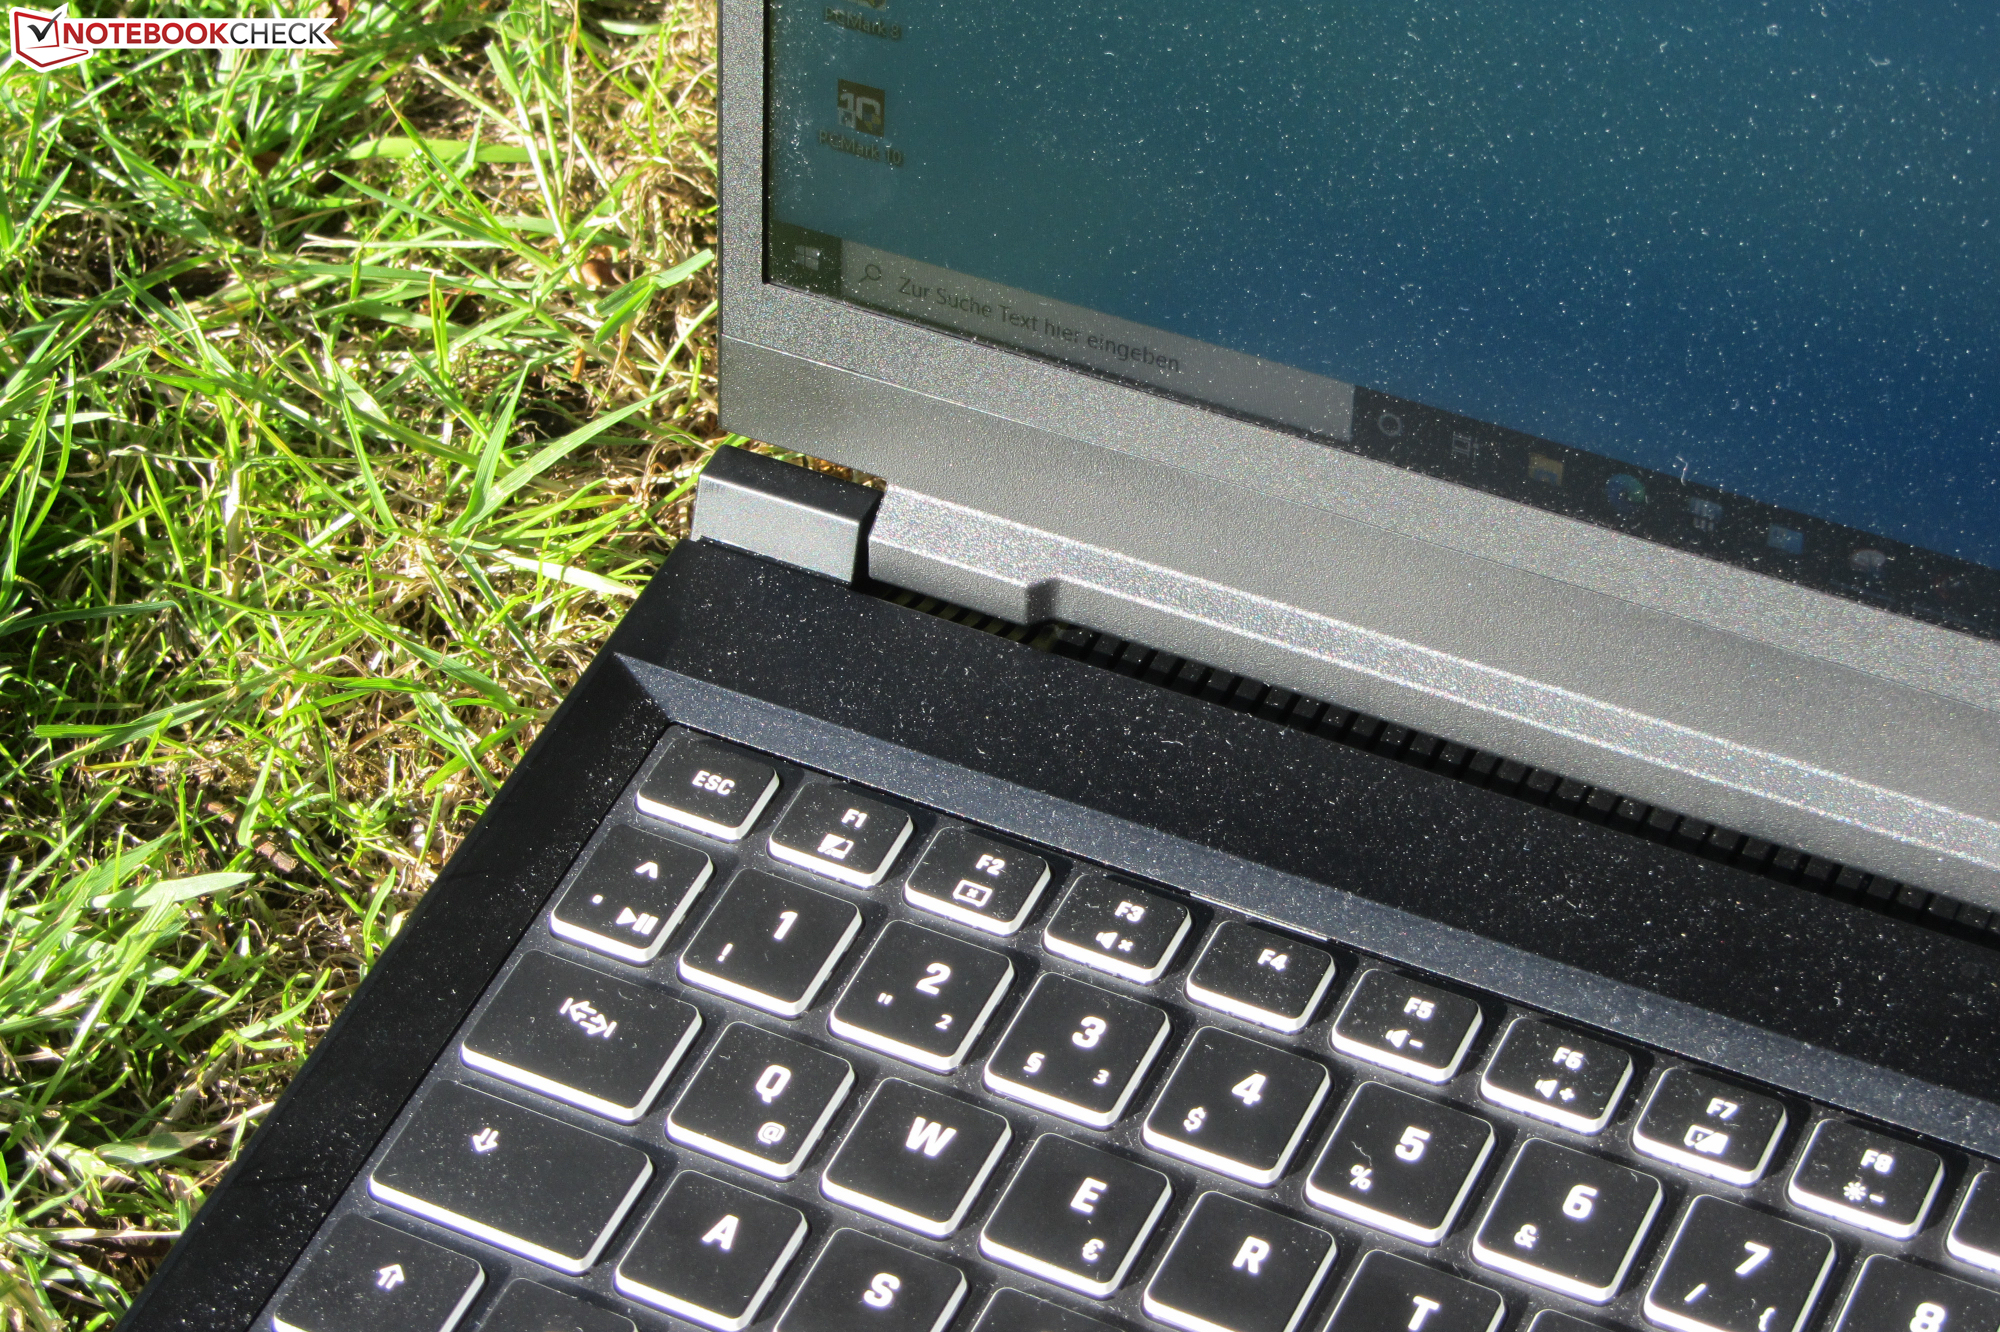
Keyboard
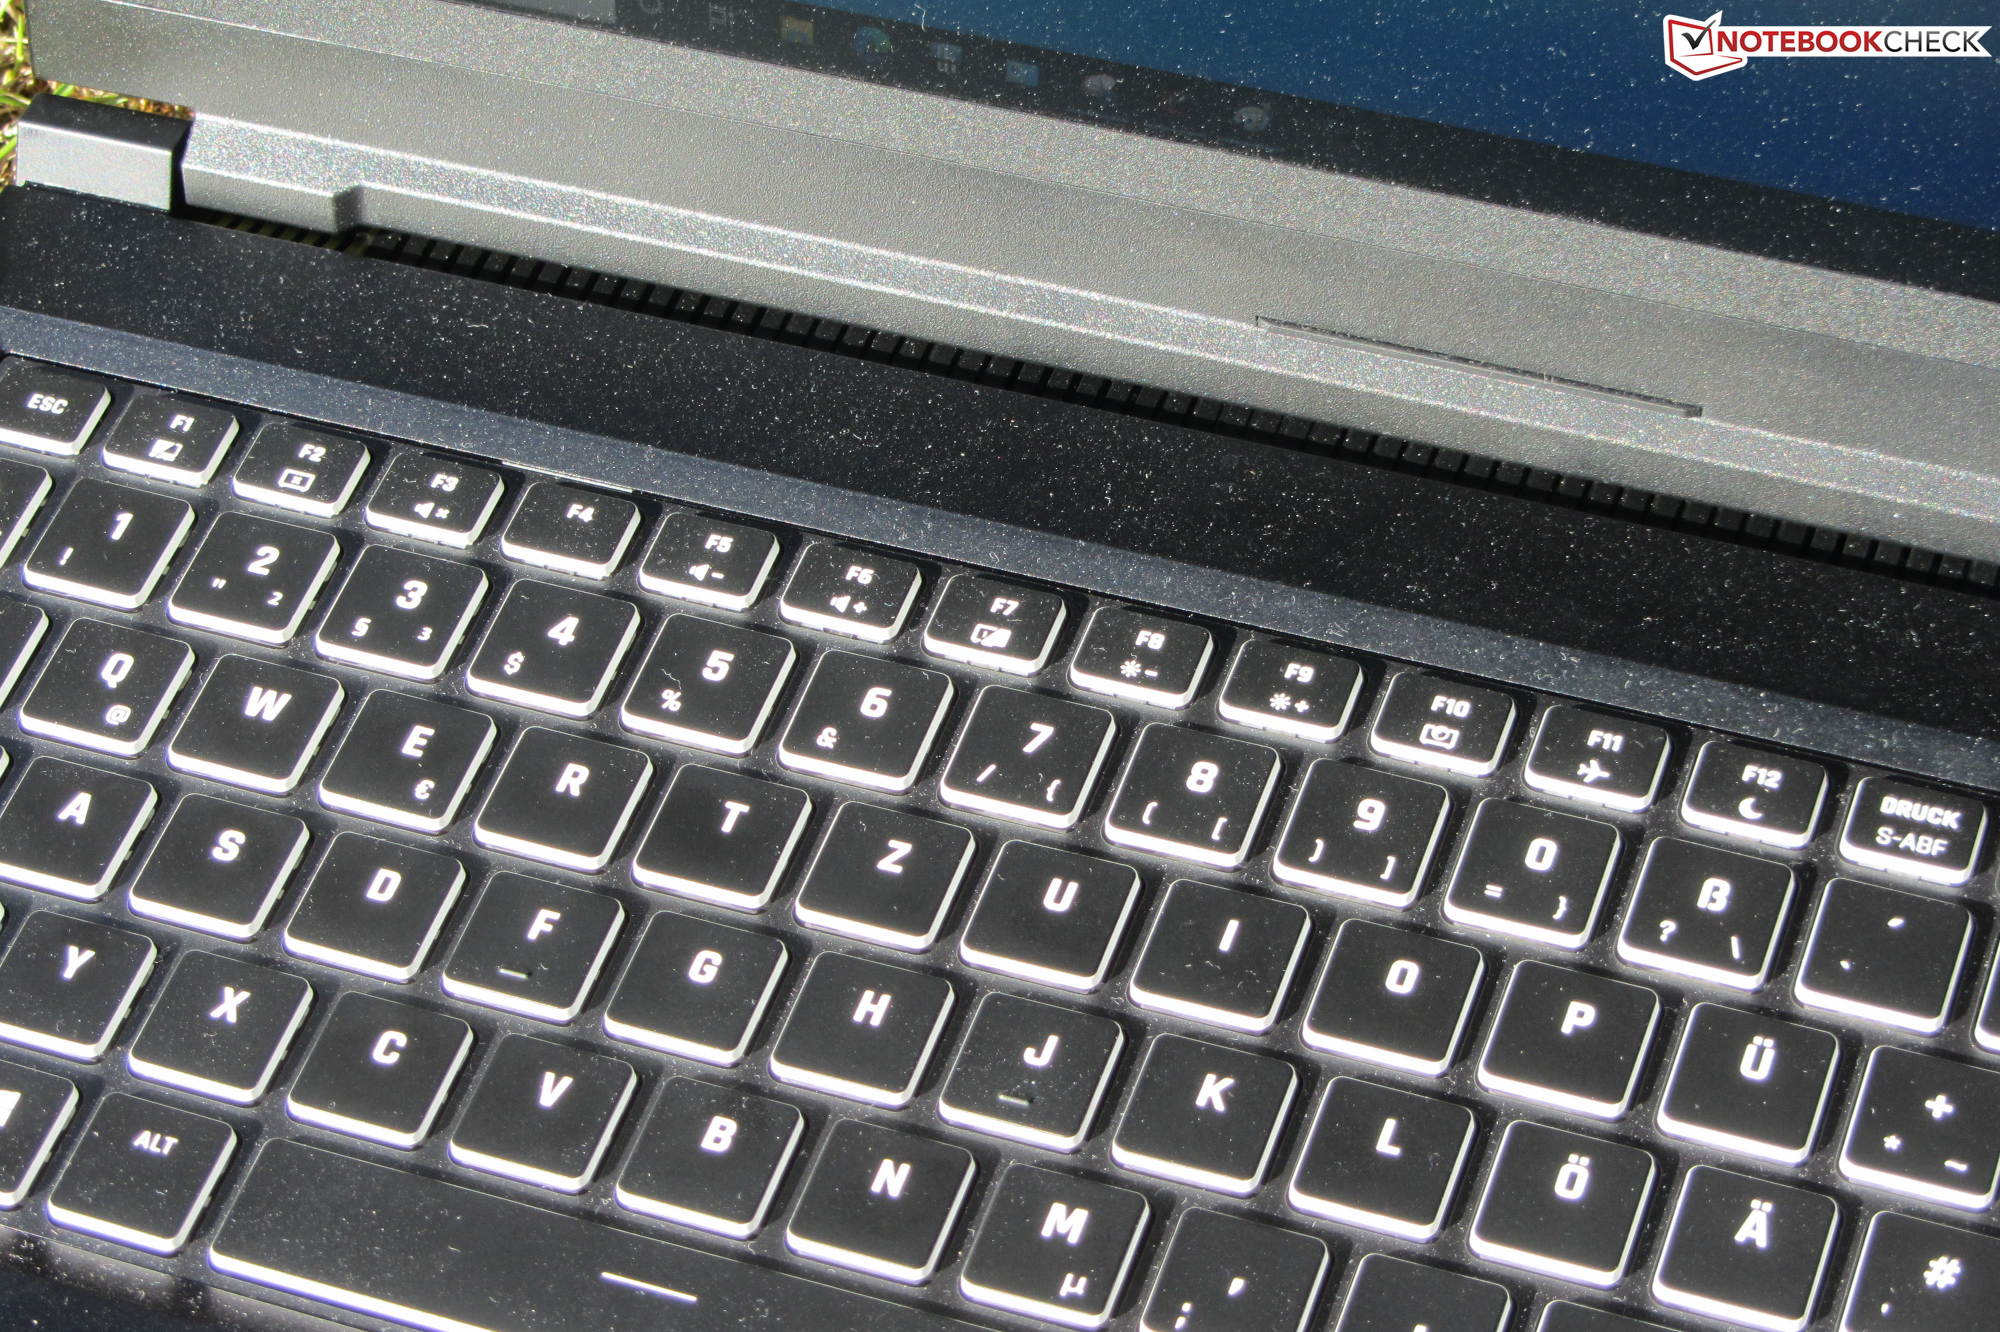
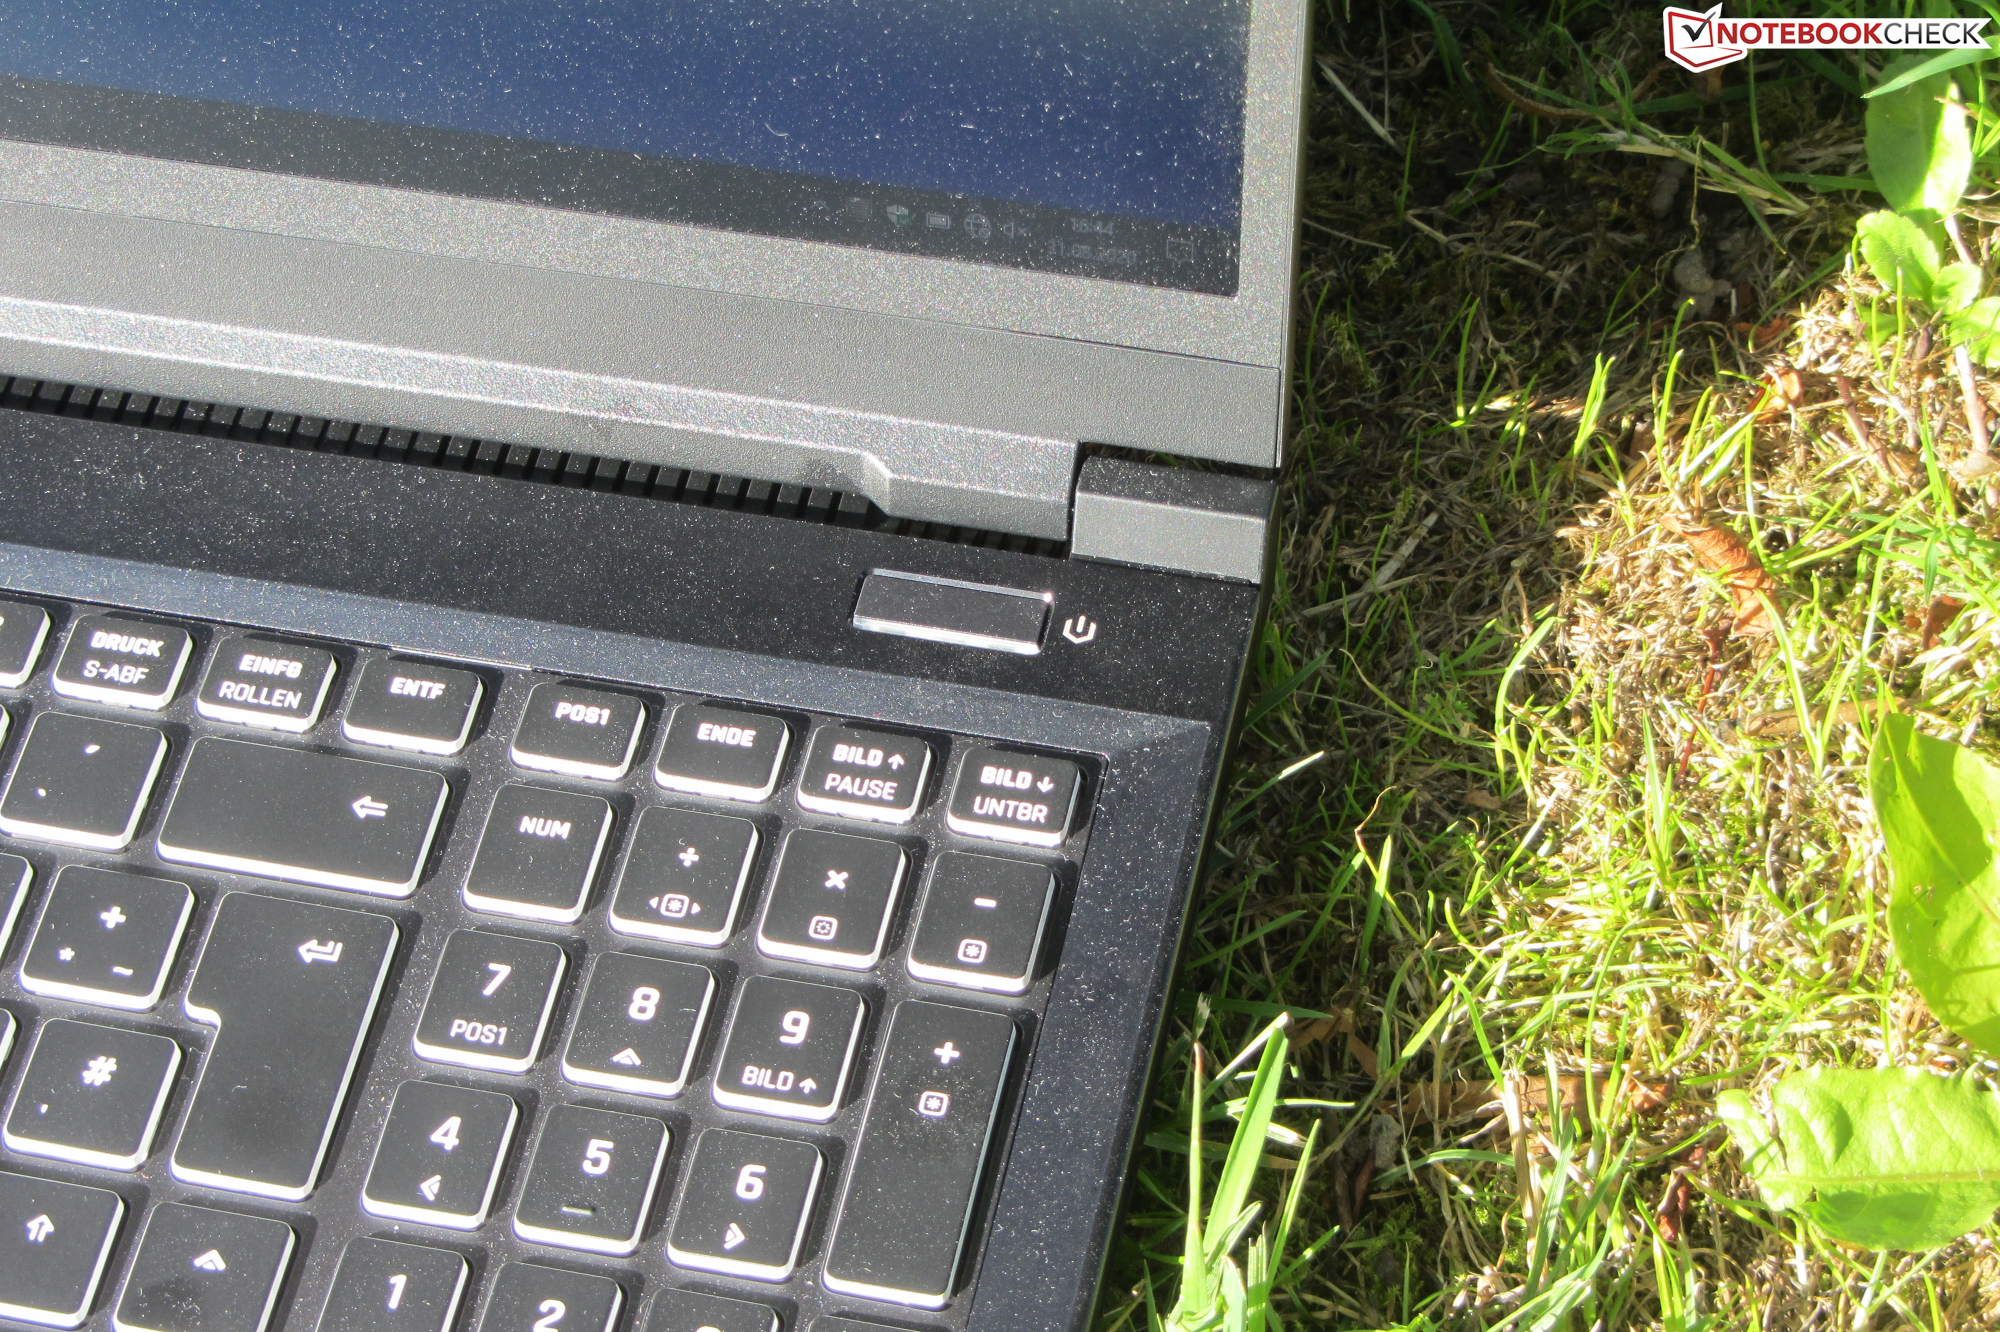
The Schenker laptop has a backlit chiclet keyboard (RGB lighting) that also comes with a number pad on board. The flat, smooth keys have a medium travel and a clear pressure point. While typing, the keyboard yields slightly in the middle, but this didn't prove to be excessively bothersome. All in all, you'll find a keyboard suitable for everyday use here.
Touchpad
The multi-touch capable touchpad occupies an area of approximately 10.8 x 6.1 cm. This provides plenty of space for using gesture controls. Furthermore, the smooth pad surface makes it easy for fingers to glide on it. The pad also reacts to input in the corners, and the two separate mouse buttons offer a short travel and a clear pressure point.
Display - 144 Hz IPS
The Key's 15.6-inch display has a native resolution of 1920x1080 pixels. While the contrast (1,034:1) is pleasing, there's still room for improvement in terms of brightness (281 cd/m²). We consider values beyond 300 cd/m² to be good. In addition, the 144 Hz panel provides quick response times. Positive: The display shows no PWM flickering. Alternatively, the Key 15 can be equipped with a 4K OLED display.
| |||||||||||||||||||||||||
Brightness Distribution: 80 %
Center on Battery: 300 cd/m²
Contrast: 1034:1 (Black: 0.29 cd/m²)
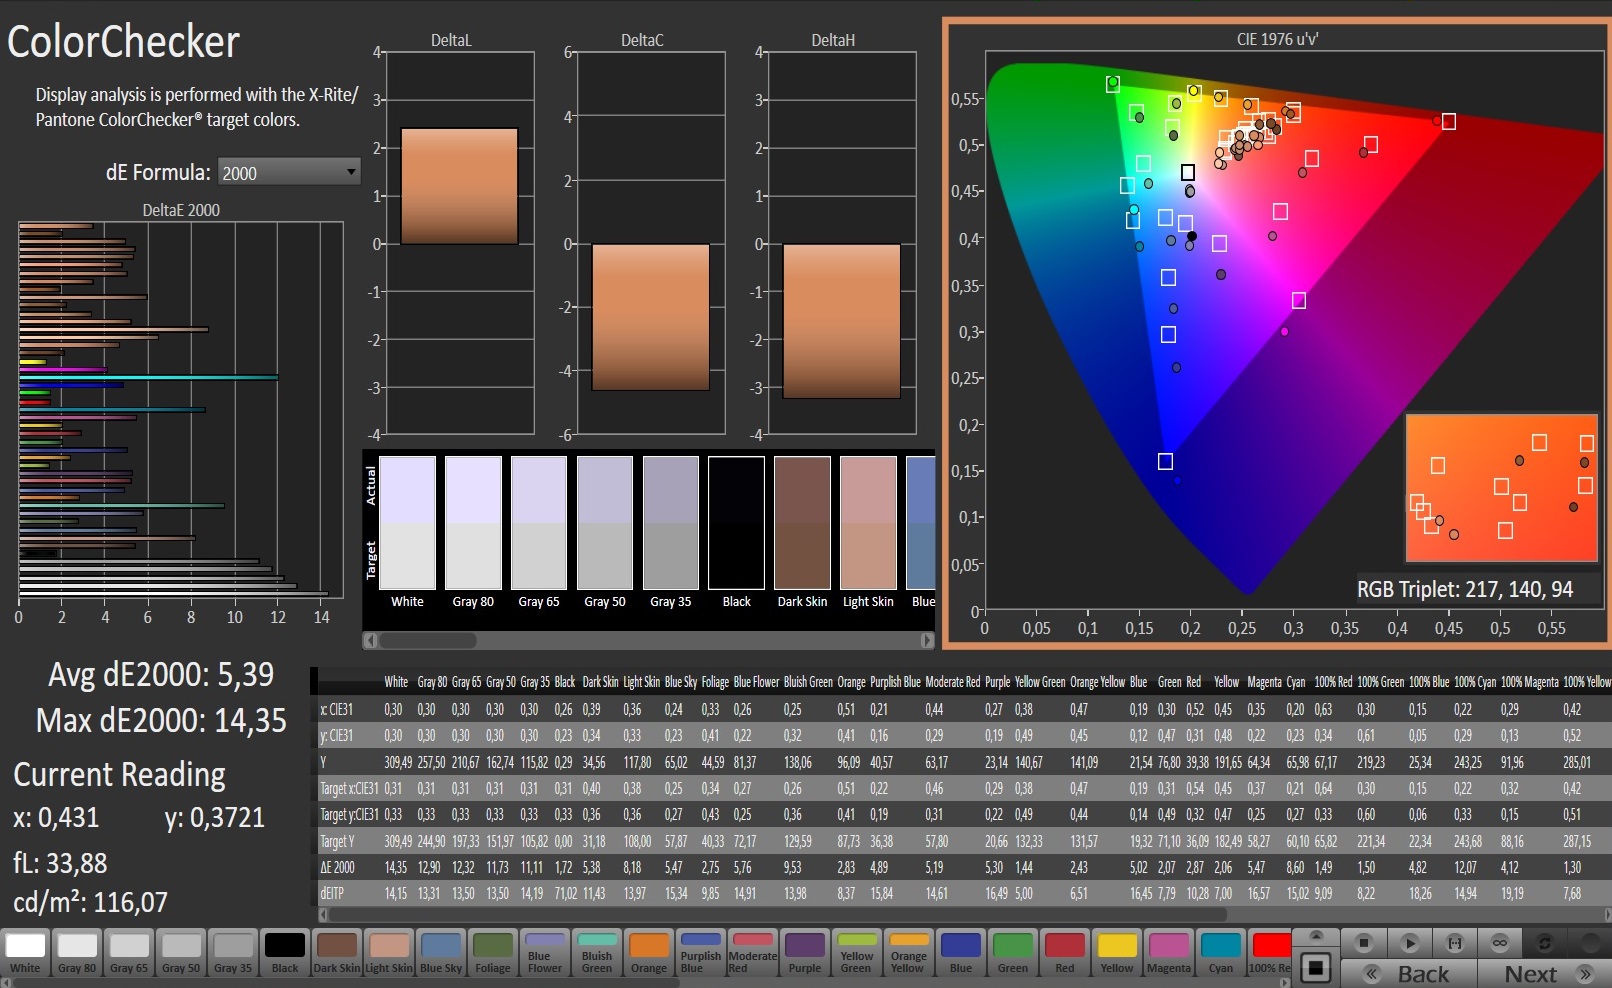
ΔE ColorChecker Calman: 5.39 | ∀{0.5-29.43 Ø4.72}
calibrated: 1.73
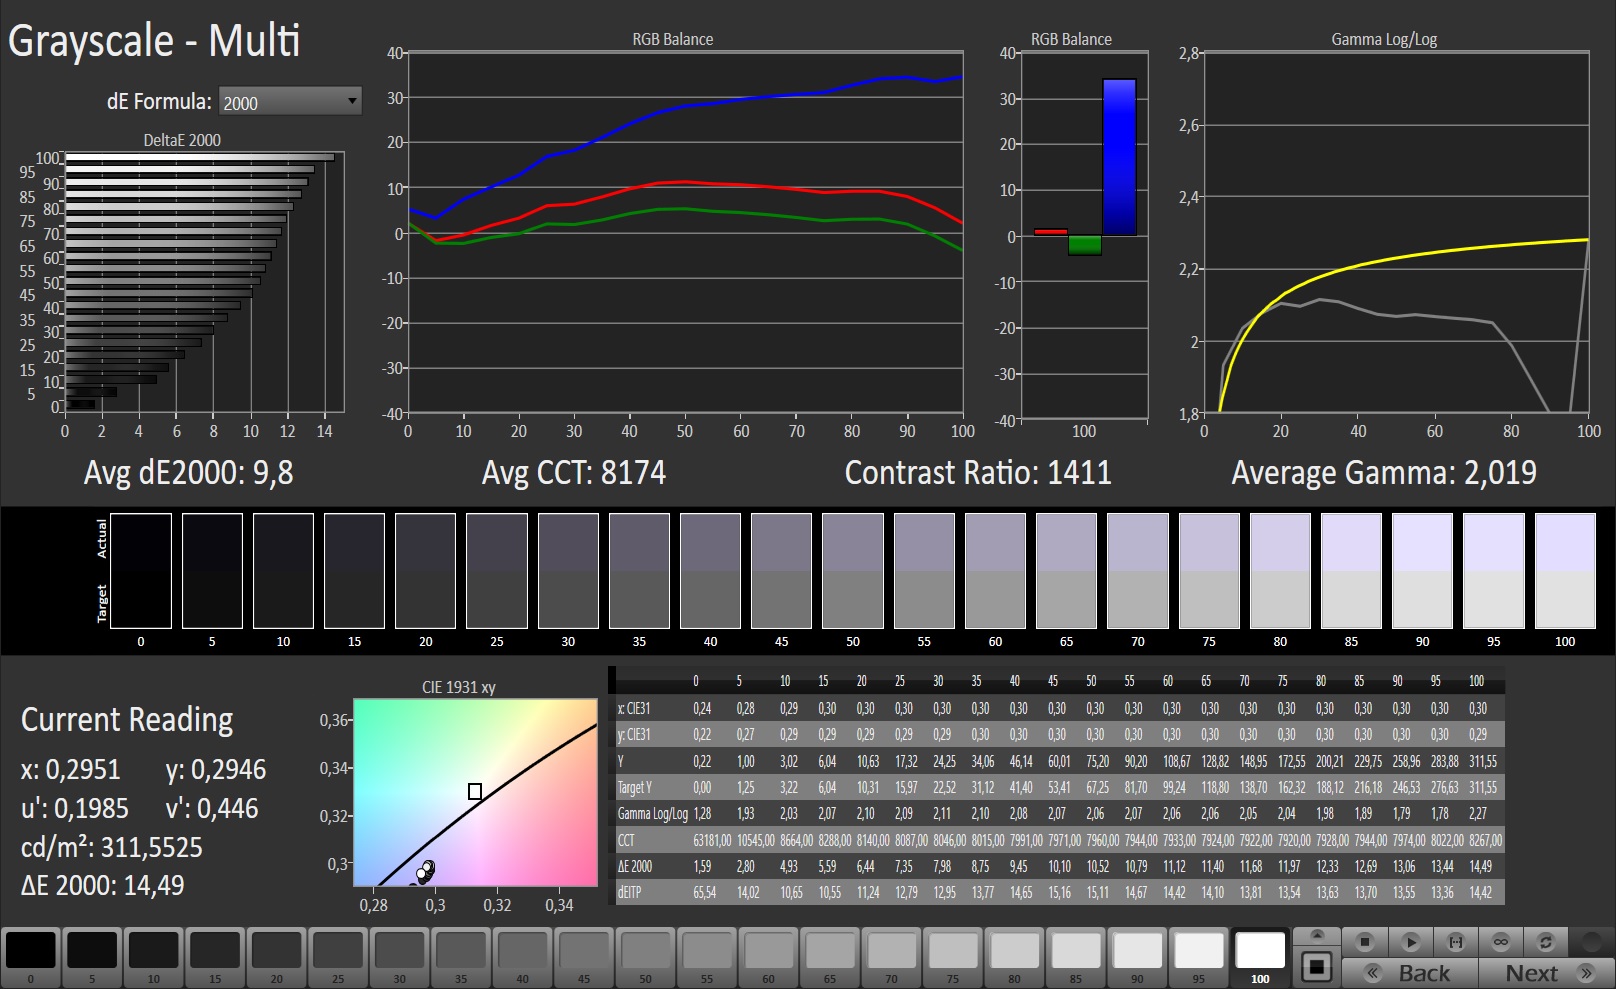
ΔE Greyscale Calman: 9.8 | ∀{0.09-98 Ø4.97}
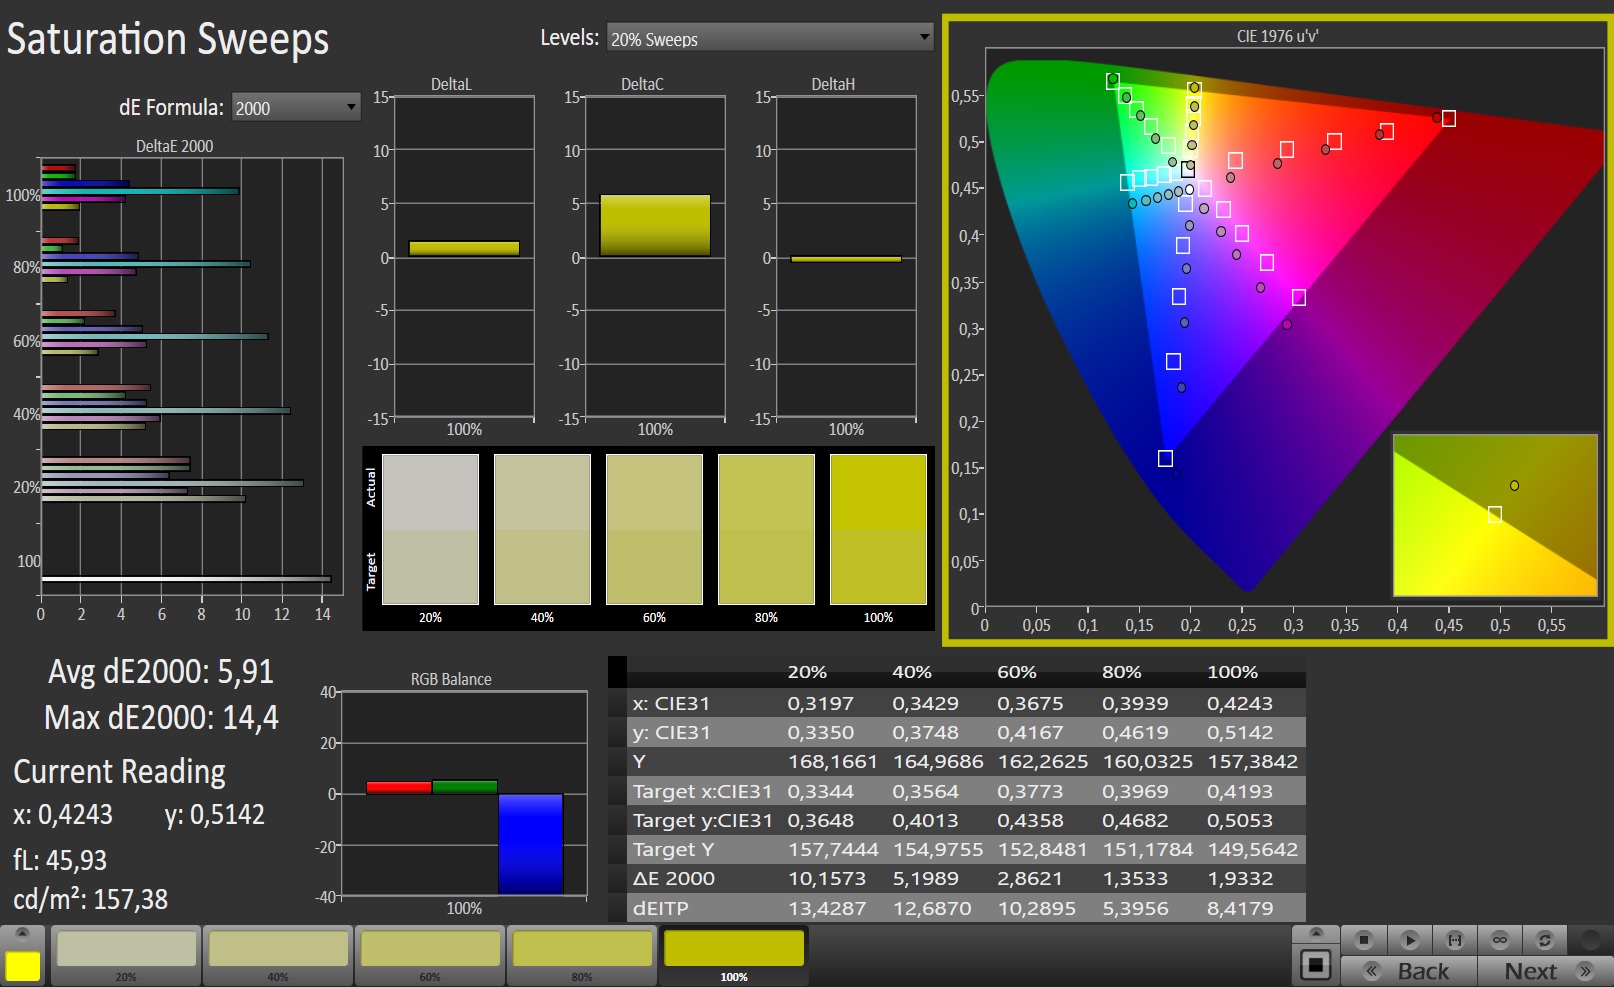
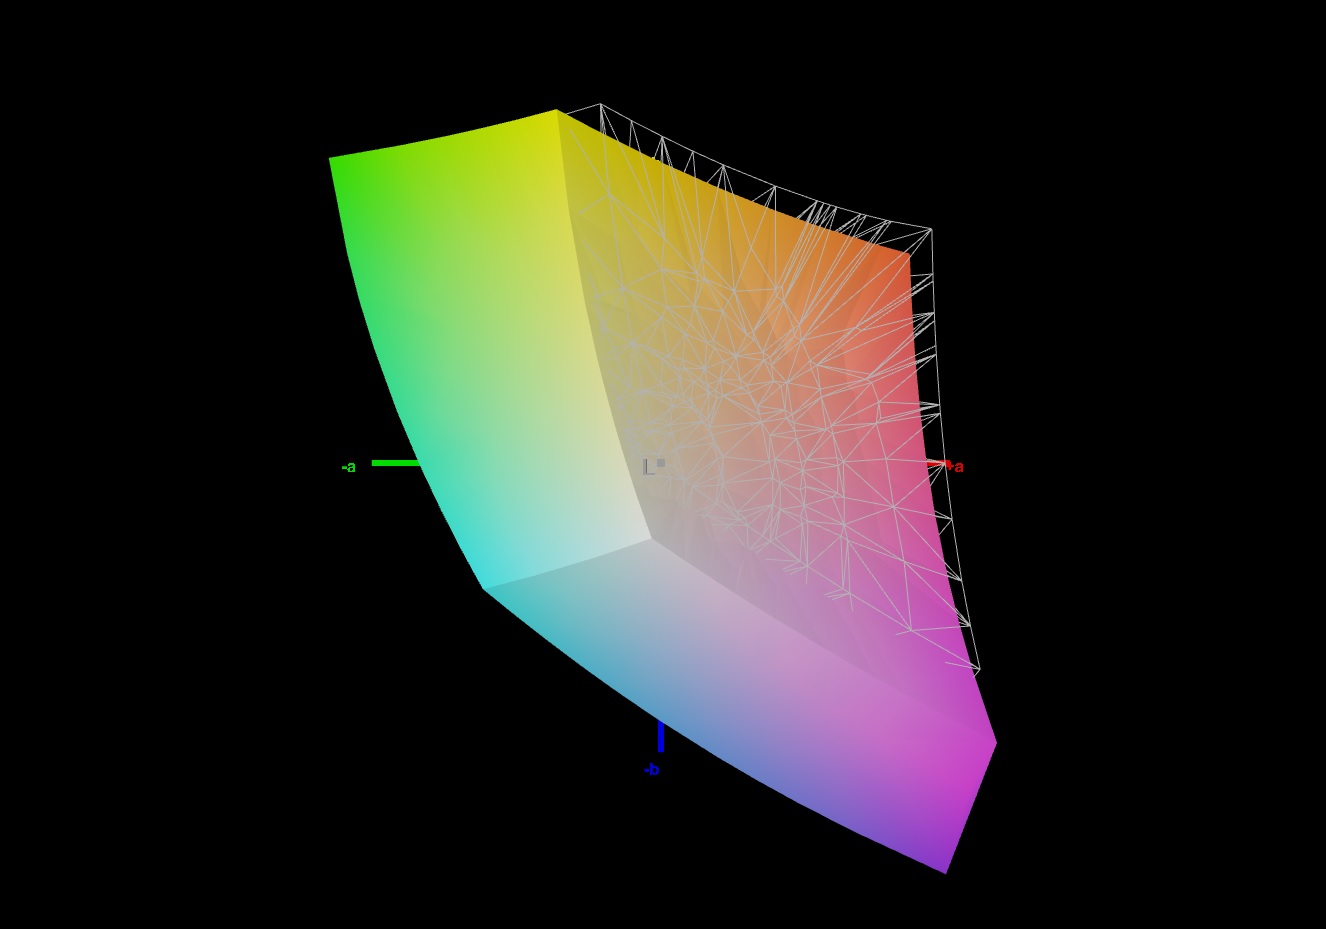
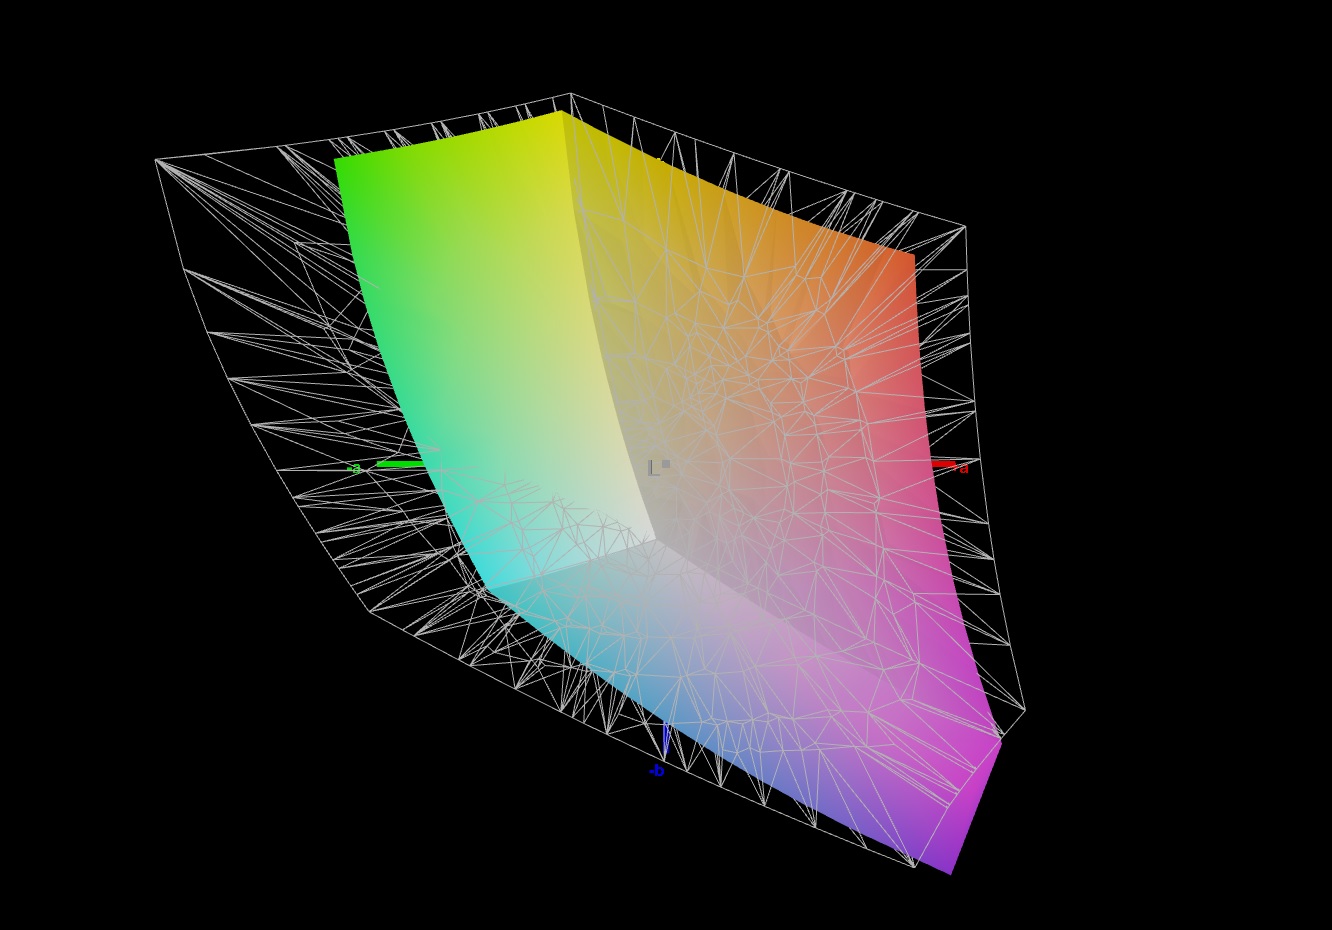
92% sRGB (Argyll 1.6.3 3D)
69% AdobeRGB 1998 (Argyll 1.6.3 3D)
68.7% AdobeRGB 1998 (Argyll 3D)
96.2% sRGB (Argyll 3D)
67.2% Display P3 (Argyll 3D)
Gamma: 2.019
CCT: 8174 K
| Schenker Key 15 Comet Lake Panda LM156LF-1F02, IPS, 1920x1080, 15.6" | MSI GS66 10SGS AU Optronics B156HAN12.0, IPS, 1920x1080, 15.6" | Aorus 15G XB Sharp LQ156M1JW03, IGZO, 1920x1080, 15.6" | Razer Blade 15 RTX 2080 Super Max-Q AU Optronics B156HAN12.0, IPS, 1920x1080, 15.6" | Gigabyte Aero 15 OLED XB-8DE51B0SP Samsung SDCA029, OLED, 3840x2160, 15.6" | Acer Predator Triton 500 PT515-52-70N3 AUO B156HAN12.0 (AUO7A8C), IPS, 1920x1080, 15.6" | |
|---|---|---|---|---|---|---|
| Display | 3% | 0% | 4% | 32% | 4% | |
| Display P3 Coverage (%) | 67.2 | 69.9 4% | 67.2 0% | 70.2 4% | 99.9 49% | 70.3 5% |
| sRGB Coverage (%) | 96.2 | 99.1 3% | 97.8 2% | 99 3% | 100 4% | 99.5 3% |
| AdobeRGB 1998 Coverage (%) | 68.7 | 71.1 3% | 68 -1% | 71.4 4% | 98.2 43% | 72.2 5% |
| Response Times | -11% | -41% | 21% | 79% | -29% | |
| Response Time Grey 50% / Grey 80% * (ms) | 10 ? | 11.2 ? -12% | 16 ? -60% | 6 ? 40% | 2.2 ? 78% | 14.4 ? -44% |
| Response Time Black / White * (ms) | 9.2 ? | 10 ? -9% | 11.2 ? -22% | 9 ? 2% | 1.8 ? 80% | 10.4 ? -13% |
| PWM Frequency (Hz) | 23580 ? | 60 ? | ||||
| Screen | 31% | 23% | 27% | 33% | 21% | |
| Brightness middle (cd/m²) | 300 | 339.4 13% | 264 -12% | 347 16% | 385 28% | 320 7% |
| Brightness (cd/m²) | 281 | 331 18% | 248 -12% | 328 17% | 390 39% | 318 13% |
| Brightness Distribution (%) | 80 | 92 15% | 89 11% | 89 11% | 93 16% | 88 10% |
| Black Level * (cd/m²) | 0.29 | 0.24 17% | 0.3 -3% | 0.285 2% | 0.24 17% | |
| Contrast (:1) | 1034 | 1414 37% | 880 -15% | 1218 18% | 1333 29% | |
| Colorchecker dE 2000 * | 5.39 | 1.58 71% | 1.21 78% | 2.35 56% | 2.46 54% | 4.03 25% |
| Colorchecker dE 2000 max. * | 14.35 | 3.8 74% | 3.07 79% | 4.15 71% | 4.01 72% | 8.43 41% |
| Colorchecker dE 2000 calibrated * | 1.73 | 1.47 15% | 0.92 47% | 1.16 33% | 2.6 -50% | 0.98 43% |
| Greyscale dE 2000 * | 9.8 | 2.3 77% | 1.6 84% | 3.04 69% | 1.39 86% | 5.94 39% |
| Gamma | 2.019 109% | 2.24 98% | 2.192 100% | 2.35 94% | 2.31 95% | 2.42 91% |
| CCT | 8174 80% | 6952 93% | 6340 103% | 6658 98% | 6395 102% | 6751 96% |
| Color Space (Percent of AdobeRGB 1998) (%) | 69 | 64.8 -6% | 68 -1% | 65 -6% | 98 42% | 66 -4% |
| Color Space (Percent of sRGB) (%) | 92 | 99.4 8% | 90 -2% | 99 8% | 100 9% | 99 8% |
| Total Average (Program / Settings) | 8% /
21% | -6% /
11% | 17% /
22% | 48% /
39% | -1% /
12% |
* ... smaller is better
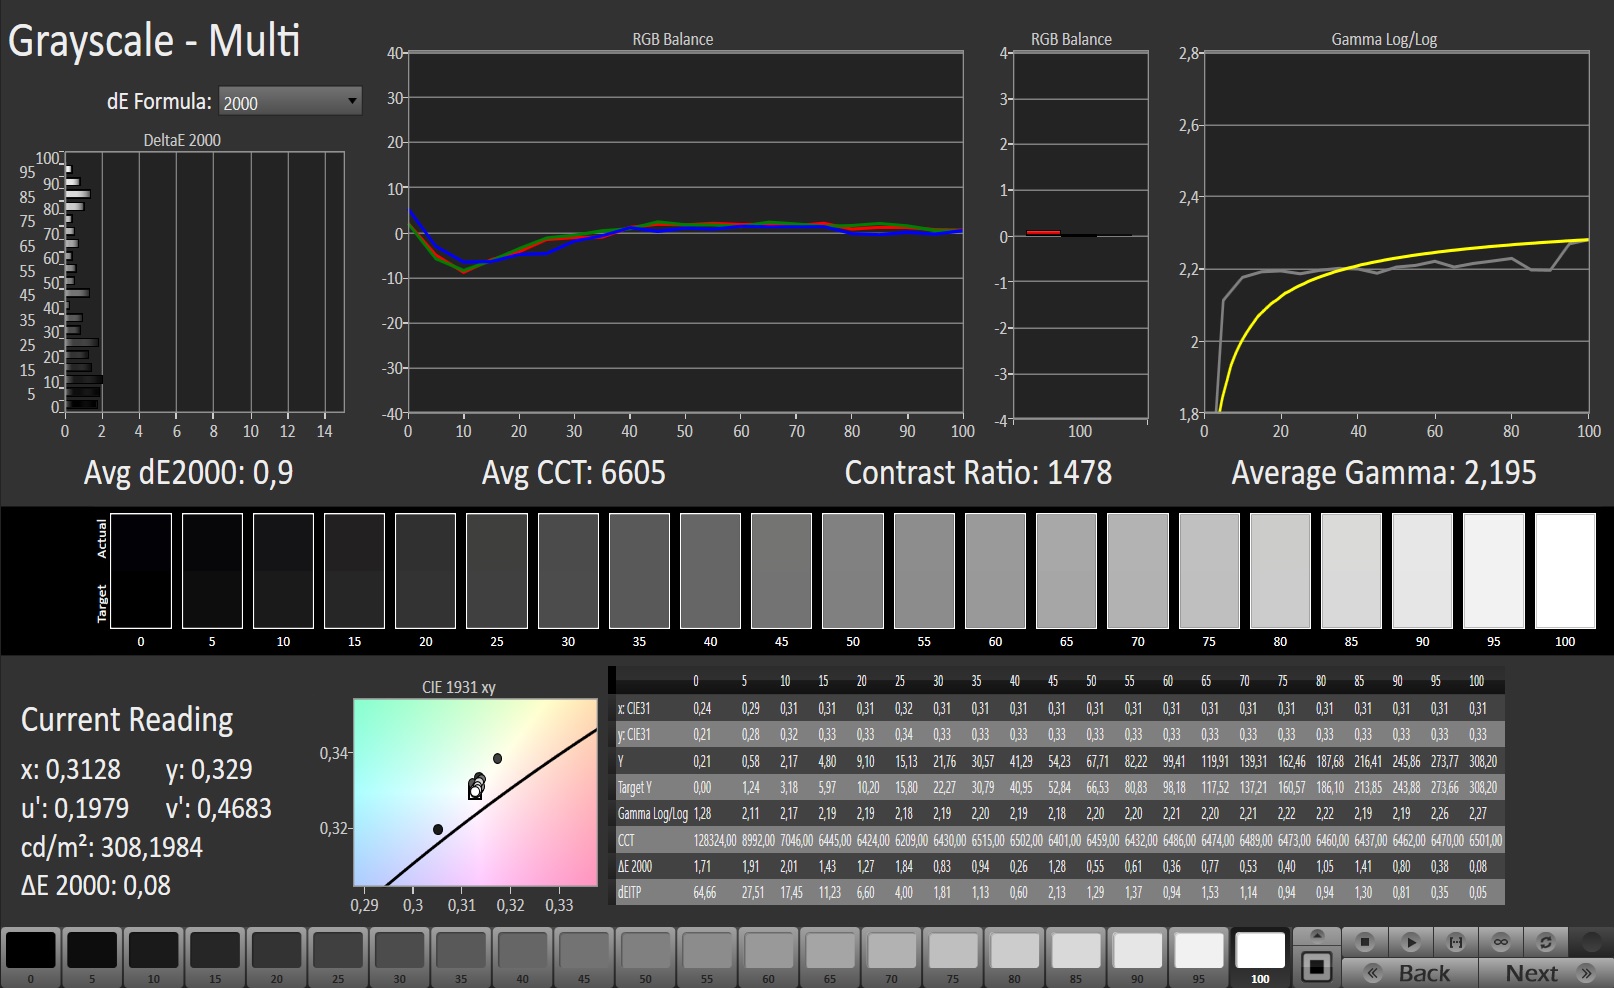
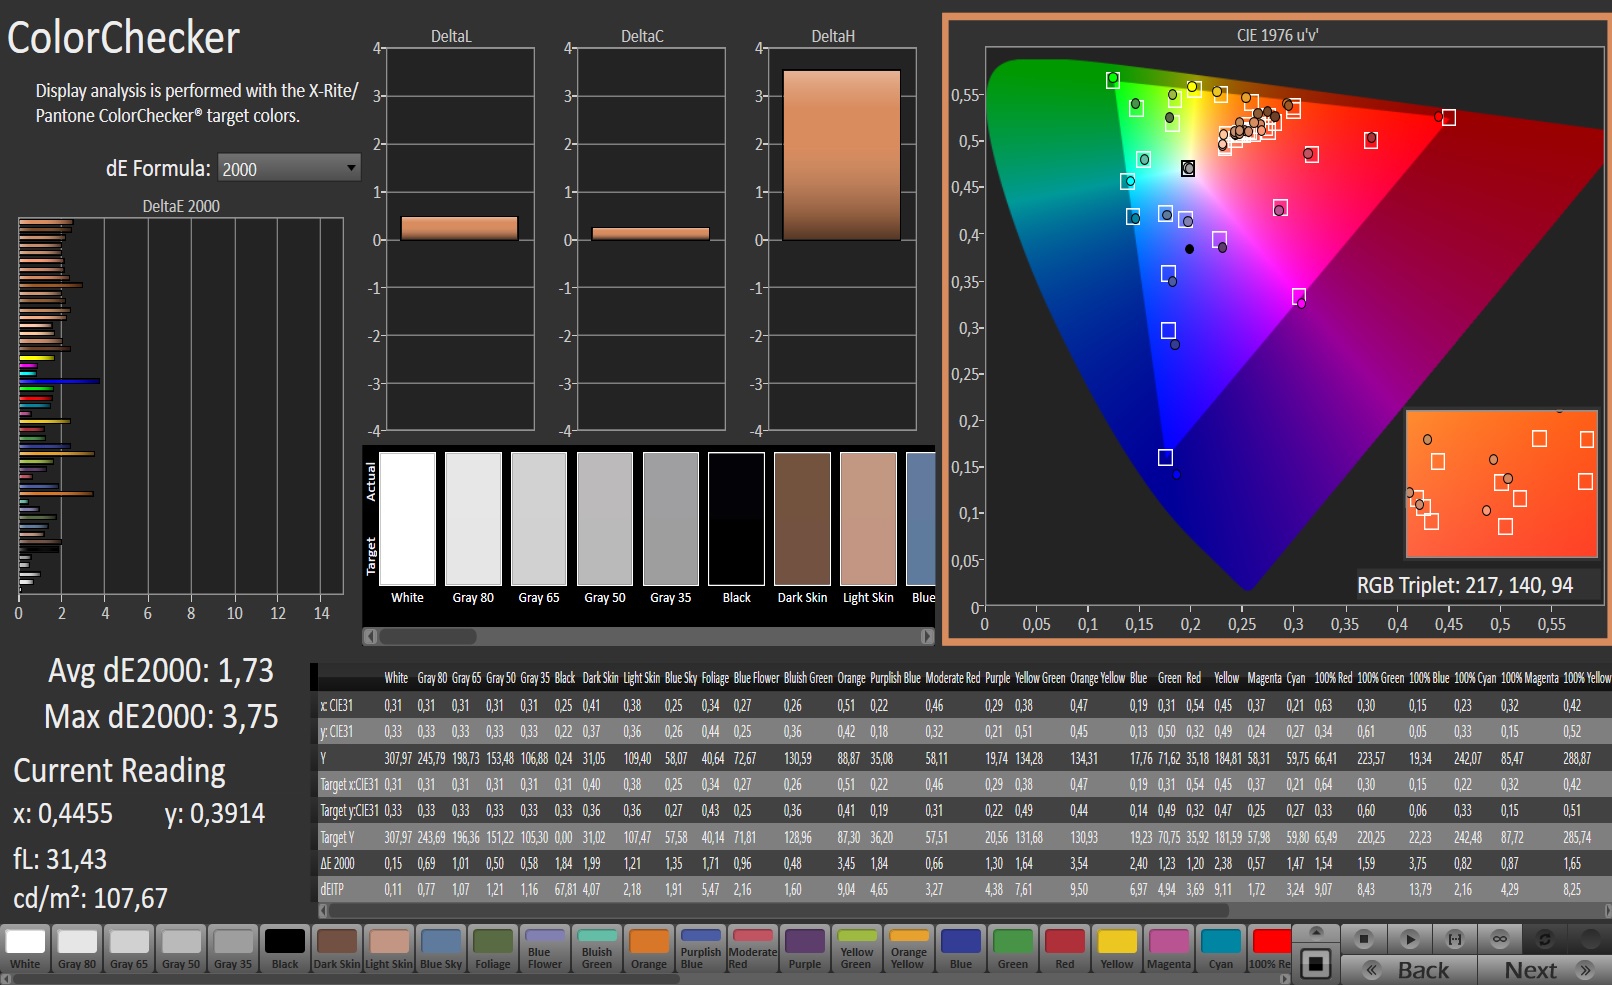
Out of the box, the display shows a mediocre color reproduction. With a Delta E 2000 color deviation of 5.39, the target (Delta E less than 3) is missed. Furthermore, the display suffers from a blue tint. Calibration provides significant improvements. In this way, the color deviation is reduced to 1.73, the blue tint disappears, and the grayscales are displayed in a more balanced way. The AdobeRGB (69%) and sRGB (92%) color spaces aren't fully reproduced.
Display Response Times
| ↔ Response Time Black to White | ||
|---|---|---|
| 9.2 ms ... rise ↗ and fall ↘ combined | ↗ 4.4 ms rise | 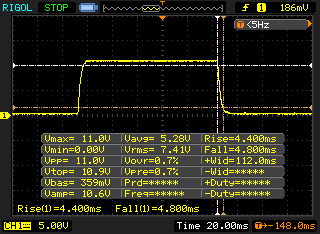 |
| ↘ 4.8 ms fall | ||
| The screen shows fast response rates in our tests and should be suited for gaming. In comparison, all tested devices range from 0.1 (minimum) to 240 (maximum) ms. » 26 % of all devices are better. This means that the measured response time is better than the average of all tested devices (19.8 ms). | ||
| ↔ Response Time 50% Grey to 80% Grey | ||
| 10 ms ... rise ↗ and fall ↘ combined | ↗ 5.2 ms rise | 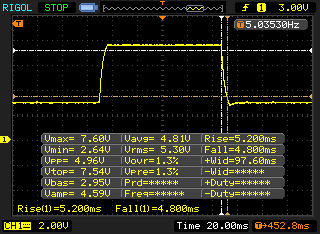 |
| ↘ 4.8 ms fall | ||
| The screen shows good response rates in our tests, but may be too slow for competitive gamers. In comparison, all tested devices range from 0.165 (minimum) to 636 (maximum) ms. » 23 % of all devices are better. This means that the measured response time is better than the average of all tested devices (31 ms). | ||
Screen Flickering / PWM (Pulse-Width Modulation)
| Screen flickering / PWM not detected | 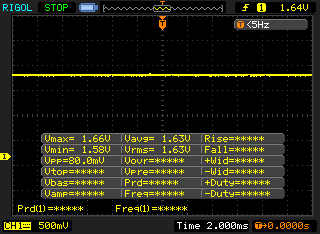 | ||
In comparison: 52 % of all tested devices do not use PWM to dim the display. If PWM was detected, an average of 7747 (minimum: 5 - maximum: 343500) Hz was measured. | |||
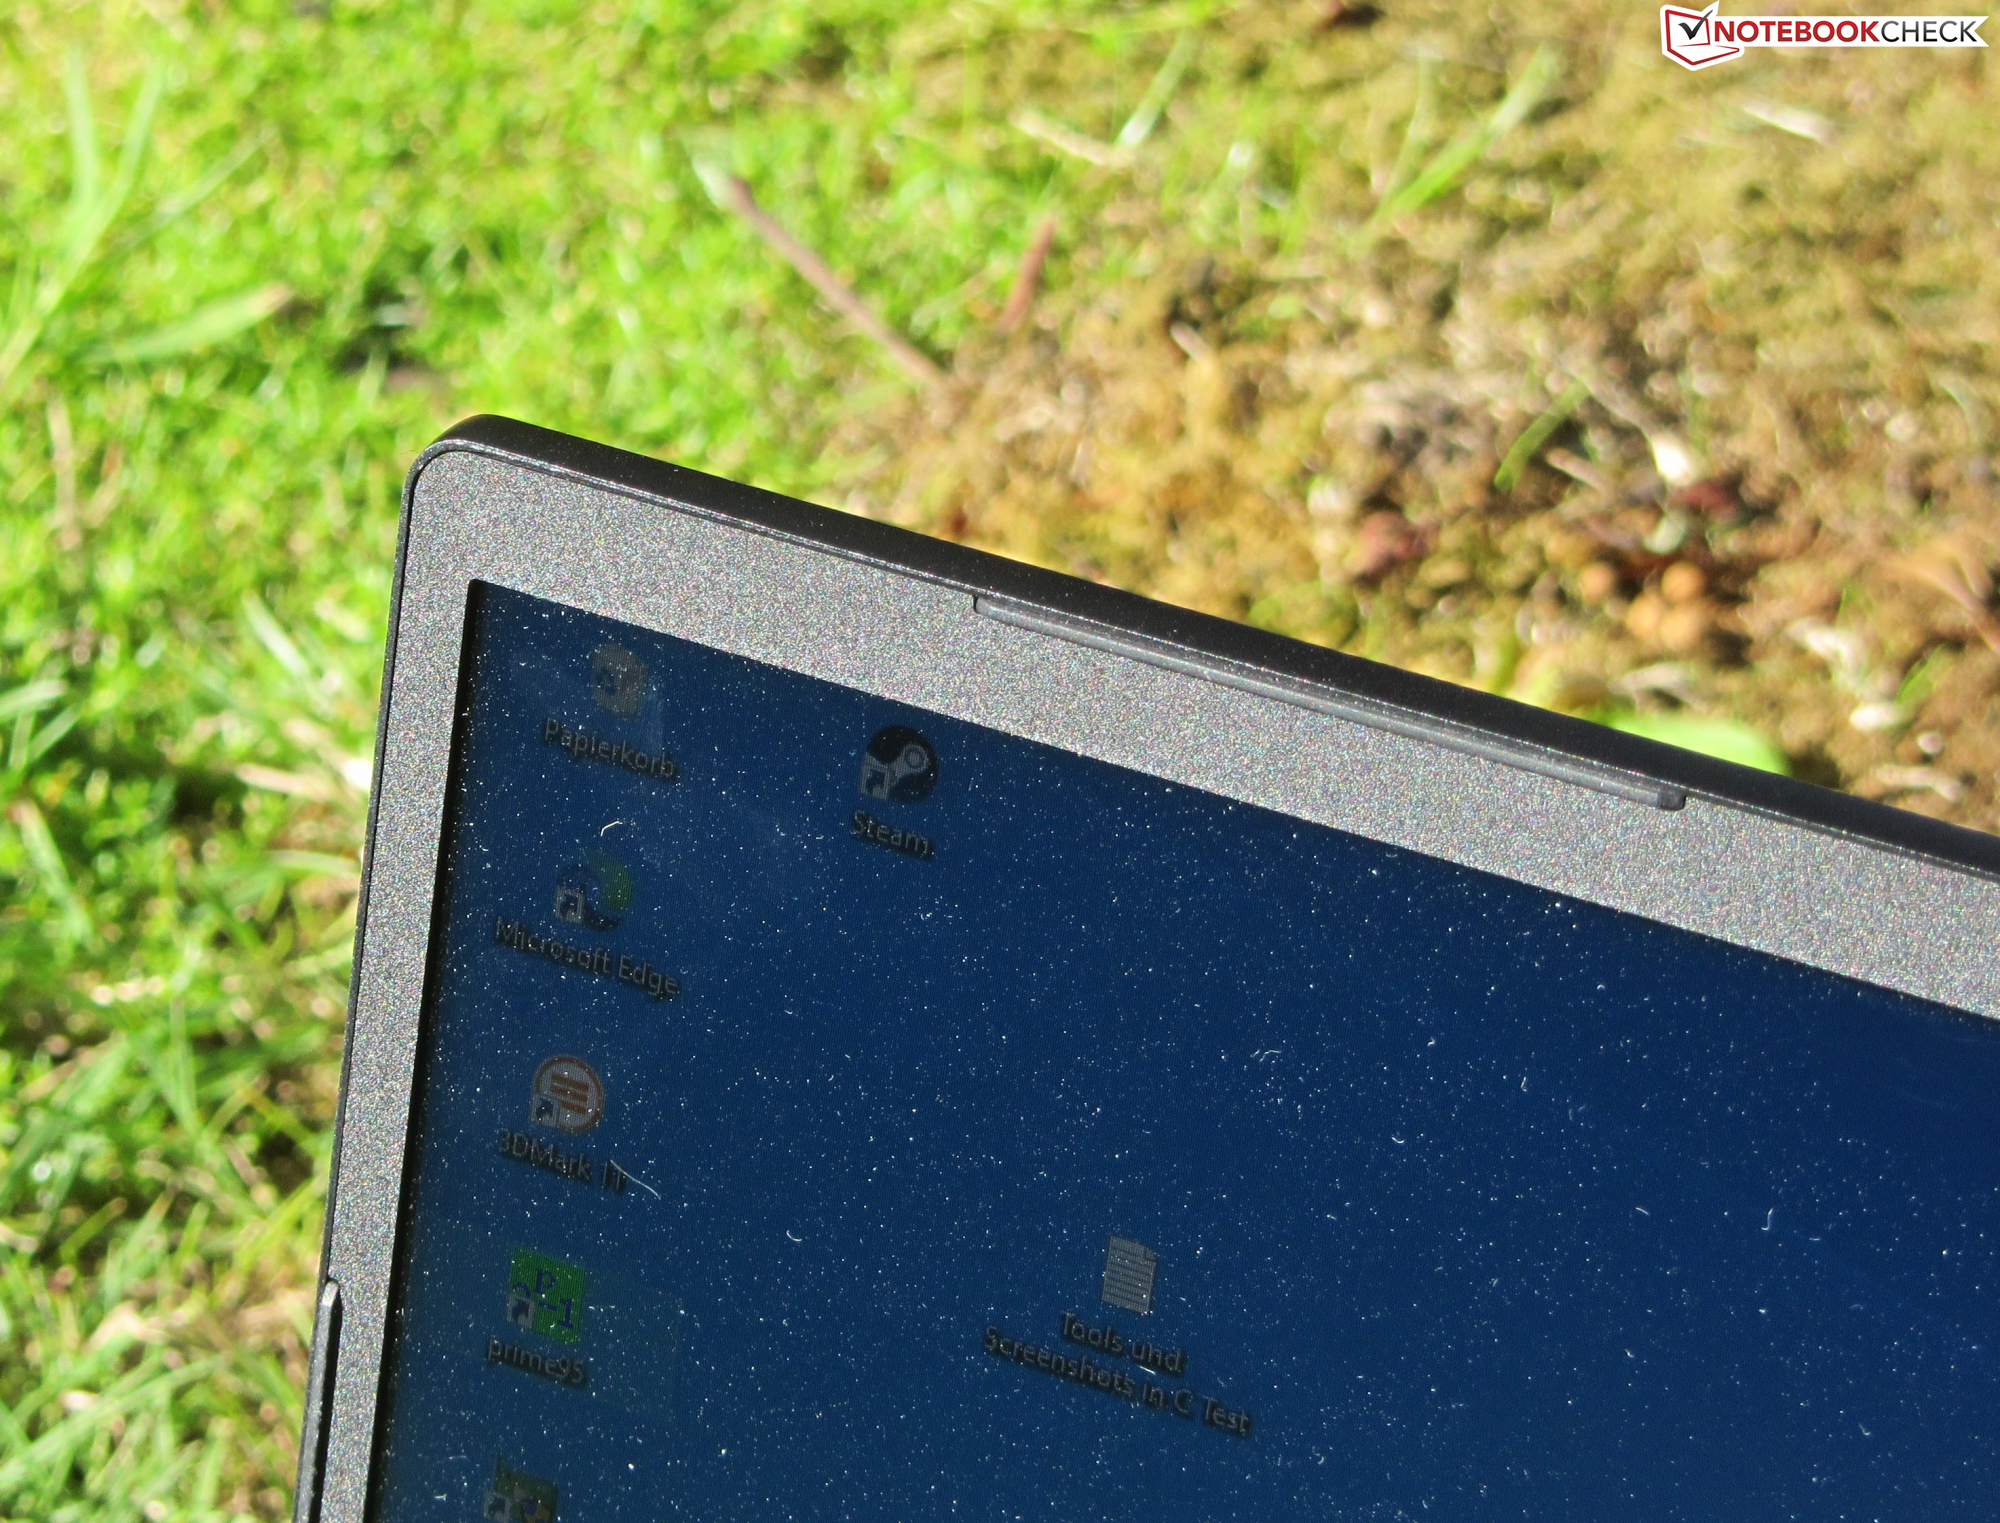
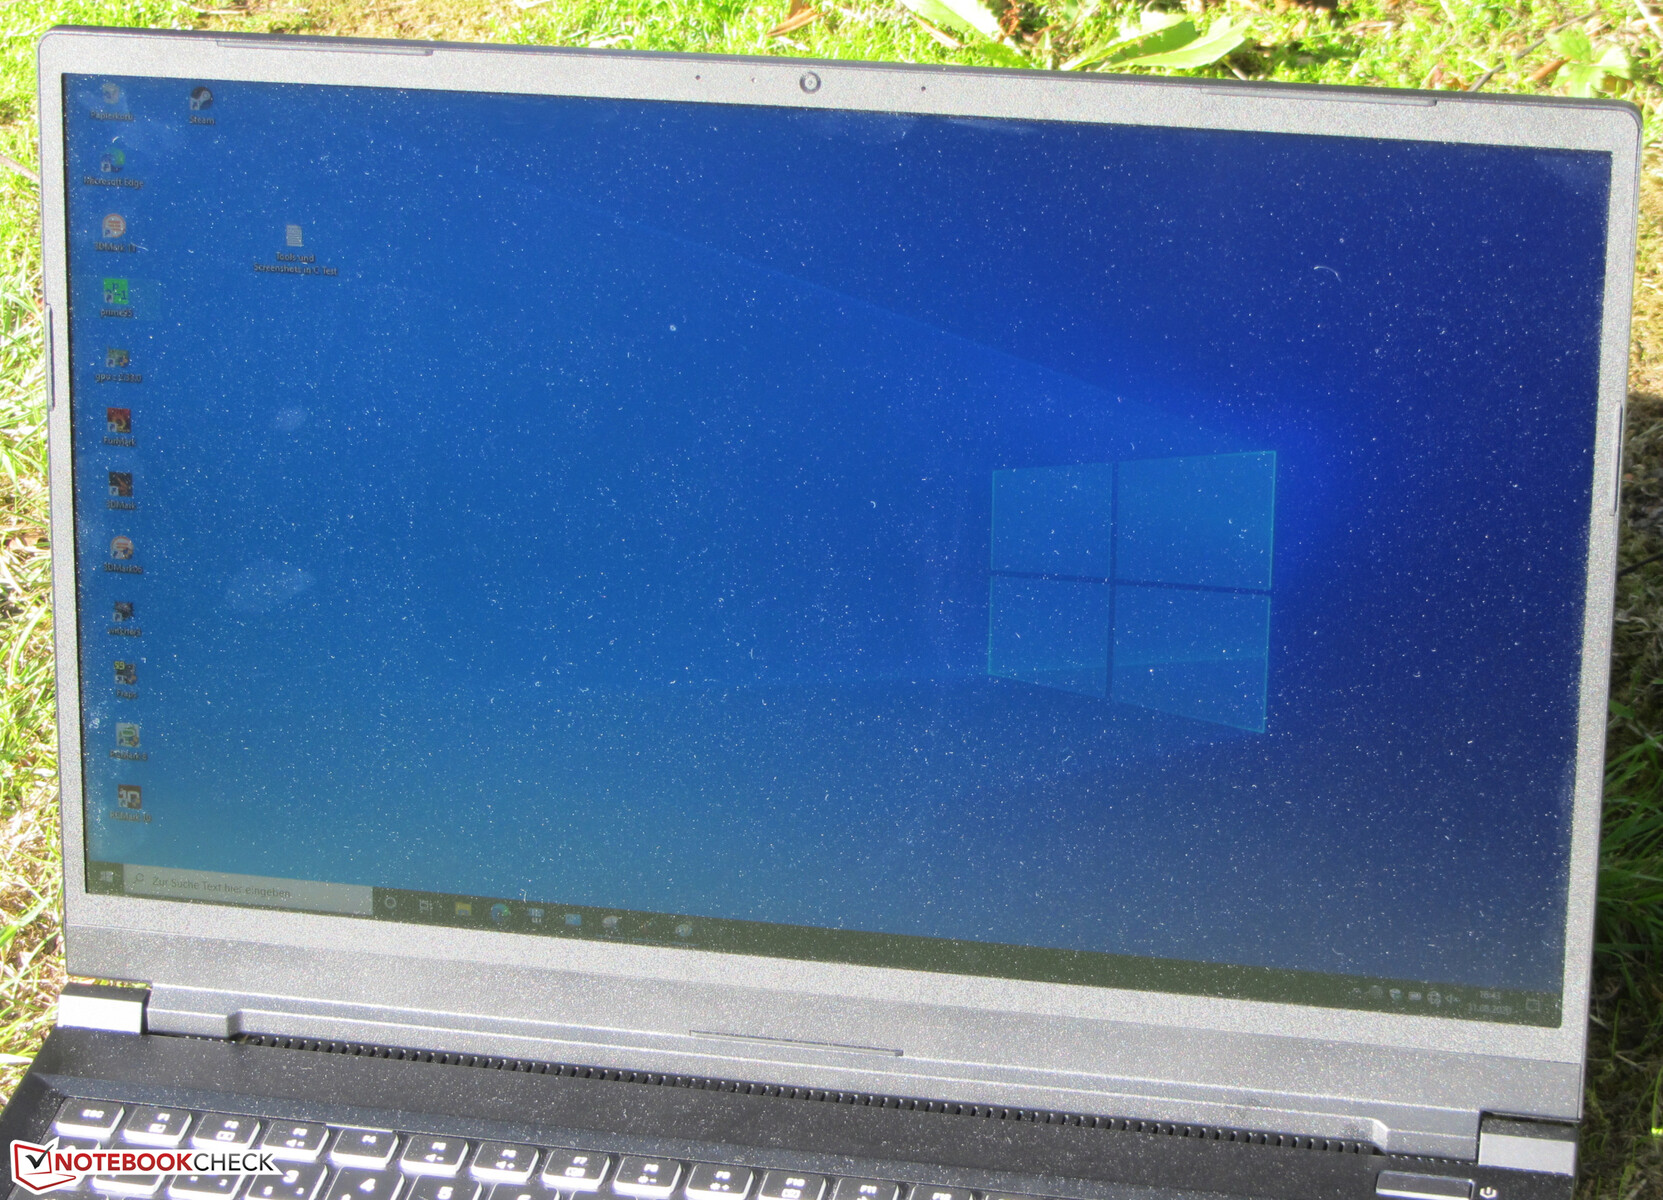
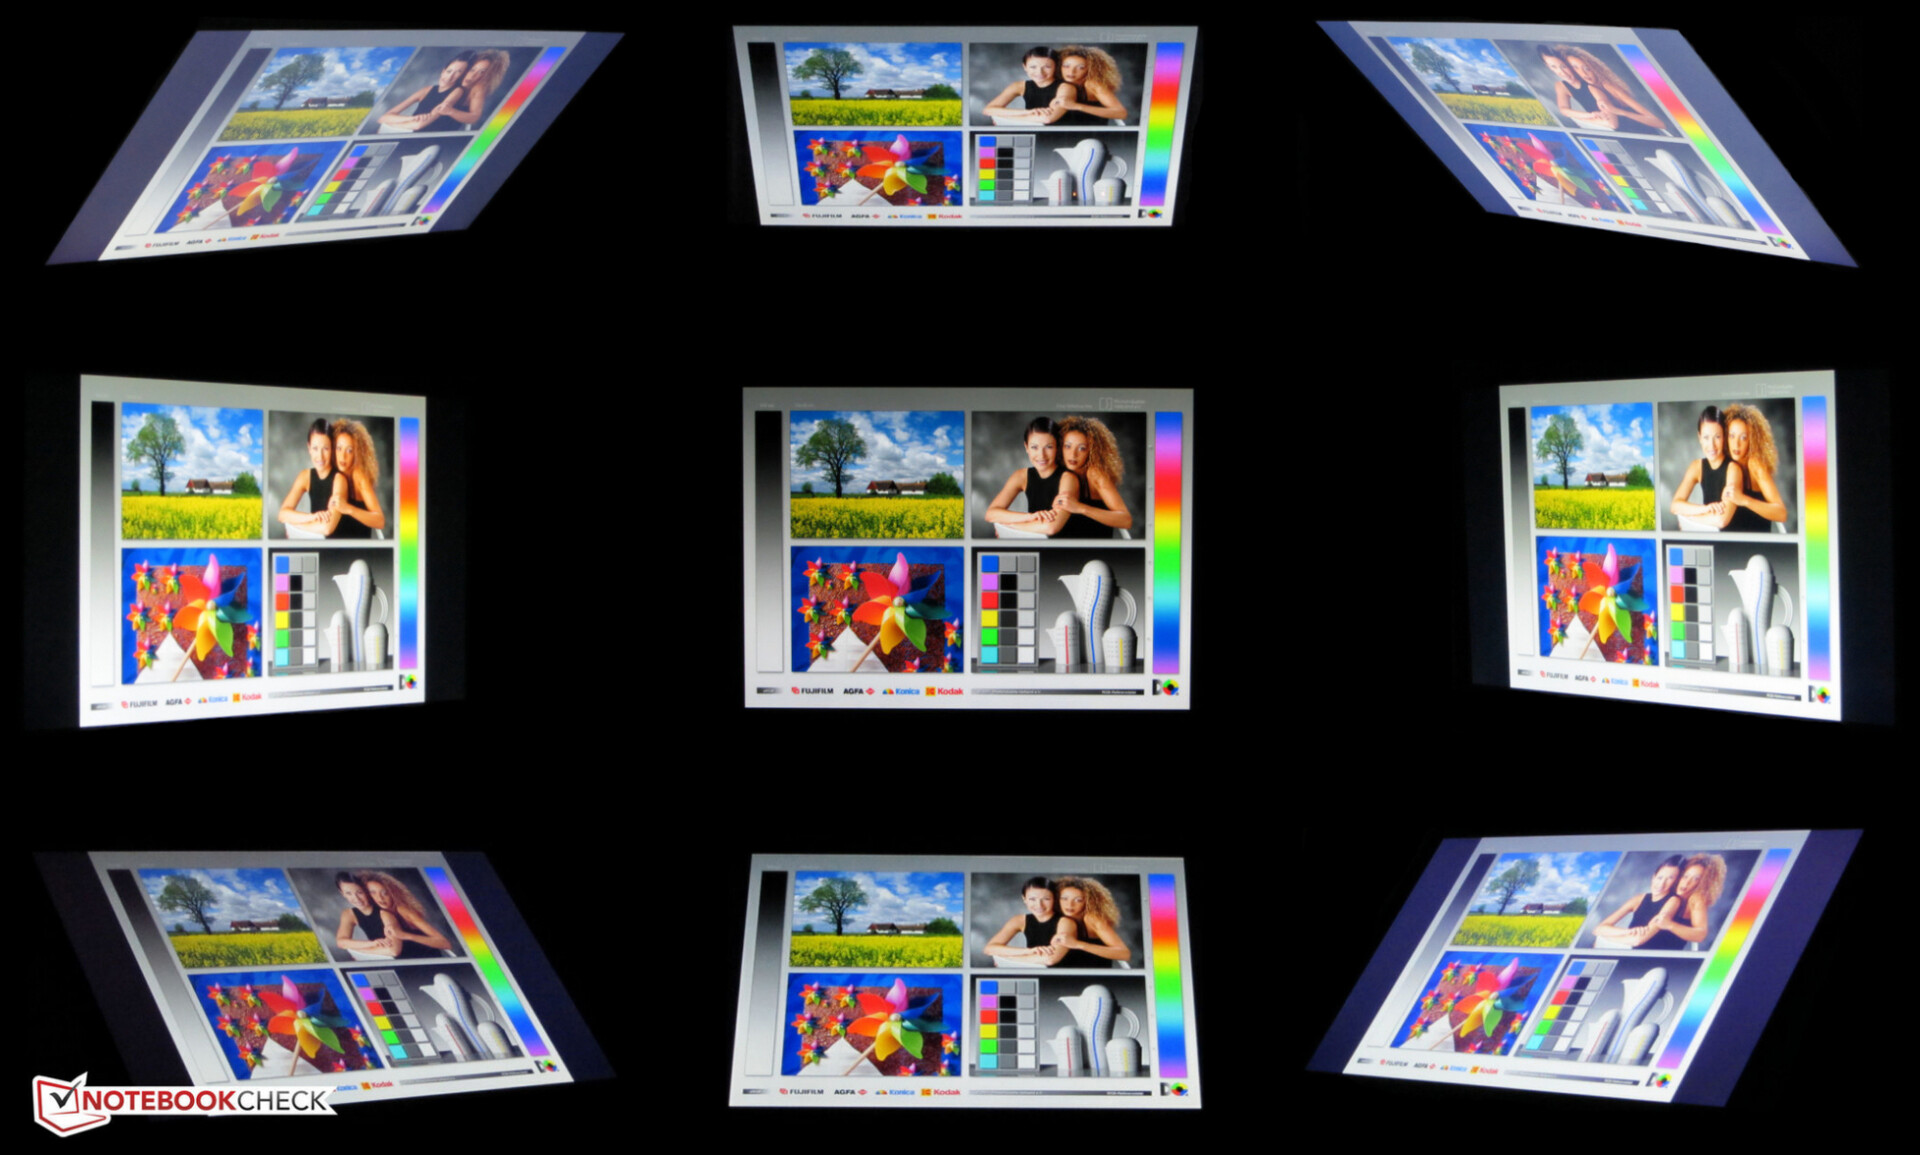
Schenker has equipped the laptop with a viewing-angle-stable IPS panel. The screen can thus be read from any position. Outdoors, the display can only be read when the sun is not too bright.
Performance - The Schenker laptop offers high-end hardware
With the Key 15, Schenker has a 15.6-inch gaming laptop in its range that brings every modern game smoothly onto the screen and also cuts a fine figure in all other application areas. Our test device costs just under 3,000 Euros (~$3,548). In addition, the device can be individually customized in the Schenker online store.


Test conditions
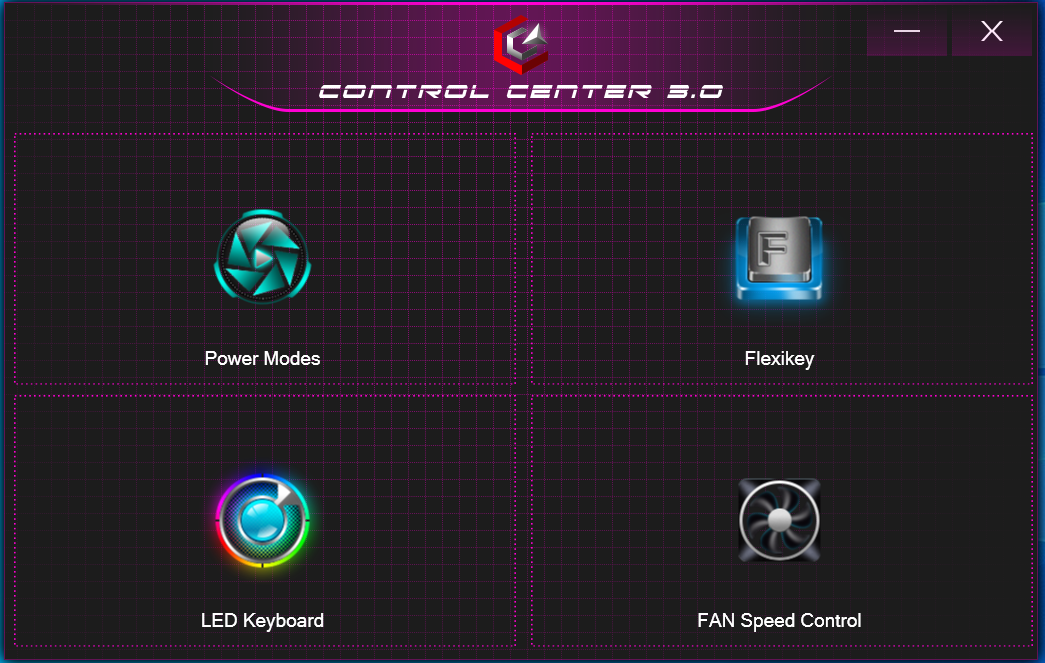
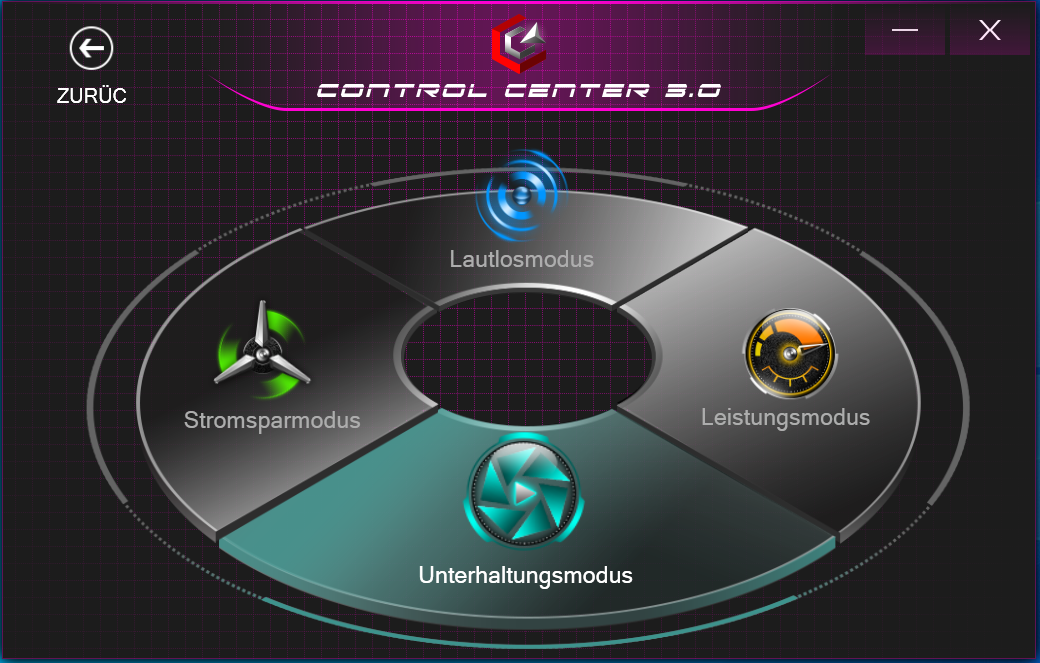
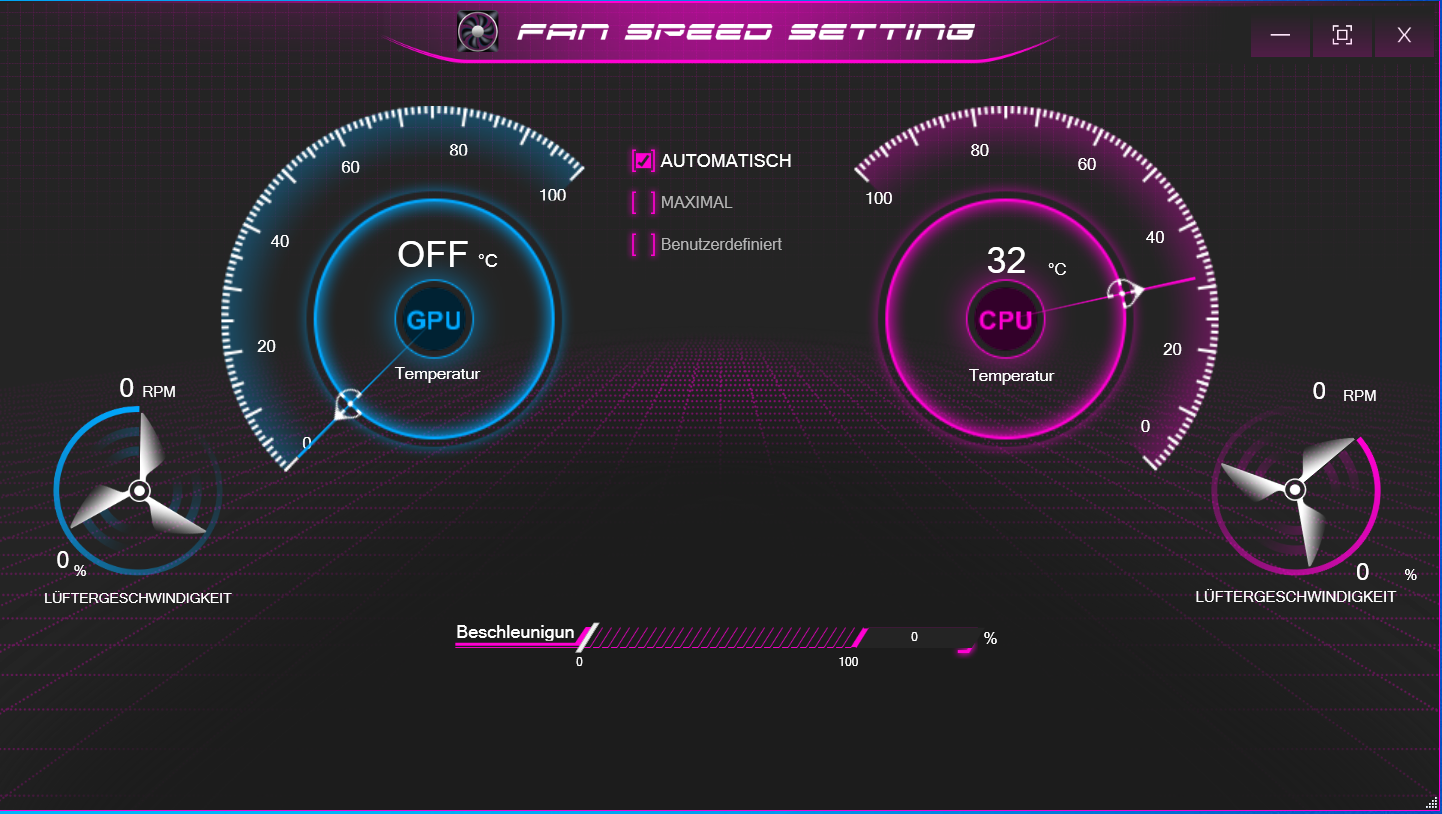
The preinstalled Control Center software allows, among other things, the fan control to be adjusted and an energy profile to be selected. We conducted all tests with automatic fan control and the "Entertainment Mode" energy profile. We also ran some benchmarks with the "Power Mode" profile active.

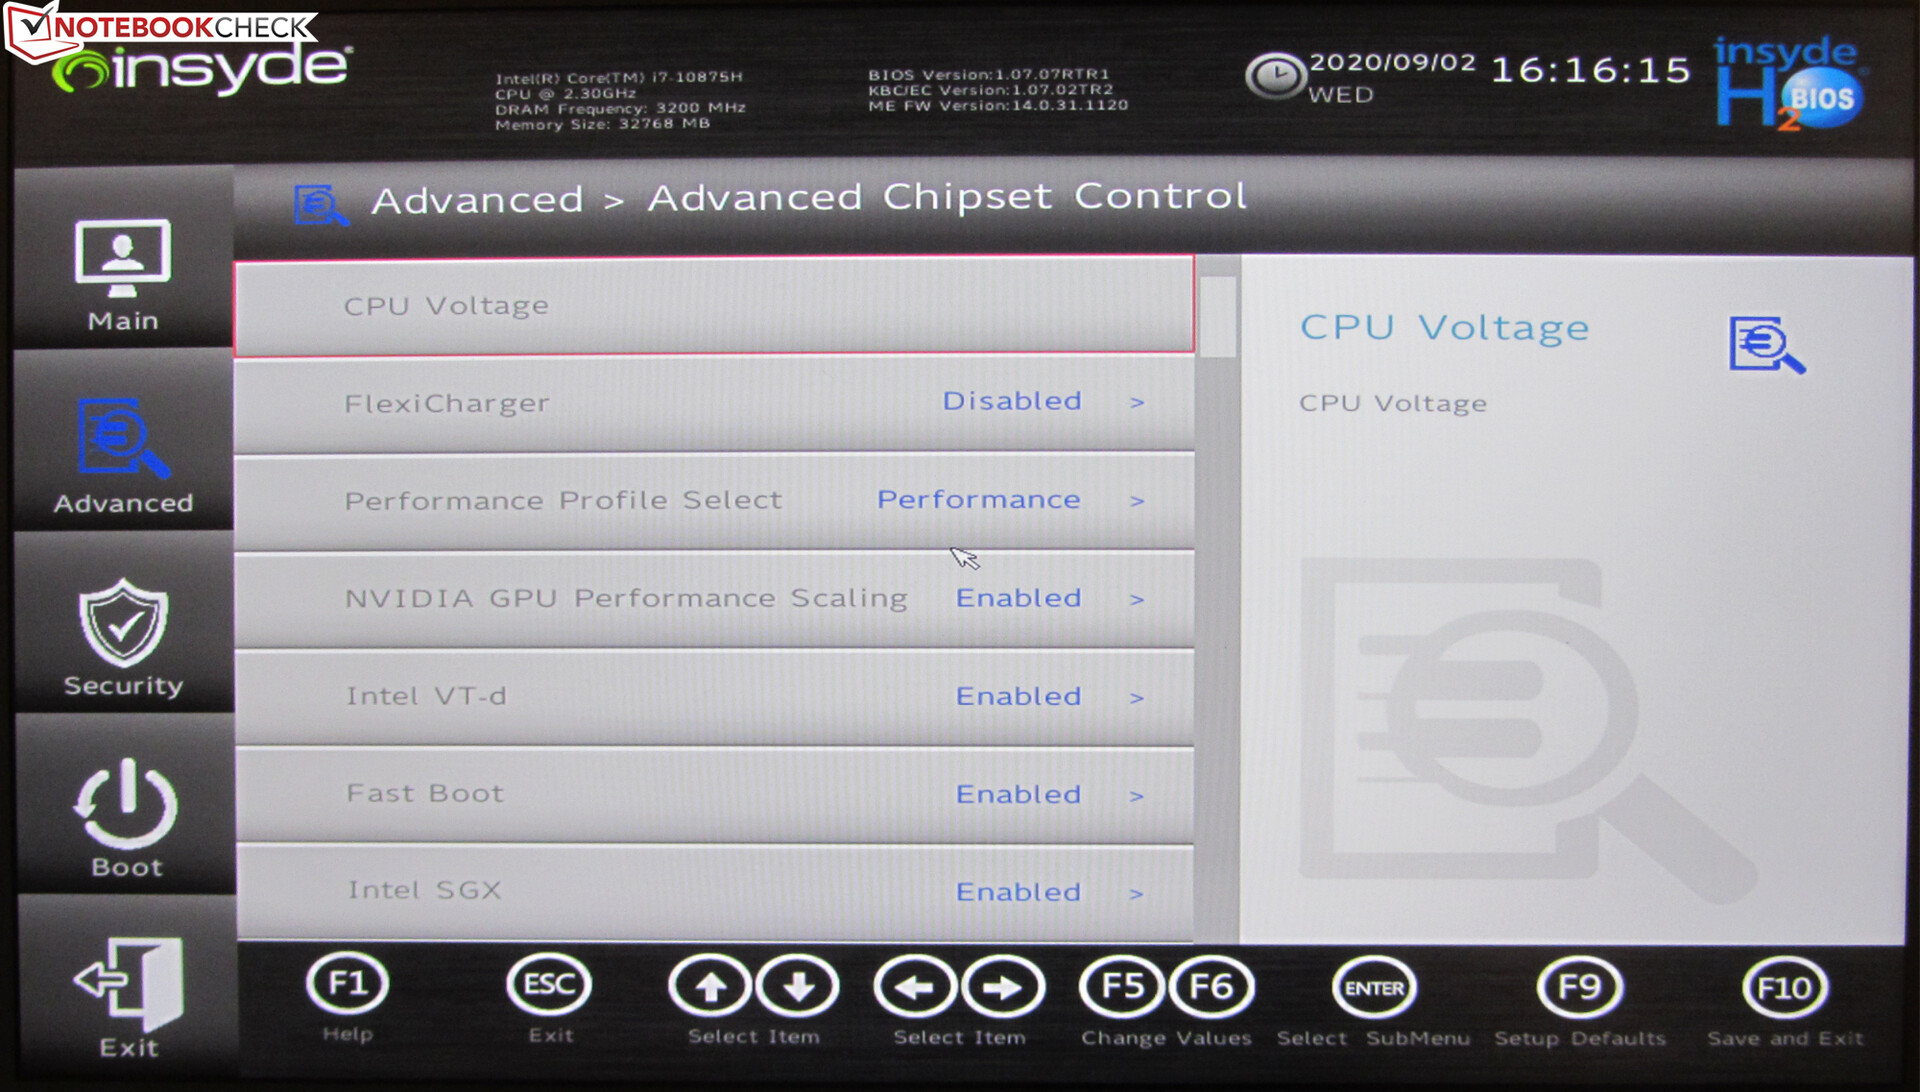
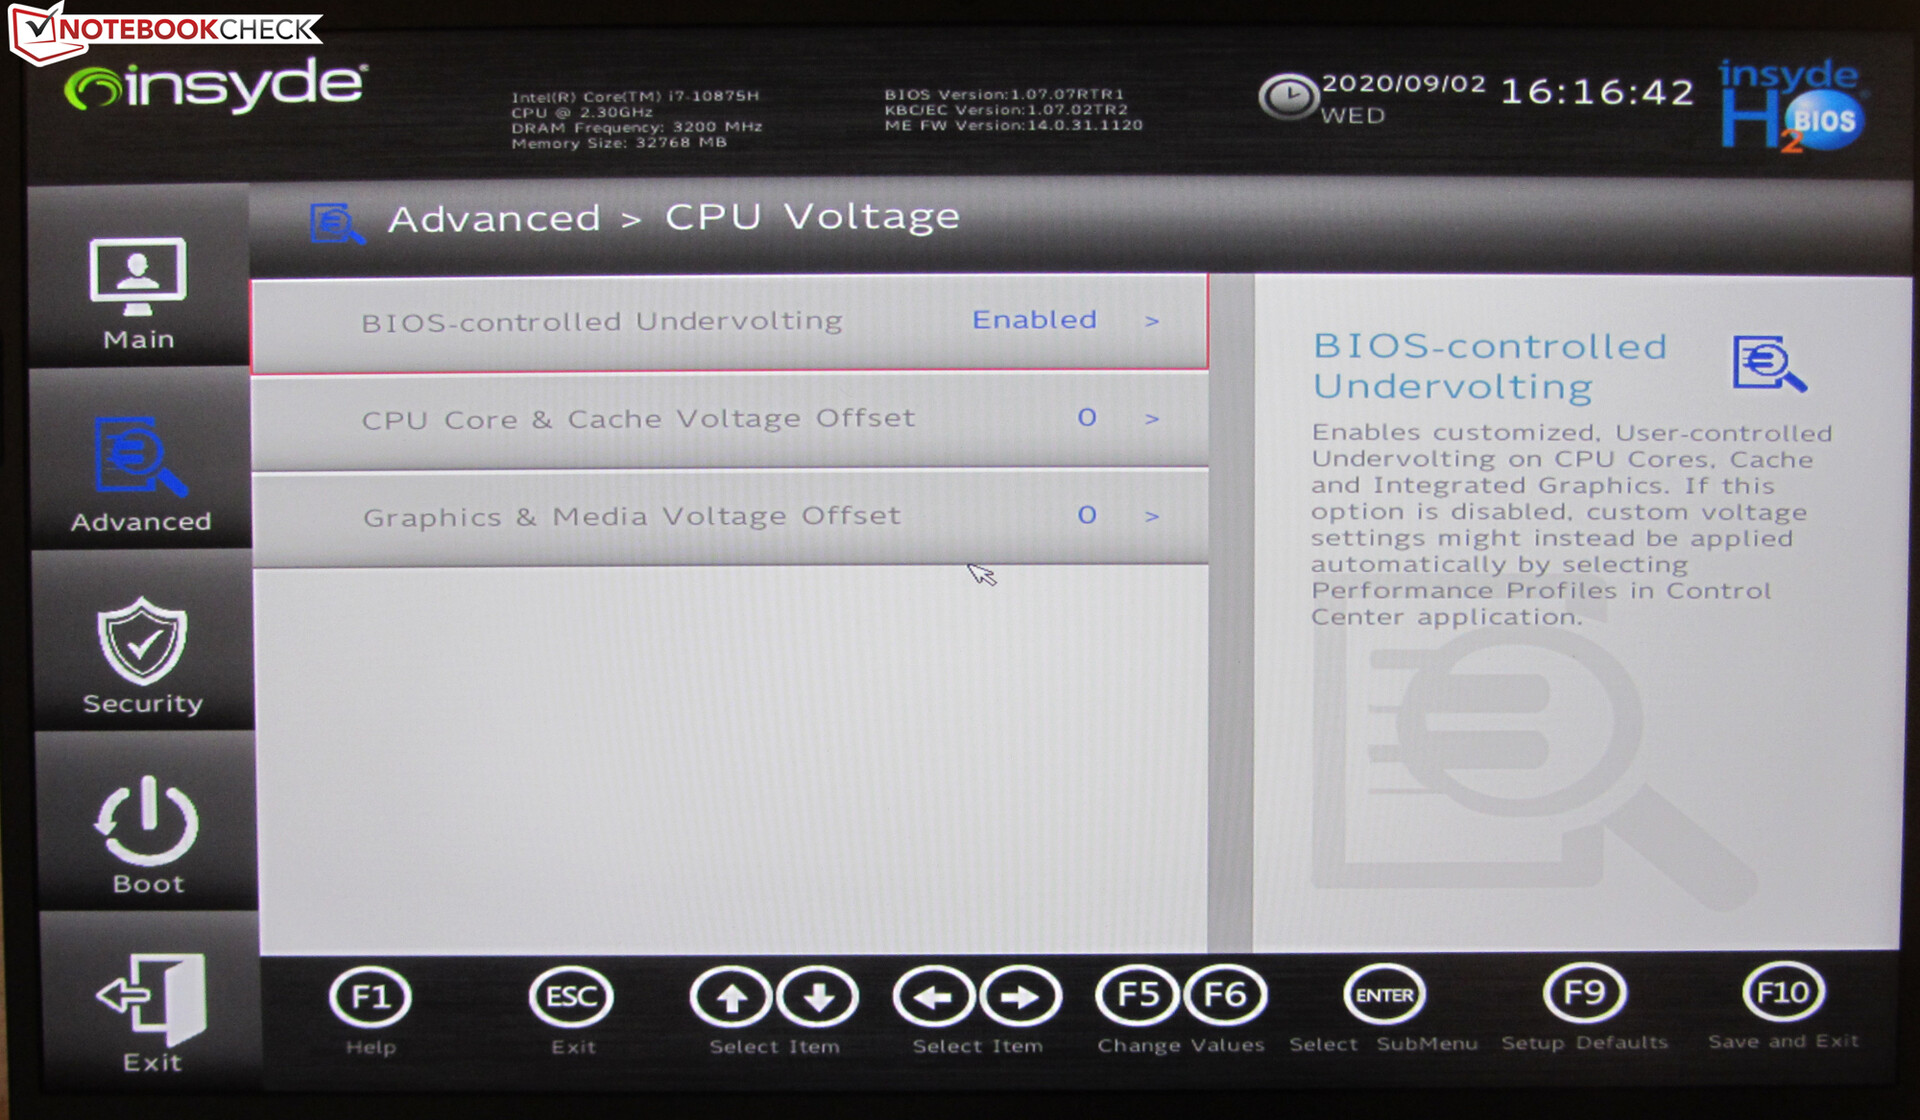
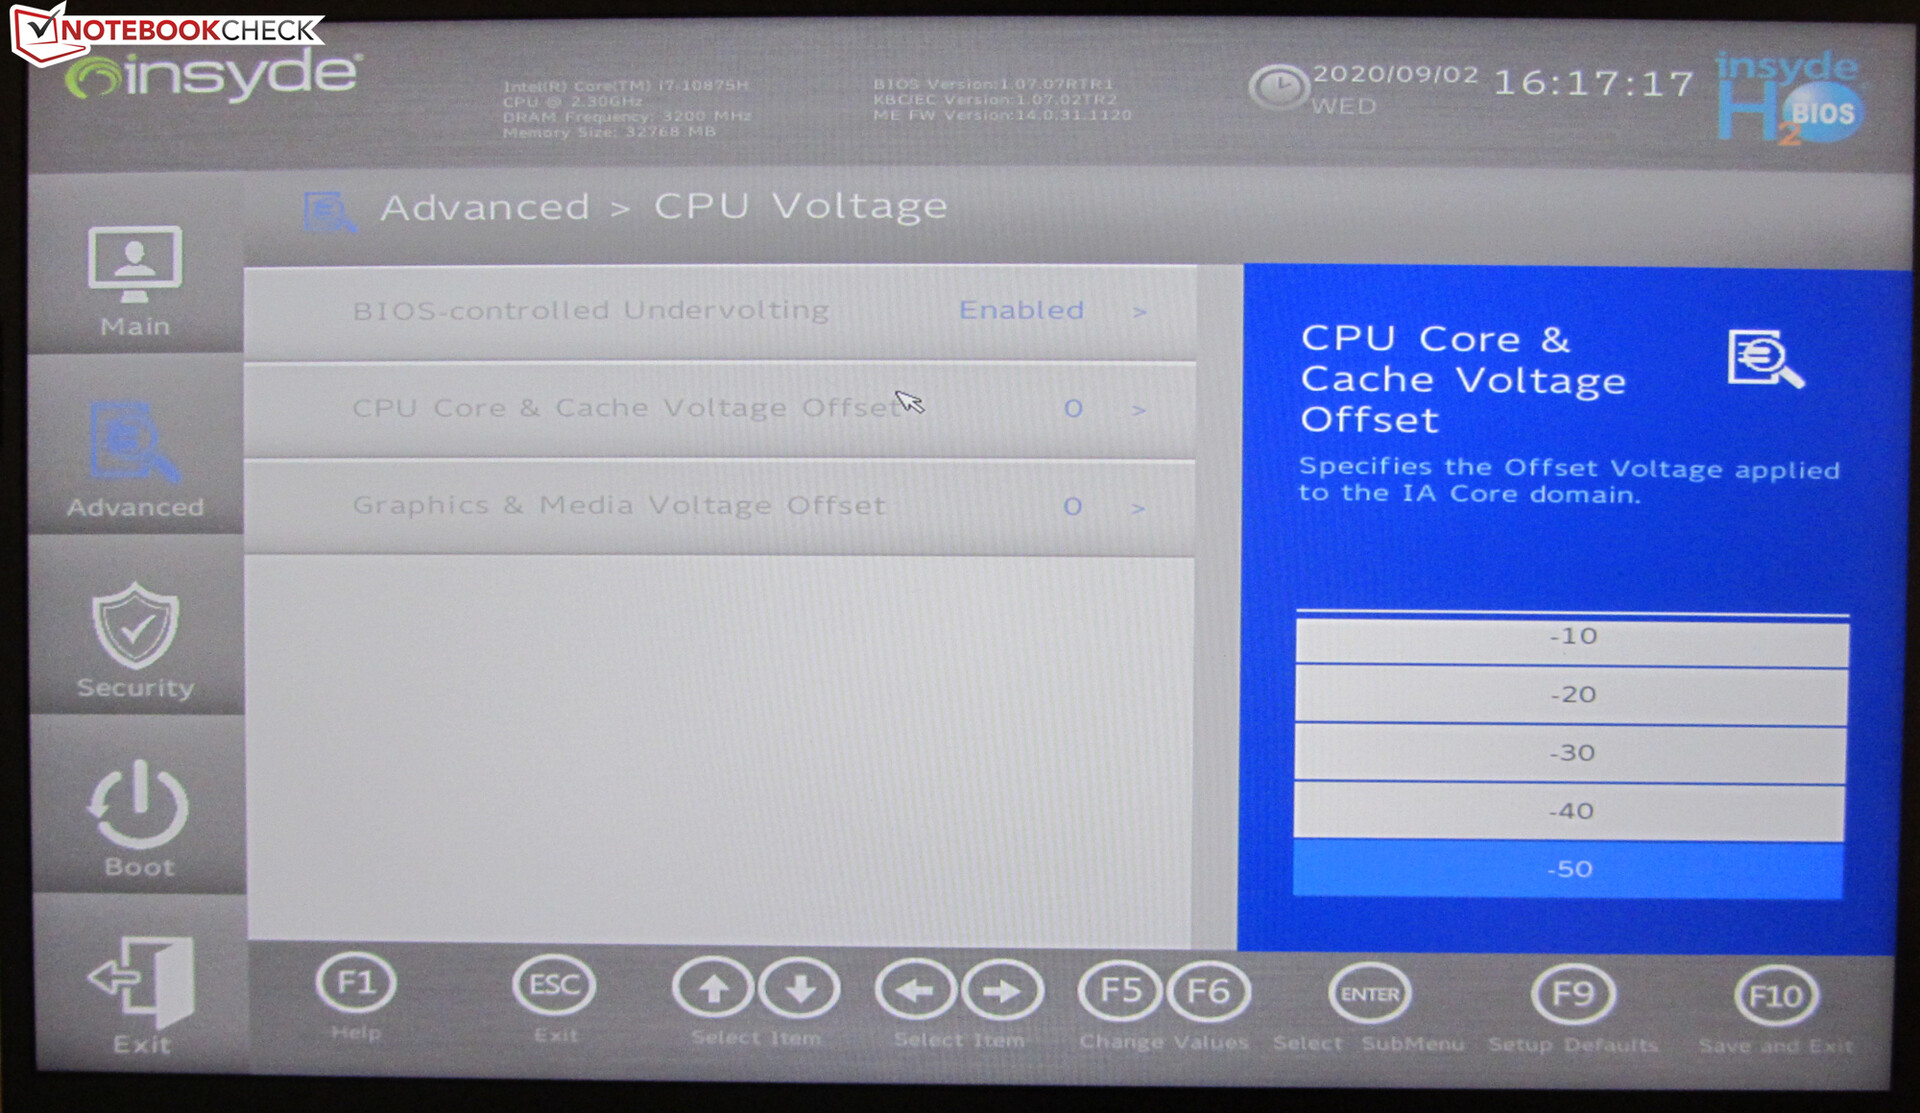
Undervolting via BIOS
The processor and the integrated GPU can be operated with lower voltages than those provided by the manufacturer (undervolting). As a result, energy consumption and heat development are lower. But reducing the voltage too much can lead to an unstable or faulty system. Schenker has, therefore, limited the voltage decrease to a maximum of 50 mV using 10 mV steps. If errors or instabilities occur, it's necessary to switch back to the previous voltage step. Please note: Undervolting is always done at the user's own risk.
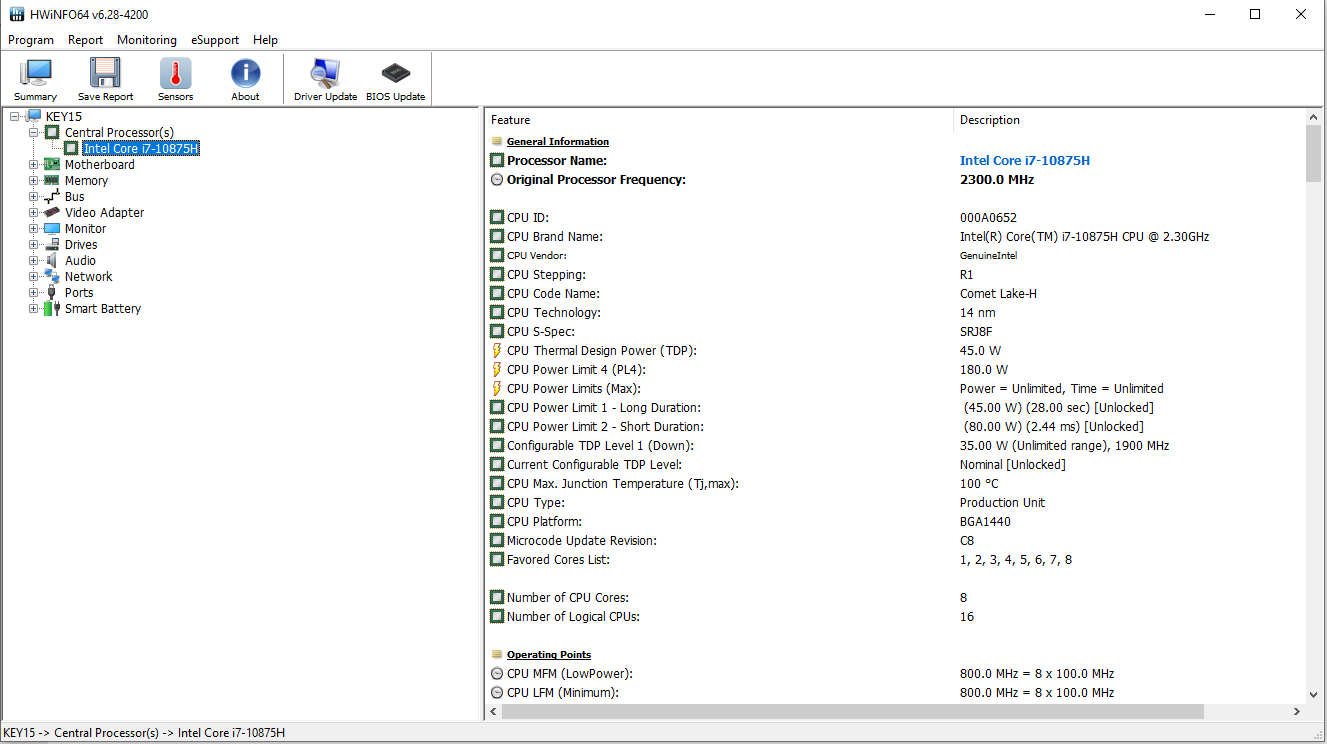
Processor
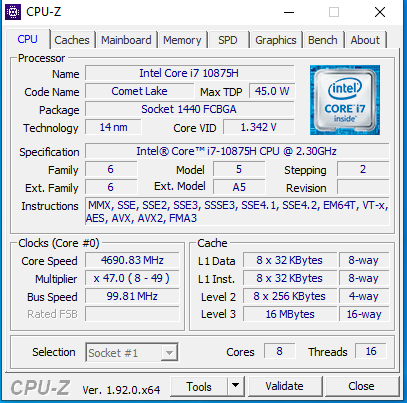
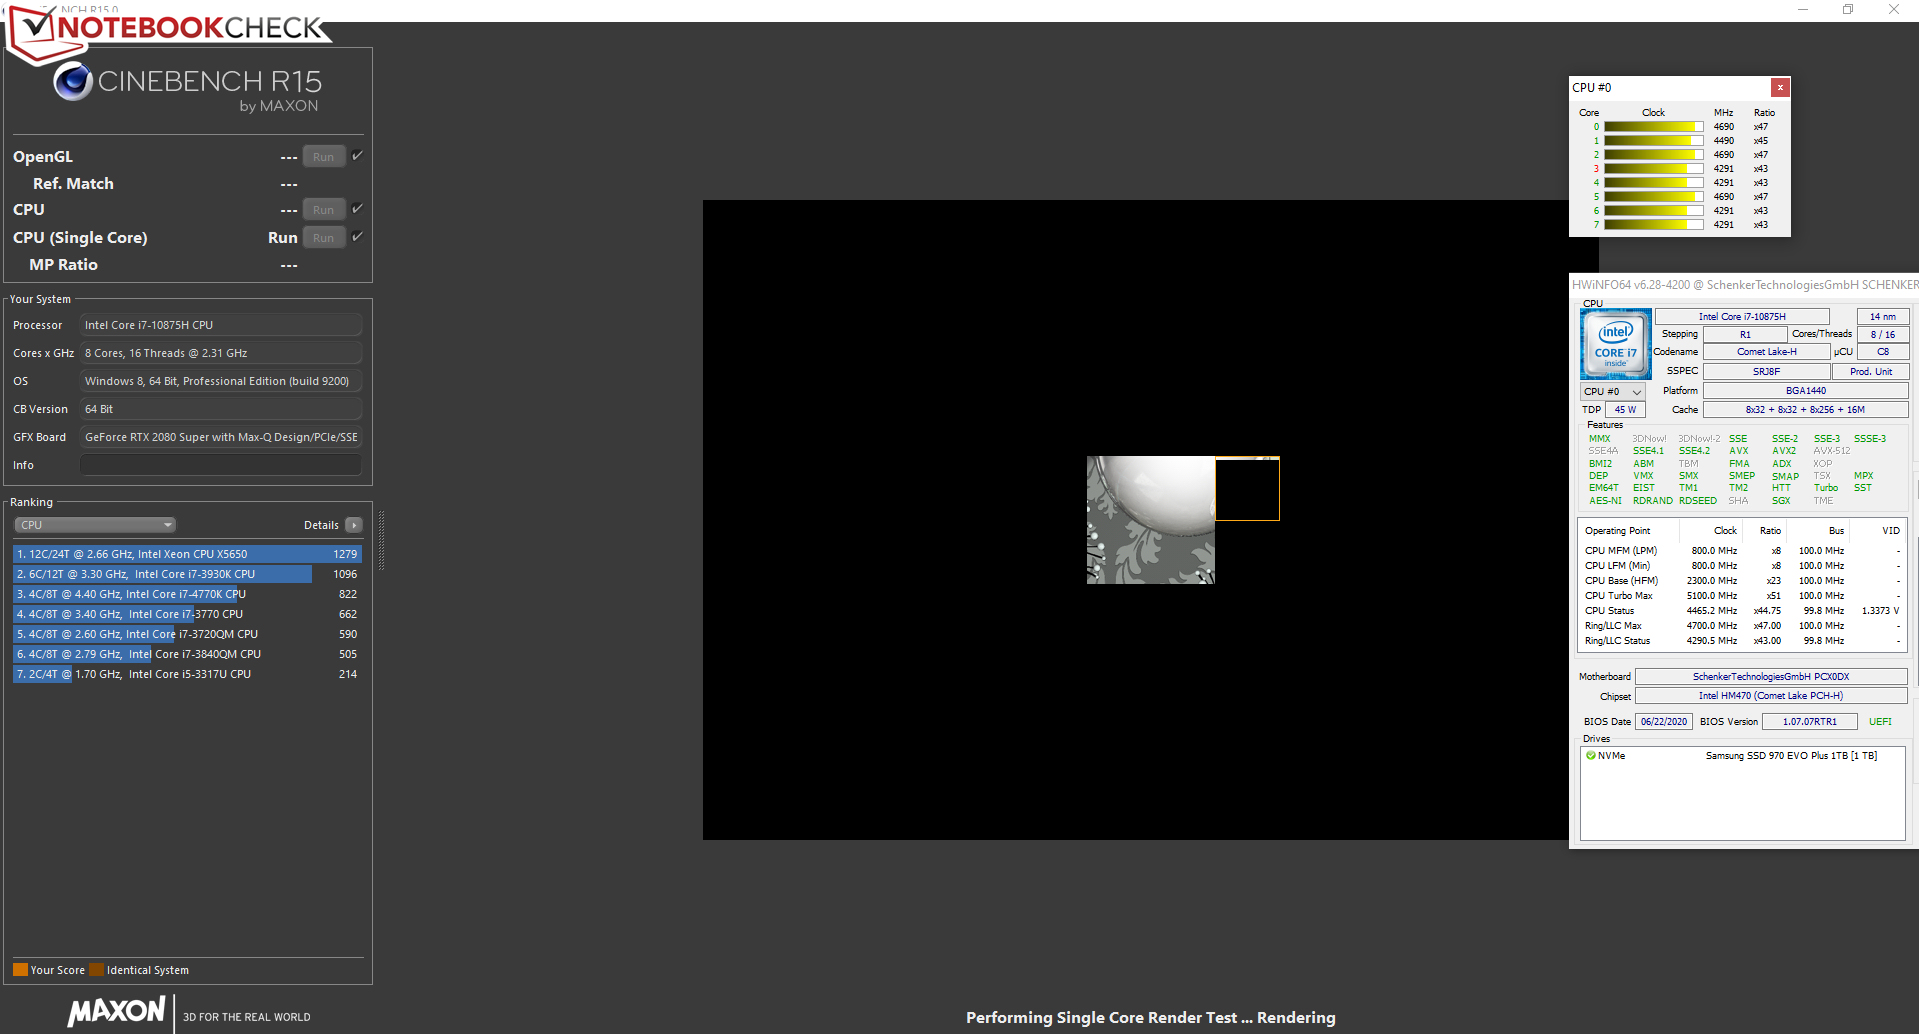
The Key 15 is powered by a Core i7-10875H octa-core processor (Comet Lake). The CPU operates at a base speed of 2.3 GHz. The clock speed can be increased to 4.3 GHz (eight cores) or 5.1 GHz (one core) via Turbo. Hyper-Threading (two threads per core) is supported.
The processor briefly works through the multithread test of the Cinebench R15 benchmark at 2.3 to 4.3 GHz. The single-thread test is run at 4.3 to 5.1 GHz. On battery power, the clock rates are 1.9 to 2.6 GHz (multithread) and 2 to 4.9 GHz (single-thread), respectively.
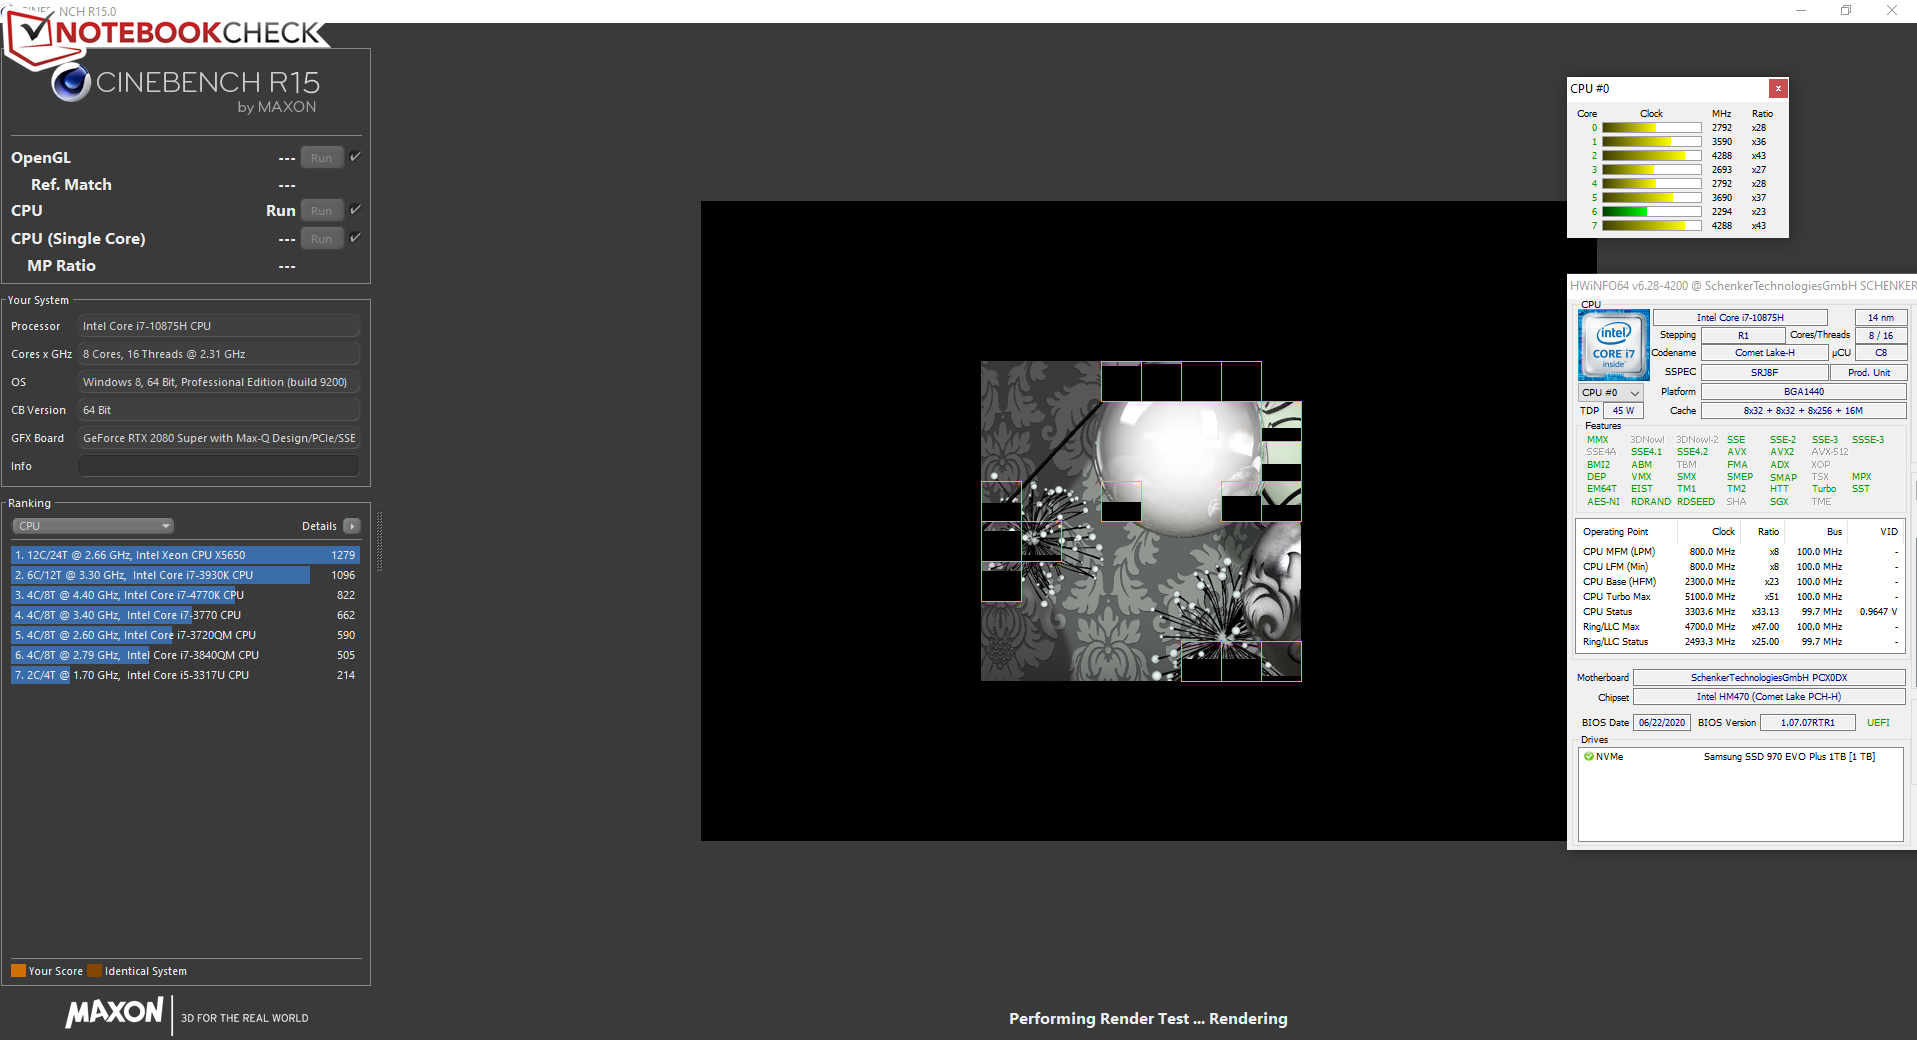
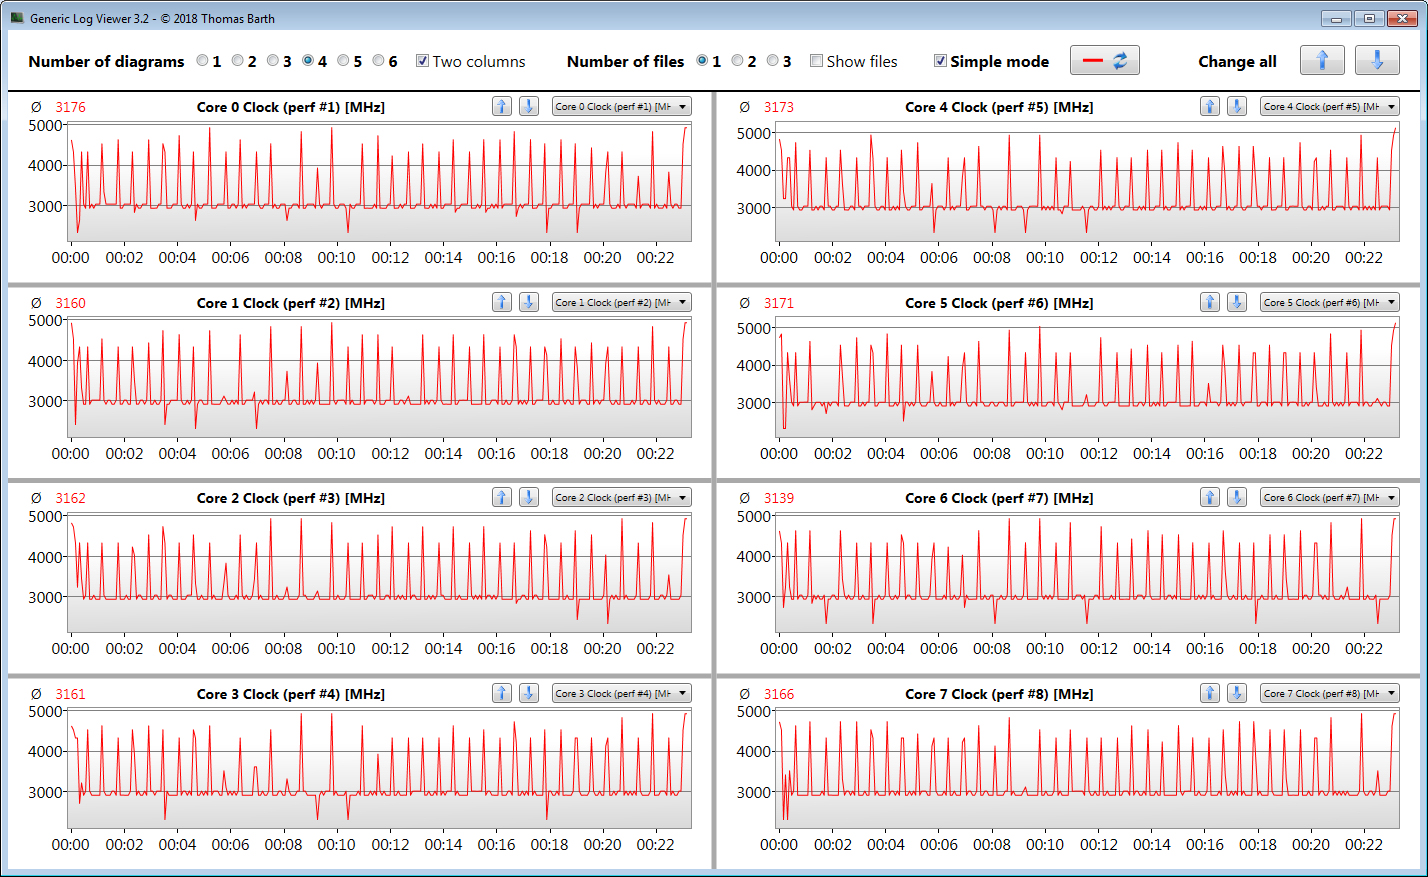
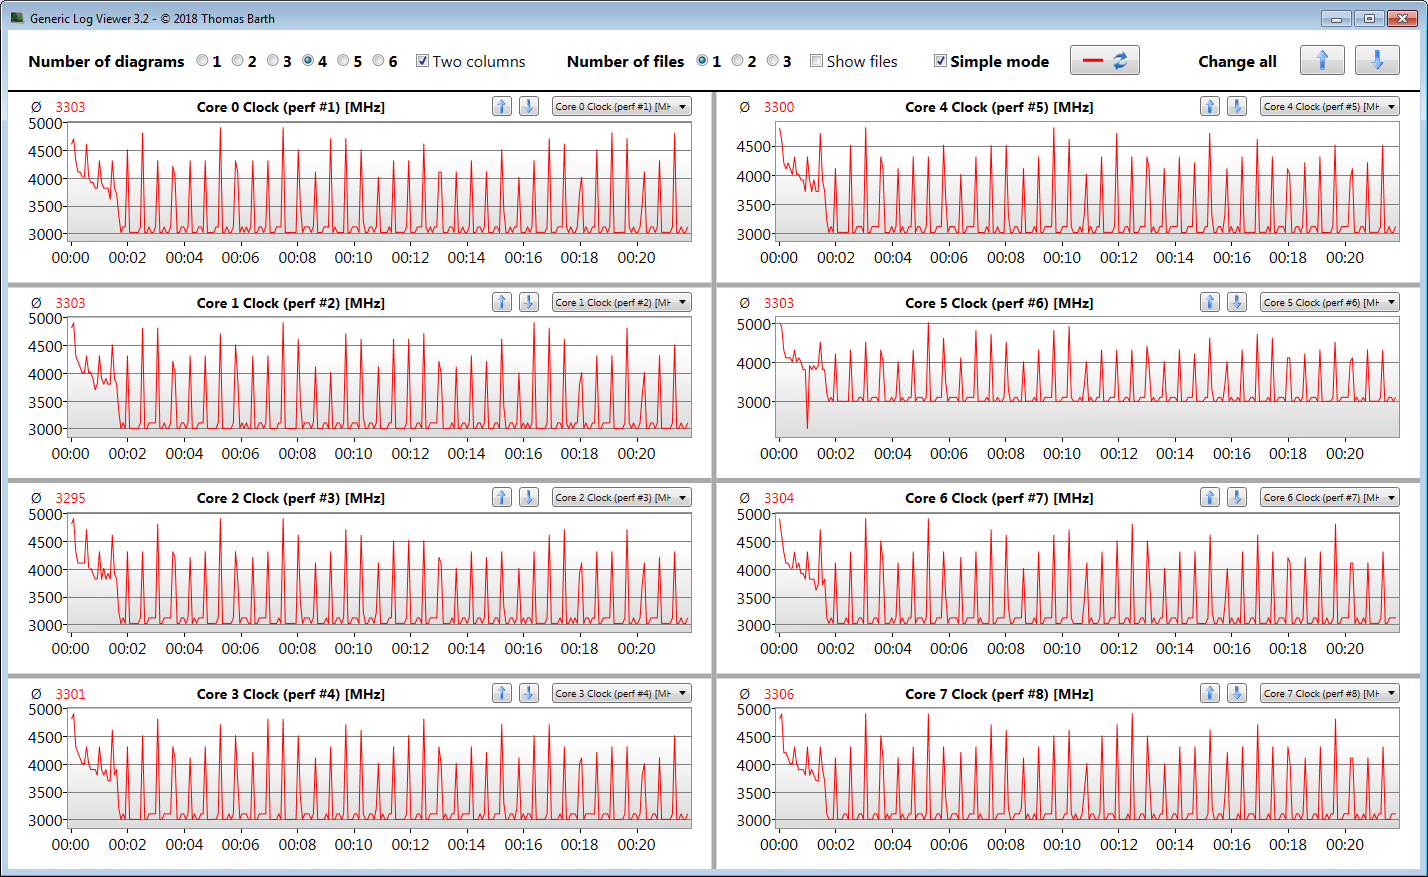
We verify if the CPU Turbo is also consistently used when plugged in by running the Cinebench R15 benchmark's multithread test in a continuous loop for at least 30 minutes. The results drop from the first to the second run and then remain at a constant level. Turbo is used. If Performance Mode is activated within the Control Center, the Turbo speeds increase and consequently the results too.
| Cinebench R15 | |
| CPU Single 64Bit | |
| Average of class Gaming (188.8 - 344, n=105, last 2 years) | |
| Gigabyte Aero 15 OLED XB-8DE51B0SP | |
| Schenker Key 15 Comet Lake (Leistungsmodus) | |
| Schenker Key 15 Comet Lake | |
| Average Intel Core i7-10875H (190 - 220, n=37) | |
| Aorus 15G XB | |
| Razer Blade 15 RTX 2080 Super Max-Q | |
| Acer Predator Triton 500 PT515-52-70N3 | |
| MSI GS66 10SGS | |
| CPU Multi 64Bit | |
| Average of class Gaming (1578 - 6271, n=104, last 2 years) | |
| Aorus 15G XB | |
| Gigabyte Aero 15 OLED XB-8DE51B0SP | |
| Schenker Key 15 Comet Lake (Leistungsmodus) | |
| Average Intel Core i7-10875H (1003 - 1833, n=38) | |
| Schenker Key 15 Comet Lake | |
| Acer Predator Triton 500 PT515-52-70N3 | |
| MSI GS66 10SGS | |
| Razer Blade 15 RTX 2080 Super Max-Q | |
| Blender - v2.79 BMW27 CPU | |
| Razer Blade 15 RTX 2080 Super Max-Q | |
| MSI GS66 10SGS | |
| Acer Predator Triton 500 PT515-52-70N3 | |
| Schenker Key 15 Comet Lake | |
| Average Intel Core i7-10875H (259 - 535, n=30) | |
| Schenker Key 15 Comet Lake (Leistungsmodus) | |
| Gigabyte Aero 15 OLED XB-8DE51B0SP | |
| Aorus 15G XB | |
| Average of class Gaming (80 - 330, n=103, last 2 years) | |
| Cinebench R20 | |
| CPU (Single Core) | |
| Average of class Gaming (442 - 904, n=105, last 2 years) | |
| Gigabyte Aero 15 OLED XB-8DE51B0SP | |
| Schenker Key 15 Comet Lake (Leistungsmodus) | |
| Schenker Key 15 Comet Lake | |
| Average Intel Core i7-10875H (430 - 524, n=32) | |
| Aorus 15G XB | |
| Razer Blade 15 RTX 2080 Super Max-Q | |
| Acer Predator Triton 500 PT515-52-70N3 | |
| MSI GS66 10SGS | |
| CPU (Multi Core) | |
| Average of class Gaming (4029 - 16108, n=105, last 2 years) | |
| Schenker Key 15 Comet Lake (Leistungsmodus) | |
| Gigabyte Aero 15 OLED XB-8DE51B0SP | |
| Aorus 15G XB | |
| Average Intel Core i7-10875H (1986 - 4176, n=32) | |
| Schenker Key 15 Comet Lake | |
| Acer Predator Triton 500 PT515-52-70N3 | |
| MSI GS66 10SGS | |
| Razer Blade 15 RTX 2080 Super Max-Q | |
| Geekbench 5.5 | |
| Single-Core | |
| Average of class Gaming (986 - 2474, n=104, last 2 years) | |
| Schenker Key 15 Comet Lake (Leistungsmodus) | |
| Gigabyte Aero 15 OLED XB-8DE51B0SP | |
| Schenker Key 15 Comet Lake | |
| Average Intel Core i7-10875H (1233 - 1371, n=29) | |
| Razer Blade 15 RTX 2080 Super Max-Q | |
| Aorus 15G XB | |
| Acer Predator Triton 500 PT515-52-70N3 | |
| MSI GS66 10SGS | |
| Multi-Core | |
| Average of class Gaming (6460 - 27010, n=104, last 2 years) | |
| Schenker Key 15 Comet Lake (Leistungsmodus) | |
| Aorus 15G XB | |
| Gigabyte Aero 15 OLED XB-8DE51B0SP | |
| Average Intel Core i7-10875H (5715 - 8620, n=29) | |
| Schenker Key 15 Comet Lake | |
| Razer Blade 15 RTX 2080 Super Max-Q | |
| MSI GS66 10SGS | |
| Acer Predator Triton 500 PT515-52-70N3 | |
| HWBOT x265 Benchmark v2.2 - 4k Preset | |
| Average of class Gaming (11.5 - 44.3, n=104, last 2 years) | |
| Gigabyte Aero 15 OLED XB-8DE51B0SP | |
| Aorus 15G XB | |
| Schenker Key 15 Comet Lake (Leistungsmodus) | |
| Average Intel Core i7-10875H (7.27 - 14.1, n=27) | |
| Schenker Key 15 Comet Lake | |
| Razer Blade 15 RTX 2080 Super Max-Q | |
| Acer Predator Triton 500 PT515-52-70N3 | |
| MSI GS66 10SGS | |
| LibreOffice - 20 Documents To PDF | |
| MSI GS66 10SGS | |
| Aorus 15G XB | |
| Gigabyte Aero 15 OLED XB-8DE51B0SP | |
| Acer Predator Triton 500 PT515-52-70N3 | |
| Schenker Key 15 Comet Lake | |
| Average Intel Core i7-10875H (30.2 - 84.3, n=30) | |
| Average of class Gaming (33.2 - 88.8, n=104, last 2 years) | |
| Razer Blade 15 RTX 2080 Super Max-Q | |
| Schenker Key 15 Comet Lake (Leistungsmodus) | |
| R Benchmark 2.5 - Overall mean | |
| MSI GS66 10SGS | |
| Acer Predator Triton 500 PT515-52-70N3 | |
| Aorus 15G XB | |
| Average Intel Core i7-10875H (0.546 - 0.662, n=29) | |
| Razer Blade 15 RTX 2080 Super Max-Q | |
| Schenker Key 15 Comet Lake | |
| Schenker Key 15 Comet Lake (Leistungsmodus) | |
| Gigabyte Aero 15 OLED XB-8DE51B0SP | |
| Average of class Gaming (0.3439 - 0.759, n=105, last 2 years) | |
* ... smaller is better
System performance
The system works well and smoothly, and we didn't encounter any problems. The built-in hardware offers enough computing power for all common application areas. This is especially confirmed by the good PCMark results.
| PCMark 8 Home Score Accelerated v2 | 4375 points | |
| PCMark 8 Creative Score Accelerated v2 | 5721 points | |
| PCMark 8 Work Score Accelerated v2 | 5682 points | |
| PCMark 10 Score | 5909 points | |
Help | ||
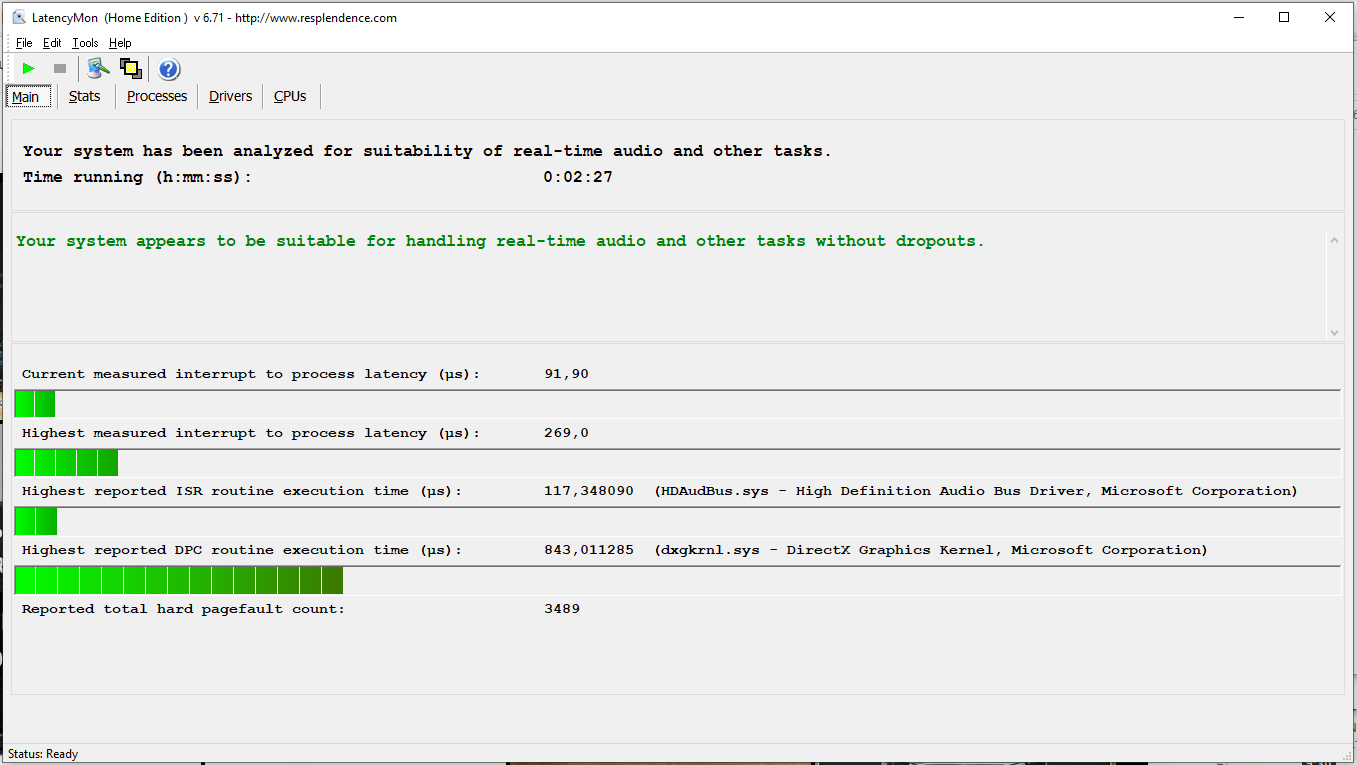
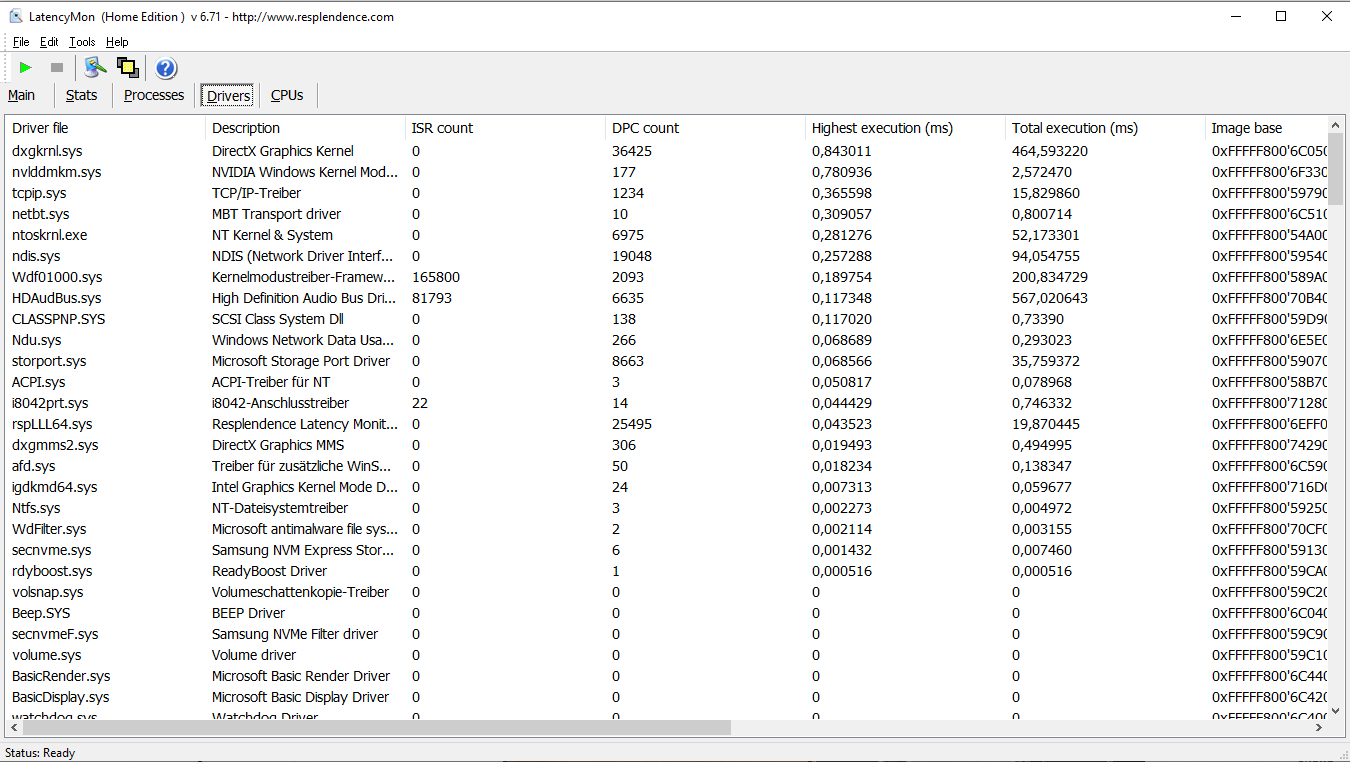
DPC latencies
In our standardized latency monitor test (web surfing, 4K video playback, high-load Prime95), we didn't observe any issues with the DPC latencies. The system seems to be suitable for real-time video and audio-editing.
| DPC Latencies / LatencyMon - interrupt to process latency (max), Web, Youtube, Prime95 | |
| Acer Predator Triton 500 PT515-52-70N3 | |
| Aorus 15G XB | |
| Gigabyte Aero 15 OLED XB-8DE51B0SP | |
| MSI GS66 10SGS | |
| Razer Blade 15 RTX 2080 Super Max-Q | |
| Schenker Key 15 Comet Lake | |
* ... smaller is better
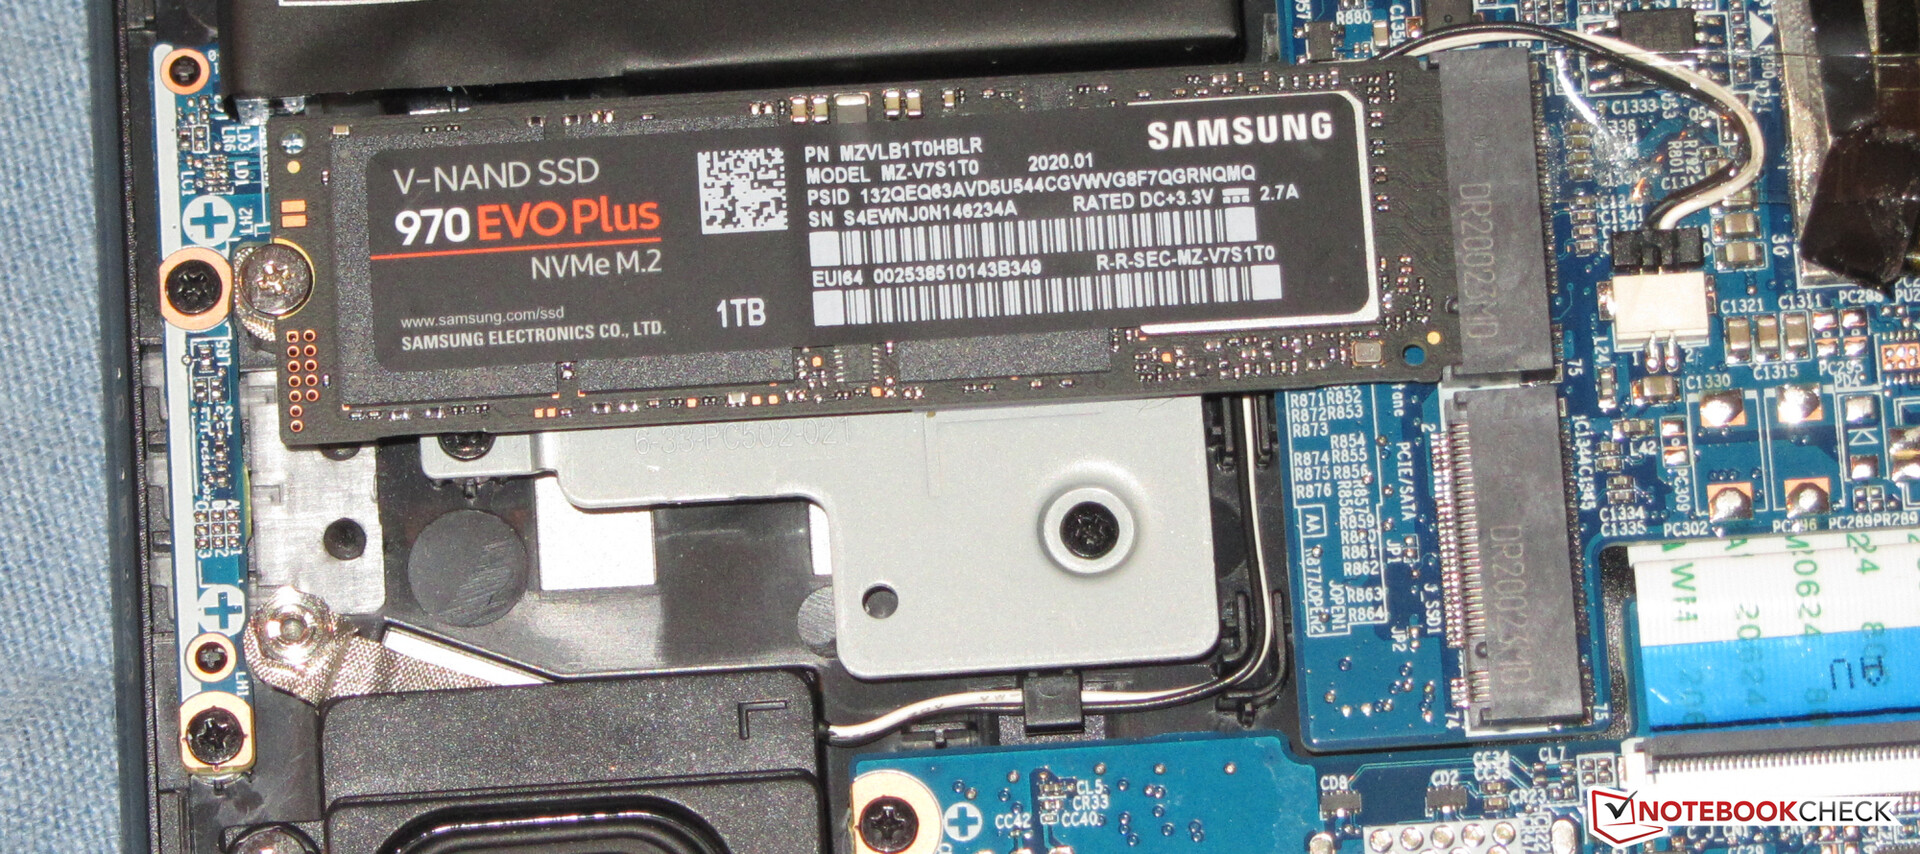
Storage
The system drive is an NVMe SSD (M.2 2280) from Samsung that provides 1 TB of storage space. The transfer rates of the SSD are excellent. The laptop has a second M.2 2280 slot that can be occupied by an NVMe or SATA SSD. If both slots are equipped with NVMe SSDs, these could form a RAID 0 or RAID 1 array if required.

| Schenker Key 15 Comet Lake Samsung SSD 970 EVO Plus 1TB | MSI GS66 10SGS Samsung SSD PM981 MZVLB512HAJQ | Aorus 15G XB Samsung SSD PM981a MZVLB512HBJQ | Razer Blade 15 RTX 2080 Super Max-Q Samsung PM981a MZVLB1T0HBLR | Gigabyte Aero 15 OLED XB-8DE51B0SP Intel Optane Memory H10 with Solid State Storage 32GB + 512GB HBRPEKNX0202A(L/H) | Acer Predator Triton 500 PT515-52-70N3 Samsung SSD PM981a MZVLB512HBJQ | |
|---|---|---|---|---|---|---|
| CrystalDiskMark 5.2 / 6 | -25% | -19% | -16% | -15% | -15% | |
| Write 4K (MB/s) | 193 | 132.5 -31% | 121.6 -37% | 135.7 -30% | 127.4 -34% | 131.7 -32% |
| Read 4K (MB/s) | 54.3 | 45.03 -17% | 44.37 -18% | 46.98 -13% | 147.5 172% | 47.34 -13% |
| Write Seq (MB/s) | 2988 | 1987 -34% | 2617 -12% | 2180 -27% | 485.9 -84% | 2884 -3% |
| Read Seq (MB/s) | 2633 | 1434 -46% | 1297 -51% | 1949 -26% | 1352 -49% | 2303 -13% |
| Write 4K Q32T1 (MB/s) | 540 | 467.5 -13% | 499 -8% | 510 -6% | 476.5 -12% | 423.9 -22% |
| Read 4K Q32T1 (MB/s) | 620 | 536 -14% | 557 -10% | 569 -8% | 531 -14% | 487.7 -21% |
| Write Seq Q32T1 (MB/s) | 3284 | 2003 -39% | 2978 -9% | 2984 -9% | 1061 -68% | 2822 -14% |
| Read Seq Q32T1 (MB/s) | 3564 | 3306 -7% | 3360 -6% | 3238 -9% | 2552 -28% | 3478 -2% |
| AS SSD | -43% | -27% | -26% | -48% | -17% | |
| Seq Read (MB/s) | 2928 | 1086 -63% | 1795 -39% | 1950 -33% | 1200 -59% | 2767 -5% |
| Seq Write (MB/s) | 2733 | 1901 -30% | 2724 0% | 2322 -15% | 836 -69% | 2613 -4% |
| 4K Read (MB/s) | 51.6 | 51 -1% | 49.67 -4% | 45.48 -12% | 65.8 28% | 47.55 -8% |
| 4K Write (MB/s) | 129.8 | 117.3 -10% | 109.3 -16% | 95.4 -27% | 103.8 -20% | 98.9 -24% |
| 4K-64 Read (MB/s) | 1838 | 1503 -18% | 1284 -30% | 1484 -19% | 789 -57% | 1205 -34% |
| 4K-64 Write (MB/s) | 2291 | 1721 -25% | 1962 -14% | 1887 -18% | 929 -59% | 2007 -12% |
| Access Time Read * (ms) | 0.062 | 0.059 5% | 0.063 -2% | 0.051 18% | 0.103 -66% | 0.065 -5% |
| Access Time Write * (ms) | 0.029 | 0.1 -245% | 0.034 -17% | 0.038 -31% | 0.045 -55% | 0.038 -31% |
| Score Read (Points) | 2183 | 1662 -24% | 1513 -31% | 1725 -21% | 975 -55% | 1529 -30% |
| Score Write (Points) | 2694 | 2029 -25% | 2344 -13% | 2215 -18% | 1117 -59% | 2367 -12% |
| Score Total (Points) | 5984 | 4588 -23% | 4685 -22% | 4843 -19% | 2594 -57% | 4677 -22% |
| Copy ISO MB/s (MB/s) | 2183 | 2155 -1% | 1533 -30% | 1903 -13% | ||
| Copy Program MB/s (MB/s) | 2694 | 715 -73% | 528 -80% | 505 -81% | ||
| Copy Game MB/s (MB/s) | 5984 | 1506 -75% | 1042 -83% | 1113 -81% | ||
| Total Average (Program / Settings) | -34% /
-37% | -23% /
-24% | -21% /
-23% | -32% /
-34% | -16% /
-16% |
* ... smaller is better
Continuous load read: DiskSpd Read Loop, Queue Depth 8
Graphics card
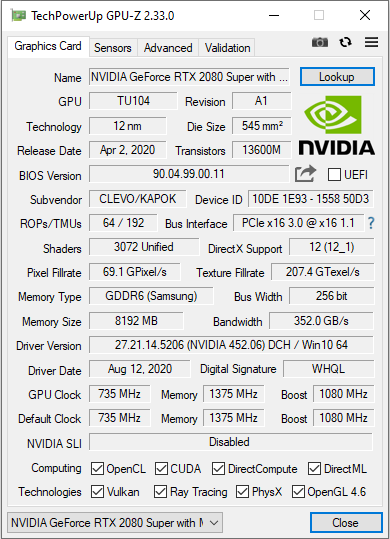
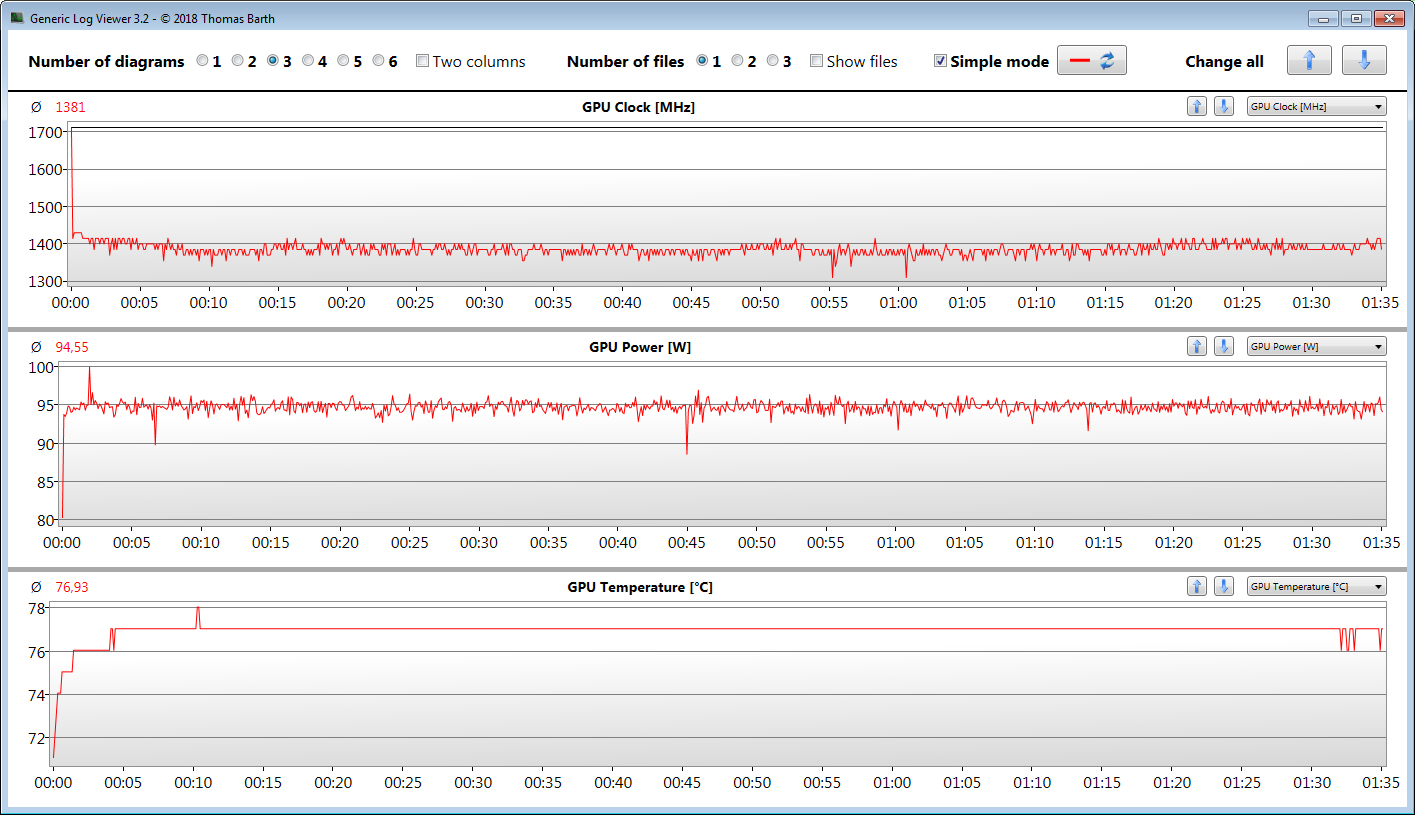
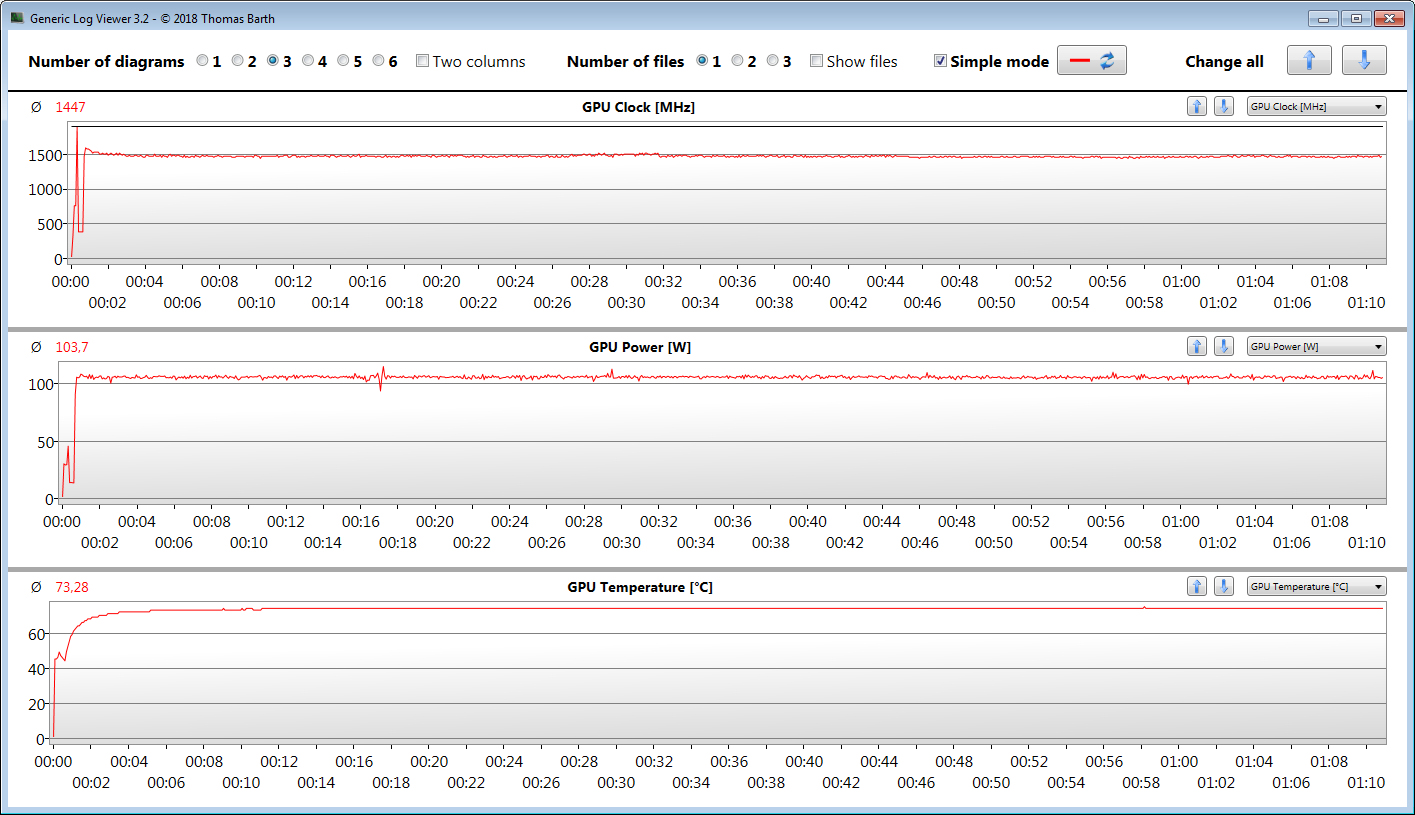
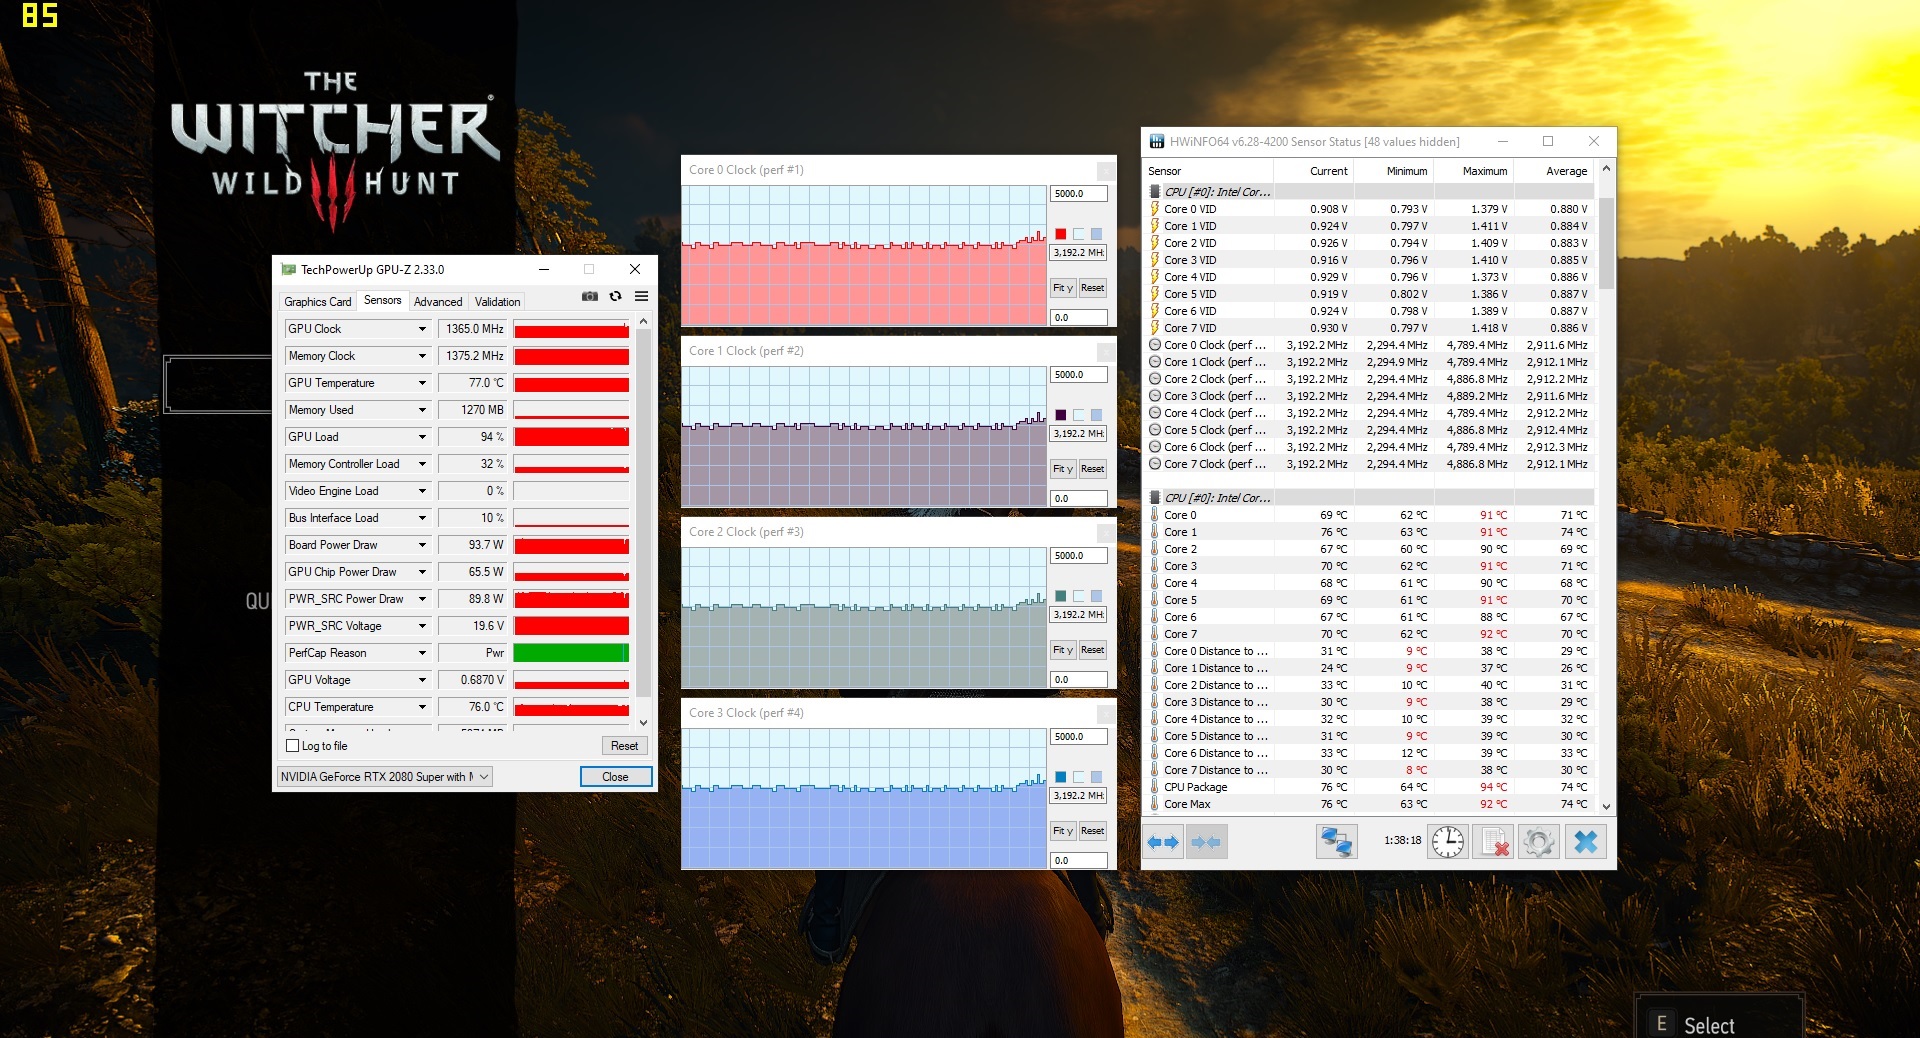
The GeForce 2080 Super Max-Q graphics core (Turing) operates at a base speed of 735 MHz. When boosted, an increase up to 1,080 MHz is possible. Higher speeds are feasible if the GPU doesn't reach a specified temperature and/or energy threshold. The maximum speed measured by us is 1,880 MHz. Moreover, the GPU runs our The Witcher 3 test at average speeds of 1,381 MHz and 1,447 MHz (Performance Mode), respectively. The GPU is supported by fast GDDR6 memory (8,192 MB).
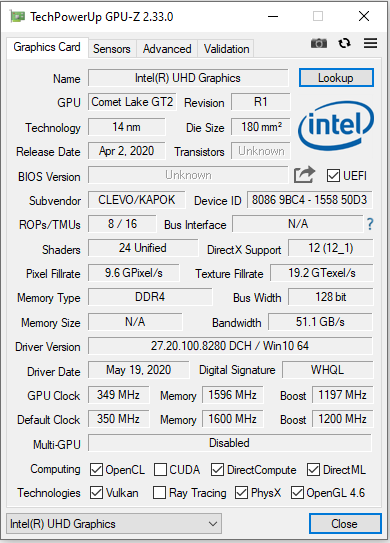
The 3DMark results are at a normal level for the GPU installed here. The UHD Graphics 630 GPU that's integrated into the processor is active, and the laptop works with Nvidia's Optimus graphics-switching solution. Furthermore, activating Performance Mode within the Control Center results in an increase of the graphics performance.
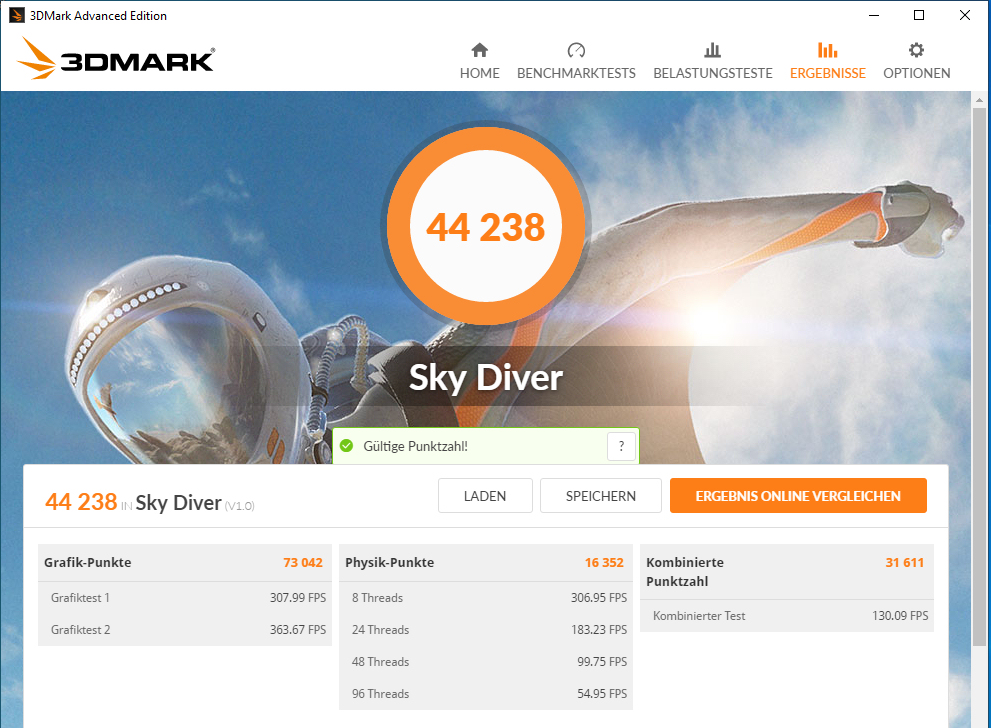
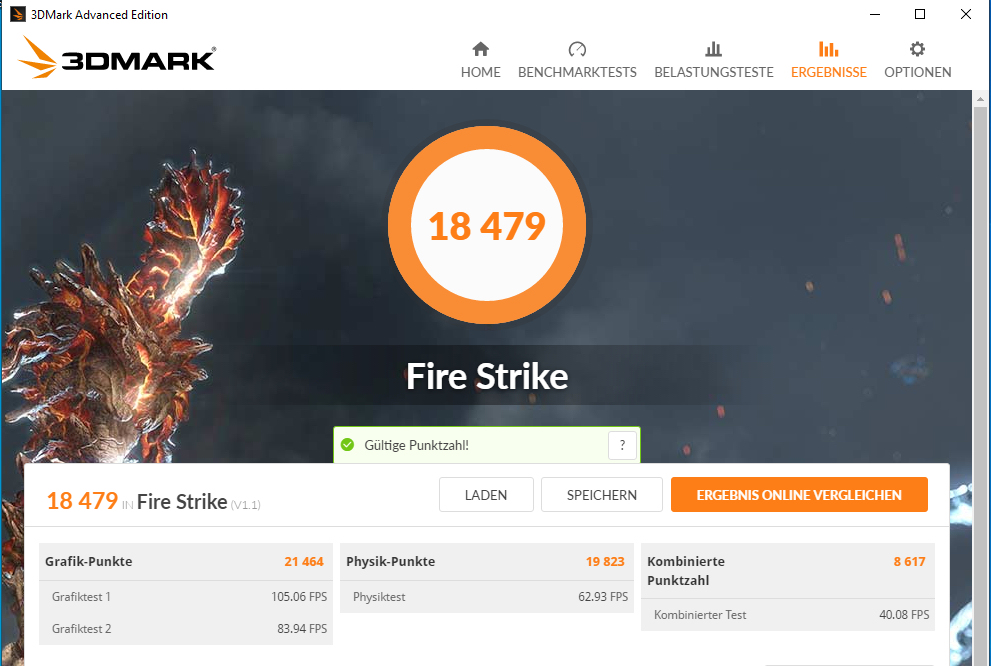
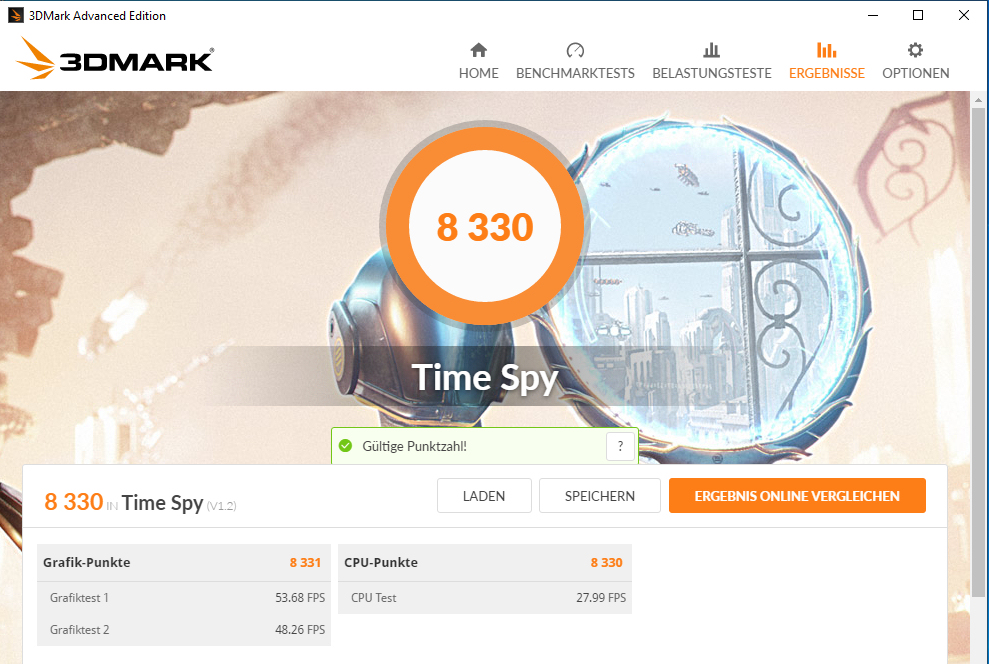
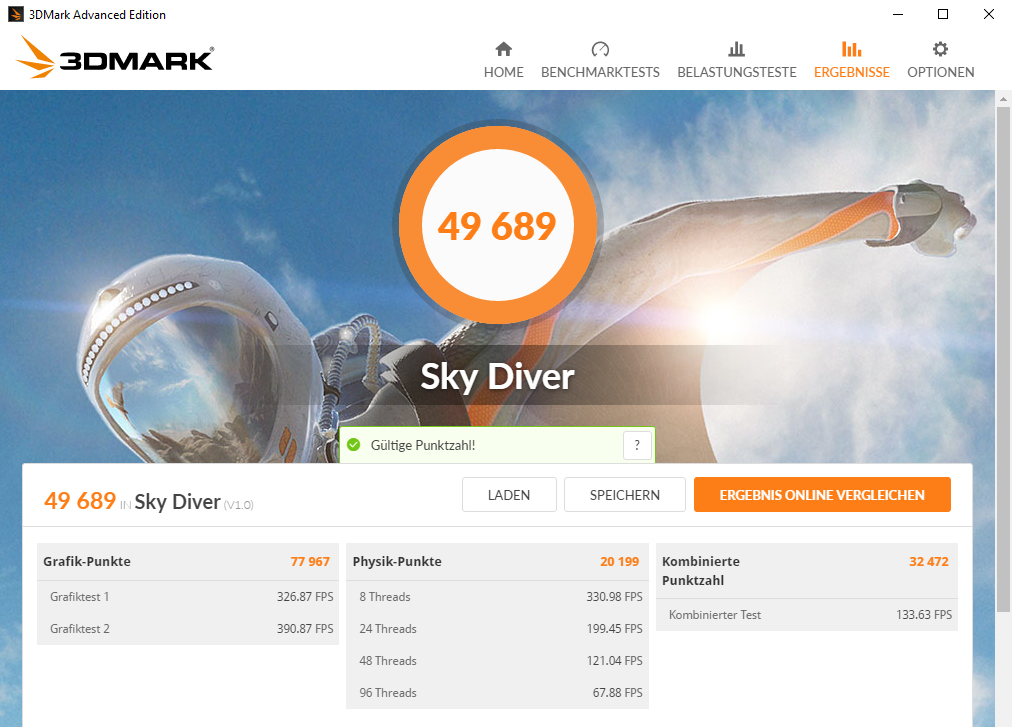
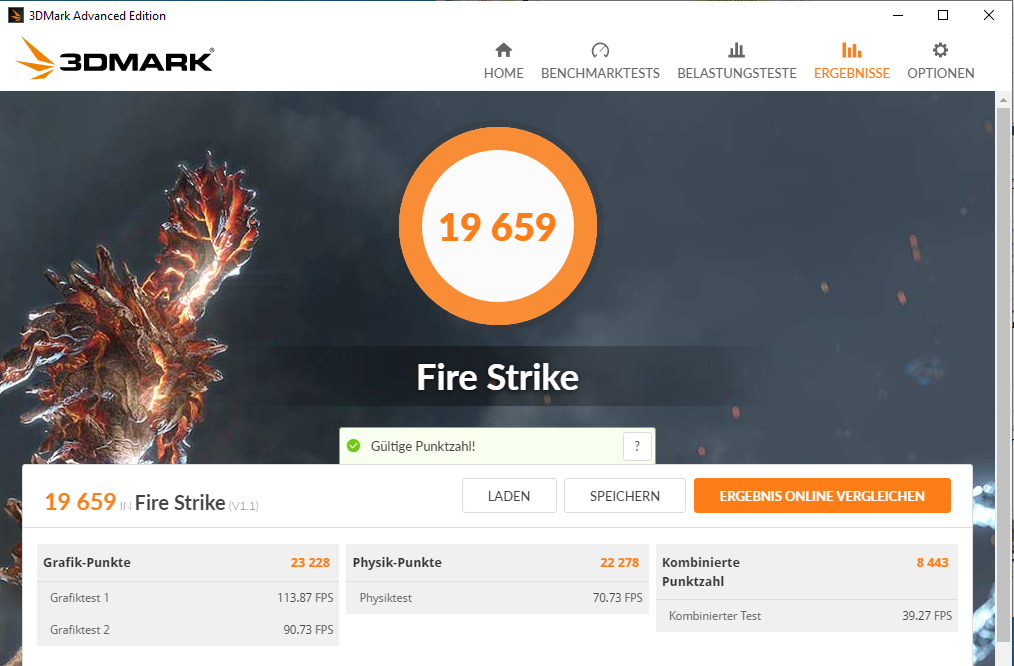
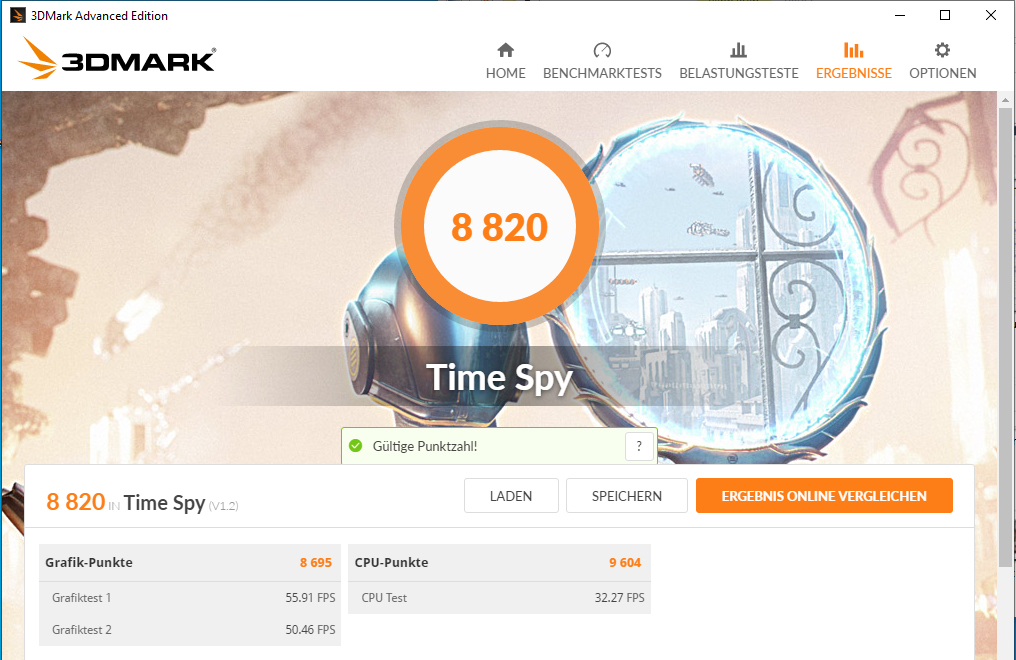

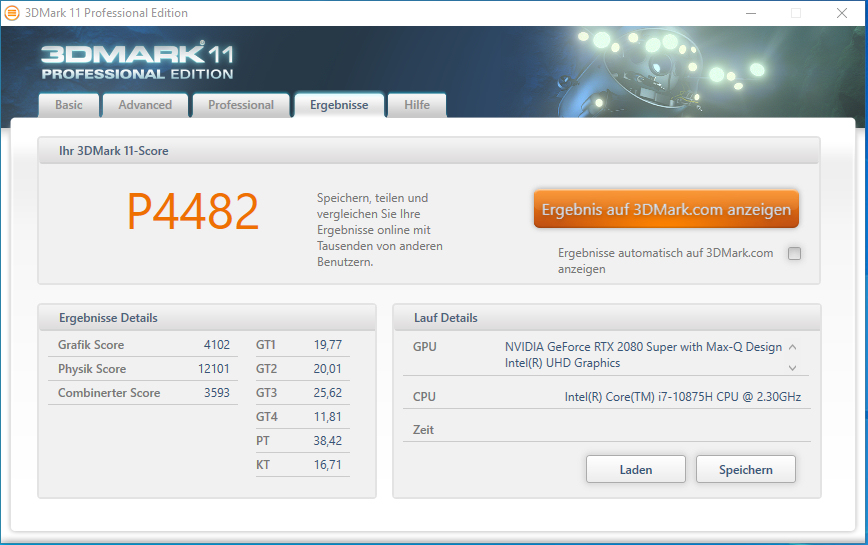

| 3DMark 11 Performance | 24712 points | |
| 3DMark Cloud Gate Standard Score | 44991 points | |
| 3DMark Fire Strike Score | 18479 points | |
| 3DMark Time Spy Score | 8330 points | |
Help | ||
| 3DMark 11 - 1280x720 Performance GPU | |
| Average of class Gaming (21841 - 80022, n=103, last 2 years) | |
| Schenker Key 15 Comet Lake (Leistungsmodus) | |
| Acer Predator Triton 500 PT515-52-70N3 | |
| Average NVIDIA GeForce RTX 2080 Super Max-Q (26292 - 32995, n=10) | |
| Gigabyte Aero 15 OLED XB-8DE51B0SP | |
| Schenker Key 15 Comet Lake | |
| Razer Blade 15 RTX 2080 Super Max-Q | |
| Aorus 15G XB | |
| MSI GS66 10SGS | |
Gaming performance
The Schenker laptop brings all the latest games smoothly onto the screen. Full HD resolution and maximum quality settings can usually be selected here. The GPU also handles resolutions beyond Full HD (an appropriate monitor needs to be connected for this). However, the quality level should then be set somewhat more conservatively - especially at 4K level.
A look at the following table shows that activating Performance Mode results in a frame-rate increase. In most cases, however, the increase is quite small. An outlier at the top is observed with the F1 2020 game.
| The Witcher 3 - 1920x1080 Ultra Graphics & Postprocessing (HBAO+) | |
| Average of class Gaming (104.7 - 240, n=6, last 2 years) | |
| Schenker Key 15 Comet Lake (Leistungsmodus) | |
| Schenker Key 15 Comet Lake | |
| Razer Blade 15 RTX 2080 Super Max-Q | |
| Average NVIDIA GeForce RTX 2080 Super Max-Q (74.3 - 96, n=11) | |
| Acer Predator Triton 500 PT515-52-70N3 | |
| Gigabyte Aero 15 OLED XB-8DE51B0SP | |
| Aorus 15G XB | |
| MSI GS66 10SGS | |
| BioShock Infinite - 1920x1080 Ultra Preset, DX11 (DDOF) | |
| Average NVIDIA GeForce RTX 2080 Super Max-Q (170.2 - 181.1, n=4) | |
| Razer Blade 15 RTX 2080 Super Max-Q | |
| Schenker Key 15 Comet Lake | |
| Aorus 15G XB | |
| F1 2020 - 1920x1080 Ultra High Preset AA:T AF:16x | |
| Schenker Key 15 Comet Lake (Leistungsmodus) | |
| Average NVIDIA GeForce RTX 2080 Super Max-Q (102 - 126, n=5) | |
| Razer Blade 15 RTX 2080 Super Max-Q | |
| Aorus 15G XB | |
| Schenker Key 15 Comet Lake | |
| Horizon Zero Dawn - 1920x1080 Ultimate Quality | |
| Schenker Key 15 Comet Lake (Leistungsmodus) | |
| Average NVIDIA GeForce RTX 2080 Super Max-Q (74 - 76, n=2) | |
| Schenker Key 15 Comet Lake | |
| Doom Eternal - 1920x1080 Ultra Preset | |
| Schenker Key 15 Comet Lake (Leistungsmodus) | |
| Average NVIDIA GeForce RTX 2080 Super Max-Q (140 - 177.7, n=8) | |
| Schenker Key 15 Comet Lake | |
| Acer Predator Triton 500 PT515-52-70N3 | |
| Razer Blade 15 RTX 2080 Super Max-Q | |
| MSI GS66 10SGS | |
| Aorus 15G XB | |
| Star Wars Jedi Fallen Order - 1920x1080 Epic Preset | |
| Schenker Key 15 Comet Lake | |
| Average NVIDIA GeForce RTX 2080 Super Max-Q (88.7 - 97.5, n=4) | |
| Aorus 15G XB | |
| Acer Predator Triton 500 PT515-52-70N3 | |
| Razer Blade 15 RTX 2080 Super Max-Q | |
| Gears Tactics - 1920x1080 Ultra Preset | |
| Schenker Key 15 Comet Lake (Leistungsmodus) | |
| Average NVIDIA GeForce RTX 2080 Super Max-Q (78.4 - 92.7, n=5) | |
| Schenker Key 15 Comet Lake | |
| Razer Blade 15 RTX 2080 Super Max-Q | |
| Aorus 15G XB | |
| Shadow of the Tomb Raider - 1920x1080 Highest Preset AA:T | |
| Average of class Gaming (96 - 116, n=2, last 2 years) | |
| Schenker Key 15 Comet Lake (Leistungsmodus) | |
| Gigabyte Aero 15 OLED XB-8DE51B0SP | |
| Schenker Key 15 Comet Lake | |
| Acer Predator Triton 500 PT515-52-70N3 | |
| MSI GS66 10SGS | |
| Aorus 15G XB | |
| Average NVIDIA GeForce RTX 2080 Super Max-Q (89 - 106, n=10) | |
| Razer Blade 15 RTX 2080 Super Max-Q | |
In order to verify whether the frame rates remain largely constant even over a prolonged period of time, we let the game The Witcher 3 run for about 60 minutes at Full HD resolution and maximum quality settings. The character embodied by the player is not moved during this whole period. A drop in frame rates wasn't found.
| low | med. | high | ultra | |
|---|---|---|---|---|
| BioShock Infinite (2013) | 426.3 | 364.5 | 323.7 | 170.2 |
| The Witcher 3 (2015) | 348.2 | 251.3 | 159.8 | 90.2 |
| Shadow of the Tomb Raider (2018) | 139 | 116 | 110 | 99 |
| Total War: Three Kingdoms (2019) | 273.1 | 142.4 | 95.4 | 69 |
| Star Wars Jedi Fallen Order (2019) | 113.7 | 103.7 | 97.5 | |
| Red Dead Redemption 2 (2019) | 138.4 | 101.5 | 69 | 45 |
| Doom Eternal (2020) | 249 | 176.6 | 156.7 | 155.1 |
| Gears Tactics (2020) | 267.4 | 184.5 | 126.2 | 84.3 |
| F1 2020 (2020) | 268 | 184 | 161 | 102 |
| Death Stranding (2020) | 166.1 | 123.5 | 114.5 | 112.8 |
| Horizon Zero Dawn (2020) | 148 | 109 | 90 | 74 |
Emissions - The Schenker Key produces a lot of noise under load
Noise emissions
In idle usage, the two fans mainly run at low rotation speeds. However, they turn up strongly from time to time - we measure sound pressure levels of up to 44 dB(A). Under load, the fans produce even more noise. During the stress test and our The Witcher 3 test, the values are 53 dB(A) and 51 dB(A), respectively. Without a headset, gaming is no fun here.
For an overall lower noise level, it's necessary to switch to Silent Mode within the Control Center. However, this is at the expense of performance.
Noise level
| Idle |
| 26 / 27 / 44 dB(A) |
| Load |
| 53 / 53 dB(A) |
 | ||
30 dB silent 40 dB(A) audible 50 dB(A) loud |
||
min: | ||
| Schenker Key 15 Comet Lake i7-10875H, GeForce RTX 2080 Super Max-Q | MSI GS66 10SGS i7-10750H, GeForce RTX 2080 Super Max-Q | Aorus 15G XB i7-10875H, GeForce RTX 2070 Super Max-Q | Razer Blade 15 RTX 2080 Super Max-Q i7-10875H, GeForce RTX 2080 Super Max-Q | Gigabyte Aero 15 OLED XB-8DE51B0SP i7-10875H, GeForce RTX 2070 Super Max-Q | Acer Predator Triton 500 PT515-52-70N3 i7-10750H, GeForce RTX 2080 Super Max-Q | |
|---|---|---|---|---|---|---|
| Noise | 1% | -4% | 2% | -9% | -3% | |
| off / environment * (dB) | 25 | 28.5 -14% | 25 -0% | 30.1 -20% | 30 -20% | 30 -20% |
| Idle Minimum * (dB) | 26 | 30 -15% | 32 -23% | 30.1 -16% | 34 -31% | 30 -15% |
| Idle Average * (dB) | 27 | 30 -11% | 34 -26% | 30.1 -11% | 36 -33% | 33 -22% |
| Idle Maximum * (dB) | 44 | 30.9 30% | 38 14% | 30.1 32% | 41 7% | 36 18% |
| Load Average * (dB) | 53 | 39.5 25% | 48 9% | 46.8 12% | 48 9% | 50 6% |
| Witcher 3 ultra * (dB) | 51 | 48 6% | 50 2% | 48.4 5% | 48 6% | 48 6% |
| Load Maximum * (dB) | 53 | 59.4 -12% | 54 -2% | 46 13% | 54 -2% | 50 6% |
* ... smaller is better
Temperature
Our stress test (Prime95 and FurMark run for at least an hour) is run by the processor and graphics core at 2.3 to 2.4 GHz and 1,260 MHz, respectively. On battery power, the clock rates are 1.3 to 1.7 GHz (CPU) and 300 MHz (GPU), respectively. The stress test represents an extreme scenario that doesn't occur in everyday life. With this test we check if the system remains stable even under full load.
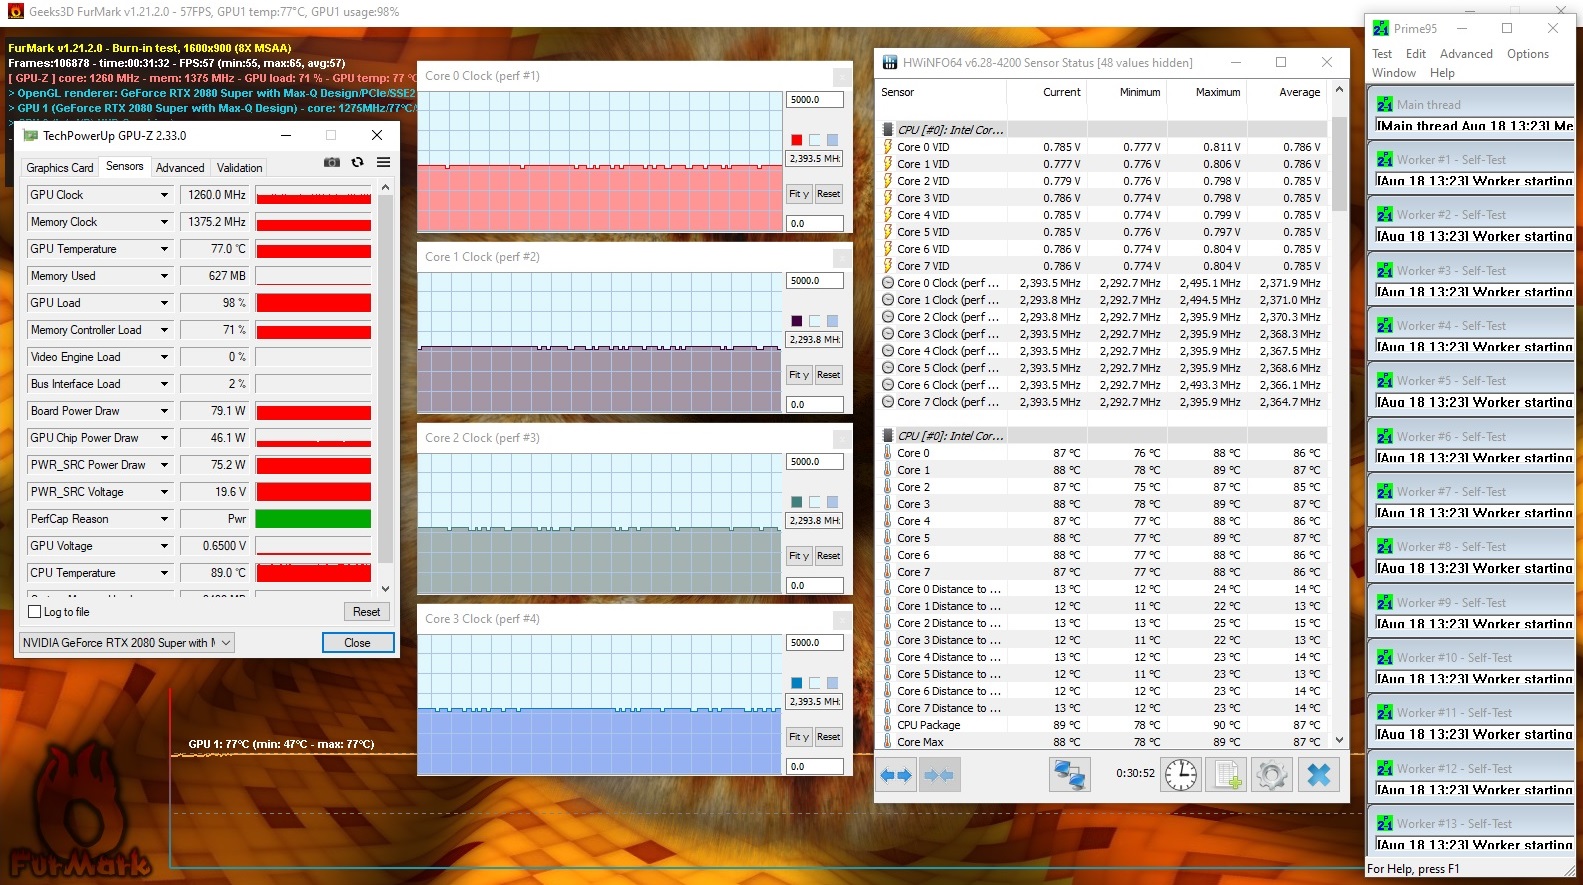
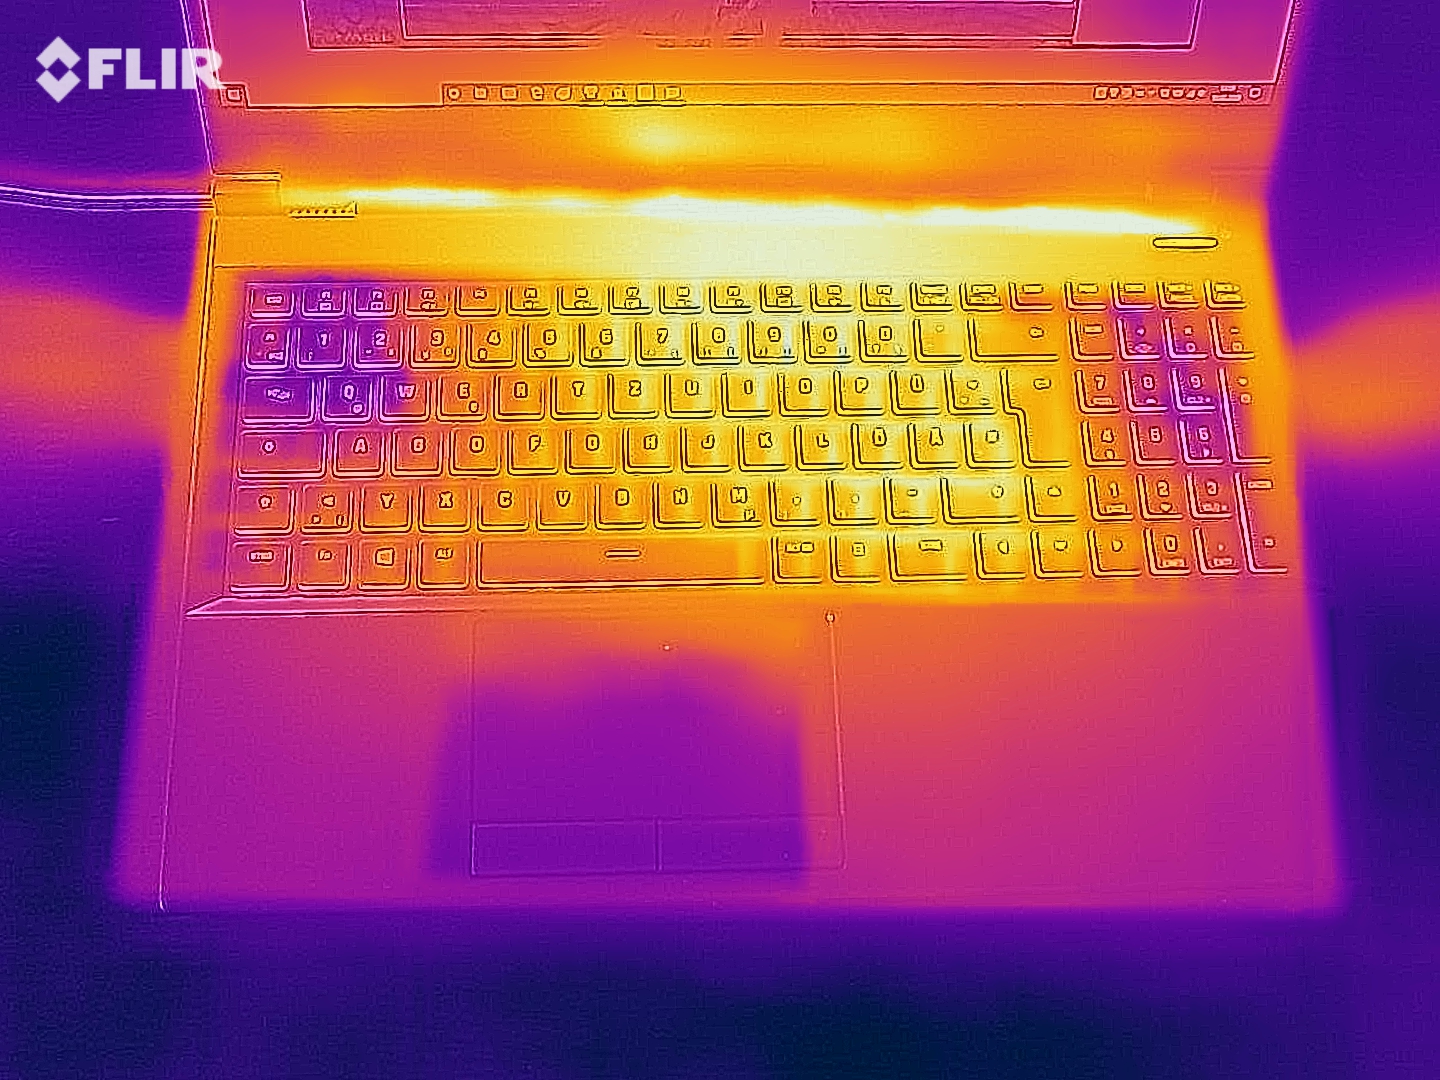
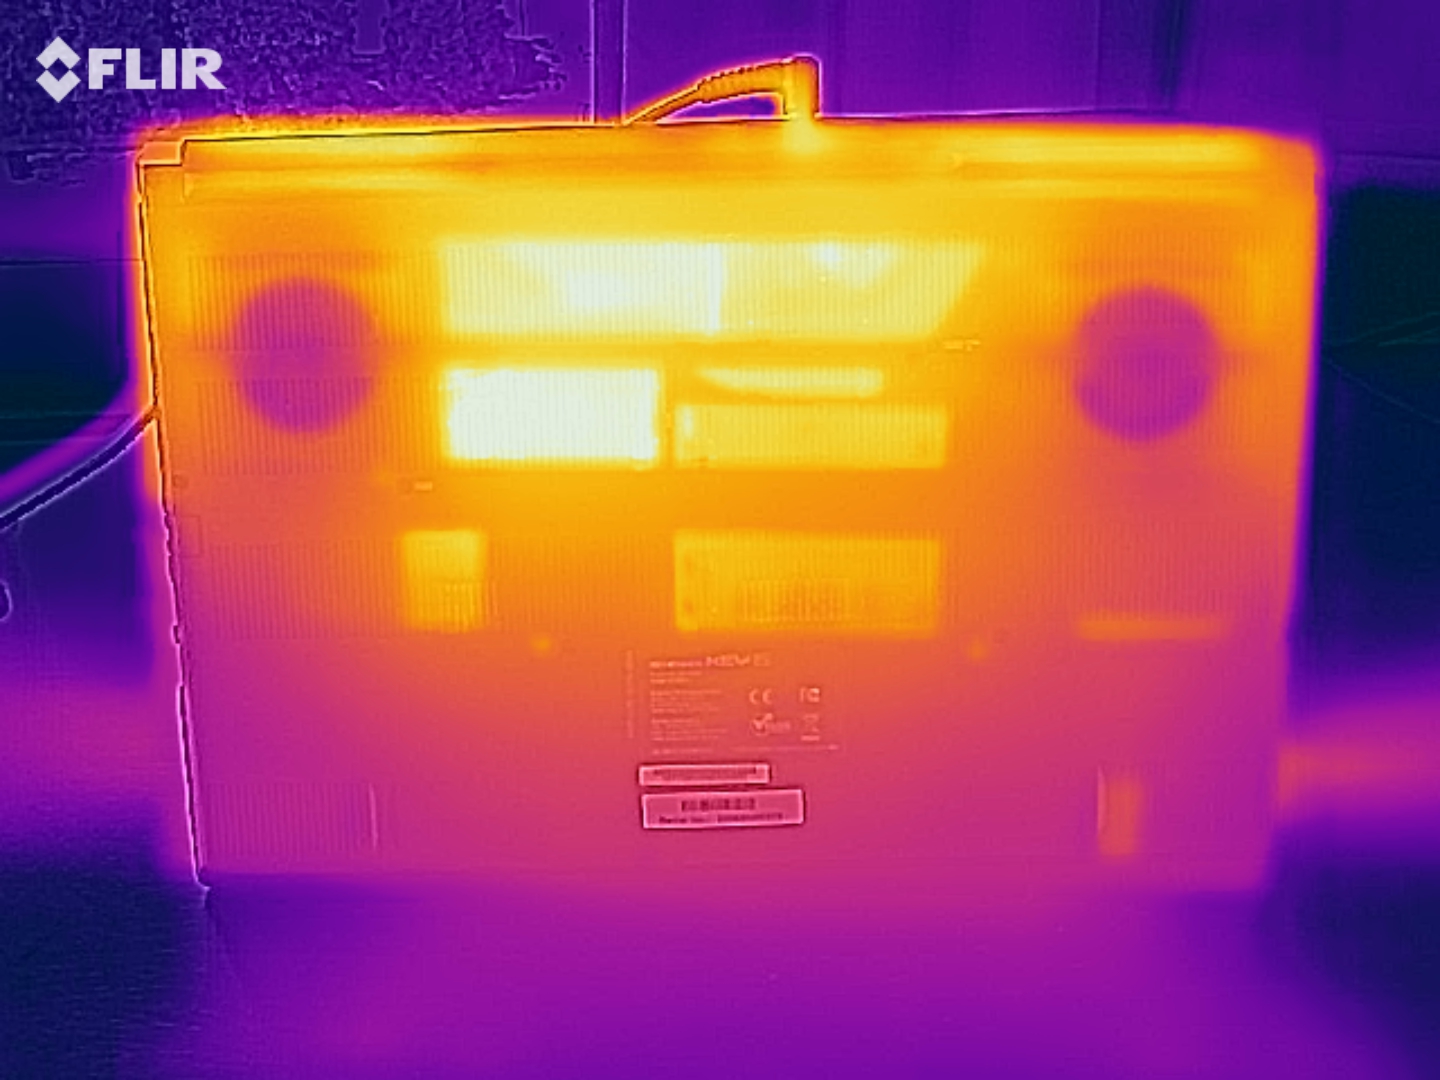
The laptop warms up noticeably. During the stress test, we register temperatures just above 60 °C (~140 °F) at two measuring points. Moreover, heat development is even more pronounced when performing our The Witcher 3 test. Consequently, the device shouldn't be placed on the lap. In everyday use, however, the temperatures are in the green range.
(-) The maximum temperature on the upper side is 52 °C / 126 F, compared to the average of 40.4 °C / 105 F, ranging from 21.2 to 68.8 °C for the class Gaming.
(-) The bottom heats up to a maximum of 62 °C / 144 F, compared to the average of 43.2 °C / 110 F
(+) In idle usage, the average temperature for the upper side is 30.1 °C / 86 F, compared to the device average of 33.9 °C / 93 F.
(-) Playing The Witcher 3, the average temperature for the upper side is 44.4 °C / 112 F, compared to the device average of 33.9 °C / 93 F.
(±) The palmrests and touchpad can get very hot to the touch with a maximum of 37 °C / 98.6 F.
(-) The average temperature of the palmrest area of similar devices was 28.8 °C / 83.8 F (-8.2 °C / -14.8 F).
| Schenker Key 15 Comet Lake i7-10875H, GeForce RTX 2080 Super Max-Q | MSI GS66 10SGS i7-10750H, GeForce RTX 2080 Super Max-Q | Aorus 15G XB i7-10875H, GeForce RTX 2070 Super Max-Q | Razer Blade 15 RTX 2080 Super Max-Q i7-10875H, GeForce RTX 2080 Super Max-Q | Gigabyte Aero 15 OLED XB-8DE51B0SP i7-10875H, GeForce RTX 2070 Super Max-Q | Acer Predator Triton 500 PT515-52-70N3 i7-10750H, GeForce RTX 2080 Super Max-Q | |
|---|---|---|---|---|---|---|
| Heat | 9% | 10% | 7% | 8% | 12% | |
| Maximum Upper Side * (°C) | 52 | 47.8 8% | 44 15% | 52 -0% | 49 6% | 44 15% |
| Maximum Bottom * (°C) | 62 | 54.4 12% | 63 -2% | 53 15% | 61 2% | 50 19% |
| Idle Upper Side * (°C) | 31 | 27.4 12% | 27 13% | 29.3 5% | 27 13% | 29 6% |
| Idle Bottom * (°C) | 33 | 32 3% | 29 12% | 30.2 8% | 29 12% | 31 6% |
* ... smaller is better
Speakers
The stereo speakers are located in the front area of the bottom of the device. They produce a very decent sound that lacks bass, though. For a better sound experience, headphones or external speakers should be used.
Schenker Key 15 Comet Lake audio analysis
(+) | speakers can play relatively loud (82 dB)
Bass 100 - 315 Hz
(-) | nearly no bass - on average 15.7% lower than median
(+) | bass is linear (2.9% delta to prev. frequency)
Mids 400 - 2000 Hz
(+) | balanced mids - only 3.2% away from median
(+) | mids are linear (6% delta to prev. frequency)
Highs 2 - 16 kHz
(+) | balanced highs - only 2.3% away from median
(+) | highs are linear (5.7% delta to prev. frequency)
Overall 100 - 16.000 Hz
(+) | overall sound is linear (11.8% difference to median)
Compared to same class
» 11% of all tested devices in this class were better, 4% similar, 85% worse
» The best had a delta of 6%, average was 18%, worst was 132%
Compared to all devices tested
» 8% of all tested devices were better, 3% similar, 89% worse
» The best had a delta of 4%, average was 23%, worst was 134%
Energy management - Acceptable battery life
Energy consumption
In idle usage, we register a maximum power consumption of 18 watts. During our stress test, the value rises up to 210 watts. We didn't encounter any instabilities here. In addition, the 180-watt power adapter seems to have enough capacity (the efficiency factor is missing in our measurements). In gaming mode (our The Witcher 3 test), the power demand is lower at an average of 142 watts.
| Off / Standby | |
| Idle | |
| Load |
|
Key:
min: | |
| Schenker Key 15 Comet Lake i7-10875H, GeForce RTX 2080 Super Max-Q | MSI GS66 10SGS i7-10750H, GeForce RTX 2080 Super Max-Q | Aorus 15G XB i7-10875H, GeForce RTX 2070 Super Max-Q | Razer Blade 15 RTX 2080 Super Max-Q i7-10875H, GeForce RTX 2080 Super Max-Q | Gigabyte Aero 15 OLED XB-8DE51B0SP i7-10875H, GeForce RTX 2070 Super Max-Q | Acer Predator Triton 500 PT515-52-70N3 i7-10750H, GeForce RTX 2080 Super Max-Q | |
|---|---|---|---|---|---|---|
| Power Consumption | -22% | -33% | 1% | -46% | -8% | |
| Idle Minimum * (Watt) | 10 | 14.9 -49% | 16 -60% | 10.6 -6% | 18 -80% | 11 -10% |
| Idle Average * (Watt) | 14 | 17.5 -25% | 20 -43% | 13.1 6% | 21 -50% | 15 -7% |
| Idle Maximum * (Watt) | 18 | 29.5 -64% | 30 -67% | 15.8 12% | 38 -111% | 25 -39% |
| Load Average * (Watt) | 106 | 94.8 11% | 102 4% | 131 -24% | 113 -7% | 95 10% |
| Witcher 3 ultra * (Watt) | 142 | 146.1 -3% | 156 -10% | 146 -3% | 149 -5% | 140 1% |
| Load Maximum * (Watt) | 210 | 210.9 -0% | 256 -22% | 169 20% | 256 -22% | 211 -0% |
* ... smaller is better
Battery life
The battery life is absolutely fine for a gaming laptop, but it won't knock anyone's socks off. Our WLAN test (accessing websites using a script) and video test (short film Big Buck Bunny [H.264 encoding, Full HD] running in a loop) are completed by the 15.6-incher after 4:49 hours and 5:44 hours, respectively.
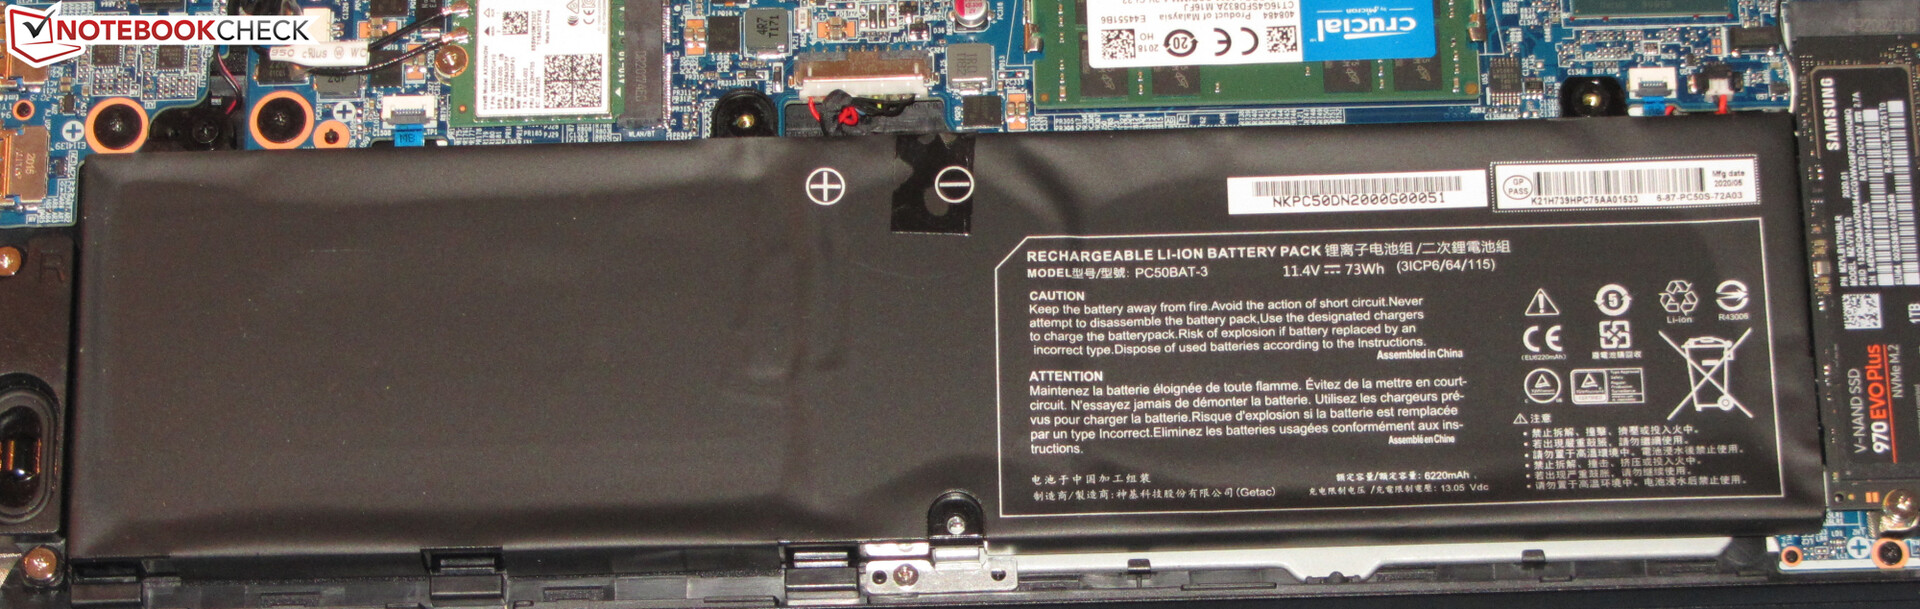
| Schenker Key 15 Comet Lake i7-10875H, GeForce RTX 2080 Super Max-Q, 73 Wh | MSI GS66 10SGS i7-10750H, GeForce RTX 2080 Super Max-Q, 99.99 Wh | Aorus 15G XB i7-10875H, GeForce RTX 2070 Super Max-Q, 94 Wh | Razer Blade 15 RTX 2080 Super Max-Q i7-10875H, GeForce RTX 2080 Super Max-Q, 80 Wh | Gigabyte Aero 15 OLED XB-8DE51B0SP i7-10875H, GeForce RTX 2070 Super Max-Q, 94.2 Wh | Acer Predator Triton 500 PT515-52-70N3 i7-10750H, GeForce RTX 2080 Super Max-Q, 84 Wh | |
|---|---|---|---|---|---|---|
| Battery runtime | 38% | 53% | 31% | 55% | 17% | |
| Reader / Idle (h) | 7 | 10.2 46% | 9.7 39% | 8.7 24% | 8.6 23% | 8.3 19% |
| H.264 (h) | 5.7 | 7.7 35% | 7.3 28% | |||
| WiFi v1.3 (h) | 4.8 | 6.9 44% | 7 46% | 6.1 27% | 6.1 27% | 6.3 31% |
| Load (h) | 1.3 | 1.6 23% | 2.5 92% | 1.9 46% | 2.8 115% | 1.3 0% |
Pros
Cons
Verdict
The Schenker Key 15 falls into the category of slim and compact gaming laptops. But don't be deceived by its looks. With the Core i7-10875H octa-core processor and the GeForce RTX 2080 Super Max-Q graphics core, the device is equipped with modern, powerful components that bring all the latest computer games smoothly onto the matte Full HD screen. Maximum quality settings can always be selected here.
With the Key 15, Schenker offers a light, powerful but also loud gaming laptop that can be customized very individually to your own needs.
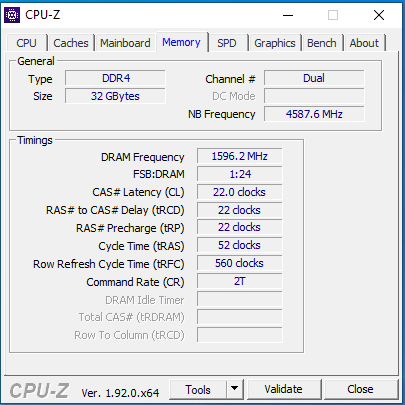
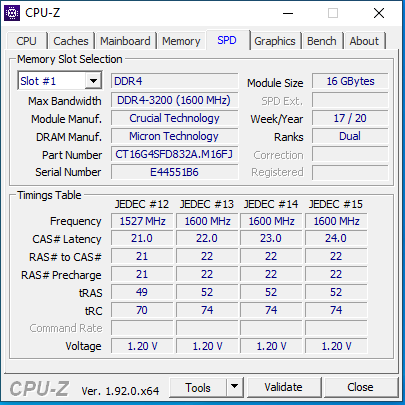
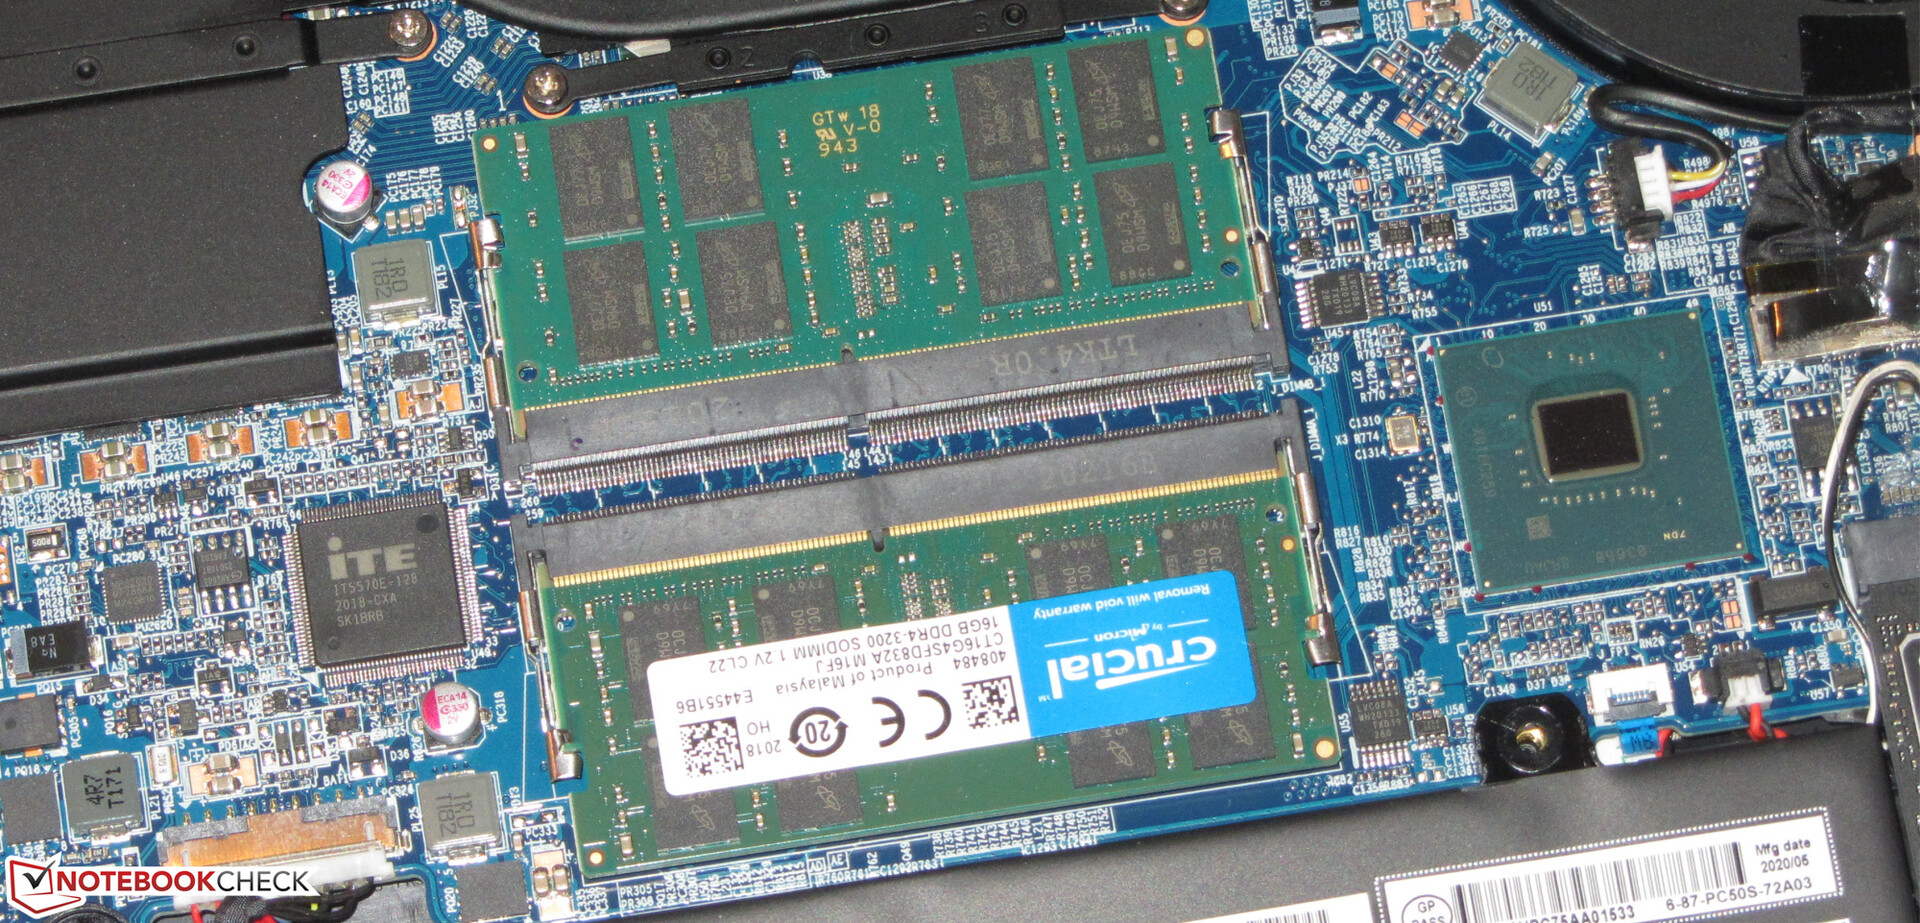
The hardware is equipped with 16 GB of RAM (dual-channel mode), and an upgrade to up to 64 GB would be possible. The laptop offers space for two M.2 2280 SSDs (1x NVMe, 1x NVMe/SATA; RAID 0/1). Should the storage space of the built-in 1 TB SSD run out, it could be easily expanded. Maintenance and upgrade procedures require removing the bottom cover of the case - no complex task.
Schenker packs a lot of performance into a compact case. The consequences: The laptop heats up considerably under load, and the fans produce a lot of noise - also sporadically in idle usage, unfortunately. If you're willing to reduce performance, Silent Mode can be used to provide a little more peace and quiet.
The laptop is equipped with a Thunderbolt 3 port that allows the connection of a docking solution or an external GPU. DisplayPort via USB-C is supported, but Power Delivery is not. The latter is not surprising: A comprehensive power supply of the laptop over this connection would not be possible, since a maximum of 100 watts of power can be transferred. However, comparable competitors like the Blade 15 Advanced offer the possibility to charge the battery via the Thunderbolt 3 port. This function is not supported by the Key.
The Full HD display (IPS, 144 Hz) offers stable viewing angles, a matte surface, good contrast, fast response times, decent color reproduction, and acceptable color-space coverage. The maximum brightness is a little too low, though. The built-in keyboard (RGB lighting) has proven to be suitable for everyday use. In addition, the battery life is decent too.
Schenker Key 15 Comet Lake
- 09/07/2020 v7 (old)
Sascha Mölck
Price comparison

