Aorus 15G XB in review: Successful gaming machine with mechanical keyboard
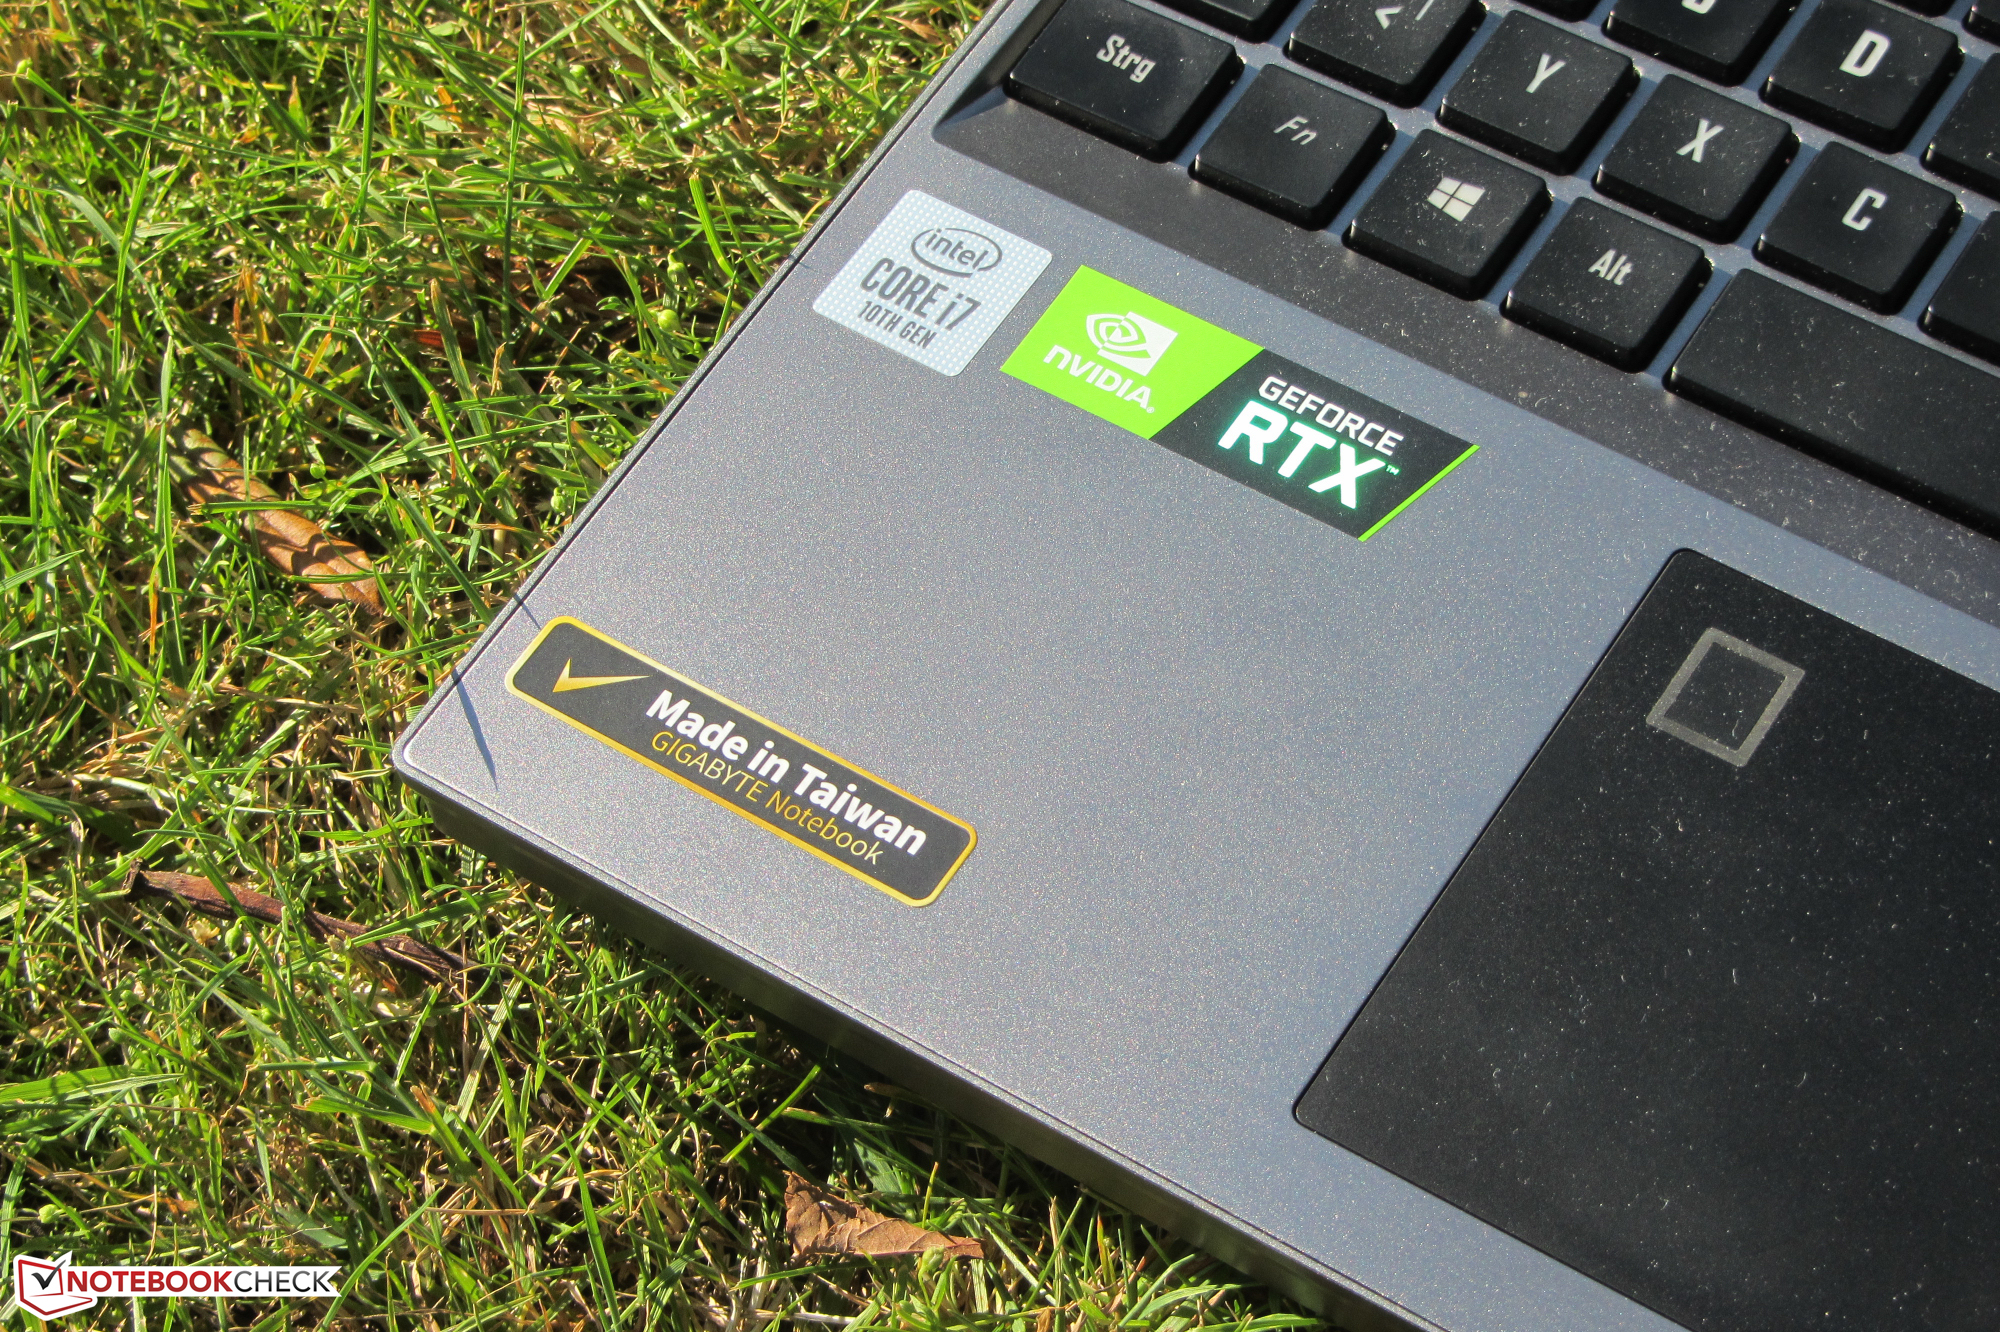
The Aorus 15G XB is a light, compact gaming laptop in the 15.6-inch format that is equipped with a lot of computing power. The test device provided to us is powered by a Core i7-10875H processor and a GeForce RTX 2070 Super Max-Q graphics core. The laptop stands out from the crowd of gaming laptops because it has a mechanical keyboard on board. Competitors include devices like the Asus ROG Strix Scar 15 G532LWS, the Alienware m15 R3, the Acer Predator Triton 500 PT515-52, the Razer Blade 15, and the Schenker XMG Neo 15.
Rating | Date | Model | Weight | Height | Size | Resolution | Price |
|---|---|---|---|---|---|---|---|
| 86.5 % v7 (old) | 08 / 2020 | Aorus 15G XB i7-10875H, GeForce RTX 2070 Super Max-Q | 2.3 kg | 25 mm | 15.60" | 1920x1080 | |
| 84.4 % v7 (old) | 07 / 2020 | Asus ROG Strix Scar 15 G532LWS i9-10980HK, GeForce RTX 2070 Super Mobile | 2.4 kg | 24.9 mm | 15.60" | 1920x1080 | |
| 84.8 % v7 (old) | 07 / 2020 | Alienware m15 R3 P87F i7-10750H, GeForce RTX 2070 Mobile | 2.3 kg | 19.9 mm | 15.60" | 1920x1080 | |
v (old) | 04 / 2020 | Acer Predator Triton 500 PT515-52-70N3 i7-10750H, GeForce RTX 2080 Super Max-Q | 2.1 kg | 18 mm | 15.60" | 1920x1080 | |
| 86 % v7 (old) | 05 / 2020 | Razer Blade 15 RZ09-0328 i7-10750H, GeForce RTX 2070 Max-Q | 2.1 kg | 19.9 mm | 15.60" | 3840x2160 | |
| 82.8 % v7 (old) | 11 / 2019 | Schenker XMG Neo 15 XNE15M19 i7-9750H, GeForce RTX 2070 Max-Q | 2.1 kg | 22 mm | 15.60" | 1920x1080 |
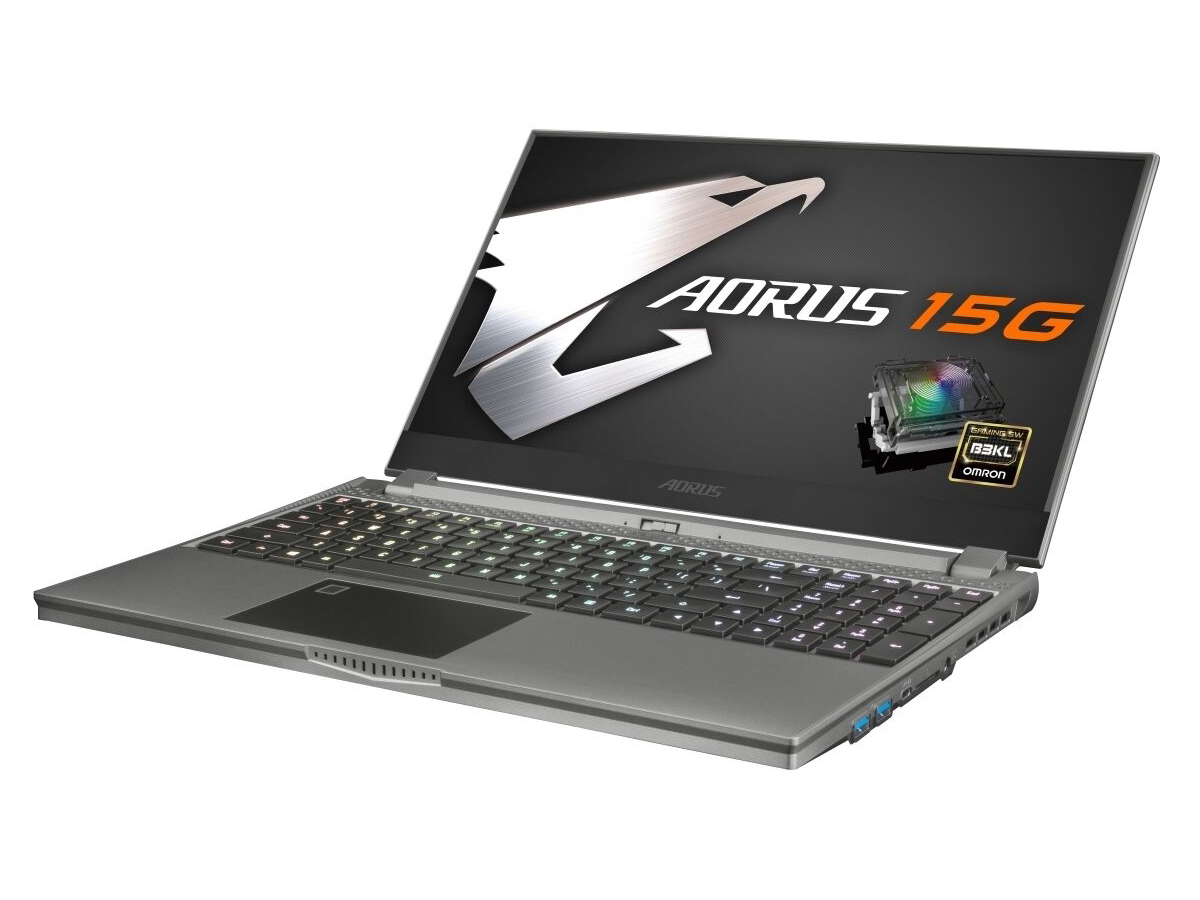
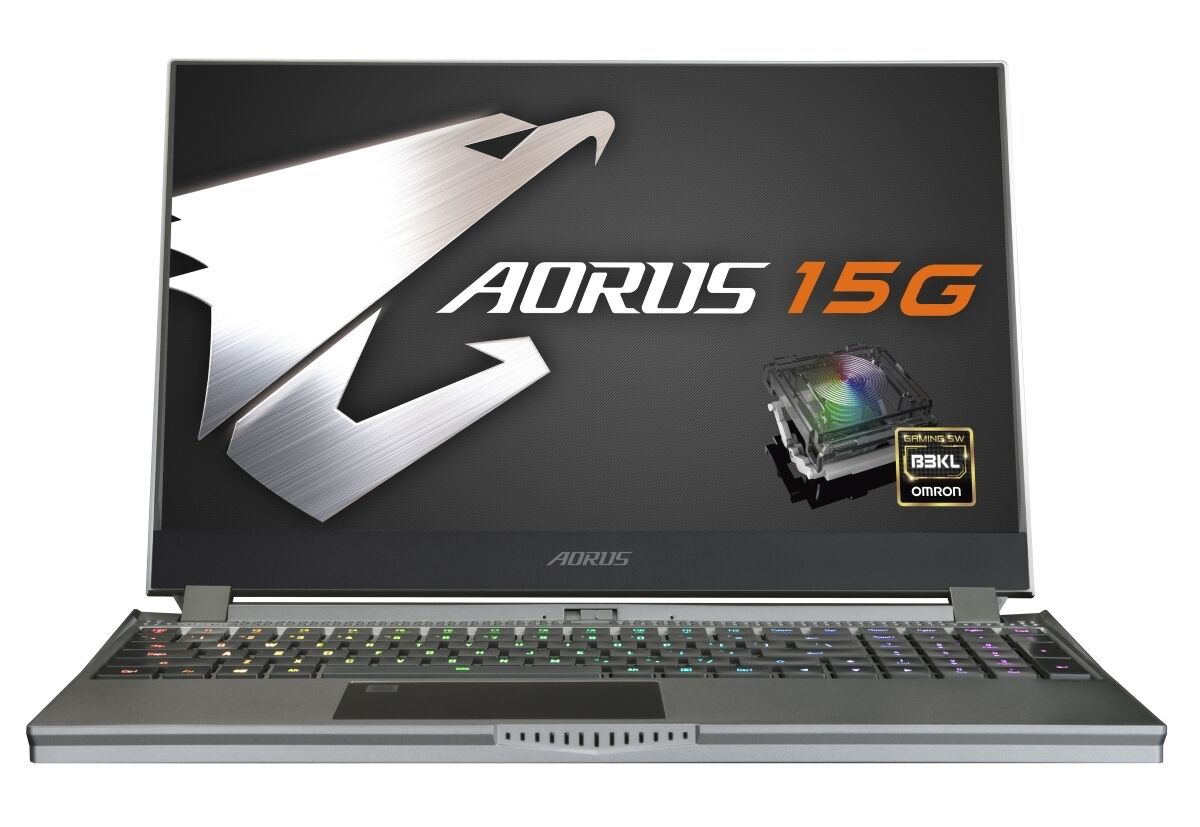
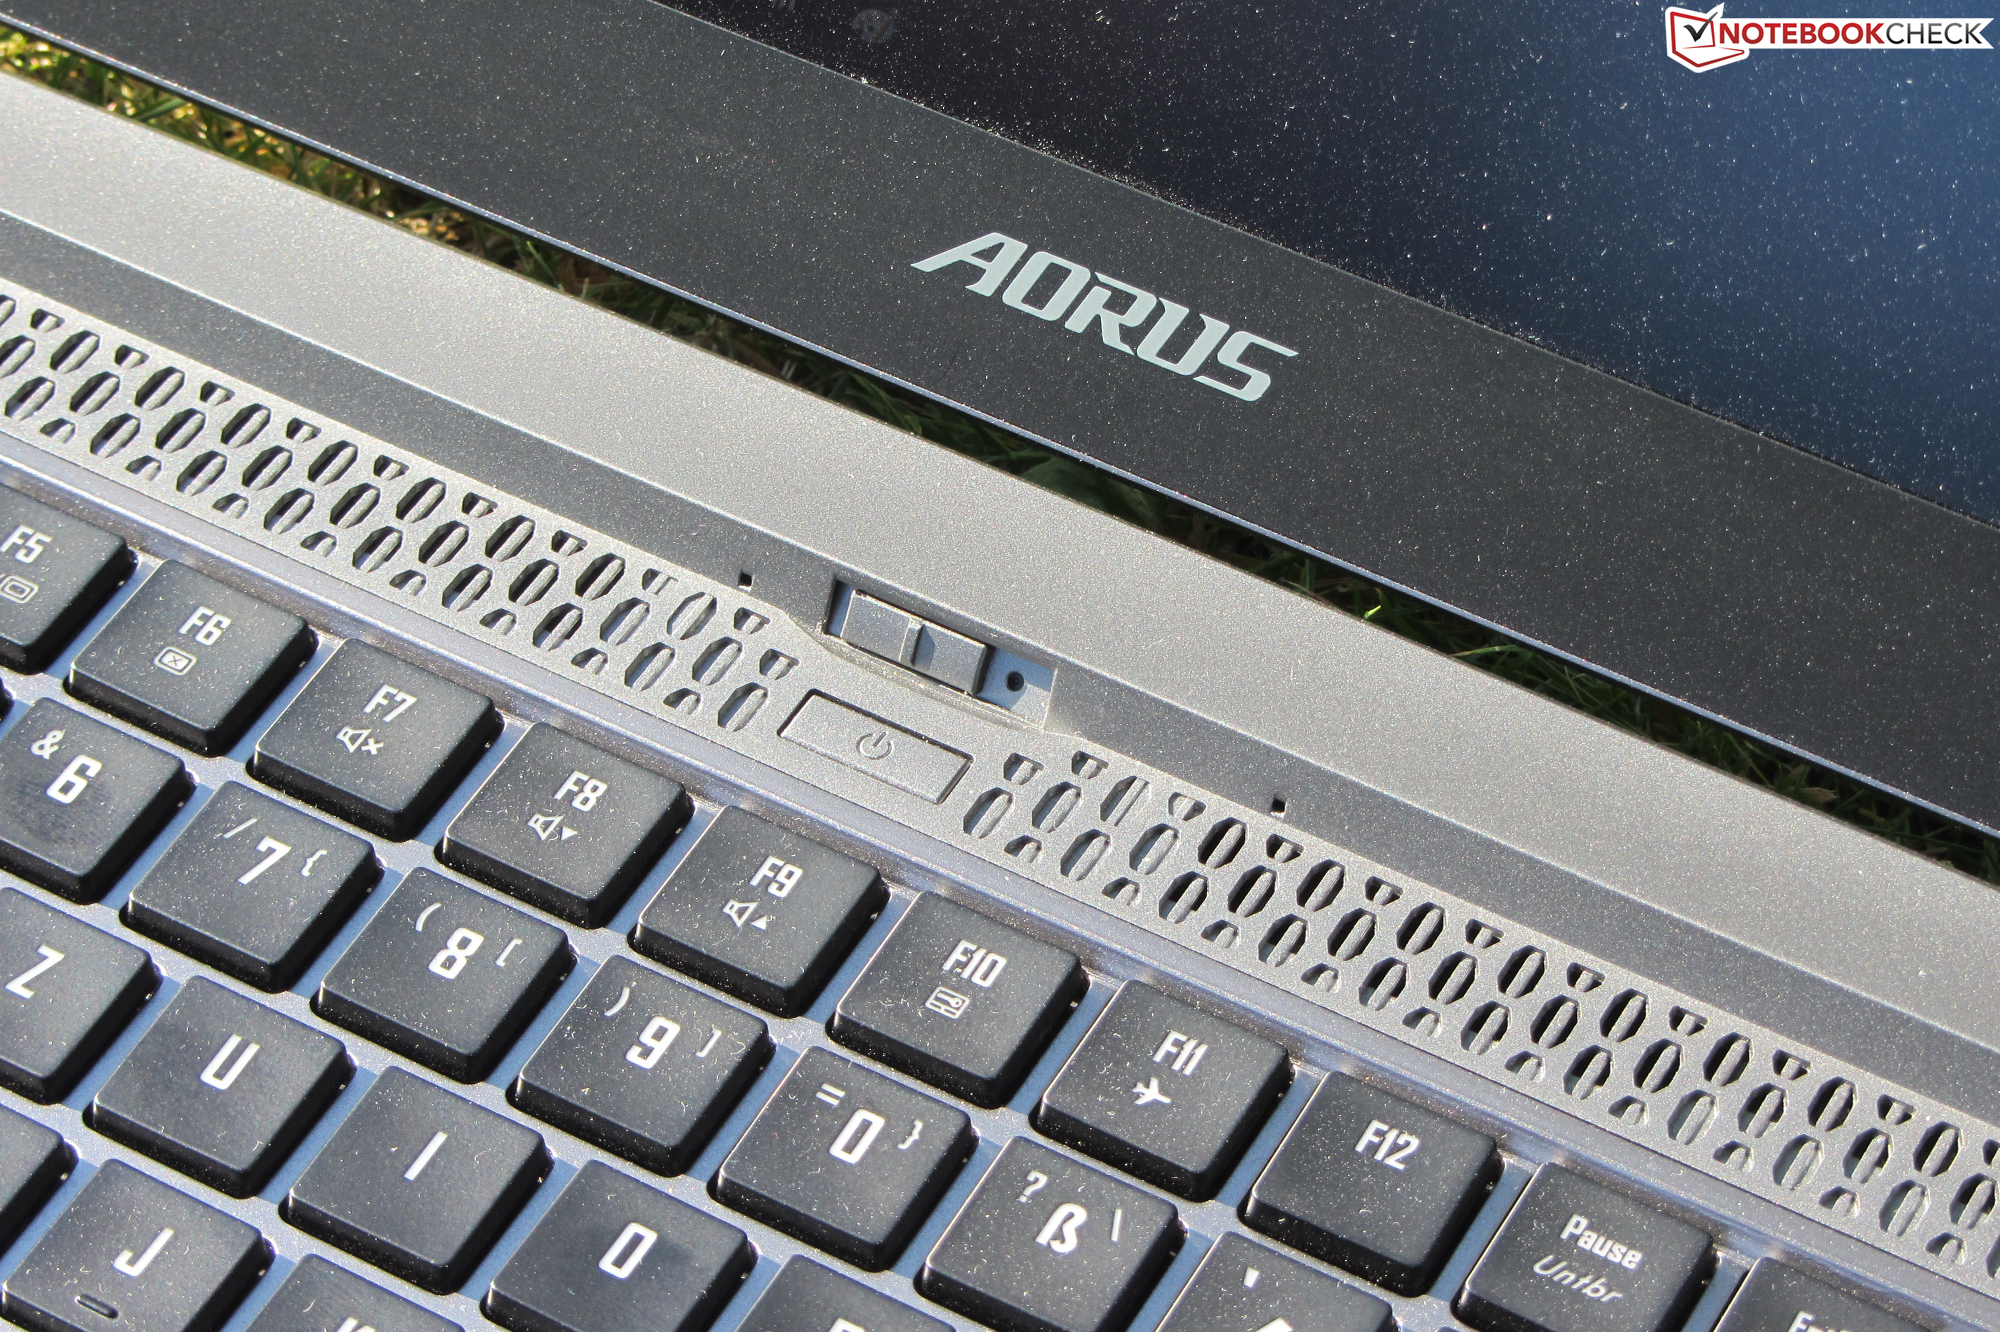
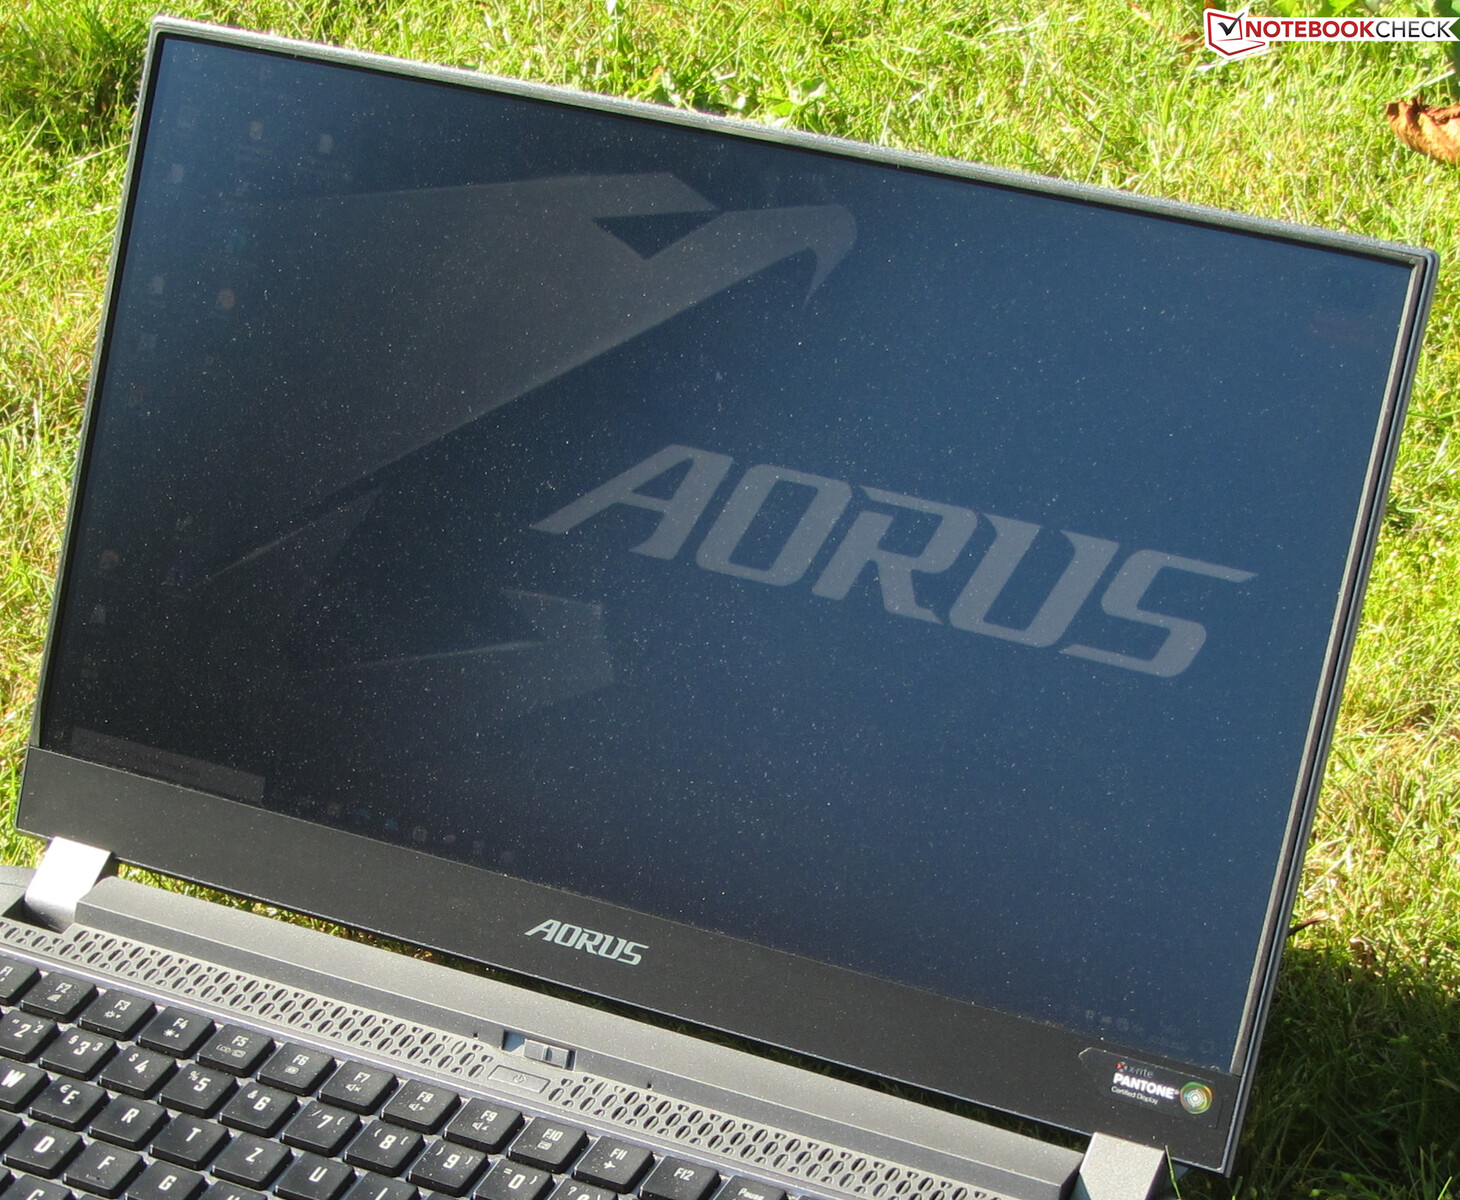
Case - Aorus with a fancy metal case
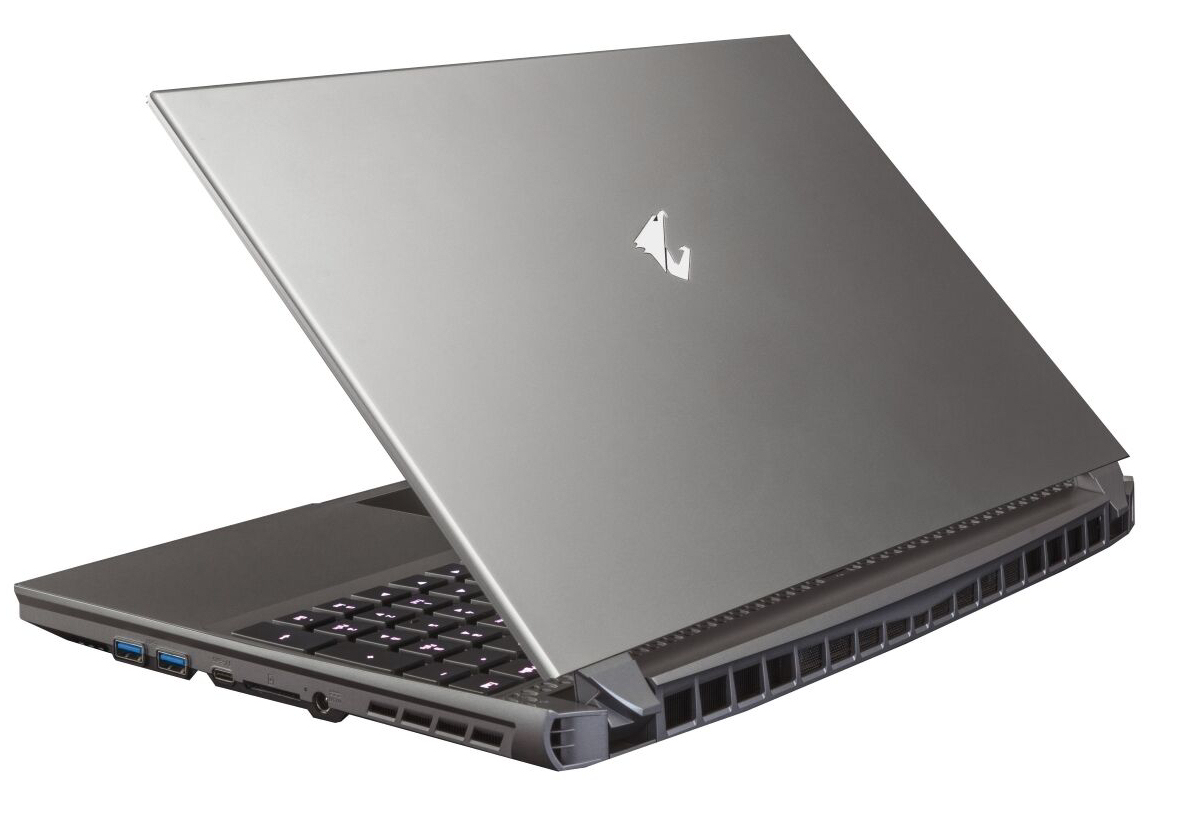
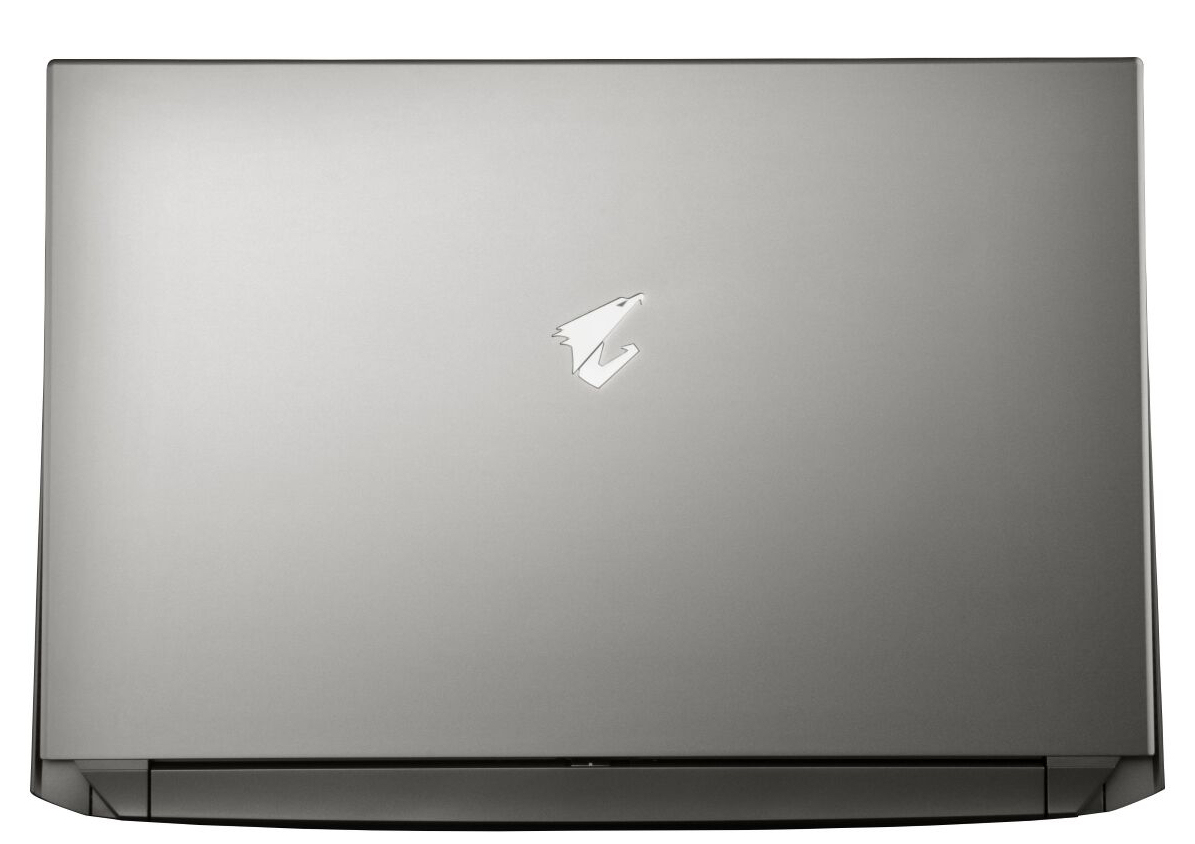
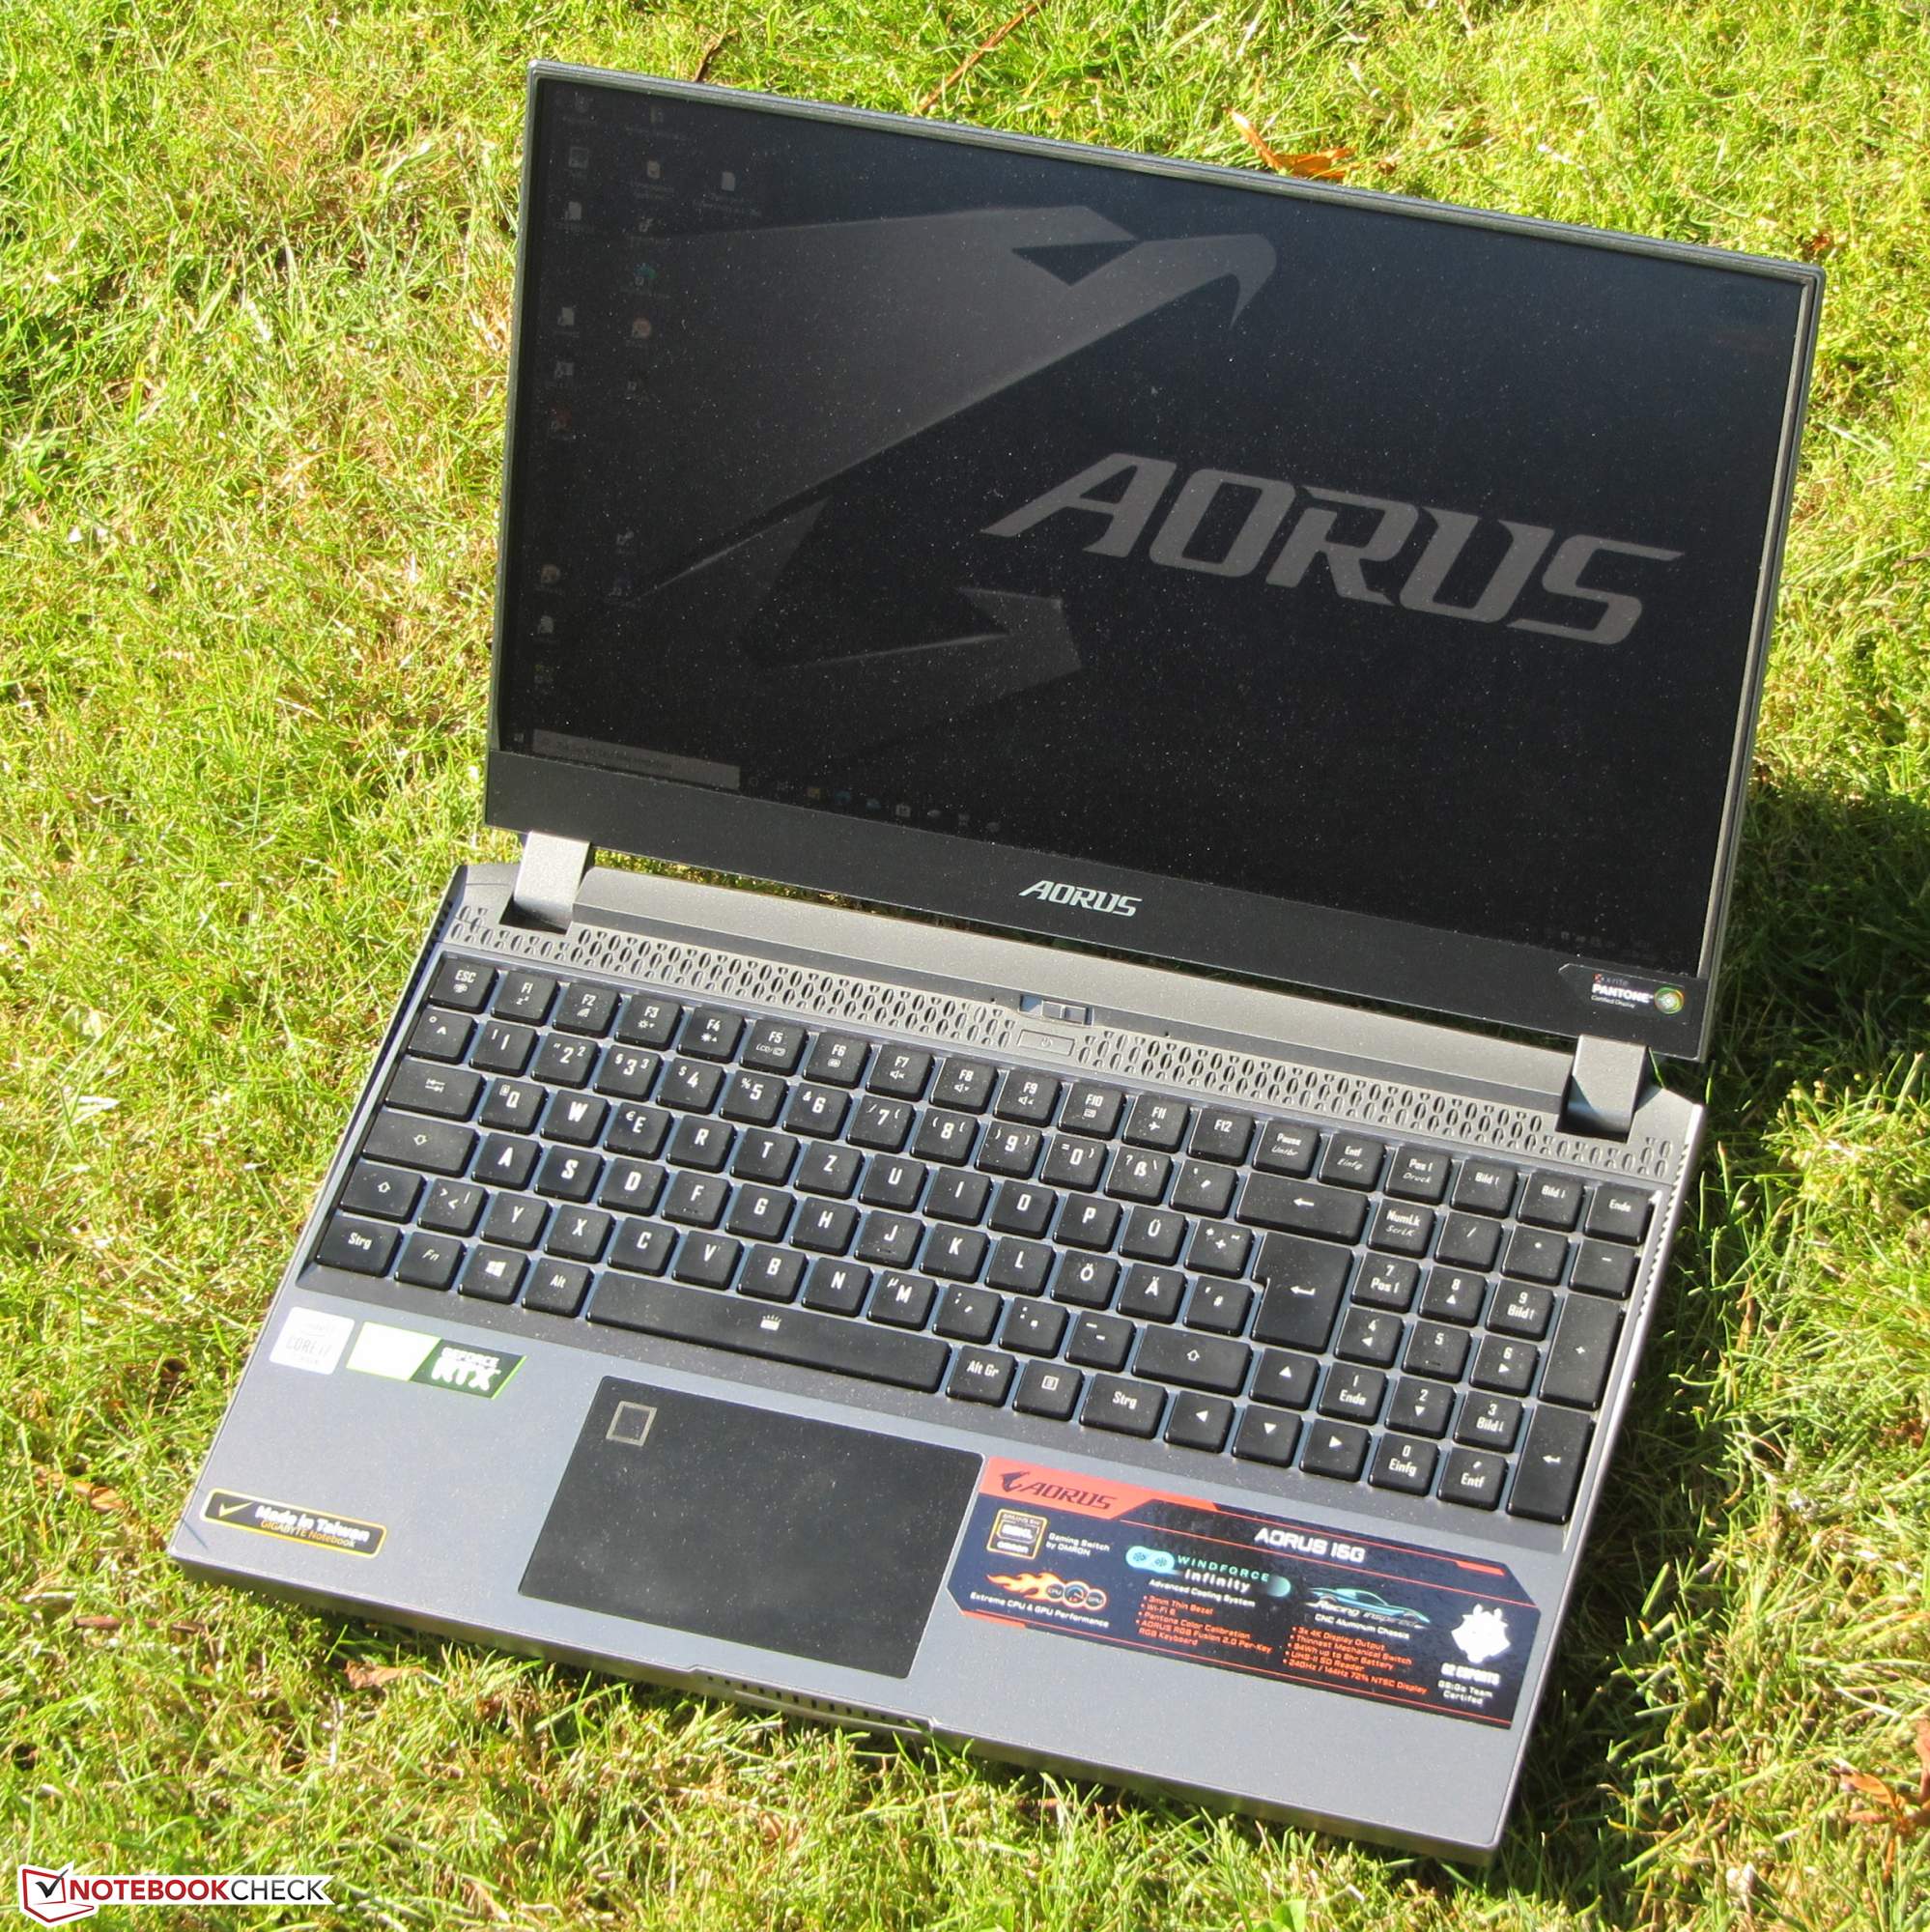
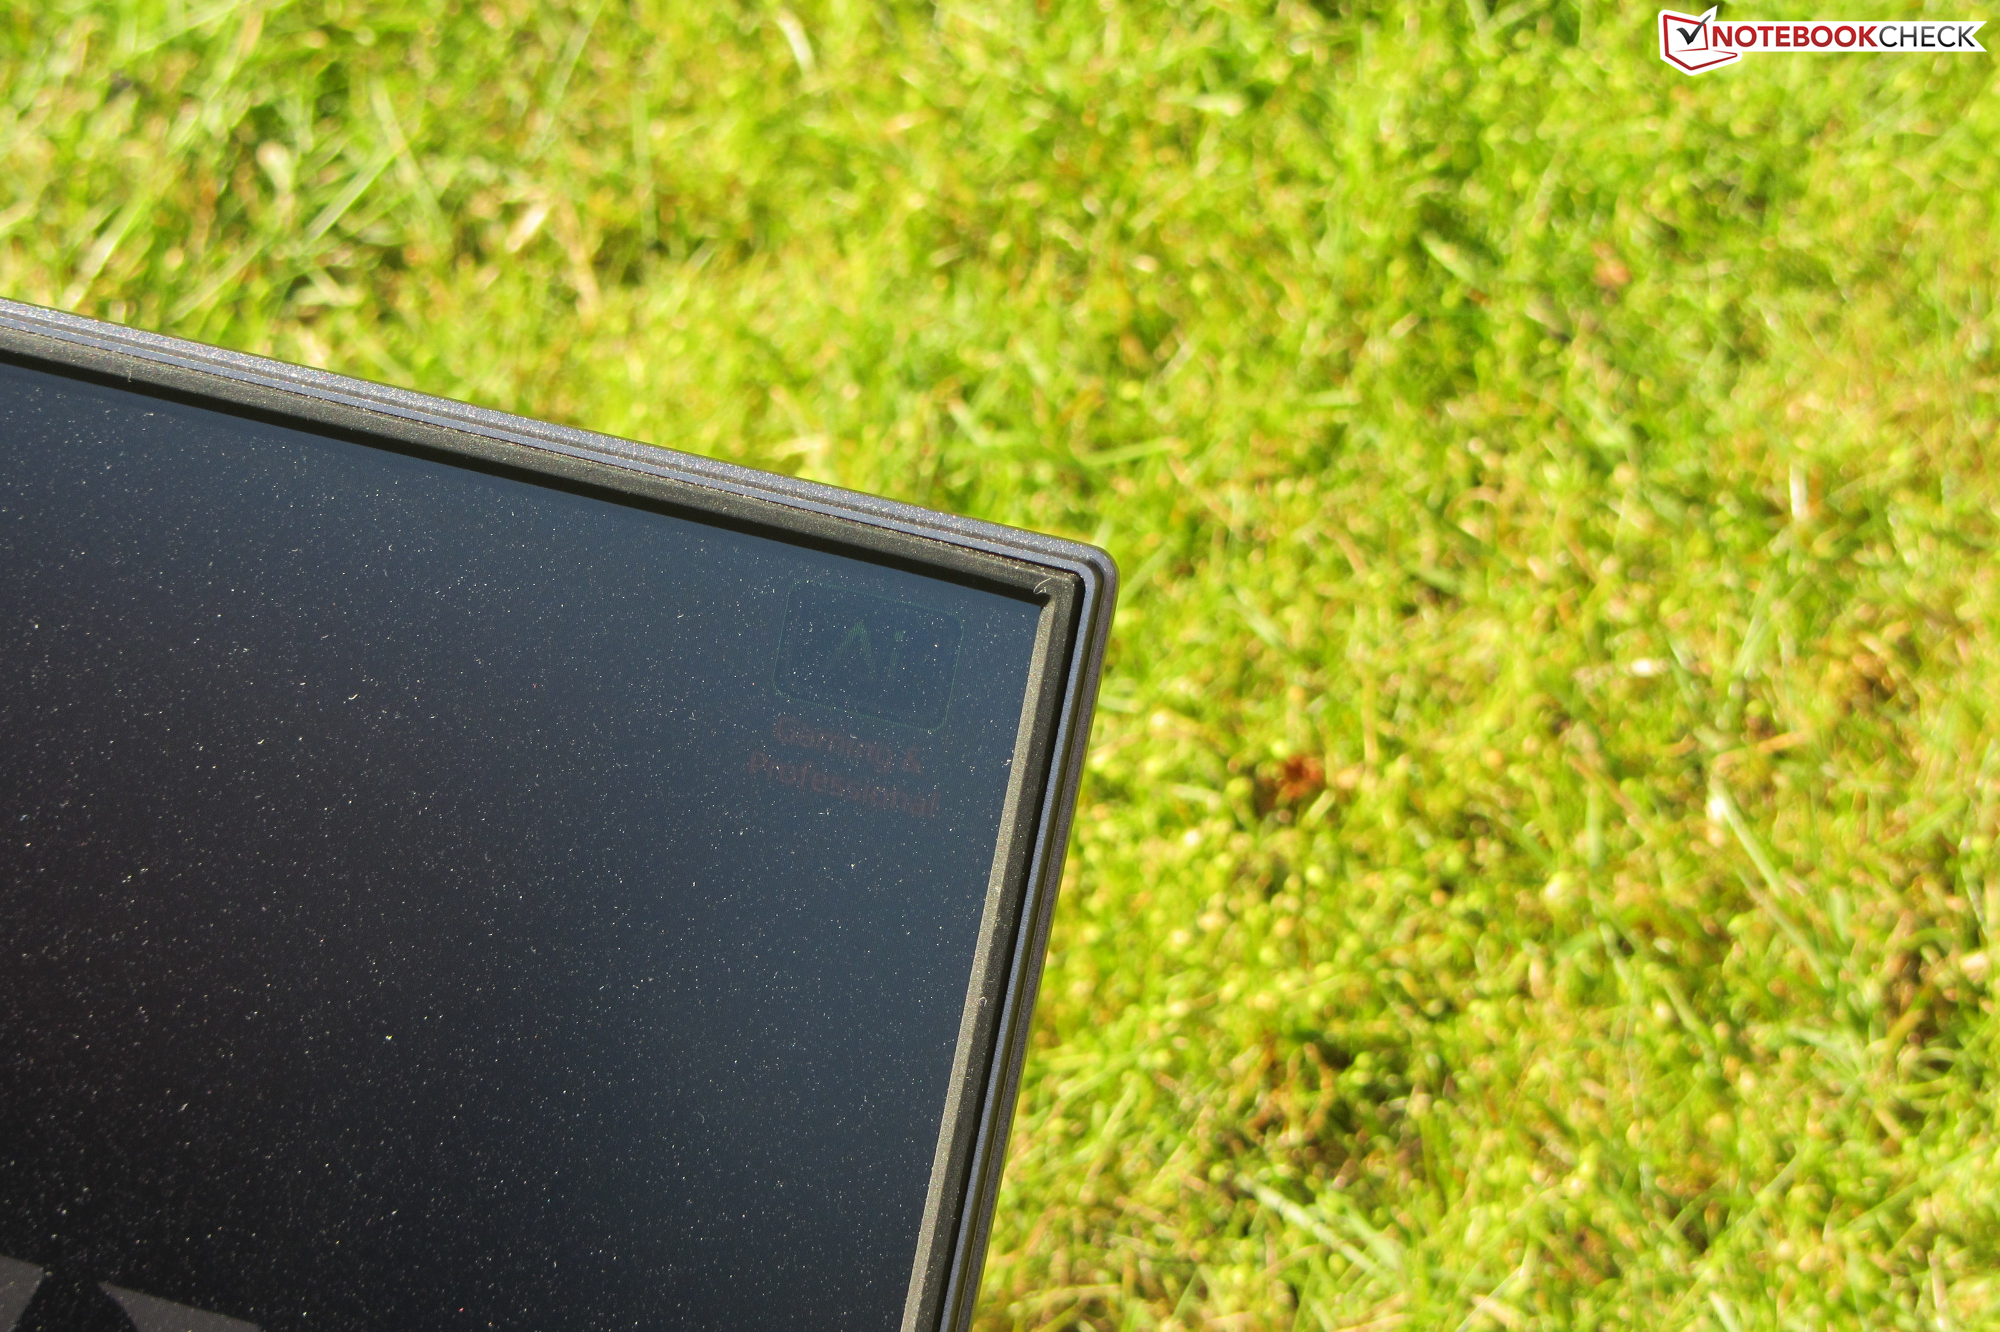
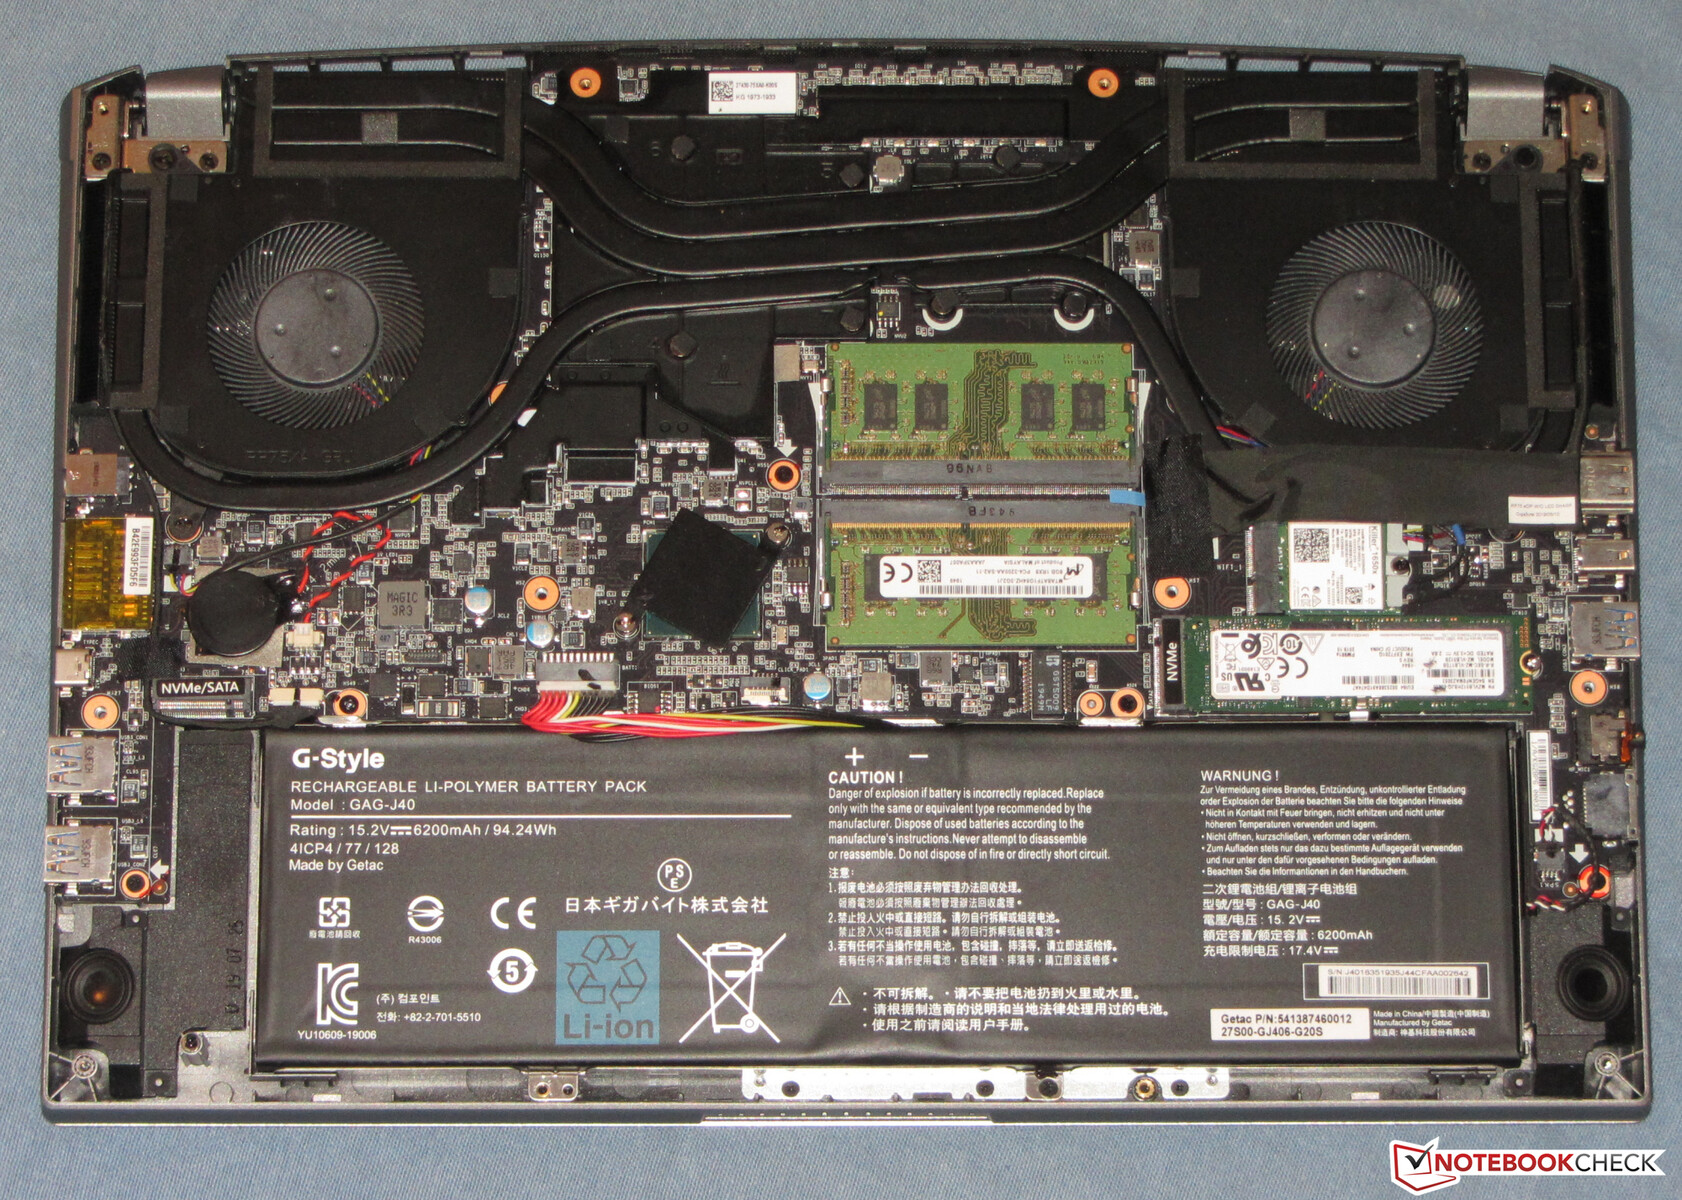
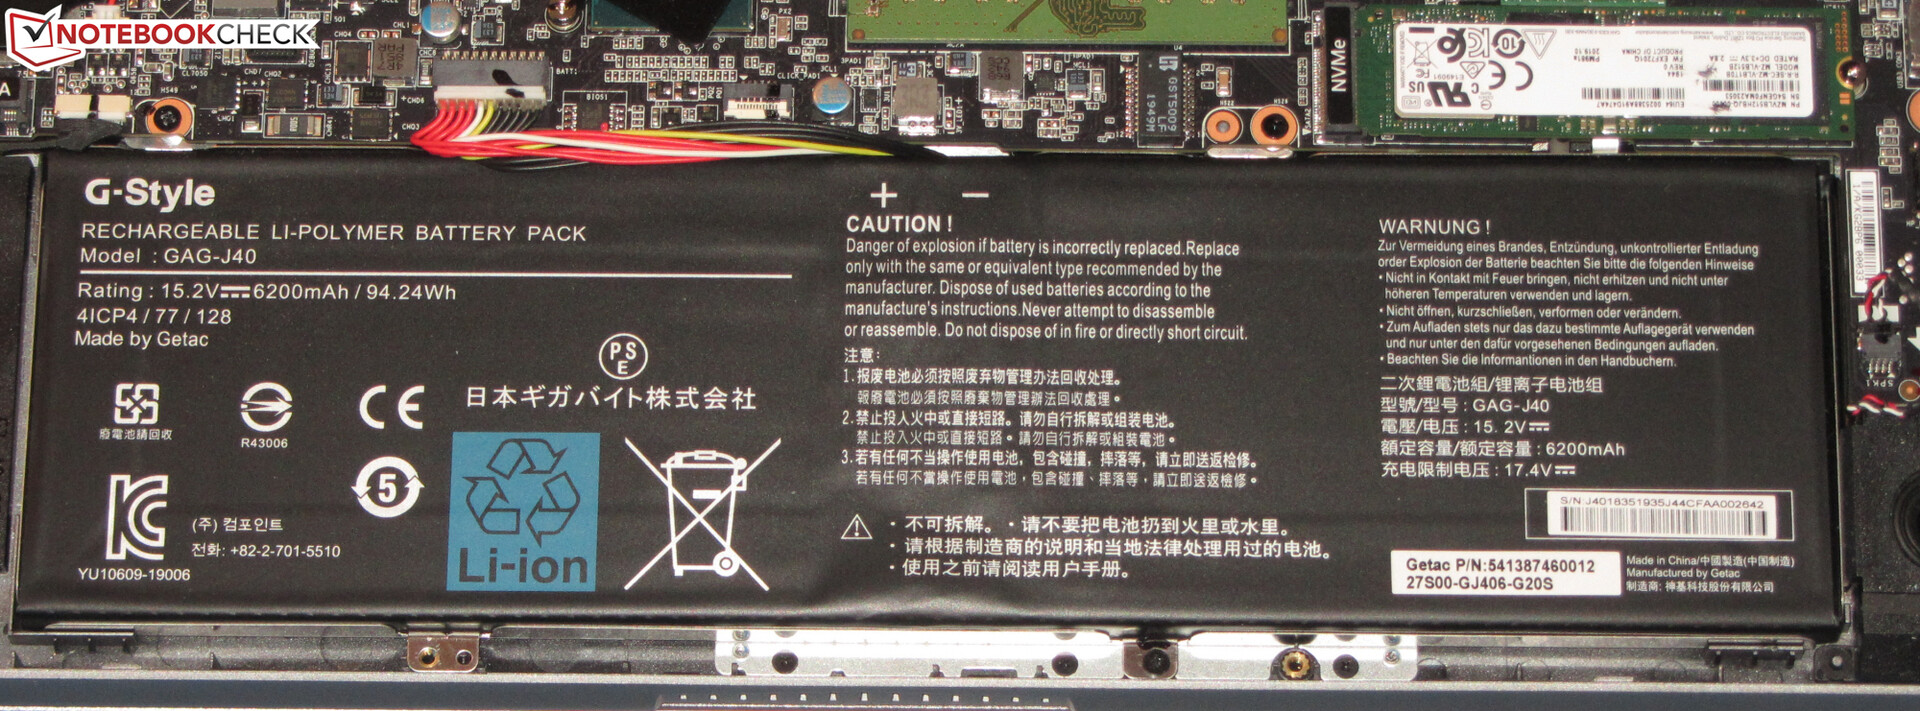
The computer's powerful hardware is housed in a silver-gray metal case that left a high-quality impression both visually and haptically. In combination with the very slim display bezels, this results in a device that is overall quite attractive. The palm rest and the back of the lid have smooth surfaces. Moreover, the illuminated Aorus logo places emphasis on the lid's back. The laptop doesn't have a maintenance hatch, and the battery is firmly installed.
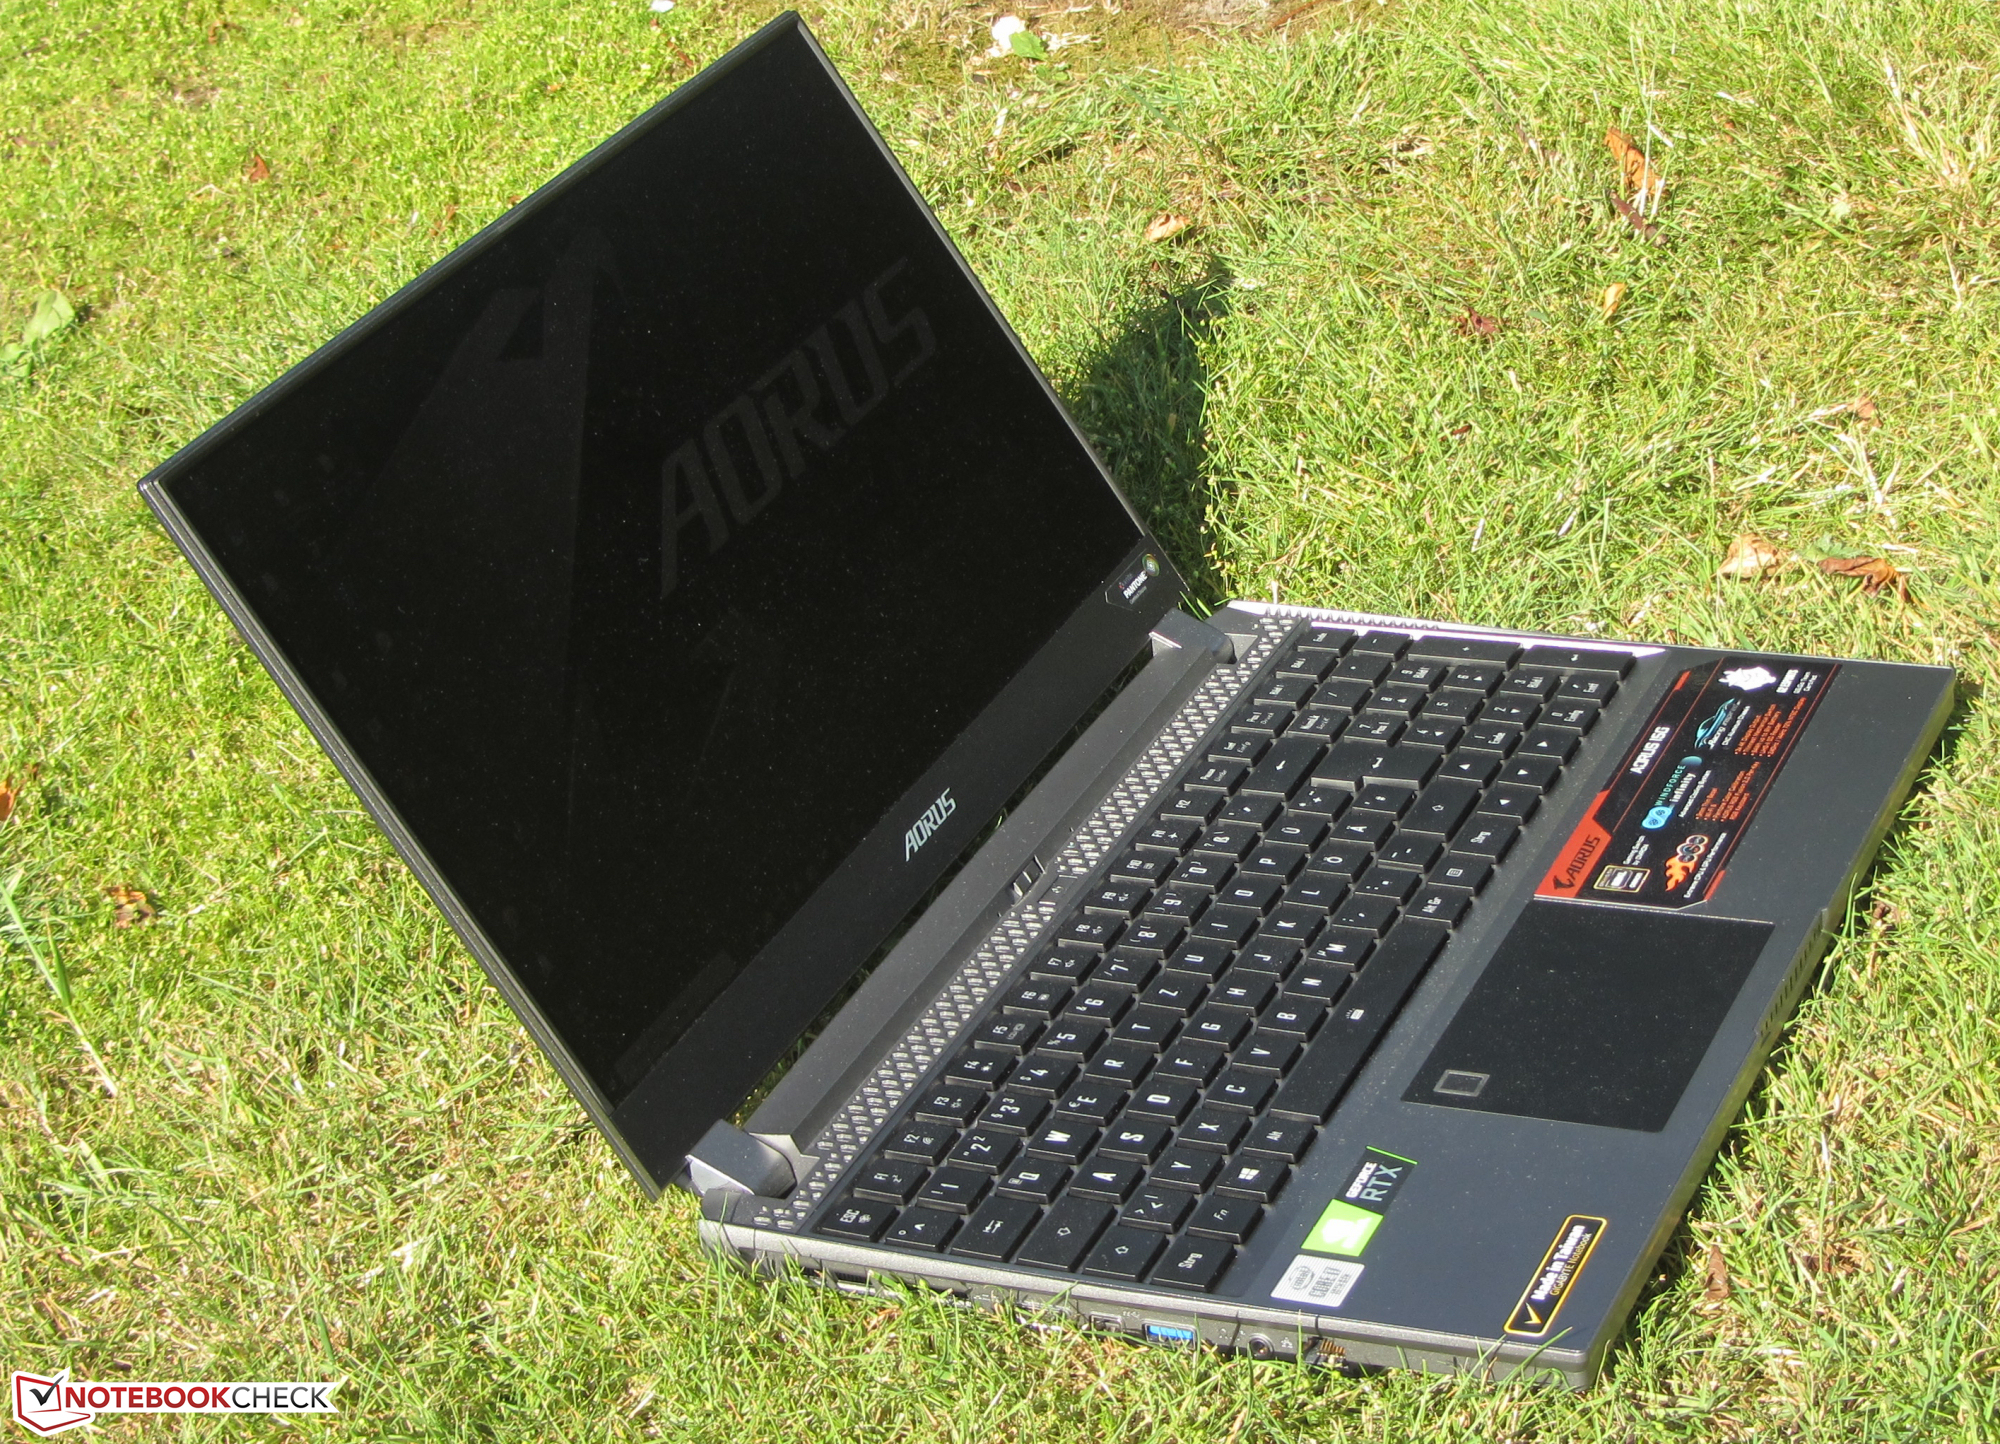
The laptop shows good workmanship. No excess material is noticeable, and the gap dimensions are in order too. Stability is also right since the base unit can only be twisted slightly. This can be done to a somewhat larger extent when it comes to the lid, but overall, everything remains completely within the limits. Furthermore, exerting pressure on the back of the lid doesn't lead to image distortions. The hinges hold the lid firmly in position, but they wobble a bit. In addition, opening the lid with one hand is possible. The maximum aperture angle is about 135°.
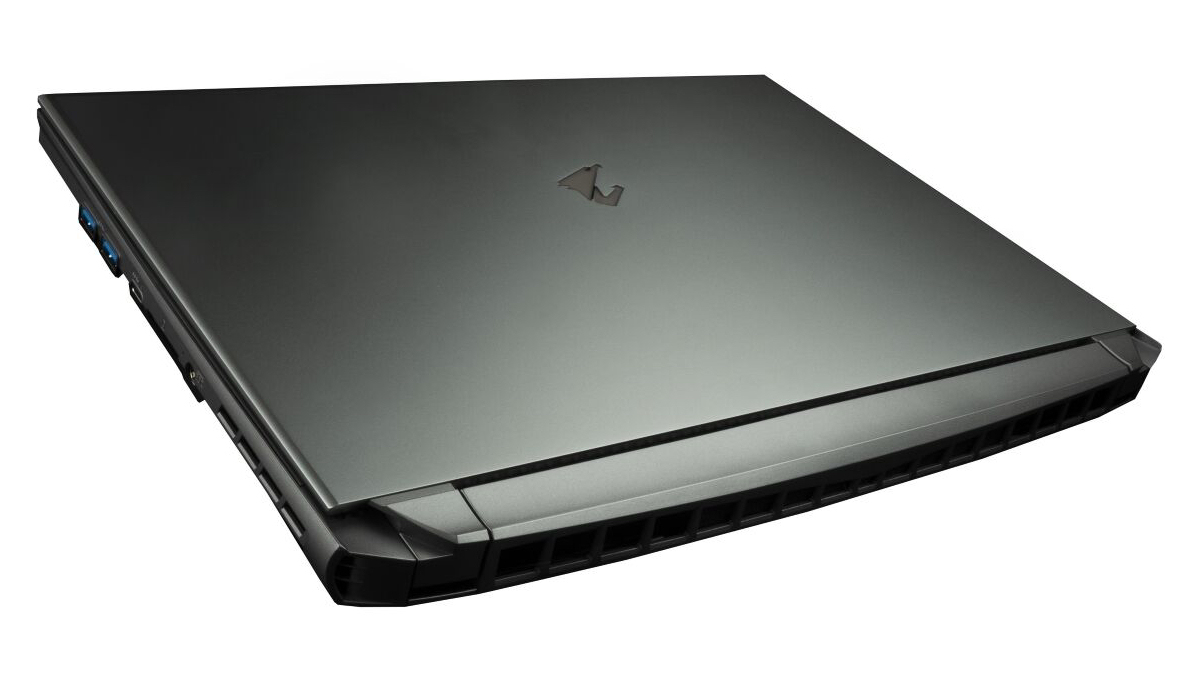
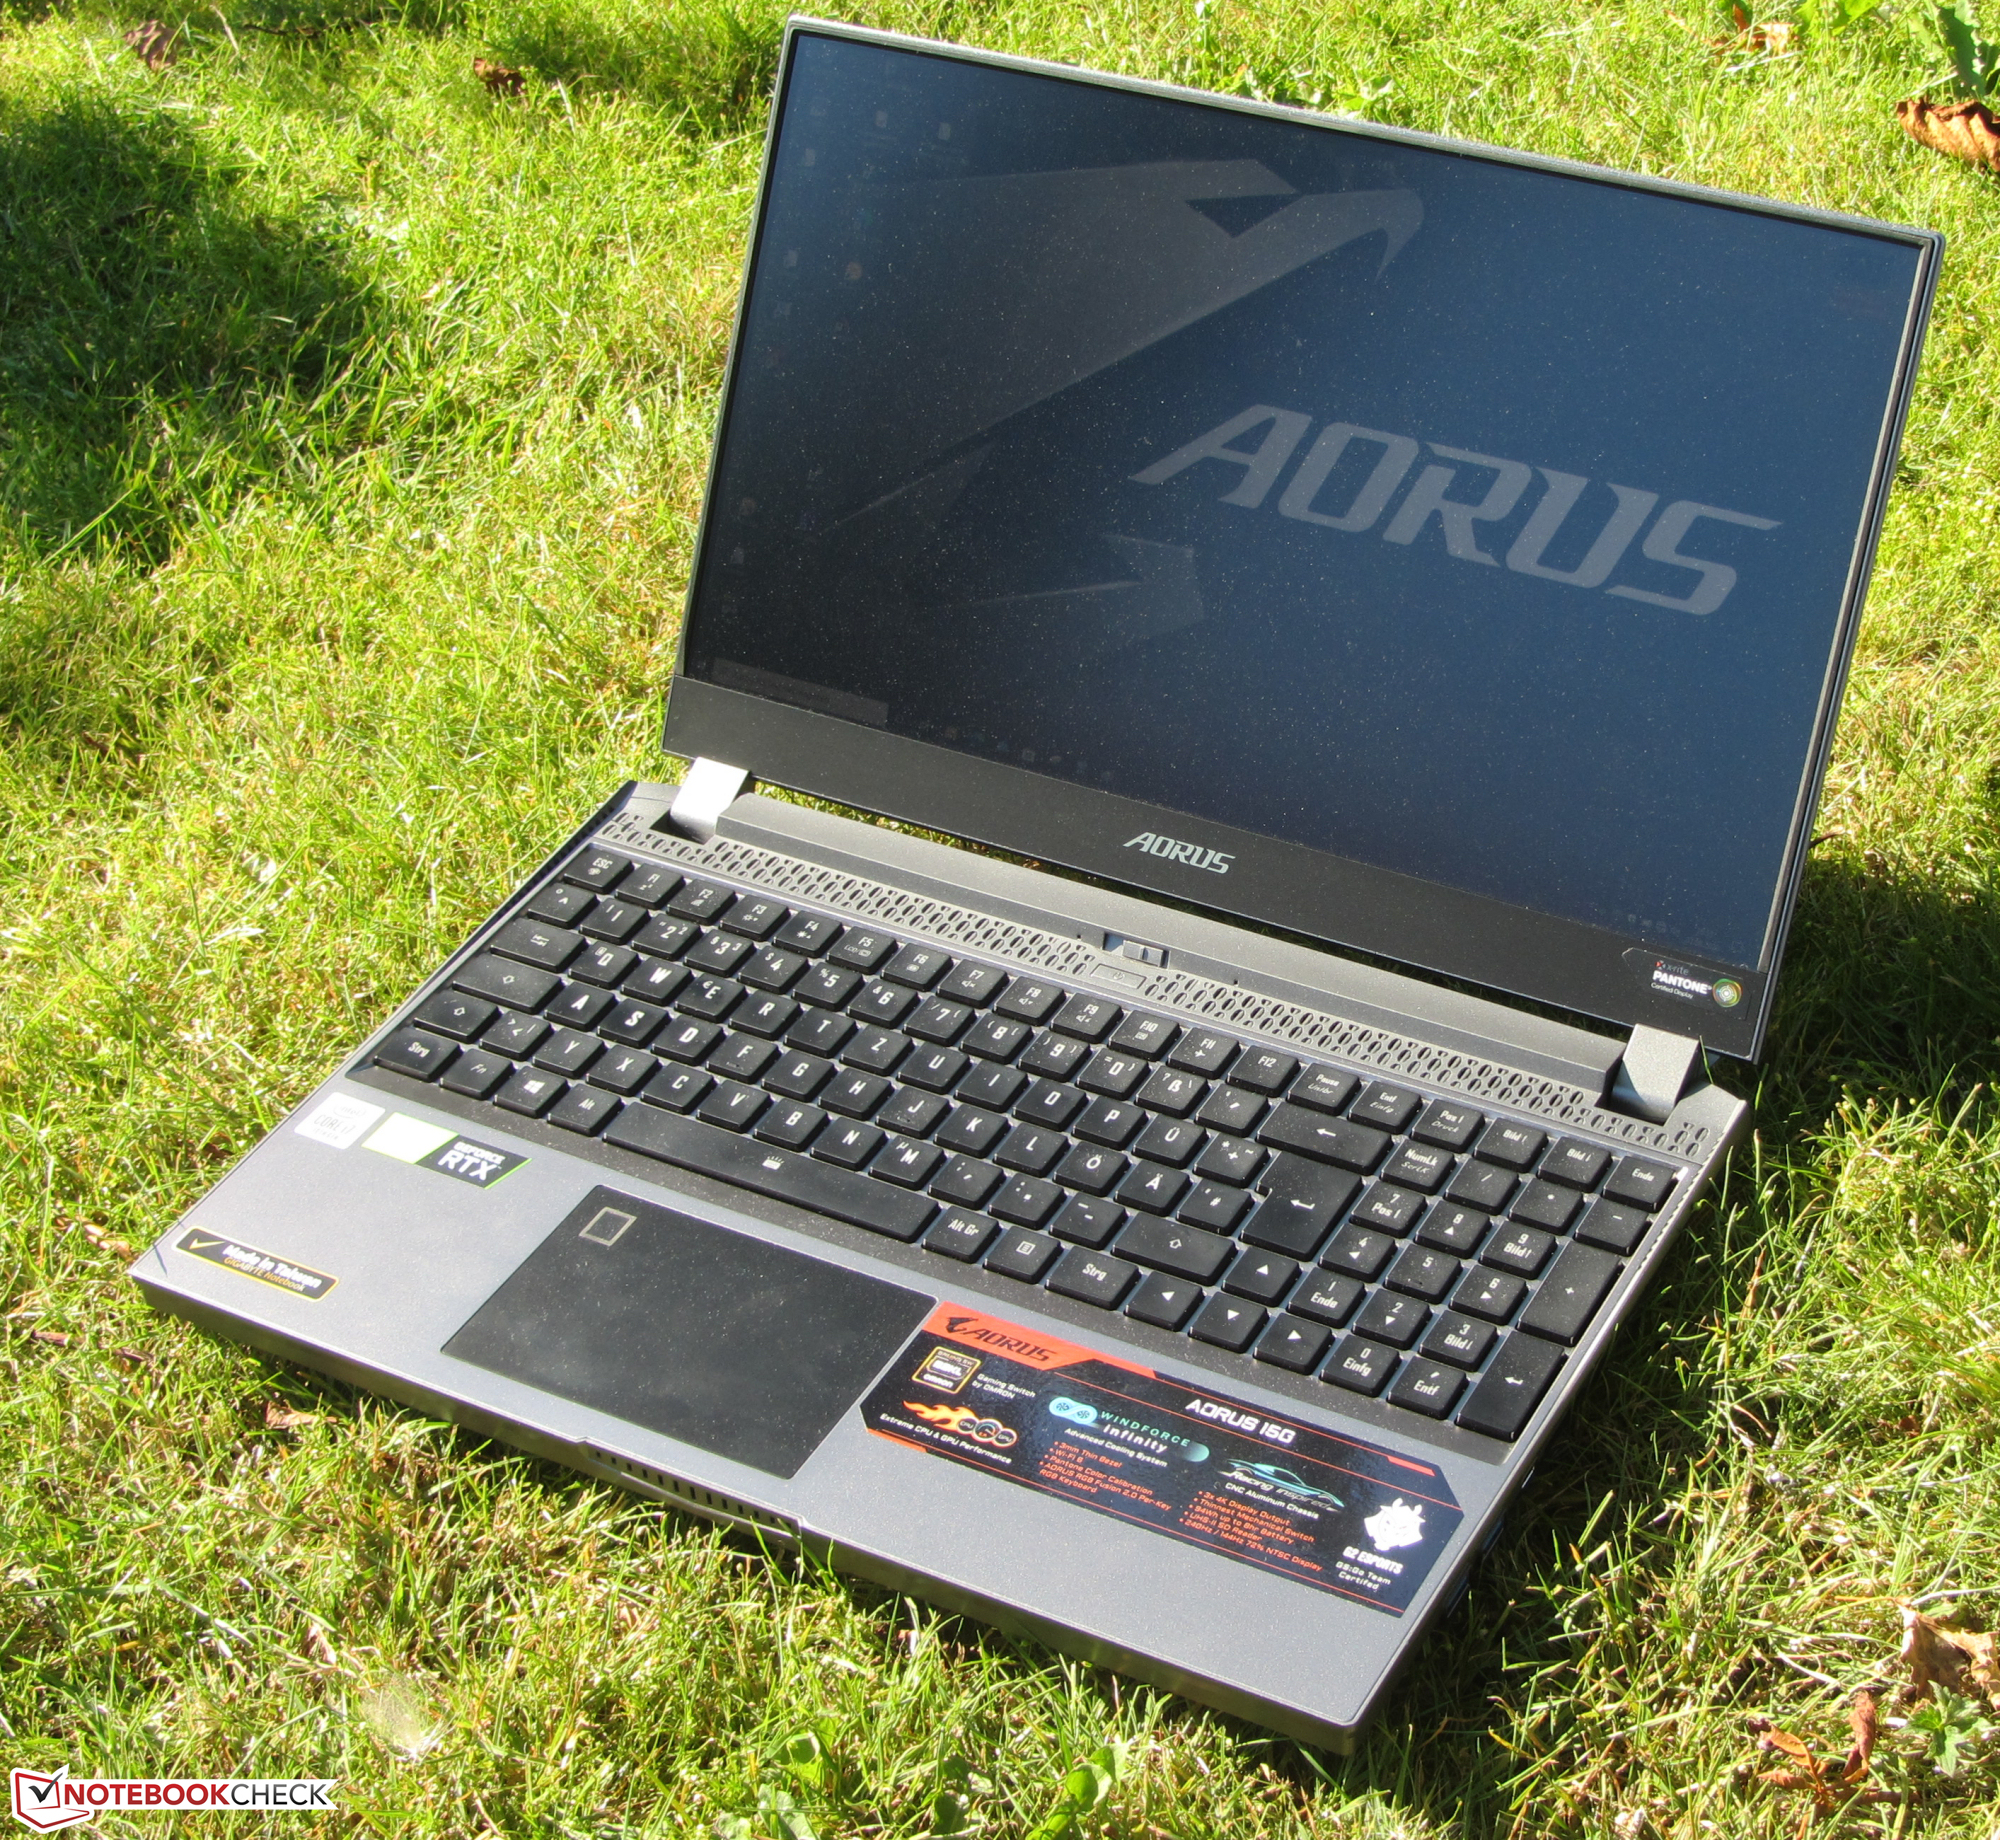
The Aorus 15 is a slim and light gaming laptop. In terms of weight, it's on par with the devices in our comparison field. The fact that it's a bit thicker than some competitors is due to the mechanical keyboard.
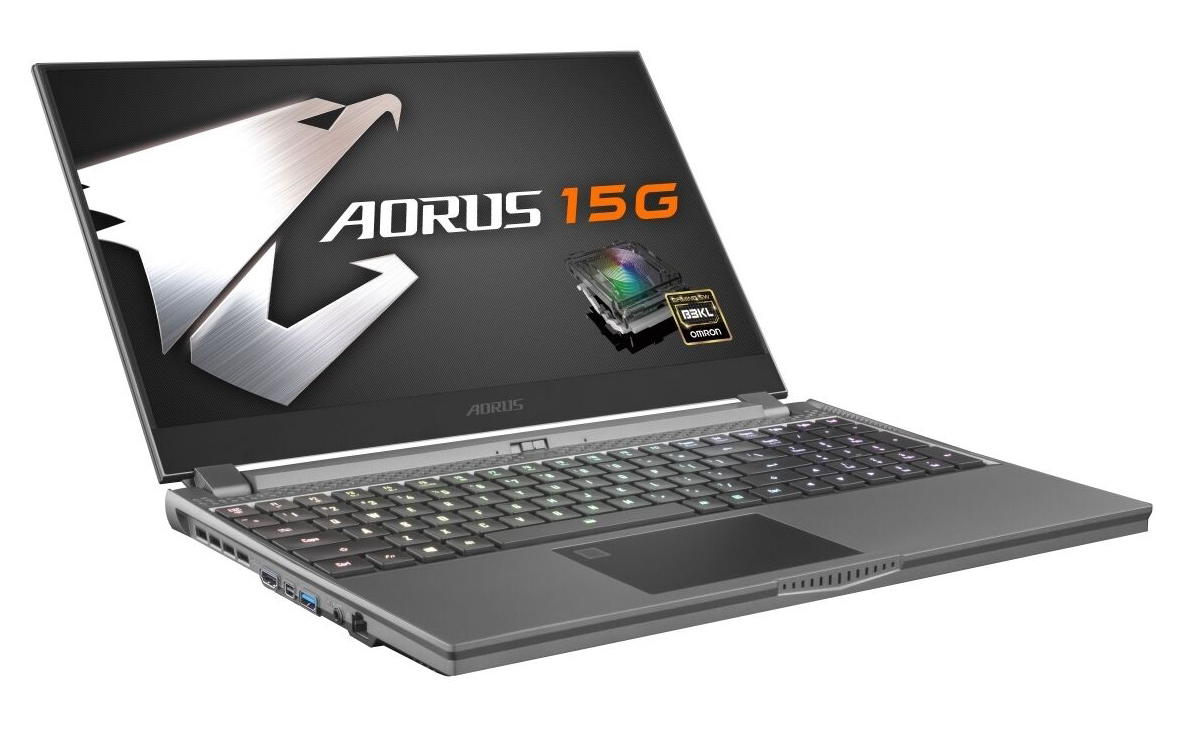
Connectivity - Thunderbolt 3 on board
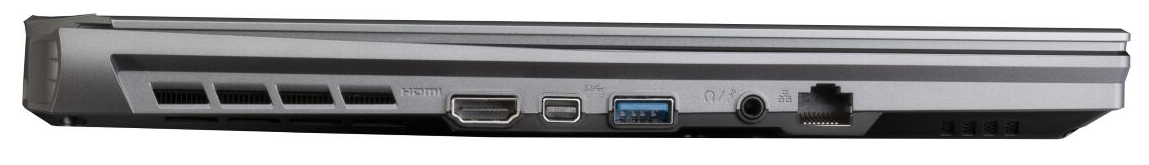
The gaming laptop features a well-rounded port configuration. All three USB Type-A ports work according to the 3.2 Gen 1 standard. There are also two video outputs (HDMI 2.0, Mini DisplayPort 1.4), a combo audio connection, and a Gigabit Ethernet port. Good: A Thunderbolt 3 port is also available. As a result, it would be possible to use extensive docking solutions or to connect an external GPU that offers more power.
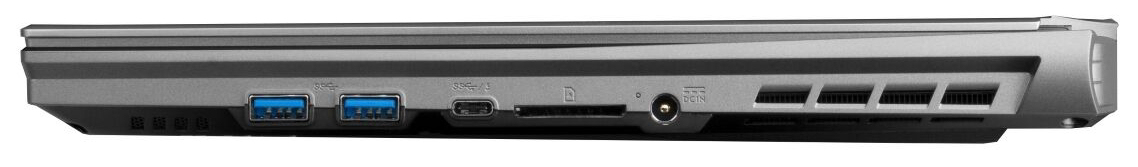
SD card reader
SD cards don't fit completely into the built-in memory card reader; they protrude a good 15 mm. Moreover, the model used here is one of the faster representatives of its kind. When copying large data blocks, a maximum transfer speed of 248 MB/s is achieved. The transfer of 250 jpg image files (about 5 MB each) is completed at a speed of 210 MB/s. We test memory card readers using a reference card (the 64 GB Toshiba Exceria Pro SDXC UHS-II).
| SD Card Reader | |
| average JPG Copy Test (av. of 3 runs) | |
| Aorus 15G XB (Toshiba Exceria Pro SDXC 64 GB UHS-II) | |
| Alienware m15 R3 P87F (Toshiba Exceria Pro M501 UHS-II) | |
| Average of class Gaming (20.9 - 210, n=54, last 2 years) | |
| maximum AS SSD Seq Read Test (1GB) | |
| Aorus 15G XB (Toshiba Exceria Pro SDXC 64 GB UHS-II) | |
| Alienware m15 R3 P87F (Toshiba Exceria Pro M501 UHS-II) | |
| Average of class Gaming (25.5 - 261, n=51, last 2 years) | |
Communication
The Killer WLAN module has a chip from Intel that supports the 802.11a/b/g/n/ac/ax WLAN standards. The transmission speeds determined under optimal conditions (no other WLAN devices nearby, short distance between laptop and server PC) are excellent. In addition, the Killer E2600 Gigabit Ethernet controller handles wired network connections, and it does its job smoothly.
Webcam
The webcam (0.9 MP) isn't located in the display bezel, but it's in the base unit instead - above the keyboard. It produces slightly blurry images in a maximum resolution of 1280x720 pixels. Moreover, there are issues with color accuracy, and the target (Delta E less than 3) is missed with a Delta E 2000 deviation of just under 12.


")
")
Accessories
The laptop comes with the usual documents: A quick-start guide and warranty information. In addition, a thermal pad for a second M.2 SSD is found in the box.
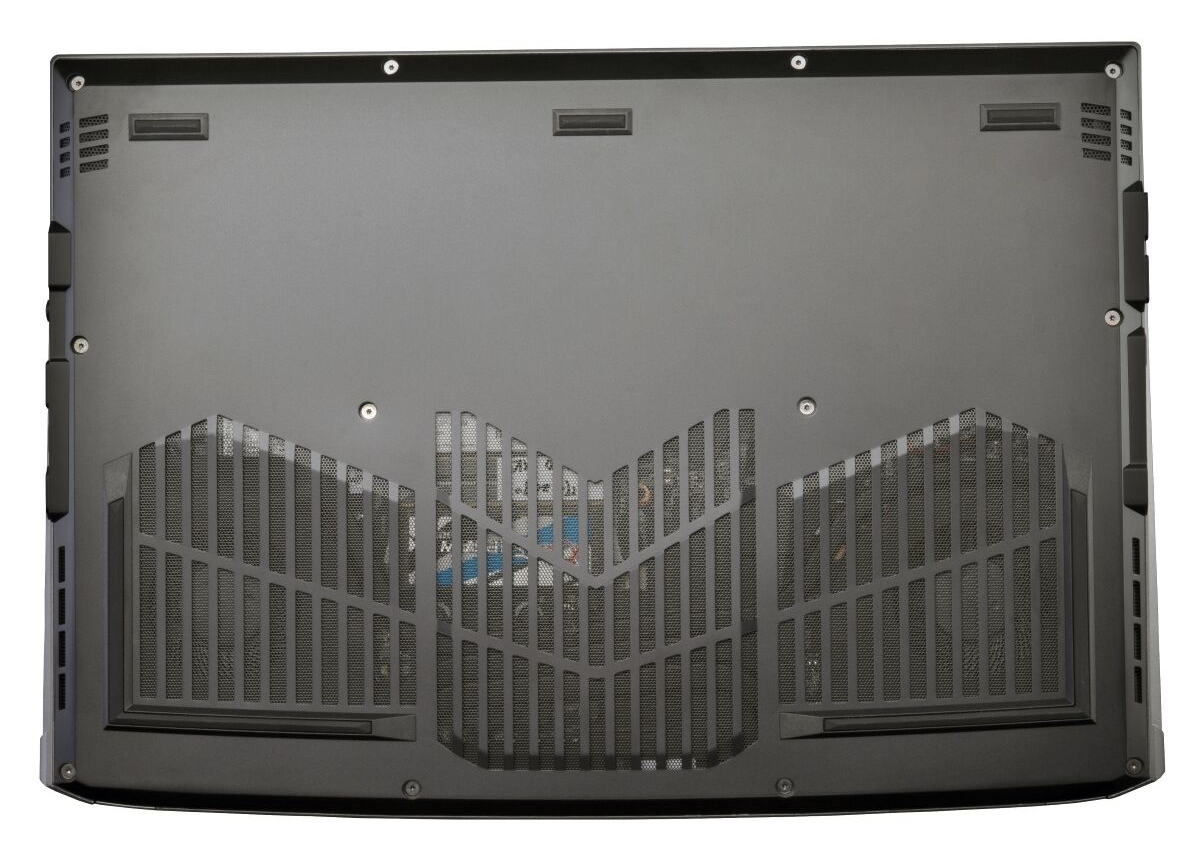
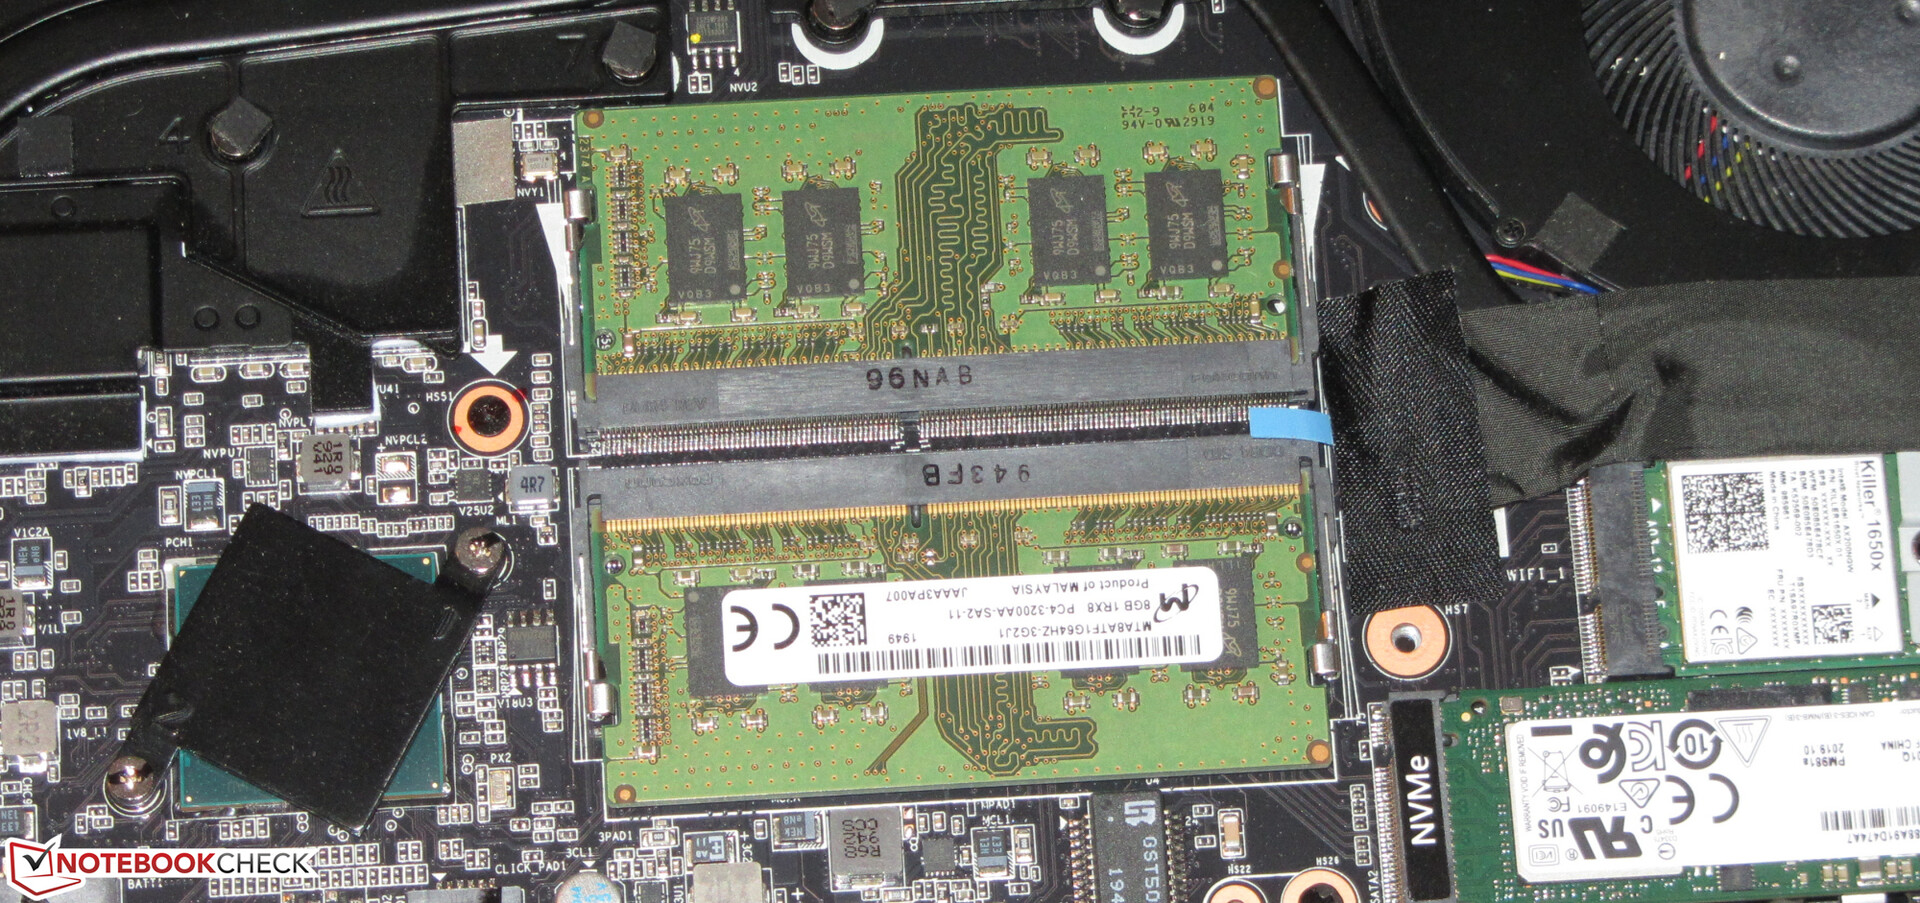
Maintenance
The laptop doesn't have a maintenance hatch. In order to get to the inside, the bottom cover must be lifted. After removing all the screws on the underside of the device, the bottom cover can be detached with the aid of a grout finishing tool or a similar auxiliary tool. The cover isn't placed in an excessively tight way.
Warranty
Gigabyte honors the laptop with a two-year warranty. We couldn't find any warranty extensions.
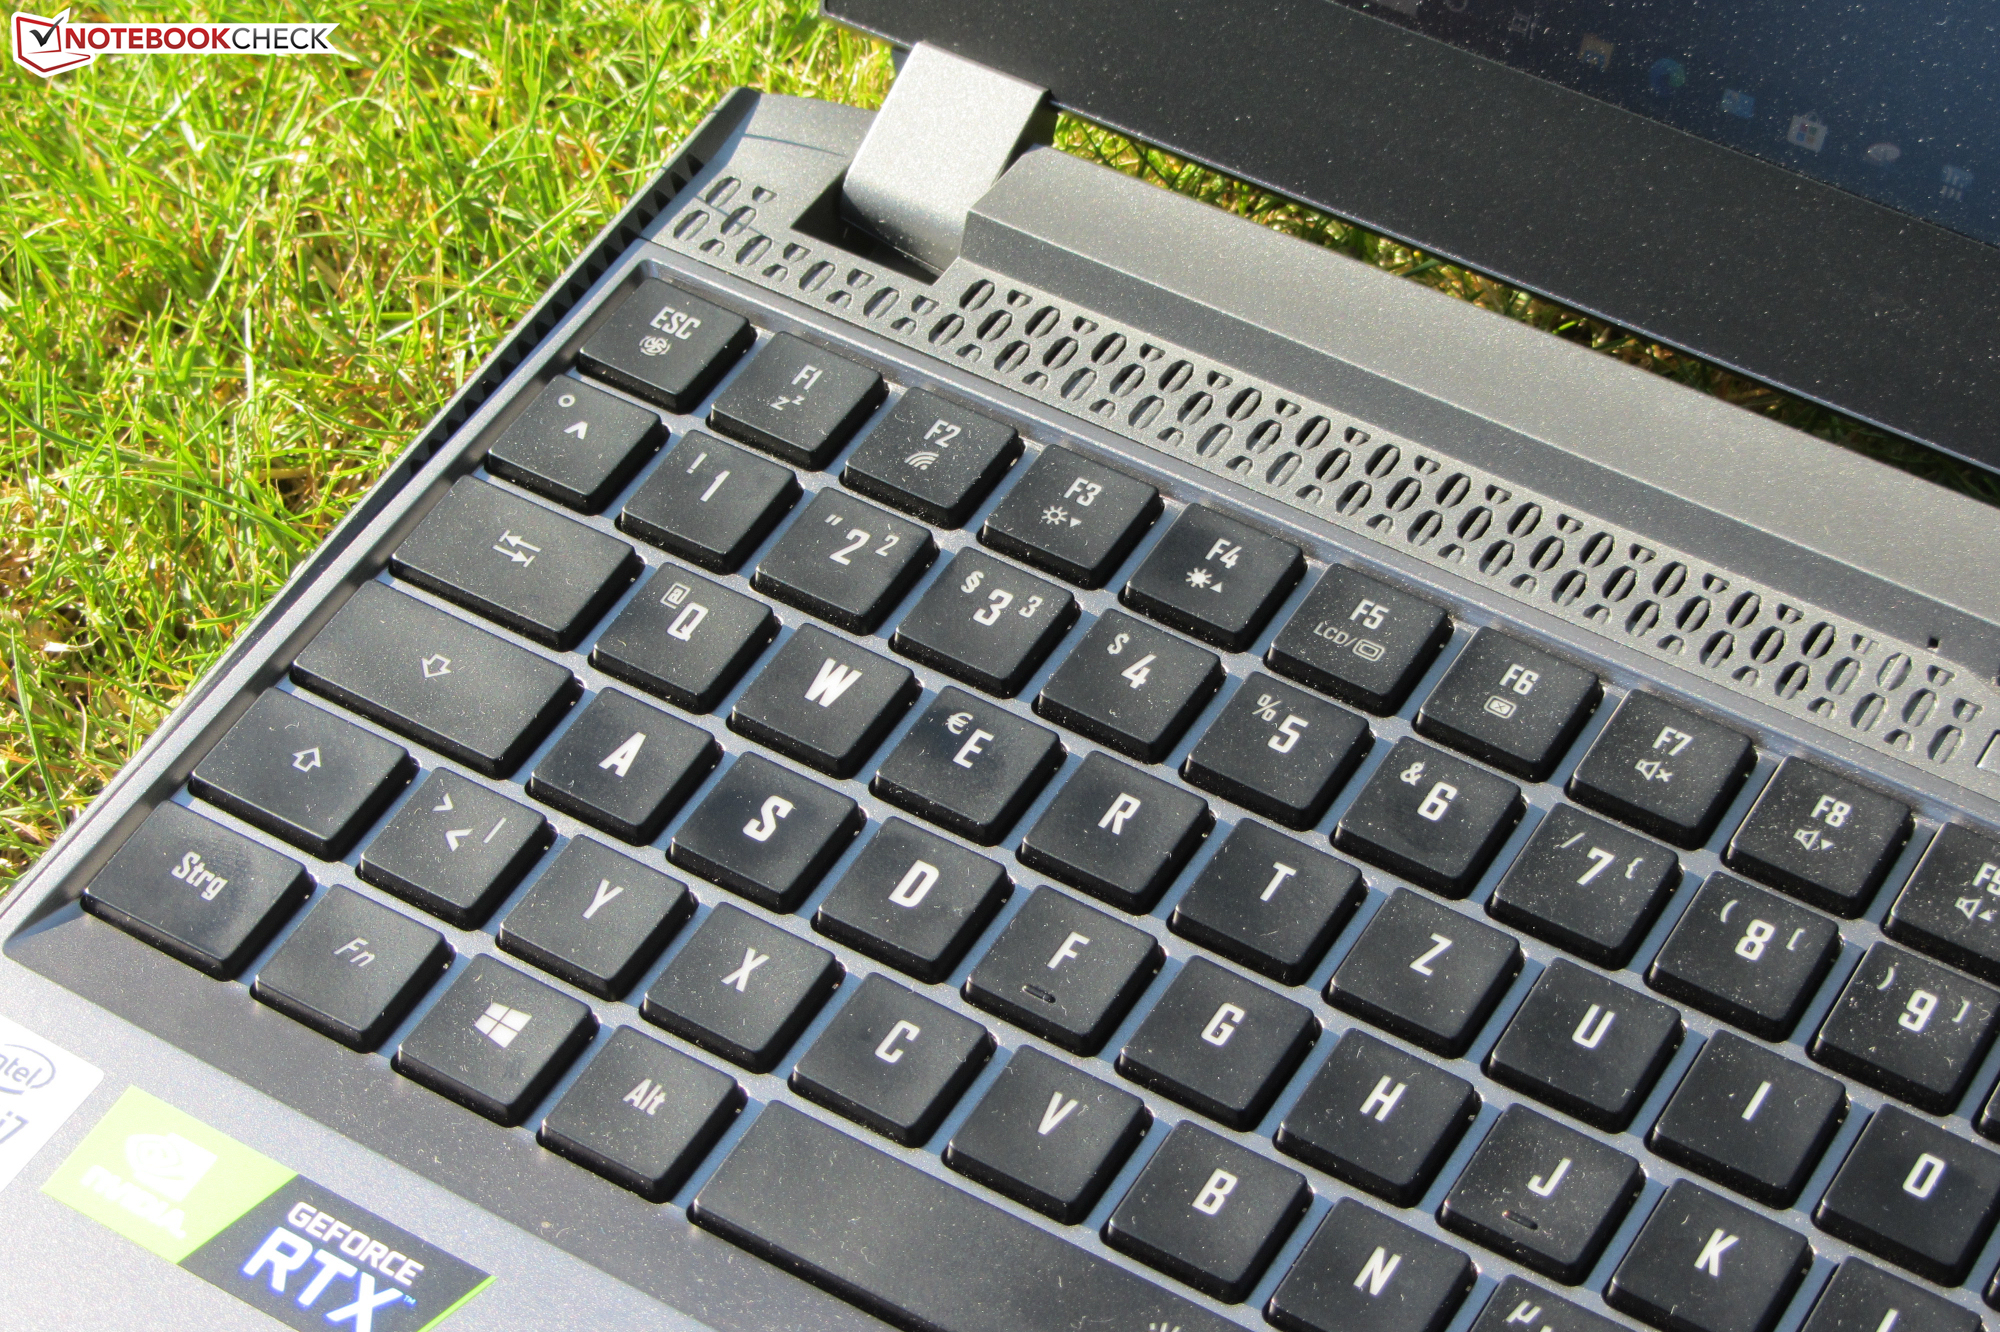
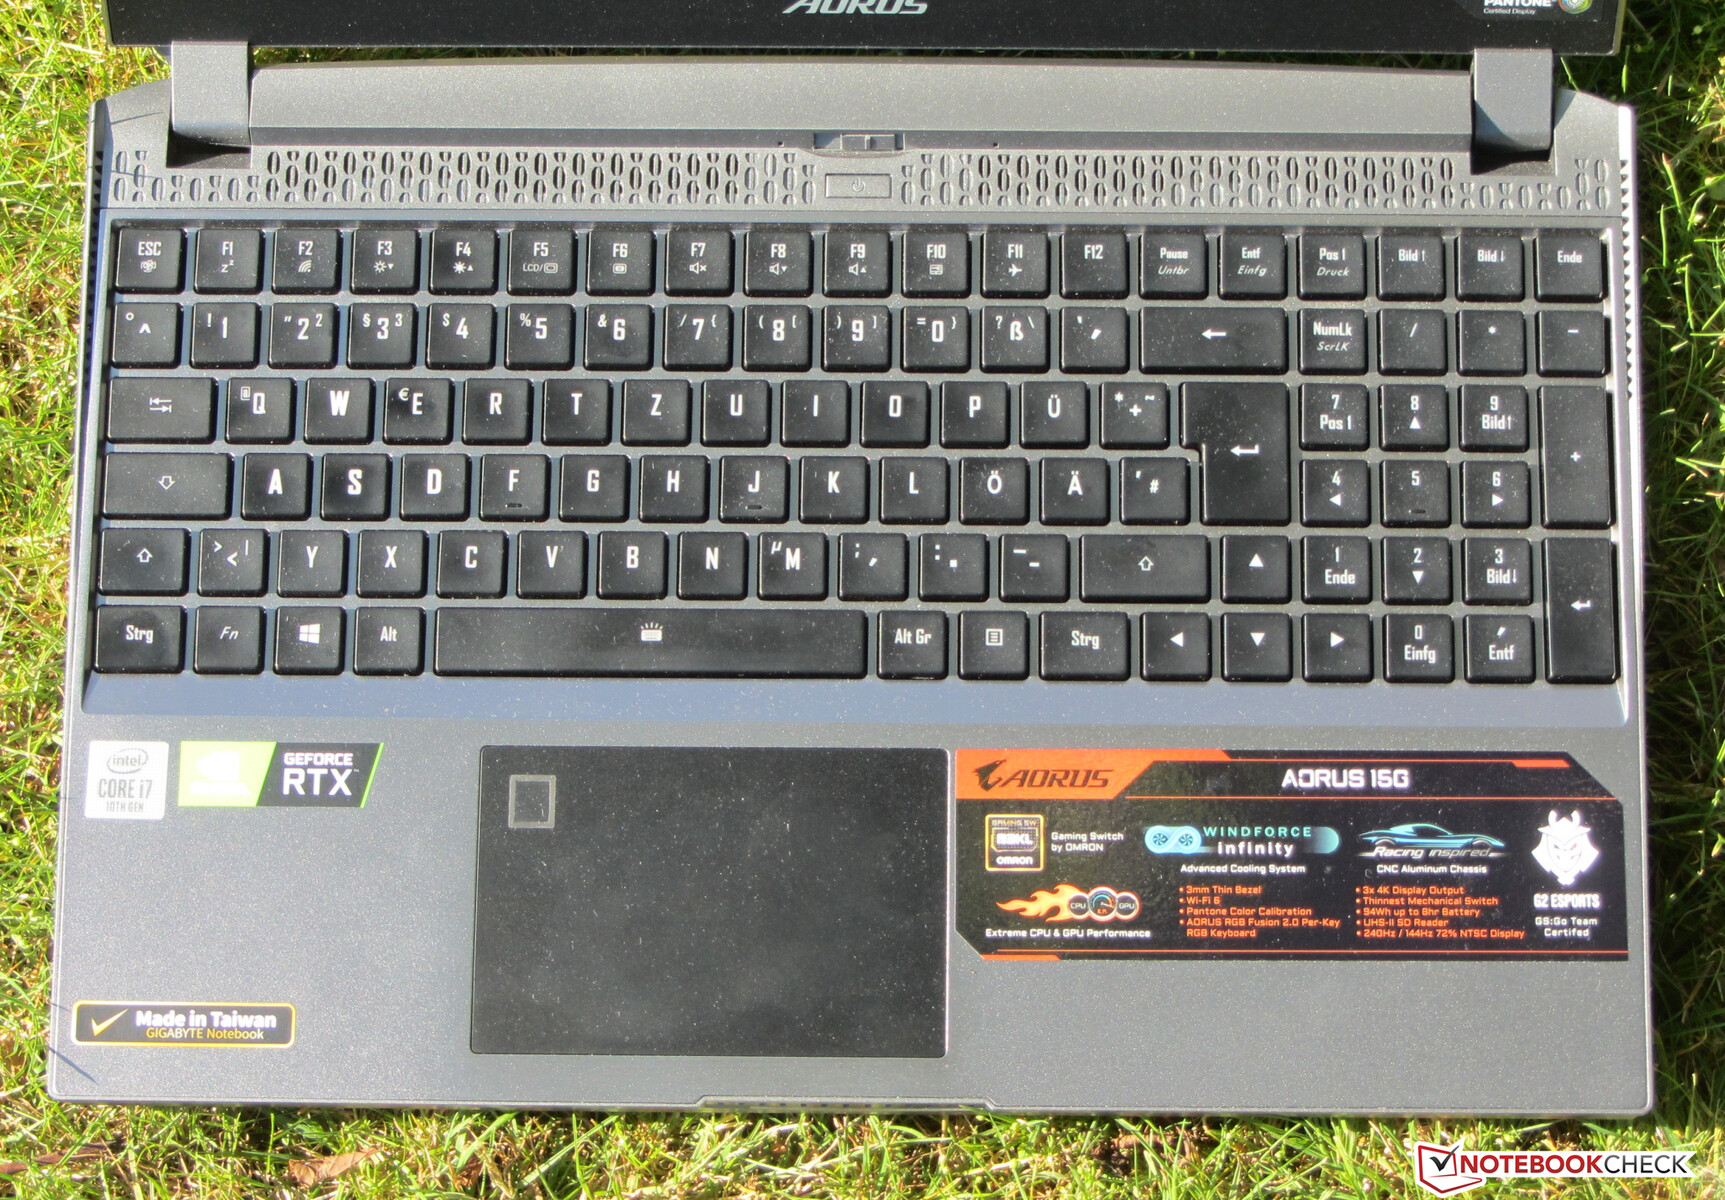
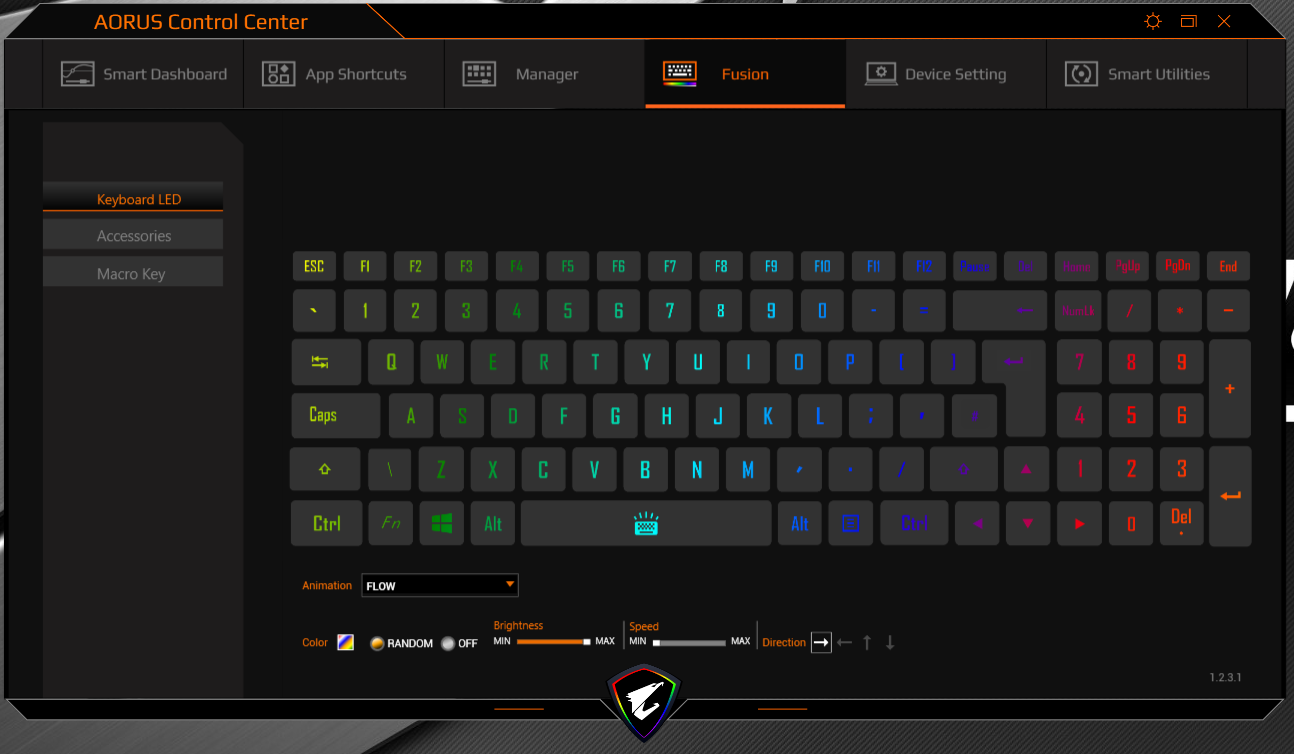
Input devices - The Aorus laptop comes with a mechanical keyboard
Keyboard
The Aorus 15 has a mechanical keyboard (including RGB lighting) from Omron on board that has keys with a concave shape. They offer a comfortable travel and have a clearly audible and perceptible pressure point. In addition, the keyboard doesn't give way when typing. All in all, Gigabyte delivers a consistent and successful keyboard here.
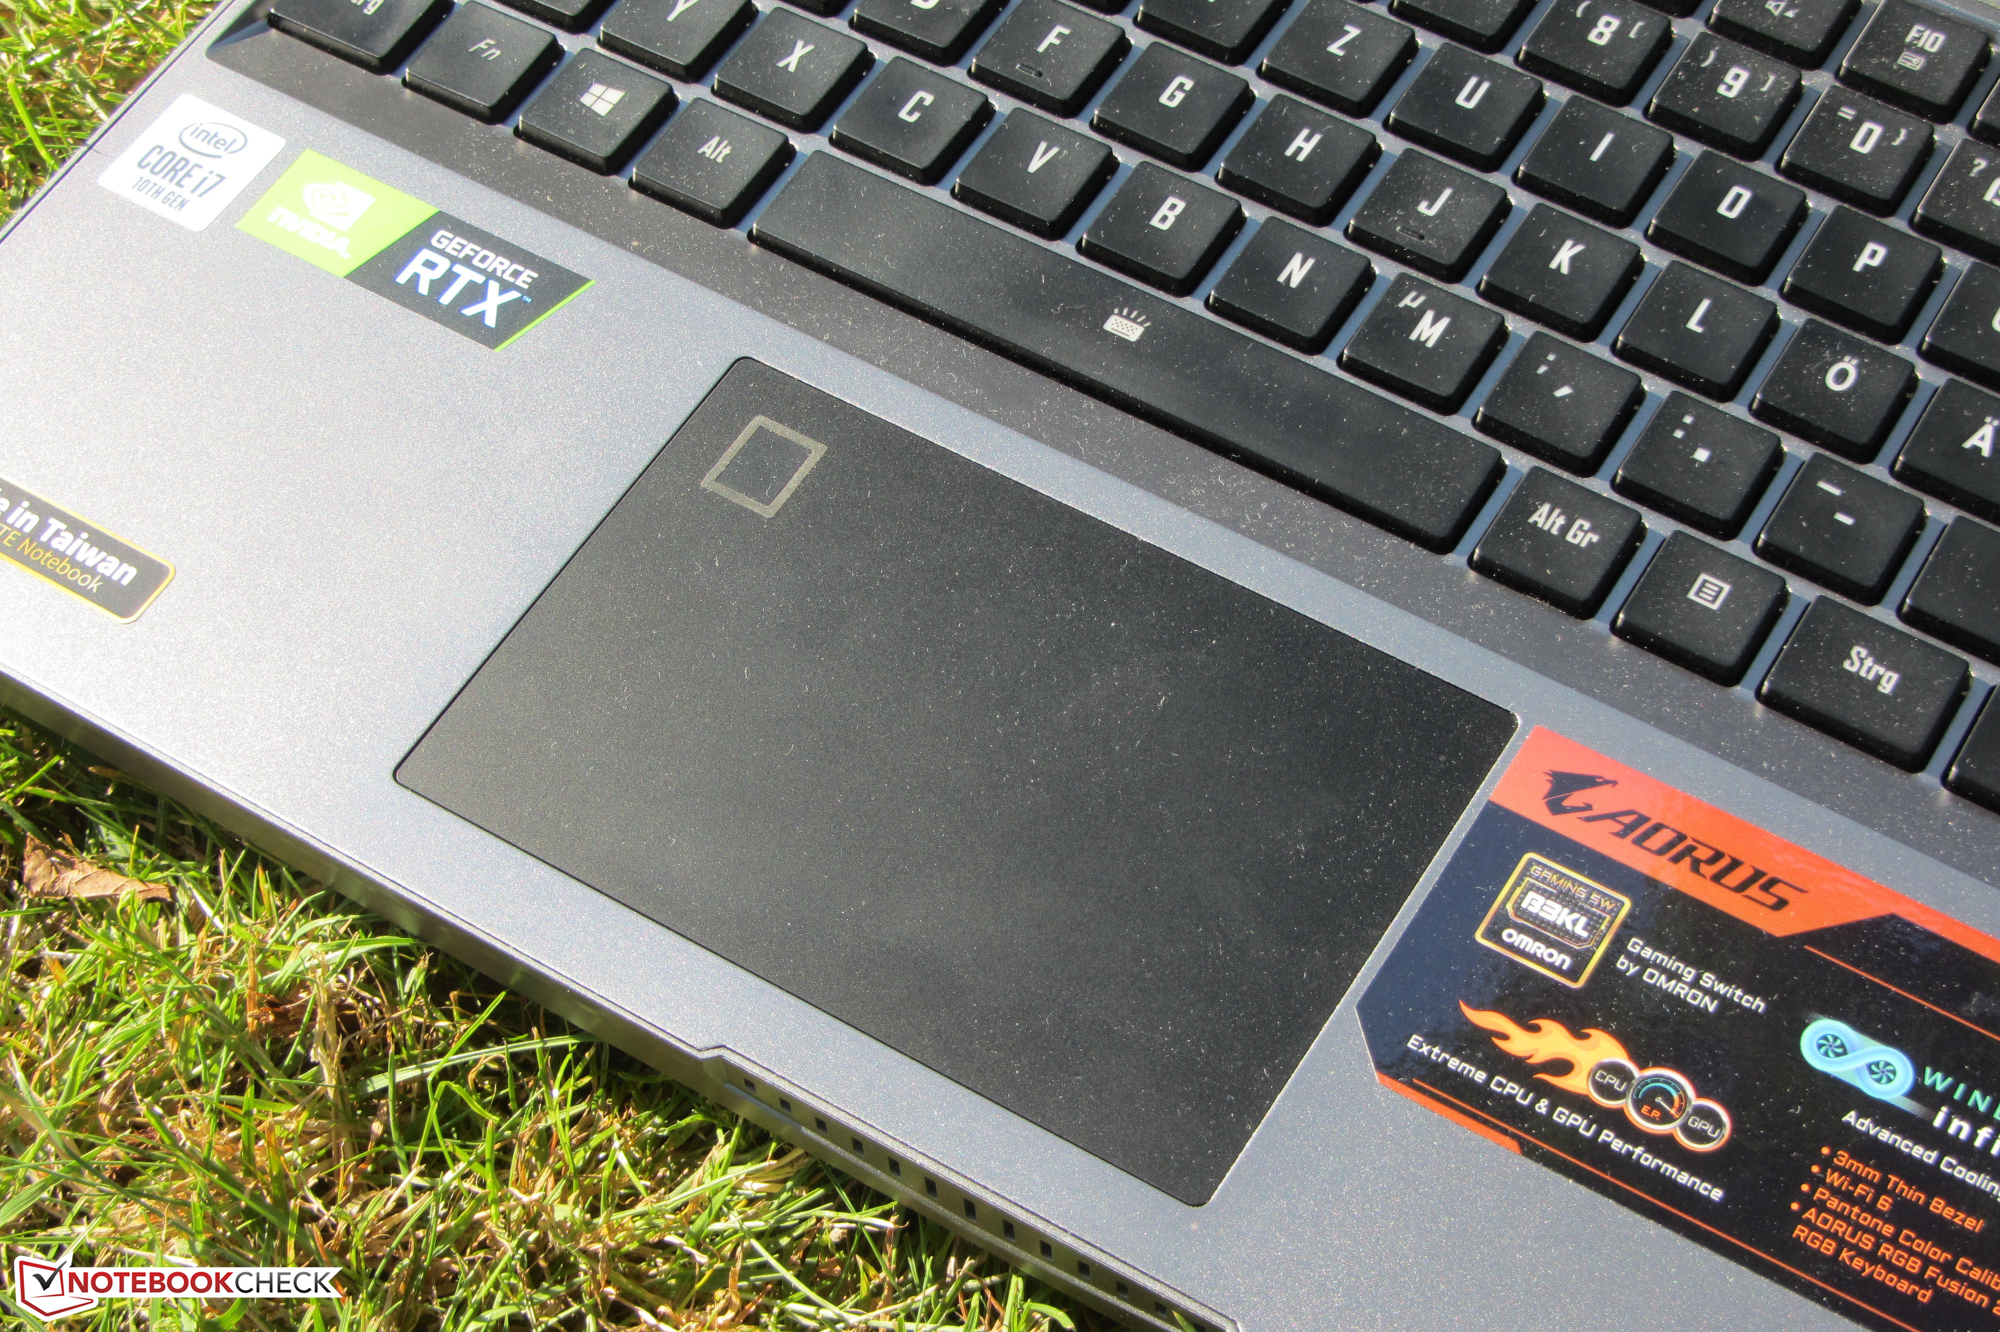
Touchpad
The multi-touch capable ClickPad takes up an area of approximately 10.6 x 7.1 cm. As a result, a lot of space is available for using gesture controls. The smooth surface of the pad makes it easy for the fingers to glide on it. Furthermore, the pad also reacts to input in the corners. An exception is the upper left corner since this area contains a fingerprint scanner.
Display - 240 Hz IGZO
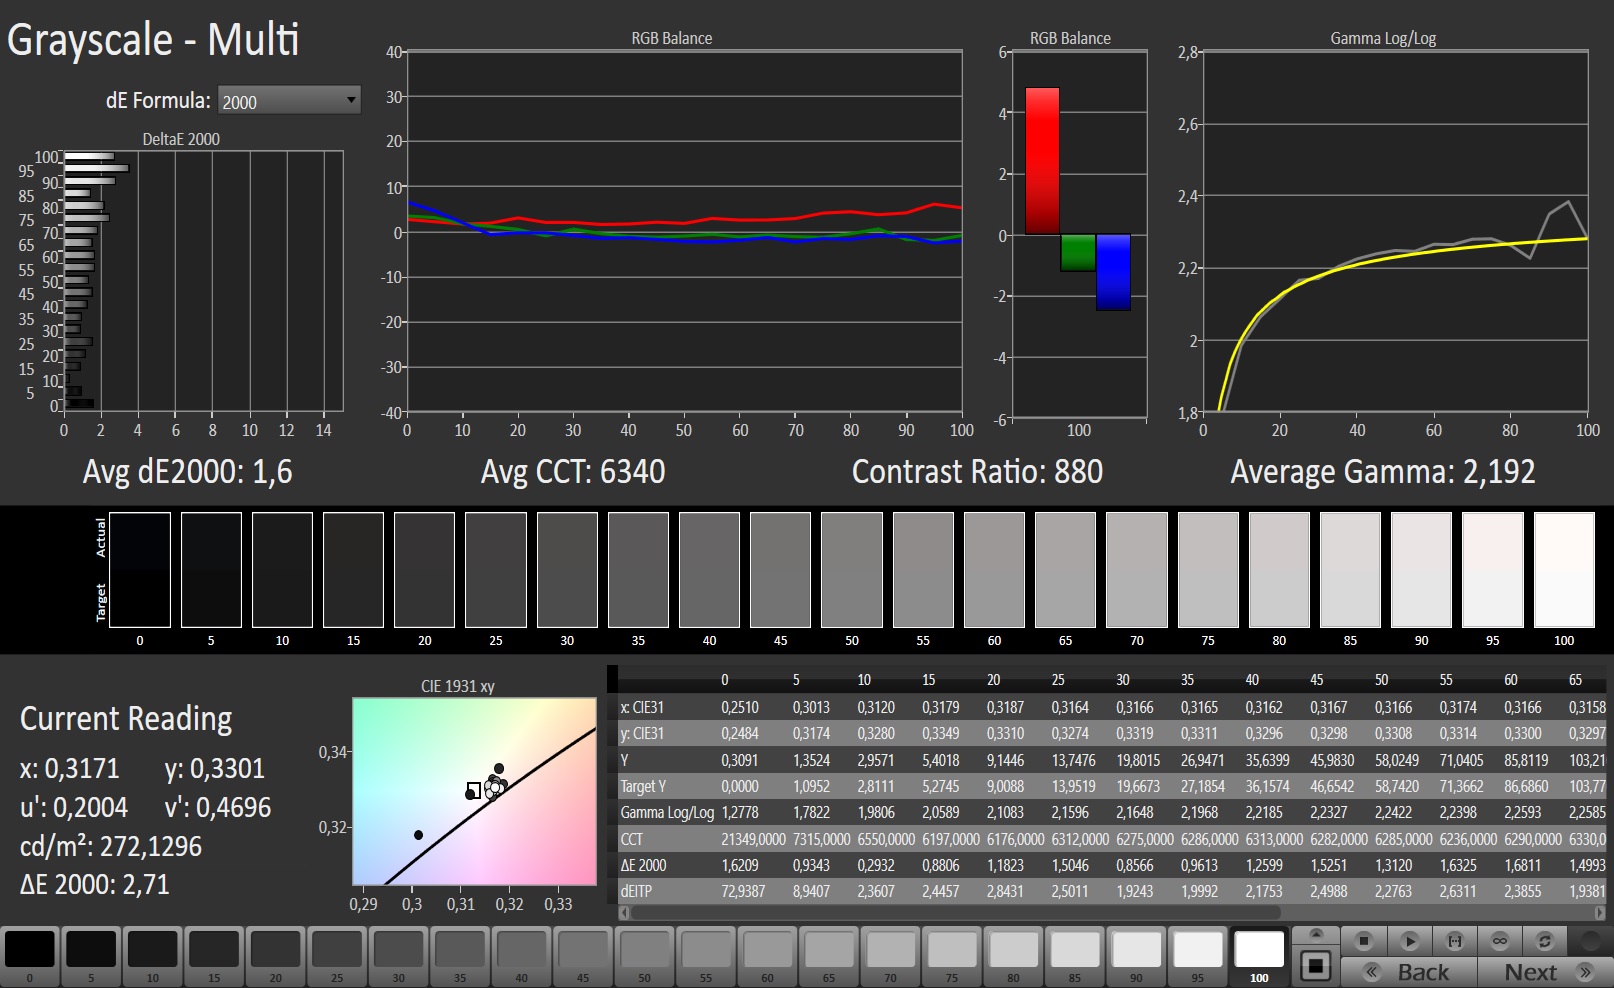
The matte 15.6-inch display has a native resolution of 1920x1080 pixels. The contrast (880:1) and brightness (248 cd/m²) are too low. A laptop in this price range should offer more. We consider values beyond 1000:1 and 300 cd/m², respectively, to be good. Moreover, the 240 Hz panel's response times are alright.
Unfortunately, the screen flickers at a frequency of 23,580 Hz at brightness levels of 24% and below. Due to the high frequency, even sensitive users shouldn't be troubled by headaches and/or eye problems.
| |||||||||||||||||||||||||
Brightness Distribution: 89 %
Center on Battery: 264 cd/m²
Contrast: 880:1 (Black: 0.3 cd/m²)
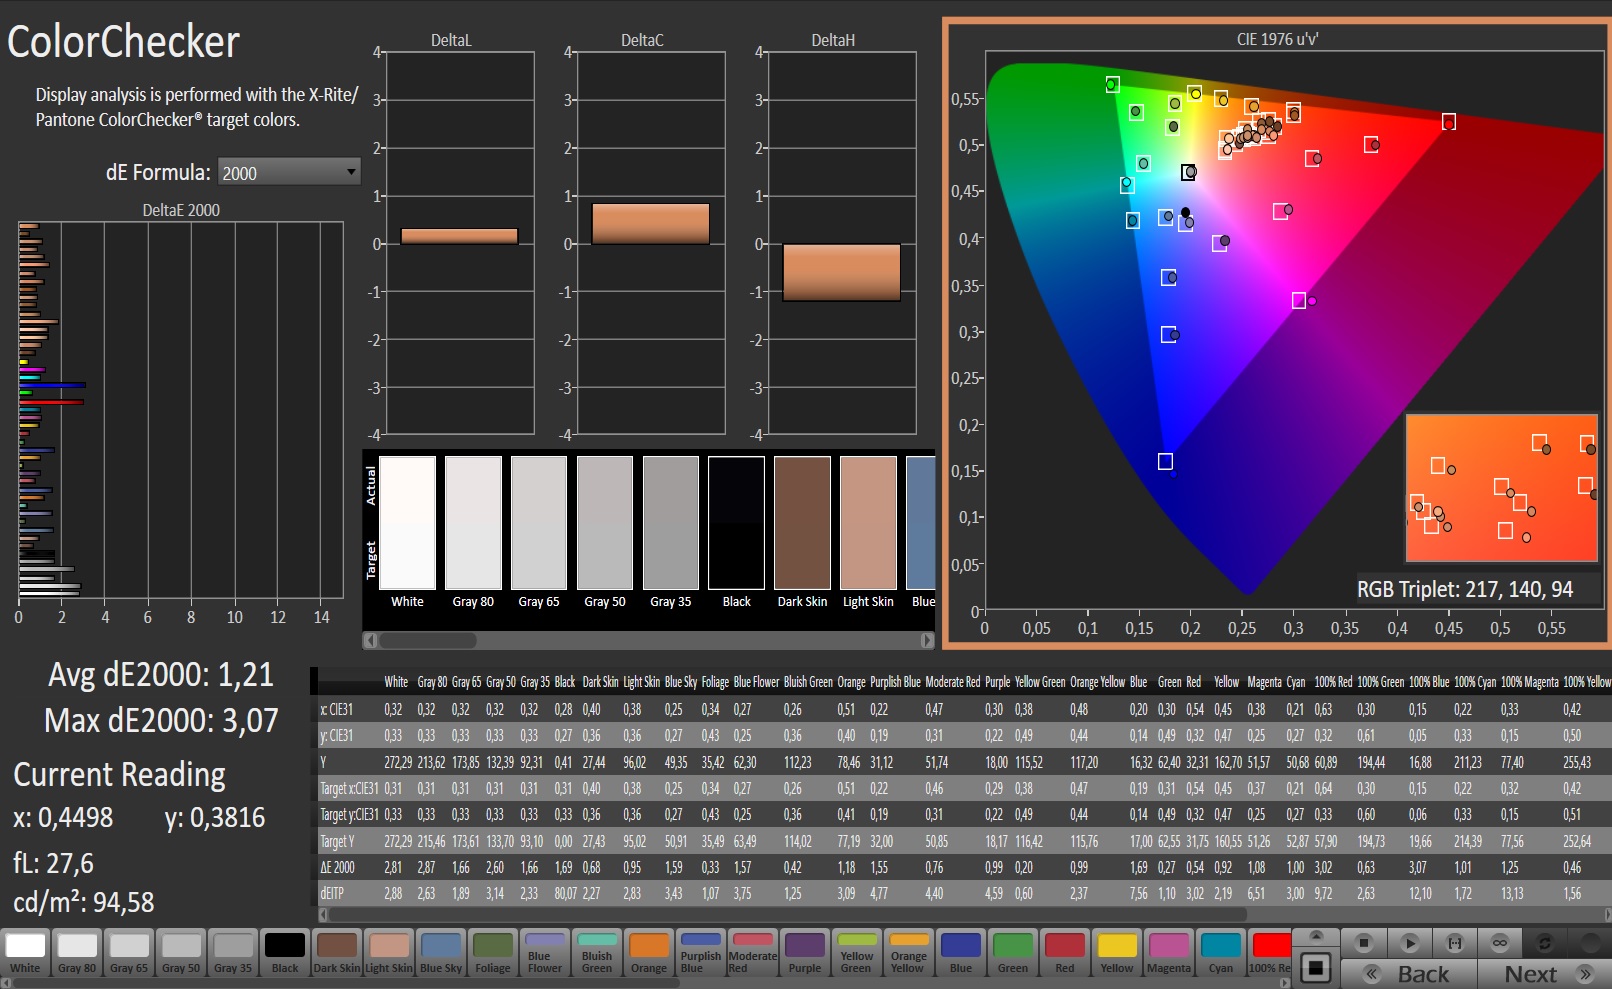
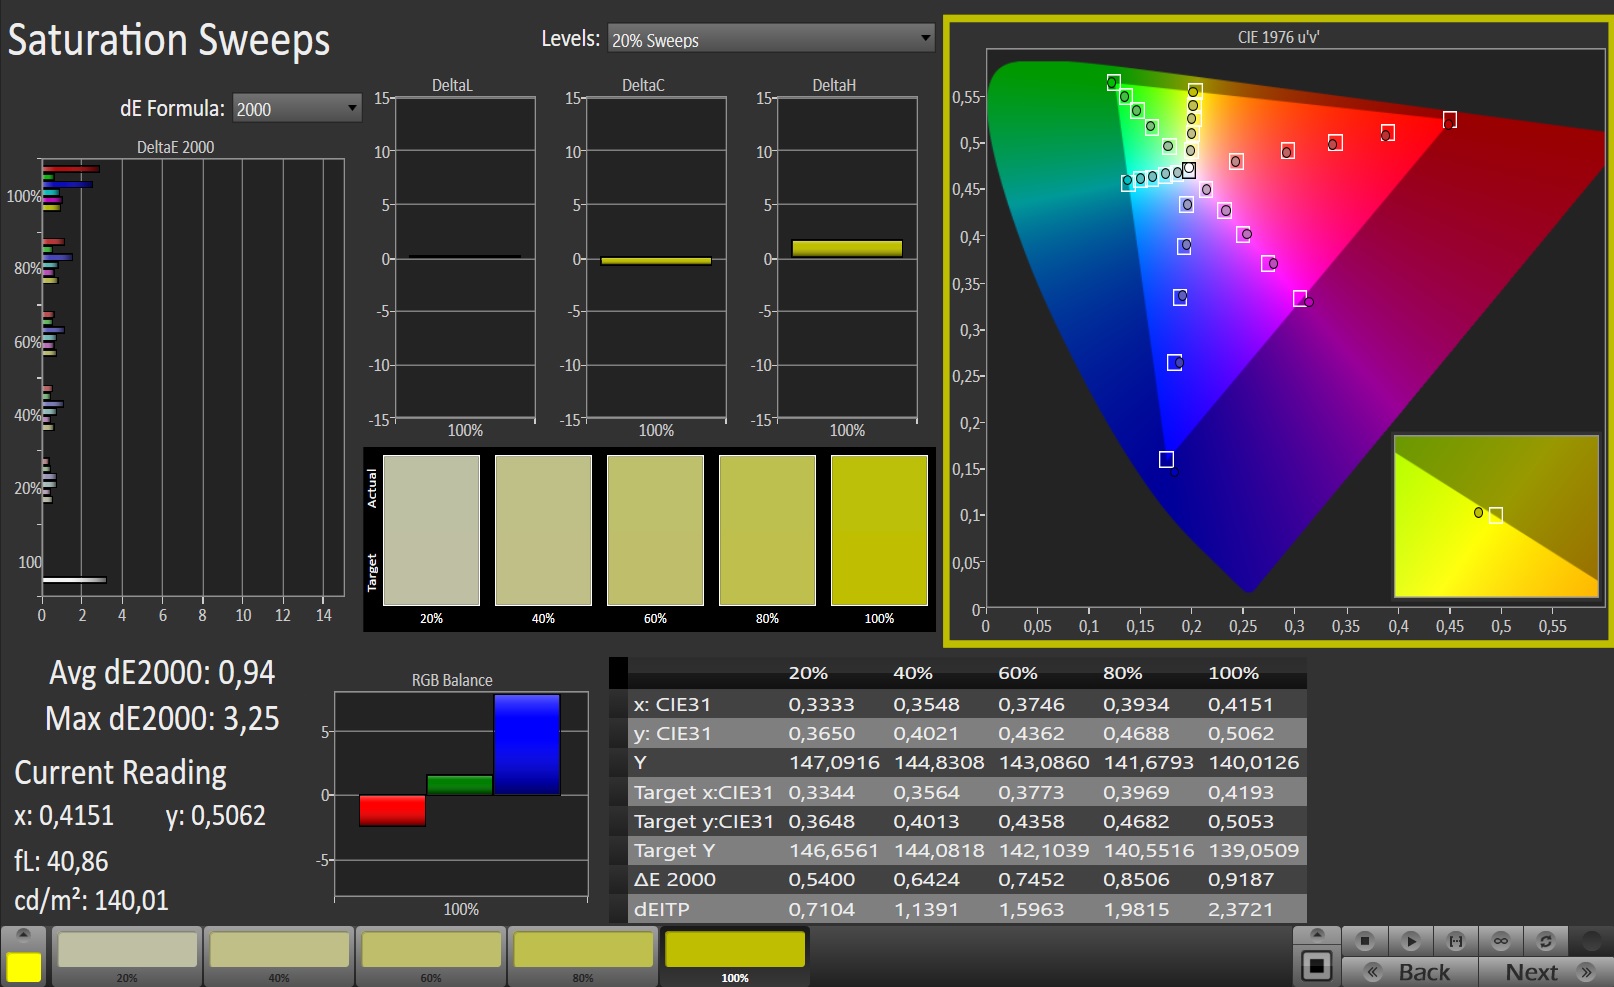
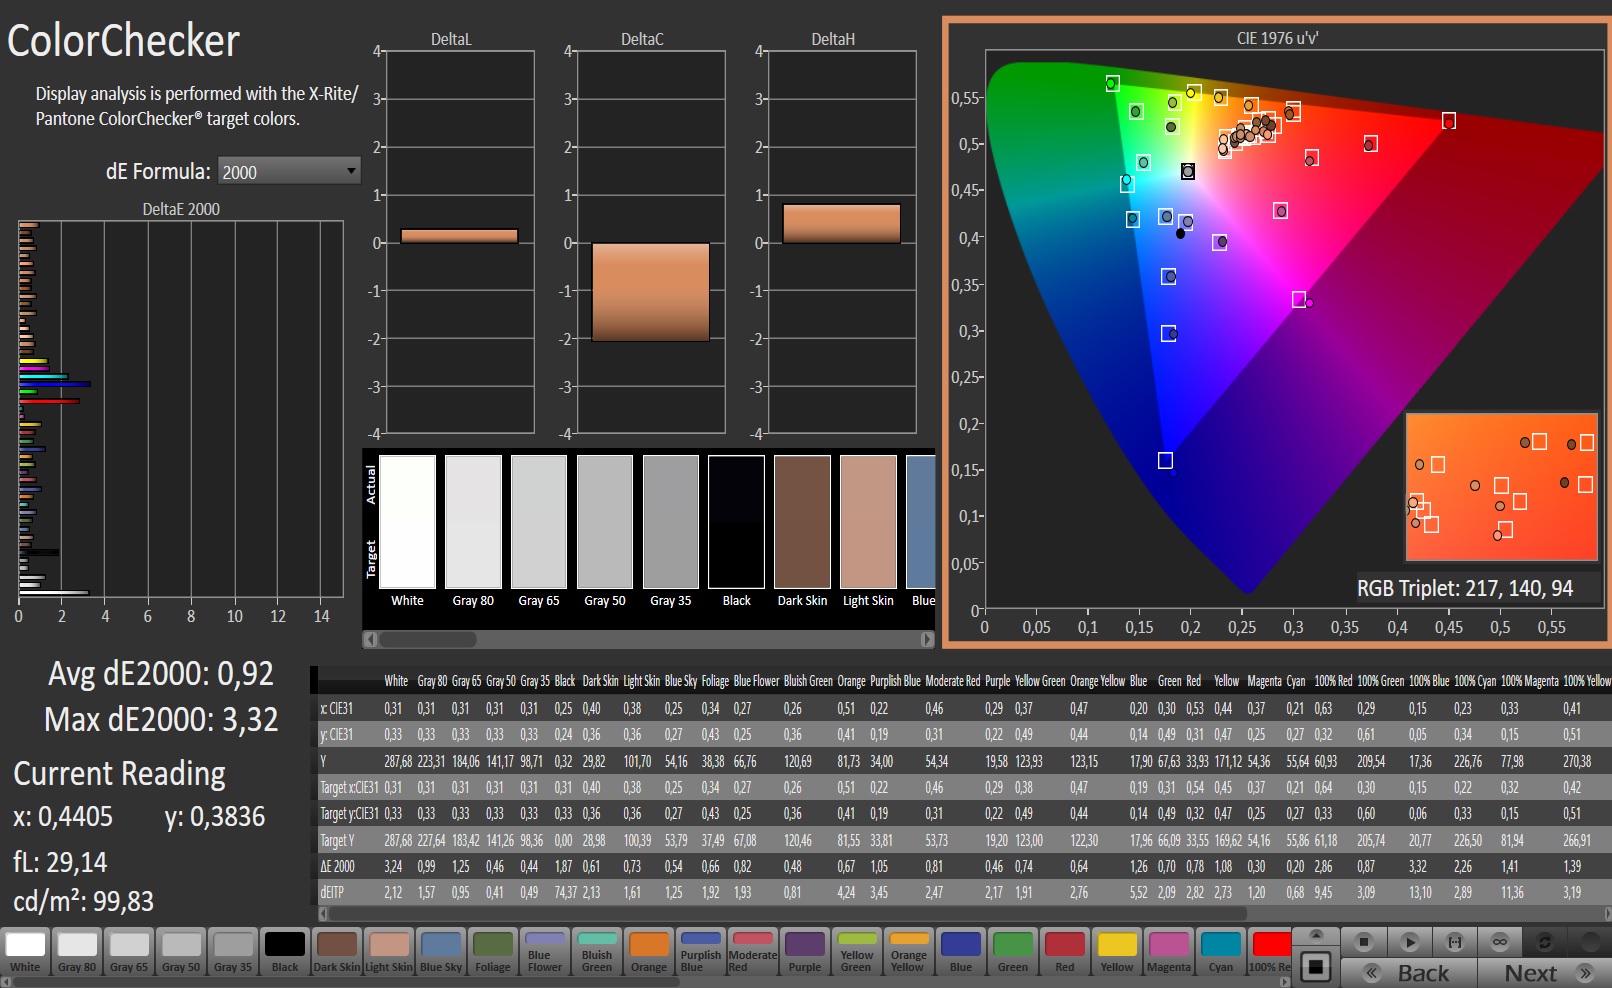
ΔE ColorChecker Calman: 1.21 | ∀{0.5-29.43 Ø4.71}
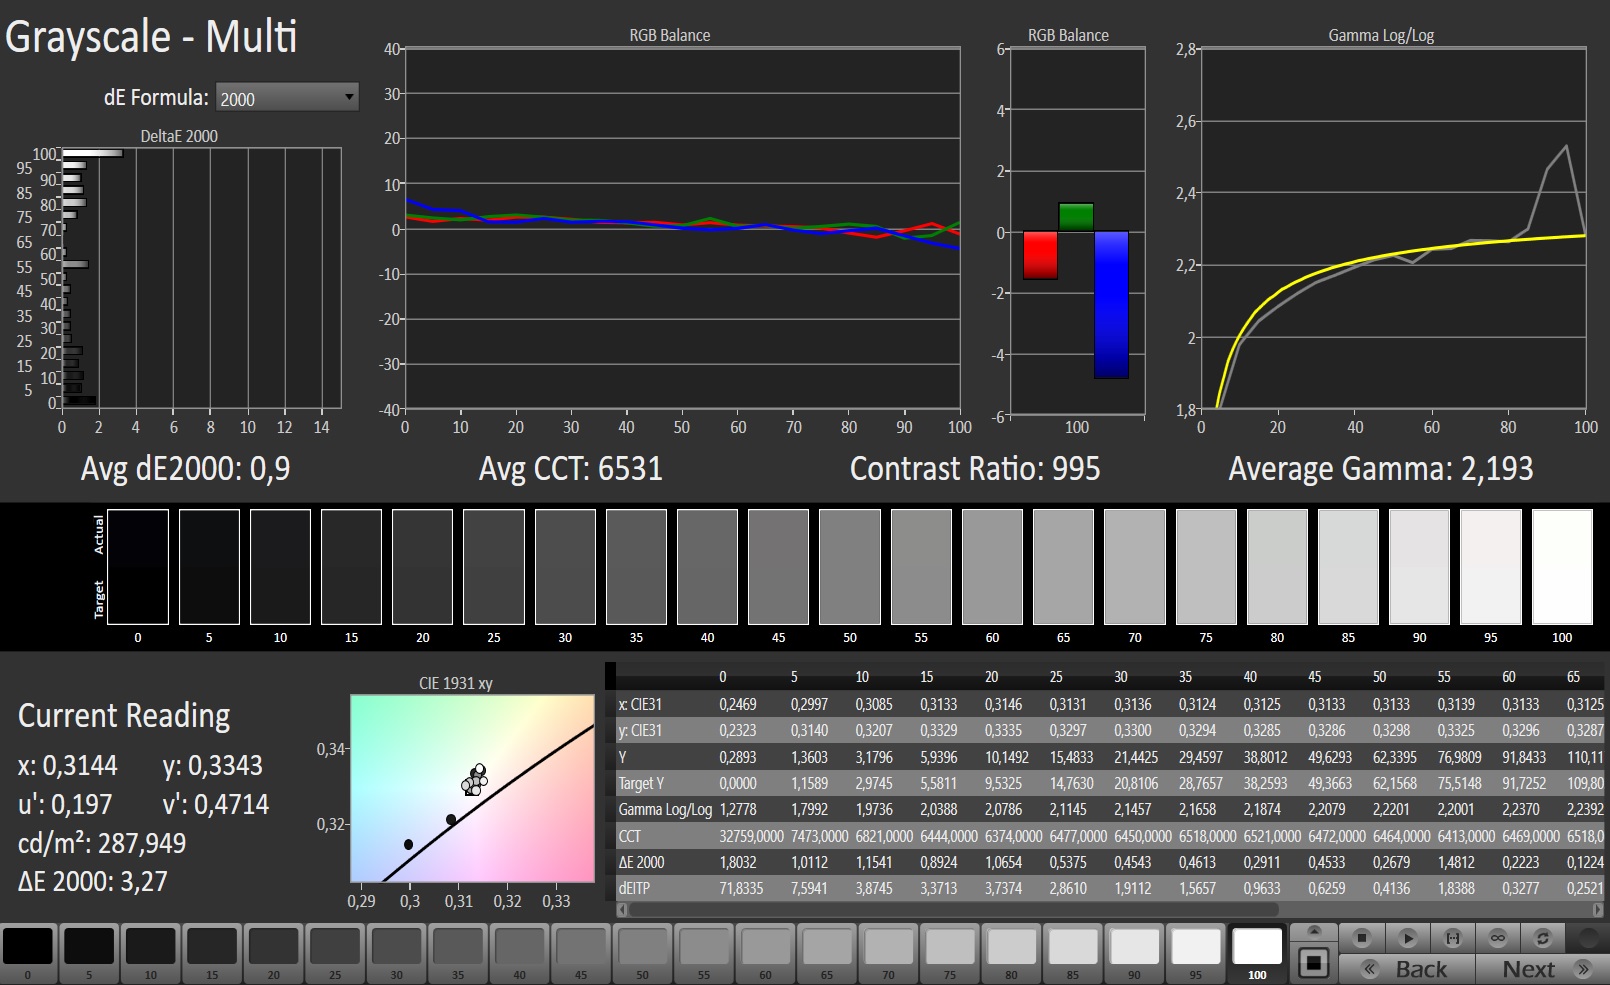
calibrated: 0.92
ΔE Greyscale Calman: 1.6 | ∀{0.09-98 Ø4.96}
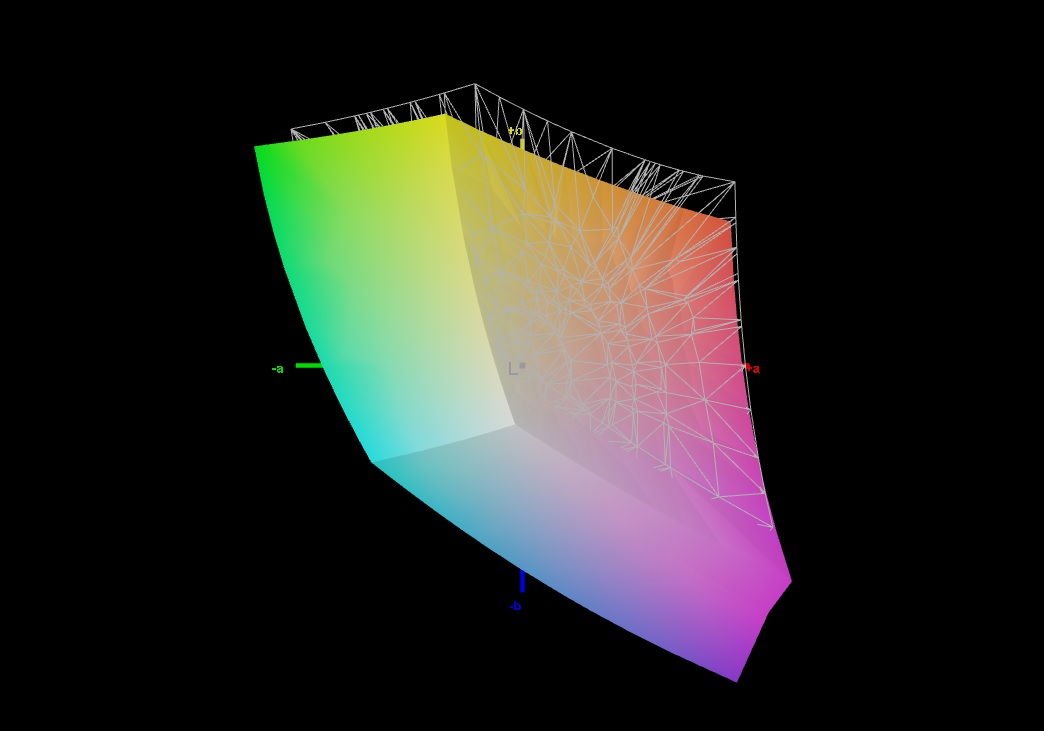
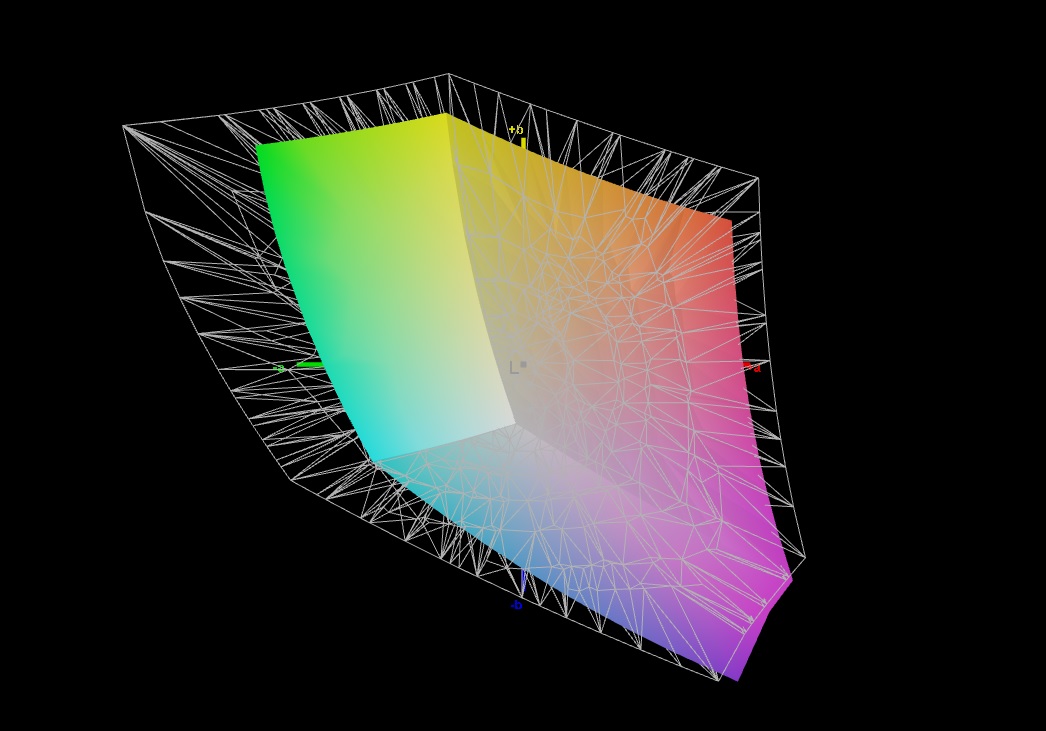
90% sRGB (Argyll 1.6.3 3D)
68% AdobeRGB 1998 (Argyll 1.6.3 3D)
68% AdobeRGB 1998 (Argyll 3D)
97.8% sRGB (Argyll 3D)
67.2% Display P3 (Argyll 3D)
Gamma: 2.192
CCT: 6340 K
| Aorus 15G XB Sharp LQ156M1JW03, IGZO, 1920x1080, 15.6" | Asus ROG Strix Scar 15 G532LWS AU Optronics B156HAN12.0, IPS, 1920x1080, 15.6" | Alienware m15 R3 P87F AU Optronics B156HAN, IPS, 1920x1080, 15.6" | Acer Predator Triton 500 PT515-52-70N3 AUO B156HAN12.0 (AUO7A8C), IPS, 1920x1080, 15.6" | Razer Blade 15 RZ09-0328 Samsung SDCA029, AMOLED, 3840x2160, 15.6" | Schenker XMG Neo 15 XNE15M19 NV156FHM-N4G (BOE084D), IPS, 1920x1080, 15.6" | |
|---|---|---|---|---|---|---|
| Display | 4% | 2% | 4% | 31% | -6% | |
| Display P3 Coverage (%) | 67.2 | 69.9 4% | 68.6 2% | 70.3 5% | 99.9 49% | 64 -5% |
| sRGB Coverage (%) | 97.8 | 99.6 2% | 98.9 1% | 99.5 2% | 100 2% | 90.3 -8% |
| AdobeRGB 1998 Coverage (%) | 68 | 71.4 5% | 69.8 3% | 72.2 6% | 97.4 43% | 65.4 -4% |
| Response Times | 14% | 40% | 9% | 80% | 17% | |
| Response Time Grey 50% / Grey 80% * (ms) | 16 ? | 14.4 ? 10% | 4 ? 75% | 14.4 ? 10% | 2.7 ? 83% | 9.6 ? 40% |
| Response Time Black / White * (ms) | 11.2 ? | 9.2 ? 18% | 10.8 ? 4% | 10.4 ? 7% | 2.6 ? 77% | 12 ? -7% |
| PWM Frequency (Hz) | 23580 ? | 59.5 ? | ||||
| Screen | -0% | -28% | -51% | -48% | -38% | |
| Brightness middle (cd/m²) | 264 | 307.2 16% | 326.7 24% | 320 21% | 366.7 39% | 313 19% |
| Brightness (cd/m²) | 248 | 301 21% | 316 27% | 318 28% | 371 50% | 295 19% |
| Brightness Distribution (%) | 89 | 91 2% | 87 -2% | 88 -1% | 91 2% | 89 0% |
| Black Level * (cd/m²) | 0.3 | 0.21 30% | 0.33 -10% | 0.24 20% | 0.3 -0% | |
| Contrast (:1) | 880 | 1463 66% | 990 13% | 1333 51% | 1043 19% | |
| Colorchecker dE 2000 * | 1.21 | 1.85 -53% | 2.4 -98% | 4.03 -233% | 5.21 -331% | 3.33 -175% |
| Colorchecker dE 2000 max. * | 3.07 | 3.92 -28% | 6.06 -97% | 8.43 -175% | 7.92 -158% | 6.25 -104% |
| Colorchecker dE 2000 calibrated * | 0.92 | 1.26 -37% | 1.51 -64% | 0.98 -7% | 1.77 -92% | |
| Greyscale dE 2000 * | 1.6 | 2 -25% | 3.2 -100% | 5.94 -271% | 2 -25% | 3.1 -94% |
| Gamma | 2.192 100% | 2.15 102% | 2.13 103% | 2.42 91% | 2.17 101% | 2.51 88% |
| CCT | 6340 103% | 6479 100% | 7129 91% | 6751 96% | 6514 100% | 6930 94% |
| Color Space (Percent of AdobeRGB 1998) (%) | 68 | 65 -4% | 63.7 -6% | 66 -3% | 86.6 27% | 59 -13% |
| Color Space (Percent of sRGB) (%) | 90 | 99.7 11% | 99.2 10% | 99 10% | 100 11% | 90 0% |
| Total Average (Program / Settings) | 6% /
2% | 5% /
-14% | -13% /
-33% | 21% /
-10% | -9% /
-25% |
* ... smaller is better
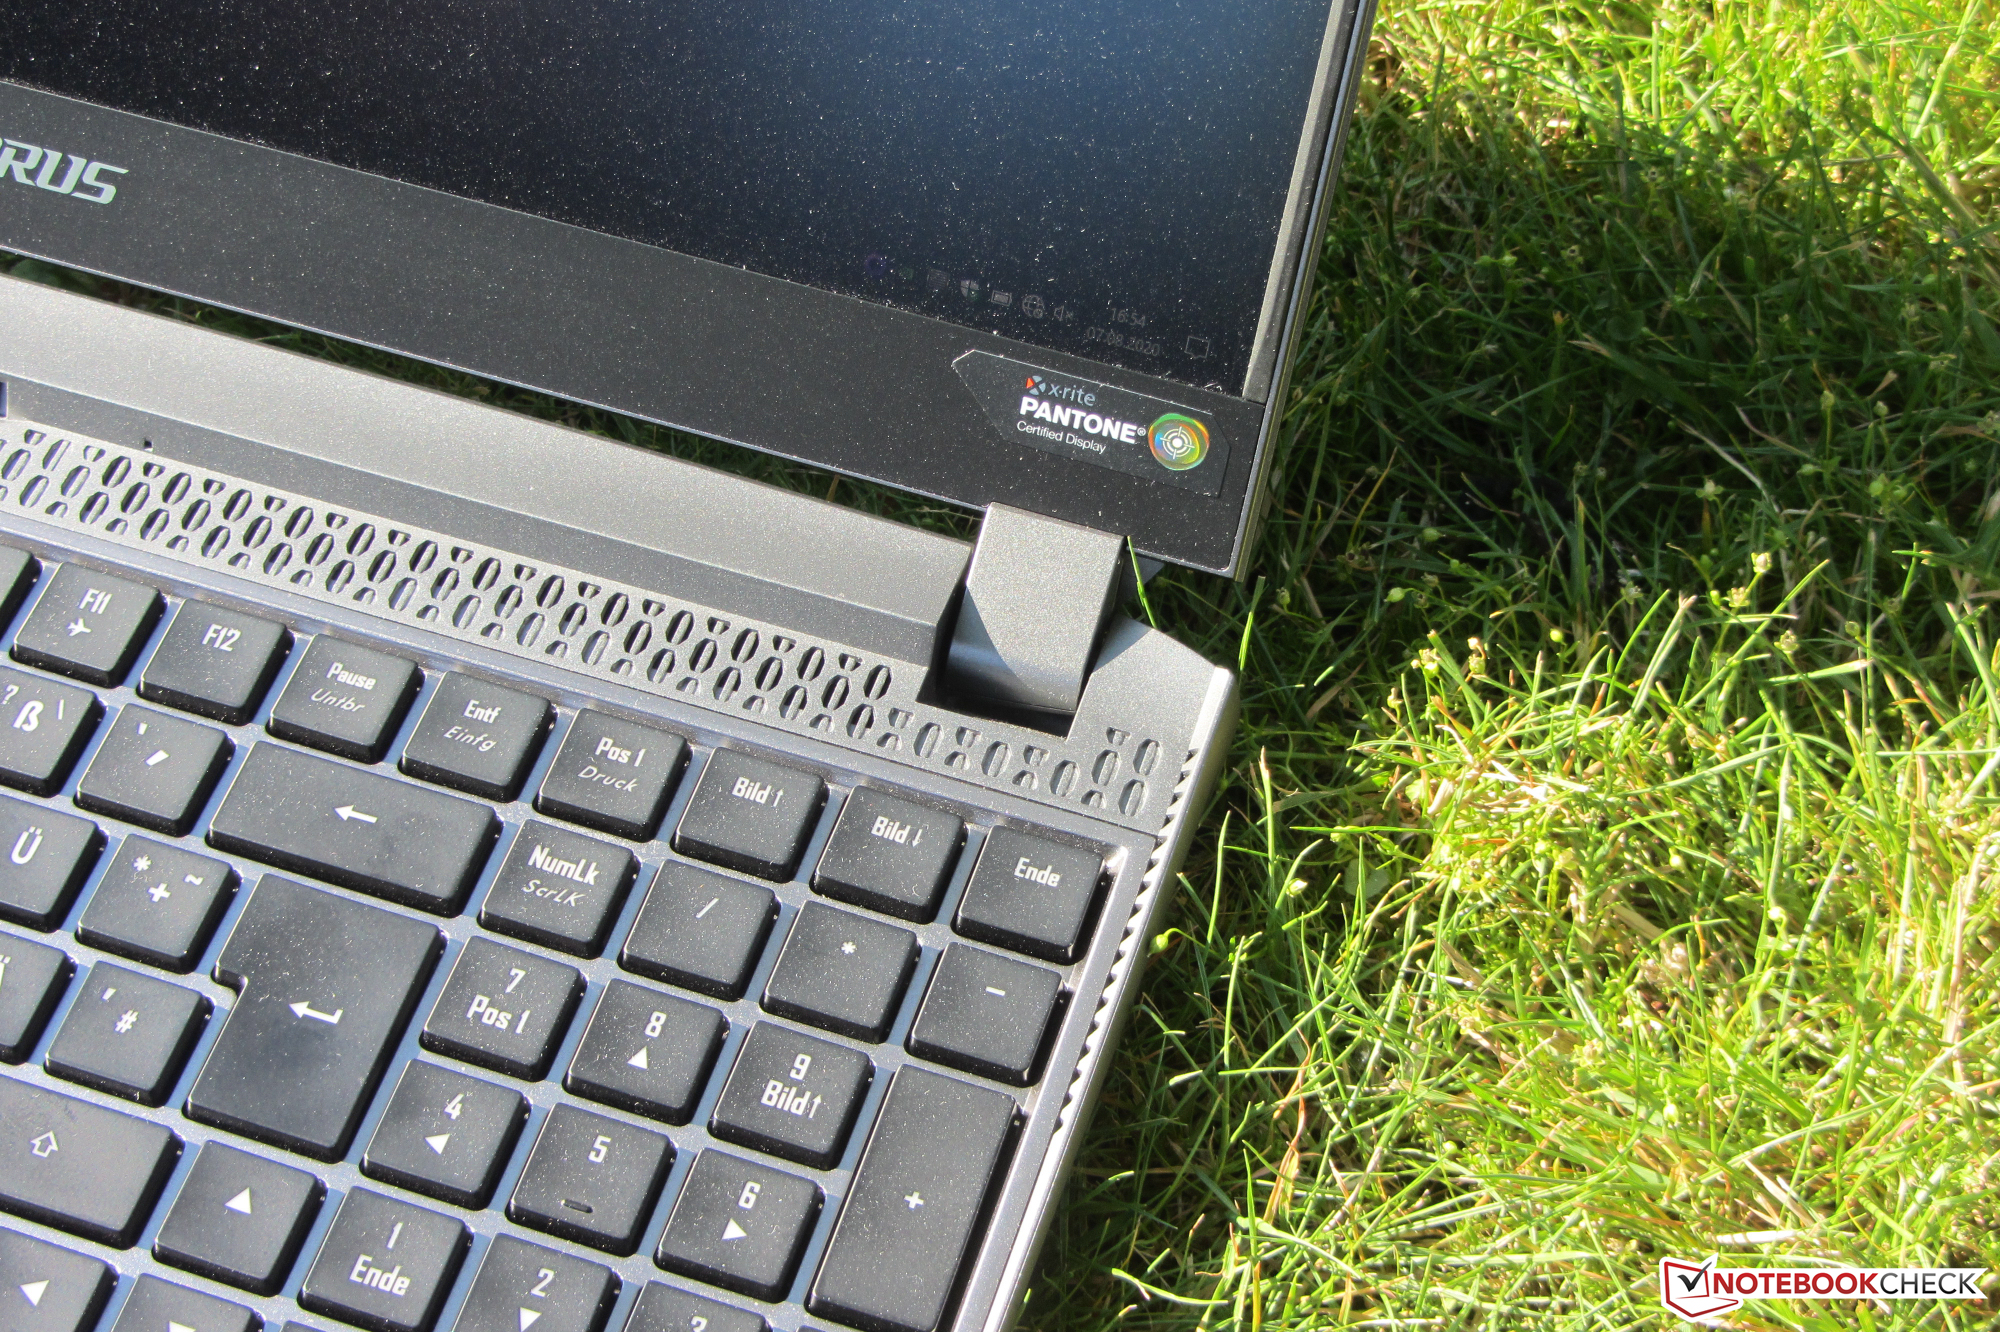
The display features an X-Rite Pantone certification that ensures a very natural color reproduction. Out of the box, the display already meets the target (Delta E less than 3) with a Delta E 2000 color deviation of 1.21. In addition, it doesn't suffer from a blue tint. Improvements can still be achieved by means of calibration. For example, the color deviation drops to 0.92, and the grayscales are displayed in a more balanced way. The AdobeRGB (68%) and sRGB (90%) color spaces aren't fully mapped.

Display Response Times
| ↔ Response Time Black to White | ||
|---|---|---|
| 11.2 ms ... rise ↗ and fall ↘ combined | ↗ 6.8 ms rise | 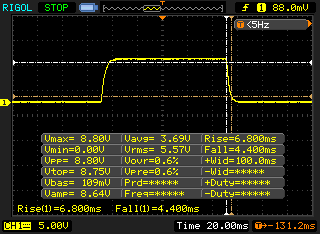 |
| ↘ 4.4 ms fall | ||
| The screen shows good response rates in our tests, but may be too slow for competitive gamers. In comparison, all tested devices range from 0.1 (minimum) to 240 (maximum) ms. » 30 % of all devices are better. This means that the measured response time is better than the average of all tested devices (19.8 ms). | ||
| ↔ Response Time 50% Grey to 80% Grey | ||
| 16 ms ... rise ↗ and fall ↘ combined | ↗ 8.4 ms rise | 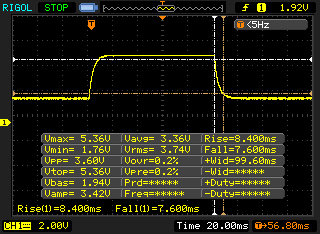 |
| ↘ 7.6 ms fall | ||
| The screen shows good response rates in our tests, but may be too slow for competitive gamers. In comparison, all tested devices range from 0.165 (minimum) to 636 (maximum) ms. » 30 % of all devices are better. This means that the measured response time is better than the average of all tested devices (31 ms). | ||
Screen Flickering / PWM (Pulse-Width Modulation)
| Screen flickering / PWM detected | 23580 Hz | ≤ 24 % brightness setting | 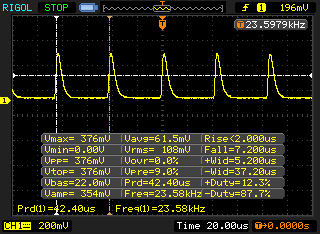 |
The display backlight flickers at 23580 Hz (worst case, e.g., utilizing PWM) Flickering detected at a brightness setting of 24 % and below. There should be no flickering or PWM above this brightness setting. The frequency of 23580 Hz is quite high, so most users sensitive to PWM should not notice any flickering. In comparison: 52 % of all tested devices do not use PWM to dim the display. If PWM was detected, an average of 7754 (minimum: 5 - maximum: 343500) Hz was measured. | |||
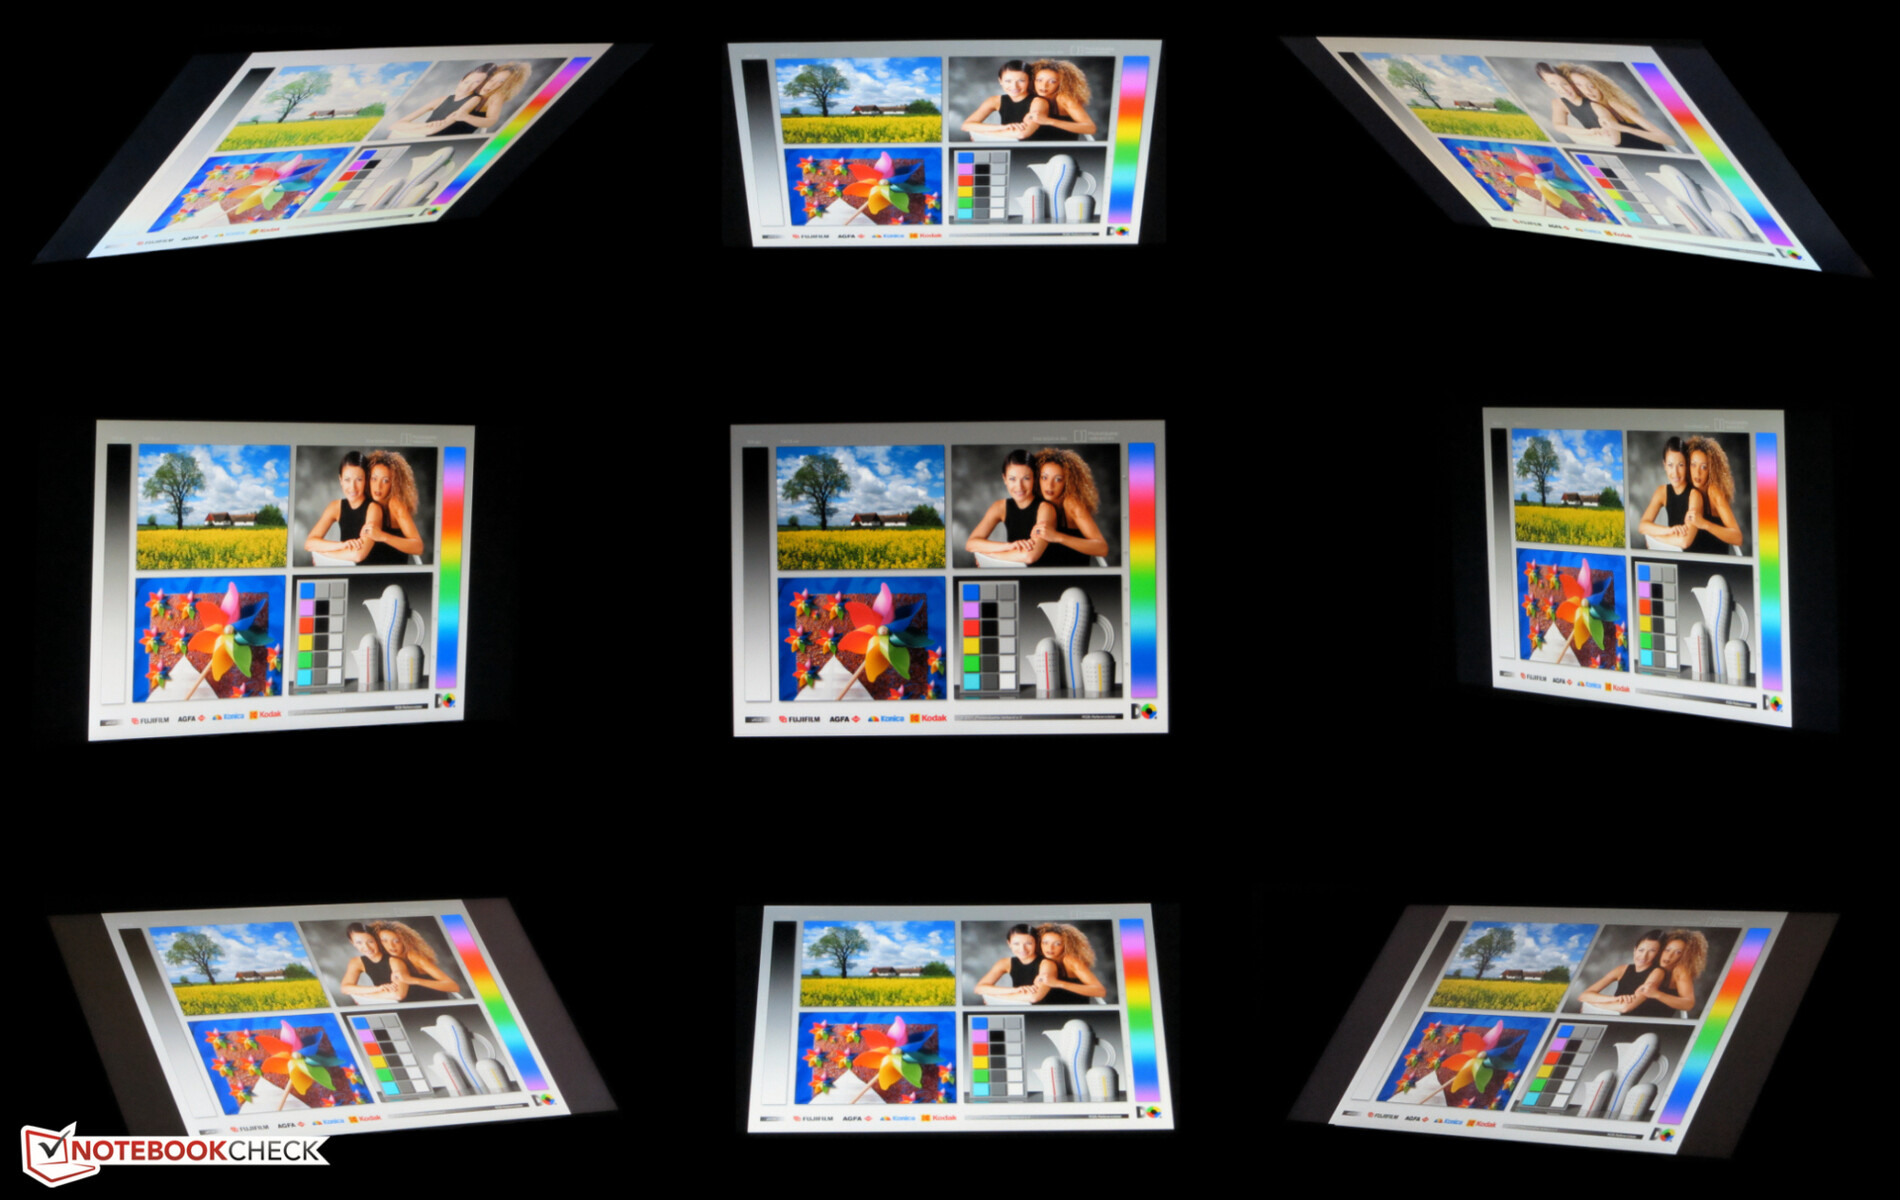
Gigabyte equips the Aorus 15 with a viewing-angle-stable IPS panel. Consequently, the screen can be read from any position. The laptop isn't really intended for outdoor use. Reading the display outdoors is only possible when the sun isn't too bright.
Performance - Core i7 with good performance development
With the Aorus 15G XB, Gigabyte has a 15.6-inch gaming laptop in its range that brings every modern game smoothly onto the screen. Our test device will set you back about 2,300 Euros (~$2,712). Other configuration variants are available as well.


Test conditions
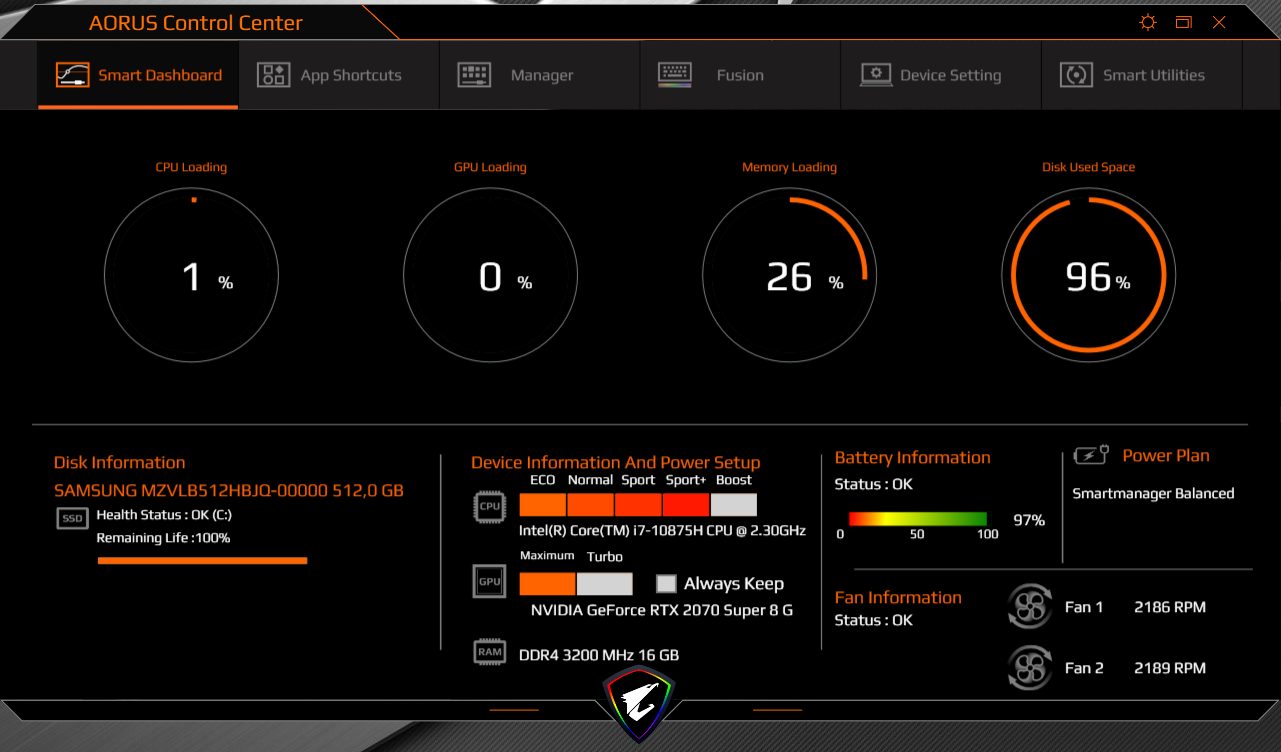
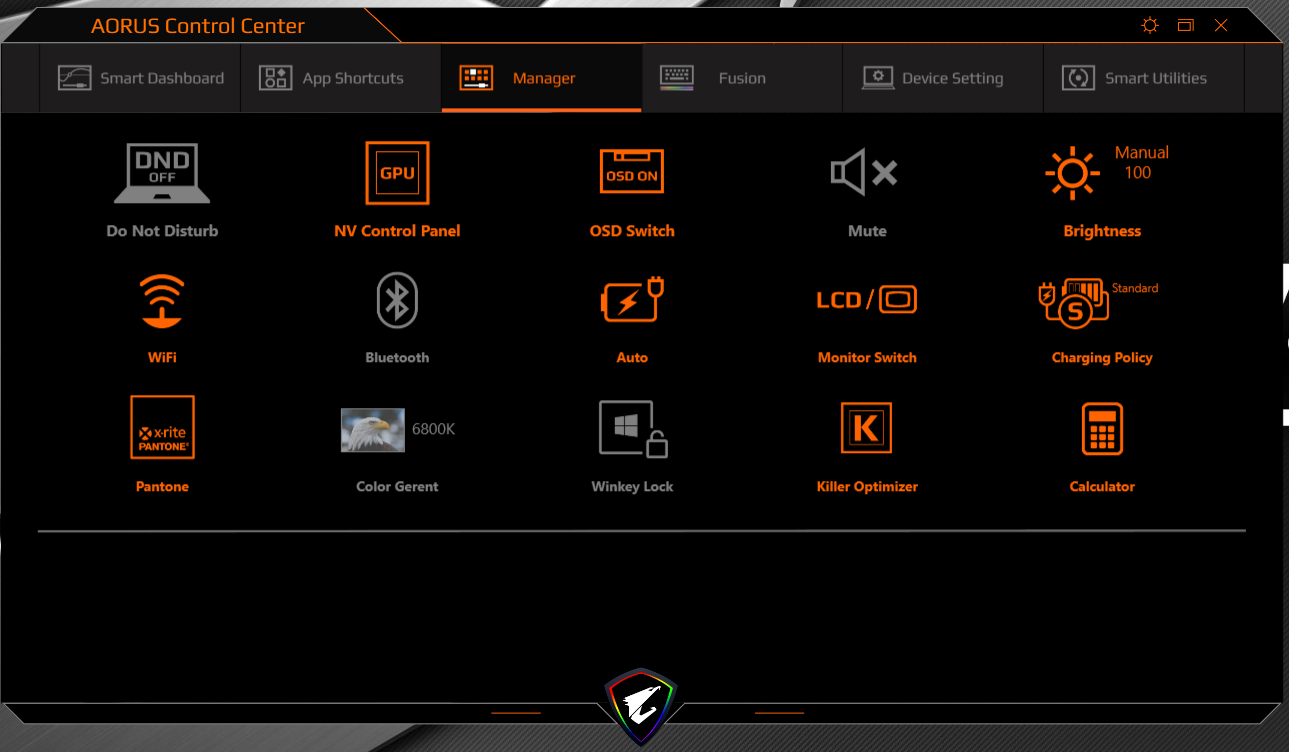
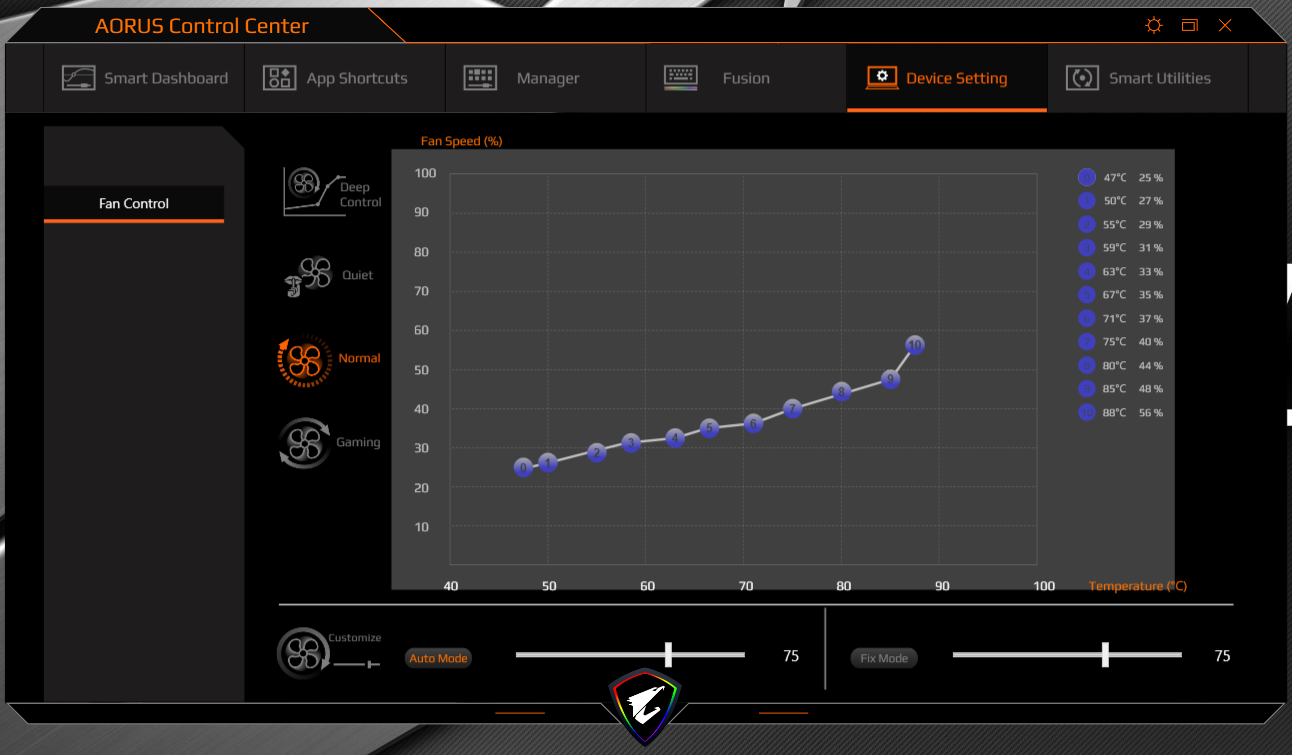
The preinstalled Aorus Control Center software offers, among other things, the possibility to set an energy profile. We use the "Auto" option (with enabled AI function) here. The Control Center then selects the appropriate settings itself. We use Windows' own energy profiles only for our runtime tests.
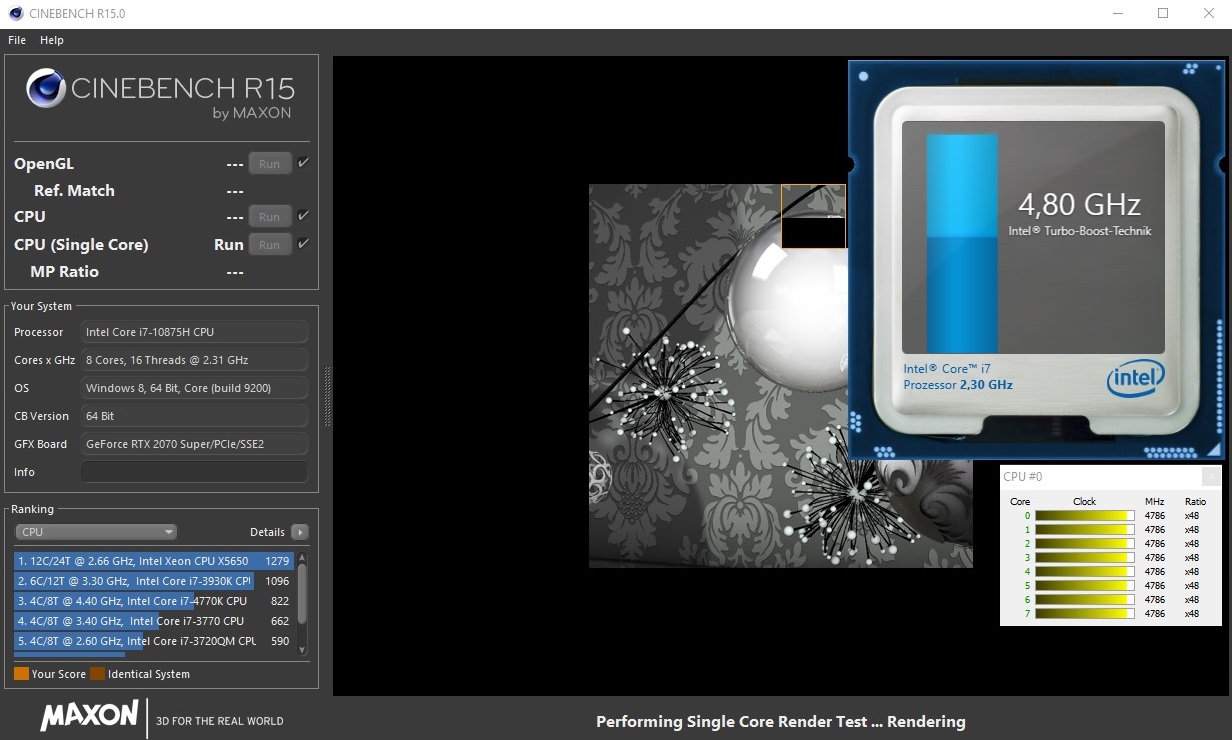
Processor
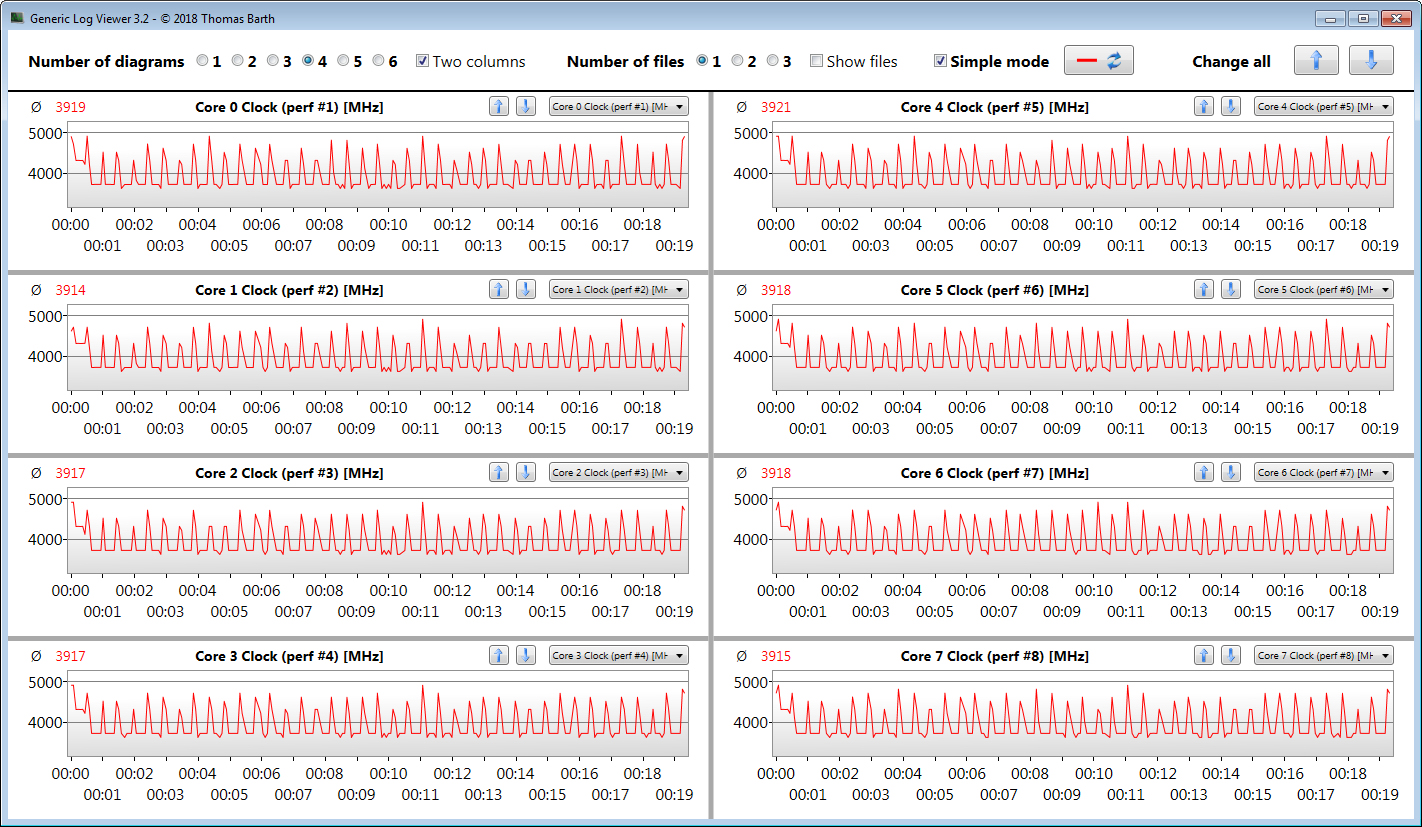
The built-in Core i7-10875H octa-core processor is from Intel's Comet Lake generation. The CPU runs at a base speed of 2.3 GHz. In addition, the clock rate can be increased to 4.3 GHz (eight cores) or 5.1 GHz (one core) via Turbo. Hyper-Threading (two threads per core) is supported.
The processor works through the Cinebench R15 benchmark's multithread test at 4.2 to 4.3 GHz for a few seconds. The clock rate then drops to 3.4 to 3.6 GHz. The single-thread test is run at 4.5 to 4.9 GHz. Furthermore, the speed is 1.8 GHz for both multithread and single-thread usage on battery power.
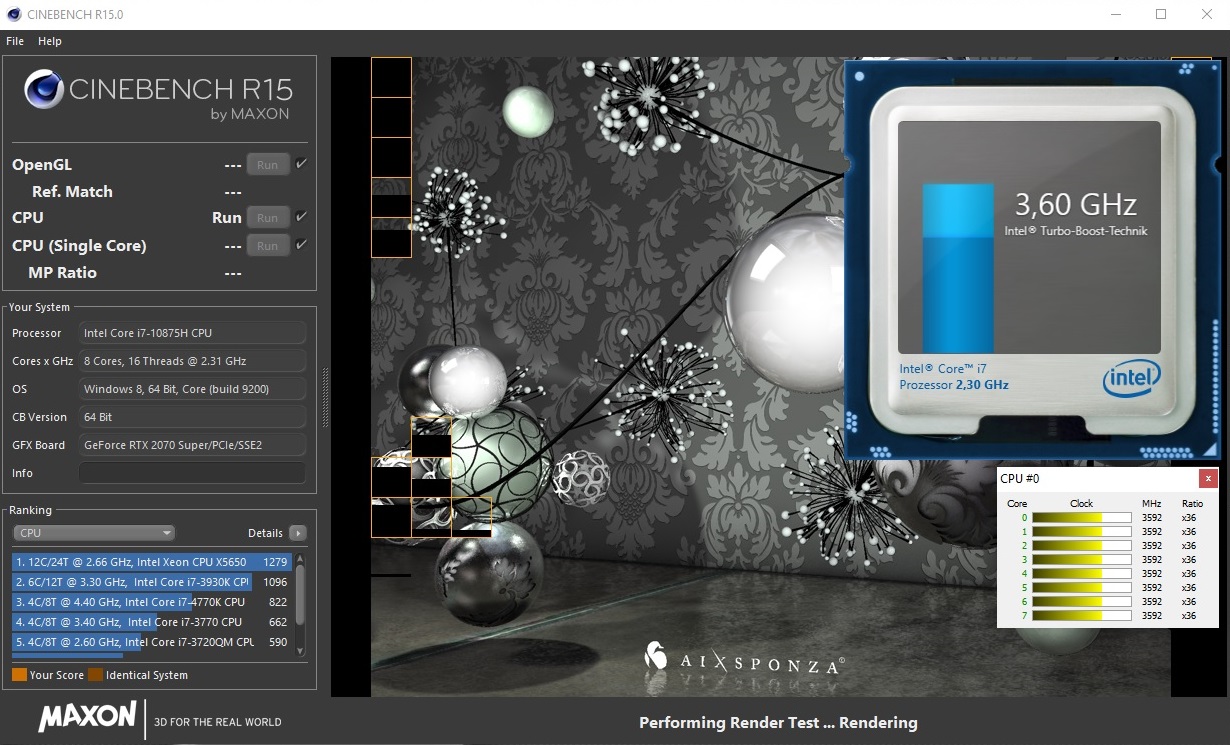
We verify if the CPU Turbo is also consistently used when plugged in by running the Cinebench R15 benchmark's multithread test in a continuous loop for at least 30 minutes. The results drop from the first to the third run and then remain at a constant level. Turbo is used to quite a large extent.
| R Benchmark 2.5 - Overall mean | |
| Alienware m15 R3 P87F | |
| Acer Predator Triton 500 PT515-52-70N3 | |
| Aorus 15G XB | |
| Asus ROG Strix Scar 15 G532LWS | |
| Average of class Gaming (0.3439 - 0.759, n=106, last 2 years) | |
* ... smaller is better
System performance
The system works well and smoothly, and we didn't encounter any problems. The laptop has enough computing power for all common application areas. In theory, gaming, video-editing, and image-editing don't pose any great challenge for the device.
| PCMark 8 Home Score Accelerated v2 | 4719 points | |
| PCMark 8 Creative Score Accelerated v2 | 4518 points | |
| PCMark 8 Work Score Accelerated v2 | 6081 points | |
| PCMark 10 Score | 5393 points | |
Help | ||
| PCMark 8 | |
| Home Score Accelerated v2 | |
| Alienware m15 R3 P87F | |
| Average of class Gaming (n=1last 2 years) | |
| Asus ROG Strix Scar 15 G532LWS | |
| Aorus 15G XB | |
| Razer Blade 15 RZ09-0328 | |
| Work Score Accelerated v2 | |
| Asus ROG Strix Scar 15 G532LWS | |
| Alienware m15 R3 P87F | |
| Aorus 15G XB | |
| Razer Blade 15 RZ09-0328 | |
| Average of class Gaming (n=1last 2 years) | |
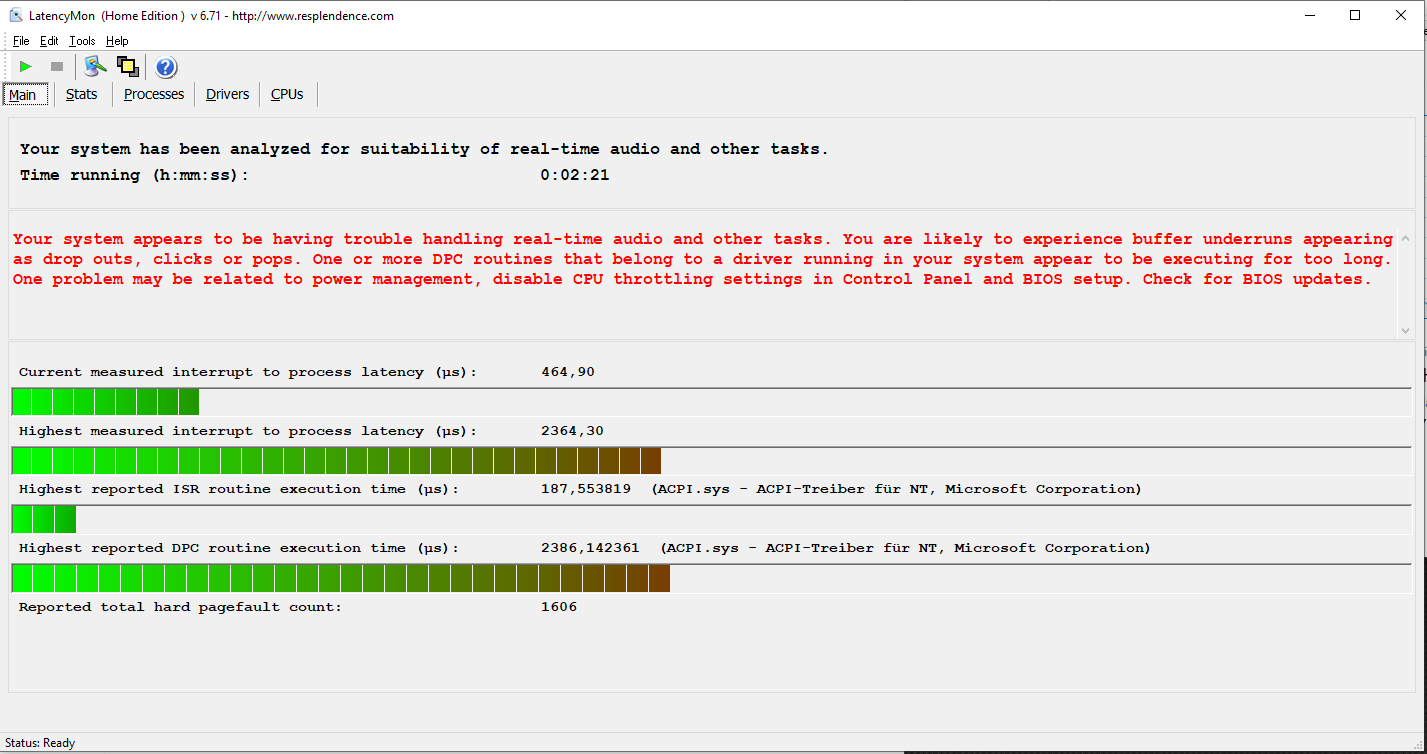
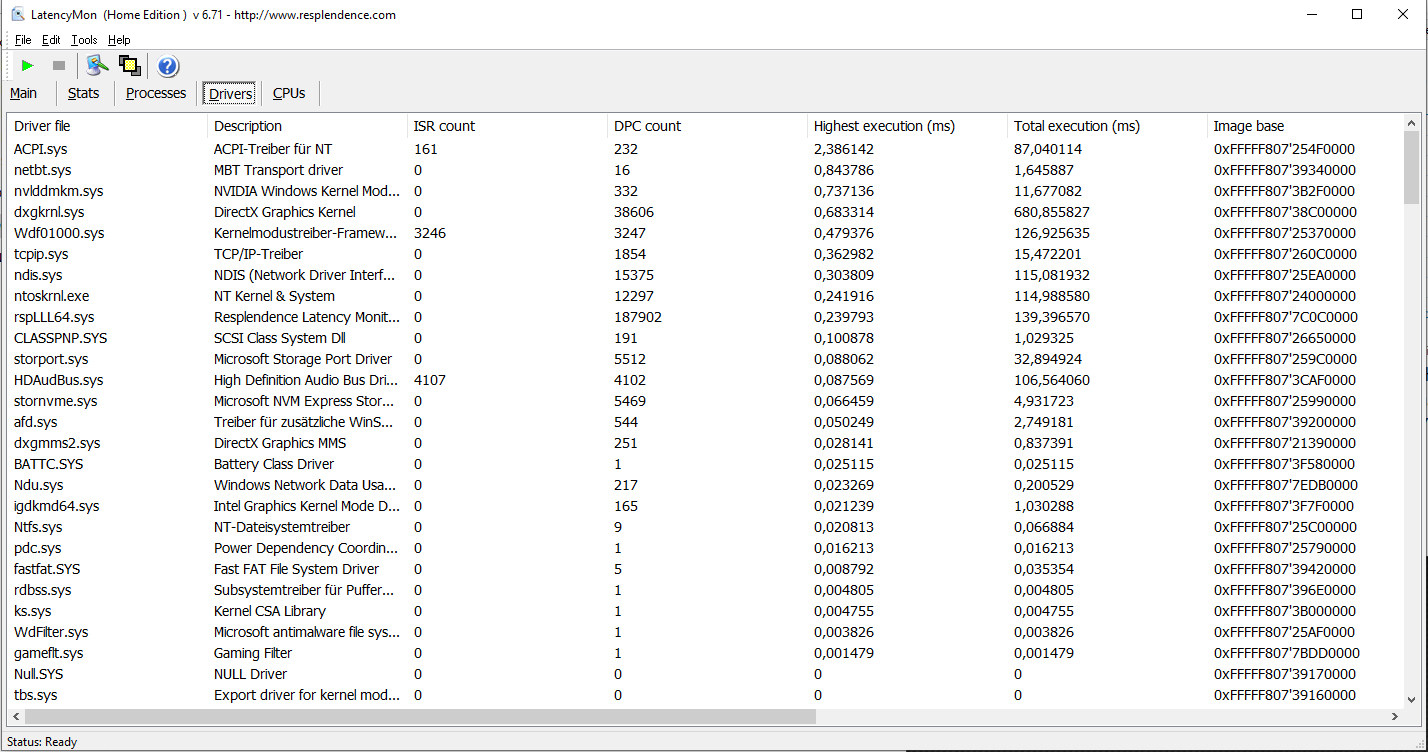
DPC latencies
In our standardized latency monitor test (web surfing, 4K video playback, high-load Prime95), we could observe issues with the DPC latencies. The system doesn't seem to be suitable for real-time video and audio-editing.
| DPC Latencies / LatencyMon - interrupt to process latency (max), Web, Youtube, Prime95 | |
| Acer Predator Triton 500 PT515-52-70N3 | |
| Aorus 15G XB | |
| Asus ROG Strix Scar 15 G532LWS | |
| Alienware m15 R3 P87F | |
| Razer Blade 15 RZ09-0328 | |
* ... smaller is better
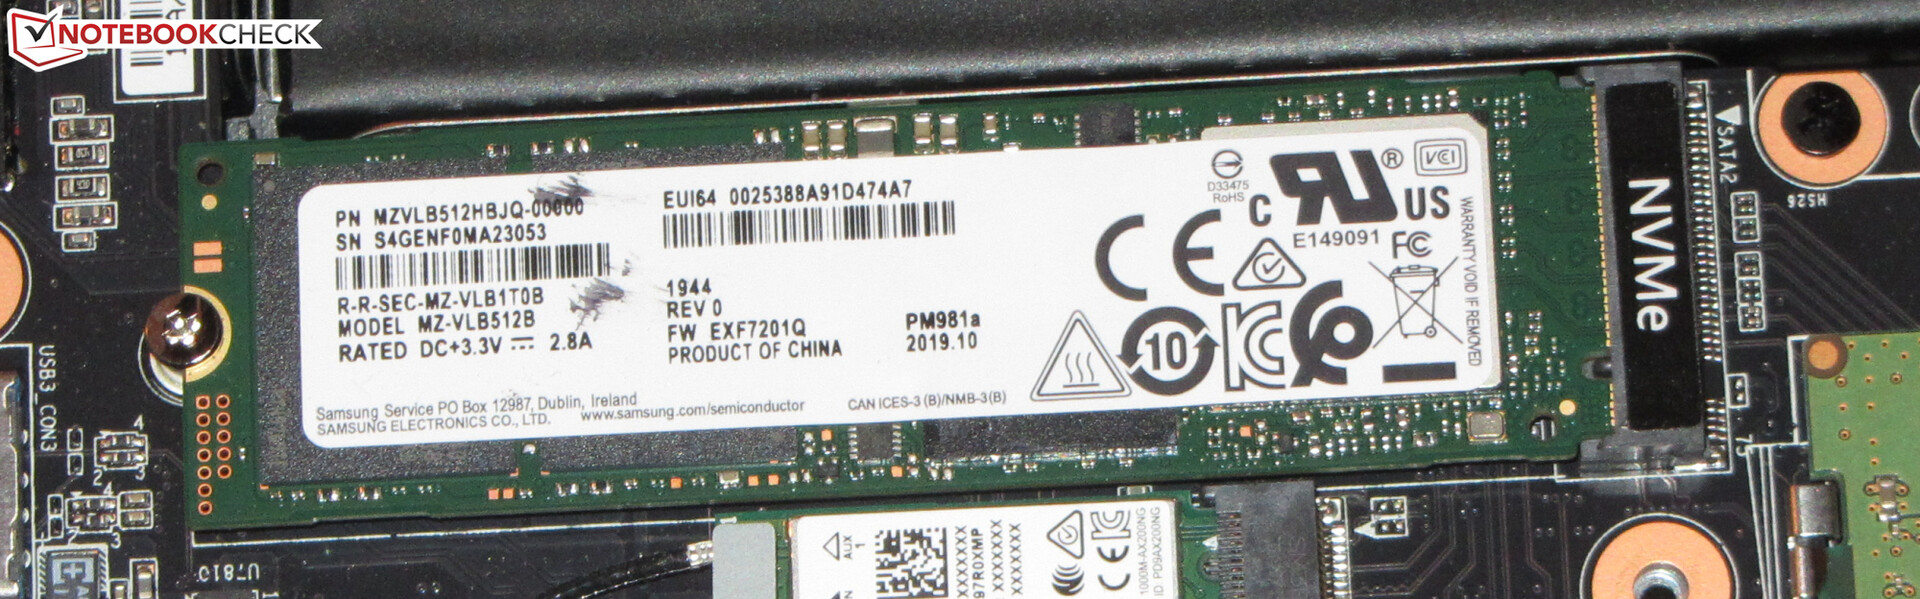
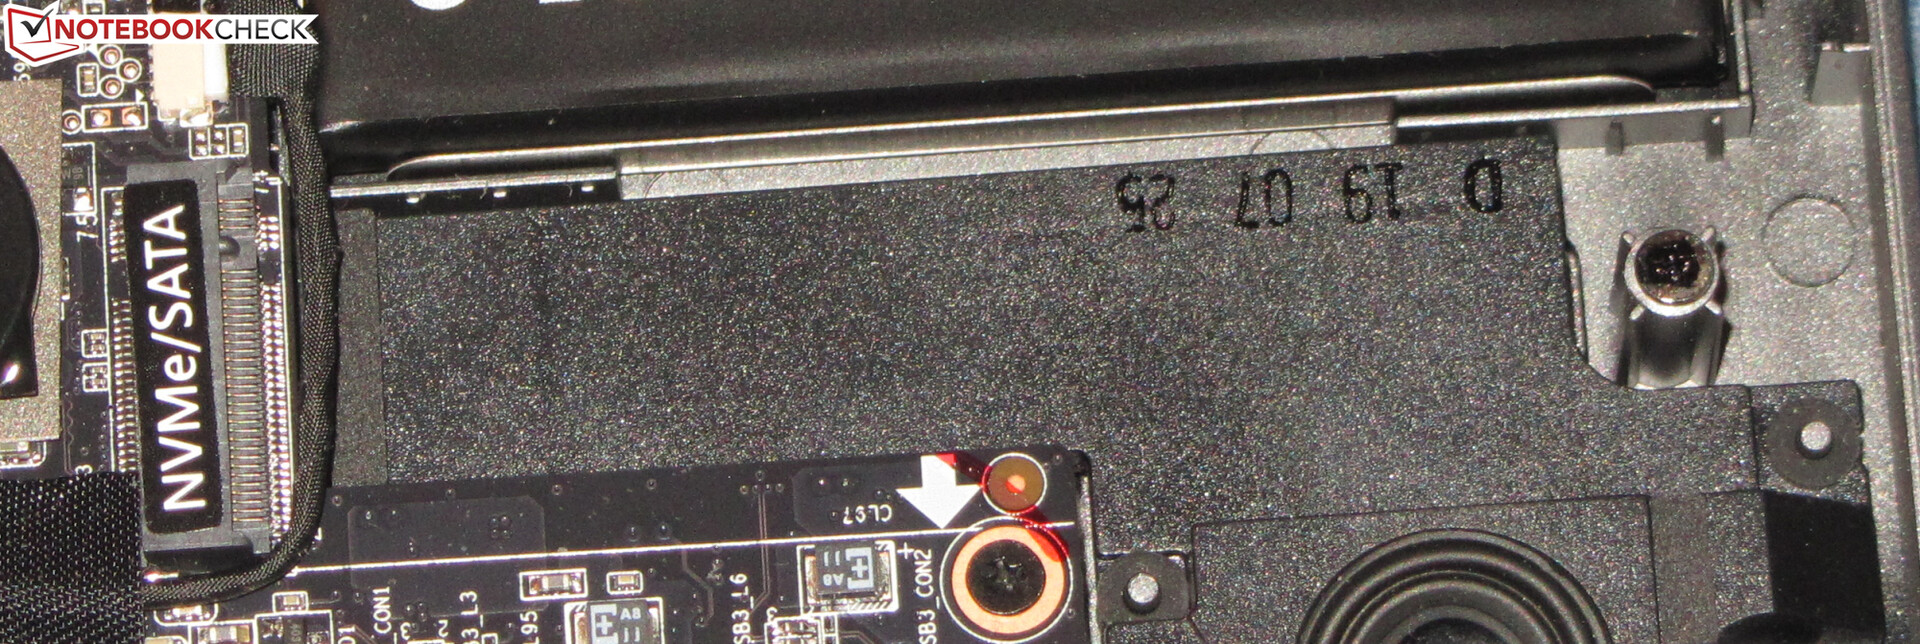
Storage
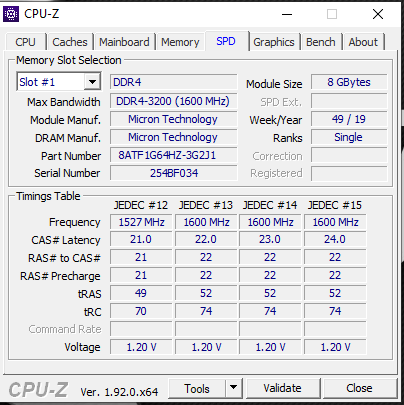
The system drive is an NVMe SSD (M.2 2280) from Samsung that offers 512 GB of storage space. The transfer speeds are very good. Moreover, the laptop still has room for a second M.2 2280 SSD. This can be either an NVMe or a SATA model.

| Aorus 15G XB Samsung SSD PM981a MZVLB512HBJQ | Asus ROG Strix Scar 15 G532LWS 2x Intel SSD 660p 1TB SSDPEKNW010T8 (RAID 0) | Alienware m15 R3 P87F 2x Micron 2200S 512 GB (RAID 0) | Acer Predator Triton 500 PT515-52-70N3 Samsung SSD PM981a MZVLB512HBJQ | Razer Blade 15 RZ09-0328 Lite-On CA5-8D512 | Schenker XMG Neo 15 XNE15M19 Seagate FireCuda 510 SSD ZP1000GM30001 | |
|---|---|---|---|---|---|---|
| CrystalDiskMark 5.2 / 6 | 4% | -3% | 9% | 6% | -14% | |
| Write 4K (MB/s) | 121.6 | 128.4 6% | 67.3 -45% | 131.7 8% | 118.7 -2% | 108.7 -11% |
| Read 4K (MB/s) | 44.37 | 53.7 21% | 41.47 -7% | 47.34 7% | 52.4 18% | 41.4 -7% |
| Write Seq (MB/s) | 2617 | 1875 -28% | 2239 -14% | 2884 10% | 2247 -14% | 1083 -59% |
| Read Seq (MB/s) | 1297 | 2315 78% | 2112 63% | 2303 78% | 2234 72% | 917 -29% |
| Write 4K Q32T1 (MB/s) | 499 | 427.2 -14% | 488.9 -2% | 423.9 -15% | 515 3% | 468.5 -6% |
| Read 4K Q32T1 (MB/s) | 557 | 440.7 -21% | 557 0% | 487.7 -12% | 584 5% | 530 -5% |
| Write Seq Q32T1 (MB/s) | 2978 | 2793 -6% | 2654 -11% | 2822 -5% | 2235 -25% | 3057 3% |
| Read Seq Q32T1 (MB/s) | 3360 | 3101 -8% | 3137 -7% | 3478 4% | 3171 -6% | 3422 2% |
| AS SSD | -8% | -78% | 2% | -23% | 15% | |
| Seq Read (MB/s) | 1795 | 1982 10% | 2058 15% | 2767 54% | 2021 13% | 2341 30% |
| Seq Write (MB/s) | 2724 | 1444 -47% | 2316 -15% | 2613 -4% | 2090 -23% | 2575 -5% |
| 4K Read (MB/s) | 49.67 | 50.3 1% | 39.72 -20% | 47.55 -4% | 47.71 -4% | 51 3% |
| 4K Write (MB/s) | 109.3 | 120.1 10% | 62.9 -42% | 98.9 -10% | 101.1 -8% | 118.6 9% |
| 4K-64 Read (MB/s) | 1284 | 1016 -21% | 1334 4% | 1205 -6% | 856 -33% | 1637 27% |
| 4K-64 Write (MB/s) | 1962 | 1351 -31% | 1271 -35% | 2007 2% | 1041 -47% | 2442 24% |
| Access Time Read * (ms) | 0.063 | 0.044 30% | 0.062 2% | 0.065 -3% | 0.052 17% | 0.066 -5% |
| Access Time Write * (ms) | 0.034 | 0.109 -221% | 0.388 -1041% | 0.038 -12% | 0.111 -226% | 0.028 18% |
| Score Read (Points) | 1513 | 1264 -16% | 1580 4% | 1529 1% | 1105 -27% | 1922 27% |
| Score Write (Points) | 2344 | 1615 -31% | 1565 -33% | 2367 1% | 1351 -42% | 2818 20% |
| Score Total (Points) | 4685 | 3510 -25% | 3968 -15% | 4677 0% | 3037 -35% | 5738 22% |
| Copy ISO MB/s (MB/s) | 1533 | 3474 127% | 1685 10% | 2474 61% | ||
| Copy Program MB/s (MB/s) | 528 | 751 42% | 669 27% | 679 29% | ||
| Copy Game MB/s (MB/s) | 1042 | 1684 62% | 1493 43% | 1037 0% | ||
| Total Average (Program / Settings) | -2% /
-4% | -41% /
-51% | 6% /
5% | -9% /
-12% | 1% /
3% |
* ... smaller is better
Continuous load read: DiskSpd Read Loop, Queue Depth 8
Graphics card
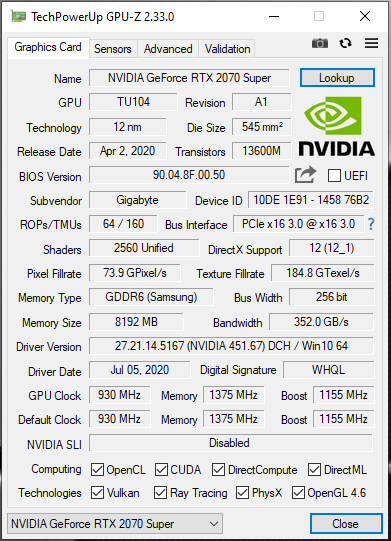
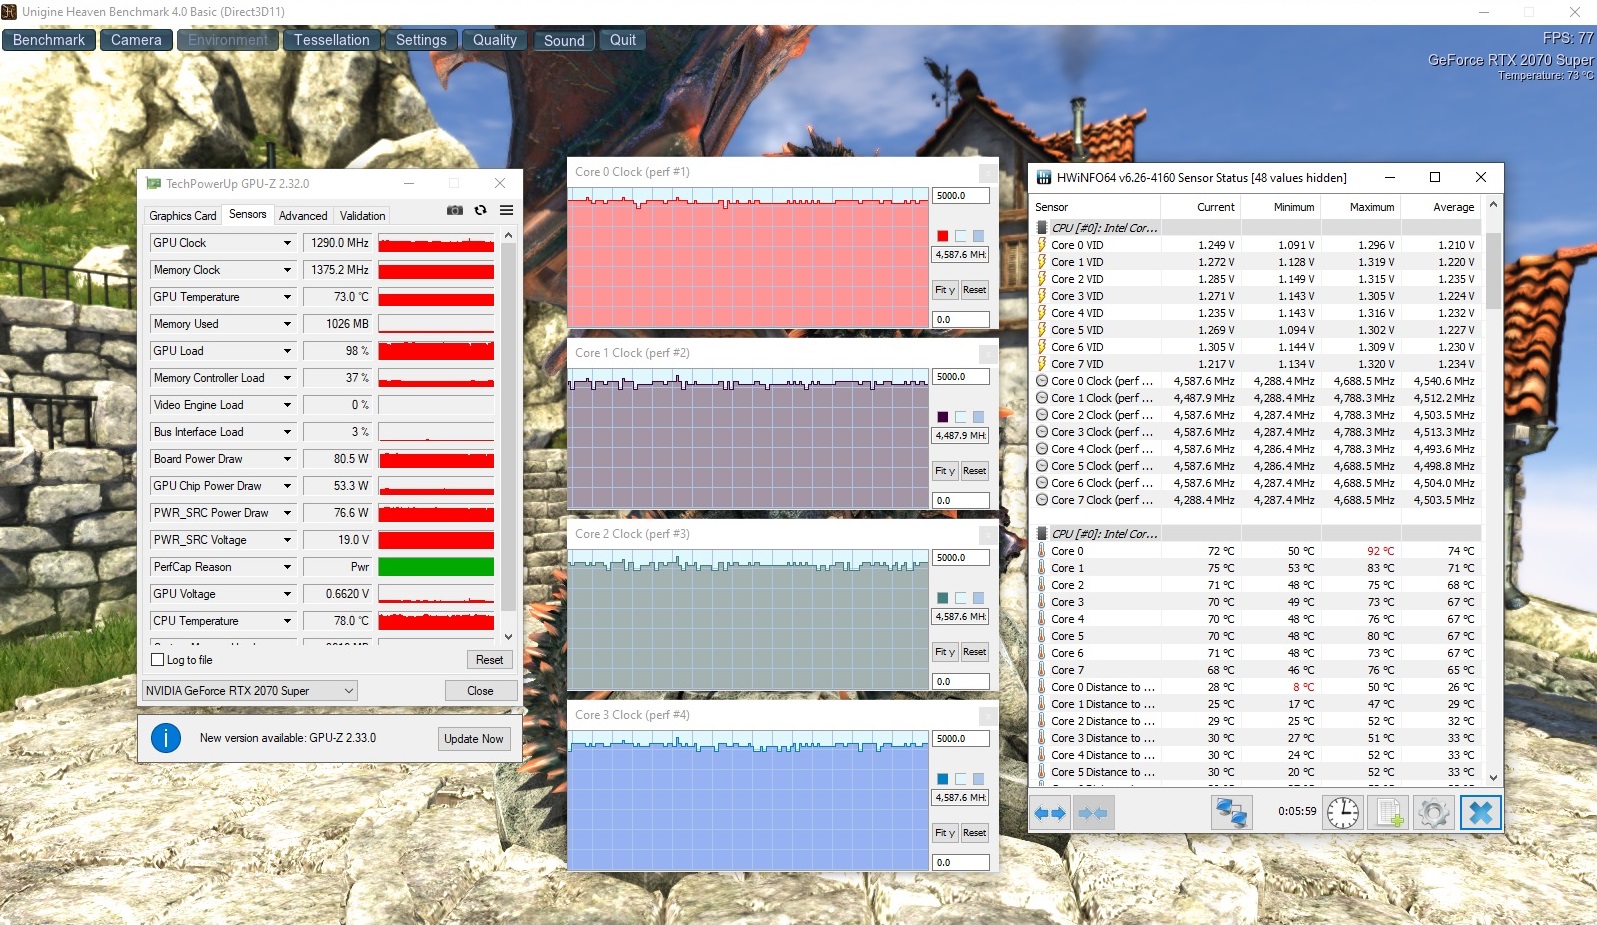
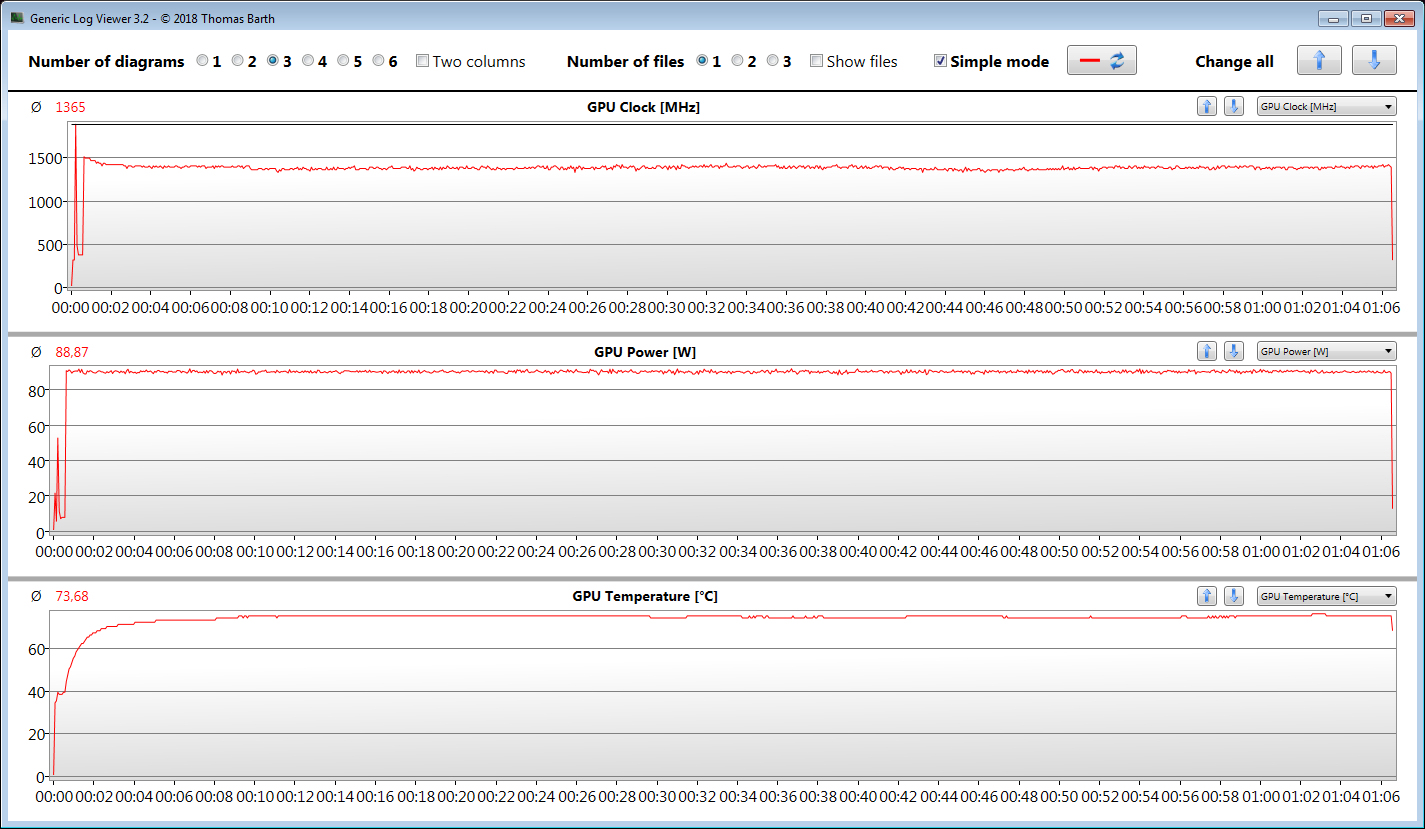
Gigabyte equips the Aorus 15 with a GeForce RTX 2070 Super Max-Q graphics core. This DirectX 12 GPU is based on Nvidia's Turing architecture. Nvidia specifies a speed level between 930 MHz (base) and 1,155 MHz (boost) for the GPU.
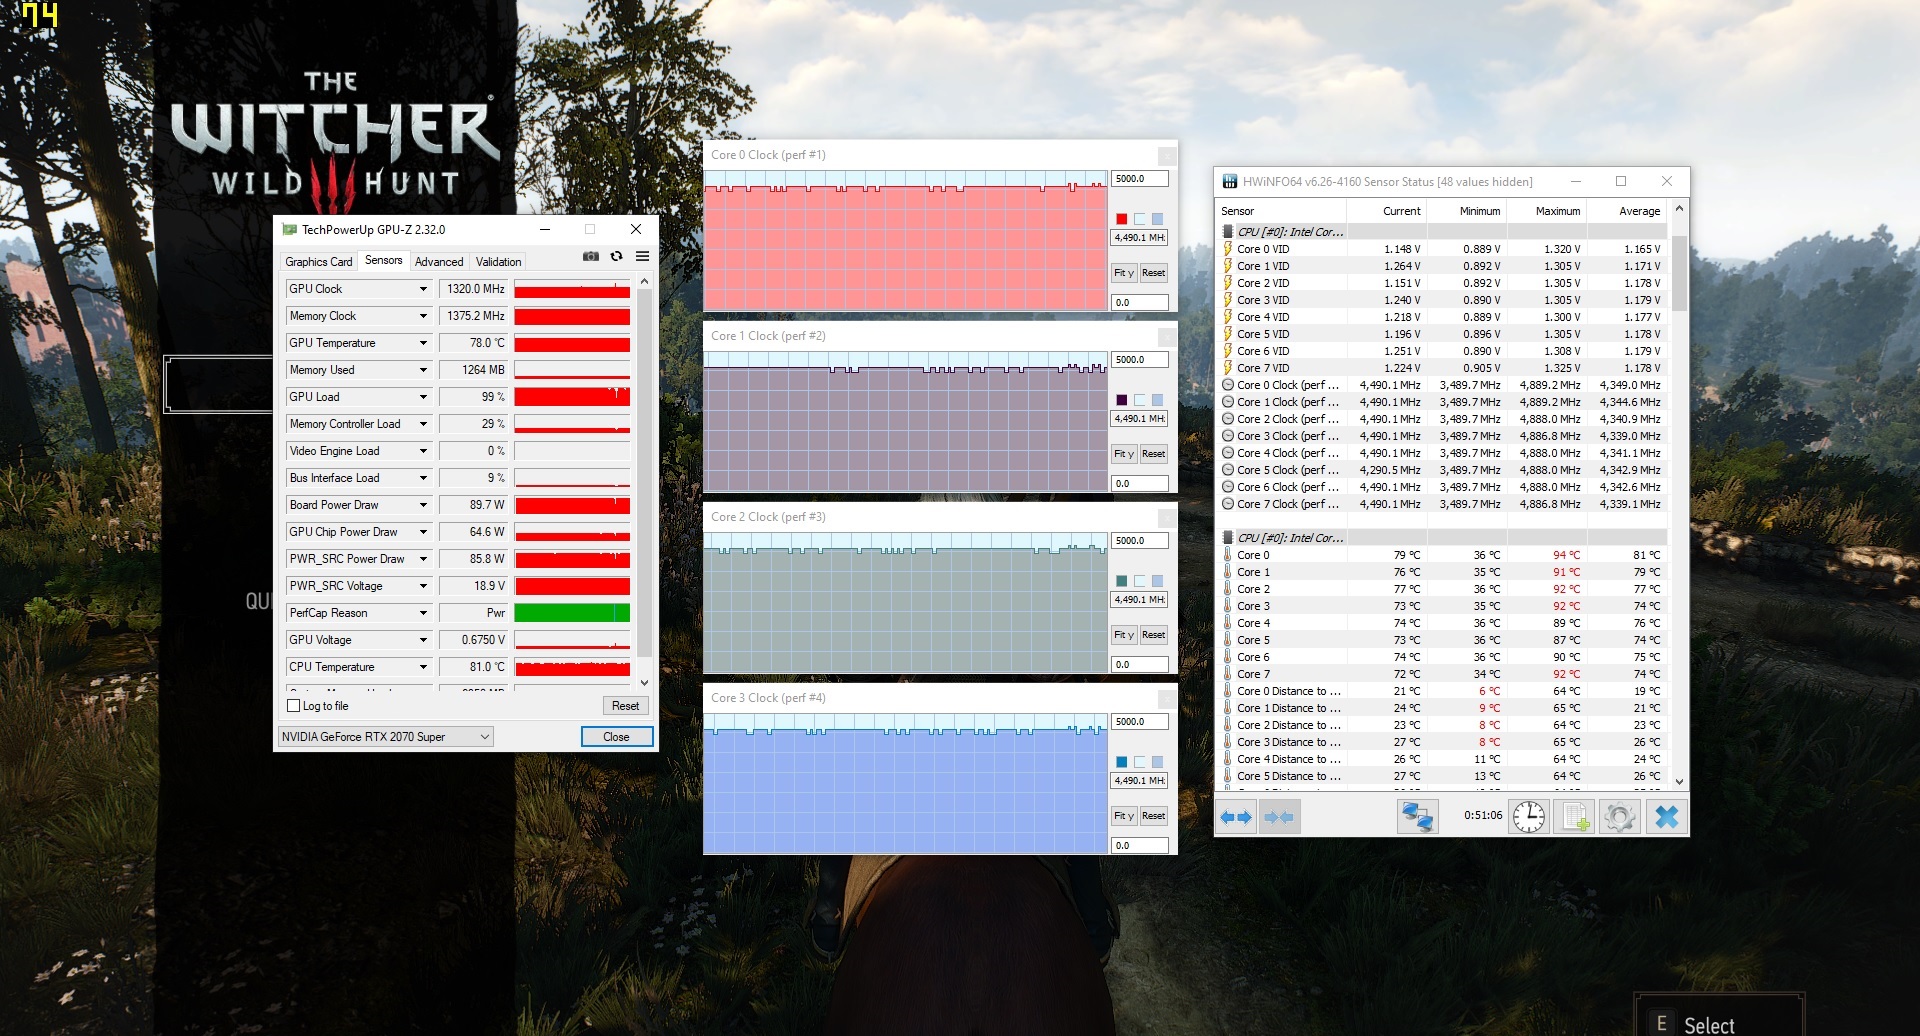
Higher speeds are feasible if the GPU doesn't reach a specified temperature and/or energy threshold. In this way, we register a maximum of 1,869 MHz. Our The Witcher 3 test is run at an average speed of 1,365 MHz. In addition, the GPU can access fast GDDR6 graphics memory (8,192 MB).
The results in the 3DMark benchmarks are at a normal level for the graphics core. Moreover, the UHD Graphics 630 GPU that's integrated into the processor is active, and the laptop works with Nvidia's Optimus graphics-switching solution.
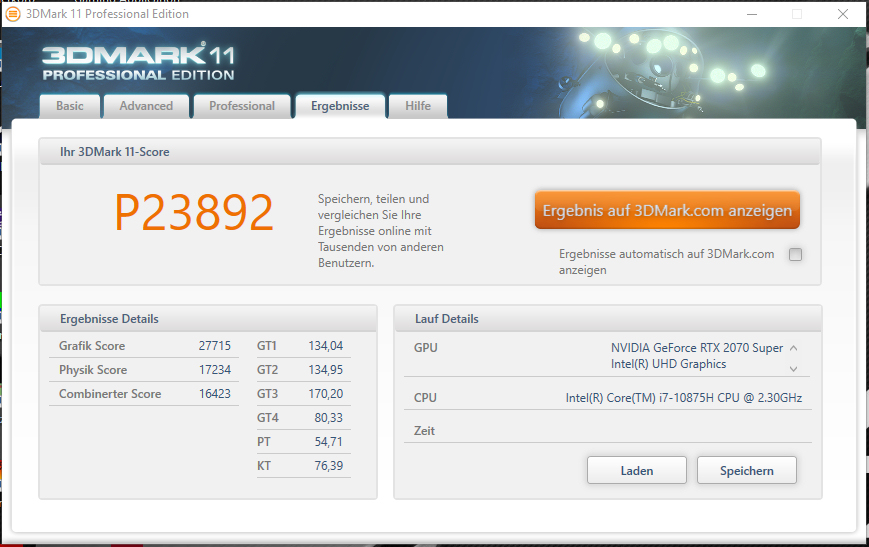
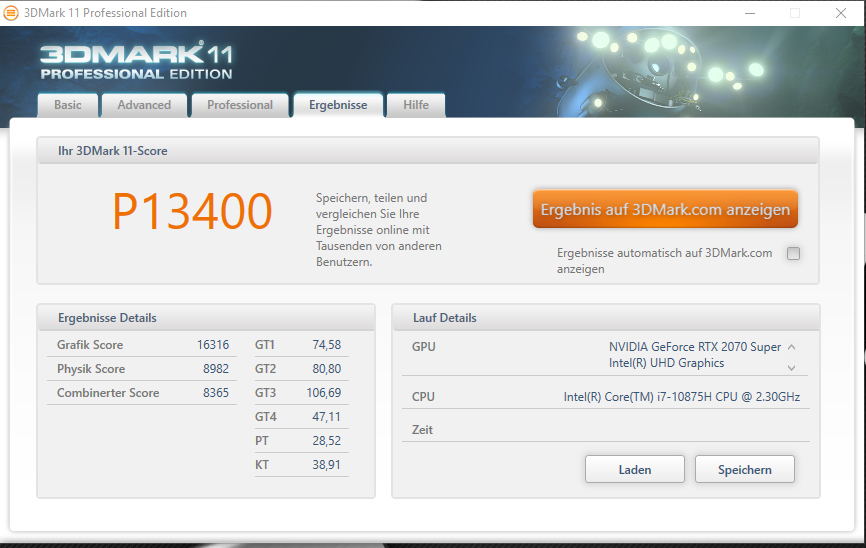
| 3DMark 11 Performance | 23892 points | |
| 3DMark Cloud Gate Standard Score | 49906 points | |
| 3DMark Fire Strike Score | 18883 points | |
| 3DMark Time Spy Score | 7590 points | |
Help | ||
Gaming performance
The Aorus XB brings all the latest games smoothly onto the screen. Usually, Full HD resolution and maximum quality settings can be selected. In addition, the GPU can also handle resolutions beyond Full HD (an appropriate monitor would have to be connected for this). However, the quality settings should be reduced in that case - especially at 4K level.
| The Witcher 3 - 1920x1080 Ultra Graphics & Postprocessing (HBAO+) | |
| Average of class Gaming (104.7 - 240, n=7, last 2 years) | |
| Asus ROG Strix Scar 15 G532LWS | |
| Acer Predator Triton 500 PT515-52-70N3 | |
| Alienware m15 R3 P87F | |
| Aorus 15G XB | |
| Razer Blade 15 RZ09-0328 | |
| Schenker XMG Neo 15 XNE15M19 | |
| BioShock Infinite - 1920x1080 Ultra Preset, DX11 (DDOF) | |
| Aorus 15G XB | |
| Shadow of the Tomb Raider - 1920x1080 Highest Preset AA:T | |
| Average of class Gaming (96 - 116, n=2, last 2 years) | |
| Asus ROG Strix Scar 15 G532LWS | |
| Acer Predator Triton 500 PT515-52-70N3 | |
| Aorus 15G XB | |
| Alienware m15 R3 P87F | |
| Razer Blade 15 RZ09-0328 | |
| Call of Duty Modern Warfare 2019 - 1920x1080 Maximum Settings AA:T2X Filmic SM | |
| Acer Predator Triton 500 PT515-52-70N3 | |
| Aorus 15G XB | |
| Schenker XMG Neo 15 XNE15M19 | |
| Doom Eternal - 1920x1080 Ultra Preset | |
| Acer Predator Triton 500 PT515-52-70N3 | |
| Aorus 15G XB | |
| Red Dead Redemption 2 - 1920x1080 Maximum Settings | |
| Acer Predator Triton 500 PT515-52-70N3 | |
| Aorus 15G XB | |
In order to verify whether the frame rates remain largely constant even over a prolonged period of time, we let the game The Witcher 3 run for about 60 minutes at Full HD resolution and maximum quality settings. The character embodied by the player is not moved during this whole period. A drop in frame rates wasn't found.
| low | med. | high | ultra | |
|---|---|---|---|---|
| BioShock Infinite (2013) | 420.2 | 359.5 | 329.8 | 166.5 |
| The Witcher 3 (2015) | 323.7 | 232 | 136.2 | 75.5 |
| Shadow of the Tomb Raider (2018) | 133 | 112 | 106 | 96 |
| Total War: Three Kingdoms (2019) | 255.2 | 122.8 | 77.6 | 54.8 |
| Call of Duty Modern Warfare 2019 (2019) | 160.9 | 116.2 | 97.8 | 84.2 |
| Star Wars Jedi Fallen Order (2019) | 108 | 98.2 | 92.1 | |
| Red Dead Redemption 2 (2019) | 132.8 | 86.6 | 60.2 | 39.4 |
| Doom Eternal (2020) | 232.3 | 152 | 135.1 | 130.2 |
| Gears Tactics (2020) | 272.4 | 165.8 | 109.2 | 79 |
| F1 2020 (2020) | 258 | 163 | 145 | 104 |
| Death Stranding (2020) | 164.3 | 114.5 | 104.3 | 101.8 |
Emissions - Hot and noisy under load
Noise emissions
The two fans are usually not quiet in idle usage. Consequently, users have to deal with a permanent but tolerable fan noise. Nevertheless: Idle sound pressure levels of up to 38 dB(A) are quite high. The fans really turn up under load. In this way, we register maximum levels of 54 dB(A) (stress test) and 50 dB(A) (The Witcher 3 test), respectively. Gaming is no fun without a headset here.
Noise level
| Idle |
| 32 / 34 / 38 dB(A) |
| Load |
| 48 / 54 dB(A) |
 | ||
30 dB silent 40 dB(A) audible 50 dB(A) loud |
||
min: | ||
| Aorus 15G XB i7-10875H, GeForce RTX 2070 Super Max-Q | Asus ROG Strix Scar 15 G532LWS i9-10980HK, GeForce RTX 2070 Super Mobile | Alienware m15 R3 P87F i7-10750H, GeForce RTX 2070 Mobile | Acer Predator Triton 500 PT515-52-70N3 i7-10750H, GeForce RTX 2080 Super Max-Q | Razer Blade 15 RZ09-0328 i7-10750H, GeForce RTX 2070 Max-Q | Schenker XMG Neo 15 XNE15M19 i7-9750H, GeForce RTX 2070 Max-Q | Average of class Gaming | |
|---|---|---|---|---|---|---|---|
| Noise | -1% | 8% | 0% | 6% | -2% | 12% | |
| off / environment * (dB) | 25 | 26.5 -6% | 26.3 -5% | 30 -20% | 28.4 -14% | 31 -24% | 24.1 ? 4% |
| Idle Minimum * (dB) | 32 | 27.1 15% | 26.7 17% | 30 6% | 28.4 11% | 31 3% | 26 ? 19% |
| Idle Average * (dB) | 34 | 32.2 5% | 26.7 21% | 33 3% | 28.4 16% | 34 -0% | 27.4 ? 19% |
| Idle Maximum * (dB) | 38 | 34 11% | 30.7 19% | 36 5% | 31.7 17% | 37 3% | 30.1 ? 21% |
| Load Average * (dB) | 48 | 52.4 -9% | 40.2 16% | 50 -4% | 47.7 1% | 47 2% | 43.6 ? 9% |
| Witcher 3 ultra * (dB) | 50 | 57.5 -15% | 51 -2% | 48 4% | 47.5 5% | 50 -0% | |
| Load Maximum * (dB) | 54 | 57.5 -6% | 59.7 -11% | 50 7% | 49.5 8% | 54 -0% | 54.2 ? -0% |
* ... smaller is better
Temperature
Our stress test (Prime95 and FurMark run for at least an hour) is run by the processor and graphics core at 2.8 GHz and 1,140 MHz, respectively. The clock rates are 1.8 GHz (CPU) and 300 MHz (GPU) on battery power. The stress test represents an extreme scenario that doesn't occur in everyday life. We use this test to check if the system remains stable even under full load.
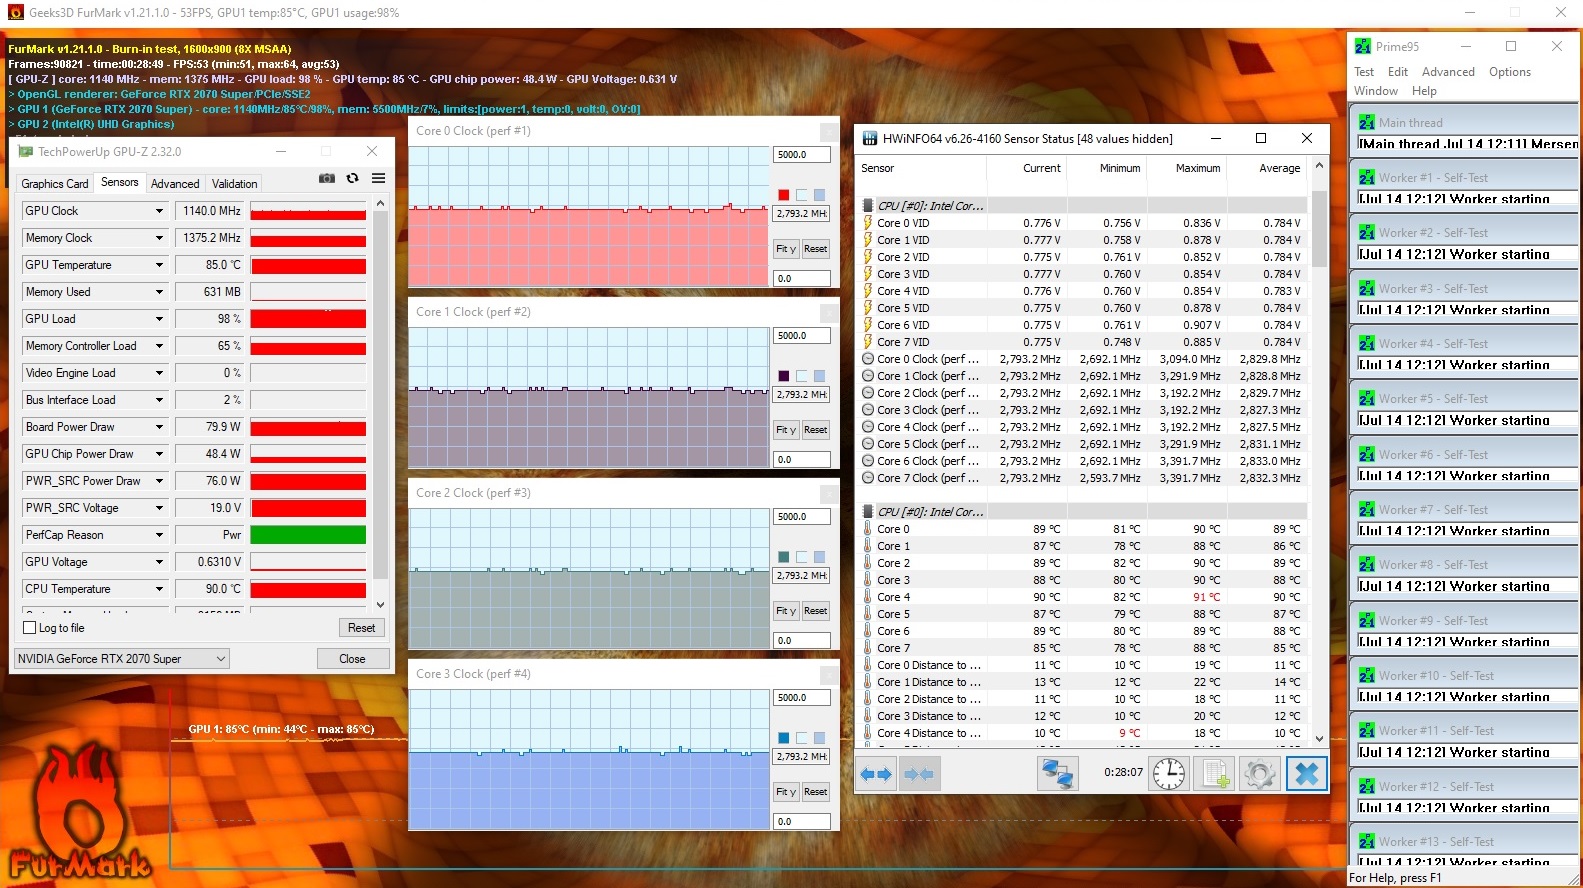
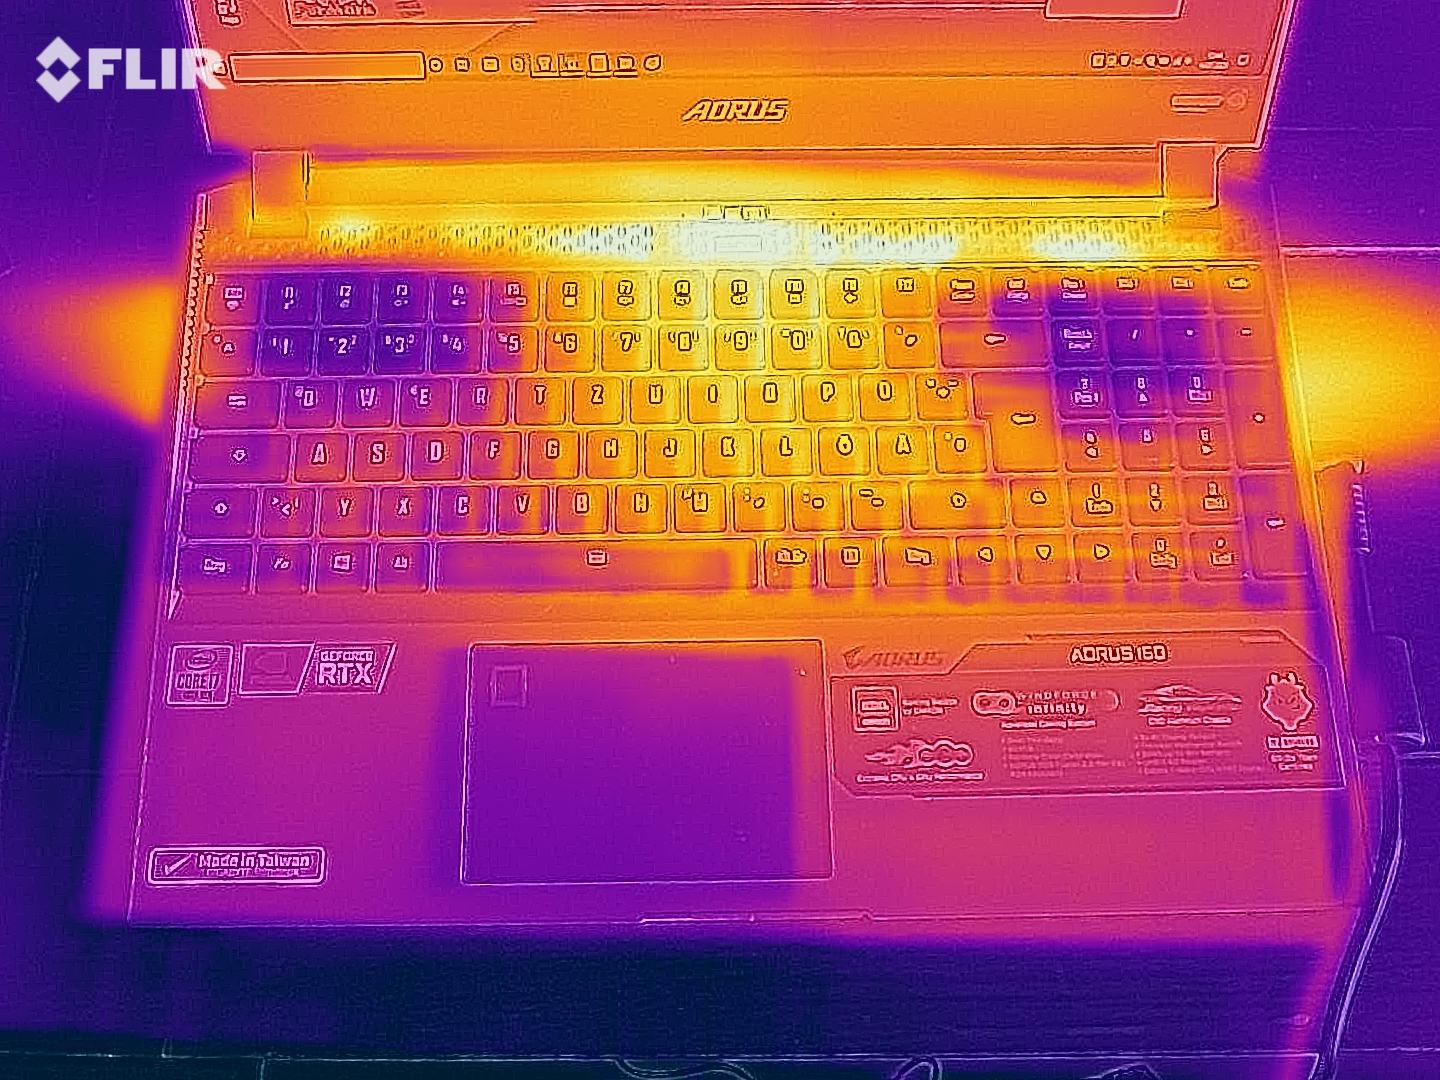
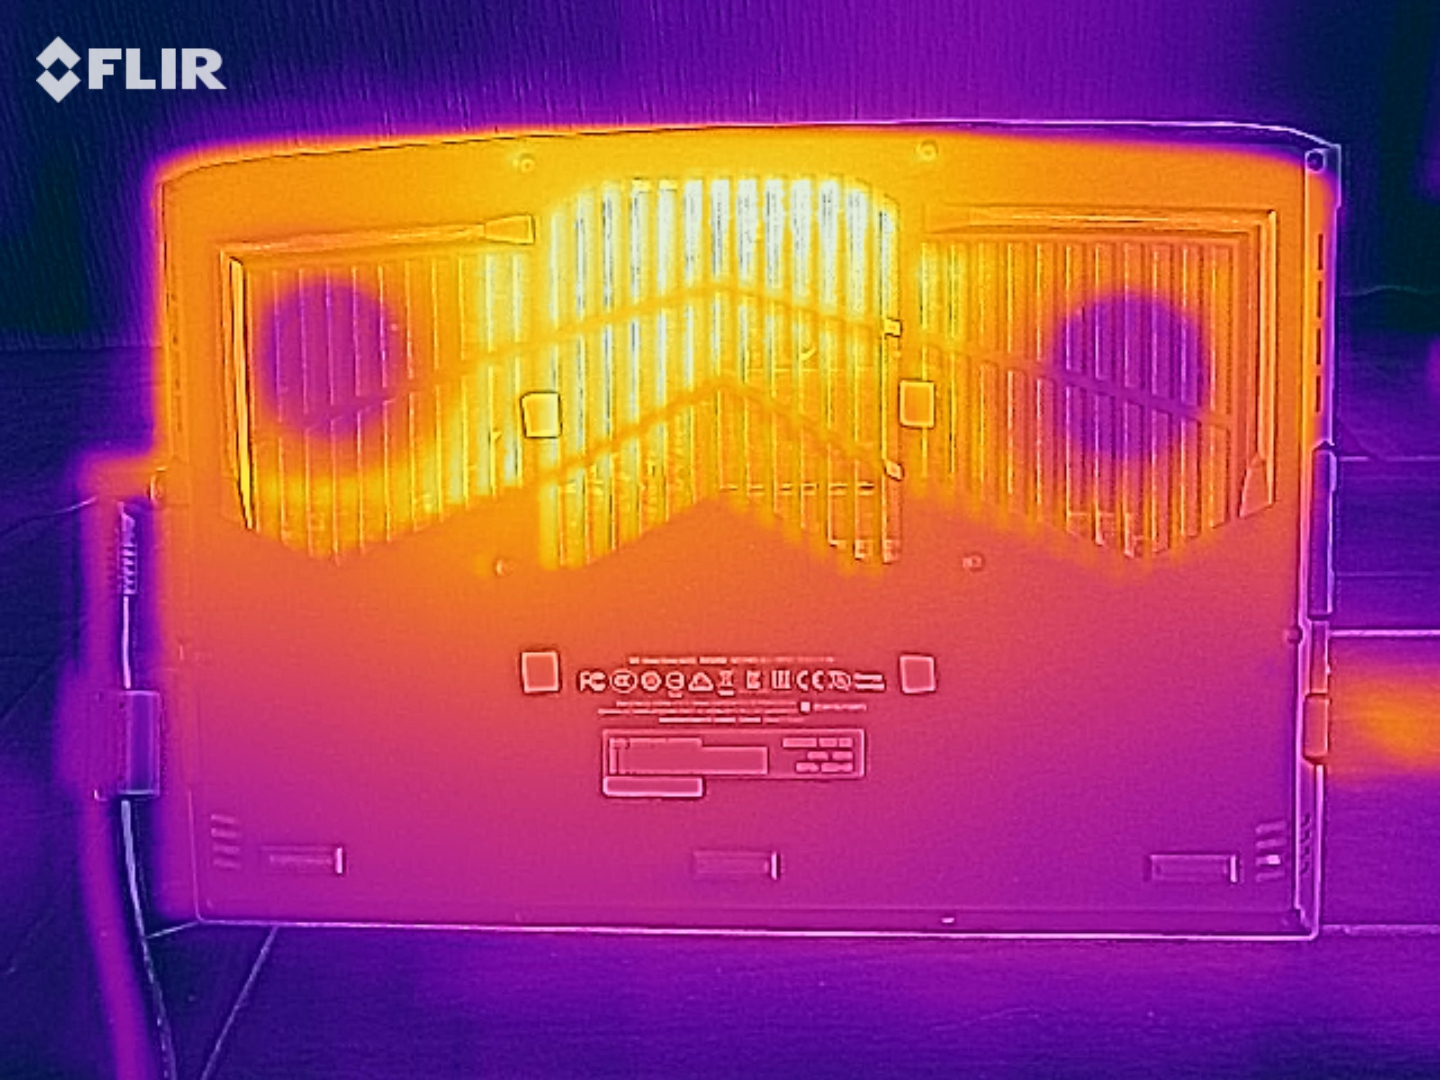
The 15G XB heats up considerably under load. During the stress test, we register temperatures around 60 °C (~140 °F) at several measuring points on the bottom. Heat development is a bit less when performing our The Witcher 3 test. However, the device shouldn't be placed on the lap. In everyday use, the temperatures remain in the green range.
(±) The maximum temperature on the upper side is 44 °C / 111 F, compared to the average of 40.4 °C / 105 F, ranging from 21.2 to 68.8 °C for the class Gaming.
(-) The bottom heats up to a maximum of 63 °C / 145 F, compared to the average of 43.2 °C / 110 F
(+) In idle usage, the average temperature for the upper side is 26.1 °C / 79 F, compared to the device average of 33.9 °C / 93 F.
(±) Playing The Witcher 3, the average temperature for the upper side is 34.4 °C / 94 F, compared to the device average of 33.9 °C / 93 F.
(+) The palmrests and touchpad are cooler than skin temperature with a maximum of 29 °C / 84.2 F and are therefore cool to the touch.
(±) The average temperature of the palmrest area of similar devices was 28.8 °C / 83.8 F (-0.2 °C / -0.4 F).
| Aorus 15G XB i7-10875H, GeForce RTX 2070 Super Max-Q | Asus ROG Strix Scar 15 G532LWS i9-10980HK, GeForce RTX 2070 Super Mobile | Alienware m15 R3 P87F i7-10750H, GeForce RTX 2070 Mobile | Acer Predator Triton 500 PT515-52-70N3 i7-10750H, GeForce RTX 2080 Super Max-Q | Razer Blade 15 RZ09-0328 i7-10750H, GeForce RTX 2070 Max-Q | Schenker XMG Neo 15 XNE15M19 i7-9750H, GeForce RTX 2070 Max-Q | Average of class Gaming | |
|---|---|---|---|---|---|---|---|
| Heat | -5% | -33% | 2% | -8% | -16% | -3% | |
| Maximum Upper Side * (°C) | 44 | 46.2 -5% | 55.8 -27% | 44 -0% | 49.6 -13% | 60 -36% | 45.2 ? -3% |
| Maximum Bottom * (°C) | 63 | 55.2 12% | 62 2% | 50 21% | 50.2 20% | 66 -5% | 48.1 ? 24% |
| Idle Upper Side * (°C) | 27 | 31.4 -16% | 43.4 -61% | 29 -7% | 32.2 -19% | 30 -11% | 31 ? -15% |
| Idle Bottom * (°C) | 29 | 32.2 -11% | 42 -45% | 31 -7% | 34.6 -19% | 32 -10% | 34.2 ? -18% |
* ... smaller is better
Speakers
The stereo speakers are located in the front area of the bottom of the device. They produce a very decent sound but lack bass. They also offer a relatively high maximum volume. For a better sound experience, however, headphones or external speakers should be used.
Aorus 15G XB audio analysis
(+) | speakers can play relatively loud (84 dB)
Bass 100 - 315 Hz
(-) | nearly no bass - on average 22.8% lower than median
(±) | linearity of bass is average (13.4% delta to prev. frequency)
Mids 400 - 2000 Hz
(±) | higher mids - on average 6.8% higher than median
(+) | mids are linear (6.4% delta to prev. frequency)
Highs 2 - 16 kHz
(+) | balanced highs - only 1.7% away from median
(+) | highs are linear (5.3% delta to prev. frequency)
Overall 100 - 16.000 Hz
(±) | linearity of overall sound is average (18.4% difference to median)
Compared to same class
» 59% of all tested devices in this class were better, 9% similar, 32% worse
» The best had a delta of 6%, average was 18%, worst was 132%
Compared to all devices tested
» 41% of all tested devices were better, 8% similar, 51% worse
» The best had a delta of 4%, average was 23%, worst was 134%
Energy management - Battery life is good
Energy consumption
The Aorus laptop has a power consumption of up to 30 watts in idle usage - quite a lot for a laptop with Optimus enabled. Competitors like the Asus ROG Strix Scar 15 and the Acer Predator Triton 500 are at least a bit more energy-efficient. Moreover, the stress test lets the demand increase up to 256 watts. We measure an average power consumption of 156 watts during our The Witcher 3 test. The power adapter's rated output is 230 watts.
| Off / Standby | |
| Idle | |
| Load |
|
Key:
min: | |
| Aorus 15G XB i7-10875H, GeForce RTX 2070 Super Max-Q | Asus ROG Strix Scar 15 G532LWS i9-10980HK, GeForce RTX 2070 Super Mobile | Alienware m15 R3 P87F i7-10750H, GeForce RTX 2070 Mobile | Acer Predator Triton 500 PT515-52-70N3 i7-10750H, GeForce RTX 2080 Super Max-Q | Razer Blade 15 RZ09-0328 i7-10750H, GeForce RTX 2070 Max-Q | Schenker XMG Neo 15 XNE15M19 i7-9750H, GeForce RTX 2070 Max-Q | Average of class Gaming | |
|---|---|---|---|---|---|---|---|
| Power Consumption | 2% | -69% | 18% | 11% | 22% | 6% | |
| Idle Minimum * (Watt) | 16 | 8 50% | 34 -113% | 11 31% | 11.1 31% | 11 31% | 13 ? 19% |
| Idle Average * (Watt) | 20 | 9.8 51% | 48.6 -143% | 15 25% | 13.7 31% | 15 25% | 19 ? 5% |
| Idle Maximum * (Watt) | 30 | 25.8 14% | 58.2 -94% | 25 17% | 33.4 -11% | 21 30% | 24.6 ? 18% |
| Load Average * (Watt) | 102 | 169 -66% | 129.4 -27% | 95 7% | 104.4 -2% | 94 8% | 110.7 ? -9% |
| Witcher 3 ultra * (Watt) | 156 | 201 -29% | 214.5 -38% | 140 10% | 159.9 -3% | 143 8% | |
| Load Maximum * (Watt) | 256 | 271.6 -6% | 257.3 -1% | 211 18% | 203.8 20% | 173 32% | 259 ? -1% |
* ... smaller is better
Battery life
The battery life is more than in order for a gaming laptop, but the device doesn't set any endurance records despite its 94.24 Wh battery. The 15.6-incher completes our WLAN test (accessing websites using a script) and video test (the short film Big Buck Bunny (H.264 encoding, Full HD) running in a loop) after 6:58 h and 7:39 h, respectively.
| Aorus 15G XB i7-10875H, GeForce RTX 2070 Super Max-Q, 94 Wh | Asus ROG Strix Scar 15 G532LWS i9-10980HK, GeForce RTX 2070 Super Mobile, 66 Wh | Alienware m15 R3 P87F i7-10750H, GeForce RTX 2070 Mobile, 86 Wh | Acer Predator Triton 500 PT515-52-70N3 i7-10750H, GeForce RTX 2080 Super Max-Q, 84 Wh | Razer Blade 15 RZ09-0328 i7-10750H, GeForce RTX 2070 Max-Q, 65 Wh | Schenker XMG Neo 15 XNE15M19 i7-9750H, GeForce RTX 2070 Max-Q, 62 Wh | Average of class Gaming | |
|---|---|---|---|---|---|---|---|
| Battery runtime | -29% | -60% | -24% | -43% | -31% | -11% | |
| Reader / Idle (h) | 9.7 | 8.1 -16% | 5 -48% | 8.3 -14% | 7.3 -25% | 8.27 ? -15% | |
| H.264 (h) | 7.7 | 8.32 ? 8% | |||||
| WiFi v1.3 (h) | 7 | 4.9 -30% | 2.8 -60% | 6.3 -10% | 4 -43% | 5.7 -19% | 7.11 ? 2% |
| Load (h) | 2.5 | 1.5 -40% | 0.7 -72% | 1.3 -48% | 1.3 -48% | 1.502 ? -40% |
Pros
Cons
Verdict
Gigabyte's latest trick can be considered a success. The fancy metal case of the Aorus 15G XB has left a high-quality impression both visually and haptically. The slim display bezels contribute greatly to the laptop's attractiveness.
The combination of a Core i7-10875H octa-core processor and GeForce RTX 2070 Super Max-Q GPU is flawless. It brings all modern computer games smoothly onto the Full HD screen, and maximum quality settings can always be selected here.
The Aorus 15G XB meets the requirements of a modern gaming powerhouse and should satisfy many gamers.
The Core i7 attracts attention with its good performance. The achieved benchmark results are among the best that we've measured with this CPU so far. The whole thing comes at a price though: The fans turn up quite a bit, and the laptop warms up considerably in some parts.
The 240 Hz IGZO display from Sharp scores points with stable viewing angles, quick response times, good color-space coverage, and - thanks to an X-Rite Pantone certification - a natural color reproduction. The brightness and contrast, on the other hand, could be better.
The mechanical keyboard (with RGB lighting) is an unusual feature in the laptop. All in all, it made a good impression and will be an important purchase criterion for many potential buyers. Those who have never used such a keyboard before will first have to get used to this kind of typing experience.
The storage space offered by the fast 512 GB NVMe SSD will be a bit too tight for passionate gamers. A second SSD in the M.2 2280 format (NVMe or SATA) can be installed here if necessary. The process is quite easy to accomplish since the laptop's bottom cover can be removed without any issues. Furthermore, the battery life is extremely good for a gaming laptop. This is complemented by a well-rounded port configuration that includes a Thunderbolt 3 port among other connections.
Aorus 15G XB
- 08/11/2020 v7 (old)
Sascha Mölck
Price comparison

