Asus ROG Strix Scar 15 G532LWS Laptop Review: GeForce Supercharged
The ROG Strix Scar 15 G532 series is the 2020 update to last year's ROG Strix Scar 15 G531. Differences are relatively minor and mostly internal with the expected CPU and GPU updates to Comet Lake-H and GeForce RTX Super options, respectively. The G532 is home to Asus' upper mid-range gaming laptops directly below the flagship G703 series but well above the TUF series. A lesser-equipped plastic version of the G532 is also available called the G512 and users who want something thinner and lighter have the Asus Zephyrus series to consider instead.
SKUs range from the Core i7-10875H CPU and GeForce RTX 2060 GPU with 240 Hz display up to the Core i9-10980HK and RTX 2070 Super with 300 Hz display like the one in review for $2800 USD. Competitors include other high-end 15.6-inch gaming machines like the MSI GE66, HP Omen X 2S, Acer Predator series, or the Dell Alienware series.
More Asus reviews:
Rating | Date | Model | Weight | Height | Size | Resolution | Price |
|---|---|---|---|---|---|---|---|
| 84.4 % v7 (old) | 07 / 2020 | Asus ROG Strix Scar 15 G532LWS i9-10980HK, GeForce RTX 2070 Super Mobile | 2.4 kg | 24.9 mm | 15.60" | 1920x1080 | |
| 84.6 % v7 (old) | 07 / 2020 | MSI GE66 Raider 10SFS i9-10980HK, GeForce RTX 2070 Super Mobile | 2.4 kg | 23 mm | 15.60" | 1920x1080 | |
v (old) | 04 / 2020 | Acer Predator Triton 500 PT515-52-70N3 i7-10750H, GeForce RTX 2080 Super Max-Q | 2.1 kg | 18 mm | 15.60" | 1920x1080 | |
| 86 % v7 (old) | 05 / 2020 | Razer Blade 15 RZ09-0328 i7-10750H, GeForce RTX 2070 Max-Q | 2.1 kg | 19.9 mm | 15.60" | 3840x2160 | |
| 82.3 % v7 (old) | 09 / 2019 | HP Omen X 2S 15-dg0075cl i7-9750H, GeForce RTX 2070 Max-Q | 2.4 kg | 19.8 mm | 15.60" | 1920x1080 | |
| 82.1 % v7 (old) | 10 / 2019 | Asus Strix Scar III G531GW-AZ062T i7-9750H, GeForce RTX 2070 Mobile | 2.4 kg | 25 mm | 15.60" | 1920x1080 |
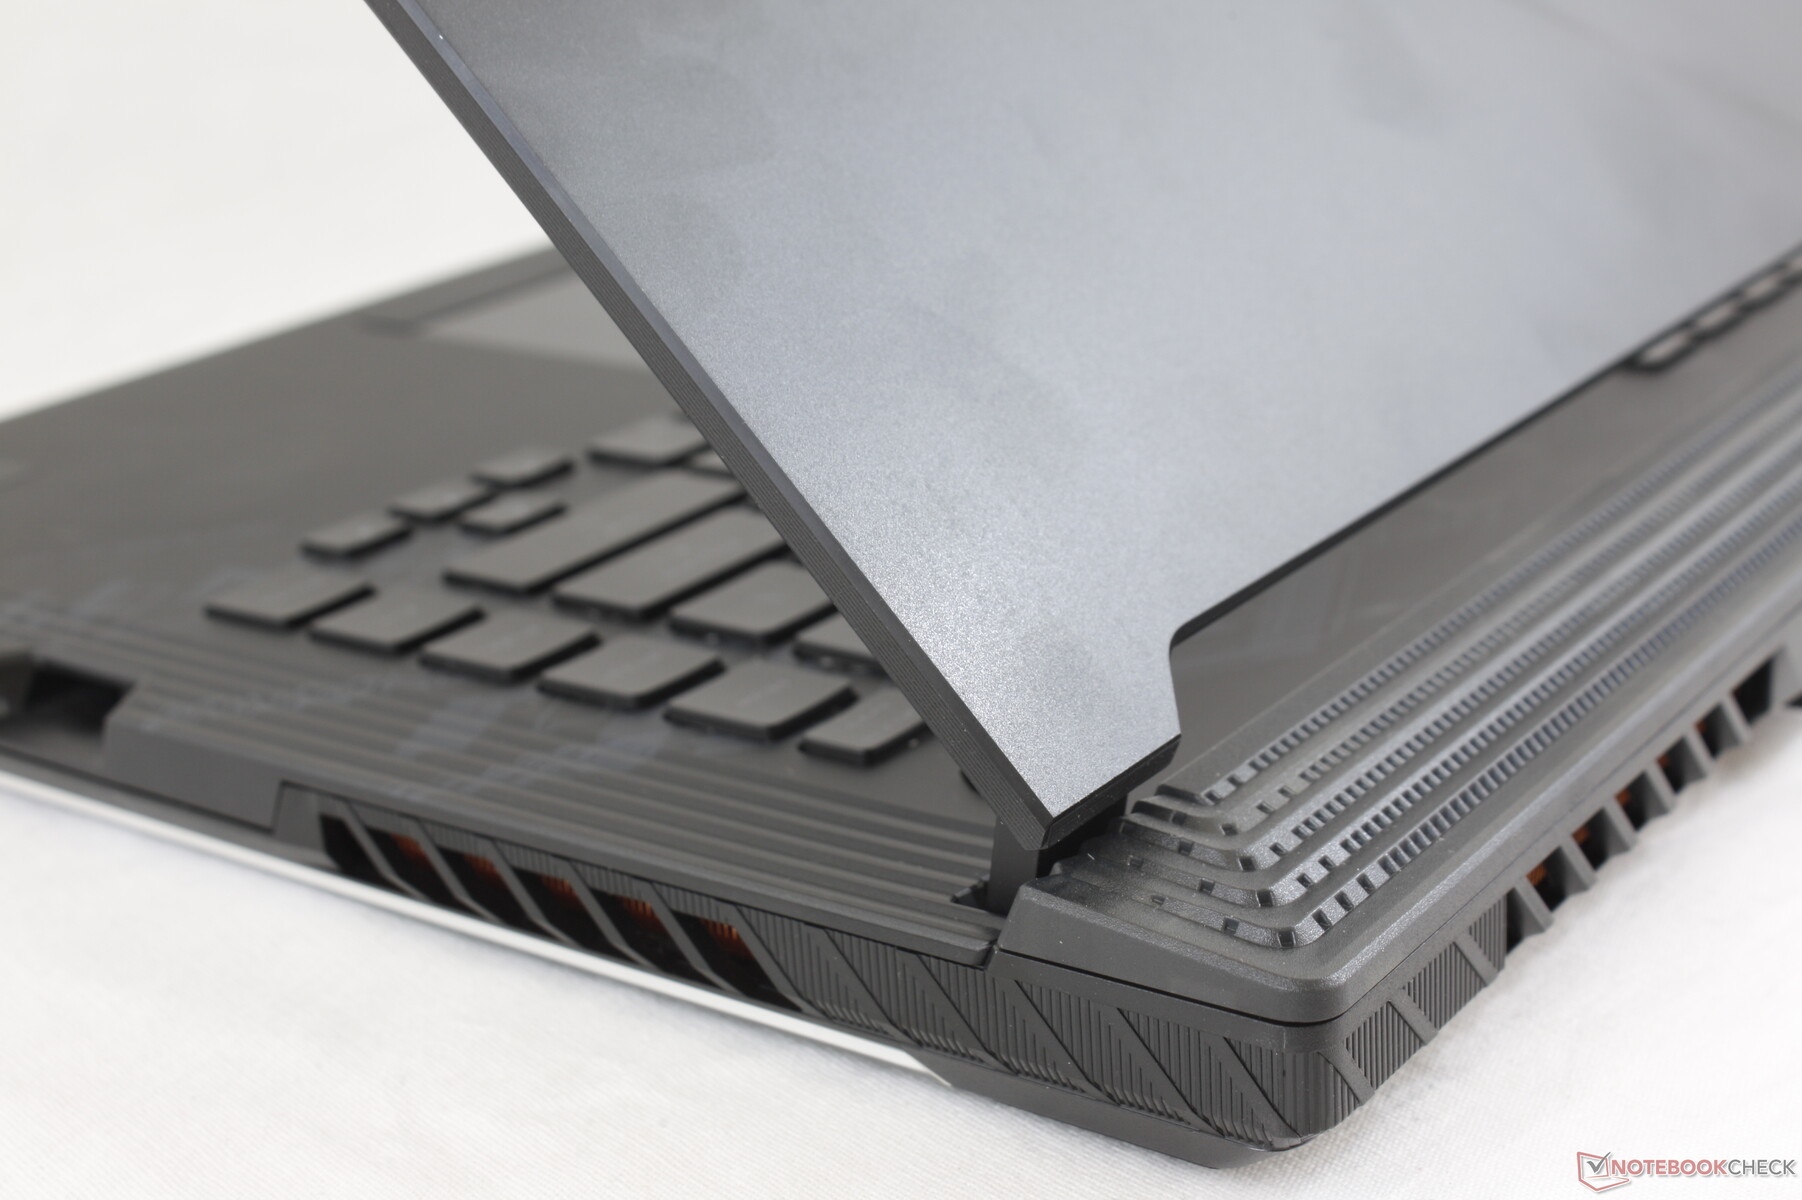
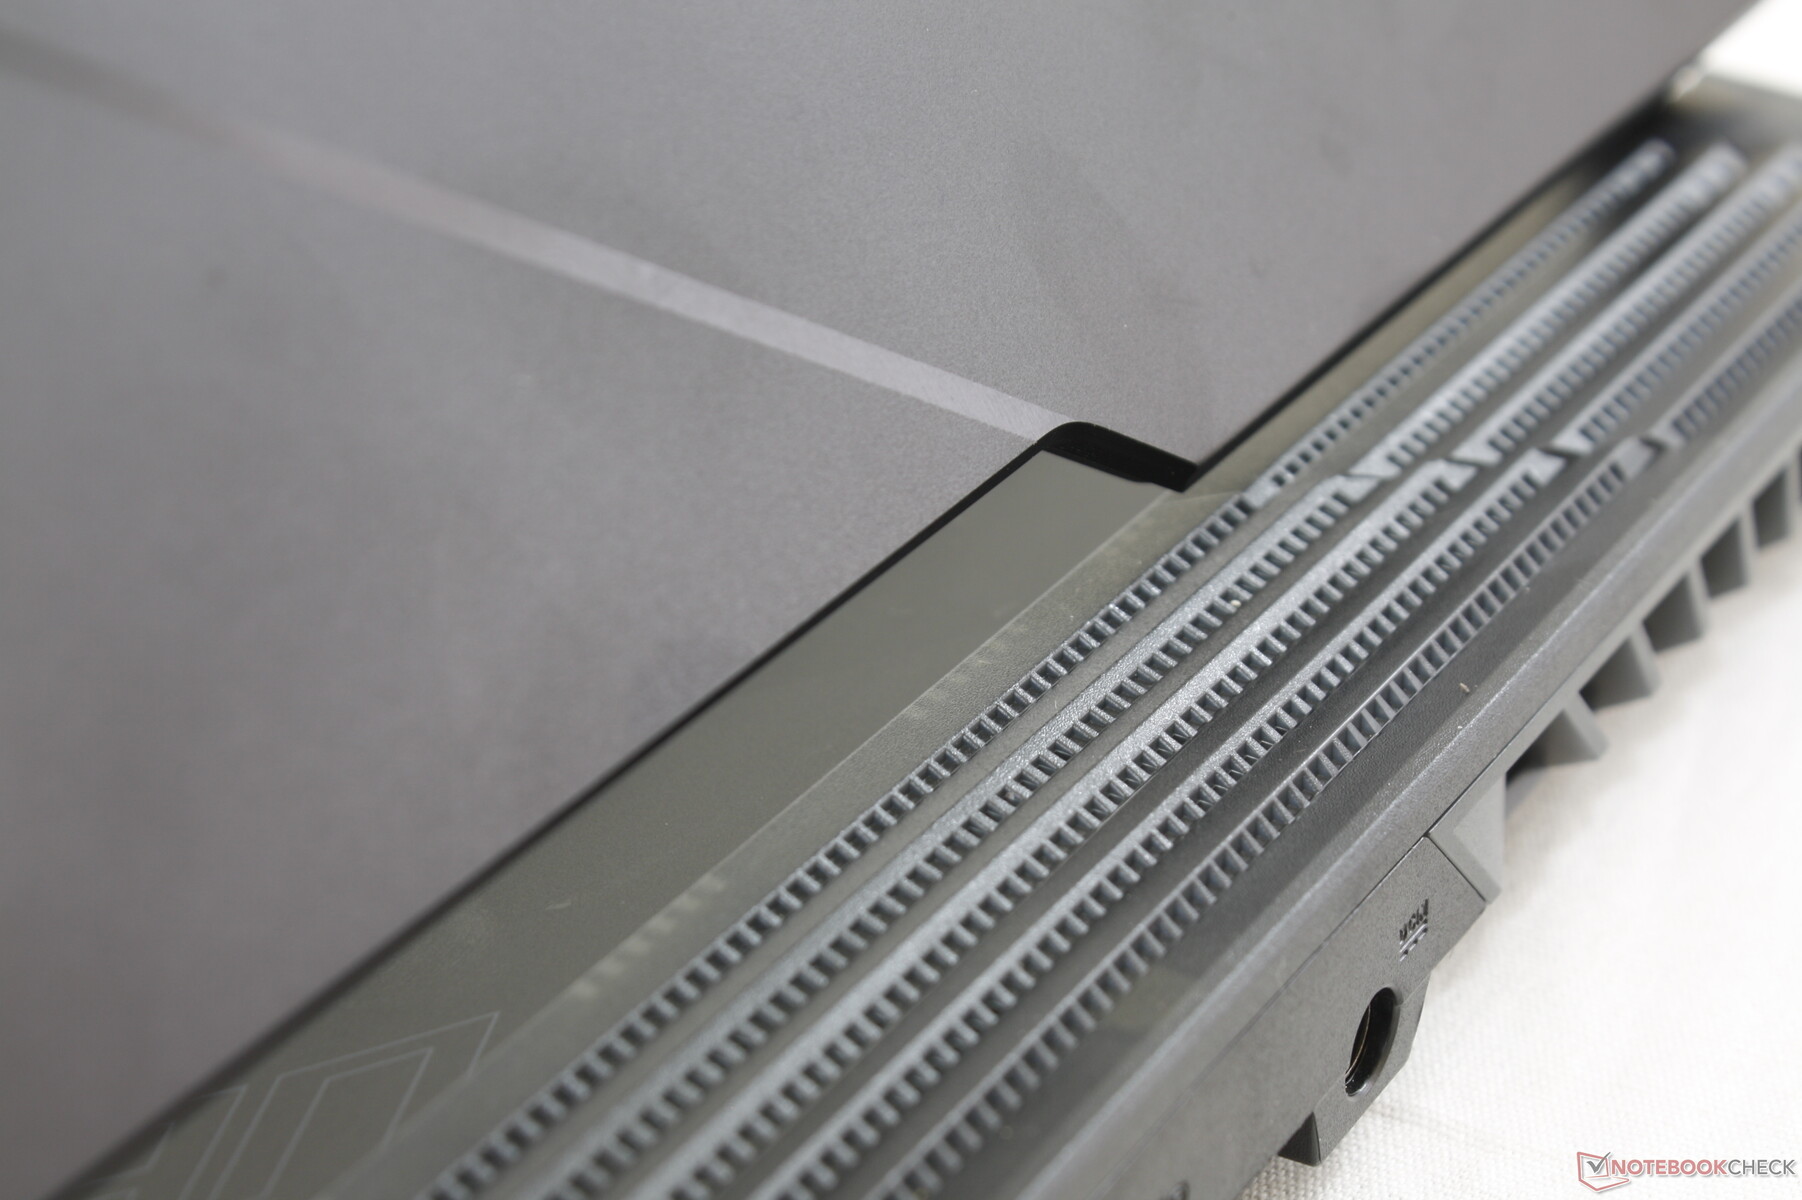
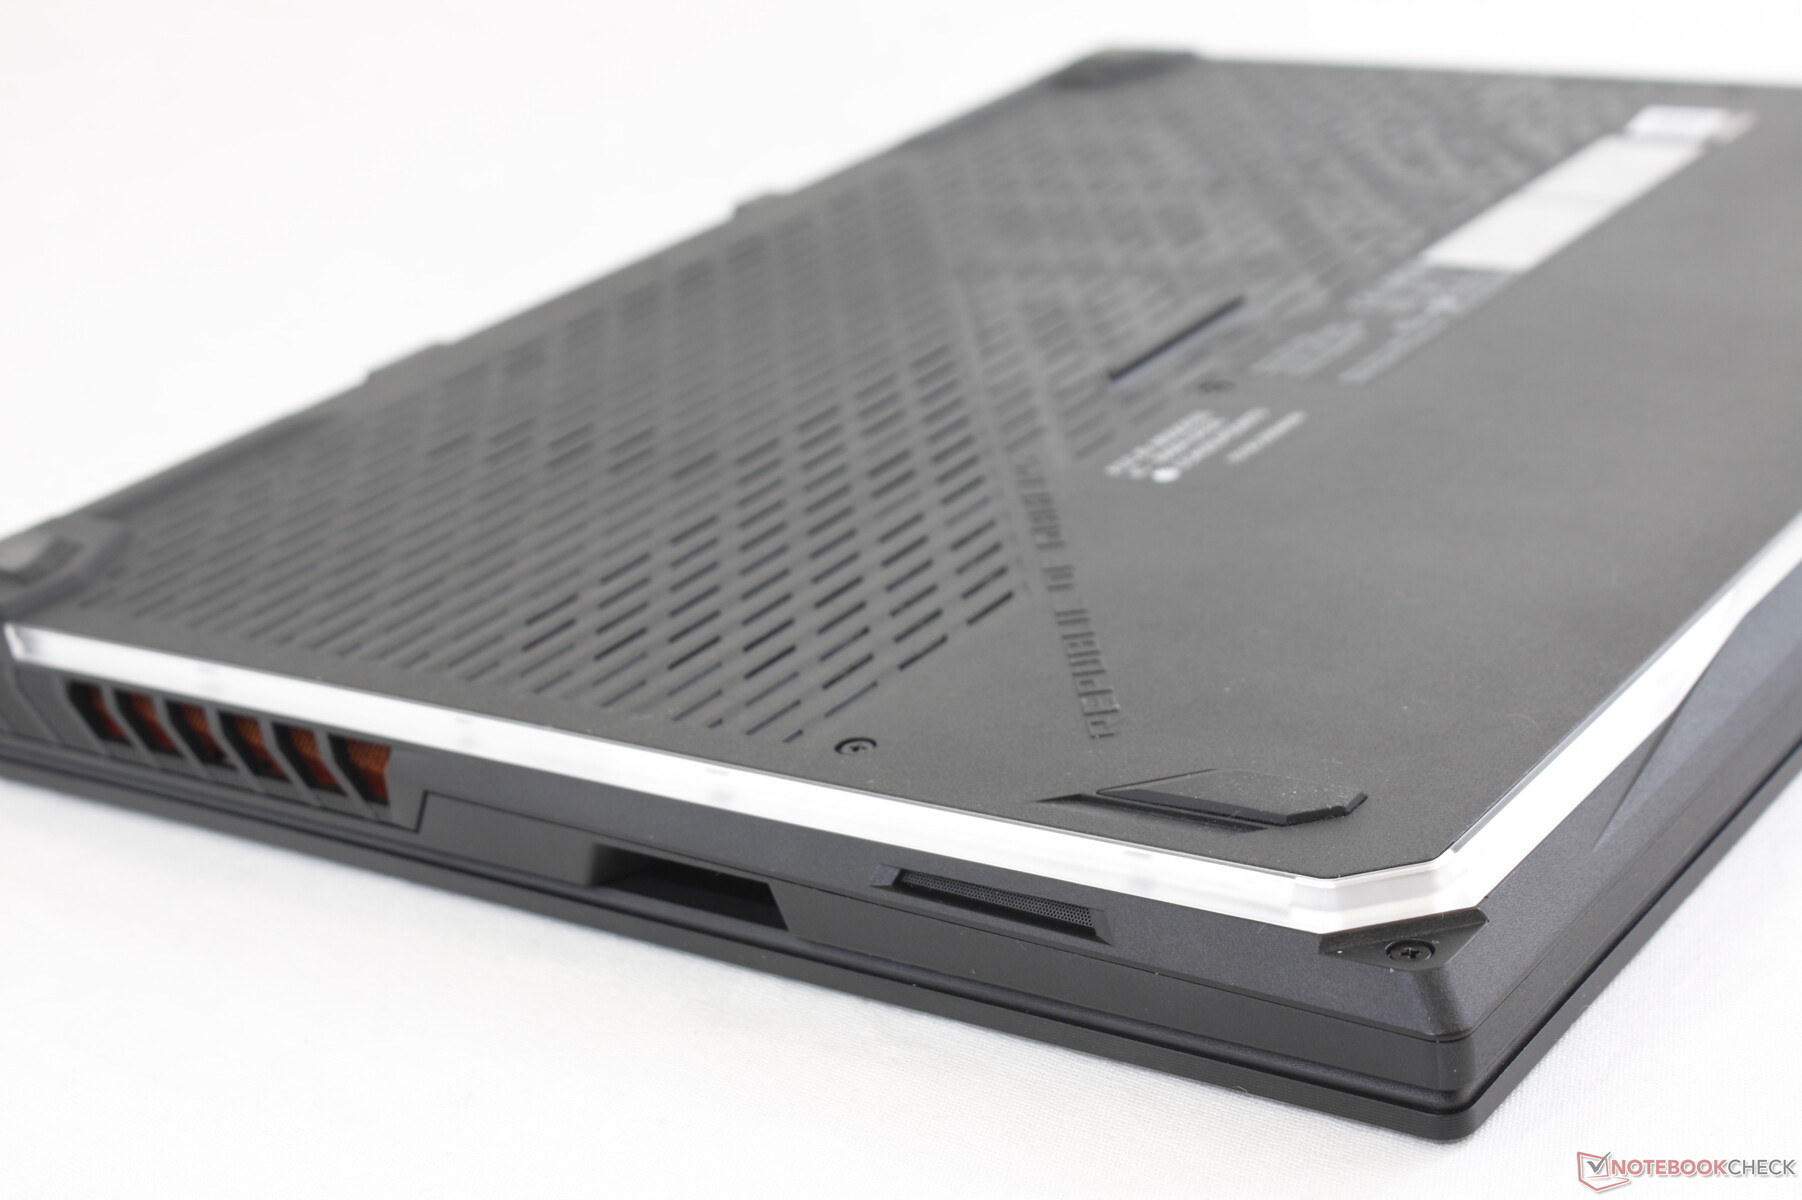
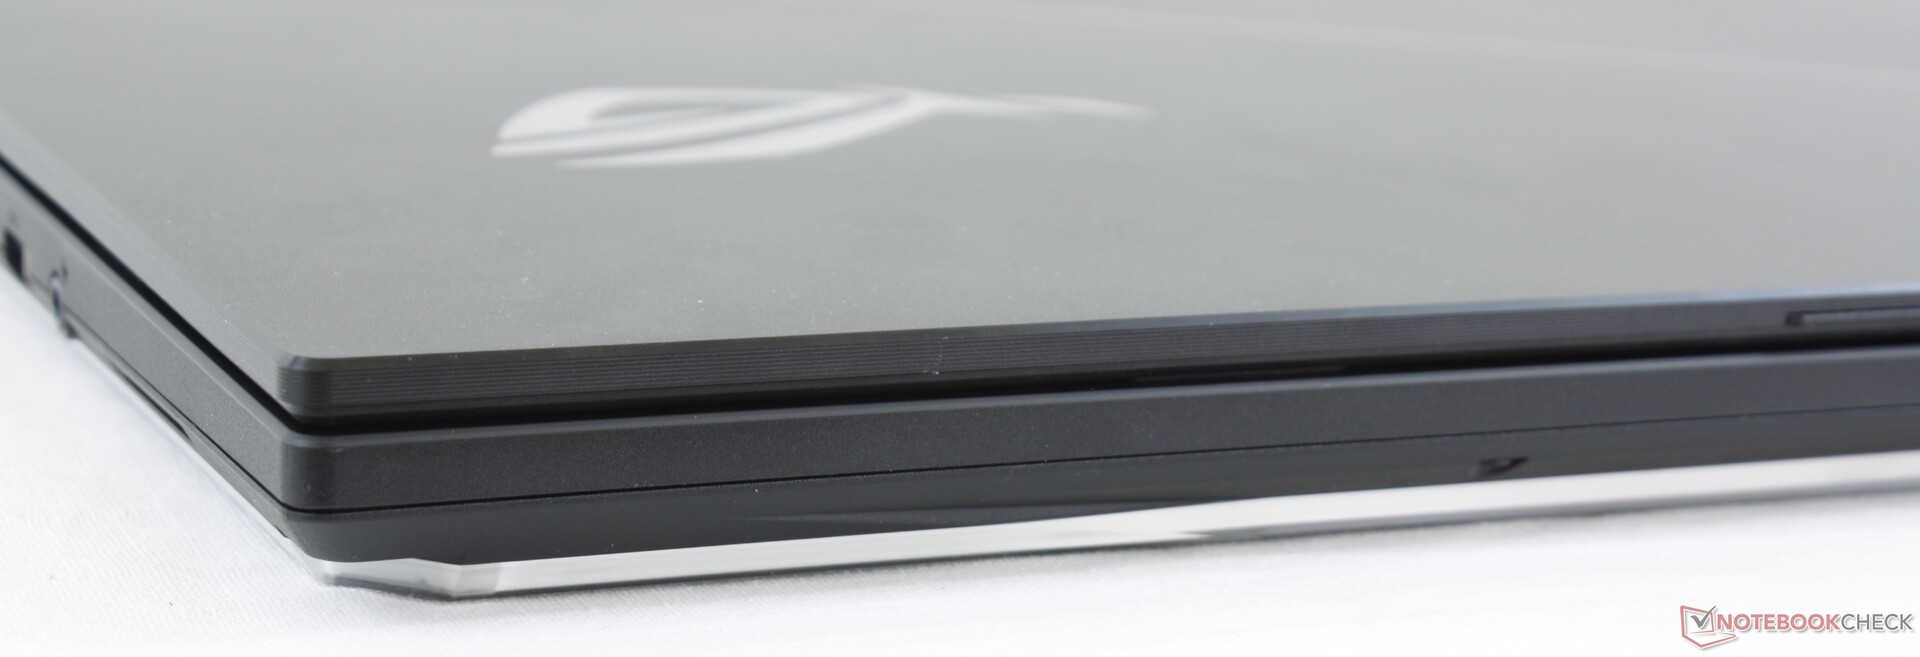
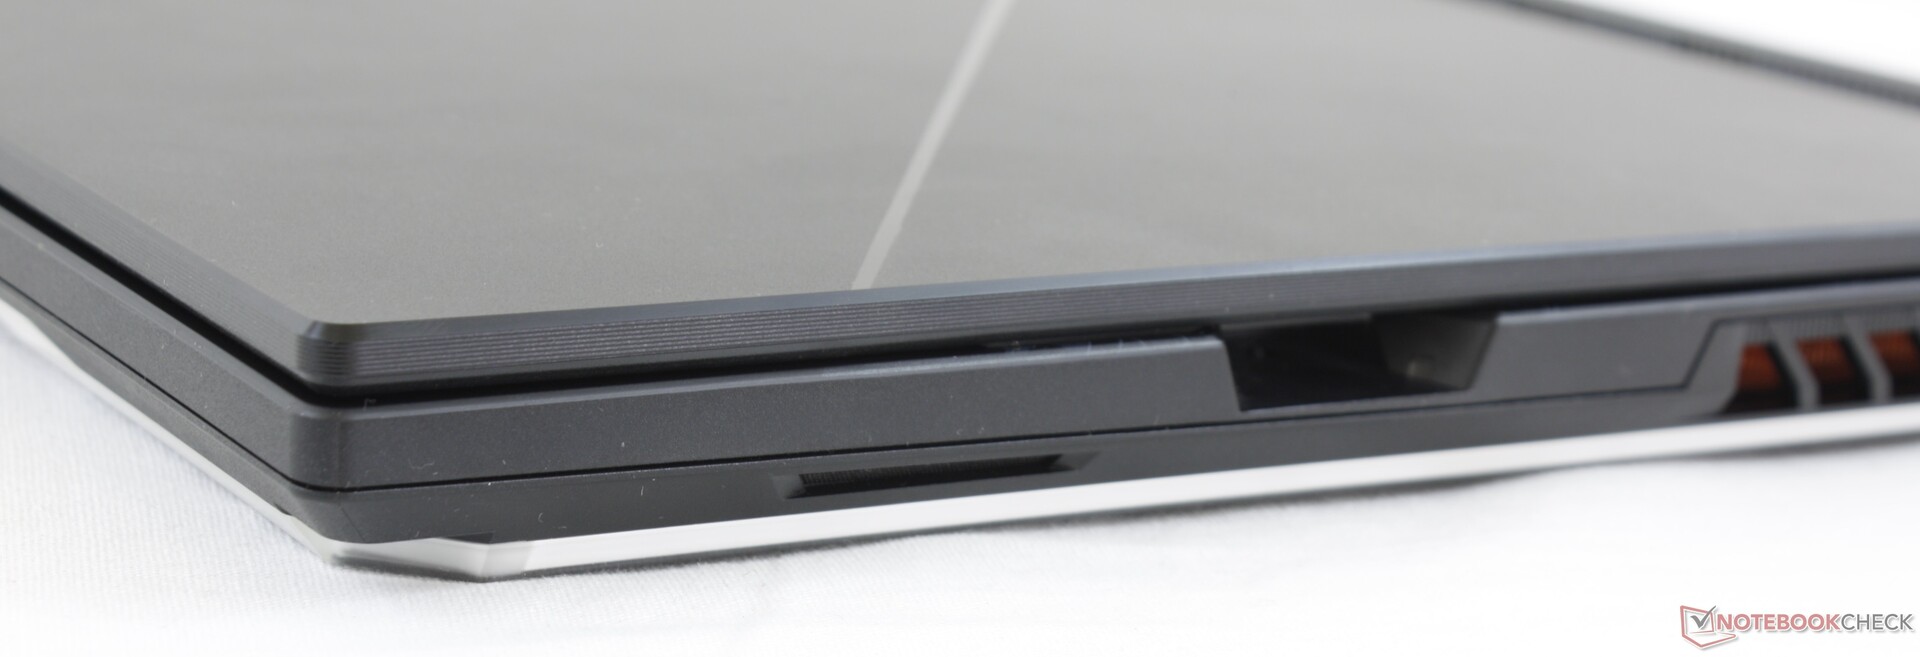
Case
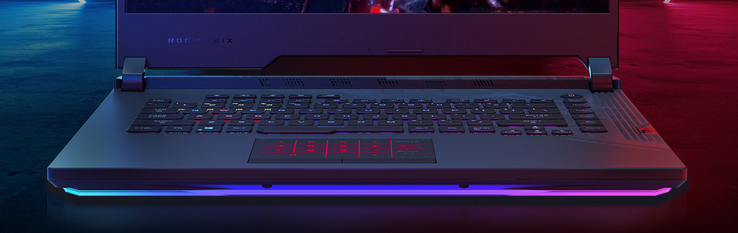
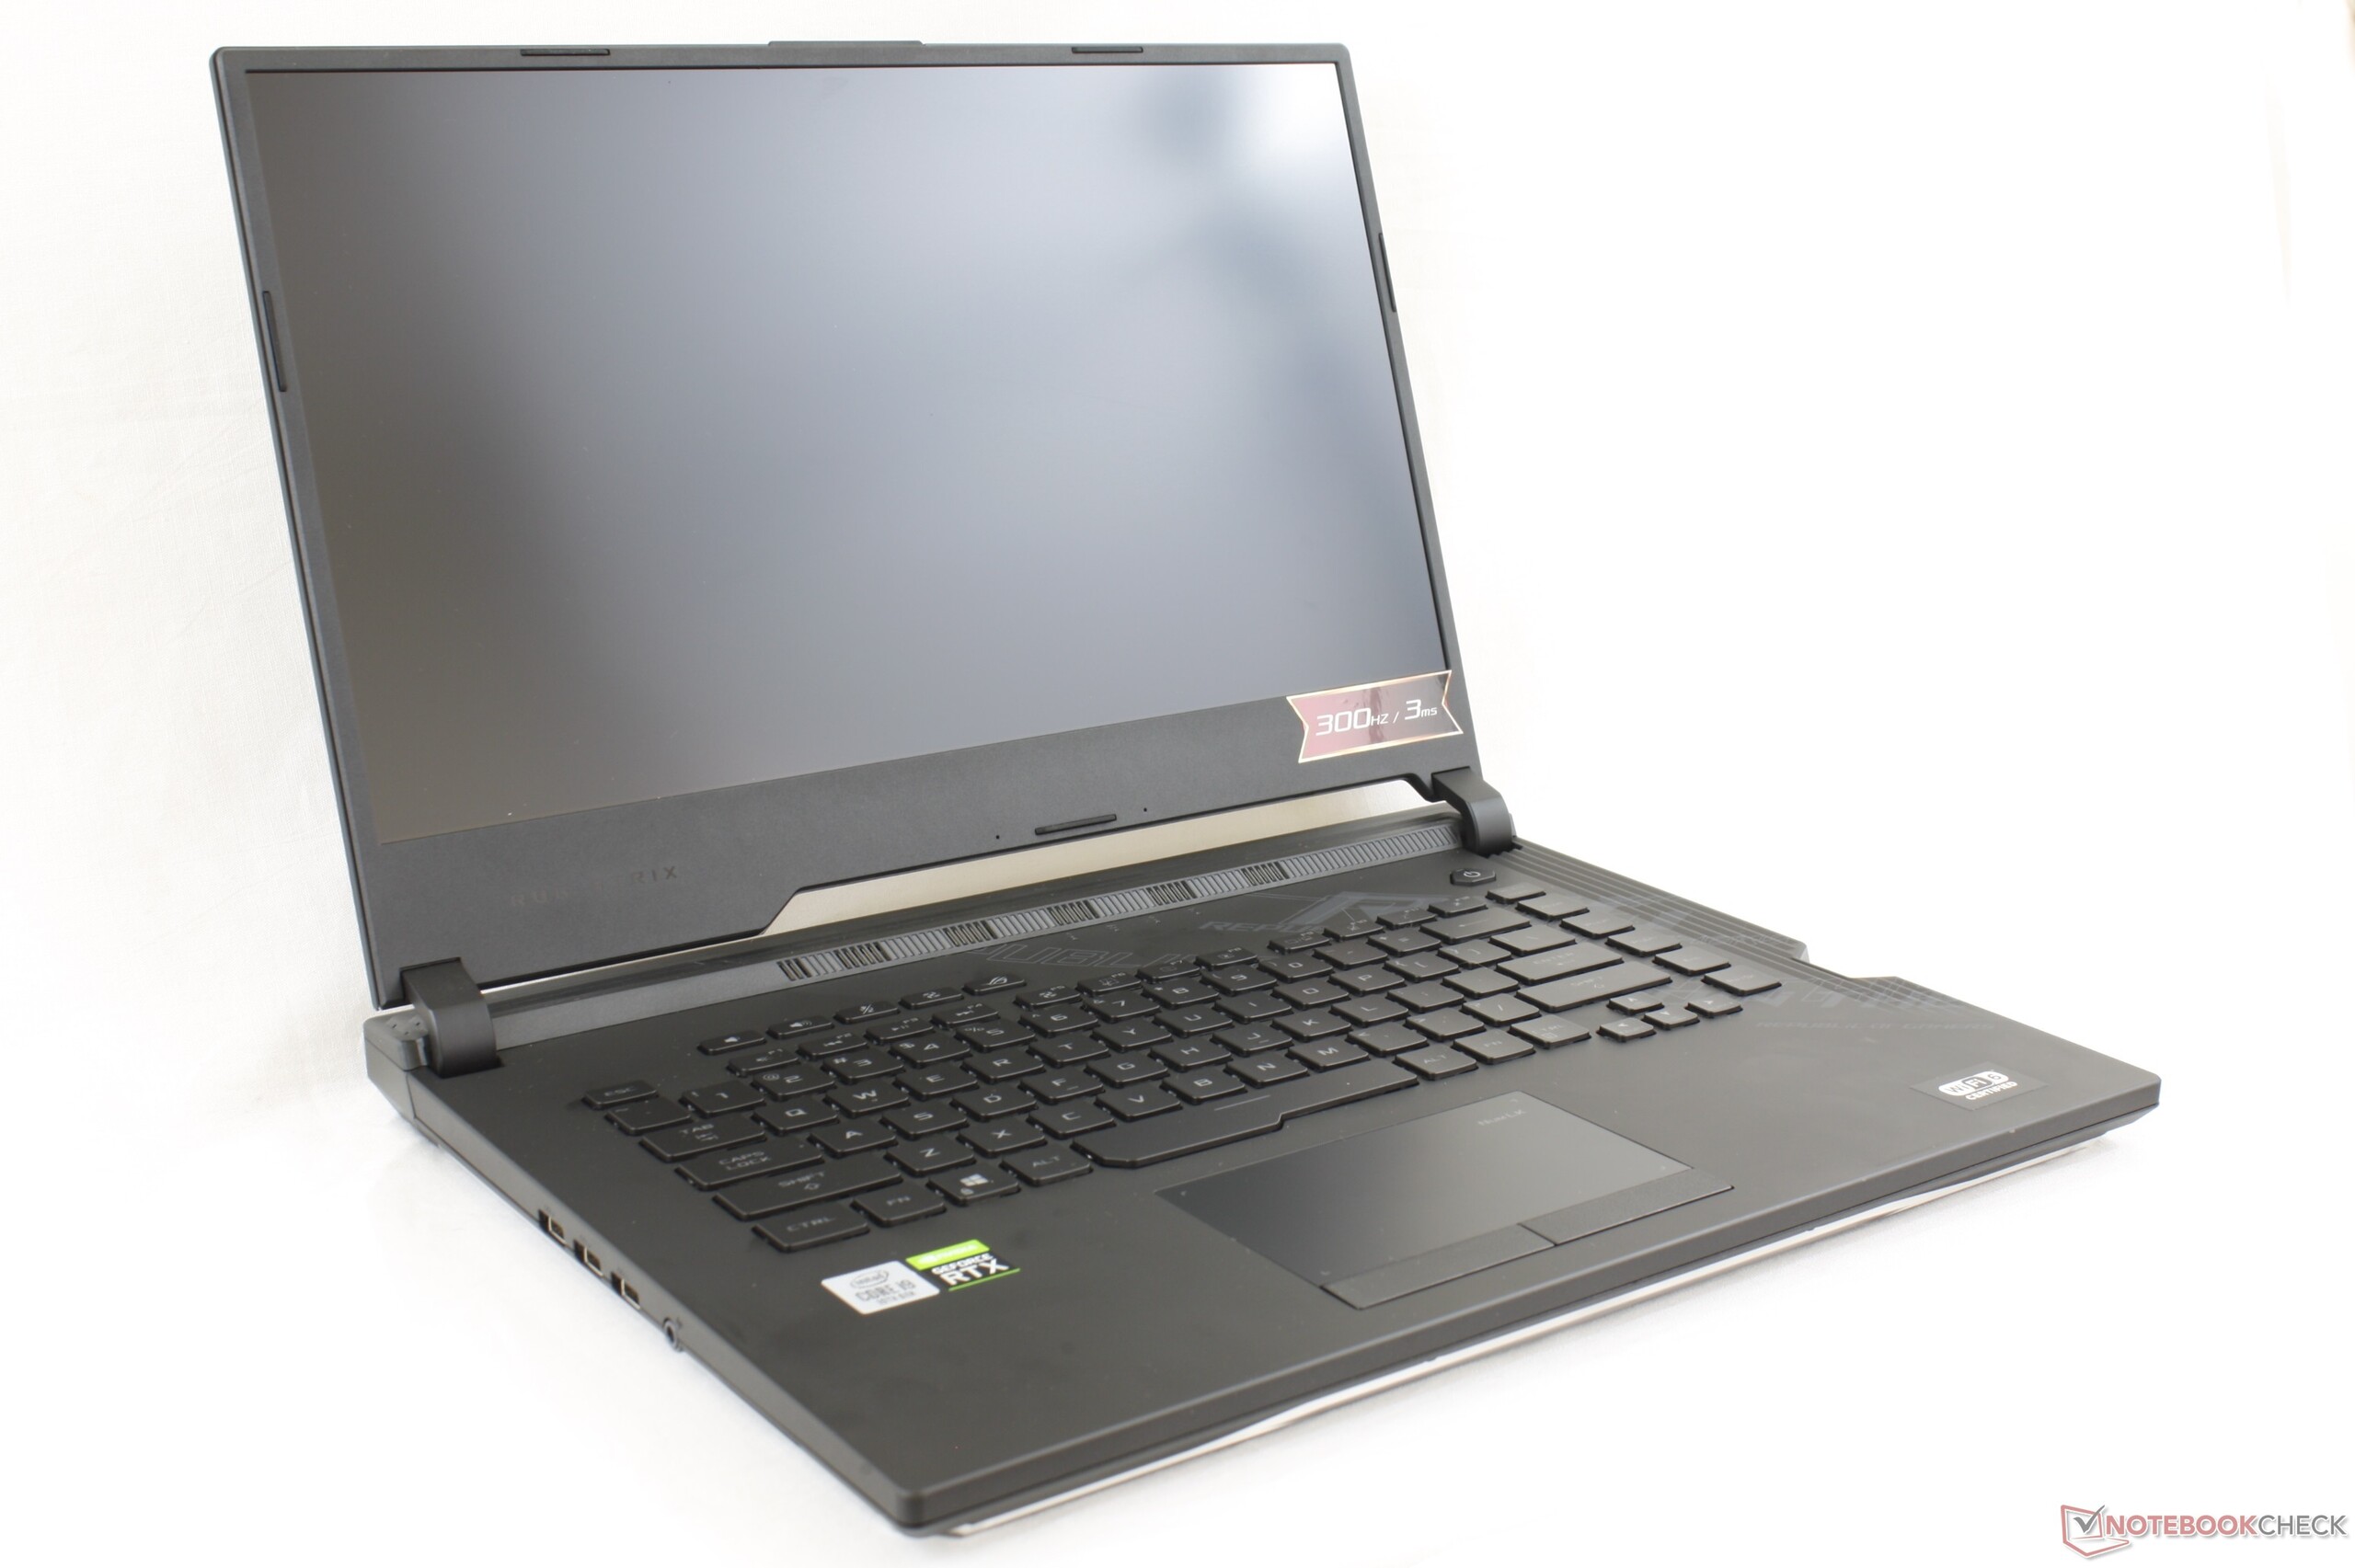
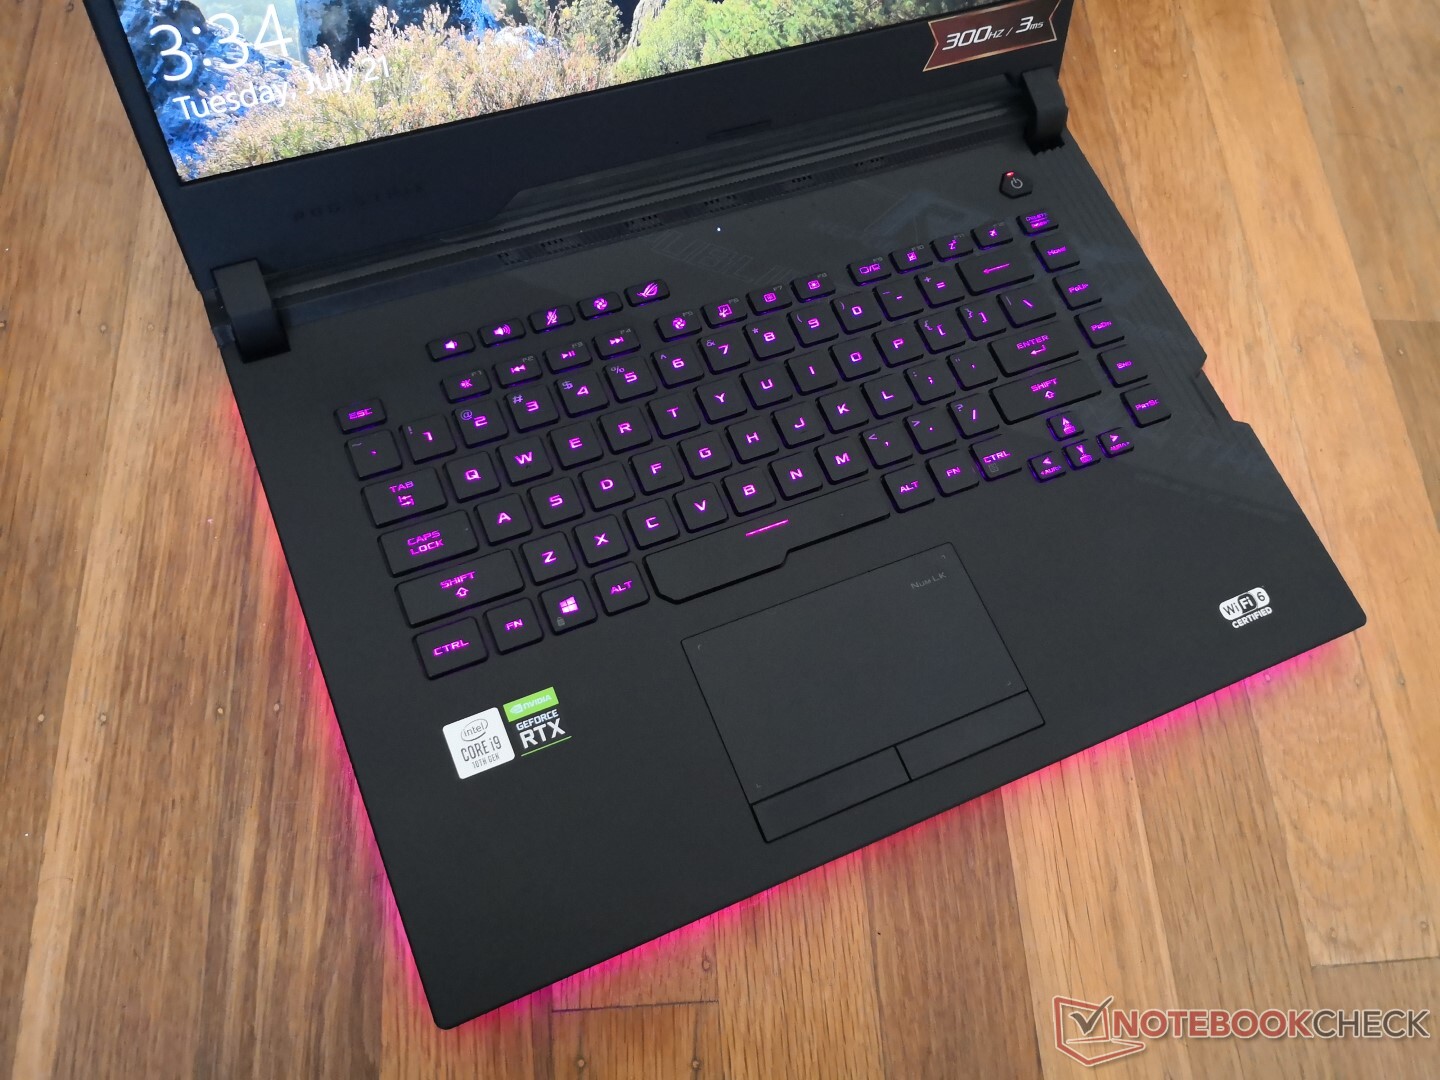
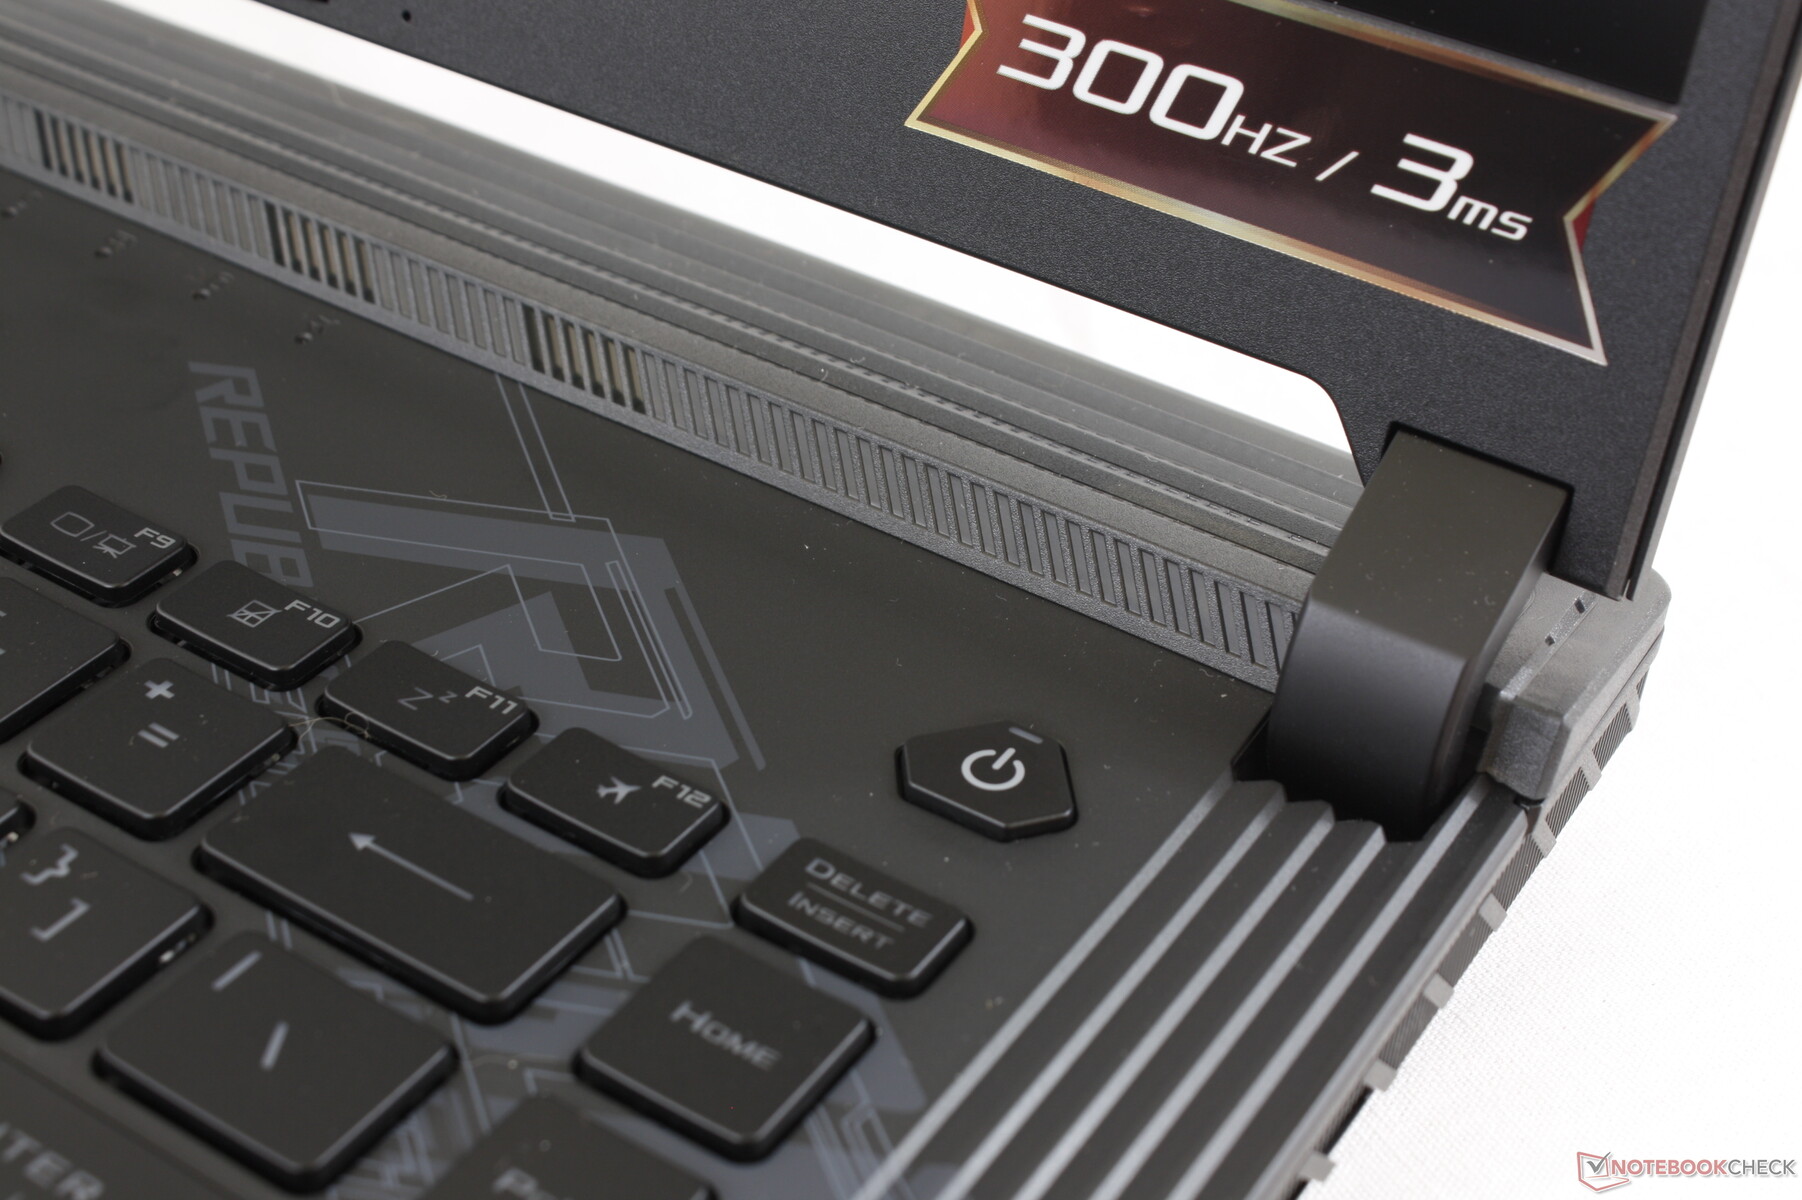
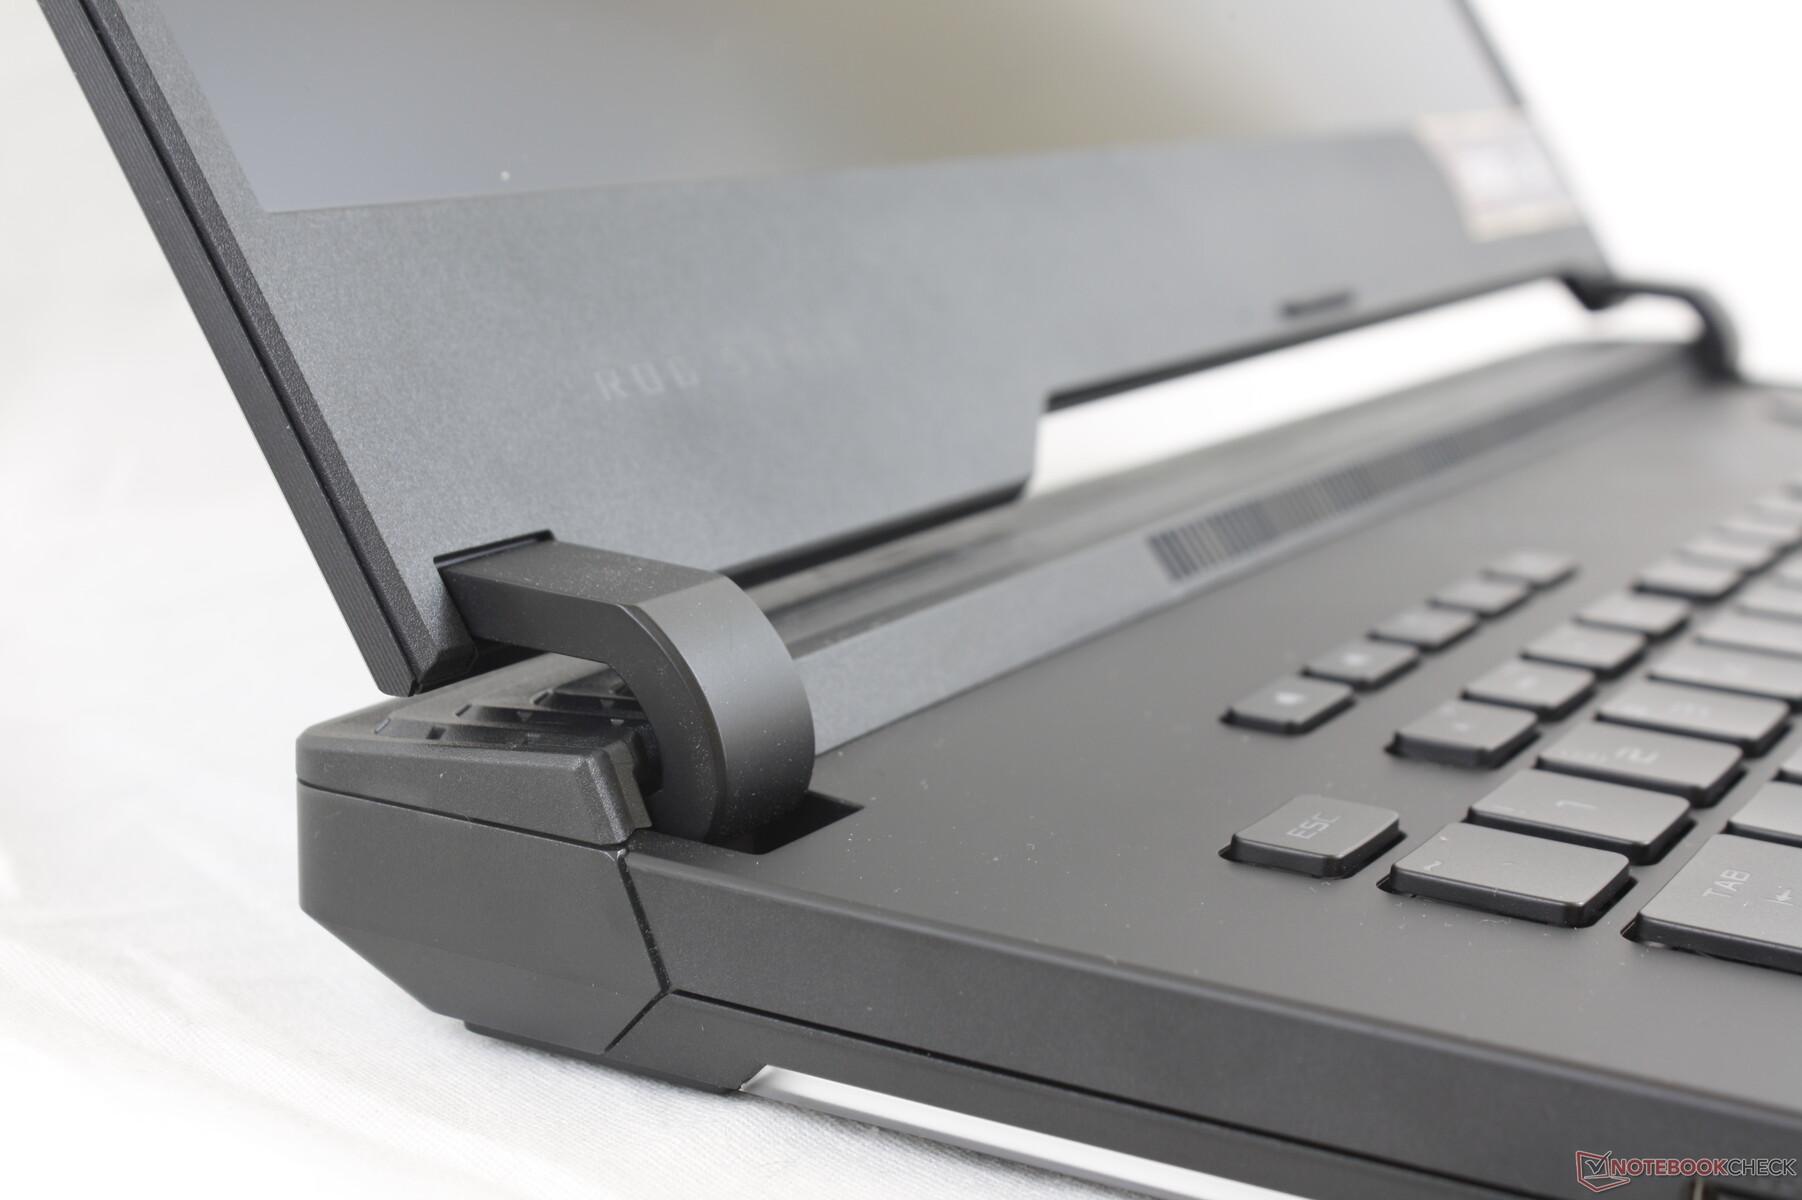
The underlying chassis design is the same as the Asus ROG G531, GL531, and the G512 including the unique LED bar along the bottom edges of the base. The hinges, keyboard, visual style, and webcam-less display lid are all identical between these systems. The only differences between the G532 and G531 are mostly aesthetic such as the new rubberized keyboard deck and matte outer lid as opposed to the checkerboard and brushed aluminum surfaces on the older model. The changes make for a more premium look and feel albeit at the cost of faster fingerprint buildup.
Chassis size and weight sit comfortably in between the smaller Zephyrus S GX531 and larger ROG G703 series. However, the extended rear makes the G532 noticeably larger than some of its closest competitors including the MSI GE66 and HP Omen X 2S.
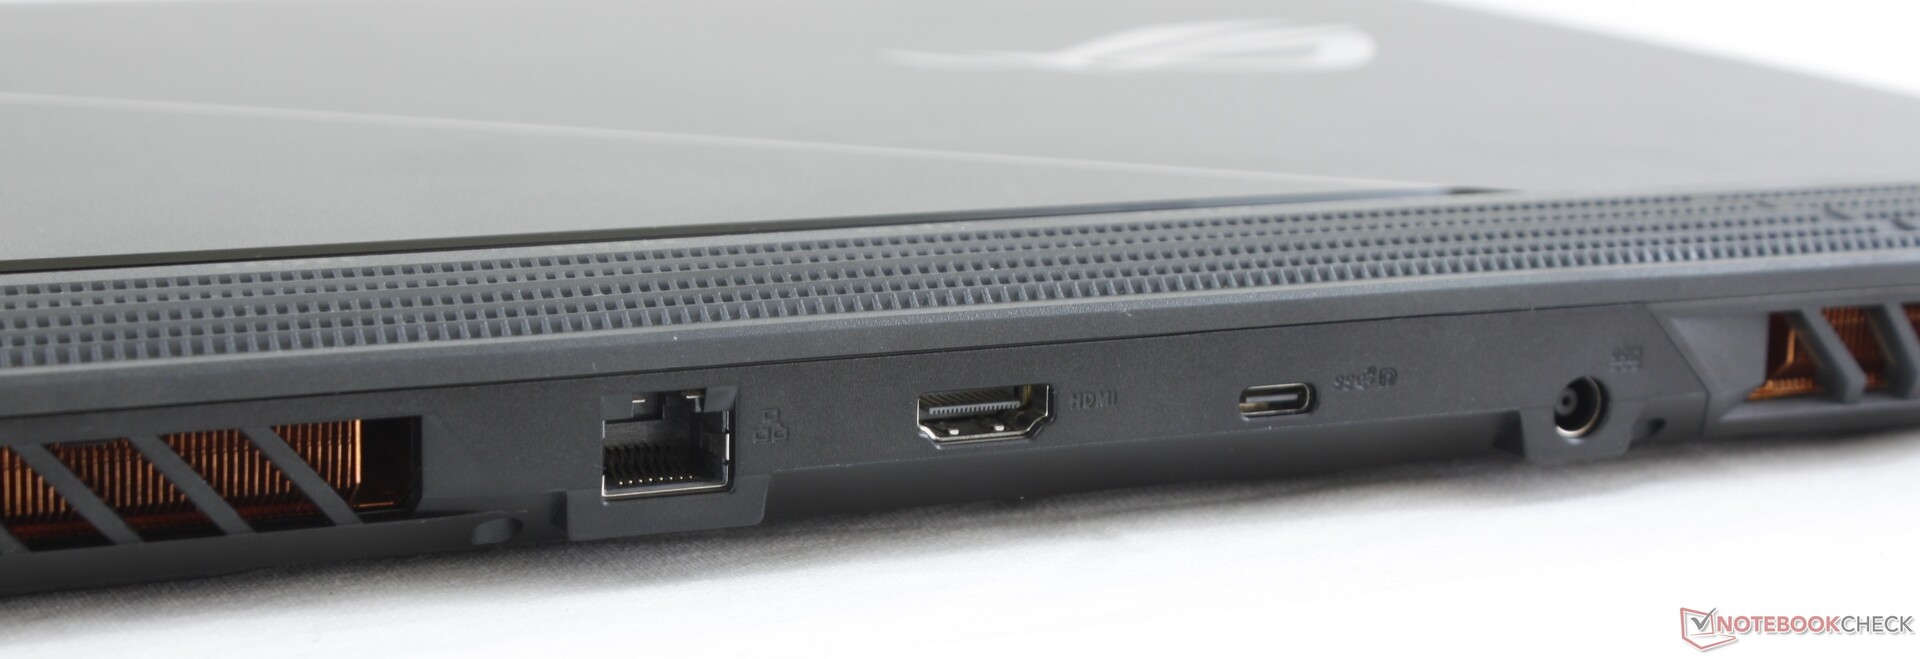
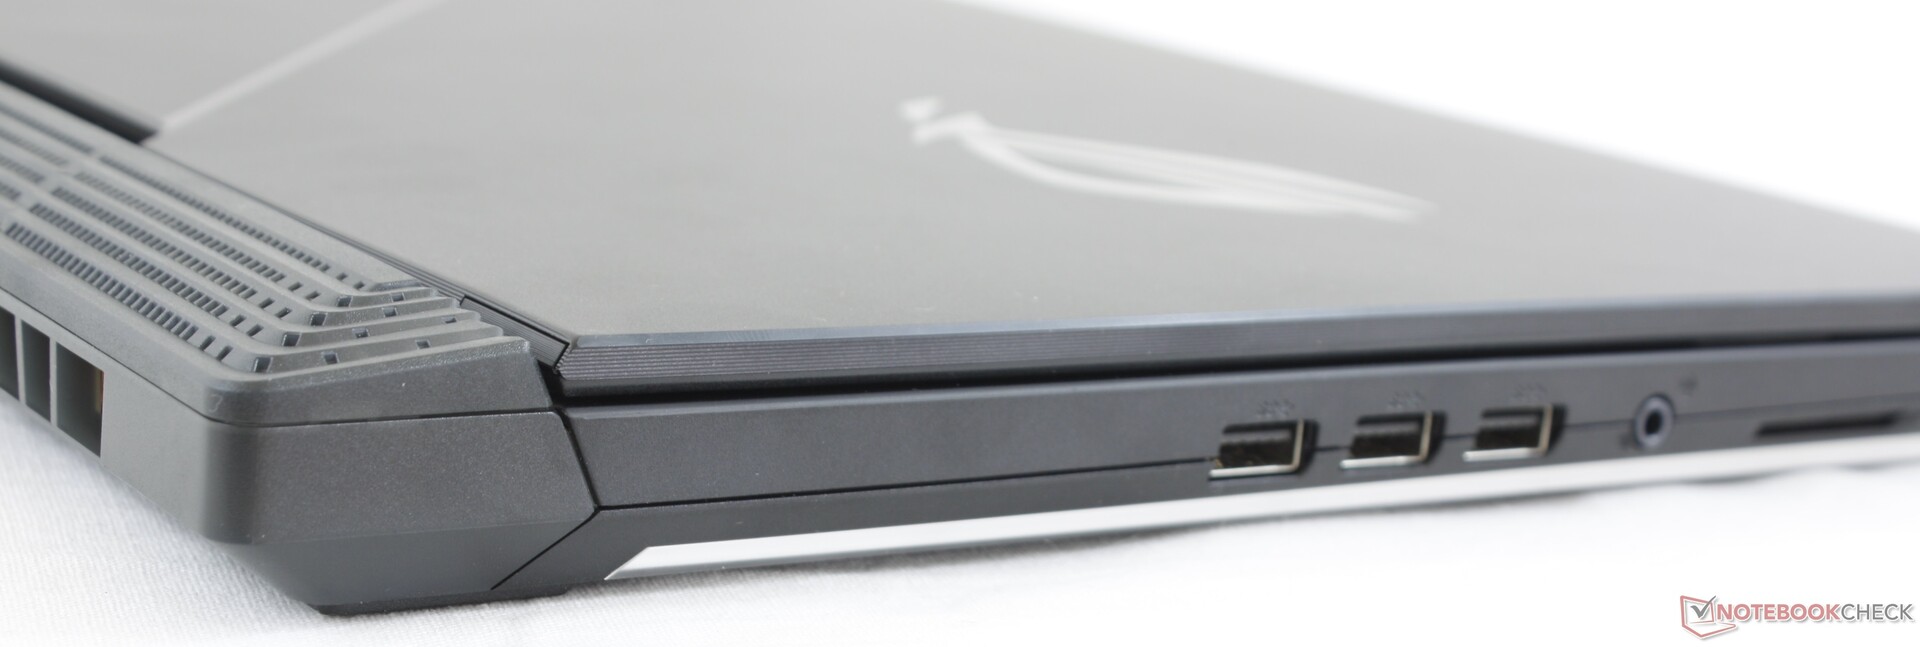
Connectivity
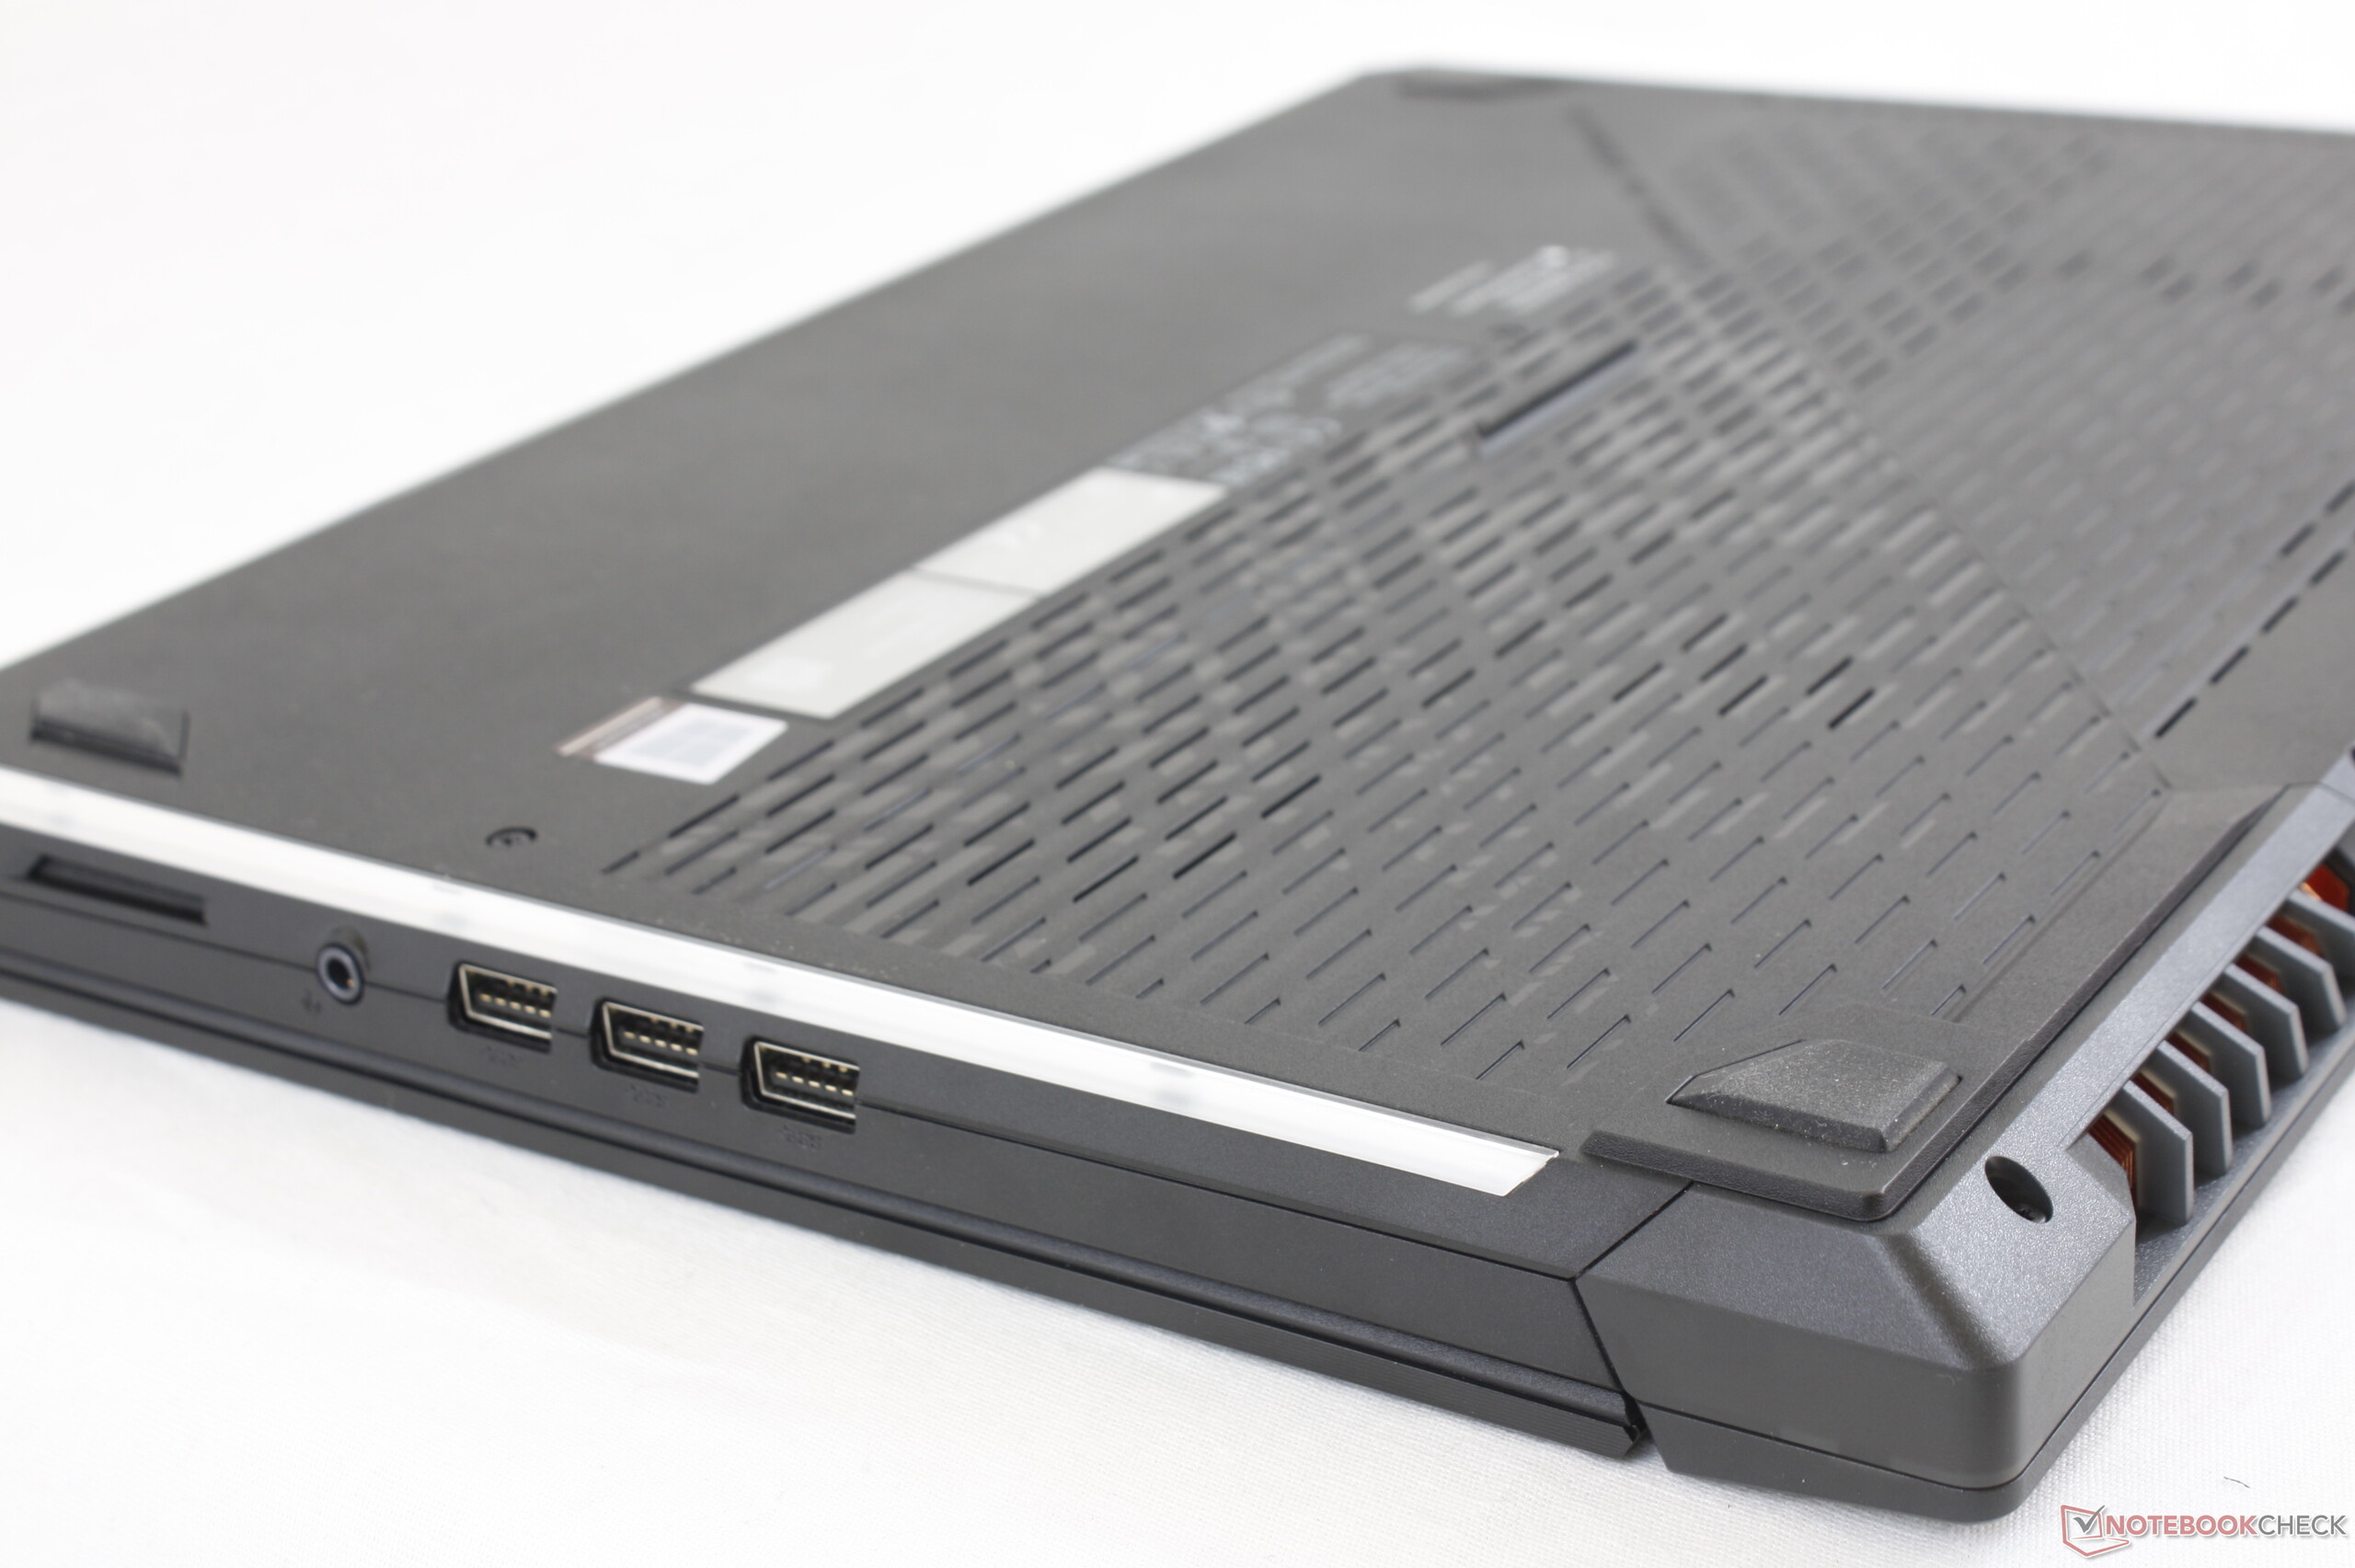
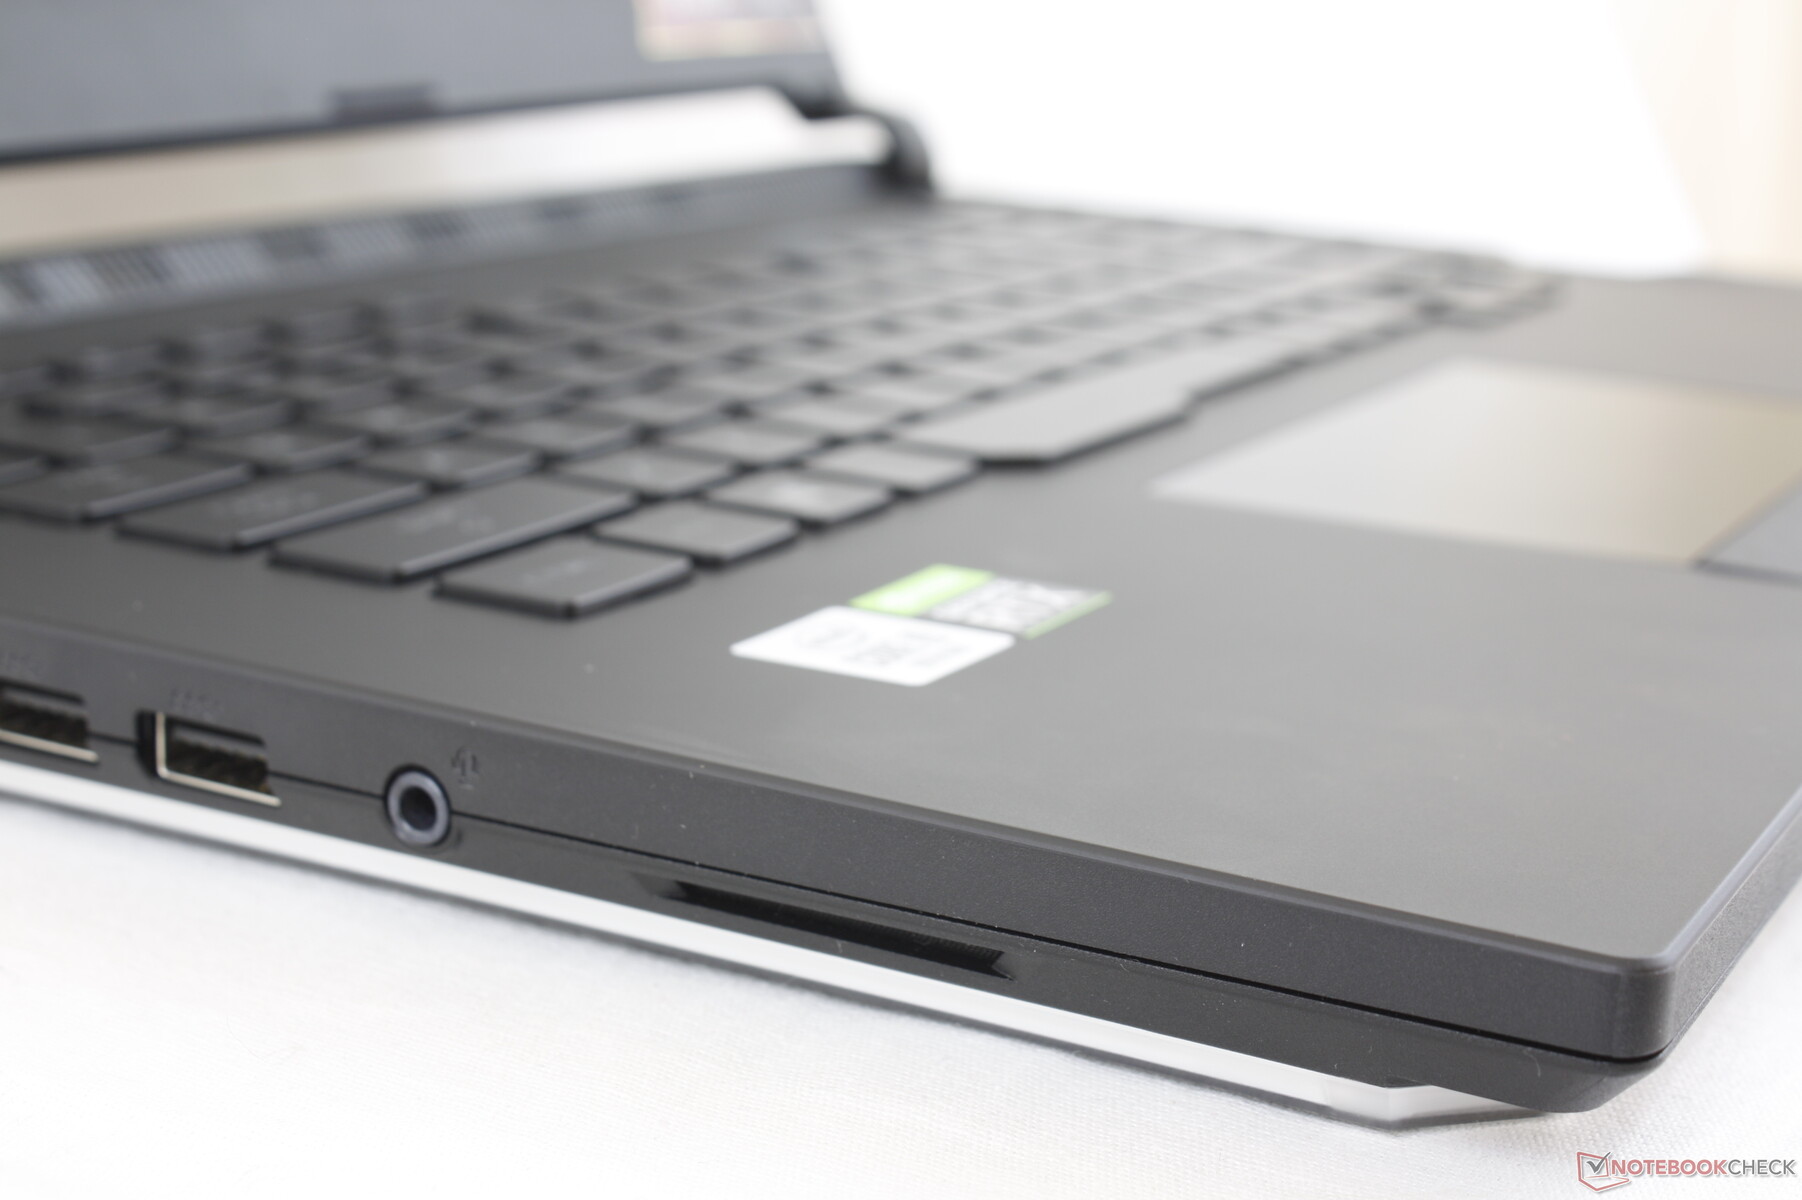
Port options and positioning are identical to what you'd find on the G532 or G512 including the lack of Thunderbolt 3. We would at least like to see a 2.5 Gbps RJ-45 port on a laptop this pricey, but the system comes with the standard 1 Gbps RJ-45 only.
Communication
The Intel AX201 comes standard on all SKUs for Wi-Fi 6 compatibility. We experienced no connectivity issues when paired with our Netgear RAX200 test router.
Maintenance
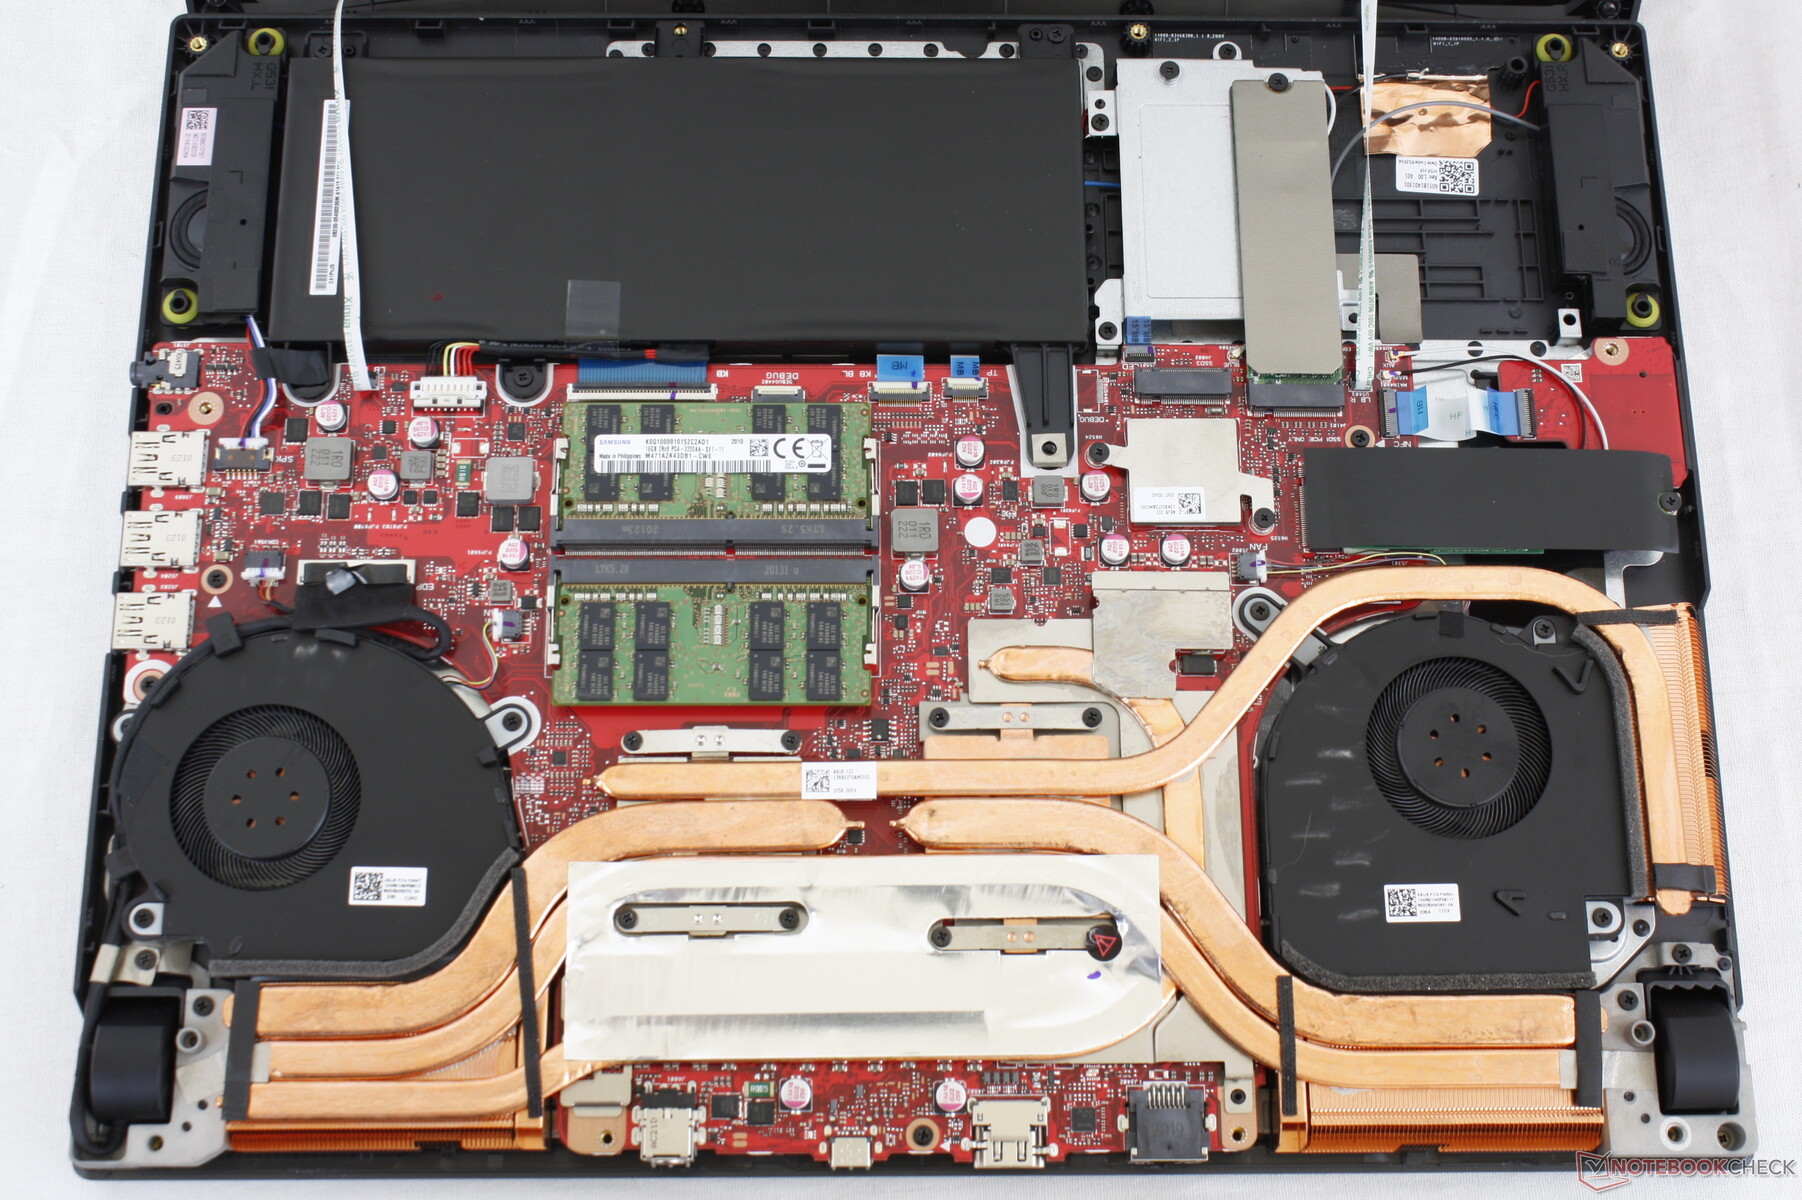
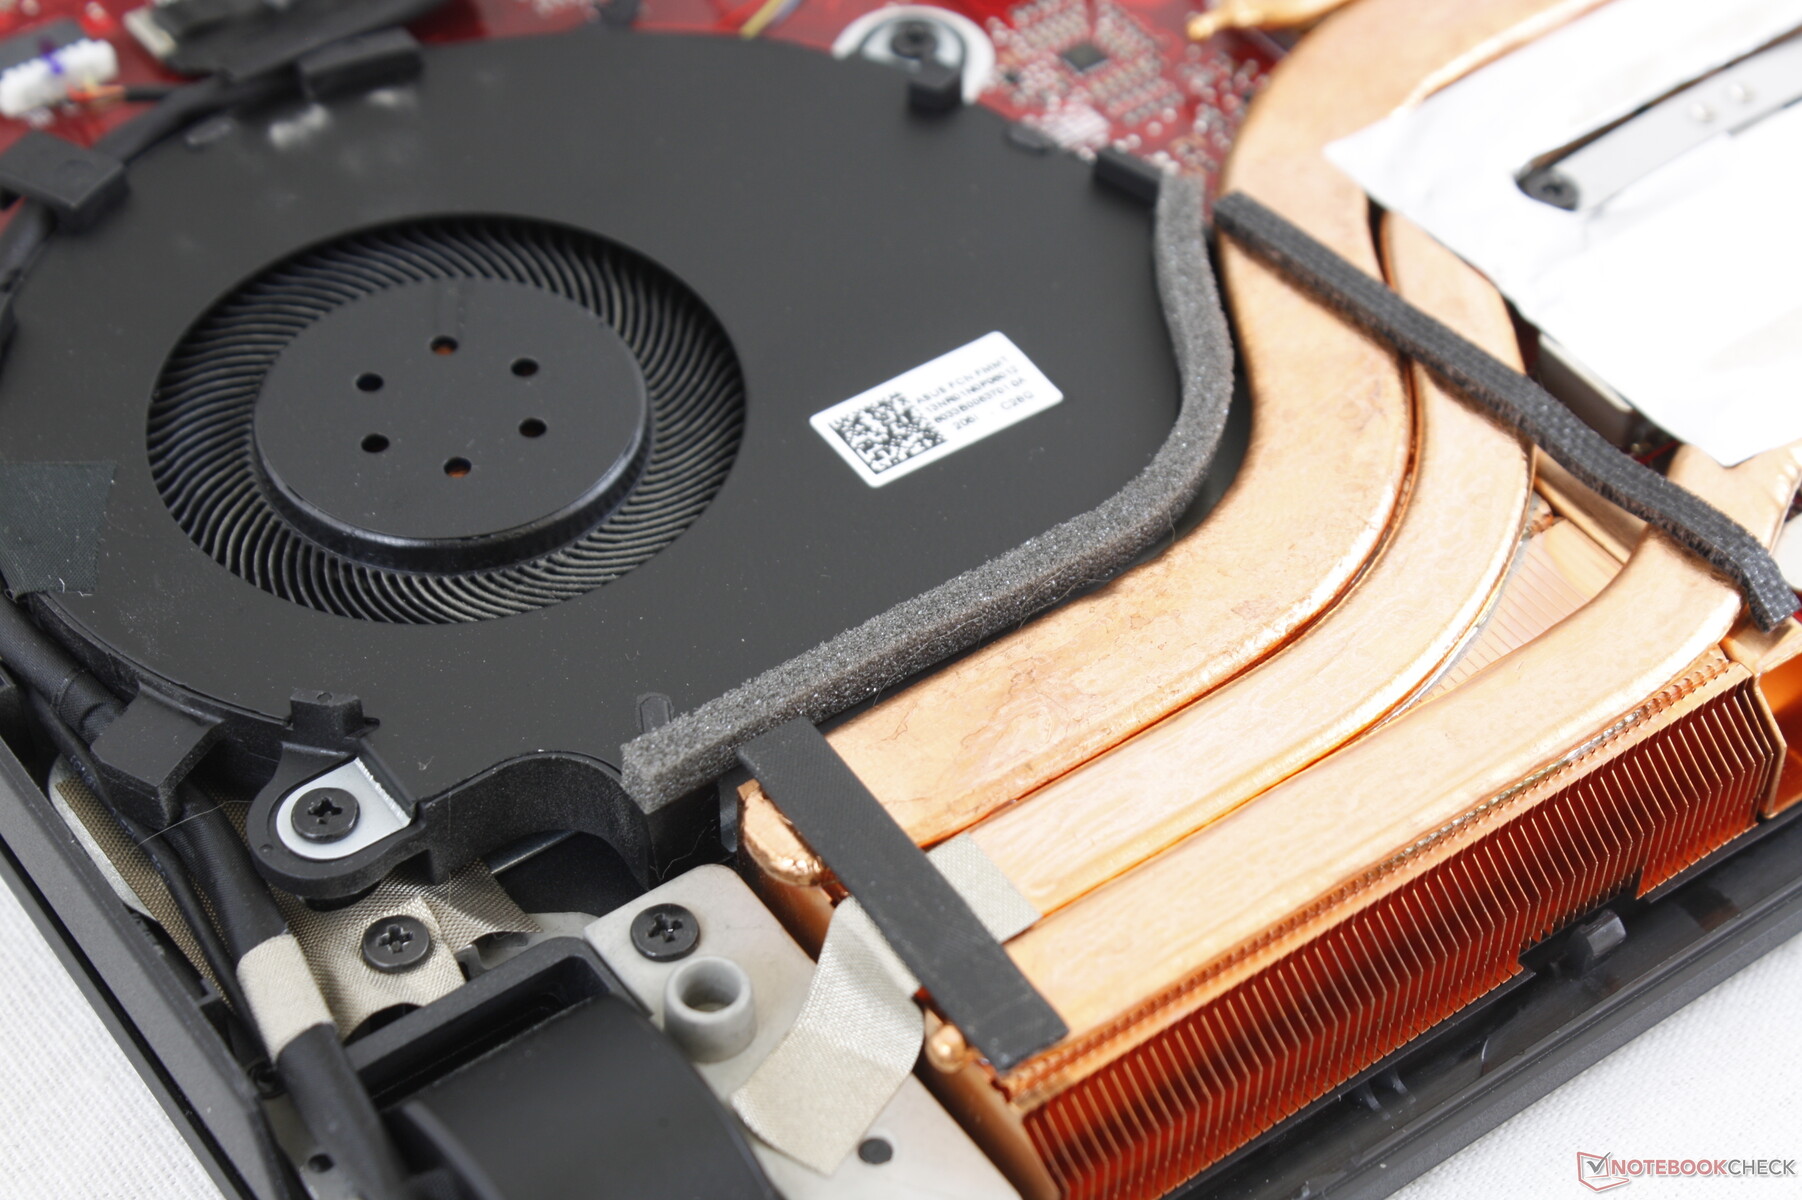
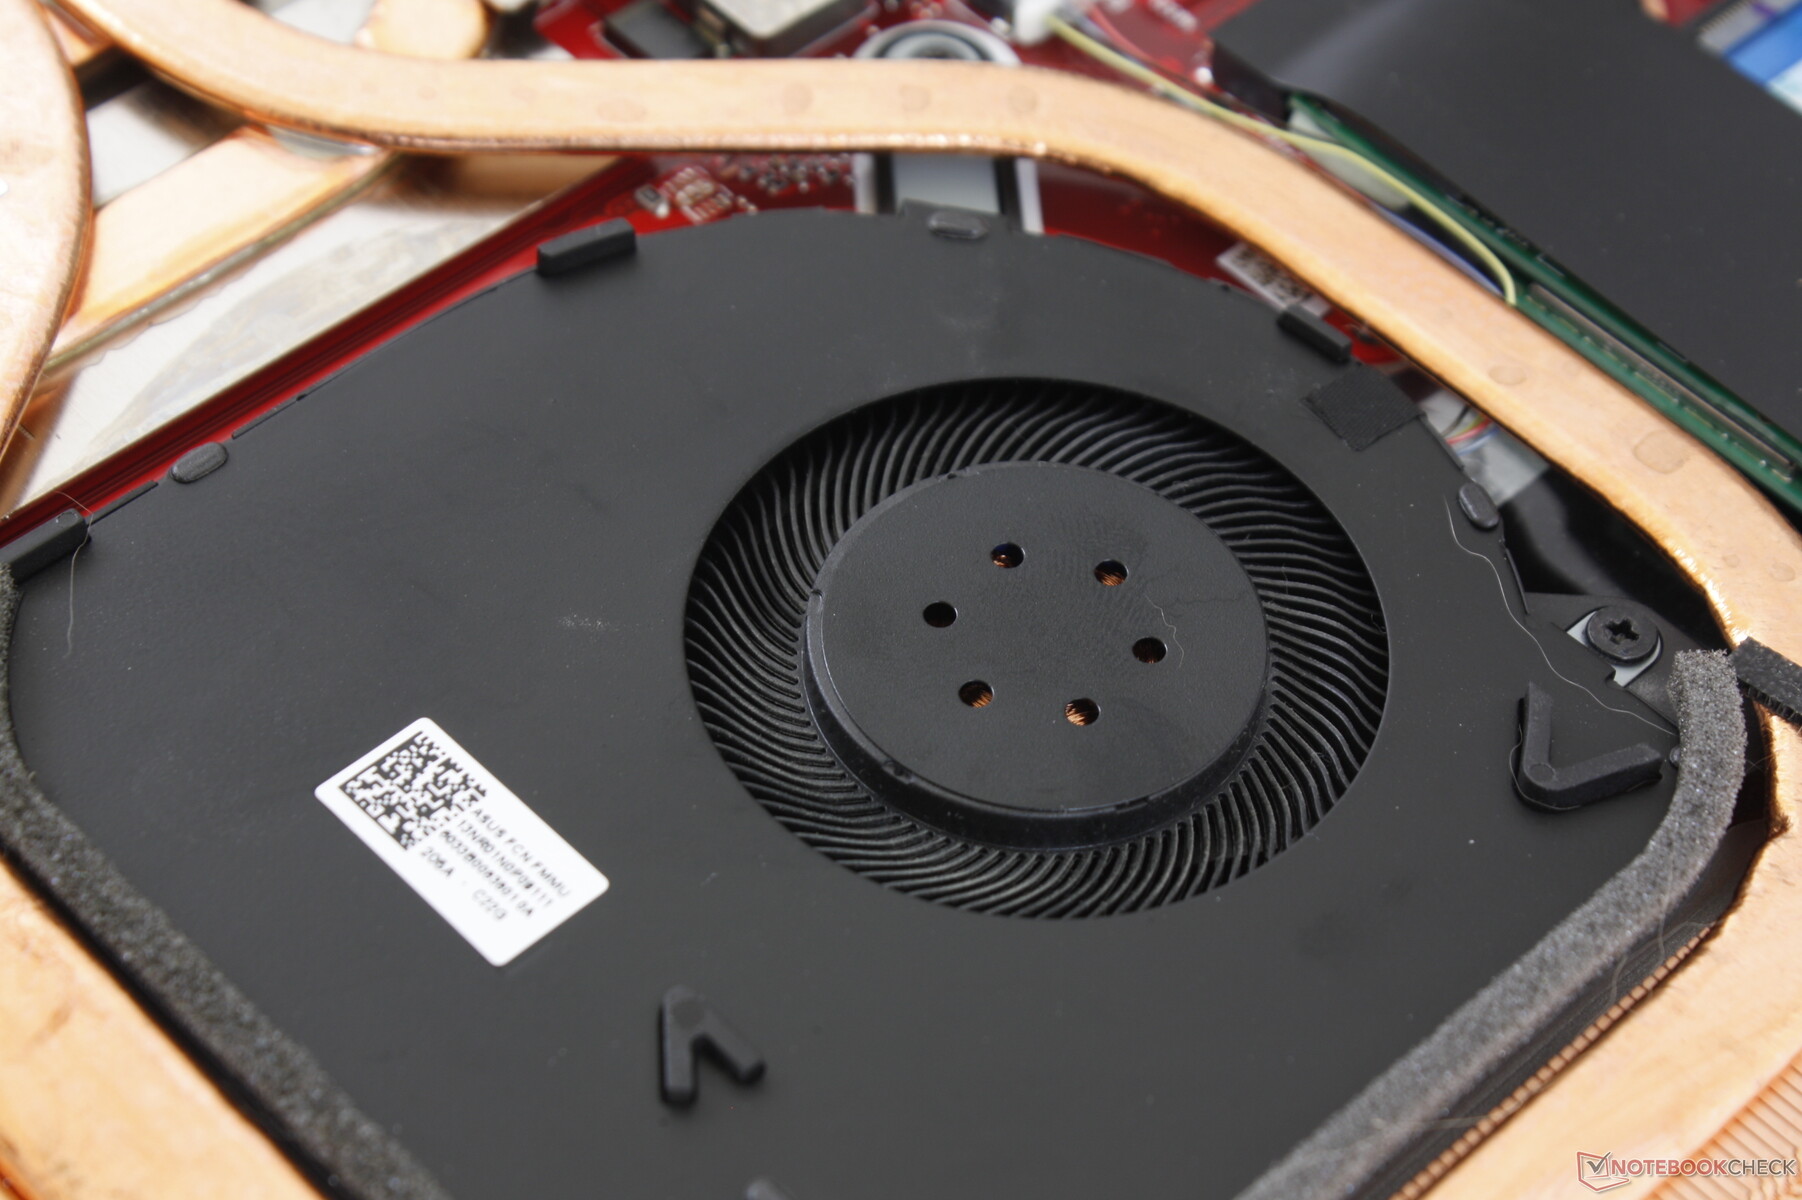
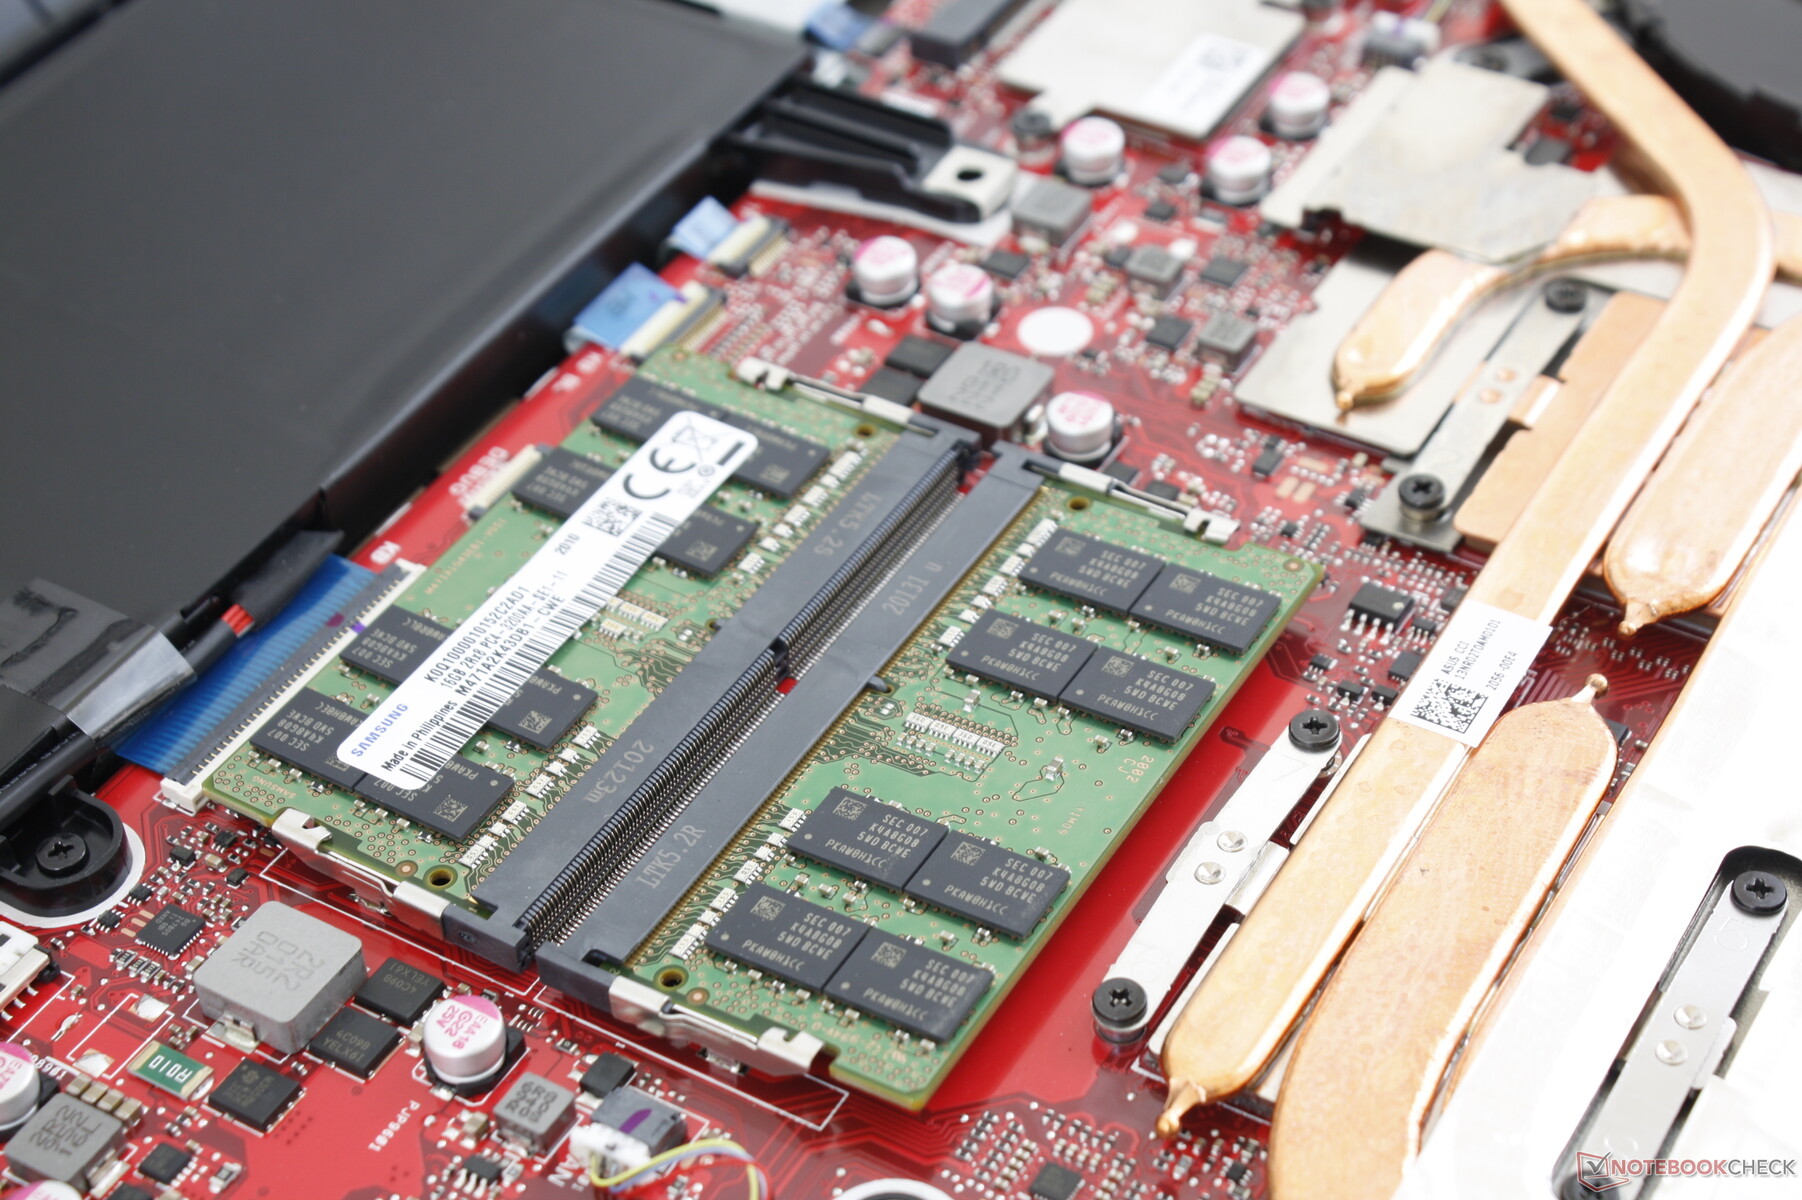
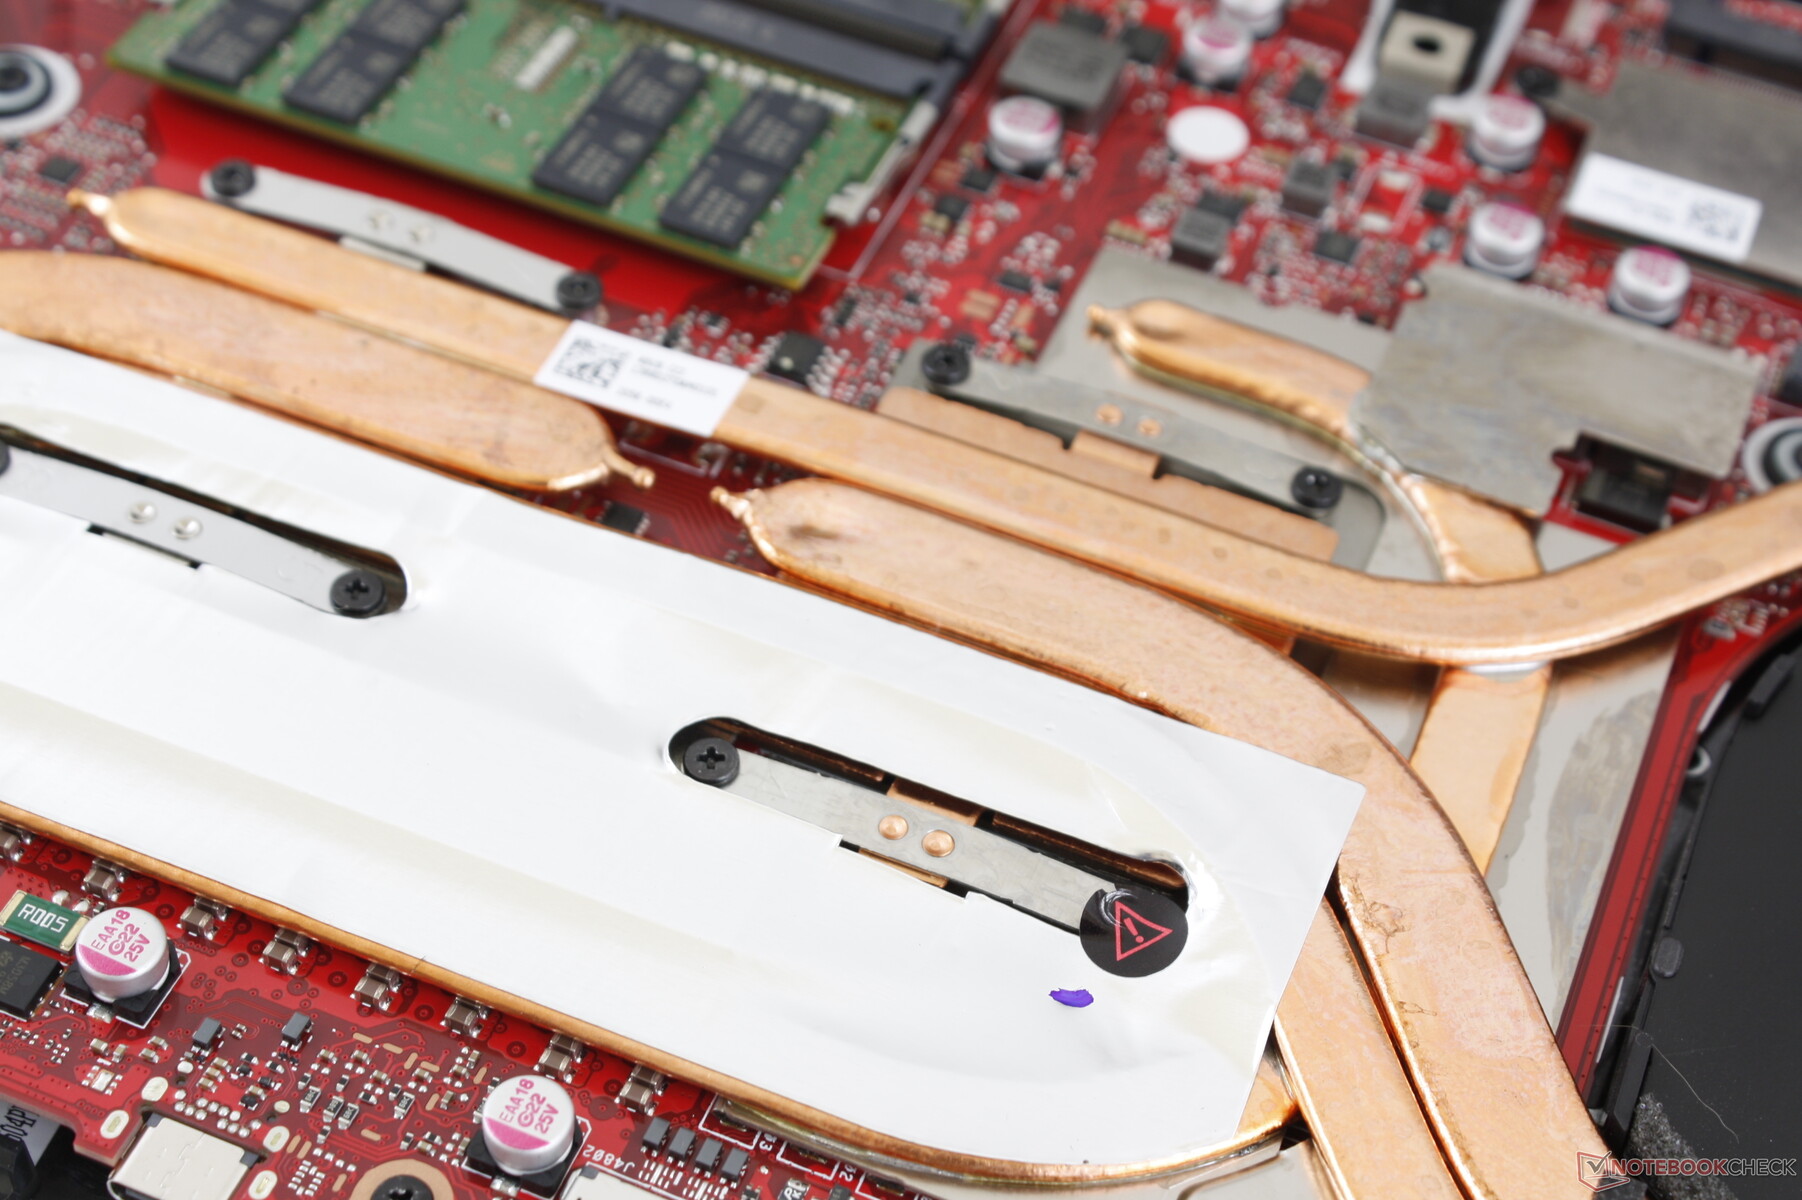
The bottom panel requires only a Philips screwdriver for easy servicing, but two delicate ribbon cables connect the bottom base light bar to the motherboard. Be careful to not damage these cables.
Accessories and Warranty
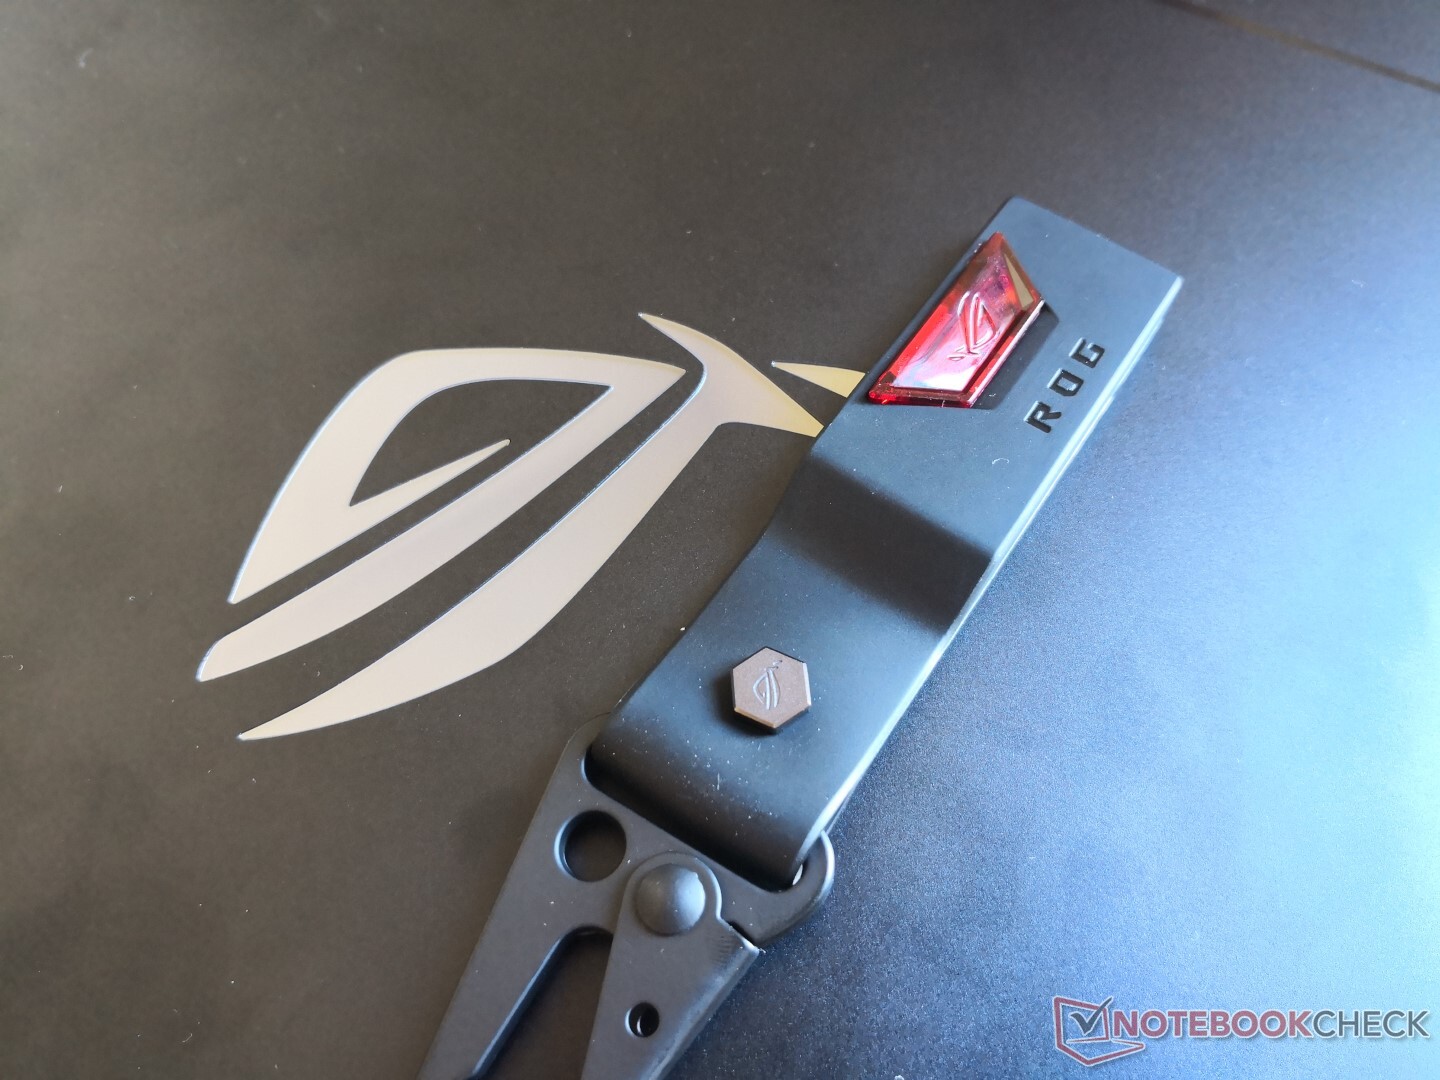
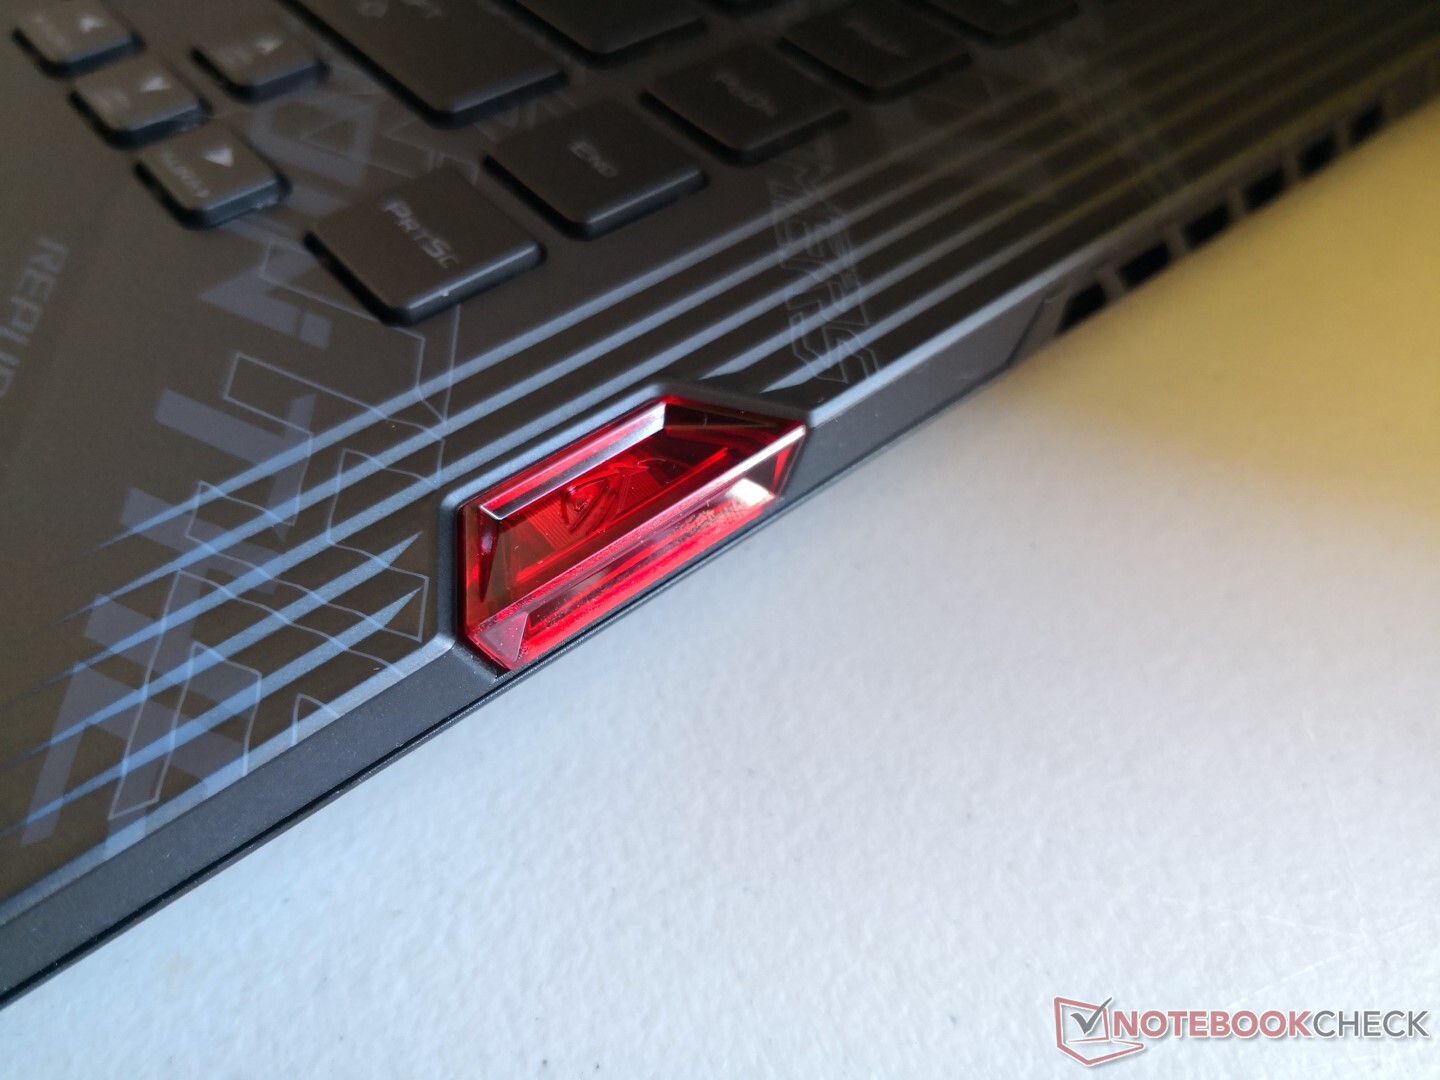
An Asus ROG Keystone is included in the box for saving personalized Armoury Crate settings and hidden "shadow" drives between compatible systems. The problem is that very few ROG laptops even support Keystone which makes the feature not as useful as it could have been. We would like to see this proprietary technology on all ROG laptops to really make Keystone worthwhile.
The standard one-year limited warranty applies.
Input Devices
Keyboard and Touchpad
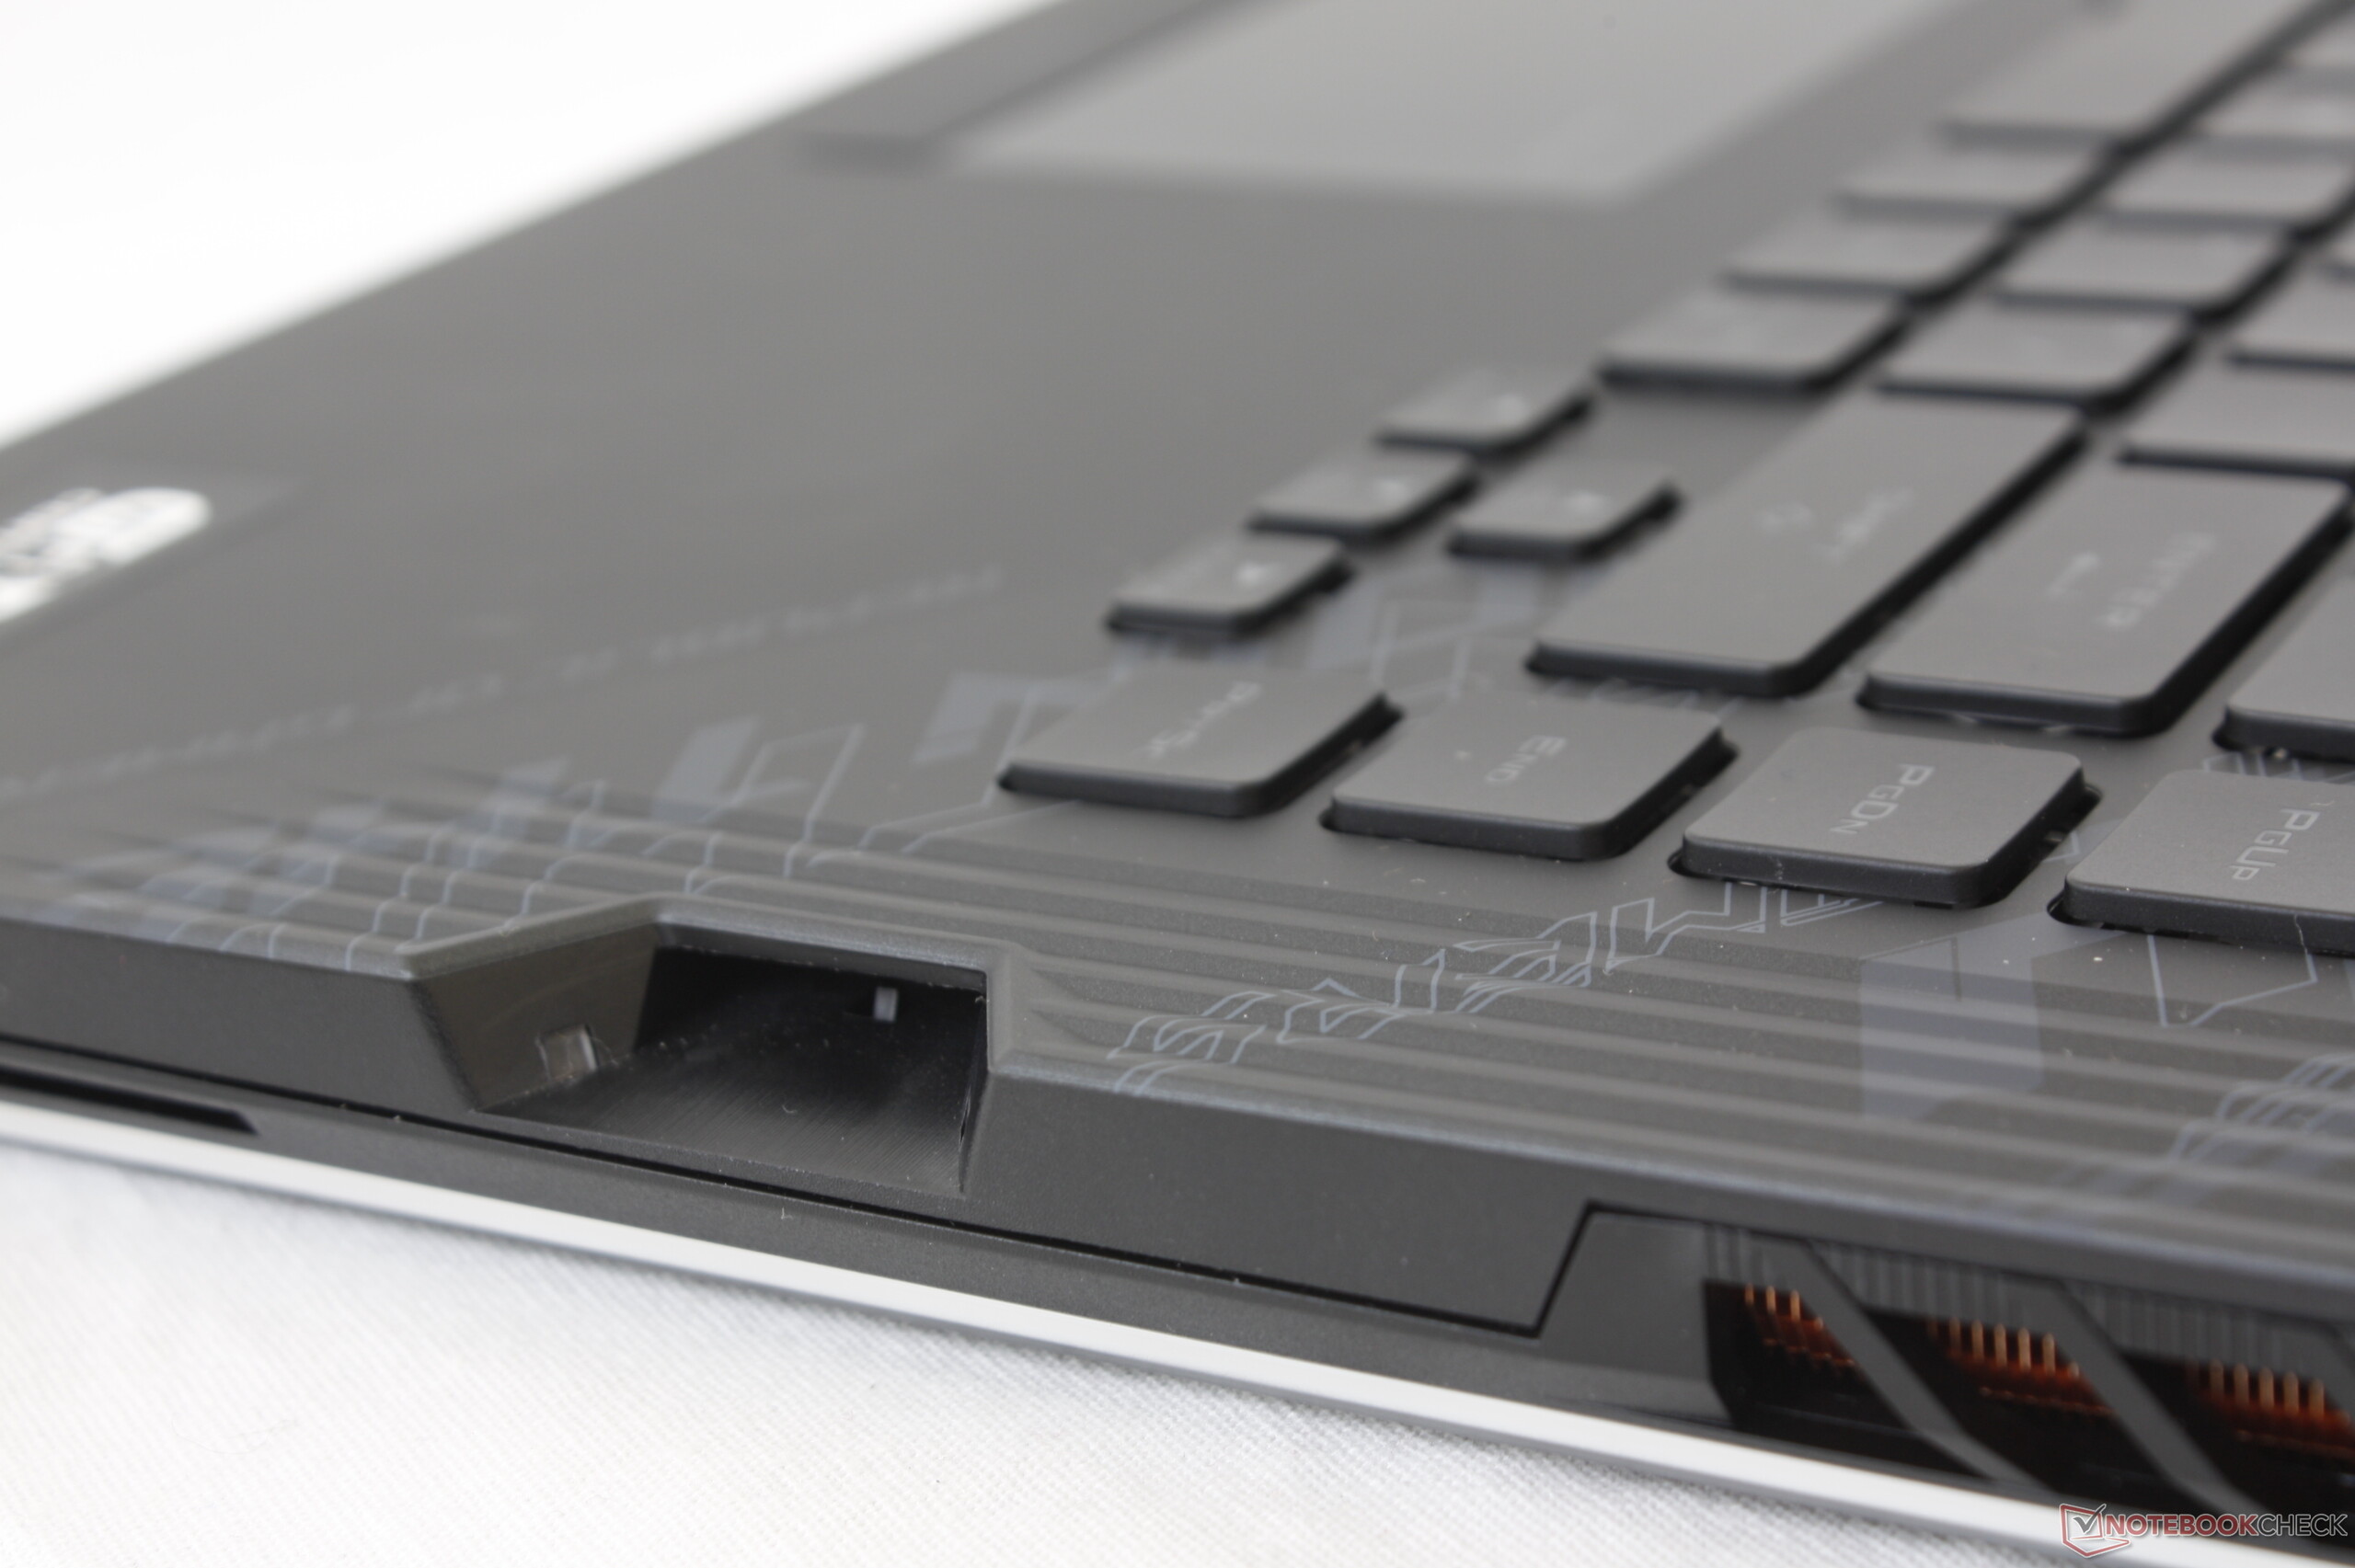
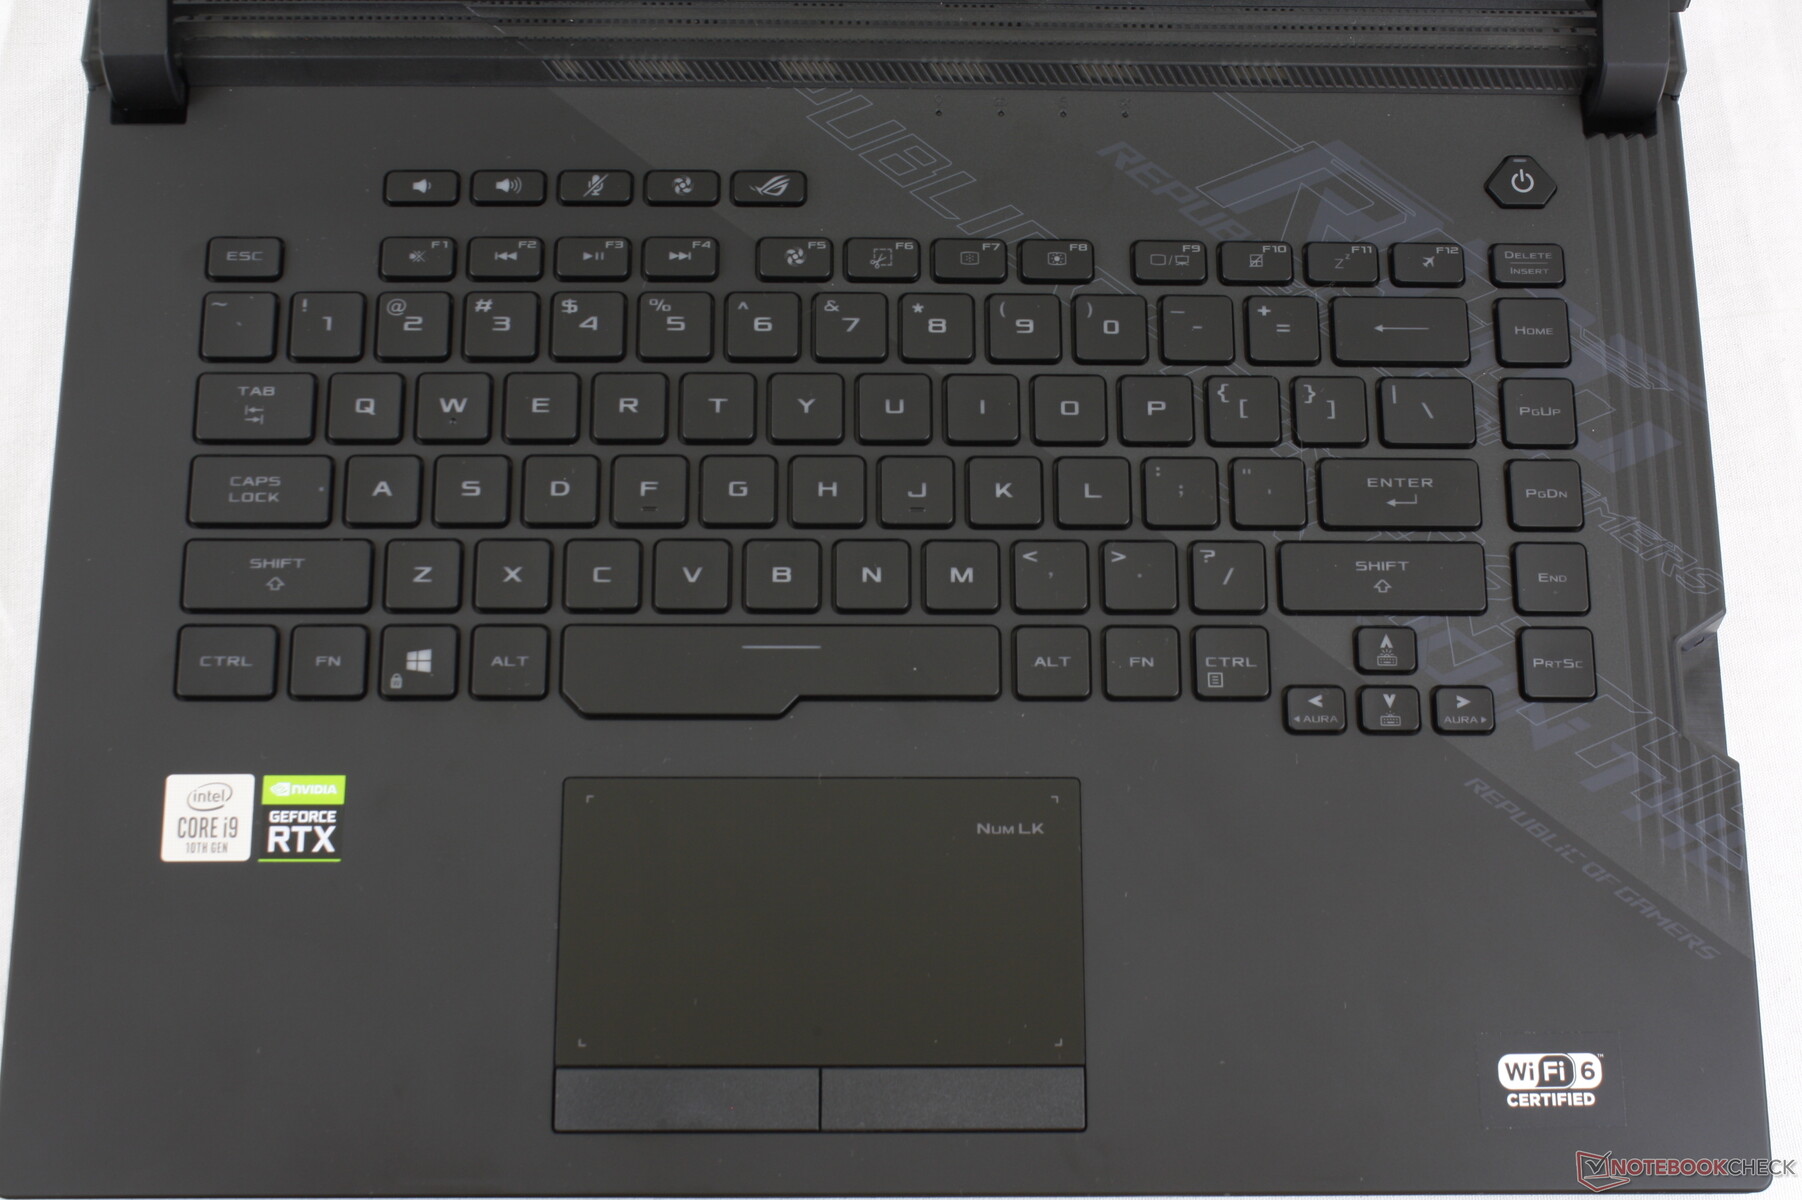
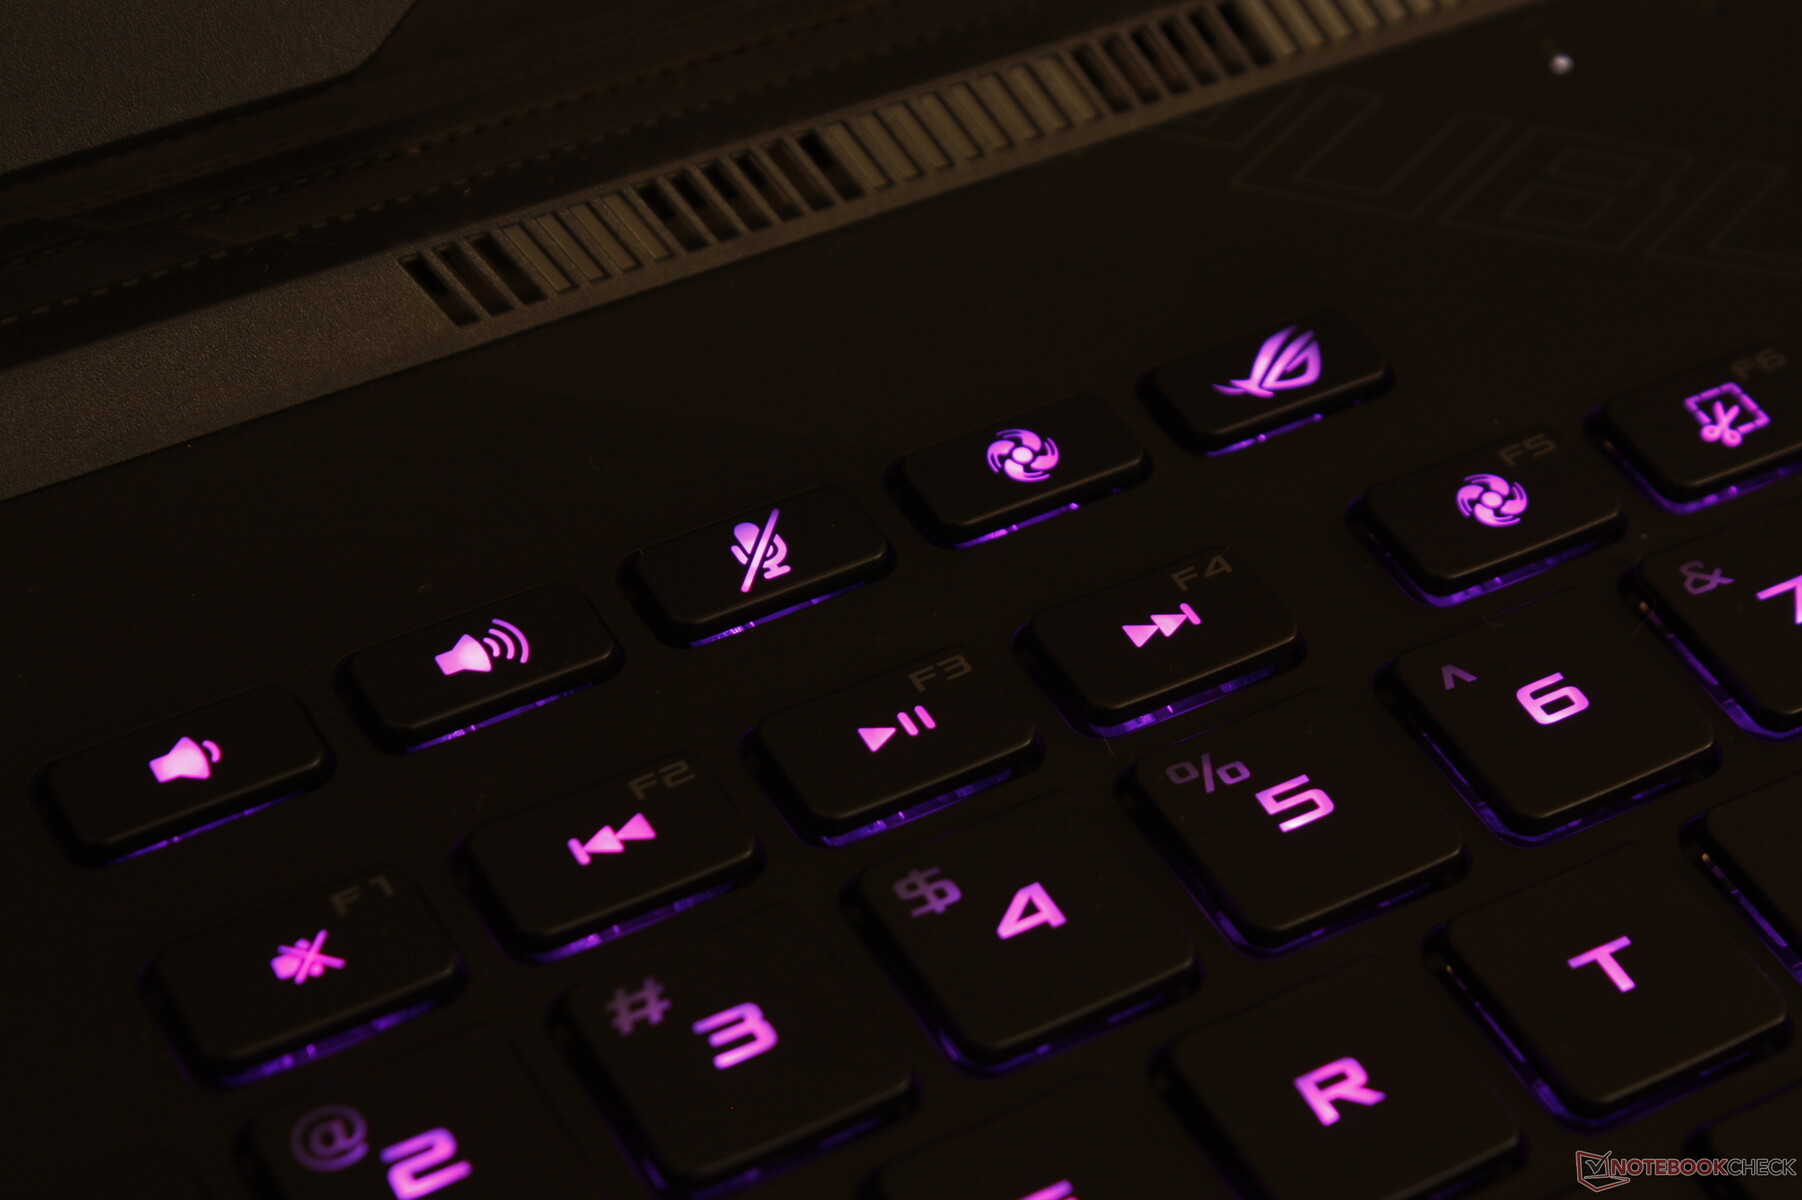
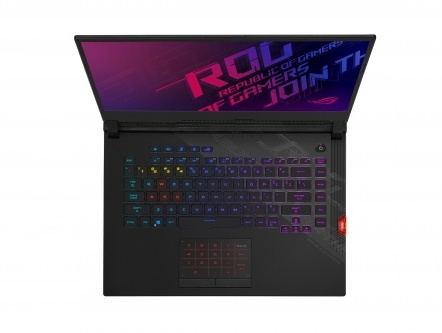
If you've typed on the G531 or G512 before, then you'll know what to expect on the G532 as the keyboard and touchpad (10.9 x 6 cm) remain identical. Typing is comfortable and the soft-touch keys feel more luxurious than straight-up plastic. However, Asus has yet to address the unlit function letters as shown by our image below. The dark gray font contrasts poorly with the black key caps as well and so the keys can be difficult to see when in a brightly lit environment.
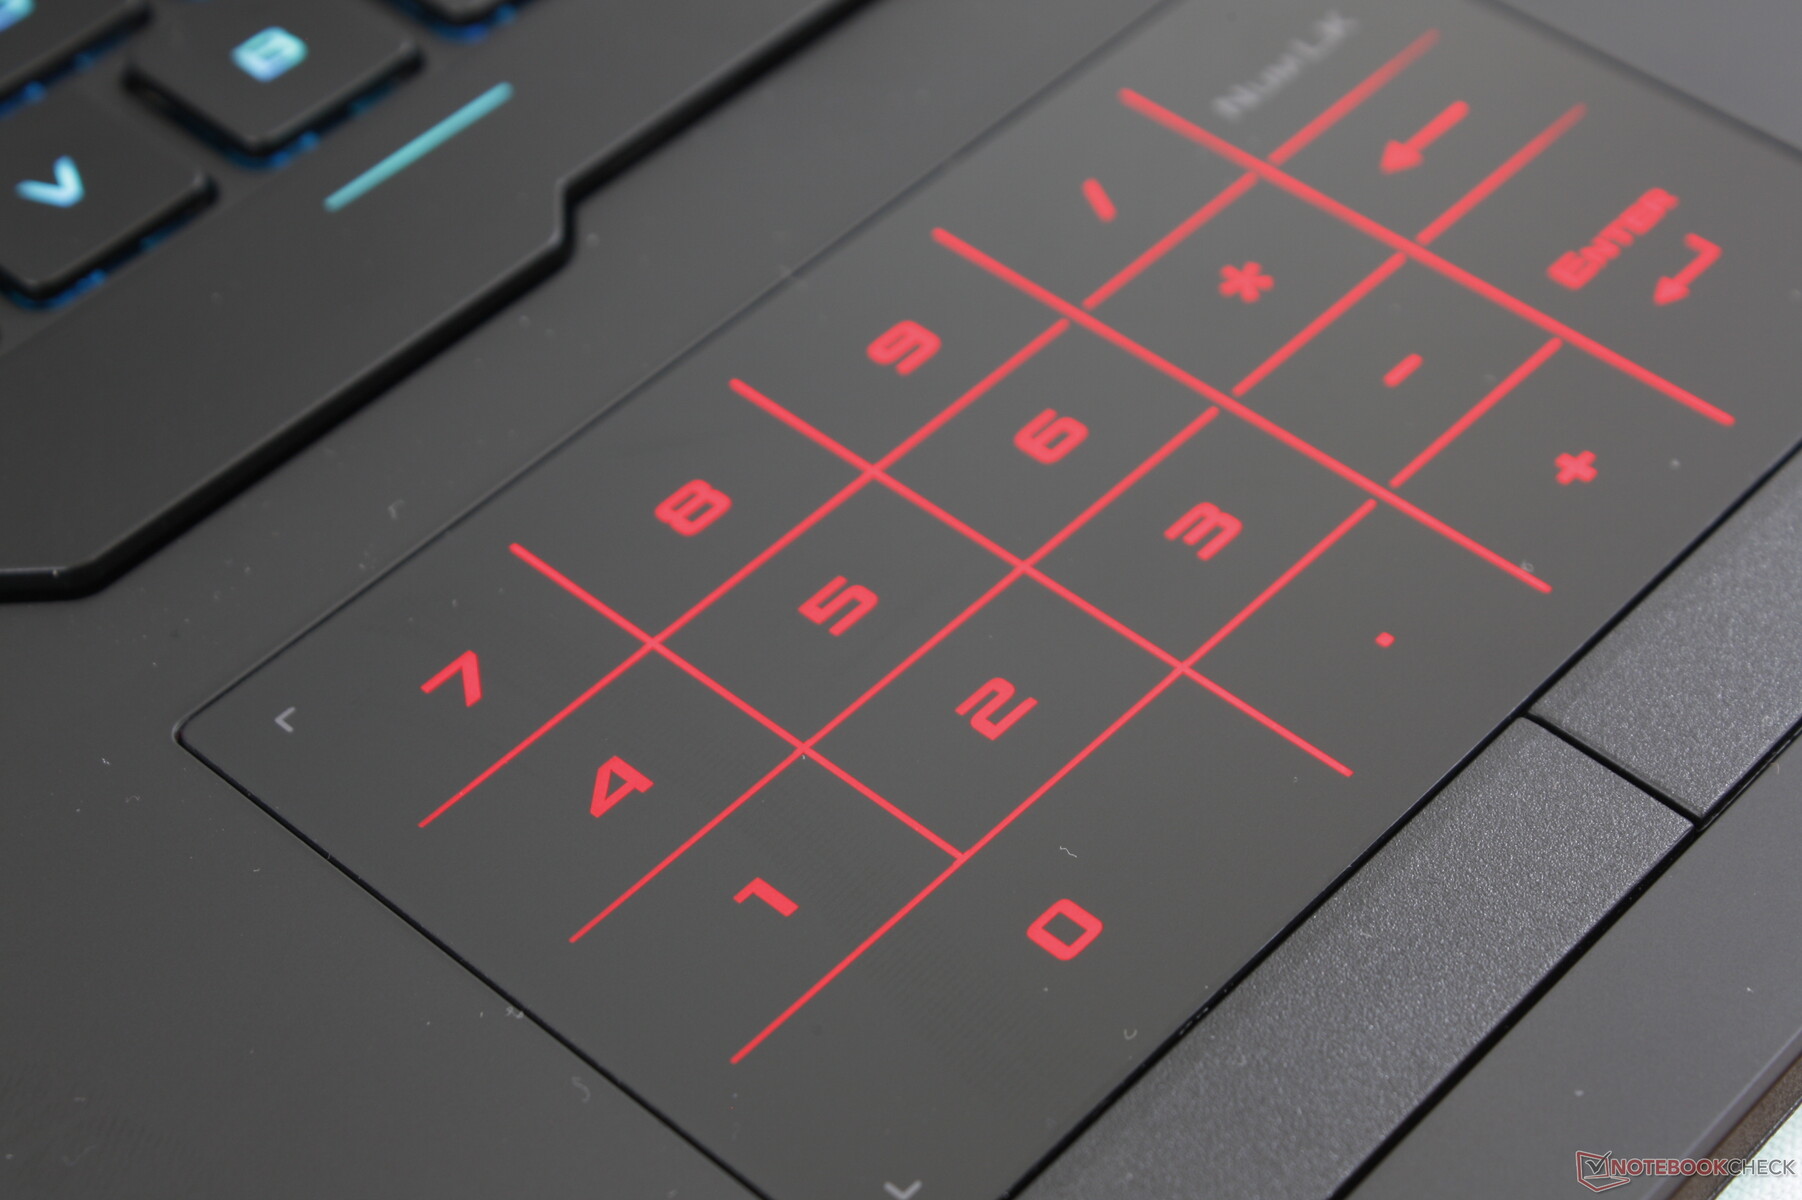
The virtual NumPad on the G531 makes a return. While neat, it's more of a novelty and users who rely on having a NumPad will be better off with a dedicated USB solution instead. The dedicated mouse keys are otherwise excellent with adequate feedback, relatively deep travel, and almost no audible click when pressed.
Display
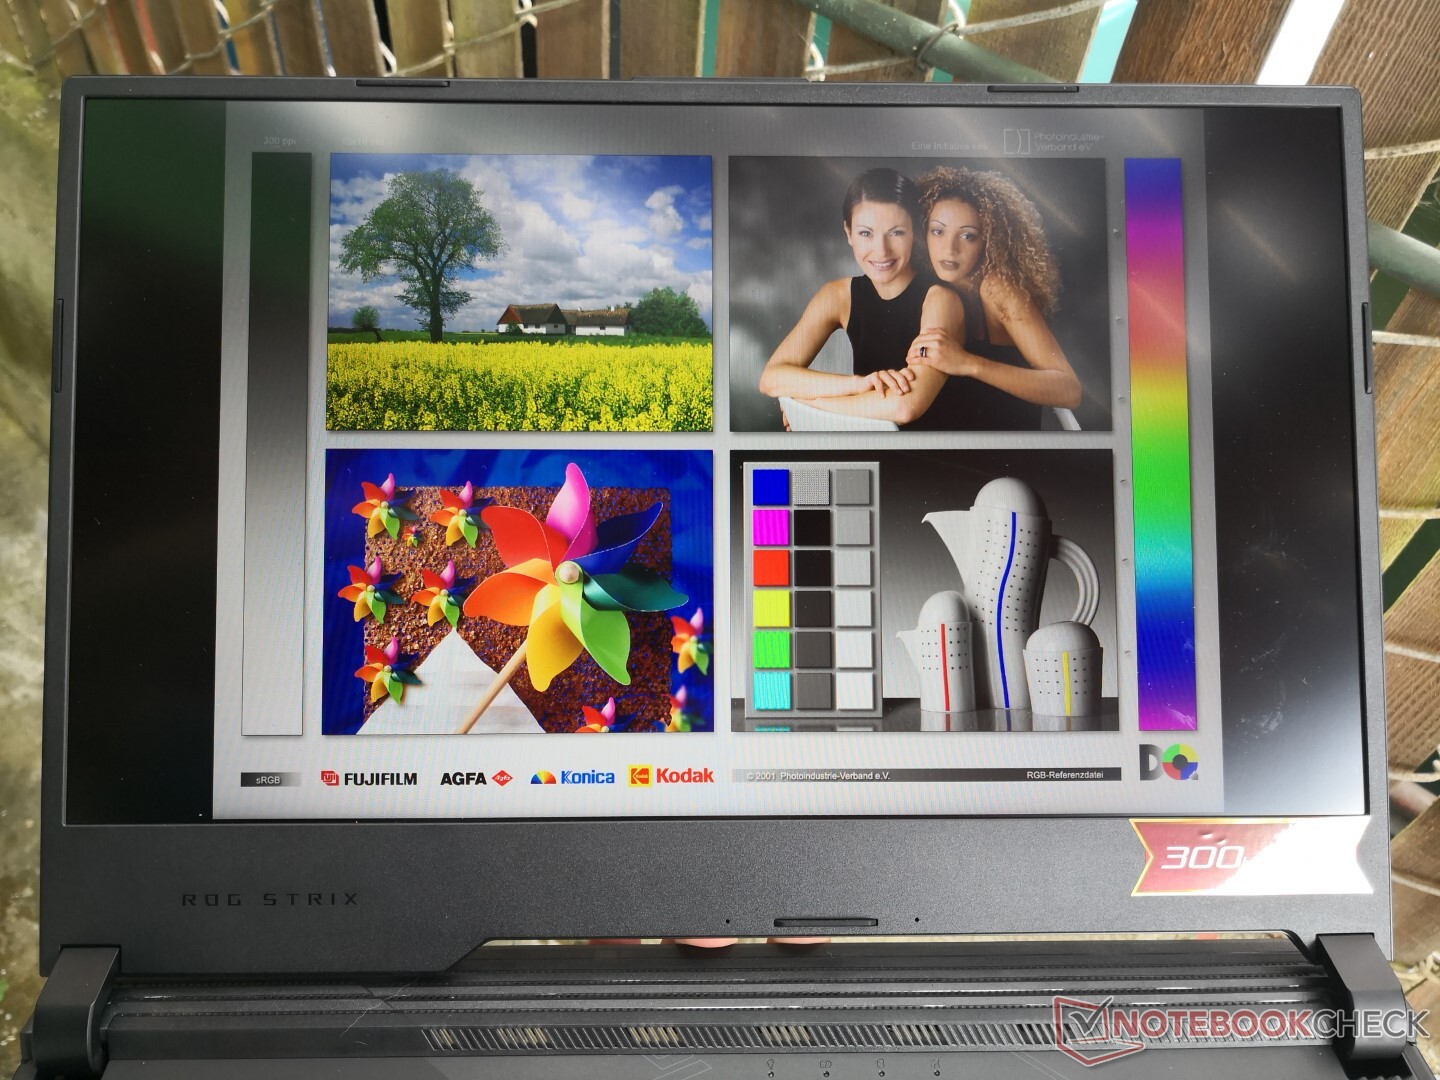
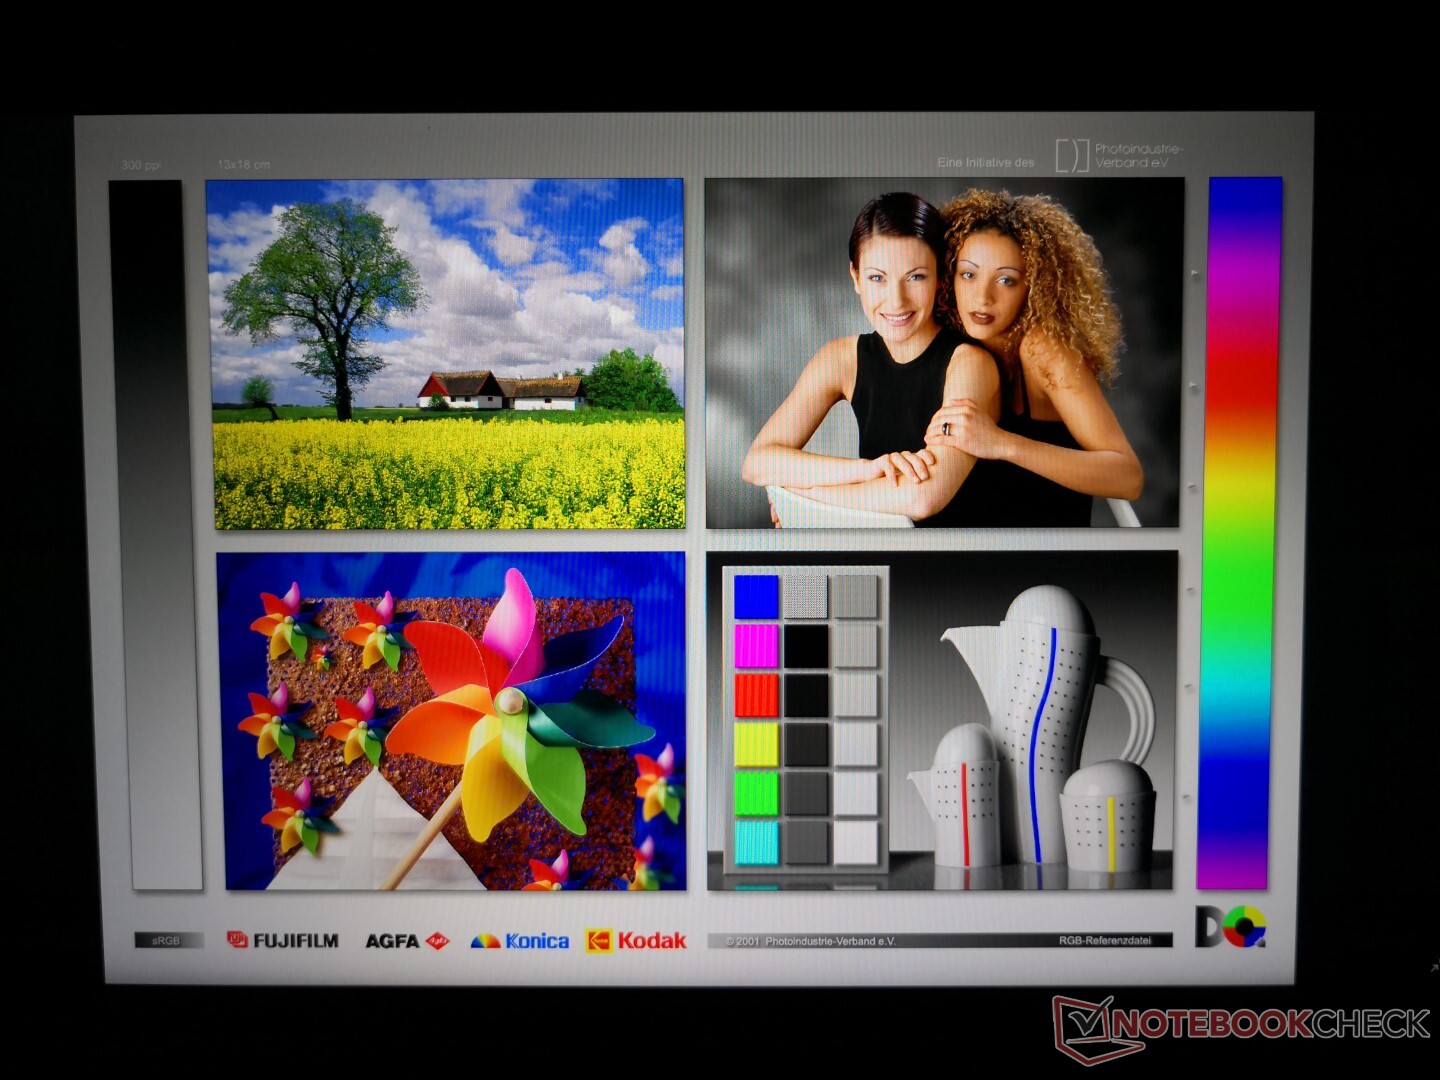
All G532 configurations come with either a 240 Hz or 300 Hz 1080p IPS panel. There aren't that many 300 Hz panel options out there and so it's unsurprising to find that our Asus configuration uses the same AU Optronics B156HAN12.0 panel as found on the MSI GS66 or Acer Predator Triton 500. Thus, certain characteristics like color coverage, contrast ratio, and black-white response times are all quite similar between these systems. We can't say for certain what the exact panel for the 240 Hz option is until we can test a SKU firsthand, but we suspect it to be the same one used for the G531GW.

| |||||||||||||||||||||||||
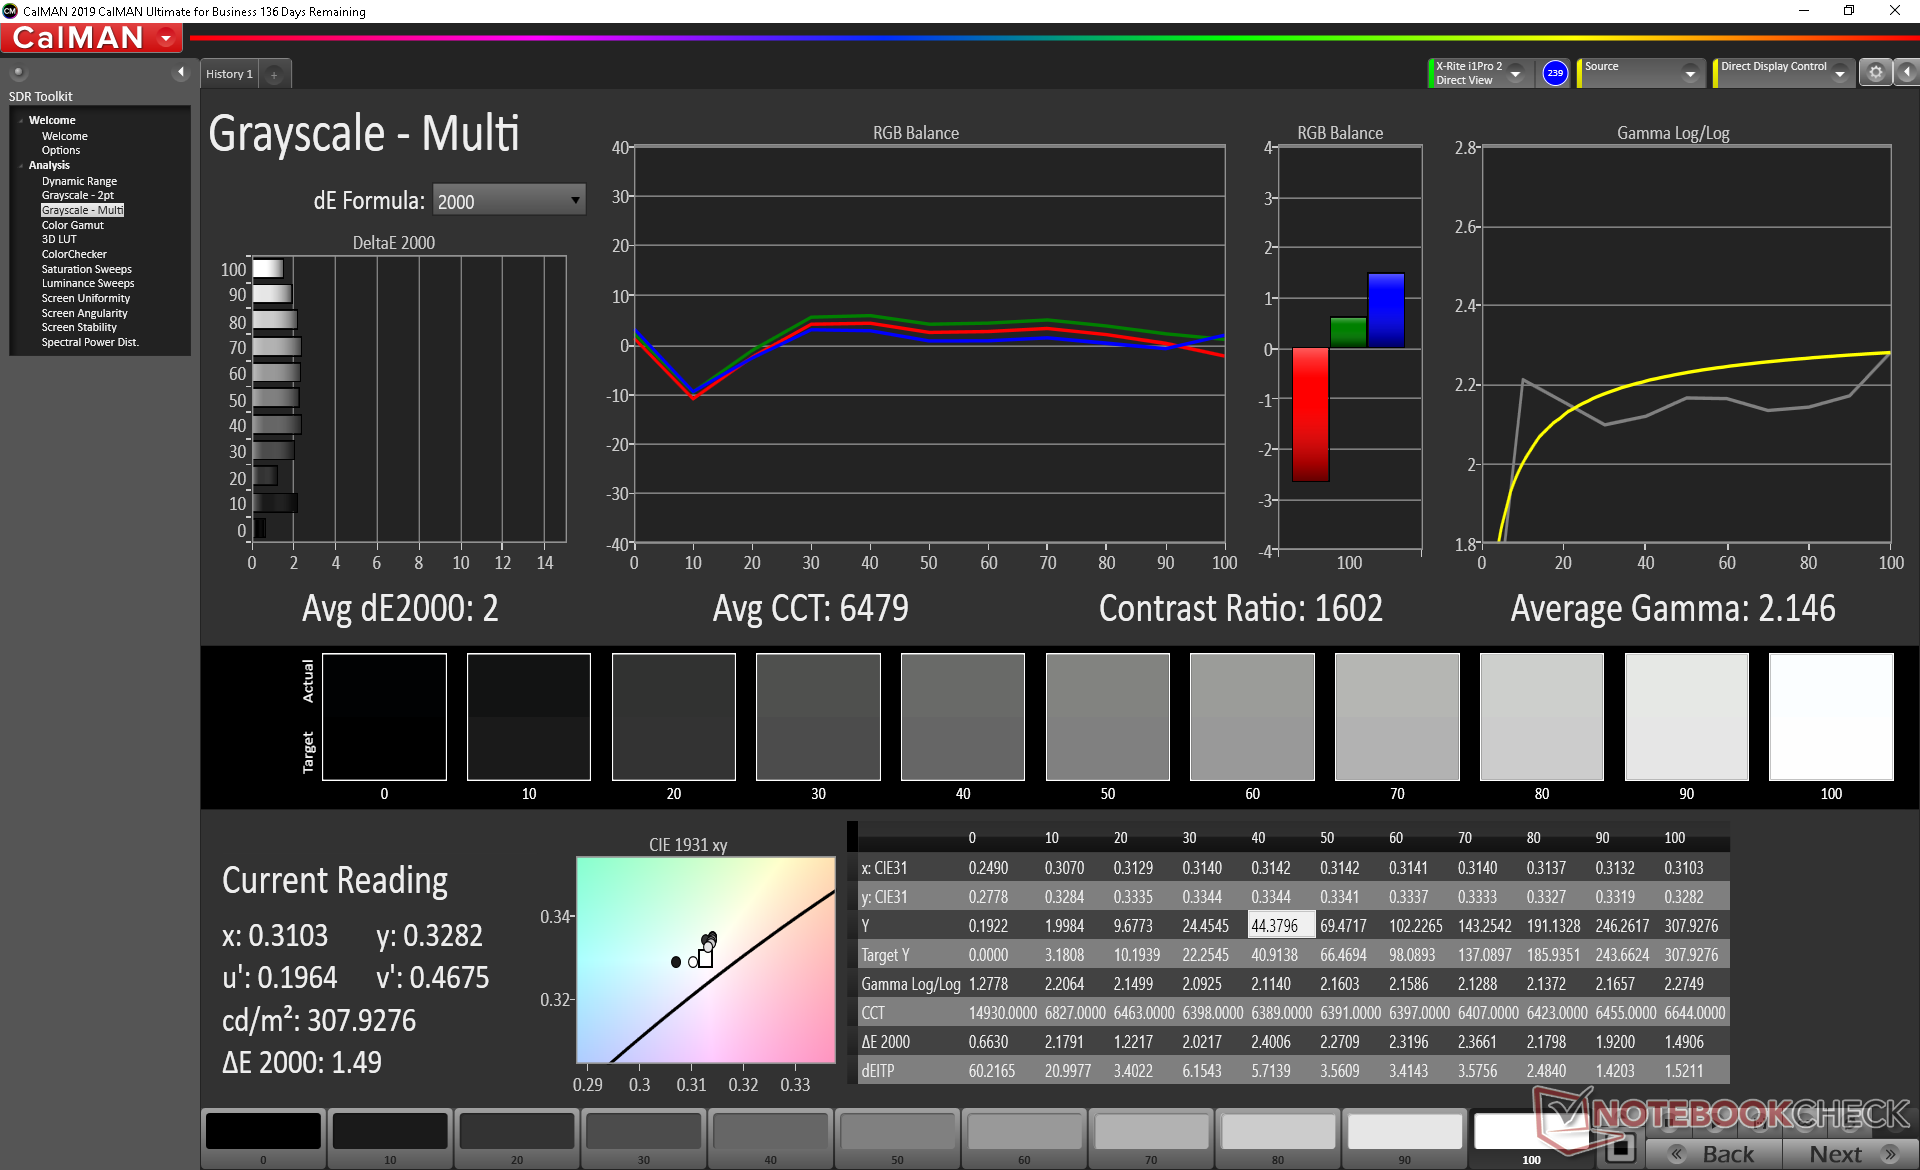
Brightness Distribution: 91 %
Center on Battery: 307.2 cd/m²
Contrast: 1463:1 (Black: 0.21 cd/m²)
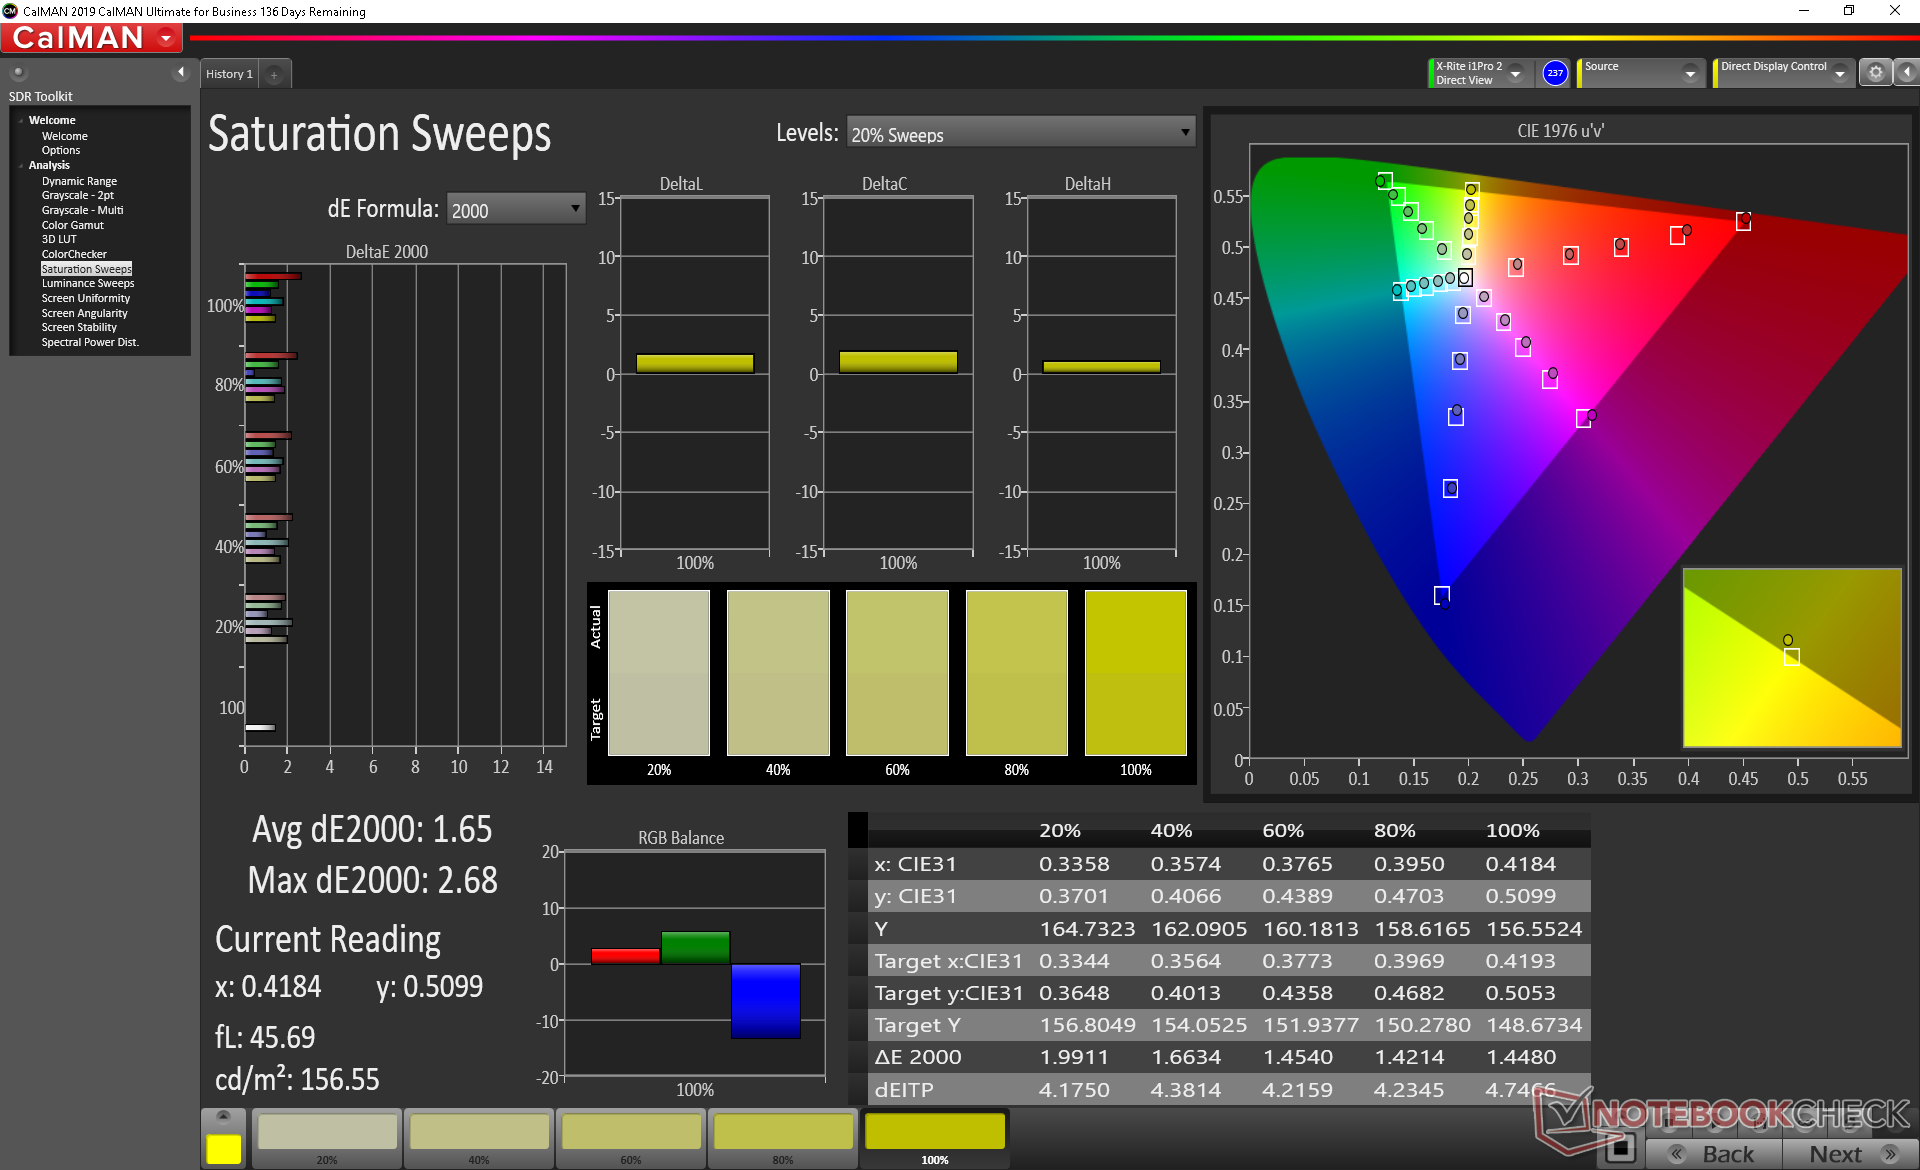
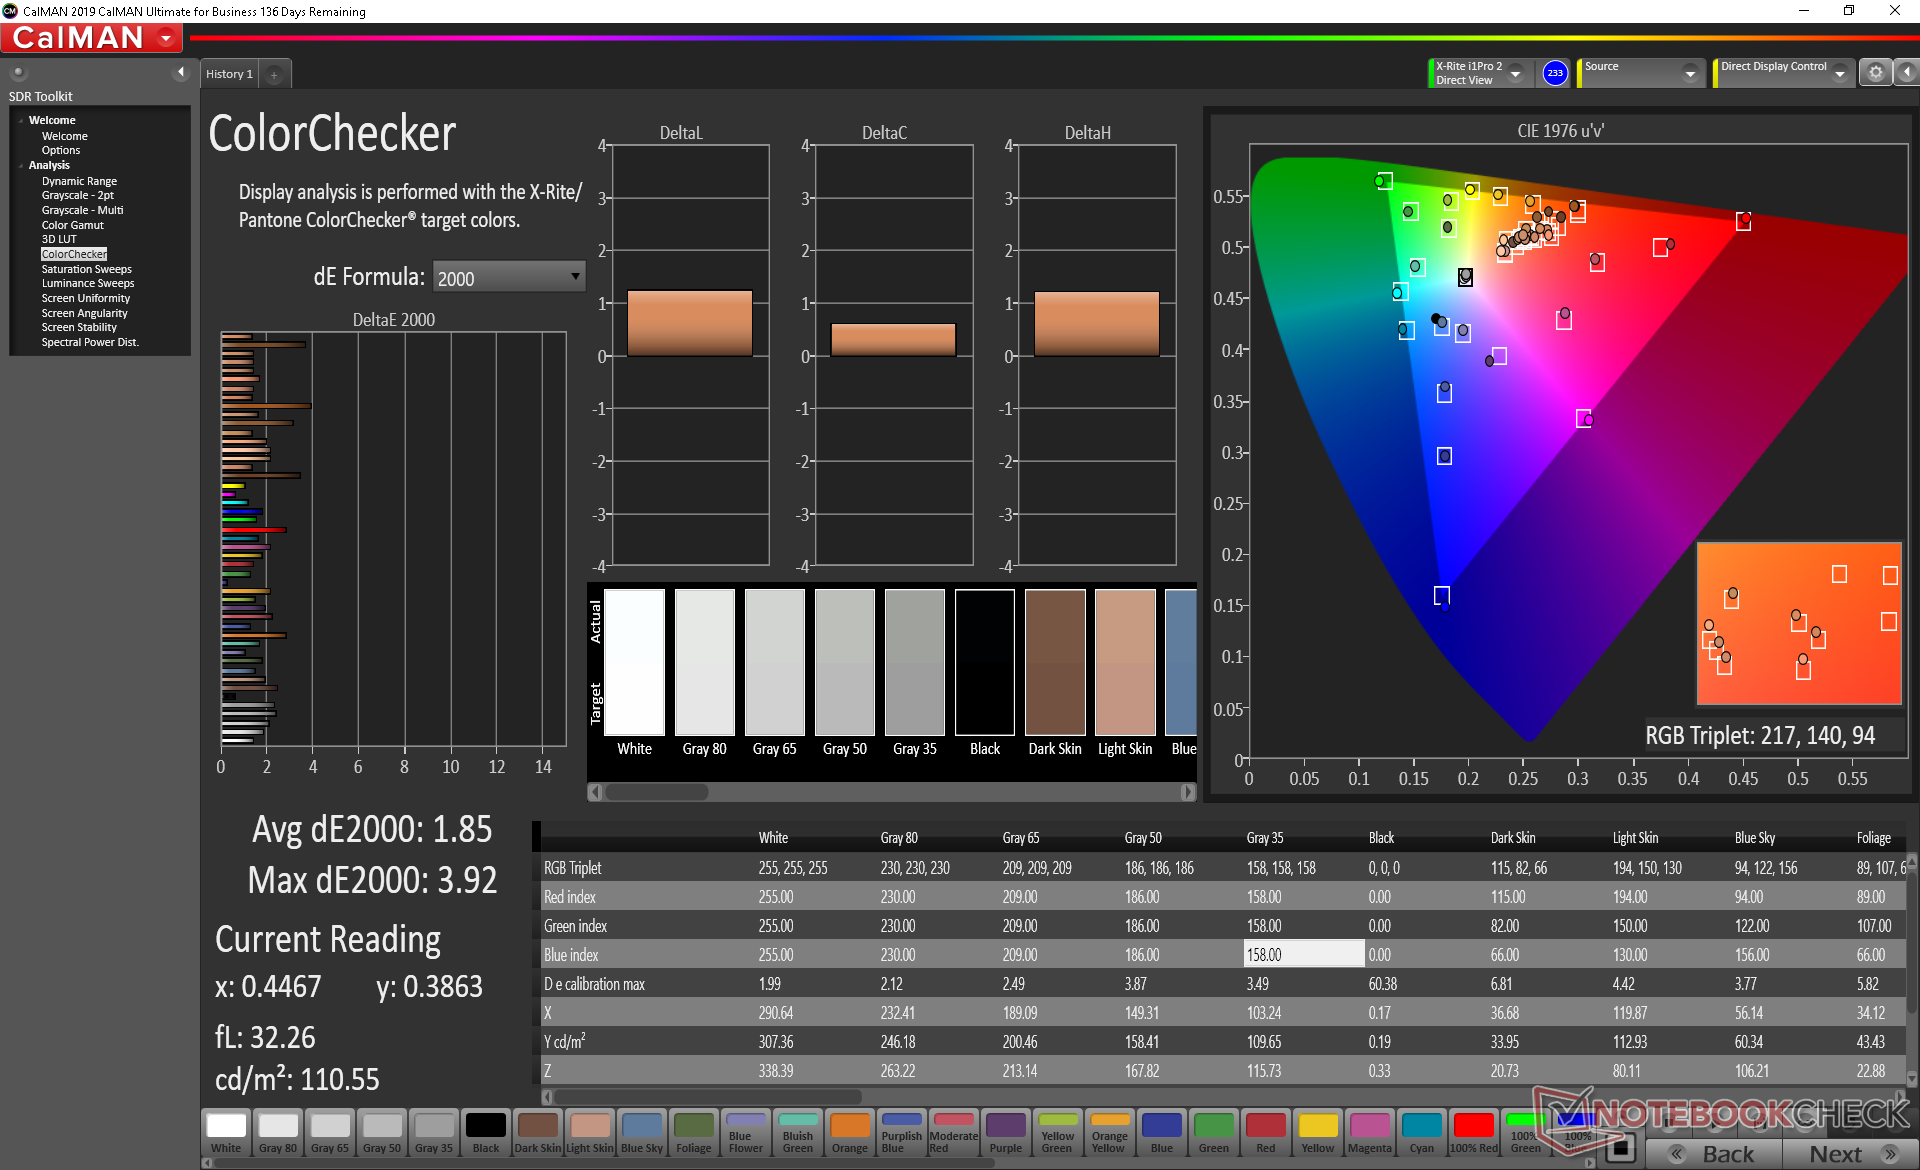
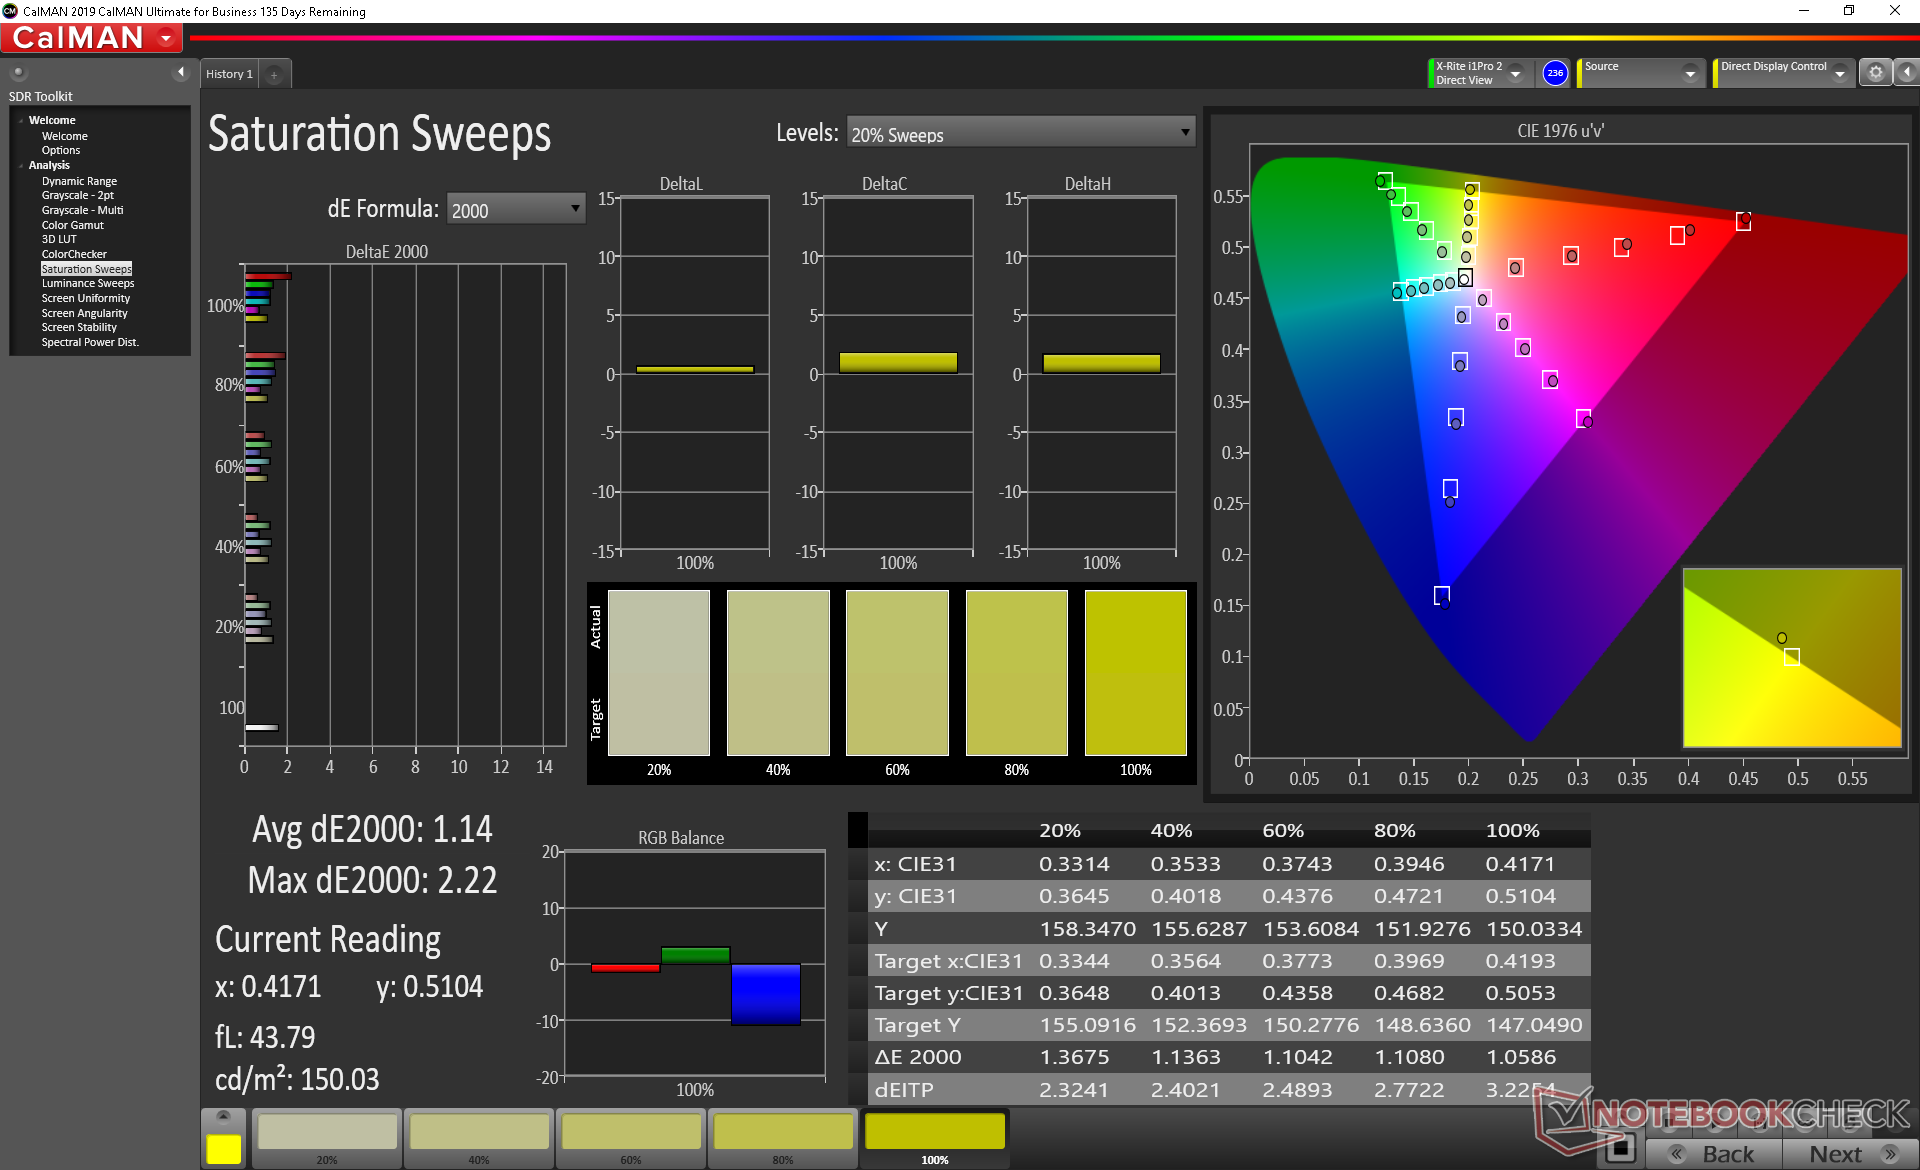
ΔE ColorChecker Calman: 1.85 | ∀{0.5-29.43 Ø4.71}
calibrated: 1.26
ΔE Greyscale Calman: 2 | ∀{0.09-98 Ø4.96}
99.7% sRGB (Argyll 1.6.3 3D)
65% AdobeRGB 1998 (Argyll 1.6.3 3D)
71.4% AdobeRGB 1998 (Argyll 3D)
99.6% sRGB (Argyll 3D)
69.9% Display P3 (Argyll 3D)
Gamma: 2.15
CCT: 6479 K
| Asus ROG Strix Scar 15 G532LWS AU Optronics B156HAN12.0, IPS, 15.6", 1920x1080 | MSI GE66 Raider 10SFS Sharp LQ156M1JW03 (SHP14C5), IPS-Level, 15.6", 1920x1080 | Acer Predator Triton 500 PT515-52-70N3 AUO B156HAN12.0 (AUO7A8C), IPS, 15.6", 1920x1080 | Razer Blade 15 RZ09-0328 Samsung SDCA029, AMOLED, 15.6", 3840x2160 | HP Omen X 2S 15-dg0075cl AU Optronics AUO82ED, IPS, 15.6", 1920x1080 | Asus Strix Scar III G531GW-AZ062T Sharp LQ156M1JW09 (SHP14D3), IPS, 15.6", 1920x1080 | |
|---|---|---|---|---|---|---|
| Display | -2% | 1% | 26% | -6% | -4% | |
| Display P3 Coverage (%) | 69.9 | 68 -3% | 70.3 1% | 99.9 43% | 66.2 -5% | 66.2 -5% |
| sRGB Coverage (%) | 99.6 | 99 -1% | 99.5 0% | 100 0% | 92.3 -7% | 97.1 -3% |
| AdobeRGB 1998 Coverage (%) | 71.4 | 69.8 -2% | 72.2 1% | 97.4 36% | 67.2 -6% | 67.6 -5% |
| Response Times | -14% | -7% | 77% | -12% | -1% | |
| Response Time Grey 50% / Grey 80% * (ms) | 14.4 ? | 16.4 ? -14% | 14.4 ? -0% | 2.7 ? 81% | 15.2 ? -6% | 15 ? -4% |
| Response Time Black / White * (ms) | 9.2 ? | 10.4 ? -13% | 10.4 ? -13% | 2.6 ? 72% | 10.8 ? -17% | 9 ? 2% |
| PWM Frequency (Hz) | 23580 ? | 59.5 ? | 250 ? | |||
| Screen | 1% | -38% | -26% | -59% | -50% | |
| Brightness middle (cd/m²) | 307.2 | 291 -5% | 320 4% | 366.7 19% | 324.8 6% | 309 1% |
| Brightness (cd/m²) | 301 | 278 -8% | 318 6% | 371 23% | 316 5% | 284 -6% |
| Brightness Distribution (%) | 91 | 91 0% | 88 -3% | 91 0% | 84 -8% | 88 -3% |
| Black Level * (cd/m²) | 0.21 | 0.25 -19% | 0.24 -14% | 0.26 -24% | 0.42 -100% | |
| Contrast (:1) | 1463 | 1164 -20% | 1333 -9% | 1249 -15% | 736 -50% | |
| Colorchecker dE 2000 * | 1.85 | 1.19 36% | 4.03 -118% | 5.21 -182% | 4.96 -168% | 3.99 -116% |
| Colorchecker dE 2000 max. * | 3.92 | 3.04 22% | 8.43 -115% | 7.92 -102% | 8.95 -128% | 8.3 -112% |
| Colorchecker dE 2000 calibrated * | 1.26 | 0.98 22% | 3.23 -156% | 1.12 11% | ||
| Greyscale dE 2000 * | 2 | 1.9 5% | 5.94 -197% | 2 -0% | 5 -150% | 5.43 -172% |
| Gamma | 2.15 102% | 2.216 99% | 2.42 91% | 2.17 101% | 2.21 100% | 2.57 86% |
| CCT | 6479 100% | 7018 93% | 6751 96% | 6514 100% | 7742 84% | 7767 84% |
| Color Space (Percent of AdobeRGB 1998) (%) | 65 | 70 8% | 66 2% | 86.6 33% | 59.8 -8% | 63 -3% |
| Color Space (Percent of sRGB) (%) | 99.7 | 92 -8% | 99 -1% | 100 0% | 91.8 -8% | 97 -3% |
| Total Average (Program / Settings) | -5% /
-1% | -15% /
-27% | 26% /
2% | -26% /
-43% | -18% /
-36% |
* ... smaller is better
Color space covers all of sRGB and about 65 percent of AdobeRGB like many other fast refresh rate panels. This is definitely an upgrade from the Panda panel on the much cheaper Asus G512. Laptops with OLED options like the Razer Blade 15 or Alienware m15 are able to offer even deeper colors, but such panels are limited to just 60 Hz at the moment.
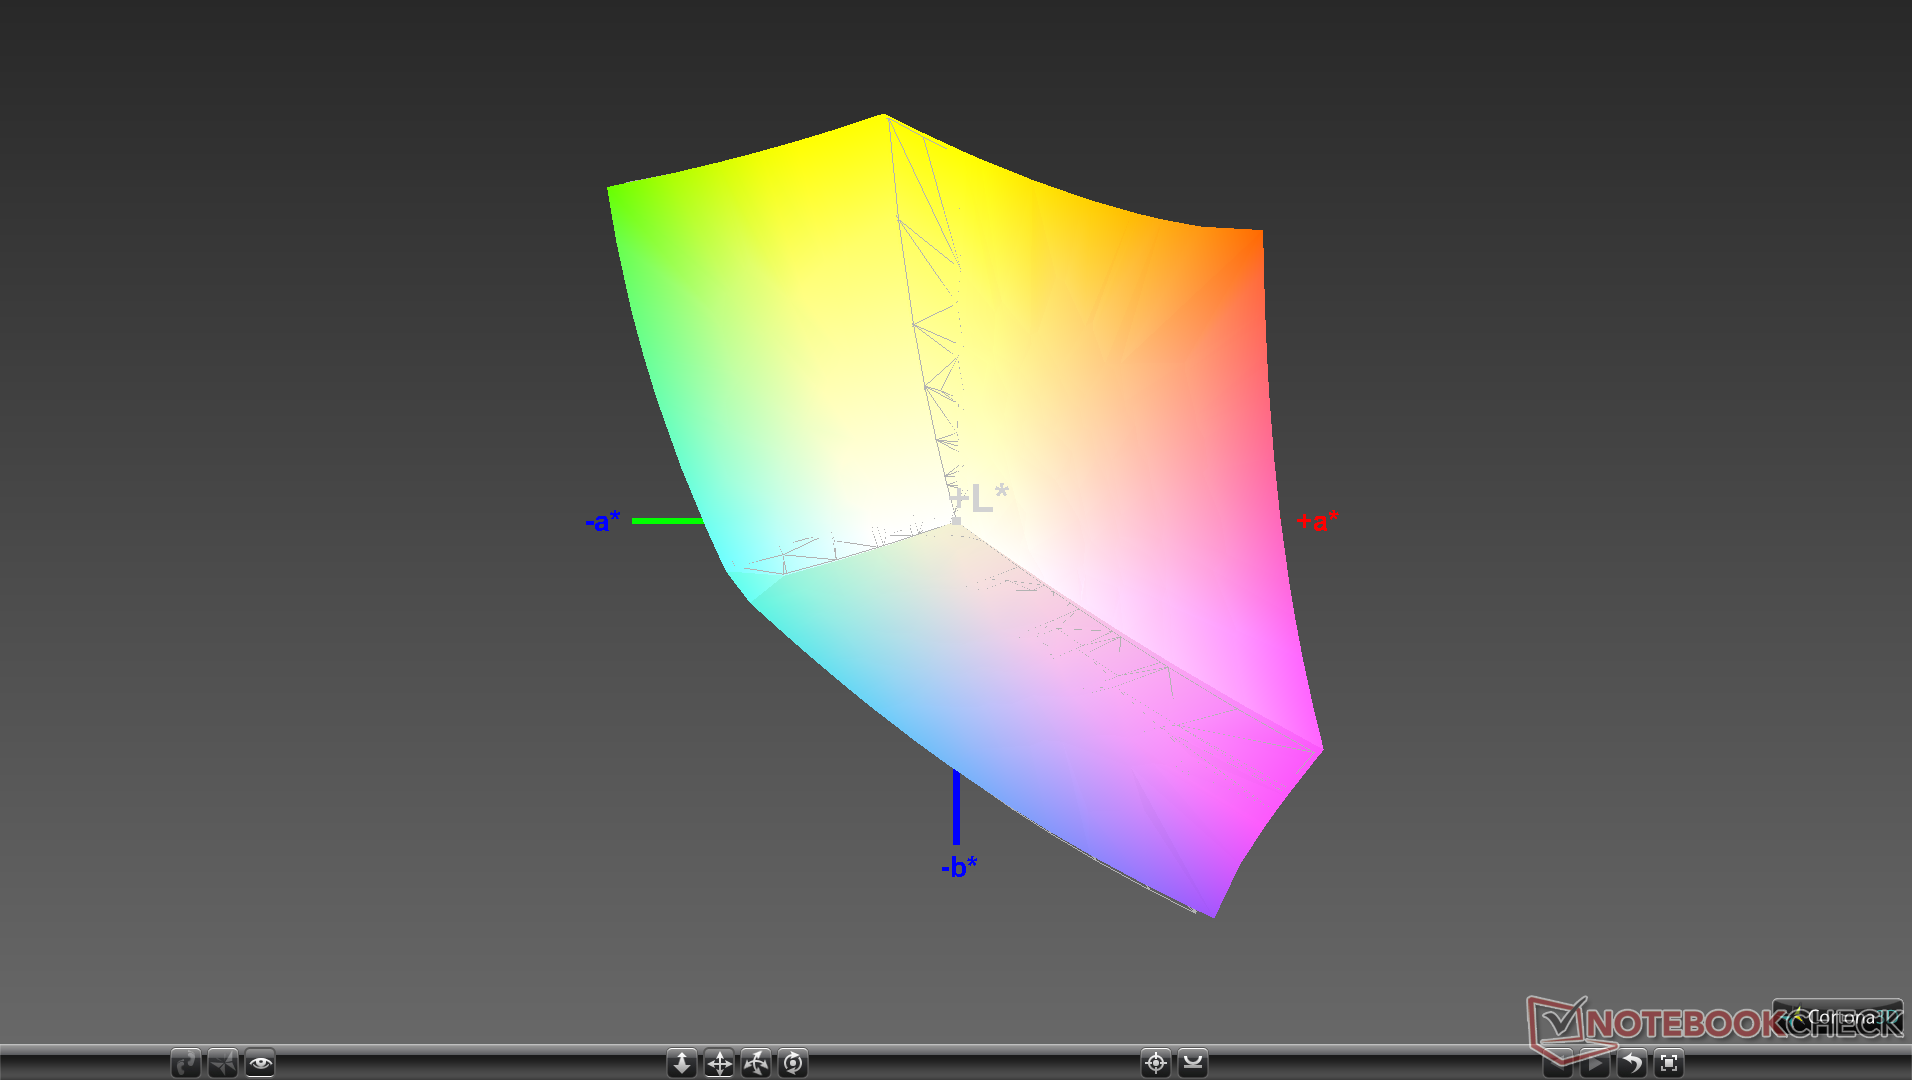
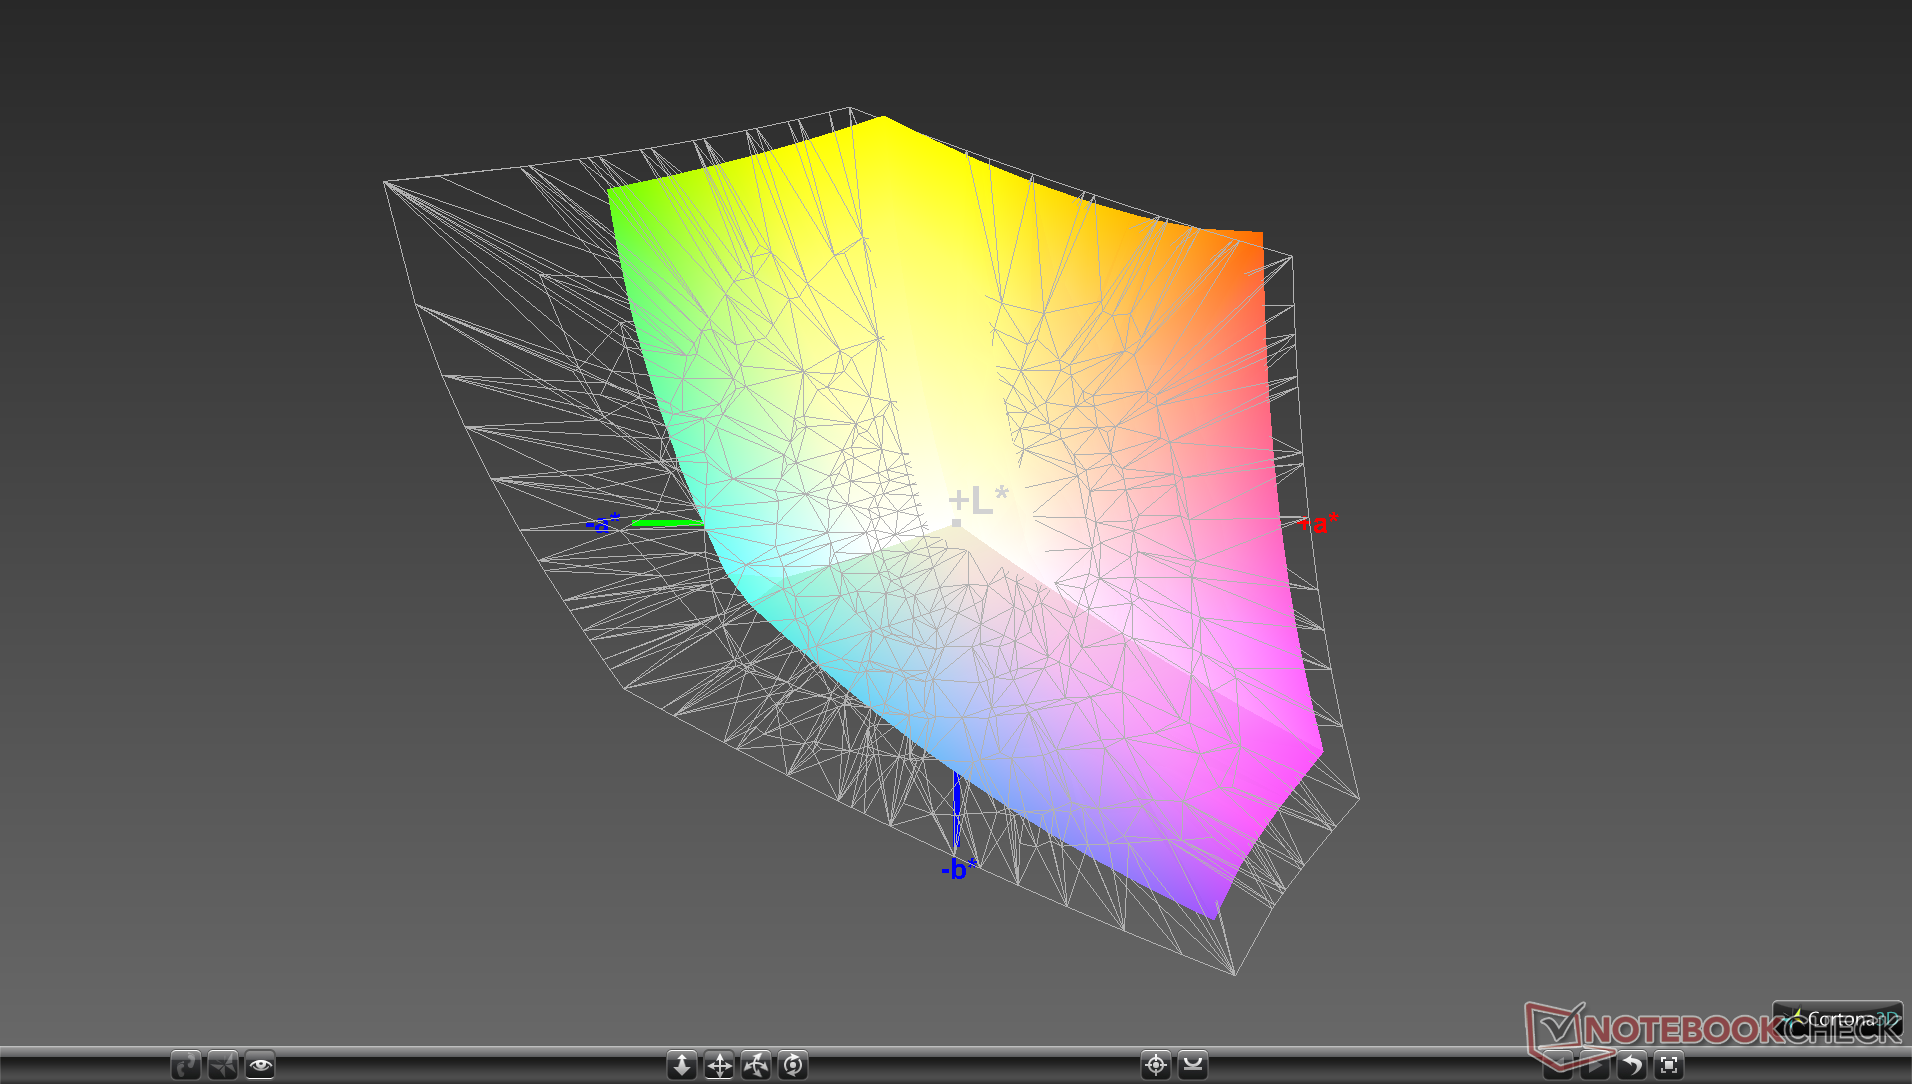
Further measurements with an X-Rite colorimeter reveal a very well-calibrated display out of the box. Average grayscale and color DeltaE values sit at just 2 and 1.85, respectively, suggesting that additional end-user calibration will not be necessary. Attempting to calibrate the panel ourselves would result in ever-so-slight improvements nonetheless.

Display Response Times
| ↔ Response Time Black to White | ||
|---|---|---|
| 9.2 ms ... rise ↗ and fall ↘ combined | ↗ 4.8 ms rise | 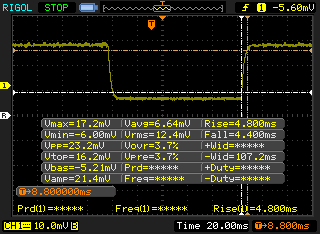 |
| ↘ 4.4 ms fall | ||
| The screen shows fast response rates in our tests and should be suited for gaming. In comparison, all tested devices range from 0.1 (minimum) to 240 (maximum) ms. » 26 % of all devices are better. This means that the measured response time is better than the average of all tested devices (19.8 ms). | ||
| ↔ Response Time 50% Grey to 80% Grey | ||
| 14.4 ms ... rise ↗ and fall ↘ combined | ↗ 6.8 ms rise | 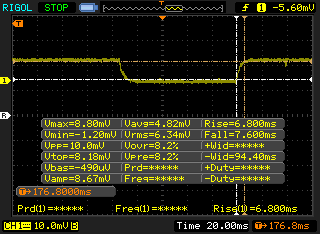 |
| ↘ 7.6 ms fall | ||
| The screen shows good response rates in our tests, but may be too slow for competitive gamers. In comparison, all tested devices range from 0.165 (minimum) to 636 (maximum) ms. » 28 % of all devices are better. This means that the measured response time is better than the average of all tested devices (31 ms). | ||
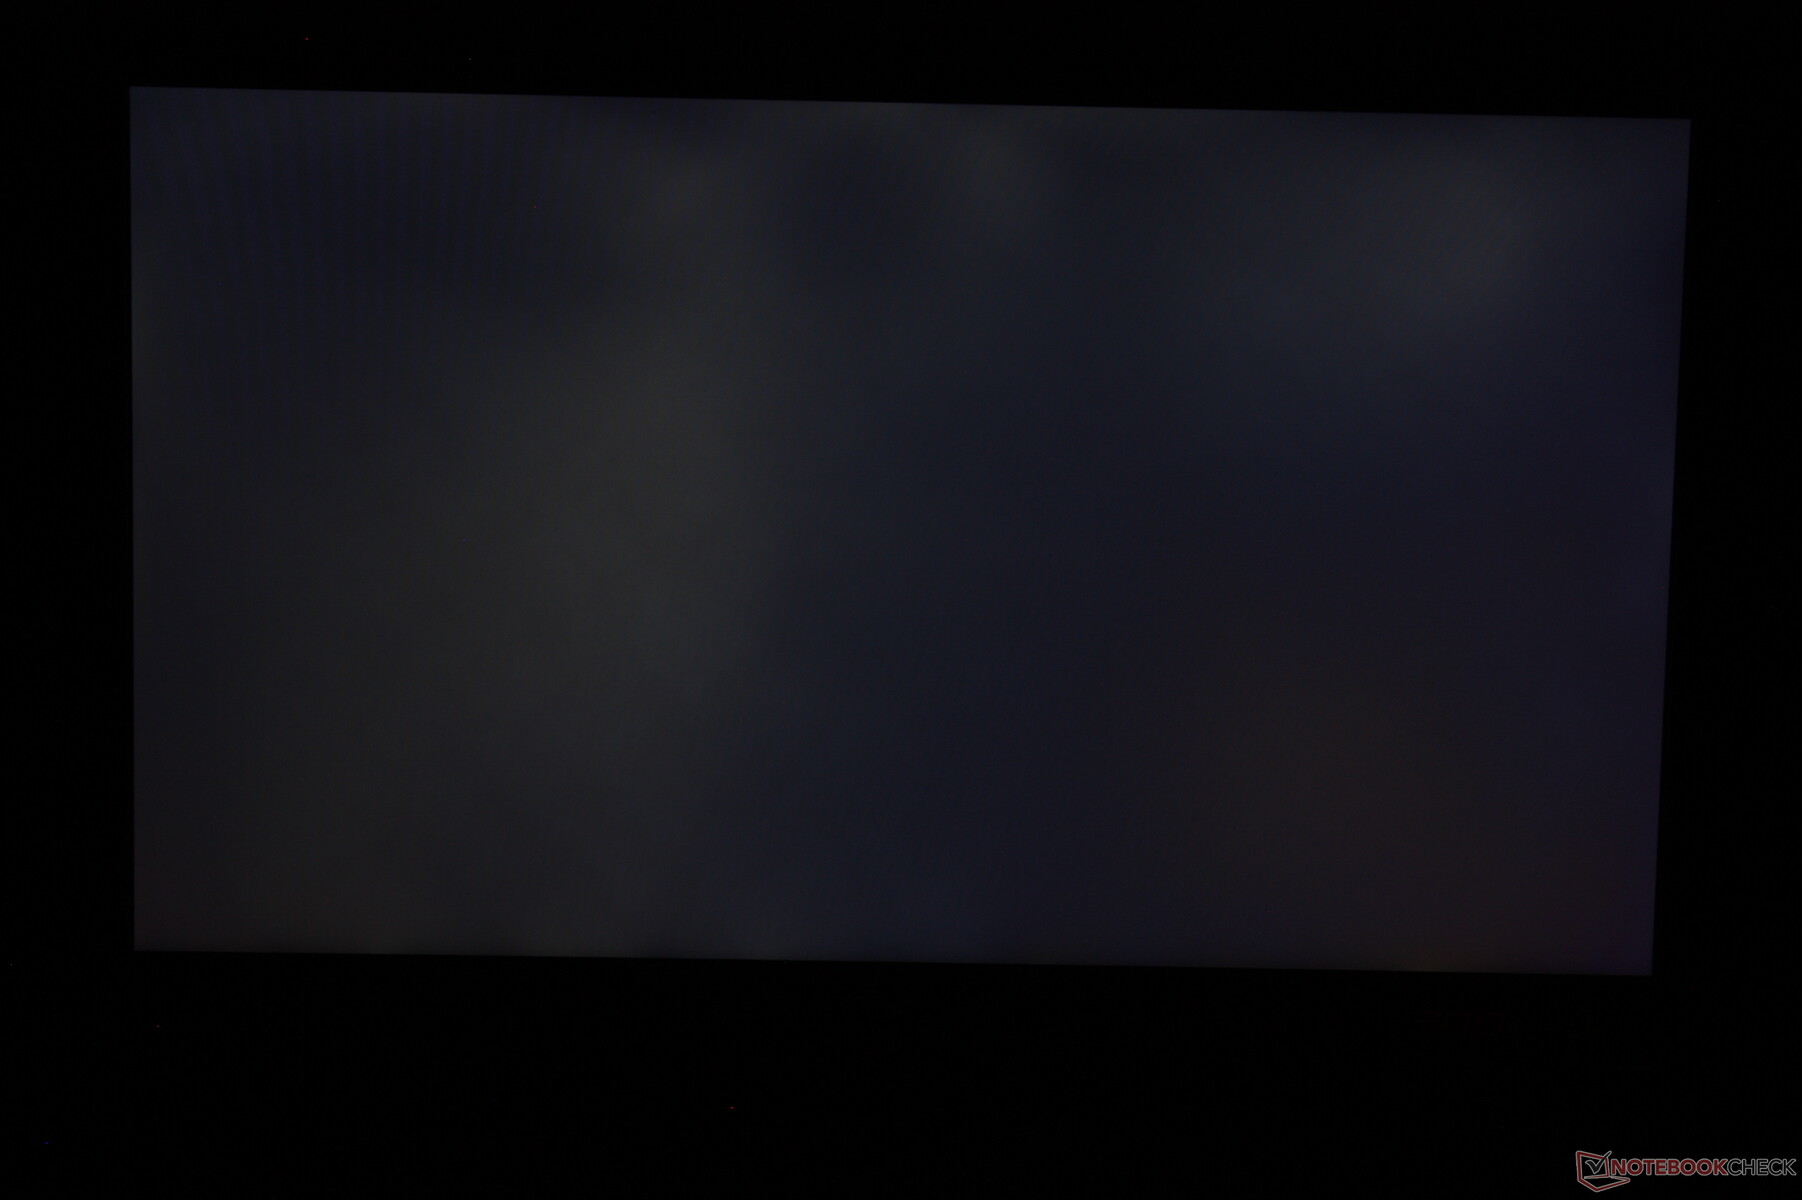
Screen Flickering / PWM (Pulse-Width Modulation)
| Screen flickering / PWM not detected | 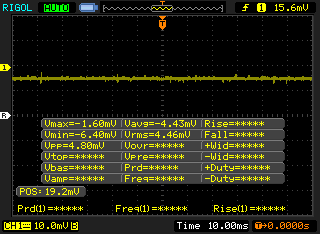 | ||
In comparison: 52 % of all tested devices do not use PWM to dim the display. If PWM was detected, an average of 7754 (minimum: 5 - maximum: 343500) Hz was measured. | |||
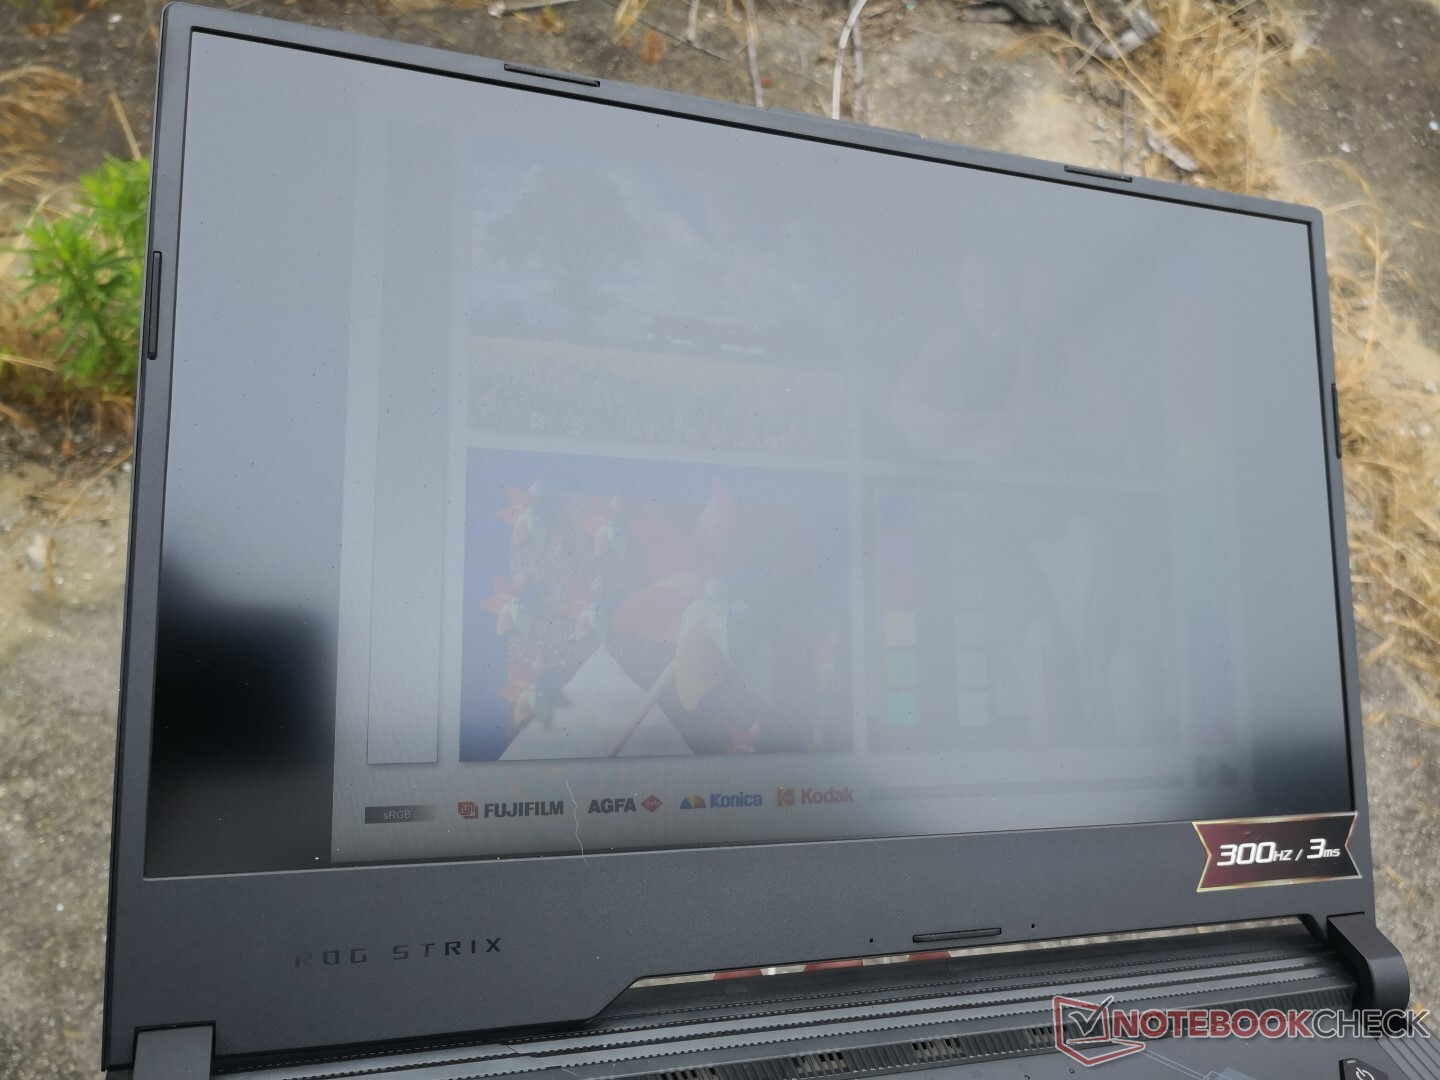
As great as the display may be for gaming, it's not designed for outdoor use. Ambient light will overwhelm the screen unless if the system is under shade.
Performance
There are no Core i7-10750H options since Asus is positioning the G532 as an upper mid-range to high-end product. Users will have to look towards the lesser G512 series for anything less than the Core i7-10875H or GeForce RTX 2060 GPU. It's a shame that there are no Ryzen 7 or Ryzen 9 options for these Strix or Scar laptops as of this writing.
Nvidia Optimus comes standard which automatically omits G-Sync on the internal monitor. However, G-Sync is compatible on external monitors.
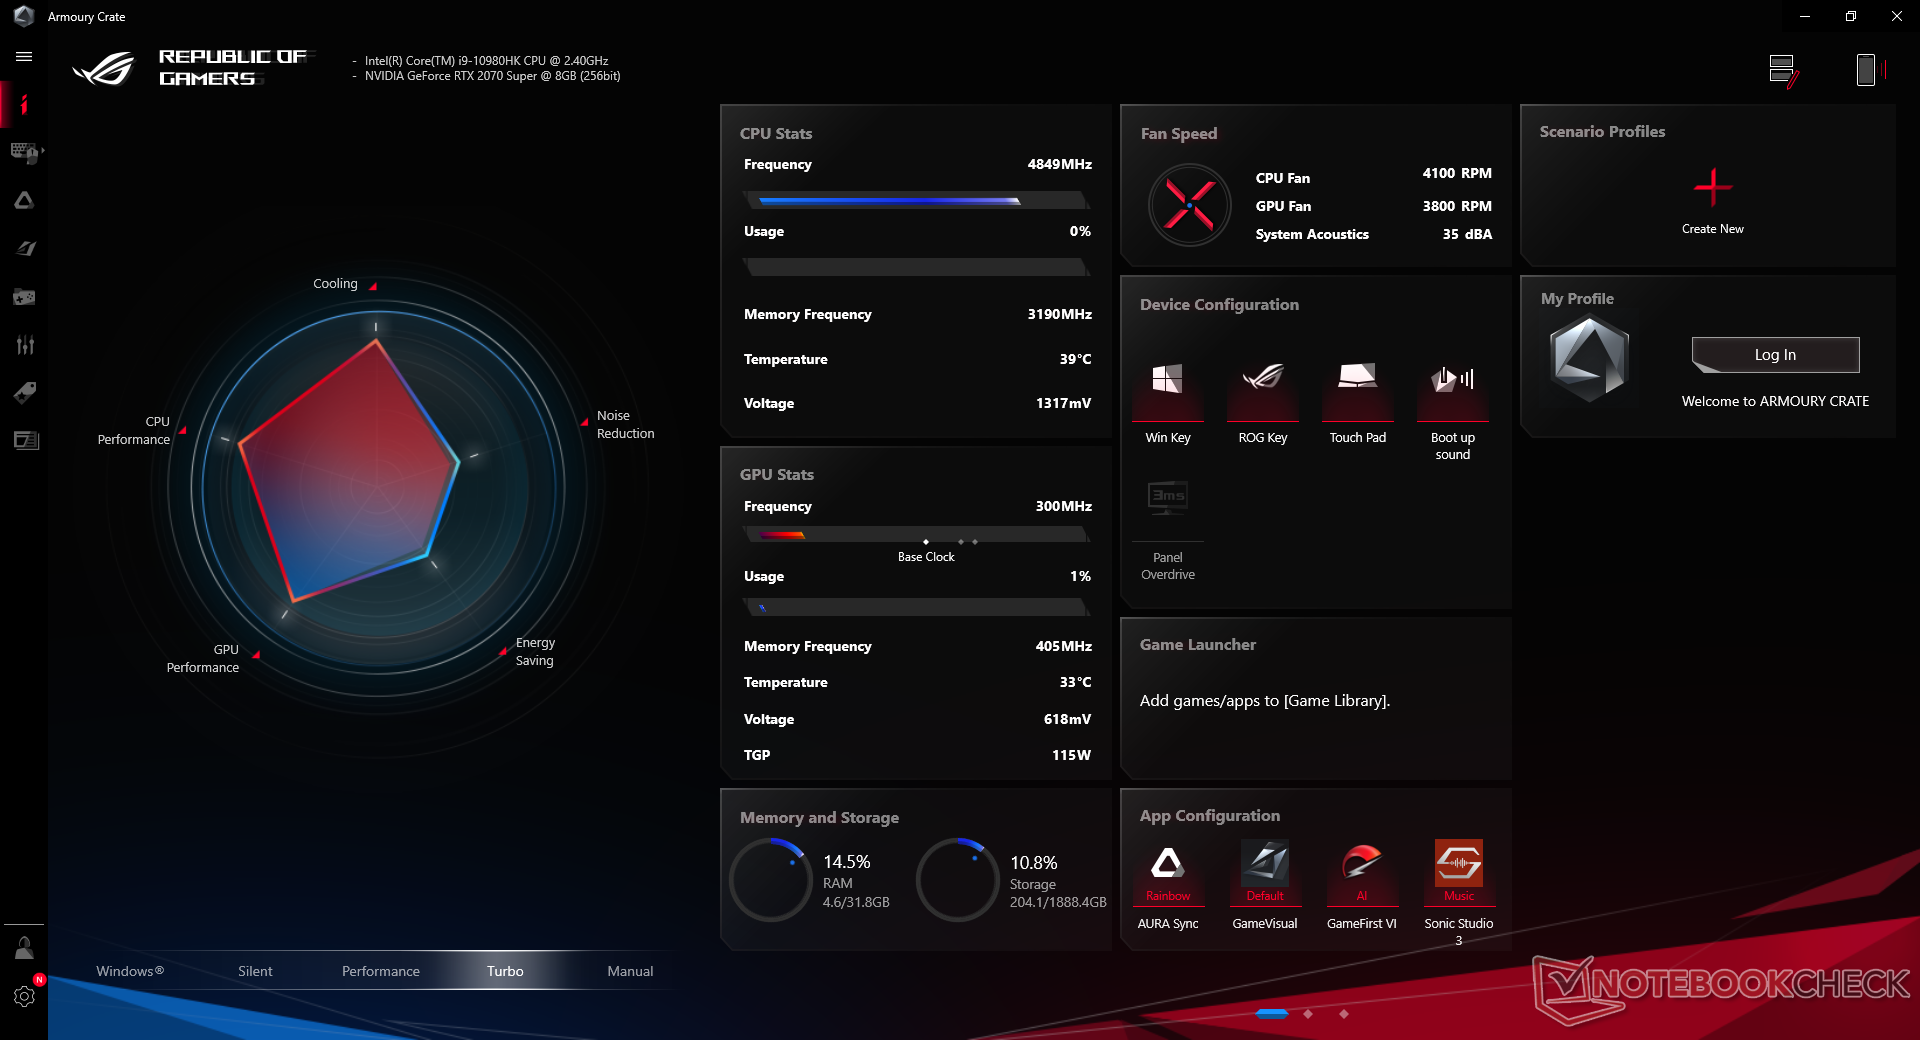
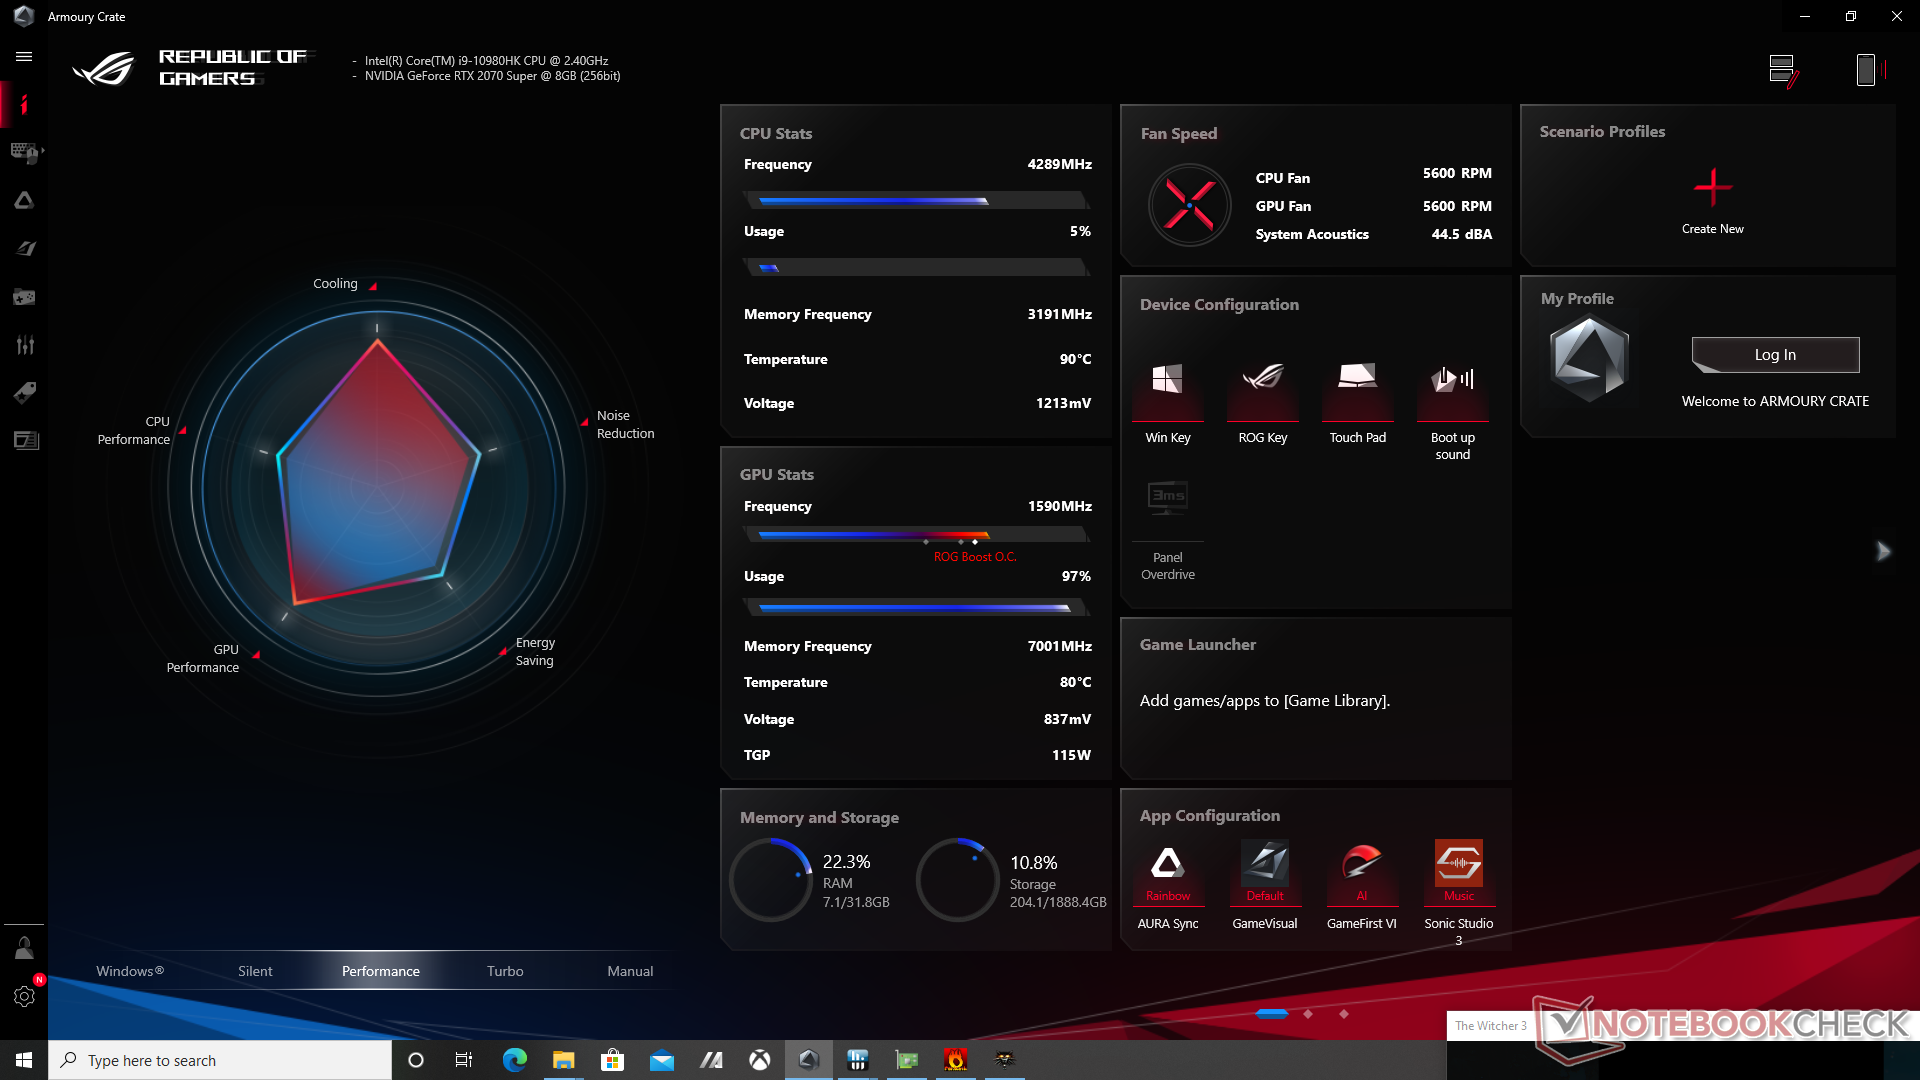
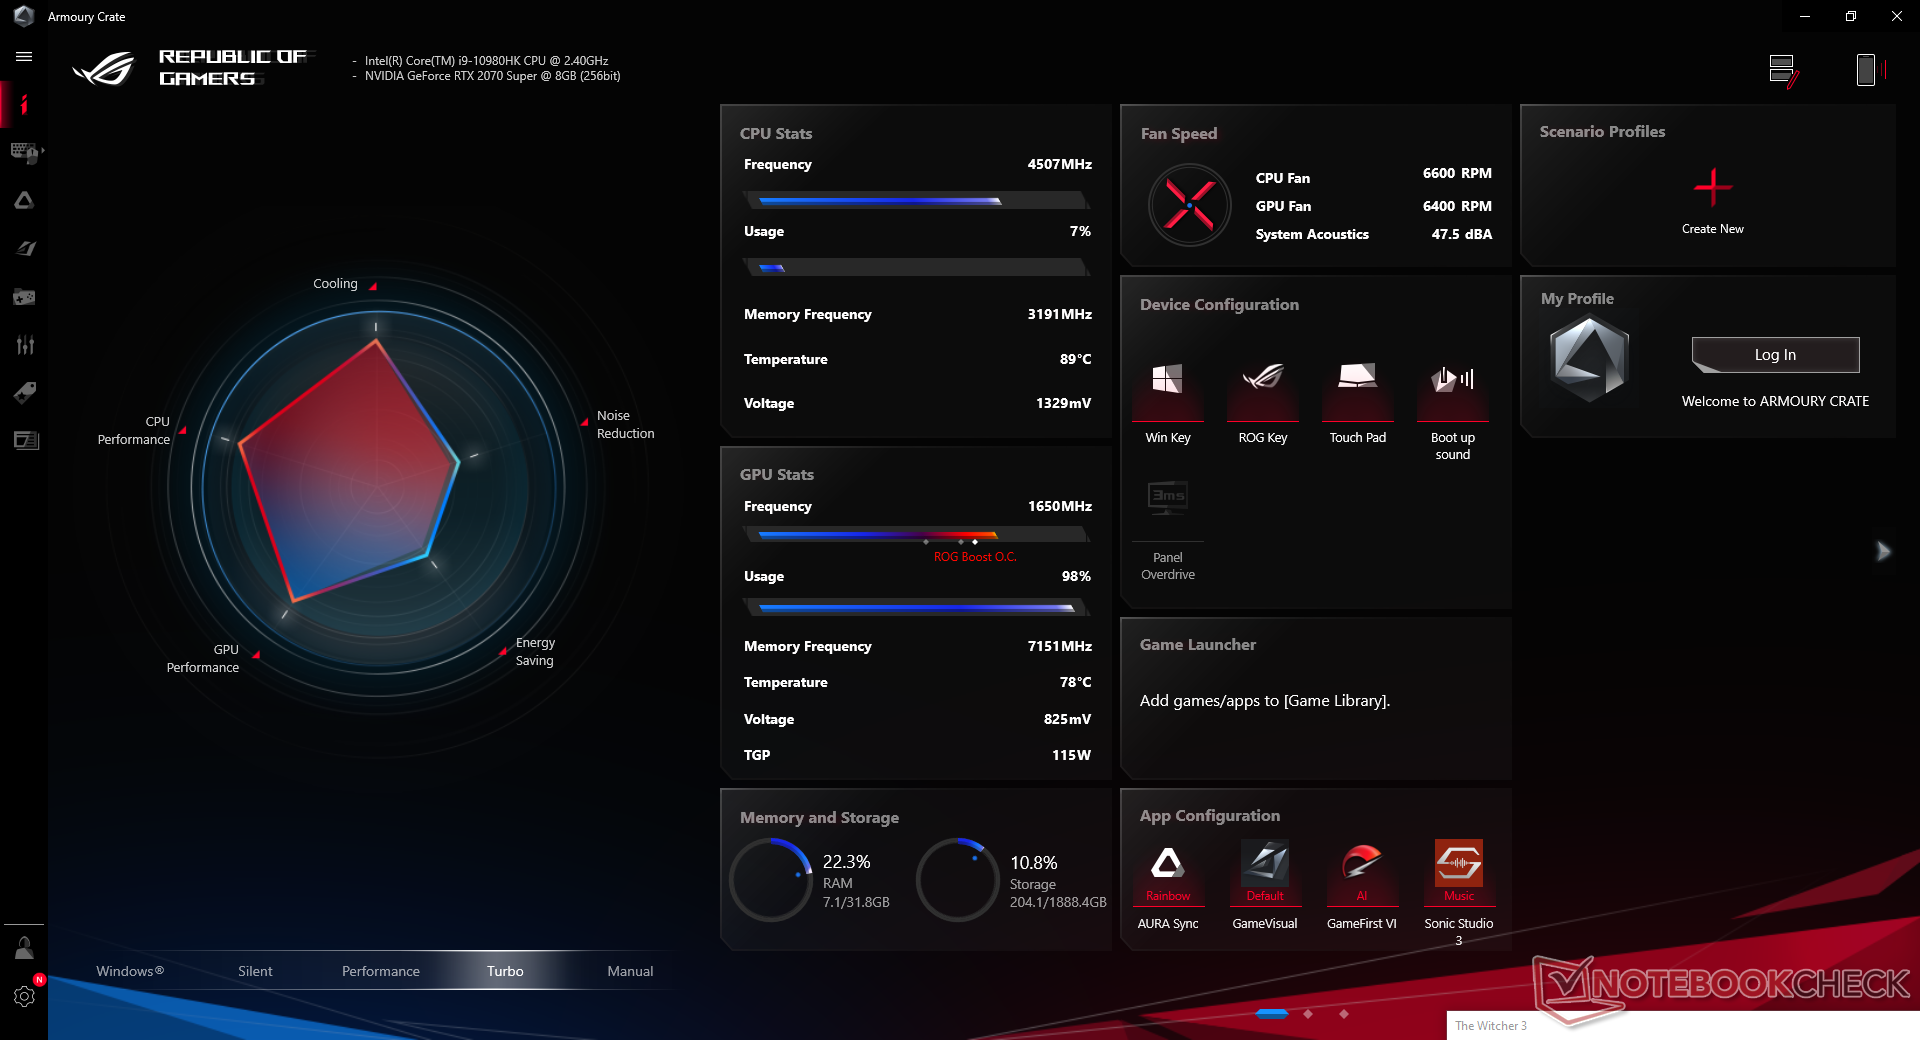
All benchmarks below were performed on Asus' Turbo mode for the highest scores possible. We recommend becoming familiar with the Asus Armoury Crate software as its options directly impact performance and fan noise behavior.
Processor
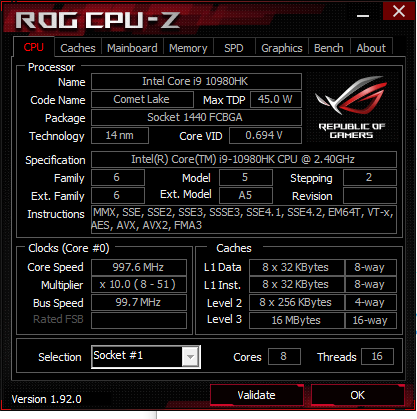
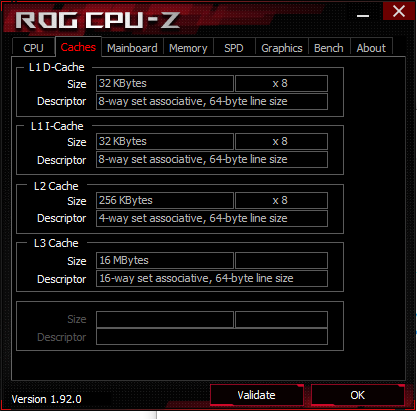
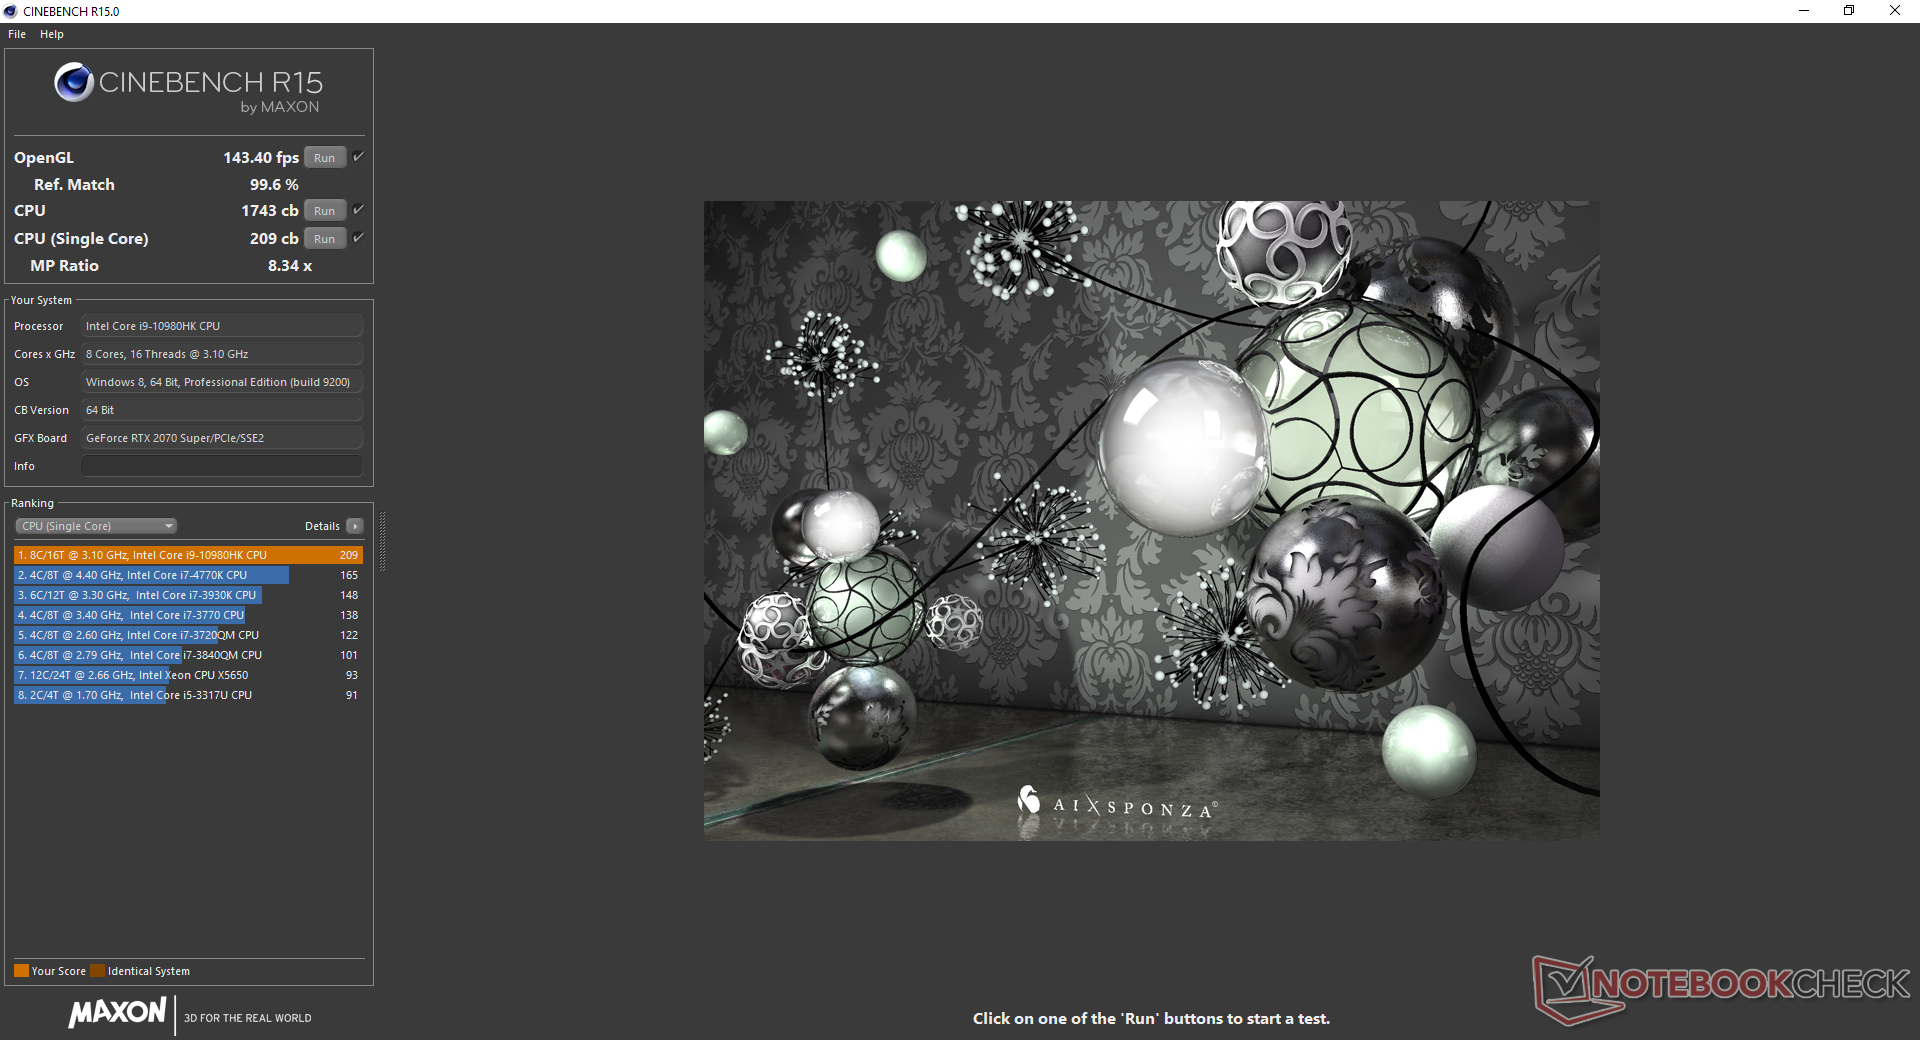
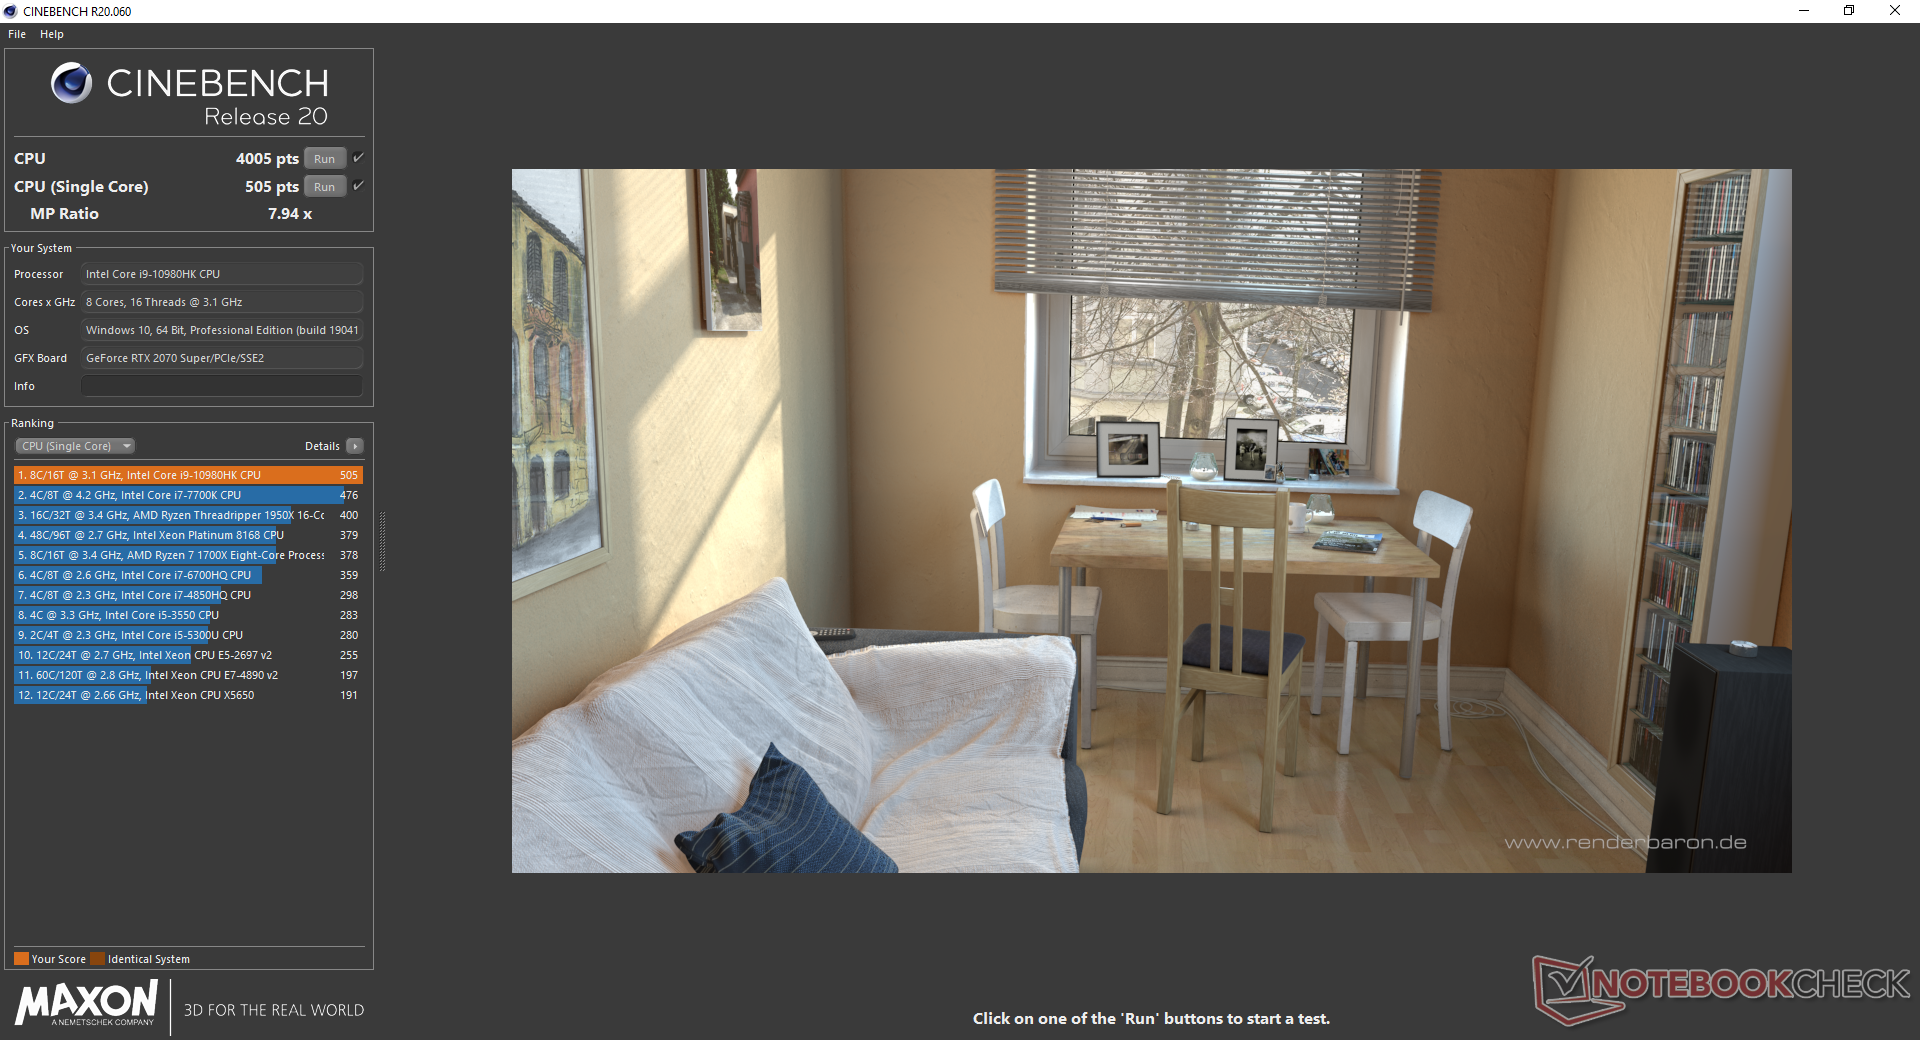
As the 8th laptop in our database with the Core i9-10980HK, performance is where we expect it to be relative to the average. Turbo Boost sustainability isn't perfect, however, as performance would dip by about 7 percent when running CineBench R15 Multi-Thread in a loop. Overall performance is only a few percentage points faster than the cheaper 8-core Core i7-10875H while being about 25 percent faster than the 6-core Core i7-10750H. It's easier for us to recommend the Core i7-10875H SKU over the Core i9 as a result.
See our dedicated page on the Core i9-10980HK for more technical information and benchmark comparisons.
Cinebench R15: CPU Multi 64Bit | CPU Single 64Bit
Blender: v2.79 BMW27 CPU
7-Zip 18.03: 7z b 4 -mmt1 | 7z b 4
Geekbench 5.5: Single-Core | Multi-Core
HWBOT x265 Benchmark v2.2: 4k Preset
LibreOffice : 20 Documents To PDF
R Benchmark 2.5: Overall mean
| Geekbench 5.5 / Single-Core | |
| Intel Core i9-10900K | |
| Eurocom Sky X4C i9-9900KS | |
| Asus ROG Strix Scar 15 G532LWS | |
| Gigabyte Aero 15 OLED XB-8DE51B0SP | |
| Average Intel Core i9-10980HK (1283 - 1401, n=12) | |
| Lenovo Legion 5 15IMH05H | |
| Eluktronics RP-15 | |
| Asus ROG Strix G15 G512LI | |
| Acer Nitro 5 AN515-44-R5FT | |
| Geekbench 5.5 / Multi-Core | |
| Intel Core i9-10900K | |
| Eurocom Sky X4C i9-9900KS | |
| Eluktronics RP-15 | |
| Asus ROG Strix Scar 15 G532LWS | |
| Average Intel Core i9-10980HK (7634 - 8666, n=12) | |
| Gigabyte Aero 15 OLED XB-8DE51B0SP | |
| Asus ROG Strix G15 G512LI | |
| Acer Nitro 5 AN515-44-R5FT | |
| Lenovo Legion 5 15IMH05H | |
| HWBOT x265 Benchmark v2.2 / 4k Preset | |
| Intel Core i9-10900K | |
| Eurocom Sky X4C i9-9900KS | |
| Eluktronics RP-15 | |
| Gigabyte Aero 15 OLED XB-8DE51B0SP | |
| Asus ROG Strix Scar 15 G532LWS | |
| Average Intel Core i9-10980HK (12 - 14.6, n=13) | |
| Asus ROG Strix G15 G512LI | |
| Acer Nitro 5 AN515-44-R5FT | |
| Asus Strix Scar III G531GW-AZ062T | |
| Lenovo Legion 5 15IMH05H | |
| LibreOffice / 20 Documents To PDF | |
| Intel Core i9-10900K | |
| Acer Nitro 5 AN515-44-R5FT | |
| Eluktronics RP-15 | |
| Average Intel Core i9-10980HK (44 - 89, n=13) | |
| Lenovo Legion 5 15IMH05H | |
| Gigabyte Aero 15 OLED XB-8DE51B0SP | |
| Asus ROG Strix G15 G512LI | |
| Asus ROG Strix Scar 15 G532LWS | |
| R Benchmark 2.5 / Overall mean | |
| Lenovo Legion 5 15IMH05H | |
| Acer Nitro 5 AN515-44-R5FT | |
| Asus ROG Strix G15 G512LI | |
| Average Intel Core i9-10980HK (0.561 - 0.596, n=13) | |
| Eluktronics RP-15 | |
| Asus ROG Strix Scar 15 G532LWS | |
| Gigabyte Aero 15 OLED XB-8DE51B0SP | |
| Intel Core i9-10900K | |
* ... smaller is better
System Performance
We encountered a bug on our test unit where the system would not wake from Sleep no matter what buttons we tried pressing. It's difficult to reproduce reliably, but we did encounter it more than once. A forced shutdown and cold boot would then be necessary.
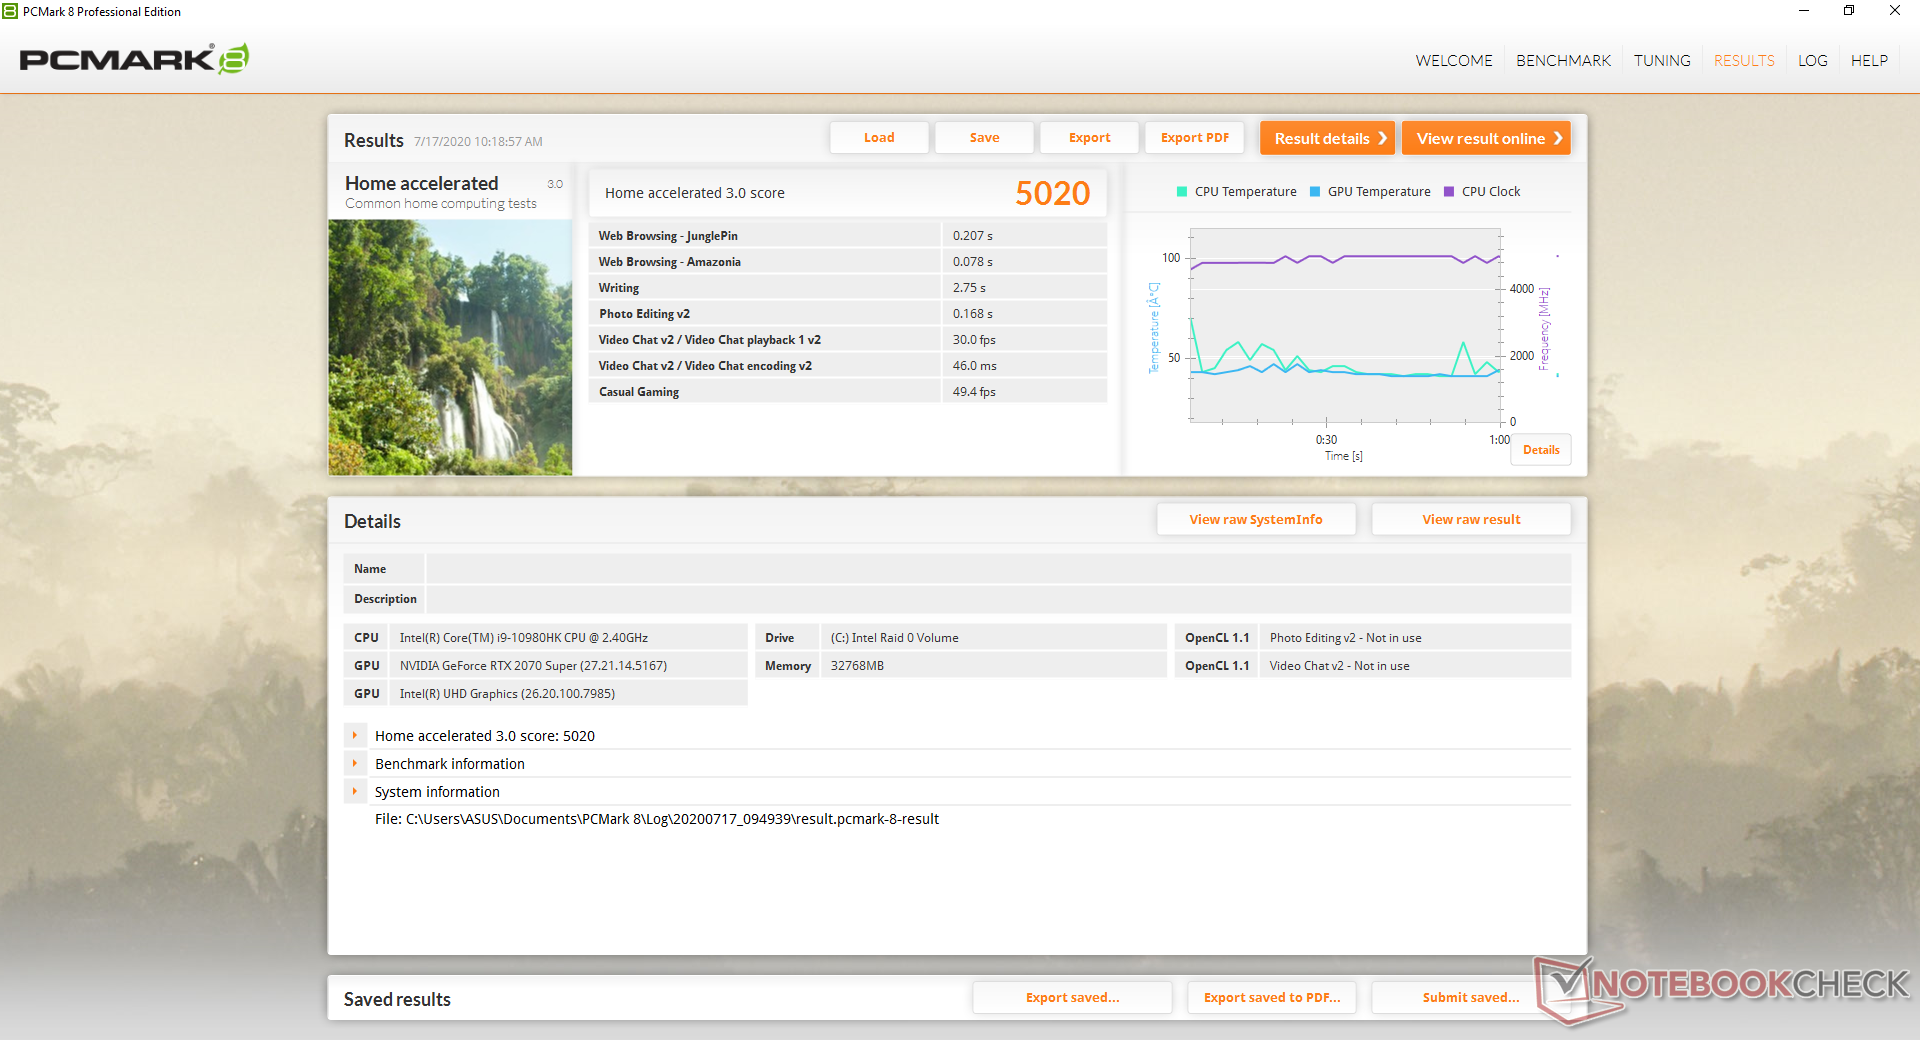
| PCMark 8 Home Score Accelerated v2 | 5020 points | |
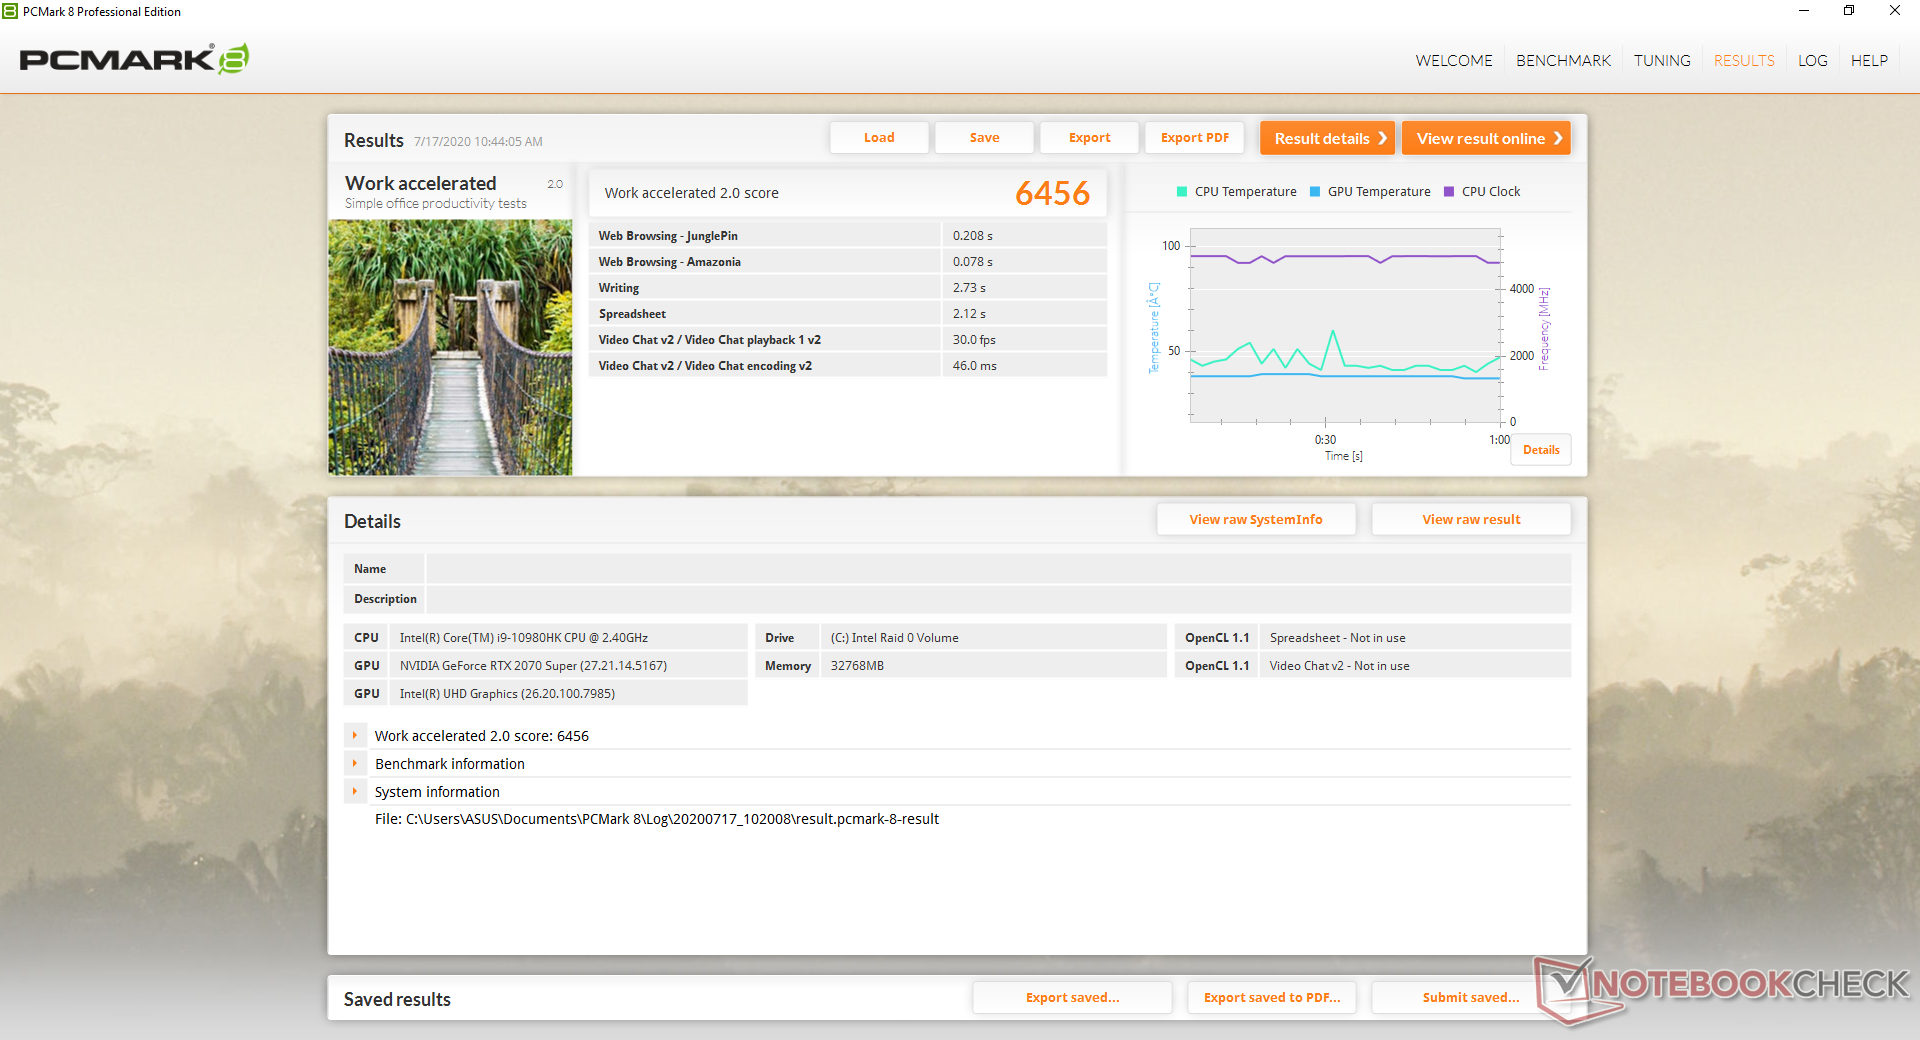
| PCMark 8 Work Score Accelerated v2 | 6456 points | |
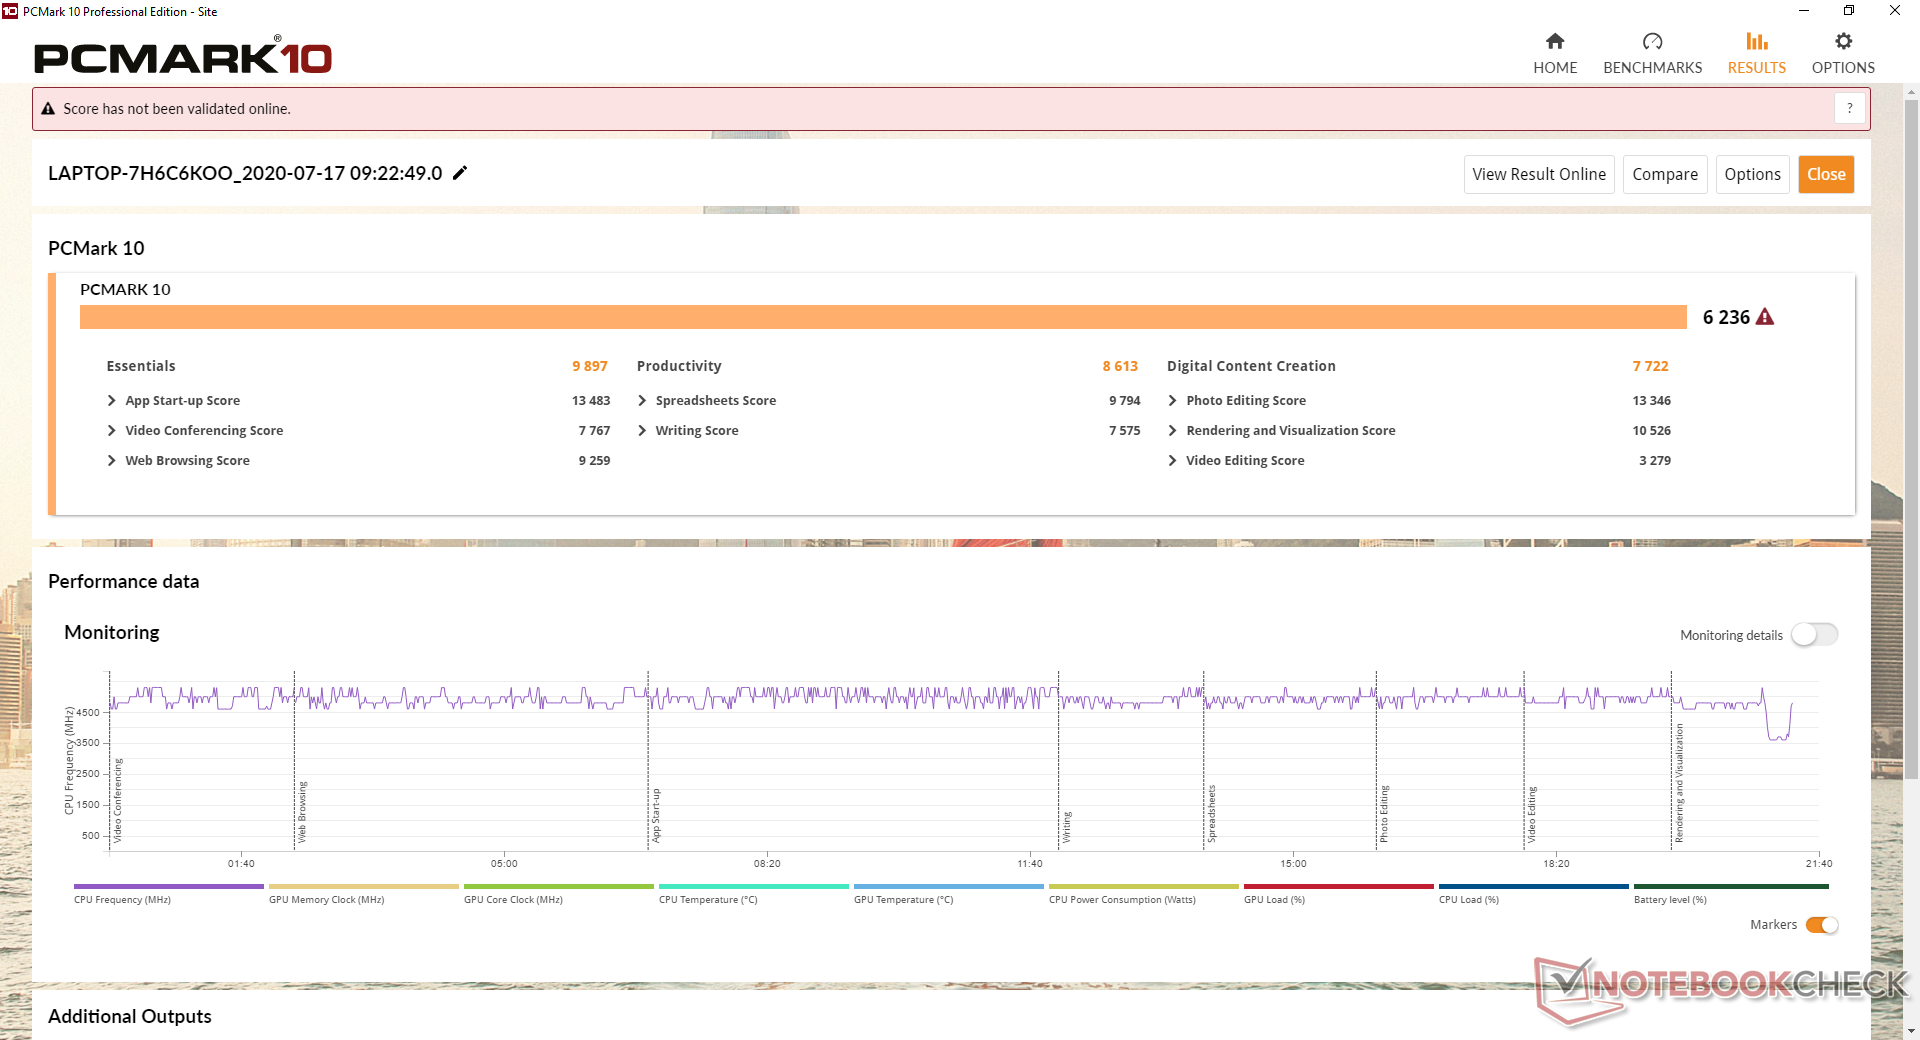
| PCMark 10 Score | 6236 points | |
Help | ||
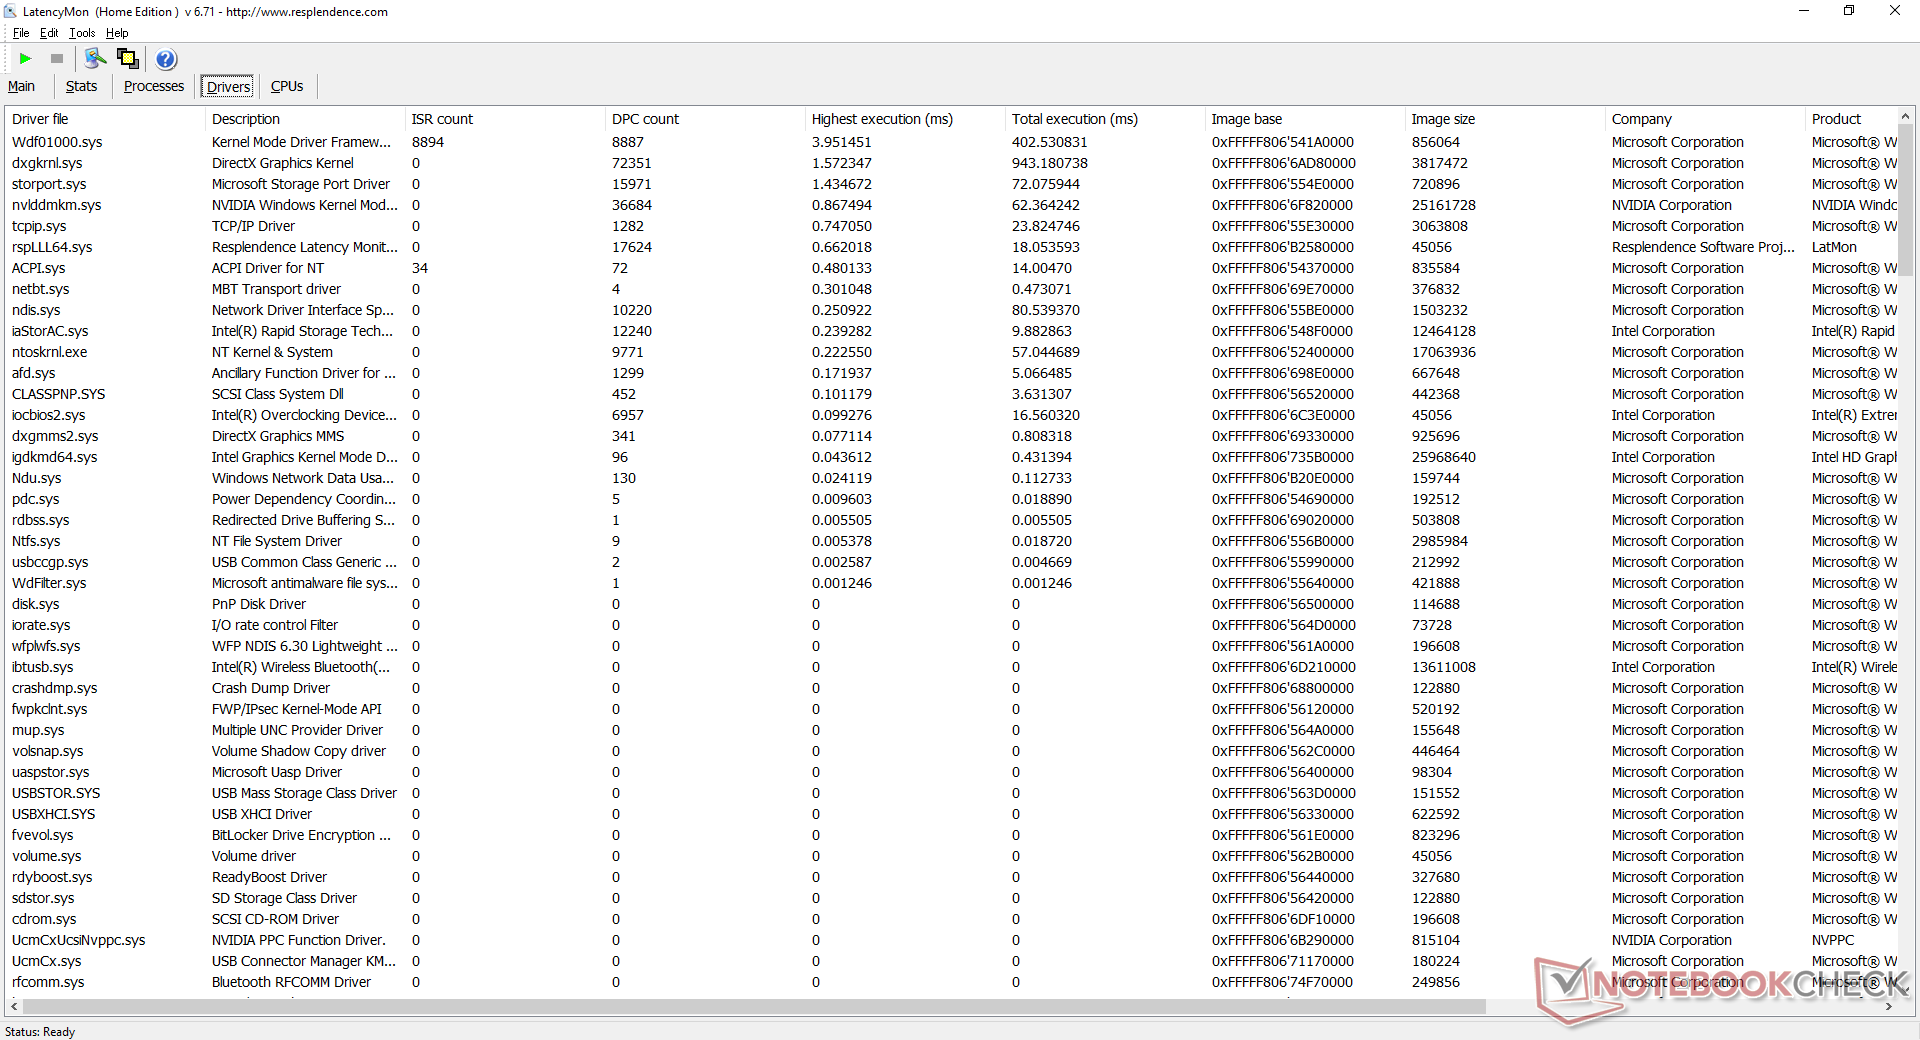
DPC Latency
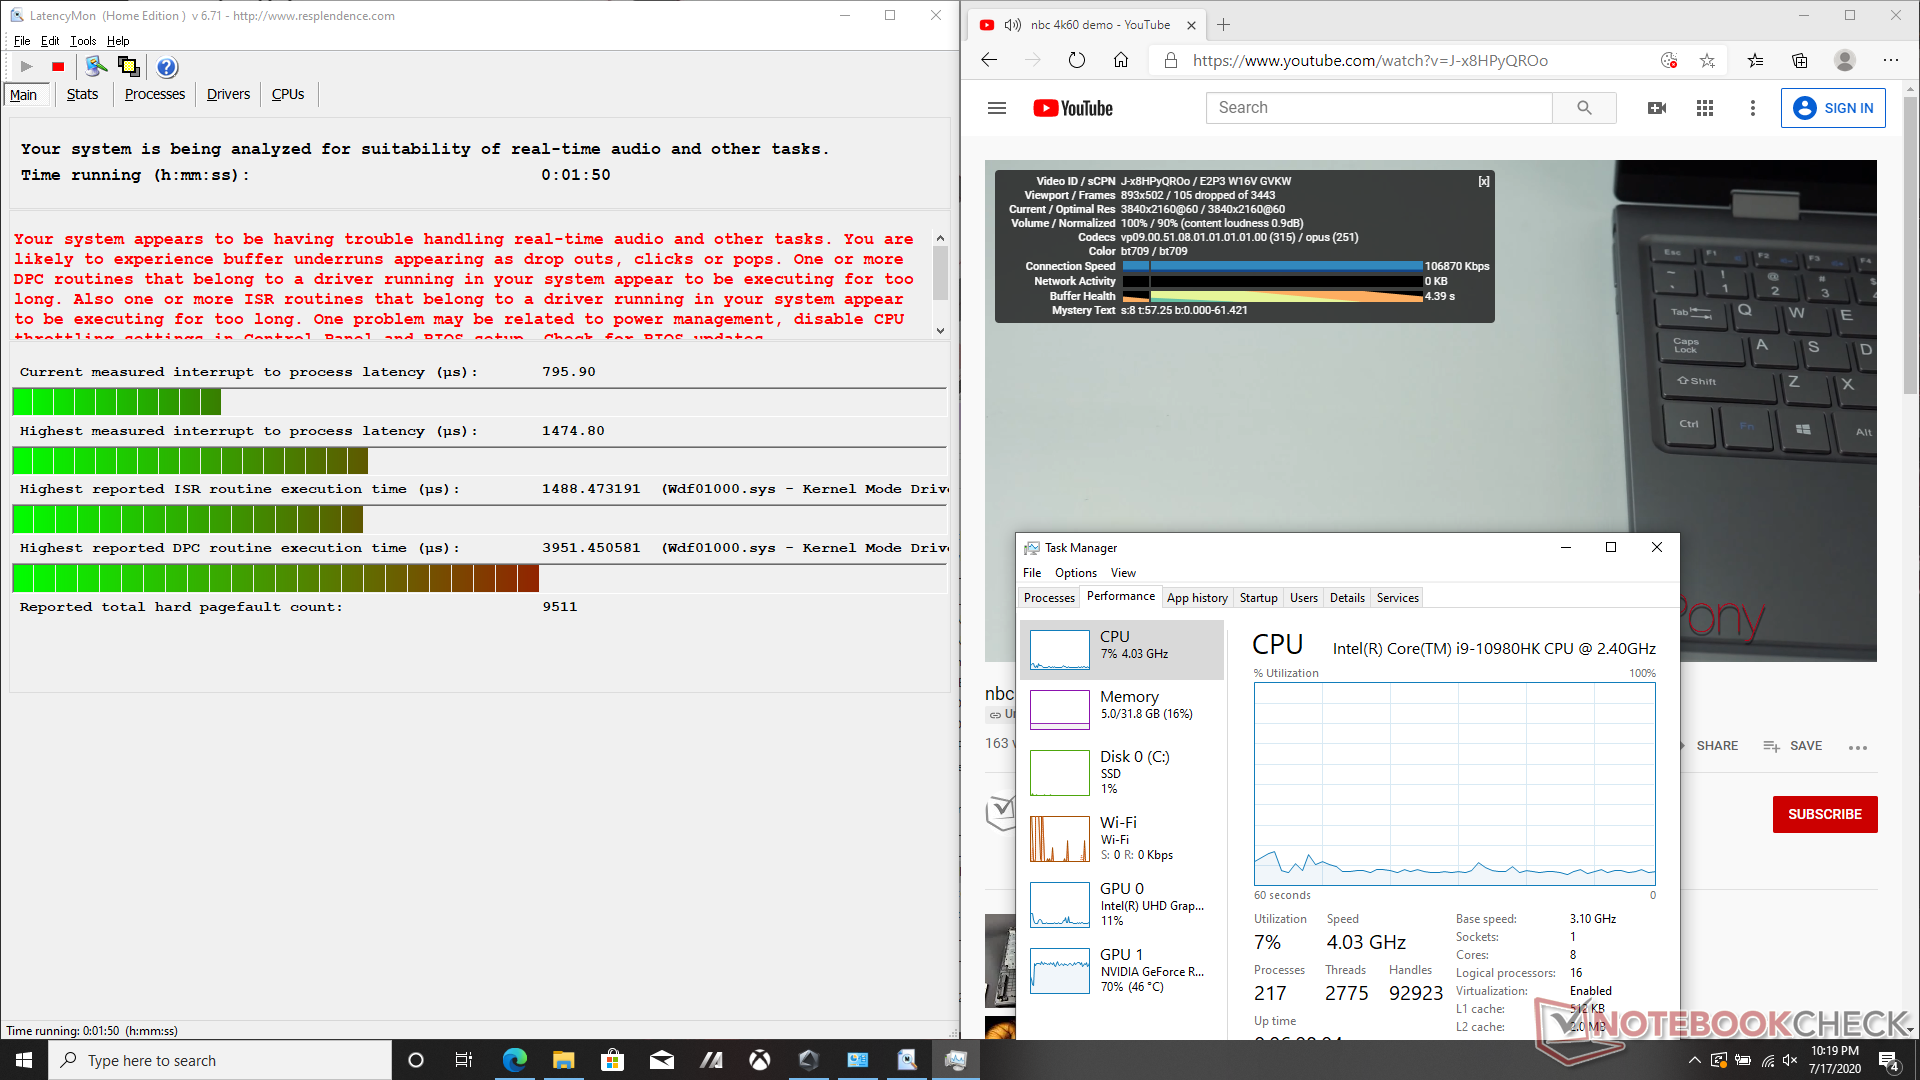
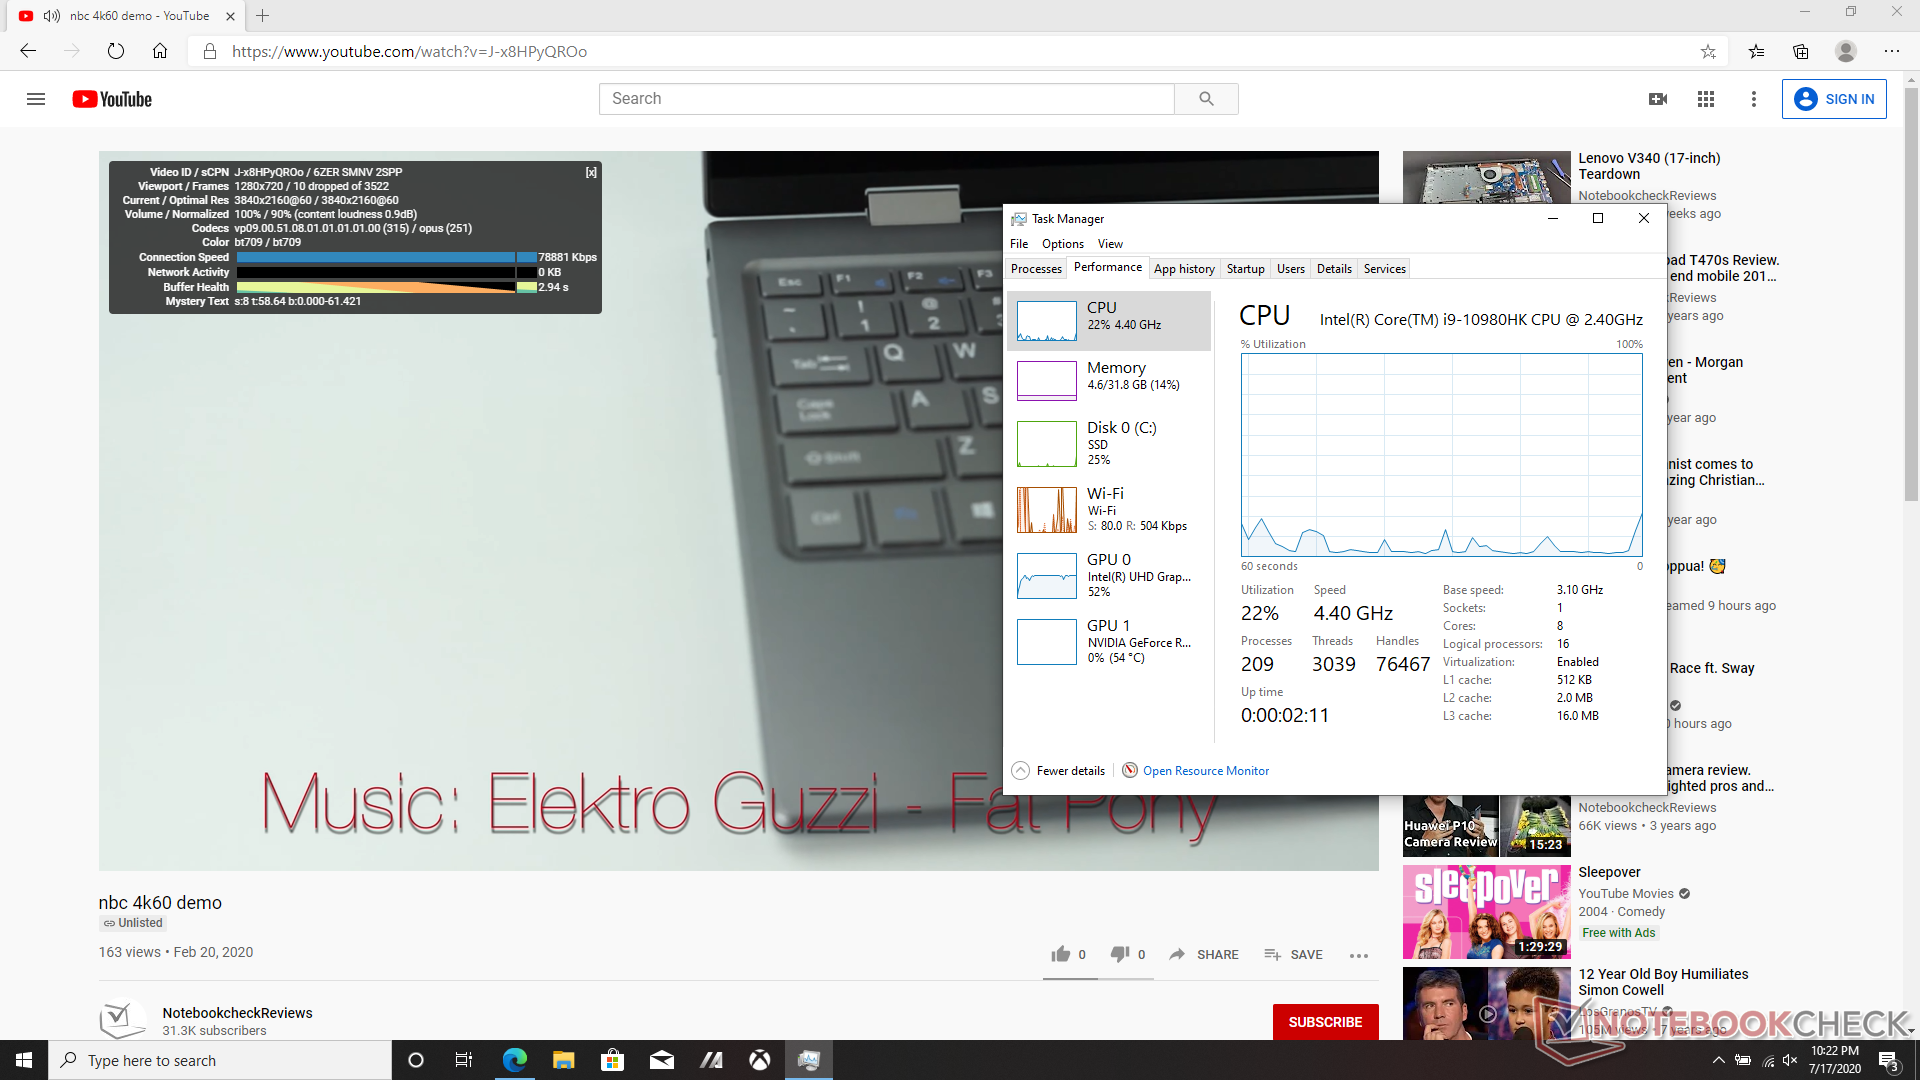
LatencyMon shows DPC latency issues related to Wdf01000.sys. We're able to record 105 dropped frames during our minute-long 4K60 YouTube test video as well which should not be happening on a laptop as powerful as this. Oddly enough, switching to the integrated GPU addresses the issue with "only" 10 dropped frames instead, but results are strange nonetheless. Both our Nvidia and Intel graphics drivers were up to date at the time of review.
| DPC Latencies / LatencyMon - interrupt to process latency (max), Web, Youtube, Prime95 | |
| Acer Predator Triton 500 PT515-52-70N3 | |
| Asus ROG Strix Scar 15 G532LWS | |
| MSI GE66 Raider 10SFS | |
| Razer Blade 15 RZ09-0328 | |
* ... smaller is better
Storage Devices
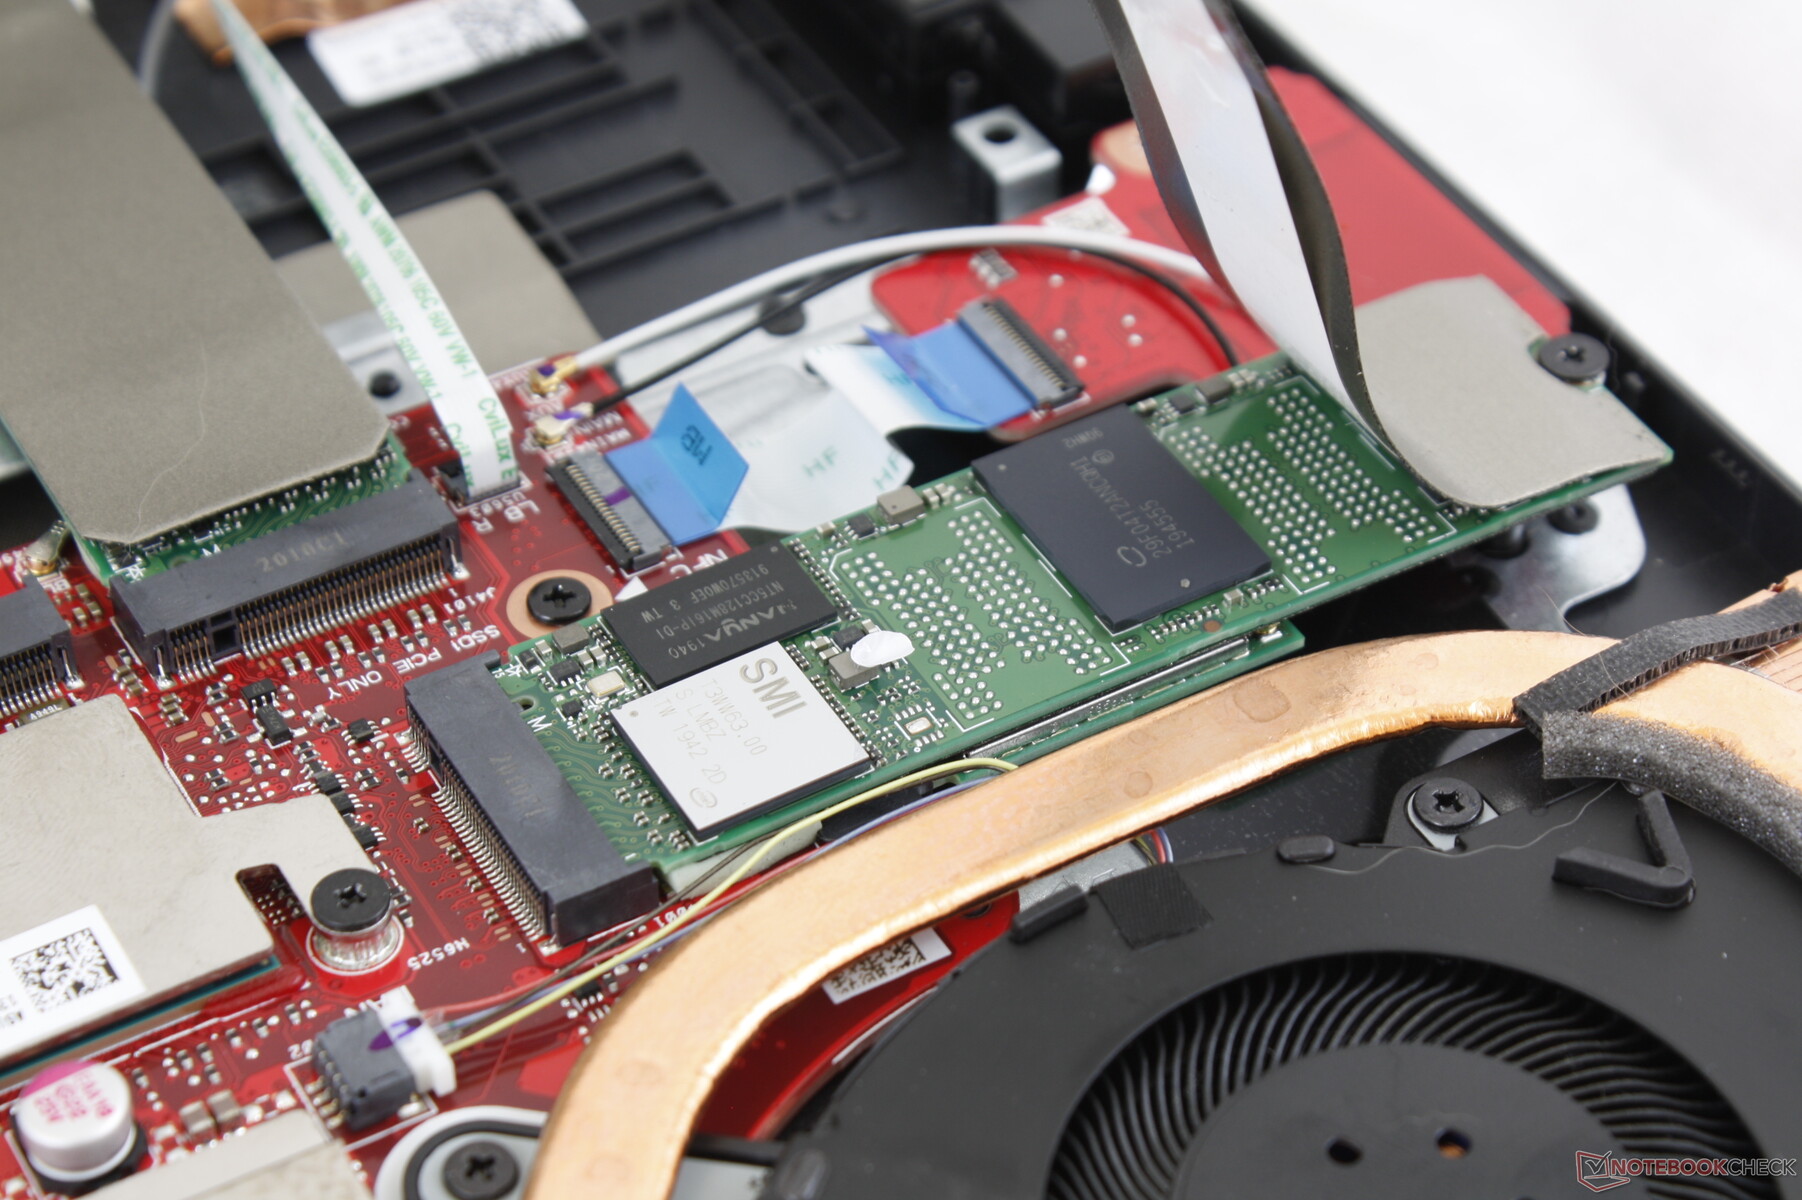
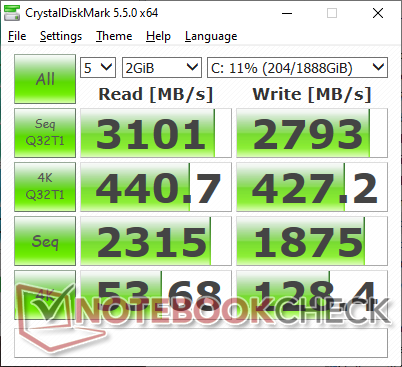
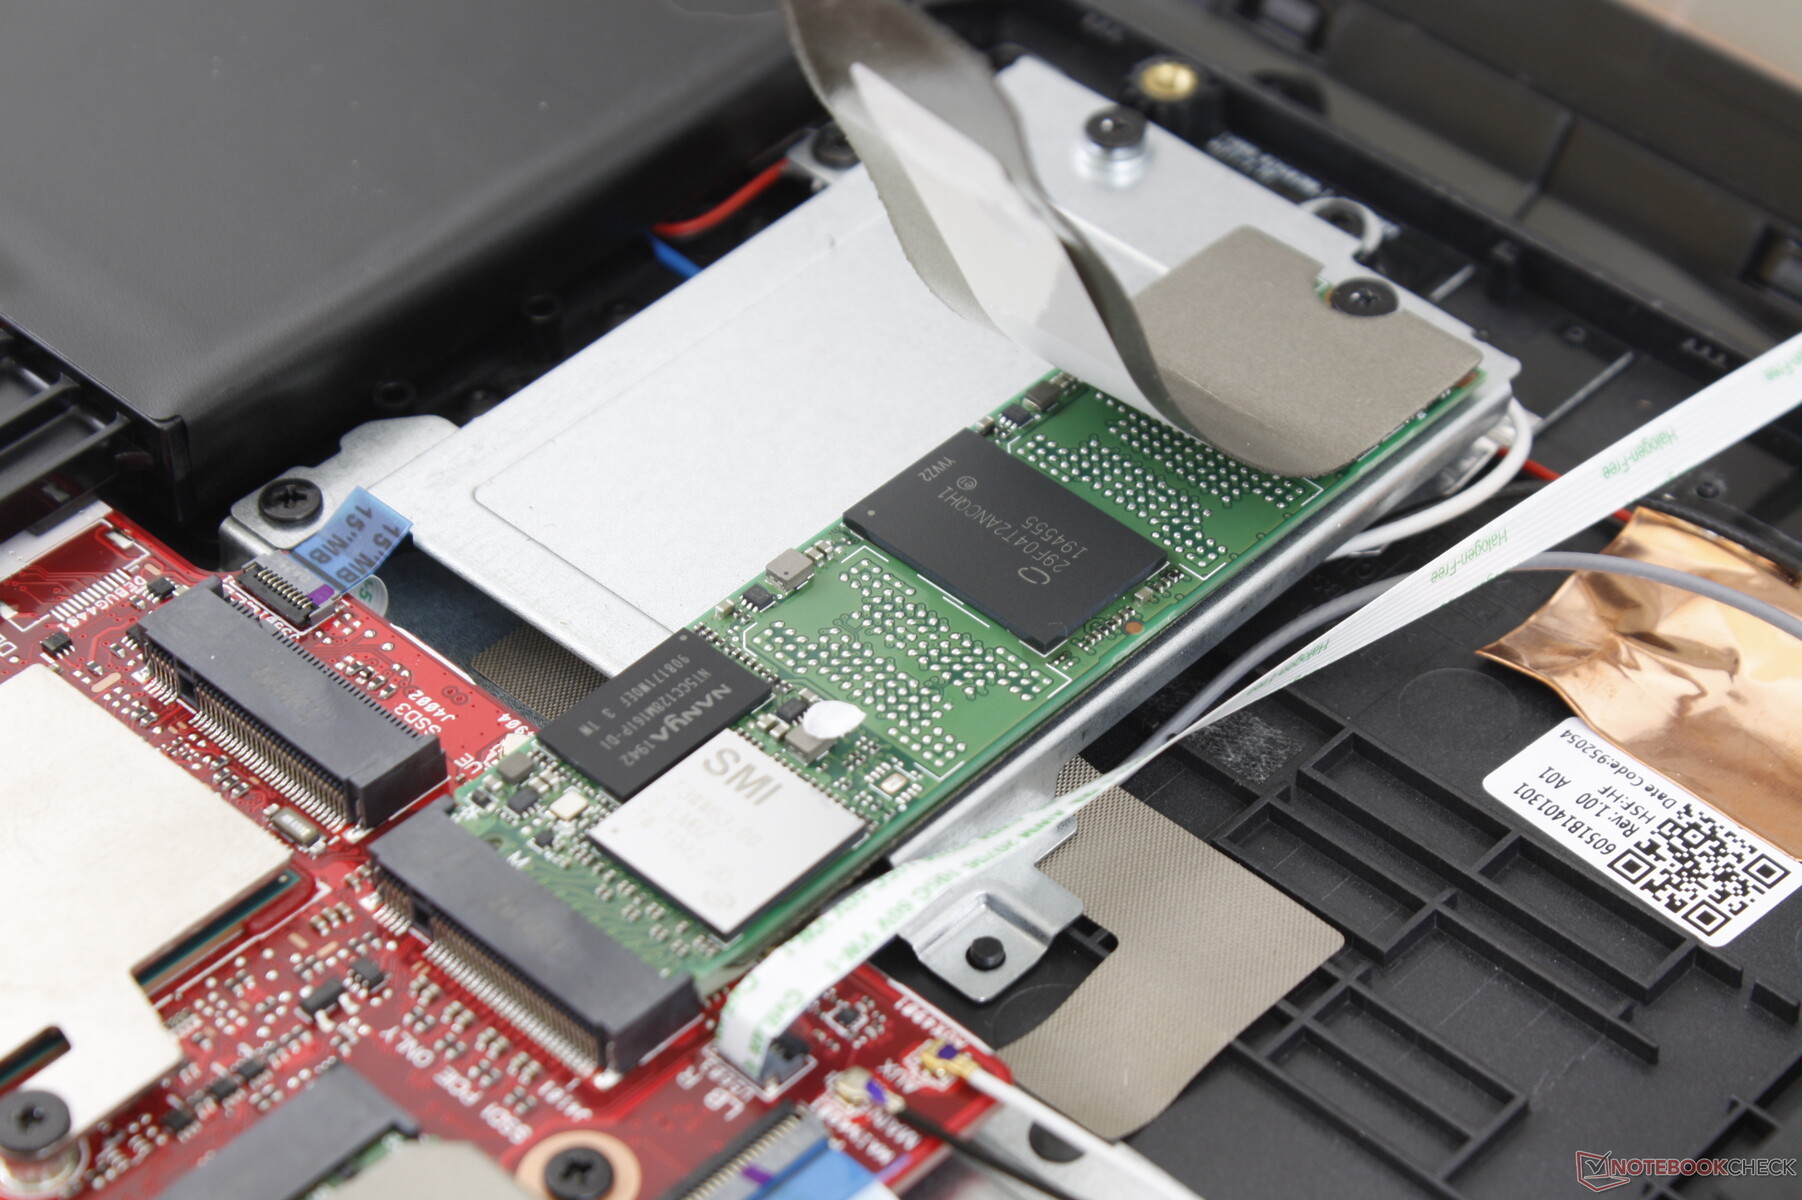
Our unit comes with two 1 TB Intel 660p M.2 SSDs in RAID 0 configuration. This particular drive is a mid-range NVMe SSD with sequential read and write speeds of 1800 MB/s each. A fast, singular drive like the Samsung PM981a in the MSI Bravo 15 can still match or outperform our RAID 0 setup as a result.
A noteworthy advantage of the system is that it can support up to three internal M.2 2280 SSDs whereas most other gaming laptops are limited to just two.
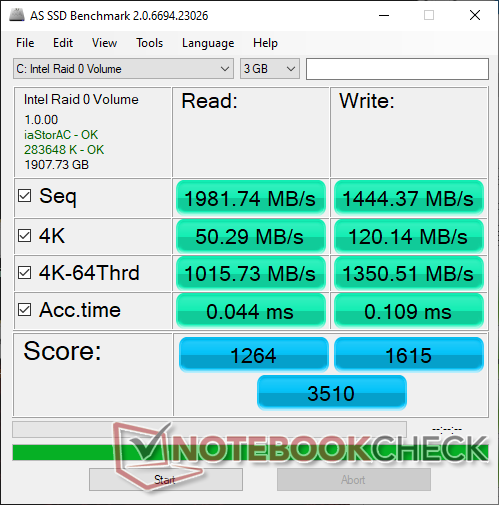
| Asus ROG Strix Scar 15 G532LWS 2x Intel SSD 660p 1TB SSDPEKNW010T8 (RAID 0) | MSI GE66 Raider 10SFS WDC PC SN730 SDBPNTY-1T00 | Razer Blade 15 RZ09-0328 Lite-On CA5-8D512 | Asus Strix Scar III G531GW-AZ062T Intel SSD 660p SSDPEKNW512G8 | MSI Bravo 15 A4DCR Samsung PM981a MZVLB1T0HBLR | |
|---|---|---|---|---|---|
| AS SSD | 47% | -11% | -70% | 44% | |
| Seq Read (MB/s) | 1982 | 2979 50% | 2021 2% | 1163 -41% | 2730 38% |
| Seq Write (MB/s) | 1444 | 2581 79% | 2090 45% | 919 -36% | 2513 74% |
| 4K Read (MB/s) | 50.3 | 47.33 -6% | 47.71 -5% | 48.88 -3% | 61.4 22% |
| 4K Write (MB/s) | 120.1 | 140 17% | 101.1 -16% | 90.1 -25% | 156.1 30% |
| 4K-64 Read (MB/s) | 1016 | 1710 68% | 856 -16% | 323.8 -68% | 1780 75% |
| 4K-64 Write (MB/s) | 1351 | 2188 62% | 1041 -23% | 403.8 -70% | 1920 42% |
| Access Time Read * (ms) | 0.044 | 0.05 -14% | 0.052 -18% | 0.24 -445% | 0.063 -43% |
| Access Time Write * (ms) | 0.109 | 0.026 76% | 0.111 -2% | 0.046 58% | 0.025 77% |
| Score Read (Points) | 1264 | 2055 63% | 1105 -13% | 489 -61% | 2114 67% |
| Score Write (Points) | 1615 | 2586 60% | 1351 -16% | 586 -64% | 2327 44% |
| Score Total (Points) | 3510 | 5673 62% | 3037 -13% | 1332 -62% | 5518 57% |
| Copy ISO MB/s (MB/s) | 3474 | 2474 -29% | 1269 -63% | ||
| Copy Program MB/s (MB/s) | 751 | 679 -10% | 452.8 -40% | ||
| Copy Game MB/s (MB/s) | 1684 | 1037 -38% | 755 -55% | ||
| CrystalDiskMark 5.2 / 6 | 11% | 5% | -32% | 8% | |
| Write 4K (MB/s) | 128.4 | 158.2 23% | 118.7 -8% | 133.3 4% | 118.3 -8% |
| Read 4K (MB/s) | 53.7 | 50.7 -6% | 52.4 -2% | 55.3 3% | 43.73 -19% |
| Write Seq (MB/s) | 1875 | 1790 -5% | 2247 20% | 980 -48% | 2854 52% |
| Read Seq (MB/s) | 2315 | 2469 7% | 2234 -3% | 1406 -39% | 2302 -1% |
| Write 4K Q32T1 (MB/s) | 427.2 | 503 18% | 515 21% | 286.3 -33% | 418.5 -2% |
| Read 4K Q32T1 (MB/s) | 440.7 | 579 31% | 584 33% | 331.5 -25% | 517 17% |
| Write Seq Q32T1 (MB/s) | 2793 | 3102 11% | 2235 -20% | 976 -65% | 3008 8% |
| Read Seq Q32T1 (MB/s) | 3101 | 3413 10% | 3171 2% | 1520 -51% | 3568 15% |
| Write 4K Q8T8 (MB/s) | 748 | ||||
| Read 4K Q8T8 (MB/s) | 344.6 | ||||
| Total Average (Program / Settings) | 29% /
32% | -3% /
-5% | -51% /
-56% | 26% /
29% |
* ... smaller is better

Disk Throttling: DiskSpd Read Loop, Queue Depth 8
GPU Performance
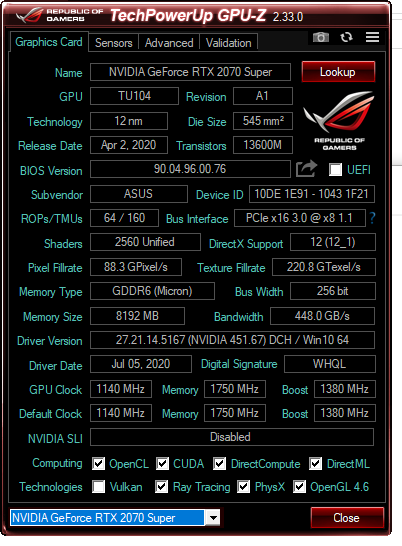
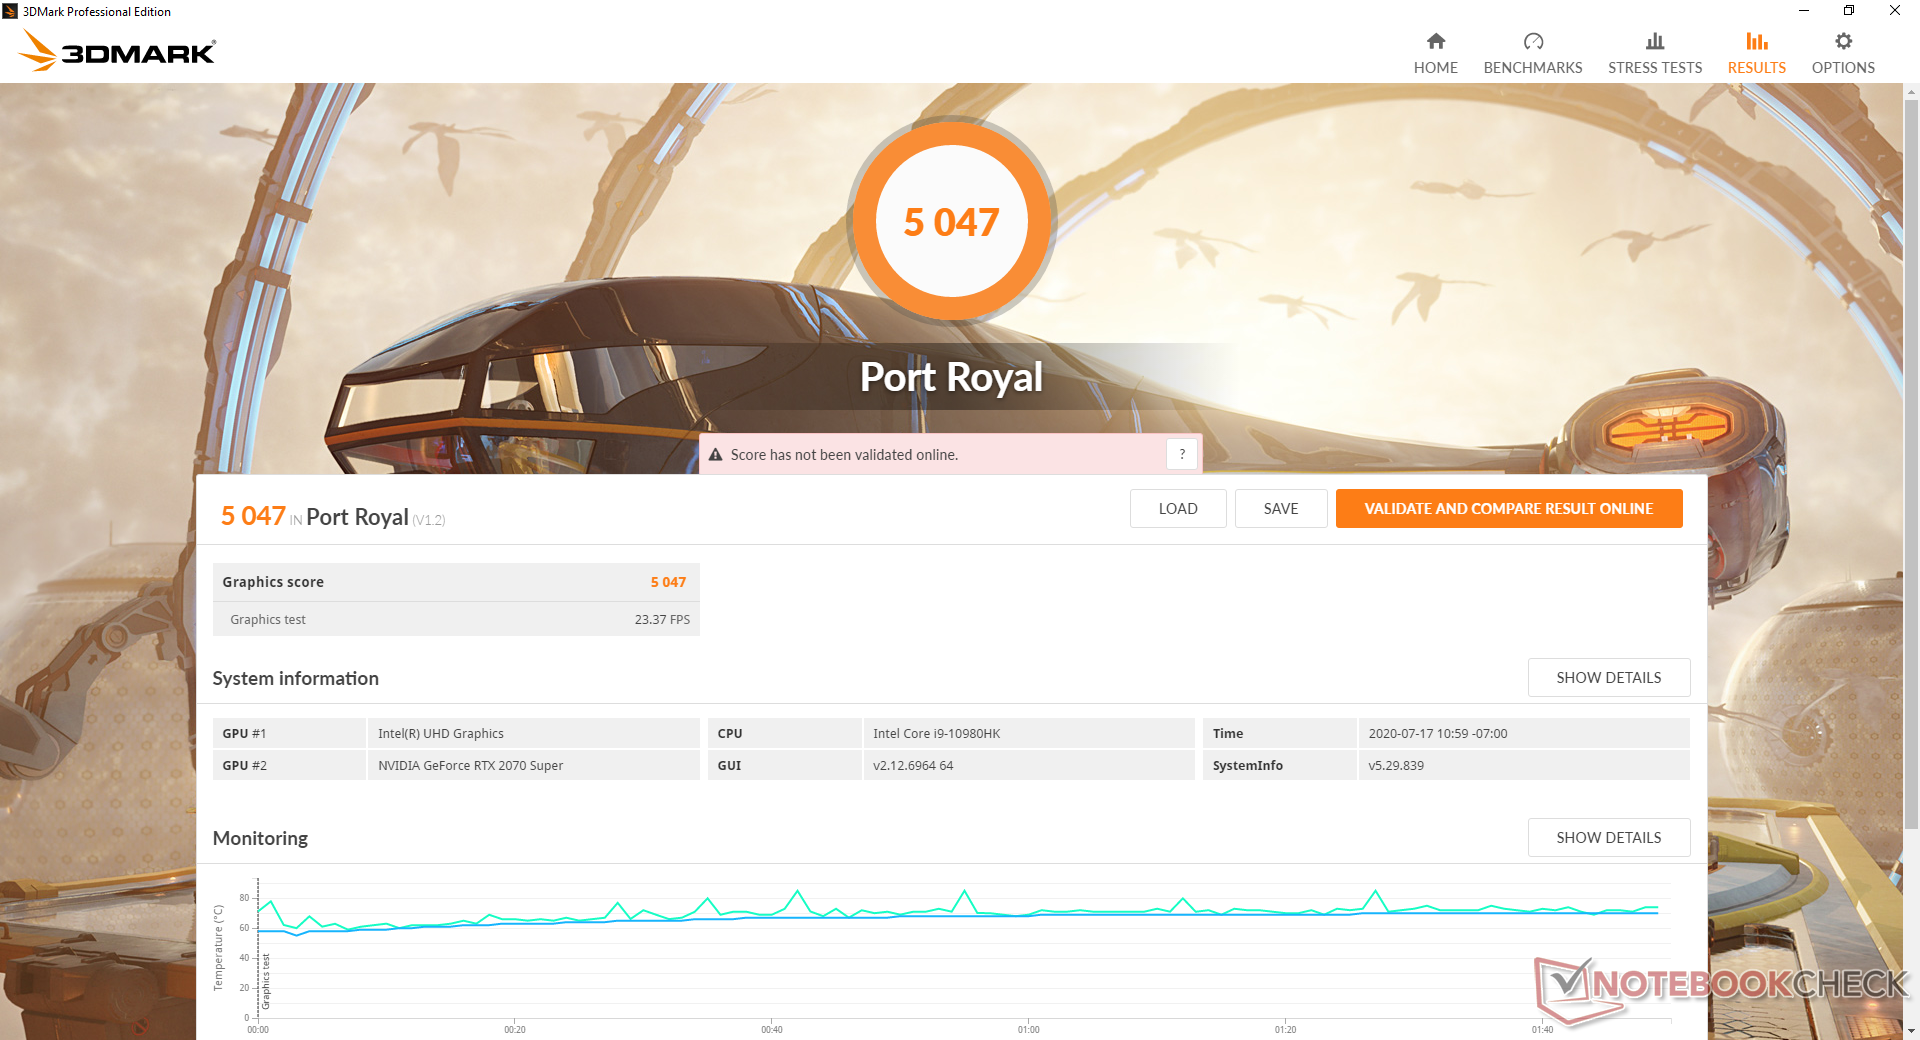
The mobile GeForce RTX 2070 Super is about 10 to 15 percent slower than the mobile GeForce RTX 2080 Super or up to 10 percent faster than the regular mobile RTX 2070. Opting for the lesser RTX 2060 option will result in a performance dip of about 25 percent. Nvidia's mobile GPU lineup has gotten out of hand recently meaning that the performance differences between many high-end RTX 2070/2080 SKUs have become marginal.
More RTX 2070 Super benchmarks and comparisons can be found on our page here. Users aiming for high frame rates to exploit the 1080p 300 Hz panel will find the most value out of this Core i9 and RTX 2070 Super combination.
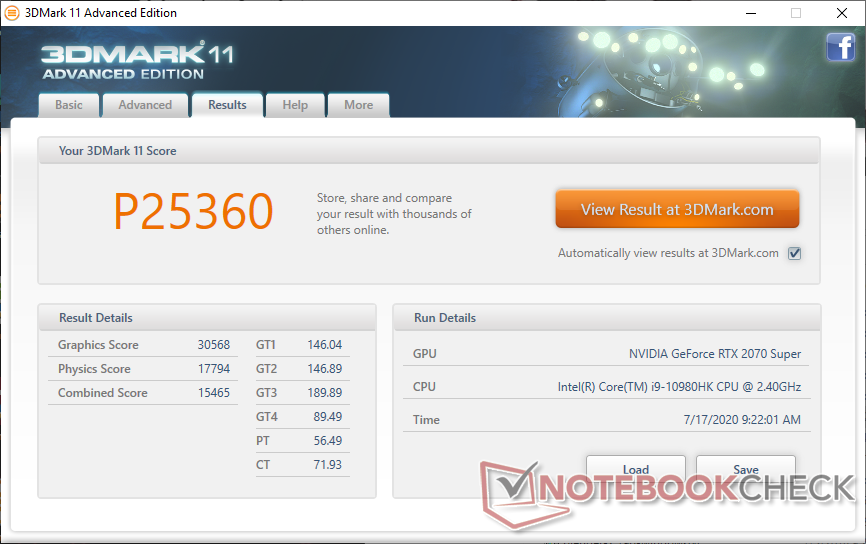
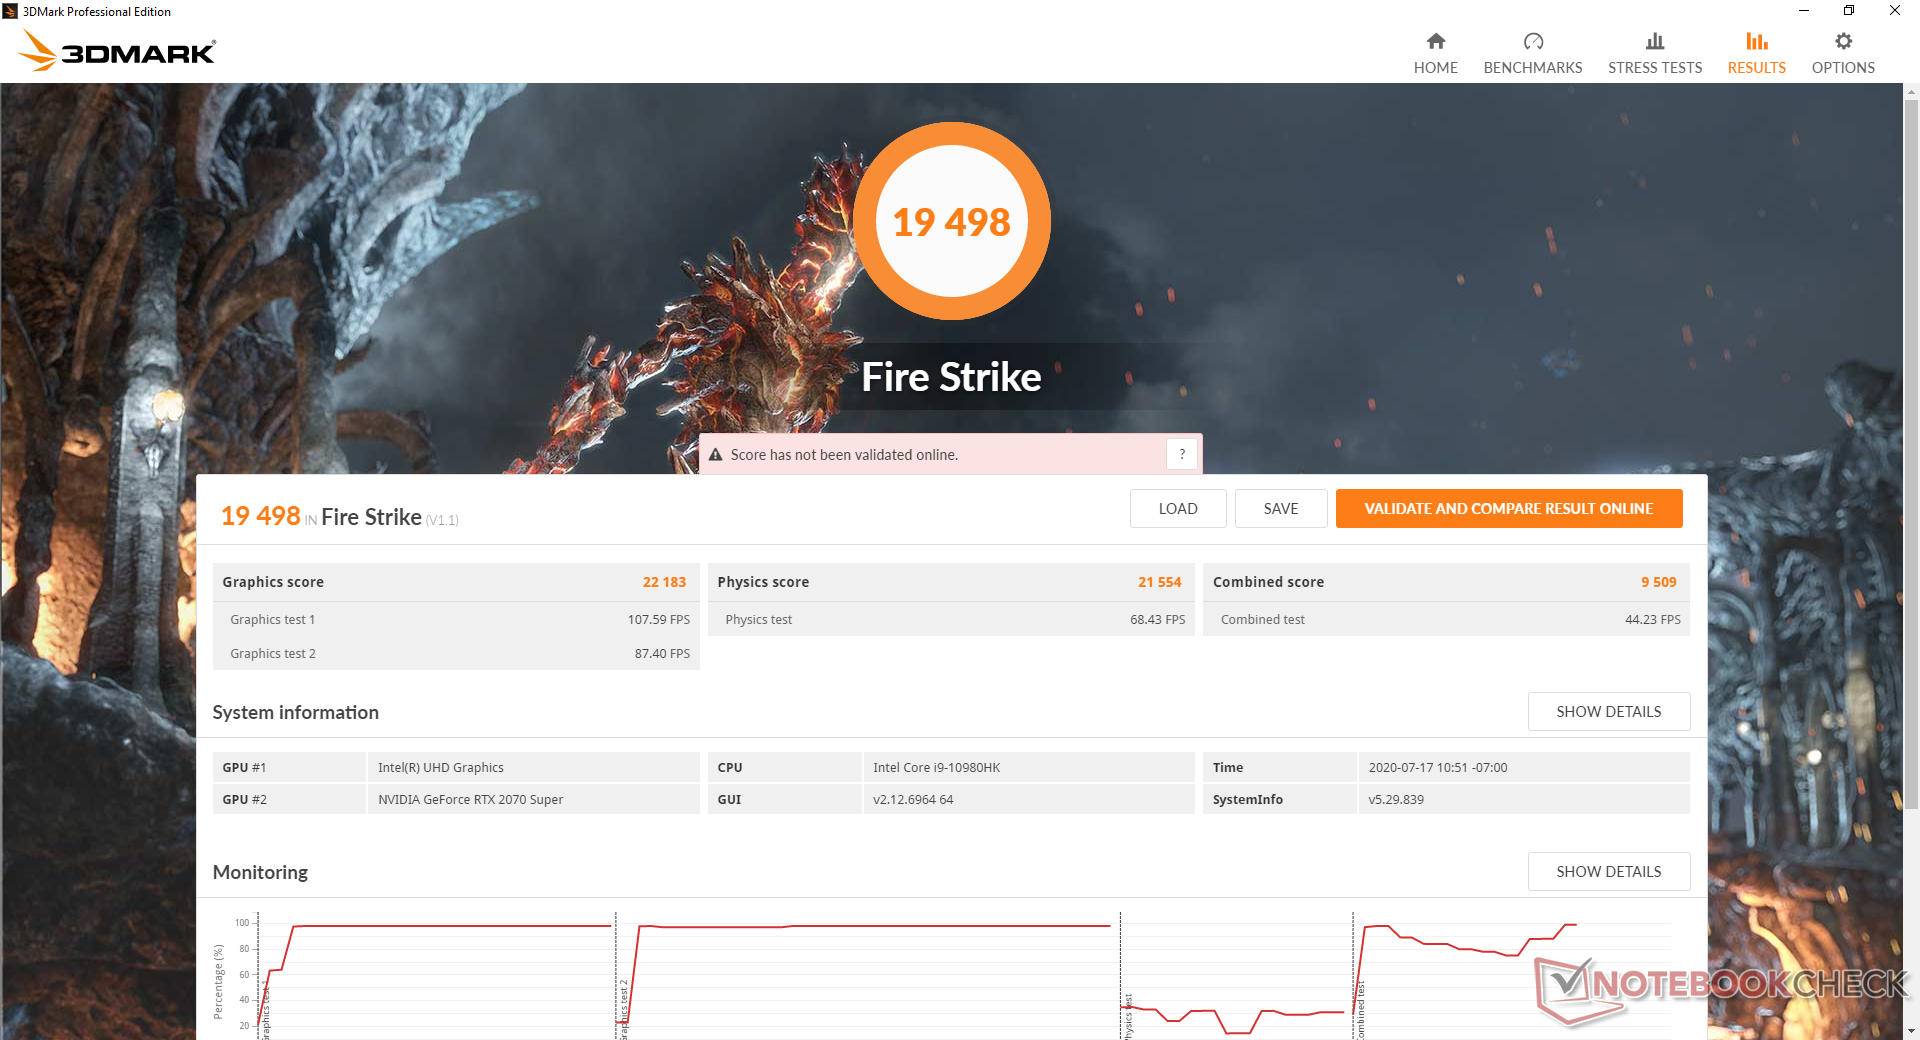
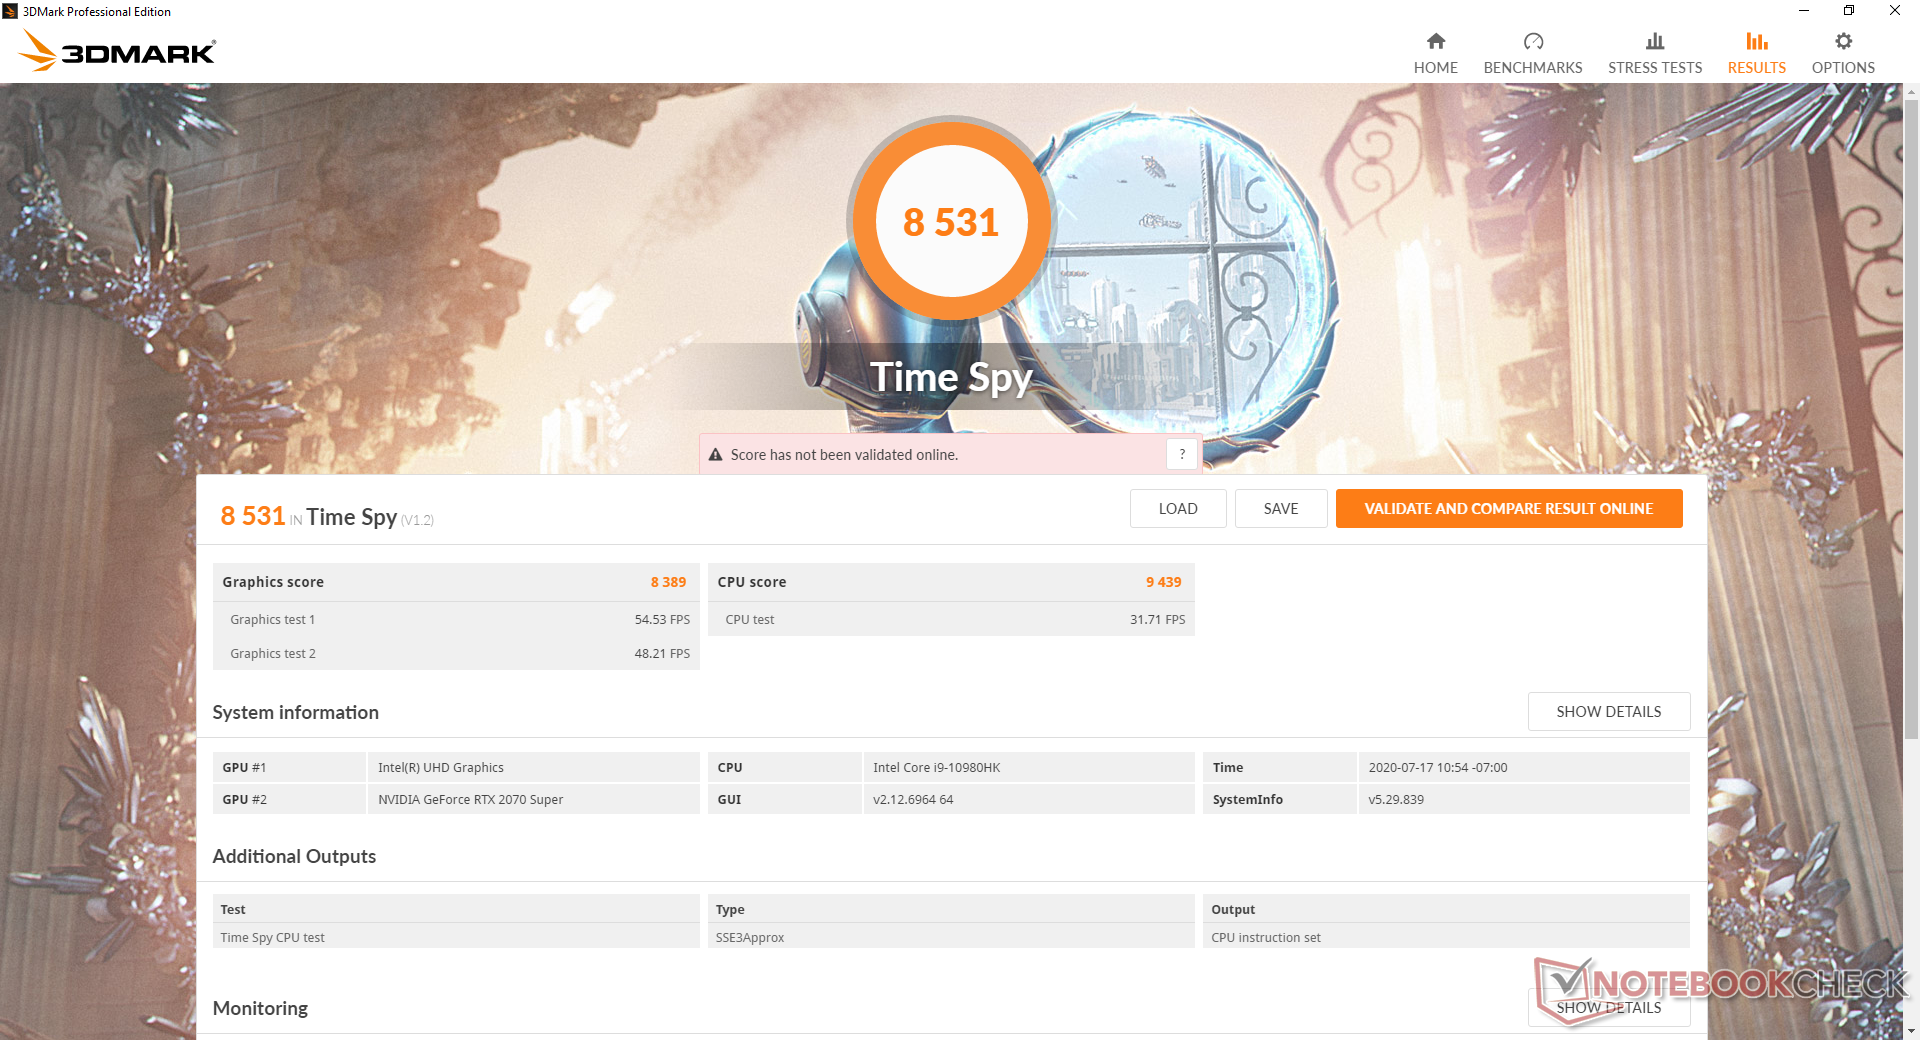
| 3DMark 11 Performance | 25360 points | |
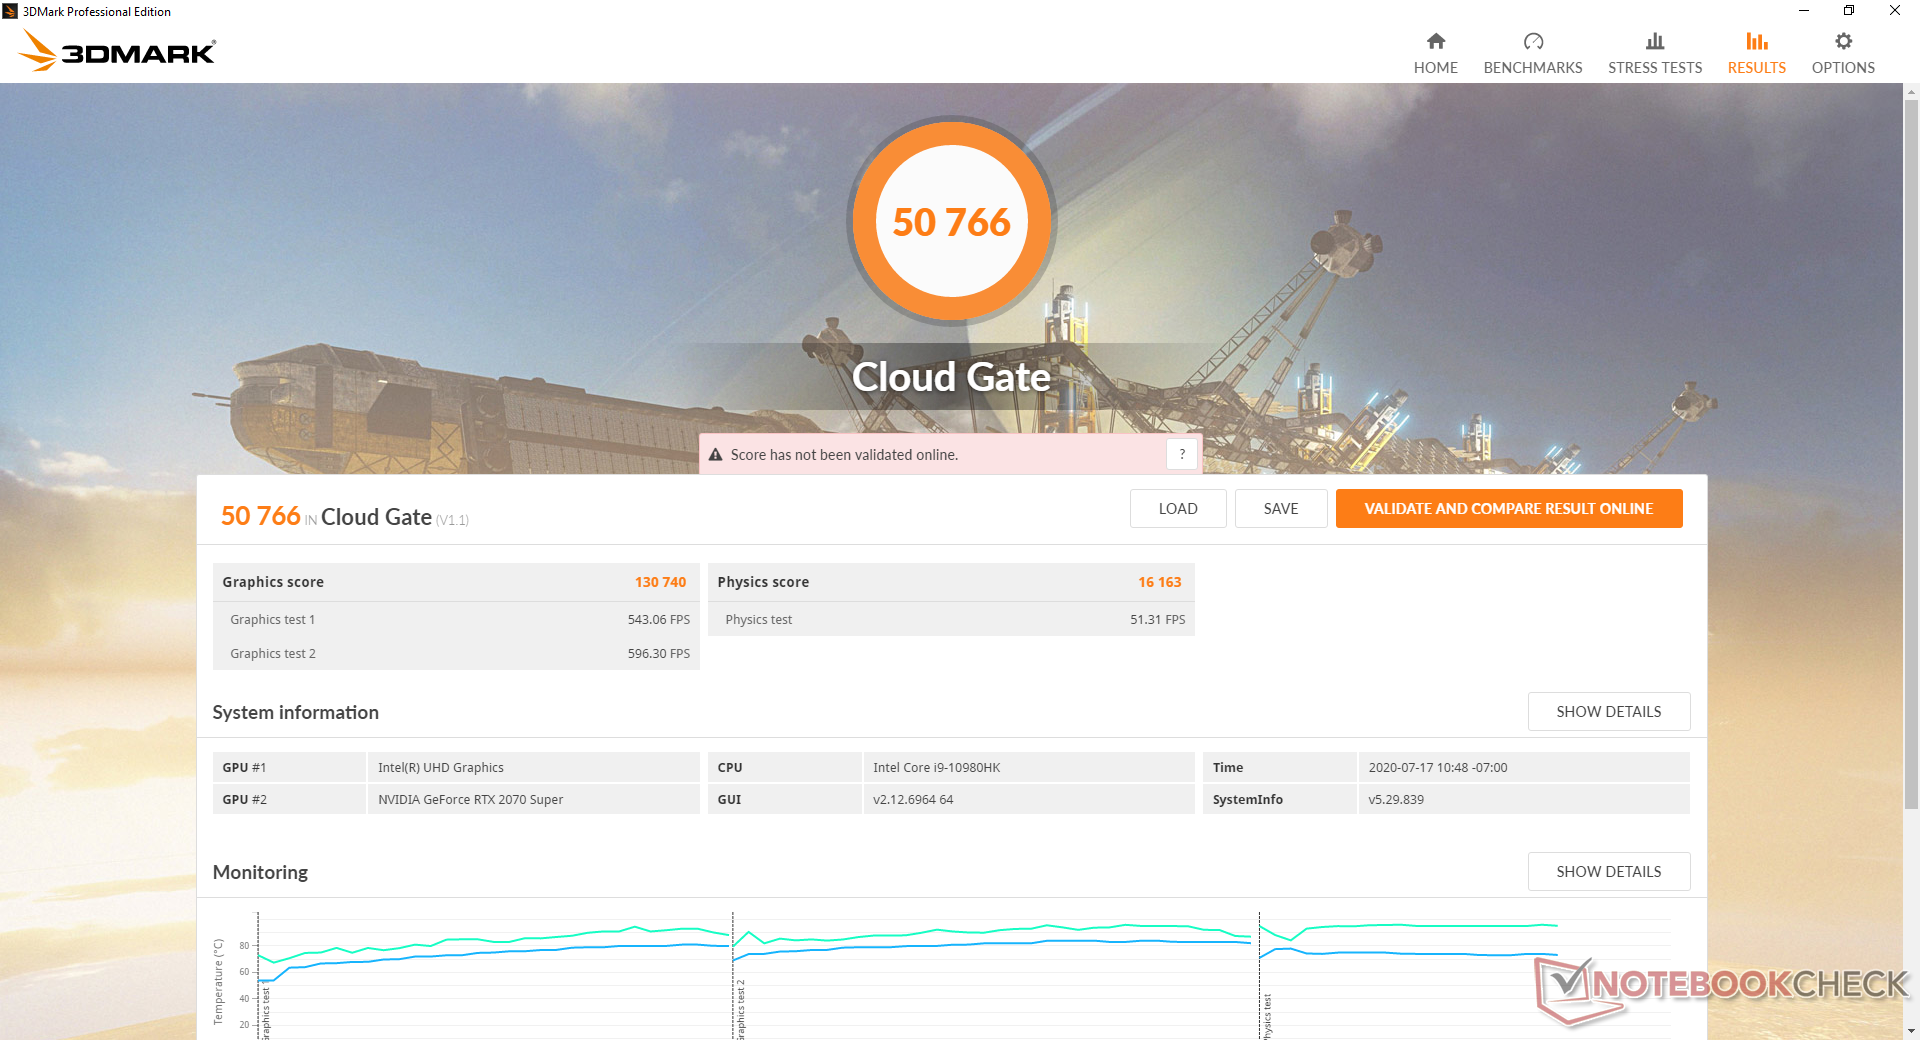
| 3DMark Cloud Gate Standard Score | 50766 points | |
| 3DMark Fire Strike Score | 19498 points | |
| 3DMark Time Spy Score | 8531 points | |
Help | ||
| low | med. | high | ultra | |
|---|---|---|---|---|
| The Witcher 3 (2015) | 368.7 | 256.5 | 168 | 85.7 |
| Dota 2 Reborn (2015) | 156 | 145 | 135 | 129 |
| X-Plane 11.11 (2018) | 118 | 103 | 86.5 | |
| Shadow of the Tomb Raider (2018) | 153 | 120 | 115 | 104 |
Emissions
System Noise
The fans are almost always active no matter the setting. Fan noise can be as high as 34 dB(A) simply by idling on desktop or browsing the web. Pulsing behavior becomes even worse if set to higher performance modes and so we recommend Power Saver or Silent mode to keep fan speeds as low as possible. This is a behavior we've encountered on all Strix and Scar laptops thus far.
Fan noise when gaming is very loud even for a gaming laptop. We're able to record a constant 57.5 dB(A) when on Turbo mode or 53.4 dB(A) when on Performance mode. In either case, results are louder than what we've recorded on many other high performance laptops including the Razer Blade 15 or MSI GE66.
| Asus ROG Strix Scar 15 G532LWS GeForce RTX 2070 Super Mobile, i9-10980HK, 2x Intel SSD 660p 1TB SSDPEKNW010T8 (RAID 0) | MSI GE66 Raider 10SFS GeForce RTX 2070 Super Mobile, i9-10980HK, WDC PC SN730 SDBPNTY-1T00 | Acer Predator Triton 500 PT515-52-70N3 GeForce RTX 2080 Super Max-Q, i7-10750H, Samsung SSD PM981a MZVLB512HBJQ | Razer Blade 15 RZ09-0328 GeForce RTX 2070 Max-Q, i7-10750H, Lite-On CA5-8D512 | HP Omen X 2S 15-dg0075cl GeForce RTX 2070 Max-Q, i7-9750H, WDC PC SN720 SDAPNTW-1T00 | Asus Strix Scar III G531GW-AZ062T GeForce RTX 2070 Mobile, i7-9750H, Intel SSD 660p SSDPEKNW512G8 | |
|---|---|---|---|---|---|---|
| Noise | -7% | 0% | 7% | 4% | 3% | |
| off / environment * (dB) | 26.5 | 30 -13% | 30 -13% | 28.4 -7% | 29 -9% | 30 -13% |
| Idle Minimum * (dB) | 27.1 | 30 -11% | 30 -11% | 28.4 -5% | 30.5 -13% | 30.6 -13% |
| Idle Average * (dB) | 32.2 | 35 -9% | 33 -2% | 28.4 12% | 31.5 2% | 30.6 5% |
| Idle Maximum * (dB) | 34 | 44 -29% | 36 -6% | 31.7 7% | 31.5 7% | 37.7 -11% |
| Load Average * (dB) | 52.4 | 53 -1% | 50 5% | 47.7 9% | 40.6 23% | 36.5 30% |
| Witcher 3 ultra * (dB) | 57.5 | 53 8% | 48 17% | 47.5 17% | 49.5 14% | 52.1 9% |
| Load Maximum * (dB) | 57.5 | 55 4% | 50 13% | 49.5 14% | 53.4 7% | 48.1 16% |
* ... smaller is better
Noise level
| Idle |
| 27.1 / 32.2 / 34 dB(A) |
| Load |
| 52.4 / 57.5 dB(A) |
 | ||
30 dB silent 40 dB(A) audible 50 dB(A) loud |
||
min: | ||
Temperature
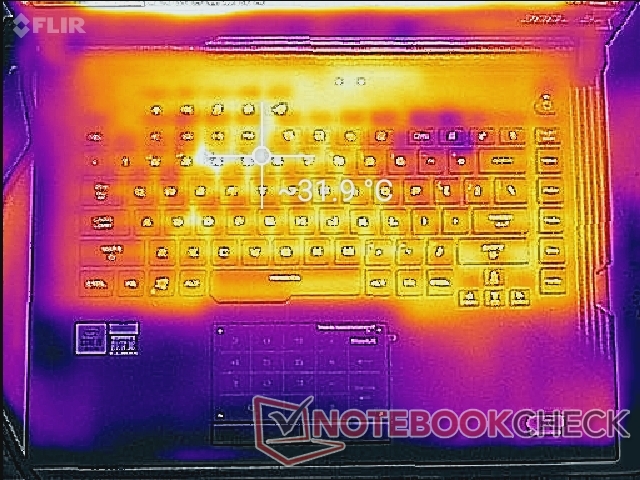
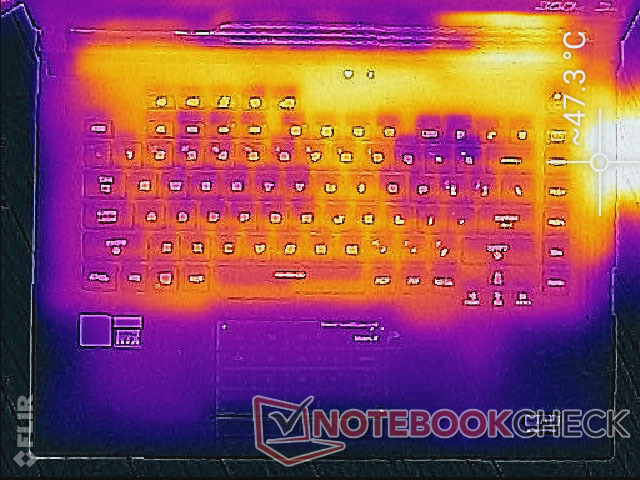
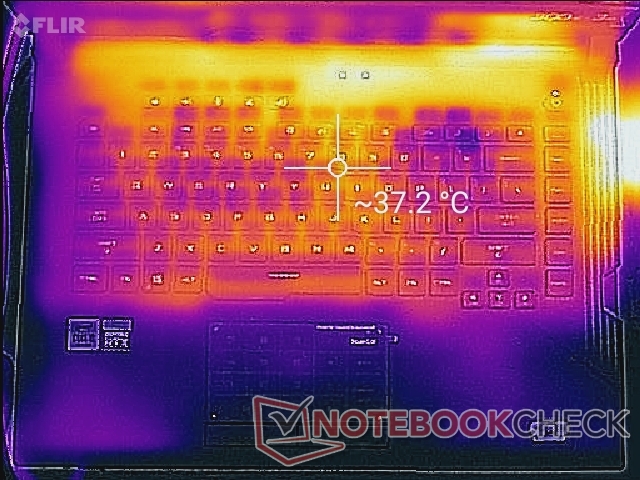
It's important for gaming laptops to have cool surfaces where palms and fingers are most likely to rest on. In this case, the palm rests and WASD keys are never uncomfortably warm no matter the onscreen load. The keyboard center can become as warm as 37 C when gaming while the real hot spots along the outer edges of the keyboard can become as warm as 47 C. Hot spots are thankfully concentrated on very specific points unlike on the thinner Razer Blade or MSI GS series where temperature gradients tend to be shallower.
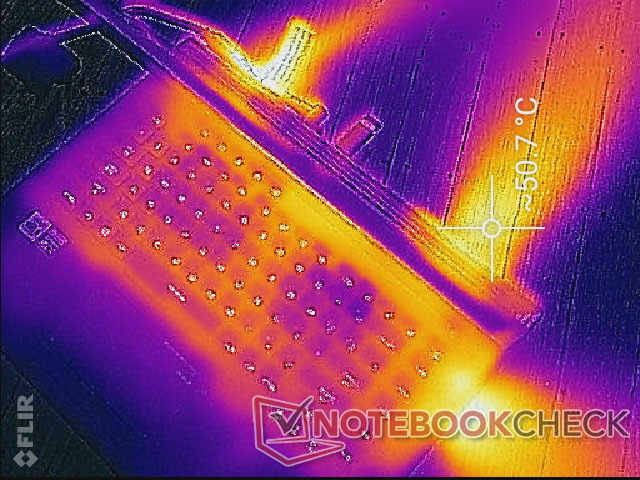
(-) The maximum temperature on the upper side is 46.2 °C / 115 F, compared to the average of 40.4 °C / 105 F, ranging from 21.2 to 68.8 °C for the class Gaming.
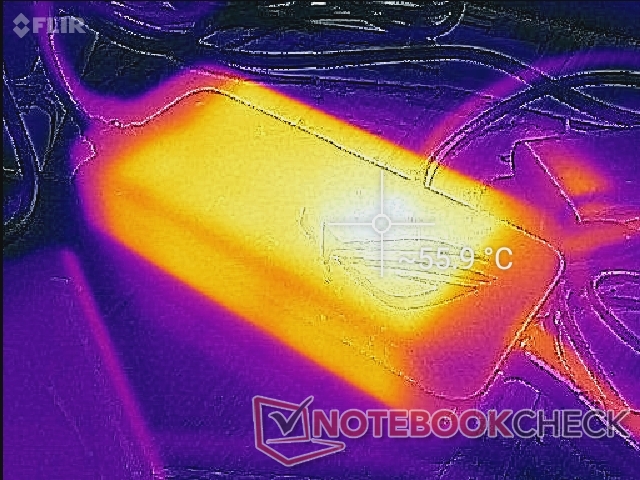
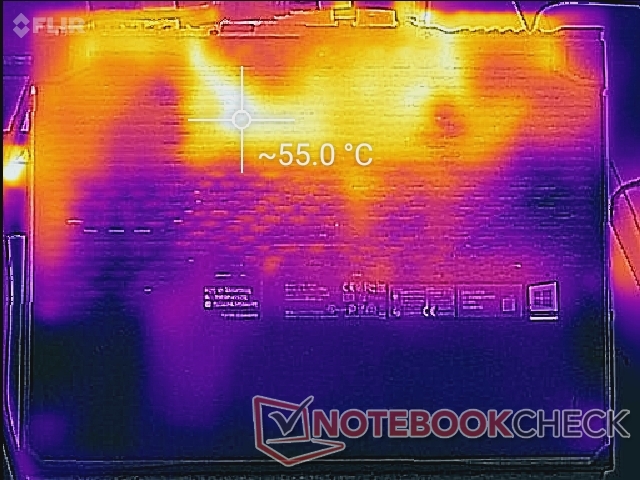
(-) The bottom heats up to a maximum of 55.2 °C / 131 F, compared to the average of 43.2 °C / 110 F
(+) In idle usage, the average temperature for the upper side is 29.1 °C / 84 F, compared to the device average of 33.9 °C / 93 F.
(±) Playing The Witcher 3, the average temperature for the upper side is 36.3 °C / 97 F, compared to the device average of 33.9 °C / 93 F.
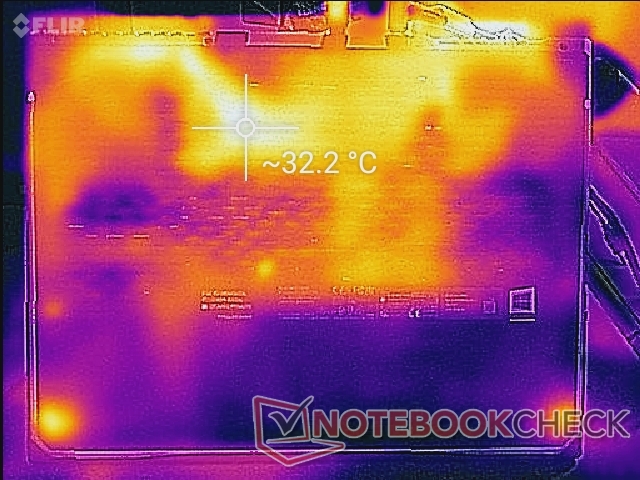
(+) The palmrests and touchpad are cooler than skin temperature with a maximum of 27.6 °C / 81.7 F and are therefore cool to the touch.
(±) The average temperature of the palmrest area of similar devices was 28.8 °C / 83.8 F (+1.2 °C / 2.1 F).

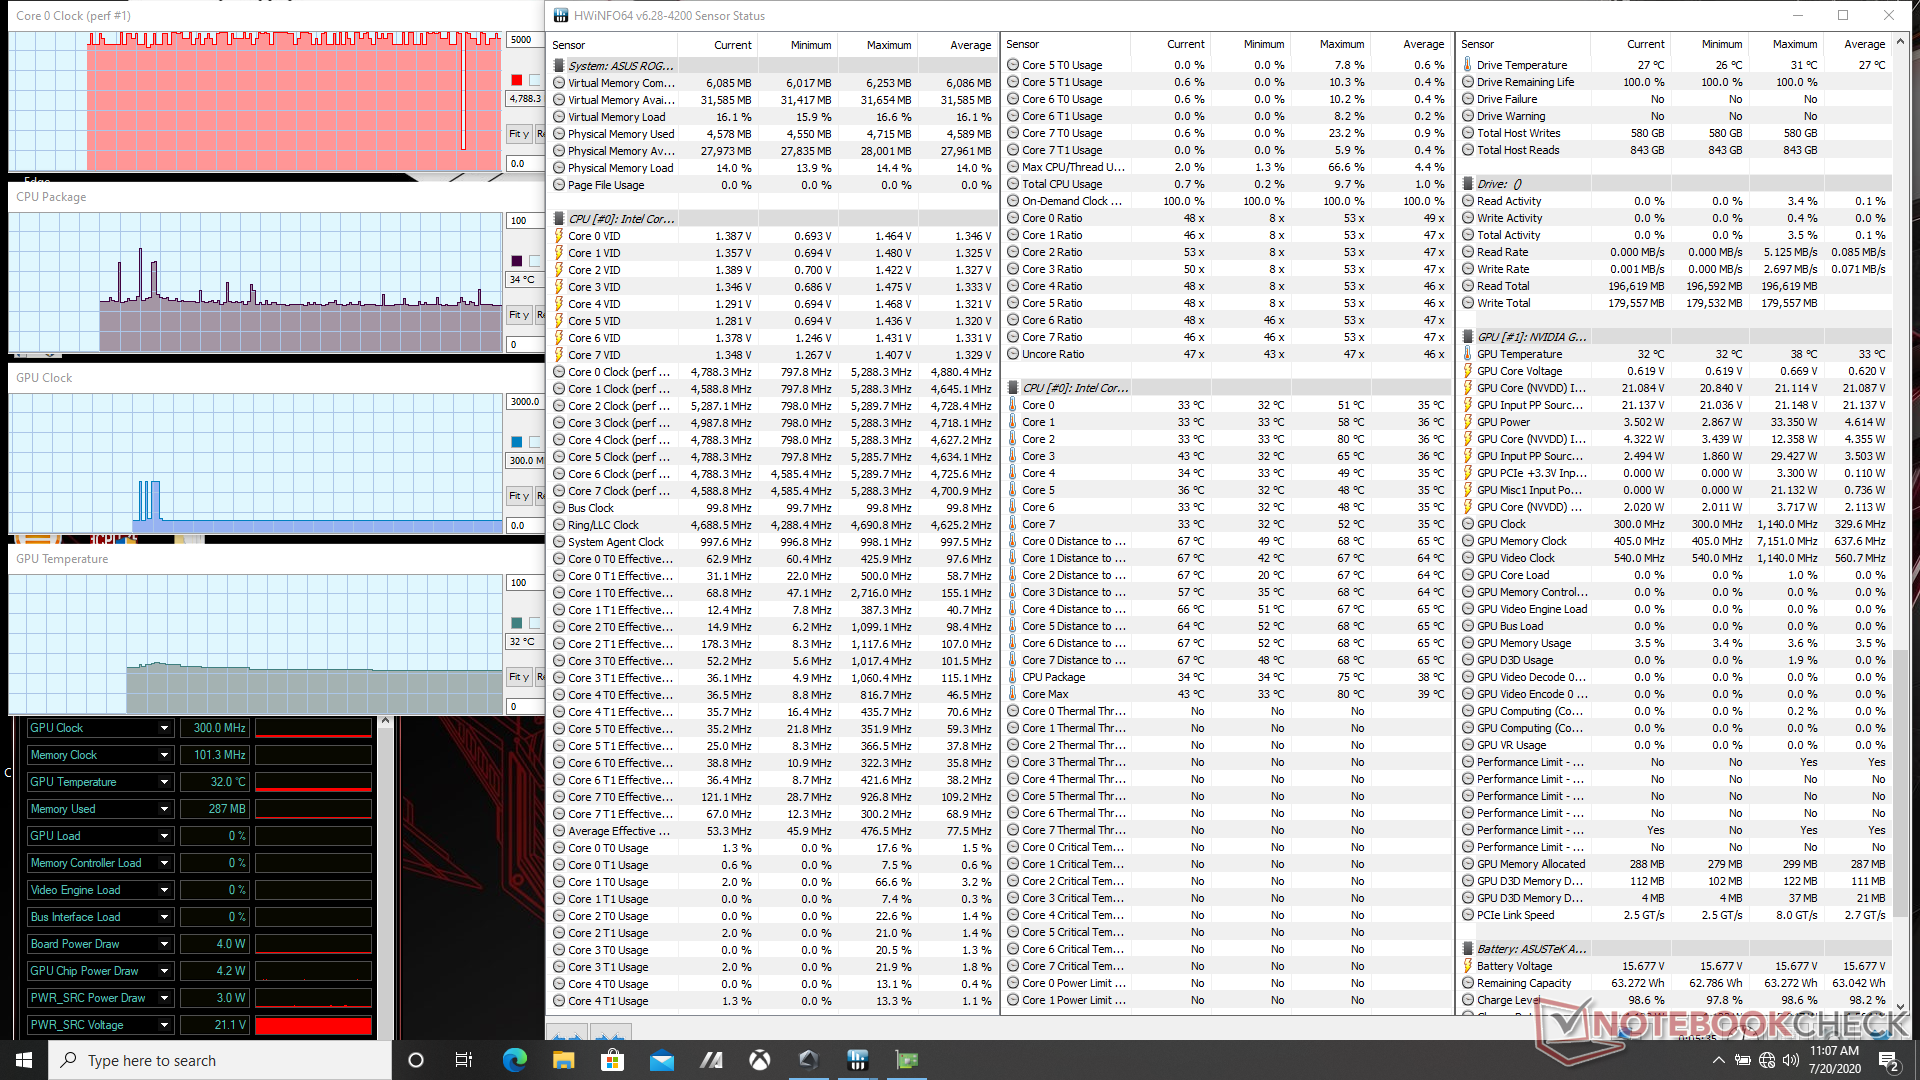
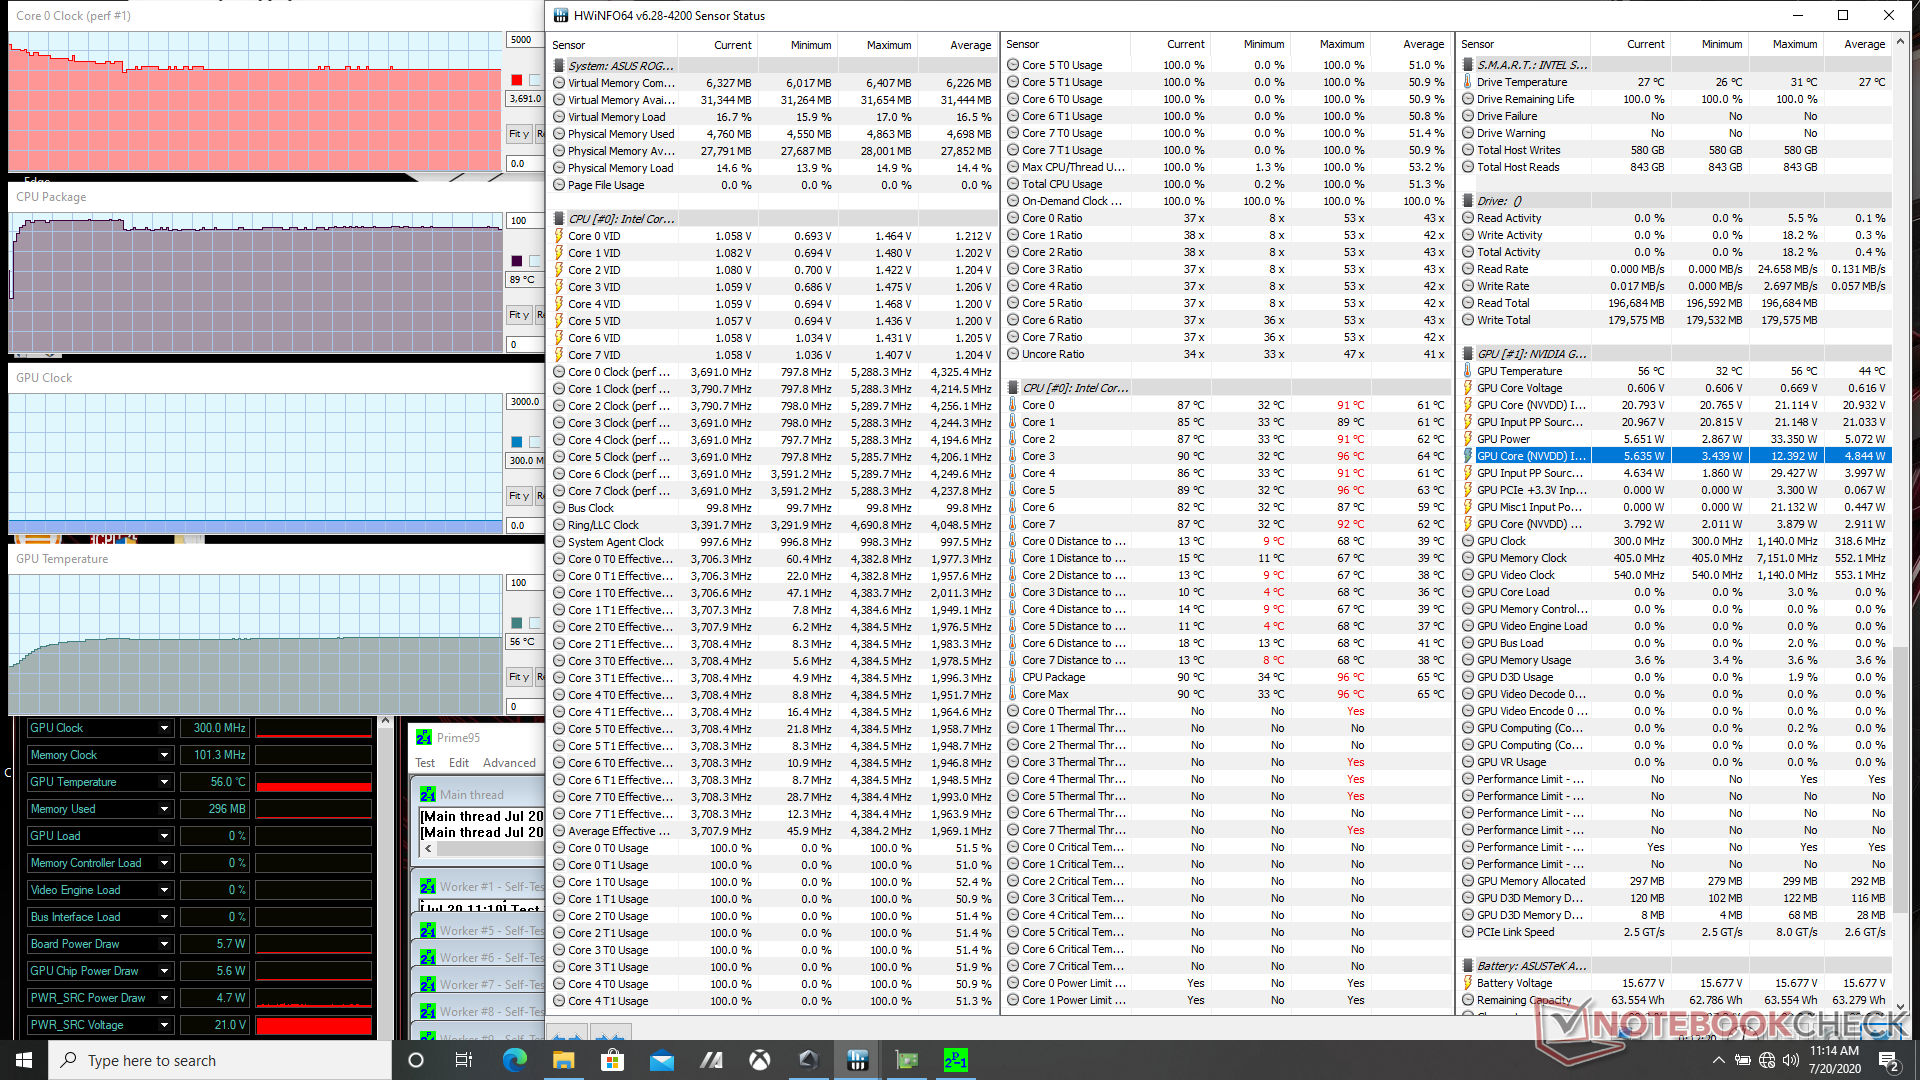
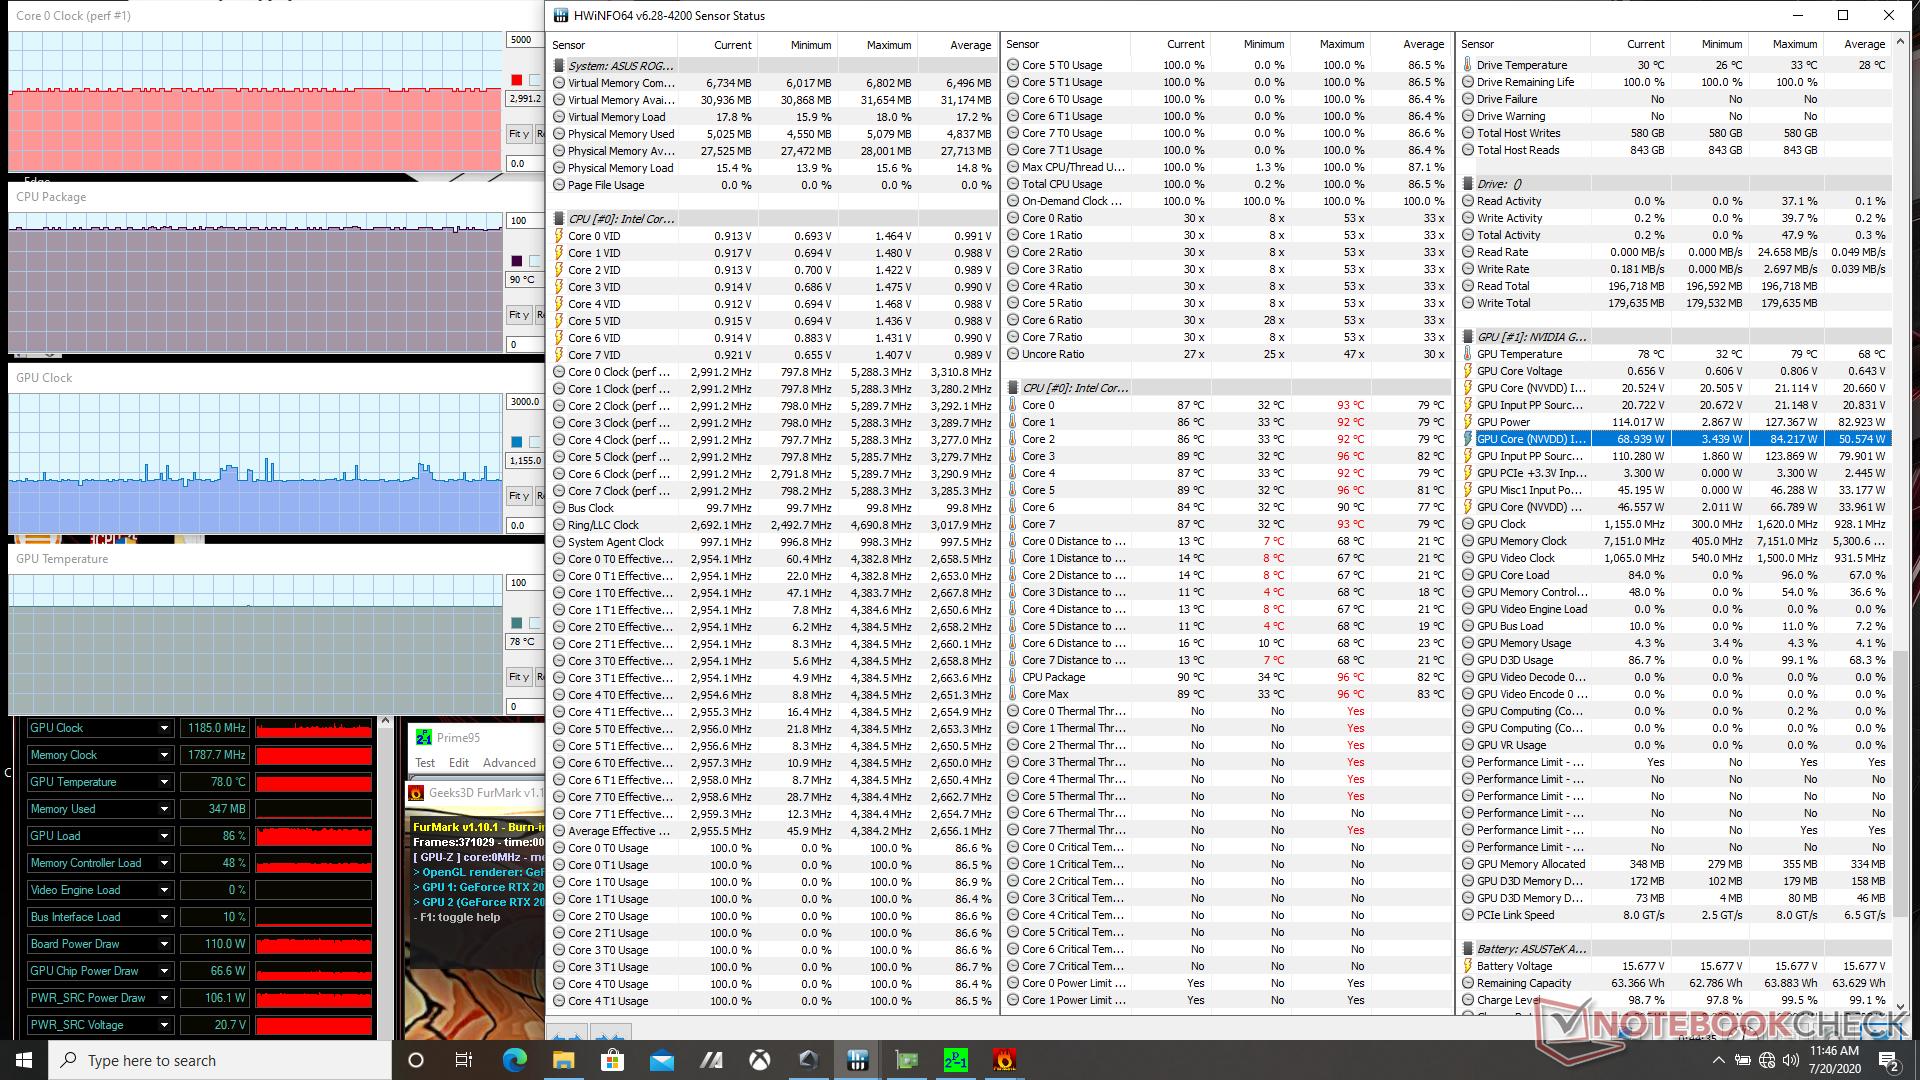
Stress Test
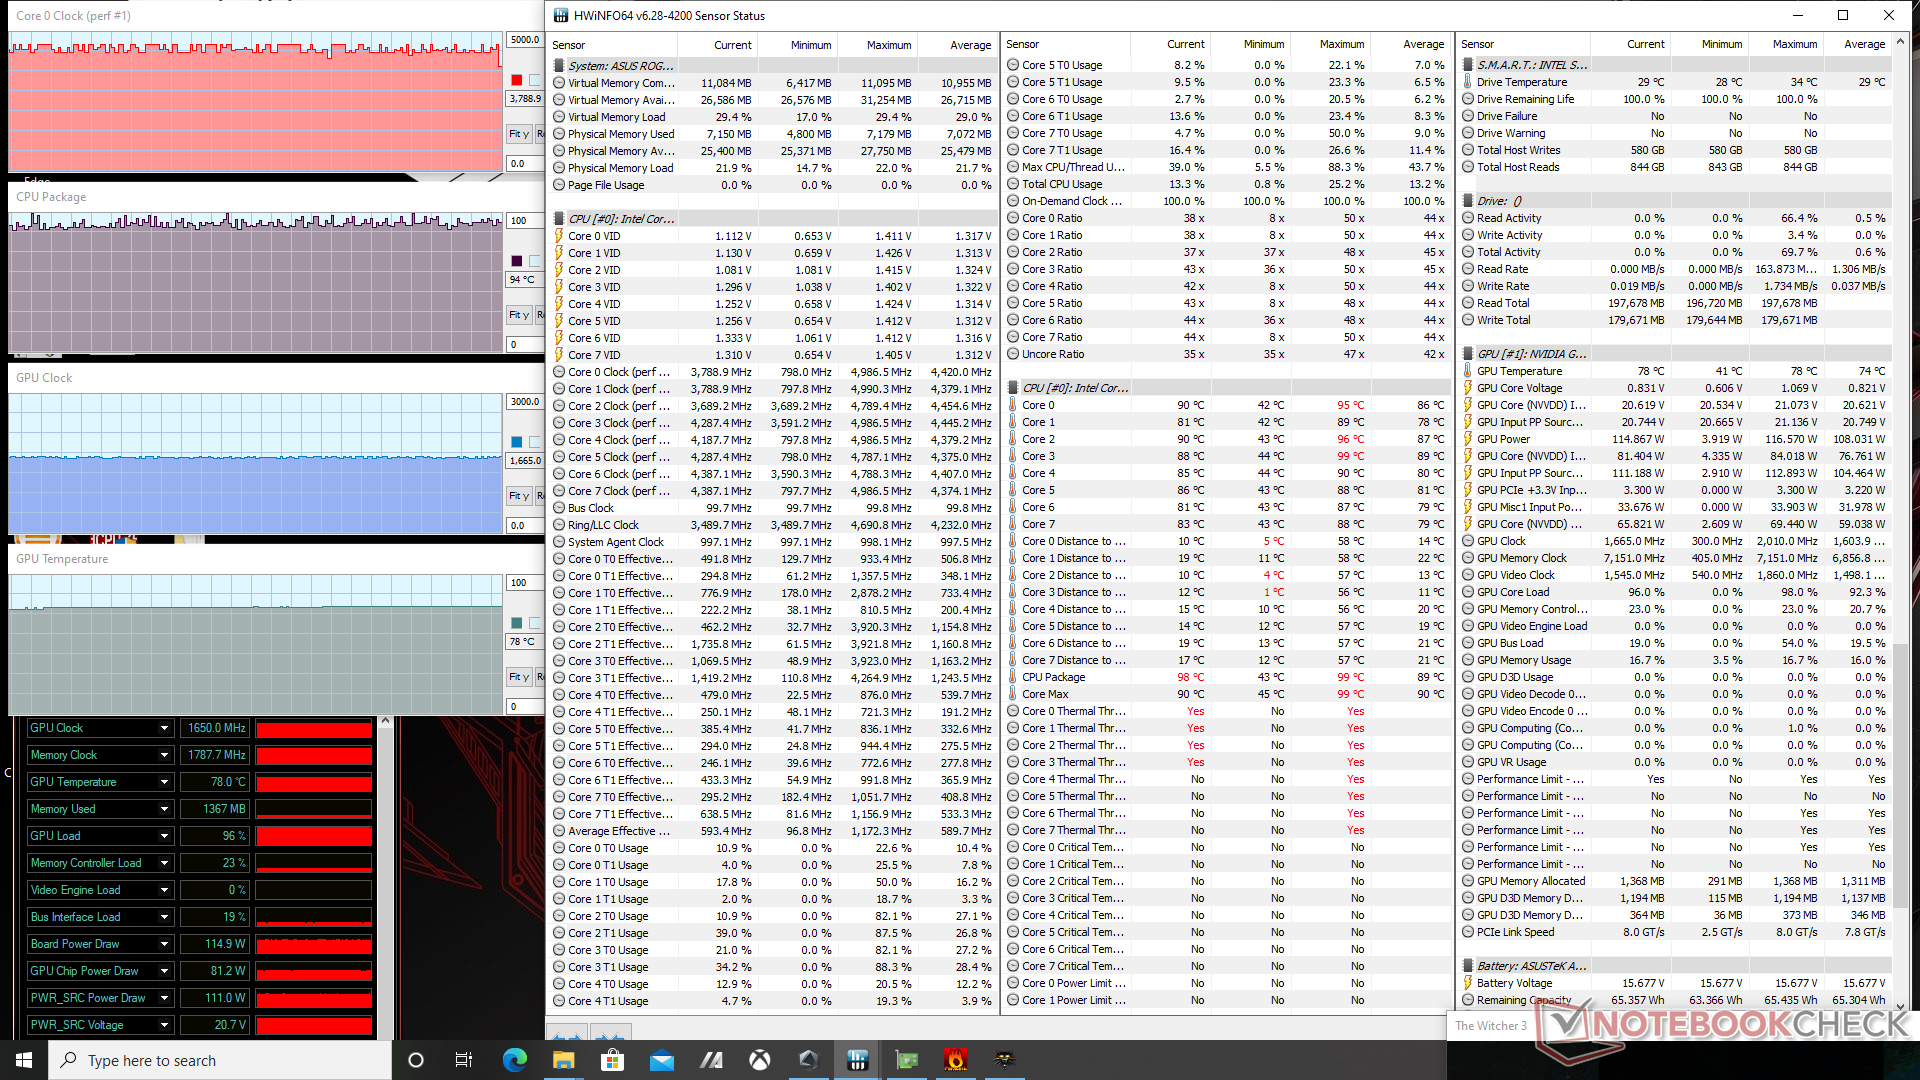
Stressing the CPU with Prime95 shows clock rates boosting to 4.4 GHz for a few seconds before reaching a core temperature of 95 C. Clock rates would then drop to 4 GHz for the next minute or so before finally stabilizing at 3.8 GHz and 90 C. When running Witcher 3 in Turbo mode, CPU and GPU temperature would stabilize at 94 C and 80 C, respectively, compared to 79 C and 69 C on our Razer Blade 15 Advanced Model.
Note that GPU and memory clocks increase just marginally to 1590 to 1650 MHz and 1750 to 1788 MHz, respectively, when moving from Performance mode to Turbo mode. Meanwhile, fan speed would increase noticeably from ~5600 RPM to ~6500 RPM.
Running on battery power will limit performance. Fire Strike on batteries would return Physics and Graphics 13330 and 6433 points, respectively, compared to 21554 and 22183 points when on mains. Turbo mode is disabled when running on battery power.

| CPU Clock (GHz) | GPU Clock (MHz) | Average CPU Temperature (°C) | Average GPU Temperature (°C) | |
| System Idle | -- | -- | 34 | 32 |
| Prime95 Stress | 3.7 | -- | 90 | 56 |
| Prime95 + FurMark Stress | 2.9 - 3.0 | 1185 | 90 | 78 |
| Witcher 3 Stress (Performance mode) | ~4.4 | 1590 | ~94 | 80 |
| Witcher 3 Stress (Turbo mode) | ~4.4 | 1650 | ~94 | 78 |
Speakers

 are slightly exaggerated")
Asus ROG Strix Scar 15 G532LWS audio analysis
(+) | speakers can play relatively loud (84.1 dB)
Bass 100 - 315 Hz
(±) | reduced bass - on average 9.7% lower than median
(±) | linearity of bass is average (7.8% delta to prev. frequency)
Mids 400 - 2000 Hz
(±) | higher mids - on average 6.4% higher than median
(+) | mids are linear (4.8% delta to prev. frequency)
Highs 2 - 16 kHz
(+) | balanced highs - only 1.9% away from median
(+) | highs are linear (5.5% delta to prev. frequency)
Overall 100 - 16.000 Hz
(+) | overall sound is linear (14.4% difference to median)
Compared to same class
» 27% of all tested devices in this class were better, 7% similar, 66% worse
» The best had a delta of 6%, average was 18%, worst was 132%
Compared to all devices tested
» 18% of all tested devices were better, 4% similar, 78% worse
» The best had a delta of 4%, average was 23%, worst was 134%
Apple MacBook 12 (Early 2016) 1.1 GHz audio analysis
(+) | speakers can play relatively loud (83.6 dB)
Bass 100 - 315 Hz
(±) | reduced bass - on average 11.3% lower than median
(±) | linearity of bass is average (14.2% delta to prev. frequency)
Mids 400 - 2000 Hz
(+) | balanced mids - only 2.4% away from median
(+) | mids are linear (5.5% delta to prev. frequency)
Highs 2 - 16 kHz
(+) | balanced highs - only 2% away from median
(+) | highs are linear (4.5% delta to prev. frequency)
Overall 100 - 16.000 Hz
(+) | overall sound is linear (10.2% difference to median)
Compared to same class
» 7% of all tested devices in this class were better, 2% similar, 90% worse
» The best had a delta of 5%, average was 18%, worst was 53%
Compared to all devices tested
» 5% of all tested devices were better, 1% similar, 94% worse
» The best had a delta of 4%, average was 23%, worst was 134%
Energy Management
Power Consumption
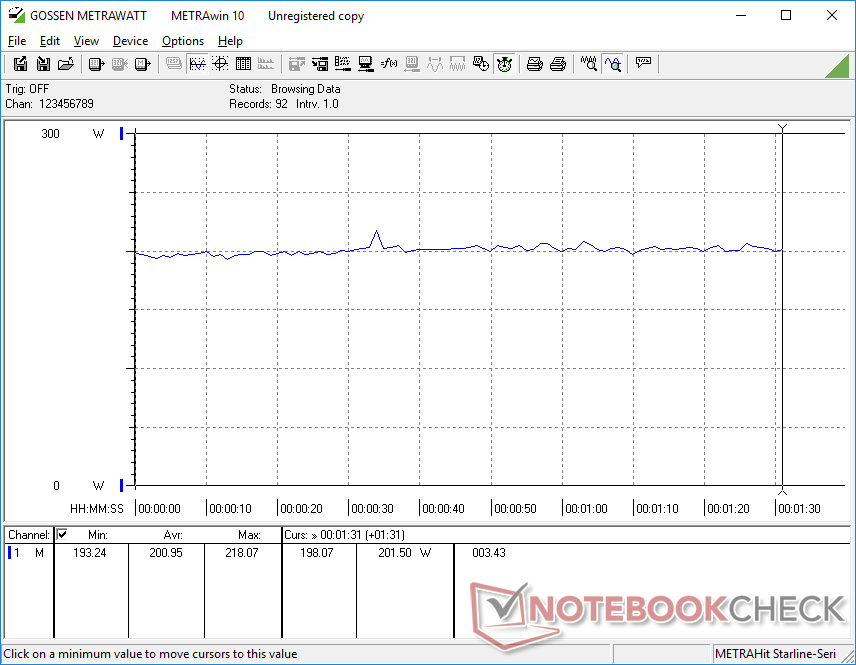
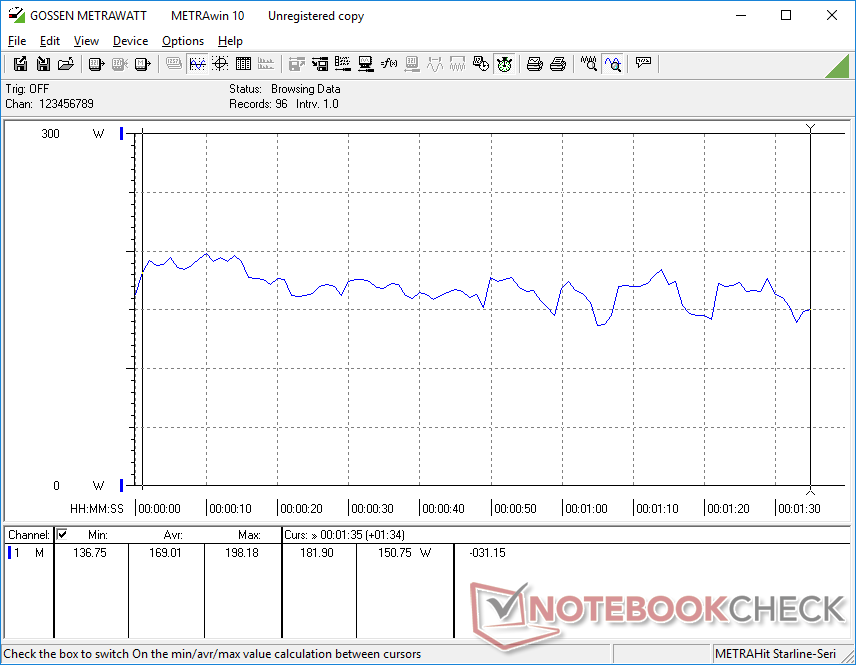
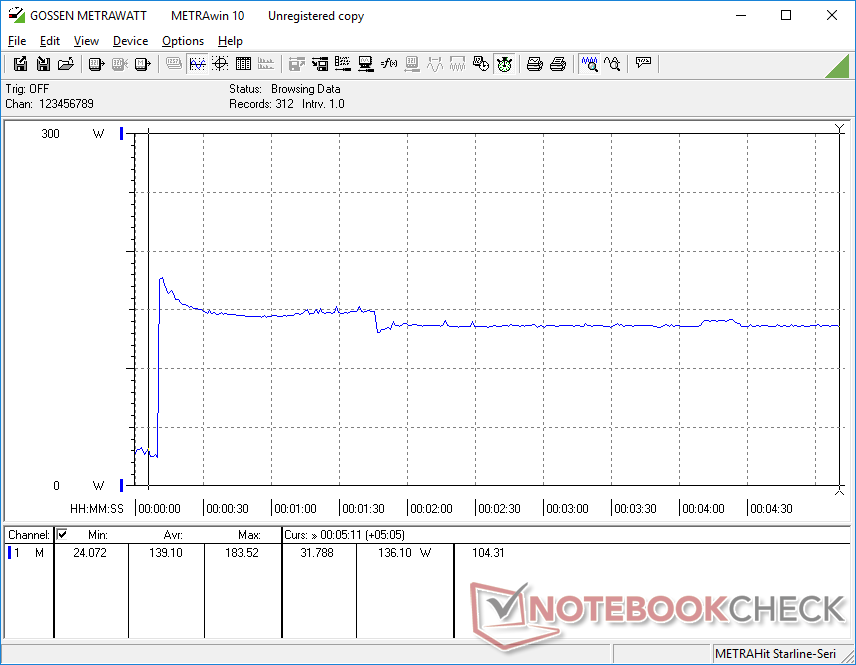
Overall power consumption when gaming is similar to what we recorded on the MSI GE66. At 201 W, the system consumes about 40 W to 50 W more than a gaming laptop equipped with the lesser GeForce RTX 2070 Max-Q or just 15 W more than the older G531 equipped with the regular mobile GeForce RTX 2070. When considering that the mobile RTX 2070 Super offers 9 to 12 percent faster graphics performance than the mobile RTX 2070, the 8 percent uptick in power consumption is more or less a linear relationship.
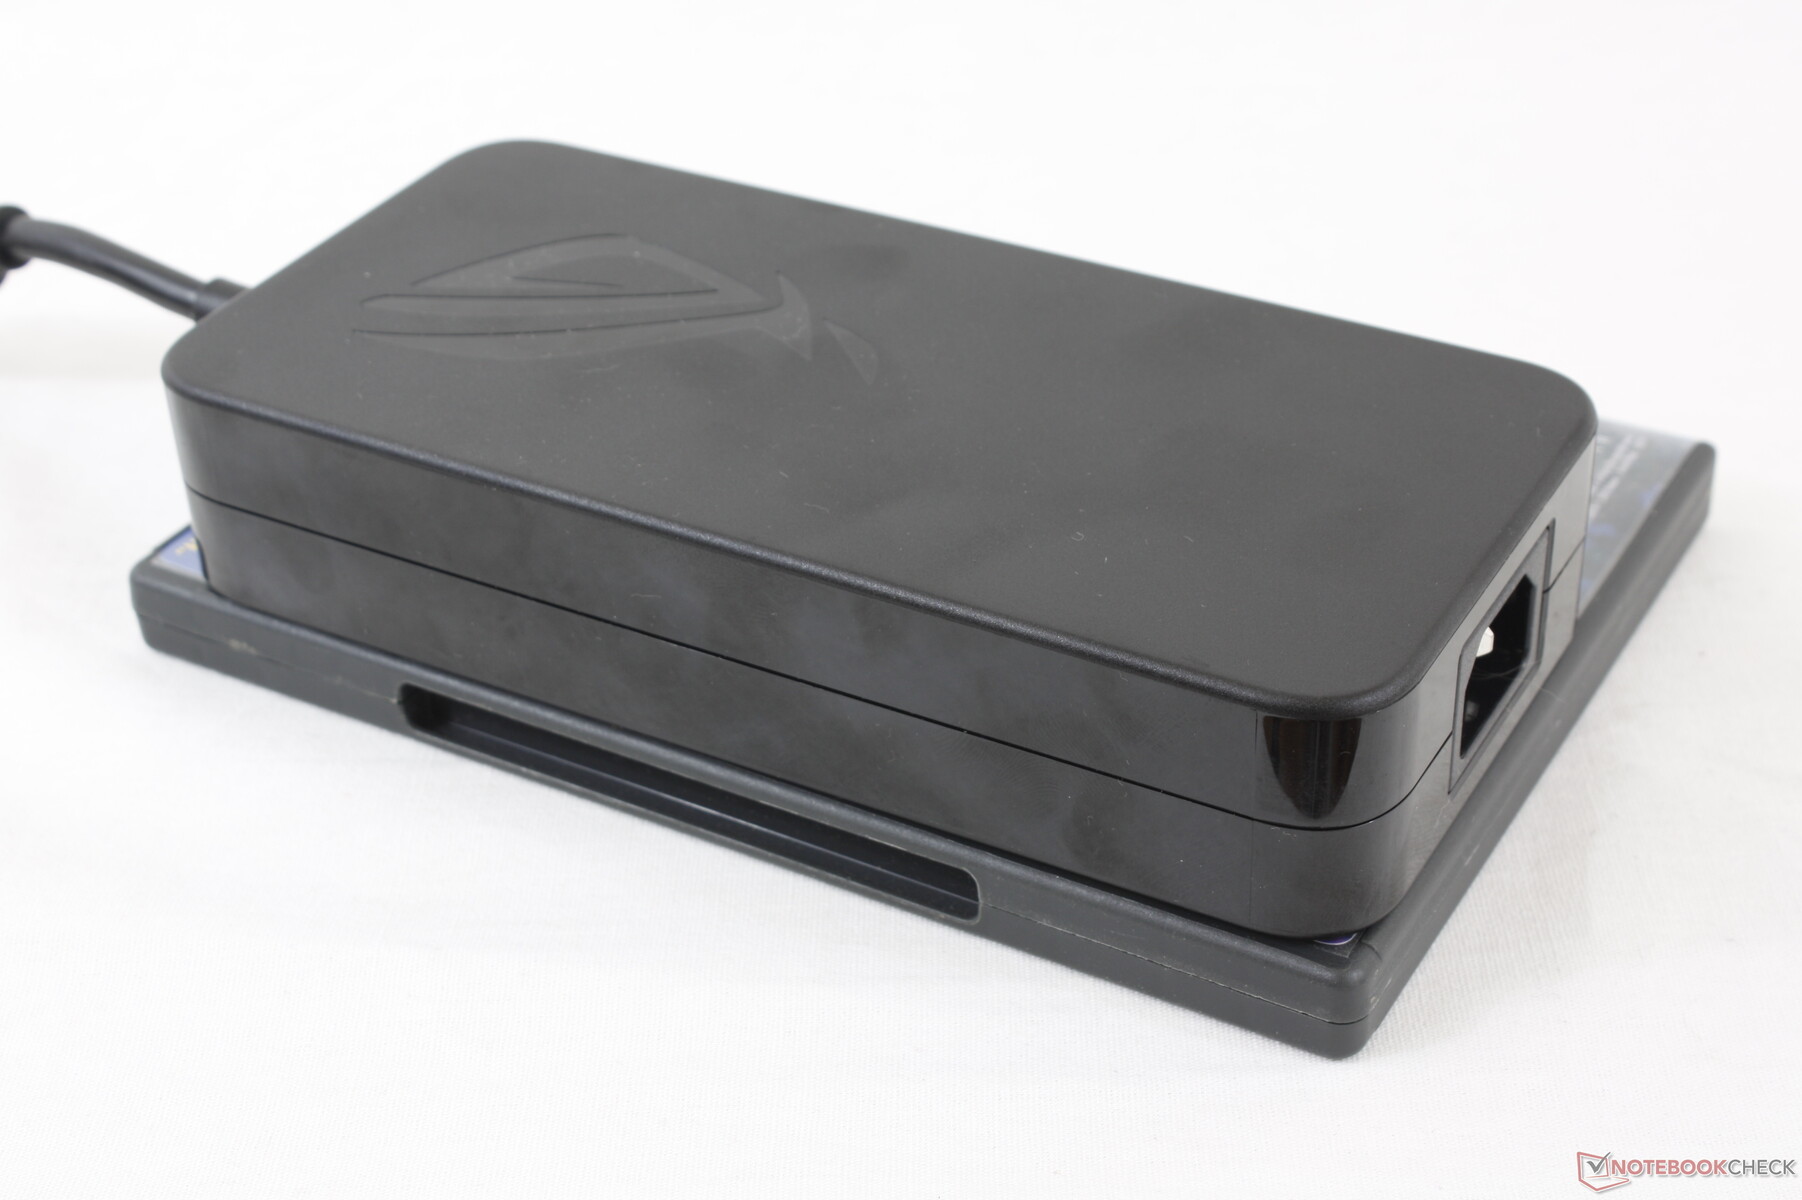
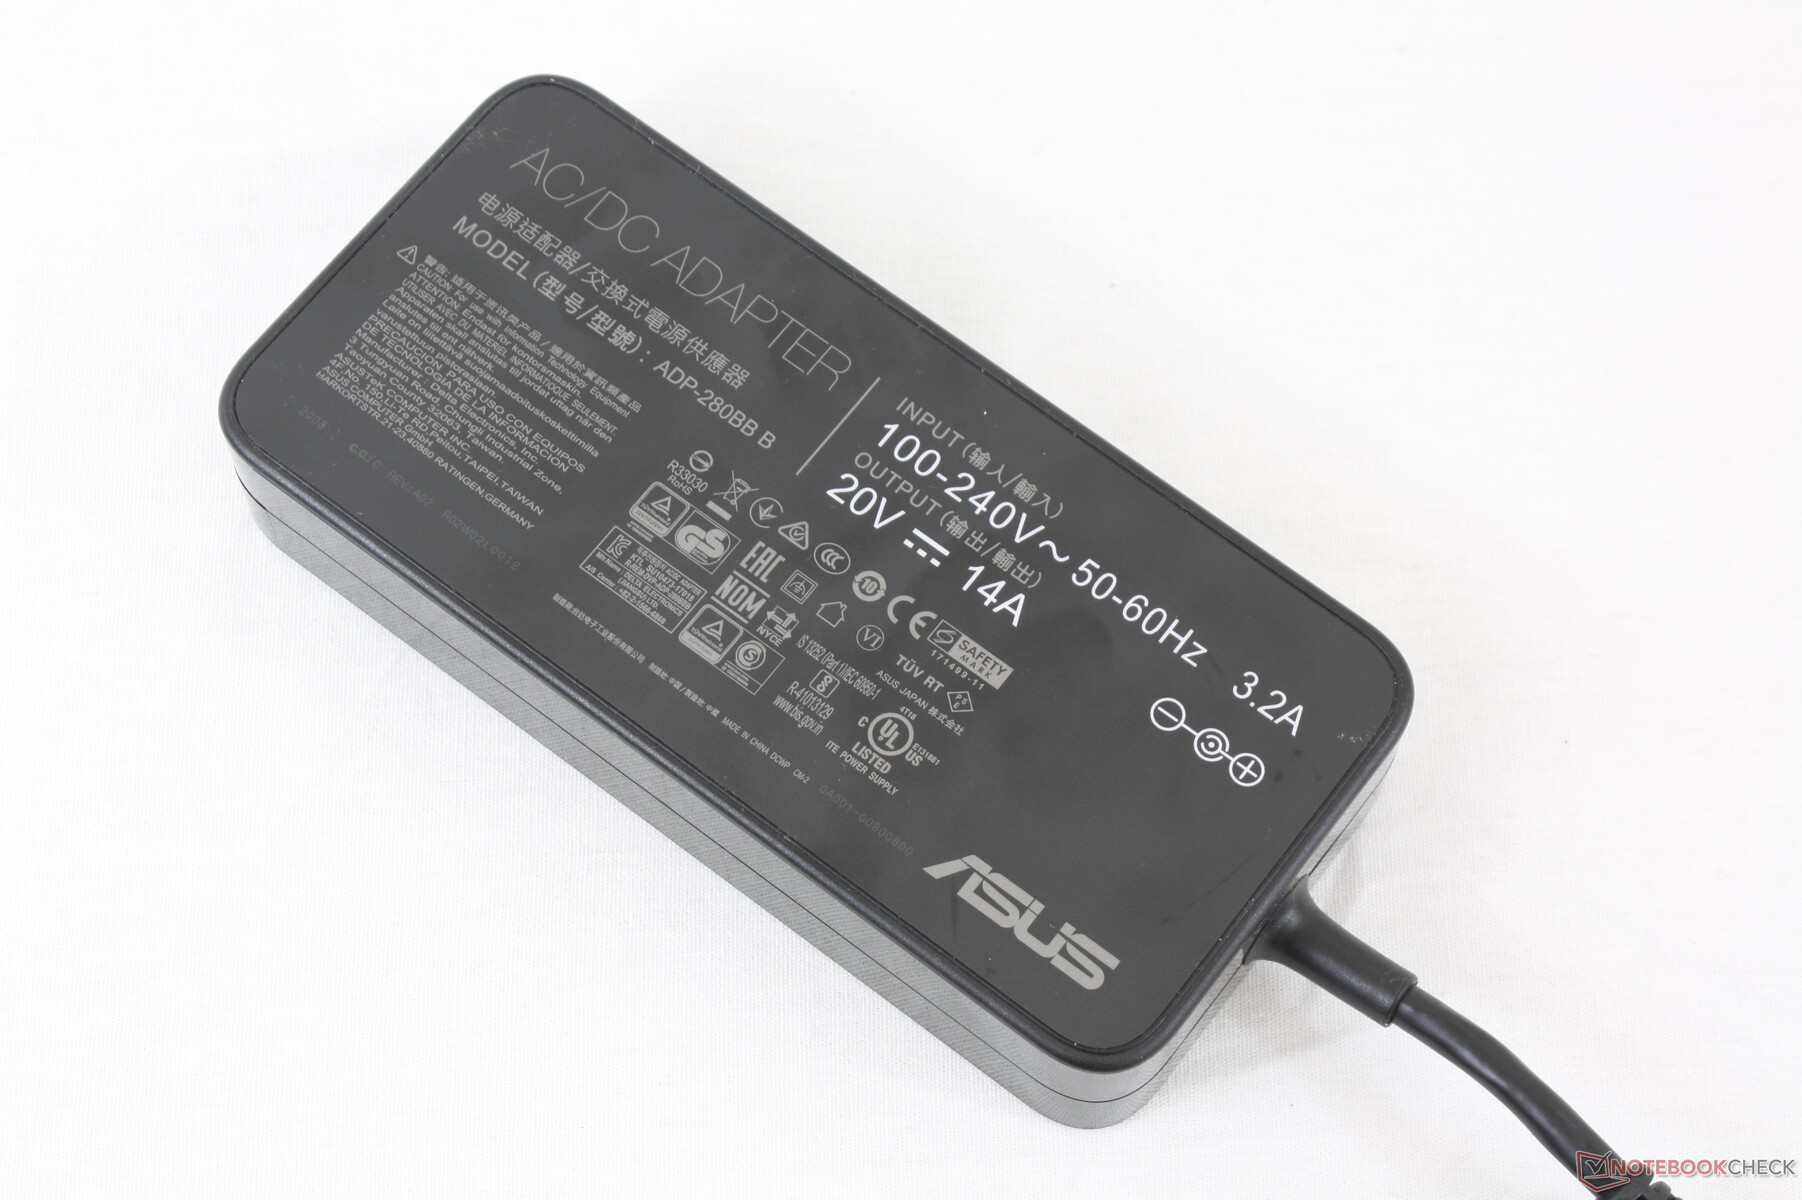
A temporary maximum consumption of 271.6 W can be recorded when running Prime95 and FurMark simultaneously. The large (~18 x 8.5 x 3.6 cm) and heavy (~995 g) AC adapter rated to push 280 W.

| Off / Standby | |
| Idle | |
| Load |
|
Key:
min: | |
| Asus ROG Strix Scar 15 G532LWS i9-10980HK, GeForce RTX 2070 Super Mobile, 2x Intel SSD 660p 1TB SSDPEKNW010T8 (RAID 0), IPS, 1920x1080, 15.6" | MSI GE66 Raider 10SFS i9-10980HK, GeForce RTX 2070 Super Mobile, WDC PC SN730 SDBPNTY-1T00, IPS-Level, 1920x1080, 15.6" | Acer Predator Triton 500 PT515-52-70N3 i7-10750H, GeForce RTX 2080 Super Max-Q, Samsung SSD PM981a MZVLB512HBJQ, IPS, 1920x1080, 15.6" | Razer Blade 15 RZ09-0328 i7-10750H, GeForce RTX 2070 Max-Q, Lite-On CA5-8D512, AMOLED, 3840x2160, 15.6" | HP Omen X 2S 15-dg0075cl i7-9750H, GeForce RTX 2070 Max-Q, WDC PC SN720 SDAPNTW-1T00, IPS, 1920x1080, 15.6" | Asus Strix Scar III G531GW-AZ062T i7-9750H, GeForce RTX 2070 Mobile, Intel SSD 660p SSDPEKNW512G8, IPS, 1920x1080, 15.6" | |
|---|---|---|---|---|---|---|
| Power Consumption | 4% | 1% | -4% | -175% | 1% | |
| Idle Minimum * (Watt) | 8 | 6 25% | 11 -38% | 11.1 -39% | 46 -475% | 11.4 -43% |
| Idle Average * (Watt) | 9.8 | 14 -43% | 15 -53% | 13.7 -40% | 59 -502% | 13.5 -38% |
| Idle Maximum * (Watt) | 25.8 | 25 3% | 25 3% | 33.4 -29% | 65.5 -154% | 21.6 16% |
| Load Average * (Watt) | 169 | 108 36% | 95 44% | 104.4 38% | 99.8 41% | 106 37% |
| Witcher 3 ultra * (Watt) | 201 | 195 3% | 140 30% | 159.9 20% | 154.1 23% | 186 7% |
| Load Maximum * (Watt) | 271.6 | 280 -3% | 211 22% | 203.8 25% | 222.7 18% | 196 28% |
* ... smaller is better
Battery Life
The 66 Wh internal battery remains unchanged from last year's G531 to be about two-thirds the capacity of the battery in the MSI GE66. We're able to record just short of 5 hours of real-world WLAN use before automatic shutdown when set to the Balanced profile with the iGPU active.
Charging from empty to full capacity takes about 1.5 hours. The system cannot be recharged via USB-C.
| Asus ROG Strix Scar 15 G532LWS i9-10980HK, GeForce RTX 2070 Super Mobile, 66 Wh | MSI GE66 Raider 10SFS i9-10980HK, GeForce RTX 2070 Super Mobile, 99.99 Wh | Acer Predator Triton 500 PT515-52-70N3 i7-10750H, GeForce RTX 2080 Super Max-Q, 84 Wh | Razer Blade 15 RZ09-0328 i7-10750H, GeForce RTX 2070 Max-Q, 65 Wh | HP Omen X 2S 15-dg0075cl i7-9750H, GeForce RTX 2070 Max-Q, 72 Wh | Asus Strix Scar III G531GW-AZ062T i7-9750H, GeForce RTX 2070 Mobile, 66 Wh | |
|---|---|---|---|---|---|---|
| Battery runtime | 13% | 6% | -18% | -41% | 14% | |
| Reader / Idle (h) | 8.1 | 7.6 -6% | 8.3 2% | 3.7 -54% | ||
| WiFi v1.3 (h) | 4.9 | 6.1 24% | 6.3 29% | 4 -18% | 2.2 -55% | 5.6 14% |
| Load (h) | 1.5 | 1.8 20% | 1.3 -13% | 1.3 -13% |
Pros
Cons
Verdict
If you value having three M.2 storage slots, then the Asus ROG G532 is one of the few 15.6-inch gaming laptops available with such a feature. However, the system still suffers from the same drawbacks as last year's model since the chassis remains identical. The MSI GE66, which just released a couple of months ago to challenge the ROG G532, is smaller and it still manages to carry both a larger battery and the same Core i9, RTX 2070 Super, and 15.6-inch 300 Hz hardware options. The performance on our Asus shouldn't be understated, but it's going to need more than just speed and Keystone support if it wants to keep up with the latest designs from competitors.
Internally, the Asus ROG Strix Scar 15 G532LWS comes equipped with some of the latest processors and fast refresh rate displays you can find. Externally, however, the thick bottom bezel and large size are starting to show their age. Future designs should focus on reducing fan noise when gaming for a unique edge over the competition or shrinking the chassis to better match alternatives.
Asus ROG Strix Scar 15 G532LWS
- 07/23/2020 v7 (old)
Allen Ngo
Price comparison
