MSI GeForce RTX 2080 Ti Gaming X Trio Desktop GPU Review: The fastest GeForce graphics card around
There is currently only one option in the high-end desktop GPU market, and it is called NVIDIA. If money is no object and you are in search of a new desktop graphics card, then you may find yourself perusing the best GPUs on the market. Our MSI review unit sits within this sector, with the GeForce RTX 2080 Ti Gaming X Trio being based on the TU102, a Turing GPU that NVIDIA manufactures on a 12 nm process. Only the TITAN RTX has the same chip as the RTX 2080 Ti, although NVIDIA restricts the TU102's full complement of 4,608 shader units to the former. By contrast, the RTX 2080 Ti must make do with 4,352 shaders, something that MSI has compensated for by slightly increasing the performance limits of its Gaming X Trio.
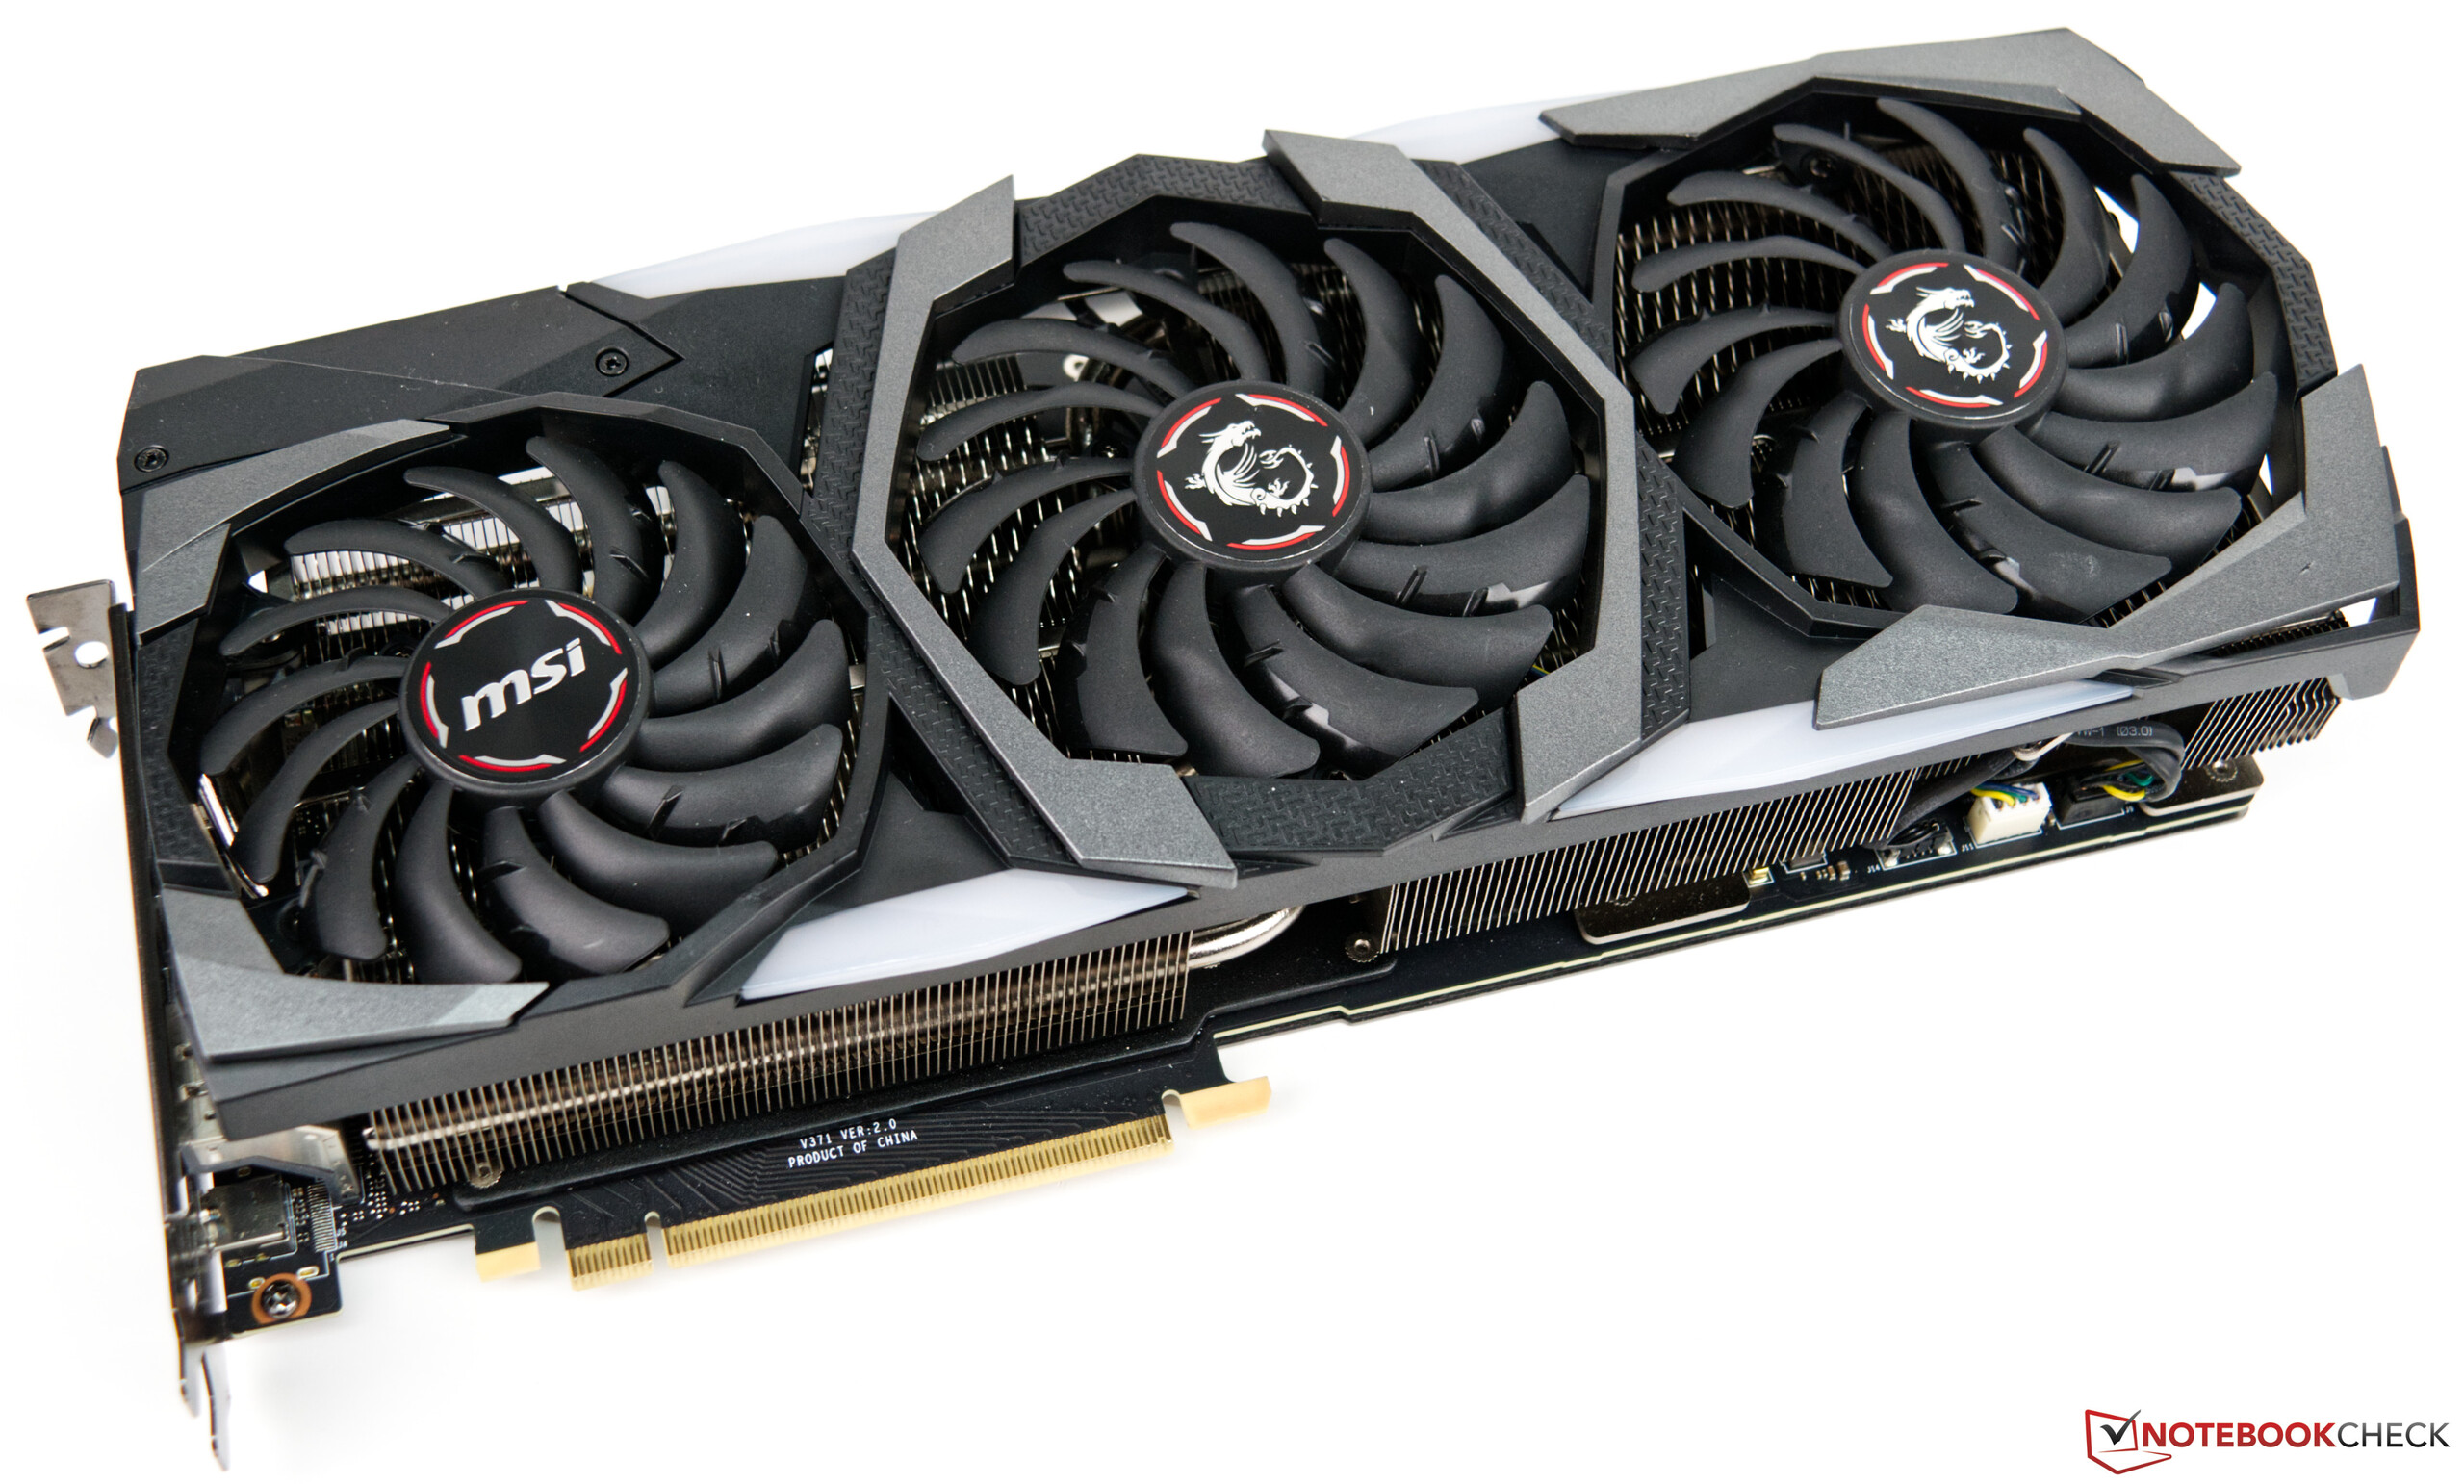
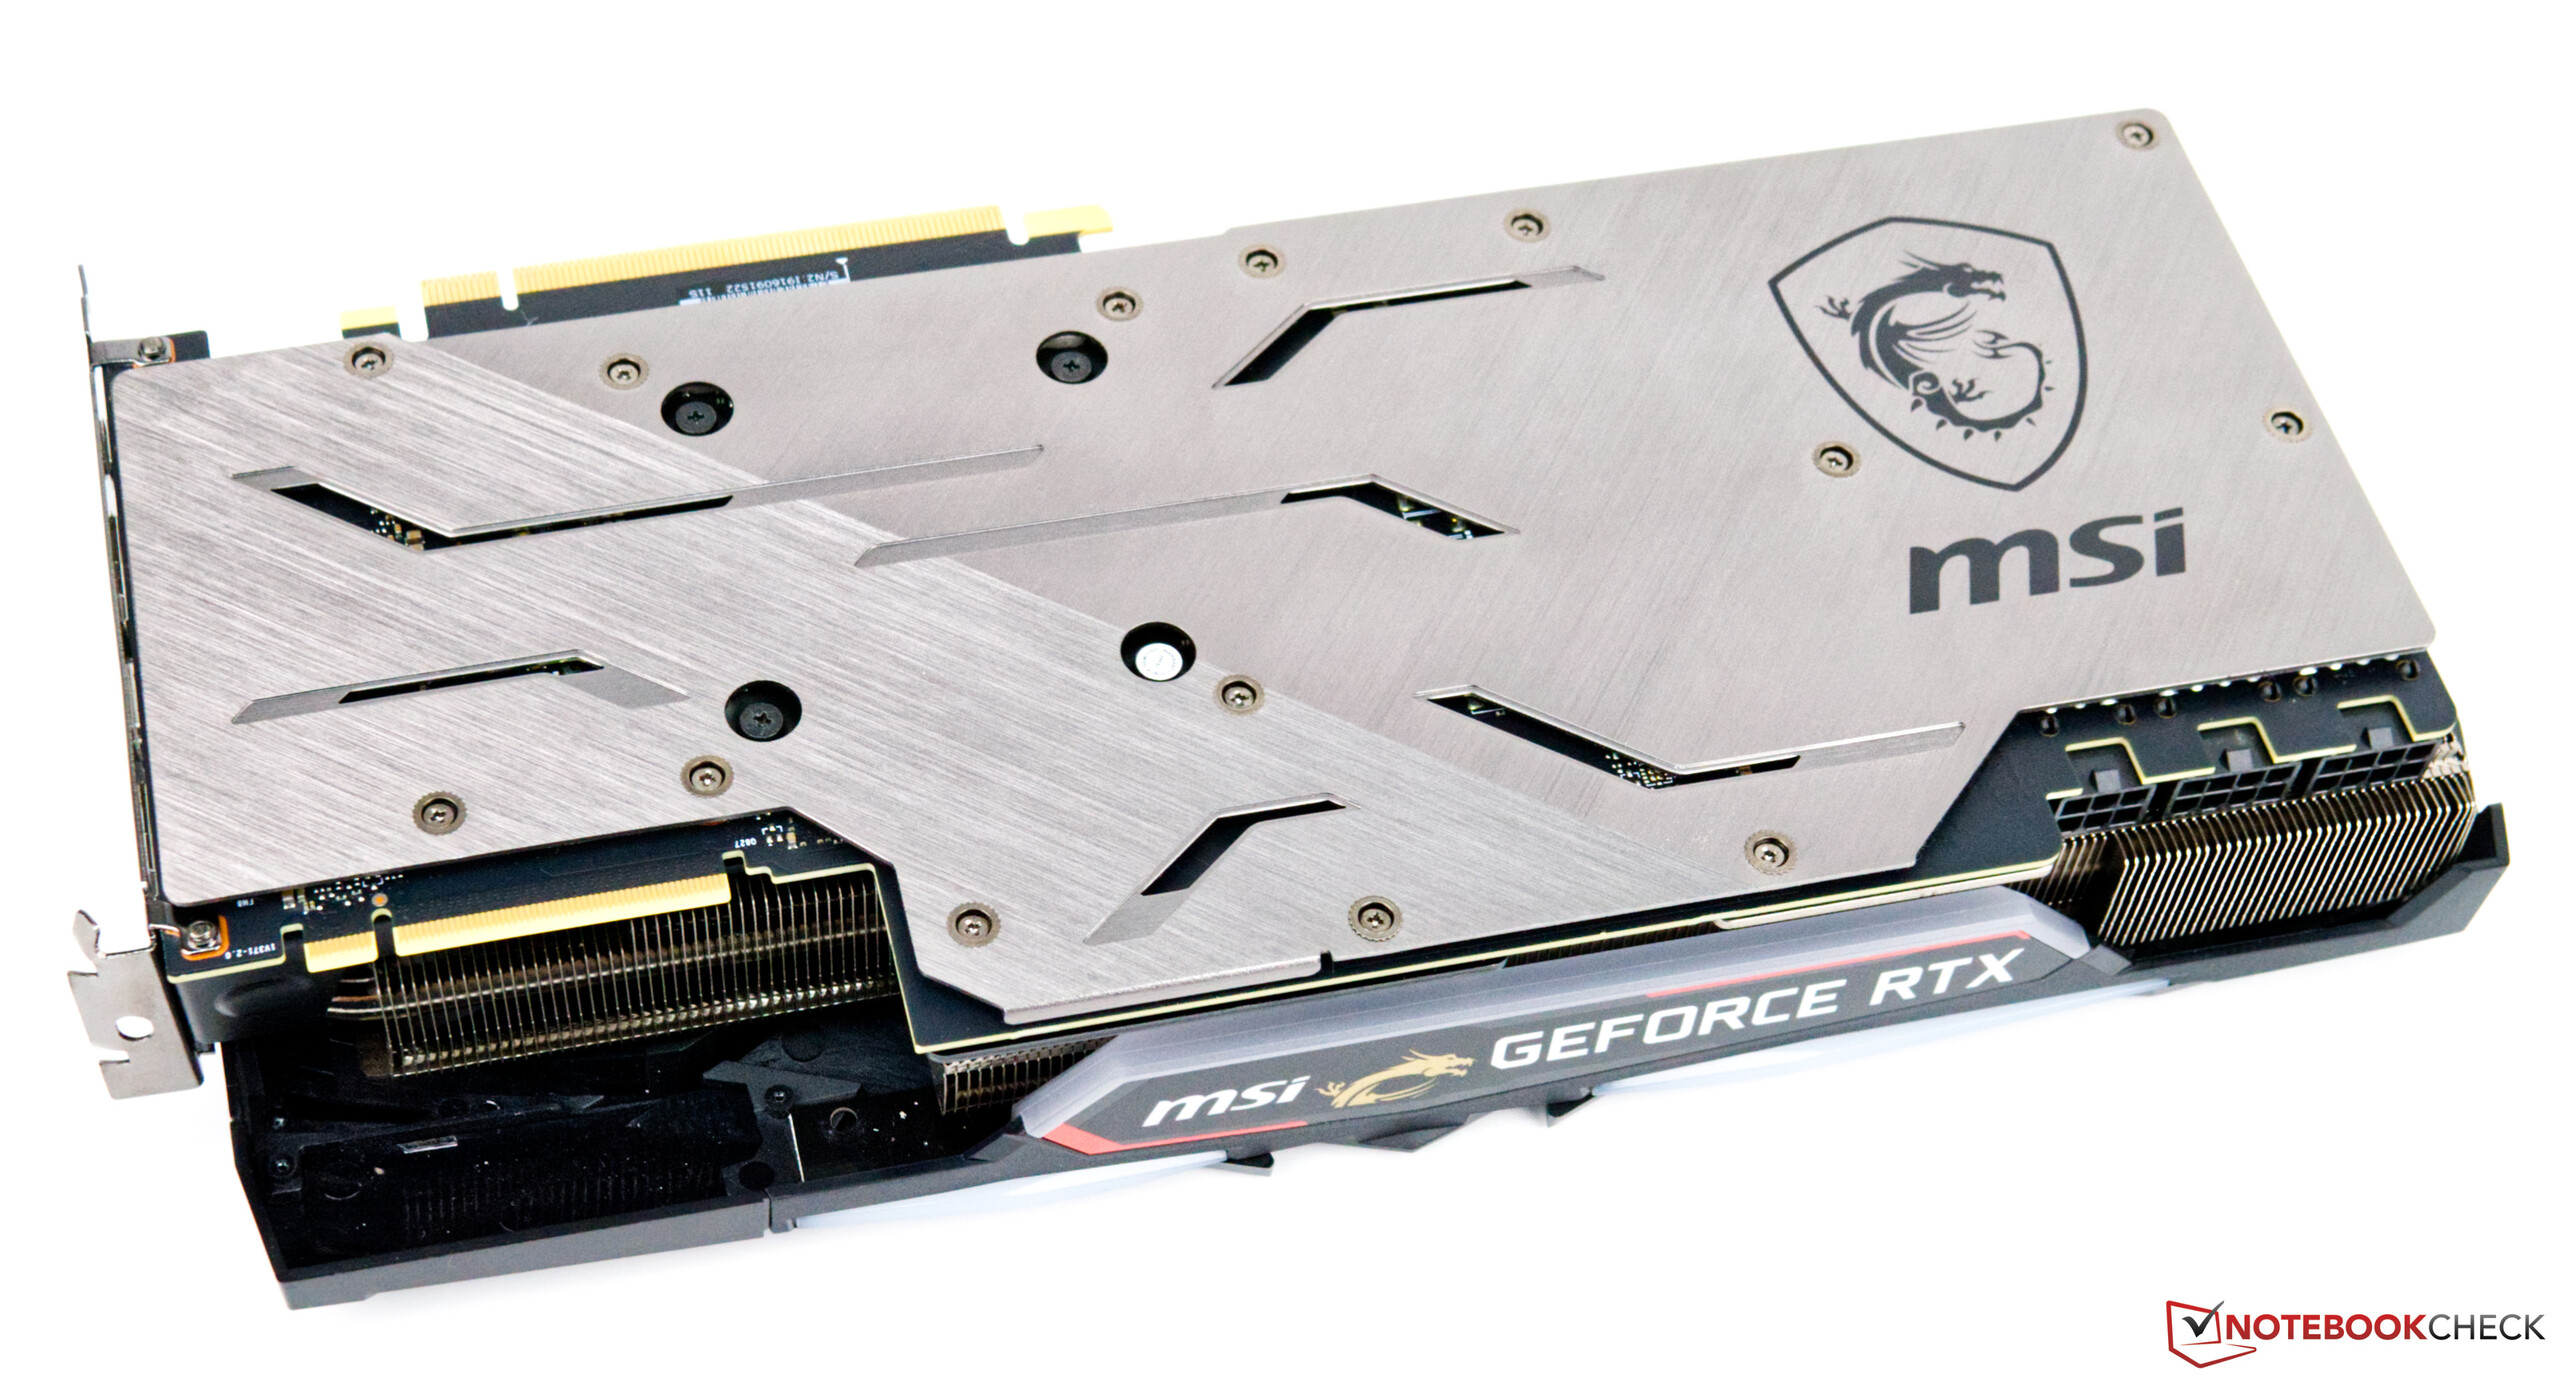
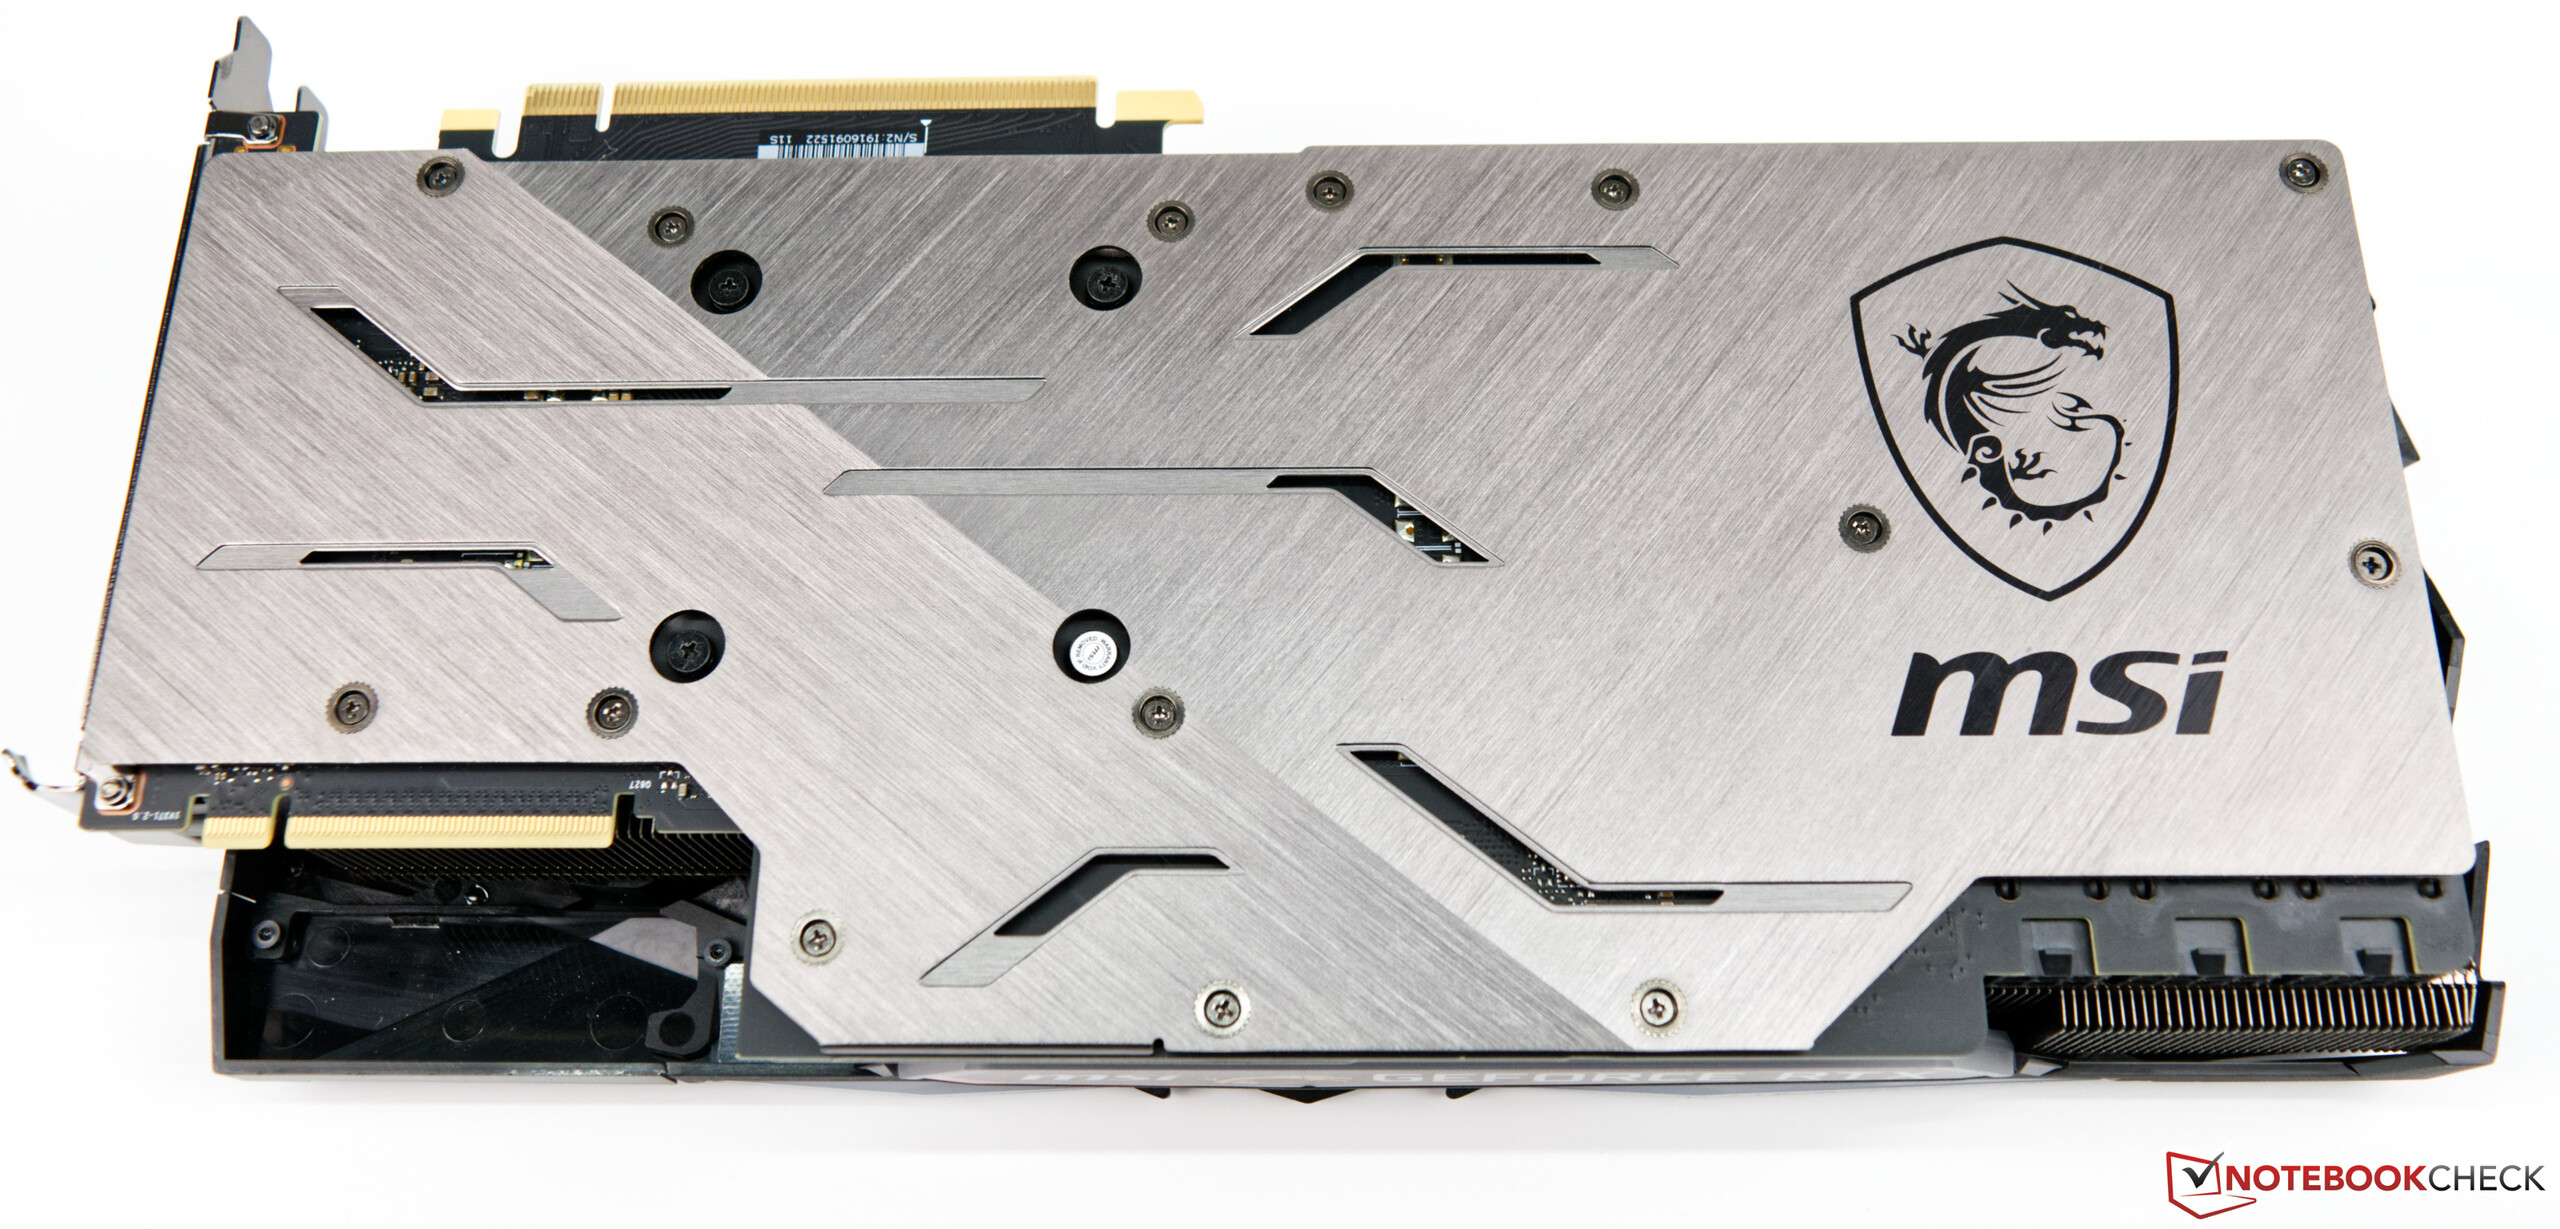
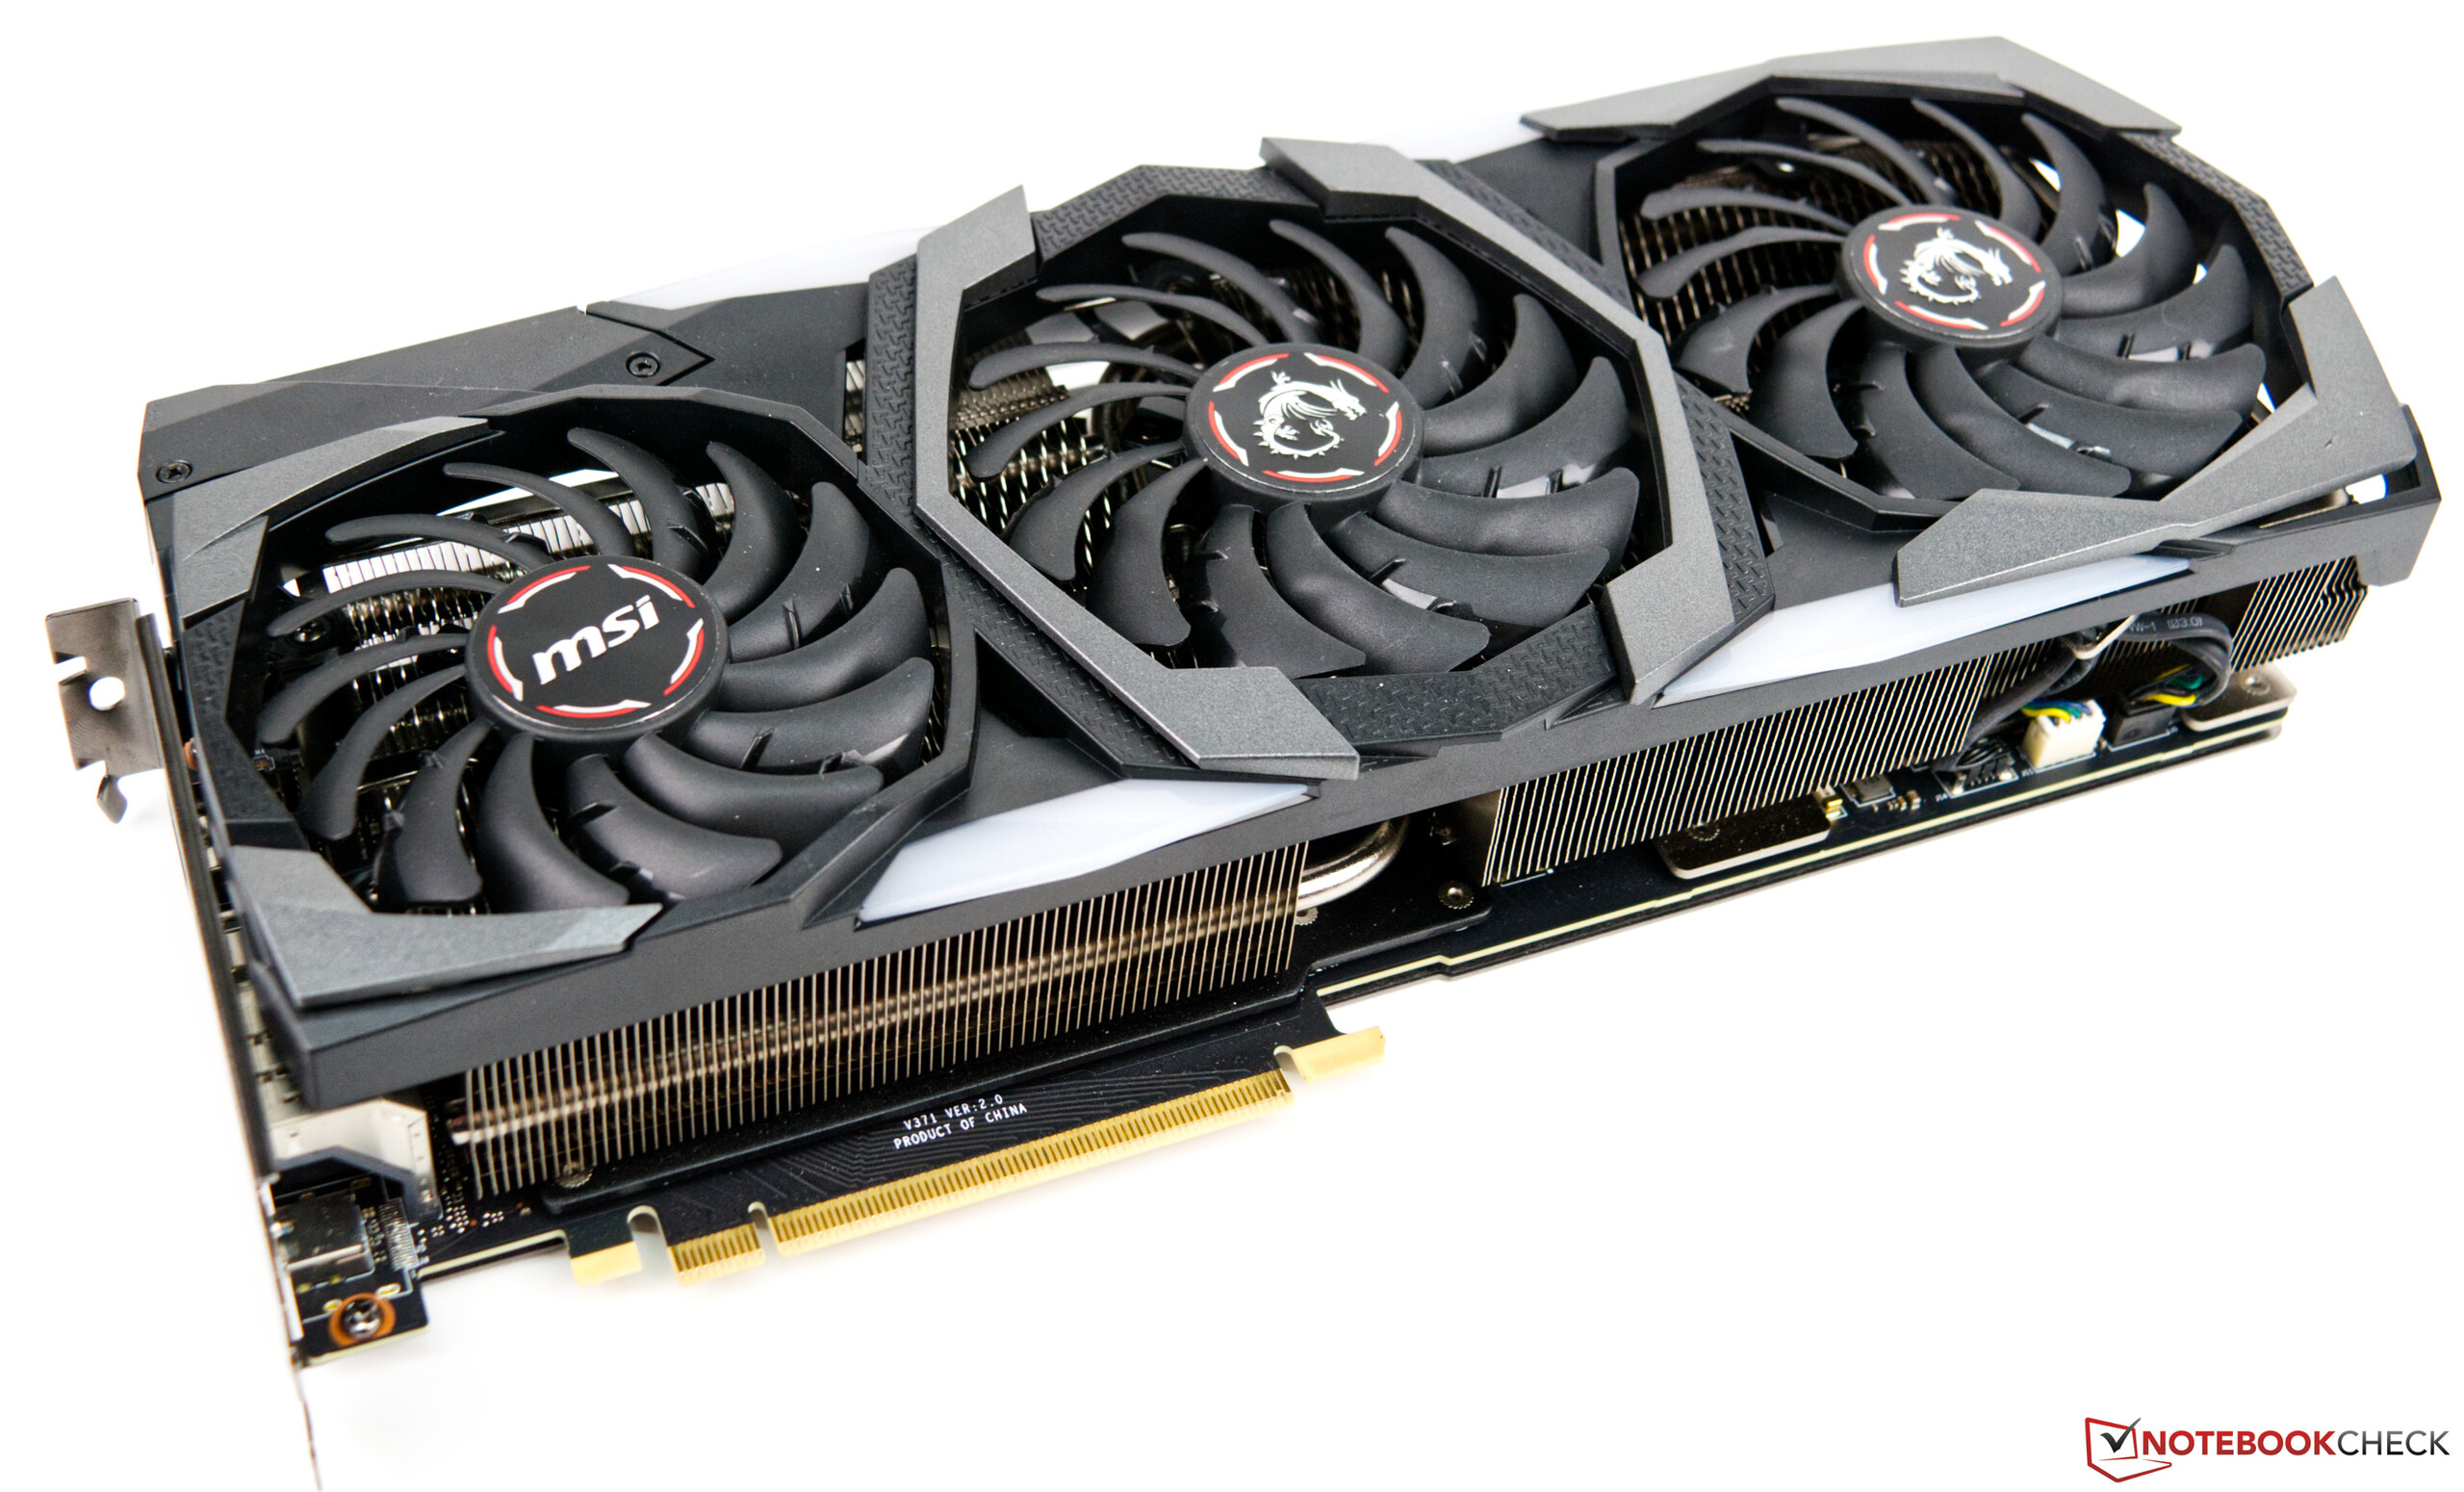
The card has a 40 W higher TDP than the RTX 2080 Ti Founders Edition, for instance, allowing the Gaming X Trio to peak at 300 W on stock settings under maximum load. The increased power consumption compared to the RTX 2080 Ti Founders Edition is why we would recommend pairing the Gaming X Trio with at least a 650 W power supply. Taking a closer look at MSI's custom card reveals that the Gaming X Trio is no ordinary RTX 2080 Ti.
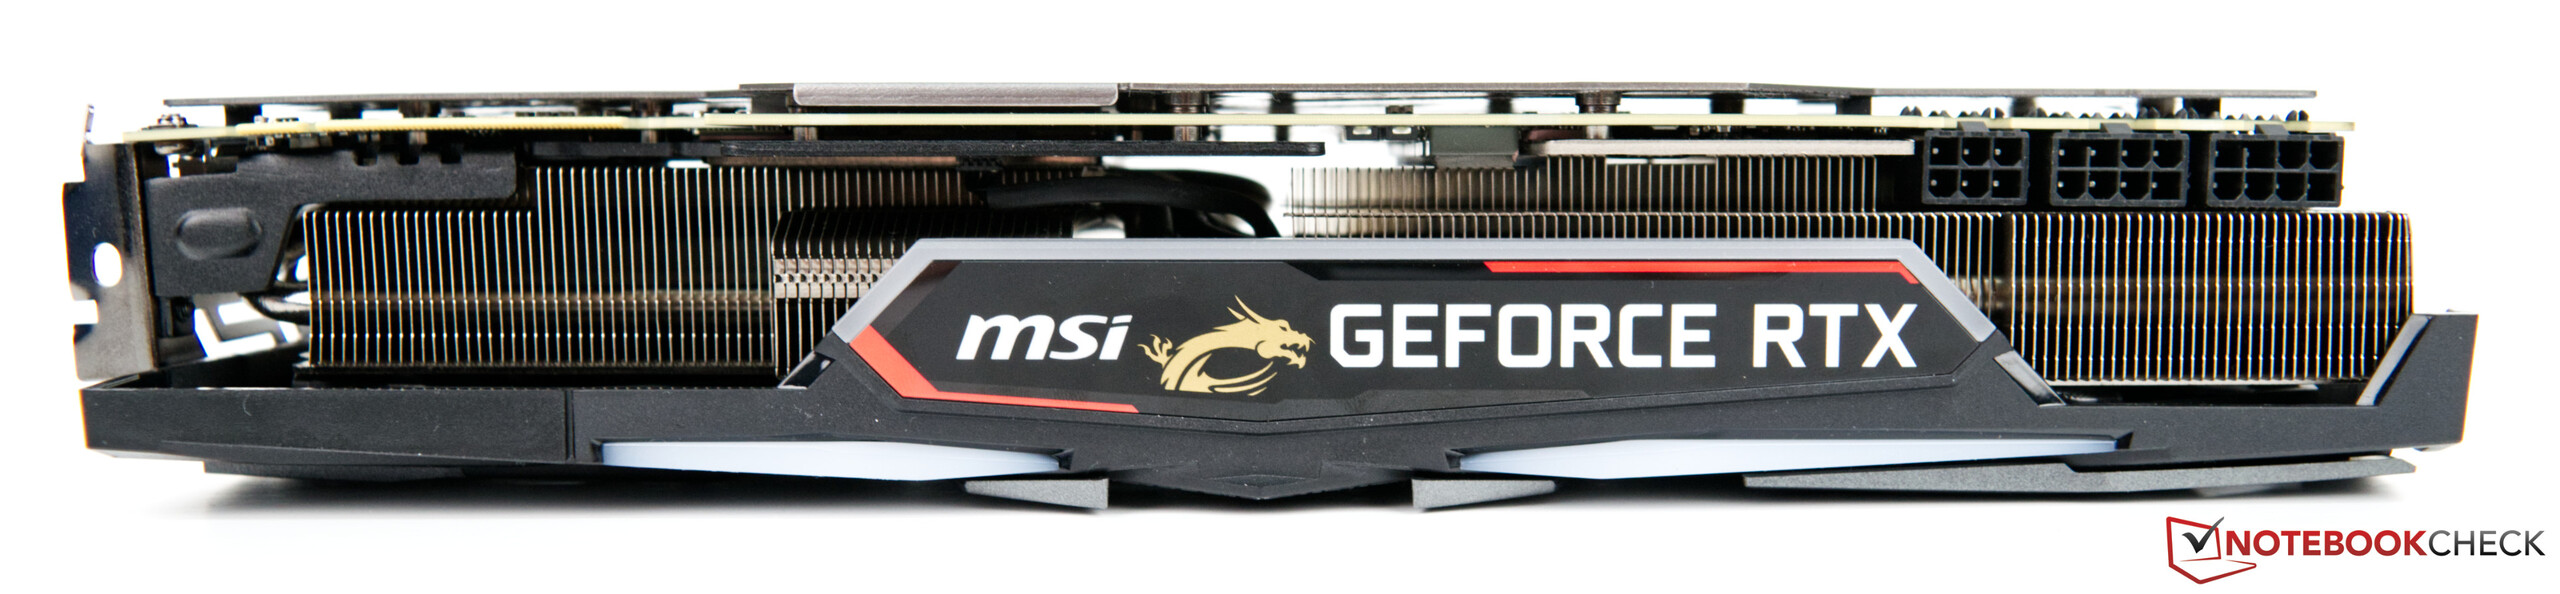
The first thing to notice is its enormous size, with the card occupying three PCIe slots. Correspondingly, we would recommend checking whether this monster fits in your case before purchasing it. Its length of 32.7 cm ought not to be underestimated, either.
At the time of testing, the MSI GeForce RTX 2080 Ti Gaming X Trio retails for 1,289 Euros (~$1,428). Hence, this price makes the Gaming X Trio one of the more expensive examples of the RTX 2080 Ti series. In comparison, the KFA2 GeForce RTX 2080 Ti EX costs about 150 Euros (~$166) less than our current review unit. However, the NVIDIA Founders Edition sits at 1,259 Euros (~$1,394), which is not much less than the Gaming Trio X considering that MSI factory overclocks the latter. Whoever chooses the MSI model will be rewarded with a high-quality graphics card that should also attract attention with its built-in RGB lighting.
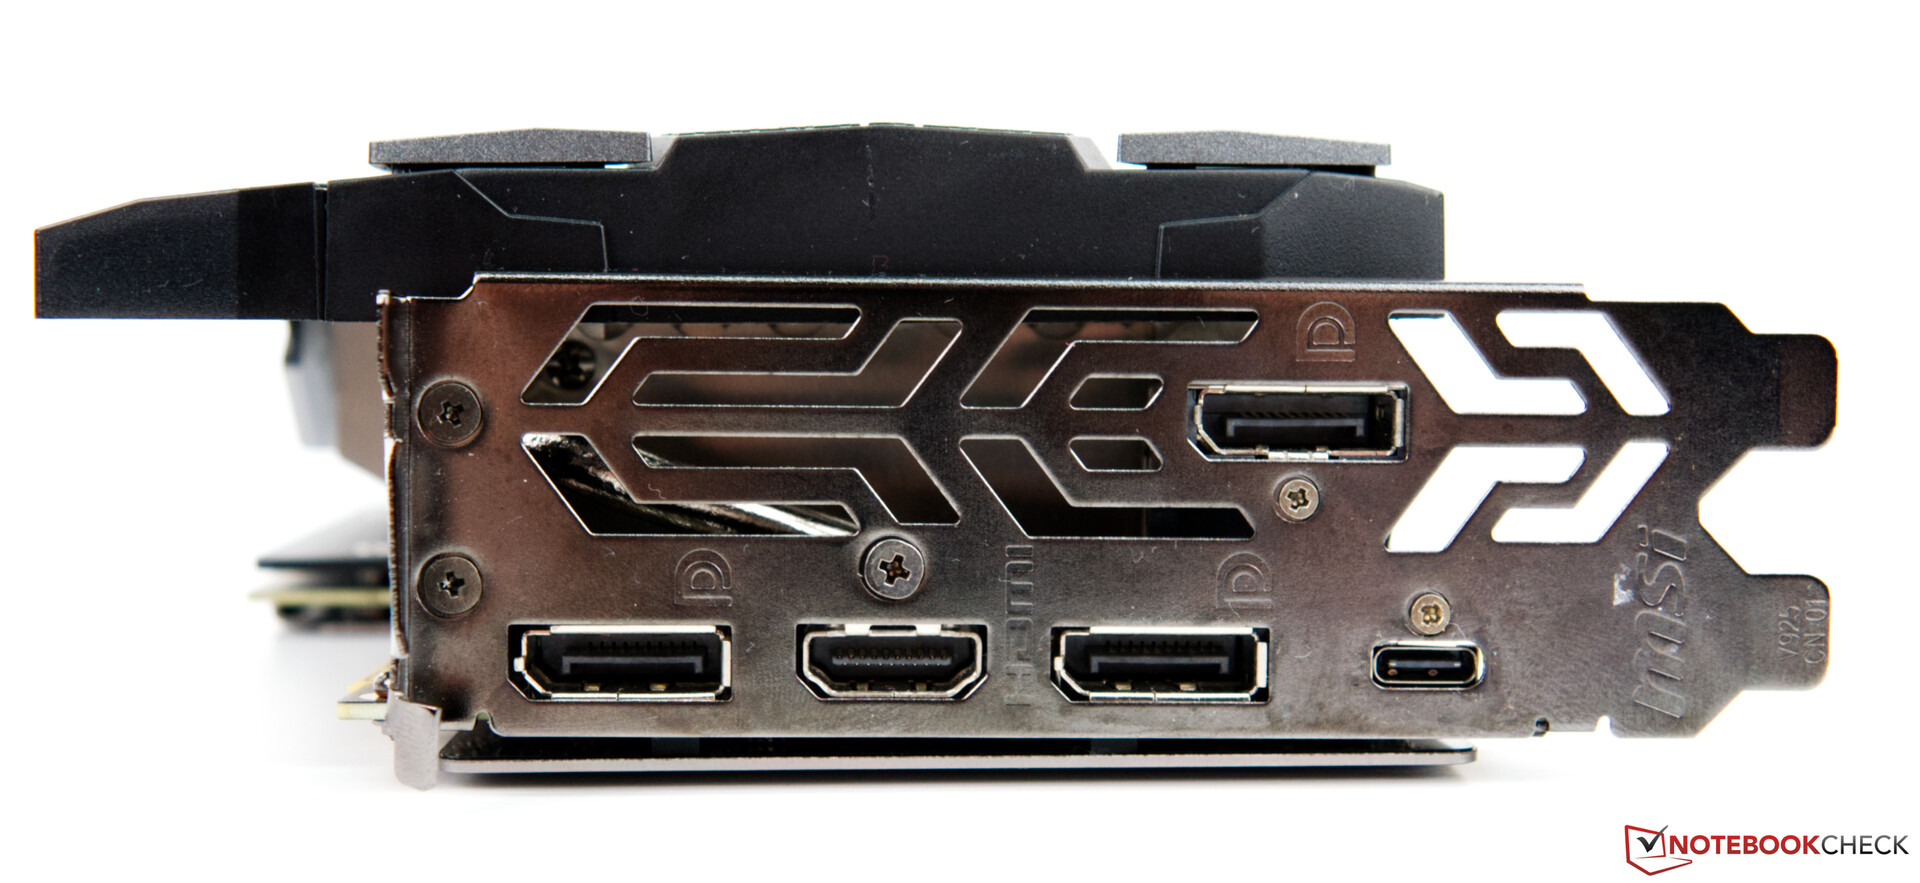
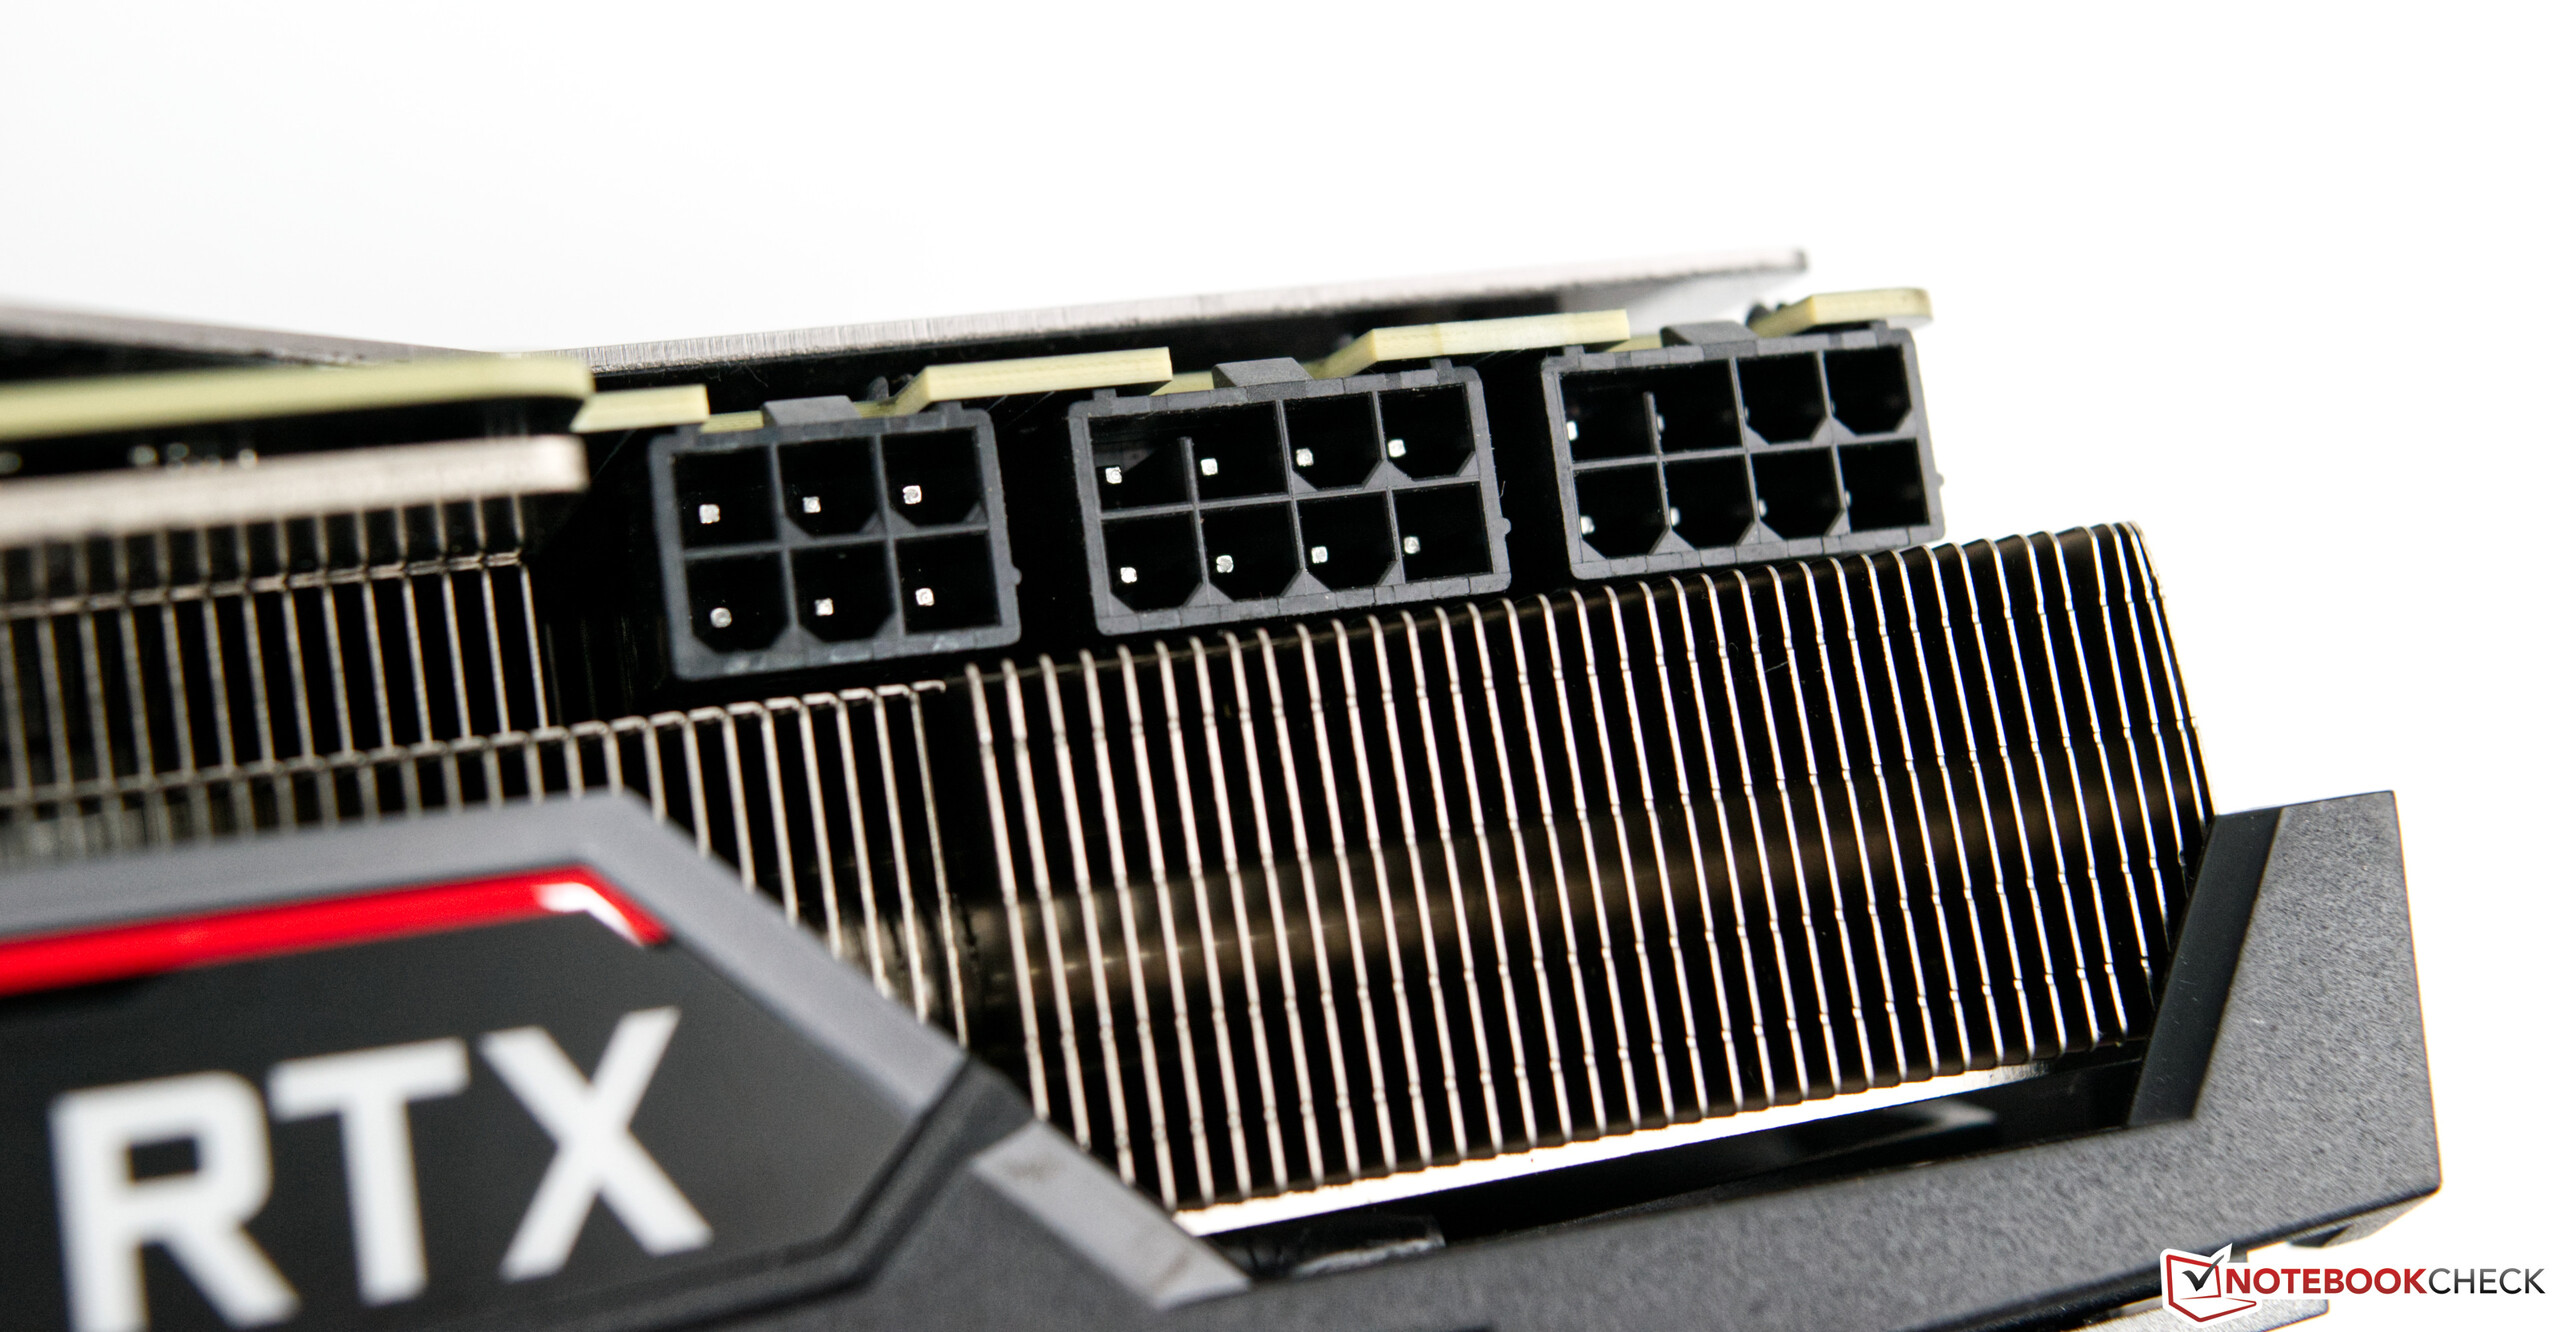
On the connection side, the Gaming X Trio offers everything that most gamers will need. MSI has included three DisplayPort ports, one HDMI and a single USB Type-C, the combination of which has almost become standard nowadays among high-end desktop GPUs. The bevy of ports makes the Gaming X Trio ideal for a multi-monitor setup too. Internally, the 300 W requires one 6-pin power connector, along with two 8-pin connectors.

NVIDIA Turing family overview
| Specifications | RTX 2060 | RTX 2060 SUPER | RTX 2070 | RTX 2070 SUPER | RTX 2080 | RTX 2080 SUPER | RTX 2080 Ti | MSI RTX 2080 Ti | TITAN RTX |
| Chip | TU106 | TU106 | TU106 | TU104 | TU104 | TU104 | TU102 | TU102 | TU102 |
| FinFET process | 12 nm | 12 nm | 12 nm | 12 nm | 12 nm | 12 nm | 12 nm | 12 nm | 12 nm |
| CUDA core | 1,920 | 2,176 | 2,304 | 2,560 | 2,944 | 3,072 | 4,352 | 4,352 | 4,608 |
| Texture units | 120 | 136 | 144 | 160 | 184 | 192 | 272 | 272 | 288 |
| Tensor cores | 240 | 272 | 288 | 320 | 368 | 384 | 544 | 544 | 572 |
| RT Cores | 30 | 34 | 36 | 40 | 46 | 48 | 68 | 68 | 72 |
| GPU base clock | 1,365 MHz | 1,470 MHz | 1,410 MHz | 1,605 MHz | 1,515 MHz | 1,650 MHz | 1,350 MHz | 1,350 MHz | 1,350 MHz |
| GPU boost clock | 1,680 MHz | 1,650 MHz | 1,620 MHz | 1,770 MHz | 1,710 MHz | 1,815 MHz | 1,545 MHz | 1,755 MHz | 1,770 MHz |
| Memory bus | 192-bit | 256-bit | 256-bit | 256-bit | 256-bit | 256-bit | 352-bit | 352-bit | 384-bit |
| Memory bandwidth | 336 GB/s | 448 GB/s | 448 GB/s | 448 GB/s | 448 GB/s | 496.1 GB/s | 616 GB/s | 616 GB/s | 672 GB/s |
| VRAM | 6 GB GDDR6 | 8 GB GDDR6 | 8 GB GDDR6 | 8 GB GDDR6 | 8 GB GDDR6 | 8 GB GDDR6 | 11 GB GDDR6 | 11 GB GDDR6 | 24 GB GDDR6 |
| TDP | 160 W | 175 W | 175 W | 215 W | 215 W | 250 W | 260 W | 300 W | 280 W |
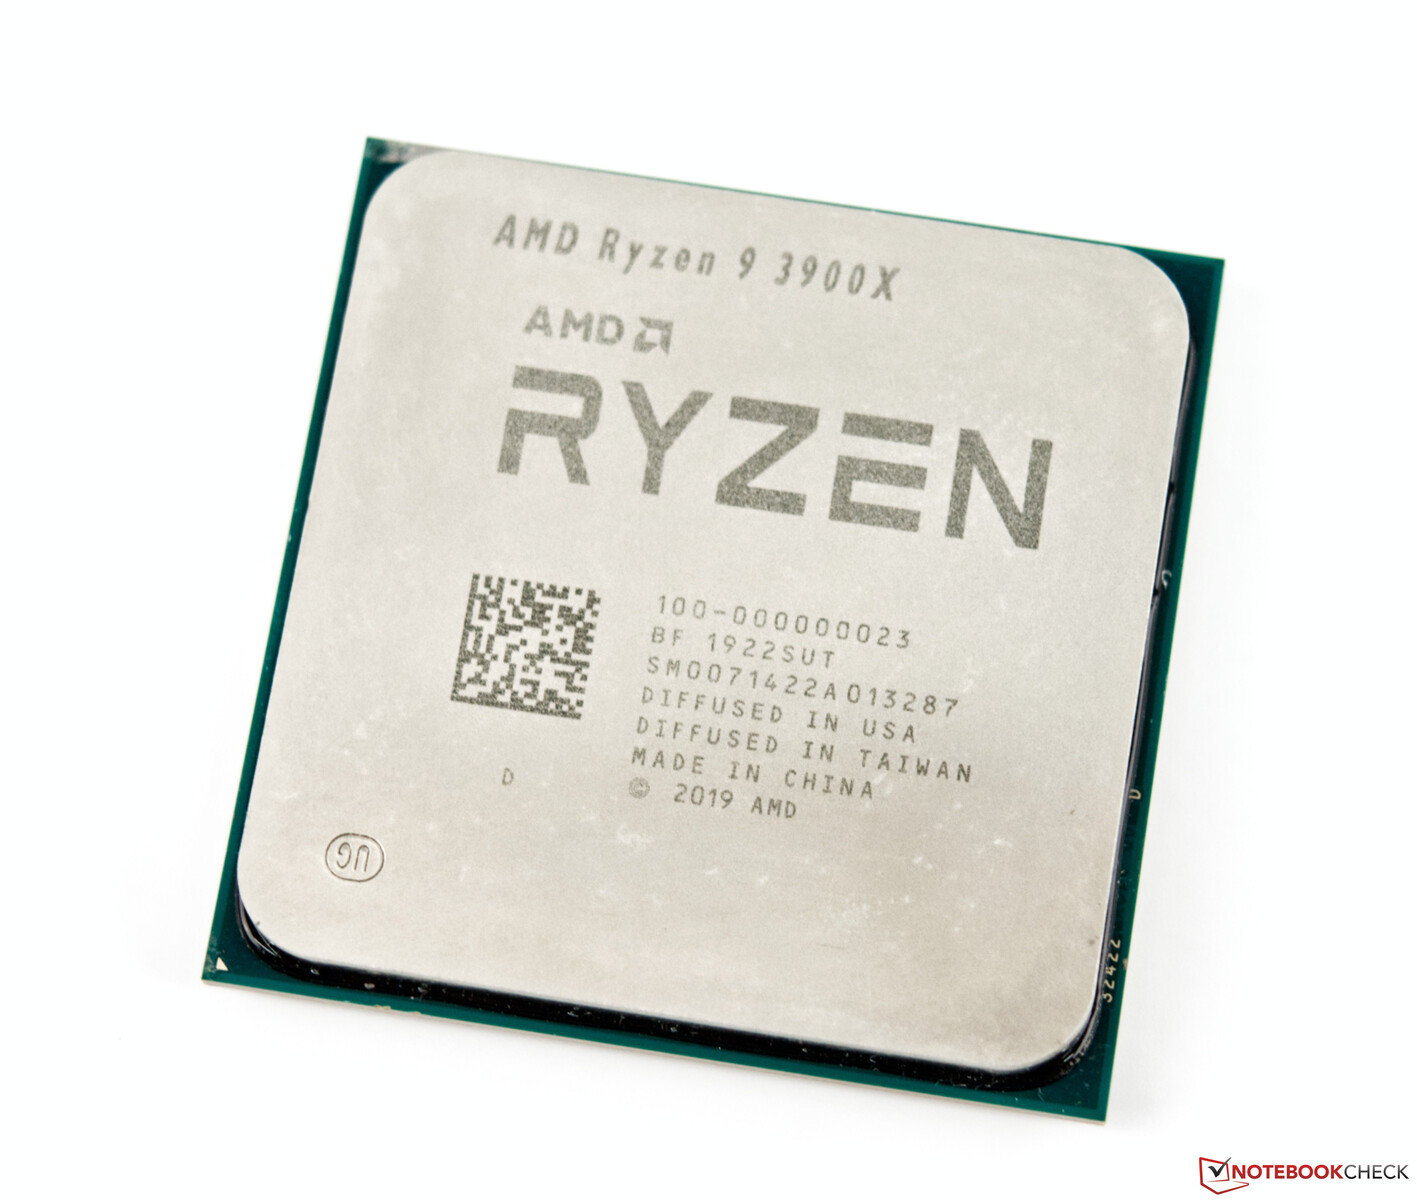
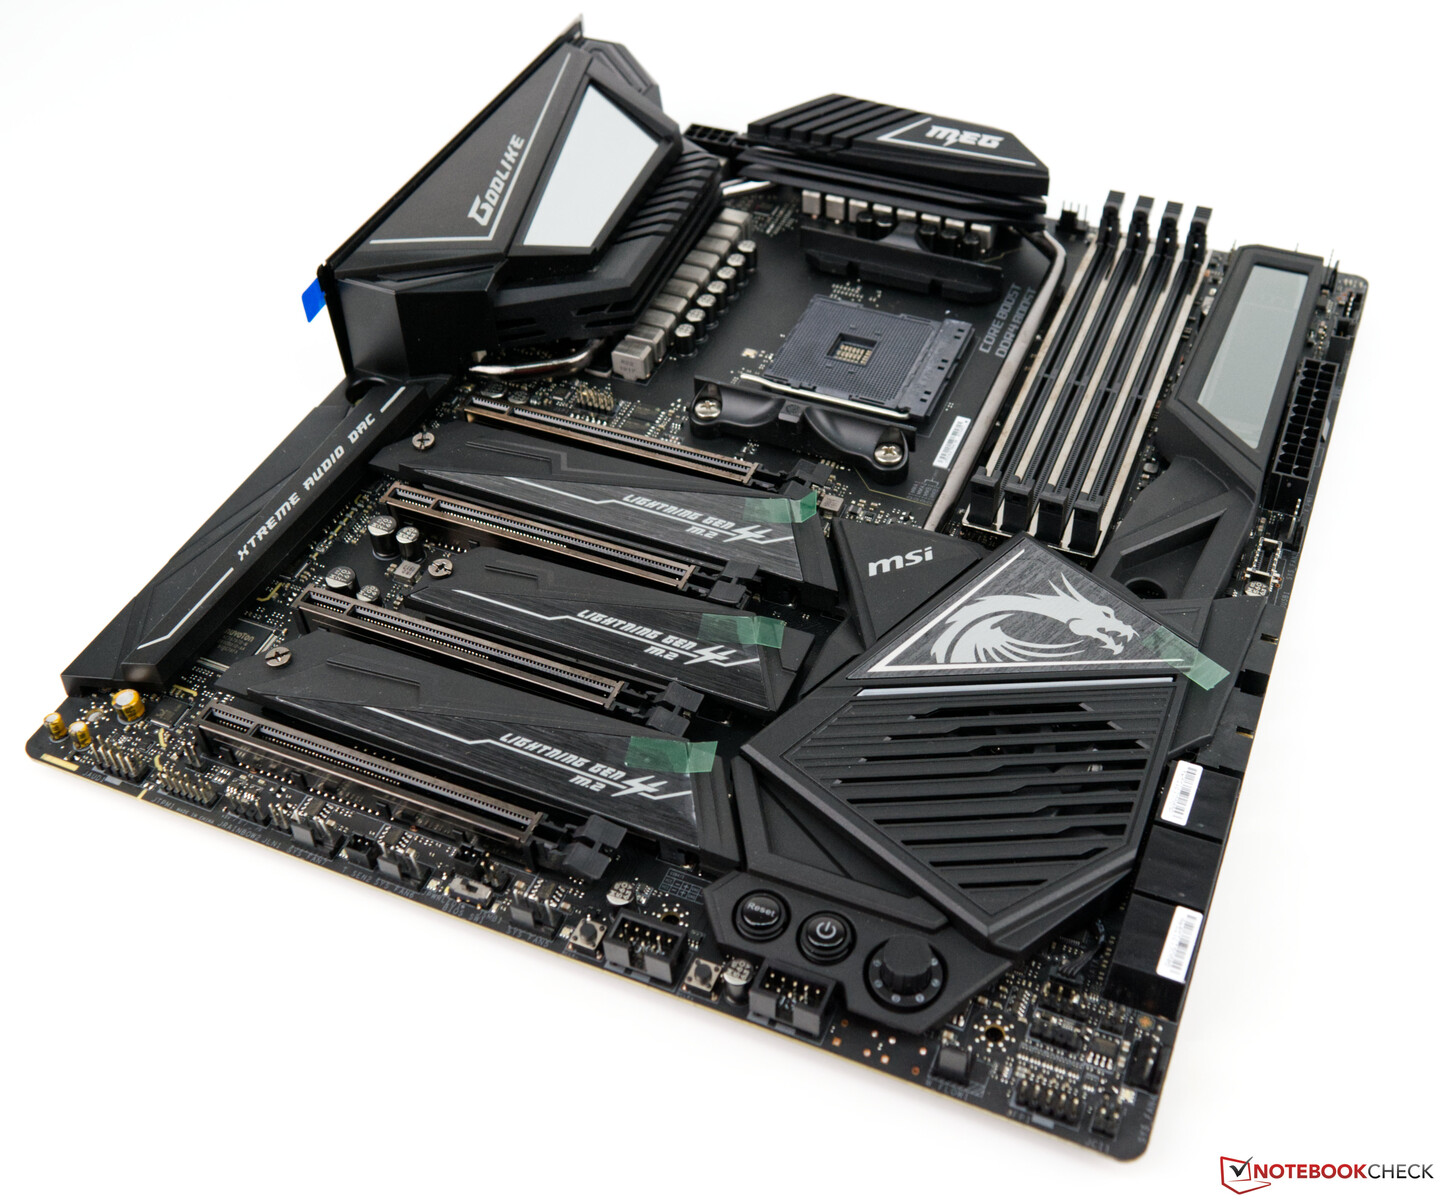
The Test System - AMD Ryzen 9 3900X as a base
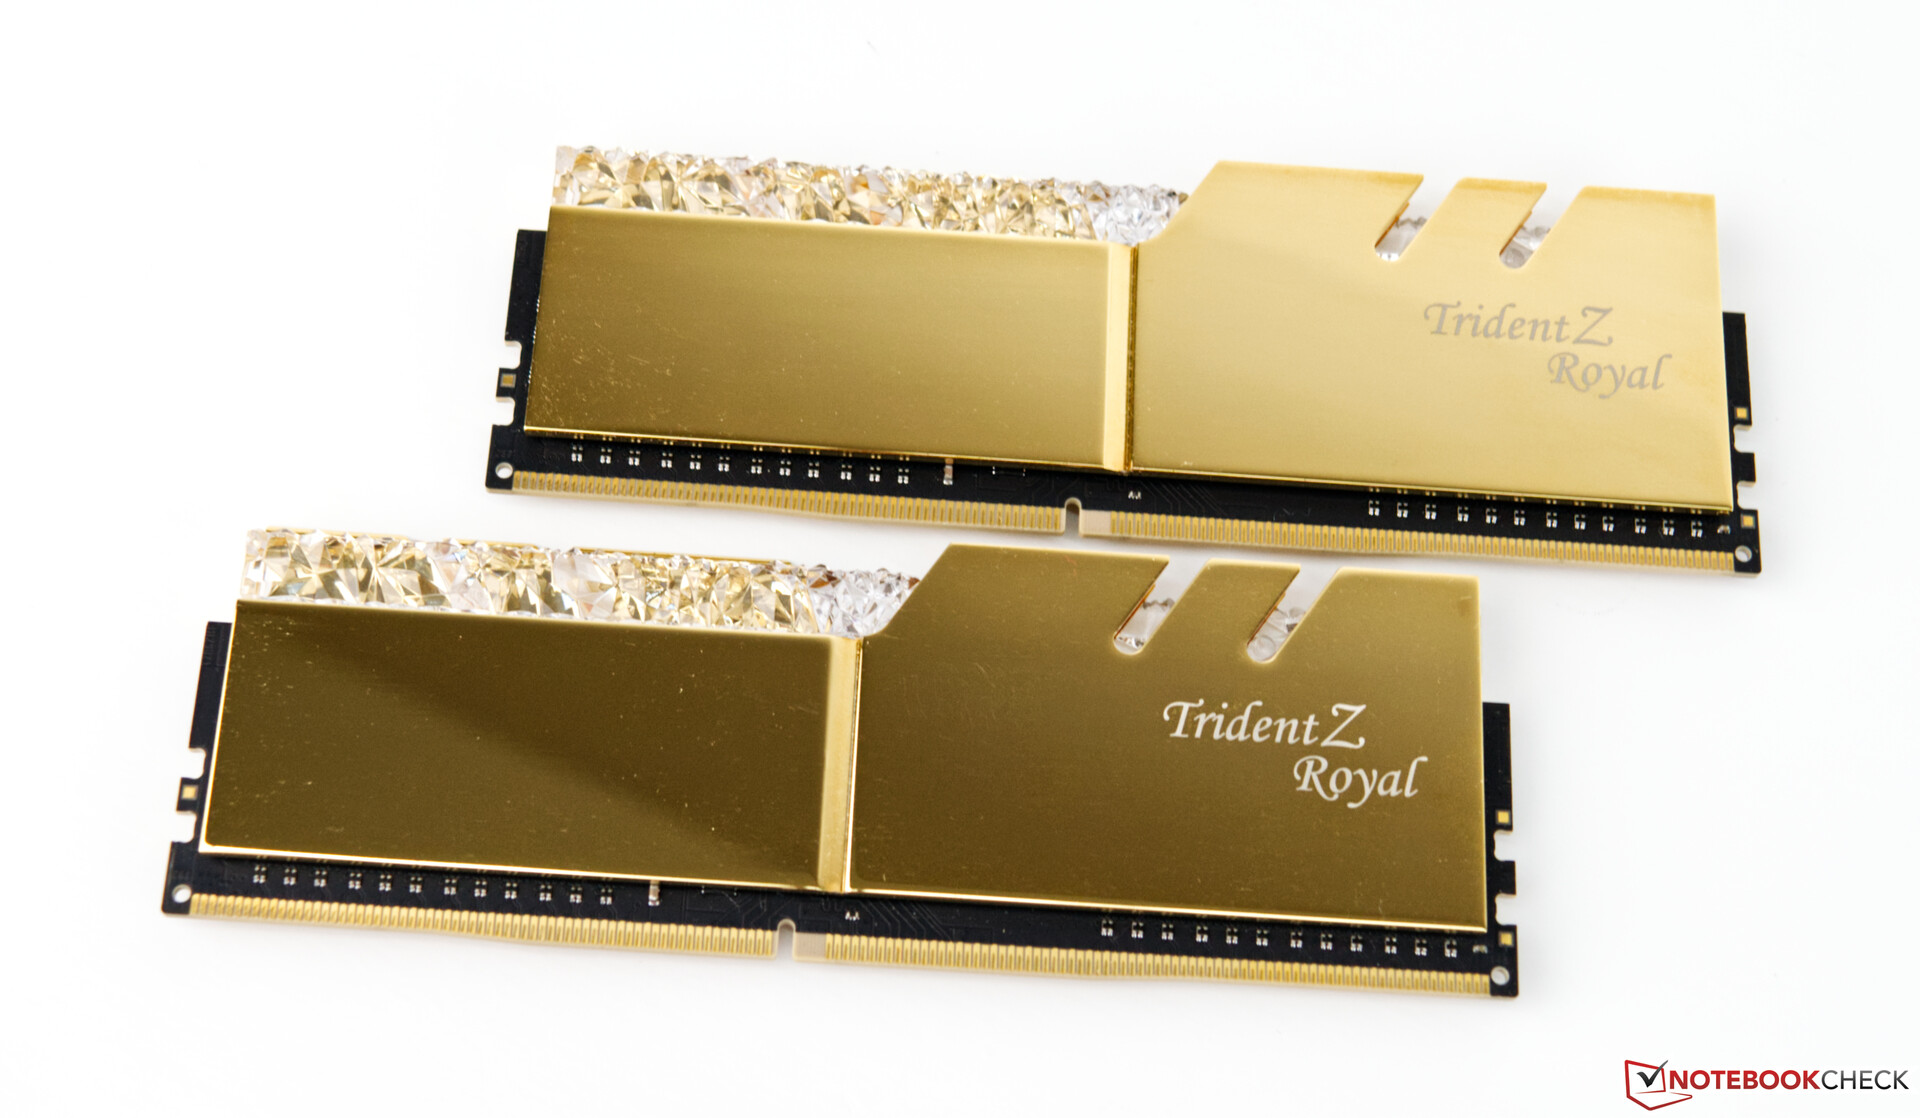
We paired the Gaming X Trio with an MSI MEG X570 Godlike motherboard and an AMD Ryzen 9 3900X processor for our tests. The Ryzen 9 3900X offers good performance as we discovered in our review earlier this year, and we used an Alphacool Eisbaer 280 AIO to keep it cool. We also used 16 GB of G-Skill Trident Z Royal Gold RAM that we left clocked at 3,600 MHz on CL16-16-16-36. Finally, we ran all our benchmarks and tests on an Acer Predator XB321HK, a 4K monitor that we have used in many of our gaming reviews.
A big thank you to AMD for kindly providing us with this test platform.
We used the following hardware for our tests and benchmarks:
| Case | Corsair Carbide Air 540 ATX Cube |
|---|---|
| CPU | AMD Ryzen 9 3900X |
| GPU | MSI GeForce RTX 2080 Ti Gaming X Trio |
| CPU cooler | Alphacool Eisbear 280 |
| RAM | G-Skill Trident Z Royal Gold DDR4-3600 2 x 8 GB (DDR4-3600 CL16-16-16-36) |
| Motherboard | MSI MEG X570 Godlike (BIOS 1.20, Default Settings, XMP 1 for DDR4-3600 CL16) |
| Monitor | Acer Predator XB321HK 4K |
| Power supply | Corsair RM 1000X |
| SSD | Corsair MP600 2 TB M.2 PCIe 4.0 SSD |
| SSD | Crucial MX500 2 TB - for games |
| OS | Microsoft Windows 10 Professional 64-Bit (Version 1903) |
| Drivers | NVIDIA 441.66 |
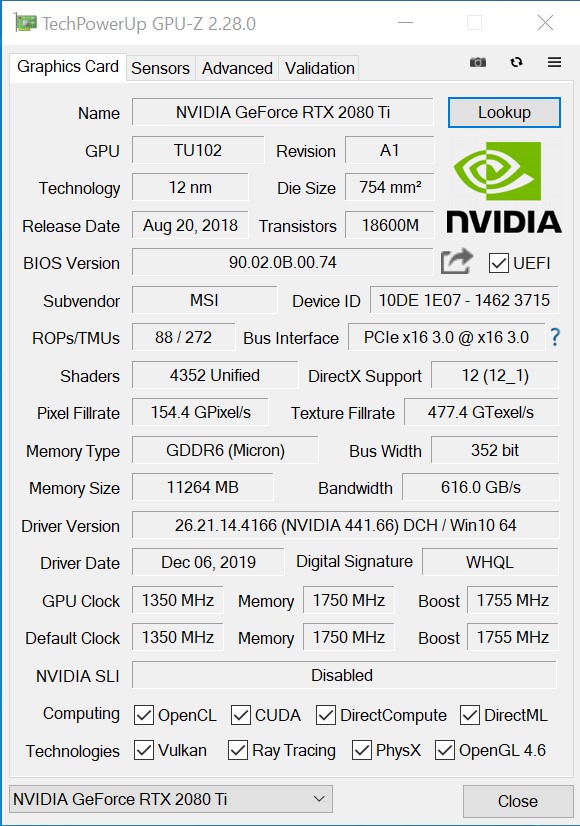
Clock speeds - A significantly higher boost clock than reference speeds
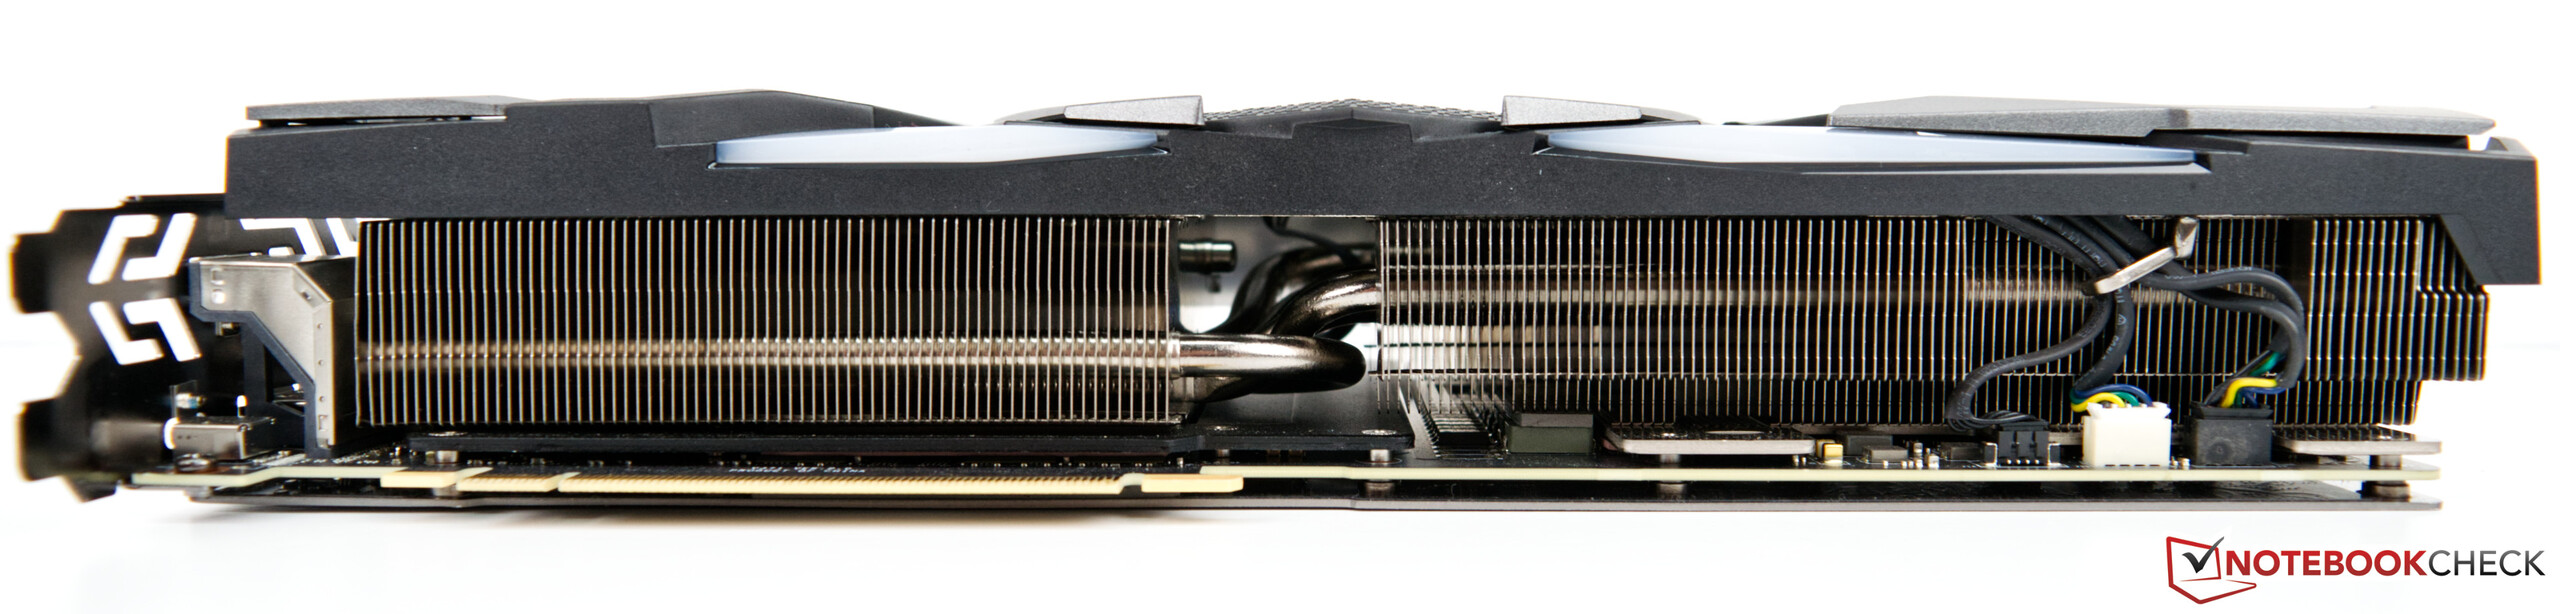
While the 1,350 MHz base clock of the Gaming X Trio matches that of NVIDIA's reference model, the former diverges from the latter's boost clock. At 1,755 MHz, the Gaming X Trio offers a 210 MHz higher boost clock than the Founders Edition, which is associated with its increased power consumption. The Gaming X Trio consumes 40 W more at stock settings than the Founders Edition as we mentioned earlier, which explains the need for a powerful heat sink. There are no differences with VRAM, though. The Gaming X Trio has 11 GB of GDDR6 like its Founder Edition sibling, which also operates at 1,750 MHz. Effectively, the VRAM operates at 14 GHz. Combining this with a 352-bit bus yields a memory bandwidth of 616 GB/s.
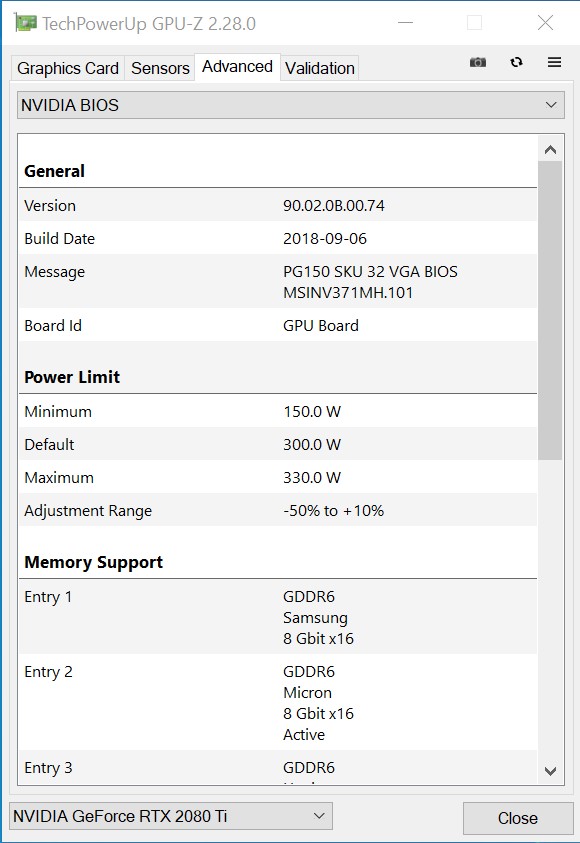
MSI allows the power target (PT) of the Gaming X Trio to be increased by 10%, giving it a maximum TDP of 330 W. We cover what advantages this increased PT brings in the Overclocking section of this review.
Synthetic Benchmarks - Closing in on the TITAN RTX
Synthetic benchmarks already reveal the potential of the Gaming X Trio. In short, our review unit only just outperforms the KFA2 GeForce RTX 20 Ti EX, while it even gets close to the nominally faster TITAN RTX.
The Gaming X Trio makes light work of the RTX 20 SUPER series too. The GeForce RTX 2080 SUPER, for example, is about 20% slower than our review unit in synthetic benchmarks, with the RTX 2070 SUPER and RTX 2060 SUPER falling even further behind. AMD cannot compete in this performance class, either. The fastest AMD graphics card in our comparison tables is the Radeon VII, but it is stuck duelling with the RTX 2070 SUPER rather than the Gaming X Trio.
| Unigine Valley 1.0 | |
| 1920x1080 Extreme HD DirectX AA:x8 | |
| AMD Ryzen 9 3900X | |
| MSI RTX 2080 Ti Gaming X Trio | |
| KFA2 GeForce RTX 2080 Ti EX | |
| Nvidia GeForce RTX 2080 Super | |
| MSI RTX 2080 Gaming X Trio | |
| Nvidia GeForce RTX 2070 Super | |
| MSI RTX 2070 Gaming Z 8G | |
| AMD Radeon VII | |
| Nvidia GeForce RTX 2060 Super | |
| AMD Radeon RX 5700 XT | |
| AMD Radeon RX 5700 | |
| MSI RTX 2060 Gaming Z 6G | |
| 1920x1080 Extreme HD Preset OpenGL AA:x8 | |
| AMD Ryzen 9 3900X | |
| MSI RTX 2080 Ti Gaming X Trio | |
| KFA2 GeForce RTX 2080 Ti EX | |
| Nvidia GeForce RTX 2080 Super | |
| MSI RTX 2080 Gaming X Trio | |
| Nvidia GeForce RTX 2070 Super | |
| MSI RTX 2070 Gaming Z 8G | |
| Nvidia GeForce RTX 2060 Super | |
| AMD Radeon RX 5700 XT | |
| MSI RTX 2060 Gaming Z 6G | |
| AMD Radeon RX 5700 | |
| AMD Radeon VII | |
| 3DMark 05 Standard | 52681 points | |
| 3DMark 06 Standard Score | 44434 points | |
| 3DMark Vantage P Result | 83556 points | |
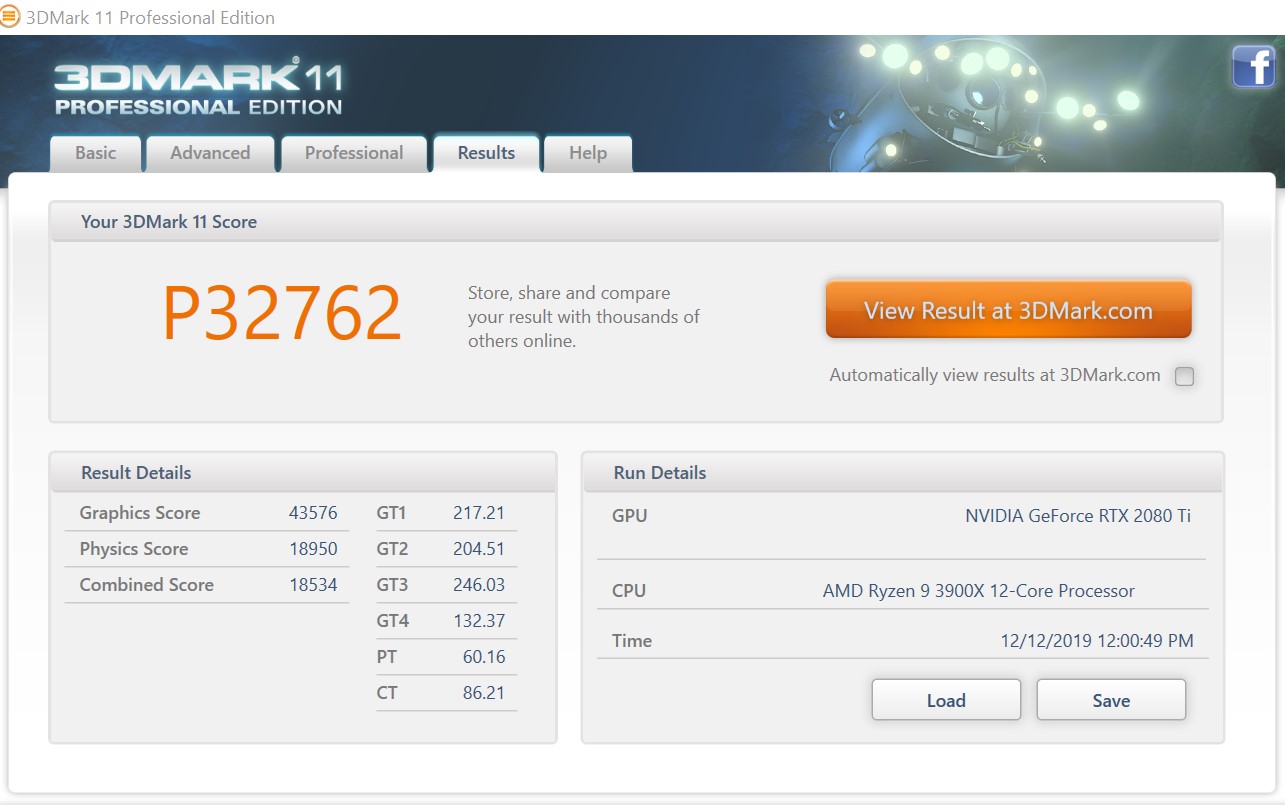
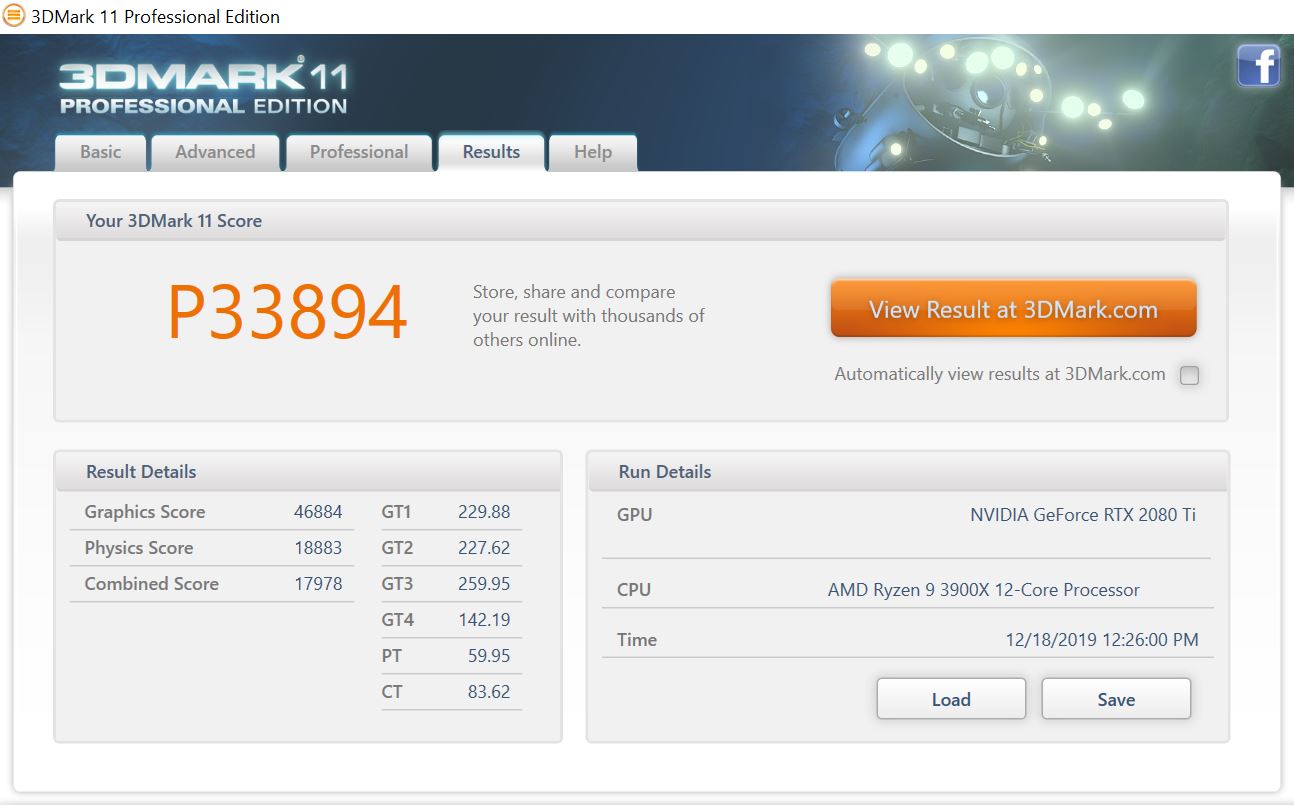
| 3DMark 11 Performance | 32762 points | |
| 3DMark Ice Storm Standard Score | 212266 points | |
| 3DMark Cloud Gate Standard Score | 54334 points | |
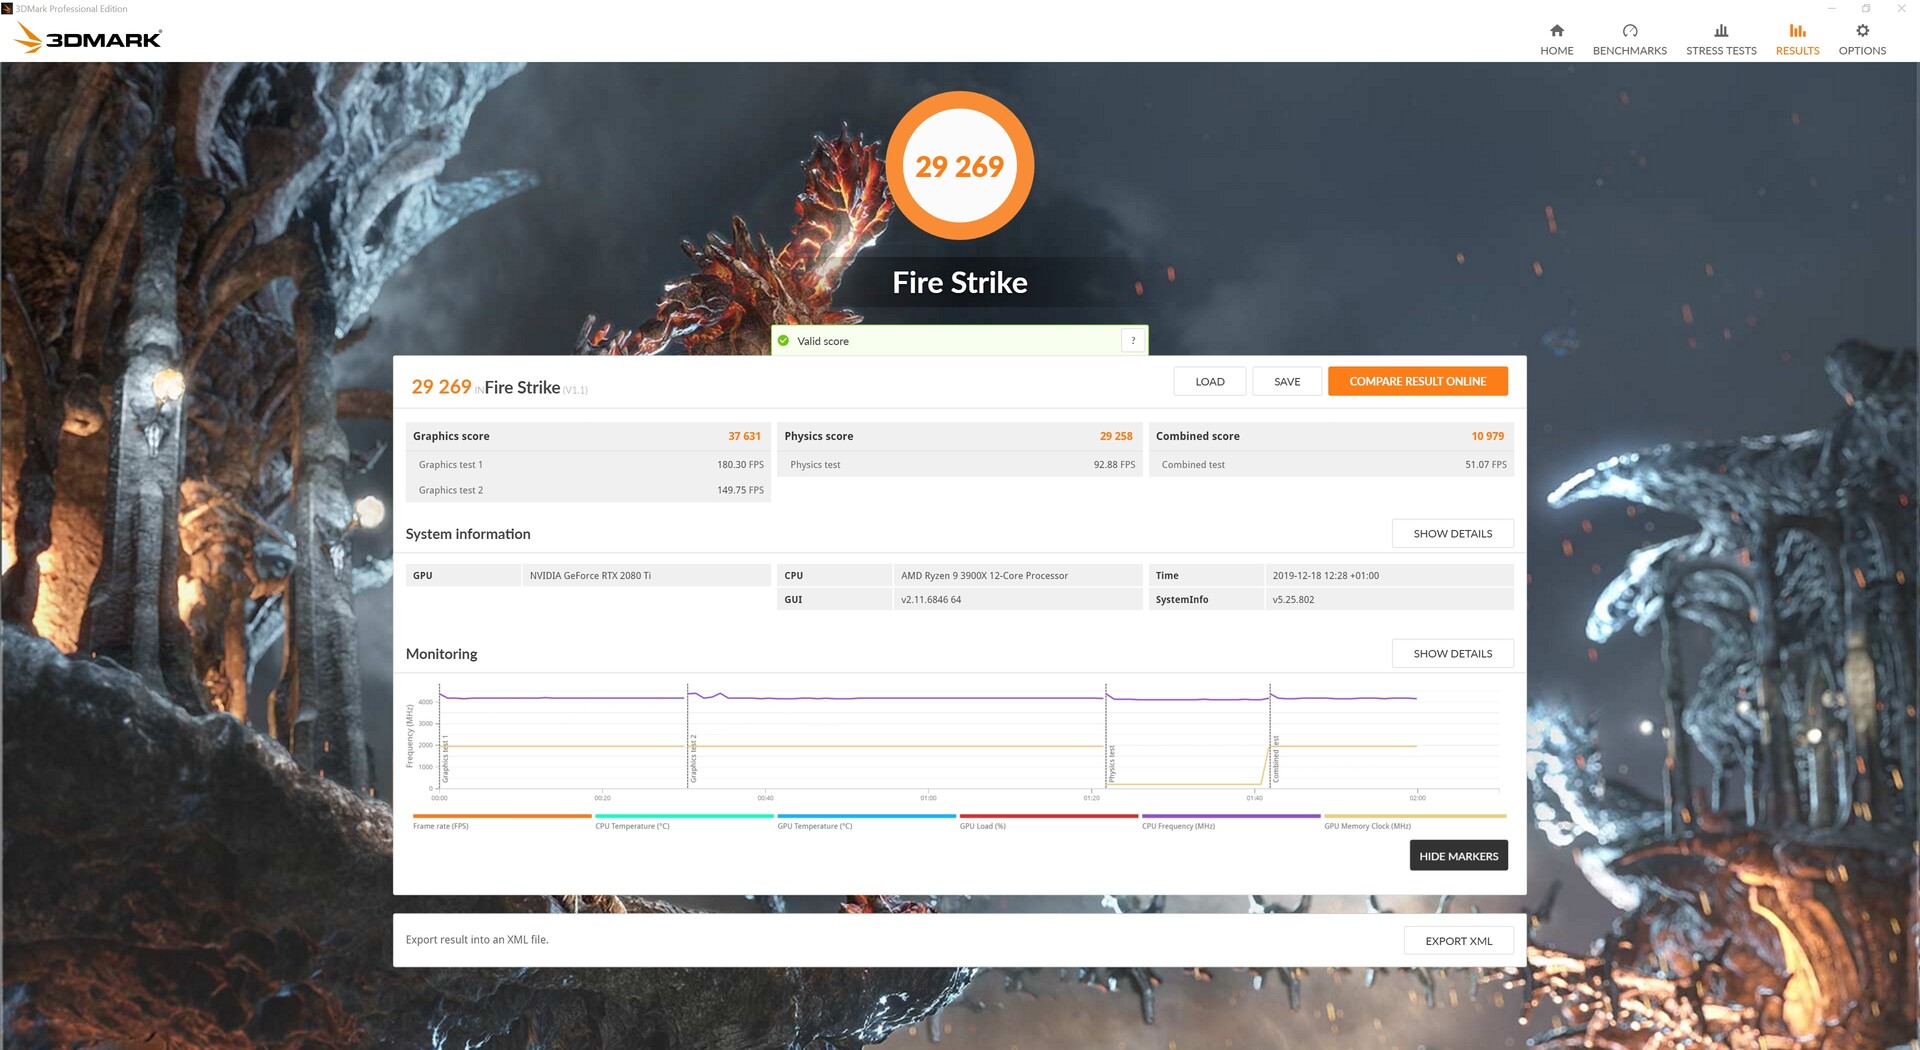
| 3DMark Fire Strike Score | 26845 points | |
| 3DMark Fire Strike Extreme Score | 16405 points | |
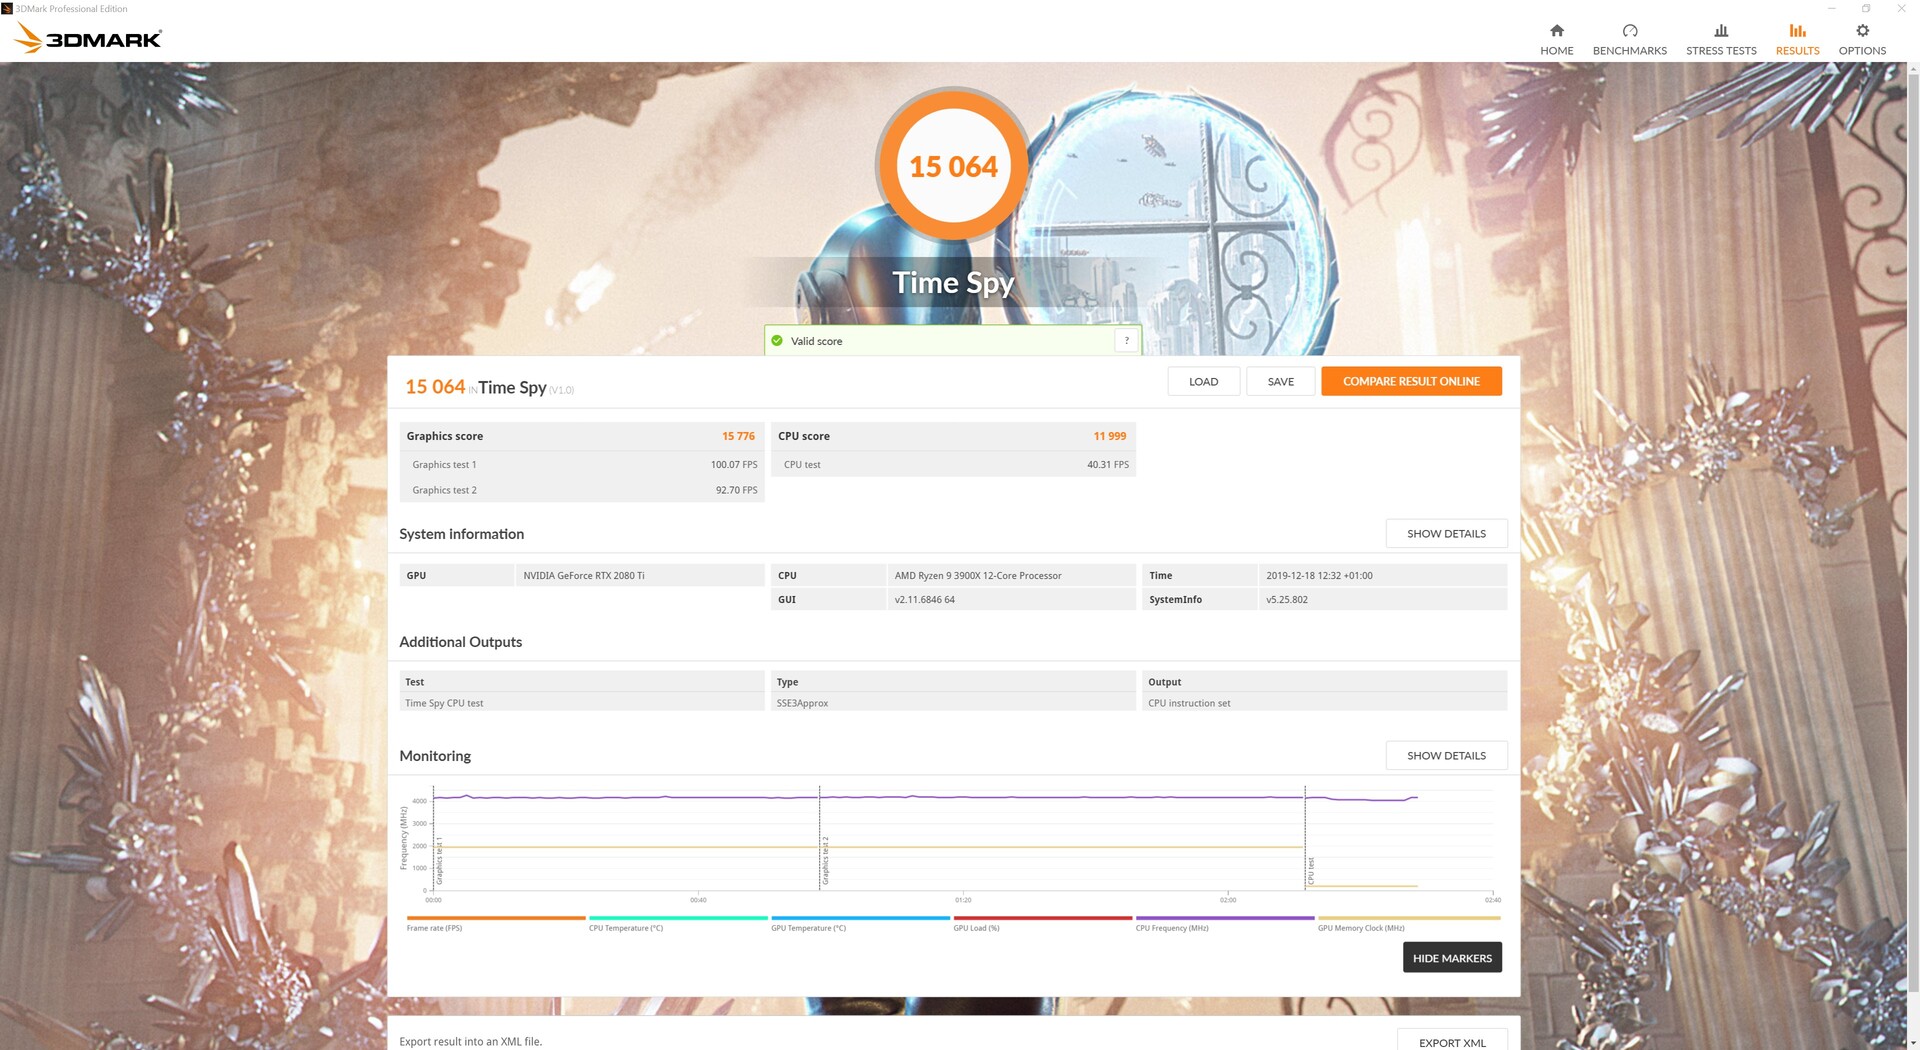
| 3DMark Time Spy Score | 14057 points | |
Help | ||
Gaming Benchmarks - A QHD- and UHD-capable graphics card
As expected, the Gaming X Trio performs very well in our gaming benchmarks. Almost all games can be displayed at maximum details and in 4K, although a few titles like Anno 1800 and Red Dead Redemption 2 drop below 60 FPS. An average of 36 and 42 FPS, respectively, will still look smooth though, in our opinion.
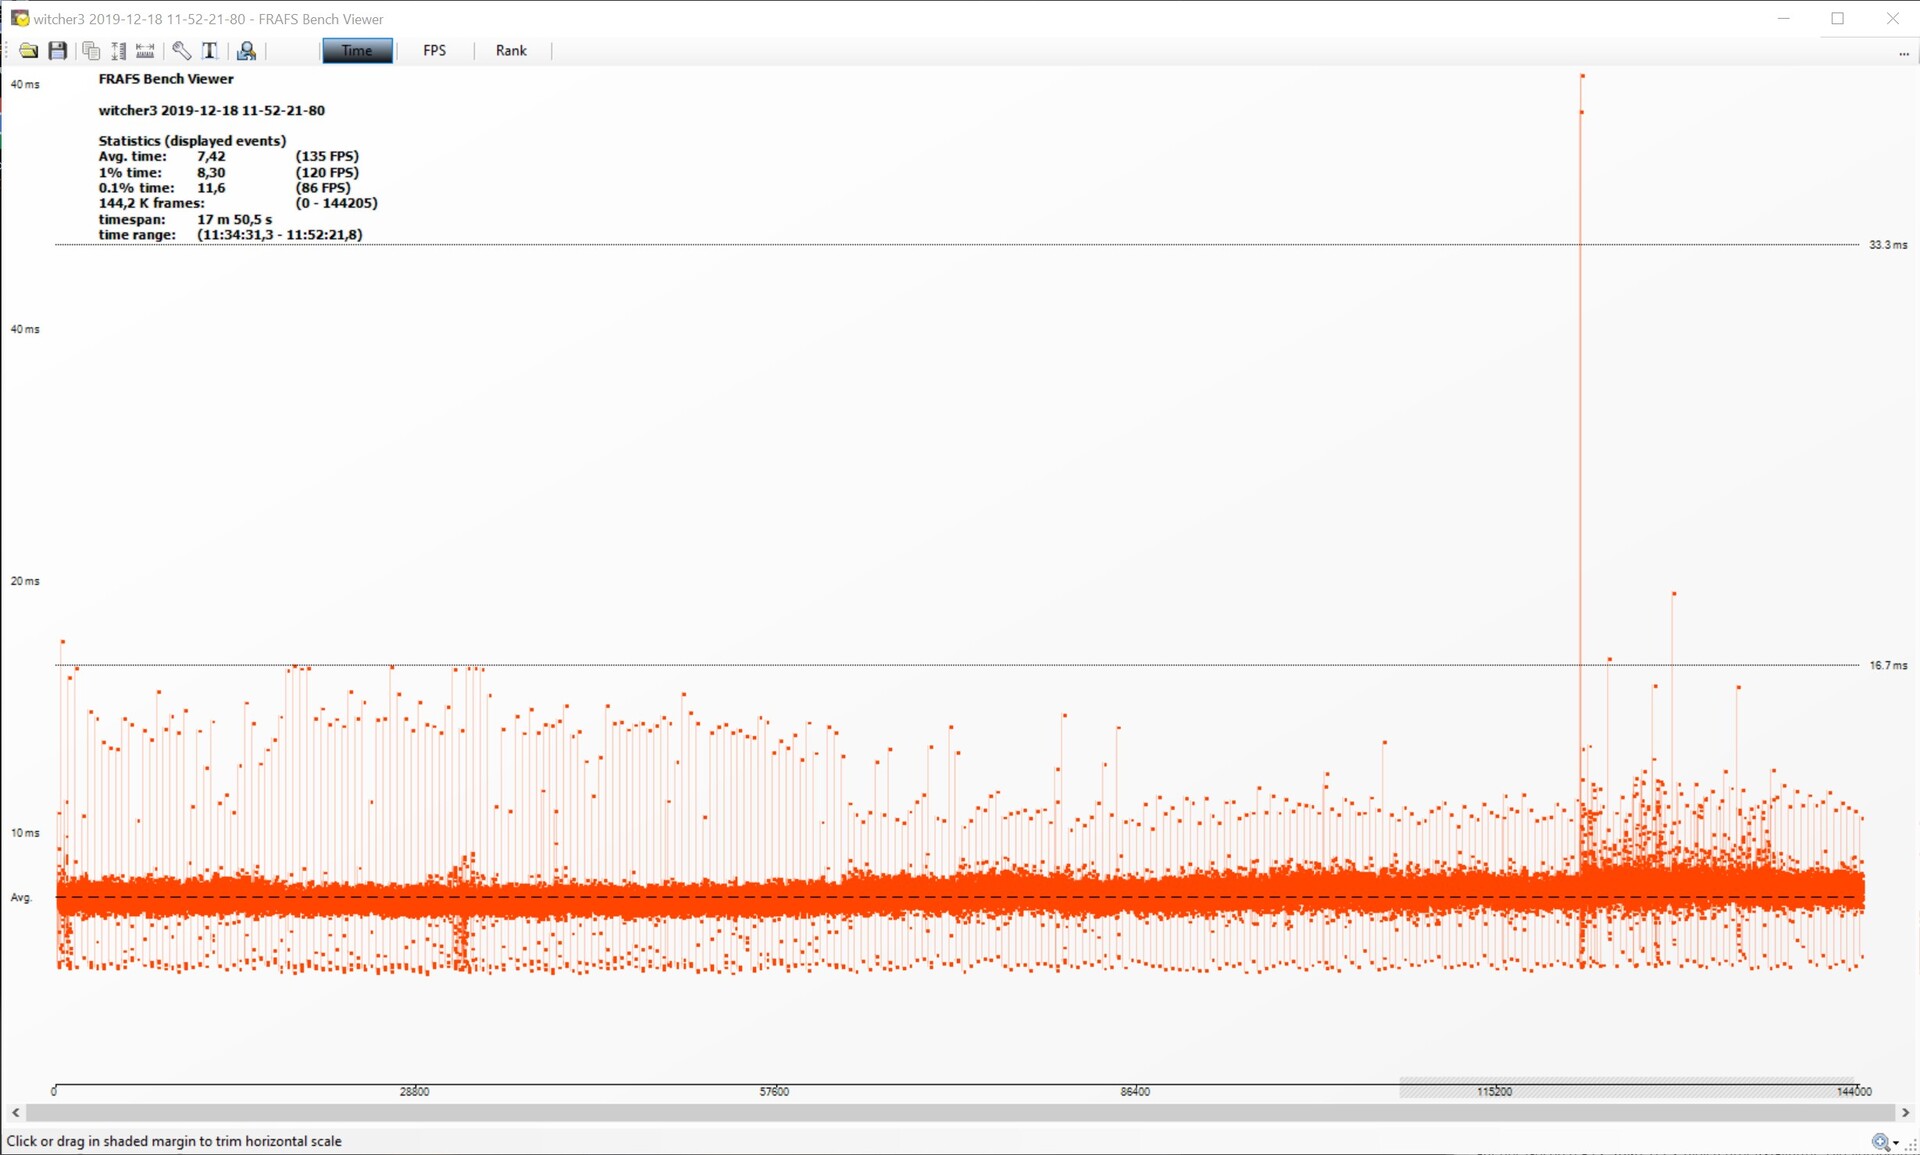
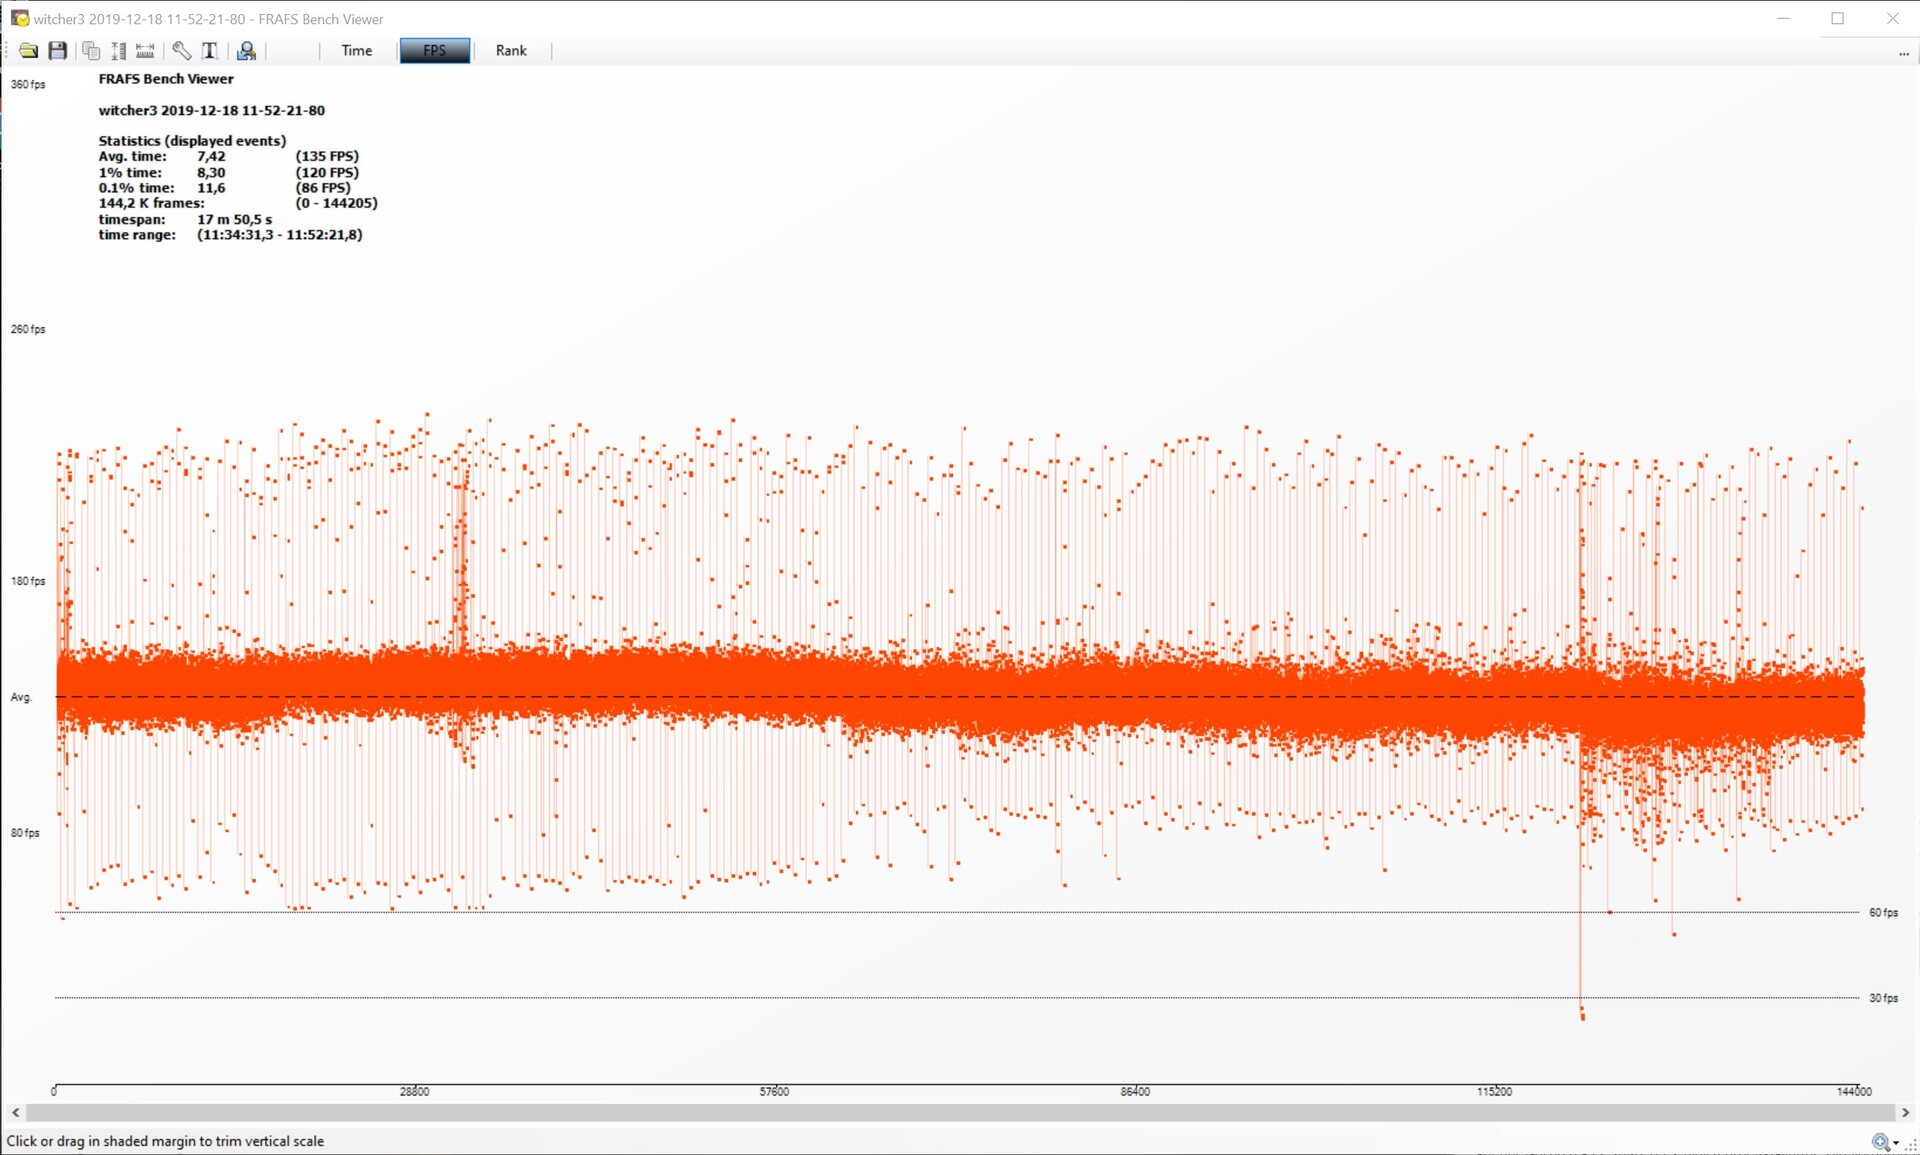
The frame times and frame rates of our review unit over a prolonged session are rather ordinary. We noticed some peaks and troughs during our tests, but these are very short, so you should not notice any jerking or stutters when gaming. We verified this by running The Witcher 3 on the ultra preset at 1080p, the results of which you can view in the graphs to the right and below. The Gaming X Trio drops from an initial high of 140 FPS to around 130 FPS by the end of our endurance test with a low of 122 FPS. An average of 135 FPS is still a top result though and demonstrates that the Gaming X Trio offers smooth frame rates even during extended gaming sessions.
The Witcher 3: Framerates – ultra preset
| low | med. | high | ultra | QHD | 4K | |
|---|---|---|---|---|---|---|
| The Witcher 3 (2015) | 380 | 335 | 247 | 136 | 101 | |
| Dota 2 Reborn (2015) | 129.5 | 134.5 | 146.2 | 136.4 | 133.4 | |
| For Honor (2017) | 370 | 273 | 262 | 210 | 100 | |
| X-Plane 11.11 (2018) | 128 | 115 | 93 | 81 | ||
| Far Cry 5 (2018) | 154 | 136 | 130 | 122 | 117 | 78 |
| Forza Horizon 4 (2018) | 206 | 182 | 181 | 169 | 150 | 111 |
| Far Cry New Dawn (2019) | 130 | 108 | 104 | 95 | 98 | 77 |
| Metro Exodus (2019) | 142 | 122 | 105 | 93 | 76 | 51 |
| Anthem (2019) | 90 | 107 | 104 | 99 | 99 | 70 |
| The Division 2 (2019) | 201 | 172 | 147 | 125 | 97 | 57 |
| Anno 1800 (2019) | 102 | 101 | 75 | 40.7 | 38.3 | 36.1 |
| Rage 2 (2019) | 329 | 207 | 180 | 174 | 119 | 61 |
| F1 2019 (2019) | 287 | 257 | 201 | 174 | 146 | 97 |
| Control (2019) | 240 | 169 | 132 | 89 | 45.8 | |
| Borderlands 3 (2019) | 162 | 142 | 127 | 109 | 83 | 47 |
| Star Wars Jedi Fallen Order (2019) | 106 | 106 | 104 | 105 | 73 | |
| Red Dead Redemption 2 (2019) | 127 | 119 | 103 | 76 | 63 | 42.3 |
Compute Performance - MSI has the measure of KFA2
The higher boost clock of the Gaming X Trio allows it to outperform its KFA2 counterpart in compute benchmarks. As before though, the TITAN RTX occasionally leads our current review unit by a large margin. Perfect performance, however, can only be achieved with the driver-optimised Quadro or FirePro series.
Emissions - Comparatively high power consumption yields cool and quiet performance under load

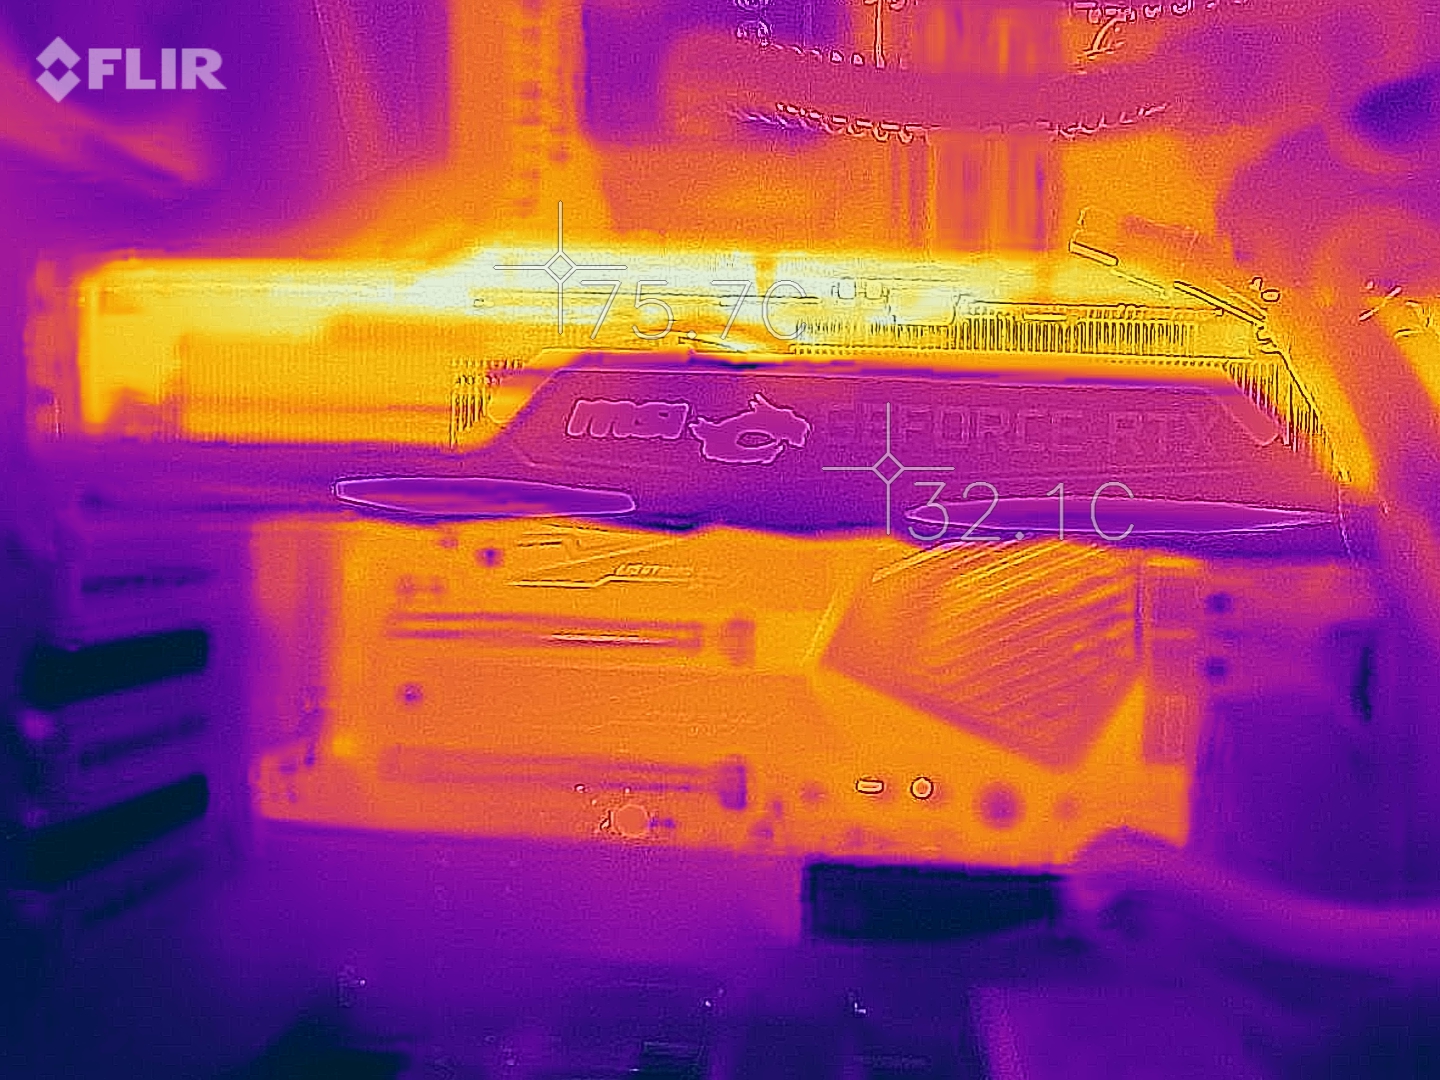


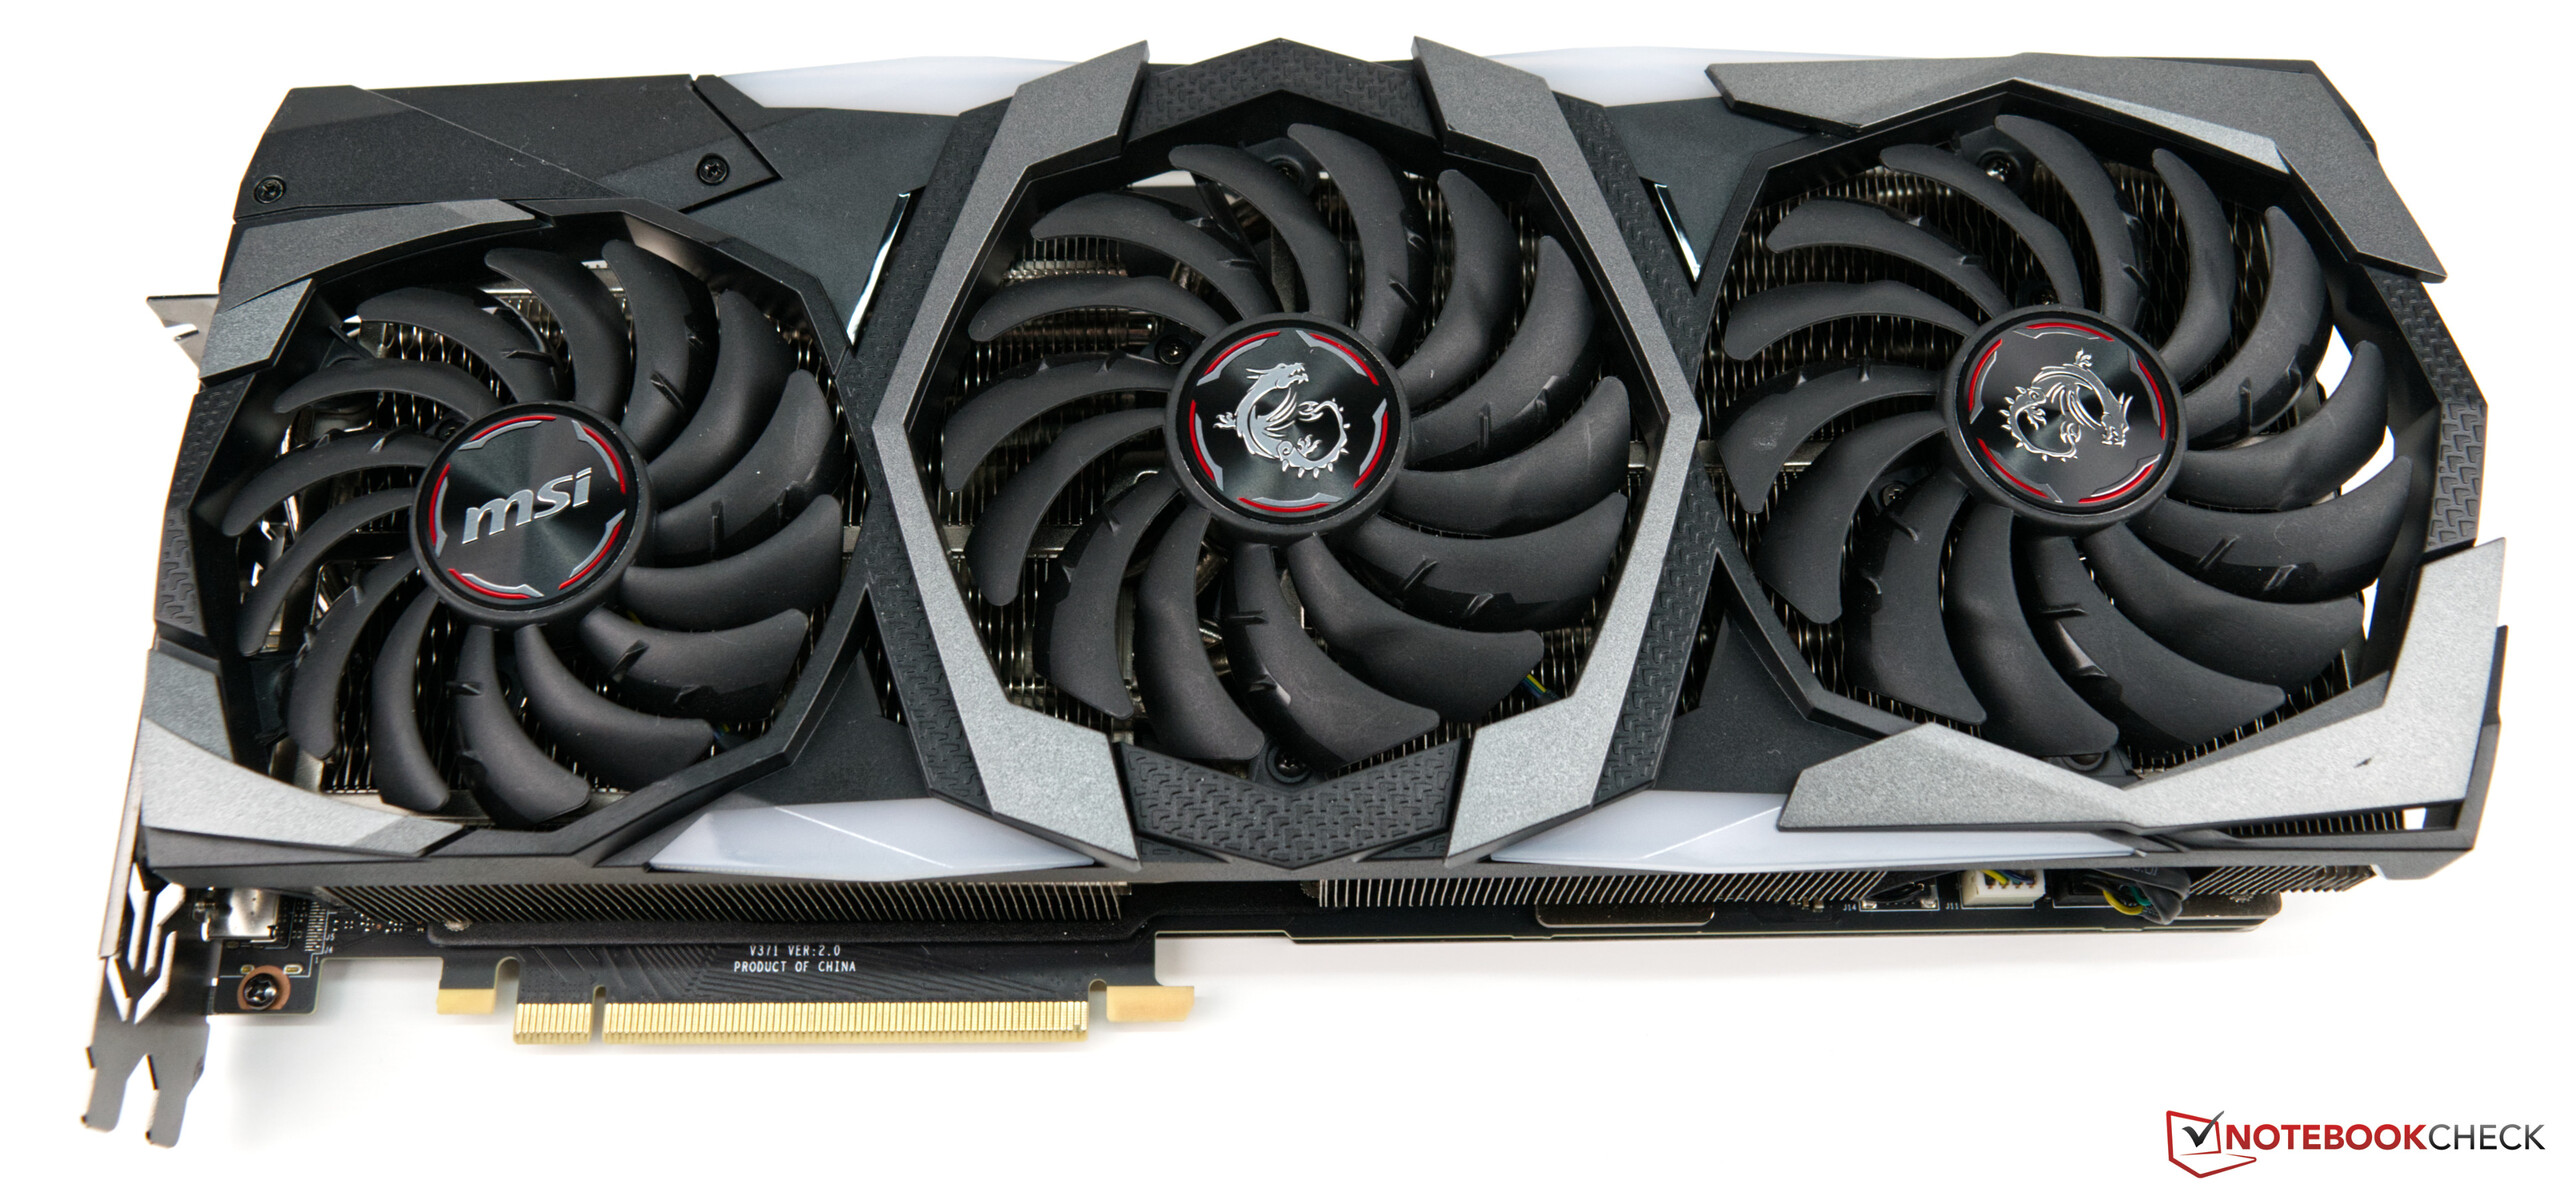
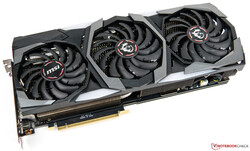
MSI has not exactly adhered to NVIDIA's RTX 2080 Ti specifications with the Gaming X Trio. This is not only true from the cooler with which the company has equipped the card but is also reflected in its power consumption. Unlike NVIDIA and its Founders Edition, MSI has equipped the Gaming X Trio with three axial fans.
Meanwhile, the GPU can consume up to 300 W under load, 40 W more than the Founders Edition at 260 W. The PT of the Gaming X Trio can be increased by 10% too, yielding a maximum TDP of 330 W.
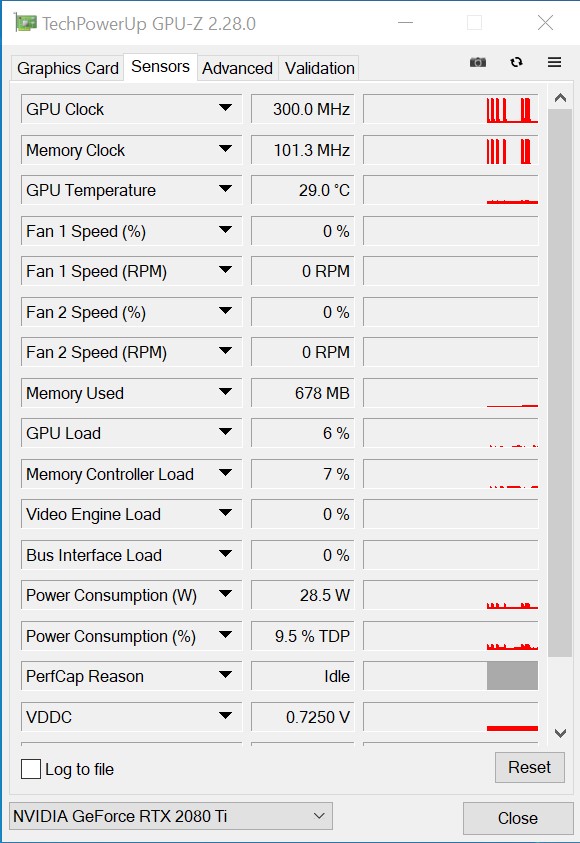
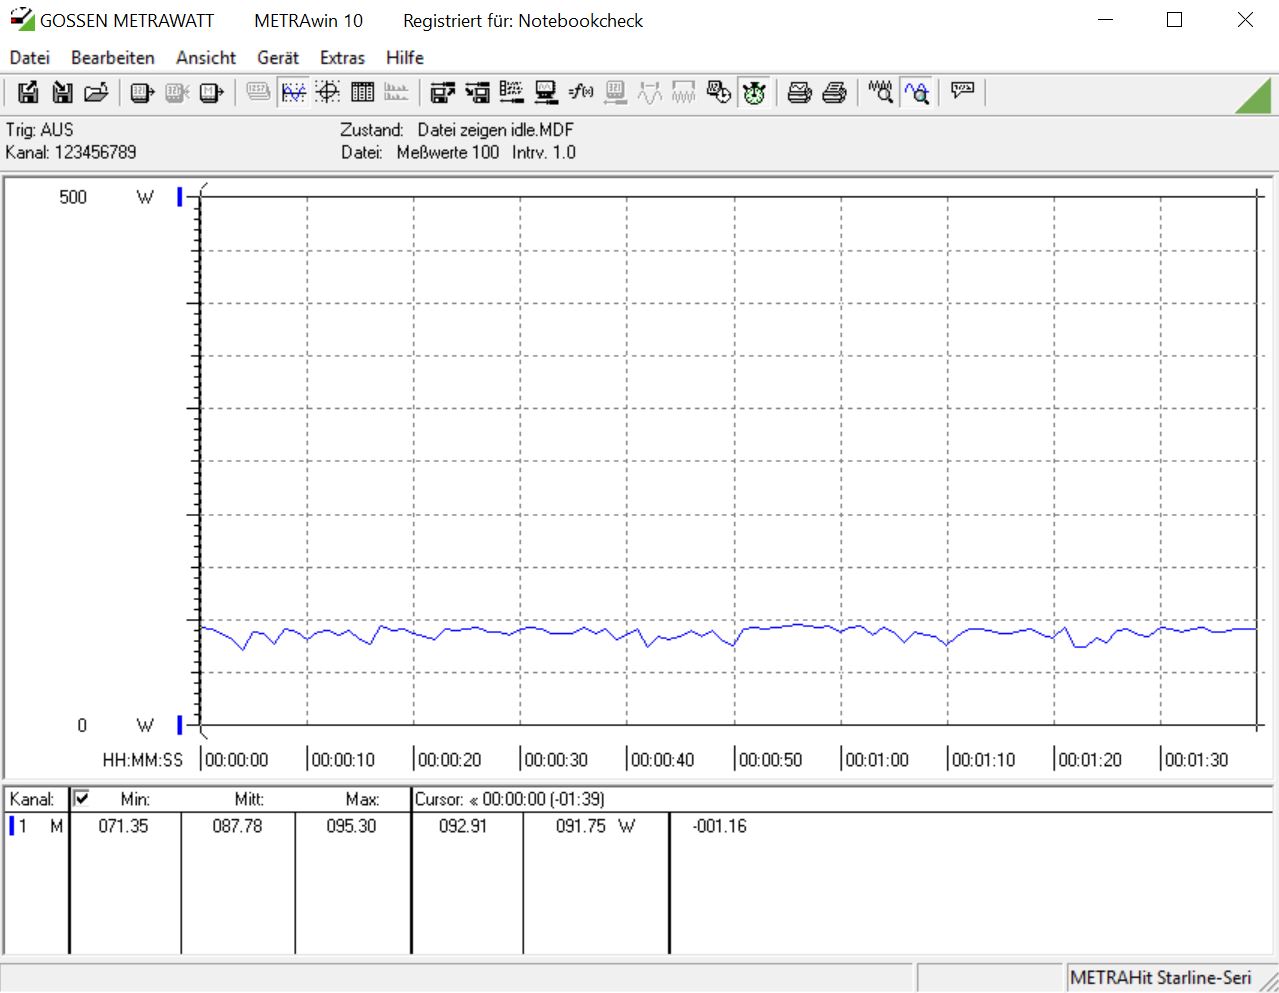
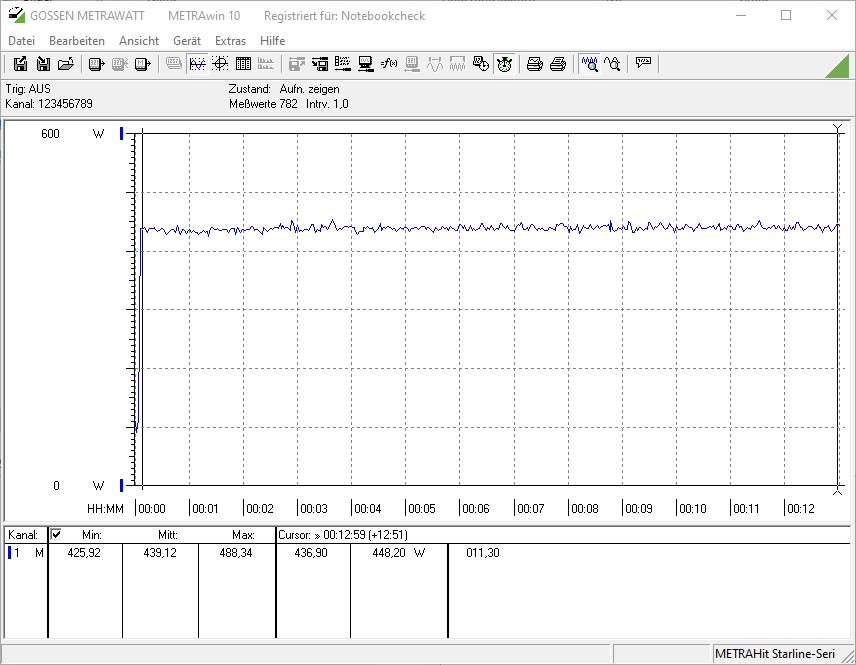
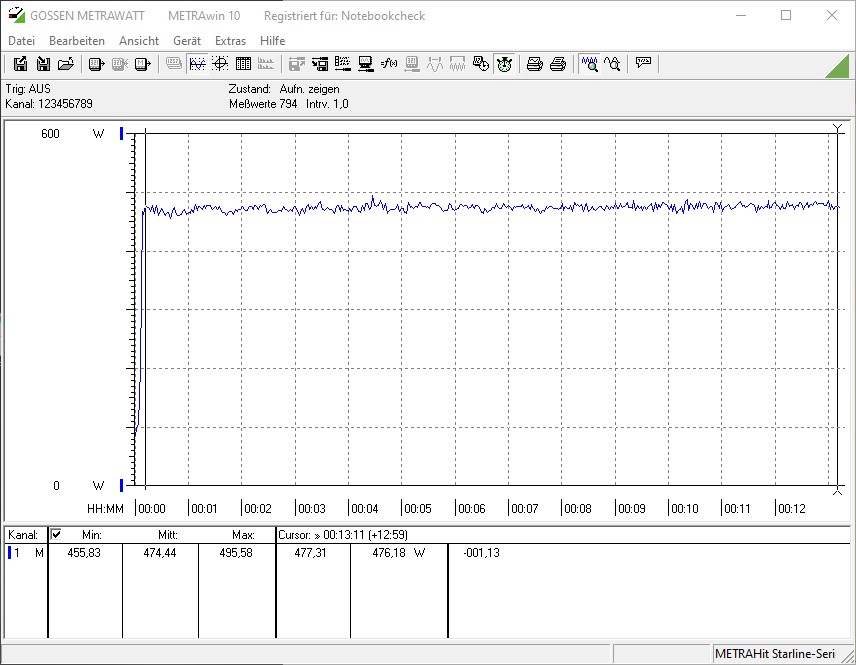
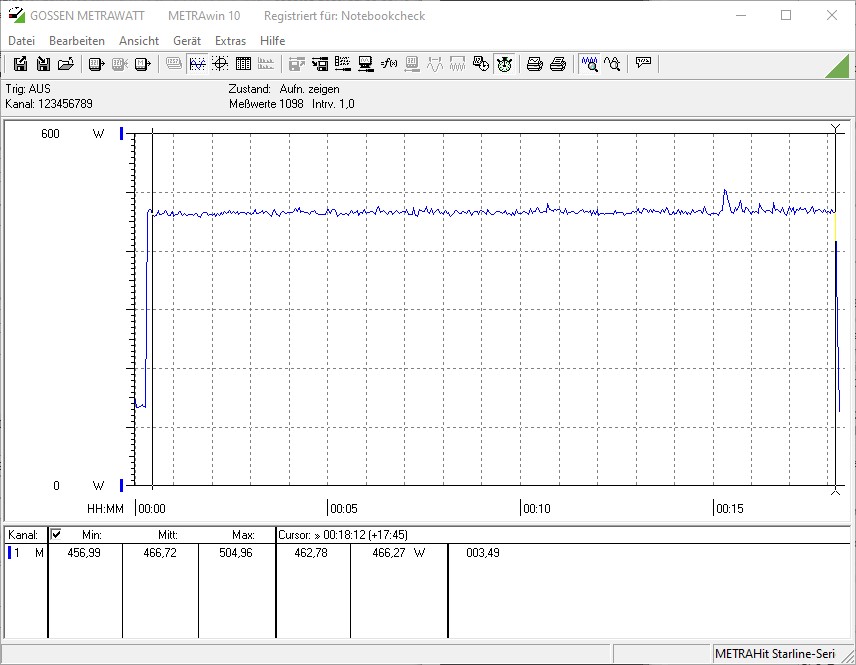
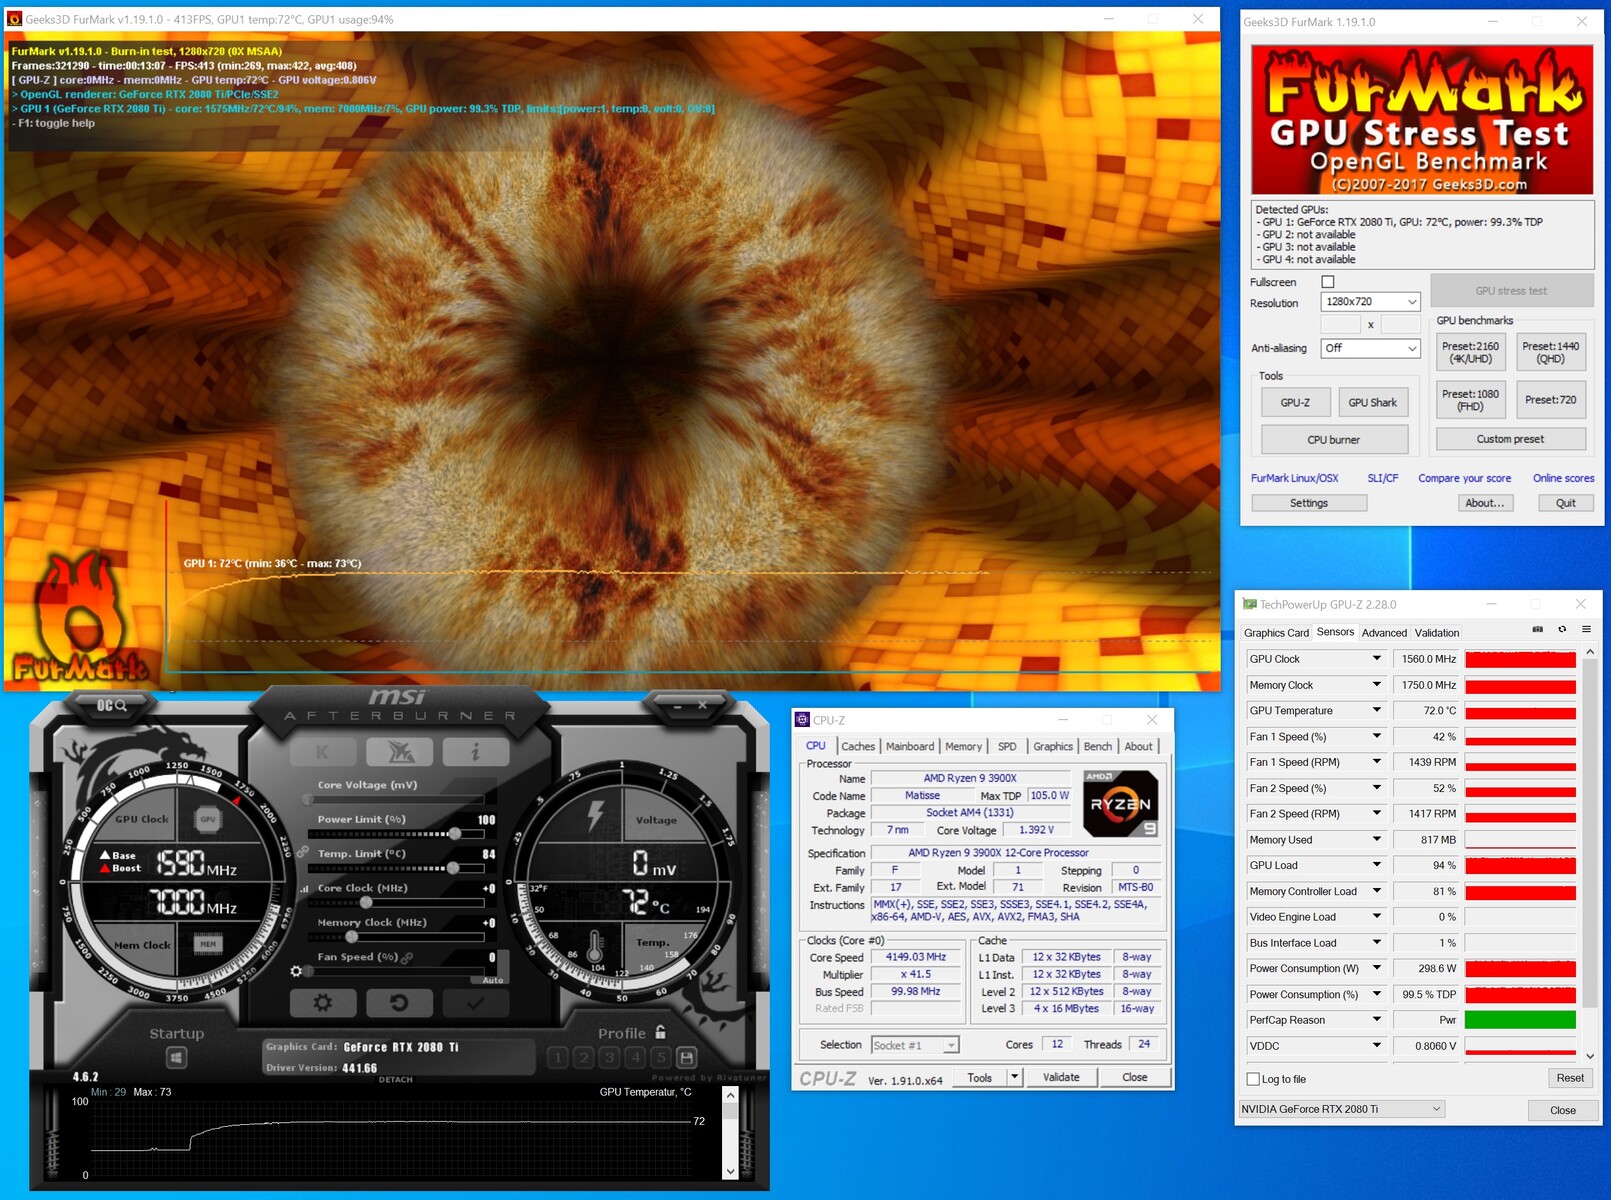
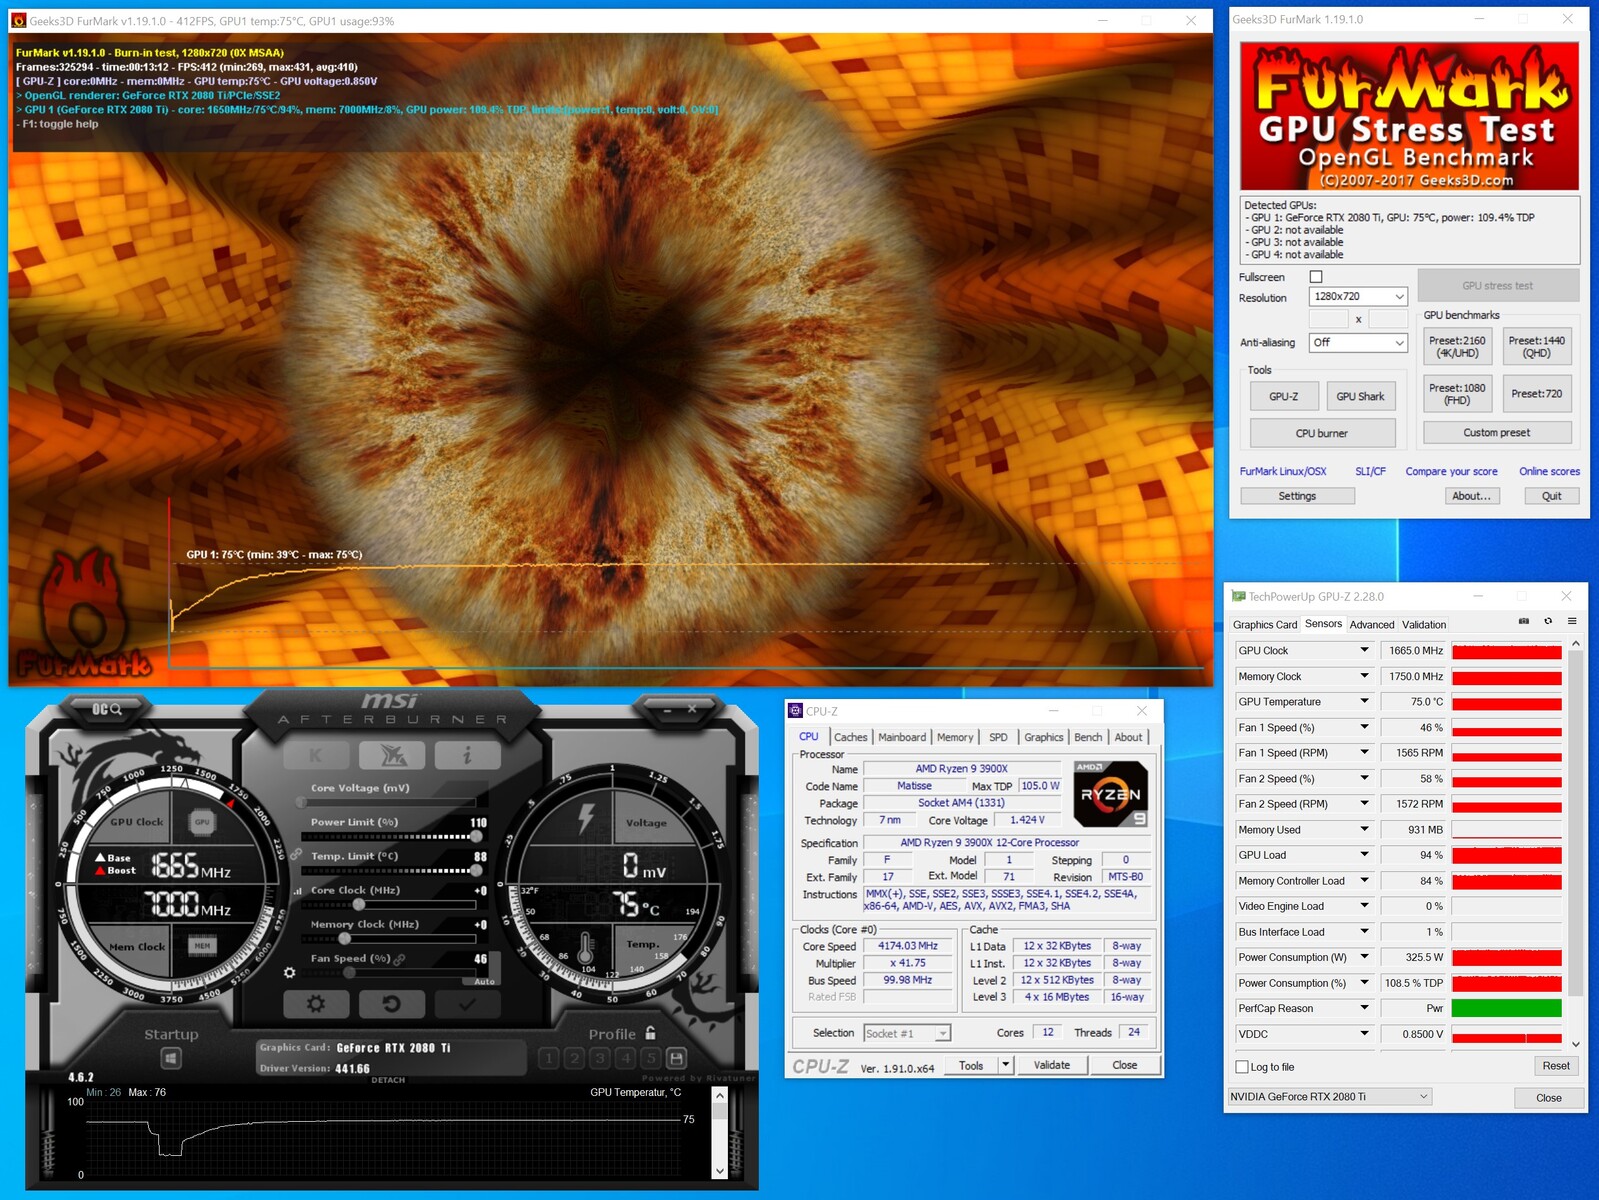
We measured our test unit consuming 87.8 W when idling and up to 488 W during a FurMark stress test. The system averaged 439.12 W during this test, for reference. These values do not include how much our monitor consumed too. GPU-Z confirms this and reports that the GPU consumes around 300 W alone. The utility also confirms that the card consumes 330 W at 110% PT. This value repeatedly fluctuates, though. Incidentally, the generously sized cooler manages core temperatures well. Our review unit averaged 72° C under load at 100% PT, while increasing the PT by 10% only resulted in a 3 °C core temperature increase.
Please note: We conducted all these tests in a closed case to best replicate how the Gaming X Trio should perform in most systems.
| Power Consumption | |
| 1920x1080 The Witcher 3 ultra (external Monitor) | |
| MSI RTX 2080 Ti Gaming X Trio (Idle: 87.8 W) | |
| KFA2 GeForce RTX 2080 Ti EX (Idle: 100.5 W) | |
| AMD Radeon RX Vega 64 (Idle: 74.3 W) | |
| MSI RTX 2080 Gaming X Trio (Idle: 87.78 W) | |
| Nvidia GeForce RTX 2080 Super (Idle: 78.87 W) | |
| AMD Radeon RX 5700 XT (Idle: 69.8 W) | |
| Nvidia GeForce RTX 2070 Super (96.8 fps, Idle: 80.5 W) | |
| MSI RTX 2070 Gaming Z 8G (Idle: 73.3 W) | |
| AMD Radeon VII (Idle: 81.39 W) | |
| Nvidia GeForce RTX 2060 Super (82.7 fps, Idle: 77.12 W) | |
| AMD Radeon RX 5700 (84.2 fps, Idle: 64.5 W) | |
| MSI RTX 2060 Gaming Z 6G (Idle: 74.66 W) | |
| 1280x720 FurMark 1.19 GPU Stress Test (external Monitor) | |
| MSI RTX 2080 Ti Gaming X Trio (Idle: 87.8 W) | |
| AMD Radeon VII (Idle: 81.39 W) | |
| MSI RTX 2080 Gaming X Trio | |
| KFA2 GeForce RTX 2080 Ti EX (Idle: 100.5 W) | |
| Nvidia GeForce RTX 2080 Super (Idle: 78.87 W) | |
| MSI RTX 2070 Gaming Z 8G (Idle: 73.3 W) | |
| AMD Radeon RX 5700 XT (239 fps, Idle: 69.8 W) | |
| Nvidia GeForce RTX 2070 Super (283 fps, Idle: 80.5 W) | |
| MSI RTX 2060 Gaming Z 6G (Idle: 74.66 W) | |
| Nvidia GeForce RTX 2060 Super (237 fps, Idle: 77.12 W) | |
| AMD Radeon RX 5700 (207 fps, Idle: 64.5 W) | |
* ... smaller is better
Overclocking - Plenty of potential thanks to a 330 W TDP
If you are not yet satisfied with the brute performance of the Gaming X Trio, then it still has more in its locker as we alluded to earlier. As a rule of thumb, the 110% PT corresponds with a 10% improvement in performance.
We were able to stably increase the boost clock of our review unit by 150 MHz. An 800 MHz increase on the VRAM proved possible, too.
It should go without saying that the Gaming X Trio is already a fast graphics card out of the box, so you need not rely on overclocking in most cases. It is good to have some reserves on tap should you ever need them, though.


Pros
Cons
Verdict - A top GPU with the performance to match
Overall, if you are looking for the fastest desktop graphics card on the market, then you will stumble upon the GeForce RTX 2080 Ti sooner or later. The Gaming X Trio is one of the fastest versions of the series too, which our review unit confirmed during our tests. While the Gaming X Trio makes for an extremely expensive purchase at 1,300 Euros (~$1,439), it is significantly cheaper than the TITAN RTX, which NVIDIA does not aim at gamers.
Our review unit remains untroubled when pushing 330 W, underlining the effectiveness of the huge heat sink and three axial fans with which MSI has equipped the Gaming X Trio. There is even RGB onboard to keep your eyes occupied too.
The MSI GeForce RTX 2080 Ti Gaming X Trio is a supremely fast graphics card designed for the uncompromising high-end gamer.
Despite everything, the price of the Gaming X Trio may put some people off. Cheaper versions of the RTX 2080 Ti start at just under 1,000 Euros (~$1,107), making MSI's card a comparatively expensive purchase. Ultimately, one must judge whether the factory overclocking and RGB lighting justify the surcharge or not.
In short, the MSI GeForce RTX 2080 Ti Gaming X Trio delivered on its potential. The card performed well during our tests, and it is one of the few options for 4K gamers. We would like to commend the 36-month warranty that MSI includes too, which is longer than many of its peers.
Please see our continually updated GeForce RTX 2080 Ti page for a full list of benchmarks and test results.

