MSI GE65 Raider 9SF Laptop Review: Huge Improvements Over the GE63
The upper mid-range MSI GE65 sits in between the cheaper MSI GL series and the pricier MSI GT series of gaming laptops. It directly supplants the GE63 with revised internal options and a brand new chassis design. More specifically, the newer model introduces narrow bezels for increased portability while dropping the GeForce RTX 2080 option in favor of the RTX 2060 or RTX 2070 only.
Two major SKUs are available as of this writing: the GE65 9SF and GE65 9SE with a Core i7-9750H or Core i9-9880H CPU, RTX 2060 or 2070 graphics, up to 64 GB of RAM, and the choice between a 144 Hz or 240 Hz 1080p IPS display. Direct competitors include other upper mid-range gaming laptops like the Lenovo Legion Y740, HP Omen 15, Asus ROG Strix III or Hero III, Aorus 15, or the Dell Gaming G7 series.
More MSI reviews:
Rating | Date | Model | Weight | Height | Size | Resolution | Price |
|---|---|---|---|---|---|---|---|
| 84.7 % v7 (old) | 12 / 2019 | MSI GE65 Raider 9SF-049US i9-9880H, GeForce RTX 2070 Mobile | 2.3 kg | 26.9 mm | 15.60" | 1920x1080 | |
| 84.8 % v7 (old) | 10 / 2019 | Lenovo Legion Y740-15ICHg i7-9750H, GeForce RTX 2070 Max-Q | 2.3 kg | 25 mm | 15.60" | 1920x1080 | |
| 83 % v7 (old) | 09 / 2019 | Alienware m15 R2 P87F i7-9750H, GeForce RTX 2080 Max-Q | 2.2 kg | 18.3 mm | 15.60" | 1920x1080 | |
| 81.1 % v7 (old) | 11 / 2019 | Maingear Vector 15 i7-9750H, GeForce GTX 1660 Ti Mobile | 1.9 kg | 19.8 mm | 15.60" | 1920x1080 | |
| 84.4 % v7 (old) | 08 / 2019 | Asus Strix GL531GV-PB74 i7-9750H, GeForce RTX 2060 Mobile | 2.4 kg | 25.9 mm | 15.60" | 1920x1080 |
Case
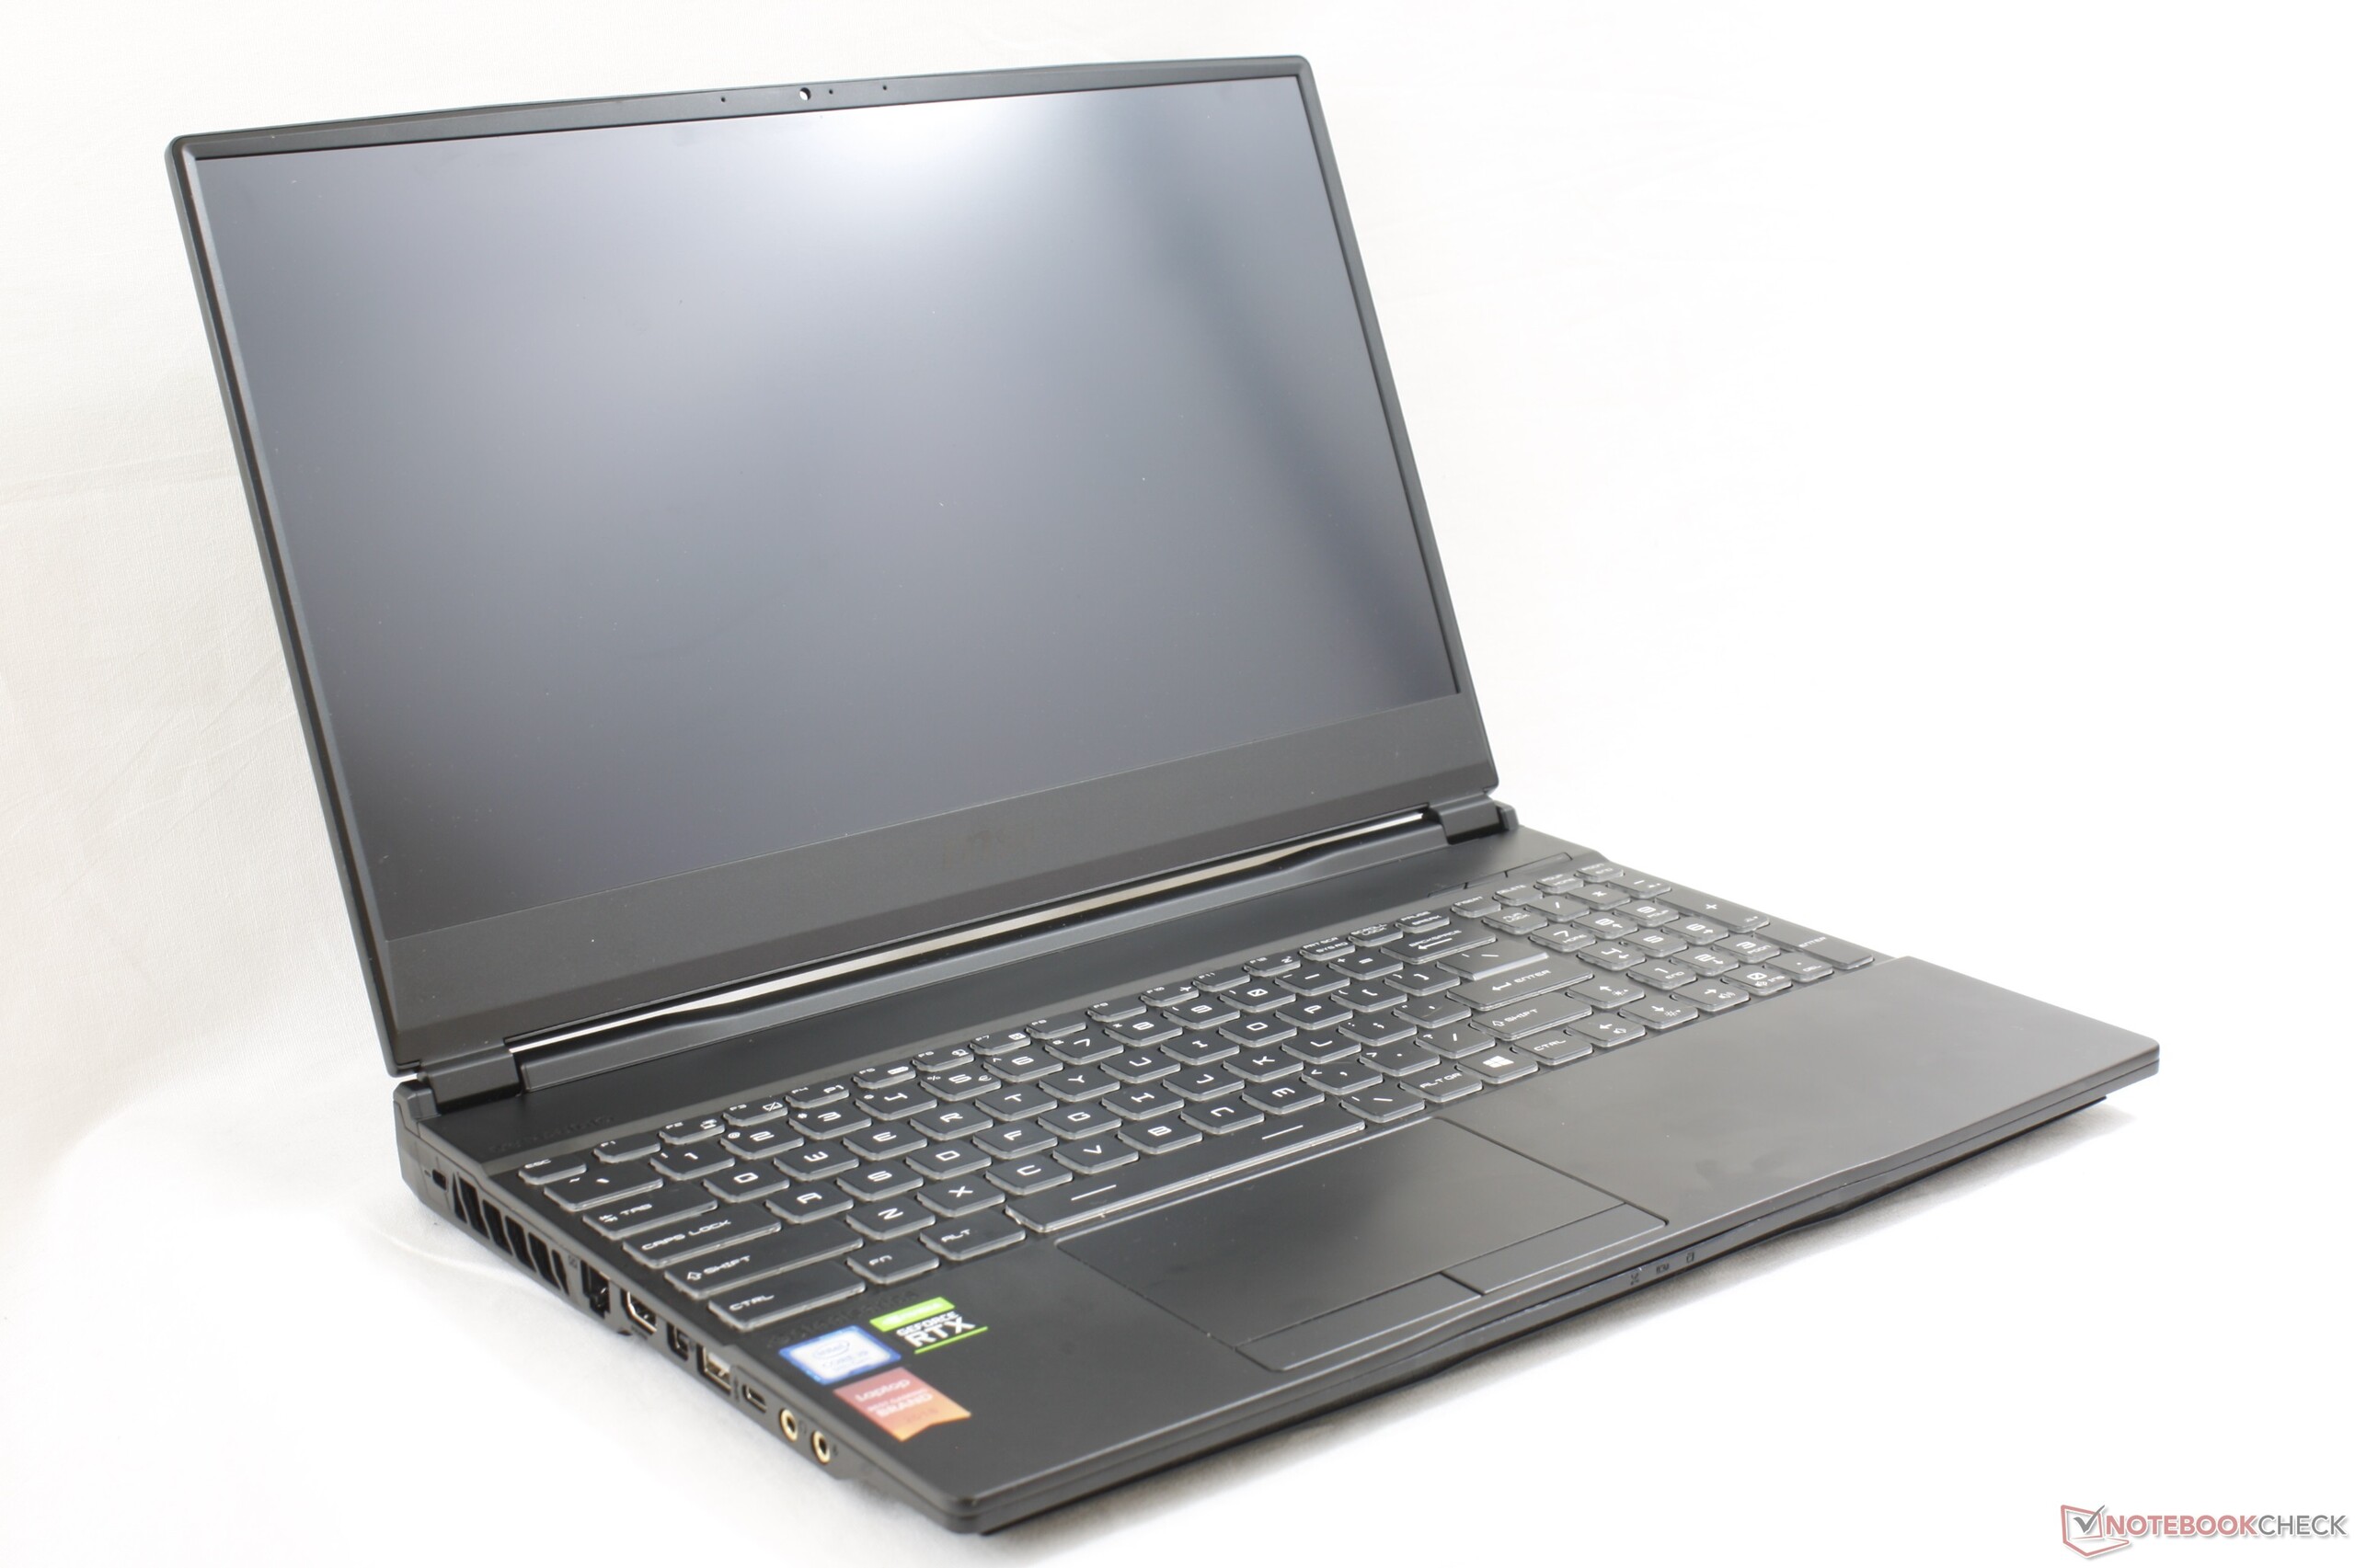
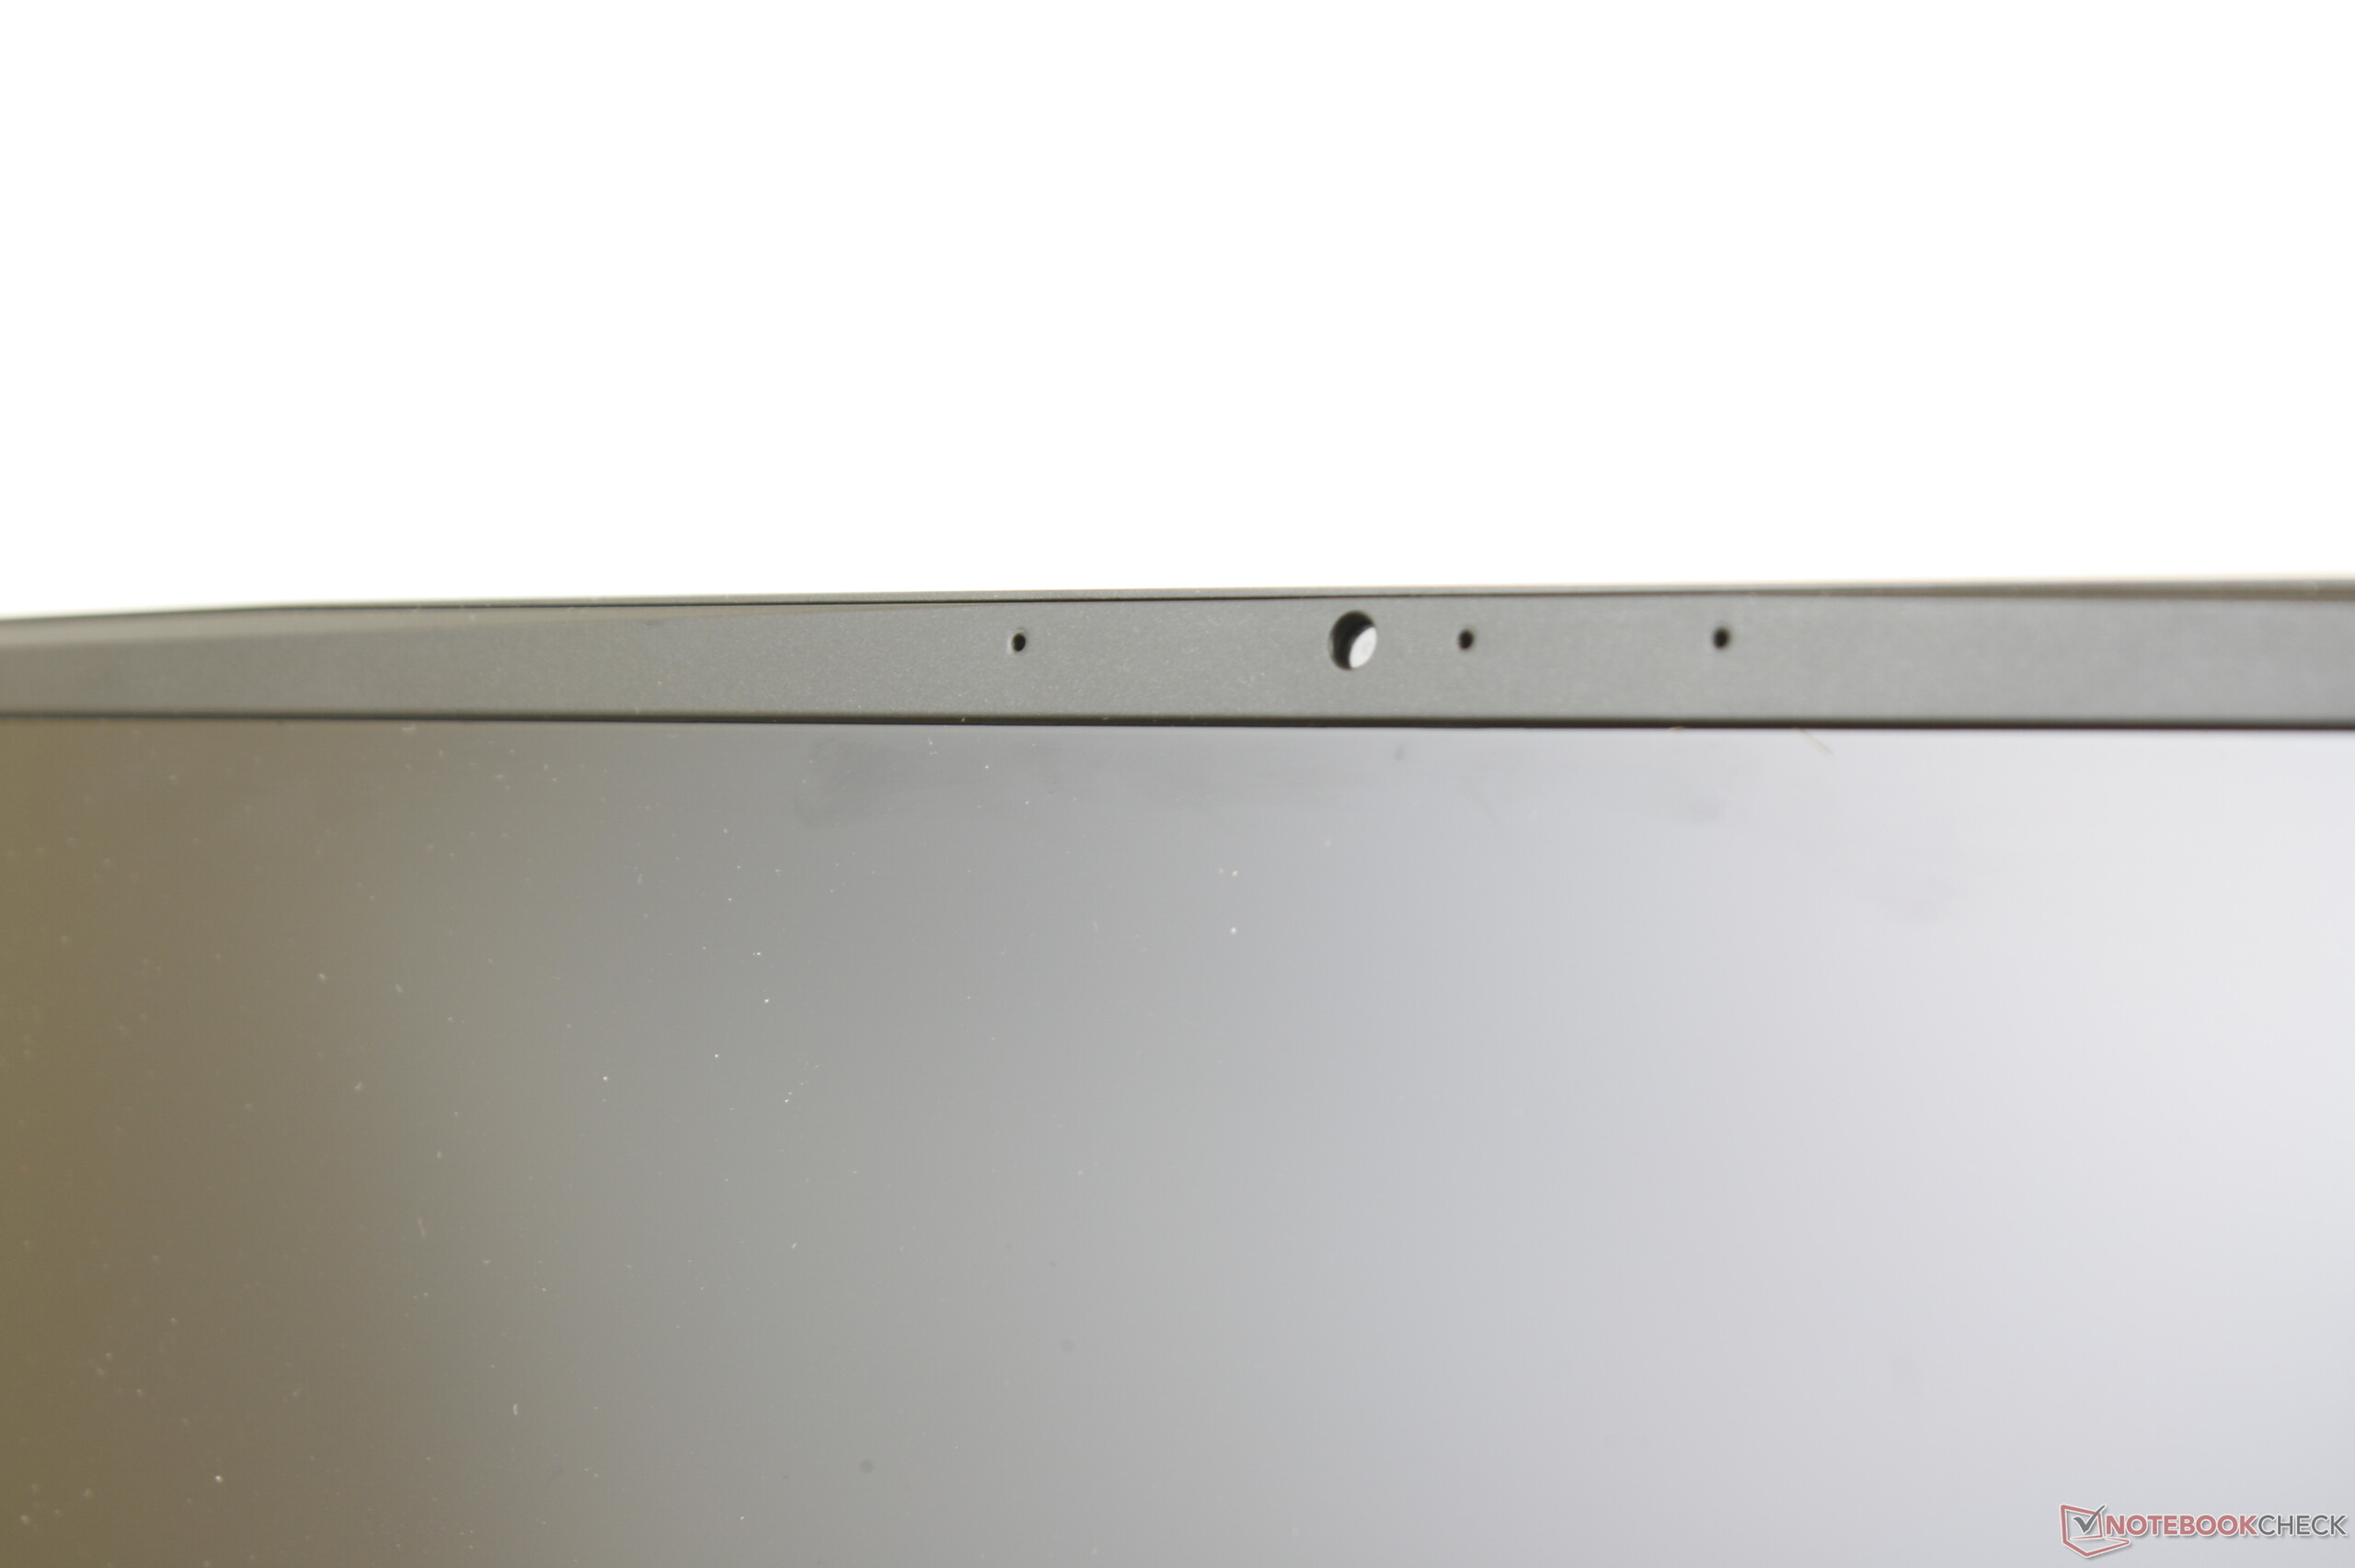
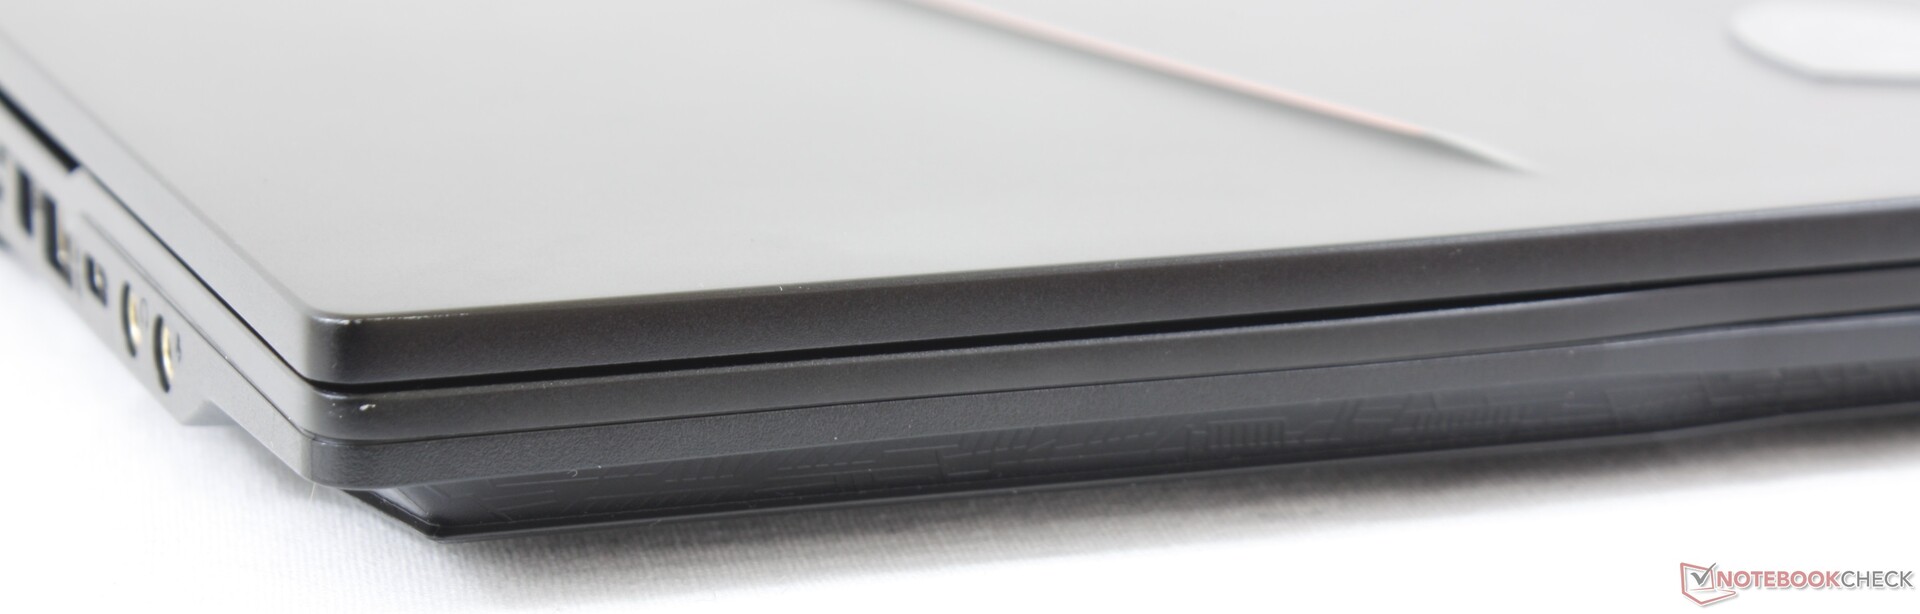
One of our main complaints about the older GE63 was its large size. The thick chassis looked outdated when compared to even the budget HP Pavilion Gaming 15 which was a bit embarrassing for a mid-range gaming laptop from MSI. The latest GE65 addresses this by switching to a new display panel in order to minimize the bezels. Webcam positioning is preserved unlike on the Asus ROG Strix or Hero series while the rest of the laptop retains the look of the GE63.
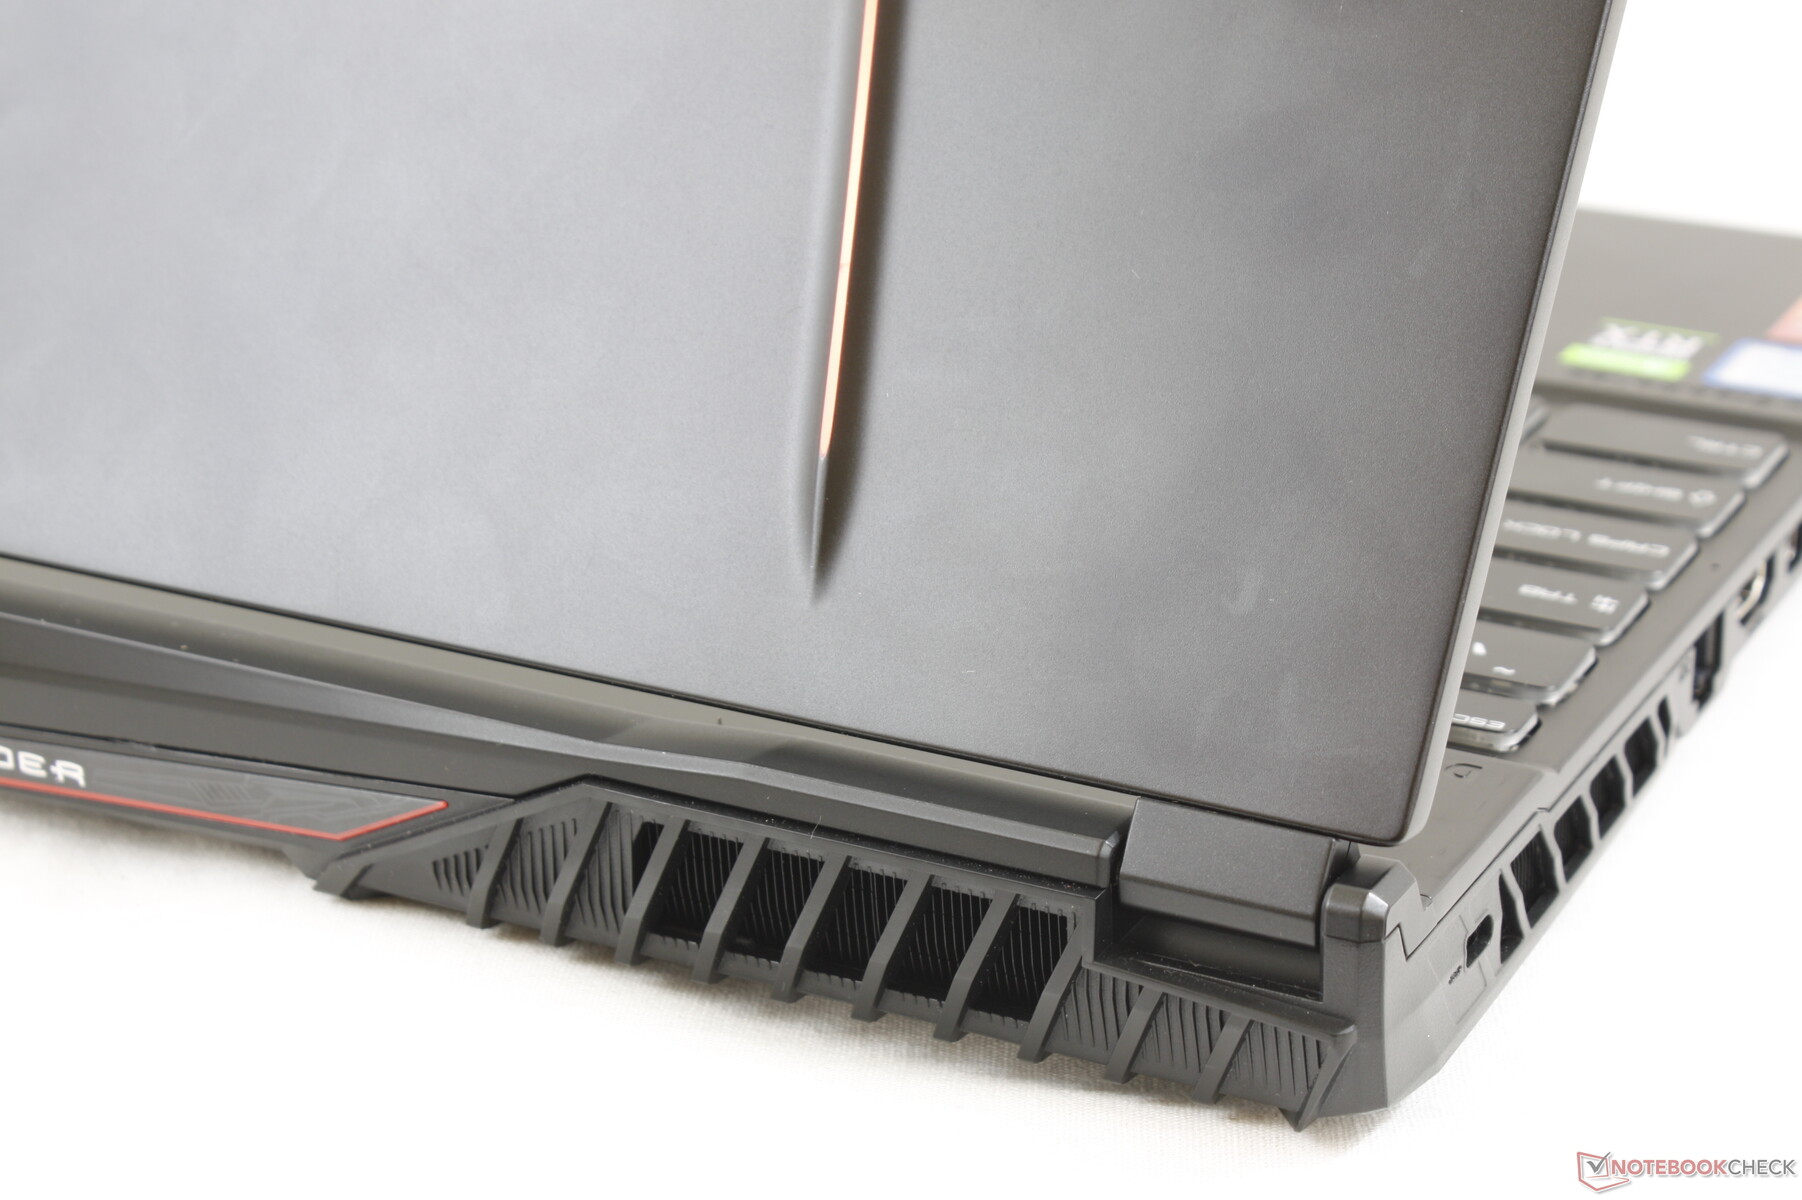
There is some room for improvement. The bottom bezel, for example, is still very thick in relation to the three other sides. The chassis doesn't feel as firm or solid as on the Alienware m15 R2 or the aforementioned Asus alternatives, either. The lid of the GE65 is a bit more flexible while the base exhibits slight-but-audible creaking when attempting to twist its sides. We suspect that the creaking occurs because the busy chassis consists of many smaller pieces as opposed to the flatter, cleaner, and more unibody approach of the Asus ROG Strix or Hero.
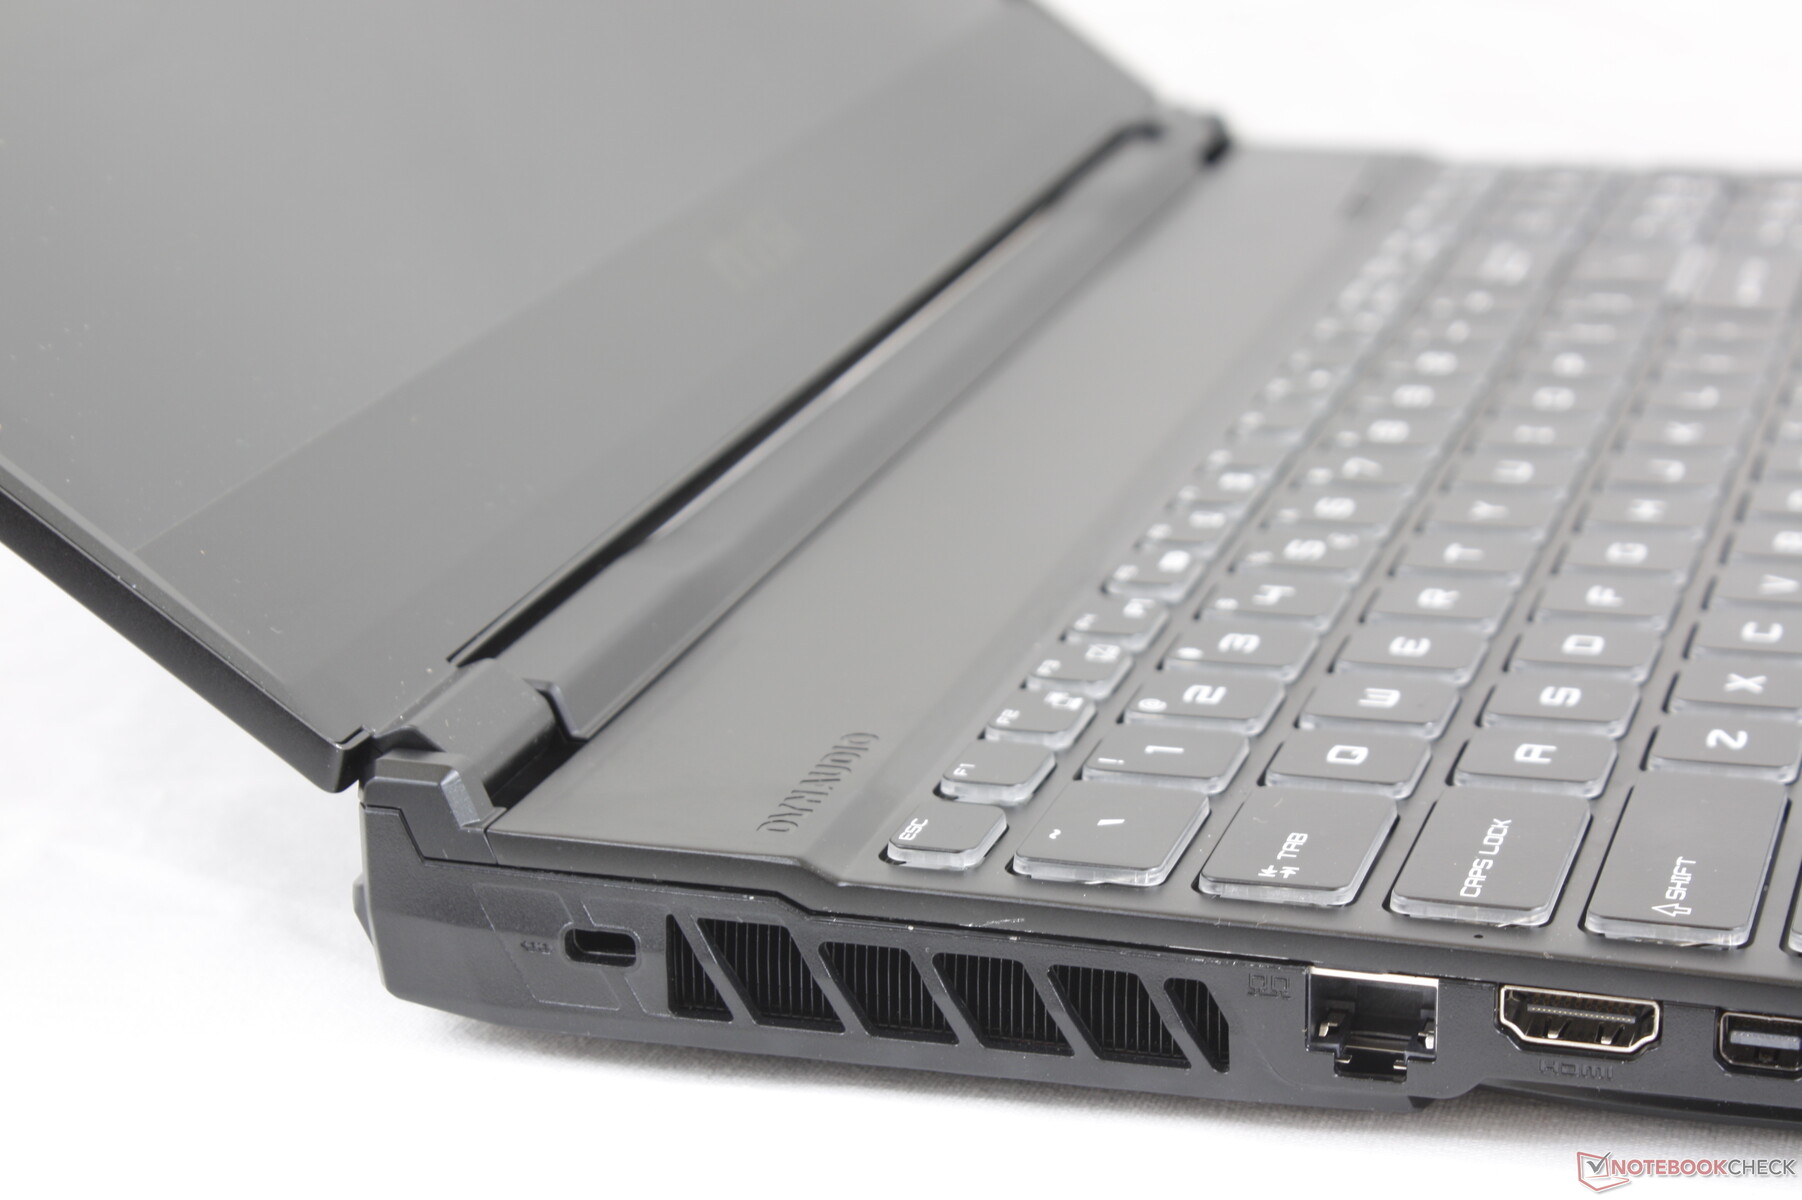
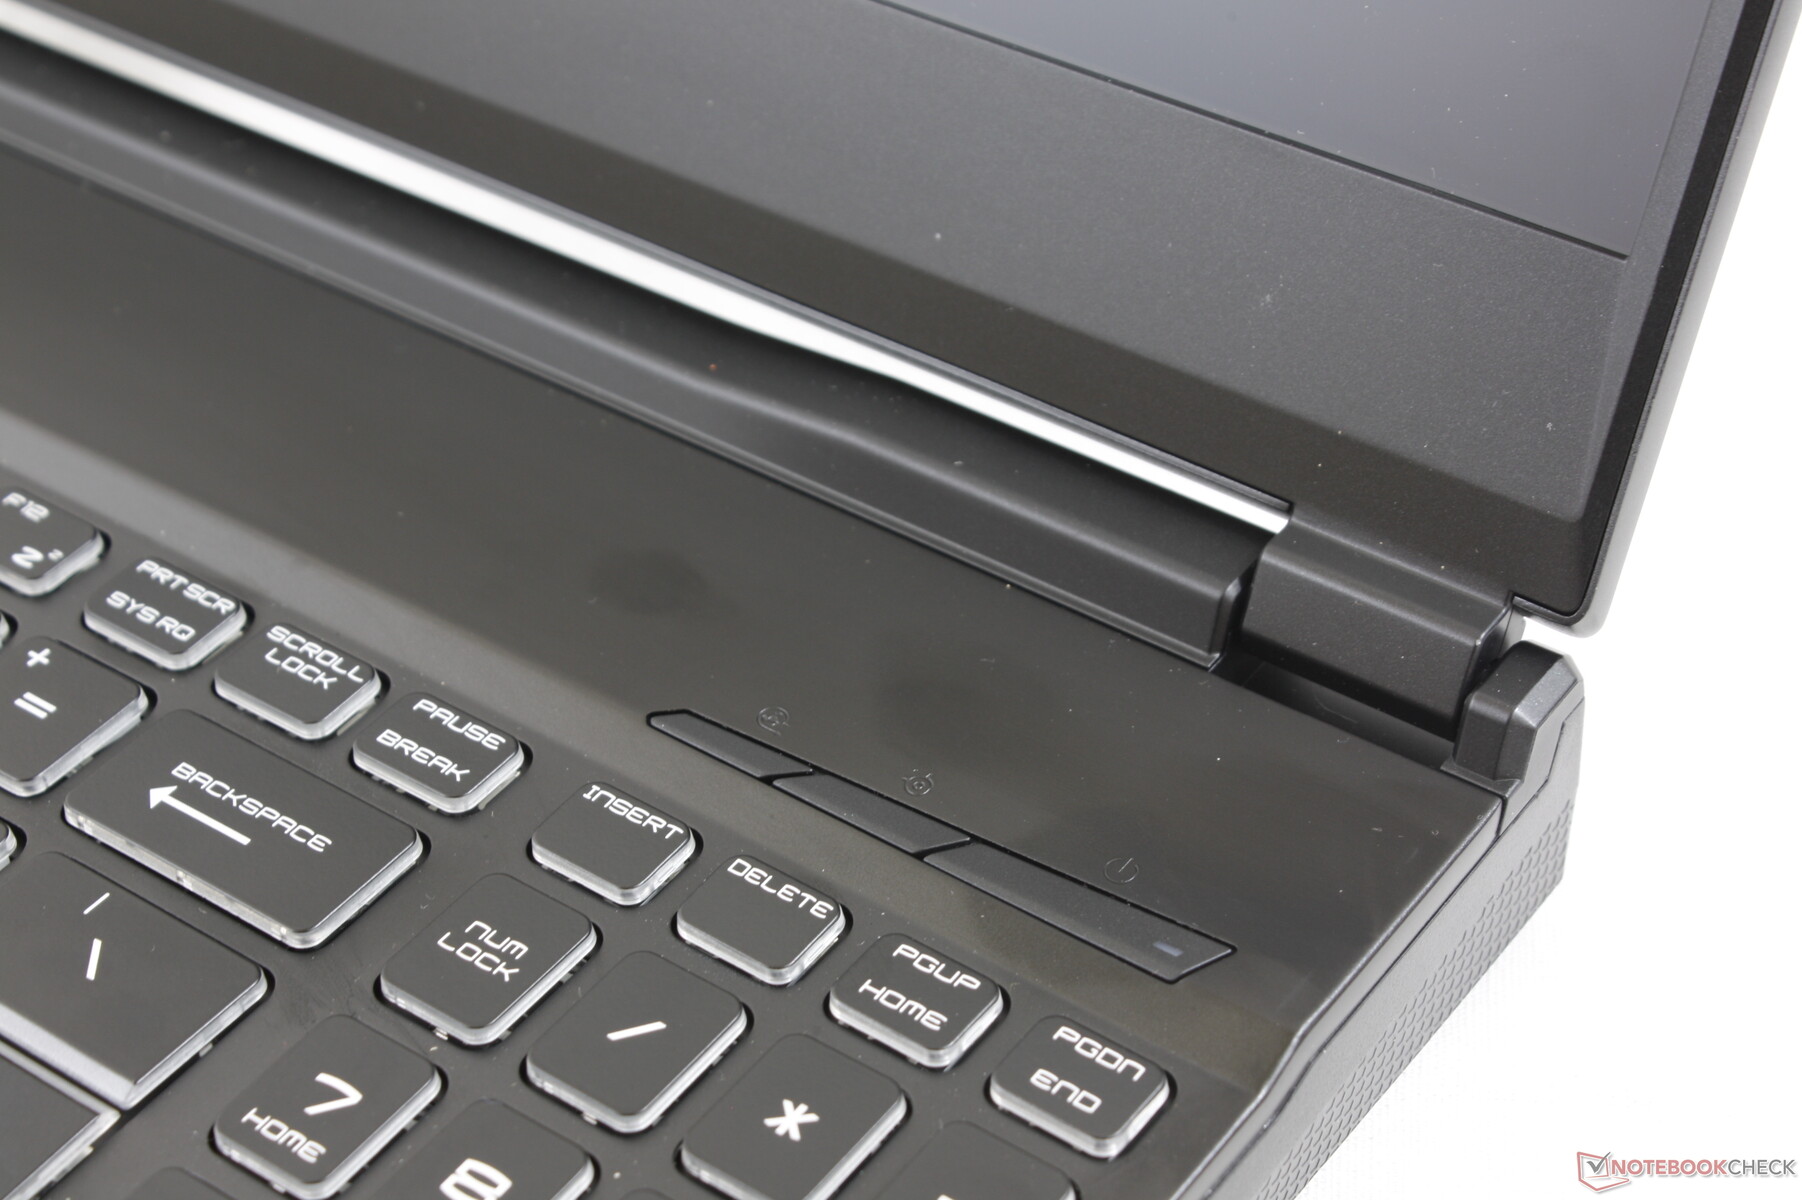
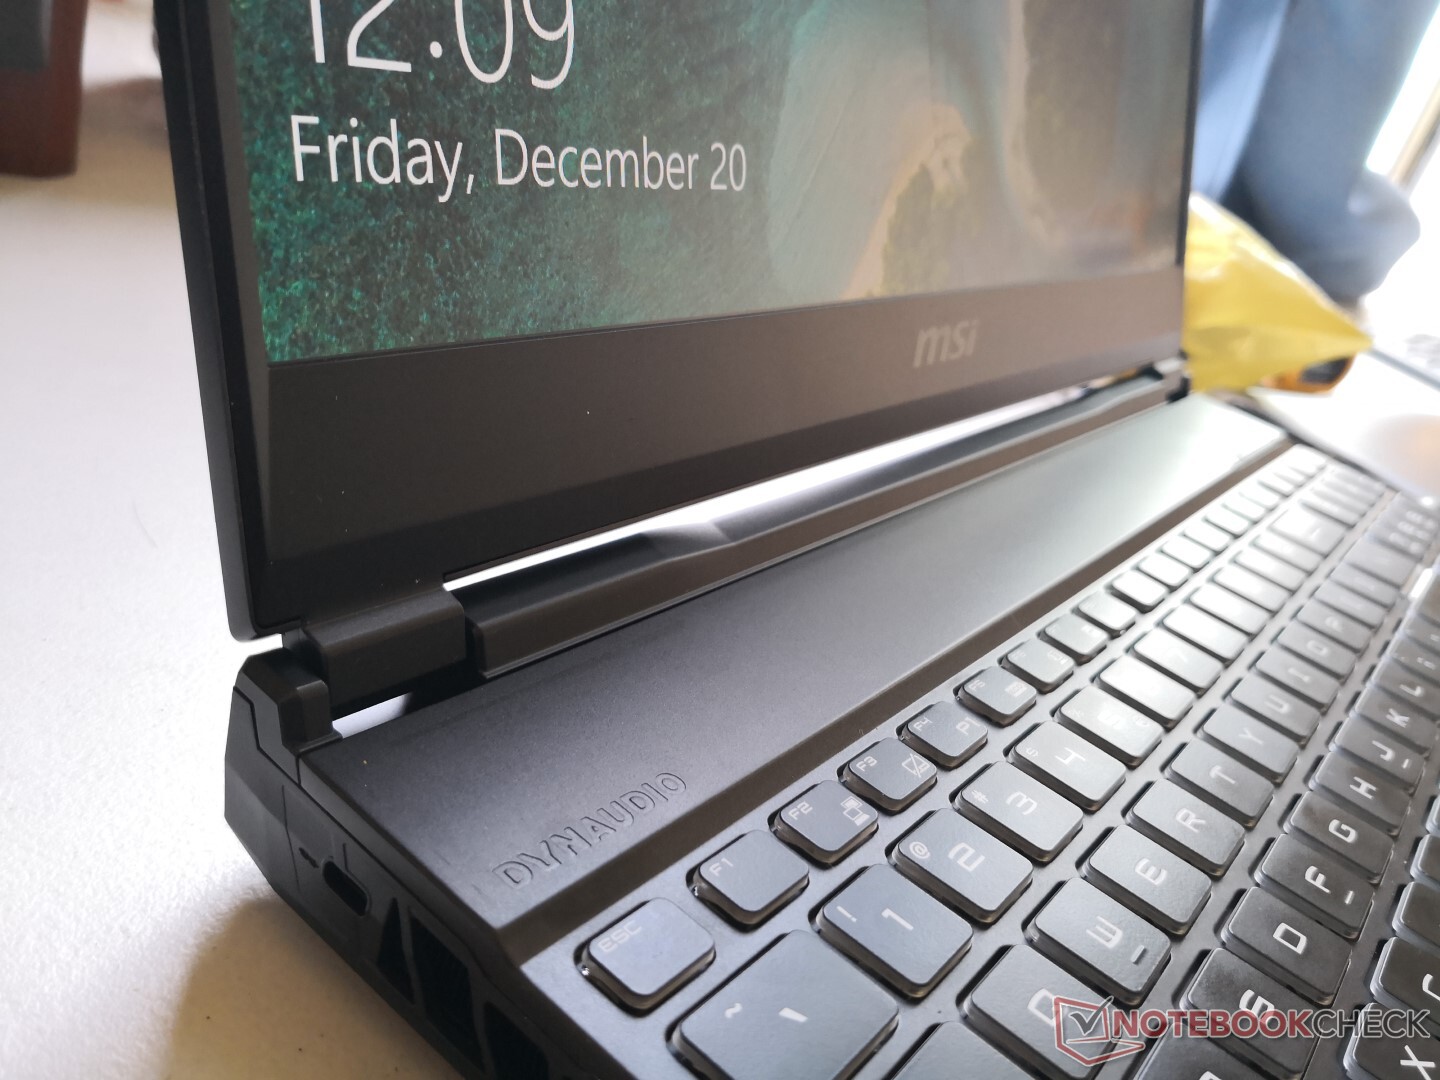
The dual hinges are different than on the GE63 as they even smaller this time around. While sufficiently firm at all angles with almost no teetering when typing, the hinges don't give a sense of longevity because of their size.
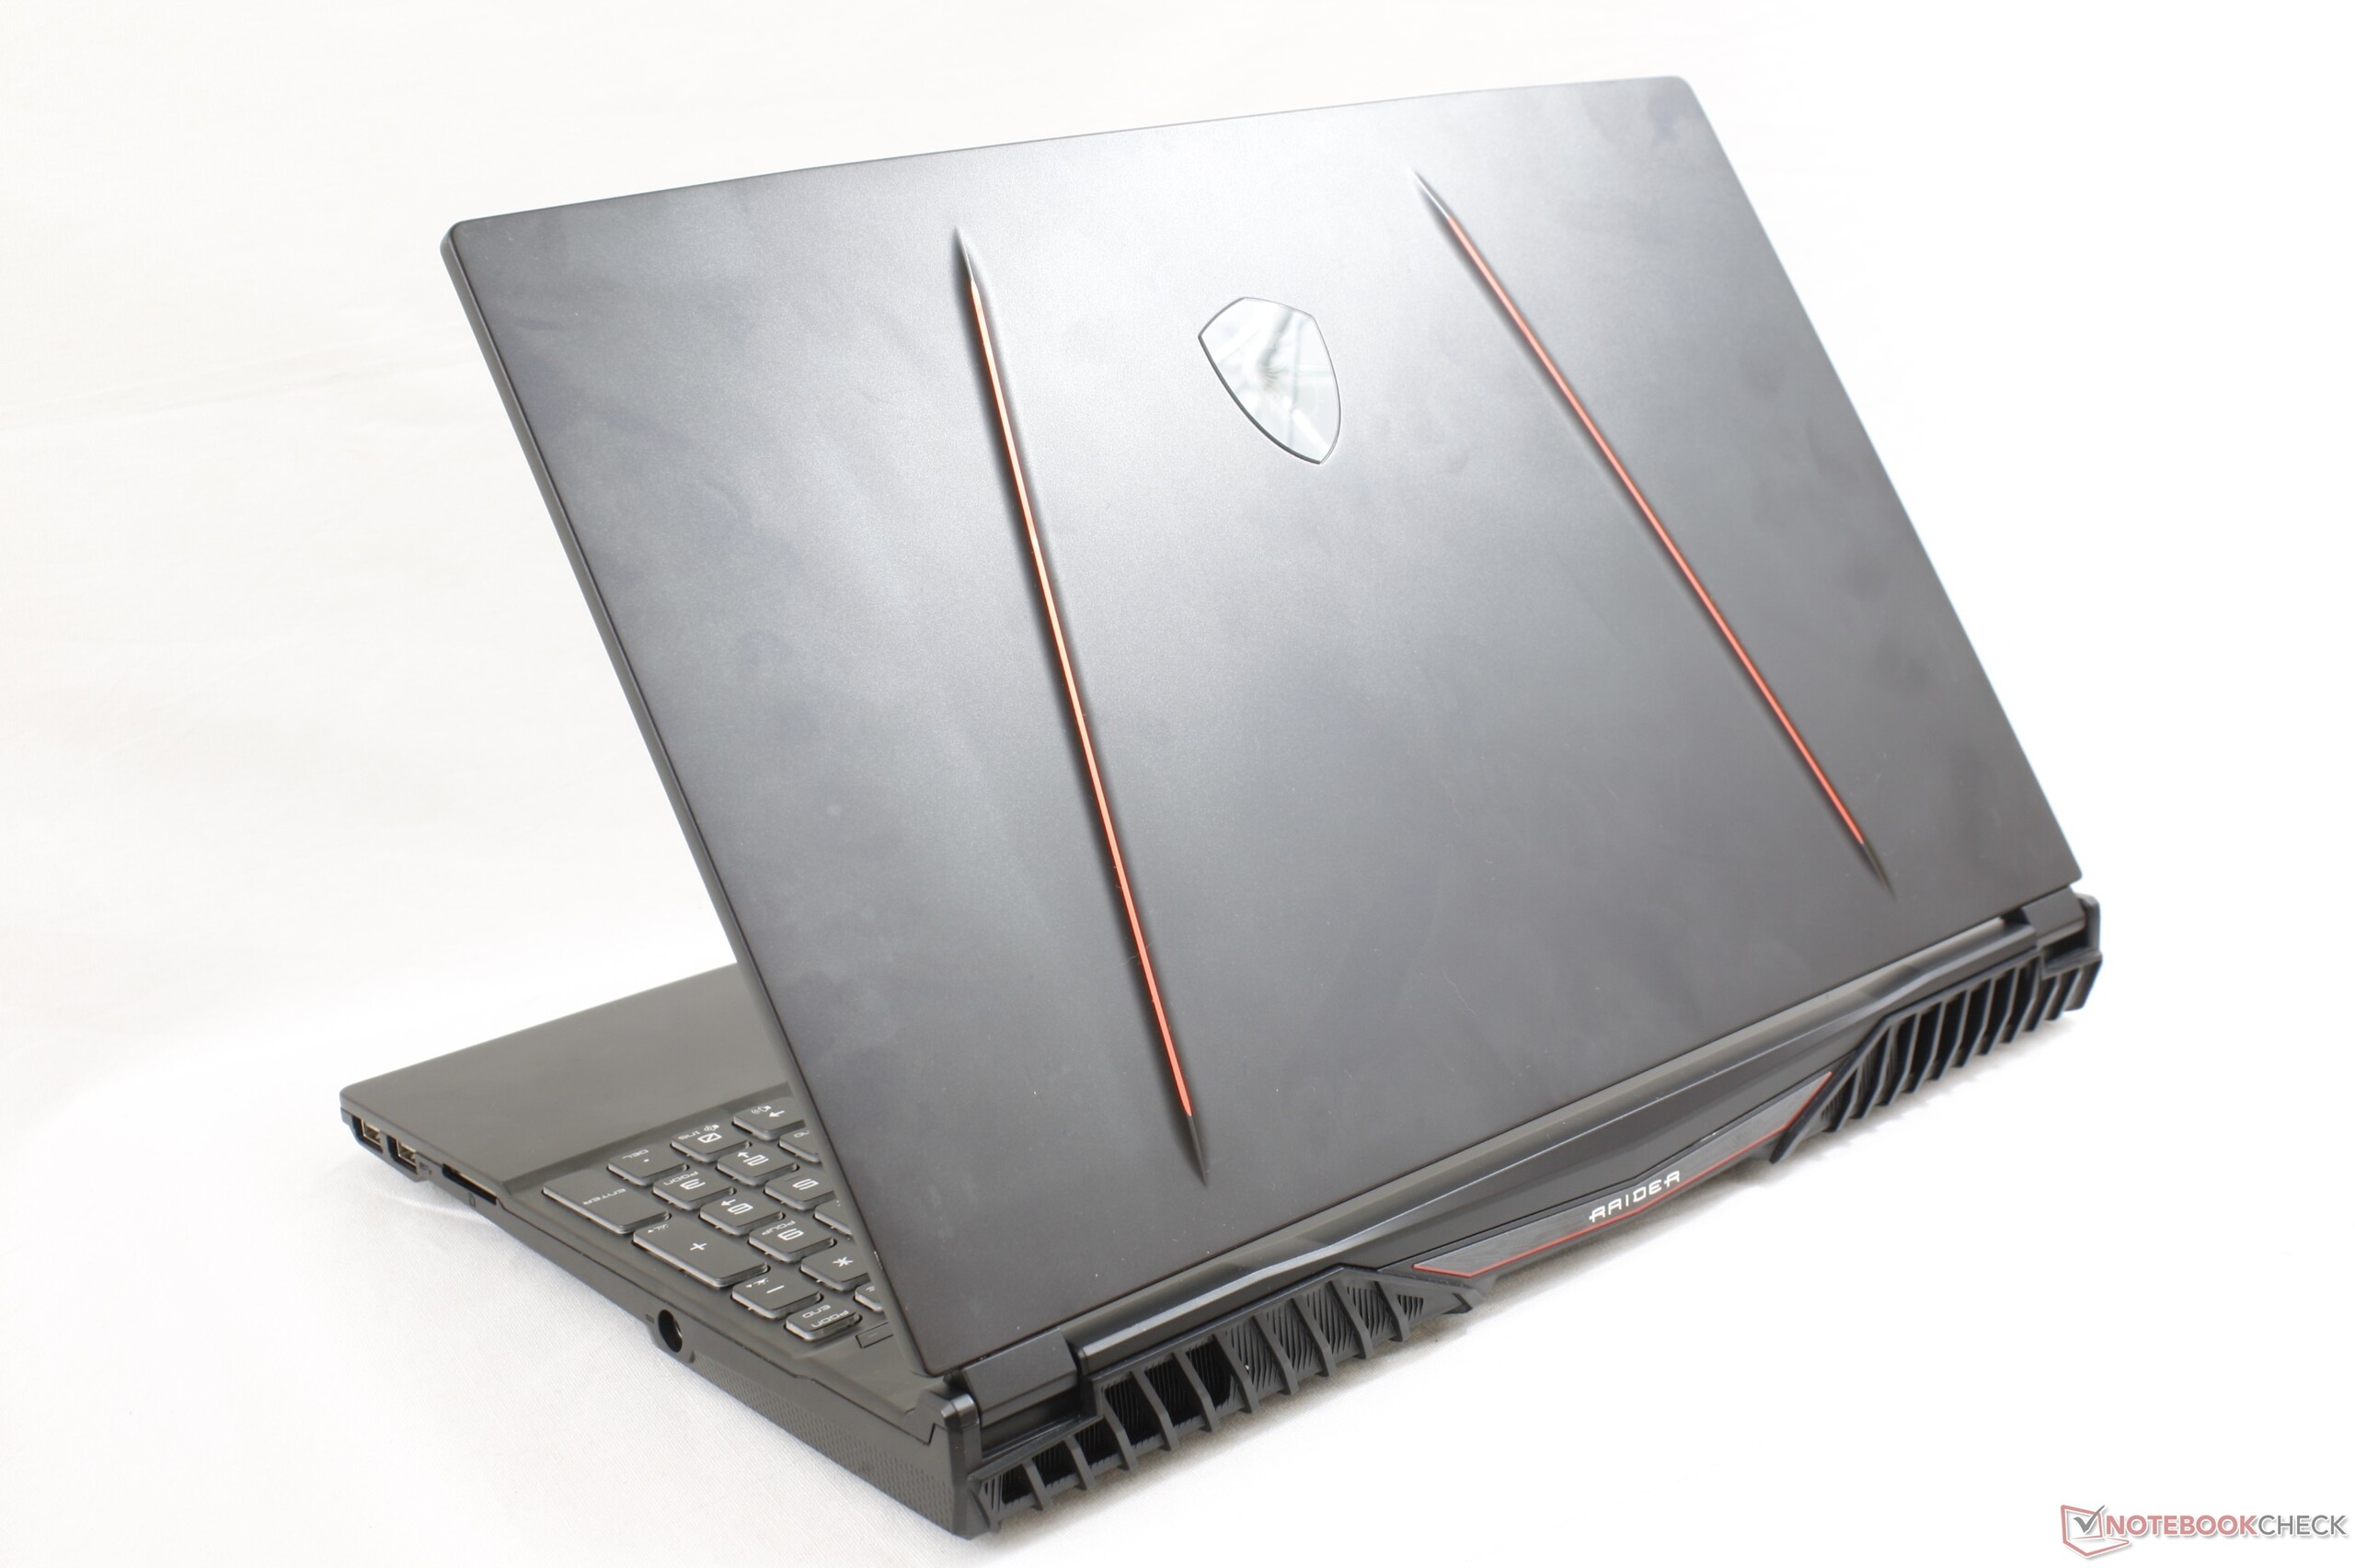
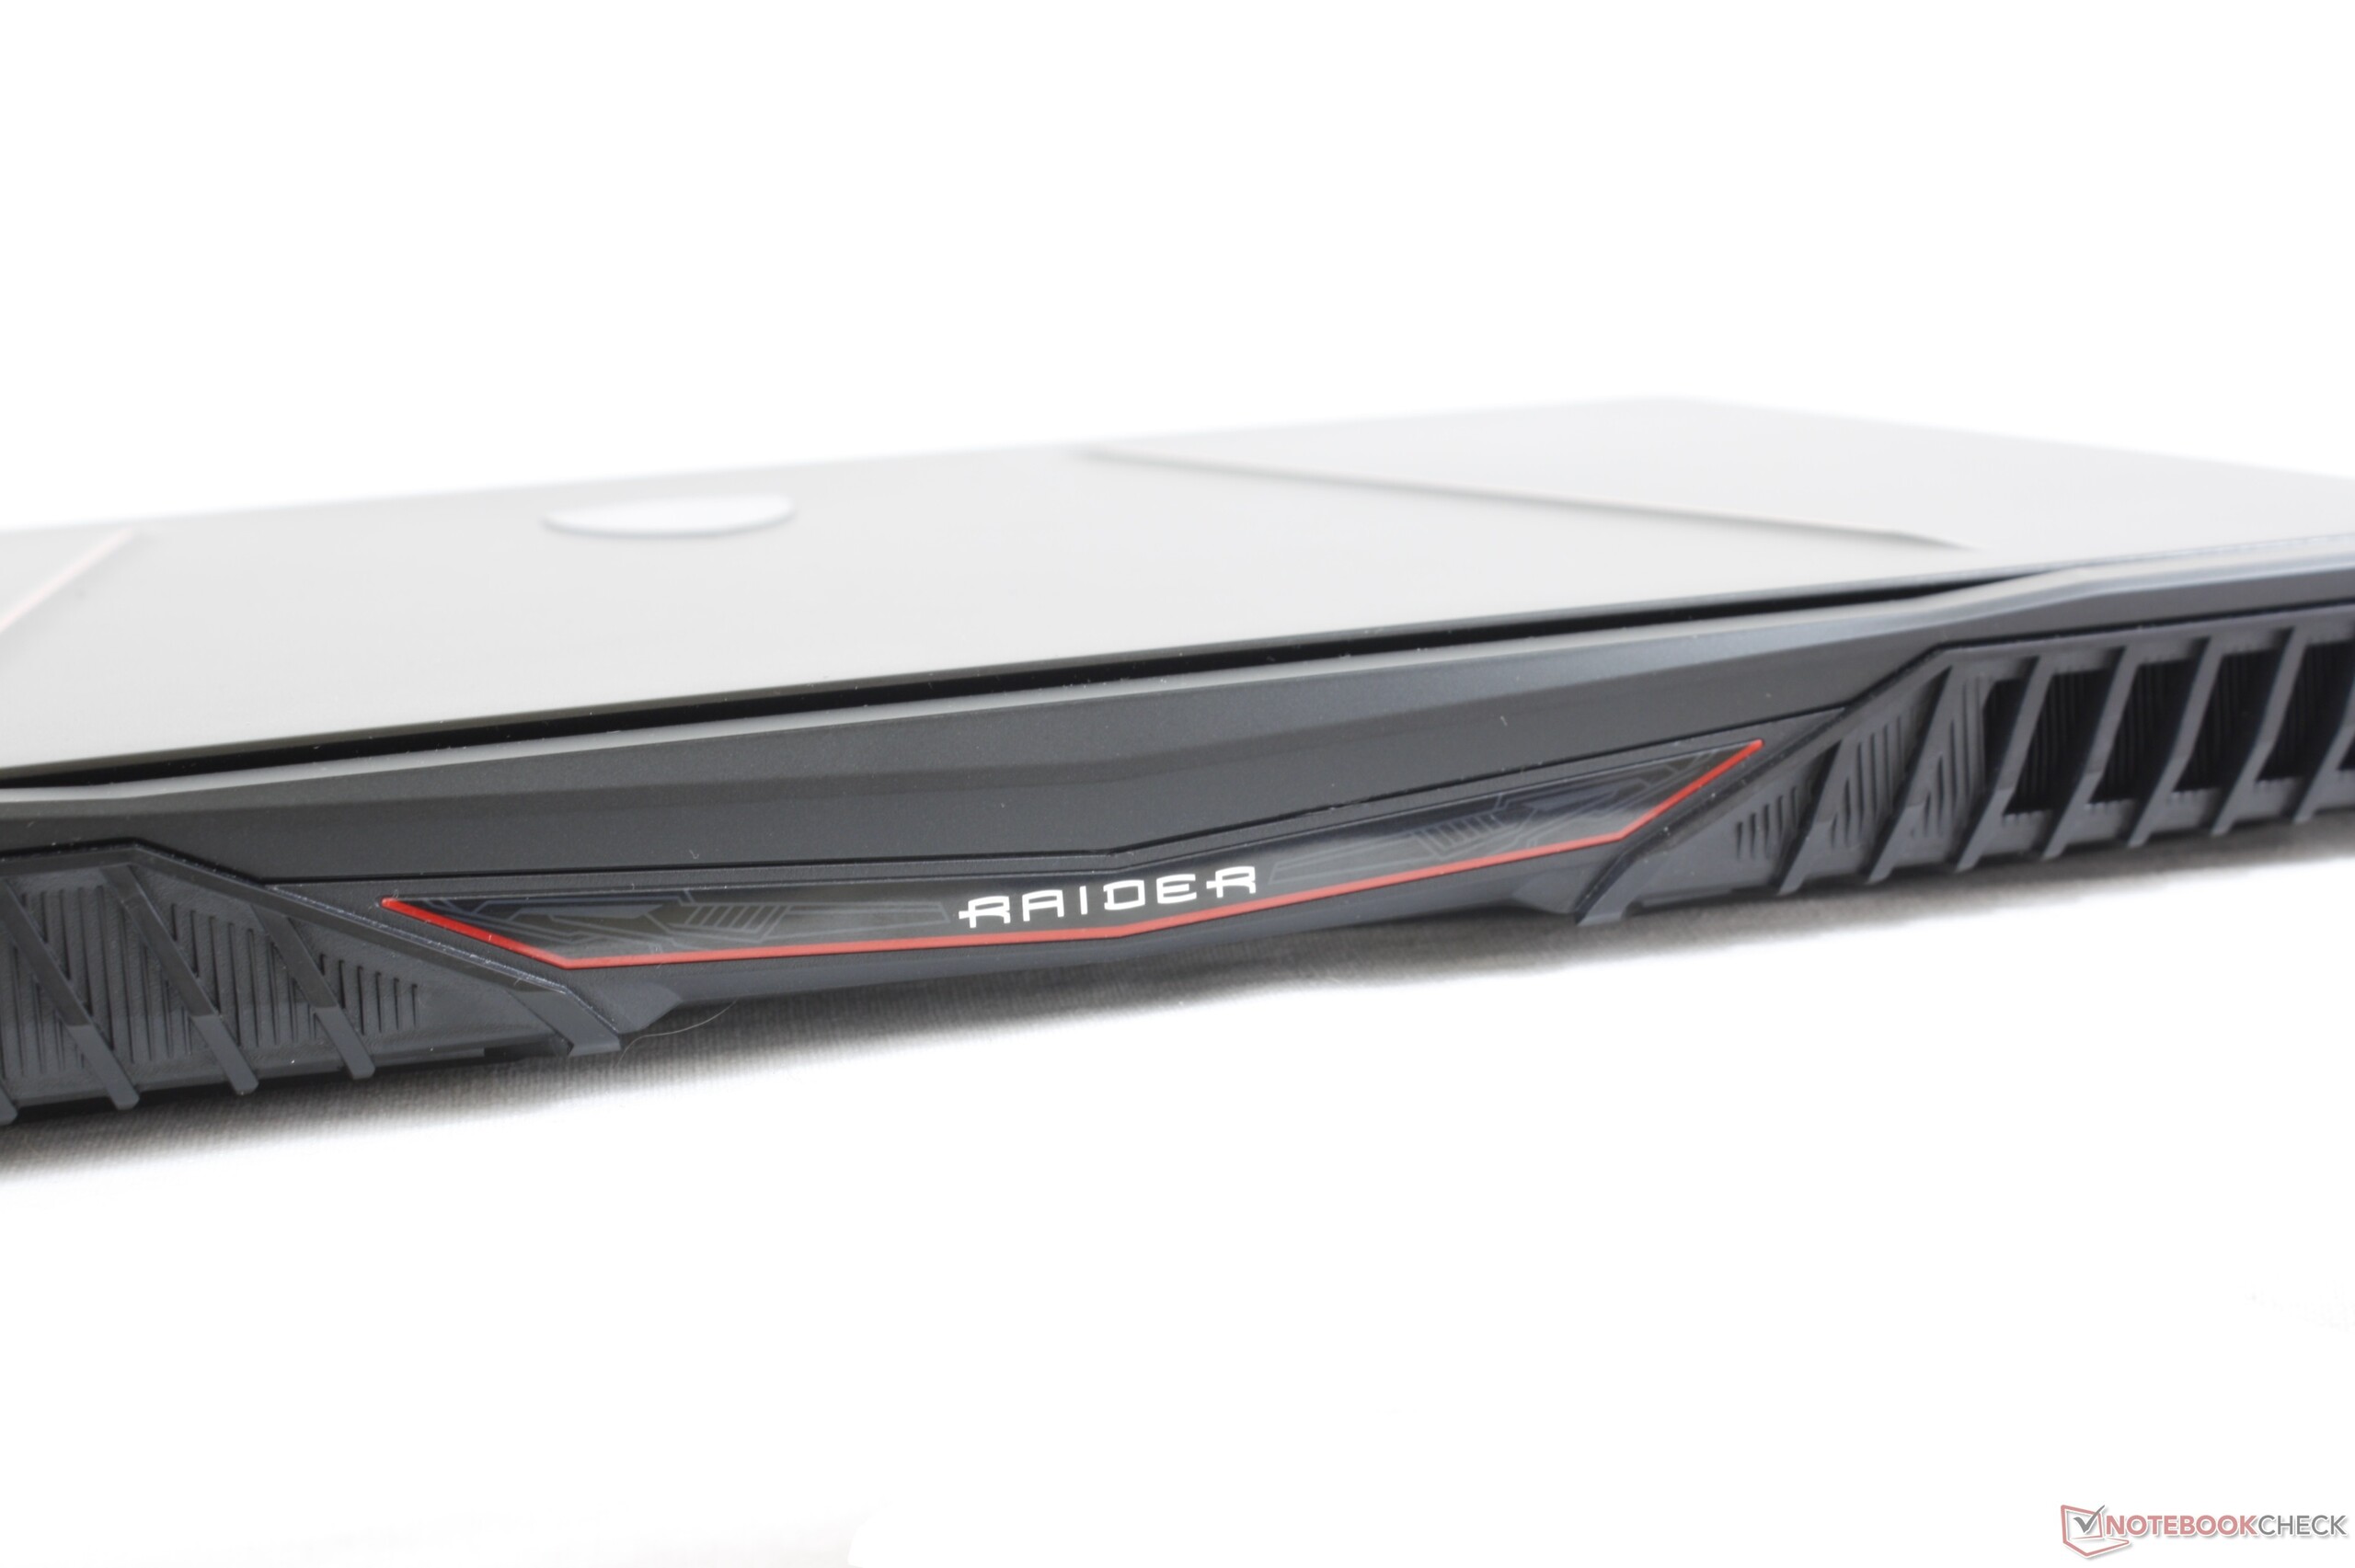
A defining characteristic of the GE65 is its small footprint when compared to most other 15.6-inch gaming laptops. In fact, its length and width are essentially the same as the more expensive MSI GS65 while weighing about 300 g more. The relatively thick 26.9 mm profile, however, gives the GE65 a noticeably boxier look than the super-thin Razer Blade series or Asus Zephyrus.
Connectivity
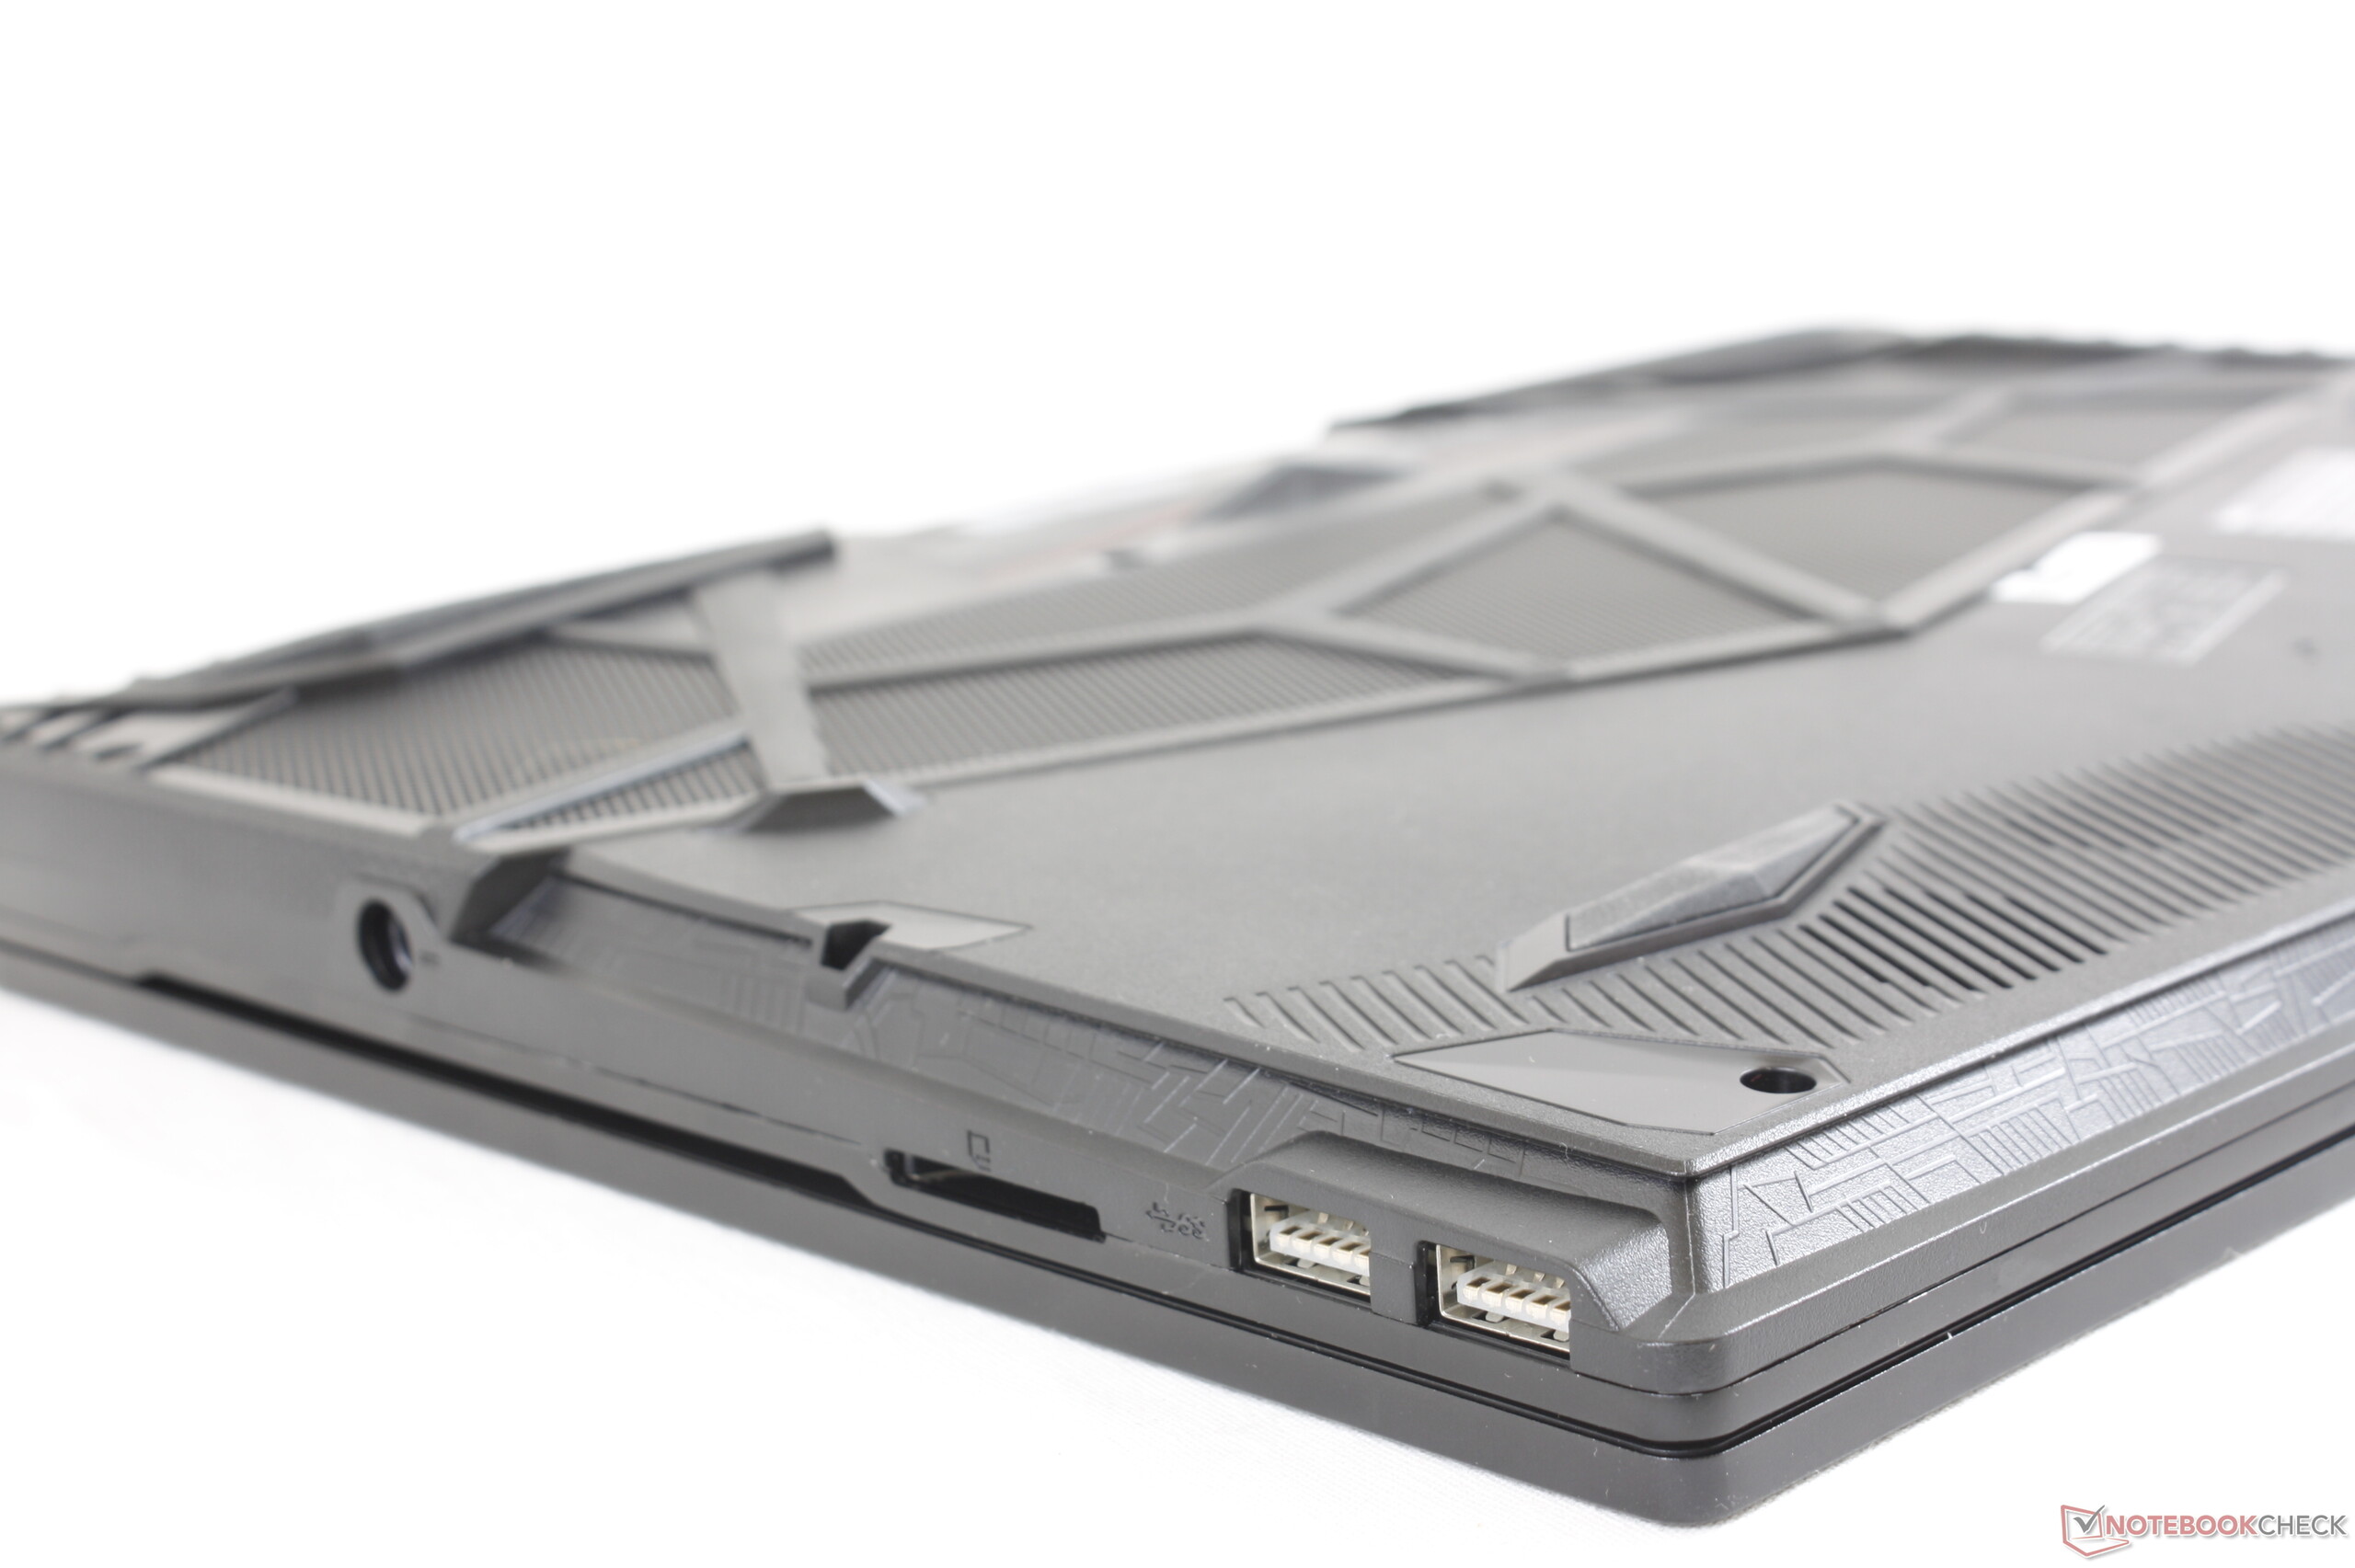
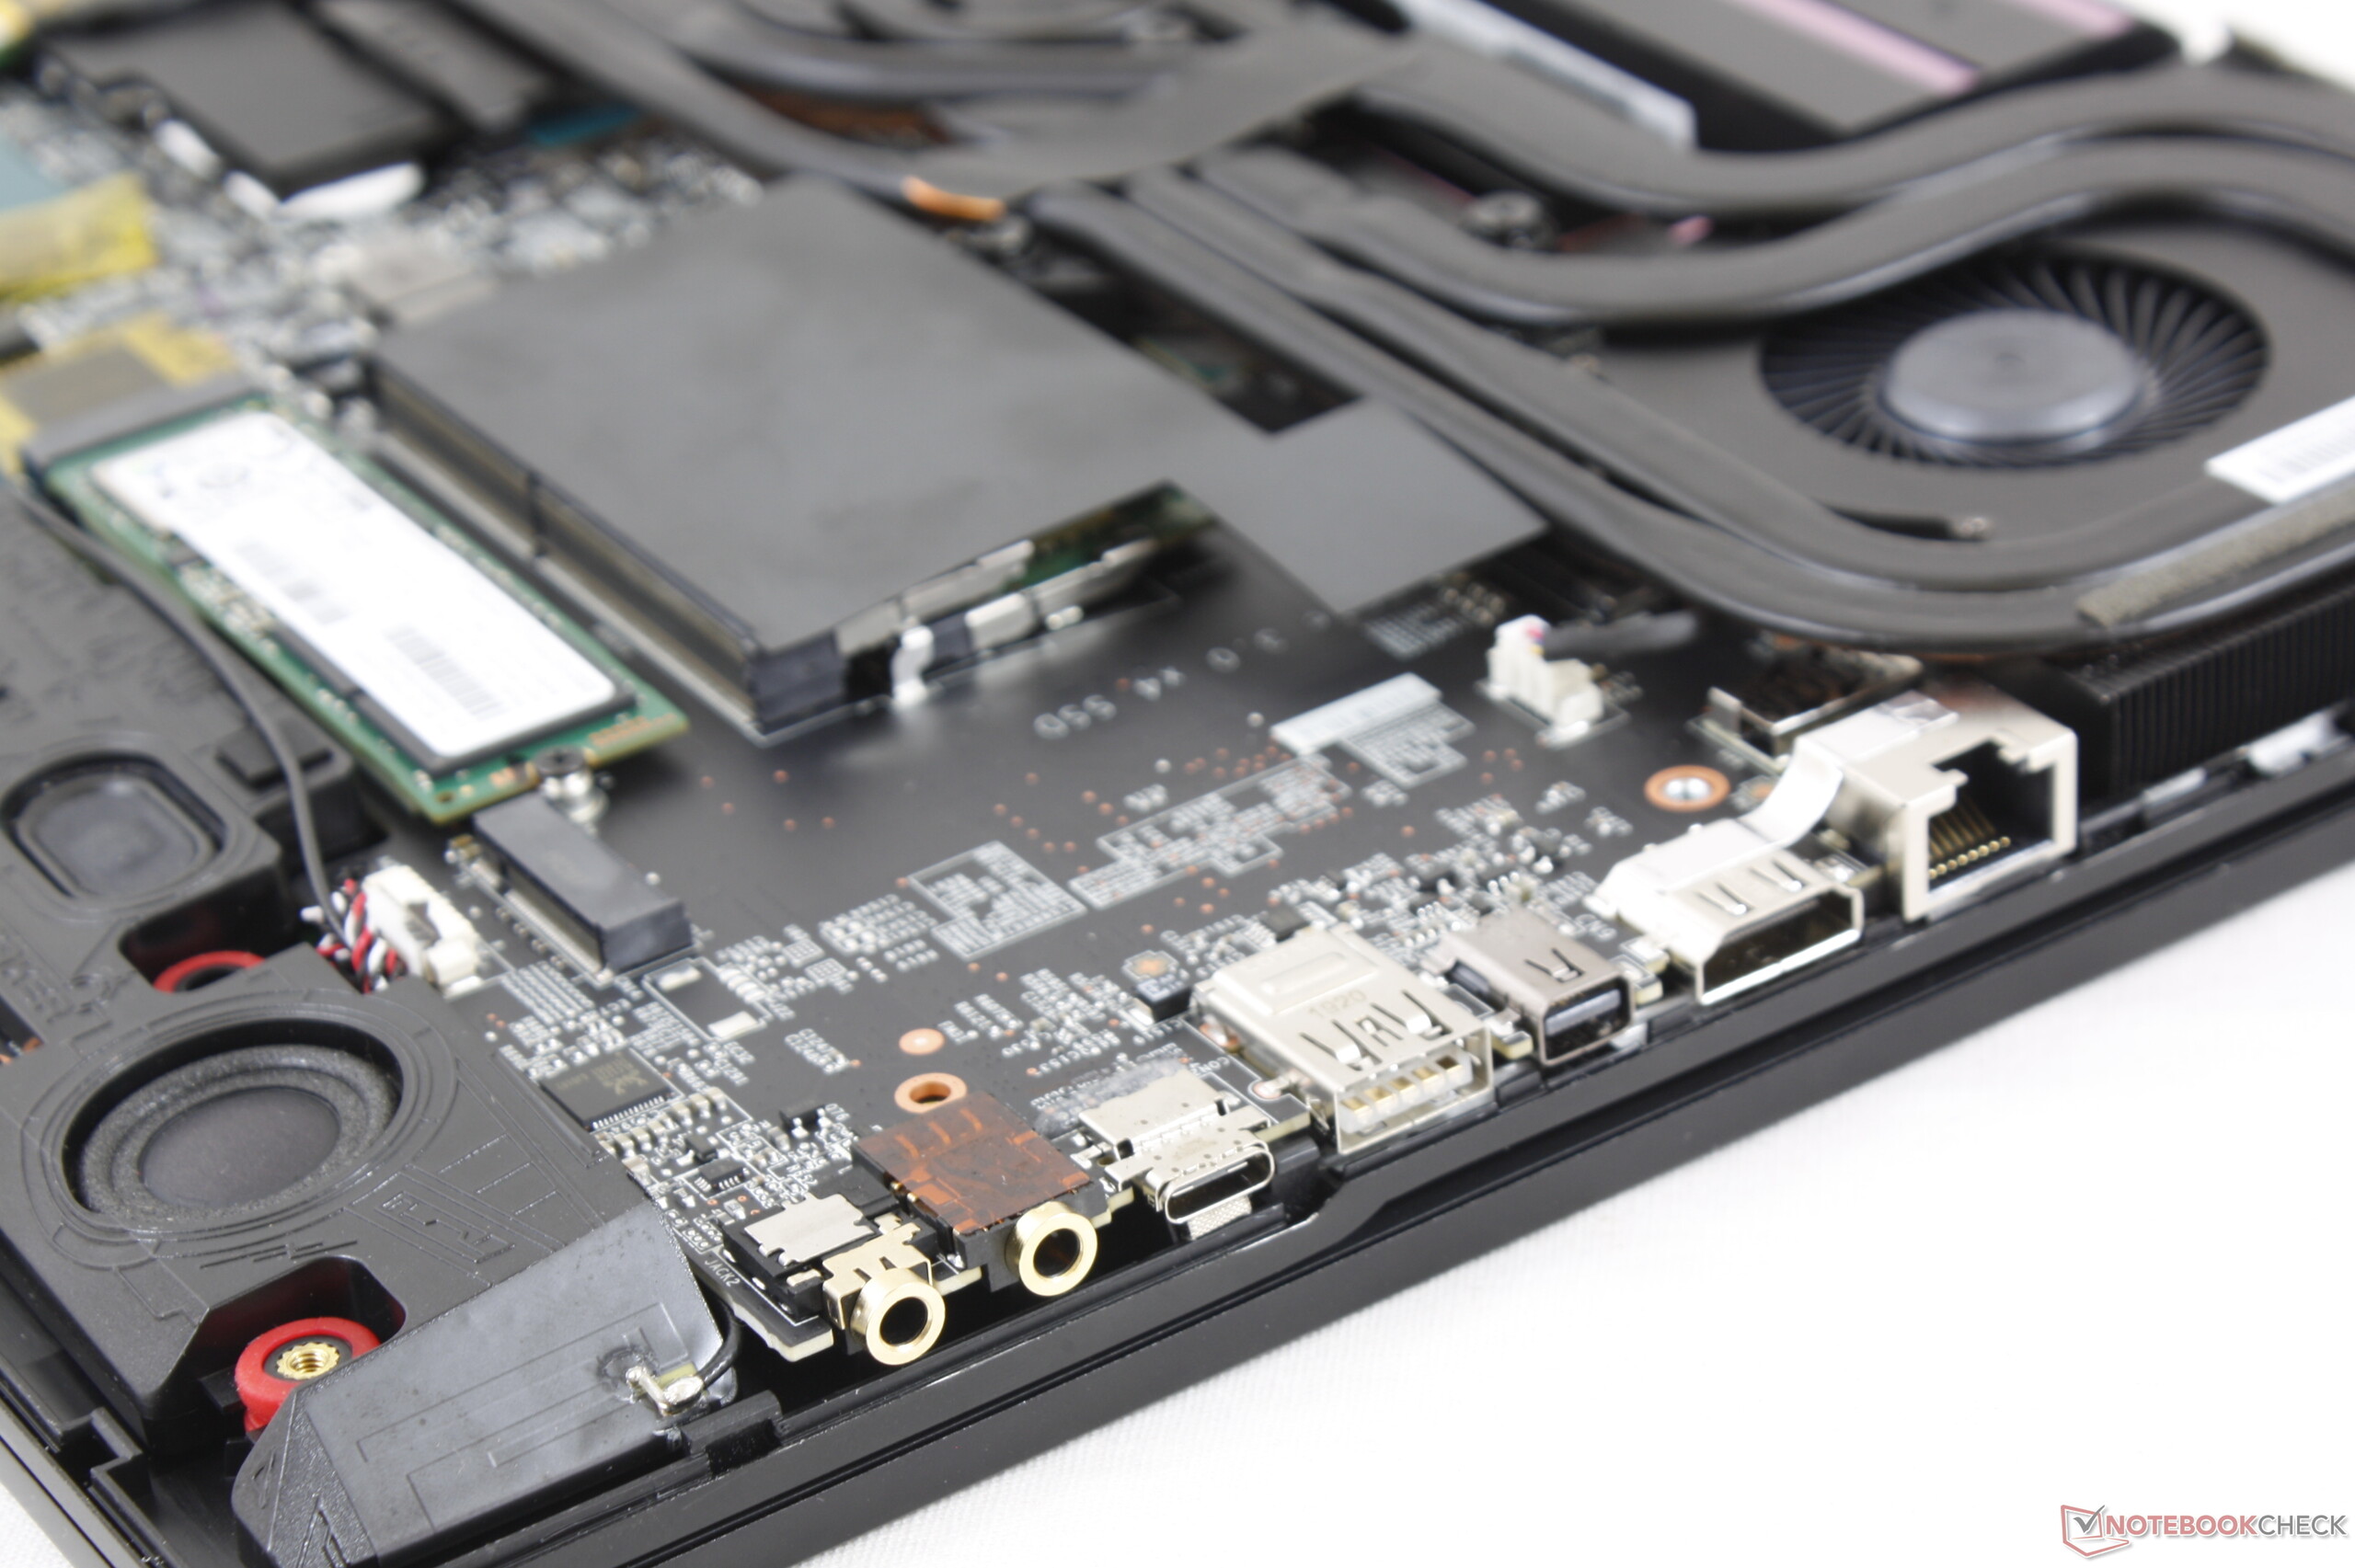
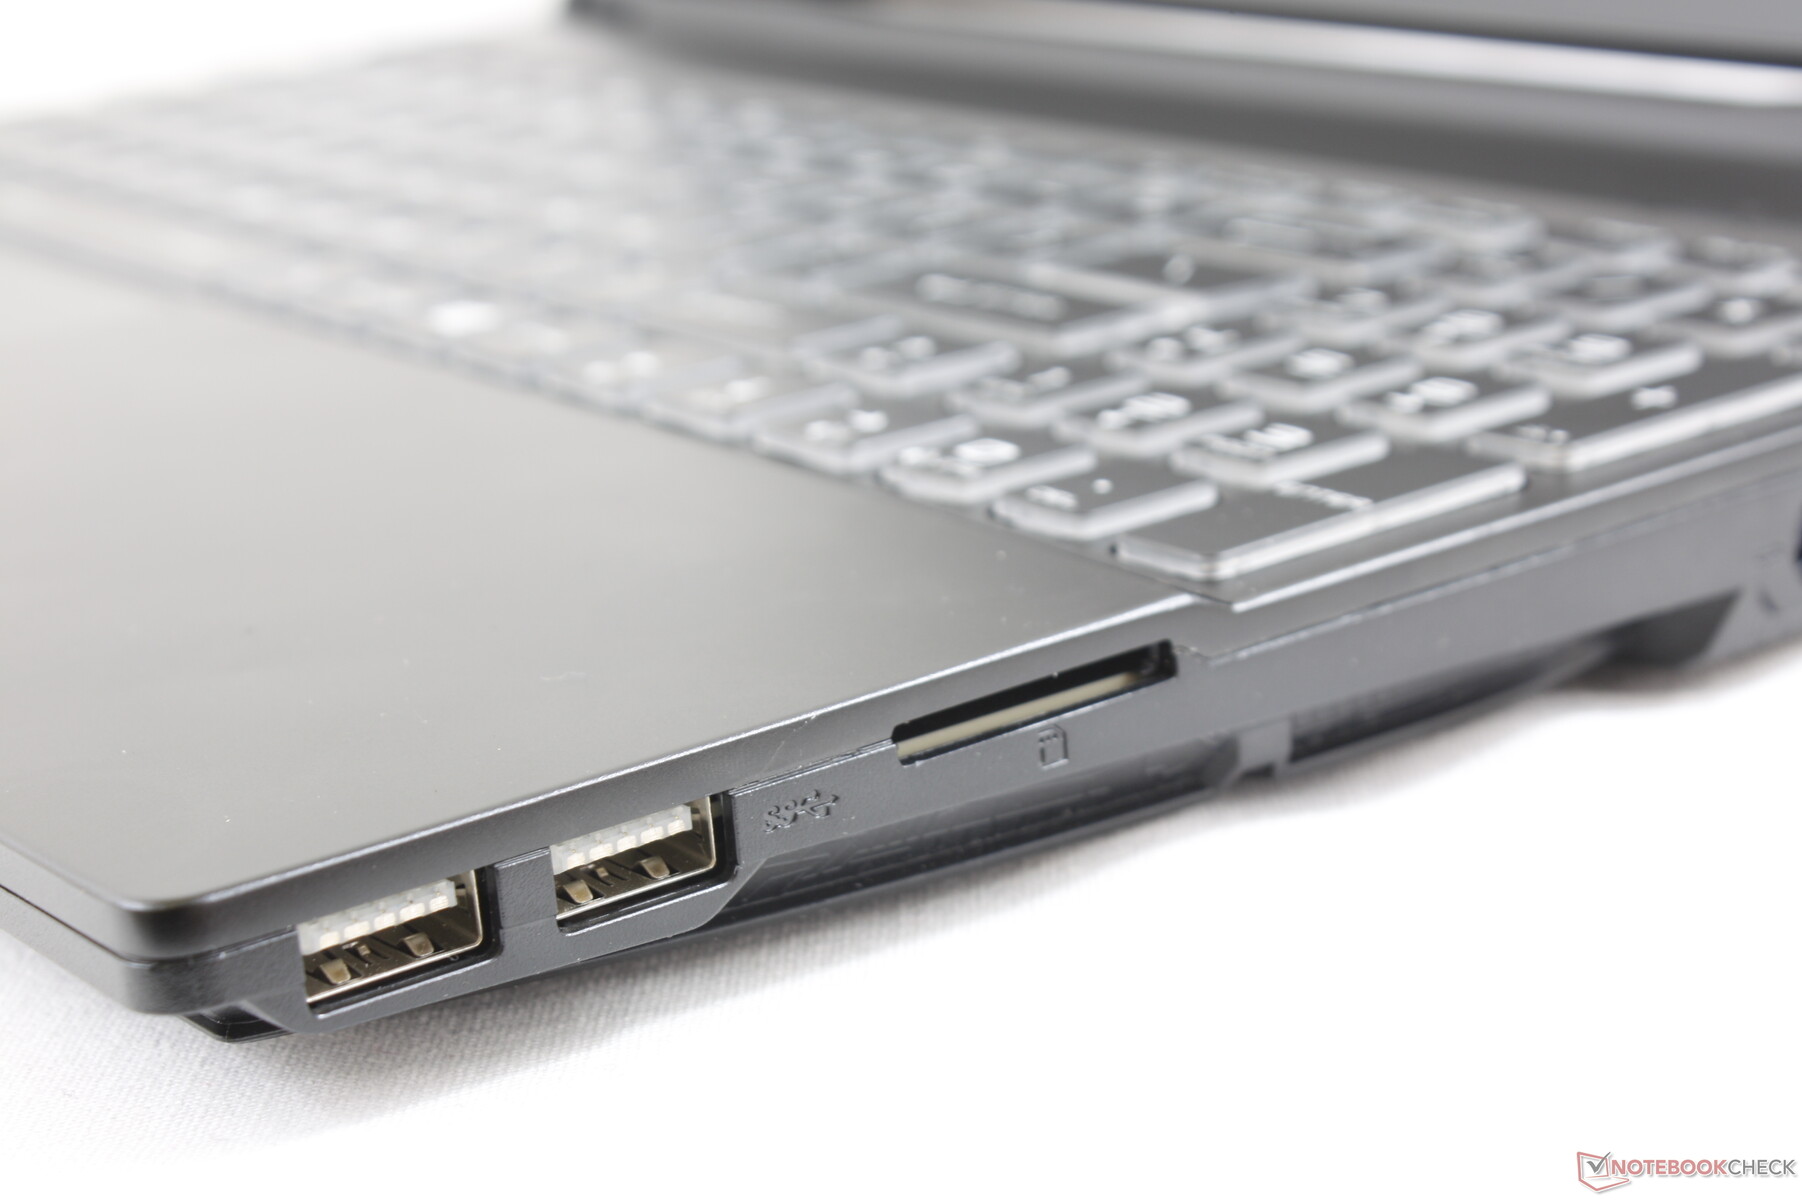
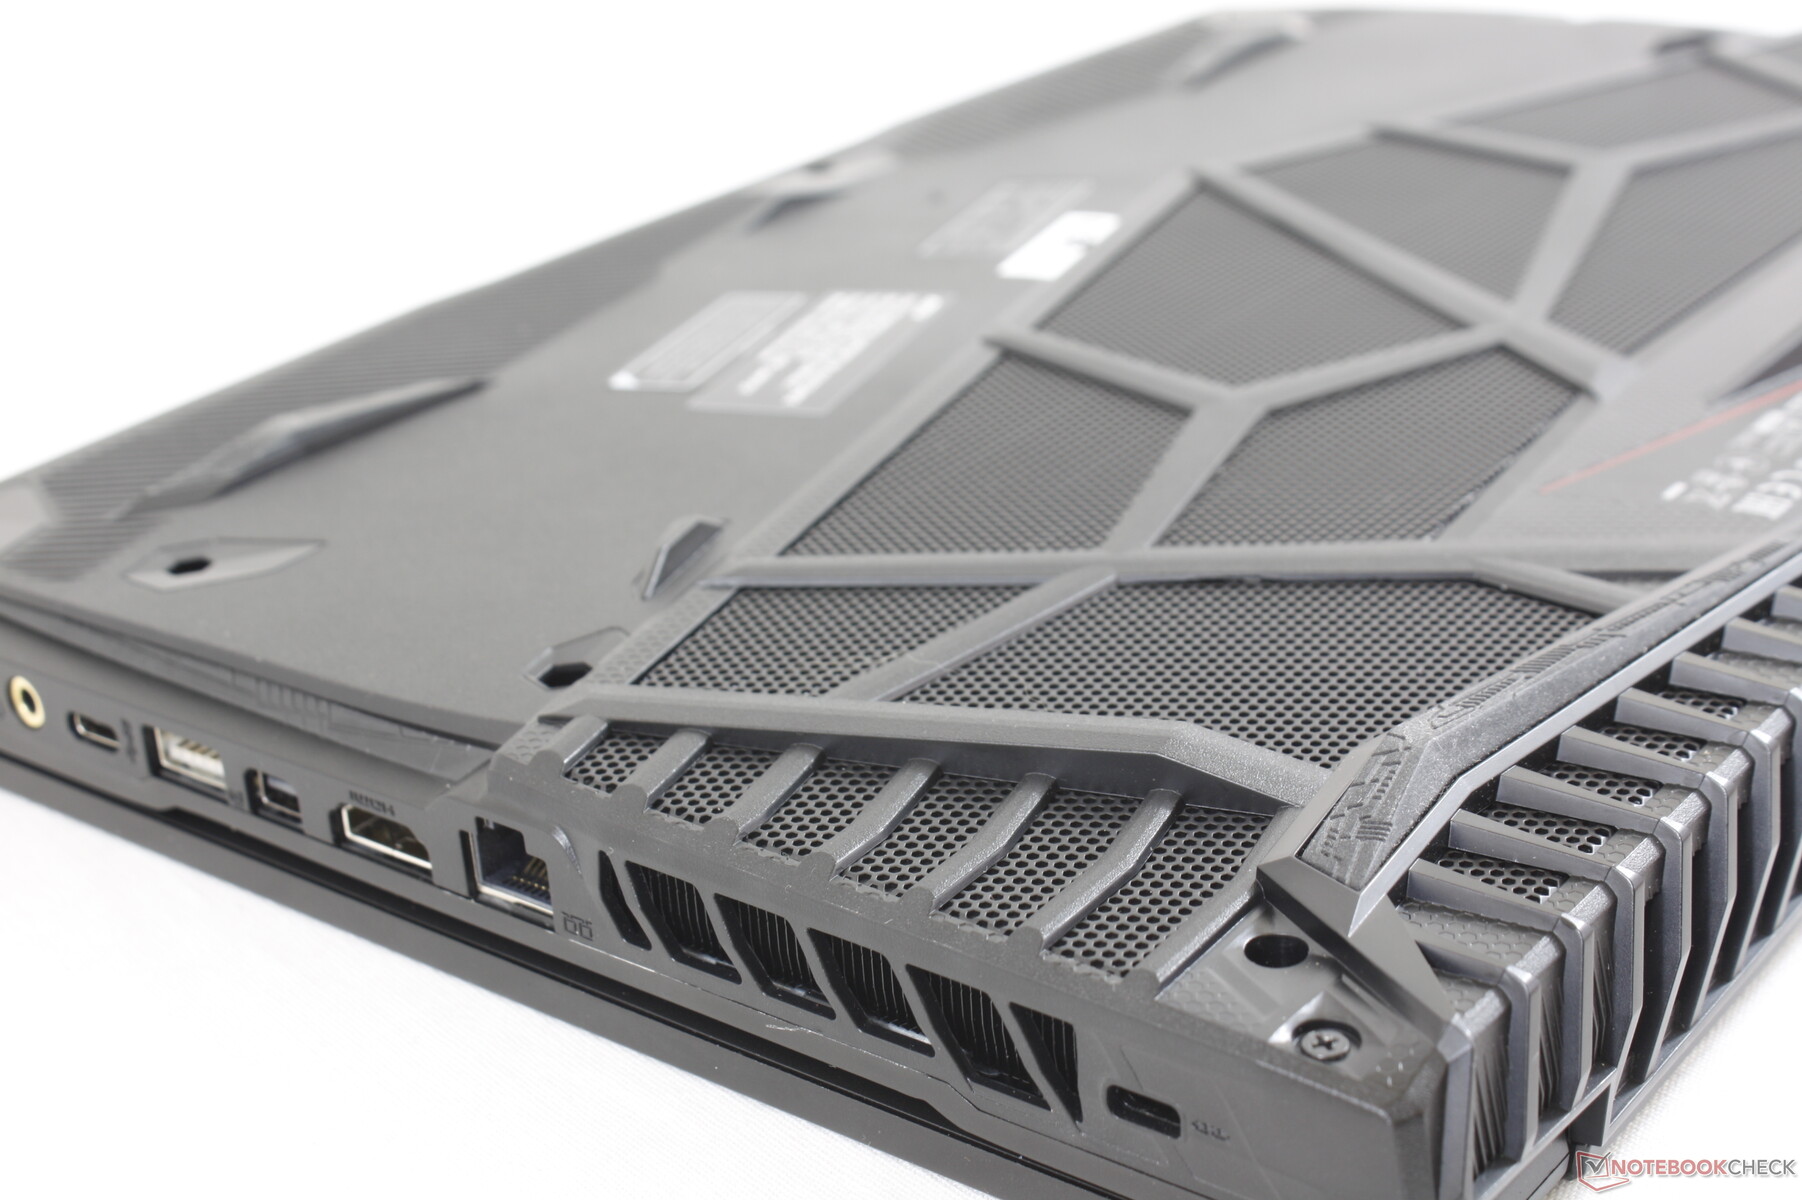
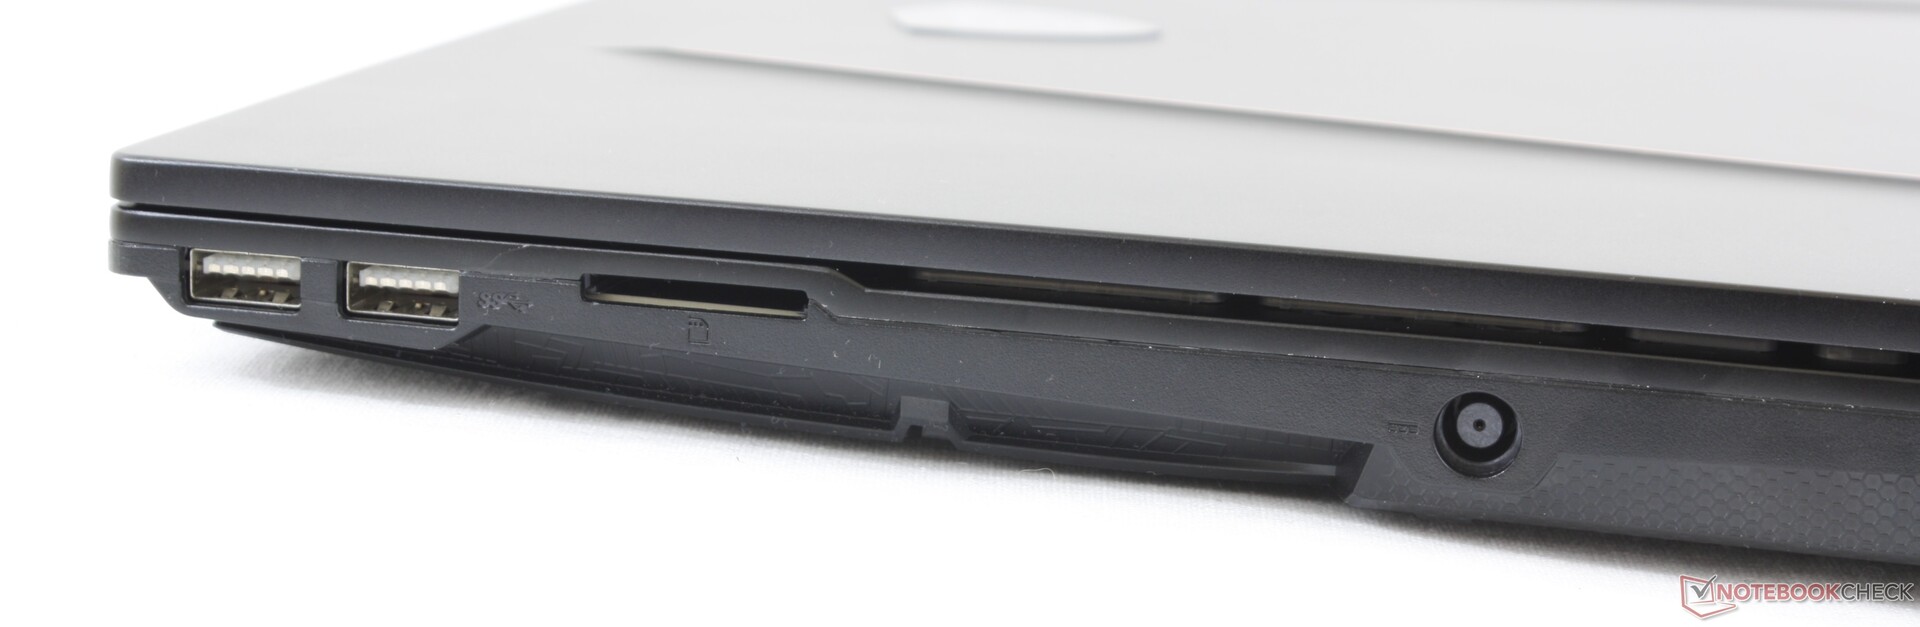
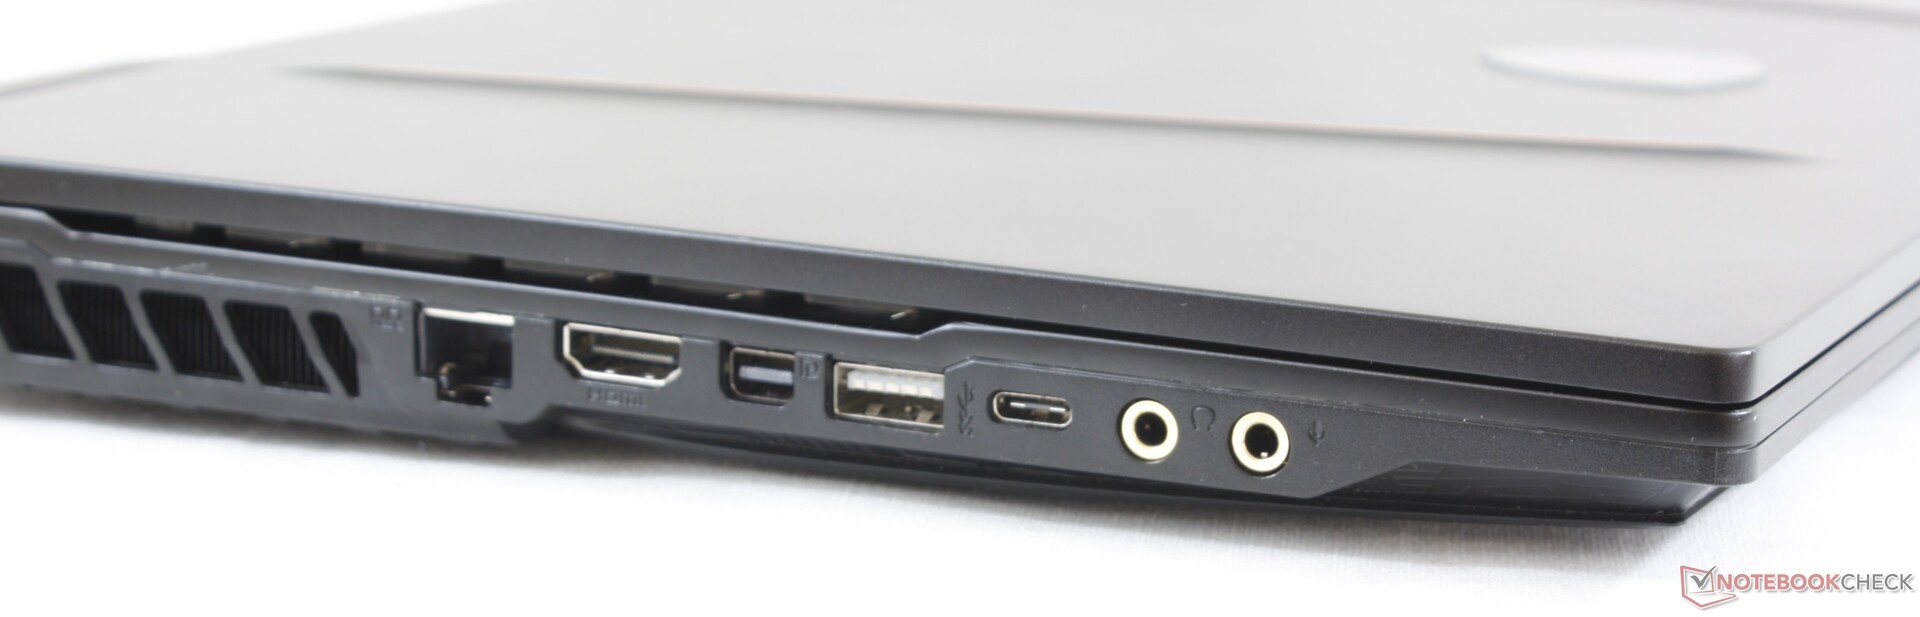
Port options are identical to the GE63 save for the repositioning of the USB Type-A ports along the right edge. Thunderbolt 3 remains elusive as you'll have to upgrade to the higher-end MSI GS or GT series for Thunderbolt support. Port positioning is a mixed bag because all ports are tightly packed and they are located close to the front edges where cables are more likely to be intrusive.
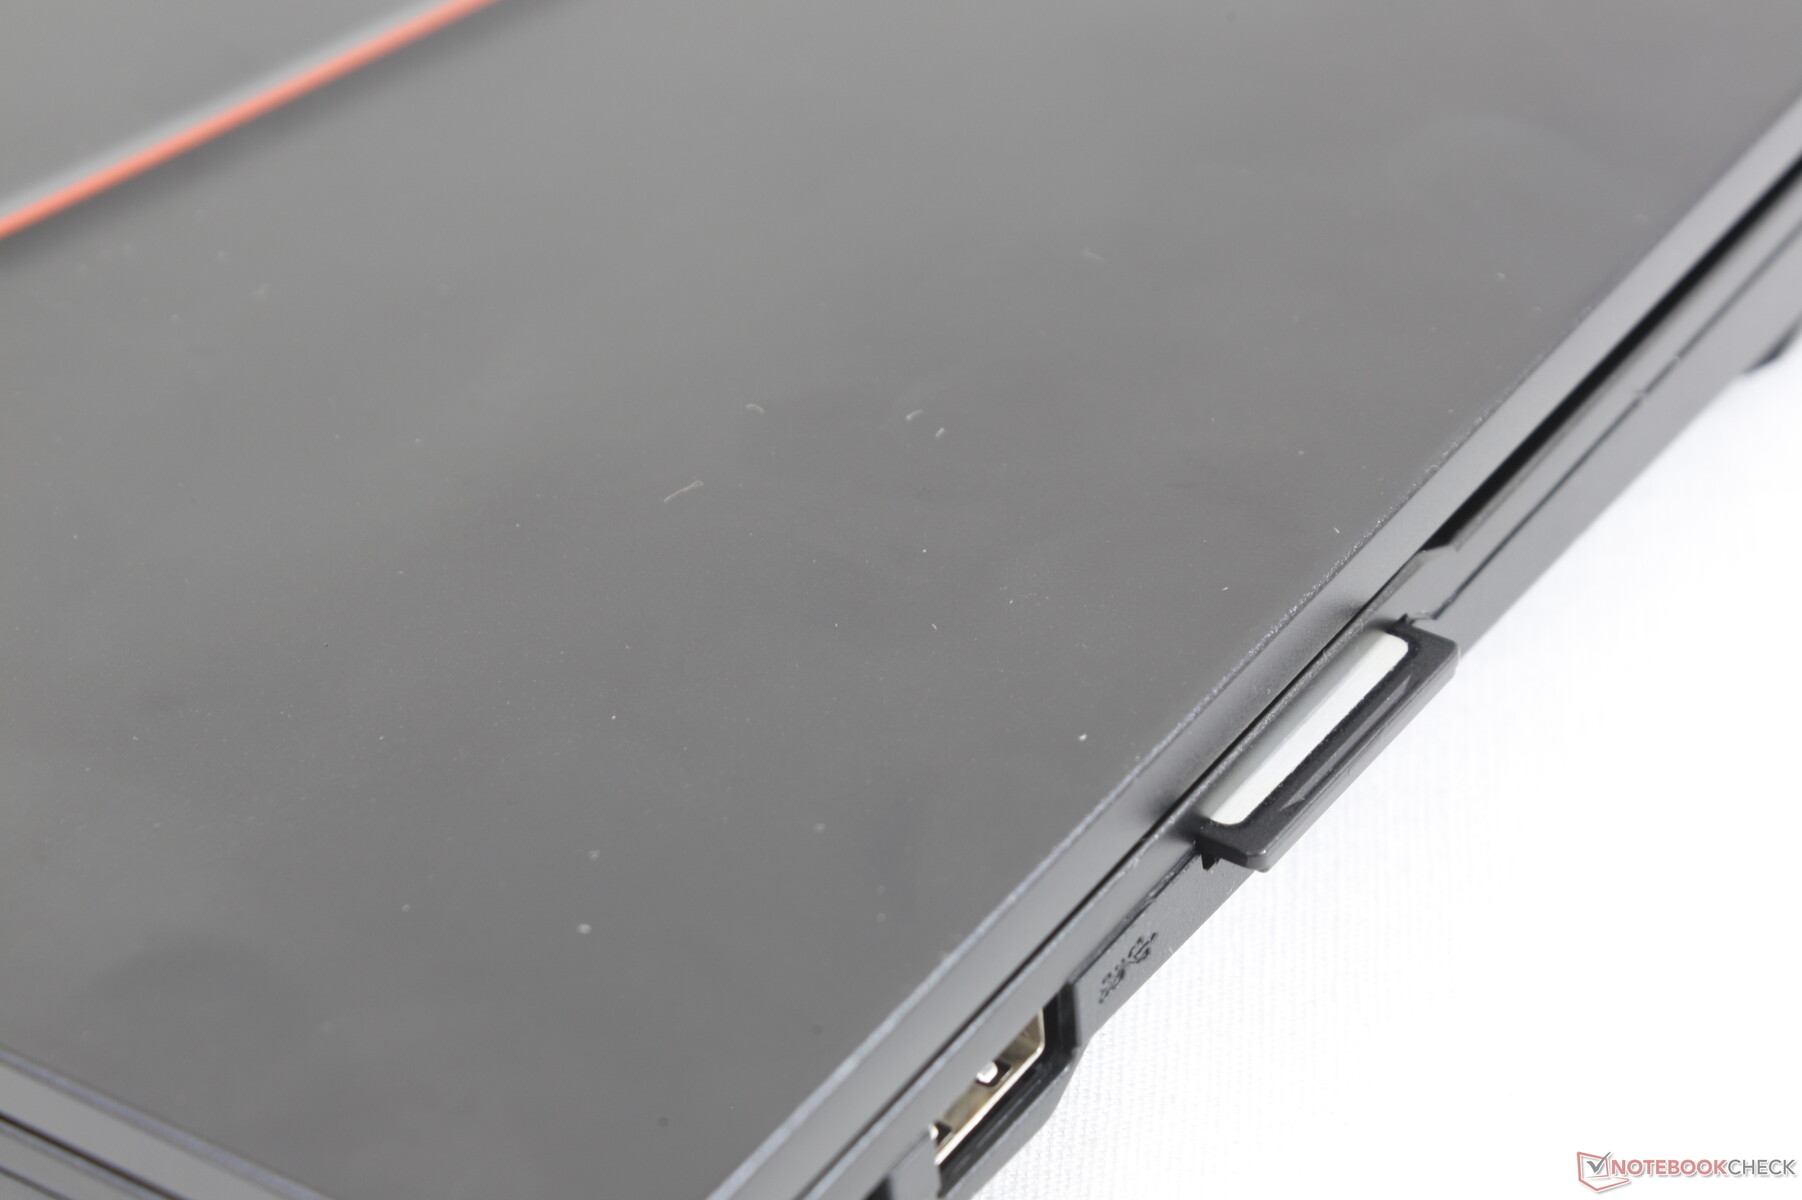
SD Card Reader
Transfer rates from the integrated spring-loaded SD card reader have not improved over the GE63. Moving 1 GB of images from our UHS-II test card takes 40 seconds compared to just 7 seconds on the Dell XPS 15. It's disappointing that MSI continues to give SD performance the cold shoulder on its GE series of laptops.
| SD Card Reader | |
| average JPG Copy Test (av. of 3 runs) | |
| Dell XPS 15 7590 9980HK GTX 1650 (Toshiba Exceria Pro SDXC 64 GB UHS-II) | |
| MSI GS73 Stealth 8RF-011 (Toshiba Exceria Pro SDXC 64 GB UHS-II) | |
| HP Omen 15-dc1303ng (Toshiba Exceria Pro SDXC 64 GB UHS-II) | |
| MSI GE63 Raider 8SG (Toshiba Exceria Pro SDXC 64 GB UHS-II) | |
| MSI GE65 Raider 9SF-049US (Toshiba Exceria Pro SDXC 64 GB UHS-II) | |
| maximum AS SSD Seq Read Test (1GB) | |
| MSI GS73 Stealth 8RF-011 (Toshiba Exceria Pro SDXC 64 GB UHS-II) | |
| Dell XPS 15 7590 9980HK GTX 1650 (Toshiba Exceria Pro SDXC 64 GB UHS-II) | |
| HP Omen 15-dc1303ng (Toshiba Exceria Pro SDXC 64 GB UHS-II) | |
| MSI GE63 Raider 8SG (Toshiba Exceria Pro SDXC 64 GB UHS-II) | |
| MSI GE65 Raider 9SF-049US (Toshiba Exceria Pro SDXC 64 GB UHS-II) | |
Communication
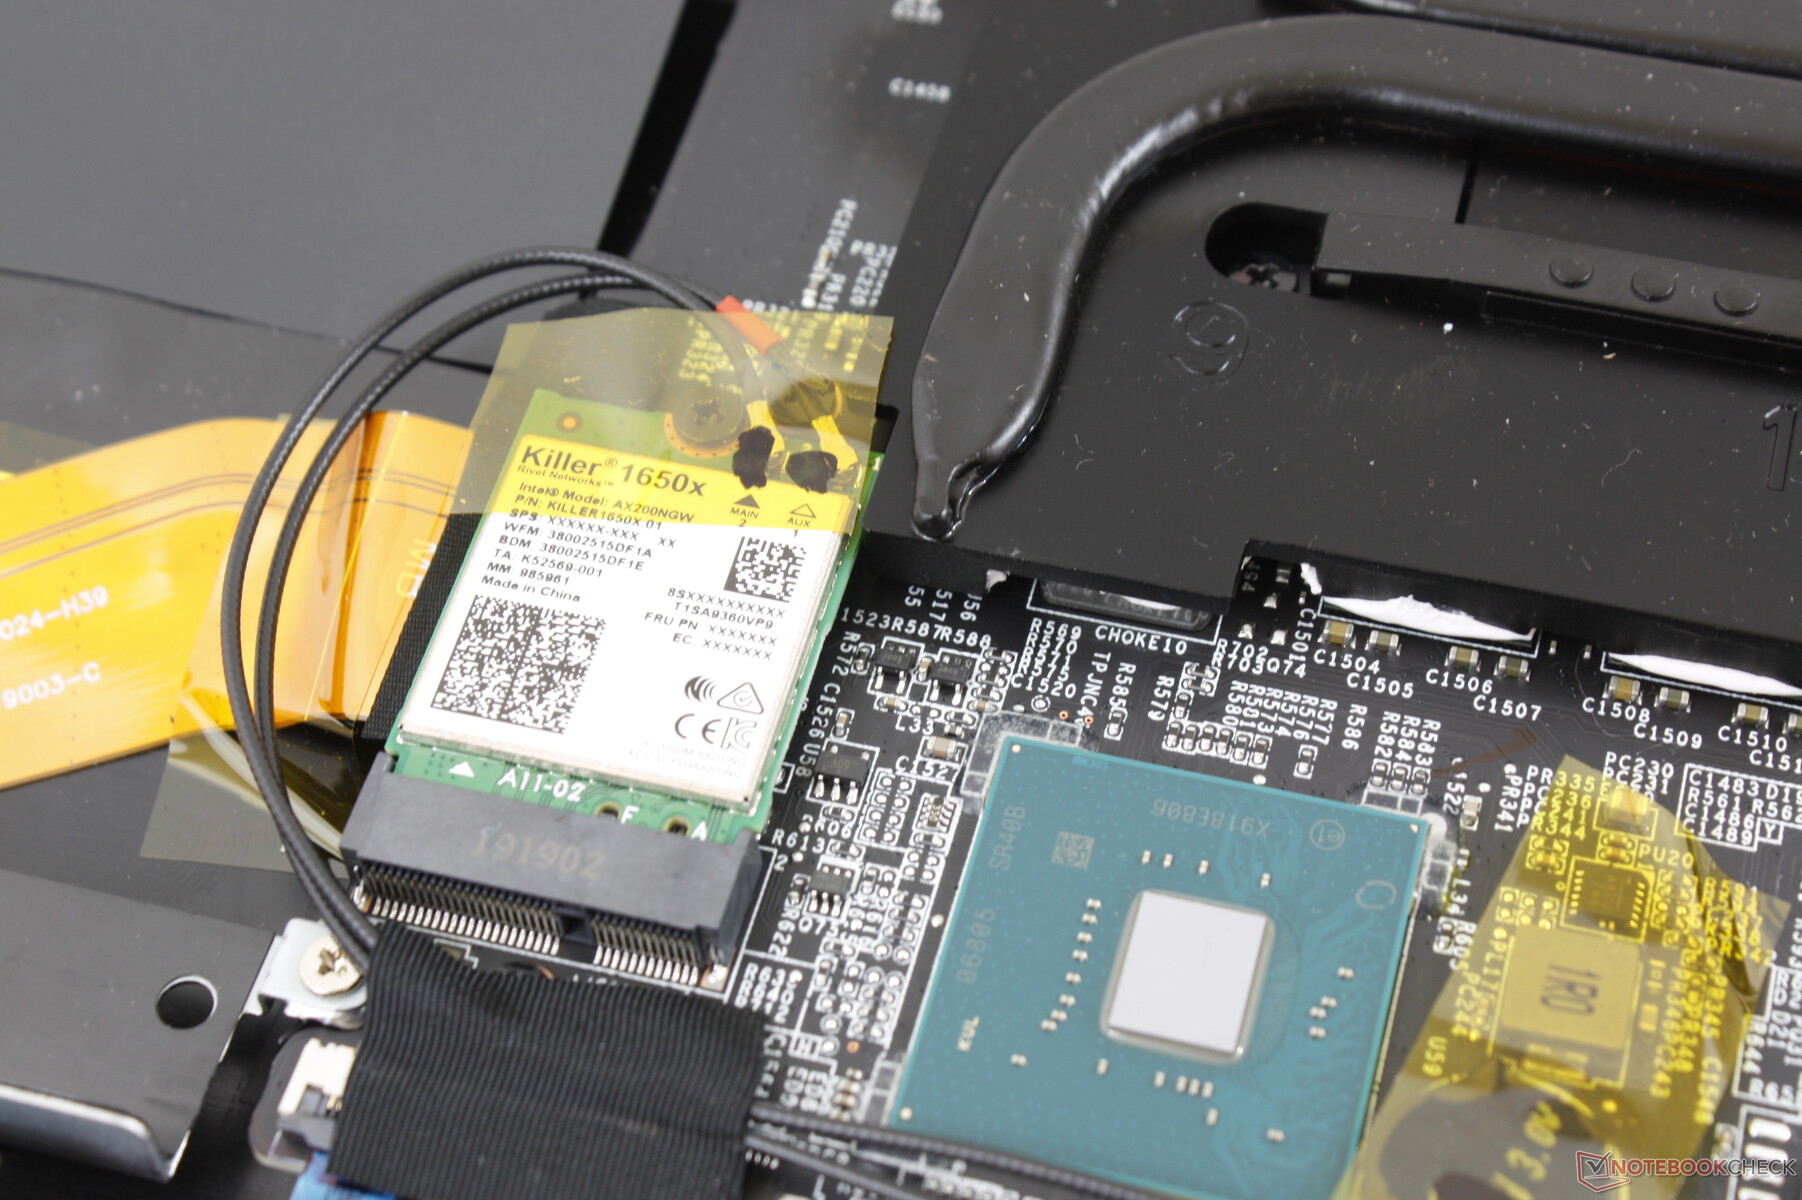
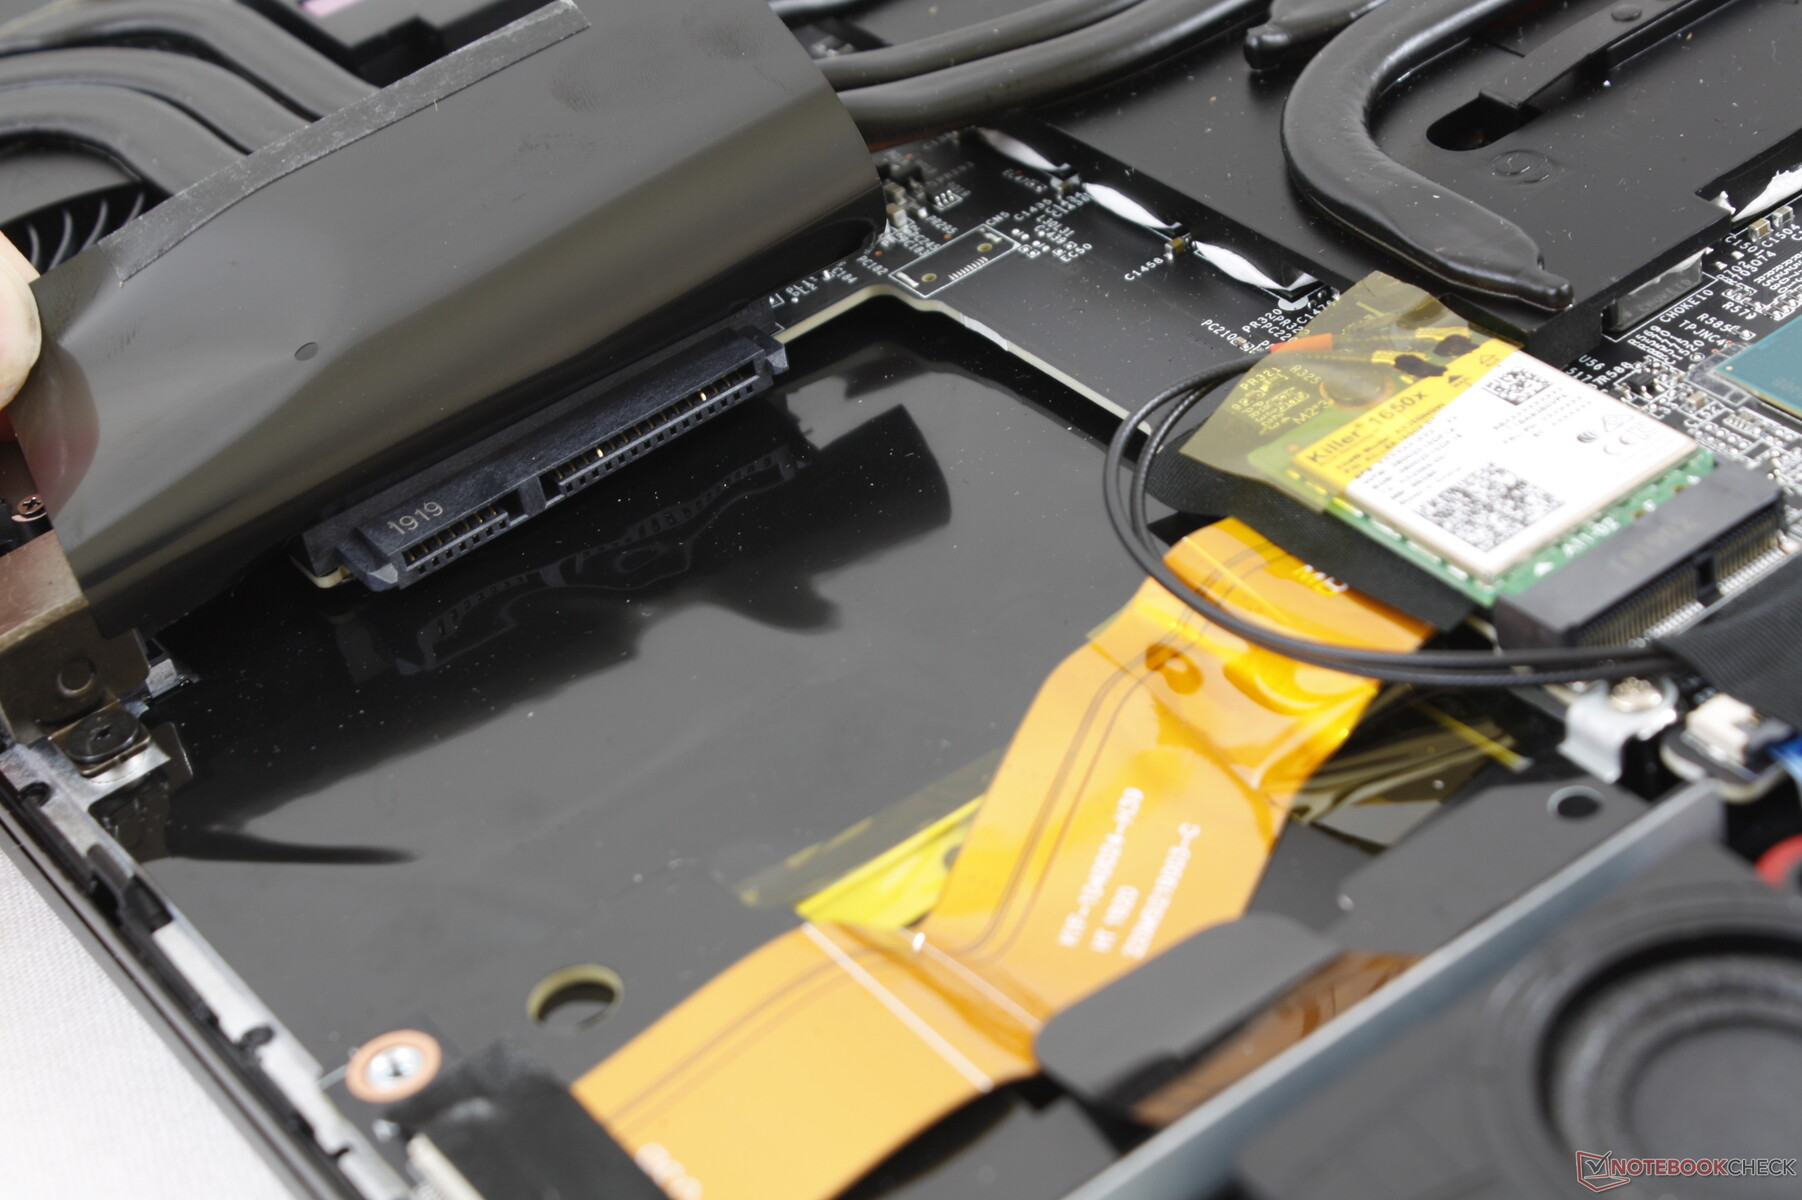
All SKUs come standard with Killer 1650x wireless for Wi-Fi 6 connectivity. The module is functionally the same as the Intel AX200/AX201 albeit with specific Killer software features catered to enthusiasts. We didn't experience any WLAN issues during our time with the test unit.
| Networking | |
| iperf3 transmit AX12 | |
| MSI Prestige 15 A10SC | |
| Lenovo Legion Y740-15ICHg | |
| Asus Strix GL531GV-PB74 | |
| Alienware m15 R2 P87F | |
| iperf3 receive AX12 | |
| MSI Prestige 15 A10SC | |
| Asus Strix GL531GV-PB74 | |
| Alienware m15 R2 P87F | |
| Lenovo Legion Y740-15ICHg | |
Maintenance
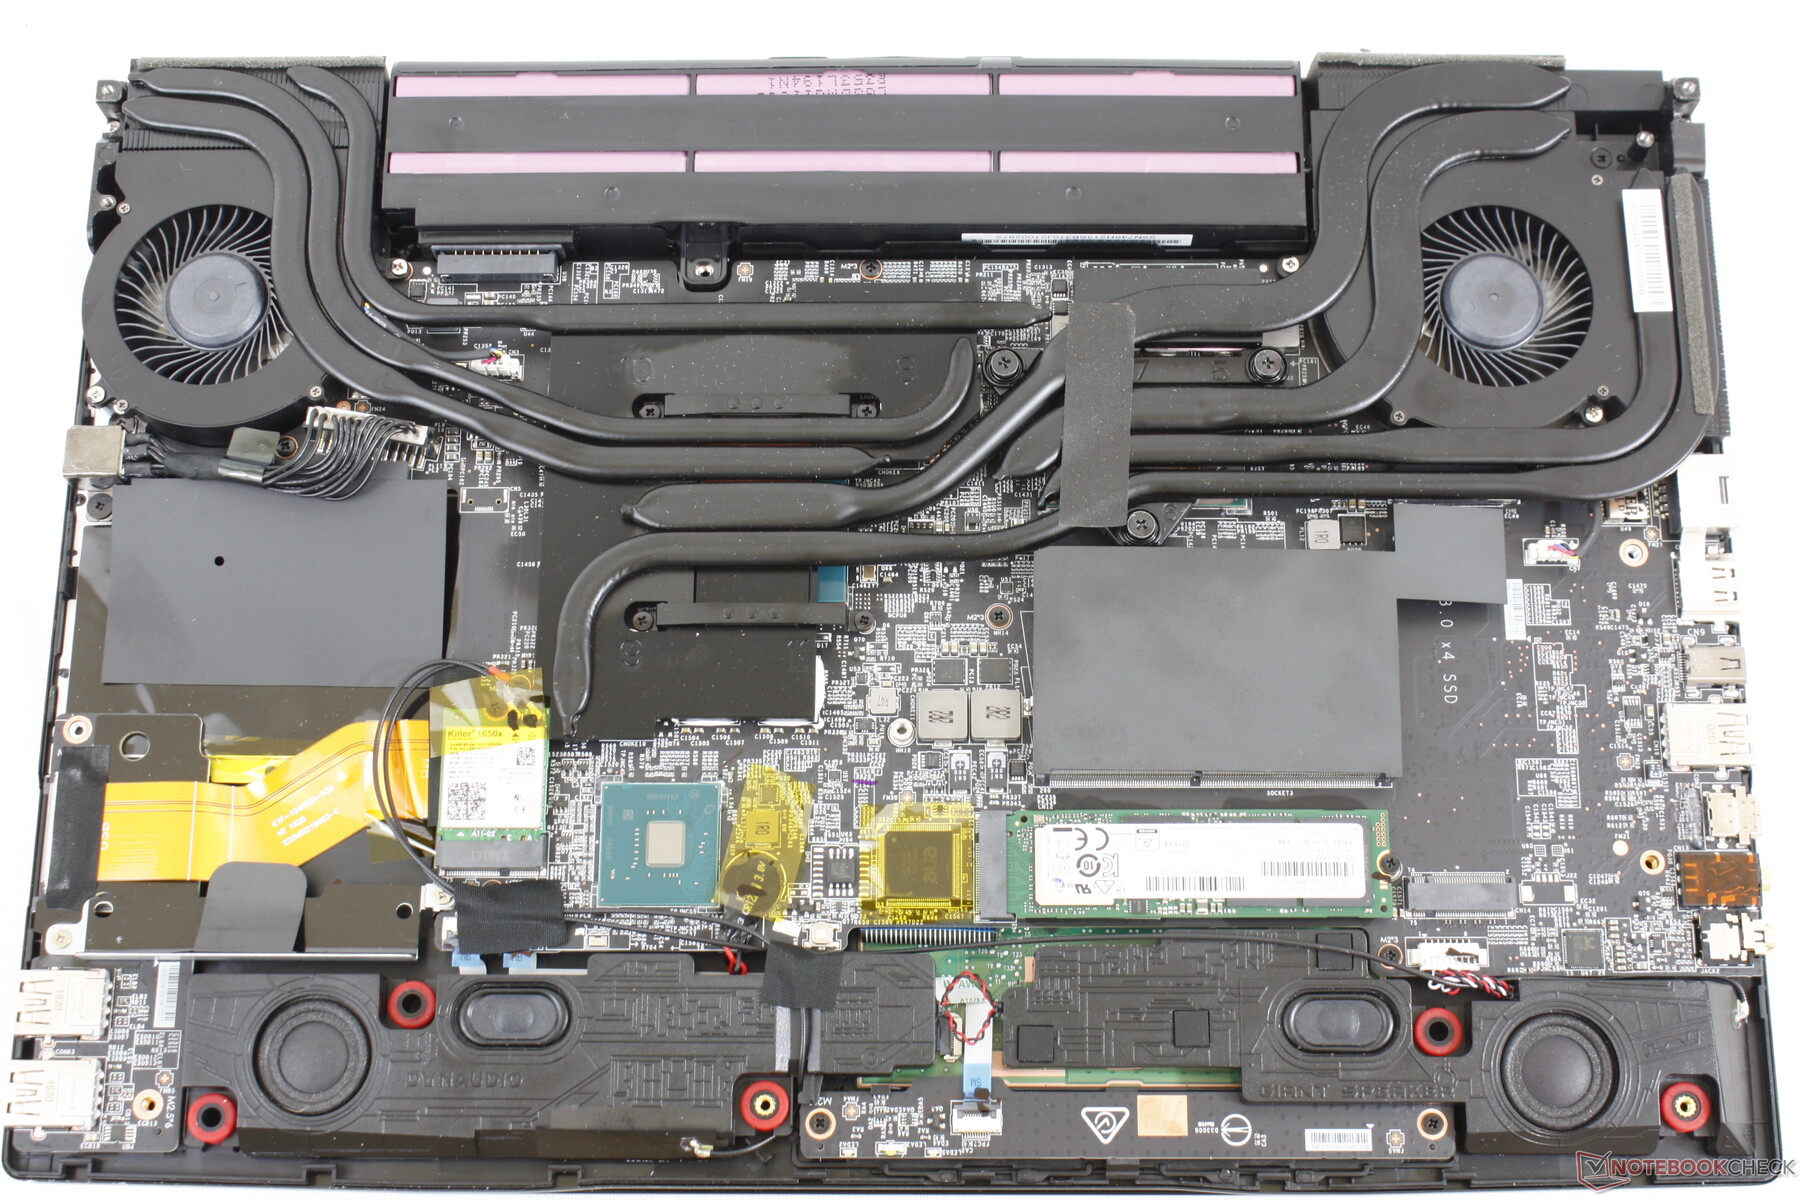
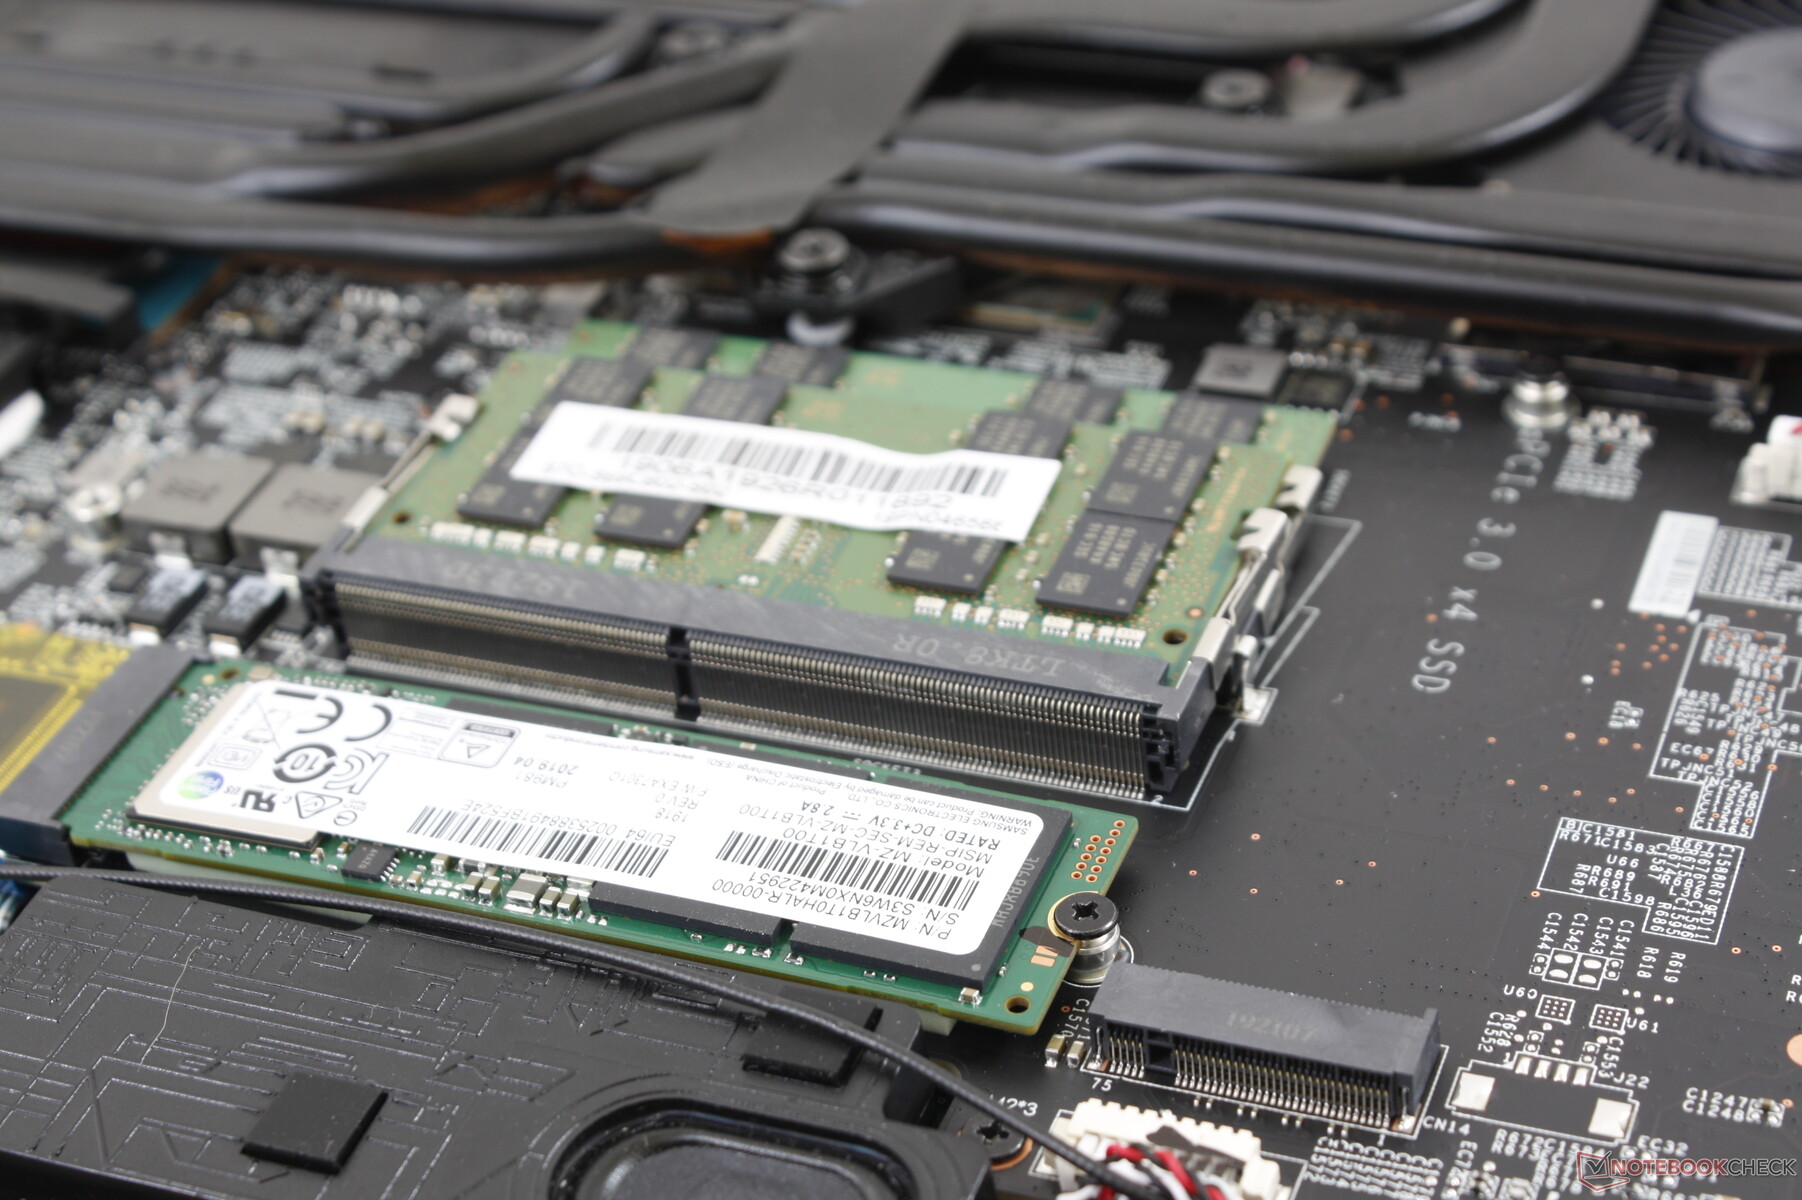
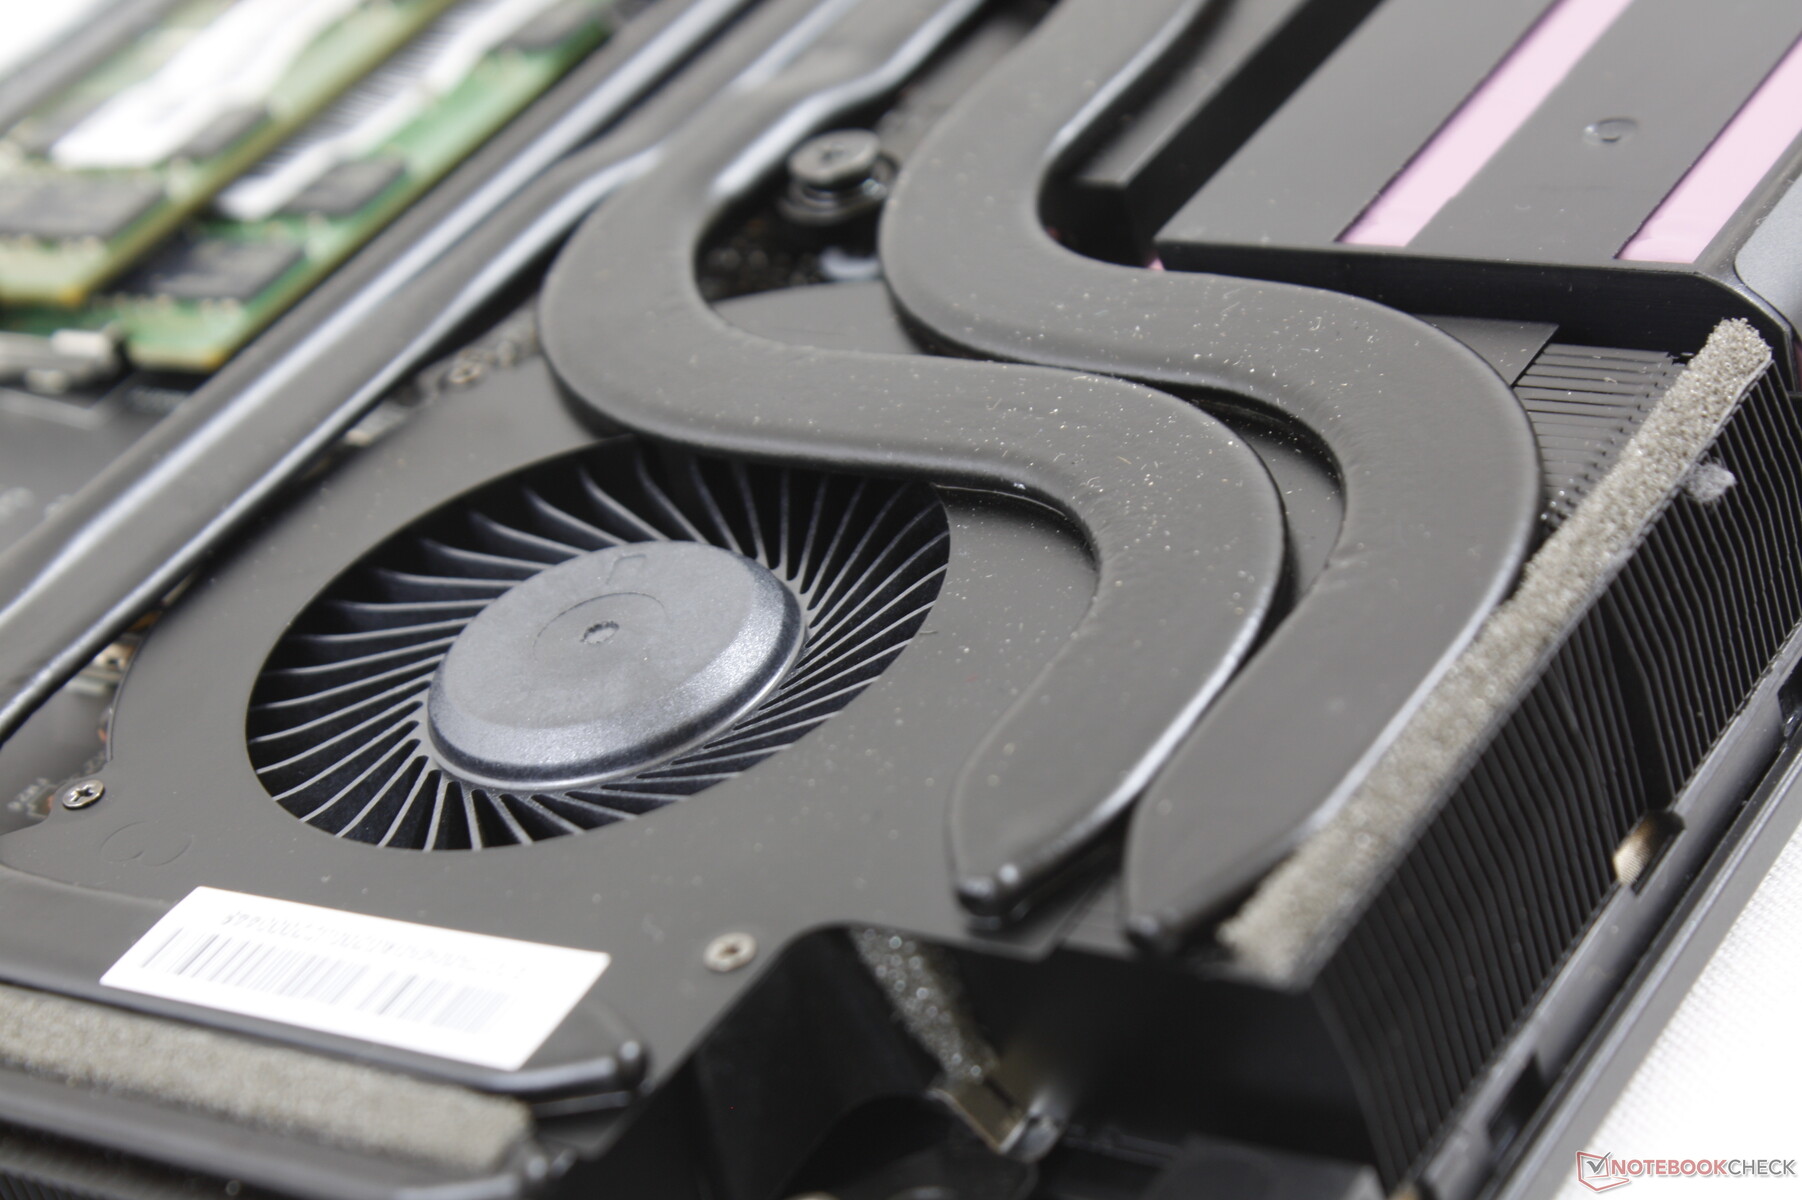
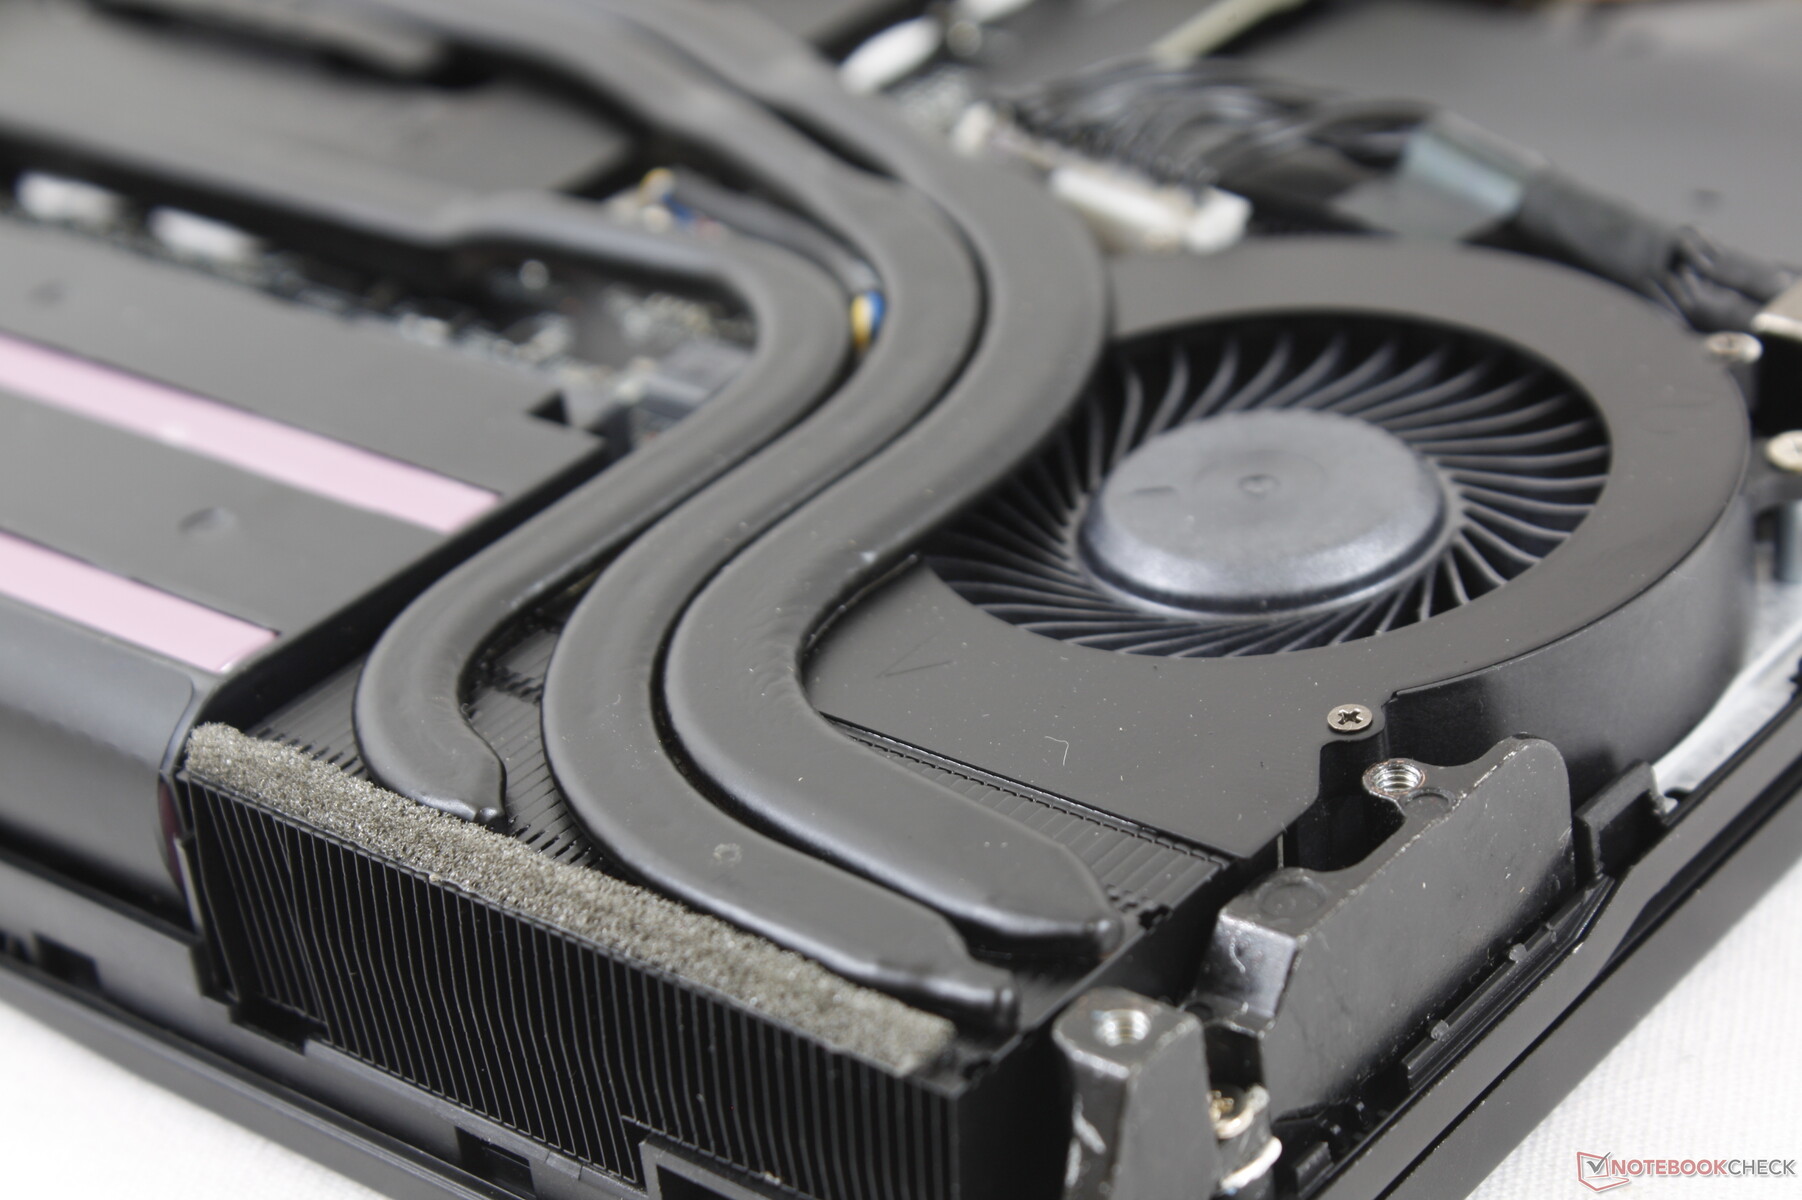
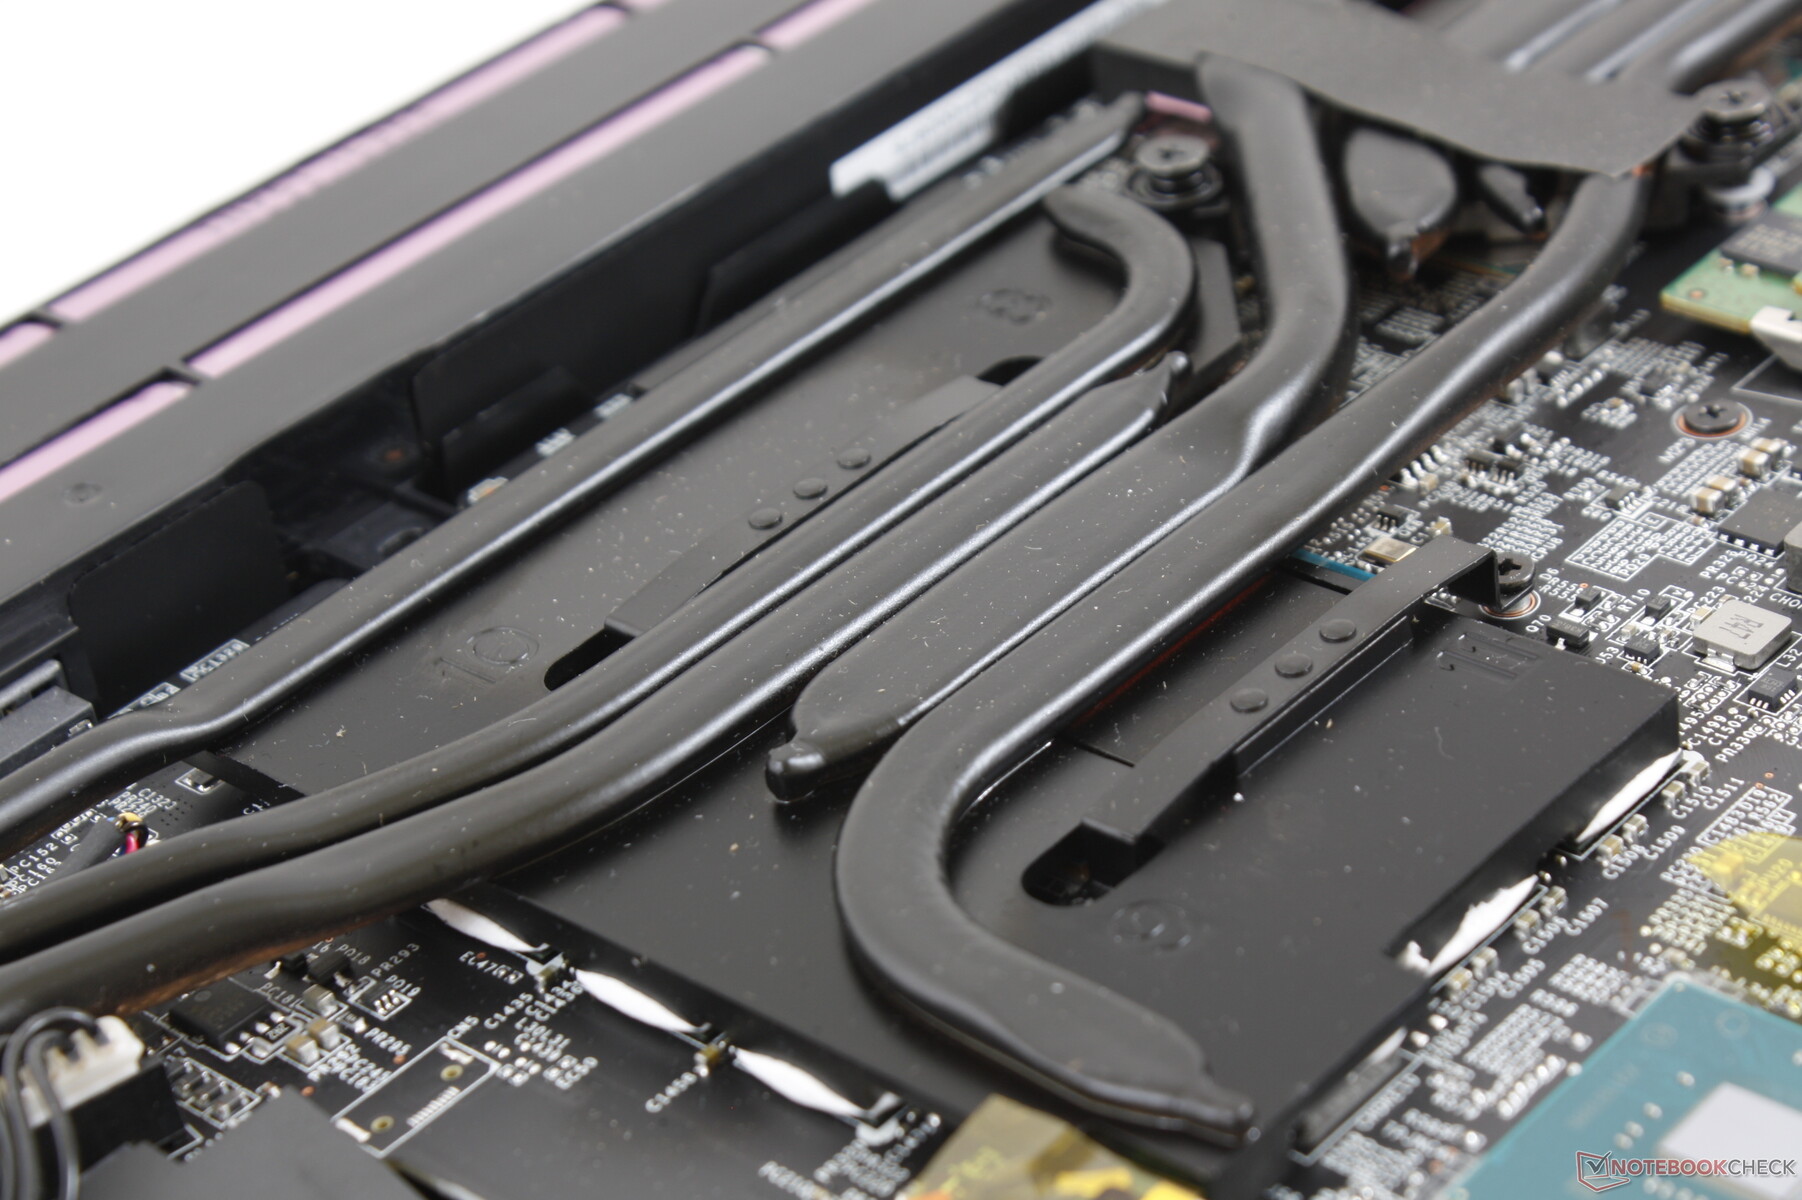
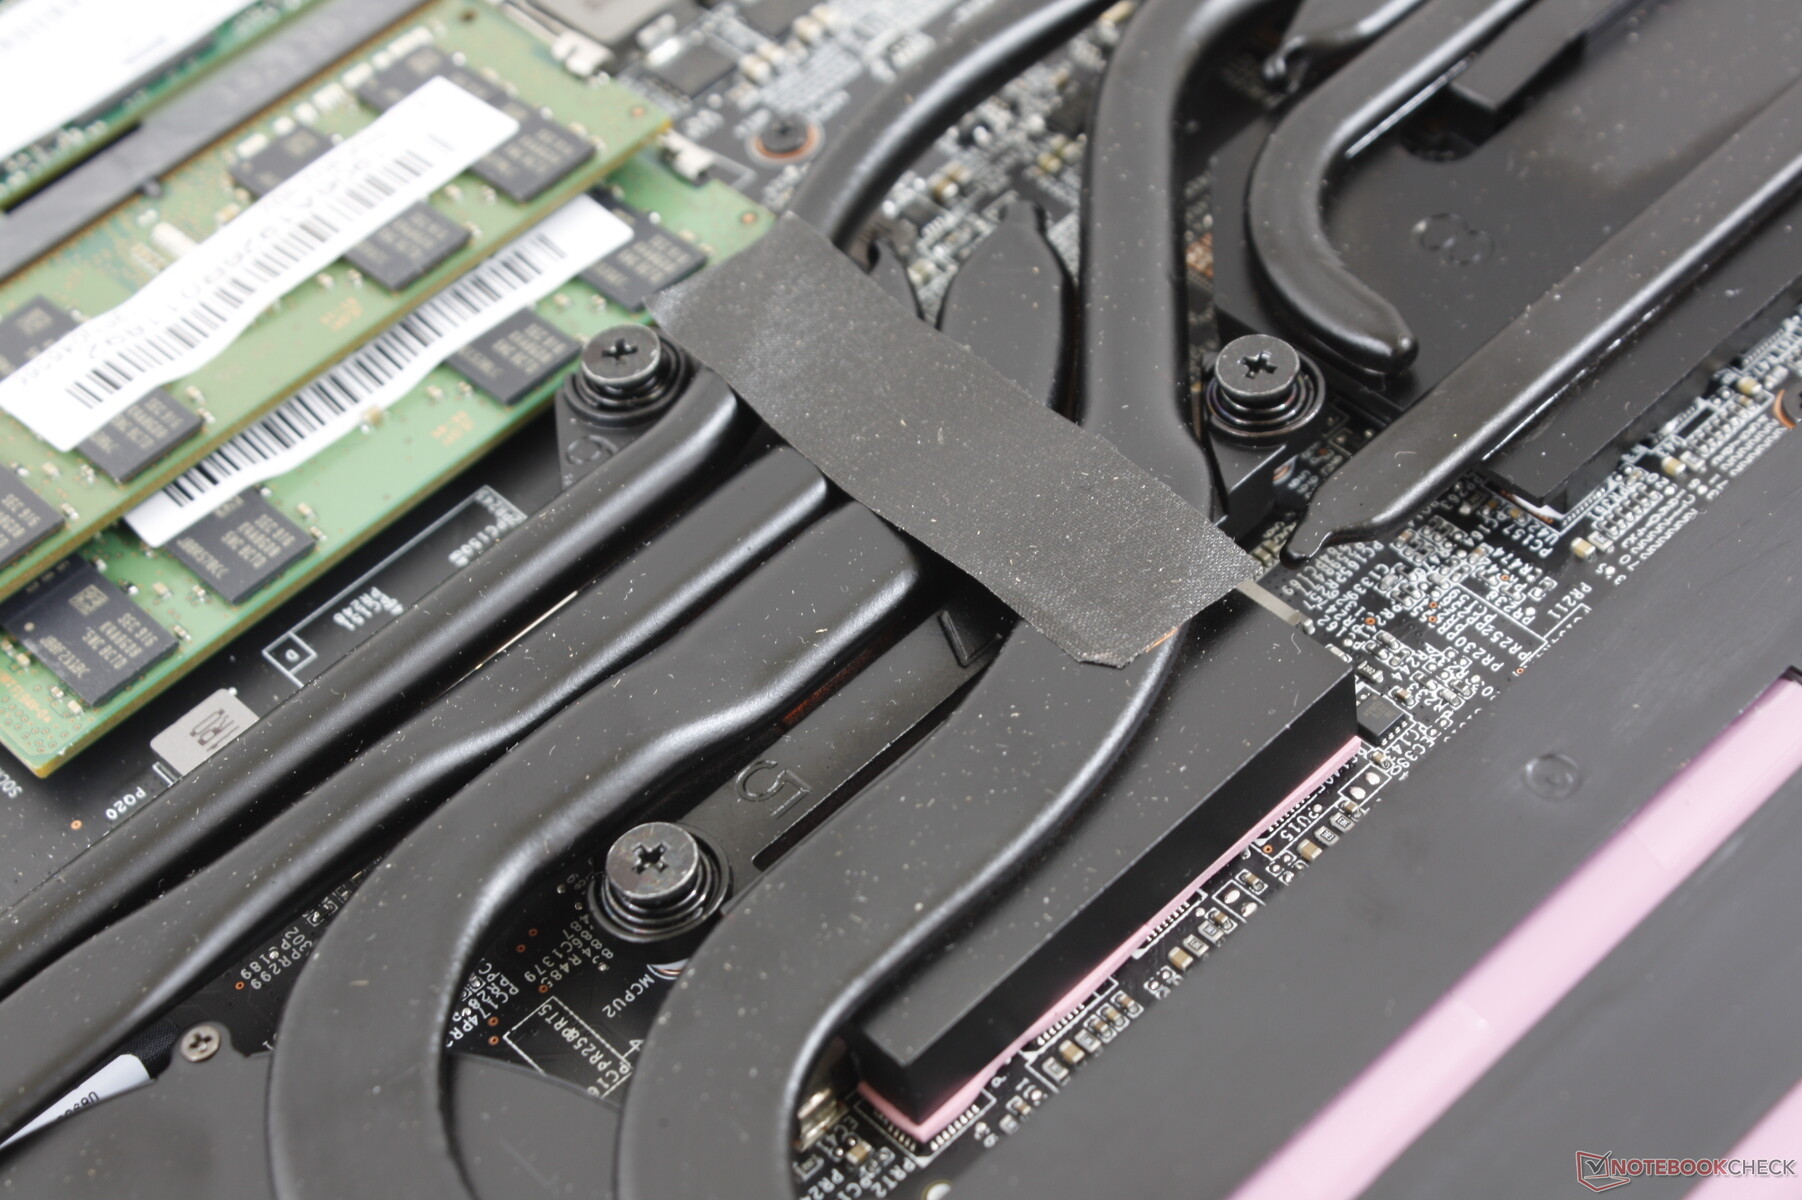
The bottom panel can be removed with just a Philips screwdriver and a sharp edge. Motherboard layout is very similar to the last generation GE63 but with some components and heat pipes rearranged in order to accommodate for the narrower bezels. A 'Factory Seal' sticker must be broken in order to gain access to the motherboard.
Accessories and Warranty
There are no notable extras in the box other than the AC adapter. The standard one-year limited warranty applies with potential extras for those who register their purchases online through MSI.
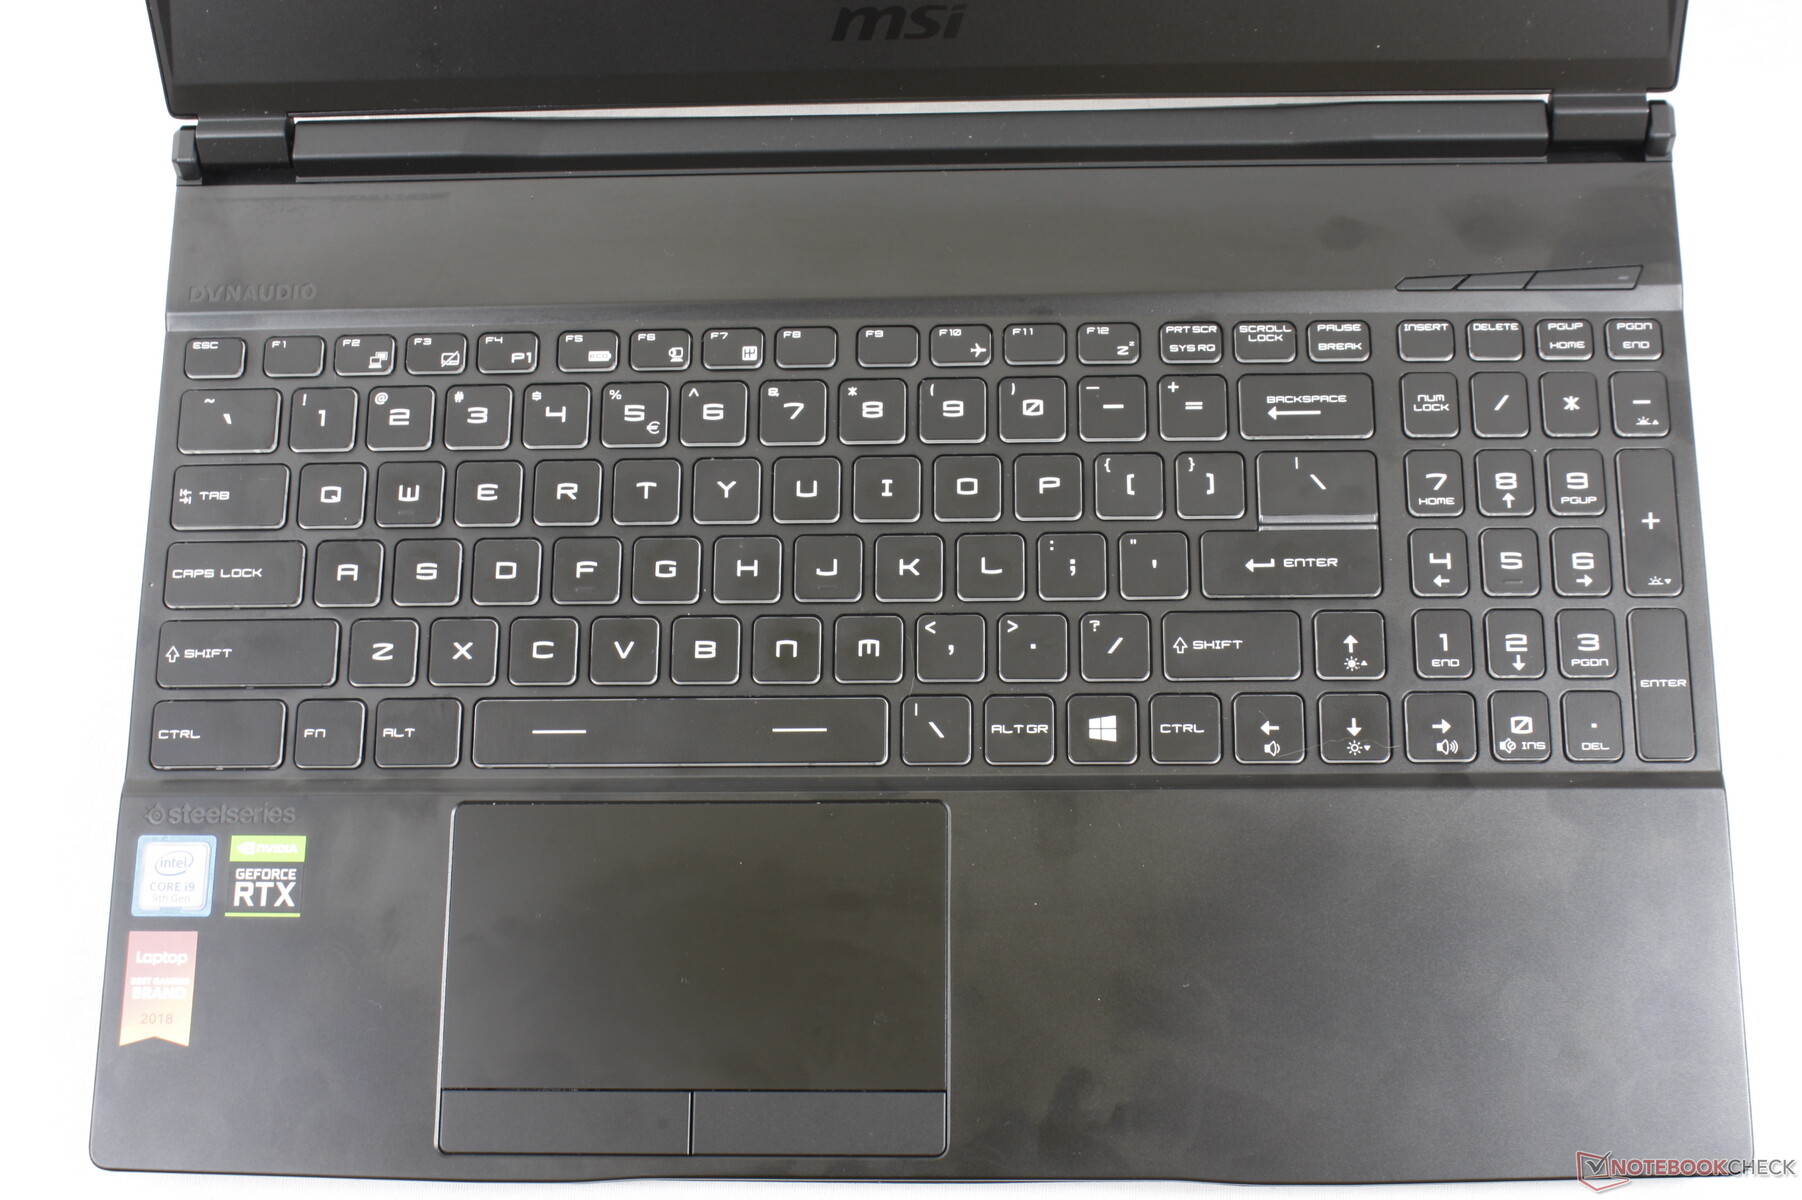
Input Devices
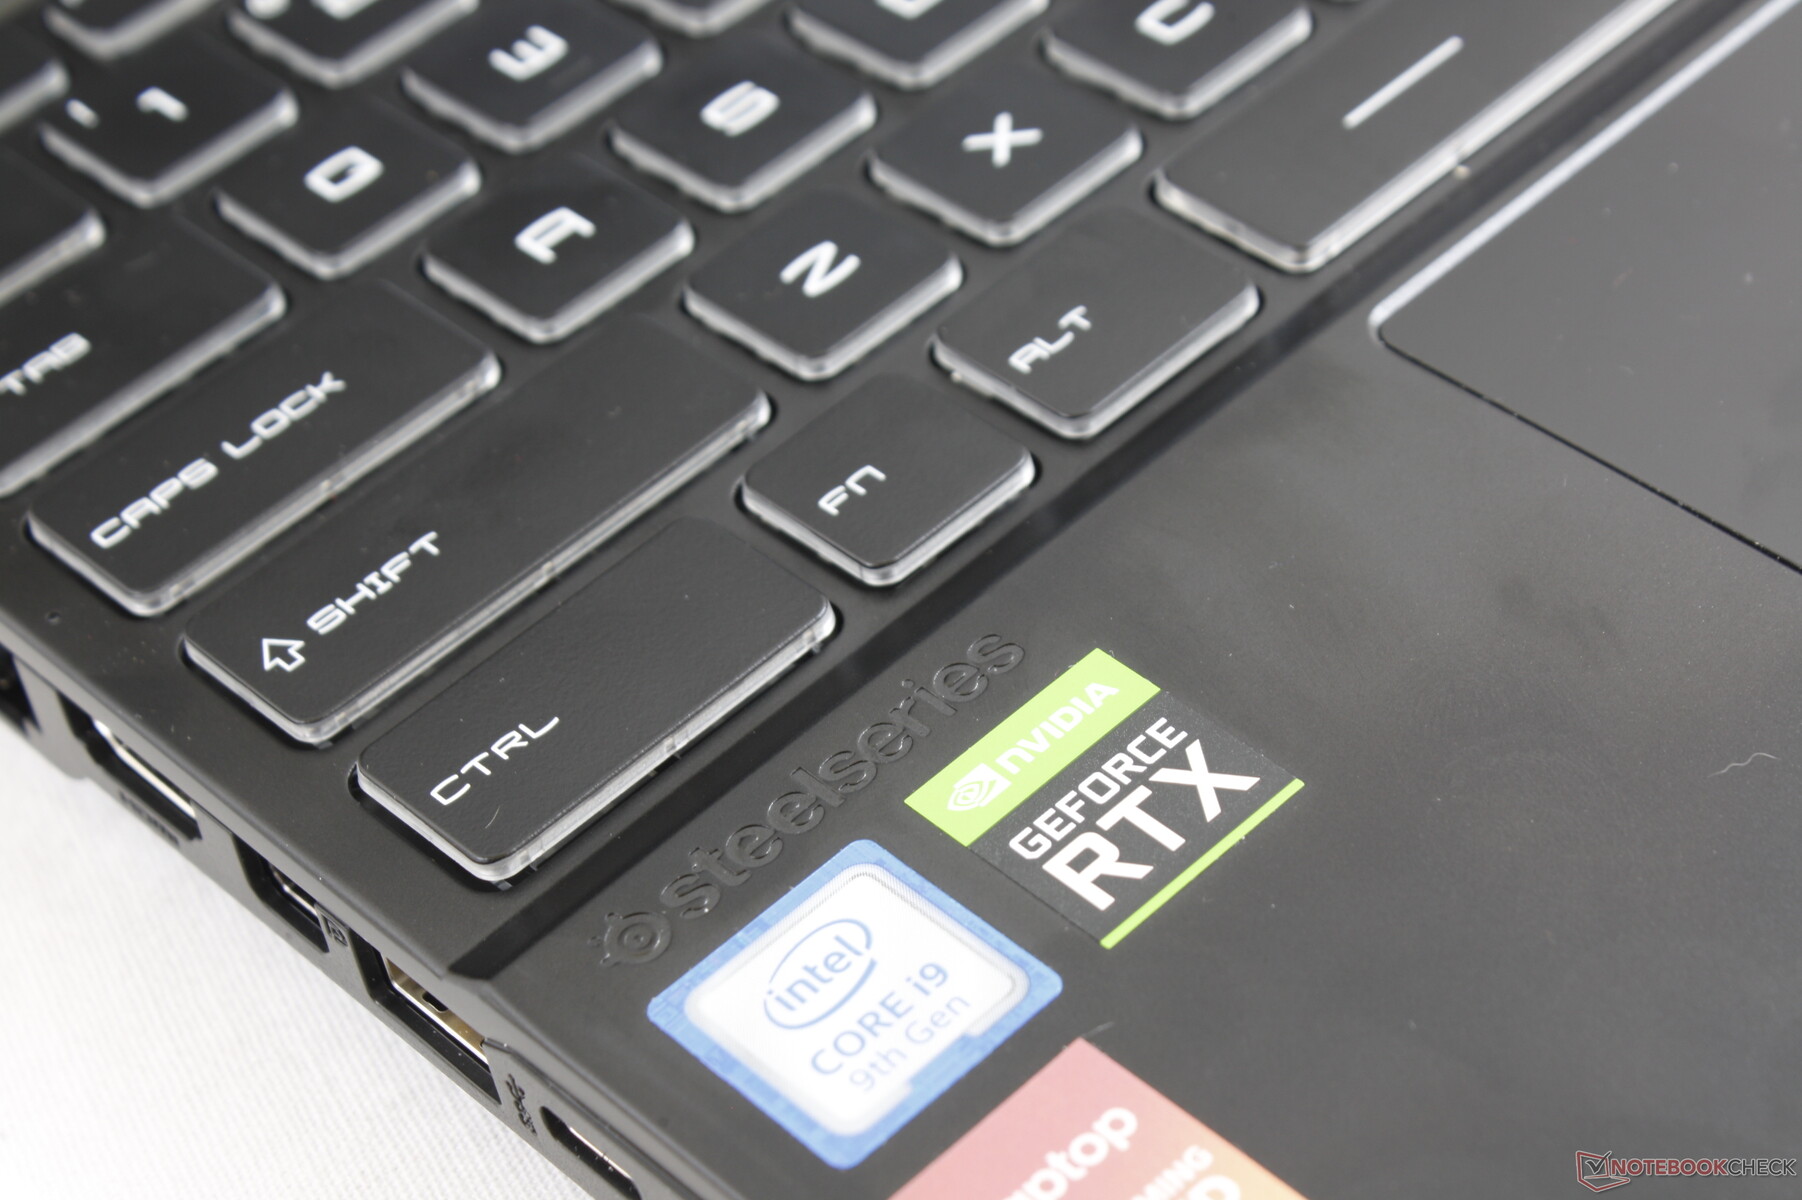
Keyboard
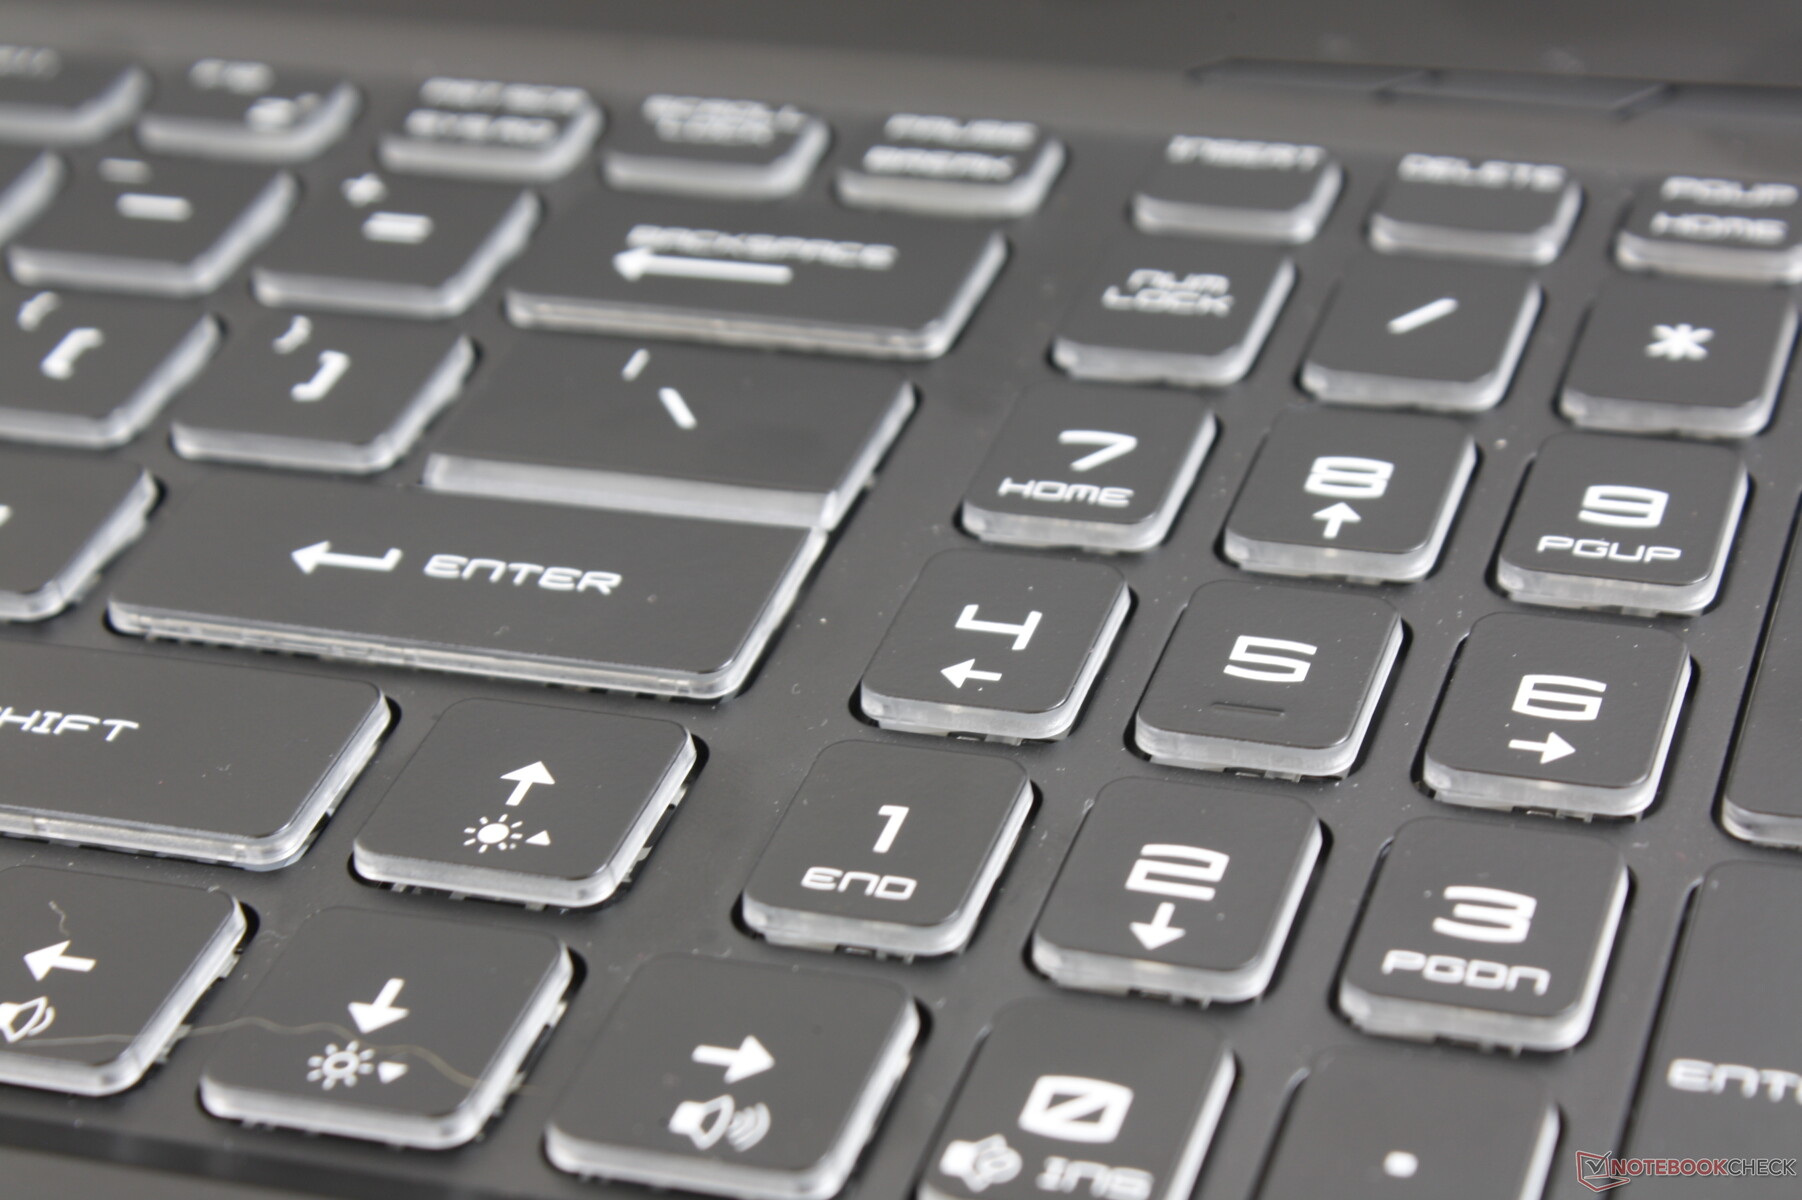
The SteelSeries keyboard remains unchanged from the GE63 despite the smaller footprint. This means that the per-key RGB lighting, uniform and firm key feedback, and moderate clatter are all back. Even the NumPad still feels cramped since its keys are narrower than the main QWERTY keys. If you've ever handled any other GS, GE, or GT series laptop from MSI, then you'll have a good idea of what to expect when typing on the GE65 as these SteelSeries keyboards are mostly consistent between models.
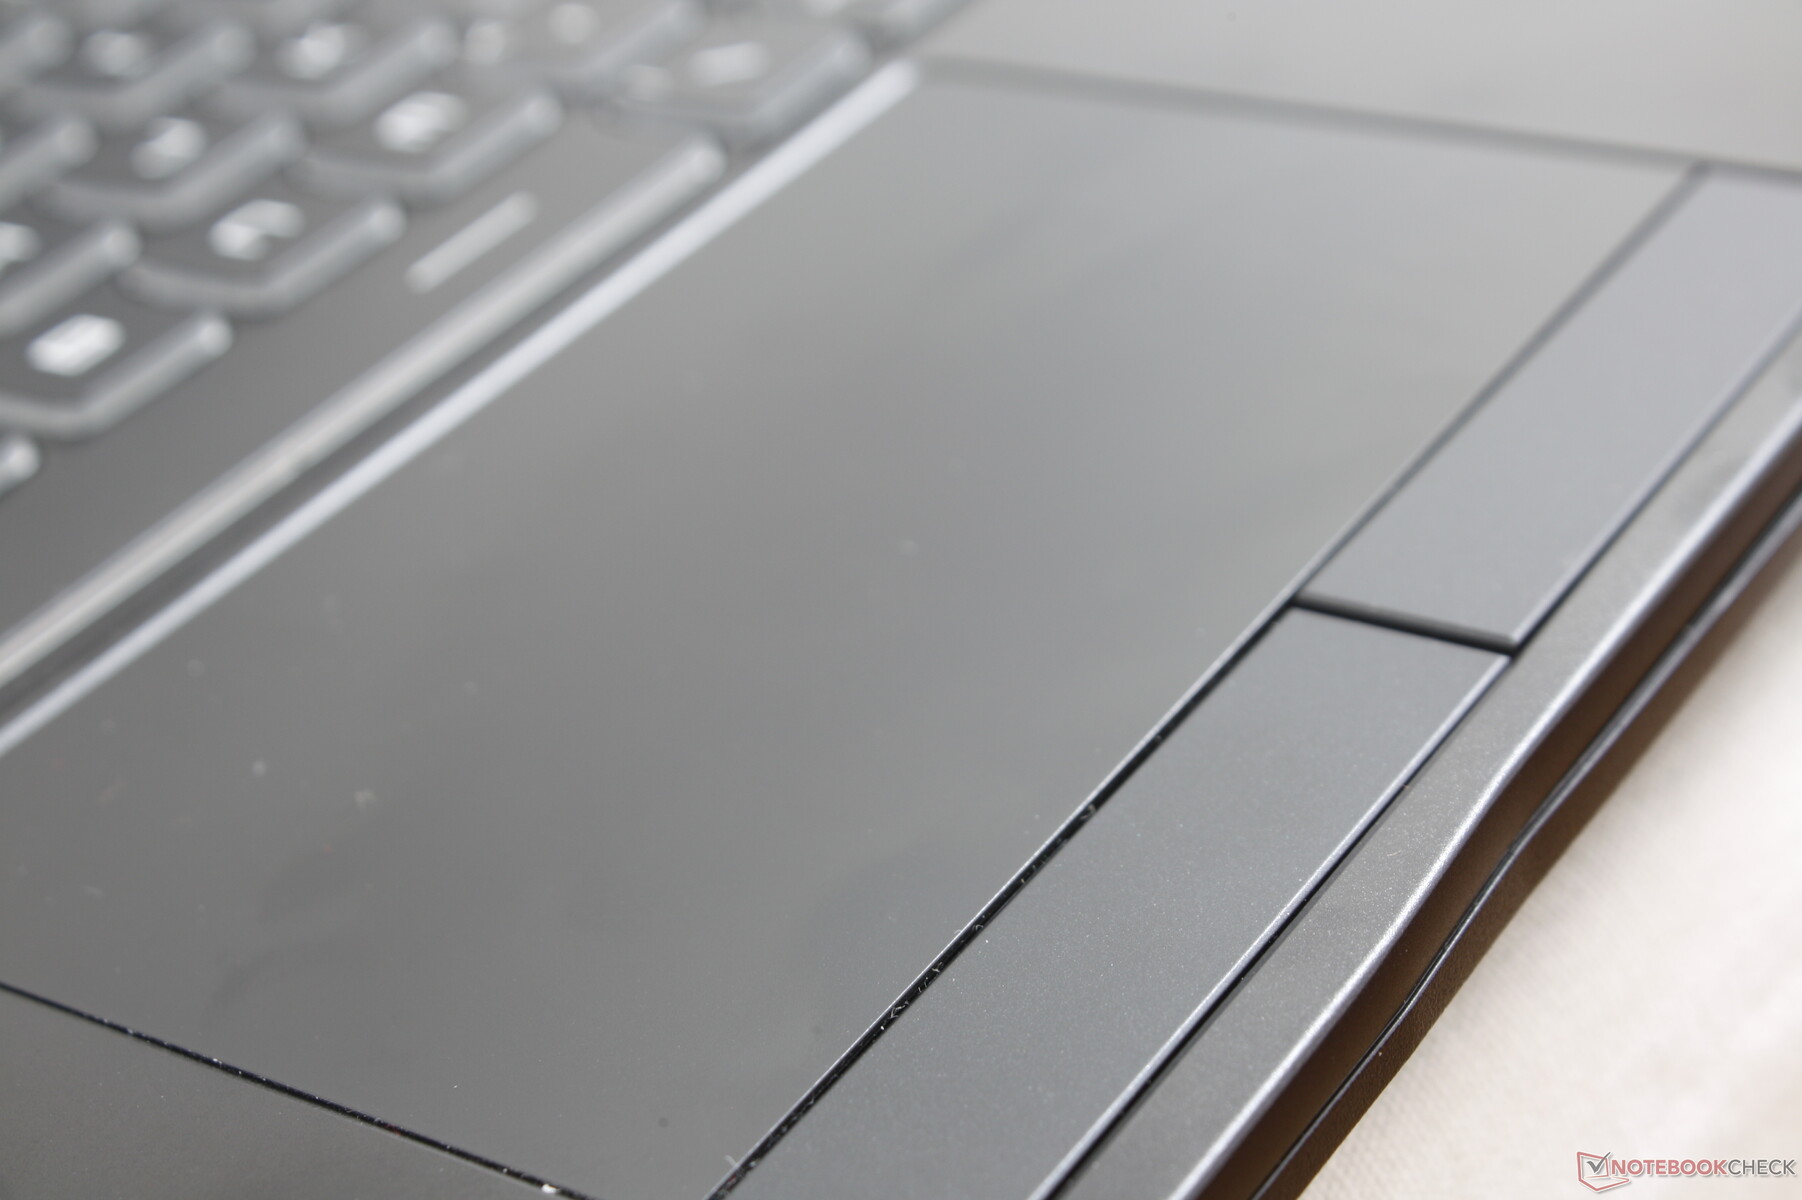
Touchpad
The touchpad is again identical to the GE63 in surface area (11 x 6.3 cm) and texture albeit without the tacky red rims of the last generation model. Fortunately, we didn't experience any cursor jumping issues that occurred on our GE63 unit. The dedicated mouse keys also return but with the same uneven feedback from the GE63. Clicking along the edges of the keys, for example, feels softer and with deeper travel than clicking from the center of either key.

Display
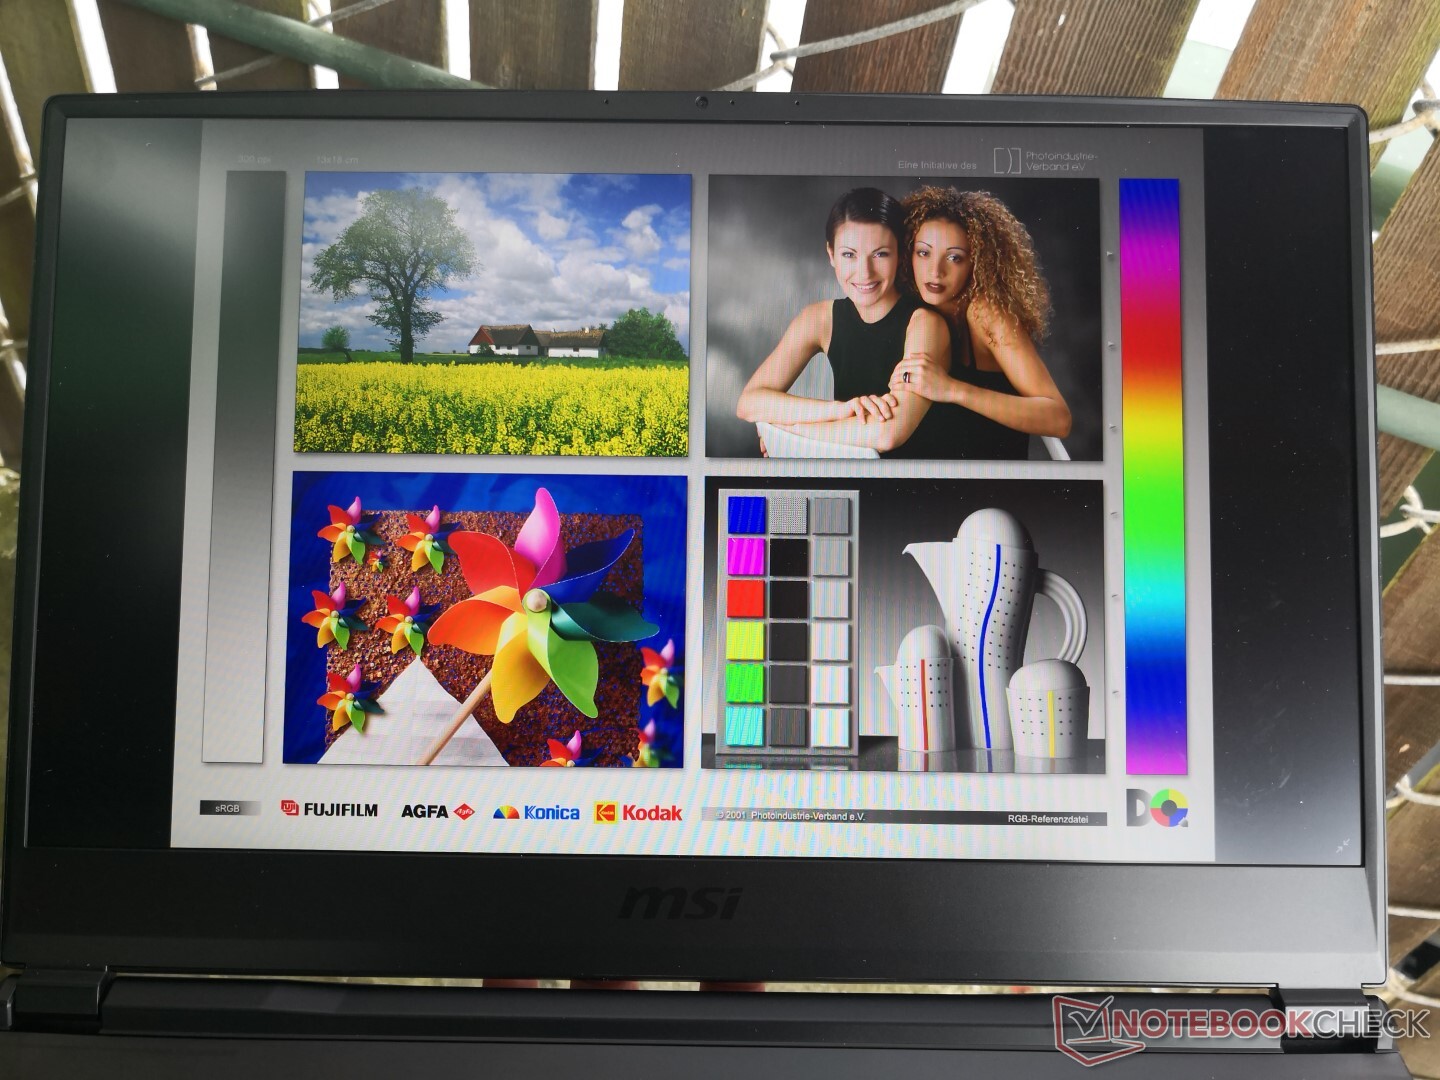
Our GE65 configuration utilizes the same 240 Hz Sharp LQ156M1JW03 IPS panel and SHP14C5 controller as found on the GS65 or Razer Blade 15. Subsequently, all three of these laptops share similar black-white and gray-gray response times, contrast levels, and gamut. The identical panels also explain how the GE65 and GS65 have almost exactly the same length and width. Display quality is actually not far from the 144 Hz AU Optronics panel on the last generation GE63 save for the higher native refresh rate.
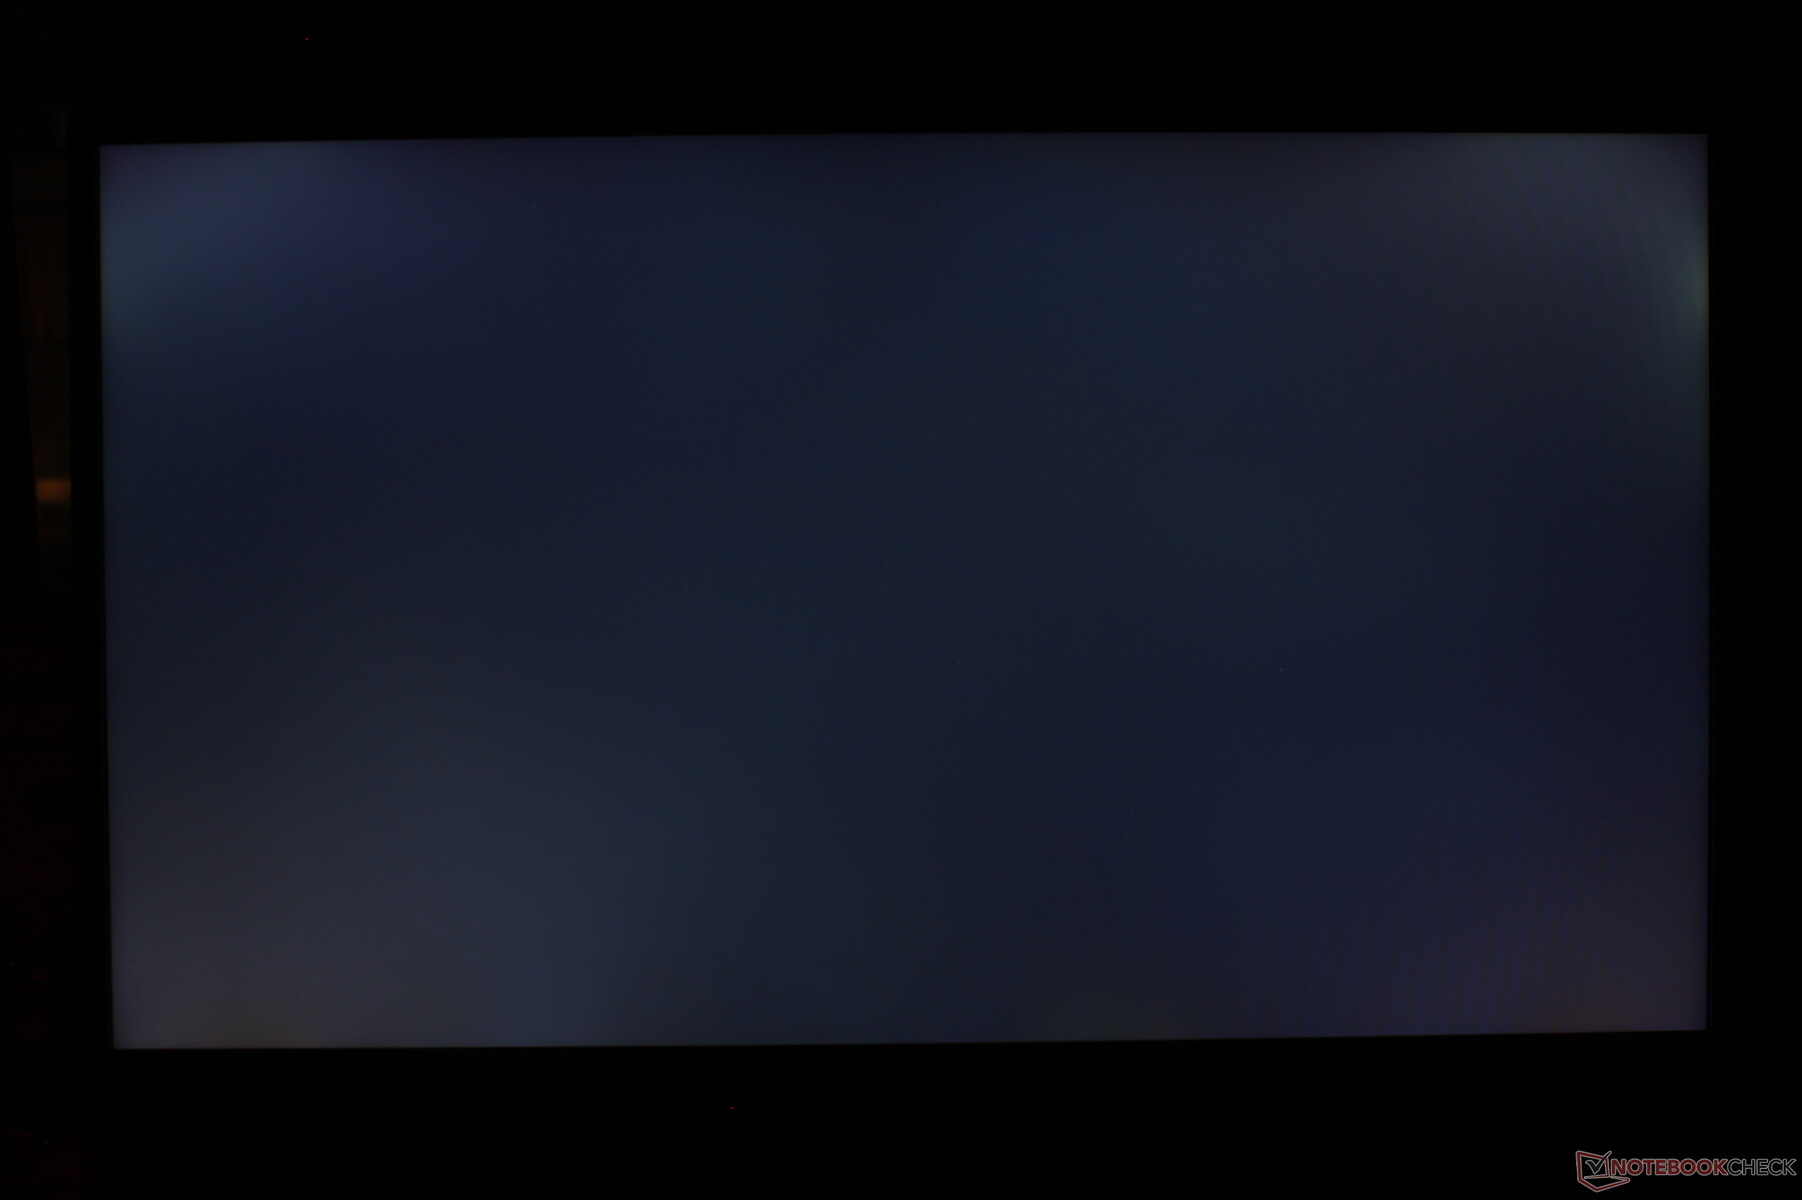
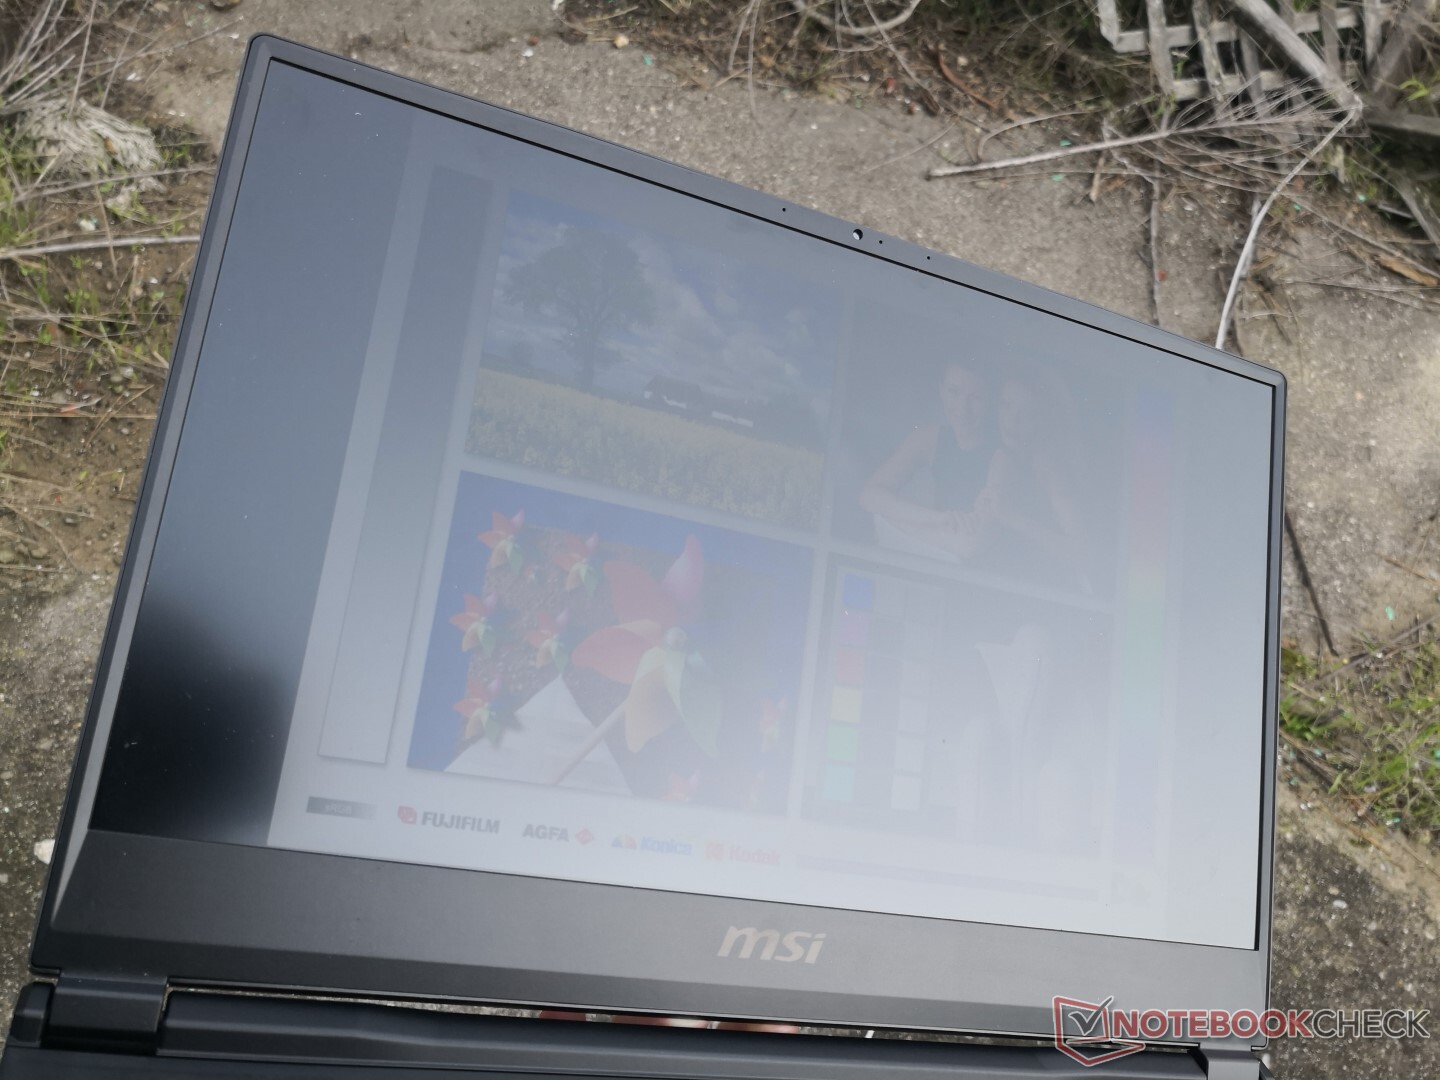
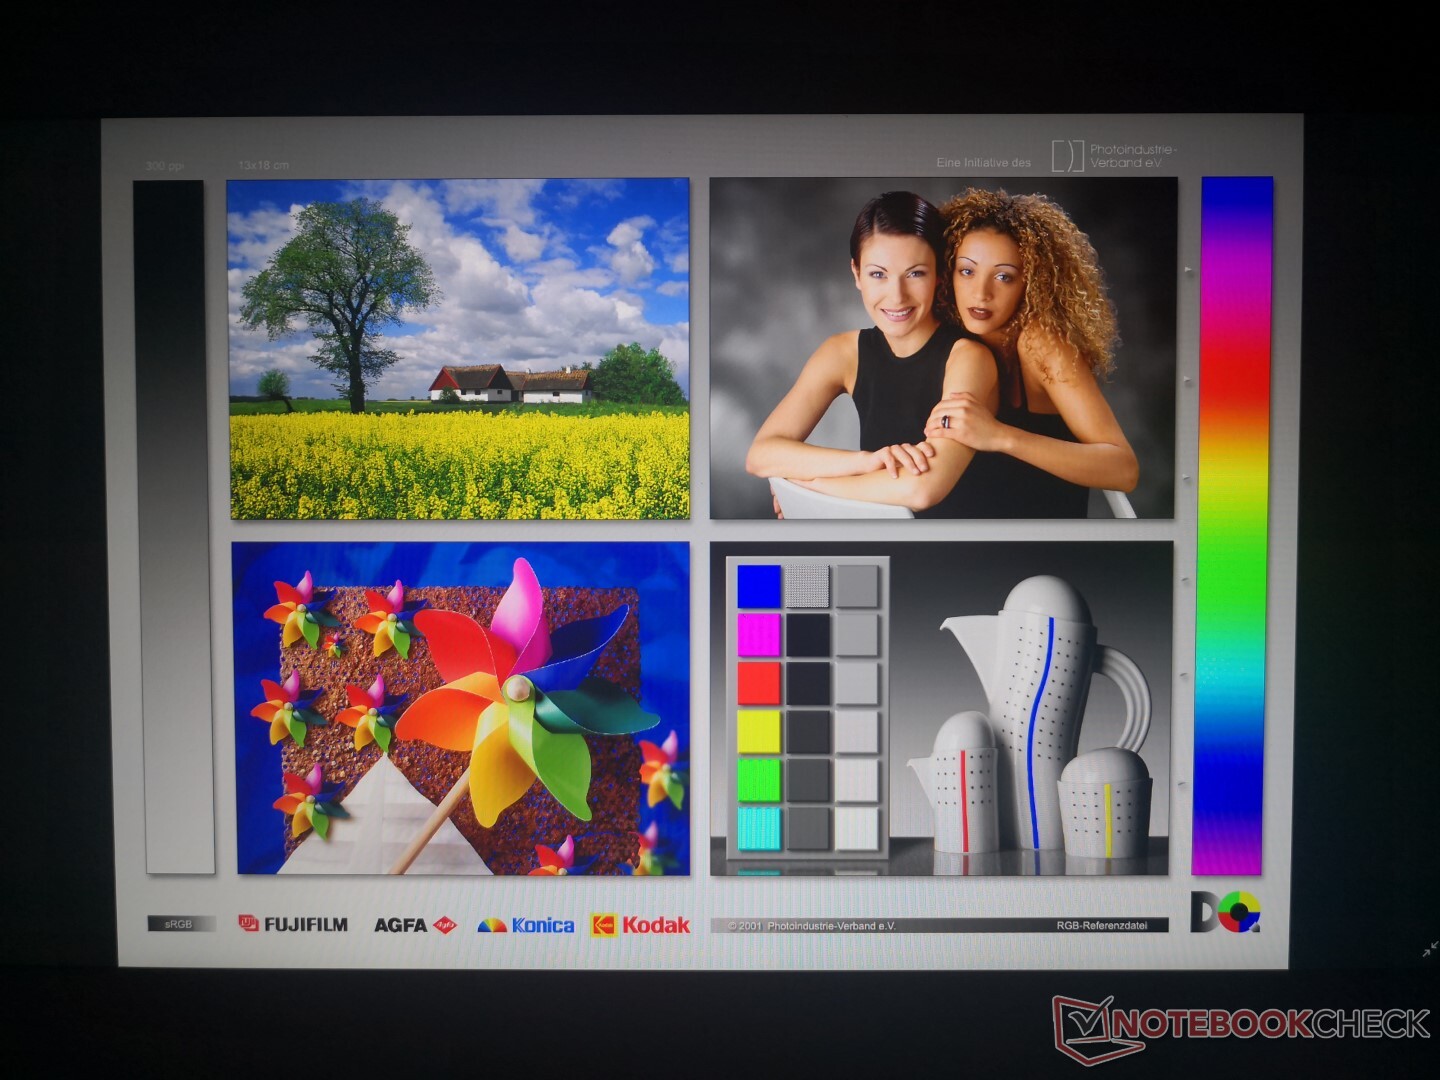
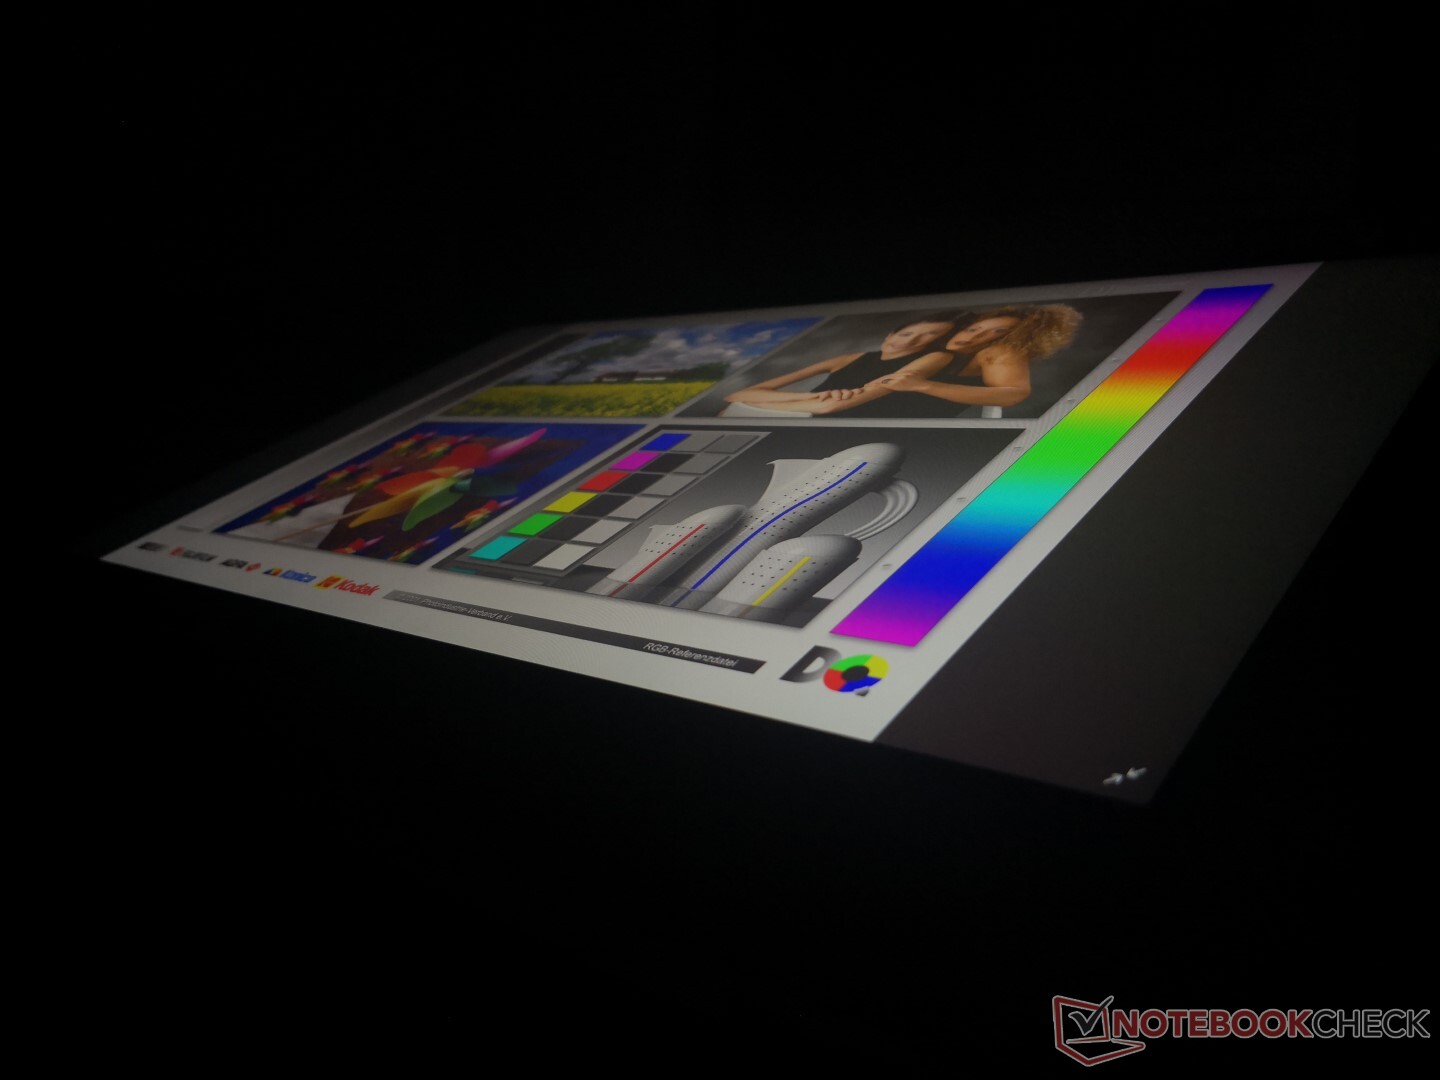
Graininess is minimal despite the matte overlay for crisp texts and images. Uneven backlight bleeding, however, is noticeable around the edges of our test unit as shown by the picture below. MSI offers no OLED options on any of its laptops as of this writing unlike Razer or Dell.
Interestingly, pulse-width modulation occurs at exactly the same brightness levels (19 percent and under) and at nearly the same frequency as on the GS65 to suggest that MSI is using the same backlight components between the two models.

| |||||||||||||||||||||||||
Brightness Distribution: 90 %
Center on Battery: 277.4 cd/m²
Contrast: 1156:1 (Black: 0.24 cd/m²)
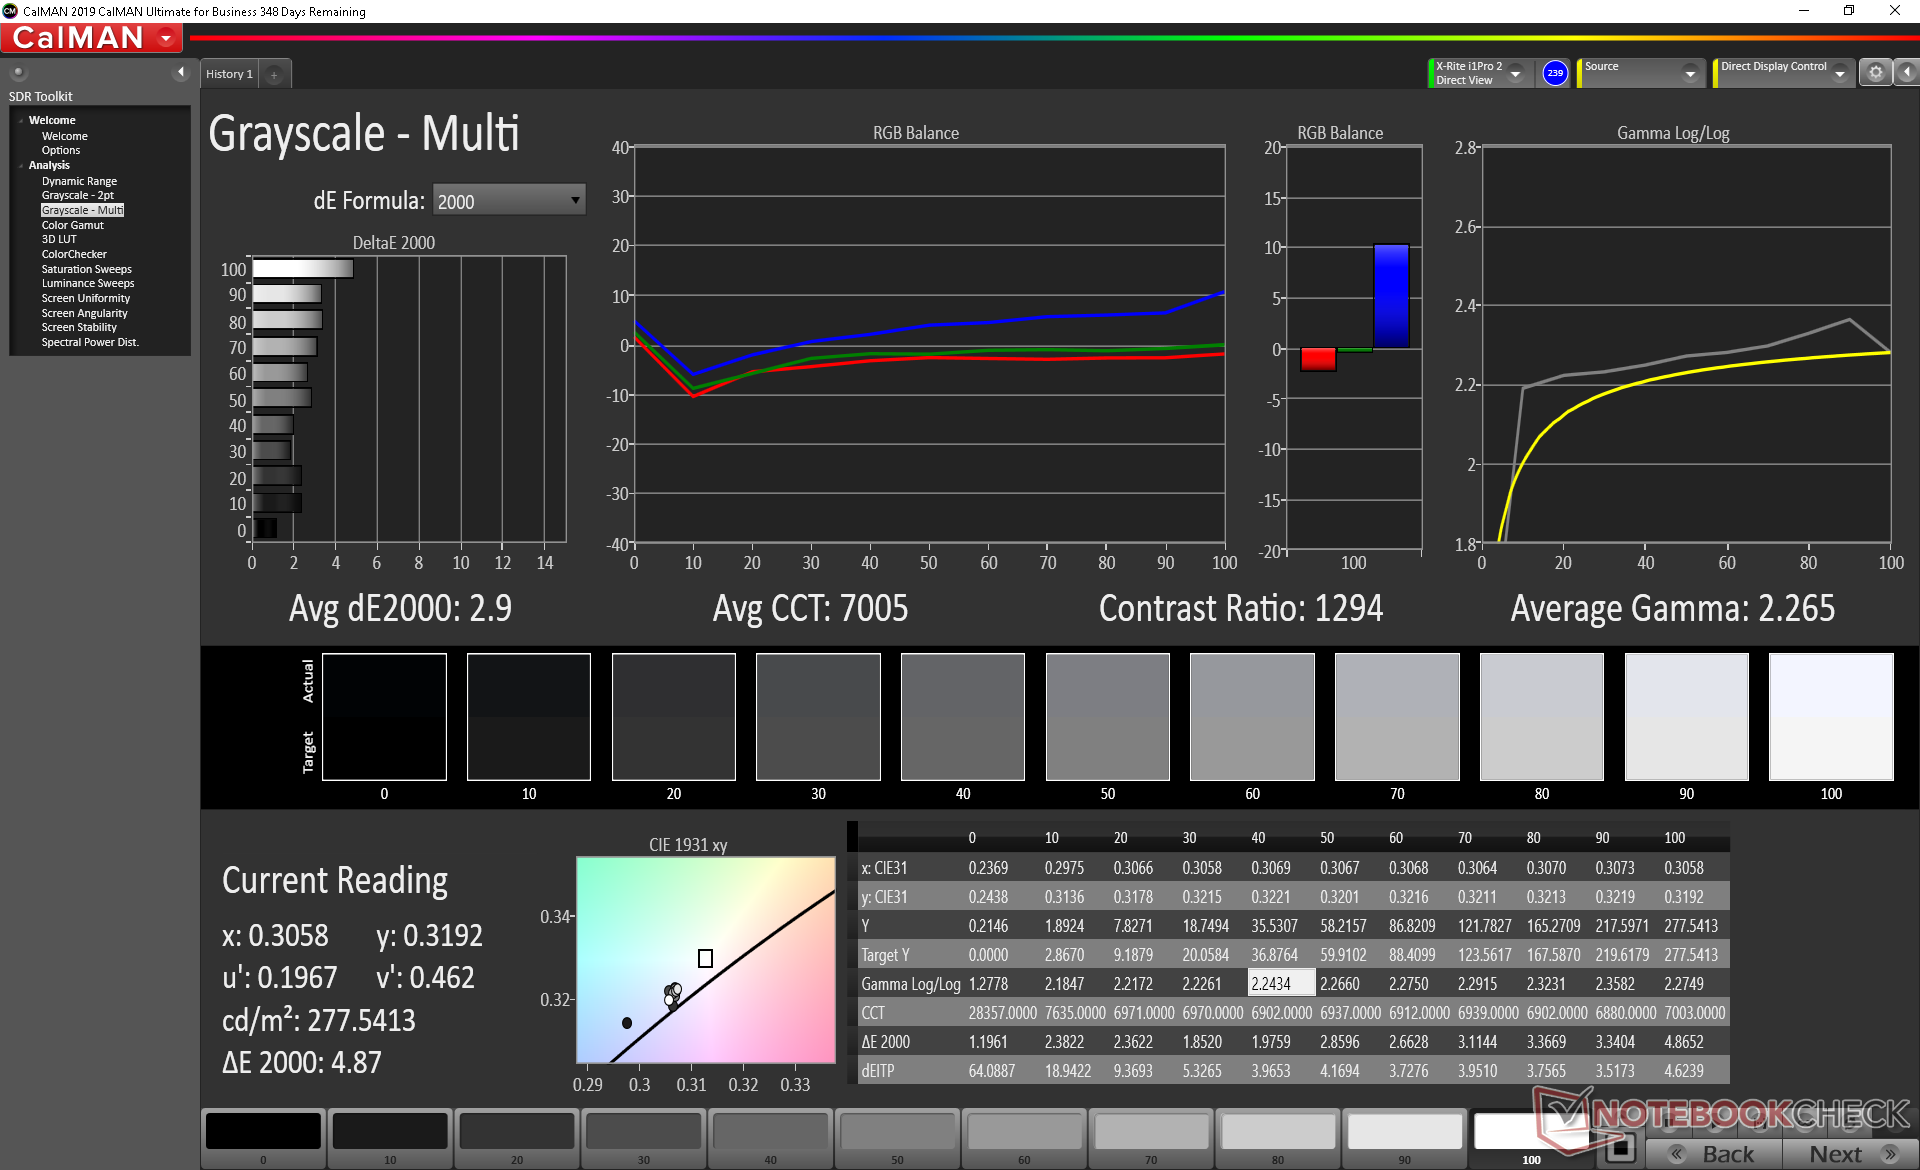
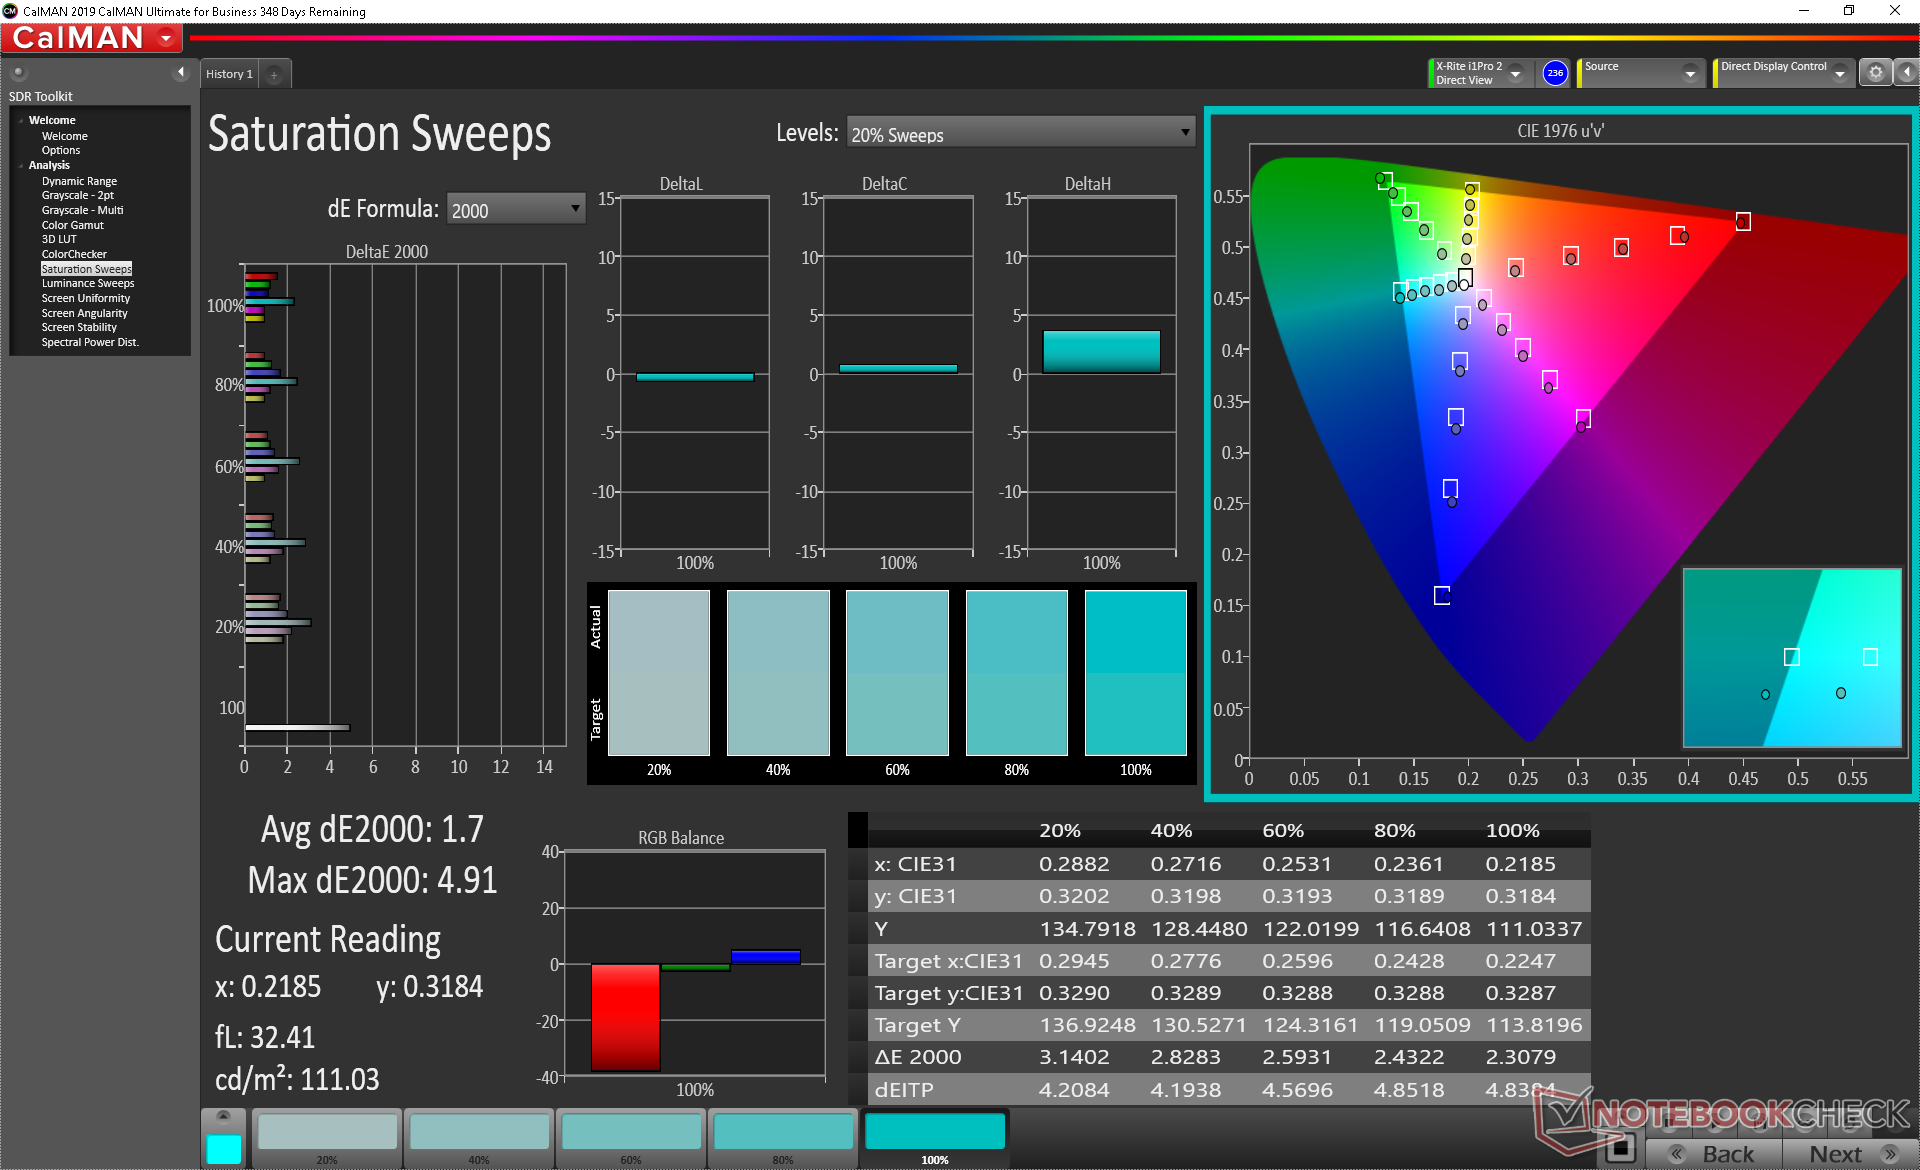
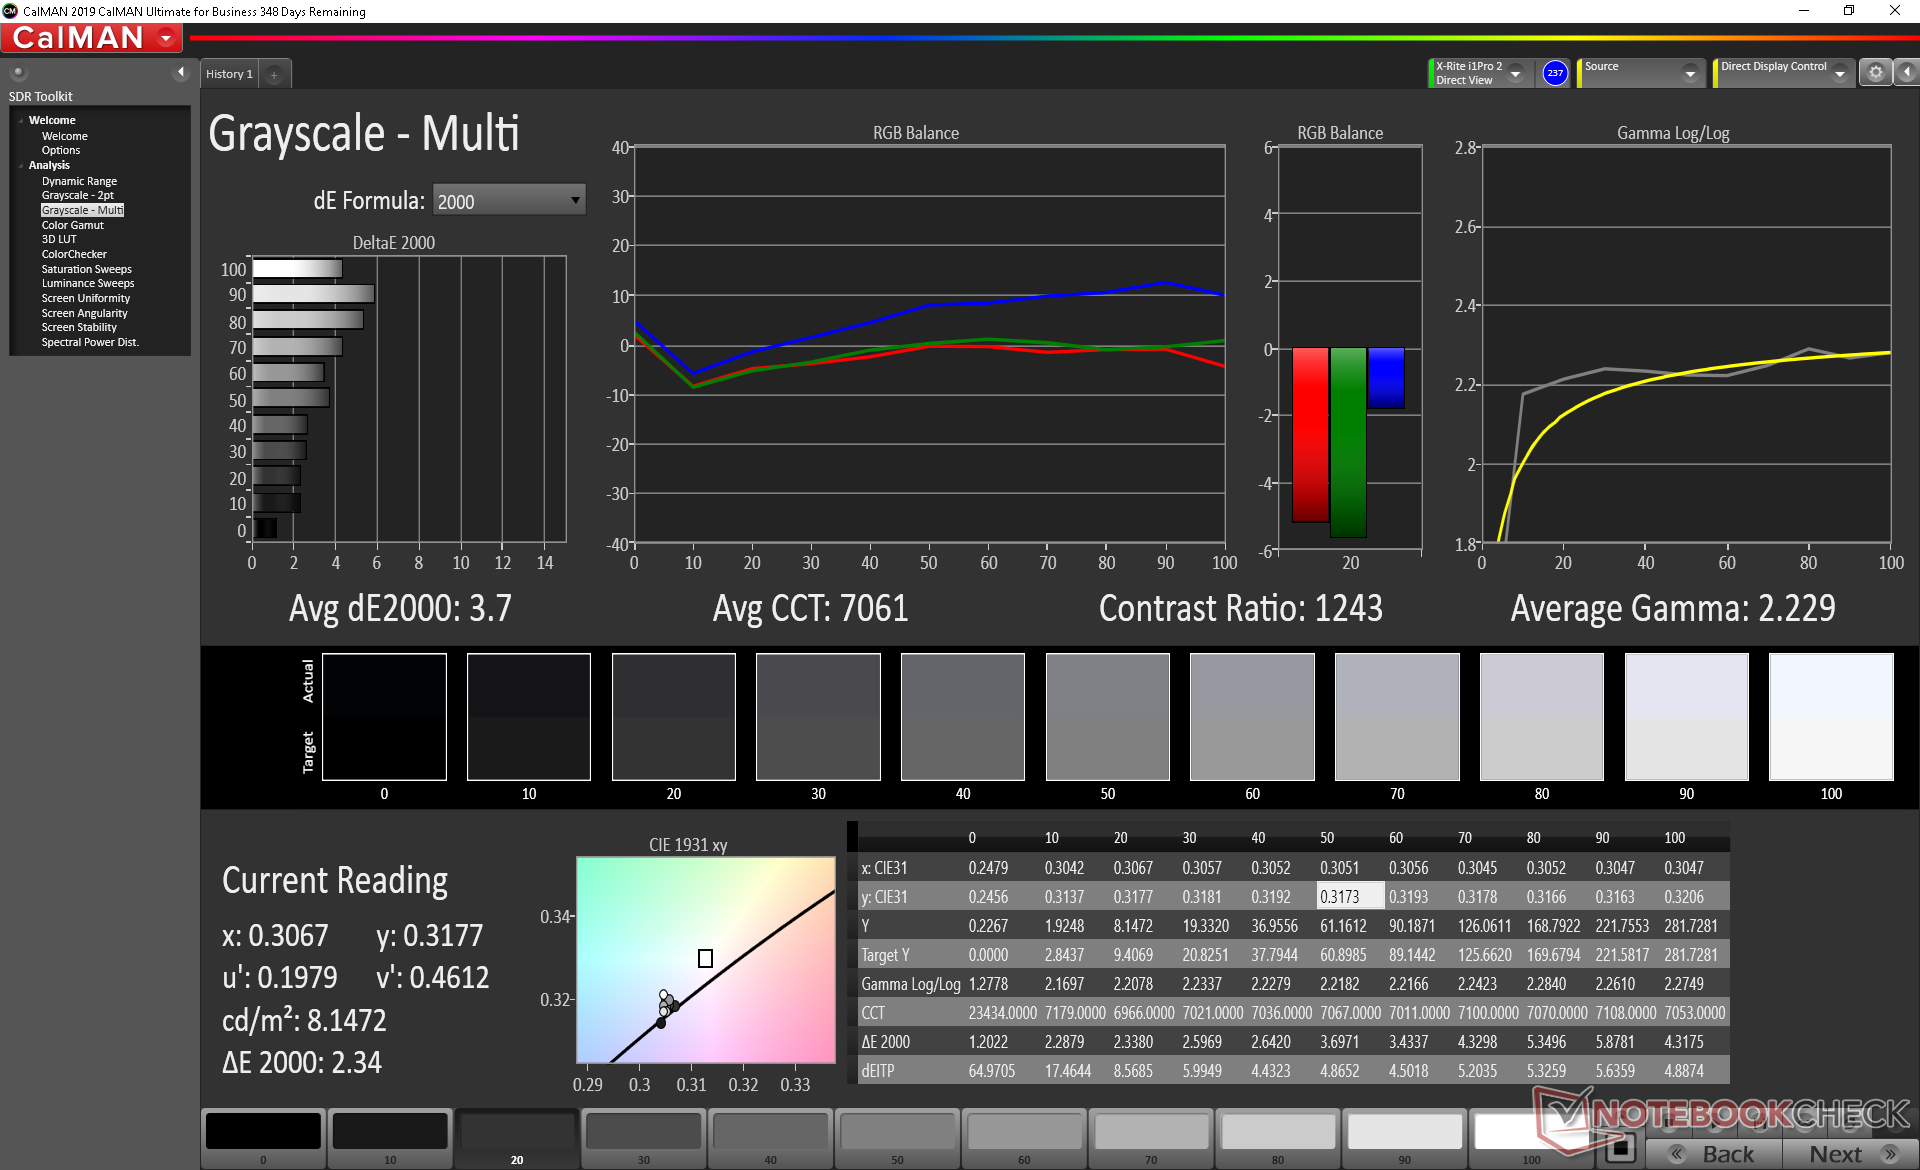
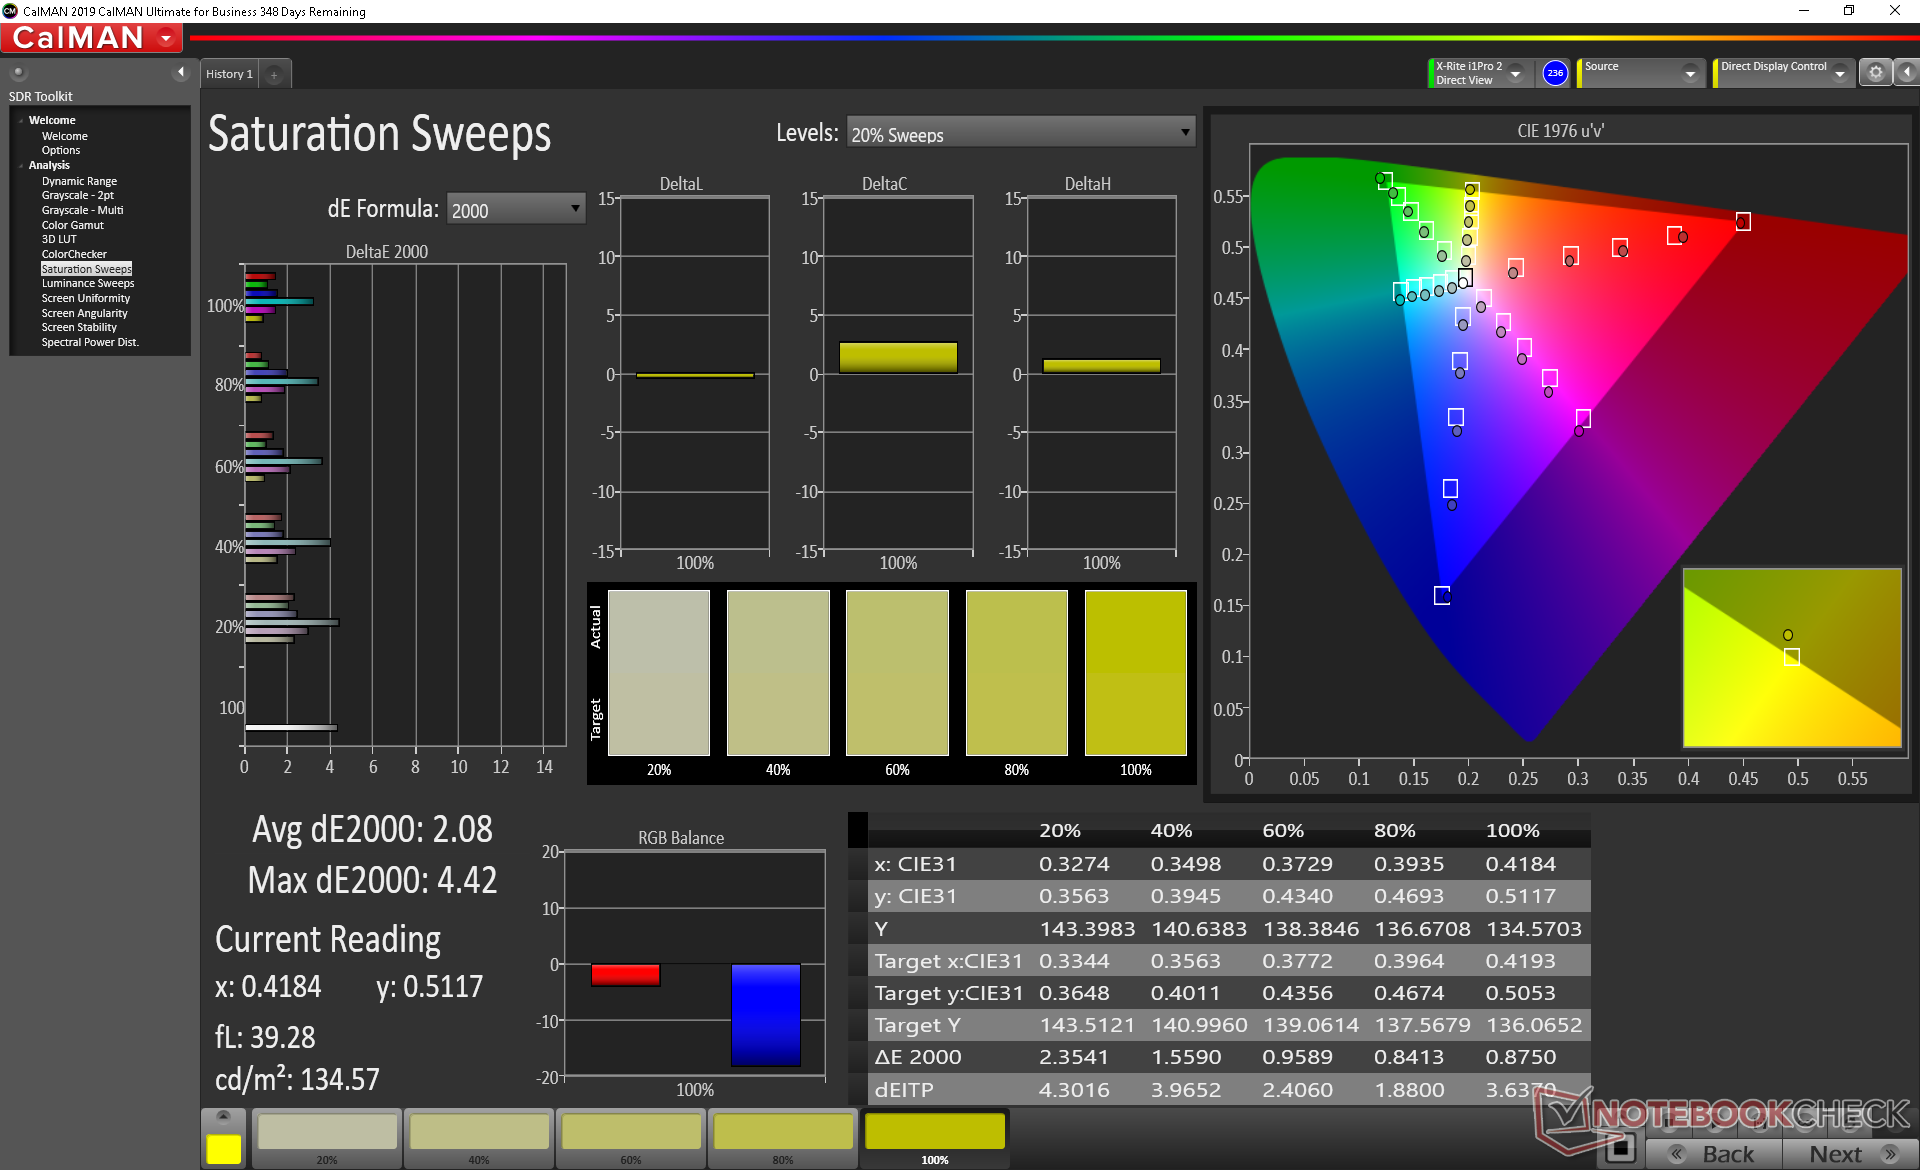
ΔE ColorChecker Calman: 1.51 | ∀{0.5-29.43 Ø4.73}
calibrated: 1.77
ΔE Greyscale Calman: 3.7 | ∀{0.09-98 Ø4.97}
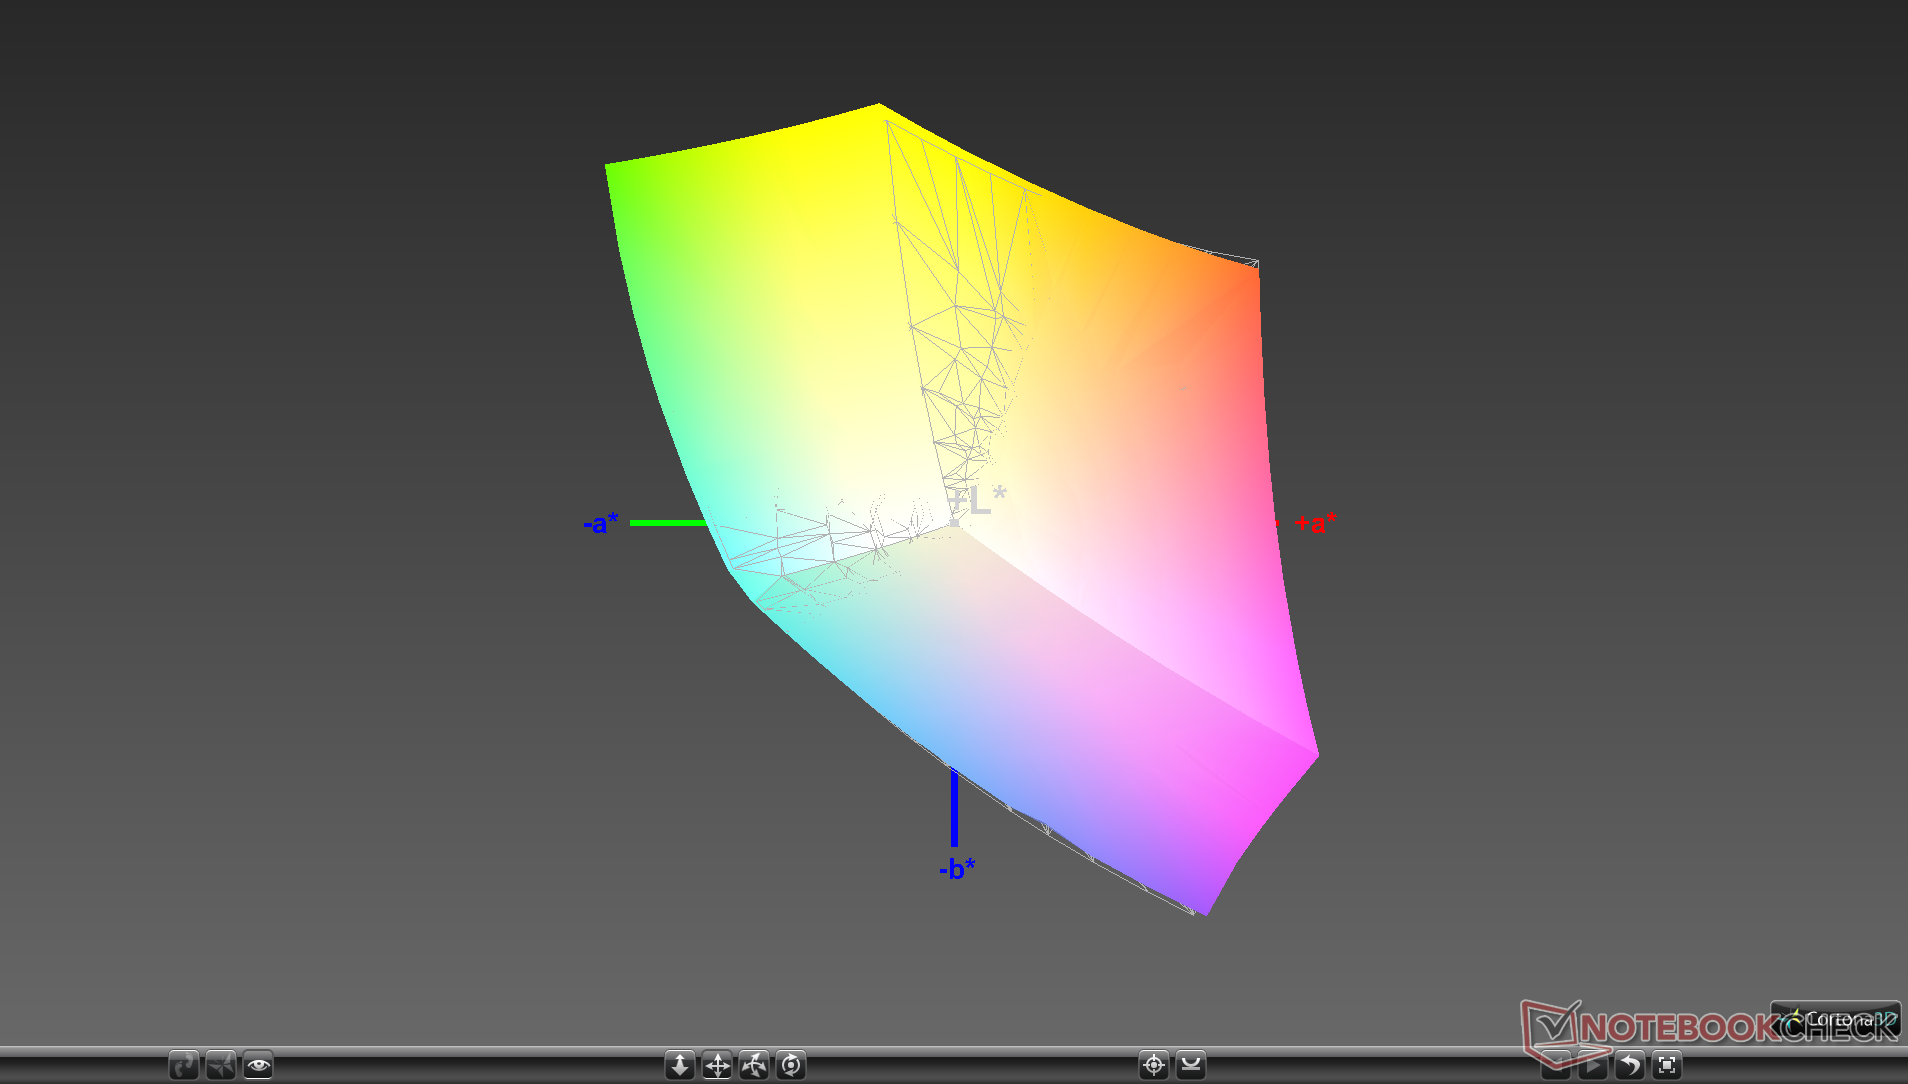
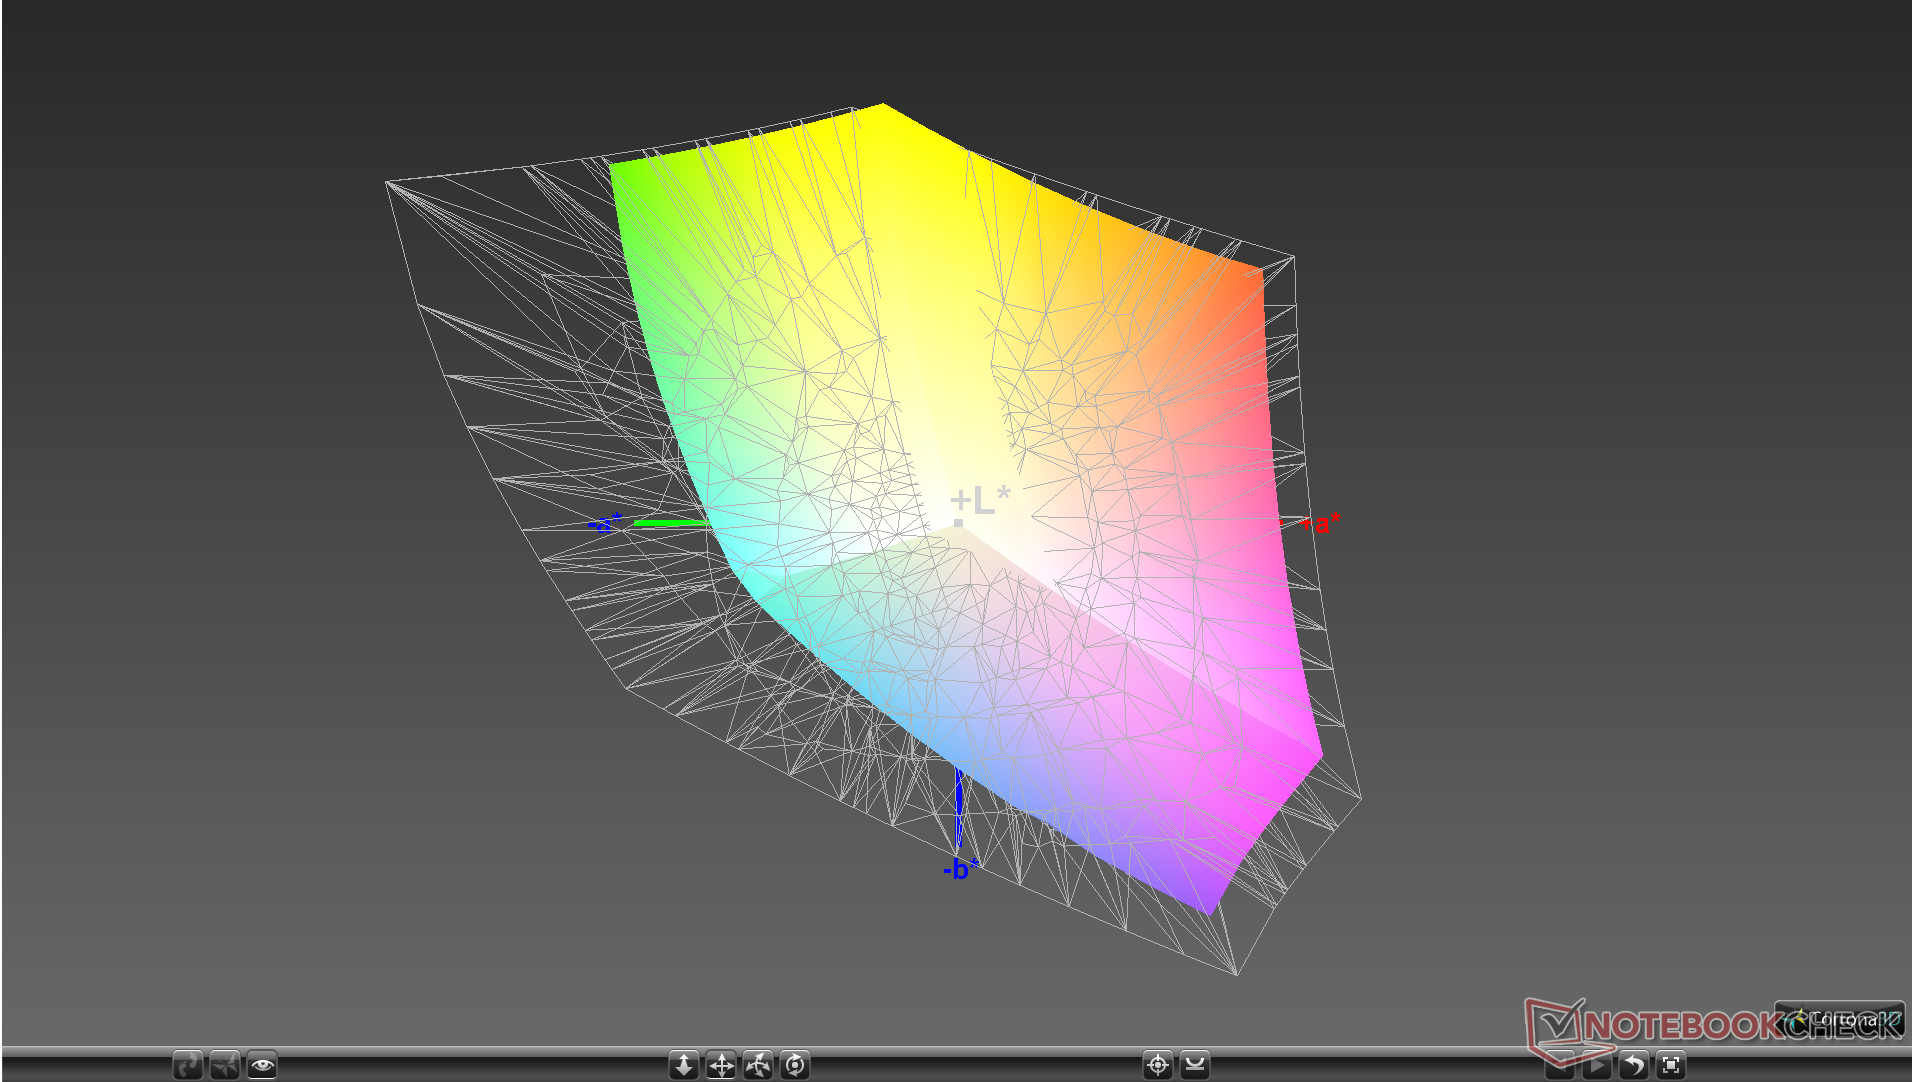
99.1% sRGB (Argyll 1.6.3 3D)
65.1% AdobeRGB 1998 (Argyll 1.6.3 3D)
70.7% AdobeRGB 1998 (Argyll 3D)
98.9% sRGB (Argyll 3D)
69.3% Display P3 (Argyll 3D)
Gamma: 2.23
CCT: 7061 K
| MSI GE65 Raider 9SF-049US Sharp LQ156M1JW03, IPS, 15.6", 1920x1080 | MSI GE63 Raider 8SG AU Optronics B156HAN07.1, IPS, 15.6", 1920x1080 | Lenovo Legion Y740-15ICHg BOE NV156FHM-N4J, IPS, 15.6", 1920x1080 | Alienware m15 R2 P87F Sharp LQ156M1, IPS, 15.6", 1920x1080 | Asus Strix GL531GV-PB74 Panda LM156LF-GL02, IPS, 15.6", 1920x1080 | Razer Blade 15 GTX 1660 Ti BOE NV156FHM-N4K, IPS, 15.6", 1920x1080 | |
|---|---|---|---|---|---|---|
| Display | -7% | -5% | -6% | -41% | -6% | |
| Display P3 Coverage (%) | 69.3 | 65.1 -6% | 67.7 -2% | 65.3 -6% | 40.13 -42% | 65.3 -6% |
| sRGB Coverage (%) | 98.9 | 91.7 -7% | 91.6 -7% | 95.1 -4% | 60.3 -39% | 91.8 -7% |
| AdobeRGB 1998 Coverage (%) | 70.7 | 65.9 -7% | 67.1 -5% | 65.9 -7% | 41.48 -41% | 66.5 -6% |
| Response Times | 17% | -17% | -2% | -113% | 4% | |
| Response Time Grey 50% / Grey 80% * (ms) | 13.2 ? | 8.8 ? 33% | 19 ? -44% | 16.4 ? -24% | 26 ? -97% | 13.6 ? -3% |
| Response Time Black / White * (ms) | 11.2 ? | 11.2 ? -0% | 10 ? 11% | 8.8 ? 21% | 25.6 ? -129% | 10 ? 11% |
| PWM Frequency (Hz) | 23150 ? | 23810 ? | 200 ? | |||
| Screen | -7% | 2% | -51% | -84% | -29% | |
| Brightness middle (cd/m²) | 277.4 | 268.3 -3% | 477 72% | 324.2 17% | 290.1 5% | 312.7 13% |
| Brightness (cd/m²) | 264 | 261 -1% | 431 63% | 304 15% | 274 4% | 305 16% |
| Brightness Distribution (%) | 90 | 84 -7% | 84 -7% | 90 0% | 86 -4% | 90 0% |
| Black Level * (cd/m²) | 0.24 | 0.2 17% | 0.175 27% | 0.38 -58% | 0.54 -125% | 0.27 -13% |
| Contrast (:1) | 1156 | 1342 16% | 2726 136% | 853 -26% | 537 -54% | 1158 0% |
| Colorchecker dE 2000 * | 1.51 | 2.65 -75% | 4.17 -176% | 5.01 -232% | 5.16 -242% | 4.57 -203% |
| Colorchecker dE 2000 max. * | 4.93 | 4.67 5% | 6.97 -41% | 12.7 -158% | 18.09 -267% | 6.81 -38% |
| Colorchecker dE 2000 calibrated * | 1.77 | 2.76 -56% | 2.51 -42% | 1.64 7% | 4.35 -146% | 2.91 -64% |
| Greyscale dE 2000 * | 3.7 | 2.2 41% | 3.49 6% | 7.9 -114% | 4.4 -19% | 4.3 -16% |
| Gamma | 2.23 99% | 2.33 94% | 2.5 88% | 2.35 94% | 2.1 105% | 2.29 96% |
| CCT | 7061 92% | 6862 95% | 7076 92% | 8455 77% | 7362 88% | 7098 92% |
| Color Space (Percent of AdobeRGB 1998) (%) | 65.1 | 59.3 -9% | 60 -8% | 60.8 -7% | 38.1 -41% | 59.4 -9% |
| Color Space (Percent of sRGB) (%) | 99.1 | 93.3 -6% | 91 -8% | 95.5 -4% | 60 -39% | 91.3 -8% |
| Total Average (Program / Settings) | 1% /
-4% | -7% /
-2% | -20% /
-36% | -79% /
-80% | -10% /
-21% |
* ... smaller is better
Color space covers sRGB in its entirety and approximately 65 percent of AdobeRGB to be similar to most high-refresh rate 15.6-inch panels currently in the market. If deeper colors are desired, then you'll have to consider the Razer Blade Pro 120 Hz model or non-gaming laptops with 4K UHD IGZO or OLED options.
The display is well-calibrated out of the box especially for a mid-range gaming laptop. Average grayscale and color DeltaE values sit at just 2.9 and 1.7, respectively, to be better calibrated than most other gaming laptops in this price range. Our attempts to calibrate the display even further did not produce better results.

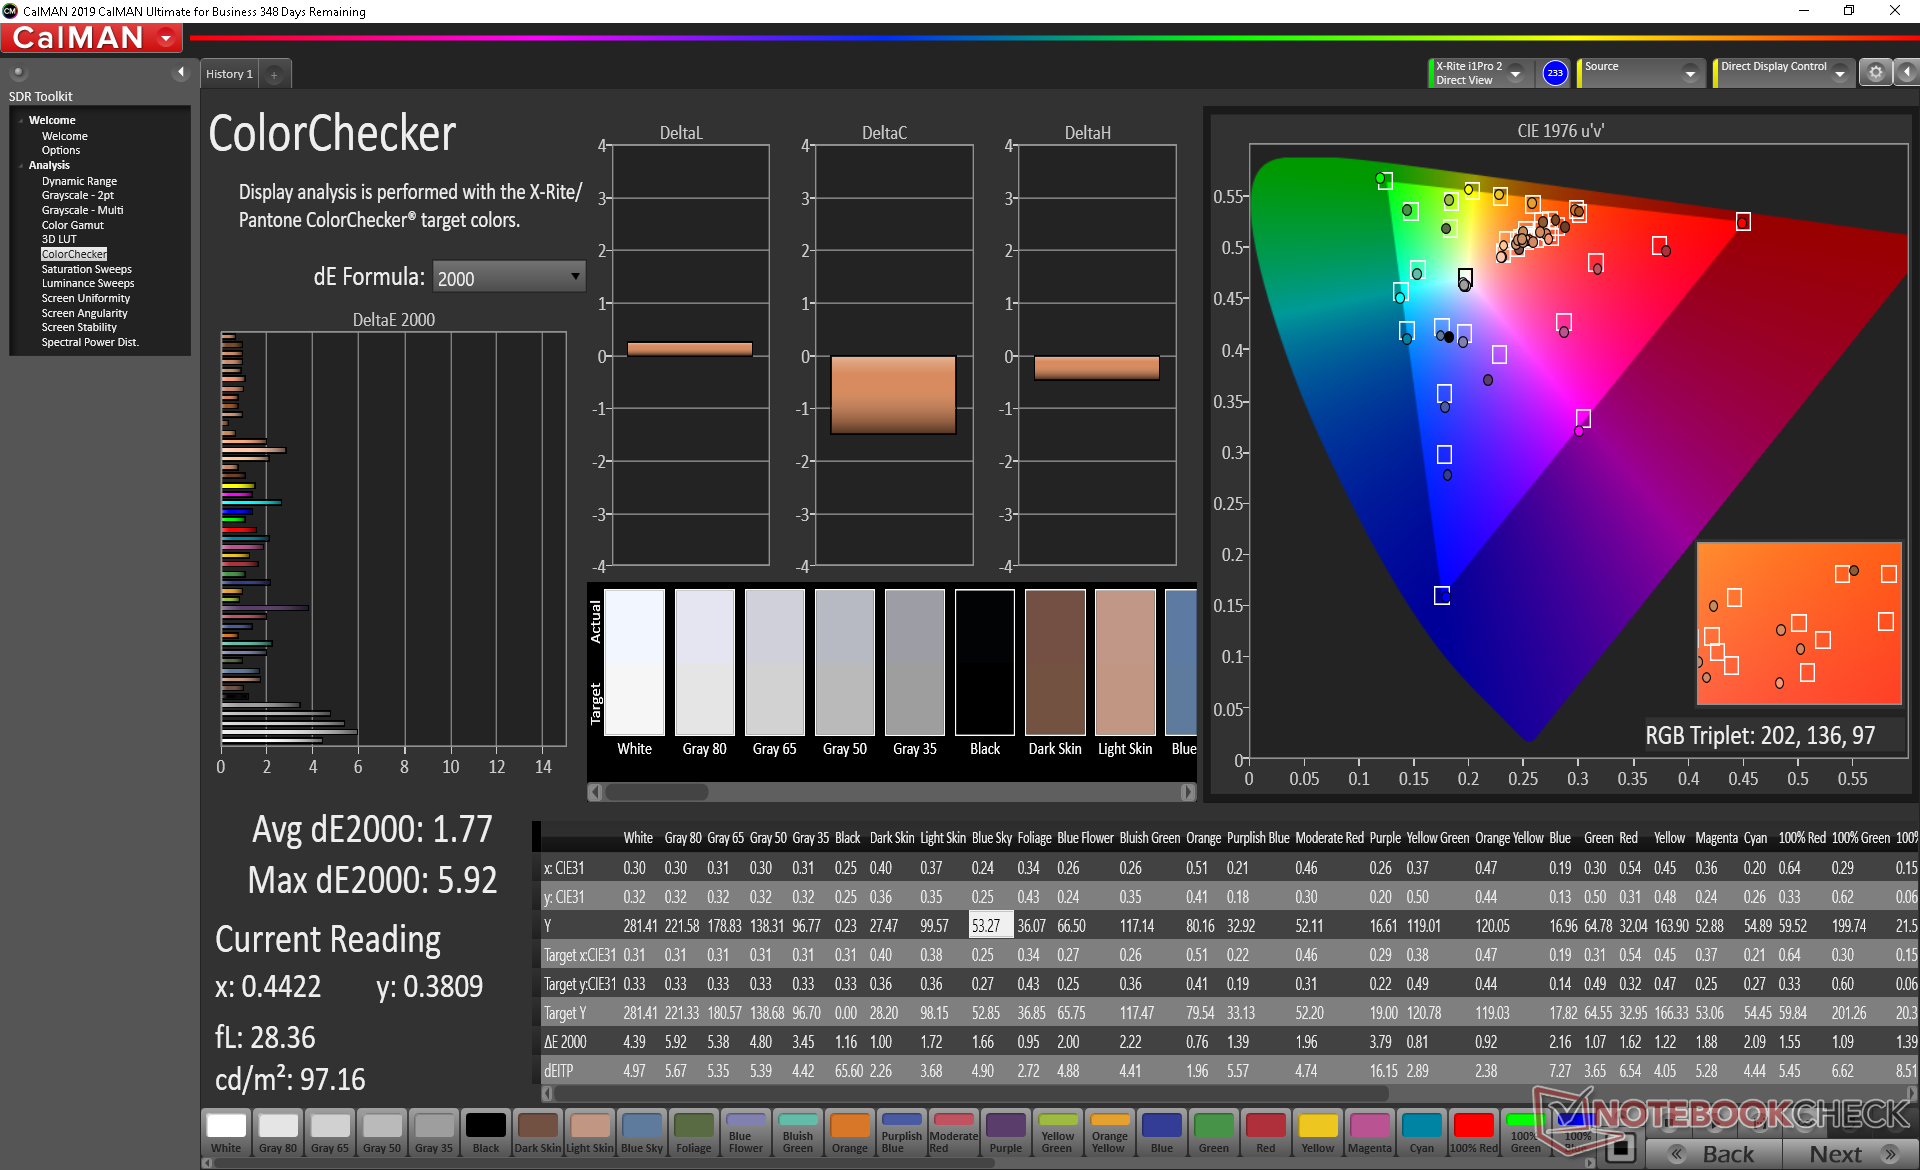
Display Response Times
| ↔ Response Time Black to White | ||
|---|---|---|
| 11.2 ms ... rise ↗ and fall ↘ combined | ↗ 6 ms rise | 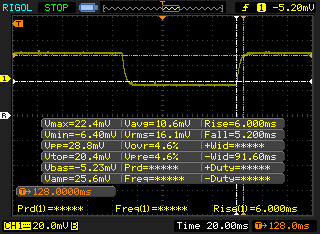 |
| ↘ 5.2 ms fall | ||
| The screen shows good response rates in our tests, but may be too slow for competitive gamers. In comparison, all tested devices range from 0.1 (minimum) to 240 (maximum) ms. » 30 % of all devices are better. This means that the measured response time is better than the average of all tested devices (19.9 ms). | ||
| ↔ Response Time 50% Grey to 80% Grey | ||
| 13.2 ms ... rise ↗ and fall ↘ combined | ↗ 7.2 ms rise | 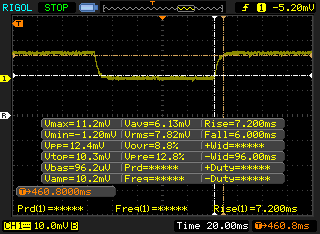 |
| ↘ 6 ms fall | ||
| The screen shows good response rates in our tests, but may be too slow for competitive gamers. In comparison, all tested devices range from 0.165 (minimum) to 636 (maximum) ms. » 27 % of all devices are better. This means that the measured response time is better than the average of all tested devices (31.1 ms). | ||
Screen Flickering / PWM (Pulse-Width Modulation)
| Screen flickering / PWM detected | 23150 Hz | ≤ 19 % brightness setting |  |
The display backlight flickers at 23150 Hz (worst case, e.g., utilizing PWM) Flickering detected at a brightness setting of 19 % and below. There should be no flickering or PWM above this brightness setting. The frequency of 23150 Hz is quite high, so most users sensitive to PWM should not notice any flickering. In comparison: 52 % of all tested devices do not use PWM to dim the display. If PWM was detected, an average of 7794 (minimum: 5 - maximum: 343500) Hz was measured. | |||
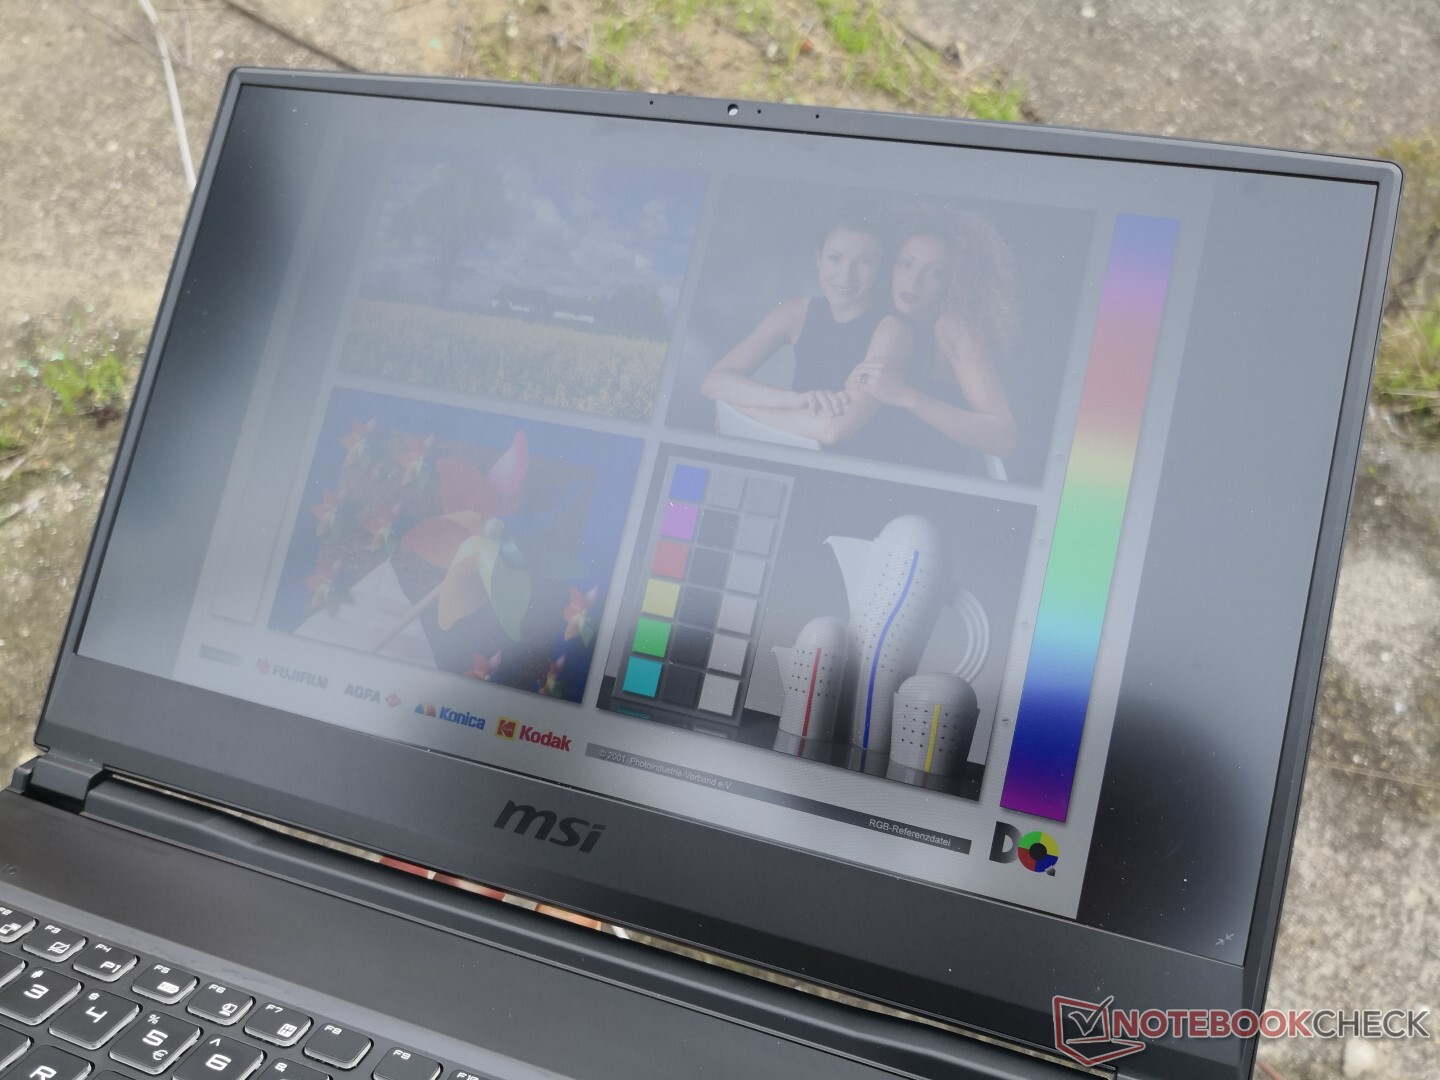
Outdoor visibility is the same as on the GE63 since brightness and contrast are nearly identical between them. Viewing angles are wide, but contrast will degrade if viewing from more extreme angles.
Performance
As an upper mid-range gaming laptop, MSI has equipped the GE65 with upper mid-range components including up to the Core i9-9880H CPU and GeForce RTX 2070 GPU. Higher-end components like the unlocked Core i9-9980HK and GeForce RTX 2080 are reserved for MSI's top-of-the-line GT series instead. There are no Max-Q options here unlike on the ultra-thin GS series.
Optimus comes standard to automatically exclude G-Sync. The 240 Hz refresh rate lessens the advantages of G-Sync since tearing becomes more infrequent the higher the native refresh rate.
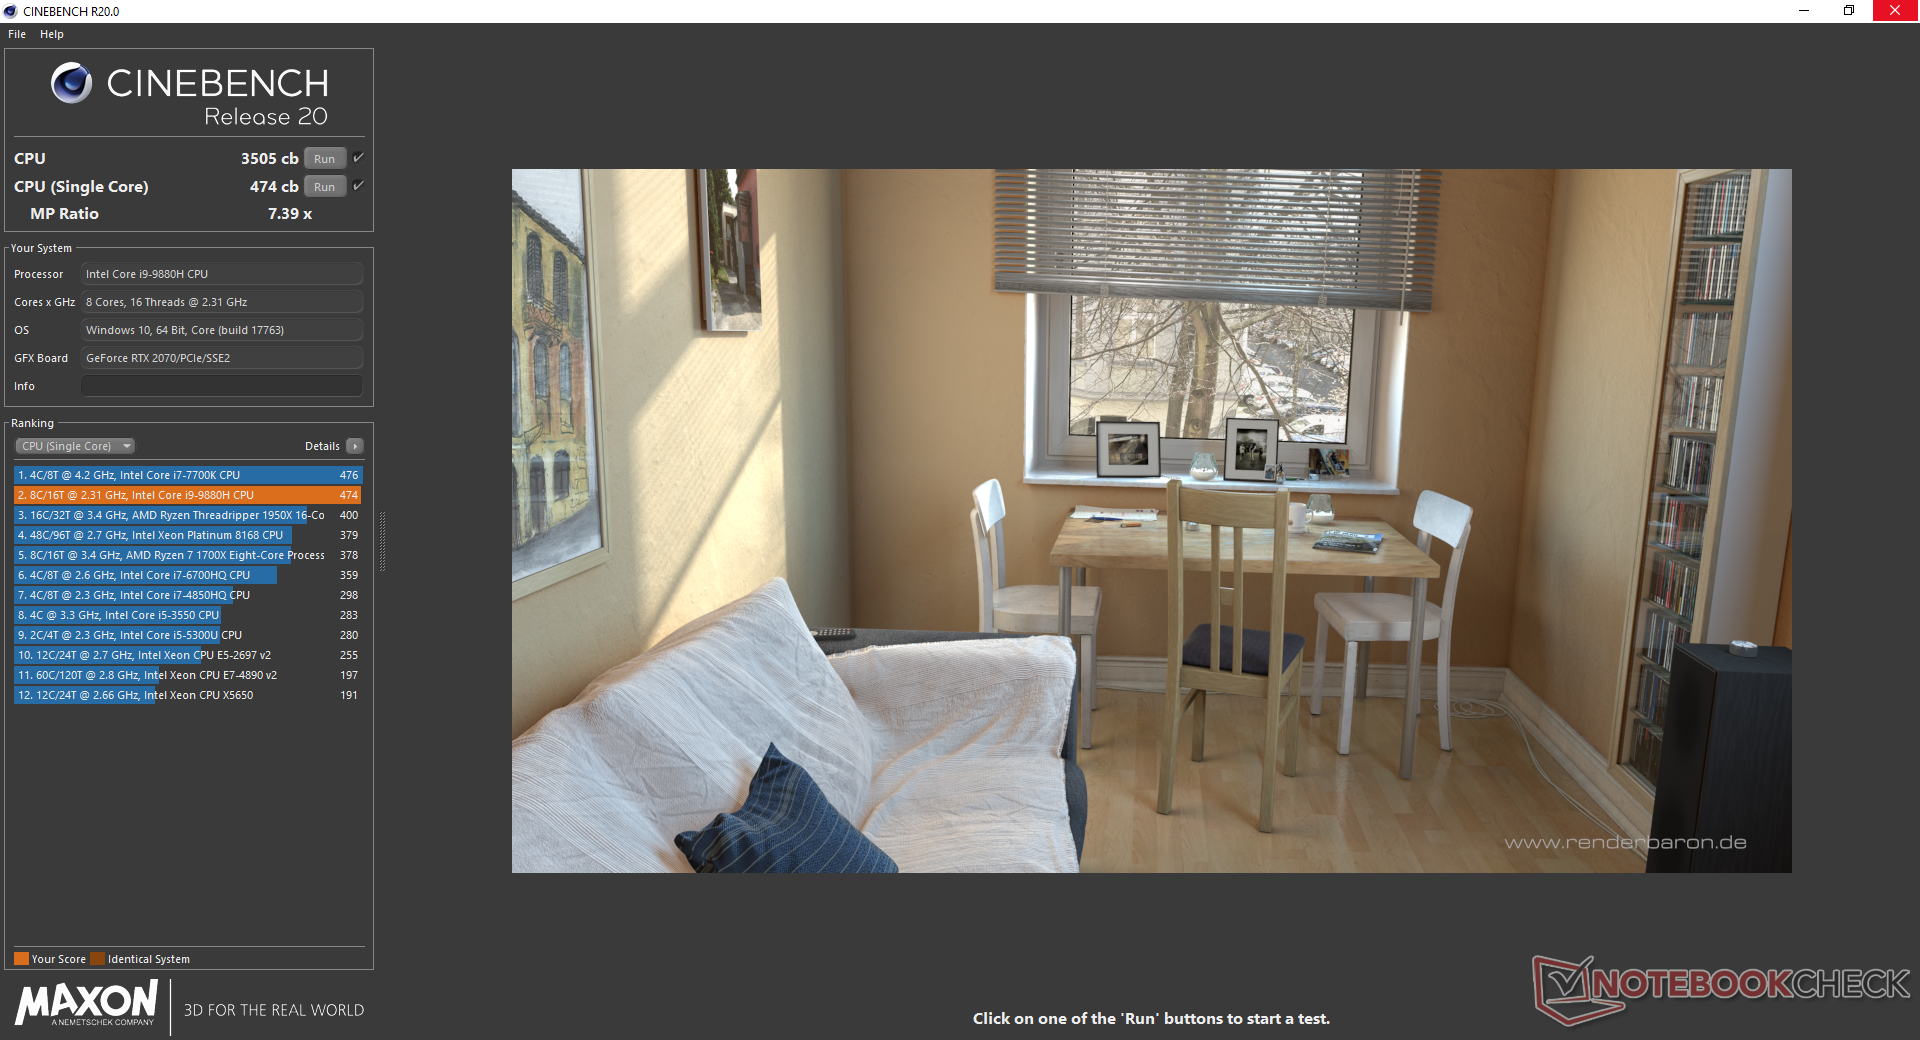
Processor
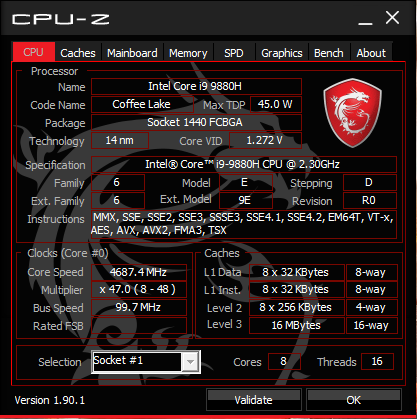
Unlike the disappointing 8th gen Core i9-8950HK, the 9th gen Core i9-9880H is able to offer much faster performance than the Core i7-8750H or i7-9750H due to its extra two physical cores. Multi-thread performance is about 30 percent faster than the Core i7-9750H to be one of the fastest mobile consumer Intel CPUs available. While MSI doesn't offer the unlocked i9-9980HK for its GE series, we wouldn't have recommended it anyway since performance advantages over the i9-9880H have proven to be marginal at best.
Performance sustainability is pretty good although still a step below the larger GE75 equipped with the same CPU as shown by our graph below. When running CineBench R15 Multi-Thread in a loop, performance would drop by about 8 percent over time.
See our dedicated page on the Core i9-9880H for more technical information and benchmark comparisons.
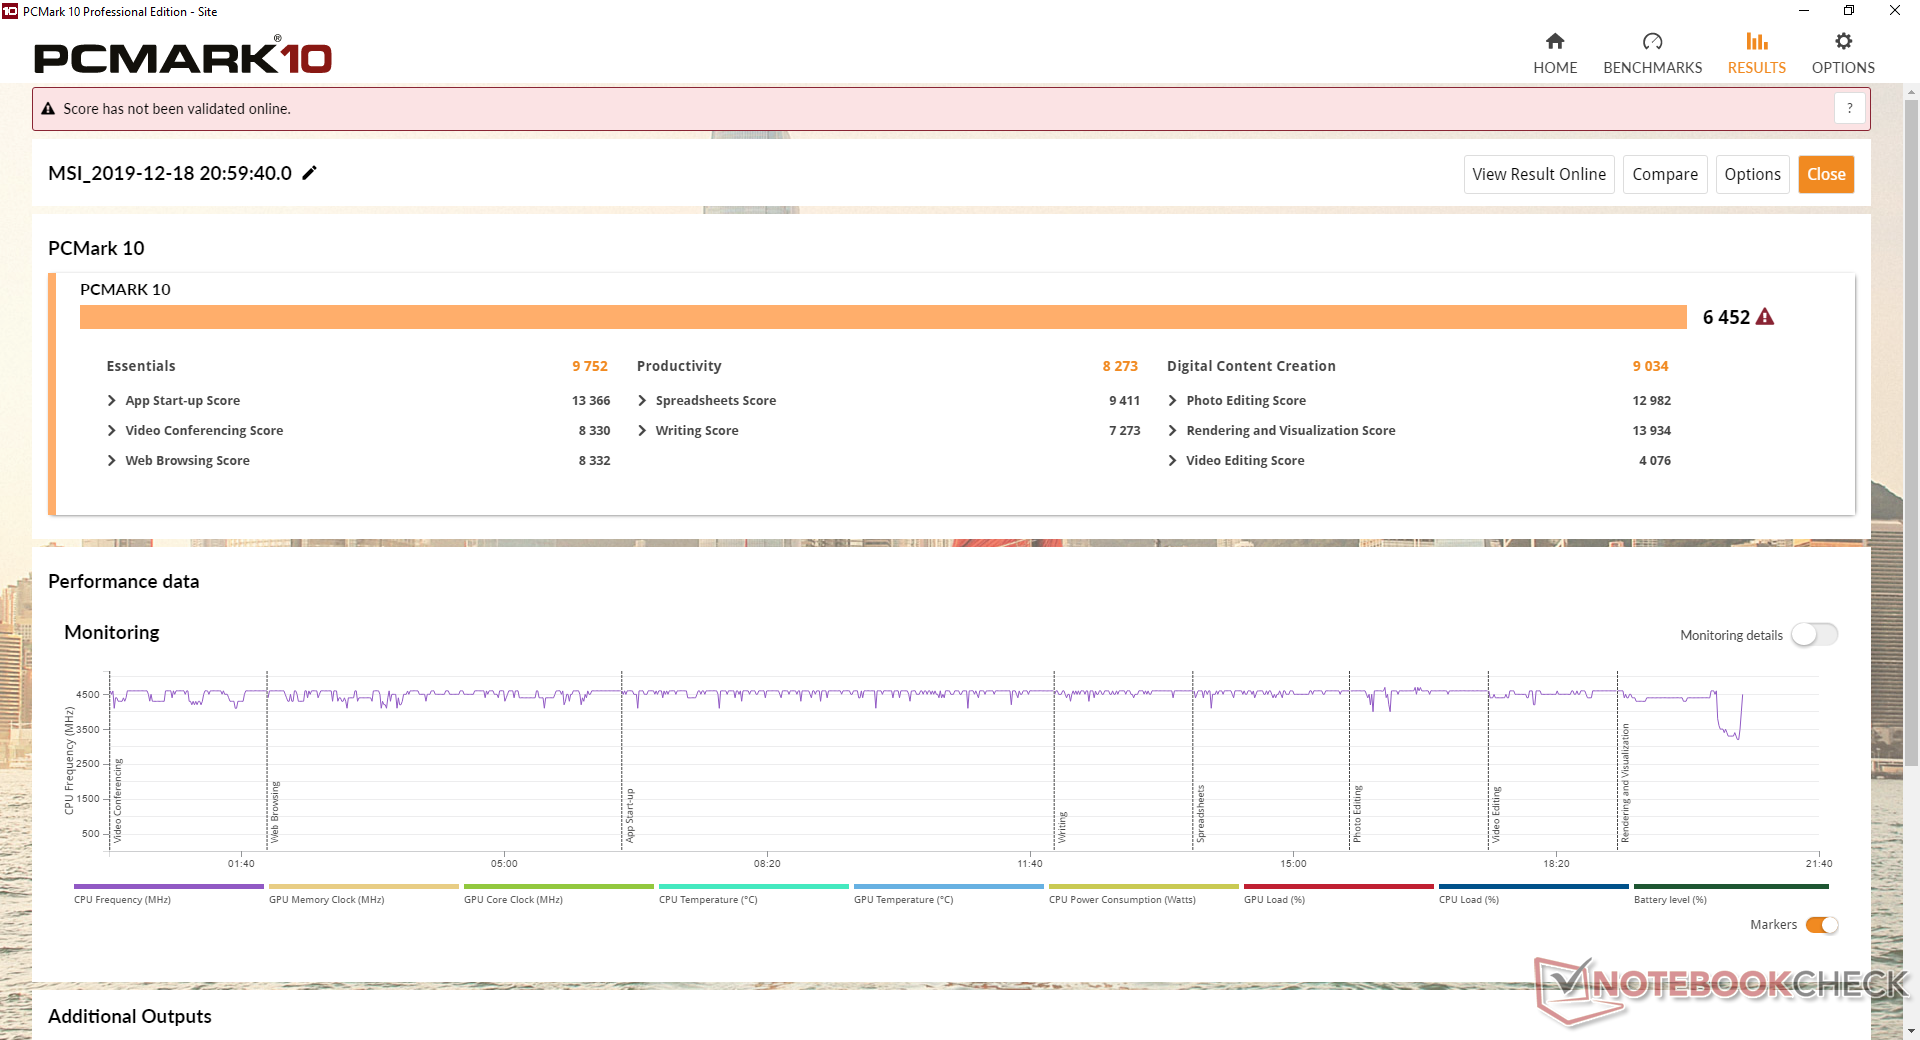
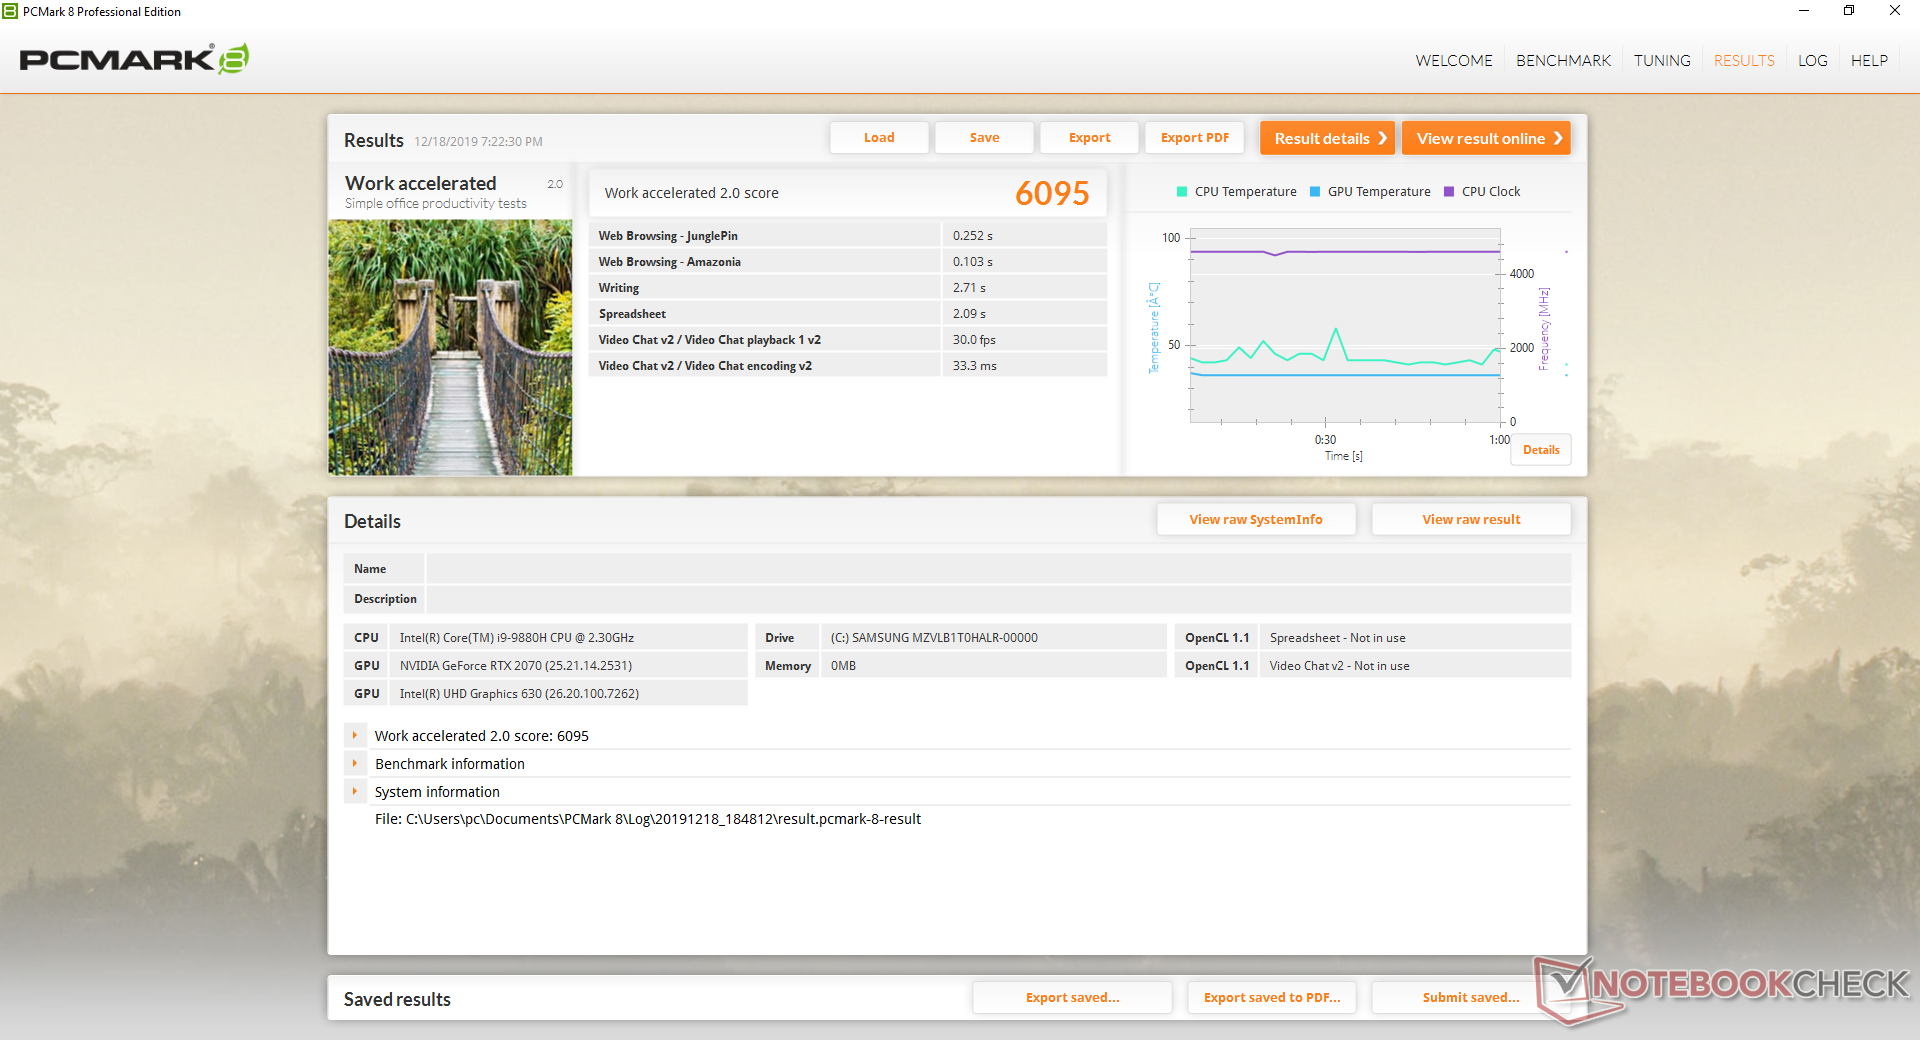
System Performance
PCMark benchmarks are higher than expected as they narrowly edge out the Eurocom Nightsky RX15 with the pricier Core i9-9980HK CPU. While we experienced no software or hardware issues during our time with the unit, the MSI pop-ups can be annoying. We recommend becoming familiar with the Dragon Center software as key system controls can be adjusted here.
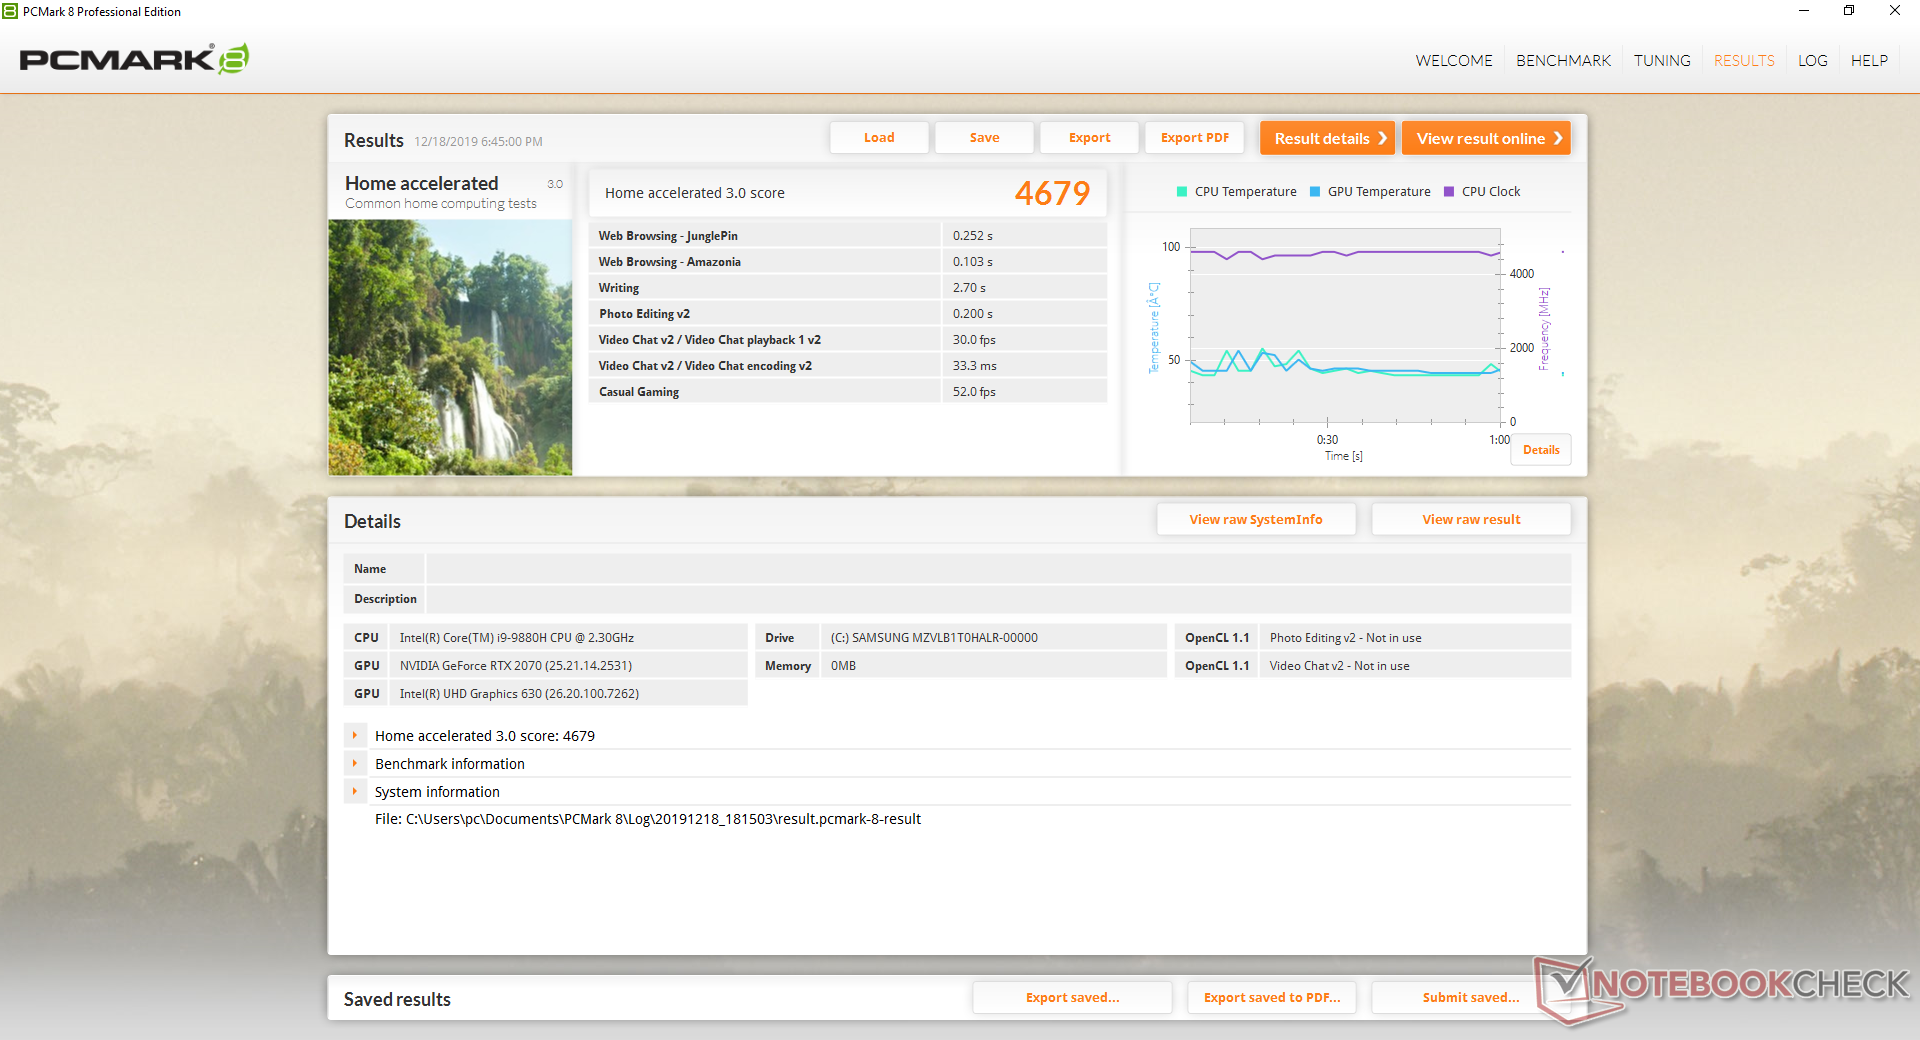
| PCMark 8 Home Score Accelerated v2 | 4679 points | |
| PCMark 8 Work Score Accelerated v2 | 6095 points | |
| PCMark 10 Score | 6452 points | |
Help | ||
Storage Devices
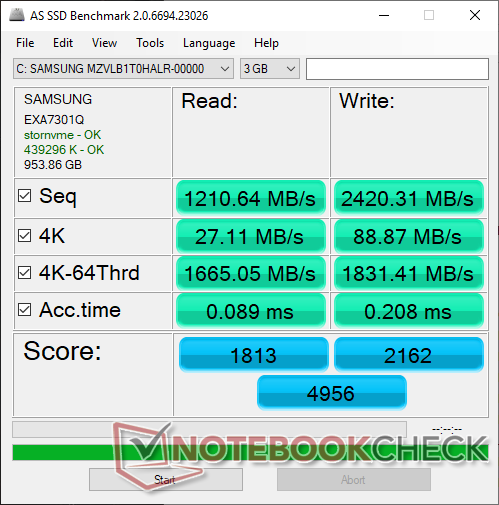
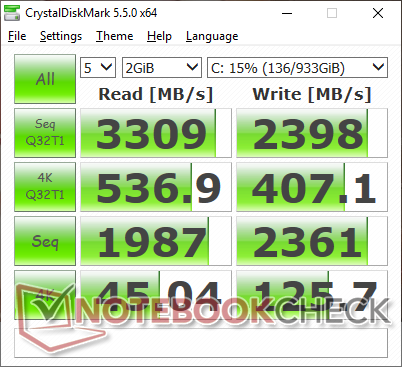
Three storage bays are available much like on the GE63: 2x M.2 2280 PCIe x4 and 1x 2.5-inch SATA III. Our test unit comes equipped with the same 1 TB MZVLB1T0HALR Samsung PM981 NVMe SSD as found on our GE75. Samsung M.2 SSDs are some of the fastest in the consumer space and so it's not surprising to see it outperforming the mid-range WD SN520 and Intel 660p. Nonetheless, there's a chance that the GE65 may come equipped with these slower SSDs instead depending on the reseller.
See our table of HDDs and SSDs for more benchmark comparisons.
| MSI GE65 Raider 9SF-049US Samsung SSD PM981 MZVLB1T0HALR | MSI GE63 Raider 8SG WDC PC SN520 SDAPNUW-512G | Lenovo Legion Y740-15ICHg WDC PC SN520 SDAPMUW-128G | Alienware m15 R2 P87F 2x Toshiba XG6 KXG60ZNV512G (RAID 0) | Asus Strix GL531GV-PB74 Intel SSD 660p SSDPEKNW512G8 | MSI GE75 9SG Samsung SSD PM981 MZVLB1T0HALR | |
|---|---|---|---|---|---|---|
| AS SSD | -31% | -39% | -1% | -19% | 2% | |
| Seq Read (MB/s) | 1211 | 904 -25% | 1372 13% | 1925 59% | 1280 6% | 1358 12% |
| Seq Write (MB/s) | 2420 | 1344 -44% | 746 -69% | 2371 -2% | 905 -63% | 2381 -2% |
| 4K Read (MB/s) | 27.11 | 24.99 -8% | 35.42 31% | 37.2 37% | 48.73 80% | 27.02 0% |
| 4K Write (MB/s) | 88.9 | 107.4 21% | 99.9 12% | 108.9 22% | 107 20% | 89.2 0% |
| 4K-64 Read (MB/s) | 1665 | 631 -62% | 302.1 -82% | 1177 -29% | 321.1 -81% | 1642 -1% |
| 4K-64 Write (MB/s) | 1831 | 731 -60% | 191.4 -90% | 1135 -38% | 761 -58% | 1799 -2% |
| Access Time Read * (ms) | 0.089 | 0.131 -47% | 0.132 -48% | 0.065 27% | 0.058 35% | 0.067 25% |
| Access Time Write * (ms) | 0.208 | 0.099 52% | 0.037 82% | 0.108 48% | 0.046 78% | 0.05 76% |
| Score Read (Points) | 1813 | 746 -59% | 475 -74% | 1407 -22% | 498 -73% | 1805 0% |
| Score Write (Points) | 2162 | 973 -55% | 366 -83% | 1481 -31% | 958 -56% | 2127 -2% |
| Score Total (Points) | 4956 | 2126 -57% | 1065 -79% | 3633 -27% | 1711 -65% | 4899 -1% |
| Copy ISO MB/s (MB/s) | 2483 | 1187 -52% | 1062 -57% | 2073 -17% | 1519 -39% | 3193 29% |
| Copy Program MB/s (MB/s) | 776 | 673 -13% | 426 -45% | 576 -26% | 749 -3% | 198.2 -74% |
| Copy Game MB/s (MB/s) | 1621 | 1295 -20% | 650 -60% | 1426 -12% | 943 -42% | 1054 -35% |
* ... smaller is better

GPU Performance
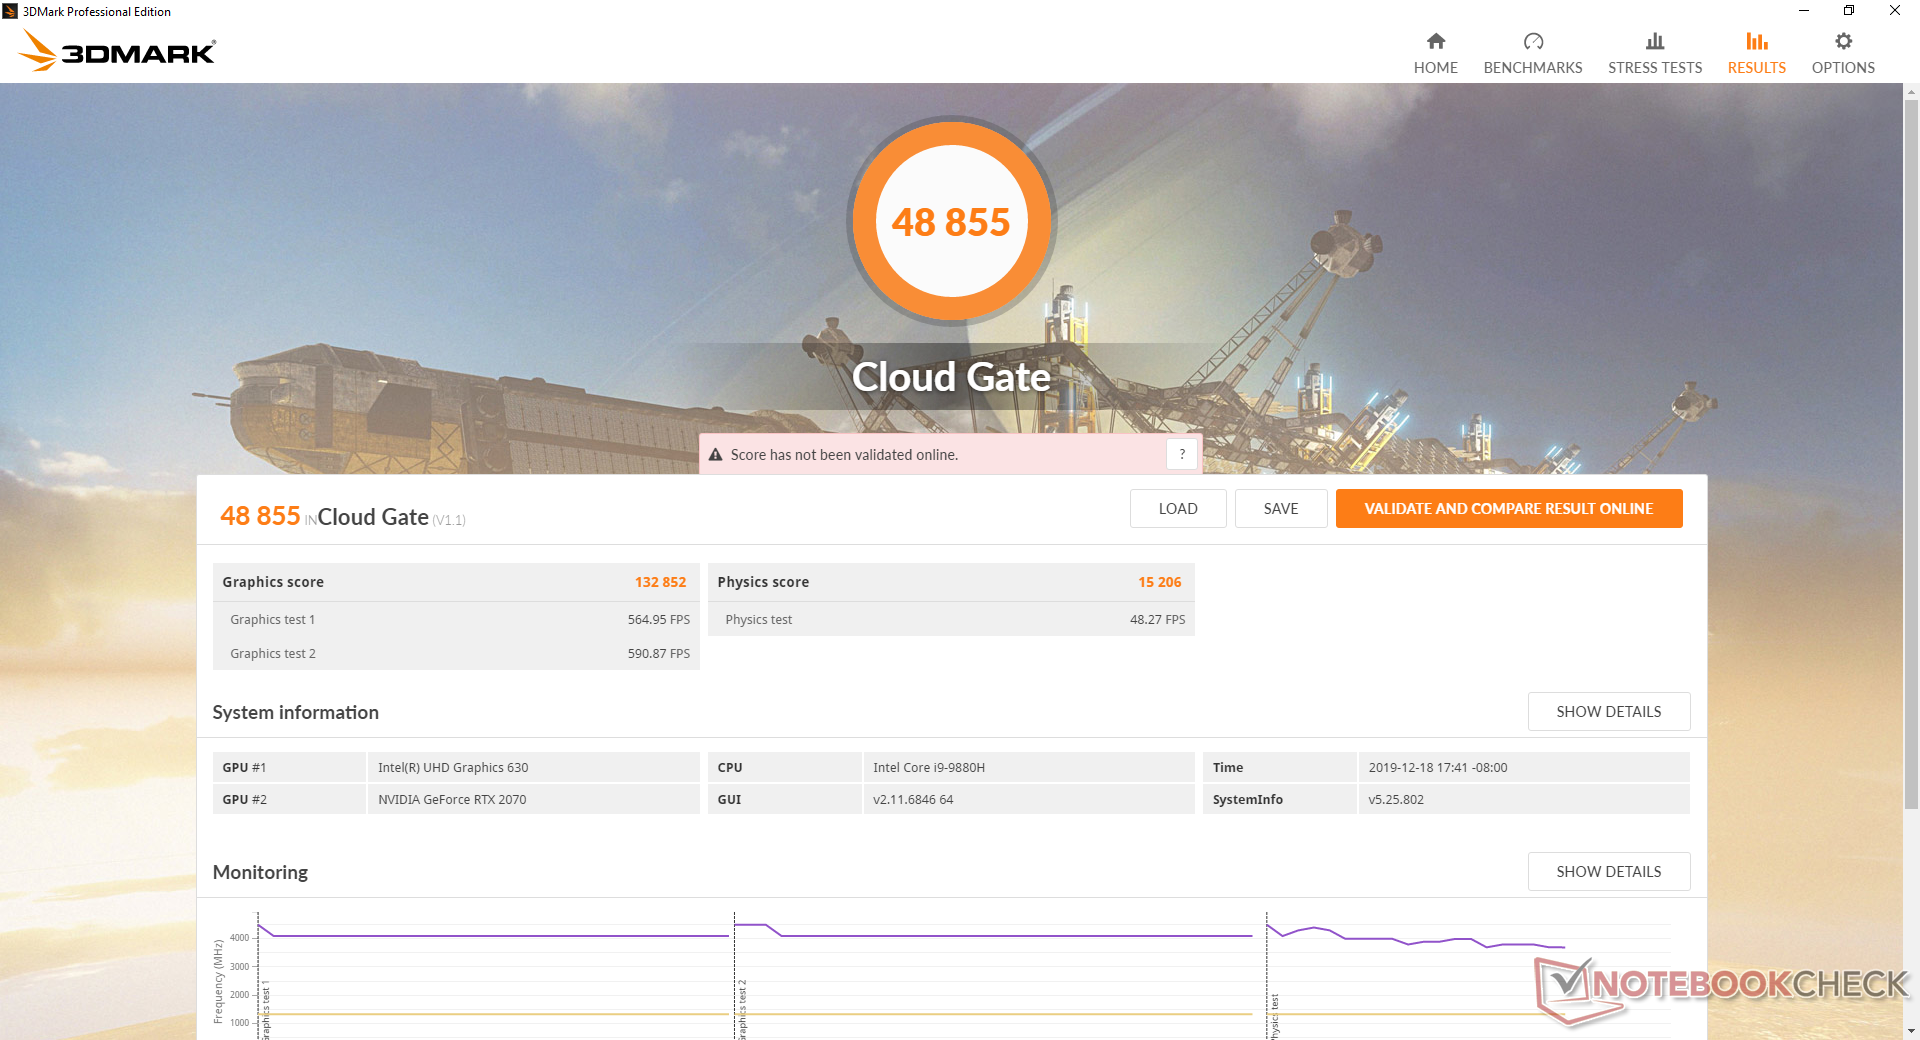
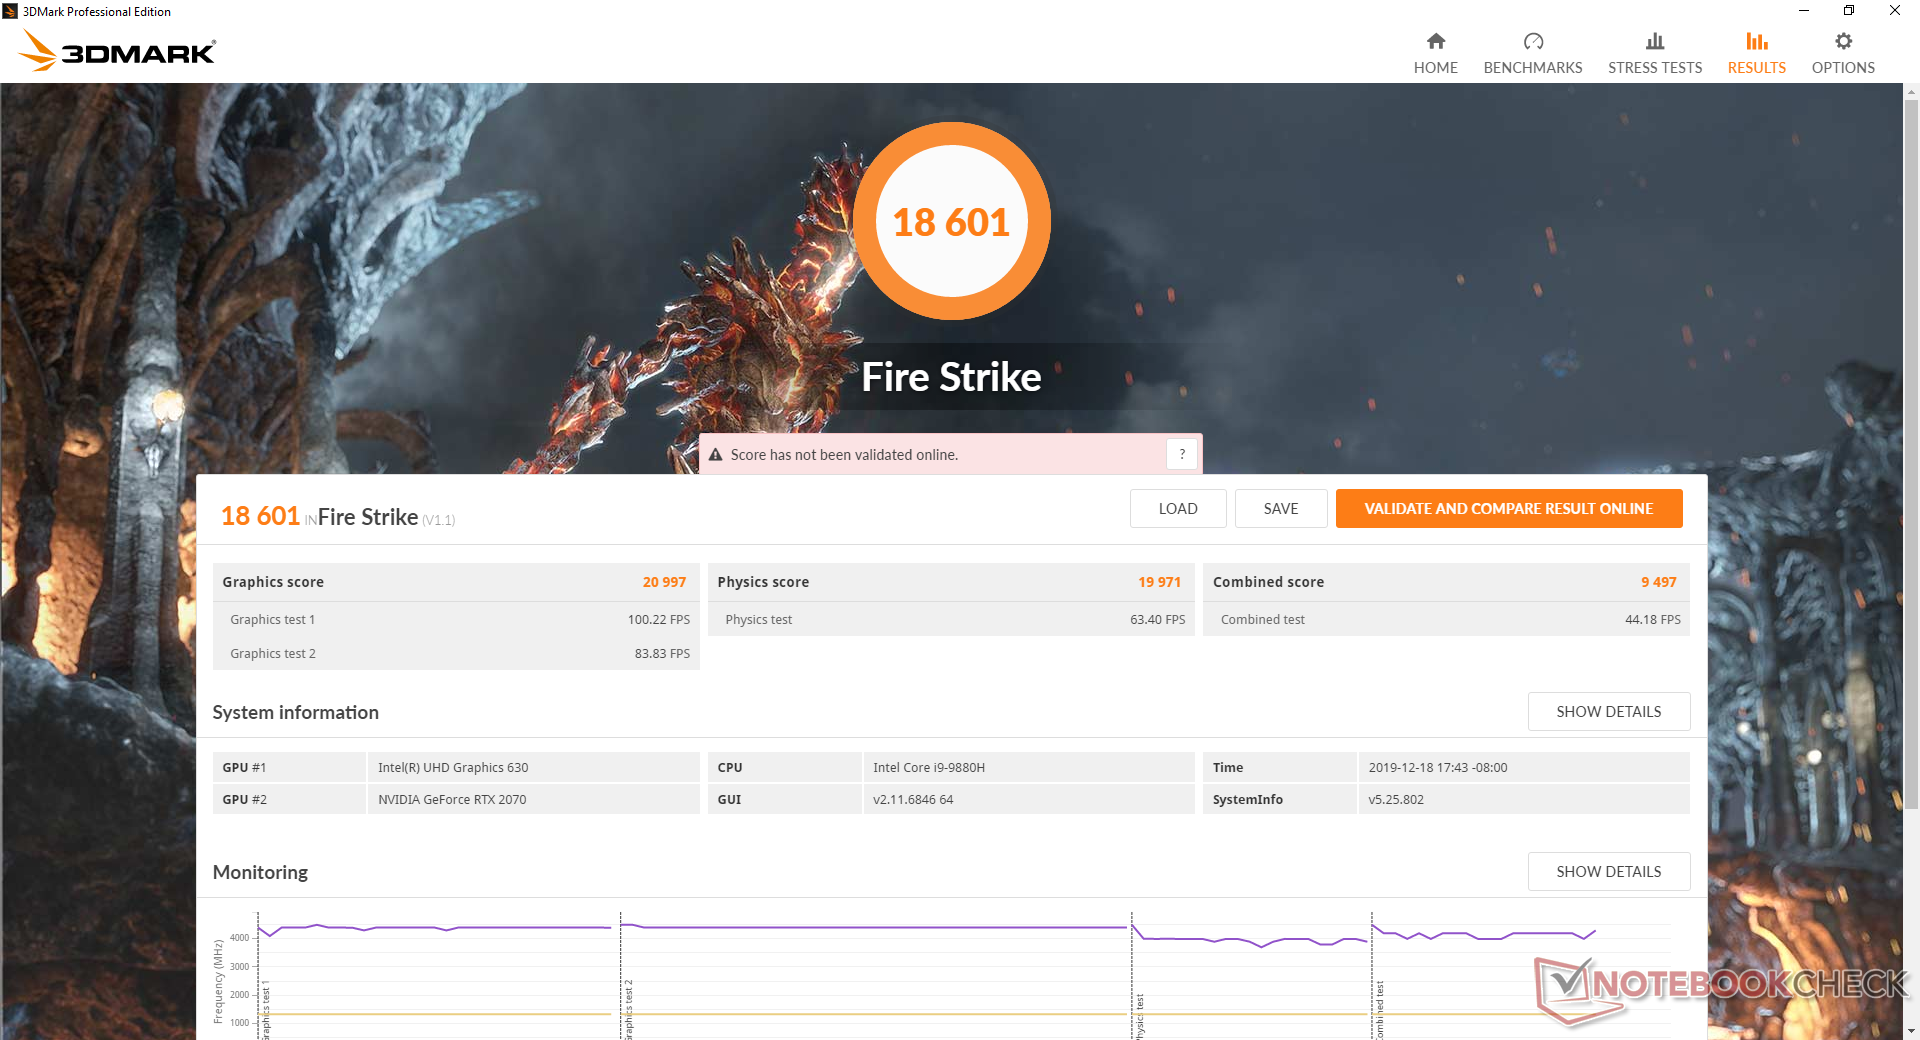
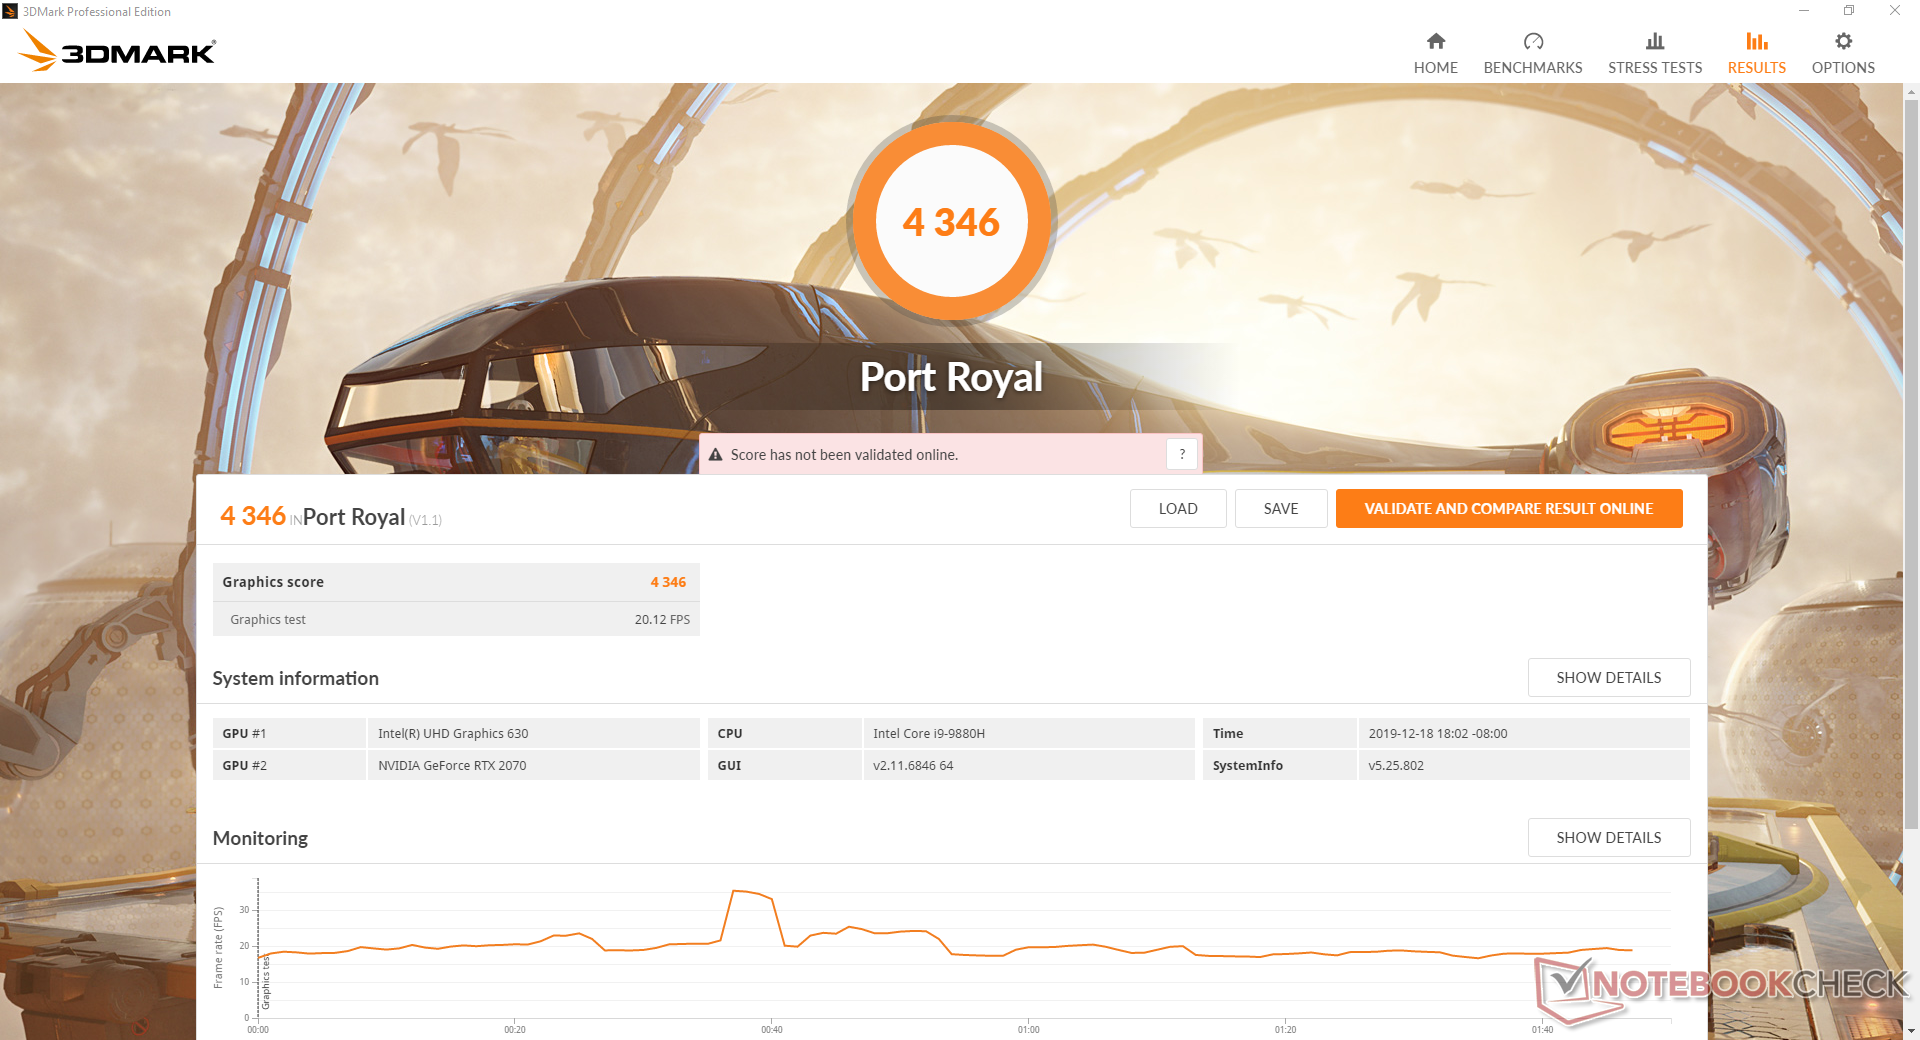
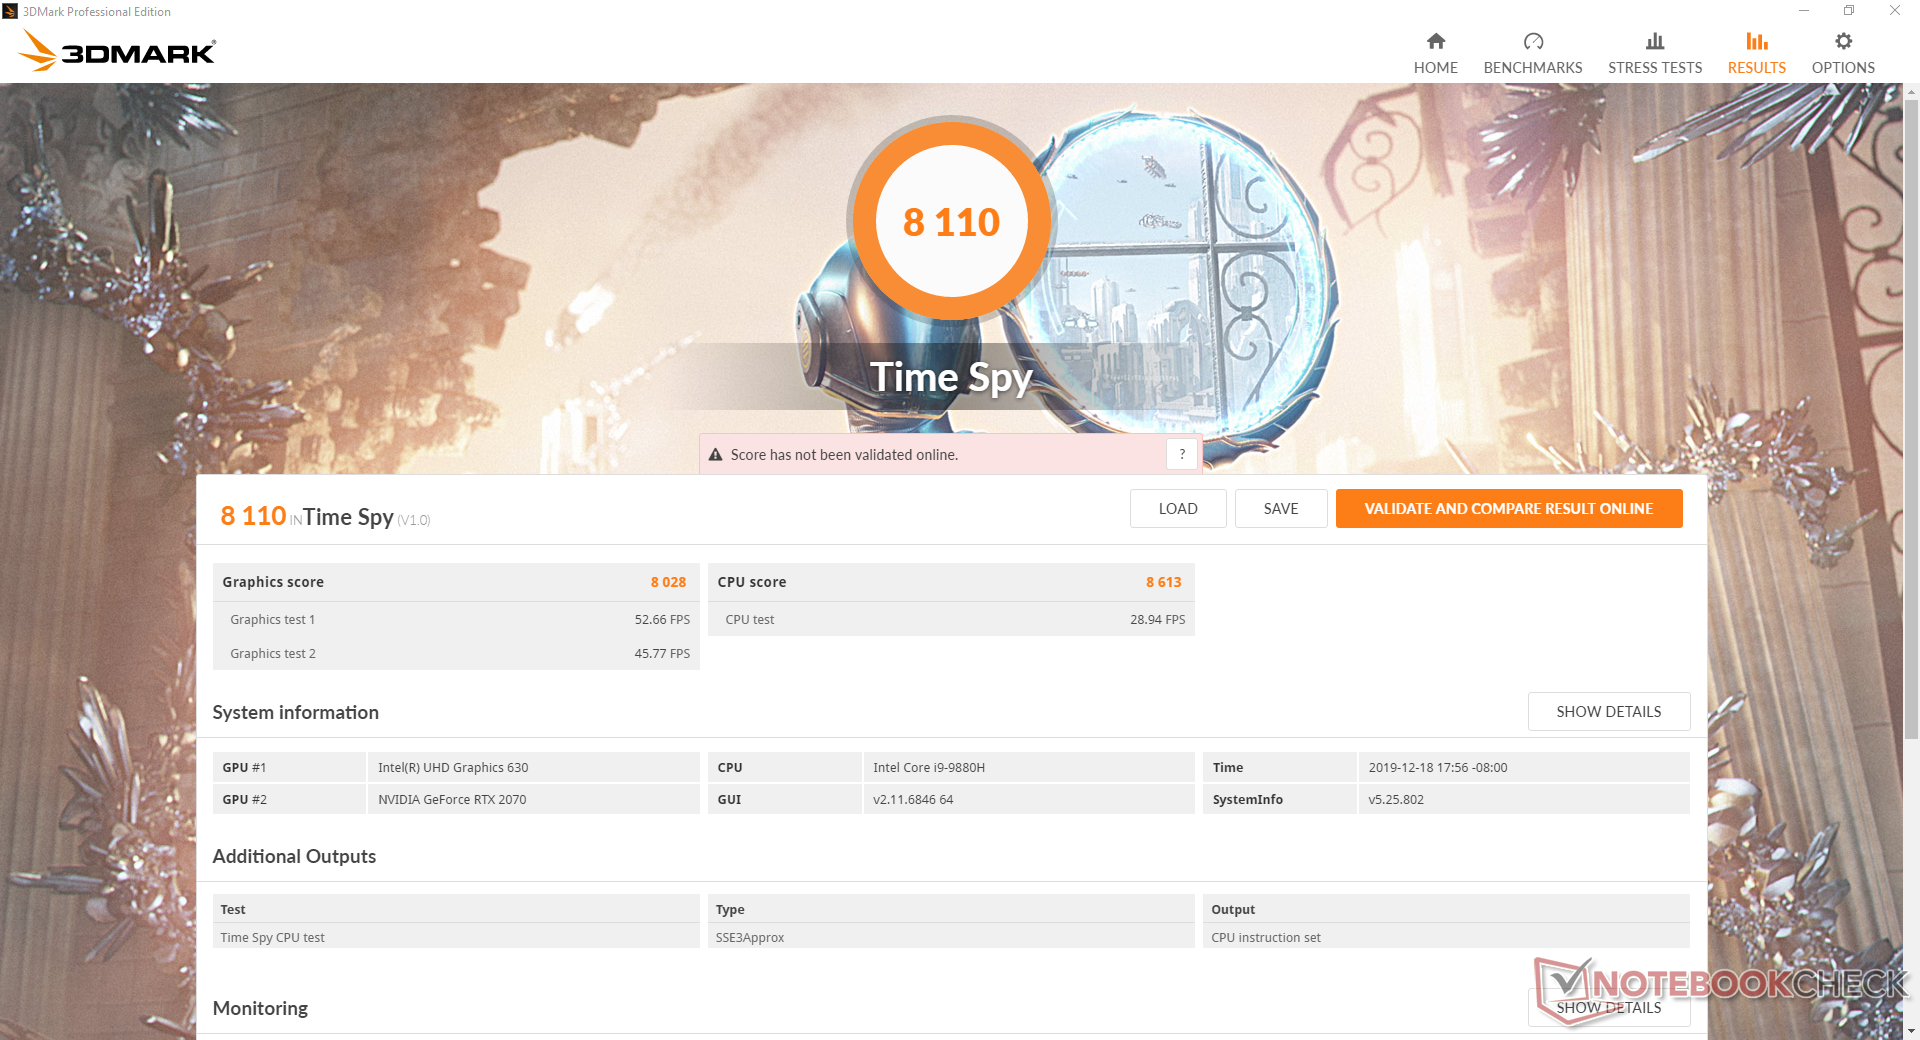
The mobile GeForce RTX 2070 is about 10 to 15 percent slower than a "proper" desktop GeForce RTX 2070. Moving down to the mobile RTX 2060 SKU entails another 15 percent performance deficit. Be sure to enable DX11 whenever possible as the Nvidia Turing series is better optimized for Microsoft's latest API than the last generation Pascal series.
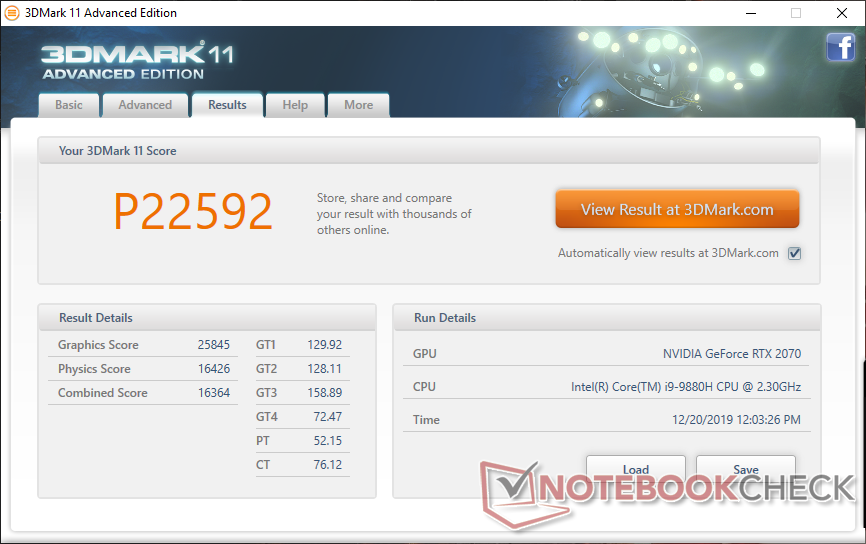
| 3DMark 11 Performance | 22592 points | |
| 3DMark Cloud Gate Standard Score | 48855 points | |
| 3DMark Fire Strike Score | 18601 points | |
| 3DMark Time Spy Score | 8110 points | |
Help | ||
Gaming Performance
Expect around 10 percent slower performance than the RTX 2080 Max-Q when gaming or about 10 percent higher performance than the last generation GTX 1080. All titles will be playable at maximum or near maximum 1080p settings at over 60 FPS. To better exploit the 240 Hz refresh rate, however, users may want to lower the in-game settings while maintaining the native 1080p resolution for sharpness to increase the frame rate even further. Fast-paced competitive games like CS:GO or Overwatch will benefit the most from this approach.
See our dedicated page on the mobile GeForce RTX 2070 for more technical information and benchmark comparisons.
| low | med. | high | ultra | |
|---|---|---|---|---|
| BioShock Infinite (2013) | 325 | 309.3 | 292.5 | 170 |
| The Witcher 3 (2015) | 290.1 | 241.3 | 152.3 | 78.4 |
| Shadow of the Tomb Raider (2018) | 143 | 107 | 101 | 95 |
Emissions
System Noise
The cooling solution is essentially identical to the cheaper GL65. The fans never idle even when on lower power settings meaning that fan noise is ever present no matter the onscreen load. We're able to measure a minimum of 33 dB(A) against a background of 28.8 dB(A) which will be audible when in quieter environments. Running the first benchmark scene of 3DMark 06 induces a fan noise of 38 dB(A) compared to just 33.5 dB(A) on the Razer Blade 15.
Perhaps unsurprisingly, fan noise and behavior are not unlike what we measured on the GE63. Running Witcher 3 induces a constant fan noise of 53 dB(A) or even 58 dB(A) if Turbo Fan mode is enabled. We recommend disabling Turbo Fan mode as it will not directly increase performance in any significant way. Fan noise when gaming is comparable to the Asus Strix III G531 with the same RTX 2070 GPU while being louder during very low loads.
We can notice no electronic noise or coil whine from our test unit.
| MSI GE65 Raider 9SF-049US GeForce RTX 2070 Mobile, i9-9880H, Samsung SSD PM981 MZVLB1T0HALR | MSI GE63 Raider 8SG GeForce RTX 2080 Mobile, i7-8750H, WDC PC SN520 SDAPNUW-512G | Lenovo Legion Y740-15ICHg GeForce RTX 2070 Max-Q, i7-9750H, WDC PC SN520 SDAPMUW-128G | Asus Strix GL531GV-PB74 GeForce RTX 2060 Mobile, i7-9750H, Intel SSD 660p SSDPEKNW512G8 | Eurocom Nightsky RX15 GeForce RTX 2070 Mobile, i9-9980HK, Samsung SSD 970 Pro 512GB | Razer Blade 15 RTX 2080 Max-Q GeForce RTX 2080 Max-Q, i7-9750H, Samsung SSD PM981 MZVLB512HAJQ | |
|---|---|---|---|---|---|---|
| Noise | -3% | 6% | 2% | 0% | 13% | |
| off / environment * (dB) | 28.8 | 28.5 1% | 30 -4% | 28.2 2% | 28.2 2% | 28.3 2% |
| Idle Minimum * (dB) | 33 | 33.9 -3% | 31.3 5% | 28.8 13% | 28.2 15% | 28.8 13% |
| Idle Average * (dB) | 33 | 33.9 -3% | 31.3 5% | 31.4 5% | 28.2 15% | 28.8 13% |
| Idle Maximum * (dB) | 33.1 | 34.3 -4% | 31.3 5% | 33.3 -1% | 31.7 4% | 29 12% |
| Load Average * (dB) | 38 | 39.5 -4% | 42 -11% | 46.2 -22% | 53.7 -41% | 33.5 12% |
| Witcher 3 ultra * (dB) | 52.9 | 56.2 -6% | 42.1 20% | 50.5 5% | 53.7 -2% | 45 15% |
| Load Maximum * (dB) | 57.8 | 57.2 1% | 46.5 20% | 51.3 11% | 53.7 7% | 45.2 22% |
* ... smaller is better
Noise level
| Idle |
| 33 / 33 / 33.1 dB(A) |
| Load |
| 38 / 57.8 dB(A) |
 | ||
30 dB silent 40 dB(A) audible 50 dB(A) loud |
||
min: | ||
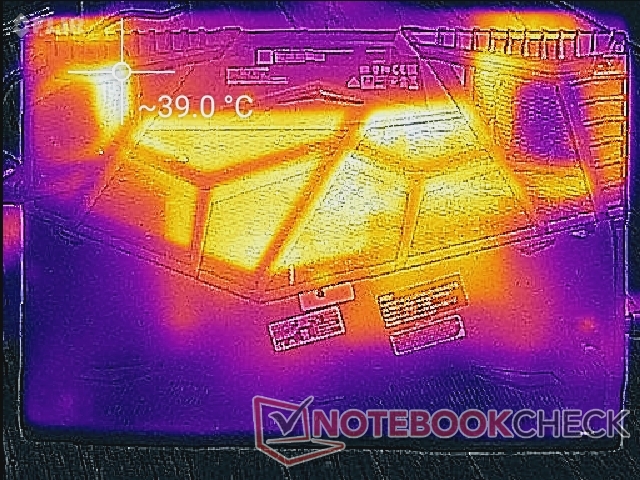
Temperature
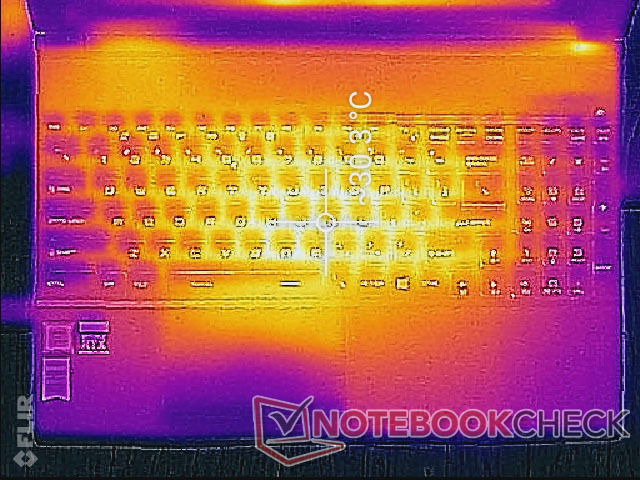
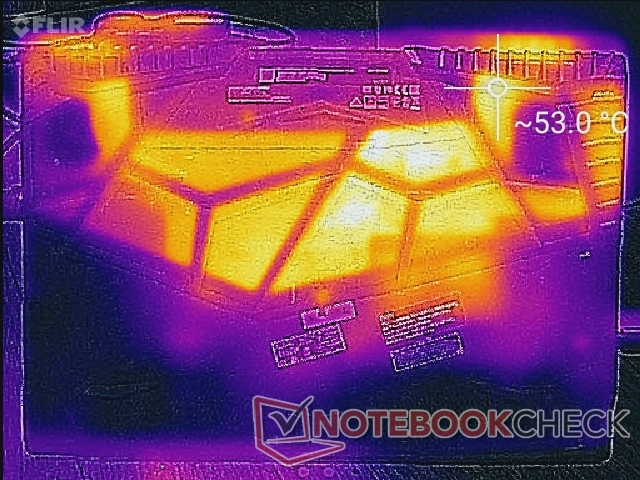
Surface temperatures are warmer than expected when idling. The very center of the keyboard can be 31 C while the palm rests can be just 23 C even when no demanding programs are running. If gaming, this center hot spot can be as warm as 45 C compared to 40 C on the Aorus 15 with the same GPU.
Note that the bottom of the laptop remains relatively cool due to the oversized ventilation grilles. Be sure to allow for optimal airflow and to game on a flat desk whenever possible.
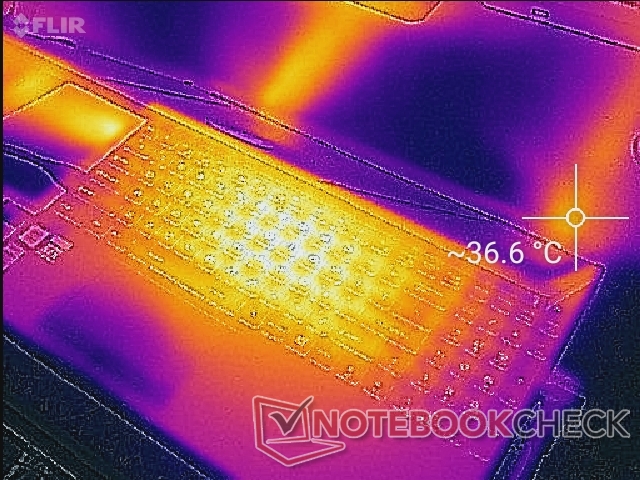

(±) The maximum temperature on the upper side is 45 °C / 113 F, compared to the average of 40.4 °C / 105 F, ranging from 21.2 to 68.8 °C for the class Gaming.
(-) The bottom heats up to a maximum of 53 °C / 127 F, compared to the average of 43.2 °C / 110 F
(+) In idle usage, the average temperature for the upper side is 25.8 °C / 78 F, compared to the device average of 33.9 °C / 93 F.
(±) Playing The Witcher 3, the average temperature for the upper side is 33.4 °C / 92 F, compared to the device average of 33.9 °C / 93 F.
(+) The palmrests and touchpad are cooler than skin temperature with a maximum of 29 °C / 84.2 F and are therefore cool to the touch.
(±) The average temperature of the palmrest area of similar devices was 28.8 °C / 83.8 F (-0.2 °C / -0.4 F).
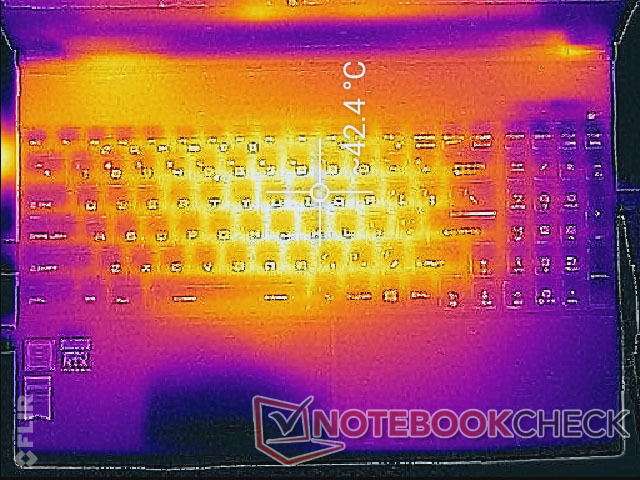
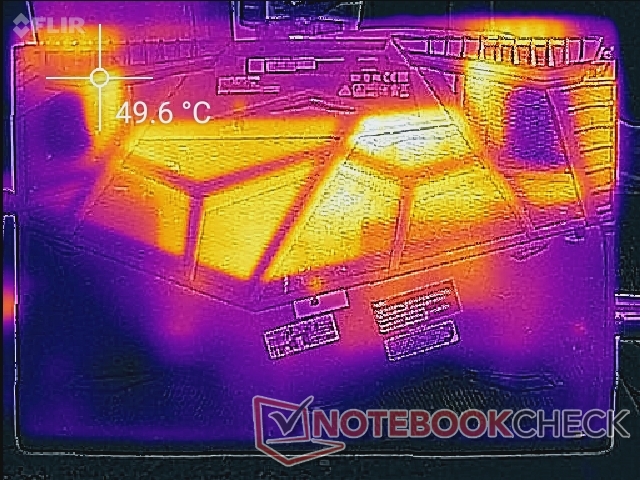
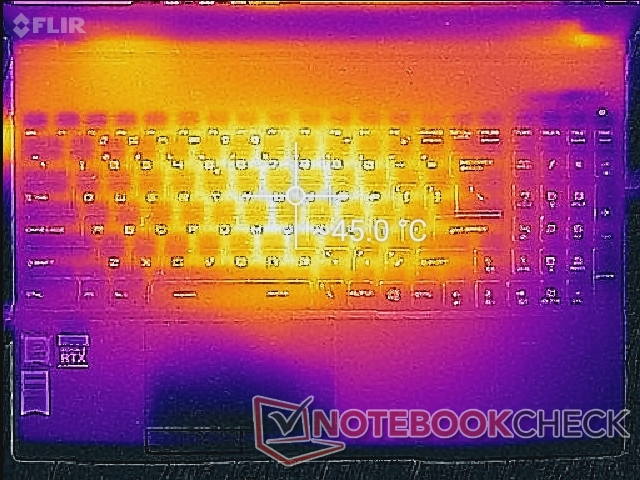
Stress Test
We stress the laptop to identify for any potential throttling or stability issues. When running Prime95, the CPU can be observed boosting up to 4 GHz for the first few seconds before steadily dropping to 3.4 GHz over the next 30 seconds. Thereafter, clock rates and temperature stabilize at 3.2 to 3.3 GHz and 88 C, respectively. Running both Prime95 and FurMark simultaneously causes CPU and GPU temperature to plateau at about 86 C and 73 C.
Running Witcher 3 is more representative of real-world gaming loads. When under such conditions, the CPU and GPU will stabilize at 81 C and 73 C, respectively, compared to 81 C and 71 C on the thinner MSI GS65 with a Core i7 CPU and RTX 2080 Max-Q GPU. Temperatures are definitely warm, but they aren't bad considering the small footprint and the non Max-Q GPU. Enabling Turbo Fan mode will bump CPU and GPU temperature down to 77 C and 68 C, respectively. Keep in mind that Turbo Fan mode will not directly boost CPU or GPU clock rates.
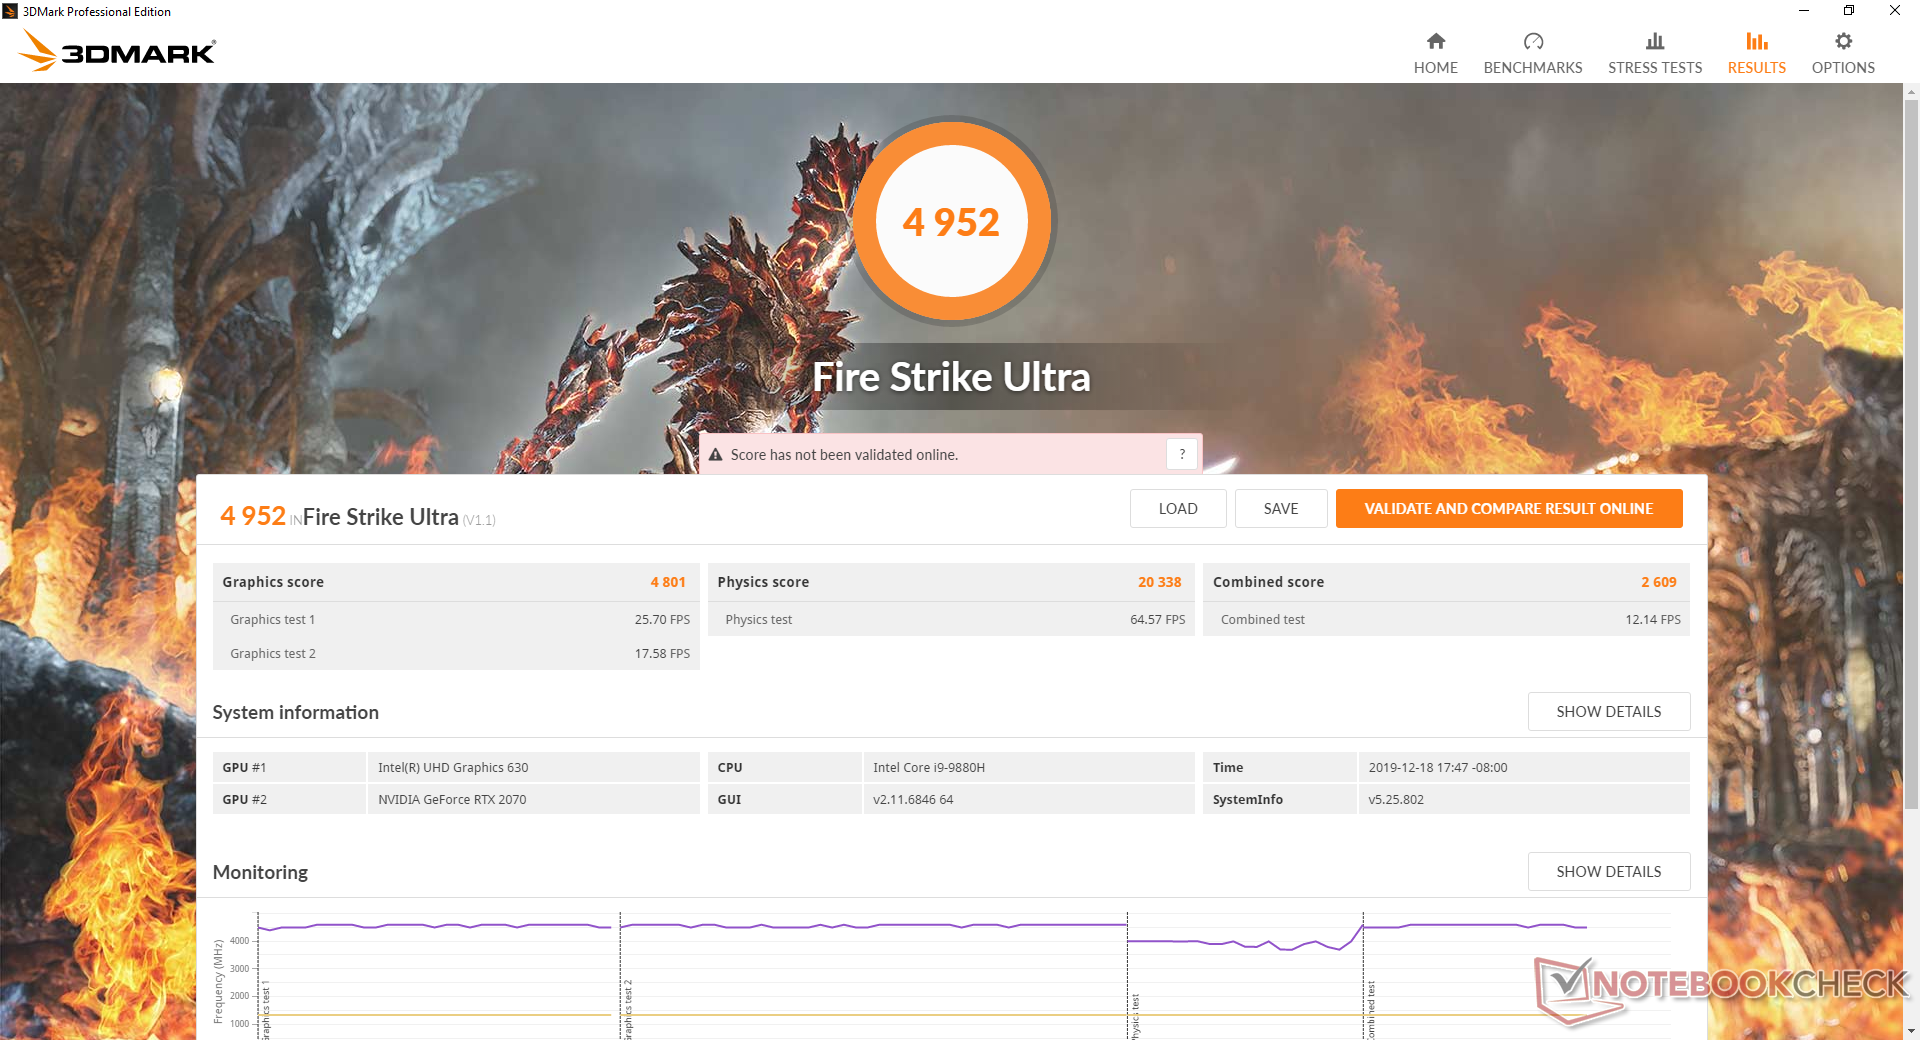
Running on battery power will limit performance. A Fire Strike run on batteries returns Physics and Graphics scores of 11671 and 5827 points, respectively, compared to 19971 and 20997 points when on mains.
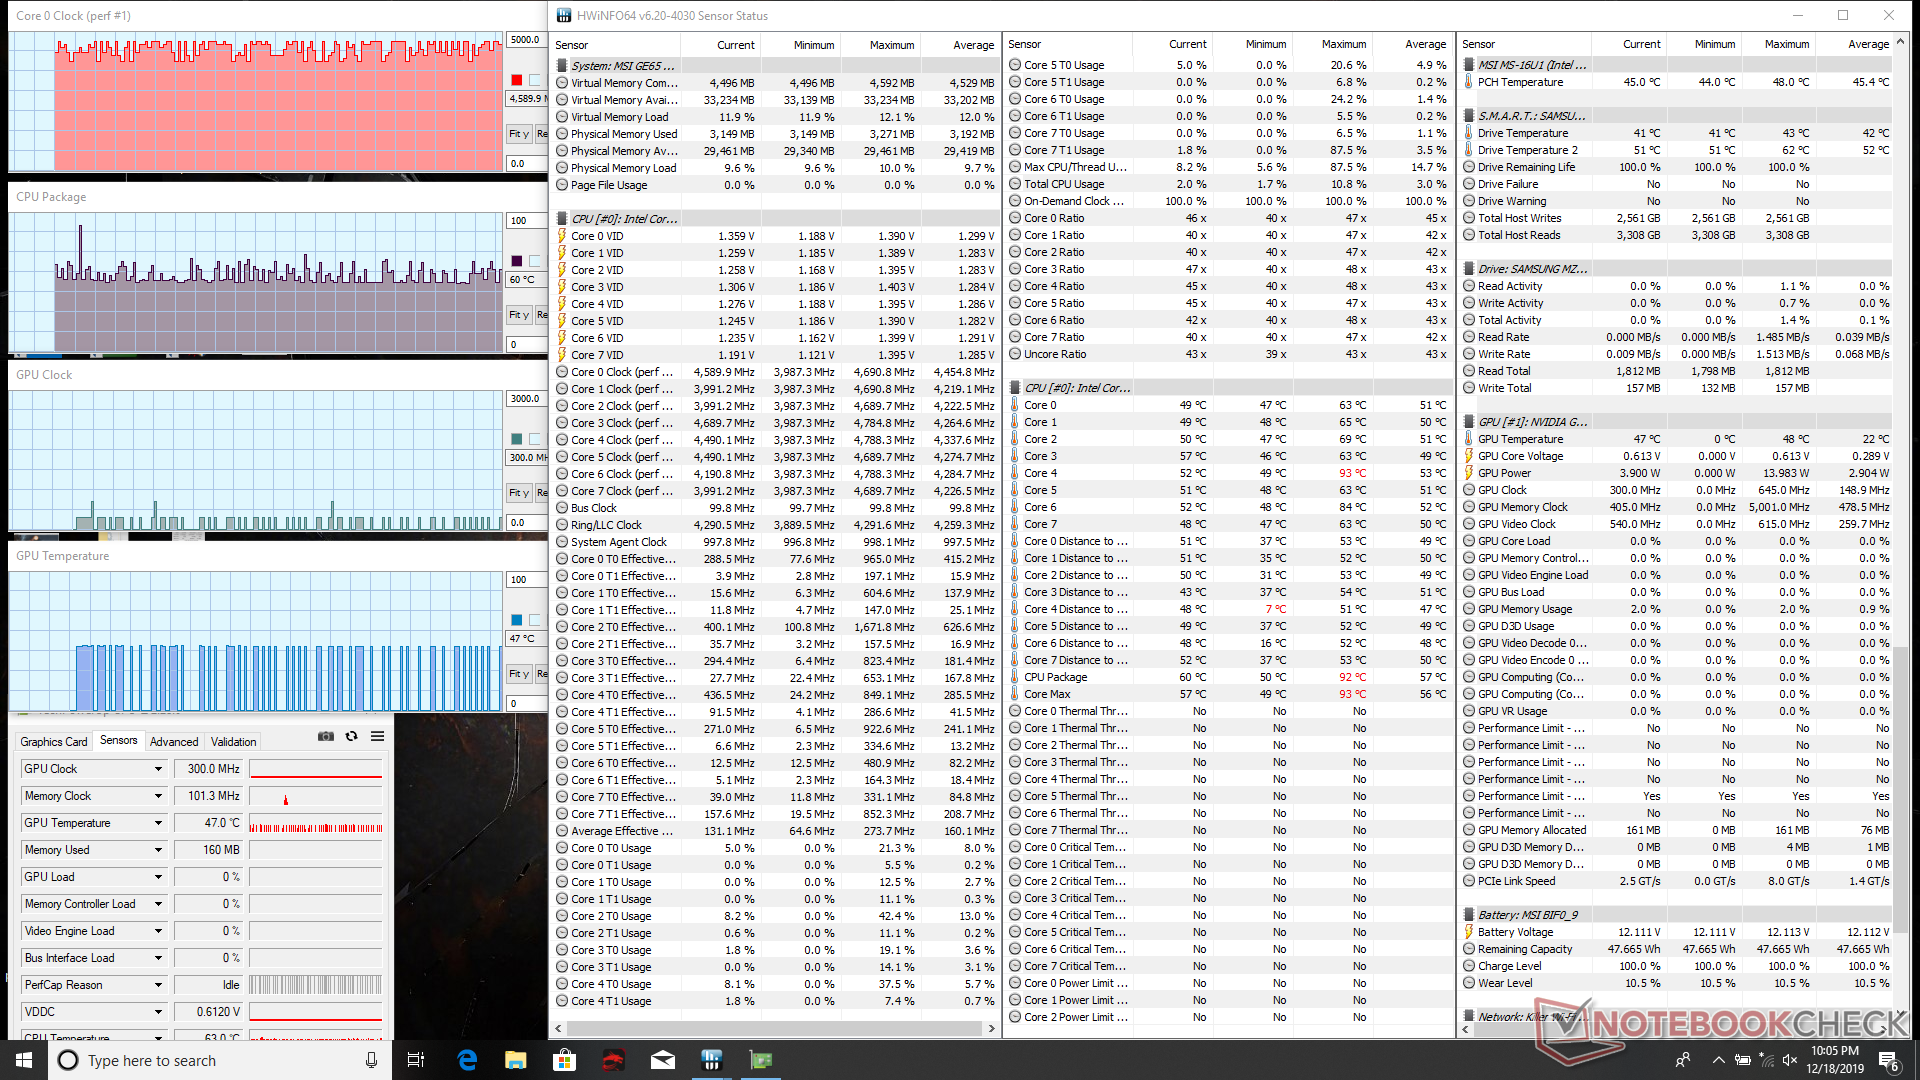
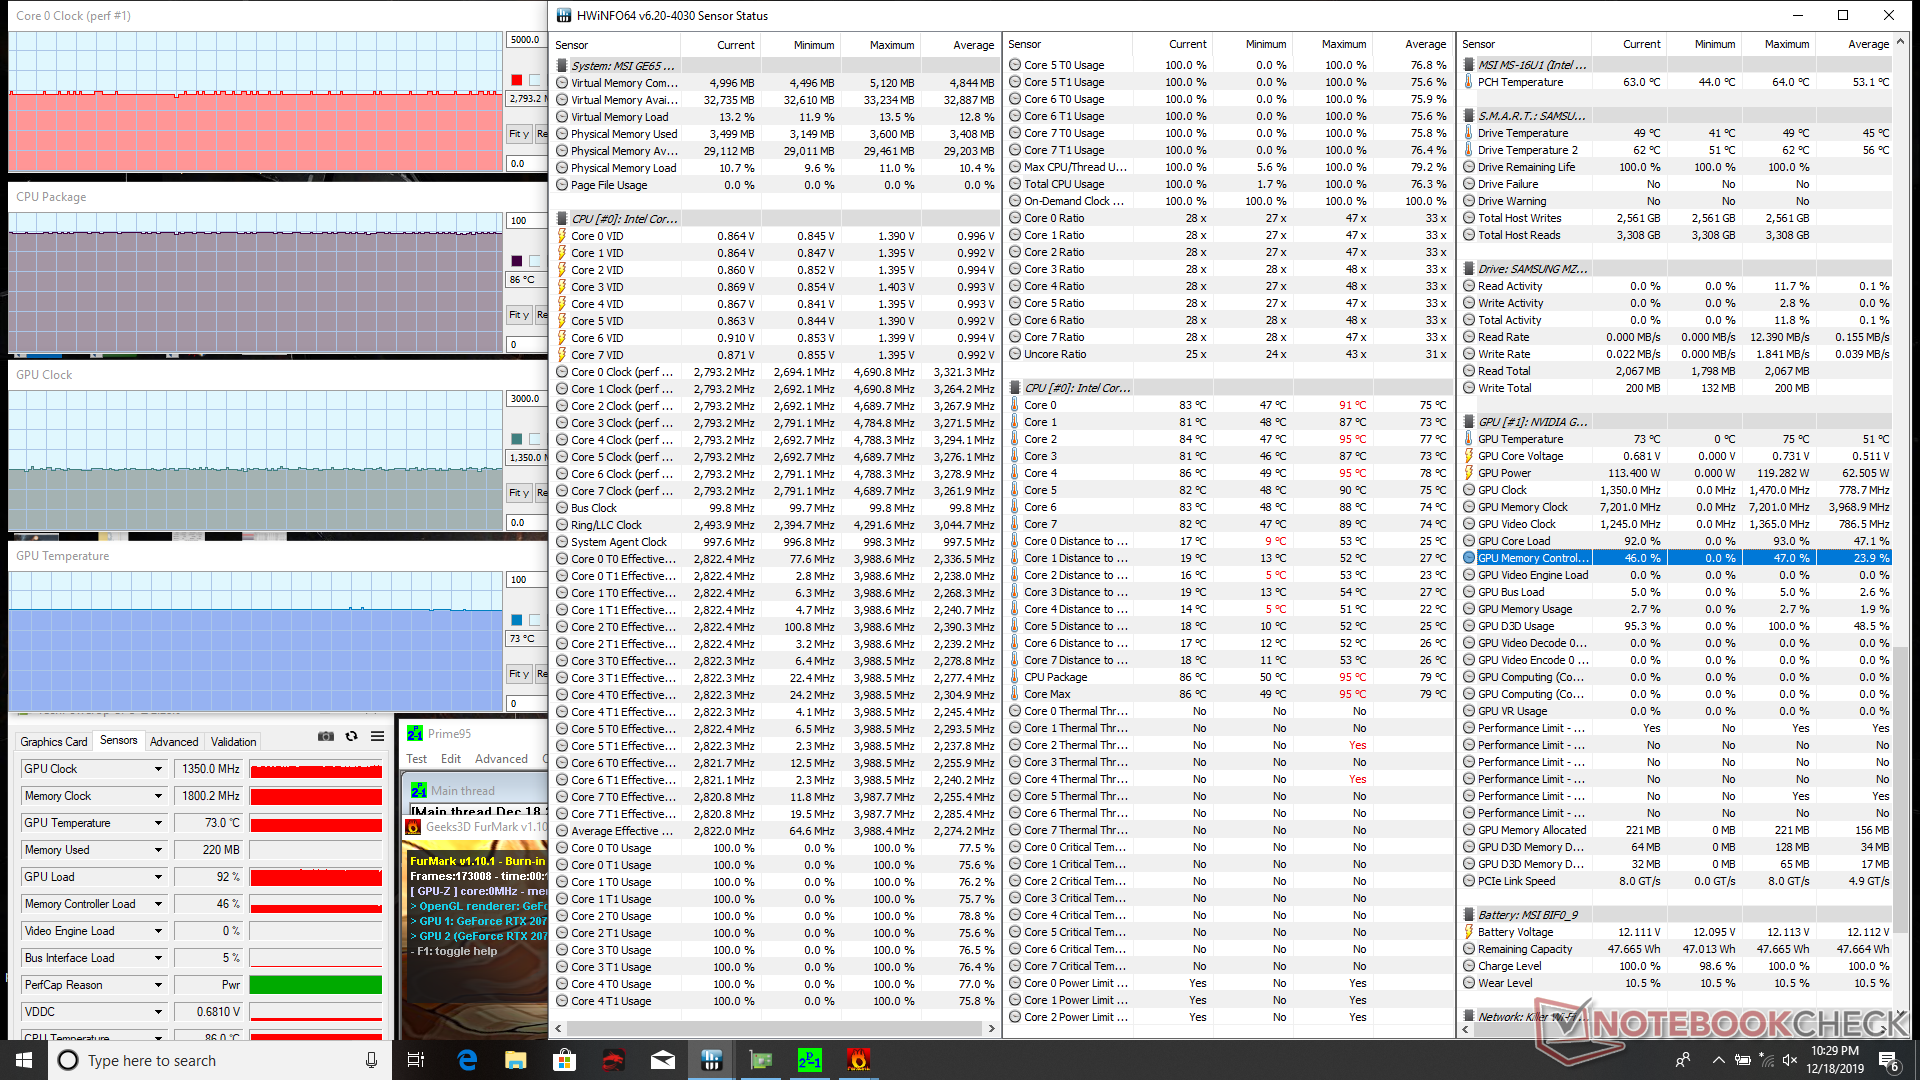
| CPU Clock (GHz) | GPU Clock (MHz) | Average CPU Temperature (°C) | Average GPU Temperature (°C) | |
| System Idle | -- | -- | 60 | 47 |
| Prime95 Stress | 3.2 - 3.3 | -- | 88 | -- |
| Prime95 + FurMark Stress | 2.8 - 2.9 | 1350 | 86 | 73 |
| Witcher 3 Stress | 4.1 - 4.3 | 1695 | 81 | 73 |
Speakers
MSI gaming laptops have always had loud audio because of their large internal speakers and the GE65 is no different. The four speakers total 10 W compared to just 2 W or 4 W or most other gaming laptops. Our pink noise measurements show relatively balanced audio with roll-off occurring between 250 Hz and 500 Hz.


MSI GE65 Raider 9SF-049US audio analysis
(+) | speakers can play relatively loud (93 dB)
Bass 100 - 315 Hz
(-) | nearly no bass - on average 20.5% lower than median
(±) | linearity of bass is average (8.8% delta to prev. frequency)
Mids 400 - 2000 Hz
(+) | balanced mids - only 3.3% away from median
(+) | mids are linear (4.6% delta to prev. frequency)
Highs 2 - 16 kHz
(+) | balanced highs - only 1.4% away from median
(+) | highs are linear (5% delta to prev. frequency)
Overall 100 - 16.000 Hz
(±) | linearity of overall sound is average (15.6% difference to median)
Compared to same class
» 36% of all tested devices in this class were better, 6% similar, 58% worse
» The best had a delta of 6%, average was 18%, worst was 132%
Compared to all devices tested
» 23% of all tested devices were better, 5% similar, 72% worse
» The best had a delta of 4%, average was 24%, worst was 134%
Apple MacBook 12 (Early 2016) 1.1 GHz audio analysis
(+) | speakers can play relatively loud (83.6 dB)
Bass 100 - 315 Hz
(±) | reduced bass - on average 11.3% lower than median
(±) | linearity of bass is average (14.2% delta to prev. frequency)
Mids 400 - 2000 Hz
(+) | balanced mids - only 2.4% away from median
(+) | mids are linear (5.5% delta to prev. frequency)
Highs 2 - 16 kHz
(+) | balanced highs - only 2% away from median
(+) | highs are linear (4.5% delta to prev. frequency)
Overall 100 - 16.000 Hz
(+) | overall sound is linear (10.2% difference to median)
Compared to same class
» 7% of all tested devices in this class were better, 2% similar, 91% worse
» The best had a delta of 5%, average was 18%, worst was 53%
Compared to all devices tested
» 5% of all tested devices were better, 1% similar, 94% worse
» The best had a delta of 4%, average was 24%, worst was 134%
Energy Management
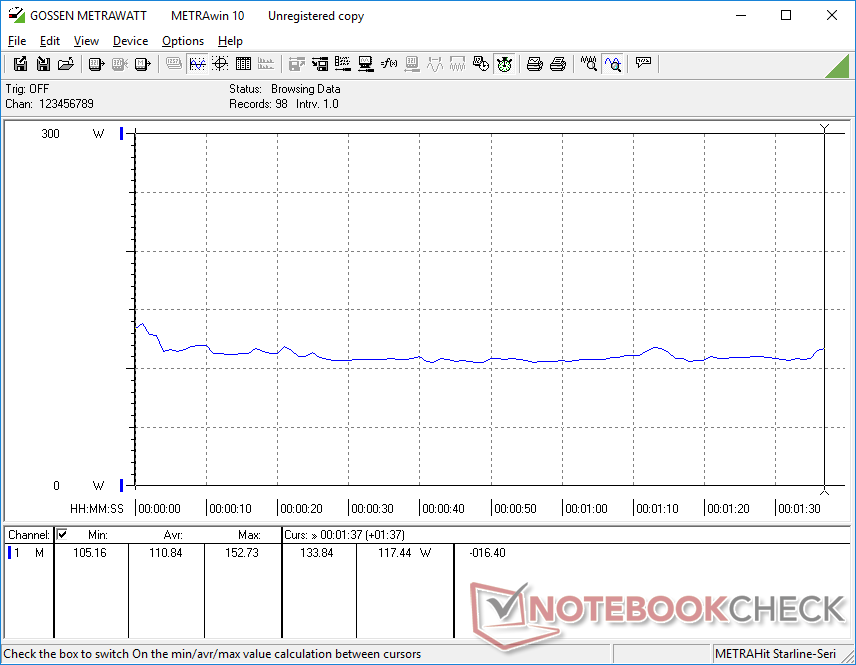
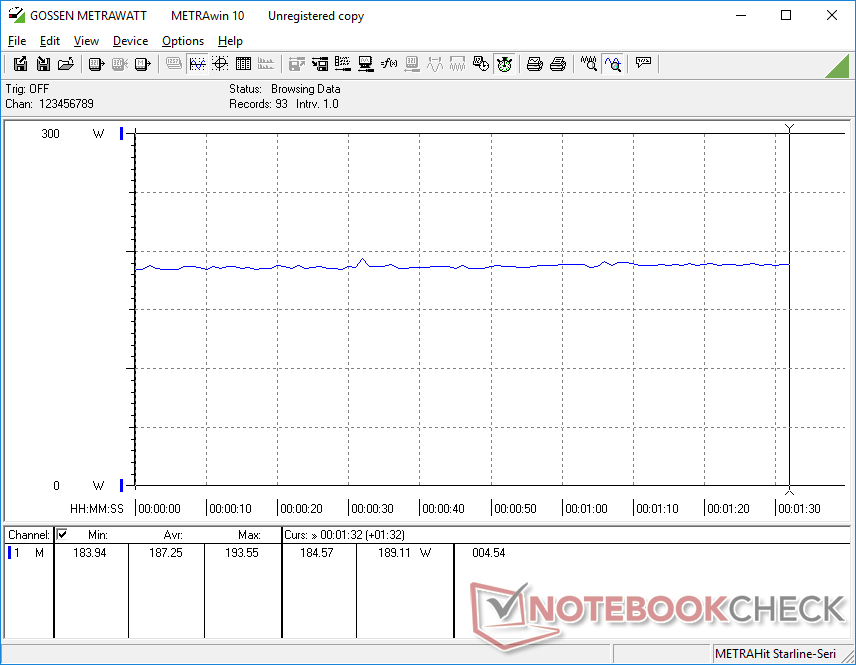
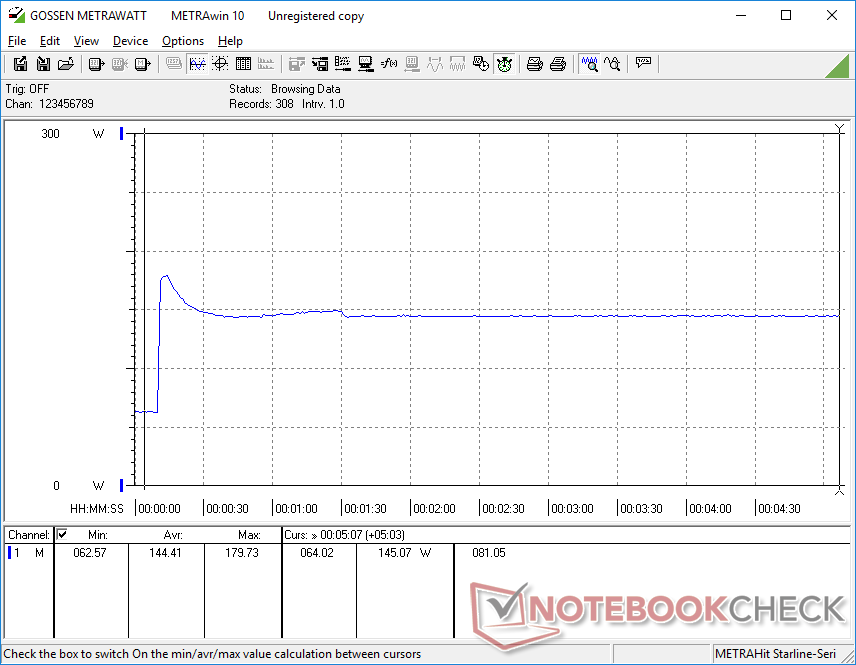
Power Consumption
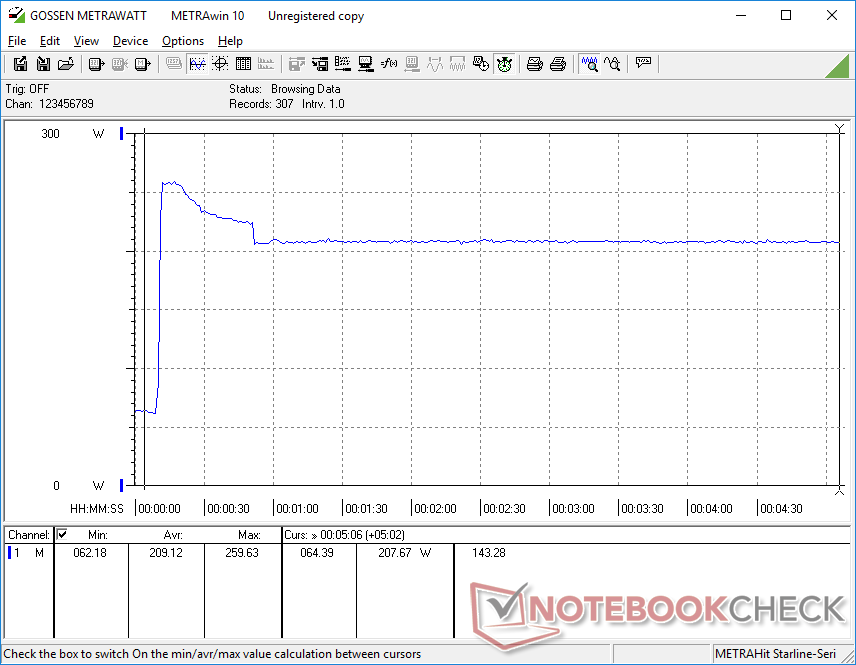
Idling on desktop demands between 15 W and 21 W depending on the brightness setting and power profile to indicate no abnormally high power consumption behavior. Running Witcher 3 consumes about 187 W to be nearly the same as the older GE63 with the last generation GTX 1070. Users are getting 20 to 40 percent faster graphics performance when jumping from the GTX 1070 to the RTX 2070 for essentially the same power consumption rate.
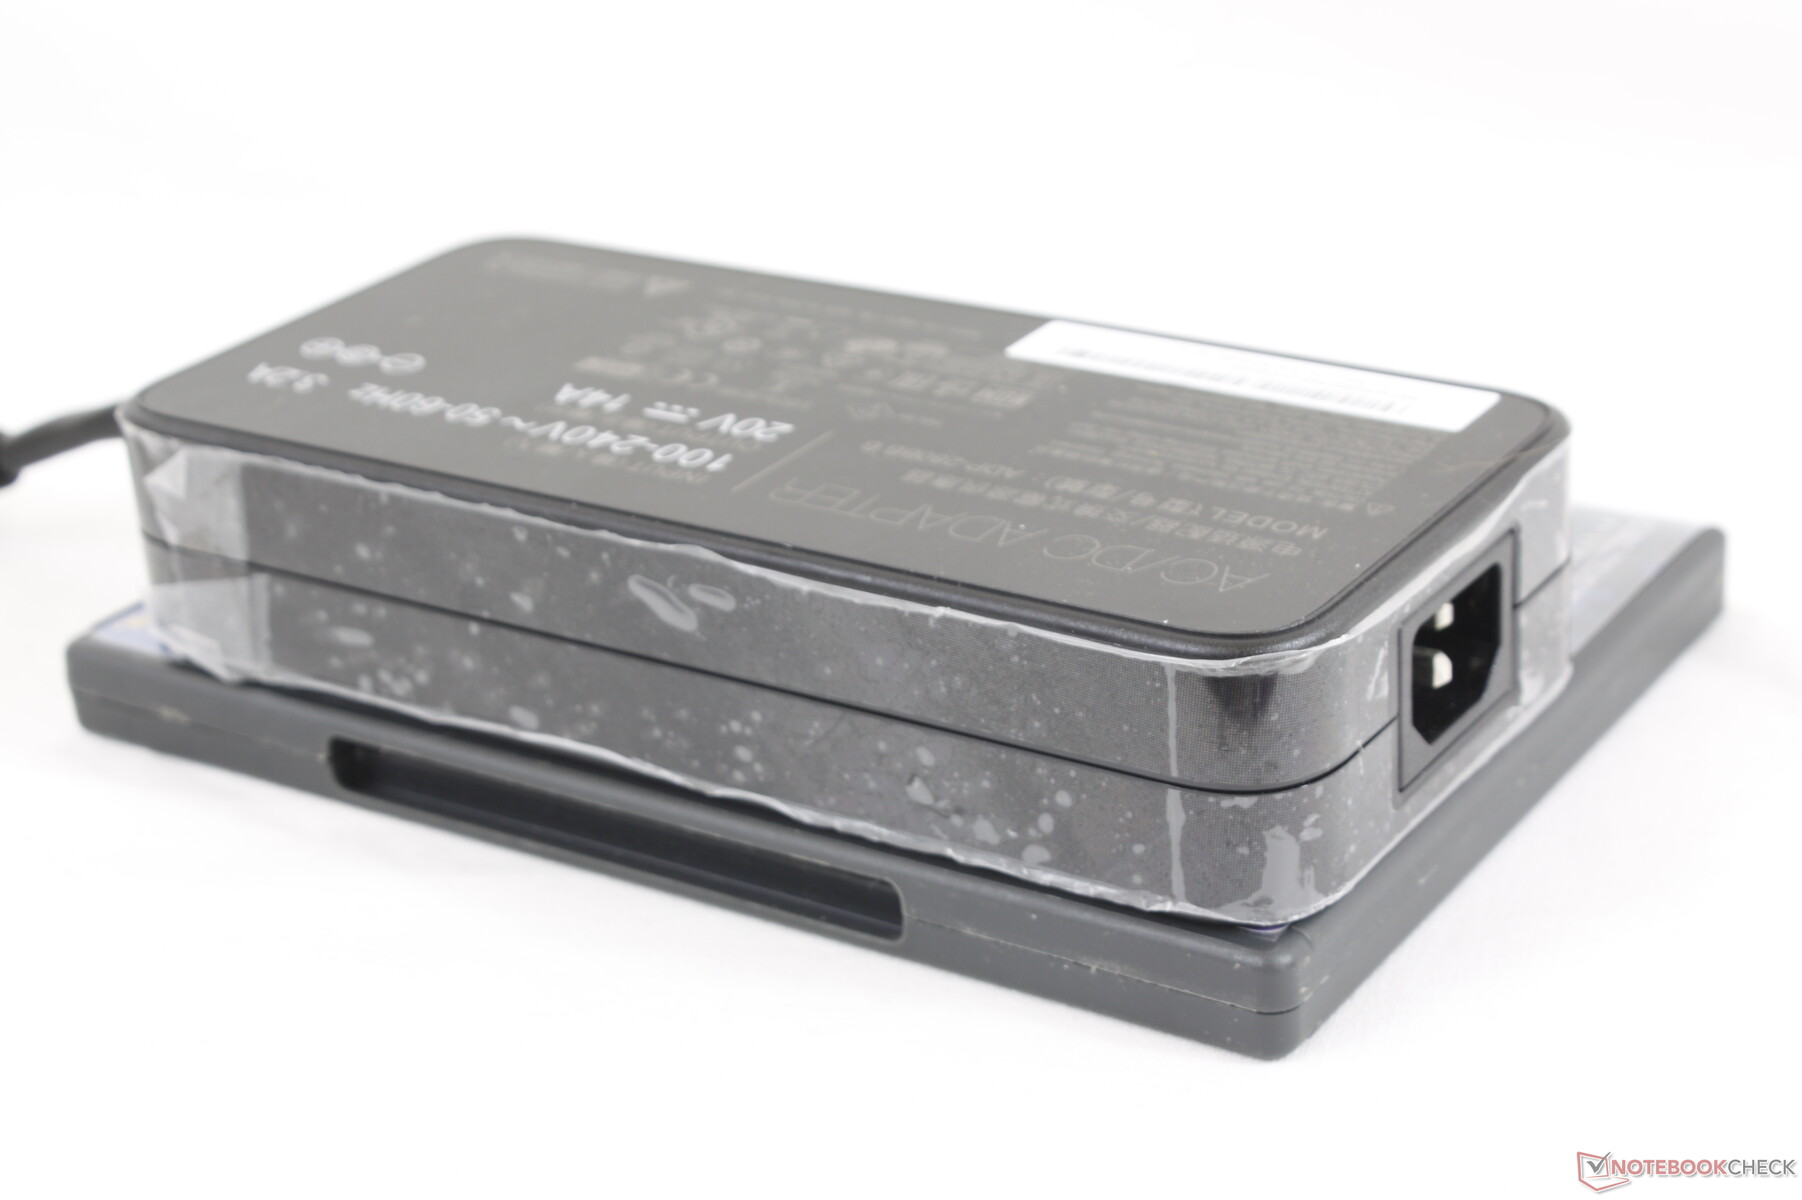
We're able to measure a maximum consumption of 260 W from the large (~18 x 8.5 x 3.5 cm) 280 W AC adapter. Consumption eventually falls to 208 W due to thermal reasons. The adapter is able to run games and recharge the system simultaneously. Note that the lesser RTX 2060 SKU ships with a smaller 180 W AC adapter instead.
| Off / Standby | |
| Idle | |
| Load |
|
Key:
min: | |
| MSI GE65 Raider 9SF-049US i9-9880H, GeForce RTX 2070 Mobile, Samsung SSD PM981 MZVLB1T0HALR, IPS, 1920x1080, 15.6" | Eurocom Nightsky RX15 i9-9980HK, GeForce RTX 2070 Mobile, Samsung SSD 970 Pro 512GB, OLED, 3840x2160, 15.6" | Maingear Vector 15 i7-9750H, GeForce GTX 1660 Ti Mobile, , IPS, 1920x1080, 15.6" | Razer Blade 15 RTX 2080 Max-Q i7-9750H, GeForce RTX 2080 Max-Q, Samsung SSD PM981 MZVLB512HAJQ, IPS, 1920x1080, 15.6" | MSI P65 Creator 9SF-657 i9-9880H, GeForce RTX 2070 Max-Q, 2x Samsung SSD PM981 MZVLB512HAJQ (RAID 0), IPS, 3840x2160, 15.6" | MSI GE63 Raider RGB 8RF-008 i7-8750H, GeForce GTX 1070 Mobile, Samsung SSD PM871a MZNLN256HMHQ, TN, 1920x1080, 15.6" | |
|---|---|---|---|---|---|---|
| Power Consumption | -13% | 2% | 14% | 14% | 17% | |
| Idle Minimum * (Watt) | 15 | 12.6 16% | 16.2 -8% | 12.5 17% | 9.4 37% | 9 40% |
| Idle Average * (Watt) | 18.5 | 21.4 -16% | 21.1 -14% | 15.3 17% | 17.4 6% | 14 24% |
| Idle Maximum * (Watt) | 20.2 | 34.4 -70% | 26.4 -31% | 20.7 -2% | 19.6 3% | 19 6% |
| Load Average * (Watt) | 110.9 | 123.2 -11% | 85.1 23% | 90.2 19% | 103 7% | 91 18% |
| Witcher 3 ultra * (Watt) | 187.3 | 192.4 -3% | 158.2 16% | 162 14% | 182 3% | |
| Load Maximum * (Watt) | 260 | 246.6 5% | 188 28% | 209.3 19% | 216 17% | 238 8% |
* ... smaller is better
Battery Life
Battery capacity has not changed from the GE63 which is a shame since most other 15.6-inch gaming laptops have larger capacity batteries. Runtimes have not improved as a result to be just around 3.5 hours of real-world WLAN use compared to almost twice that on the Razer Blade 15. Idling on desktop at the lowest possible settings and brightness level lasts about 6 hours only. It's interesting to note that MSI continues to be one of the few OEMs to use to Li-Ion instead of Li-Ion polymer.
Recharging from empty to full capacity takes about 1.5 to 2 hours. Recharging the system via USB Type-C will not work.
| MSI GE65 Raider 9SF-049US i9-9880H, GeForce RTX 2070 Mobile, 51 Wh | MSI GE63 Raider 8SG i7-8750H, GeForce RTX 2080 Mobile, 51 Wh | Razer Blade 15 RTX 2080 Max-Q i7-9750H, GeForce RTX 2080 Max-Q, 80 Wh | Walmart EVOO Gaming 17 i7-9750H, GeForce RTX 2060 Mobile, 46 Wh | Maingear Vector 15 i7-9750H, GeForce GTX 1660 Ti Mobile, 62 Wh | HP Omen 15-dc1303ng i7-8750H, GeForce RTX 2070 Max-Q, 70 Wh | |
|---|---|---|---|---|---|---|
| Battery runtime | 15% | 141% | 17% | 67% | 24% | |
| Reader / Idle (h) | 6.2 | 6.2 0% | 15.9 156% | 5 -19% | ||
| WiFi v1.3 (h) | 3.6 | 4 11% | 6.6 83% | 4.2 17% | 6 67% | 3.3 -8% |
| Load (h) | 0.6 | 0.8 33% | 1.7 183% | 1.2 100% |
Pros
Cons
Verdict

Take the GE63, cut off a bit from the sides, and you end up with the GE65. MSI's latest mid-range machine keeps everything we liked about the GE63 while updating some of the aspects that we didn't like in the process. Namely, the series is now noticeably more compact and travel-friendly than before without running any louder or warmer.
On the other hand, some less desirable features have not improved at all gen-to-gen. Screen brightness, ports, battery life, chassis rigidity, and noise are all pretty much the same as on the GE63. As a result, choosing the GE65 over the GE63 will be largely superficial.
Potential buyers will likely compare the MSI GE65 with the Asus ROG Strix Scar III G531GW since both laptops carry the same Core i9 CPU and RTX 2070 GPU. After having tested both systems, the MSI solution has the edge as it's easier to service with more storage options, more ports, a better keyboard, an actual webcam, and generally quieter fans during low loads while the Asus system has a stronger chassis design with a brighter screen.
At $2600 USD, our Core i9 configuration can be a big pill to swallow for a mid-range gaming laptop. We recommend going for the Core i7 configuration and then upgrading the storage yourself to save on costs since servicing is so much easier than on the GS65. It's tough to go back to 60 Hz displays after becoming accustomed to 144 Hz or 240 Hz options.
MSI GE65 Raider 9SF-049US
- 12/23/2019 v7 (old)
Allen Ngo
Price comparison
