Schenker Key 16 (Clevo P960EN-K) Review: The slim notebook pleases with a lot of computing power

Although Schenker calls the Key 16 a "slim mobile workstation," we see the device more as a multimedia all-rounder with an emphasis on gaming. The reason is fairly obvious: In the Key-16 series (and the Key-17 as well), the GeForce GPUs that are targeted for the consumer market are used. Nvidia's professional Quadro GPUs are only available in the current Key-15 series.
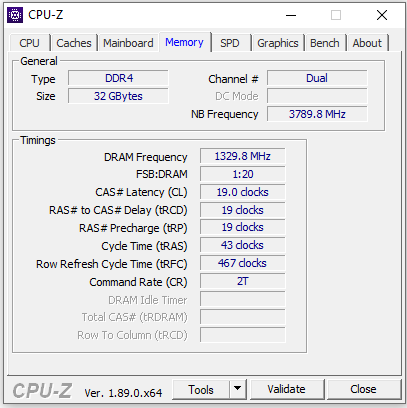
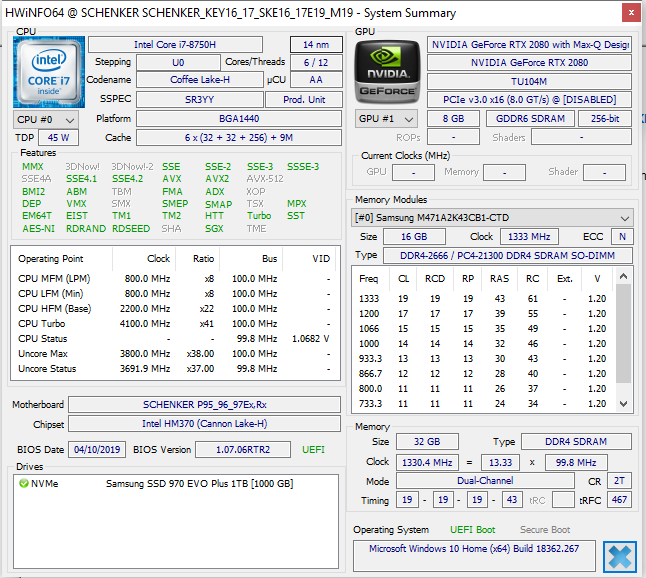
The Key 16 is based on a Barebone from Clevo (P960EN-K). The test unit provided to us is run by a Core i7-8750H processor and a GeForce RTX 2080 Max-Q GPU. Alternatively you can also select the GeForce GTX 1660 Ti, GeForce RTX 2060, or GeForce RTX 2070 Max-Q graphics cores.
Since there are currently no other 16.1-inch notebooks in our database, the competitors of the Key 16 include the current 15.6 and 17.3-inchers that fall within a similar price range, such as the HP Omen 15-dc1303ng, the Gigabyte Aero 15-X9, the Acer Predator Triton 500, the MSI GS65 Stealth 9SG, the Razer Blade 15, and the Alienware m15 P79F.
Case - Schenker uses metal
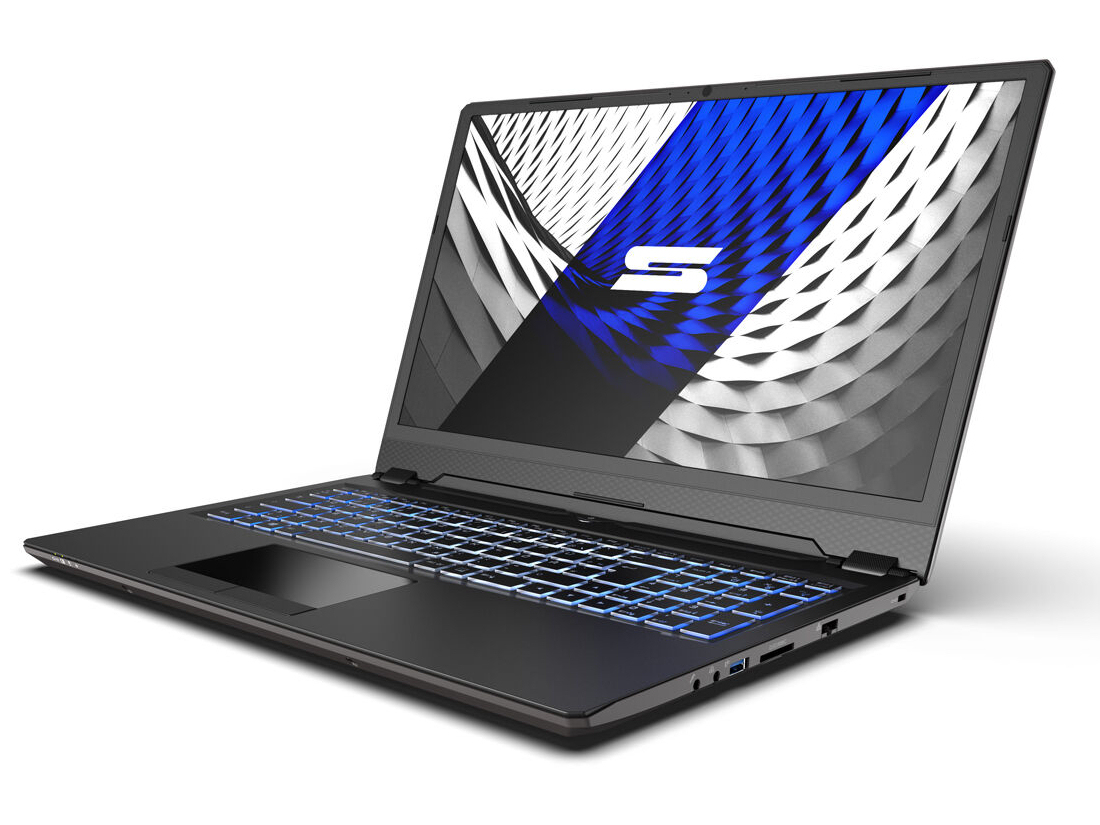
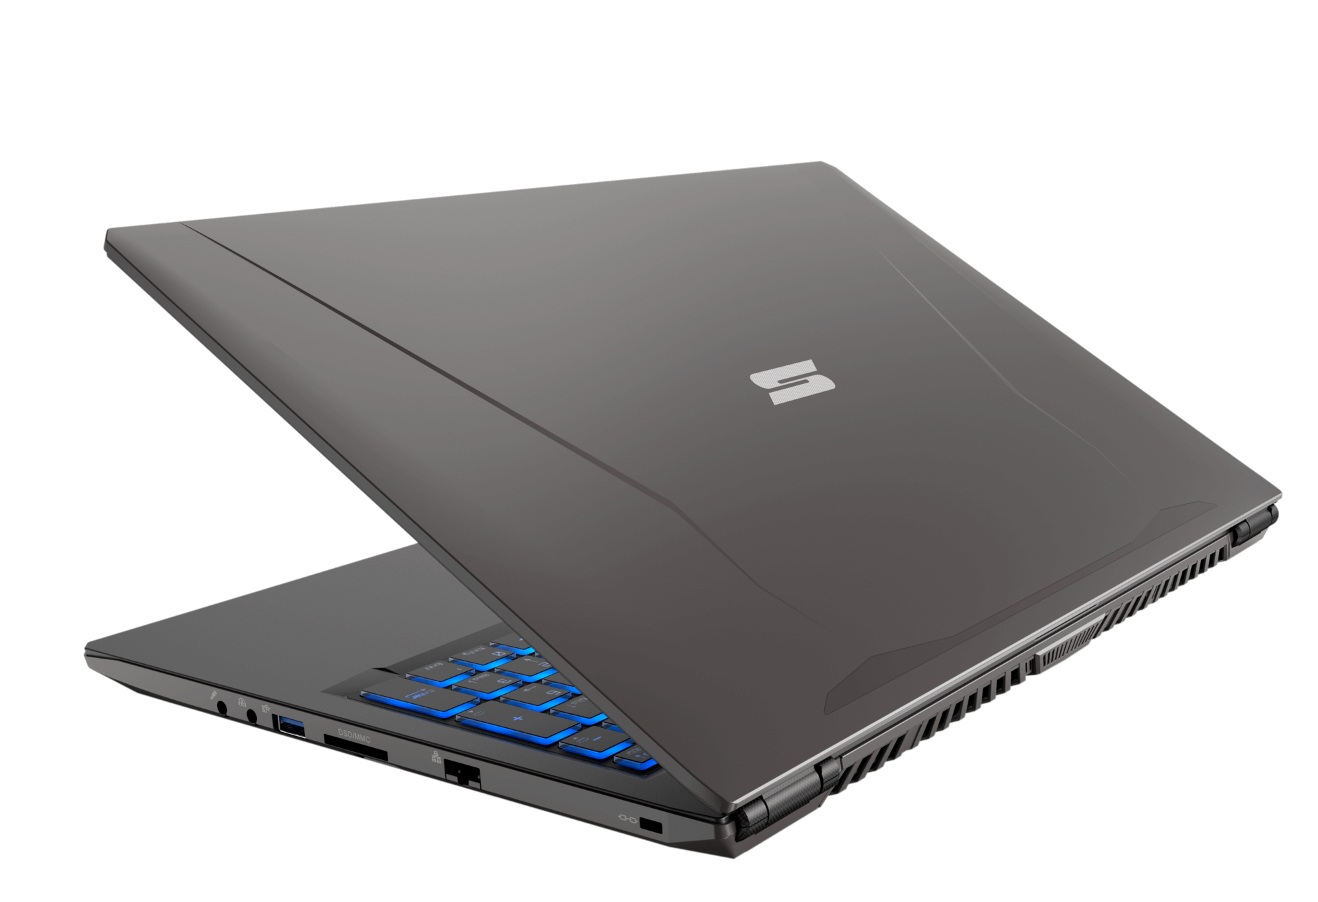
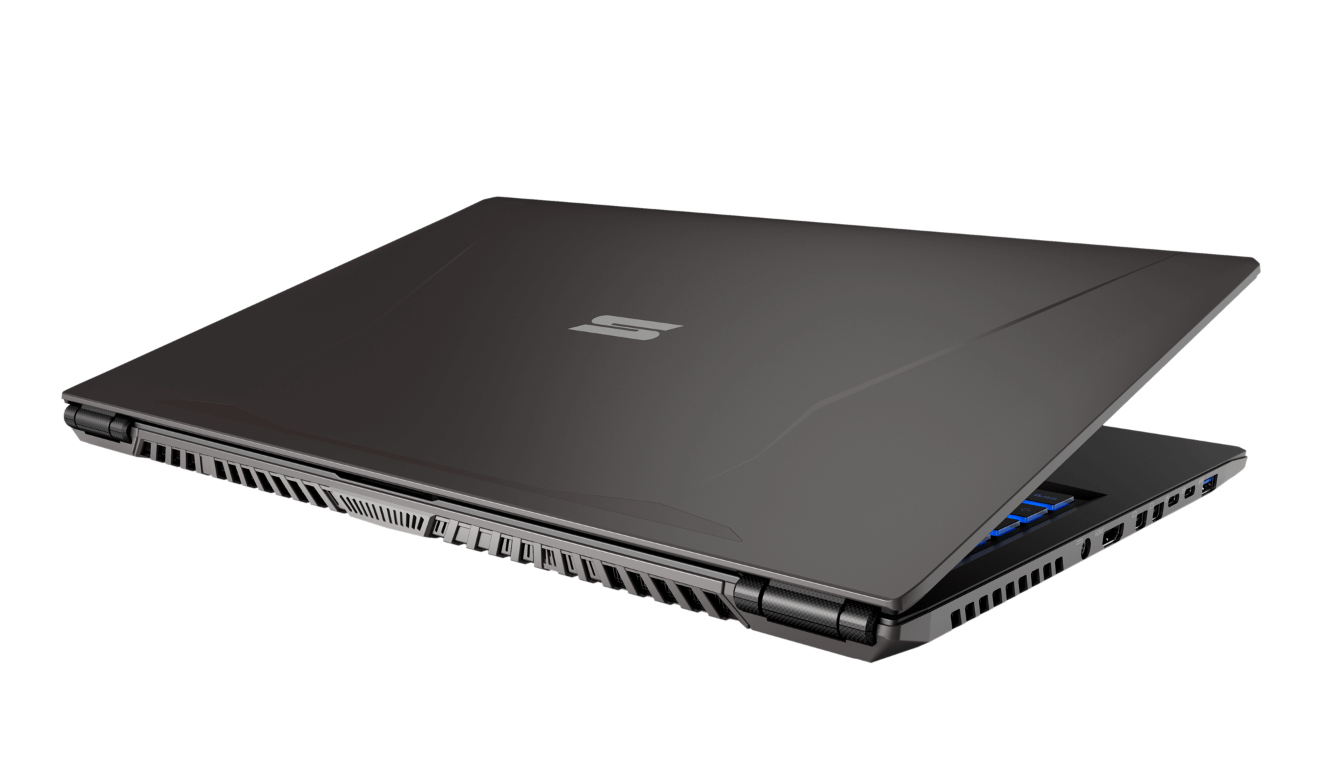
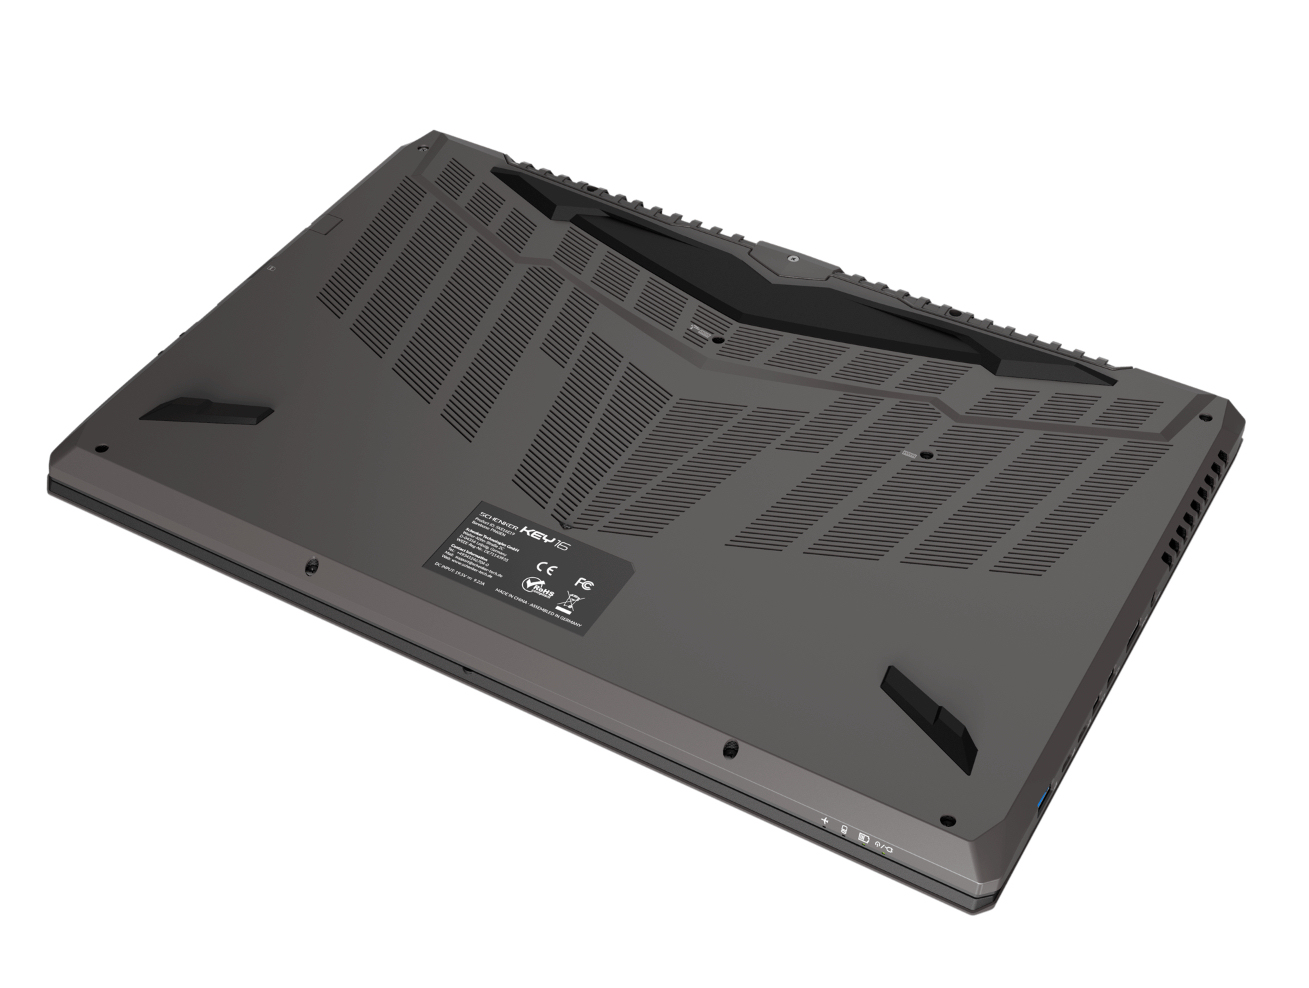
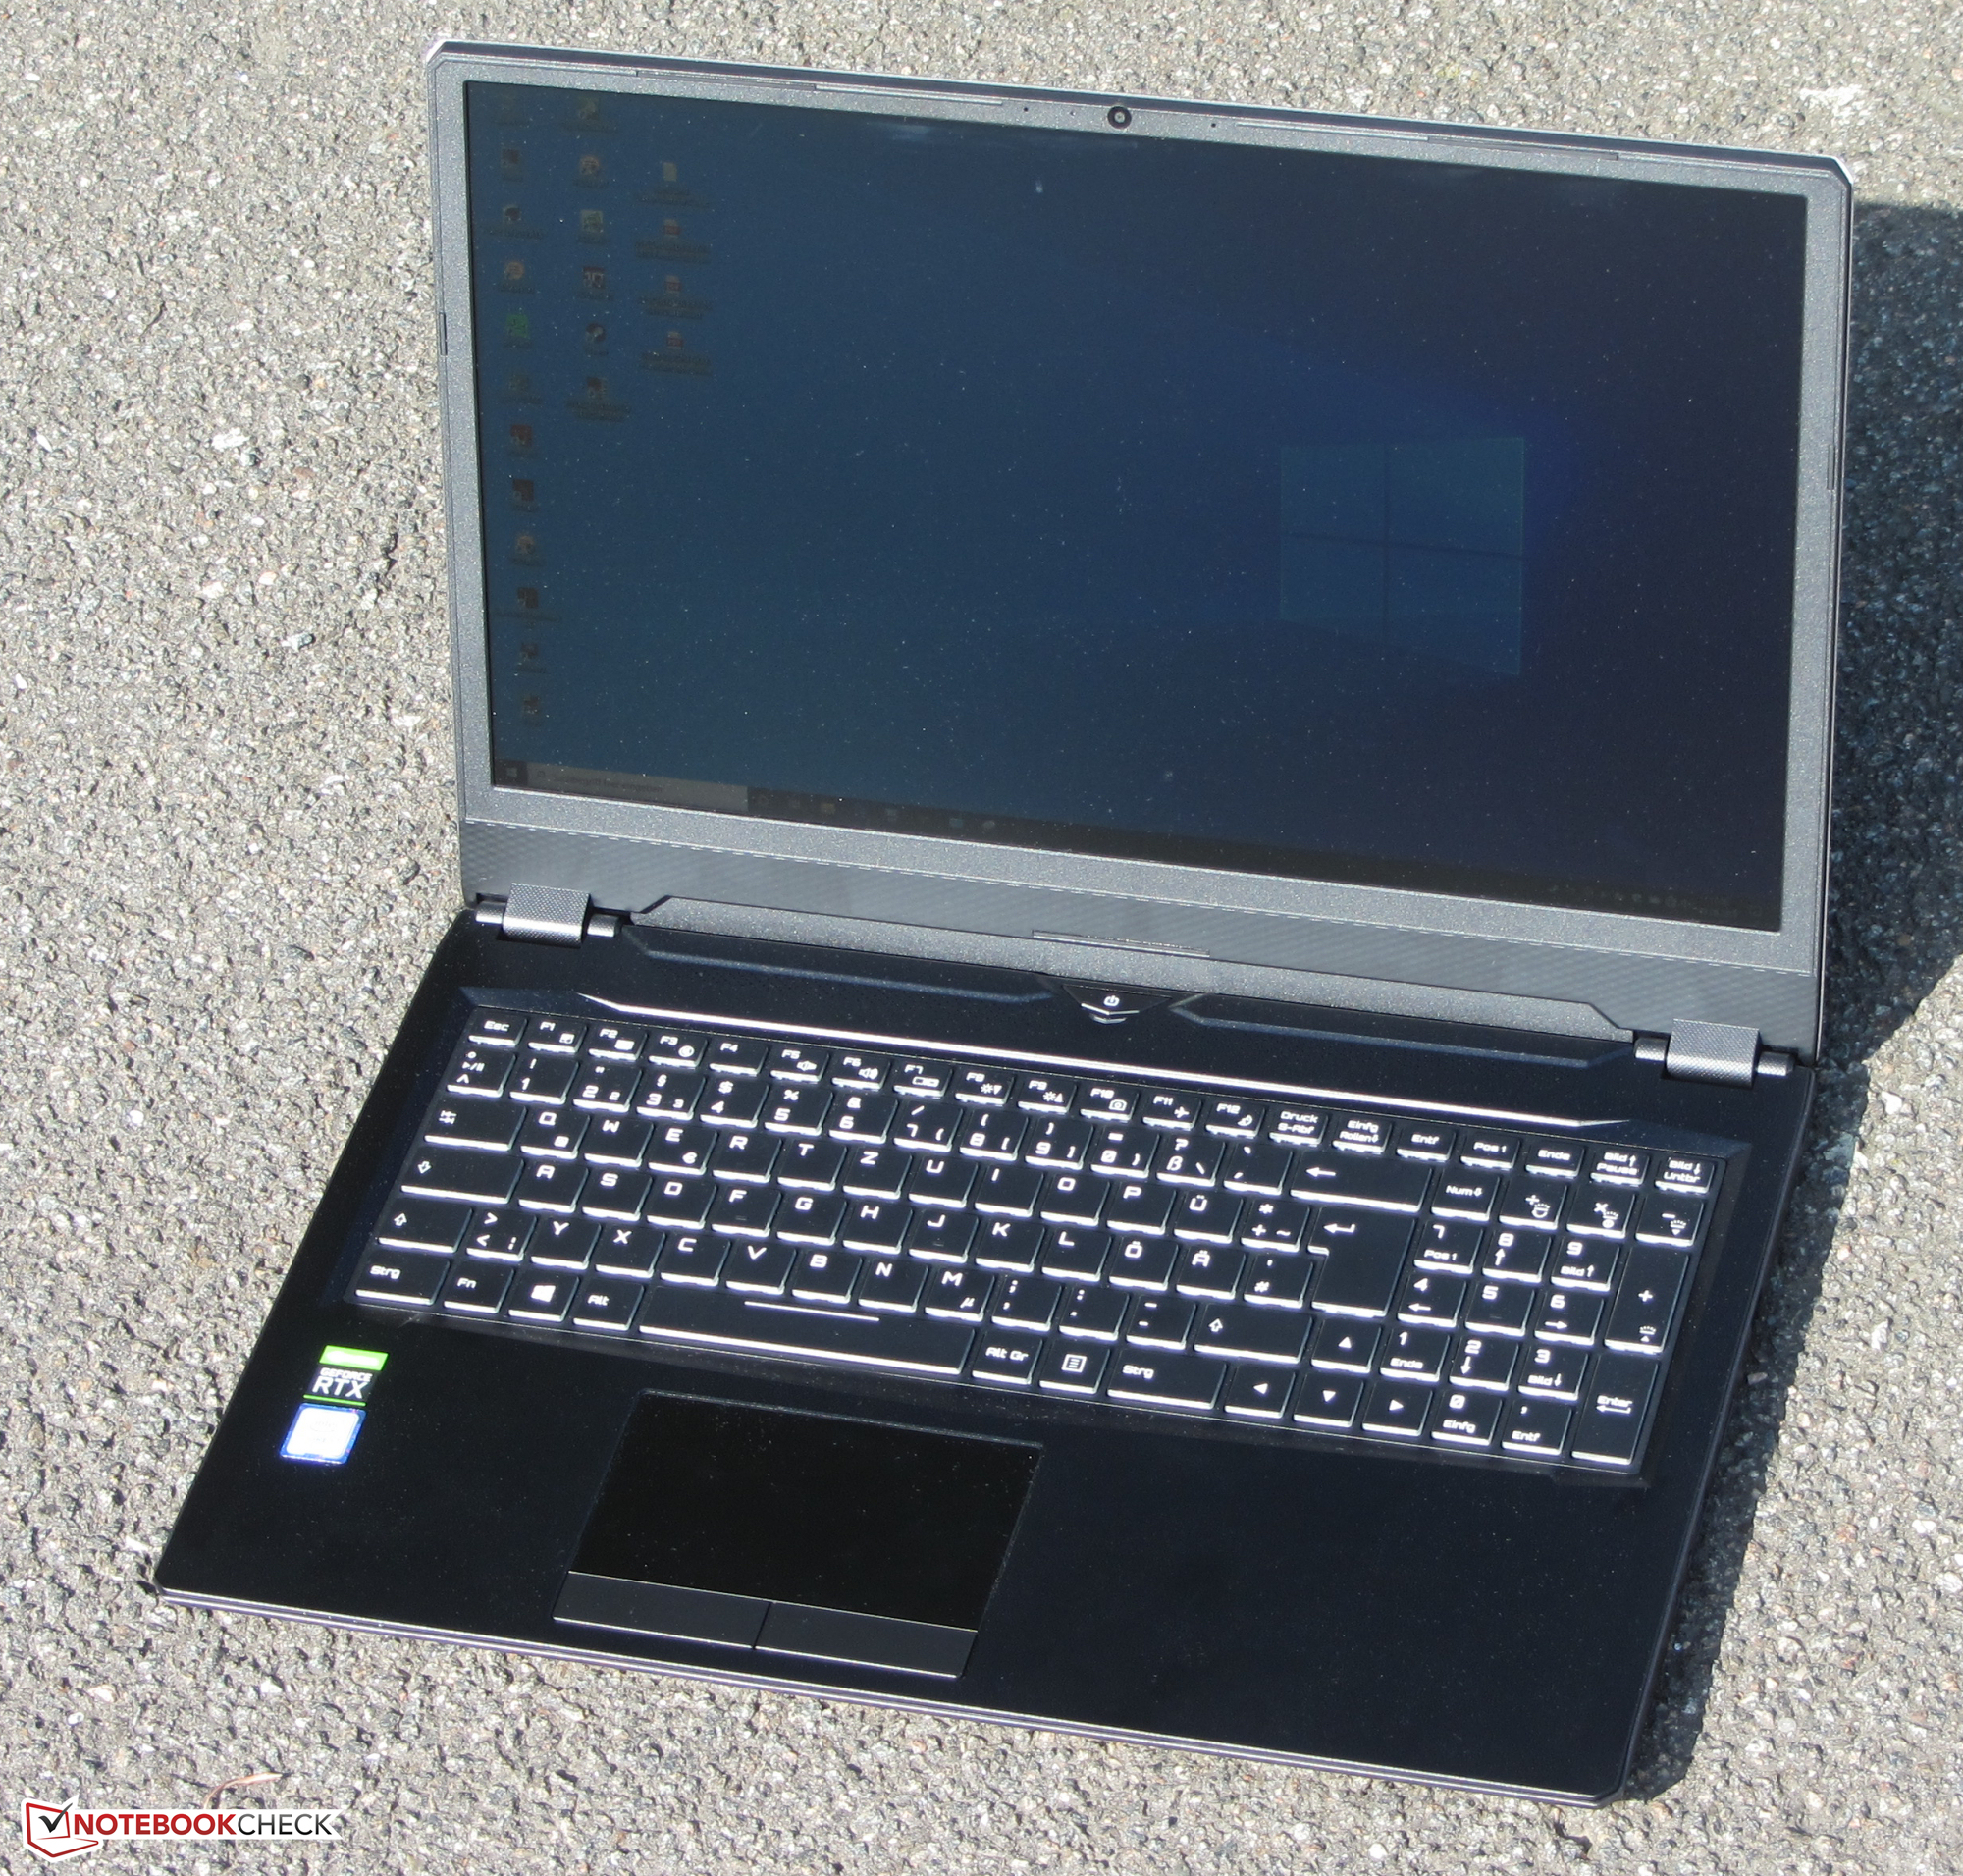
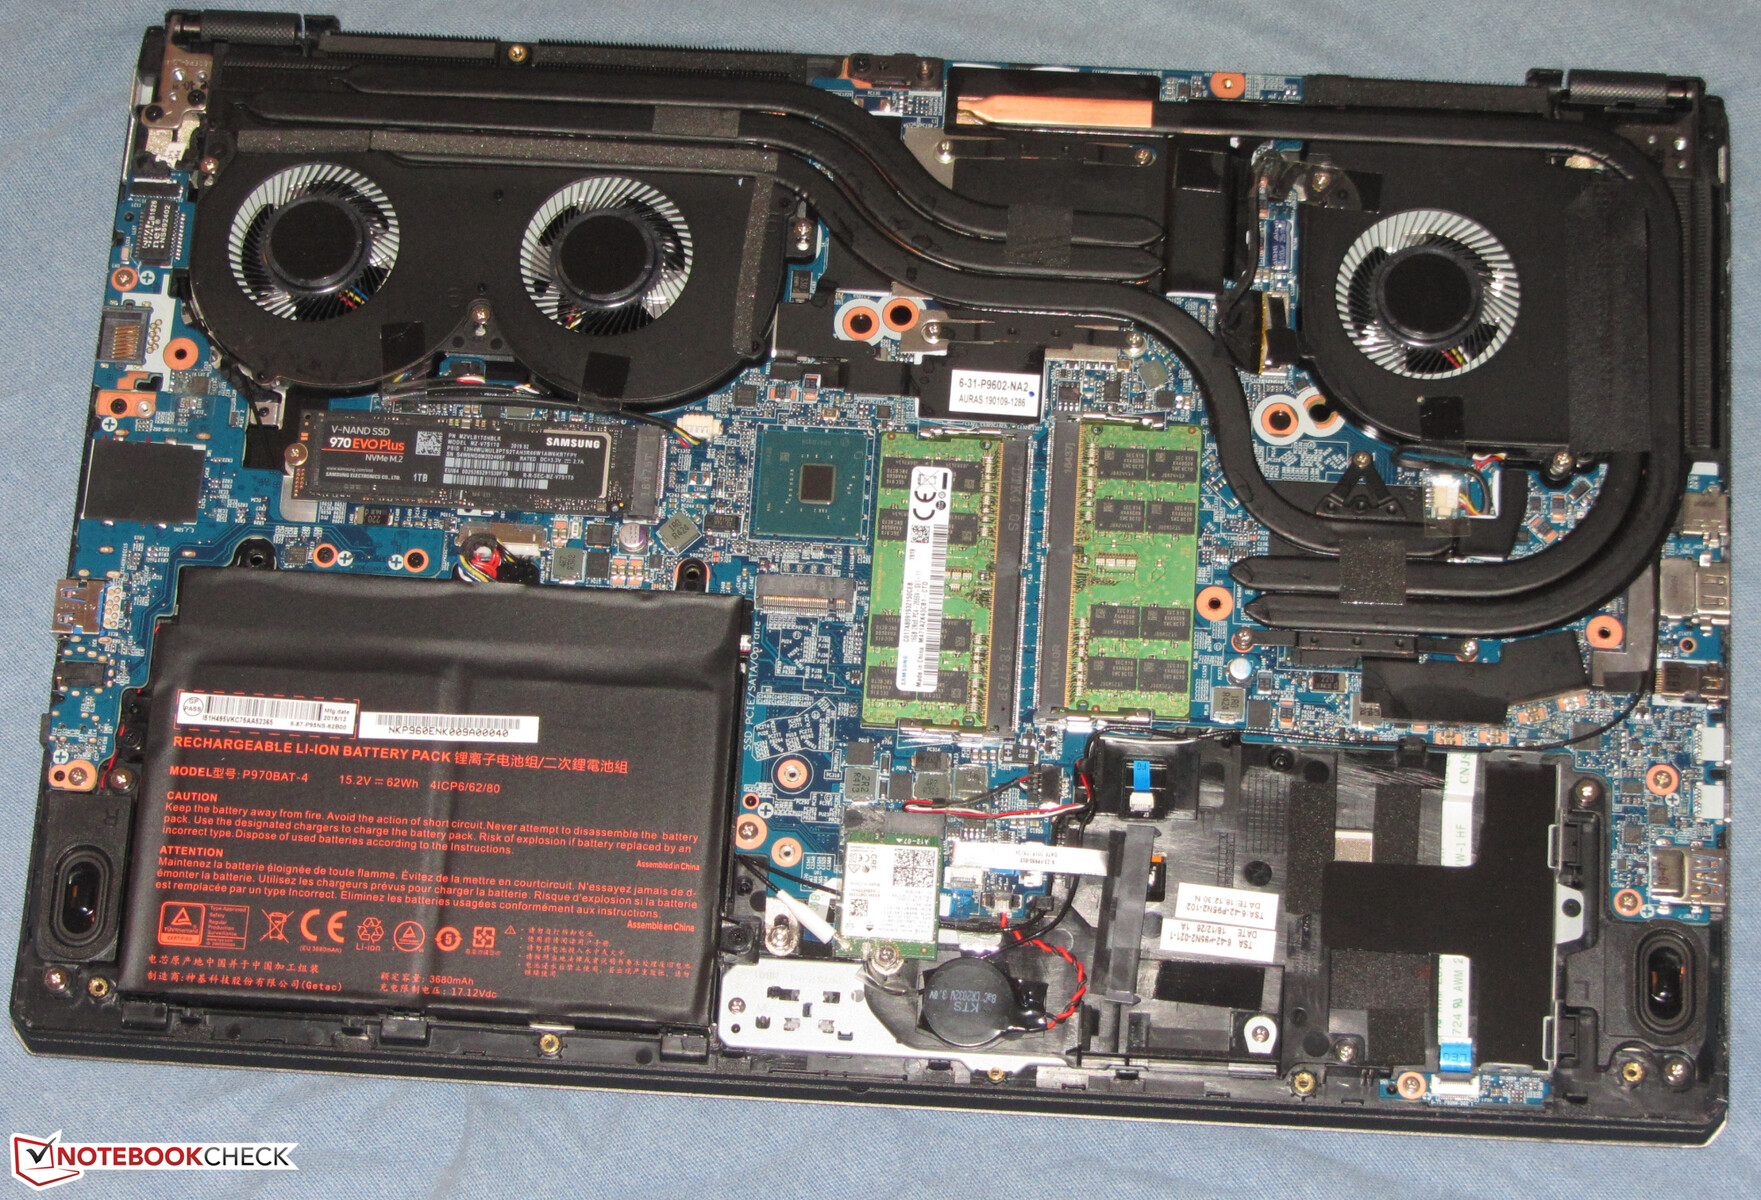
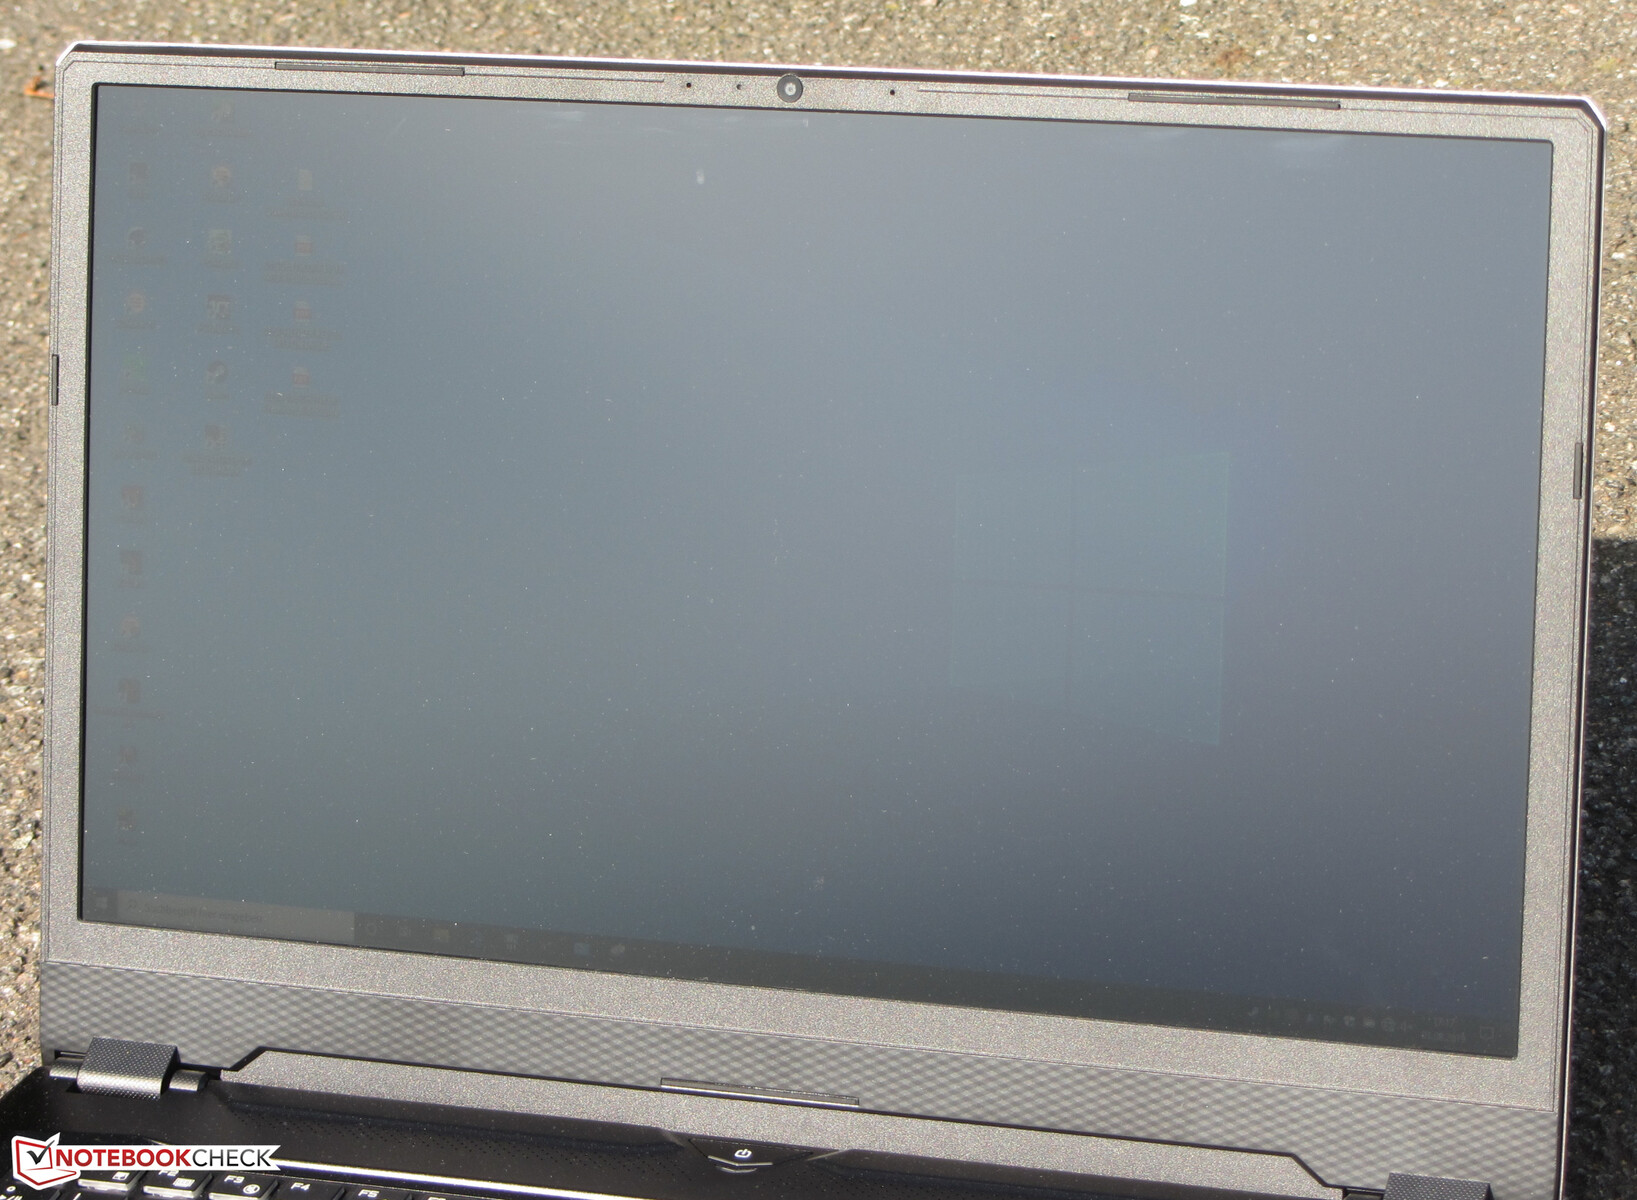
The Key 16 is based on the P960EN-K Barebone from Clevo. The slim case is able to please at first sight. With its simple design, it would strike a good figure on any desk. The relatively slim display bezels contribute to the visually pleasing overall impression. To a large extent, the case is made of metal, and only the display frame is made from plastic. Gray (display lid) and black colors (rest of the case) are used. Schenker bets on matte surfaces. The device does not offer a maintenance flap, but you have to remove the bottom of the case in order to access the insides. More on this later.
The notebook does not show any faults in terms of the workmanship. The gap measurements are even and there are no noticeable material overhangs. In terms of the stability, there are also no major complaints. If you press down a little below the touchpad, the base unit shows a little give. In addition, the base unit can also be warped slightly. However, all this remains within limits. While the display lid can be warped significantly more, pressure on the lid does not lead to any changes in the displayed image. The hinges hold the cover tightly in position, but wobble slightly. You can also open the display lid with a single hand, and the maximum opening angle is about 130 degrees.
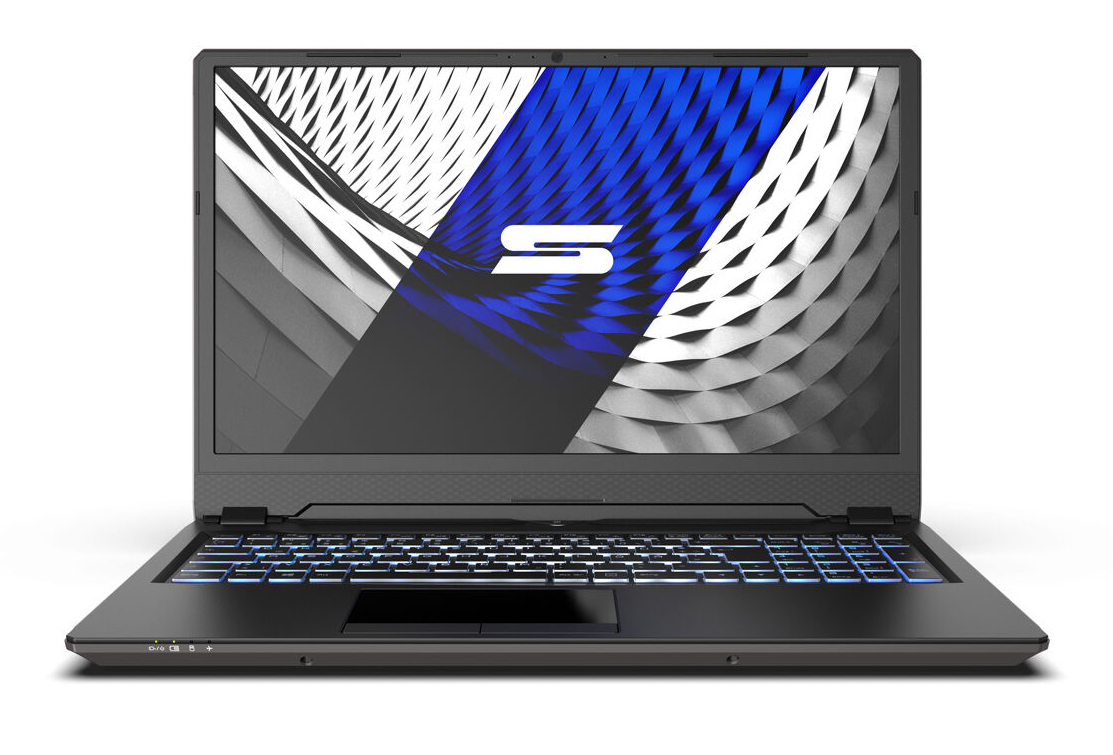
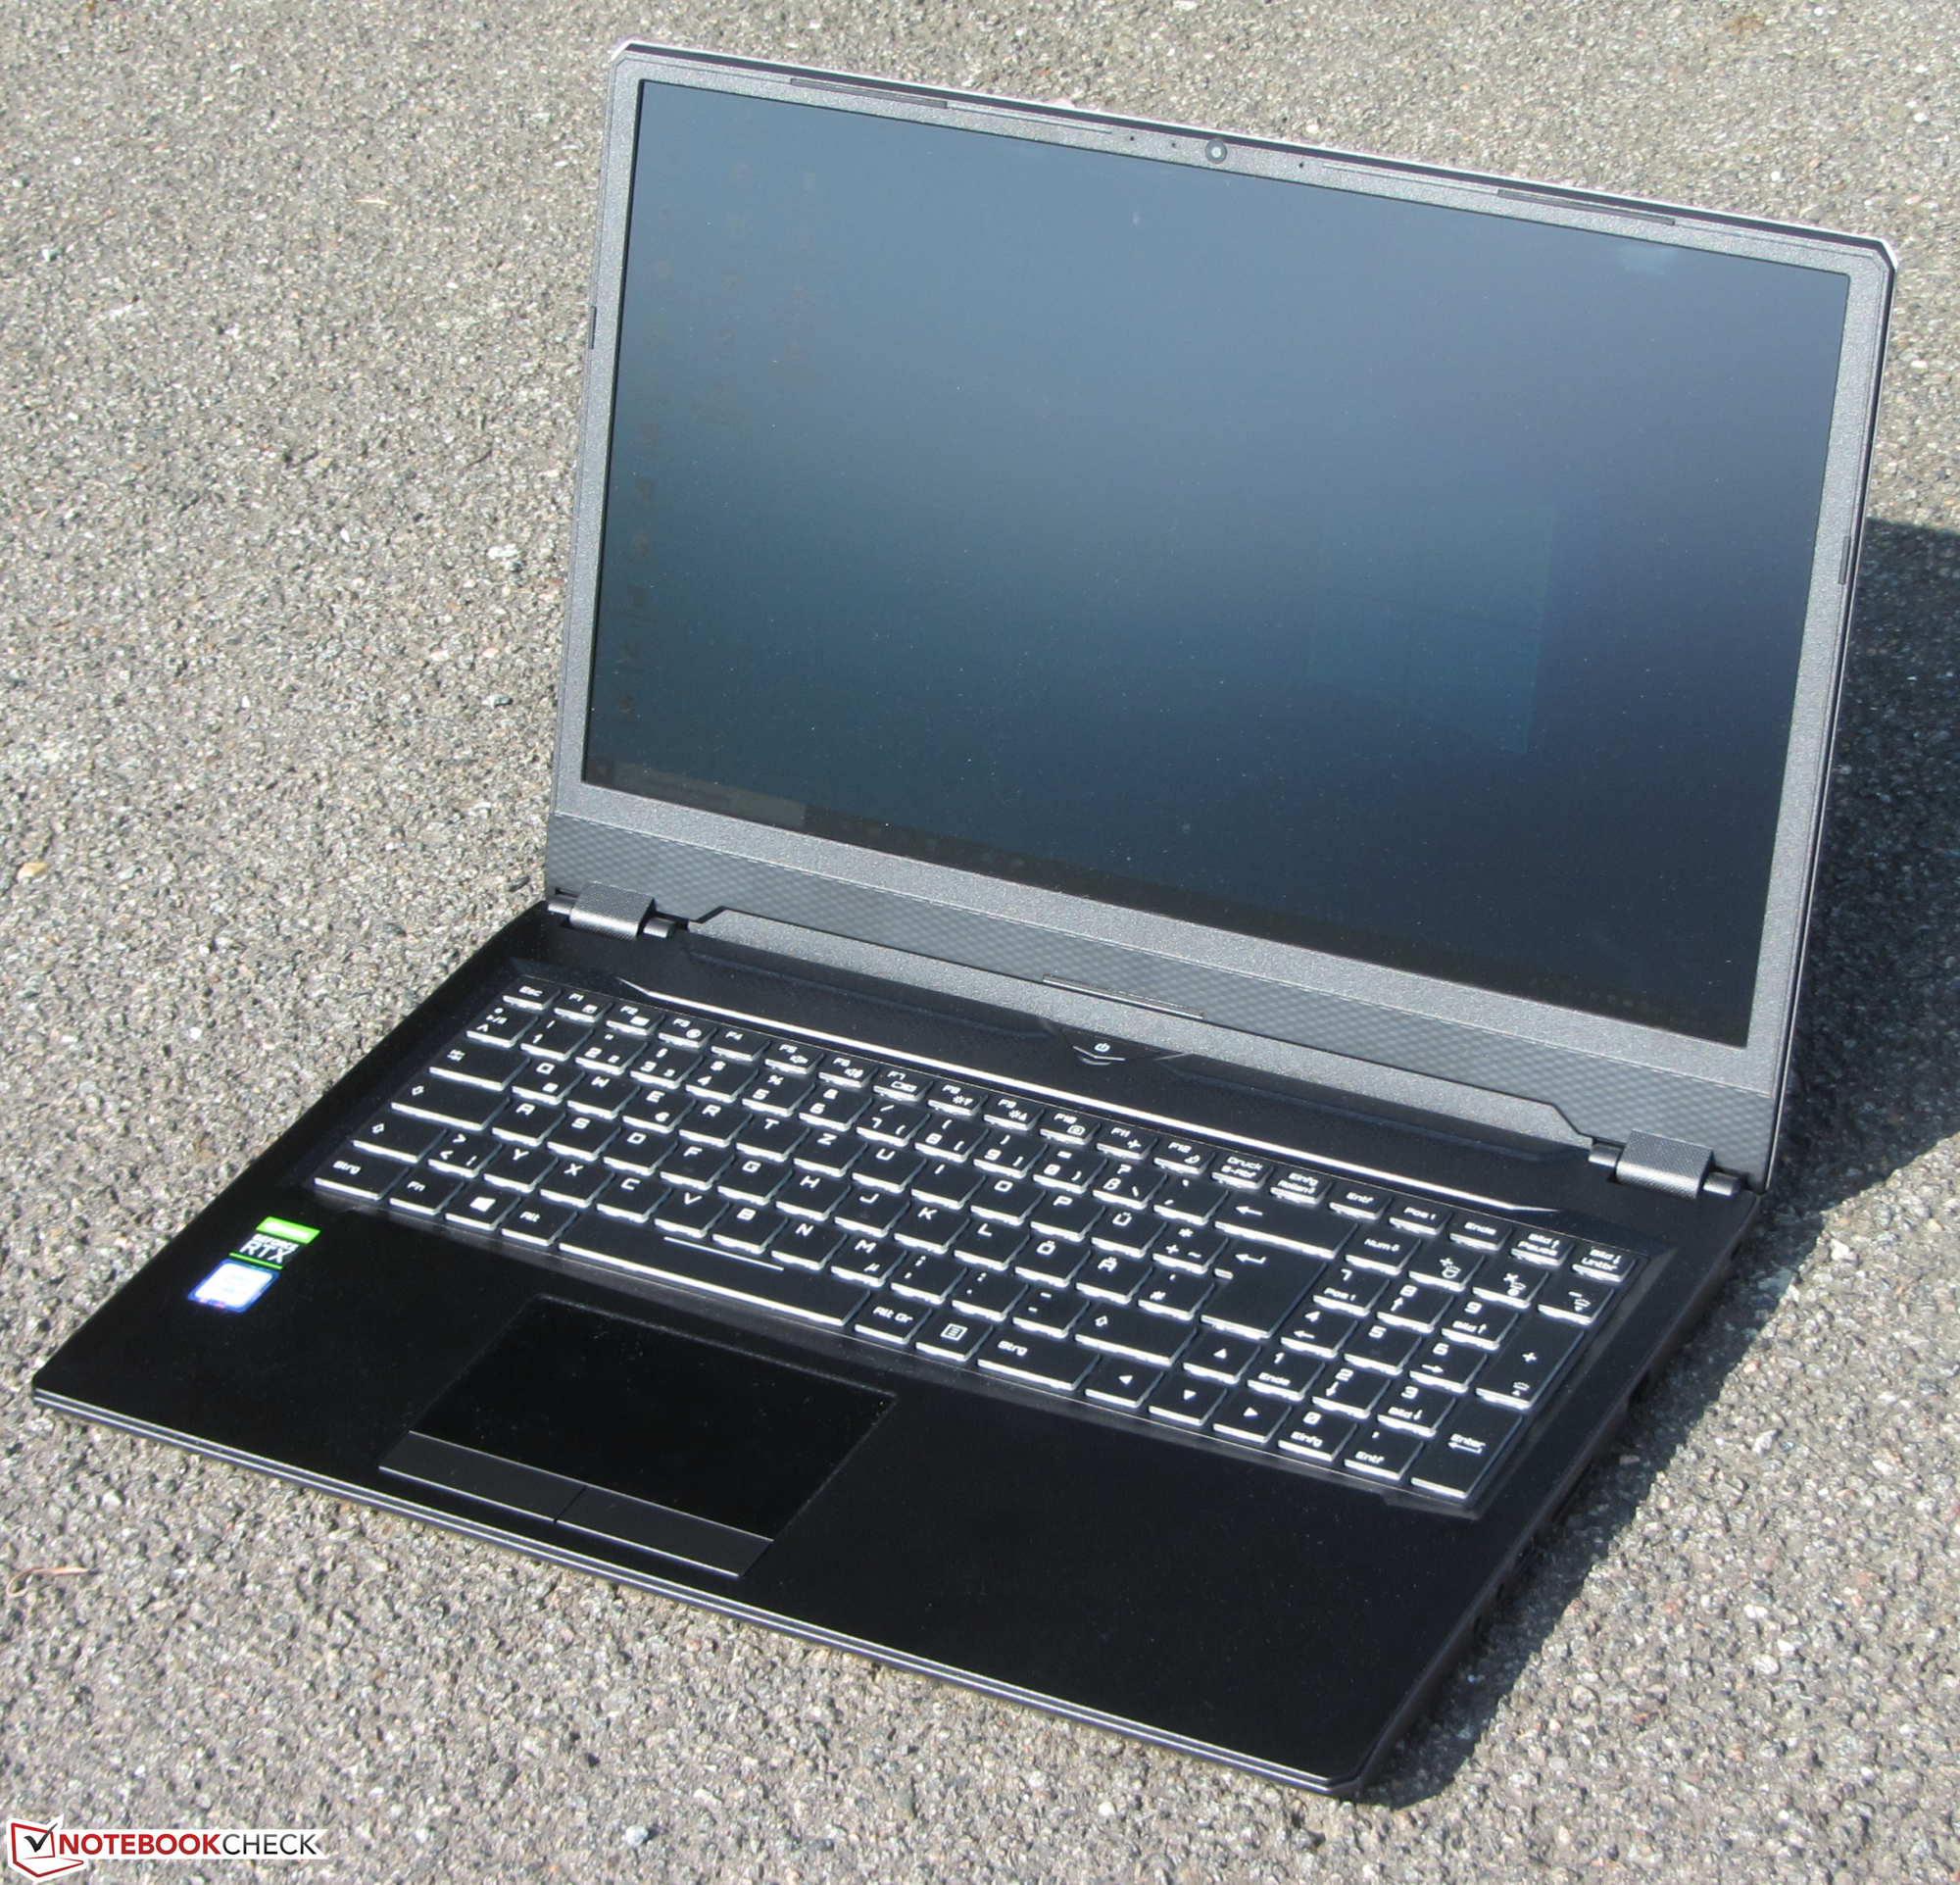
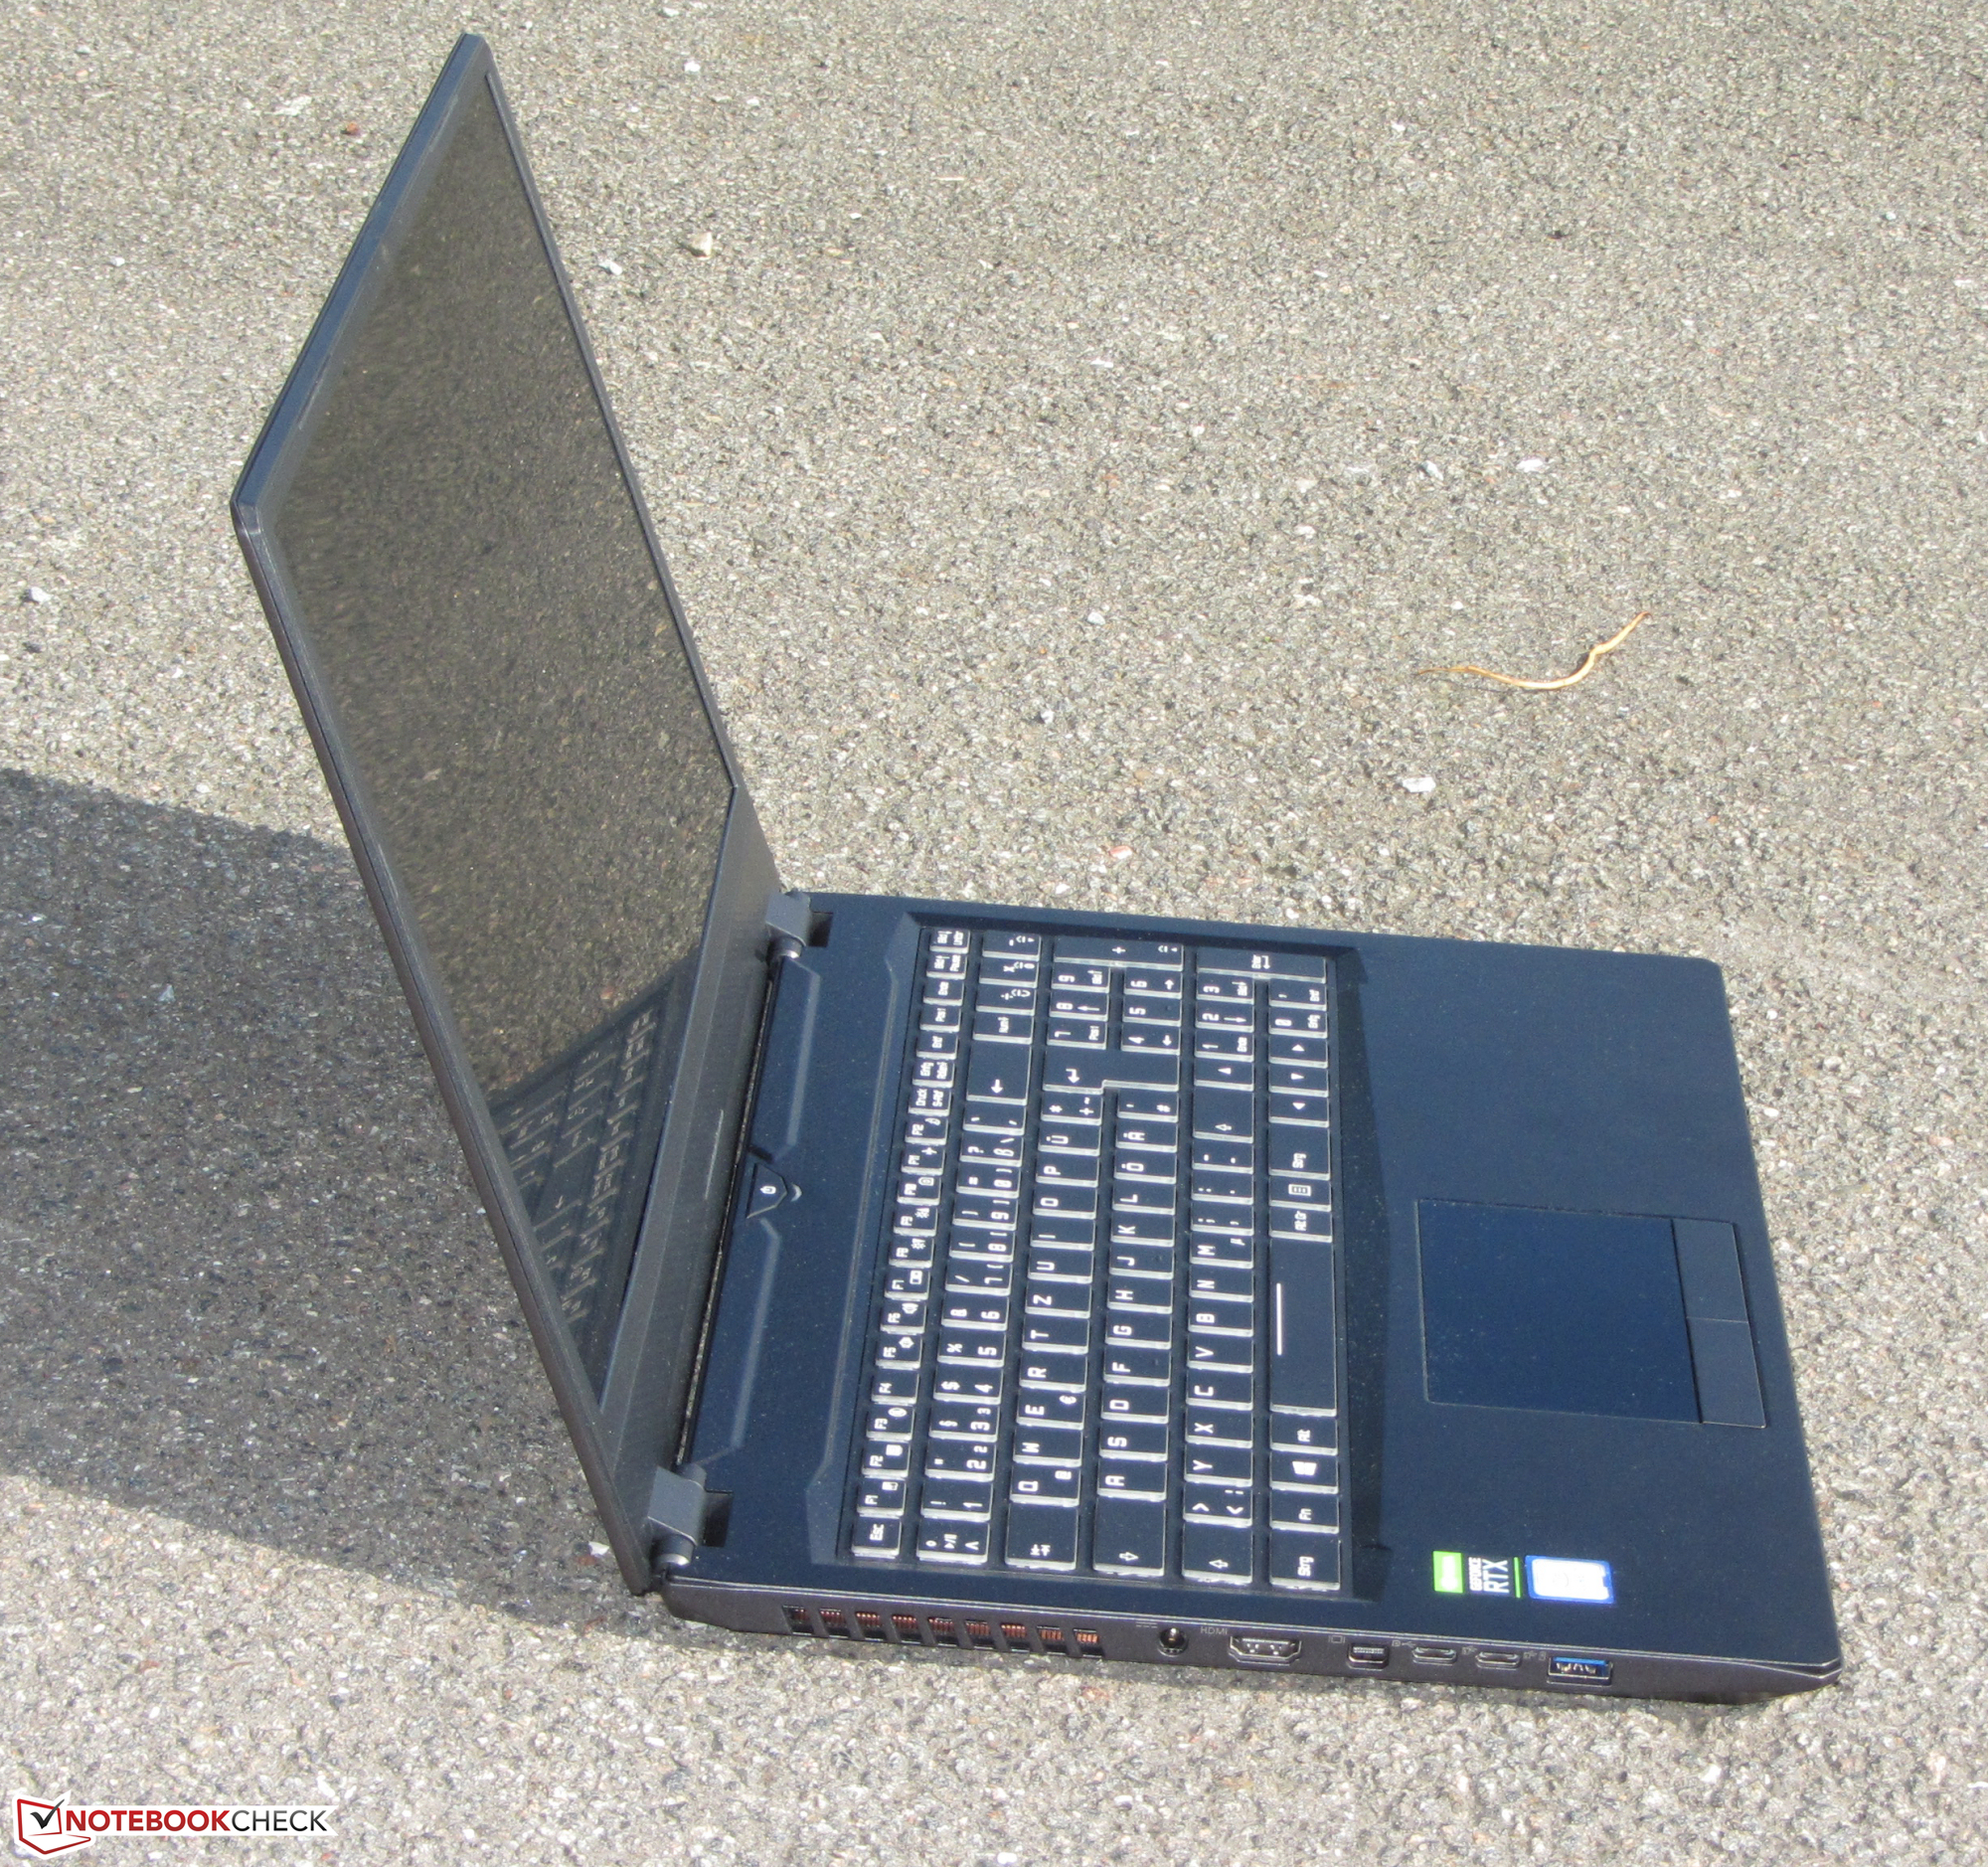
Schenker uses a 16.1-inch display in a case that has the approximate dimensions of a 15.6-inch device. While the case is able to keep up with the 15.6-inch competitors in terms of height and width, it is slightly longer. With a weight of about 2200 grams (4.85 lb), the Key 16 is also at the same level as the competitors.
Connections - There is no Thunderbolt 3
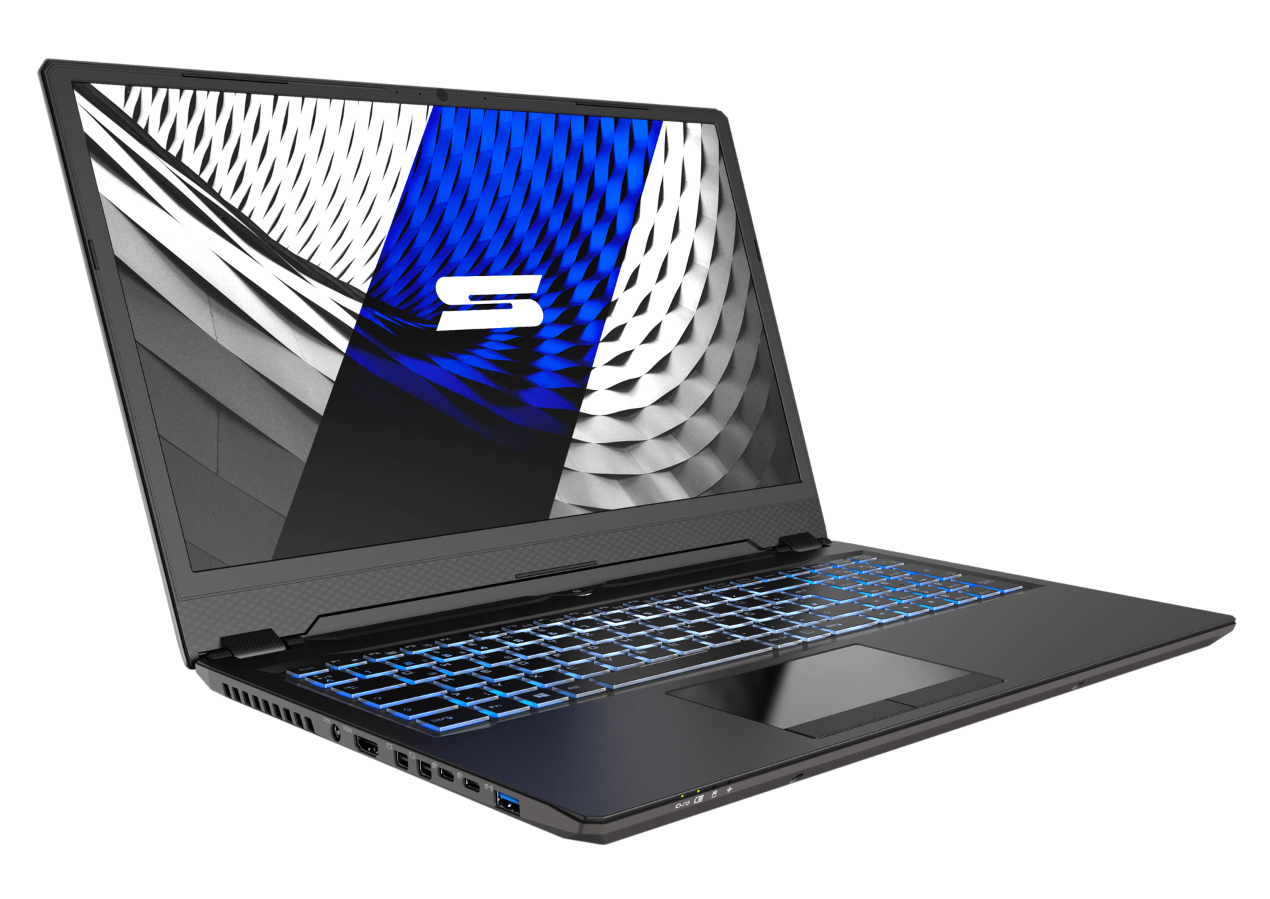
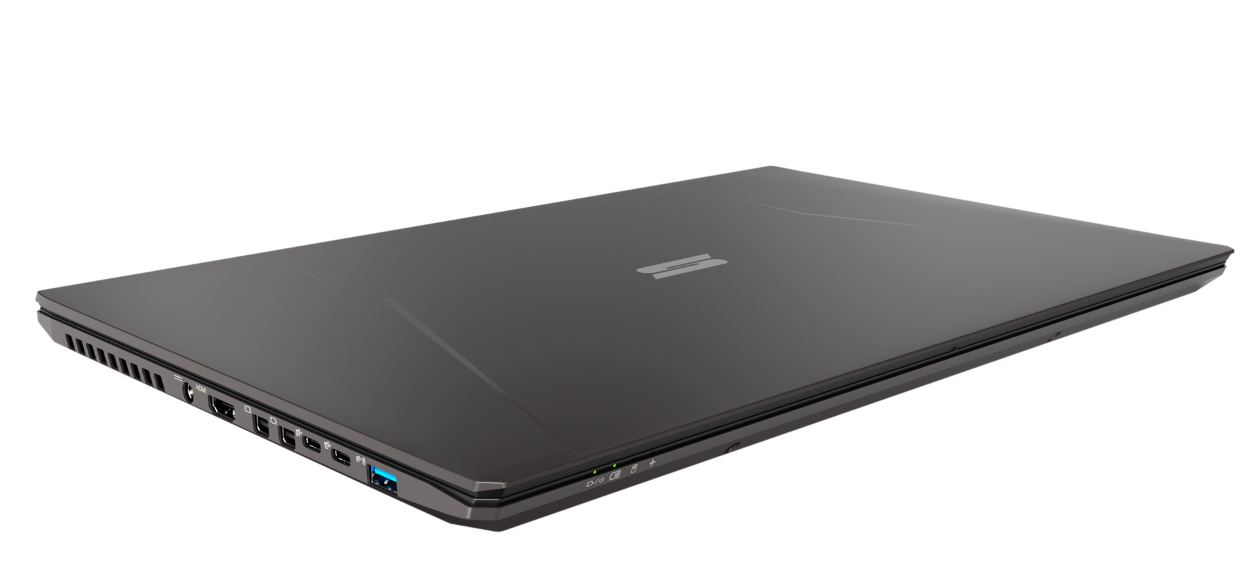
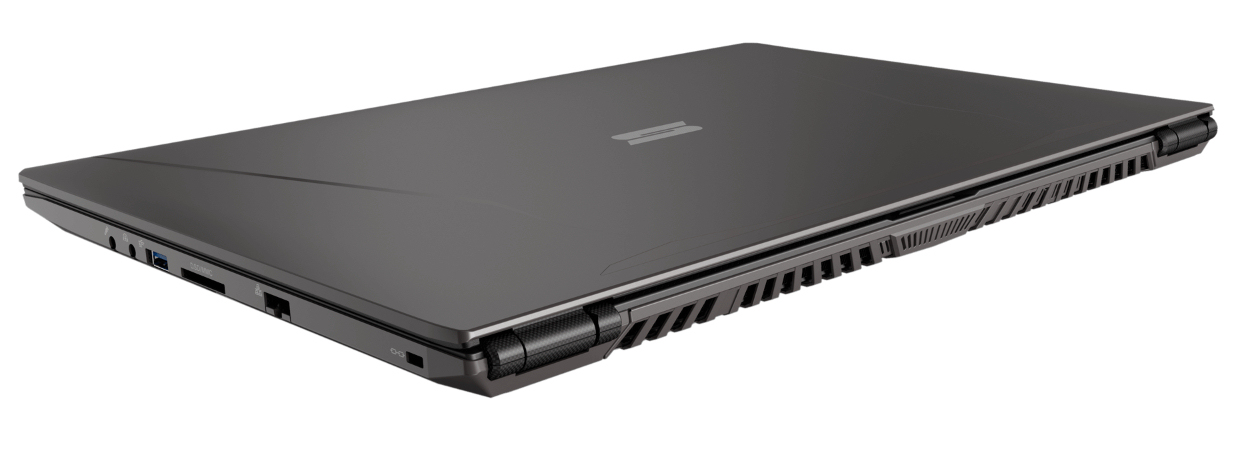
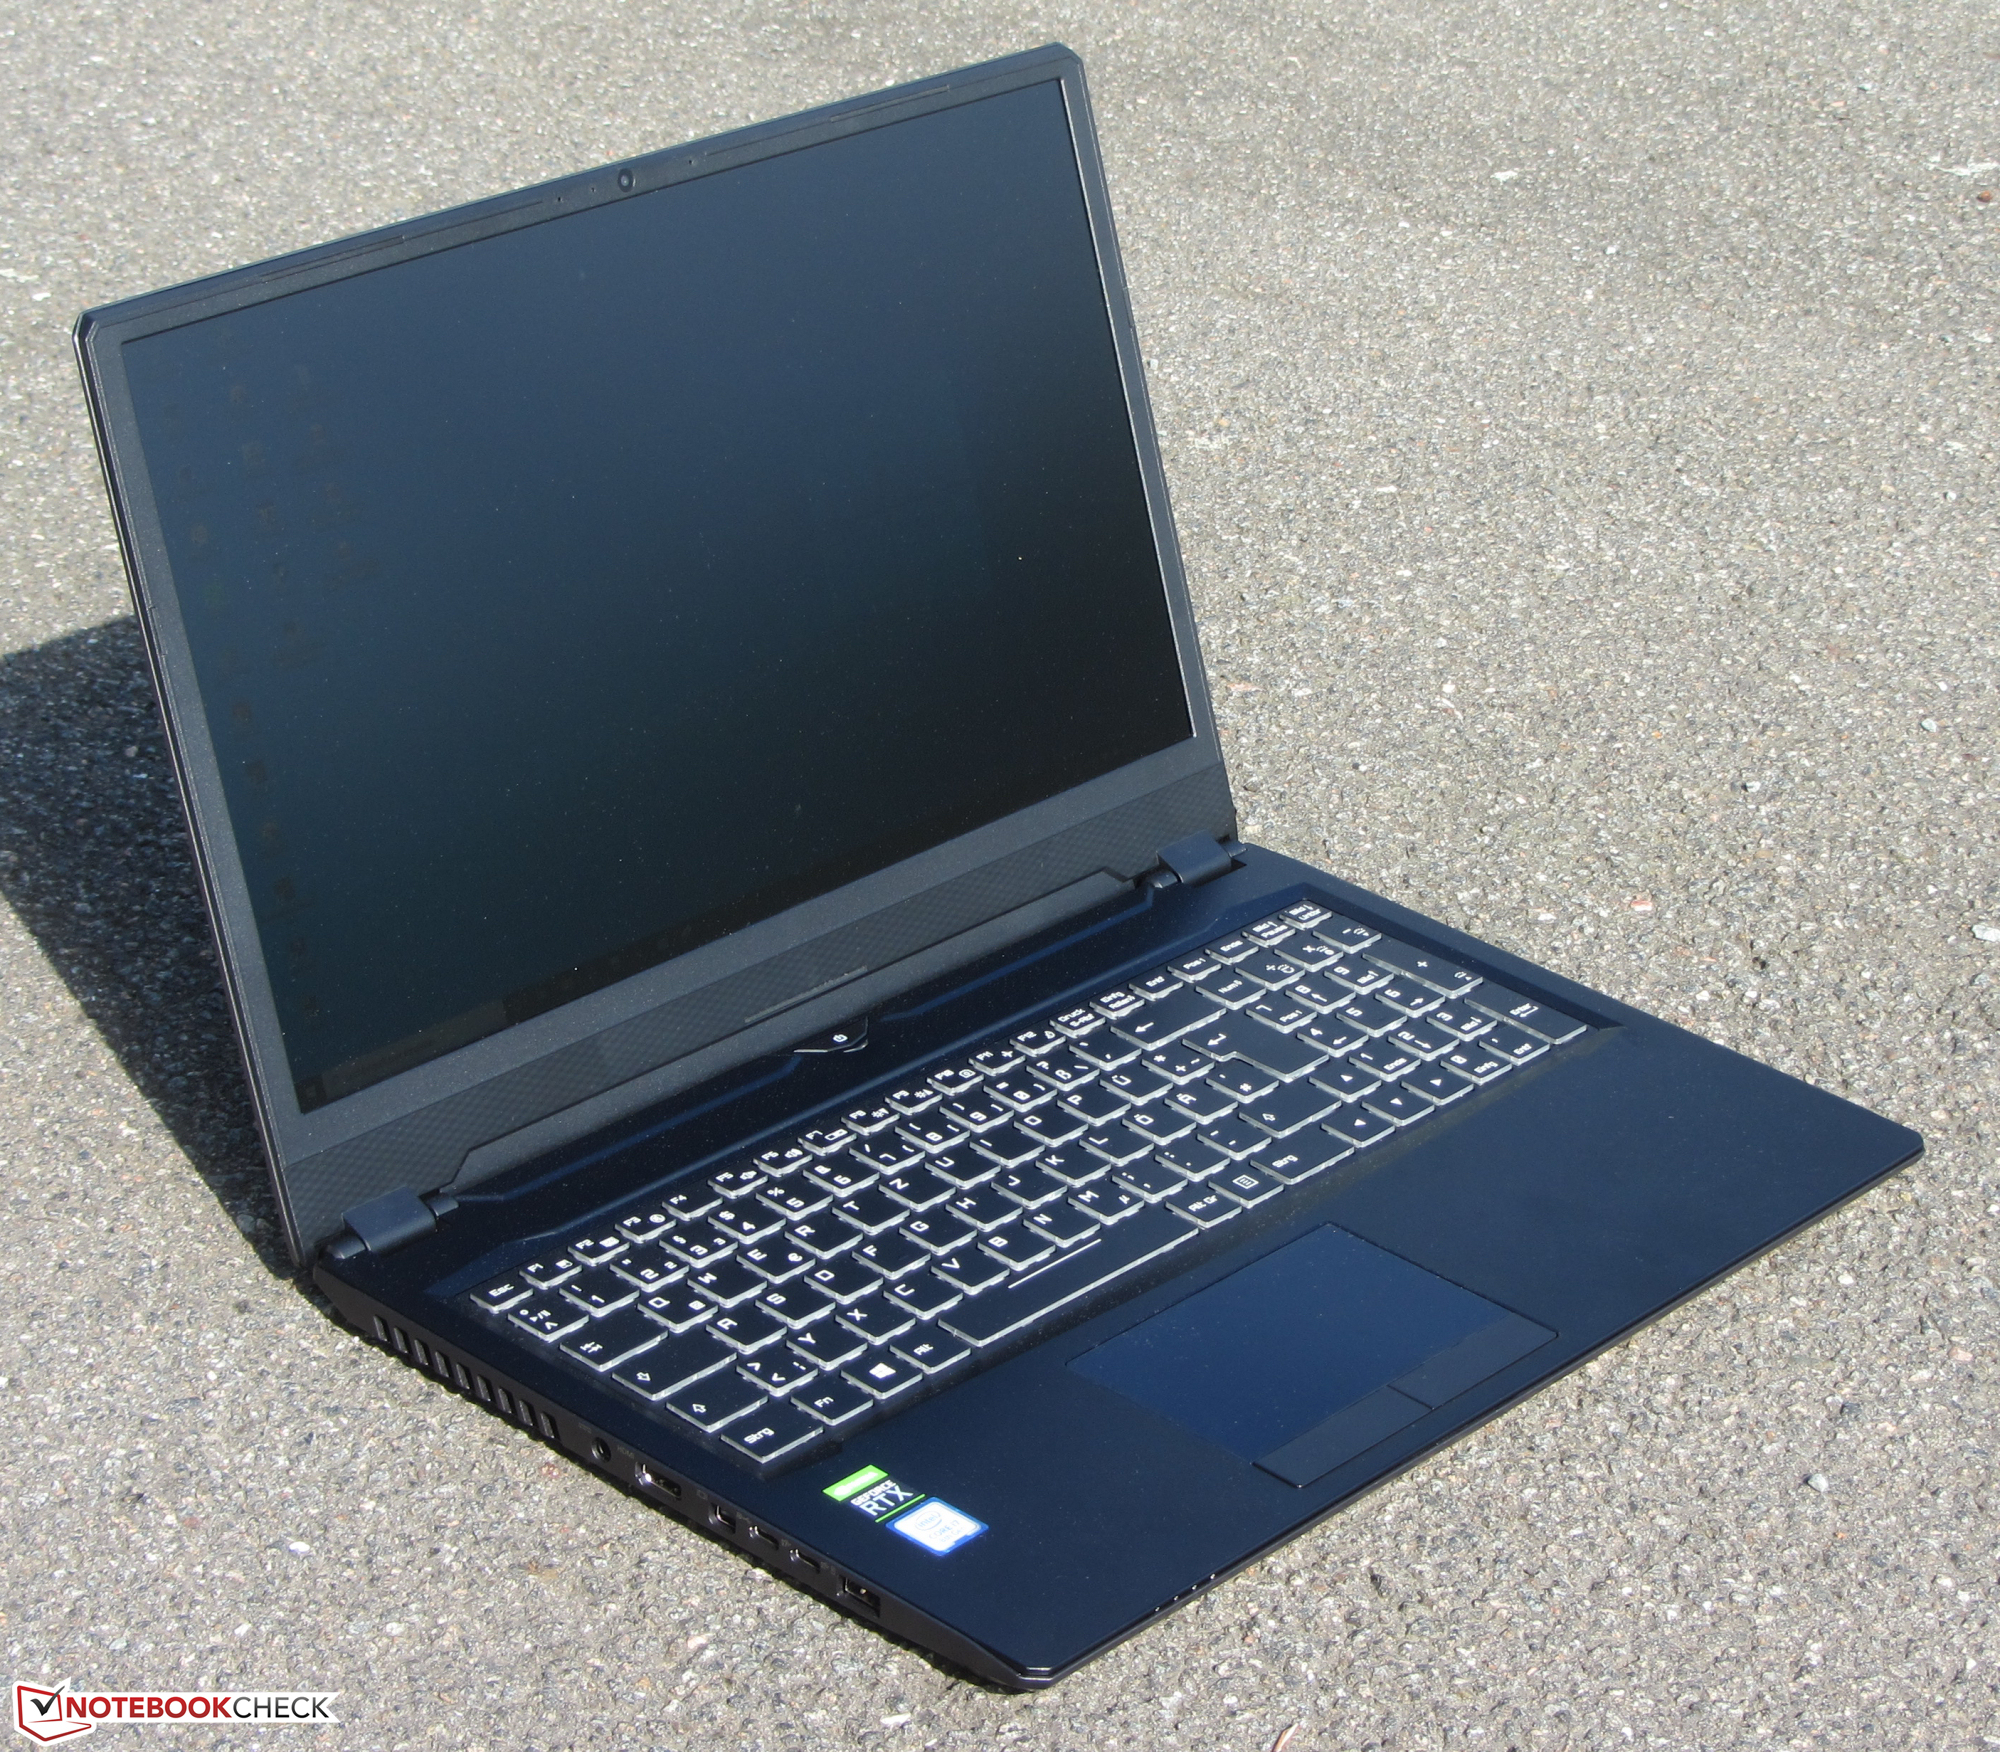
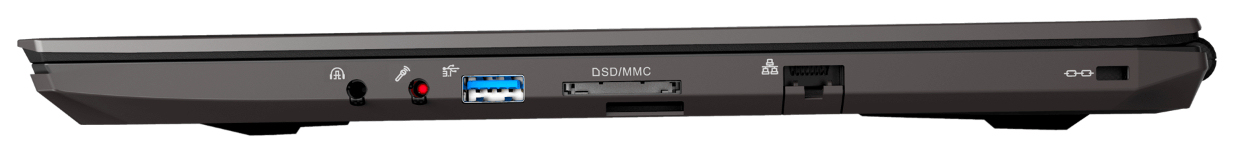
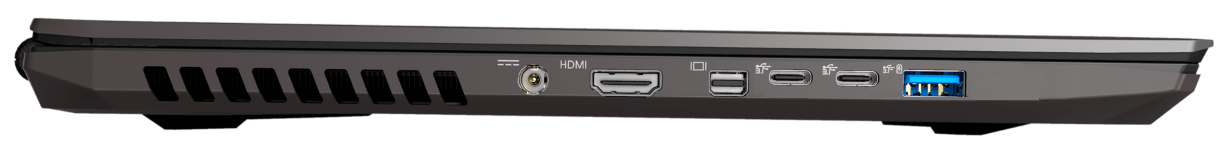
The Key 16 offers a selection of connections that is overall well-rounded. The two USB Type-A connections support the USB 3.2 Gen-1 standard, and the two USB Type-C connections support the USB 3.2 Gen-2 standard. We would have preferred if there had been at least one Type-C port that could also handle Thunderbolt 3. One of the two Type-C ports supports DisplayPort via USB-C (an adapter needs to be purchased separately). With this, together with the HDMI-2.0 port and the Mini-DisplayPort 1.4 (offering G-Sync support), the 16.1-incher offers a total of three video ports. Those are accompanied by a headphone port, a 2-in-1 audio port (microphone in + S/PDIF optical), and an opening for a cable lock.
Below the storage card reader is an additional slot, which is meant for a SIM card. However, the Key 16 includes neither a SIM card reader, nor an LTE modem on board.
The ports are in the front areas of the left and right side, so some cables might get in the way when using a mouse.
Note that in addition to our own photos, in this review we also use some image material offered by Schenker. However, some of this was slightly misleading, since the images showed two Mini-DisplayPorts on the left side of the device, even though there is only a single port. In addition, the symbols of the audio ports were switched. We therefore did some processing of the images of the side views, so that they now correspond to our test unit.
SD Card Reader
SD cards can be inserted completely into the storage card reader of the Key 16, which also locks them in place. The model used here runs blazing fast. While copying larger data blocks, a maximum transfer rate of 210 MB/s is reached. The transfer of 250 JPG files (about 5 MB each) is completed with a speed of 188 MB/s. We test storage card readers using a reference card (Toshiba Exceria Pro SDXC 64 GB UHS-II).
| SD Card Reader | |
| average JPG Copy Test (av. of 3 runs) | |
| Gigabyte Aero 15-X9 (Toshiba Exceria Pro SDXC 64 GB UHS-II) | |
| Schenker Key 16 (Toshiba Exceria Pro SDXC 64 GB UHS-II) | |
| Schenker Key 15 Coffee Lake (Toshiba Exceria Pro SDXC 64 GB UHS-II) | |
| Average of class Gaming (20.9 - 210, n=54, last 2 years) | |
| HP Omen 15-dc1303ng (Toshiba Exceria Pro SDXC 64 GB UHS-II) | |
| maximum AS SSD Seq Read Test (1GB) | |
| Gigabyte Aero 15-X9 (Toshiba Exceria Pro SDXC 64 GB UHS-II) | |
| Schenker Key 16 (Toshiba Exceria Pro SDXC 64 GB UHS-II) | |
| Schenker Key 15 Coffee Lake (Toshiba Exceria Pro SDXC 64 GB UHS-II) | |
| Average of class Gaming (25.5 - 261, n=51, last 2 years) | |
| HP Omen 15-dc1303ng (Toshiba Exceria Pro SDXC 64 GB UHS-II) | |
Communication
Our test unit includes a WLAN module that has an Intel chip (Wireless-AC 9560). In addition to the 802.11 a/b/g/n WLAN standards, the fast ac standard is also supported. The module also supports Bluetooth-5 functionality. The transfer rates we measure under optimal conditions (no other WLAN devices in close proximity, small distance between notebook and server PC) turn out good. A Gigabit Ethernet controller from Realtek's well-known RTL8168/8111 family handles wired network connections, completing its tasks without any problems.
Accessories
As typical for Schenker, the notebook also includes some accessories. The box includes a recovery DVD, a driver DVD, a cleaning cloth, various screws (to fasten a 2.5-inch storage drive), and a printed user manual. In addition, there is also a license key for the Bullguard Internet Security software. The license is valid for 12 months and can be used on up to three devices.
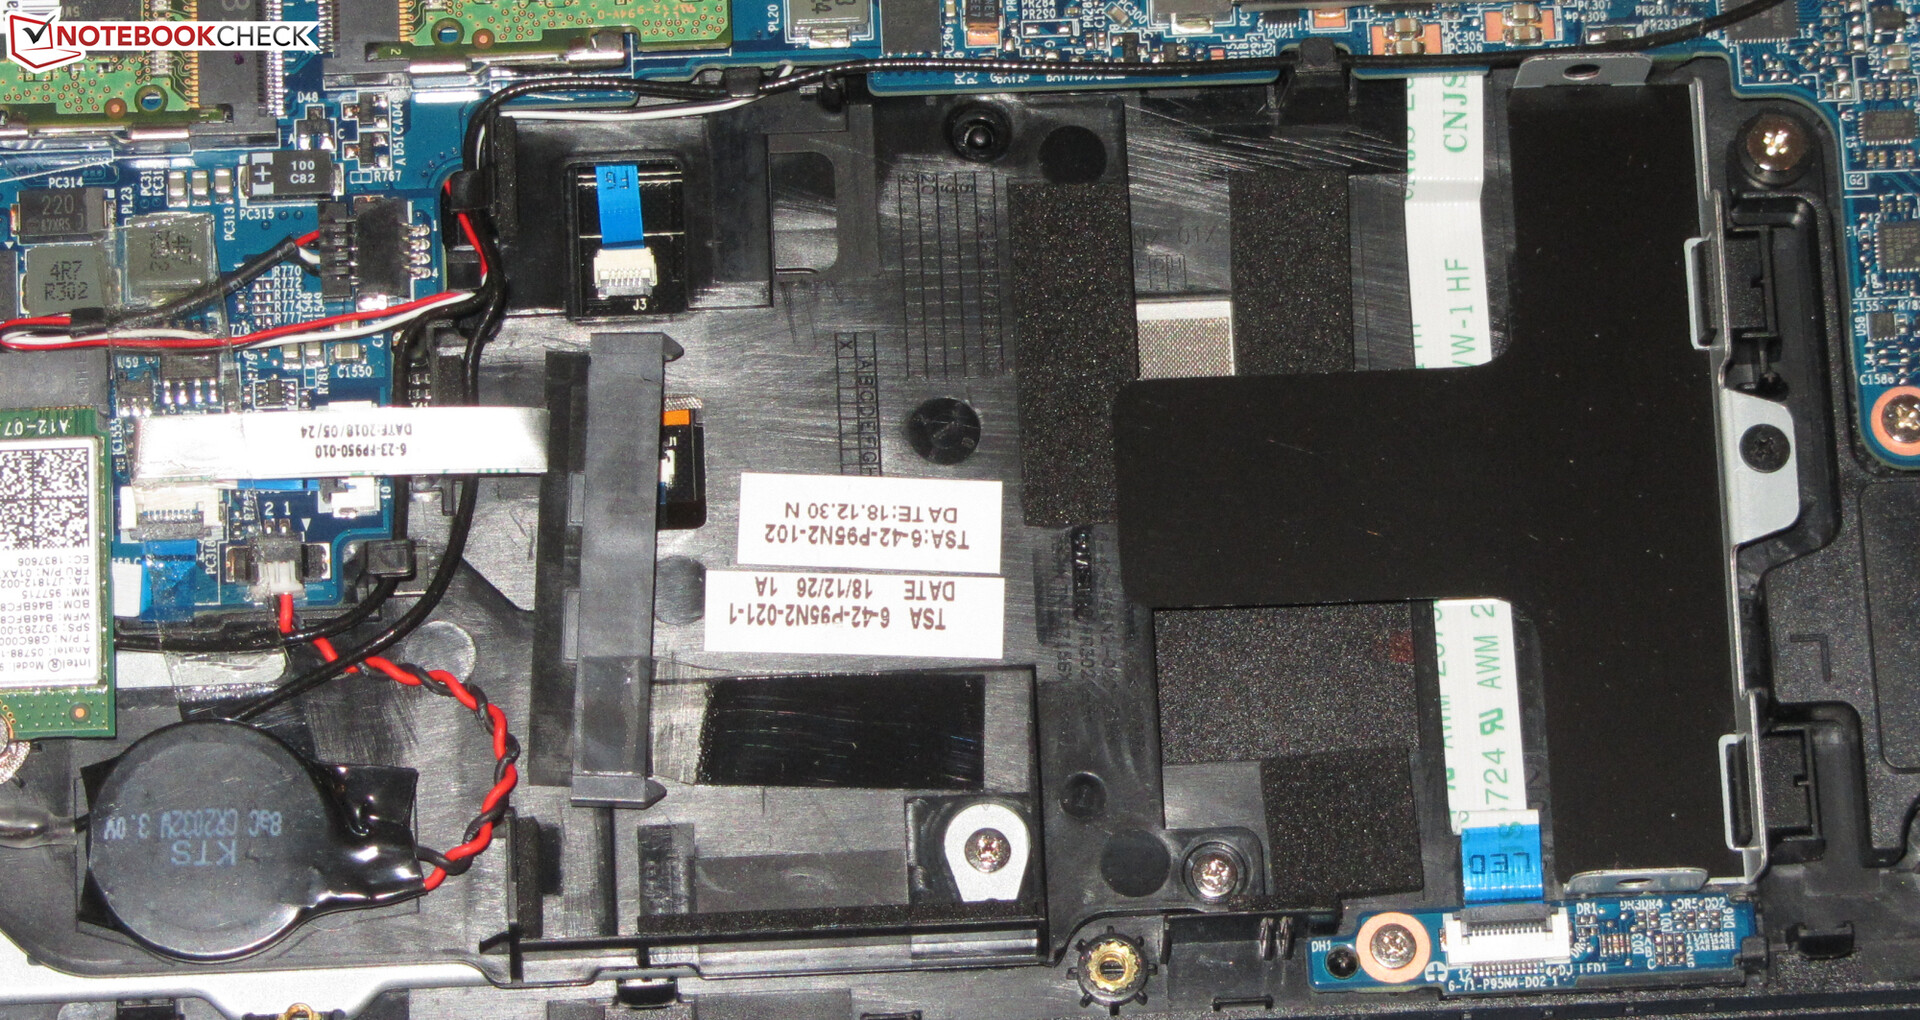
Maintenance
The Key 16 does not have a maintenance flap. To get access to the hardware, you need to open the case. To do this, you first need to remove the keyboard. After removing the two screws that hold the keyboard in place, it can be carefully pushed out from the bottom. Next, you need to remove the three flat cables that connect the keyboard with the main board. You can then see five screws below the keyboard, which also have to be removed. After that, you remove all the screws from the bottom of the case. And finally, you can then remove the bottom of the case with a thin spatula or prying tool.
Warranty
The basic warranty covers two years, including pick-up service and six months of quick-repair (within 48 hours) service. A 36-months warranty will cost about 100 to 150 Euros (~$111-166), depending on the quick-repair time period.
Input Devices - The glass touchpad invites sliding
Keyboard
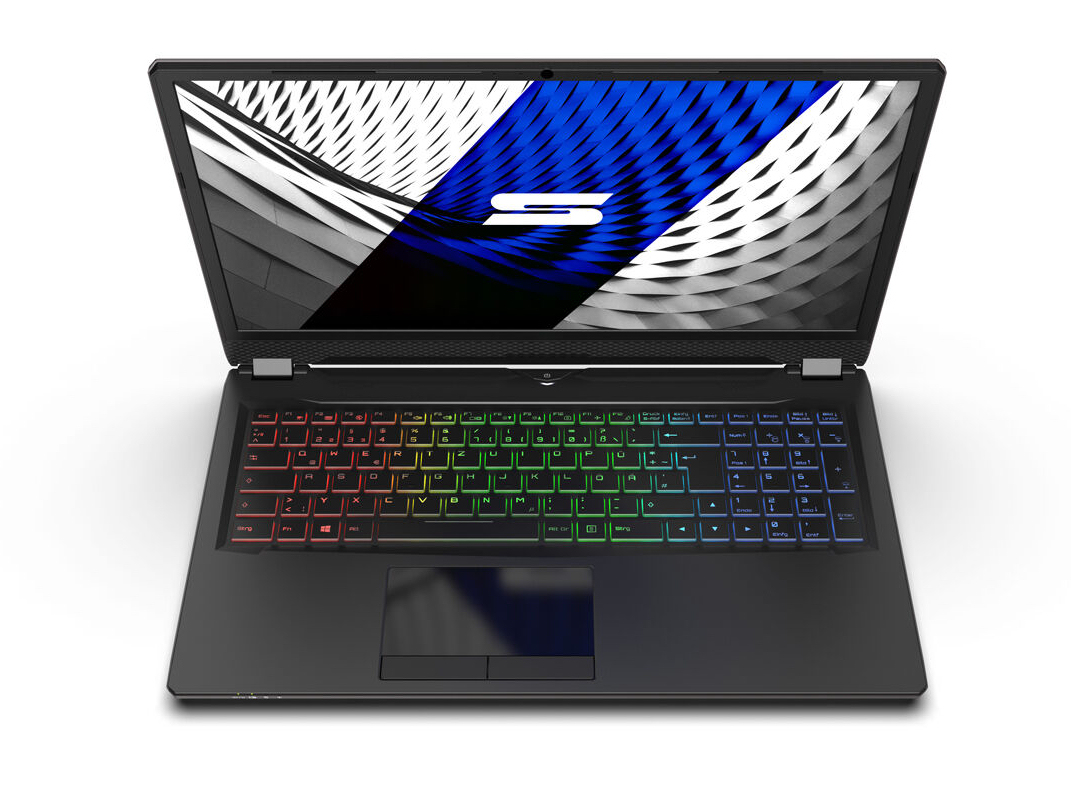
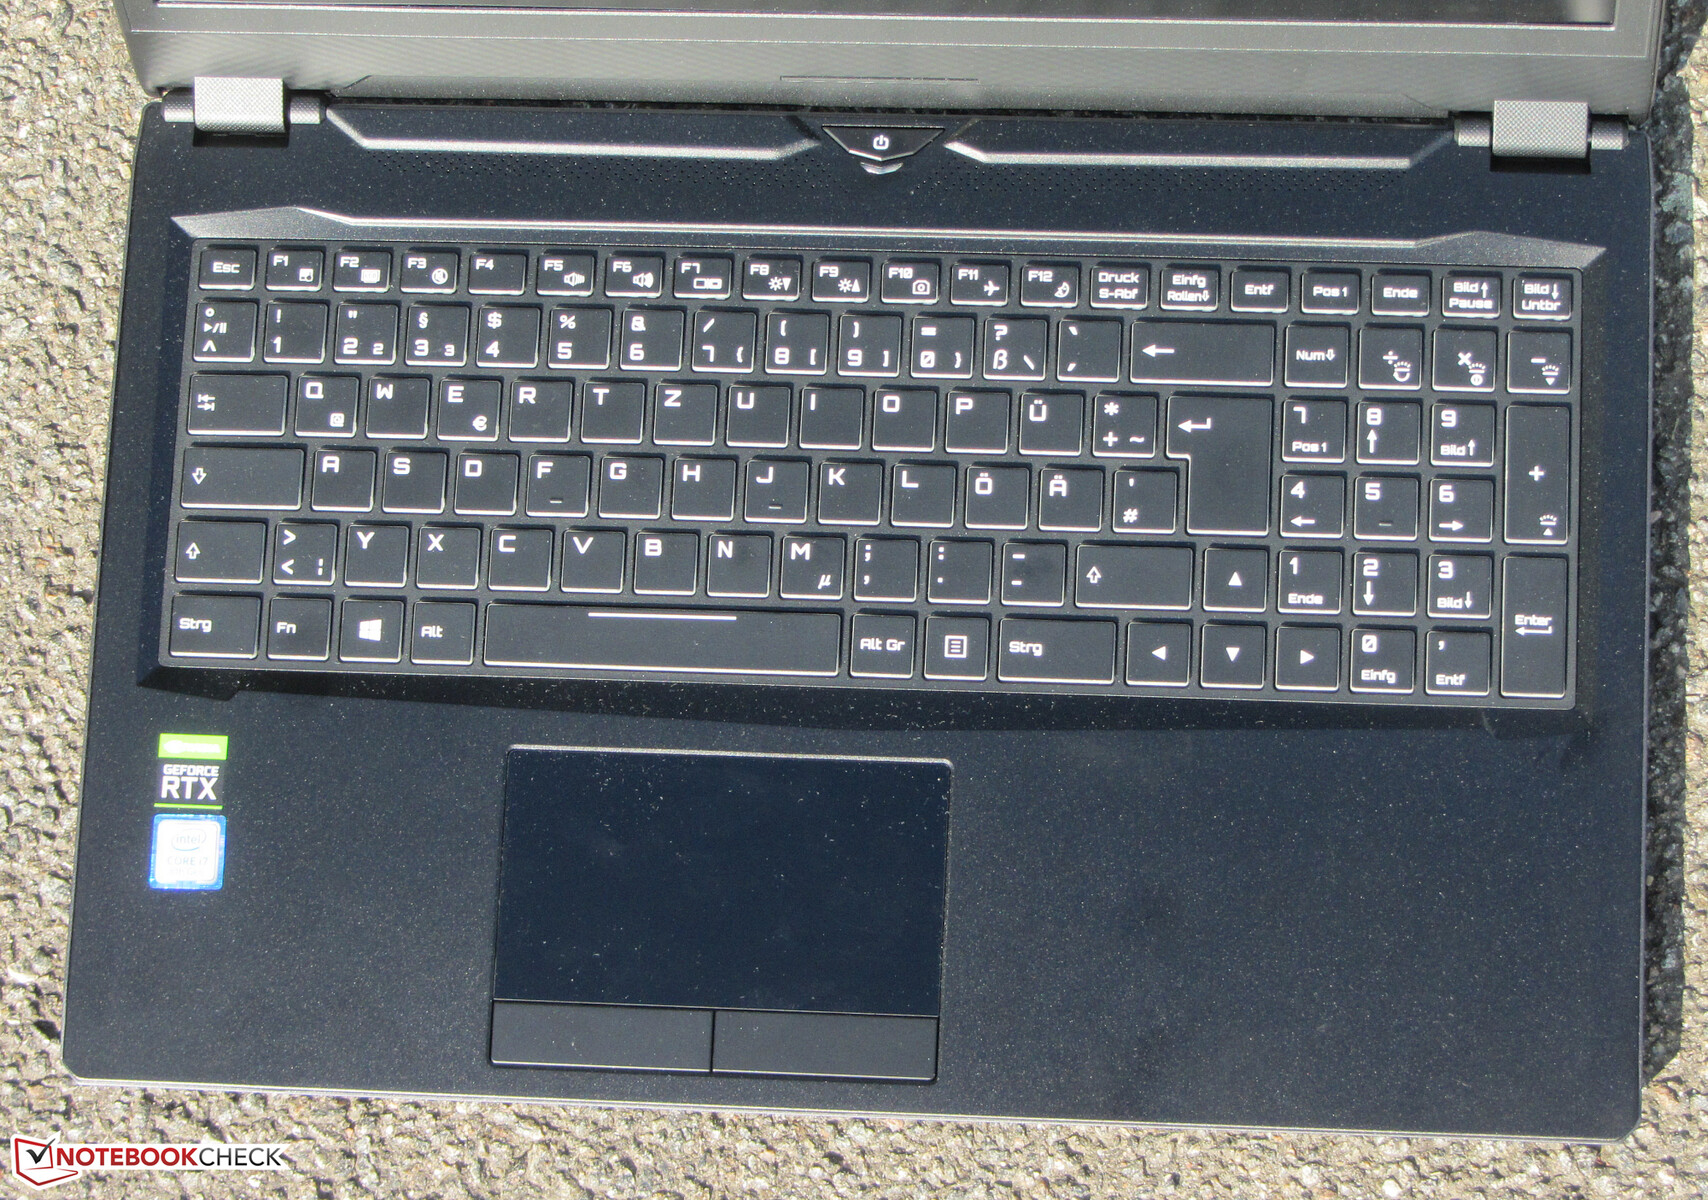
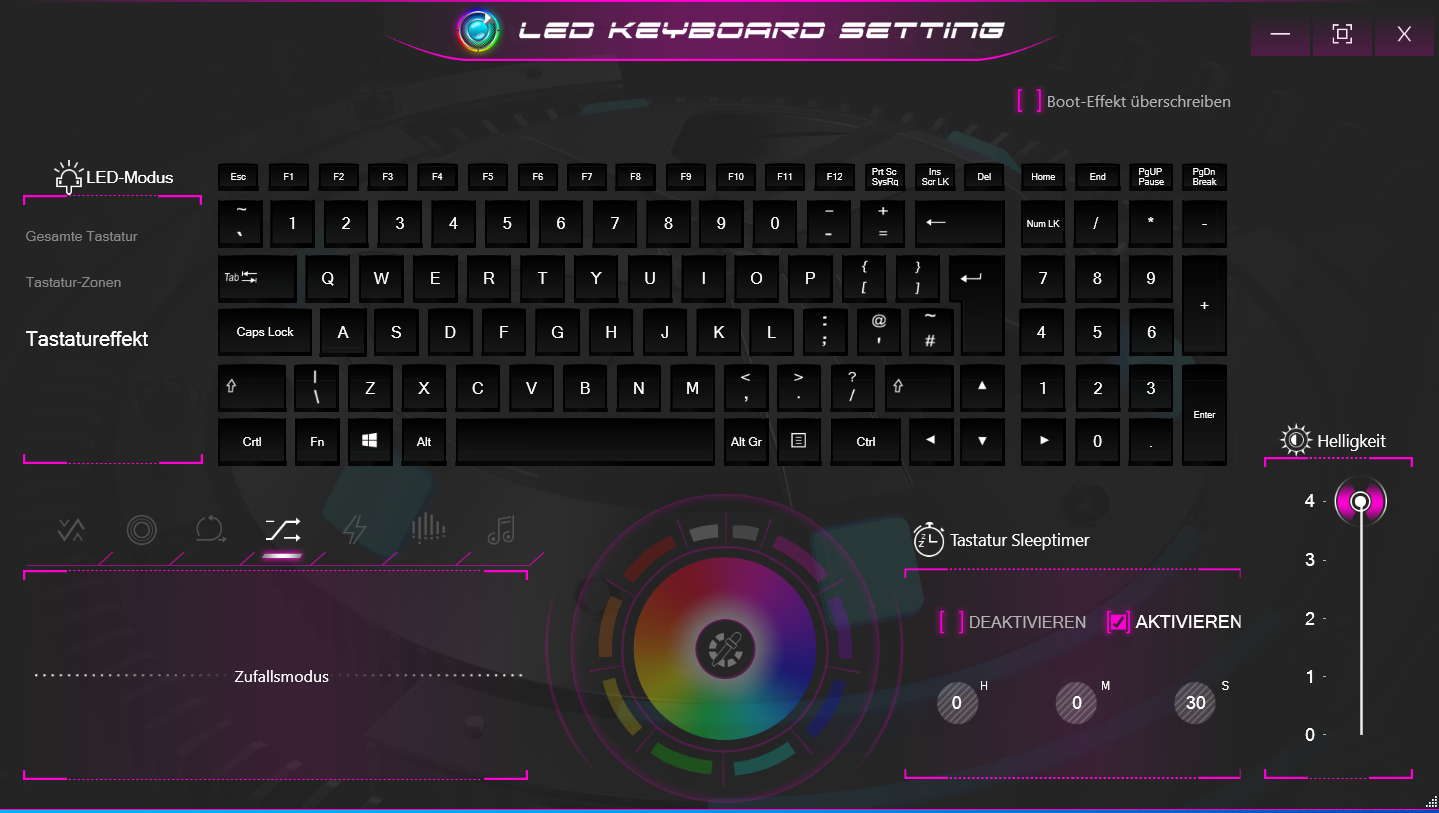
The Key 16 has an illuminated chiclet keyboard, including a number block. The main keys have a size of 15 x 15 mm (~0.6 x 0.6 in) and can be easily distinguished from one another (~3 mm/~0.12 inch gap between the keys). The built-in keys offer a medium stroke overall and a clear pressure point. The resistance of the keys pleasing. While typing, the keyboard has a minimal give, but this did not turn out to interfere with our typing. The RGB illumination offers four brightness levels in total. Four function keys control the illumination. Overall, Schenker succeeds in delivering a keyboard suitable for everyday tasks.
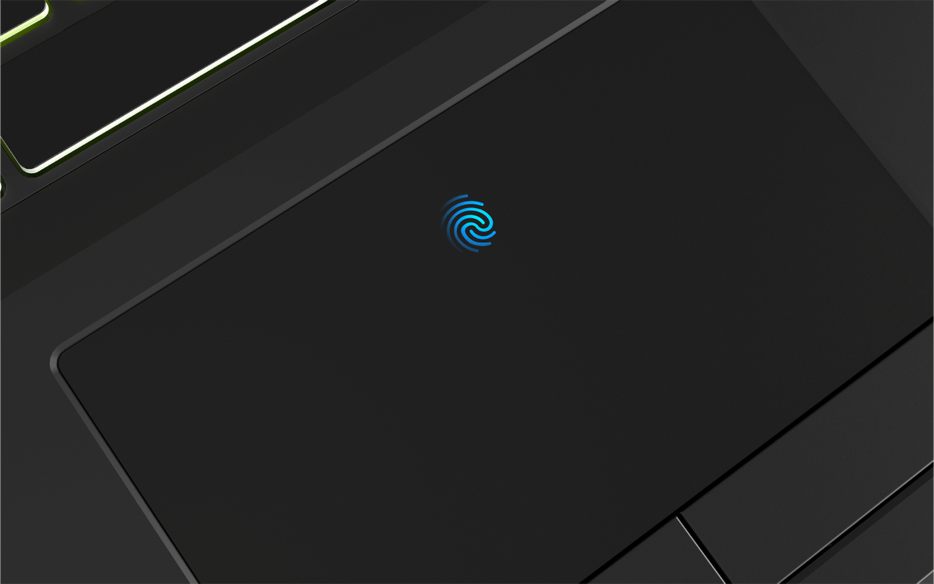
Touchpad
The multi-touch capable touchpad has a footprint of about 10.7 x 6.1 cm (~4.2 x 2.4 in). This offers sufficient space for using gesture controls. The smooth glass surfaces make sliding of the fingers very easy. The pad responds accurately to inputs, including in the corners. There are two separate mouse keys below the pad, which offer a medium stroke and clear pressure point.
Display - 144-Hz IPS
With its 16.1-inch screen, the Schenker Key 16 offers a new display size that we will see more often in the future. The model used here has a matte surface and a native resolution of 1920x1080 pixels. While the display offers a good contrast (1138:1), the brightness turns out a little low (271 cd/m²). We consider values above 300 cd/m² as good. Within our comparison field, the display of the Alienware m15 P79F with its brightness of 452 cd/m² is clearly able to leave the competitors behind.
The built-in 144-Hz panel shows good response times overall. However, it is also bested by the display of the Alienware m15 in this regard, which is equipped with an OLED panel.
Unfortunately, at brightness levels of 20% and below, the display of the Key 16 shows flickering at a frequency of 25,510 Hz. But since this is a very high frequency, even sensitive people should not be afflicted with headaches or eye problems.
| |||||||||||||||||||||||||
Brightness Distribution: 88 %
Center on Battery: 296 cd/m²
Contrast: 1138:1 (Black: 0.26 cd/m²)
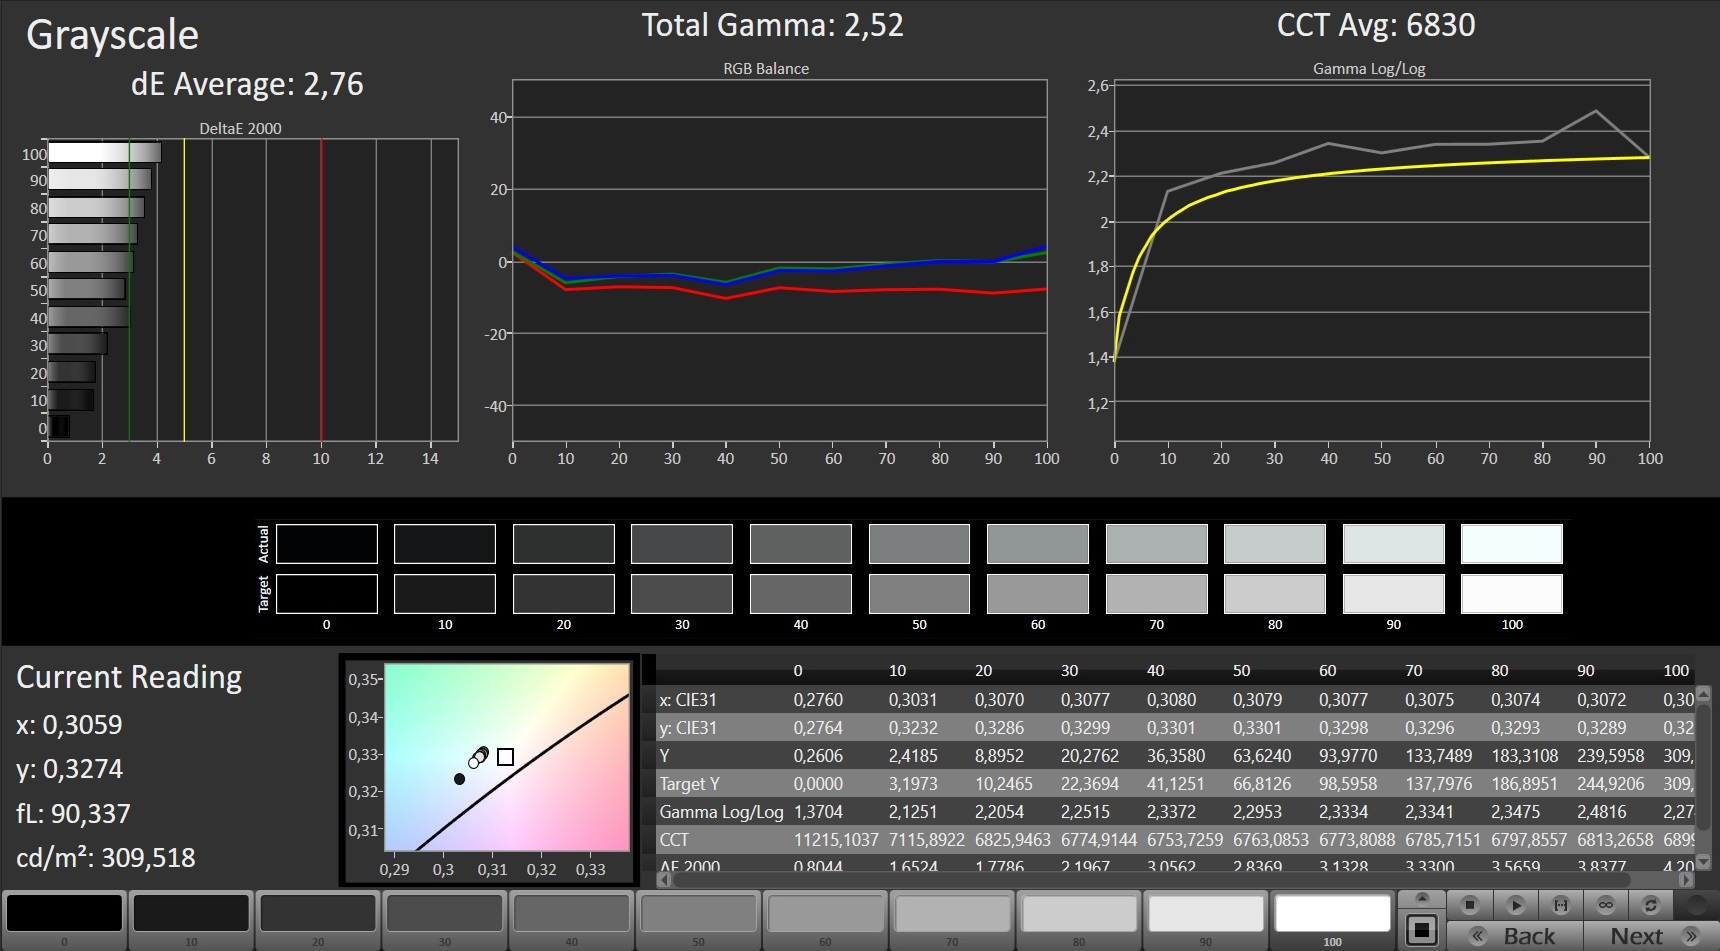
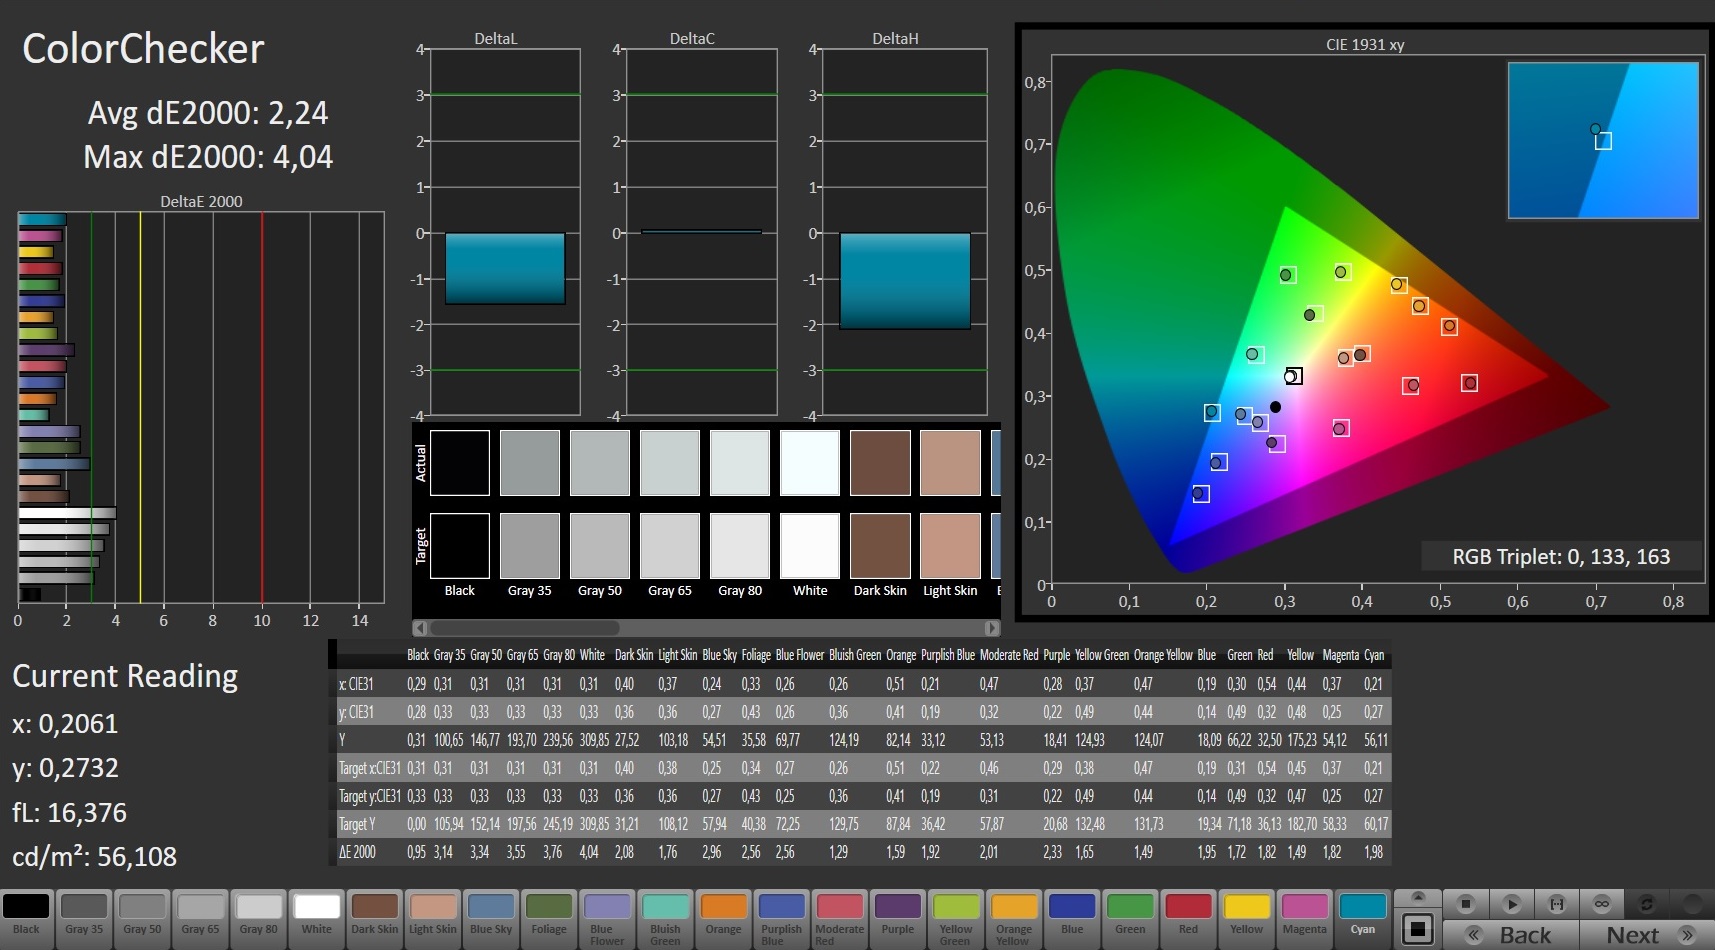
ΔE ColorChecker Calman: 2.24 | ∀{0.5-29.43 Ø4.71}
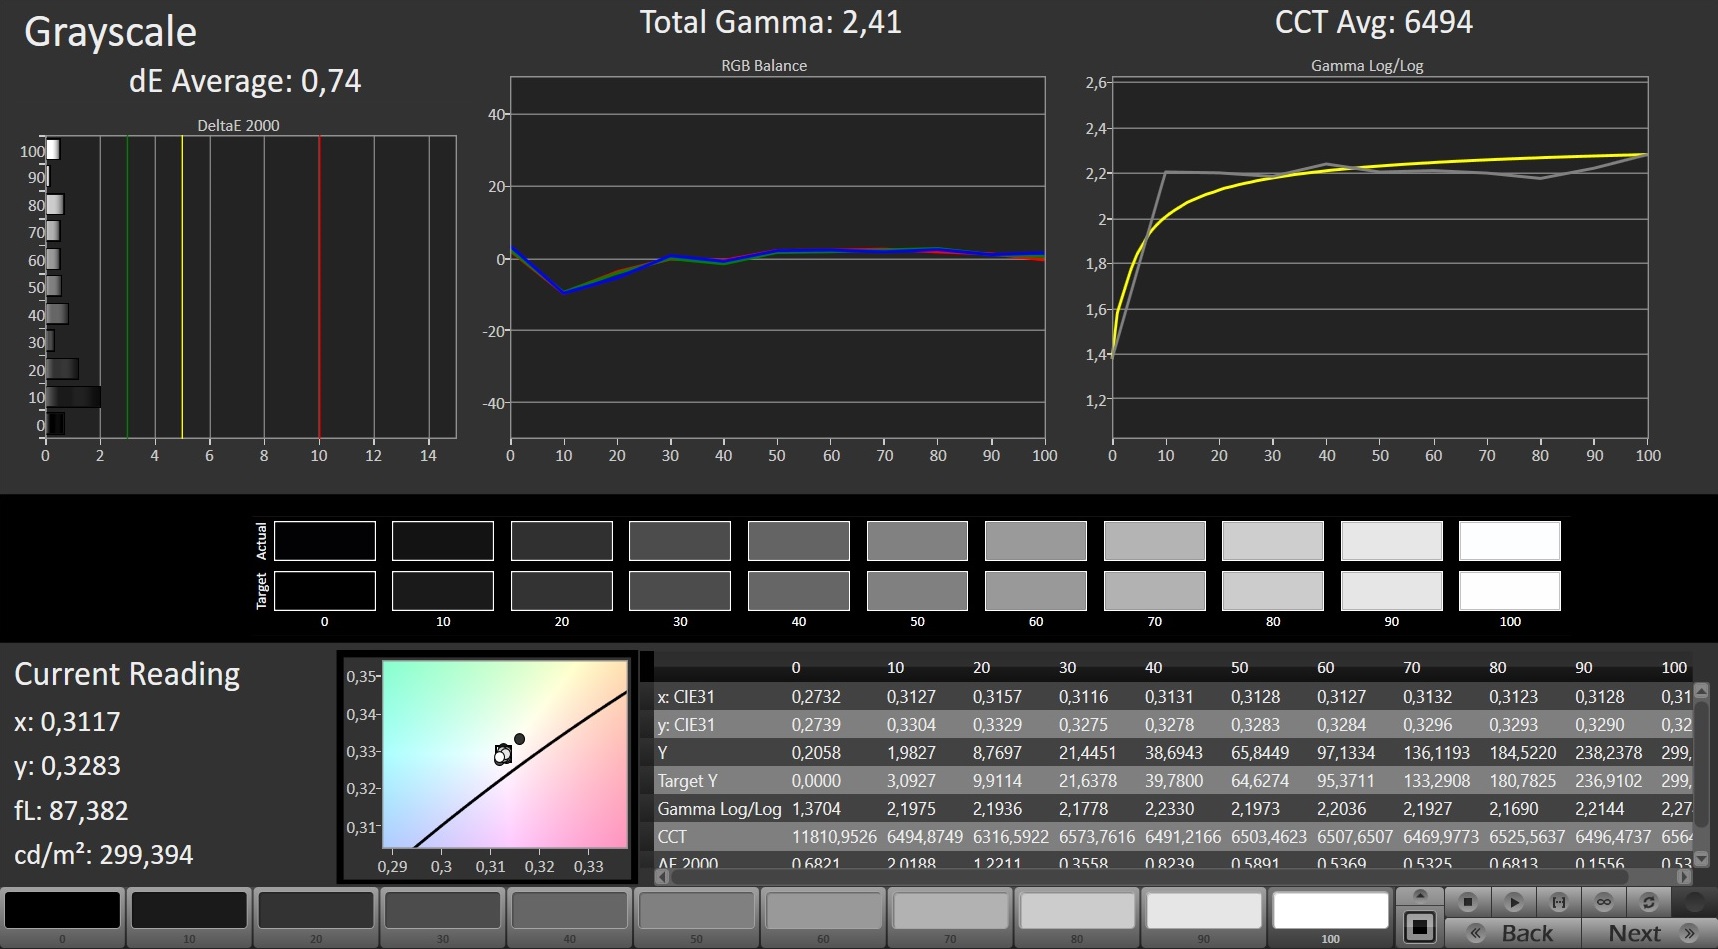
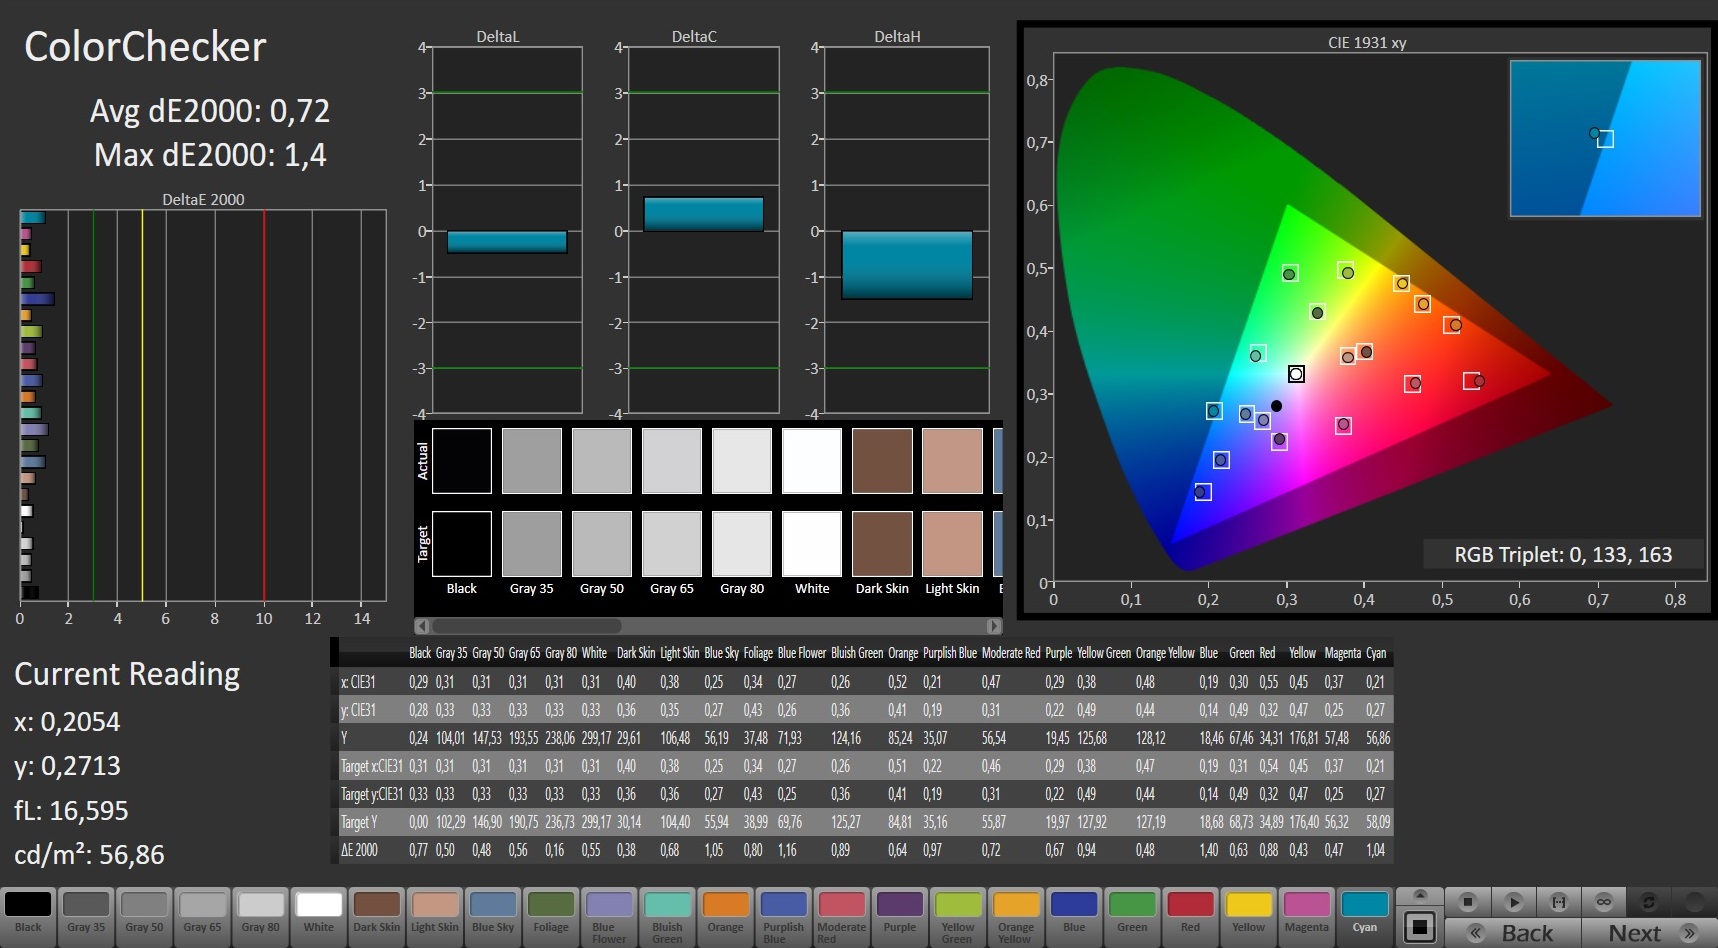
calibrated: 0.72
ΔE Greyscale Calman: 2.76 | ∀{0.09-98 Ø4.96}
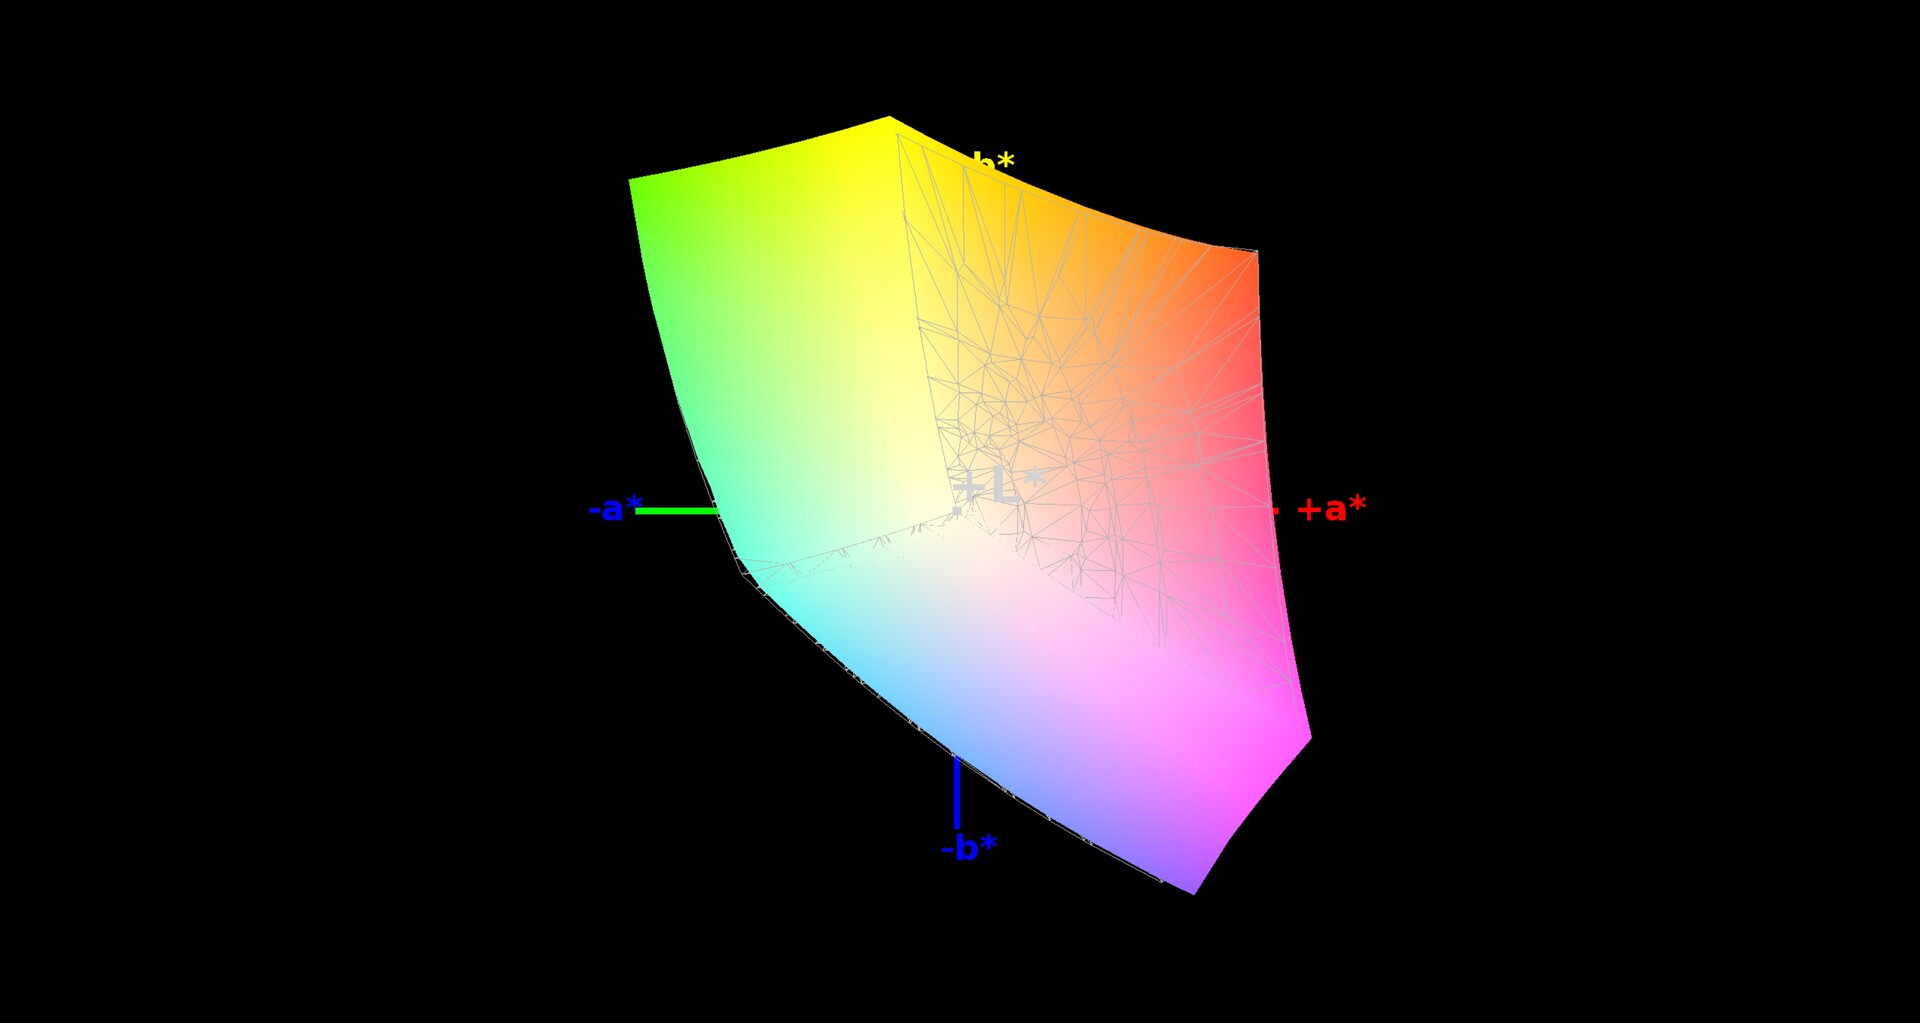
99% sRGB (Argyll 1.6.3 3D)
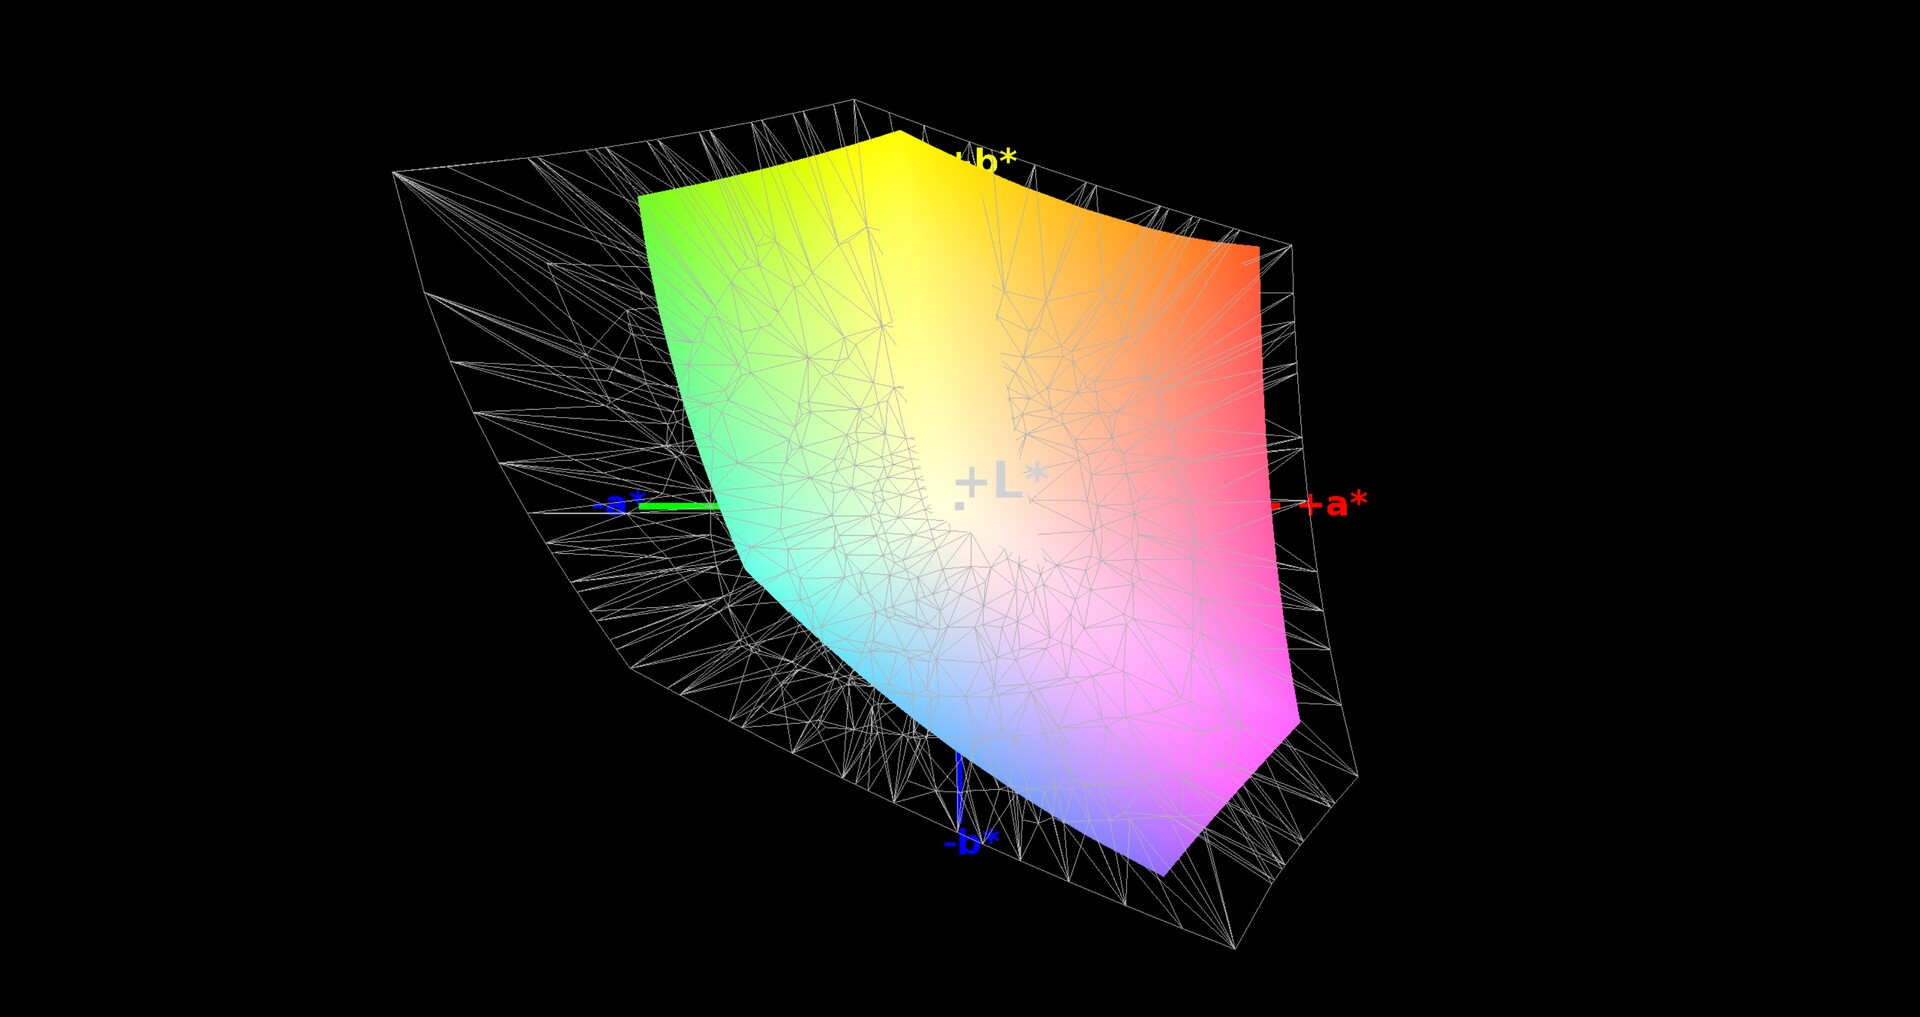
60% AdobeRGB 1998 (Argyll 1.6.3 3D)
65.9% AdobeRGB 1998 (Argyll 3D)
94.9% sRGB (Argyll 3D)
63.8% Display P3 (Argyll 3D)
Gamma: 2.52
CCT: 6830 K
| Schenker Key 16 Chi Mei N161HCA-GA1 (CMN1602), IPS, 1920x1080, 16.1" | MSI GS65 Stealth 9SG Sharp LQ156M1JW03 (SHP14C5), IPS, 1920x1080, 15.6" | Acer Predator Triton 500 AU Optronics B156HAN08.2 (AUO82ED), IPS, 1920x1080, 15.6" | HP Omen 15-dc1303ng LG Philips LGD05C0, IPS, 1920x1080, 15.6" | Alienware m15 P79F Samsung SDCA029, 156WR04, OLED, 3840x2160, 15.6" | Razer Blade 15 RTX 2080 Max-Q Sharp LQ156M1JW03 (SHP14C5), IPS, 1920x1080, 15.6" | Gigabyte Aero 15-X9 LGD05C0, IPS, 1920x1080, 15.6" | |
|---|---|---|---|---|---|---|---|
| Display | 5% | -0% | -1% | 38% | 4% | -1% | |
| Display P3 Coverage (%) | 63.8 | 67.6 6% | 64.2 1% | 63.8 0% | 99.9 57% | 66.9 5% | 63.5 0% |
| sRGB Coverage (%) | 94.9 | 97.5 3% | 92.6 -2% | 93.4 -2% | 100 5% | 98.1 3% | 93.1 -2% |
| AdobeRGB 1998 Coverage (%) | 65.9 | 68.9 5% | 65.7 0% | 65 -1% | 100 52% | 68.5 4% | 64.5 -2% |
| Response Times | 5% | 24% | 8% | 82% | 15% | -11% | |
| Response Time Grey 50% / Grey 80% * (ms) | 18 ? | 13.6 ? 24% | 8 ? 56% | 14 ? 22% | 2.6 ? 86% | 12.8 ? 29% | 16.4 ? 9% |
| Response Time Black / White * (ms) | 10.4 ? | 12 ? -15% | 11.2 ? -8% | 11 ? -6% | 2.3 ? 78% | 10.4 ? -0% | 13.6 ? -31% |
| PWM Frequency (Hz) | 25510 ? | 23260 ? | 60.2 ? | 23810 ? | |||
| Screen | 3% | -44% | -23% | -29% | -3% | 5% | |
| Brightness middle (cd/m²) | 296 | 282.3 -5% | 304 3% | 316 7% | 452.1 53% | 293 -1% | 250 -16% |
| Brightness (cd/m²) | 271 | 269 -1% | 299 10% | 295 9% | 452 67% | 270 0% | 235 -13% |
| Brightness Distribution (%) | 88 | 90 2% | 89 1% | 84 -5% | 90 2% | 87 -1% | 85 -3% |
| Black Level * (cd/m²) | 0.26 | 0.32 -23% | 0.27 -4% | 0.42 -62% | 0.29 -12% | 0.29 -12% | |
| Contrast (:1) | 1138 | 882 -22% | 1126 -1% | 752 -34% | 1010 -11% | 862 -24% | |
| Colorchecker dE 2000 * | 2.24 | 1.17 48% | 4.66 -108% | 2.7 -21% | 6.34 -183% | 1.69 25% | 1.46 35% |
| Colorchecker dE 2000 max. * | 4.04 | 3.29 19% | 9.65 -139% | 5.65 -40% | 12.97 -221% | 3.37 17% | 2.47 39% |
| Colorchecker dE 2000 calibrated * | 0.72 | 1.06 -47% | 1.72 -139% | 1.58 -119% | 1.24 -72% | ||
| Greyscale dE 2000 * | 2.76 | 1.3 53% | 5.53 -100% | 2.35 15% | 2.8 -1% | 2.3 17% | 1.27 54% |
| Gamma | 2.52 87% | 2.2 100% | 2.5 88% | 2.41 91% | 2.21 100% | 2.3 96% | 2.4 92% |
| CCT | 6830 95% | 6643 98% | 8028 81% | 6904 94% | 6114 106% | 6758 96% | 6749 96% |
| Color Space (Percent of AdobeRGB 1998) (%) | 60 | 63.8 6% | 60 0% | 60 0% | 91 52% | 63 5% | 60 0% |
| Color Space (Percent of sRGB) (%) | 99 | 97.5 -2% | 93 -6% | 93 -6% | 100 1% | 98.5 -1% | 93 -6% |
| Total Average (Program / Settings) | 4% /
3% | -7% /
-27% | -5% /
-15% | 30% /
4% | 5% /
0% | -2% /
2% |
* ... smaller is better
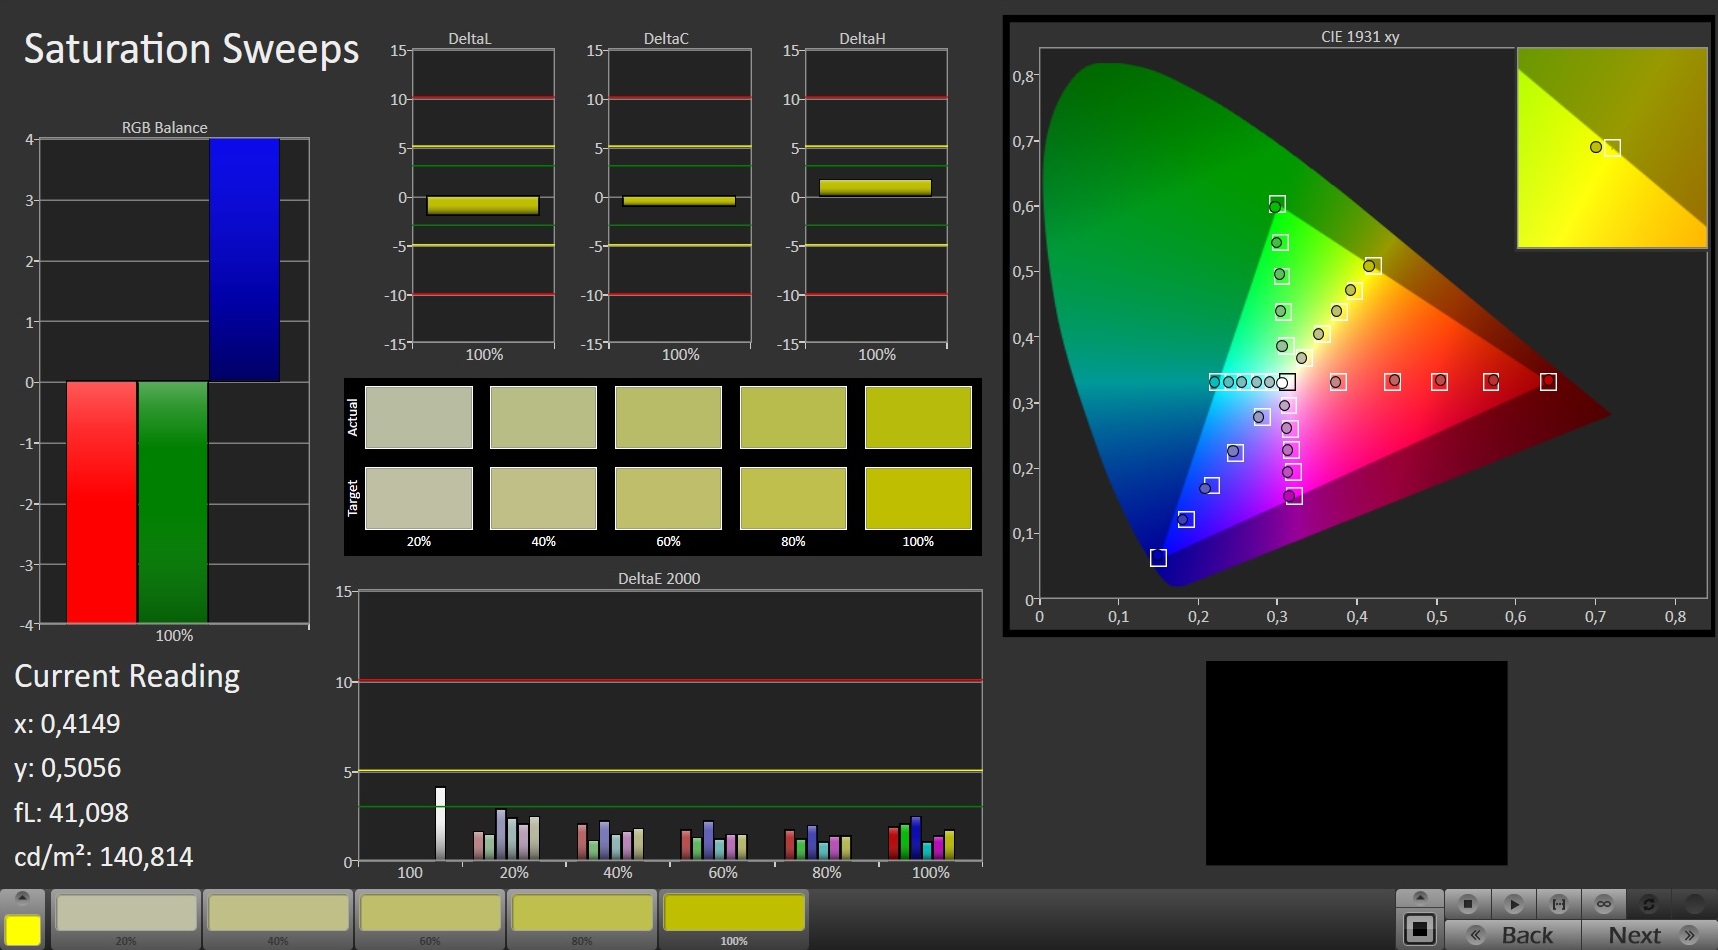
The display of the Key 16 offers a very good color reproduction already in the state of delivery. With a DeltaE-2000 color deviation of 2.24, the target (DeltaE < 3) is met. You can even achieve further improvement via calibration of the display. We tried it and were able to reduce the color deviation to a value of 0.72 and to cause the grayscales to be reproduced significantly more balanced. The color space coverage also does not look bad. The coverage rates are 60% (AdobeRGB) and 99% (sRGB).
Using the color profile we are offering, you can adjust the color reproduction of the display according to our calibration. However, you need to make sure that you have the same display model (manufacturer + model number) as our test unit, since otherwise the color reproduction can become worse, instead of improving. Often displays from different manufacturers are used within the same notebook model series.

Display Response Times
| ↔ Response Time Black to White | ||
|---|---|---|
| 10.4 ms ... rise ↗ and fall ↘ combined | ↗ 6 ms rise | 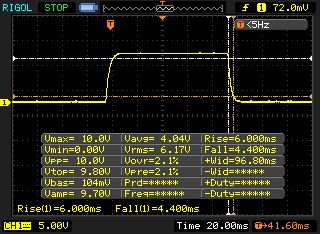 |
| ↘ 4.4 ms fall | ||
| The screen shows good response rates in our tests, but may be too slow for competitive gamers. In comparison, all tested devices range from 0.1 (minimum) to 240 (maximum) ms. » 28 % of all devices are better. This means that the measured response time is better than the average of all tested devices (19.8 ms). | ||
| ↔ Response Time 50% Grey to 80% Grey | ||
| 18 ms ... rise ↗ and fall ↘ combined | ↗ 8.8 ms rise | 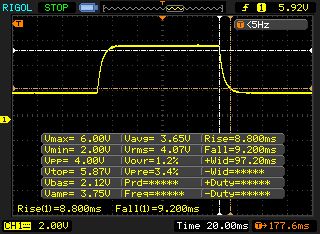 |
| ↘ 9.2 ms fall | ||
| The screen shows good response rates in our tests, but may be too slow for competitive gamers. In comparison, all tested devices range from 0.165 (minimum) to 636 (maximum) ms. » 32 % of all devices are better. This means that the measured response time is better than the average of all tested devices (30.9 ms). | ||
Screen Flickering / PWM (Pulse-Width Modulation)
| Screen flickering / PWM detected | 25510 Hz | ≤ 20 % brightness setting | 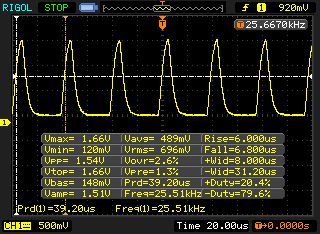 |
The display backlight flickers at 25510 Hz (worst case, e.g., utilizing PWM) Flickering detected at a brightness setting of 20 % and below. There should be no flickering or PWM above this brightness setting. The frequency of 25510 Hz is quite high, so most users sensitive to PWM should not notice any flickering. In comparison: 52 % of all tested devices do not use PWM to dim the display. If PWM was detected, an average of 7741 (minimum: 5 - maximum: 343500) Hz was measured. | |||
Schenker has equipped the Key 16 with an IPS panel with stable viewing angles, allowing the display to be read from any angle. Outdoors, you can only read the display when the sunlight is not too bright.

Performance - Sufficient for the next few years
With the Key 16, Schenker offers a slim, 16.1-inch notebook that is able to bring any current game to the screen smoothly, and also strikes a good figure in all the other application areas. You have to pay about 2500 Euros (~$2773) for our test unit. The most affordable model can be purchased for about 1600 Euros (~$1775), and then there will be a GeForce GTX 1660-Ti graphics core on board. Since Schenker allows for very individual configurations, some correspondingly well-equipped models can cost more than 4000 Euros (~$4437).


Test Conditions
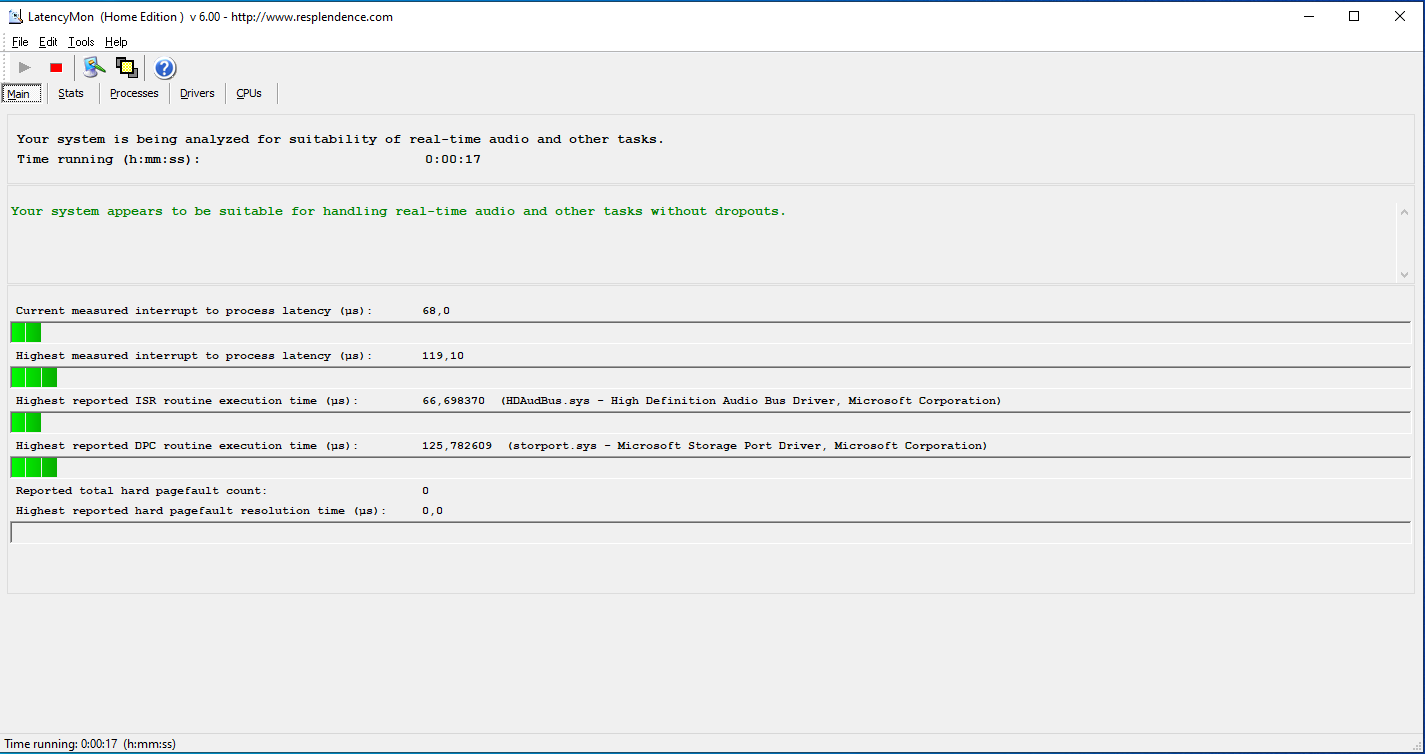
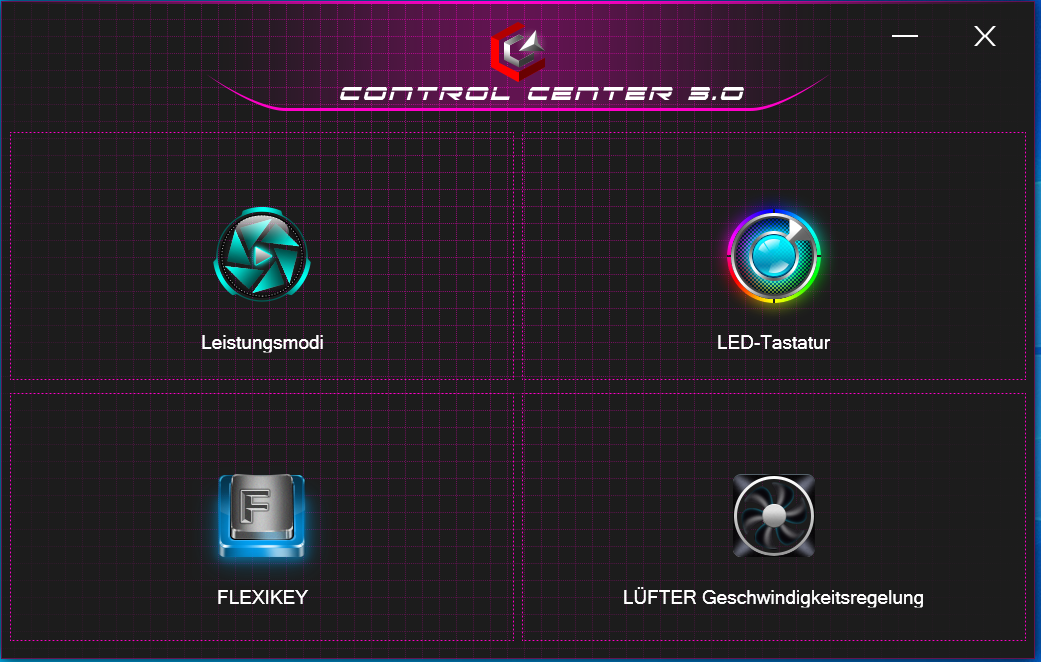
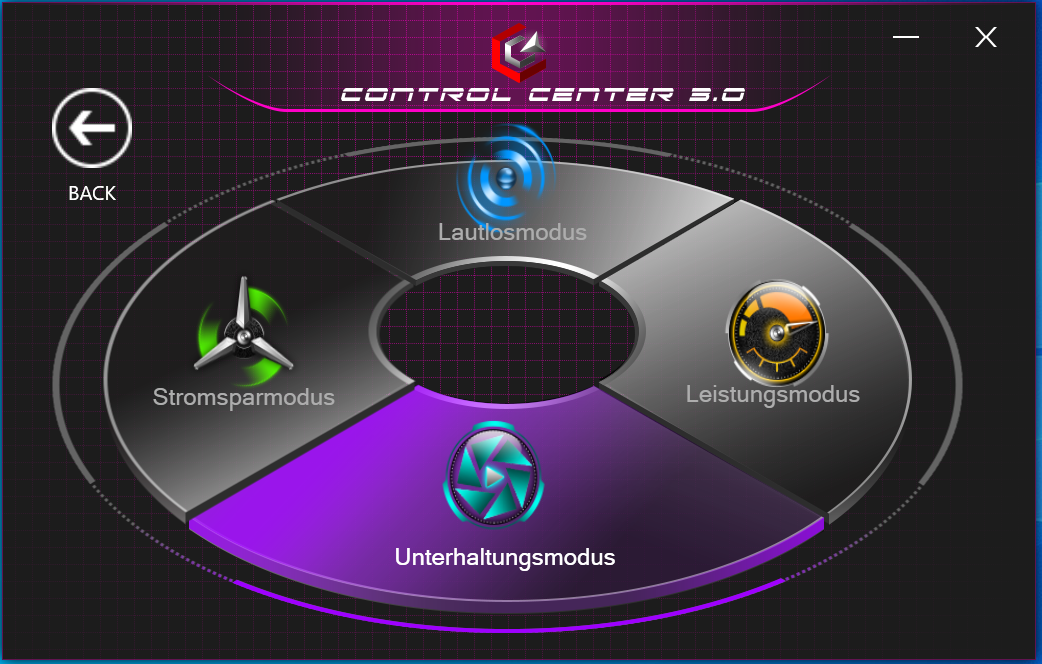
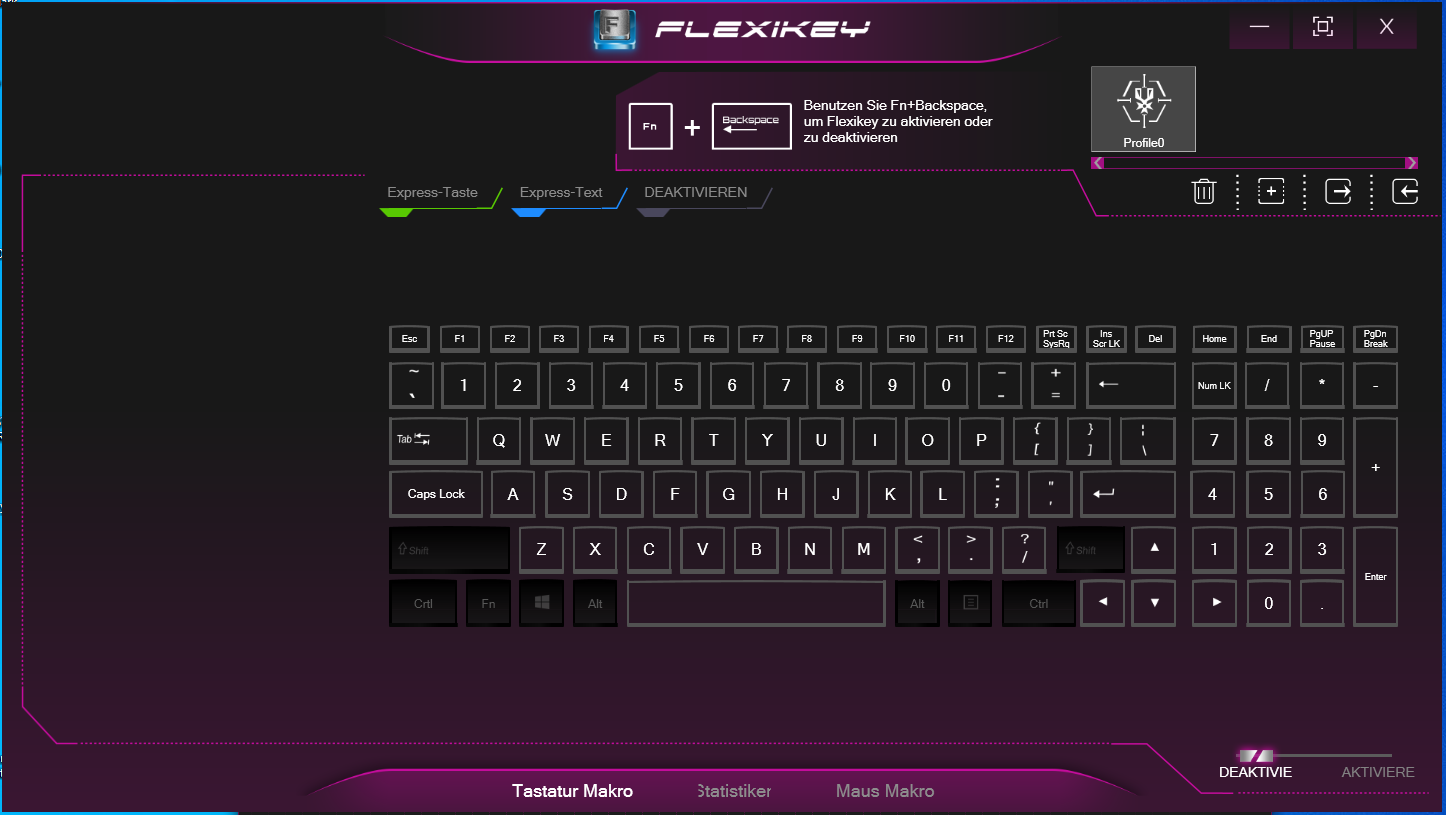
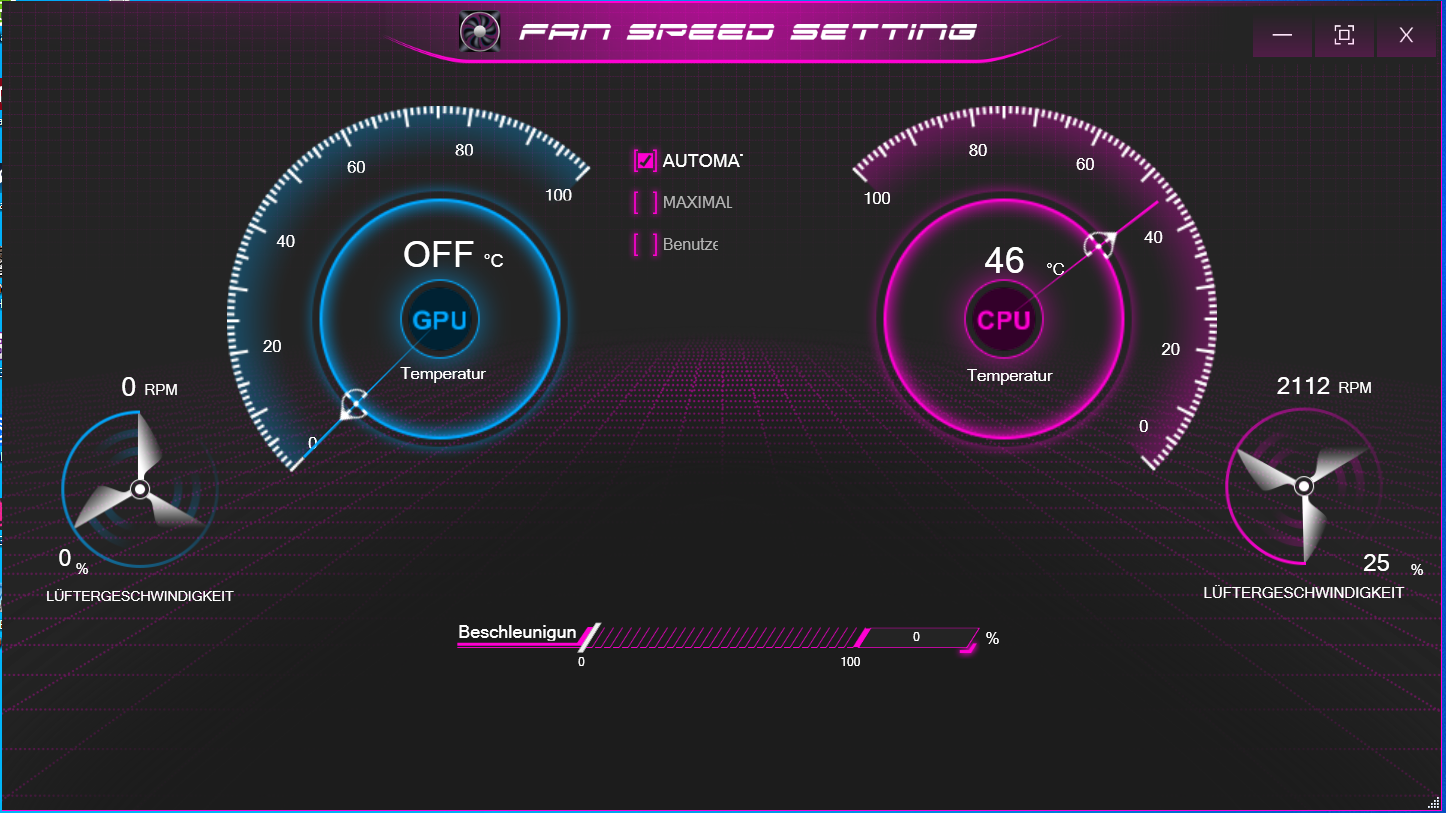
In addition to functions to view the system status and control the keyboard illumination, the preinstalled Control Center also offers the option to set up a performance profile and adjust the fan control. The profiles "Silent Mode," "Power Saver Mode," "Entertainment Mode," and "Performance Mode" are available. We ran our tests with the "Entertainment Mode" profile and automatic fan control activated.
The "Performance Mode" does not lead to a performance increase in the Key 16. The results in the CPU and GPU tests remain within the same range in the "Entertainment" and "Performance" modes. The fan running constantly at maximum speeds will not change anything about this.
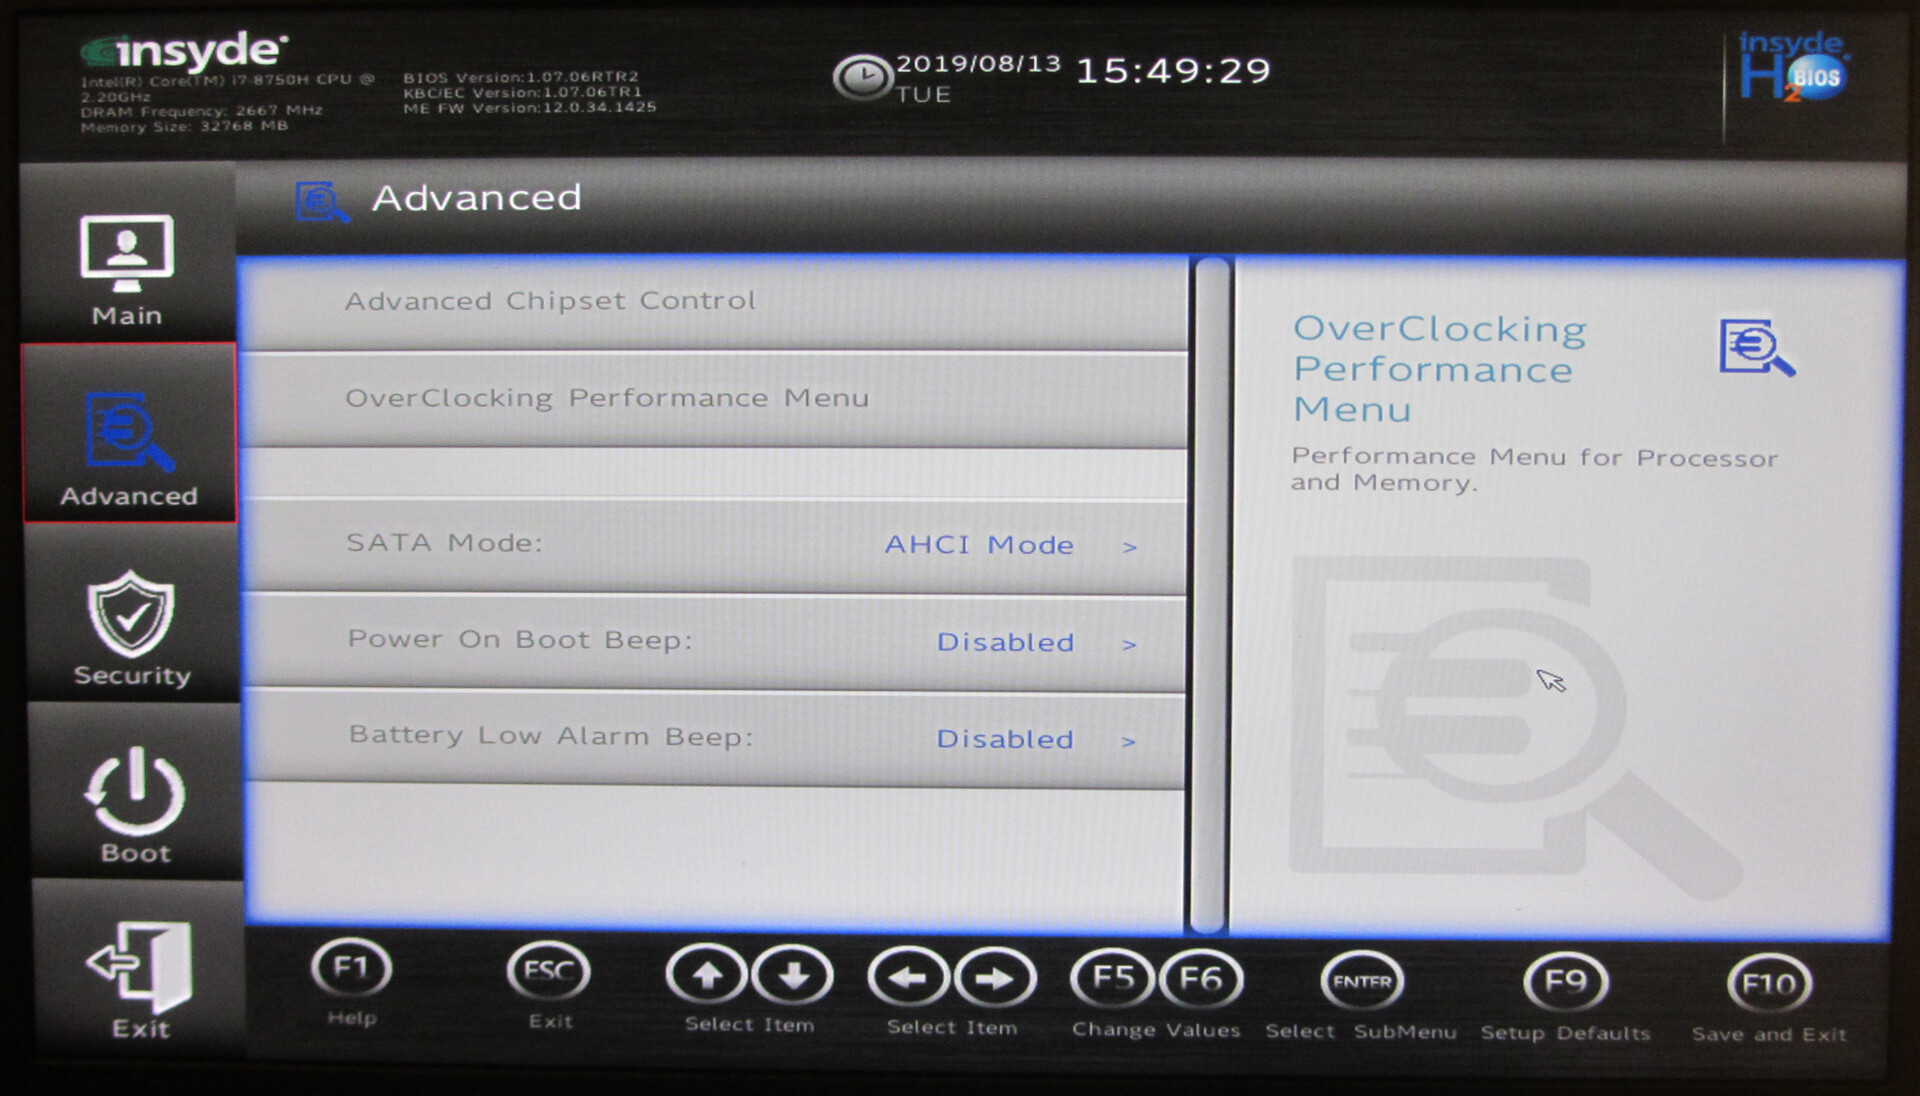
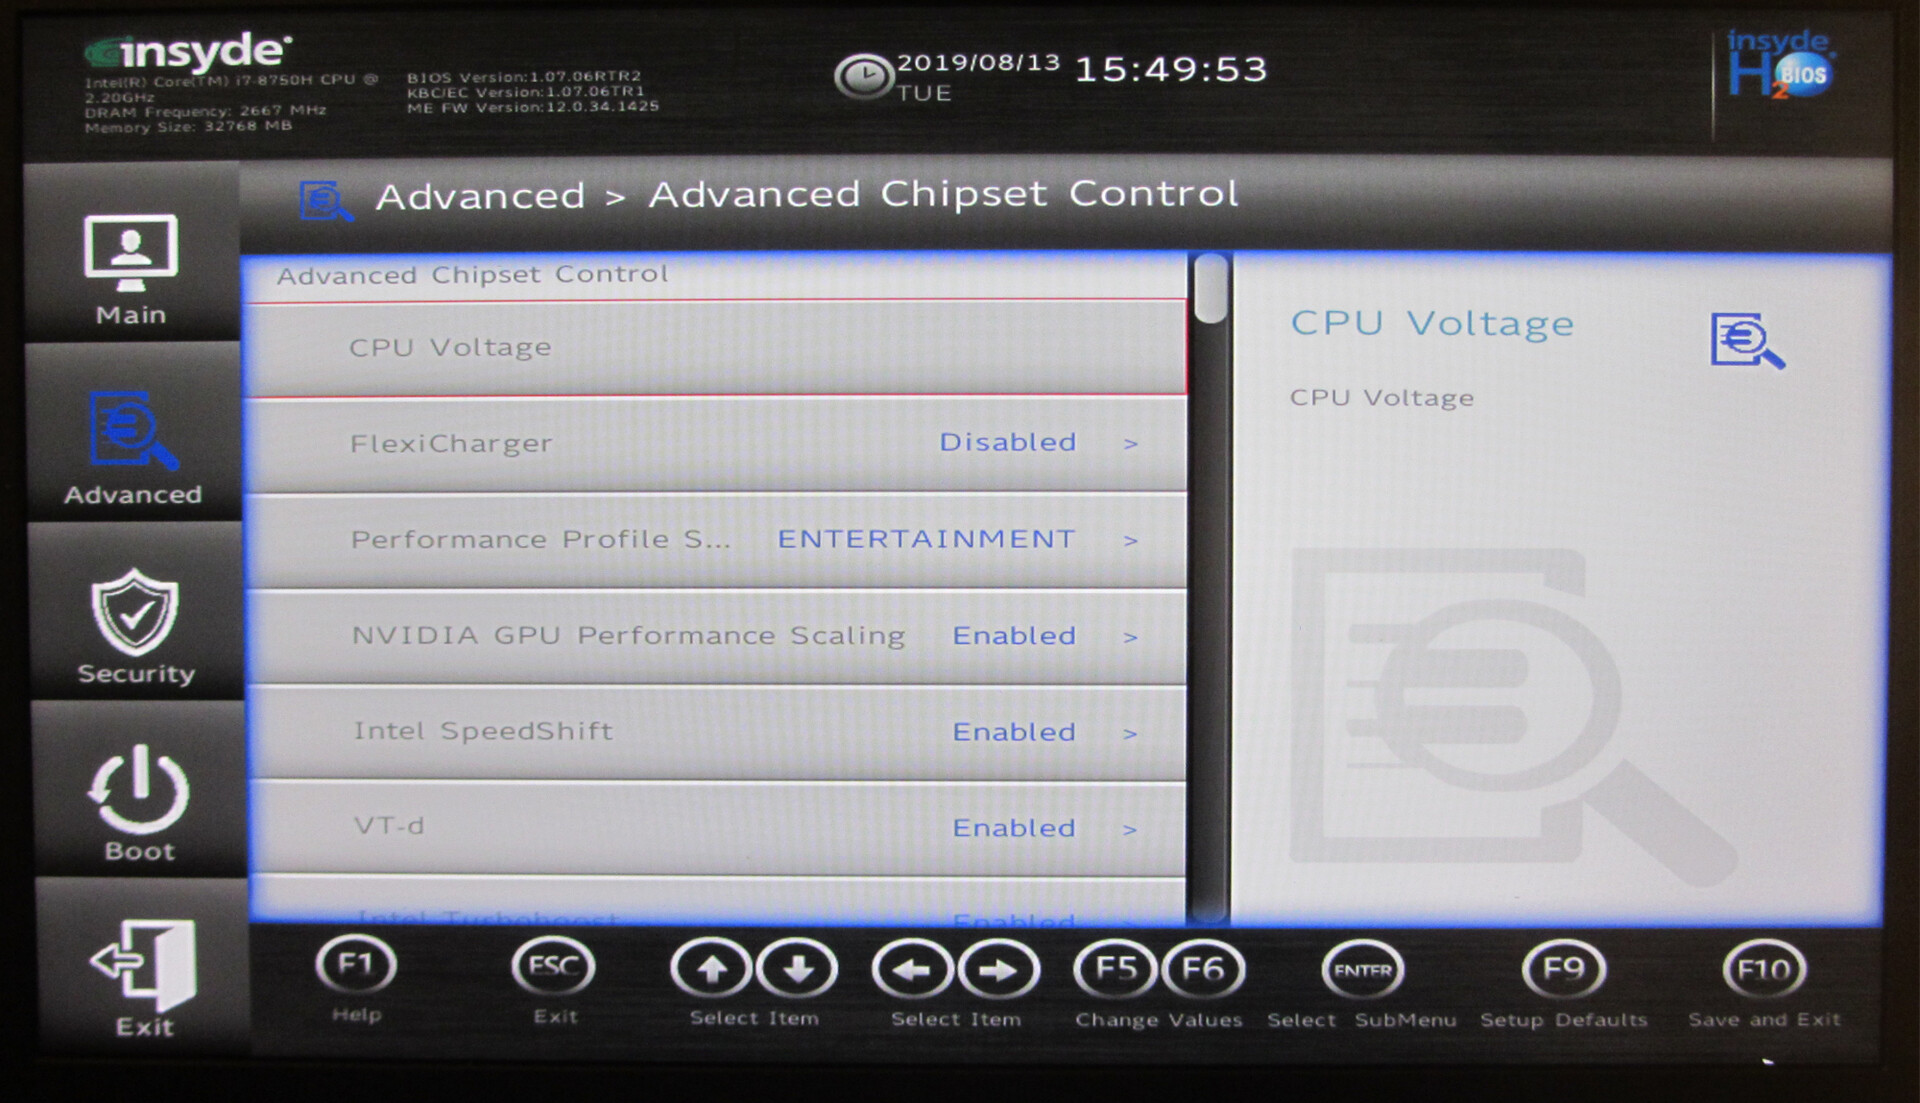
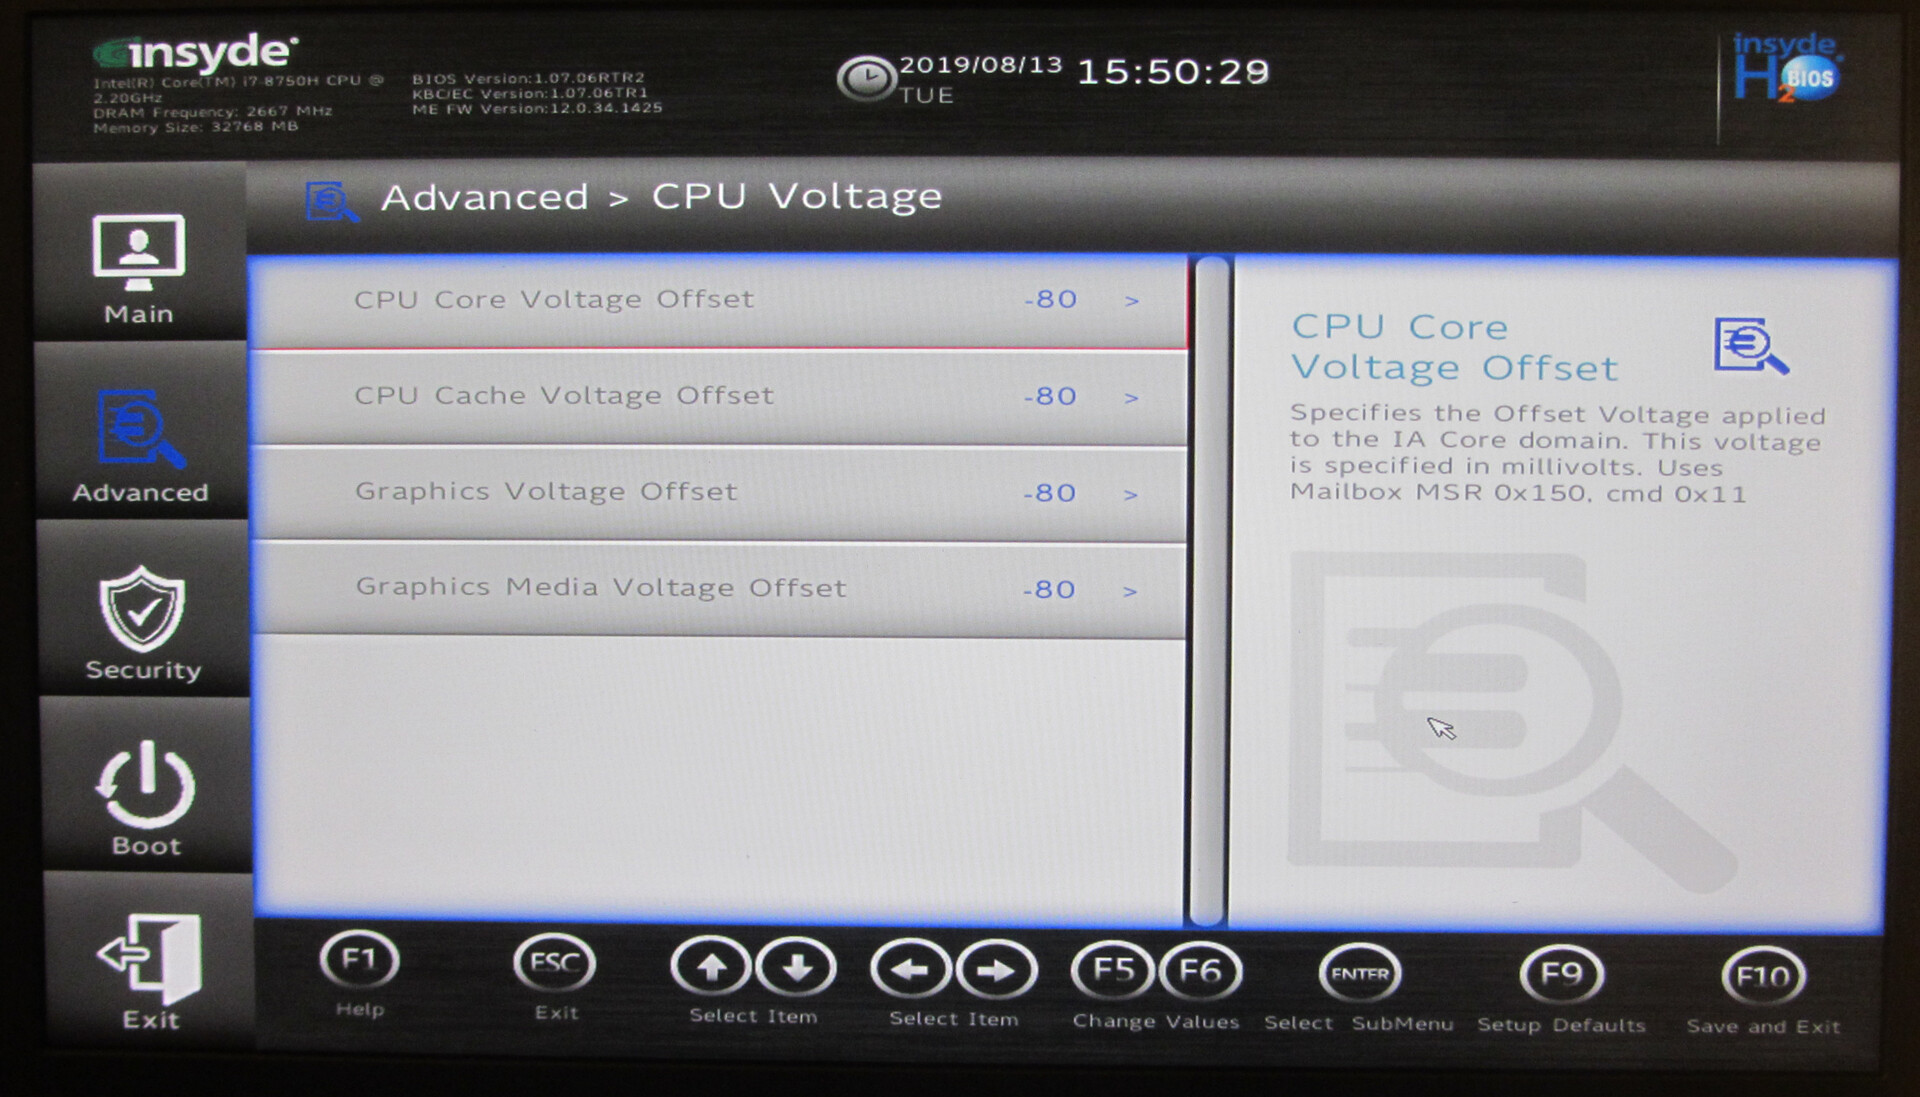
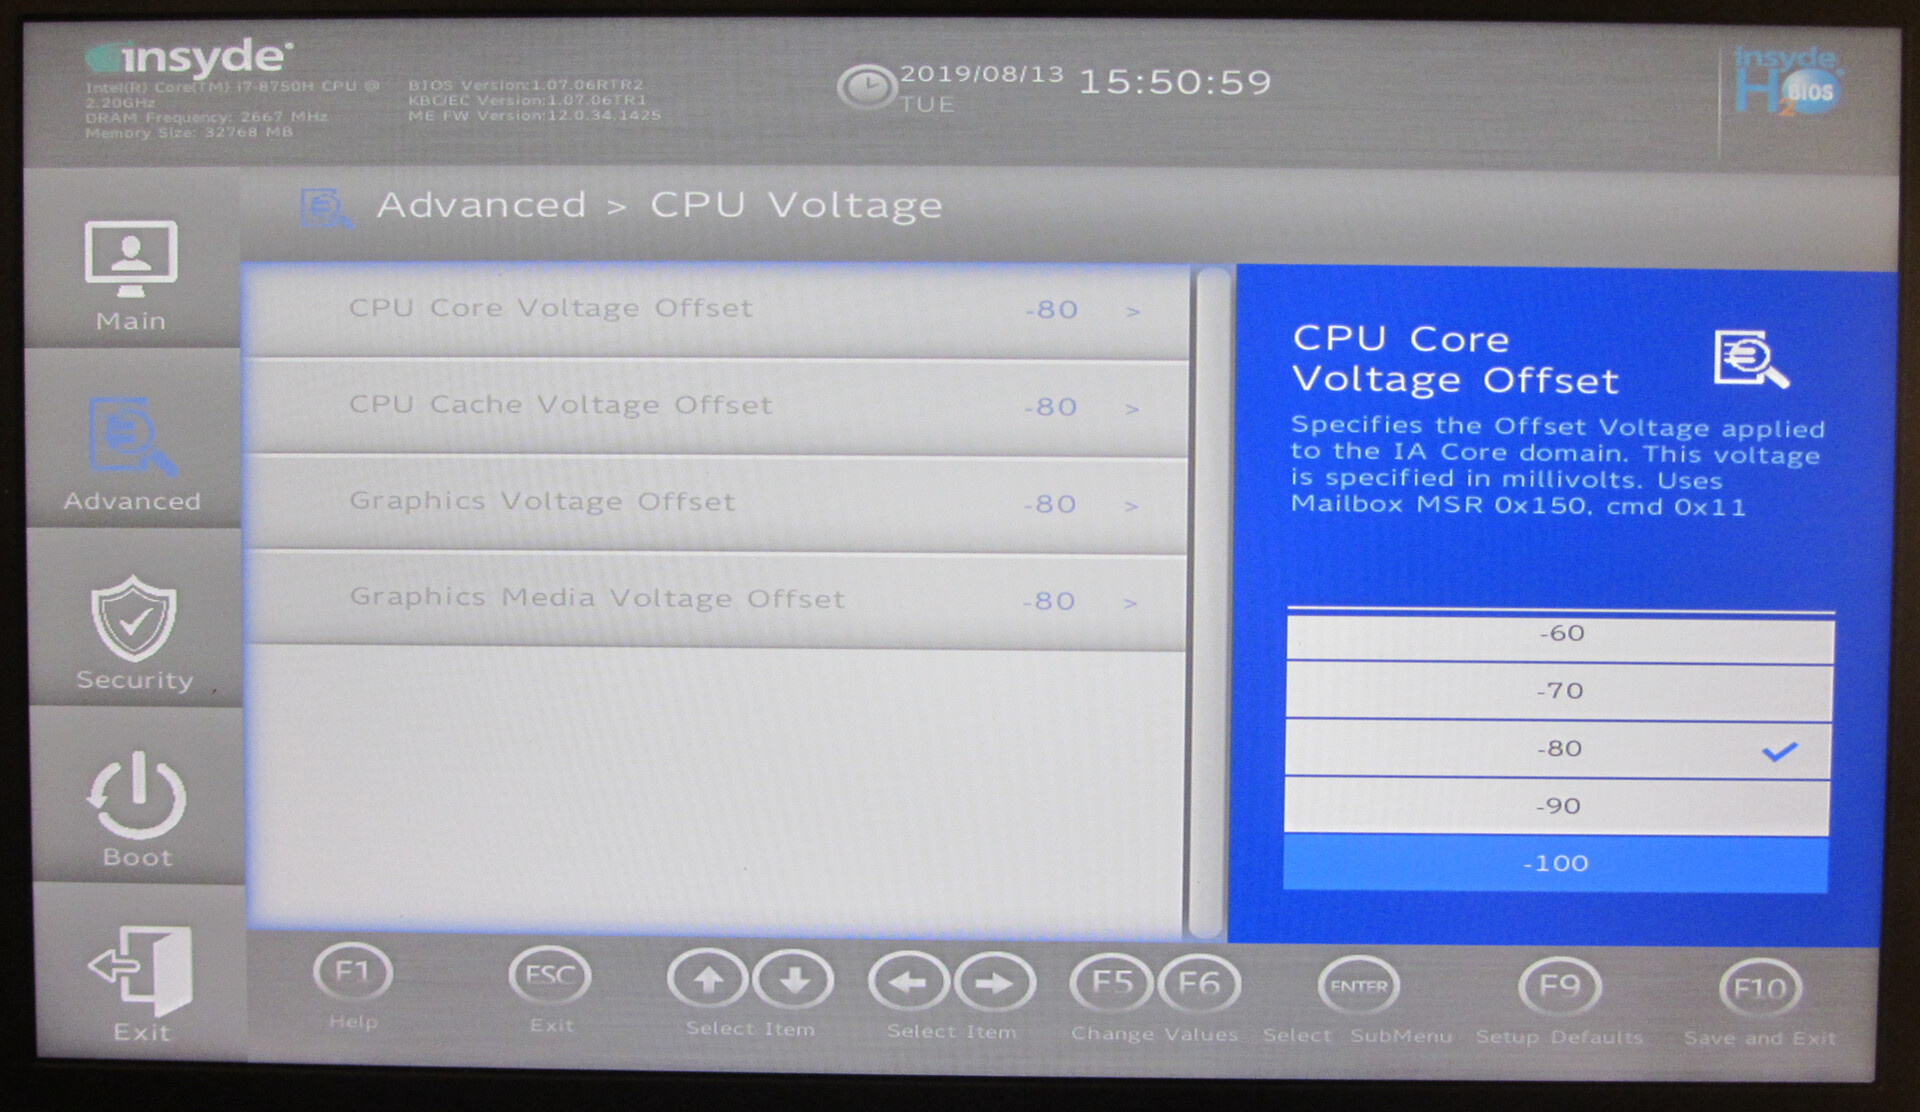
Undervolting via BIOS
The BIOS of the Key 16 allows for the so-called "undervolting" of the processor and the integrated GPU. This will run the two components with less voltage than intended by the manufacturer. As a result, the power consumption and also the heat development will turn out lower. If the voltage is lowered too much, there is a danger of the system becoming unstable or errors occurring. Schenker has therefore limited the voltage drop to a maximum of 100 mV, since this will still ensure stable operation of the hardware. The BIOS enables undervolting in steps of 10 mV. If the system becomes unstable or errors occur, you should go back to the previous voltage setting.
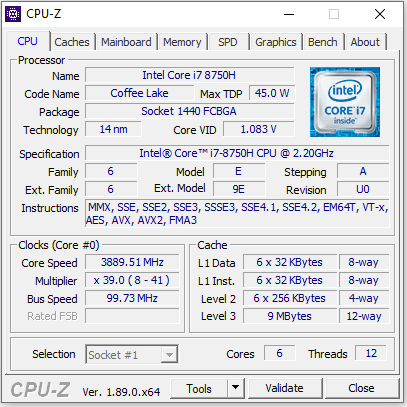
Processor
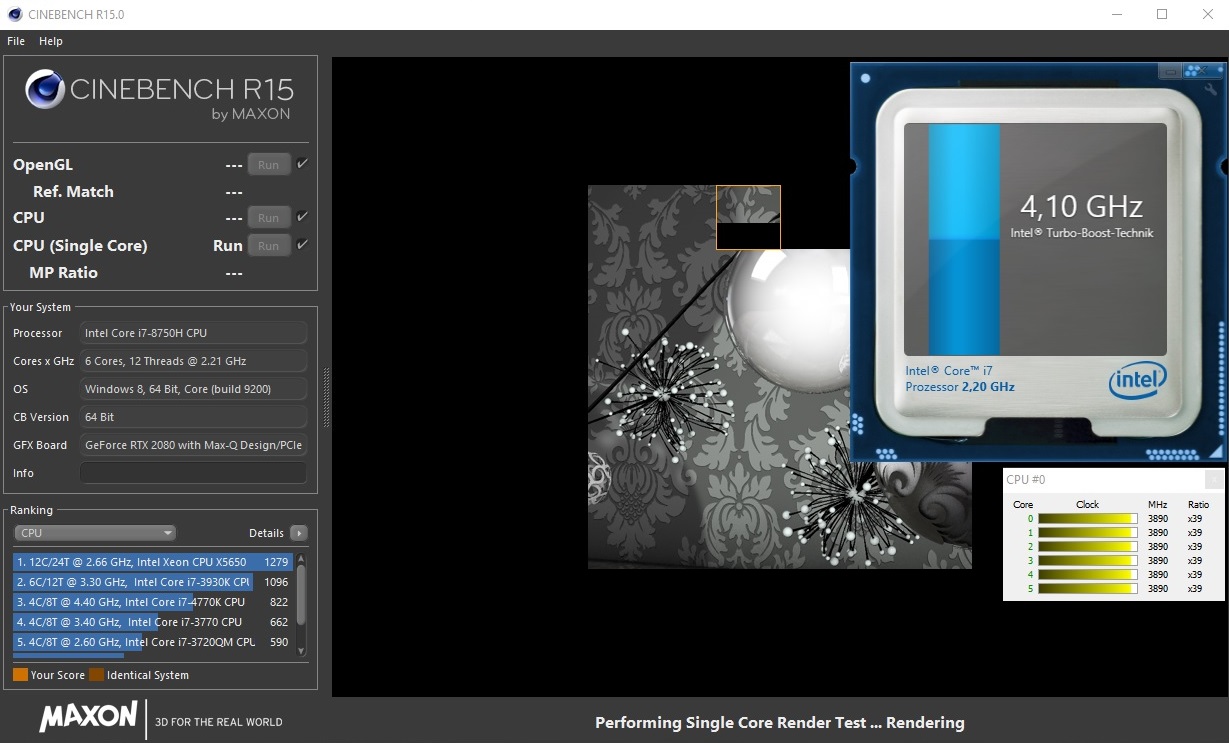
The Schenker Key 16 is run by an Intel Core i7-8750H (Coffee Lake) hexa-core processor. The CPU represents a good compromise between computing performance, power consumption, and purchase price. The same goes for its successor, the Core i7-9750H, which is also available. The 8750H runs at a basic clock speed of 2.2 GHz. The clock speed can be increased via Turbo to 3.9 GHz (six cores), 4 GHz (four cores), and 4.1 GHz (one or two cores).
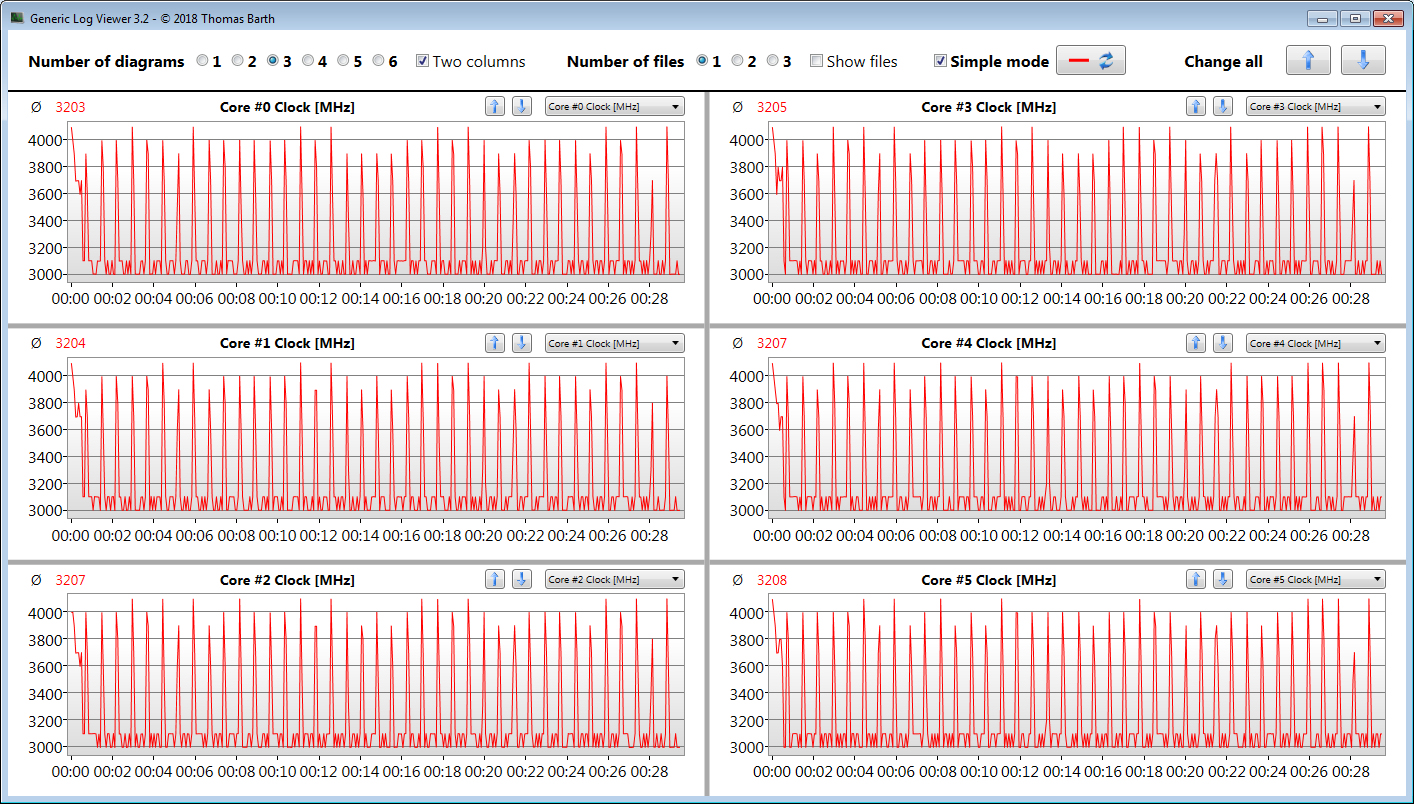
The processor runs through the multi-thread tests of the Cinebench benchmarks at 3.4 to 3.9 GHz for a short time, before the clock speed drops to 3.1 - 3.2. GHz. It runs through the single-thread tests at 3.9 to 4.1 GHz. This is the behavior in mains operation. In battery operation, the CPU runs at 1.4 to 2.9 GHz (multi-thread) and 2.5 to 4.1 GHz (single-thread).
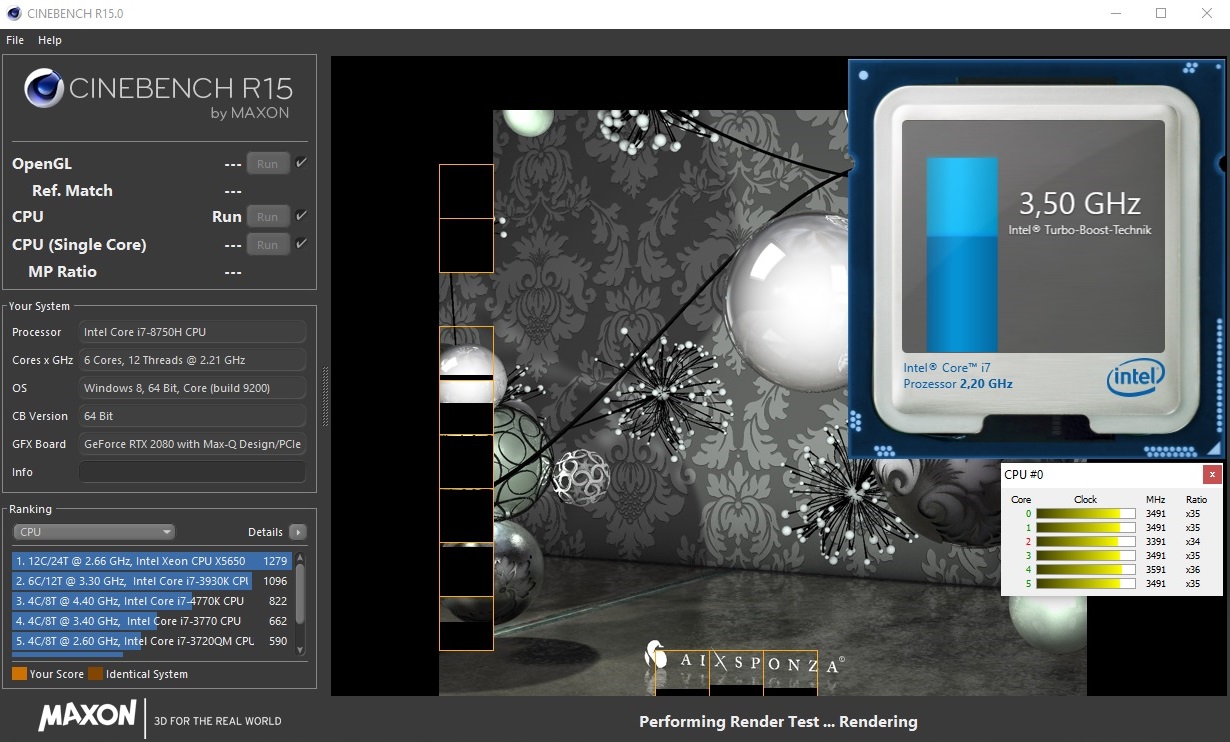
By running the multi-thread test of the Cinebench R15 benchmarks for at least 30 minutes in a constant loop, we evaluate whether the CPU Turbo is also used constantly in mains operation. From the first to the second run, the results drop by about 12% and then remain at a constant level. So while the Turbo is used, it is not used to the full extent possible.
A glance at the following diagram shows that the Core i7 remains slightly behind its full potential, and the Alienware m15, which is equipped with the same CPU, offers better results. The activation of Performance Mode in the Control Center does not lead to any improvement, since Schenker has implemented a power limit (PL2) of 68 watts for Entertainment Mode as well as Performance Mode.
| Cinebench R10 | |
| Rendering Single 32Bit | |
| Average of class Gaming (7457 - 12575, n=9, last 2 years) | |
| Schenker Key 16 | |
| Gigabyte Aero 15-X9 | |
| Rendering Multiple CPUs 32Bit | |
| Average of class Gaming (42932 - 102066, n=9, last 2 years) | |
| Gigabyte Aero 15-X9 | |
| Schenker Key 16 | |
| Cinebench R20 | |
| CPU (Single Core) | |
| Average of class Gaming (622 - 913, n=103, last 2 years) | |
| Schenker Key 16 | |
| CPU (Multi Core) | |
| Average of class Gaming (4029 - 16433, n=103, last 2 years) | |
| Schenker Key 16 | |
| Geekbench 3 | |
| 32 Bit Multi-Core Score | |
| Schenker Key 16 | |
| Gigabyte Aero 15-X9 | |
| 32 Bit Single-Core Score | |
| Schenker Key 16 | |
| Gigabyte Aero 15-X9 | |
| Geekbench 4.4 | |
| 64 Bit Multi-Core Score | |
| Average of class Gaming (89200 - 101054, n=3, last 2 years) | |
| Schenker Key 16 | |
| Gigabyte Aero 15-X9 | |
| 64 Bit Single-Core Score | |
| Average of class Gaming (9335 - 9775, n=3, last 2 years) | |
| Schenker Key 16 | |
| Gigabyte Aero 15-X9 | |
| Mozilla Kraken 1.1 - Total | |
| Gigabyte Aero 15-X9 (Edge 44) | |
| MSI GS65 Stealth 9SG (Edge 44.17763.1.0) | |
| Alienware m15 P79F | |
| Schenker Key 16 (Edge 44) | |
| Razer Blade 15 RTX 2080 Max-Q (Edge 44.17763.1.0) | |
| HP Omen 15-dc1303ng | |
| Average of class Gaming (391 - 590, n=100, last 2 years) | |
| Octane V2 - Total Score | |
| Average of class Gaming (93292 - 139447, n=26, last 2 years) | |
| HP Omen 15-dc1303ng | |
| Razer Blade 15 RTX 2080 Max-Q (Edge 44.17763.1.0) | |
| Schenker Key 16 (Edge 44) | |
| MSI GS65 Stealth 9SG (Edge 44.17763.1.0) | |
| Alienware m15 P79F (Edge 44.17763.1.0) | |
| Gigabyte Aero 15-X9 (Edge 44) | |
| JetStream 1.1 - 1.1 Total | |
| Average of class Gaming (549 - 647, n=2, last 2 years) | |
| Razer Blade 15 RTX 2080 Max-Q (Edge 44.17763.1.0) | |
| Schenker Key 16 (Edge 44) | |
| MSI GS65 Stealth 9SG (Edge 44.17763.1.0) | |
| Gigabyte Aero 15-X9 (Edge 44) | |
| Alienware m15 P79F (Edge 44.17763.1.0) | |
| HP Omen 15-dc1303ng | |
* ... smaller is better
System Performance
The Key 16 does not lack in system performance. The six-core processor offers more than enough computing power for all the usual application areas - and that also includes the next few years. The dedicated graphics core allows playing the current computer games. The system runs smoothly and without a hitch, and we did not encounter any problems. This impression is accompanied by very good results in the PC-Mark benchmarks.
| PCMark 7 Score | 6701 points | |
| PCMark 8 Home Score Accelerated v2 | 4277 points | |
| PCMark 8 Creative Score Accelerated v2 | 4037 points | |
| PCMark 8 Work Score Accelerated v2 | 5617 points | |
| PCMark 10 Score | 5694 points | |
Help | ||
Storage Solution
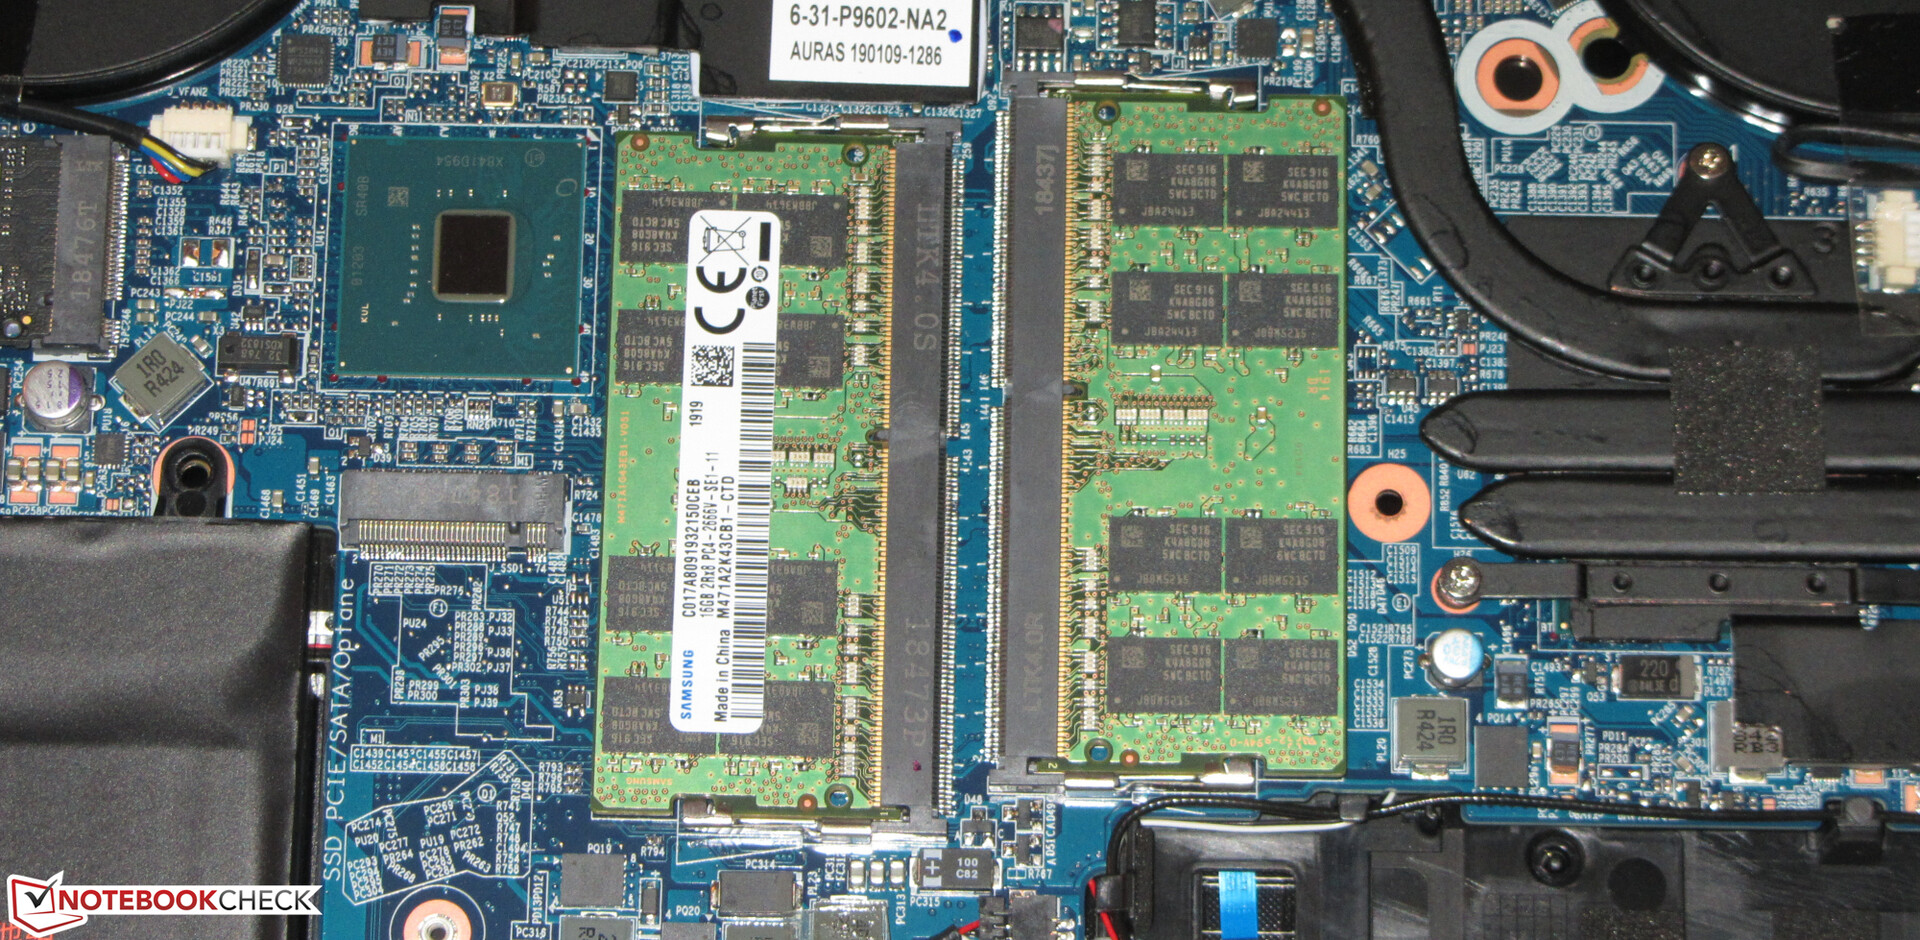
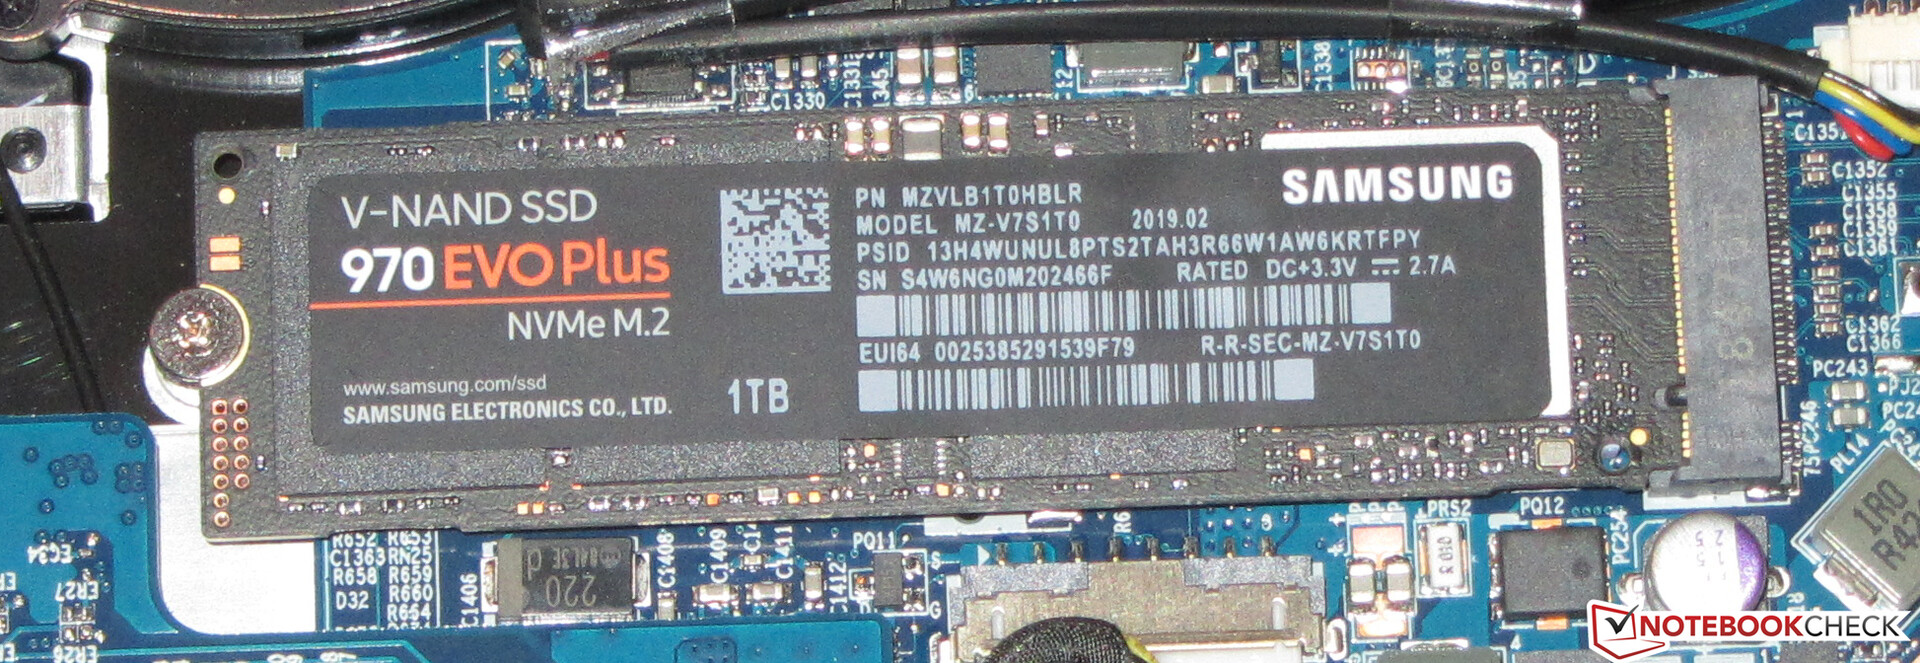
As the system drive, an NVMe SSD from Samsung is used. This is an M.2-2280 model with a total capacity of 1 TB. In the state of delivery, about 890 GB of that is still available. The rest of the storage is occupied by the recovery partition and the Windows installation. The SSD offers very good transfer rates. Its connection via PCI Express becomes noticeable here.
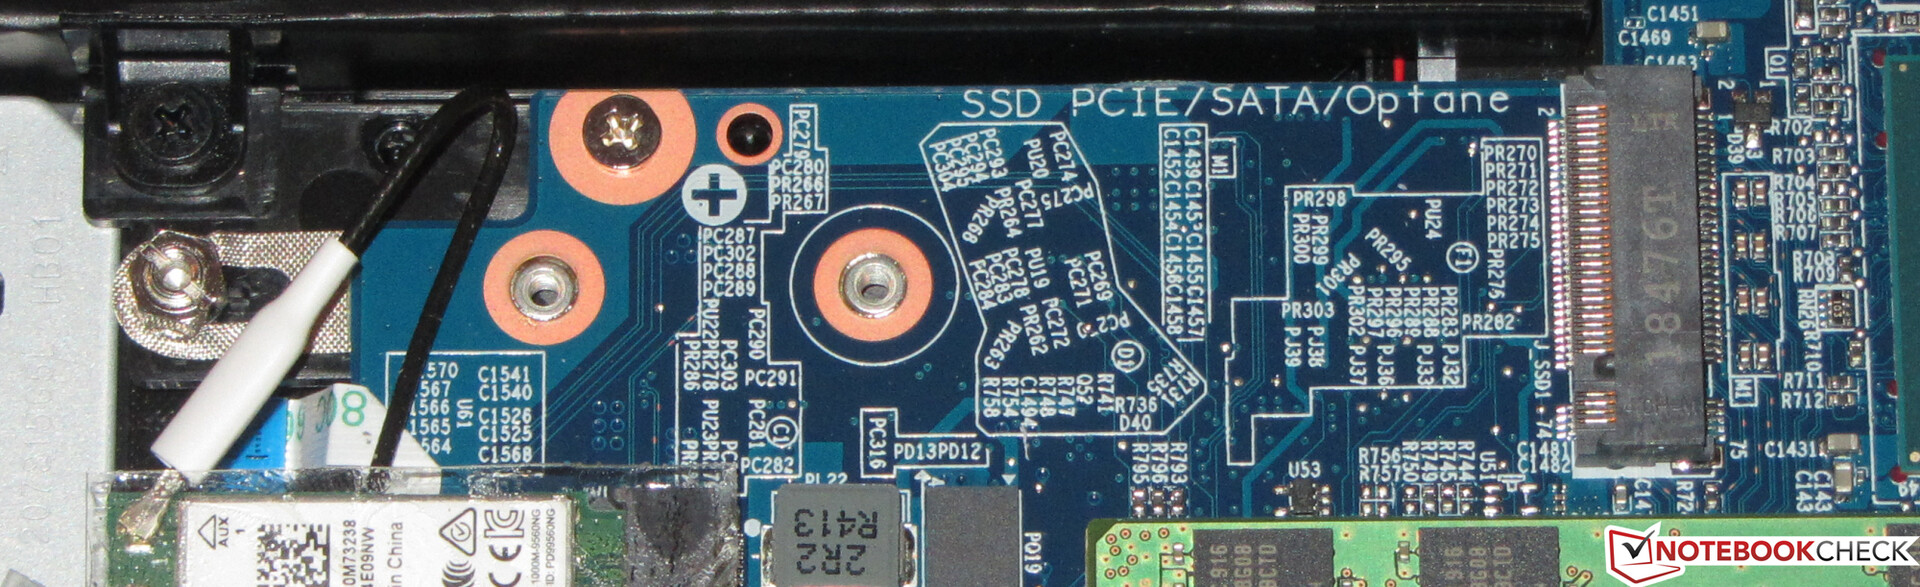
But this is not the end of it. Inside the notebook, there is also a second, unoccupied M.2-2280 slot. Both storage slots support NVMe SSDs, and the unoccupied slot can also accept SATA SSDs. The slots also support RAID 0/1. In order to create a RAID configuration, both slots have to be occupied with NVMe models. In addition, there is also an option to insert a 2.5-inch storage drive into the notebook.

| Schenker Key 16 Samsung SSD 970 EVO Plus 1TB | MSI GS65 Stealth 9SG Samsung SSD PM981 MZVLB512HAJQ | Acer Predator Triton 500 2x WDC PC SN720 SDAPNTW-256G-1014 (RAID 0) | HP Omen 15-dc1303ng Samsung SSD PM981 MZVLB256HAHQ | Alienware m15 P79F Toshiba XG5 KXG50ZNV512G | Razer Blade 15 RTX 2080 Max-Q Samsung SSD PM981 MZVLB512HAJQ | Gigabyte Aero 15-X9 Intel SSD 760p SSDPEKKW010T8 | |
|---|---|---|---|---|---|---|---|
| CrystalDiskMark 5.2 / 6 | -7% | -2% | -15% | 6% | 4% | -14% | |
| Write 4K (MB/s) | 112.5 | 91.3 -19% | 93.6 -17% | 50.2 -55% | 148.4 32% | 137.2 22% | 97.1 -14% |
| Read 4K (MB/s) | 43.79 | 40.73 -7% | 38.82 -11% | 35.32 -19% | 49.65 13% | 46.82 7% | 53.7 23% |
| Write Seq (MB/s) | 1944 | 1915 -1% | 2455 26% | 991 -49% | 1139 -41% | 1221 -37% | 1526 -22% |
| Read Seq (MB/s) | 1656 | 2051 24% | 2107 27% | 1526 -8% | 2353 42% | 1217 -27% | 2020 22% |
| Write 4K Q32T1 (MB/s) | 324.6 | 308.3 -5% | 298.7 -8% | 445.1 37% | 484.7 49% | 527 62% | 285.6 -12% |
| Read 4K Q32T1 (MB/s) | 407 | 417.4 3% | 338.7 -17% | 526 29% | 542 33% | 614 51% | 321.8 -21% |
| Write Seq Q32T1 (MB/s) | 3296 | 1922 -42% | 2902 -12% | 1647 -50% | 1139 -65% | 1986 -40% | 1533 -53% |
| Read Seq Q32T1 (MB/s) | 3555 | 3395 -5% | 3536 -1% | 3427 -4% | 3108 -13% | 3234 -9% | 2351 -34% |
Graphics Card
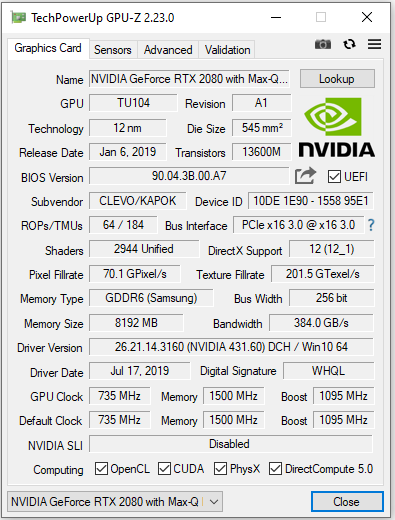
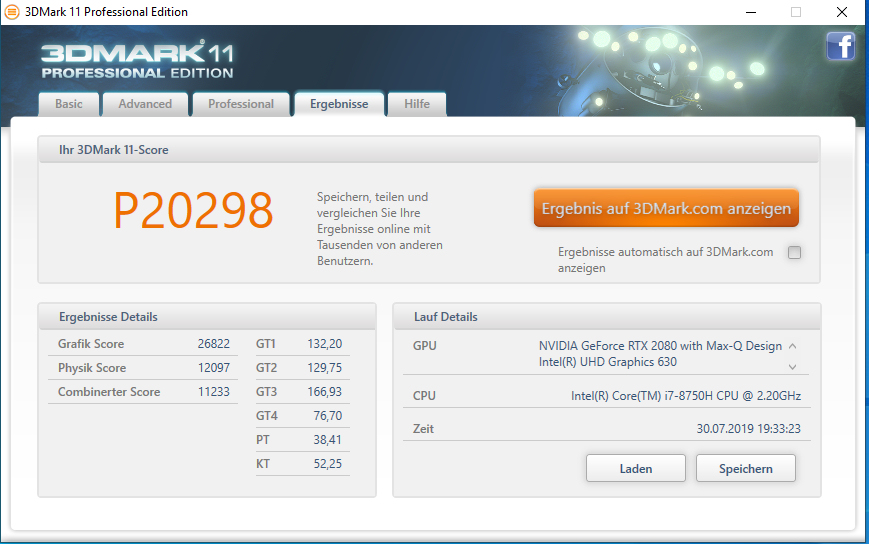
The Schenker notebook brings a dedicated GeForce RTX 2080 Max-Q graphics core from Nvidia. This is a version of the regular RTX 2080 that is trimmed for efficiency and targeted for slim and light notebooks. The GPU supports DirectX 12 and is able to use fast GDDR6 storage (8192 MB).
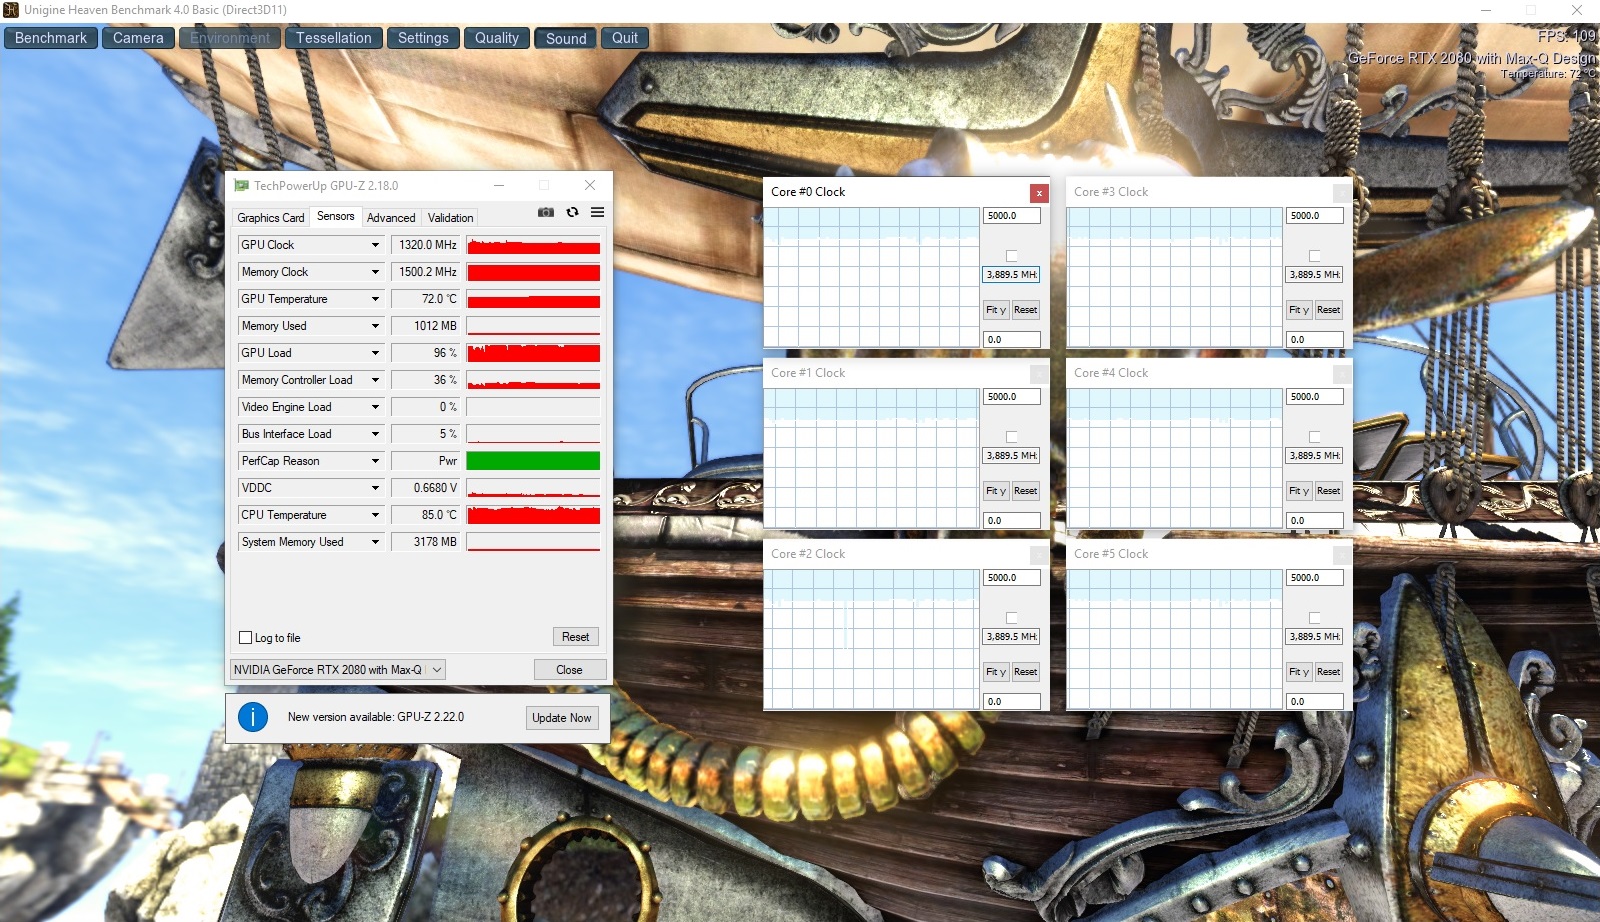
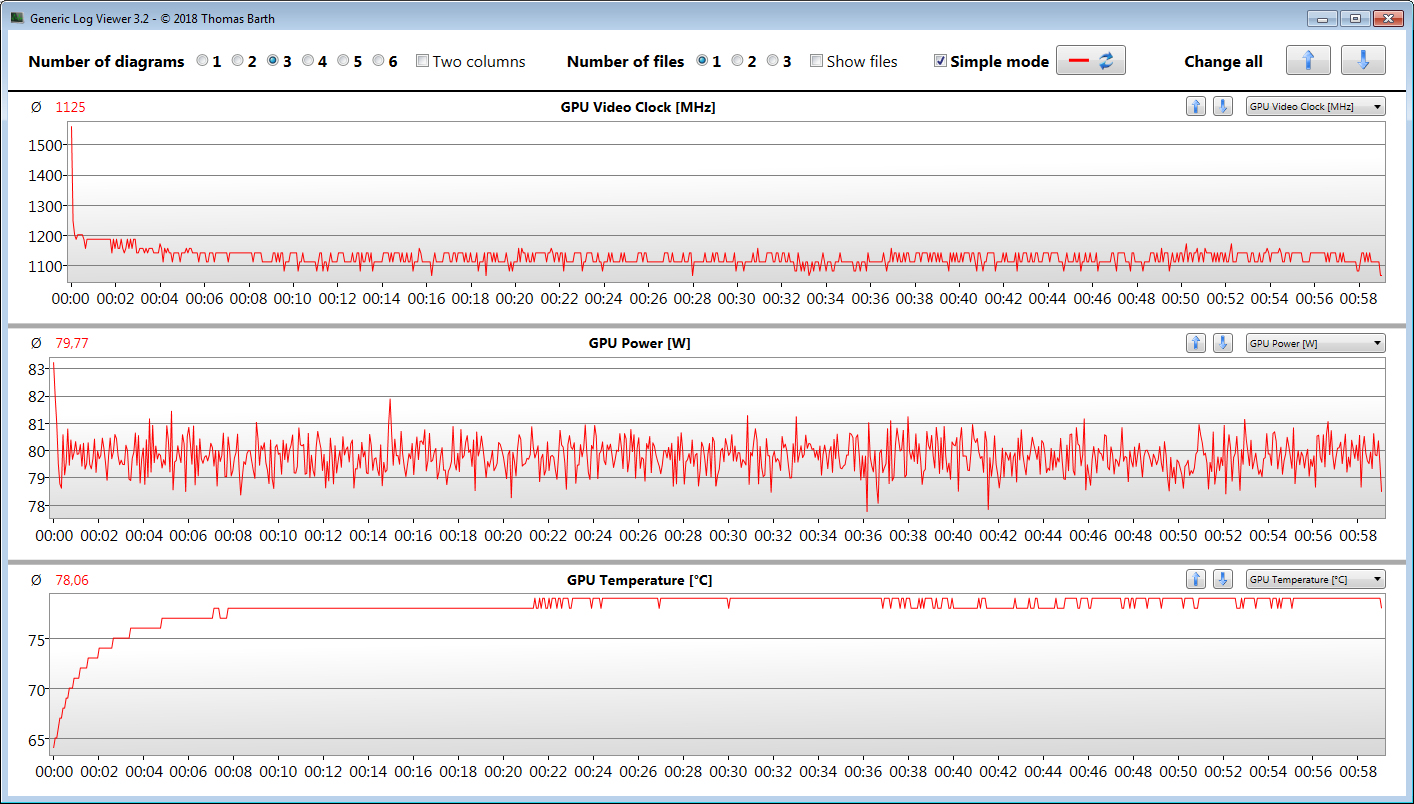
The RTX 2080 Max-Q runs at a basic clock speed of 735 MHz. Via Boost, this can be increased up to 1095 MHz. You can even achieve higher speeds, if the GPU does not reach a specified temperature and/or power limit. We measure a maximum of 1875 MHz, which can only be maintained for a short time. During our benchmarks, we measured an operating speed of 1320 MHz on average. The GPU runs through our "The Witcher 3" test with an average speed of 1125 MHz.
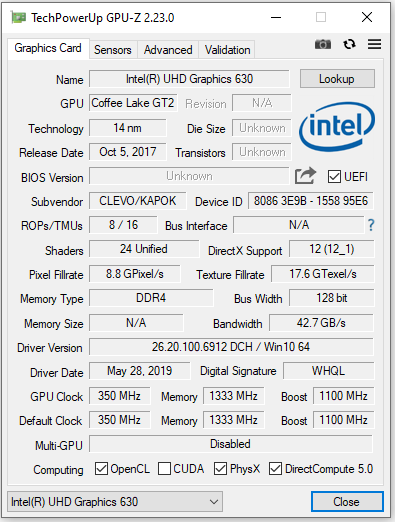
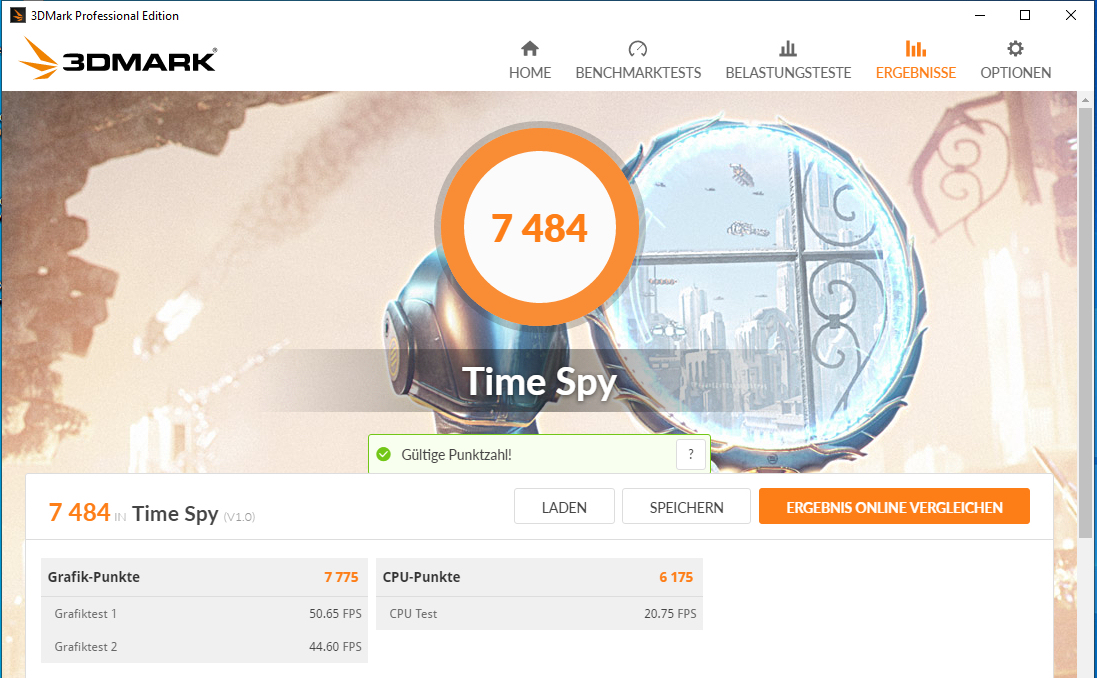
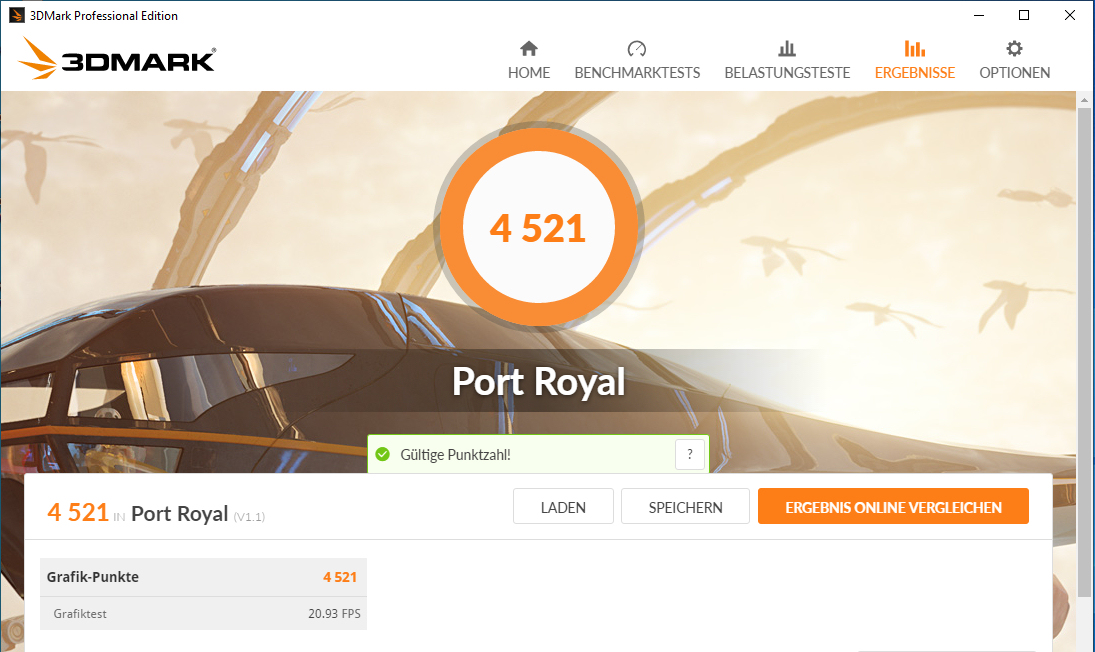
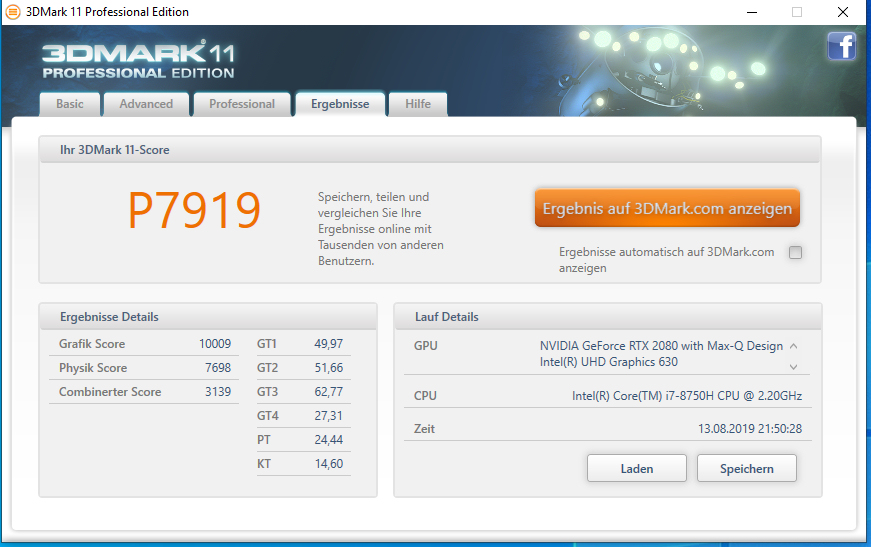
In mains operation, the results in the 3D Mark benchmarks range at a normal level for the GPU. In battery operation, less than half of the graphics performance is available. The UHD Graphics 630 GPU integrated in the processor is active, and the notebook uses Nvidia's Optimus graphics switching solution.
| 3DMark 06 Standard Score | 36601 points | |
| 3DMark 11 Performance | 20298 points | |
| 3DMark Ice Storm Standard Score | 116851 points | |
| 3DMark Cloud Gate Standard Score | 34938 points | |
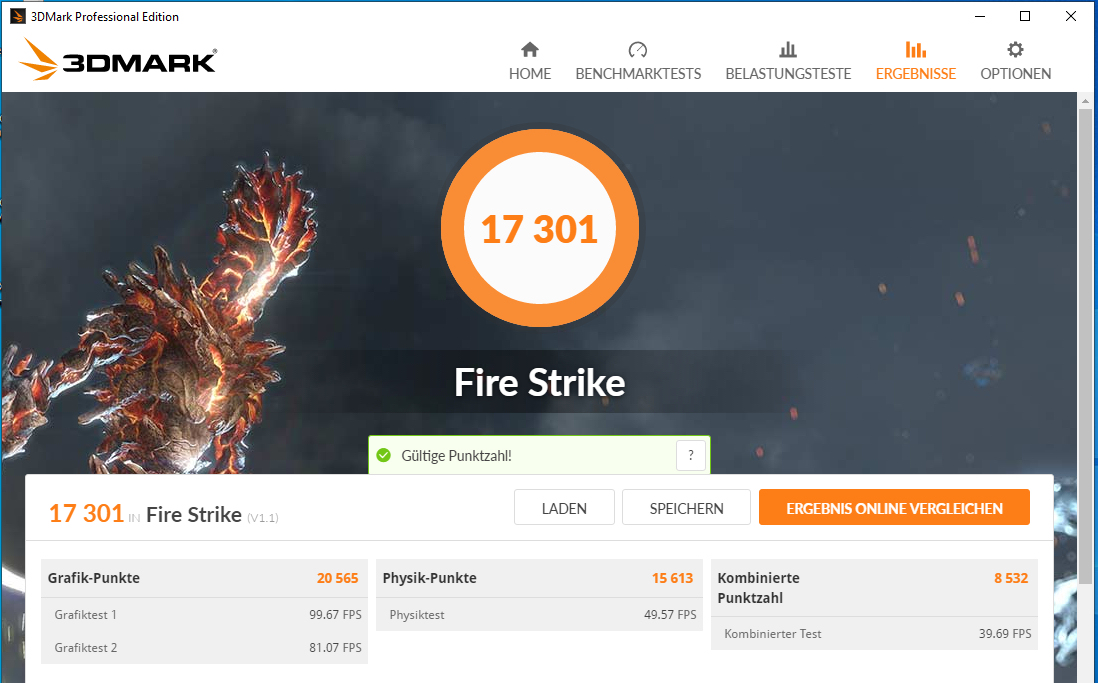
| 3DMark Fire Strike Score | 17301 points | |
| 3DMark Time Spy Score | 7484 points | |
Help | ||
Gaming Performance
The Key 16 is able to bring all the games in our database smoothly to the screen. Generally, Full-HD resolution and high to maximum quality settings can be selected. The GPU can also handle resolutions beyond Full-HD (you would need an external monitor for this). However, you then have to be more conservative in the choice of your quality settings.
| The Witcher 3 - 1920x1080 Ultra Graphics & Postprocessing (HBAO+) | |
| Average of class Gaming (104.7 - 240, n=7, last 2 years) | |
| Razer Blade 15 RTX 2080 Max-Q | |
| Schenker Key 16 | |
| Acer Predator Triton 500 | |
| MSI GS65 Stealth 9SG | |
| Alienware m15 P79F | |
| Gigabyte Aero 15-X9 | |
| BioShock Infinite - 1920x1080 Ultra Preset, DX11 (DDOF) | |
| Razer Blade 15 RTX 2080 Max-Q | |
| Schenker Key 16 | |
| MSI GS65 Stealth 9SG | |
| Alienware m15 P79F | |
| Gigabyte Aero 15-X9 | |
| HP Omen 15-dc1303ng | |
| Far Cry New Dawn - 1920x1080 Ultra Preset | |
| Schenker Key 16 | |
| Rage 2 - 1920x1080 Ultra Preset (Resolution Scale Off) | |
| Schenker Key 16 | |
| For Honor - 1920x1080 Extreme Preset AA:T AF:16x | |
| Schenker Key 16 | |
| X-Plane 11.11 - 1920x1080 high (fps_test=3) | |
| Average of class Gaming (55.5 - 148.5, n=106, last 2 years) | |
| Schenker Key 16 | |
| Gigabyte Aero 15-X9 | |
In order to evaluate whether the frame rates remain mostly constant even over a longer time period, we run the game "The Witcher 3" for about 60 minutes in Full-HD resolution and maximum settings. The character of the gamer is not moved for the whole time period. While the frame rates drop slightly in the first few minutes, they always remain at playable levels. We did not notice any FPS drops.
| low | med. | high | ultra | |
|---|---|---|---|---|
| BioShock Infinite (2013) | 297.6 | 268 | 255.1 | 165.7 |
| The Witcher 3 (2015) | 294.7 | 236.6 | 146.6 | 77.4 |
| For Honor (2017) | 267.2 | 165.2 | 156.5 | 123.4 |
| Final Fantasy XV Benchmark (2018) | 125.2 | 100.1 | 75.9 | |
| X-Plane 11.11 (2018) | 101.9 | 89.2 | 74.8 | |
| Far Cry 5 (2018) | 122 | 103 | 97 | 93 |
| Far Cry New Dawn (2019) | 110 | 95 | 90 | 81 |
| Rage 2 (2019) | 204.2 | 111 | 93.5 | 91.9 |
| Total War: Three Kingdoms (2019) | 224.8 | 126.1 | 88.8 | 65.5 |
| F1 2019 (2019) | 188 | 165 | 137 | 114 |
Emissions - Hot and loud under load
Noise emissions
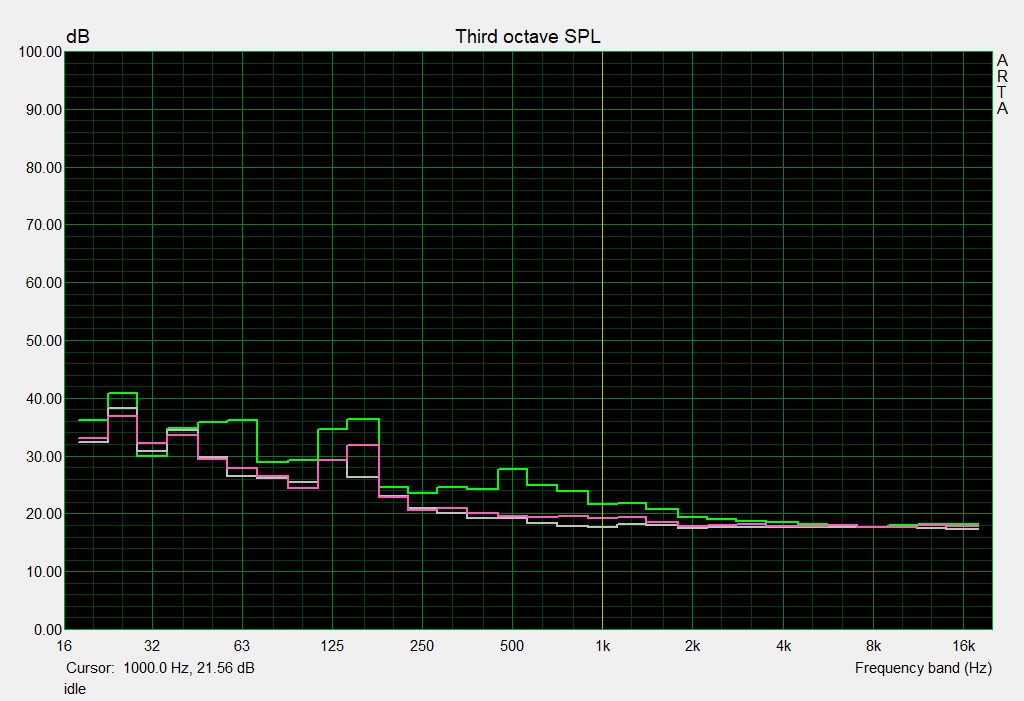
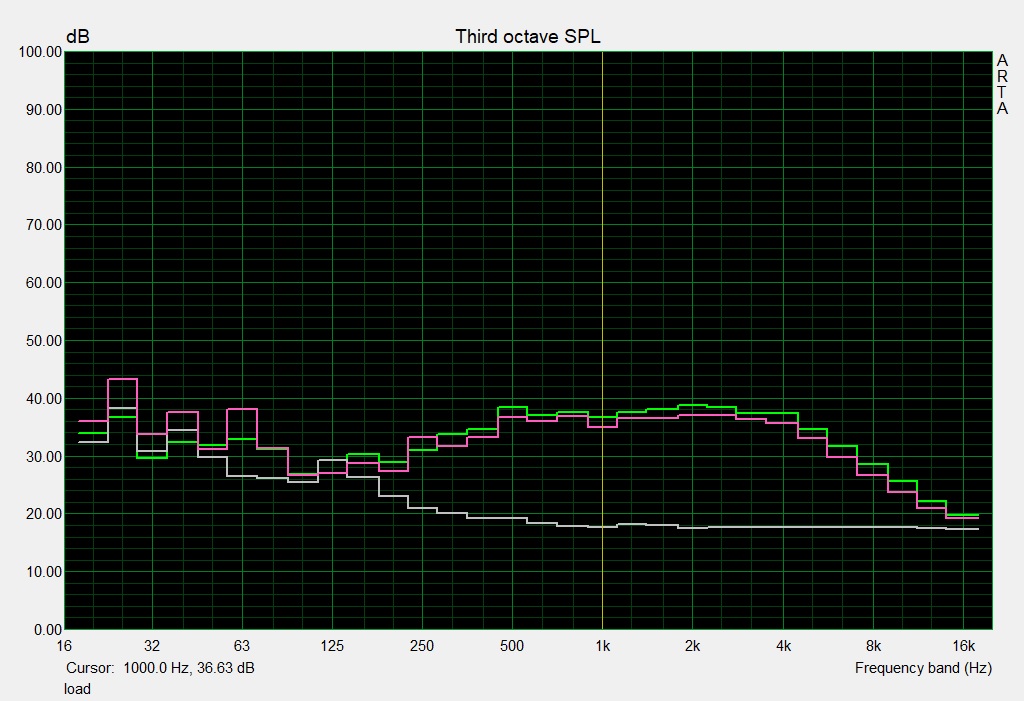
During idle operation and under low load, the fans generally run at a low speed. We measure a noise level of 31 to 34 dB(A). Occasionally the fans turn off and it is quiet. Under load, the three fans rev up quite a bit. During the stress test, we measure a noise level of 49 dB(A). It gets similarly loud during gaming operation. When running our The Witcher-3 test, the Key 16 reaches a level of 48 dB(A).
Noise level
| Idle |
| 30 / 31 / 34 dB(A) |
| Load |
| 47 / 49 dB(A) |
 | ||
30 dB silent 40 dB(A) audible 50 dB(A) loud |
||
min: | ||
| Schenker Key 16 i7-8750H, GeForce RTX 2080 Max-Q | MSI GS65 Stealth 9SG i7-9750H, GeForce RTX 2080 Max-Q | Acer Predator Triton 500 i7-8750H, GeForce RTX 2080 Max-Q | HP Omen 15-dc1303ng i7-8750H, GeForce RTX 2070 Max-Q | Alienware m15 P79F i7-8750H, GeForce RTX 2070 Max-Q | Razer Blade 15 RTX 2080 Max-Q i7-9750H, GeForce RTX 2080 Max-Q | Gigabyte Aero 15-X9 i7-8750H, GeForce RTX 2070 Max-Q | Average of class Gaming | |
|---|---|---|---|---|---|---|---|---|
| Noise | 4% | 2% | 0% | -10% | 11% | -0% | 9% | |
| off / environment * (dB) | 30 | 28.3 6% | 29 3% | 30.5 -2% | 28.2 6% | 28.3 6% | 30 -0% | 24.1 ? 20% |
| Idle Minimum * (dB) | 30 | 30.4 -1% | 30 -0% | 32.8 -9% | 30.3 -1% | 28.8 4% | 32 -7% | 25.9 ? 14% |
| Idle Average * (dB) | 31 | 30.5 2% | 32 -3% | 32.8 -6% | 35.4 -14% | 28.8 7% | 34 -10% | 27.4 ? 12% |
| Idle Maximum * (dB) | 34 | 30.6 10% | 34 -0% | 32.8 4% | 50.3 -48% | 29 15% | 36 -6% | 30.1 ? 11% |
| Load Average * (dB) | 47 | 37.6 20% | 44 6% | 42.5 10% | 50.3 -7% | 33.5 29% | 42 11% | 43.7 ? 7% |
| Witcher 3 ultra * (dB) | 48 | 46 4% | 46 4% | 50.2 -5% | 45 6% | 44 8% | ||
| Load Maximum * (dB) | 49 | 55.1 -12% | 47 4% | 47.5 3% | 50.2 -2% | 45.2 8% | 48 2% | 54.3 ? -11% |
* ... smaller is better
Temperature
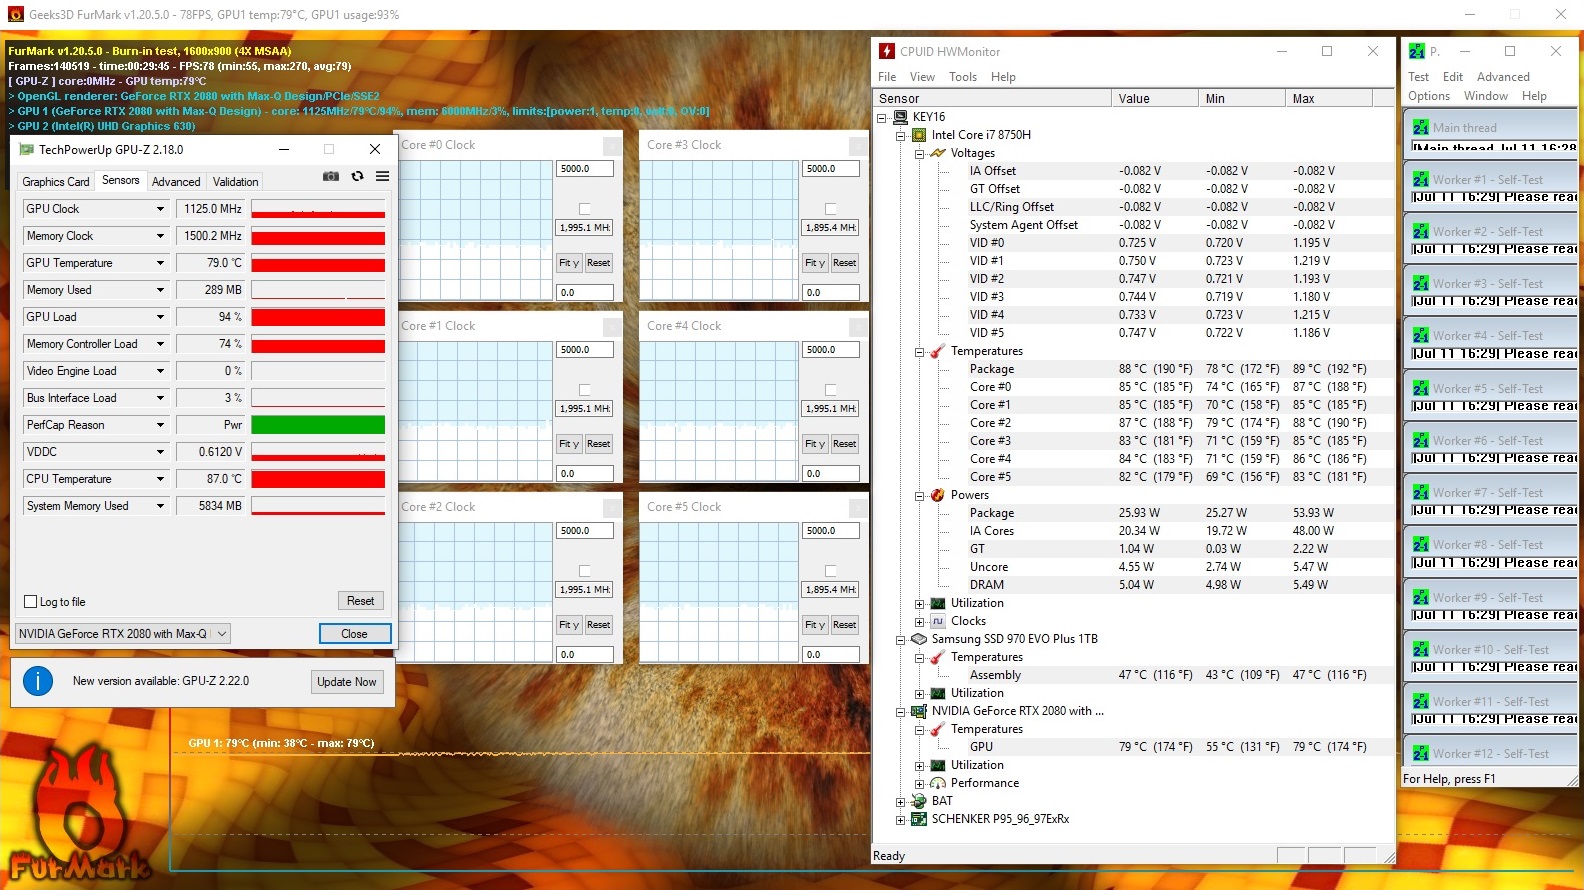
The Key 16 runs through our stress test (Prime95 and FurMark run for at least one hour) in different ways in mains and battery operation. In mains operation, the processor runs at 1.9 to 2 GHz and the graphics core at 1125 MHz. In battery operation, the clock speeds are at 800 MHz (CPU) and 1200 to 1300 MHz (GPU). The stress test represents an extreme scenario which does not occur in everyday operation. We use this test to evaluate whether the system remains stable even under full load.
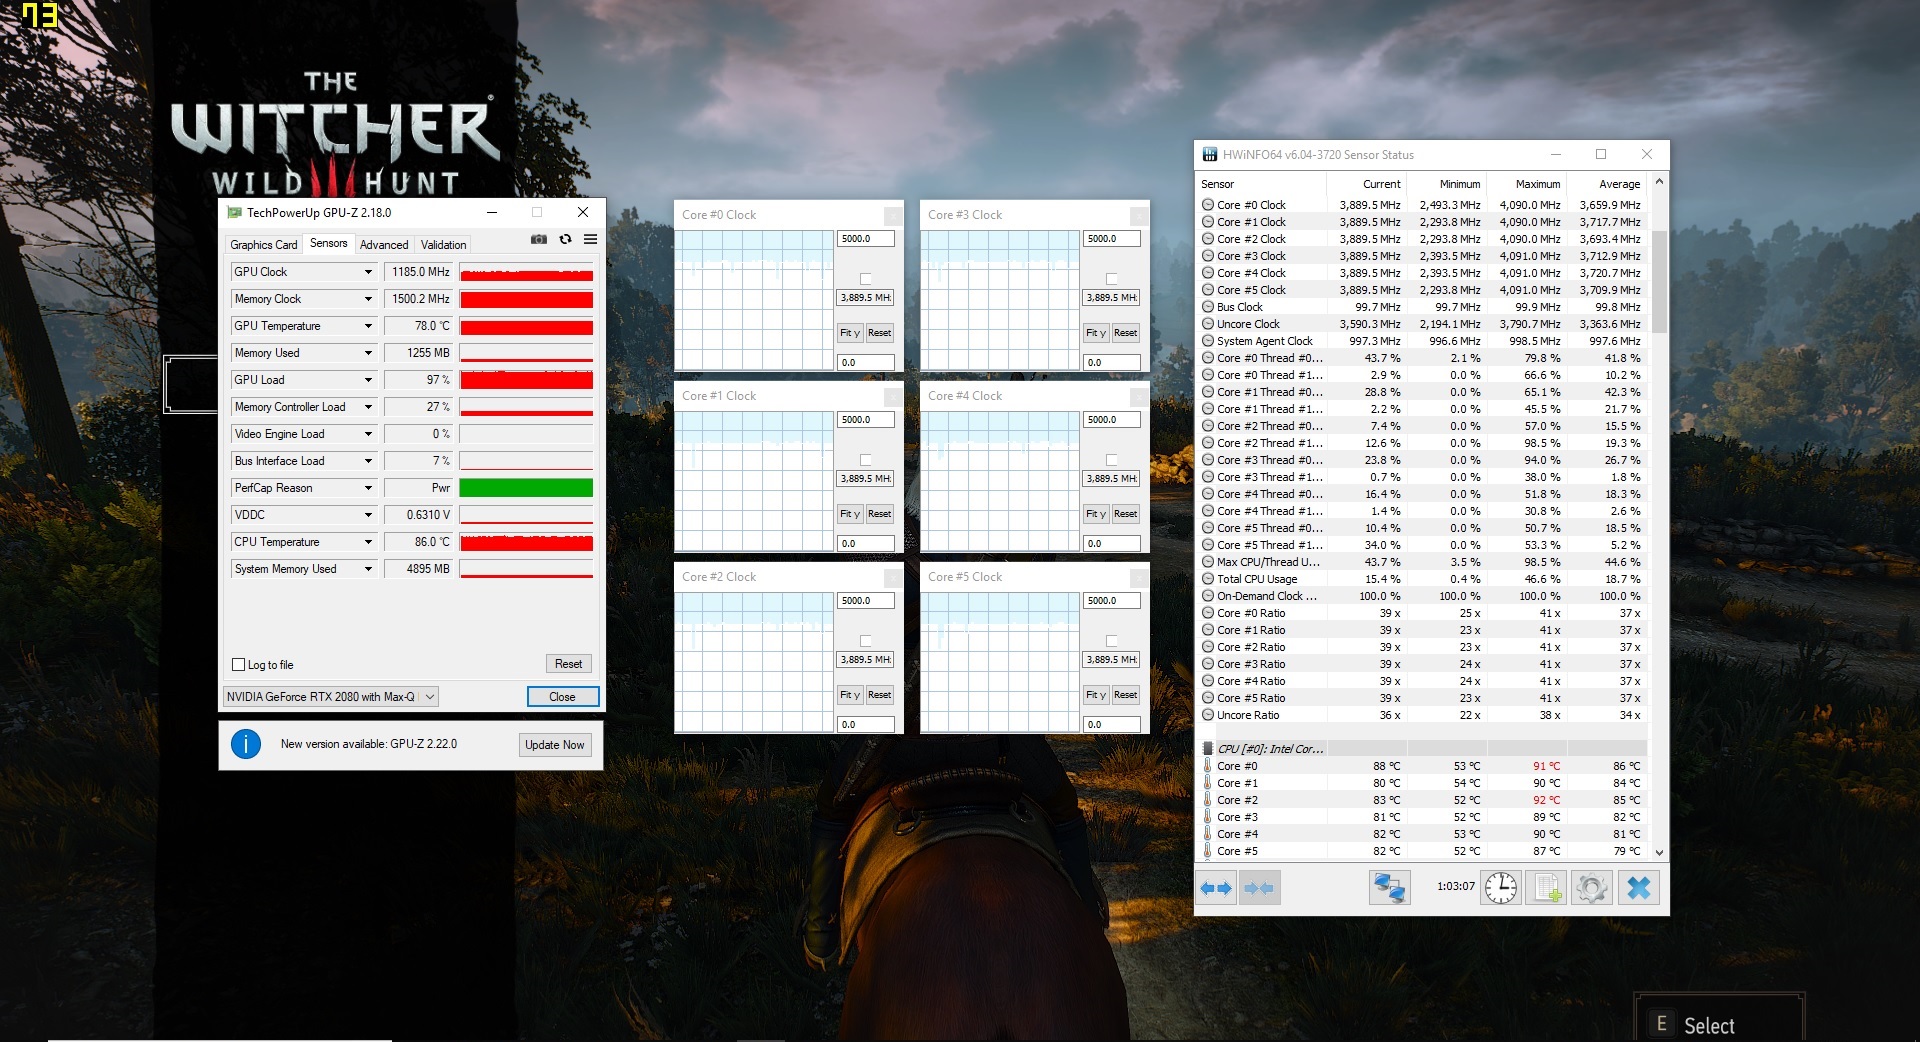
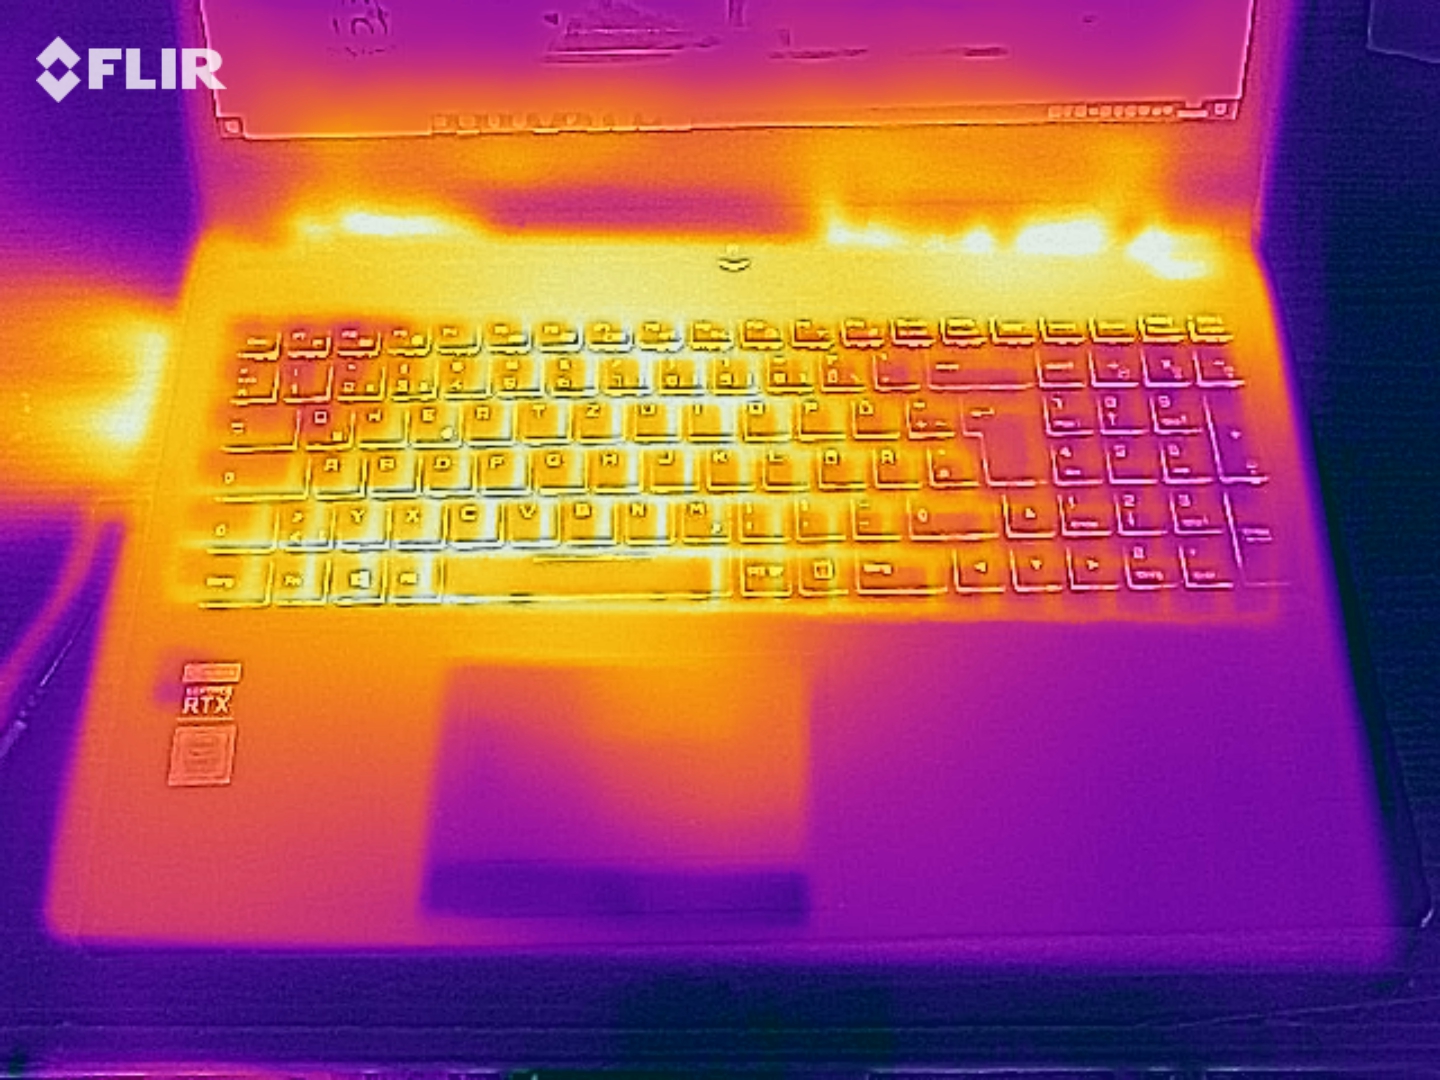
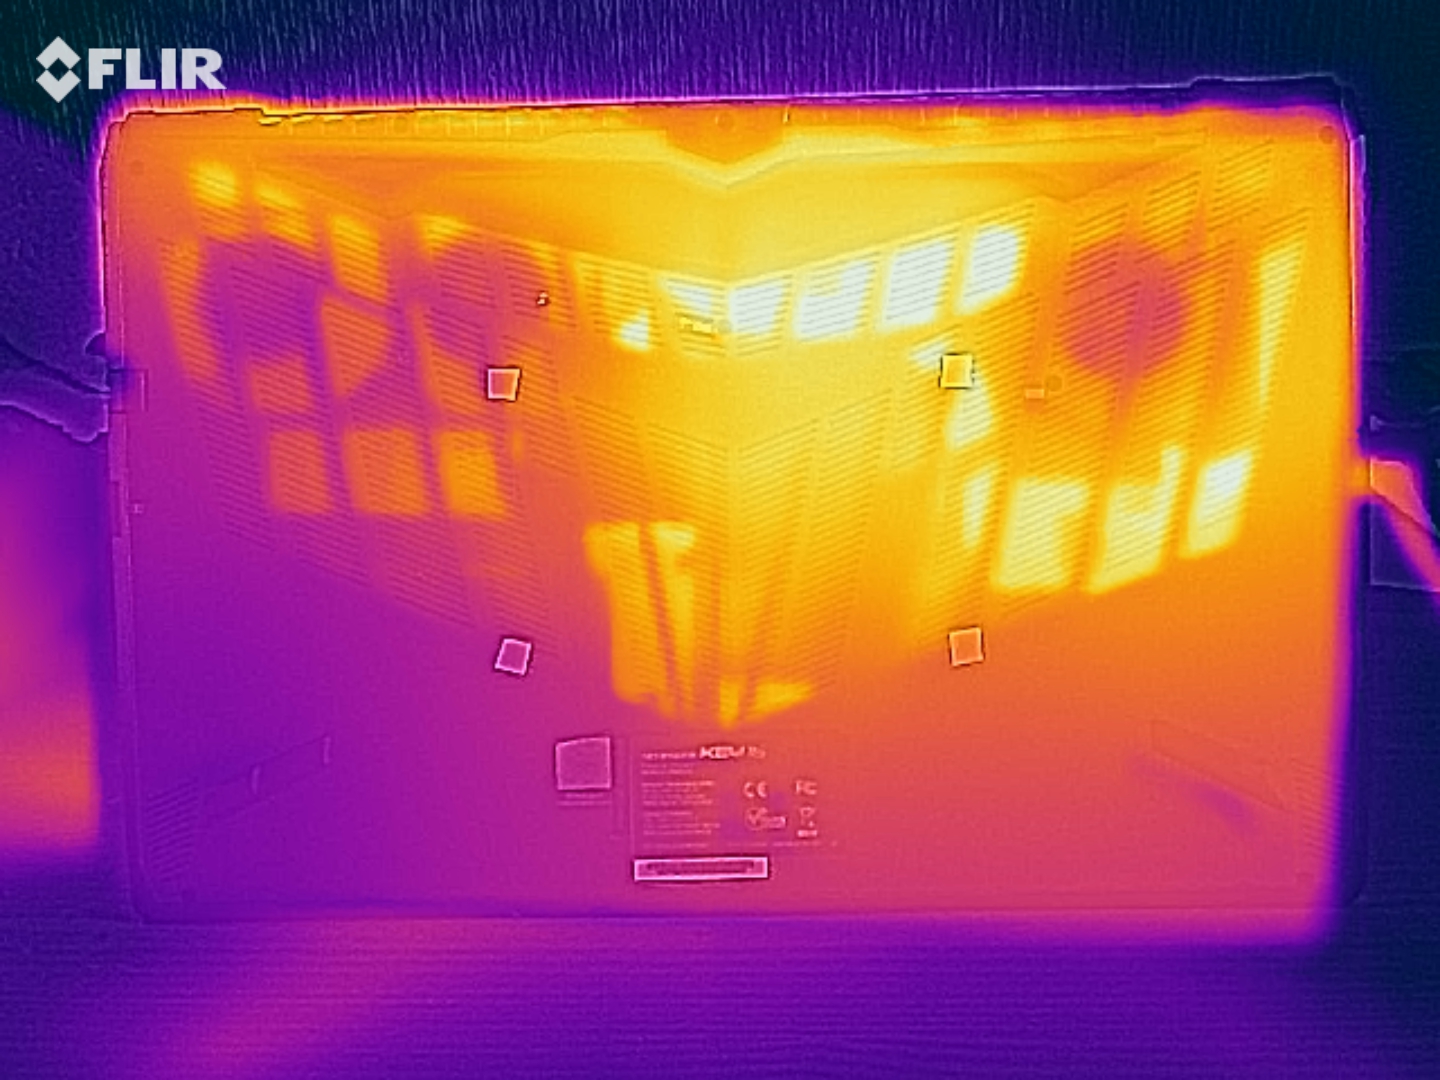
Schenker's 16.1-incher warms up quite significantly under load. At several measurement points, we register temperatures beyond the 50-degree Celsius mark (122 °F). While running our "The Witcher 3" test (the game runs for one hour in Full-HD resolution and maximum quality settings), the heat development turns out only slightly less. With this, you would not be able to place the device on your lap. During everyday operation, the temperatures remain within an acceptable range.
(-) The maximum temperature on the upper side is 51 °C / 124 F, compared to the average of 40.4 °C / 105 F, ranging from 21.2 to 68.8 °C for the class Gaming.
(-) The bottom heats up to a maximum of 59 °C / 138 F, compared to the average of 43.2 °C / 110 F
(+) In idle usage, the average temperature for the upper side is 30.4 °C / 87 F, compared to the device average of 33.9 °C / 93 F.
(-) Playing The Witcher 3, the average temperature for the upper side is 43.9 °C / 111 F, compared to the device average of 33.9 °C / 93 F.
(-) The palmrests and touchpad can get very hot to the touch with a maximum of 44 °C / 111.2 F.
(-) The average temperature of the palmrest area of similar devices was 28.8 °C / 83.8 F (-15.2 °C / -27.4 F).
| Schenker Key 16 i7-8750H, GeForce RTX 2080 Max-Q | MSI GS65 Stealth 9SG i7-9750H, GeForce RTX 2080 Max-Q | Acer Predator Triton 500 i7-8750H, GeForce RTX 2080 Max-Q | HP Omen 15-dc1303ng i7-8750H, GeForce RTX 2070 Max-Q | Alienware m15 P79F i7-8750H, GeForce RTX 2070 Max-Q | Razer Blade 15 RTX 2080 Max-Q i7-9750H, GeForce RTX 2080 Max-Q | Gigabyte Aero 15-X9 i7-8750H, GeForce RTX 2070 Max-Q | Average of class Gaming | |
|---|---|---|---|---|---|---|---|---|
| Heat | 10% | 3% | -0% | -7% | 12% | 5% | 10% | |
| Maximum Upper Side * (°C) | 51 | 45.6 11% | 49 4% | 47.6 7% | 55.6 -9% | 47 8% | 56 -10% | 45.1 ? 12% |
| Maximum Bottom * (°C) | 59 | 53.8 9% | 58 2% | 59.6 -1% | 62.4 -6% | 49.2 17% | 66 -12% | 48.1 ? 18% |
| Idle Upper Side * (°C) | 32 | 28.6 11% | 33 -3% | 33.8 -6% | 36 -13% | 28.6 11% | 27 16% | 31 ? 3% |
| Idle Bottom * (°C) | 36 | 33.2 8% | 33 8% | 36.5 -1% | 36 -0% | 31.4 13% | 27 25% | 34.2 ? 5% |
* ... smaller is better
Speakers
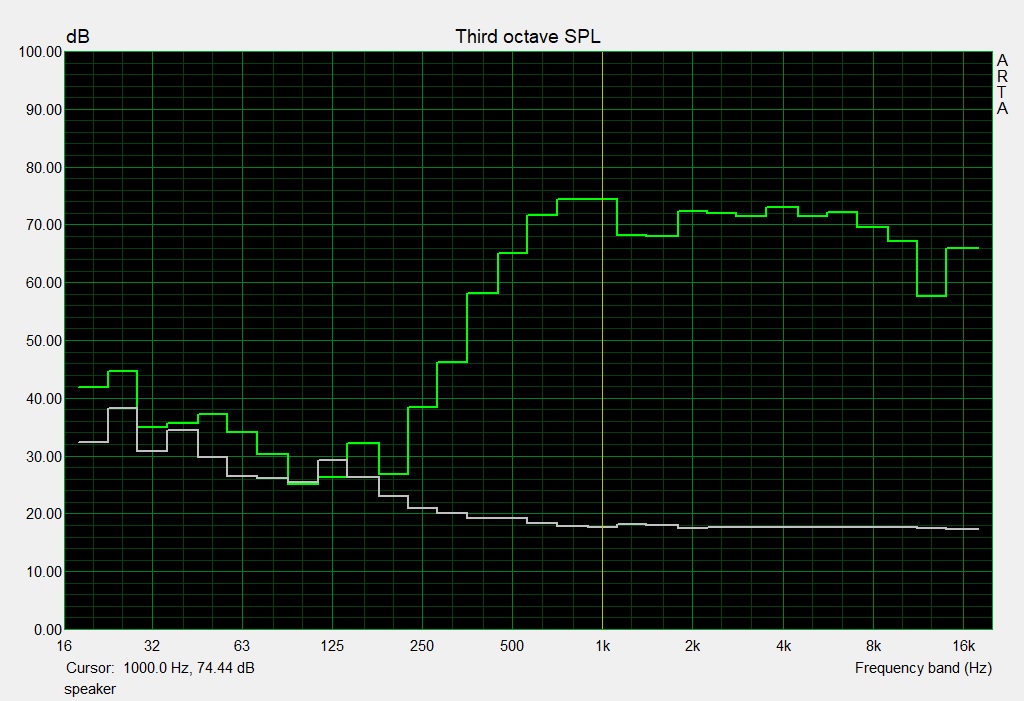
The stereo speakers are placed at the front edge of the case bottom. They produce a rather mediocre sound that lacks bass to a large extent. For a better sound experience, you have to use headphones or external speakers.
Schenker Key 16 audio analysis
(+) | speakers can play relatively loud (83 dB)
Bass 100 - 315 Hz
(-) | nearly no bass - on average 35.5% lower than median
(±) | linearity of bass is average (12.3% delta to prev. frequency)
Mids 400 - 2000 Hz
(+) | balanced mids - only 4.2% away from median
(±) | linearity of mids is average (9.7% delta to prev. frequency)
Highs 2 - 16 kHz
(+) | balanced highs - only 3.2% away from median
(+) | highs are linear (2.6% delta to prev. frequency)
Overall 100 - 16.000 Hz
(±) | linearity of overall sound is average (24.5% difference to median)
Compared to same class
» 88% of all tested devices in this class were better, 4% similar, 8% worse
» The best had a delta of 6%, average was 18%, worst was 132%
Compared to all devices tested
» 74% of all tested devices were better, 6% similar, 20% worse
» The best had a delta of 4%, average was 23%, worst was 134%
Schenker Key 15 Coffee Lake audio analysis
(±) | speaker loudness is average but good (76 dB)
Bass 100 - 315 Hz
(-) | nearly no bass - on average 26.7% lower than median
(±) | linearity of bass is average (10.8% delta to prev. frequency)
Mids 400 - 2000 Hz
(±) | higher mids - on average 5.7% higher than median
(±) | linearity of mids is average (9.6% delta to prev. frequency)
Highs 2 - 16 kHz
(+) | balanced highs - only 1.4% away from median
(+) | highs are linear (3.8% delta to prev. frequency)
Overall 100 - 16.000 Hz
(±) | linearity of overall sound is average (24.6% difference to median)
Compared to same class
» 89% of all tested devices in this class were better, 4% similar, 8% worse
» The best had a delta of 6%, average was 18%, worst was 132%
Compared to all devices tested
» 75% of all tested devices were better, 5% similar, 20% worse
» The best had a delta of 4%, average was 23%, worst was 134%
Power Management - Nothing unusual
Power Consumption
The Schenker notebook does not show any unusual behavior in terms of its power consumption. During idle operation, we measure a maximum power consumption of 22 watts, which is a normal value for the hardware platform used here. During our stress test, the value increases up to 191 watts, but during gaming operation, the value turns out lower. While running our "The Witcher 3" test, we measure a consumption of about 145 watts. The power supply is rated at 180 watts.
| Off / Standby | |
| Idle | |
| Load |
|
Key:
min: | |
| Schenker Key 16 i7-8750H, GeForce RTX 2080 Max-Q | MSI GS65 Stealth 9SG i7-9750H, GeForce RTX 2080 Max-Q | Acer Predator Triton 500 i7-8750H, GeForce RTX 2080 Max-Q | HP Omen 15-dc1303ng i7-8750H, GeForce RTX 2070 Max-Q | Alienware m15 P79F i7-8750H, GeForce RTX 2070 Max-Q | Razer Blade 15 RTX 2080 Max-Q i7-9750H, GeForce RTX 2080 Max-Q | Gigabyte Aero 15-X9 i7-8750H, GeForce RTX 2070 Max-Q | Average of class Gaming | |
|---|---|---|---|---|---|---|---|---|
| Power Consumption | -30% | -24% | -8% | -3% | -8% | -9% | -26% | |
| Idle Minimum * (Watt) | 10 | 18.3 -83% | 16 -60% | 14.7 -47% | 10.9 -9% | 12.5 -25% | 16 -60% | 13.1 ? -31% |
| Idle Average * (Watt) | 15 | 22 -47% | 22 -47% | 18.6 -24% | 12.3 18% | 15.3 -2% | 18 -20% | 19 ? -27% |
| Idle Maximum * (Watt) | 22 | 28.8 -31% | 32 -45% | 22.6 -3% | 19 14% | 20.7 6% | 23 -5% | 24.6 ? -12% |
| Load Average * (Watt) | 88 | 93 -6% | 89 -1% | 90 -2% | 96 -9% | 90.2 -3% | 88 -0% | 111.3 ? -26% |
| Witcher 3 ultra * (Watt) | 145 | 142.6 2% | 147 -1% | 161.7 -12% | 162 -12% | 120 17% | ||
| Load Maximum * (Watt) | 191 | 215.9 -13% | 173 9% | 120 37% | 229.1 -20% | 209.3 -10% | 167 13% | 260 ? -36% |
* ... smaller is better
Battery Life
In our realistic WLAN test, the Key 16 achieves a runtime of 5:29 h. Using a script, we simulate the load when loading websites. The Balanced power profile is active and the display brightness is adjusted to about 150 cd/m². The 16.1-inch notebook lasts for 5:58 h in our video test, where we run the short film Big Buck Bunny (H.264 coding, 1920x1080 pixels) in a constant loop. The Power Saving mode is active, the Wi-Fi module is deactivated, and the display brightness lowered to 150 cd/m².
| Schenker Key 16 i7-8750H, GeForce RTX 2080 Max-Q, 62 Wh | MSI GS65 Stealth 9SG i7-9750H, GeForce RTX 2080 Max-Q, 82 Wh | Acer Predator Triton 500 i7-8750H, GeForce RTX 2080 Max-Q, 82 Wh | HP Omen 15-dc1303ng i7-8750H, GeForce RTX 2070 Max-Q, 70 Wh | Alienware m15 P79F i7-8750H, GeForce RTX 2070 Max-Q, 90 Wh | Razer Blade 15 RTX 2080 Max-Q i7-9750H, GeForce RTX 2080 Max-Q, 80 Wh | Gigabyte Aero 15-X9 i7-8750H, GeForce RTX 2070 Max-Q, 94.24 Wh | Average of class Gaming | |
|---|---|---|---|---|---|---|---|---|
| Battery runtime | 9% | -23% | -30% | -5% | 41% | 39% | 18% | |
| Reader / Idle (h) | 9.8 | 5.6 -43% | 5 -49% | 15.9 62% | 9.2 -6% | 7.84 ? -20% | ||
| H.264 (h) | 6 | 6.1 2% | 8.27 ? 38% | |||||
| WiFi v1.3 (h) | 5.5 | 6 9% | 3.2 -42% | 3.3 -40% | 5.2 -5% | 6.6 20% | 6.4 16% | 7.08 ? 29% |
| Load (h) | 1.2 | 1.4 17% | 1.2 0% | 1.7 42% | 2.9 142% | 1.496 ? 25% |
Pros
Cons
Verdict
With the Key 16, Schenker is offering a slim gaming notebook that is able to score with an elegant metal case. Even though a display with a diagonal of 16.1-inch is used, the notebook is overall hardly any larger than the usual 15.6-inch devices.
The built-in combination of a Core i7-8750H processor and GeForce RTX 2080 Max-Q graphics core is able to bring all the current computer games to the matte Full-HD screen. You can always use high to maximum quality settings.
Schenker has stuffed a lot of computing power into an elegant, slim case.
A fast NVMe SSD ensures a fast and smoothly running system. There is also a slot for a second M.2 SSD (NVMe or SATA). If you use two NVMe SSDs, they can be joined in a RAID configuration (0 or 1). In addition, you can also add a 2.5-inch storage drive. Any upgrade or maintenance tasks require opening the case, which turns out to be fairly complicated.
The 144-Hz IPS display is able to score with short response times, stable viewing angles, a good contrast, and great color reproduction. However, the brightness of the display could have been better. For using it indoors, the brightness is sufficient.
While the battery life does not inspire much enthusiasm, it is okay for a notebook of this performance class. The chiclet keyboard (RGB illumination) has proven itself suitable for everyday tasks. This is accompanied by a well-rounded amount of connections. We miss a Thunderbolt-3 connection, however.
Schenker Key 16
- 09/20/2019 v7 (old)
Sascha Mölck
Price comparison

