Notebook reviews with NVIDIA GeForce RTX 2080 Mobile graphics card
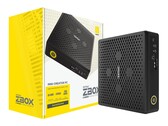
Zotac ZBOX Magnus mini PC with GeForce RTX 2080 in review
As a barebone system, Zotac is following the same path with the ZBOX as Intel did with its Ghost Canyon NUC. We took a closer look at the ZBOX Magnus with the GeForce RTX 2080 GPU and were positively surprised. You can find out what the mini PC is capable of in our detailed review.
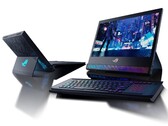
Intel Core i7-9750H, NVIDIA GeForce RTX 2080 MobileAsus ROG Mothership GZ700GX Laptop Review: Out of this world
Due to its particularly innovative products, Asus has often been the center of attention in the past. Now, with the ROG GZ700 and after the watercooled ROG GX700, comes one more unusual gaming laptop. The 17-inch device sets itself apart with a convertible design. However, the price leaves us speechless.
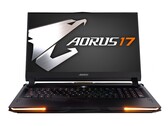
Intel Core i9-9980HK, NVIDIA GeForce RTX 2080 Mobile, 17.3", 4.8 kgAorus 17 YA Gaming Laptop Review: Extreme performance, extreme noise
It is large, it is loud, and it is heavy. Surely the Aorus 17 is not meant for those who like delicate laptops that operate silently. Instead, it offers a lot of performance for gaming fans, and is targeted towards all those who are not afraid of massive notebooks. We find out in our test, what exactly the new Aorus 17 YA has to offer.
Intel Core i9-9980HK, NVIDIA GeForce RTX 2080 Mobile, 17.3", 3.8 kgMSI GE63 Raider 8SG Laptop Review: GeForce RTX 2080 for Cheap
It may not have the sexy narrow bezels of the latest laptops, but the GE63 still comes equipped with one of the fastest Nvidia GPUs available and an ultra-smooth 144 Hz display with almost no ghosting.
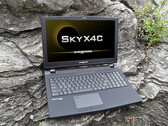
Intel Core i7-8750H, NVIDIA GeForce RTX 2080 Mobile, 15.6", 2.6 kgEurocom Sky X4C Core i9-9900KS Laptop Review: Unlocked Desktop Processor in a Mobile Form Factor
The three-year old Clevo P751DM2 chassis is beginning to show its age. While the system can handle Intel's latest Core i9 CPU, it can't fully exploit the high Turbo Boost potential of the processor without running at temperatures well beyond 90 C.
Intel Core i9-9900KS, NVIDIA GeForce RTX 2080 Mobile, 15.6", 3.6 kgAsus ROG G703GXR: Intel Core i7-9750H, 17.30", 4.7 kg
Review » ASUS ROG G703GXR Laptop Review: A high-end old-school gamer
Acer Predator Helios 700 PH717-71-785M: Intel Core i7-9750H, 17.30", 4.8 kg
Review » Acer Predator Helios 700 Laptop Review: Innovative gaming laptop with a lot of features
HP Omen 17-cb0020ng: Intel Core i9-9880H, 17.30", 3.3 kg
Review » HP Omen 17 Laptop Review: High-end gaming with some small limitations
MSI GT76 Titan DT 9SG: Intel Core i9-9900K, 17.30", 4.2 kg
Review » MSI GT76 9SG Laptop Review: The Titan of Gaming Laptops
MSI GE75 9SG: Intel Core i9-9880H, 17.30", 2.7 kg
Review » MSI GE75 Raider 9SG (Core i9-9880H, RTX 2080) Laptop Review
MSI GE75 8SG Raider: Intel Core i7-8750H, 17.30", 2.6 kg
Review » MSI GE75 8SG Raider (i7-8750H, RTX 2080) Laptop Review
Alienware Area-51m i9-9900K RTX 2080: Intel Core i9-9900K, 17.30", 3.9 kg
Review » Alienware Area-51m (i9-9900K, RTX 2080) Laptop Review
Eurocom Sky X7C i9-9900K: Intel Core i9-9900K, 17.30", 4.3 kg
Review » Eurocom Sky X7C (i9-9900K, RTX 2080, FHD 144 Hz) Clevo P775TM1-G Laptop Review
Schenker XMG Ultra 17 Turing: Intel Core i9-9900K, 17.30", 4.3 kg
Review » Schenker XMG Ultra 17 (Core i9-9900K, RTX 2080) Clevo P775TM1-G Laptop Review
Asus ROG G703GX: Intel Core i7-8750H, 17.30", 4.7 kg
Review » Asus ROG G703GX (i7-8750H, RTX 2080) Laptop Review
Gigabyte Aero 17 HDR: Intel Core i9-9980HK, 17.30", 2.5 kg
External Review » Gigabyte Aero 17 HDR
HP Omen 15-dh0008ns: Intel Core i9-9880H, 15.60", 2.6 kg
External Review » HP Omen 15-dh0008ns
HP Omen X 15-dg0370ng: Intel Core i9-9980HK, 15.60", 2.5 kg
External Review » HP Omen X 15-dg0370ng
HP Omen X 2S 15-dg0830no: Intel Core i7-9750H, 15.60", 2.5 kg
External Review » HP Omen X 2S 15-dg0830no
Acer Predator Helios 700 PH717-71-785M: Intel Core i7-9750H, 17.30", 4.8 kg
External Review » Acer Predator Helios 700 PH717-71-785M
Asus ROG Mothership GZ700GX: Intel Core i9-9980HK, 17.30", 4.8 kg
External Review » Asus ROG Mothership GZ700GX
Alienware m17 R2-WNm17R240s: Intel Core i7-9750H, 15.60", 2.6 kg
External Review » Alienware m17 R2-WNm17R240s
Alienware m15 R2, i9-9980HK, RTX 2080: Intel Core i9-9980HK, 15.60", 2.2 kg
External Review » Alienware m15 R2, i9-9980HK, RTX 2080
MSI GS75 Stealth-479: Intel Core i9-9880H, 17.30", 2.3 kg
External Review » MSI GS75 Stealth-479
HP Omen 17-CB0006UR: Intel Core i7-9750H, 17.30", 3.3 kg
External Review » HP Omen 17-CB0006UR
Acer ConceptD 7 CN715-71-73A9: Intel Core i7-9750H, 15.60", 2.1 kg
External Review » Acer ConceptD 7 CN715-71-73A9
Aorus 17-YA-9DE2452SH: Intel Core i9-9980HK, 17.30", 3.8 kg
External Review » Aorus 17-YA-9DE2452SH
Acer Predator Helios 700 PH717-71-92A7: Intel Core i9-9980HK, 17.30", 4.5 kg
External Review » Acer Predator Helios 700 PH717-71-92A7
MSI GT75 Titan 8SG-051: Intel Core i9-8950HK, 17.30", 4.6 kg
External Review » MSI GT75 Titan 8SG-051
Asus ROG Mothership GZ700GX-AD032R: Intel Core i9-9980HK, 17.30", 4.7 kg
External Review » Asus ROG Mothership GZ700GX-AD032R
Acer Predator Triton 900 PT917-71-969C: Intel Core i9-9980HK, 17.30", 4.4 kg
External Review » Acer Predator Triton 900 PT917-71-969C
Asus ROG Chimera G703GXR-EV003T: Intel Core i7-9750H, 17.30", 4.7 kg
External Review » Asus ROG Chimera G703GXR-EV003T
Acer Predator Triton 900 PT917-71-93MW: Intel Core i7-9750H, 17.30", 4.5 kg
External Review » Acer Predator Triton 900 PT917-71-93MW
MSI GE75 9SG: Intel Core i9-9880H, 17.30", 2.7 kg
External Review » MSI GE75 9SG
HP Omen X 2S 15: Intel Core i7-9750H, 15.60", 2.4 kg
External Review » HP Omen X 2S 15
Origin PC Eon17-X 2019: Intel Core i9-9900K, 17.30", 3.9 kg
External Review » Origin PC Eon17-X 2019
Acer Predator Triton 900 PT917-71-71C: Intel Core i7-9750H, 17.30", 4.4 kg
External Review » Acer Predator Triton 900 PT917-71-71C
Acer Predator Triton 900 PT917-71-79PF: Intel Core i7-9750H, 17.30", 4.1 kg
External Review » Acer Predator Triton 900 PT917-71-79PF
Acer Predator Helios 700 PH717-71-95Q9: Intel Core i9-9980HK, 17.30", 4.5 kg
External Review » Acer Predator Helios 700 PH717-71-95Q9
MSI GE75 Raider 9SG-417: Intel Core i7-9750H, 17.30", 2.6 kg
External Review » MSI GE75 Raider 9SG-417
Asus ROG GRIFFIN GZ755GX-E5028T: Intel Core i9-8950HK, 17.30", 4.7 kg
External Review » Asus ROG GRIFFIN GZ755GX-E5028T
Asus G703GX-XB96K: Intel Core i9-9980HK, 17.30", 4.7 kg
External Review » Asus G703GX-XB96K
MSI GT76 Titan DT 9SG: Intel Core i9-9900K, 17.30", 4.2 kg
External Review » MSI GT76 Titan DT 9SG
Schenker XMG Ultra 17 Turing: Intel Core i9-9900K, 17.30", 4.3 kg
External Review » Schenker XMG Ultra 17 Turing
Acer Predator Triton 900 PT917-71-76VT: Intel Core i7-9750H, 17.30", 4.4 kg
External Review » Acer Predator Triton 900 PT917-71-76VT
Acer ConceptD 9: Intel Core i9-9980HK, 17.30", 4.1 kg
External Review » Acer ConceptD 9
Acer Predator Helios 700 (i9-9980HK, RTX 2080): Intel Core i9-9980HK, 17.30", 4.5 kg
External Review » Acer Predator Helios 700 (i9-9980HK, RTX 2080)
Asus ROG Chimera G703GX-E5006T: Intel Core i9-8950HK, 17.30", 4.7 kg
External Review » Asus ROG Chimera G703GX-E5006T
MSI GS75 Stealth 8SG-054NE: Intel Core i7-8750H, 17.30", 2.3 kg
External Review » MSI GS75 Stealth 8SG-054NE
Acer Predator Triton 500 PT515-51-73UX: Intel Core i7-8750H, 15.60", 2 kg
External Review » Acer Predator Triton 500 PT515-51-73UX
MSI GE75 8SG-042 Raider: Intel Core i7-8750H, 17.30", 2.7 kg
External Review » MSI GE75 8SG-042 Raider
MSI GS75 8SG-064ES: Intel Core i7-8750H, 17.30", 2.3 kg
External Review » MSI GS75 8SG-064ES
MSI GT75 8SG-035: Intel Core i9-8950HK, 17.30", 4.6 kg
External Review » MSI GT75 8SG-035
Asus ROG G703GX: Intel Core i7-8750H, 17.30", 4.7 kg
External Review » Asus ROG G703GX
Alienware Area-51m i9-9900K RTX 2080: Intel Core i9-9900K, 17.30", 3.9 kg
External Review » Alienware Area-51m, i9-9900K, RTX 2080