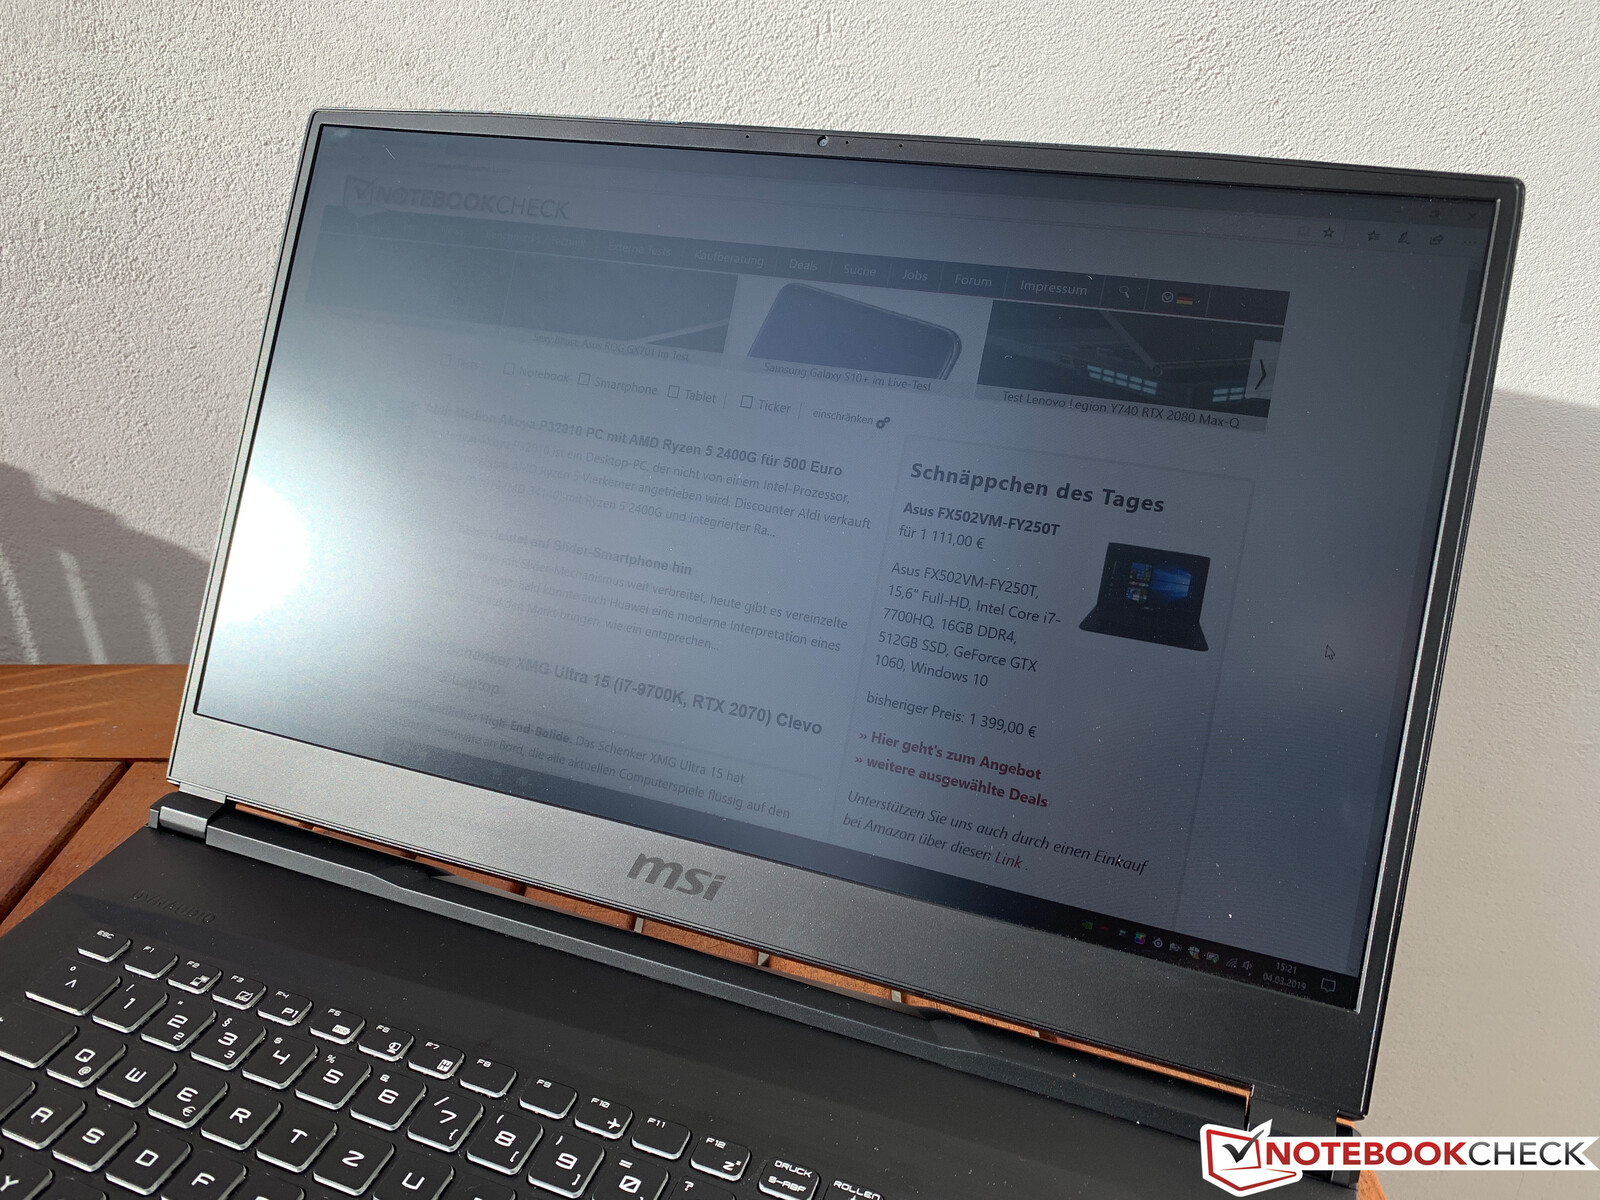
MSI GE75 8SG Raider (i7-8750H, RTX 2080) Laptop Review
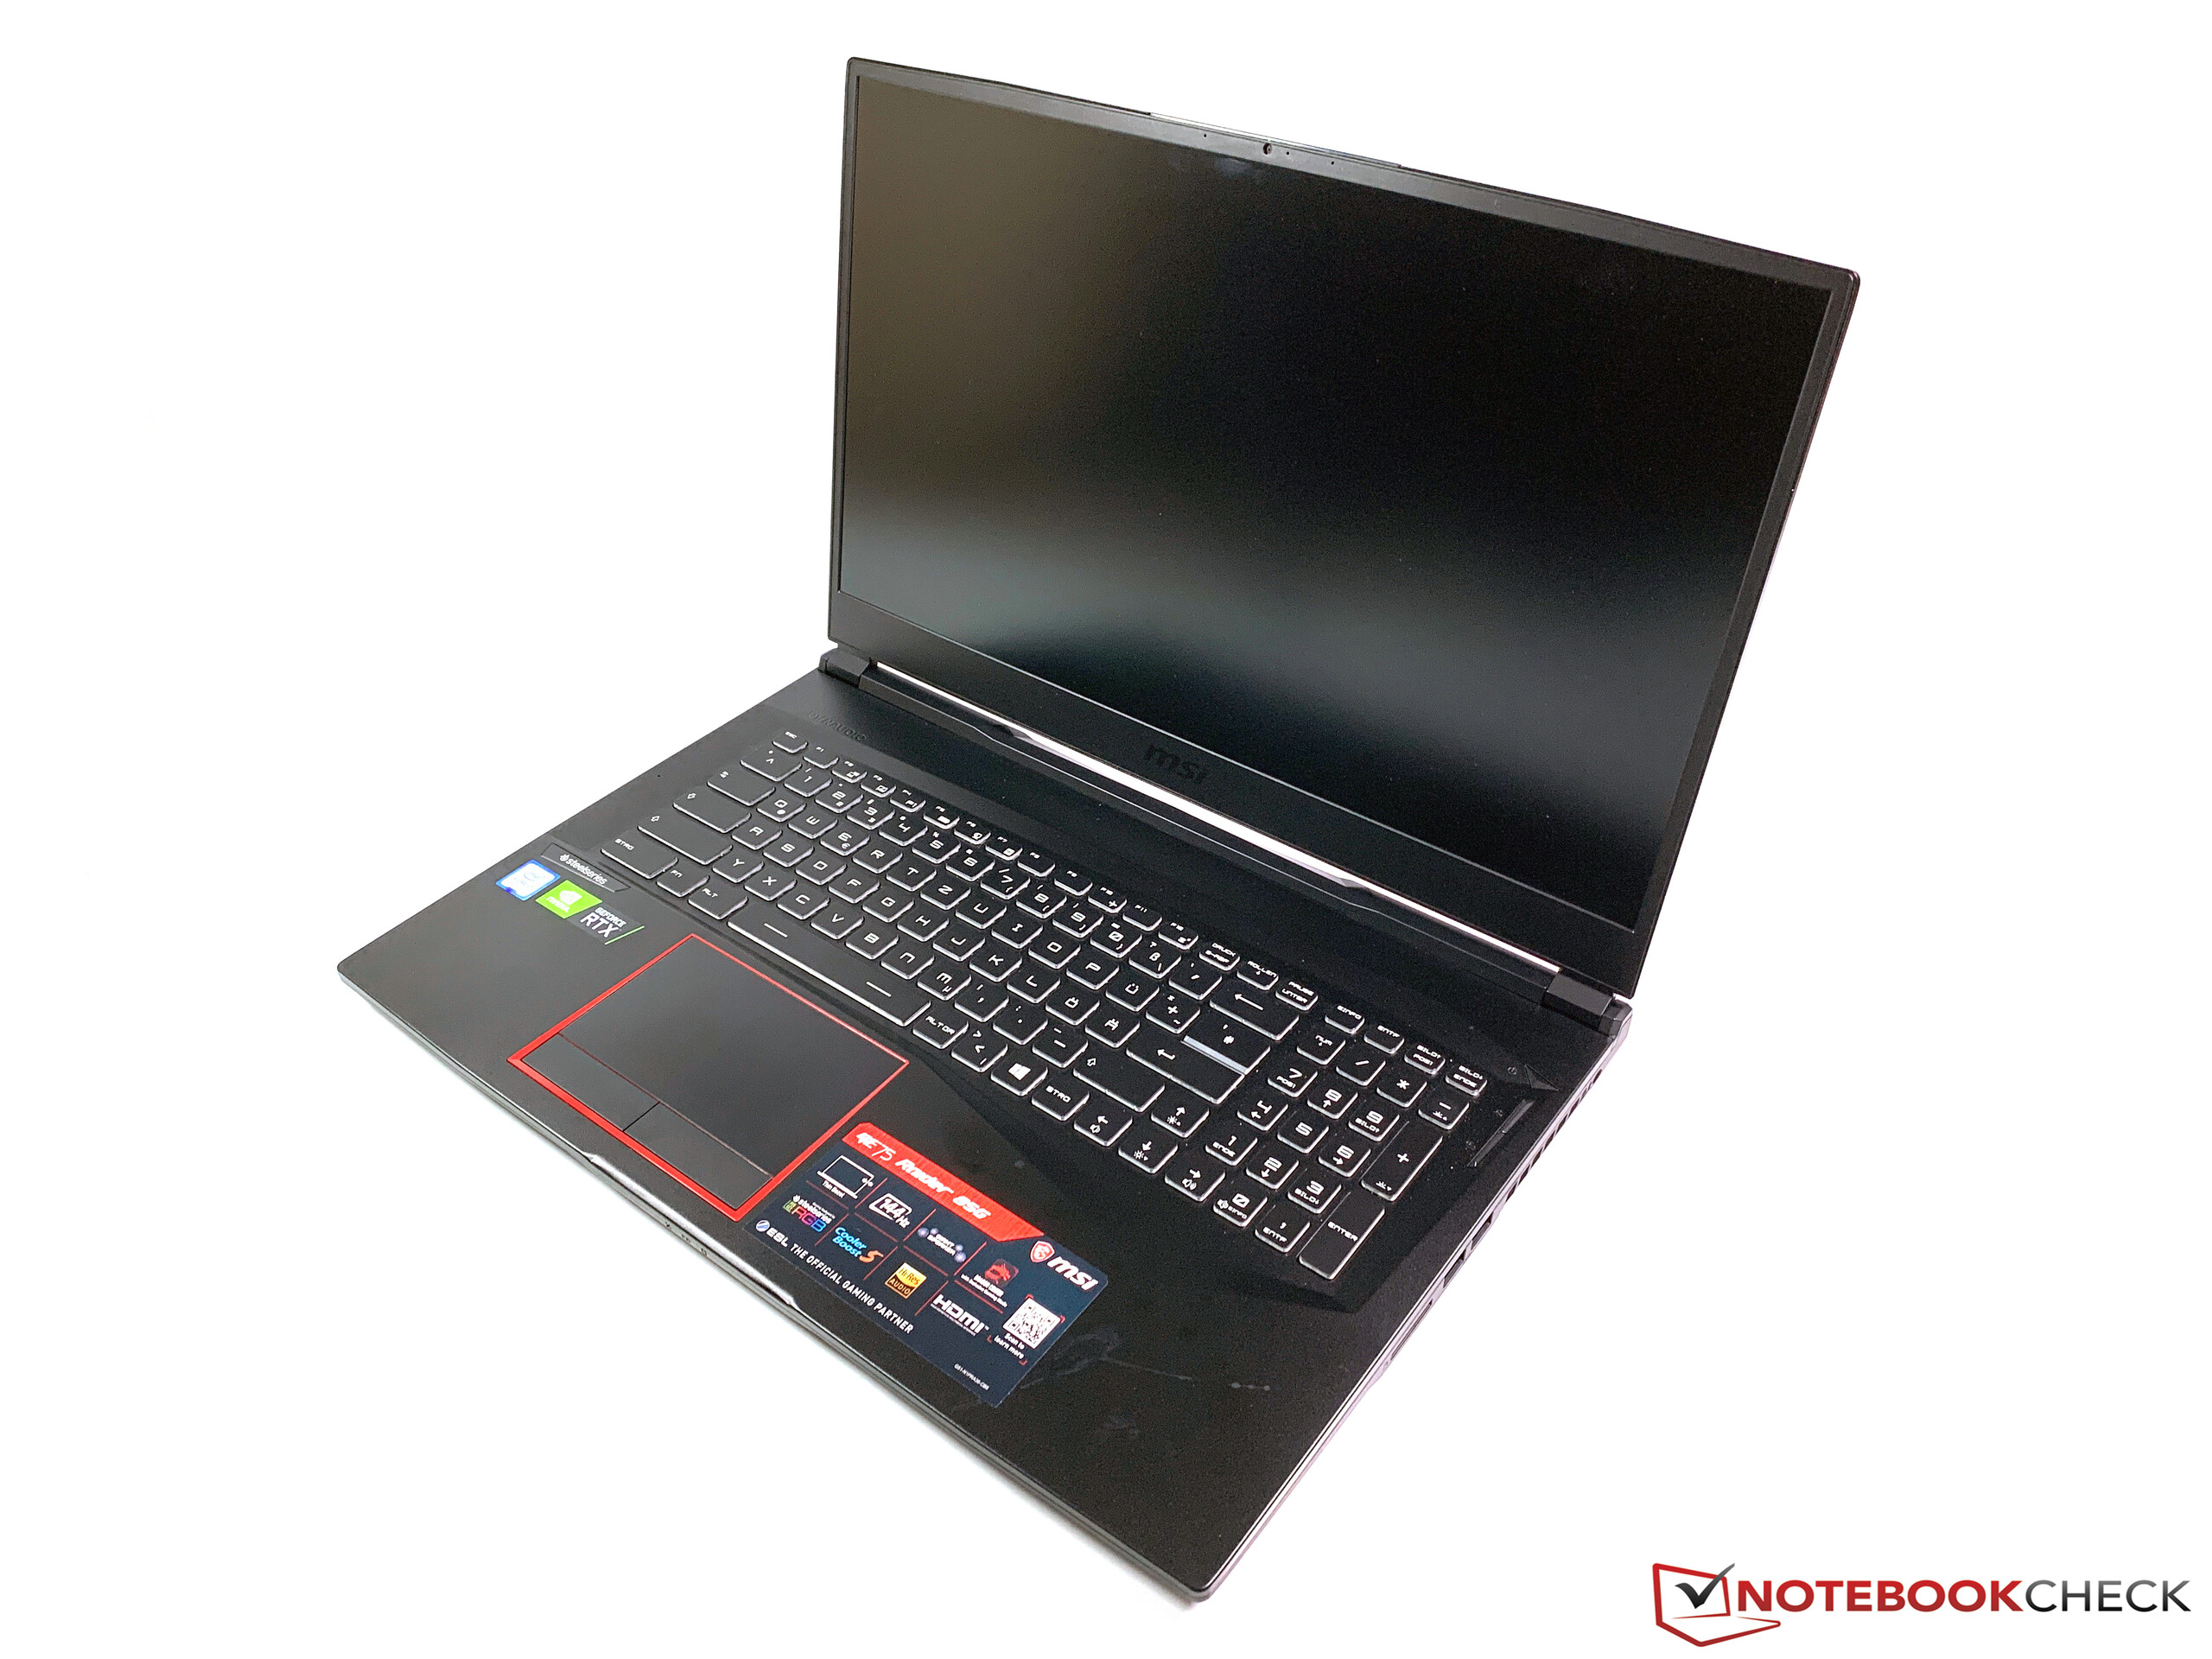
MSI's GE75 Raider is a gaming laptop with a 17.3-inch screen and follows the trend towards a slim-bezel design, so the device is comparatively compact. Compared to the original SKU with a GeForce GTX 1070, the system is now available with the faster RTX 2080 GPU, which promises a healthy performance advantage. It is interesting that MSI waives the Max-Q versions of the new GPUs, despite the slim construction. Those chips are reserved for the upcoming GS series (GS75/65). We already had a look at the U.S. spec of the GE75 Raider with the RTX 2070, and now we review the more expensive 8SG SKU for around 3000 Euros.
There is no shortage of compact 17.3-inch rivals right now, but many models use less powerful GPUs. Among others, we will compare the MSI GE75 Raider with the Asus Zephyrus S GX701GX and the Lenovo Legion Y740-17, which are equipped with the slower RTX 2080 Max-Q. Another rival is the Asus ROG Strix Scar II GL704W with the RTX 2070. We will use "bigger" gaming laptops like the Eurocom Sky X7C and Schenker XMG Ultra 17 to see if the RTX 2080 can utilize its full potential.
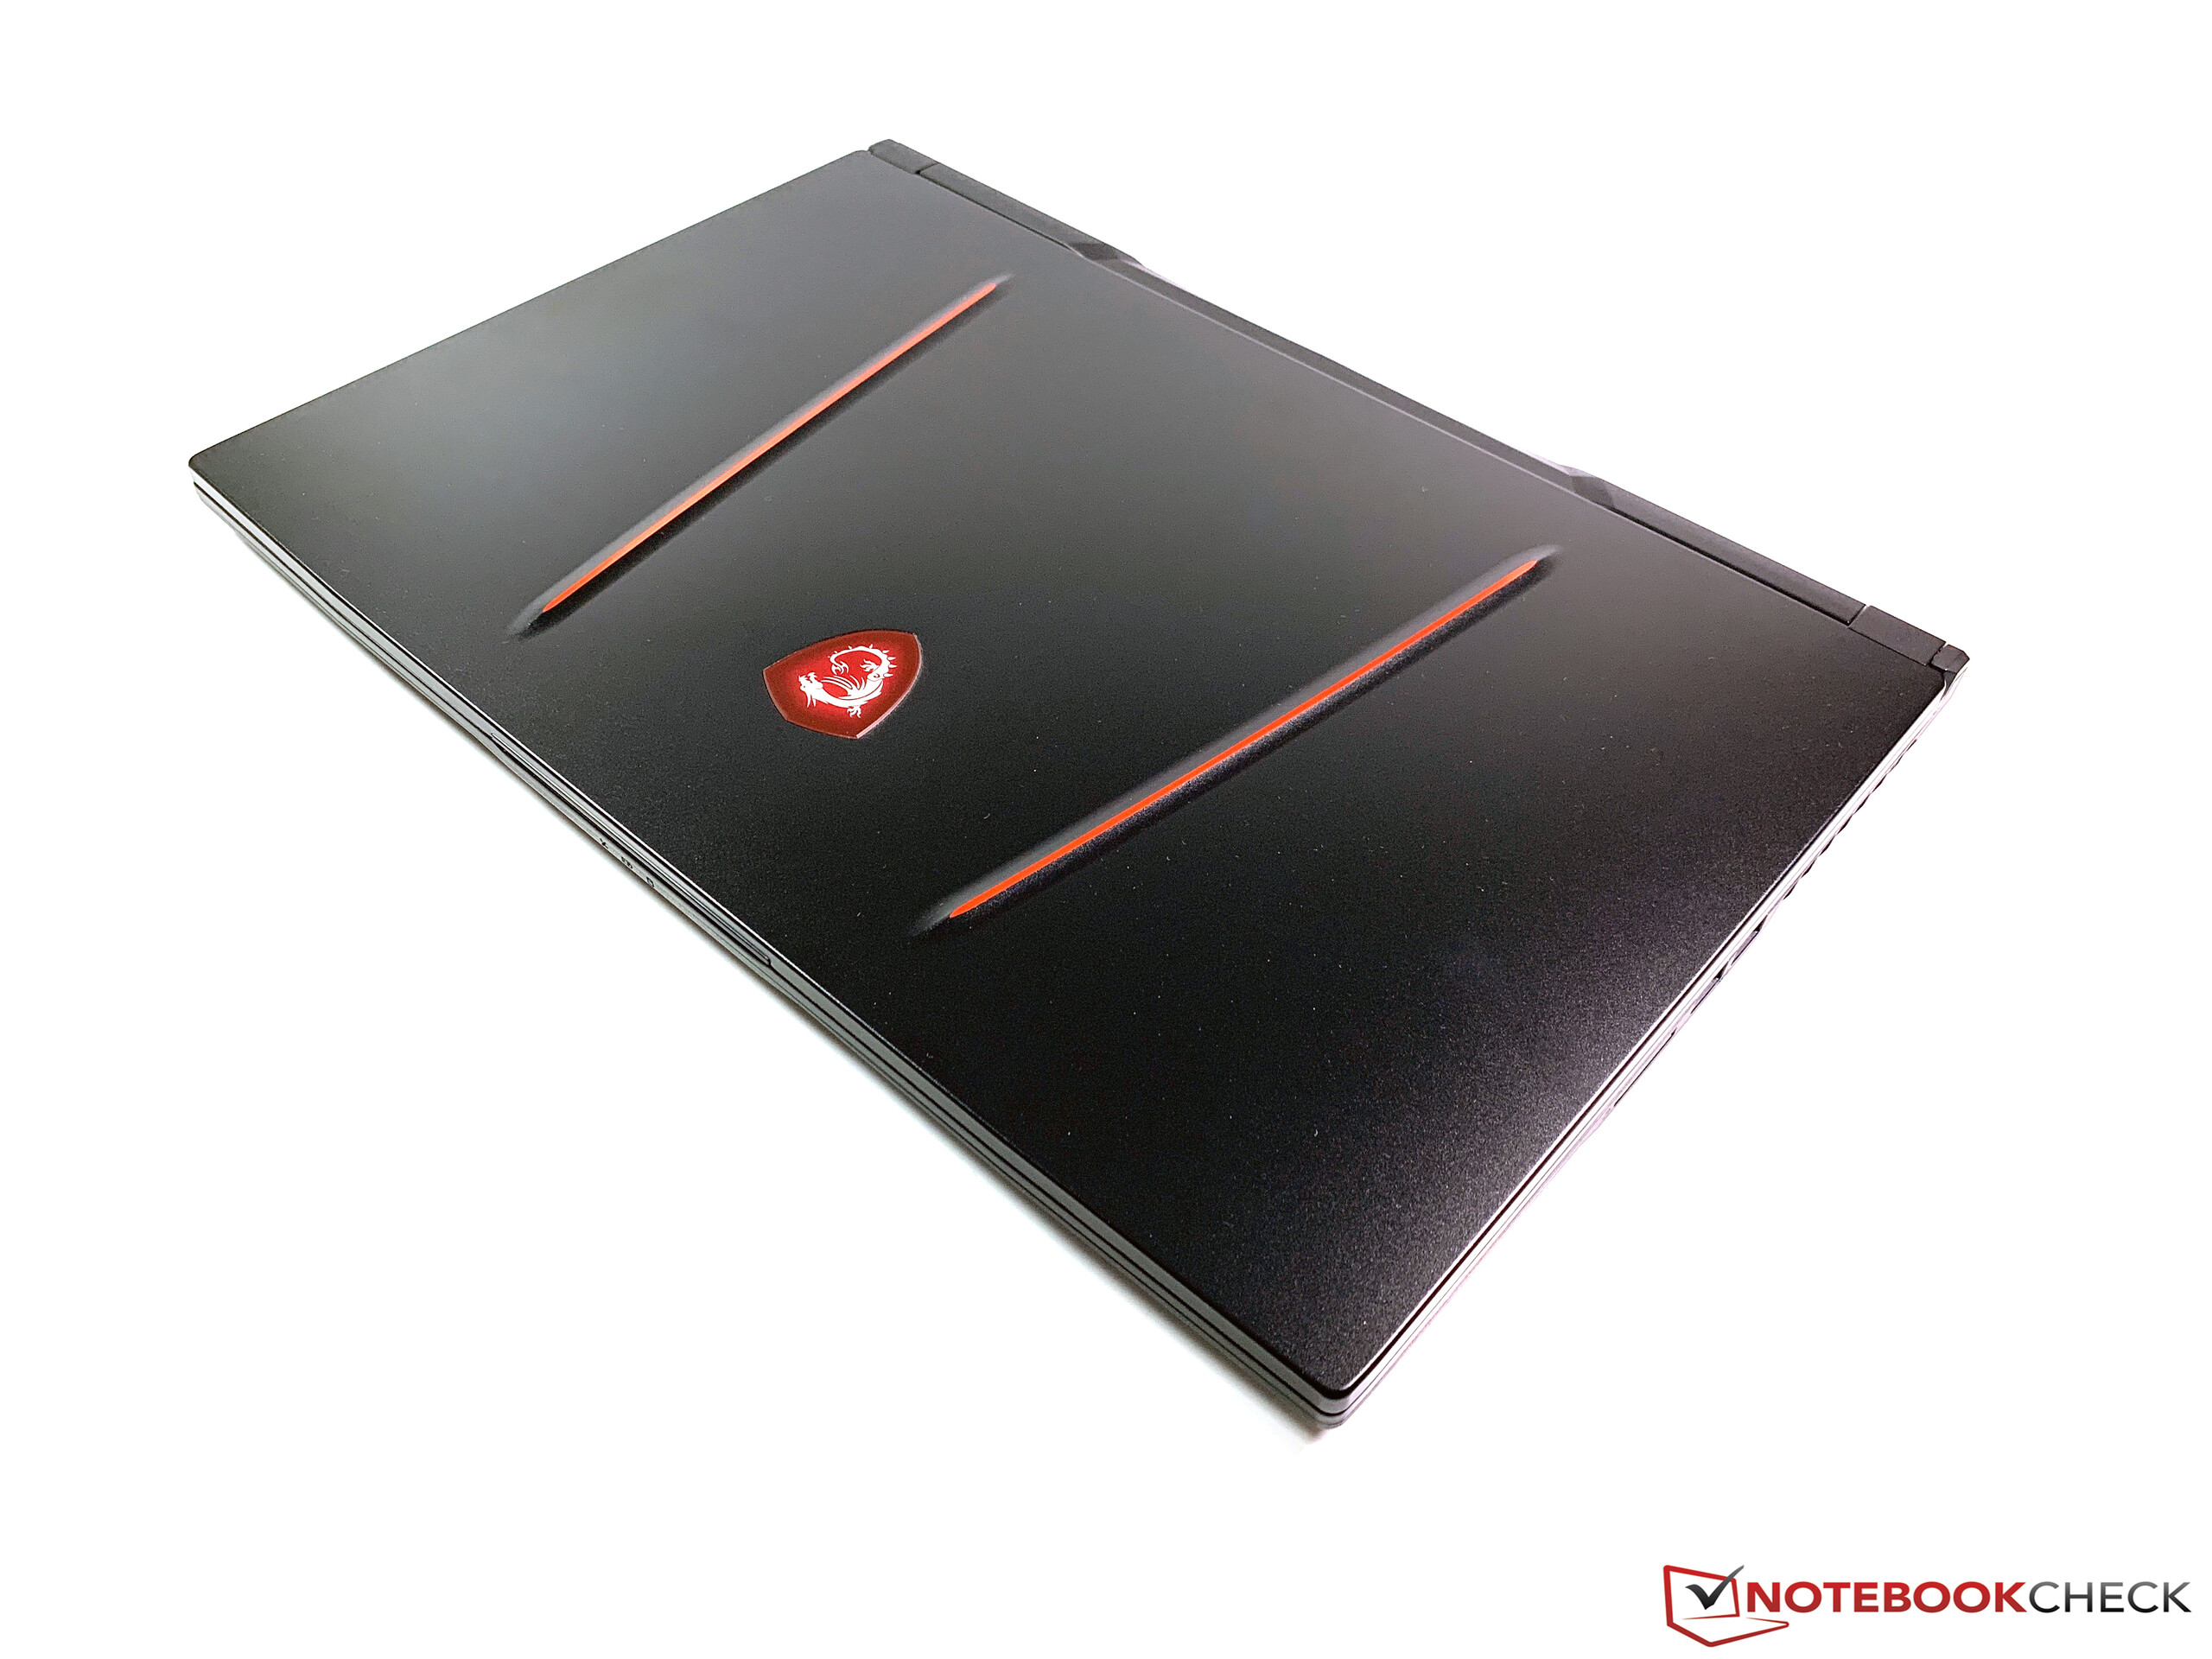
Case – Surfaces attract dirt
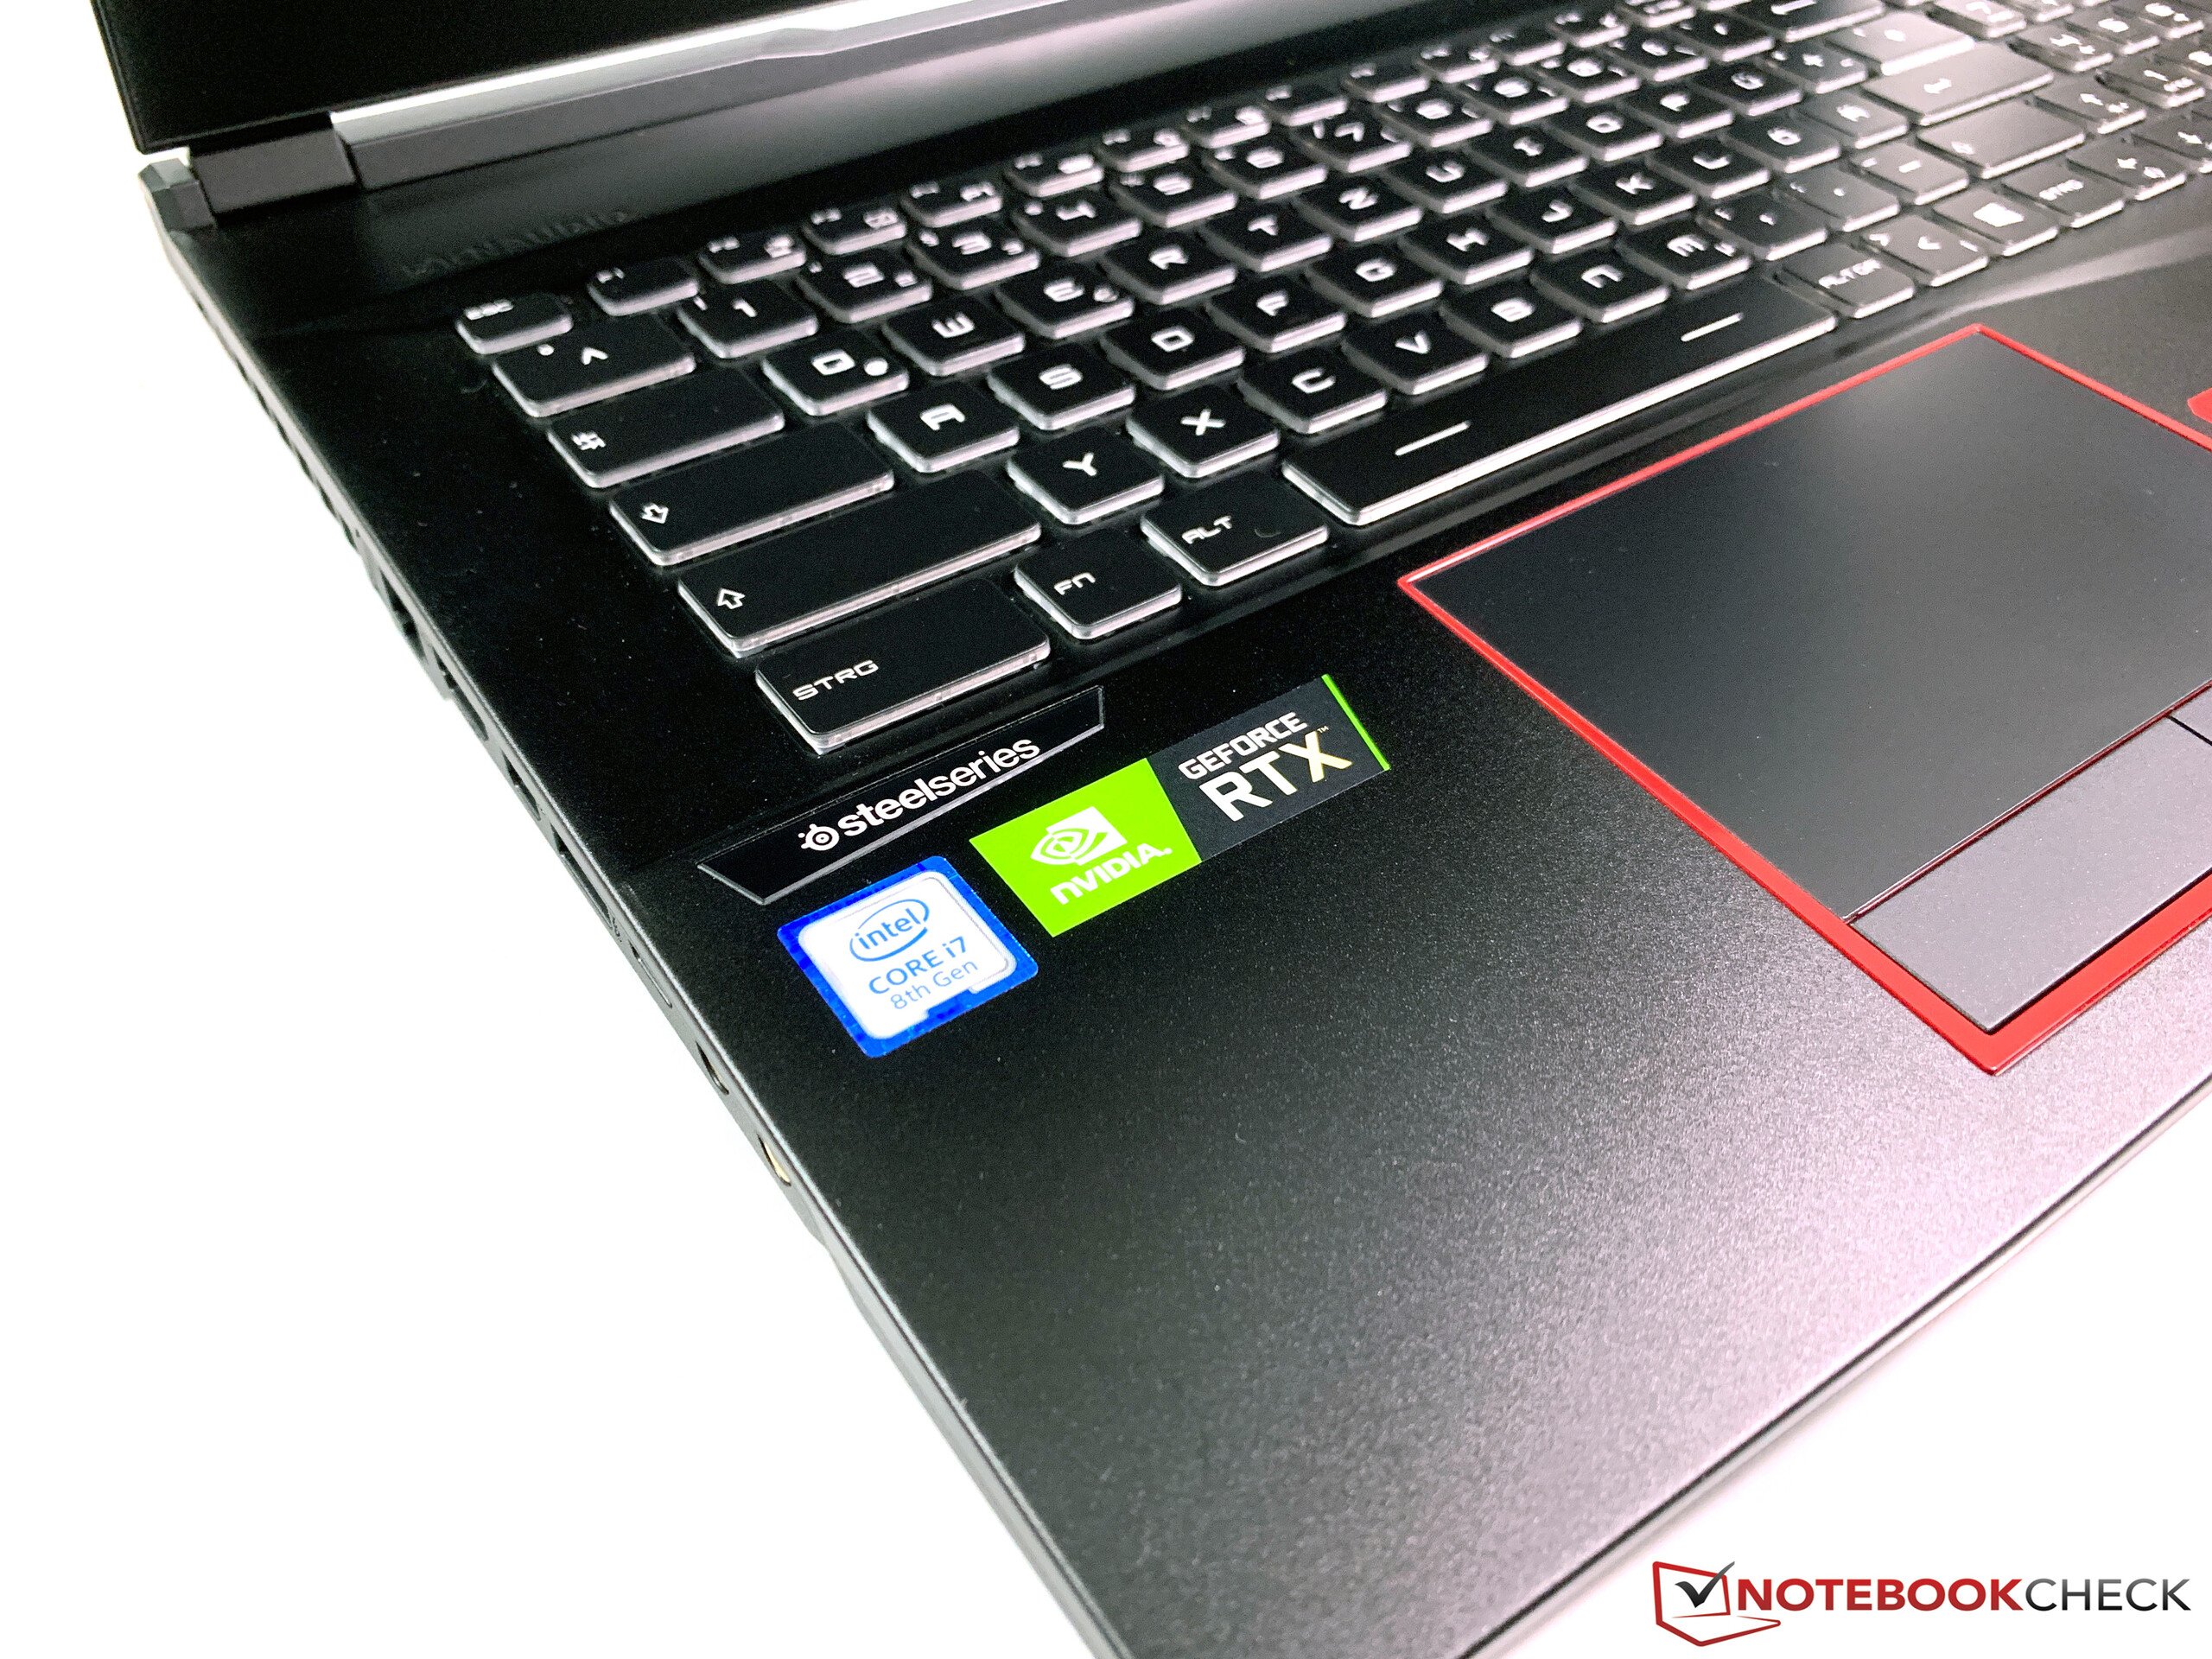
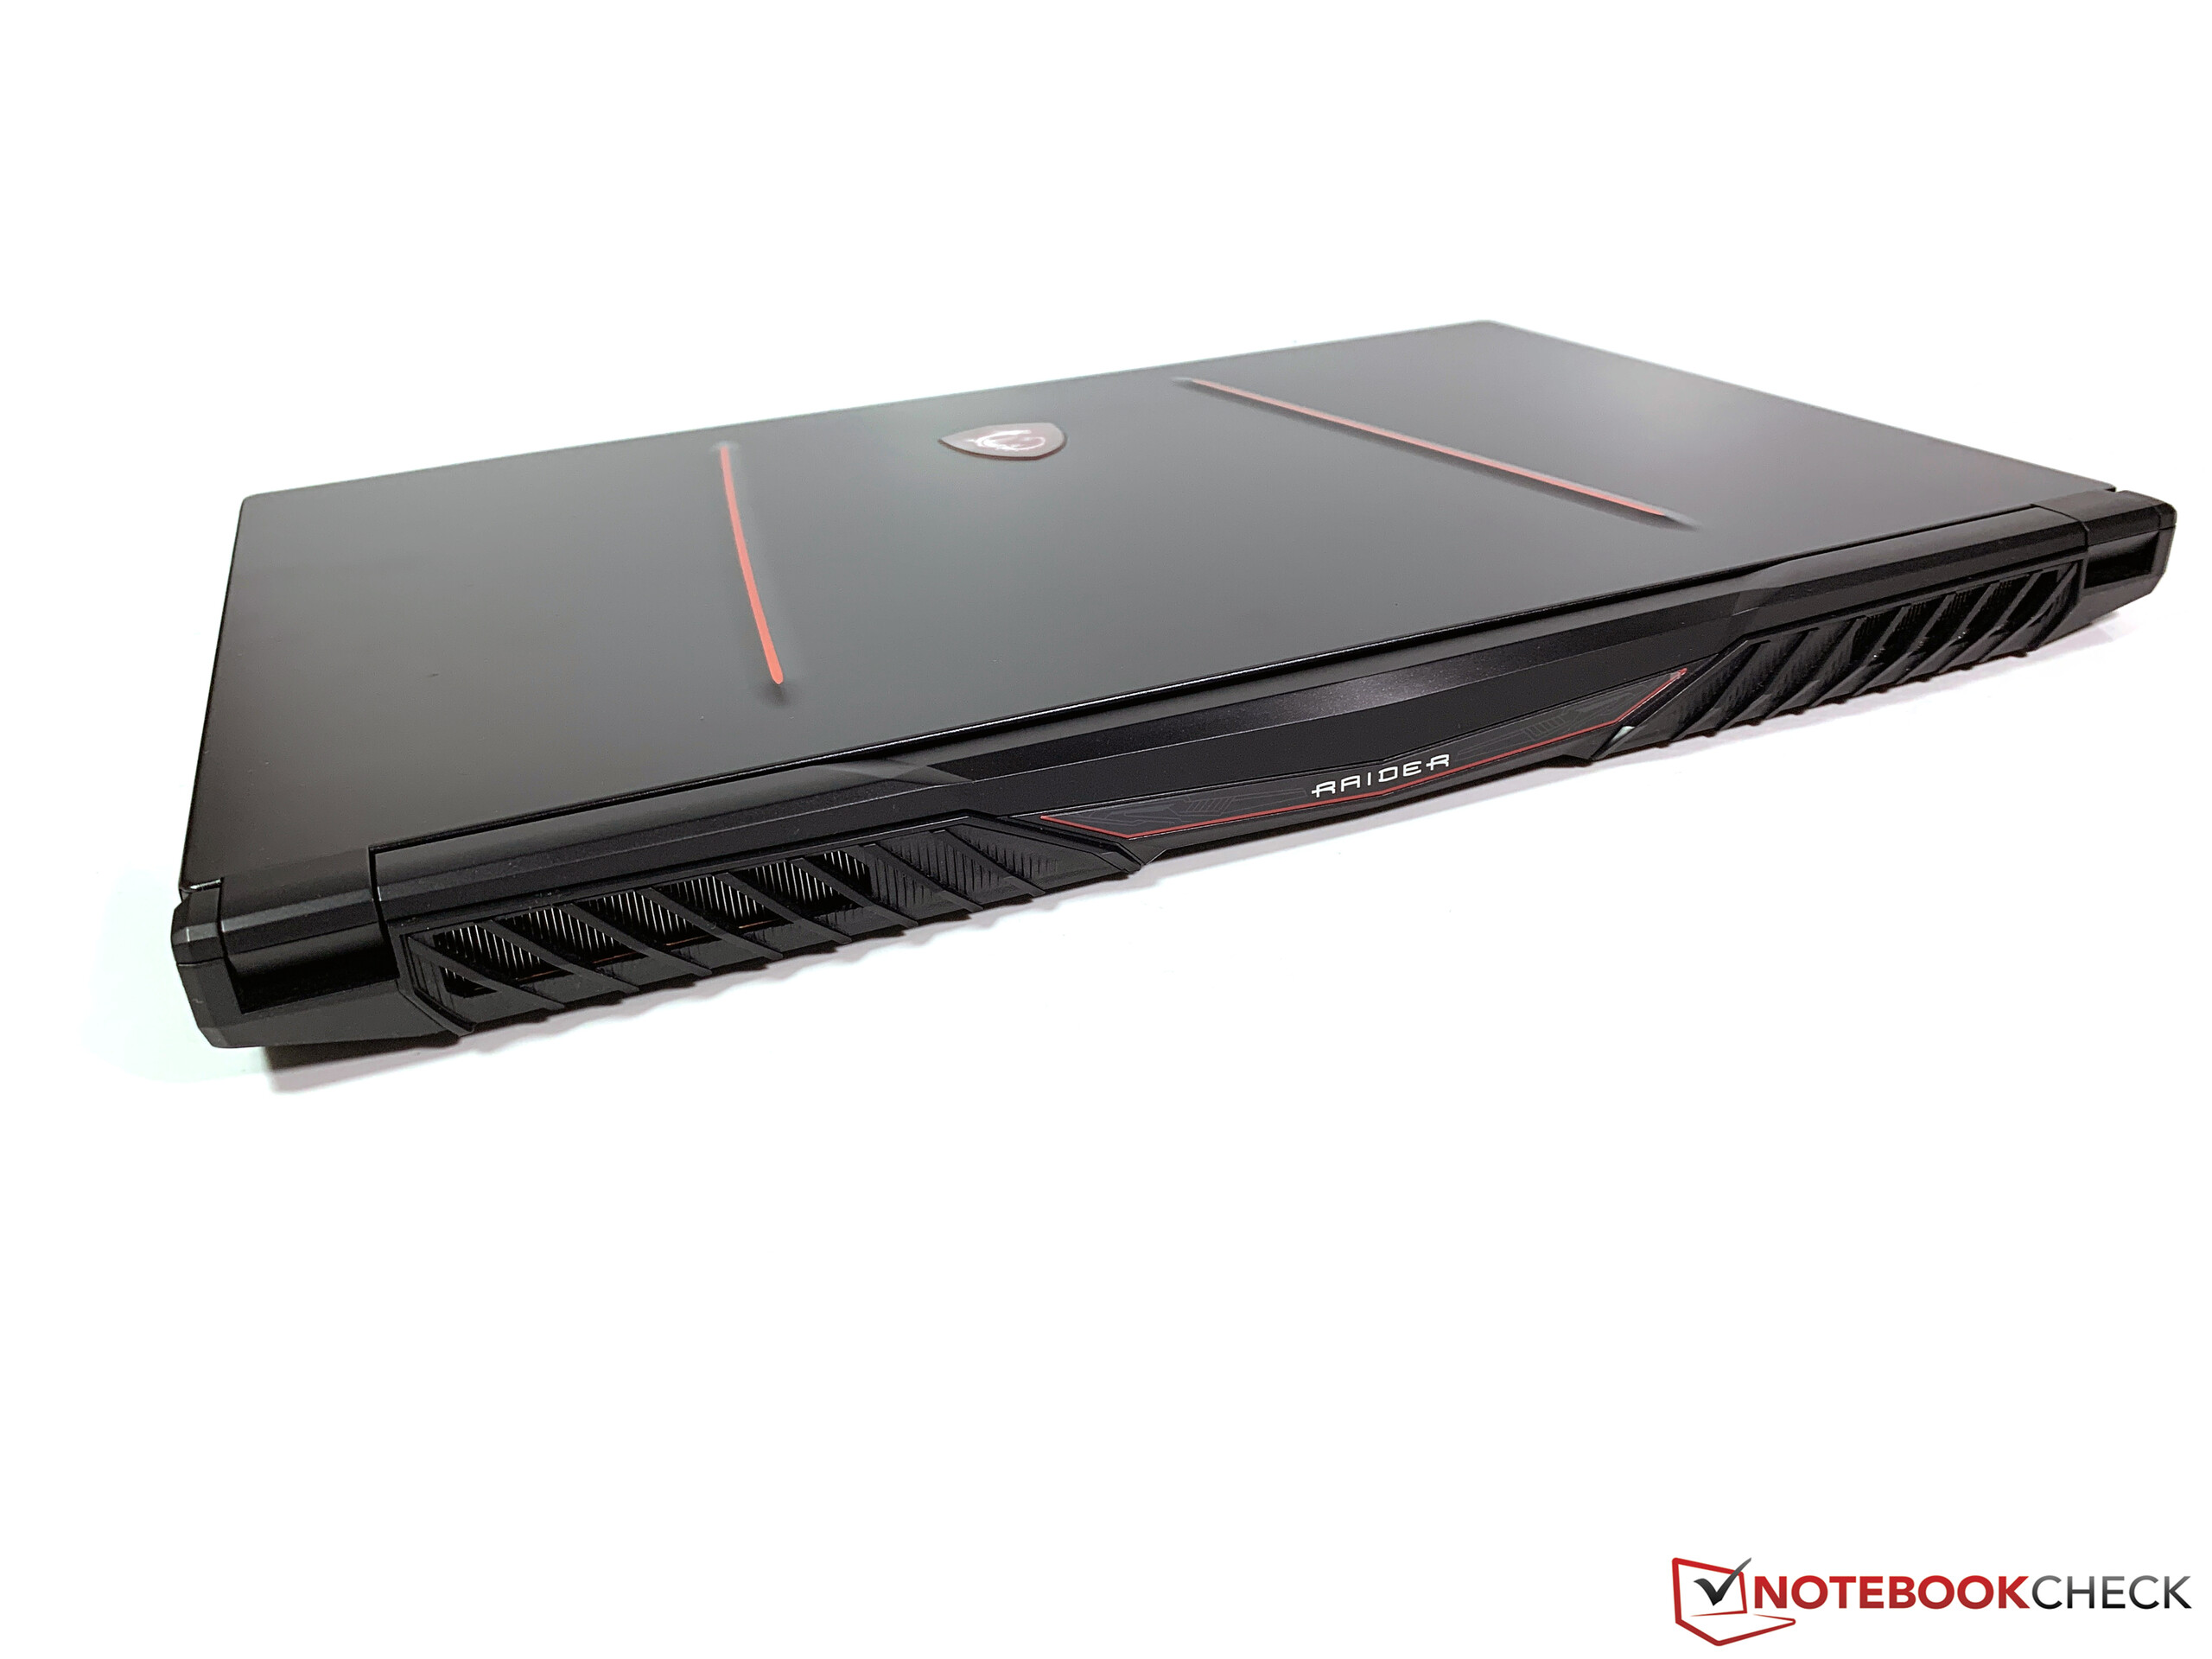
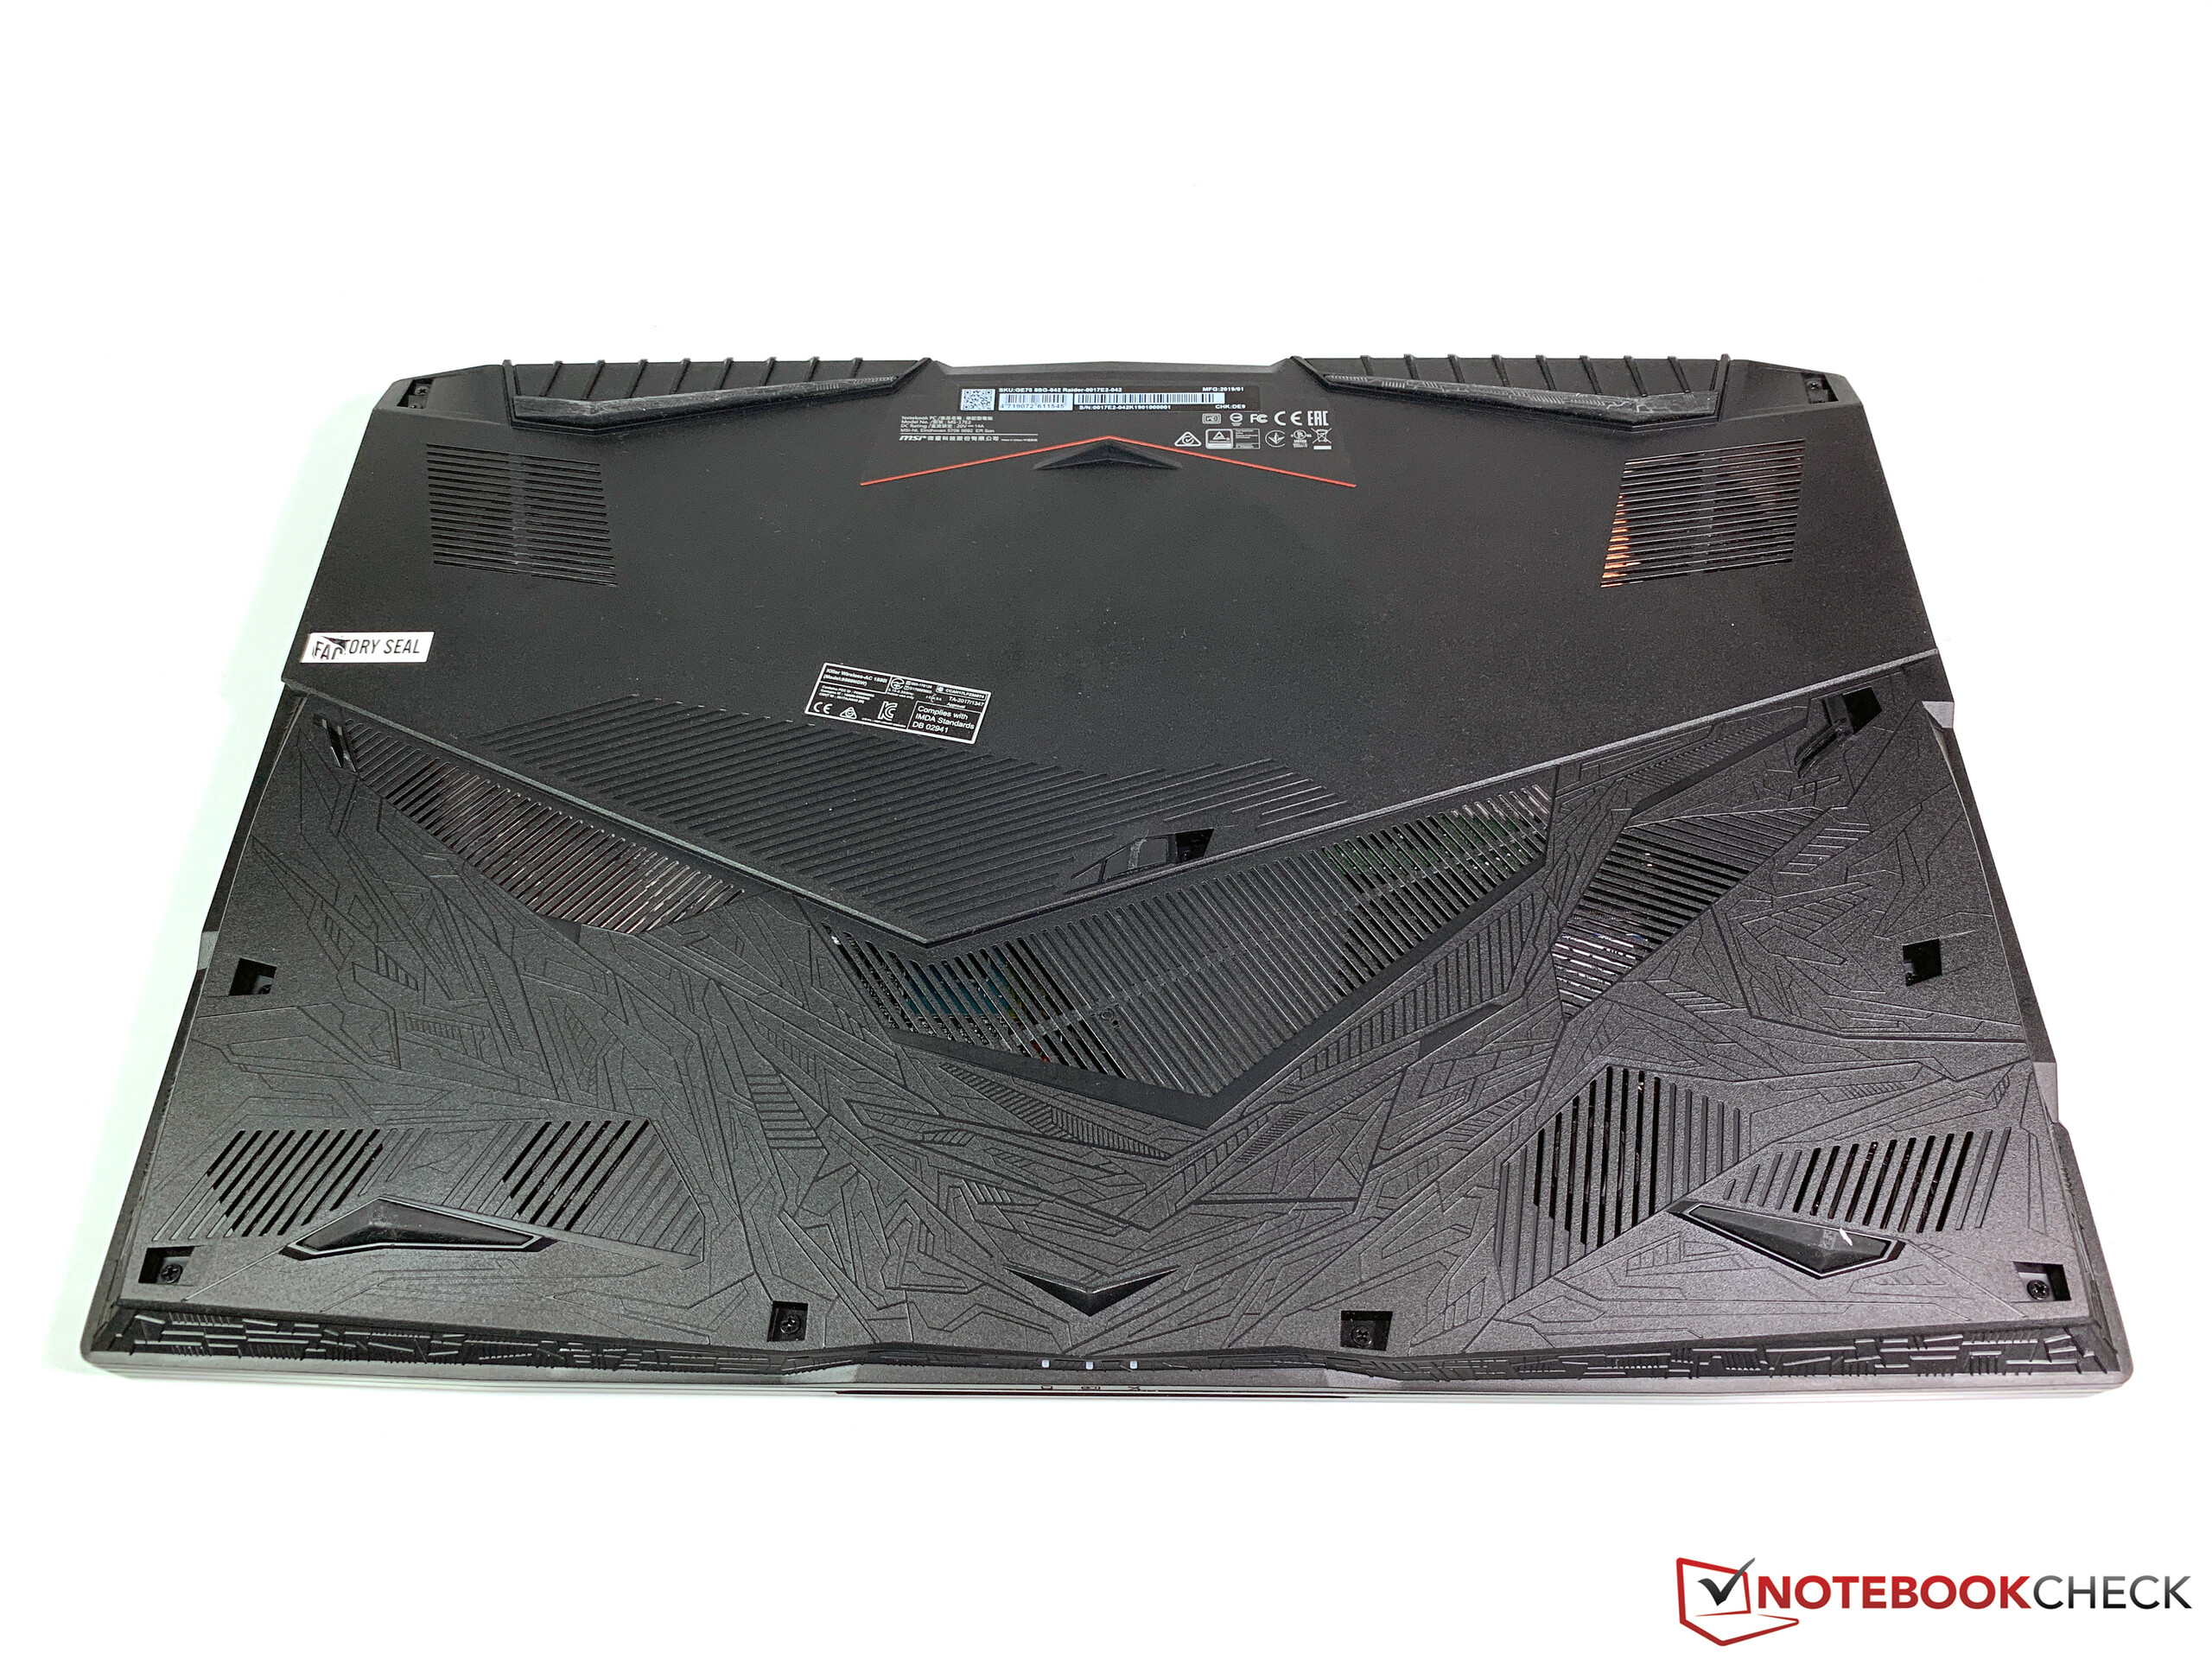
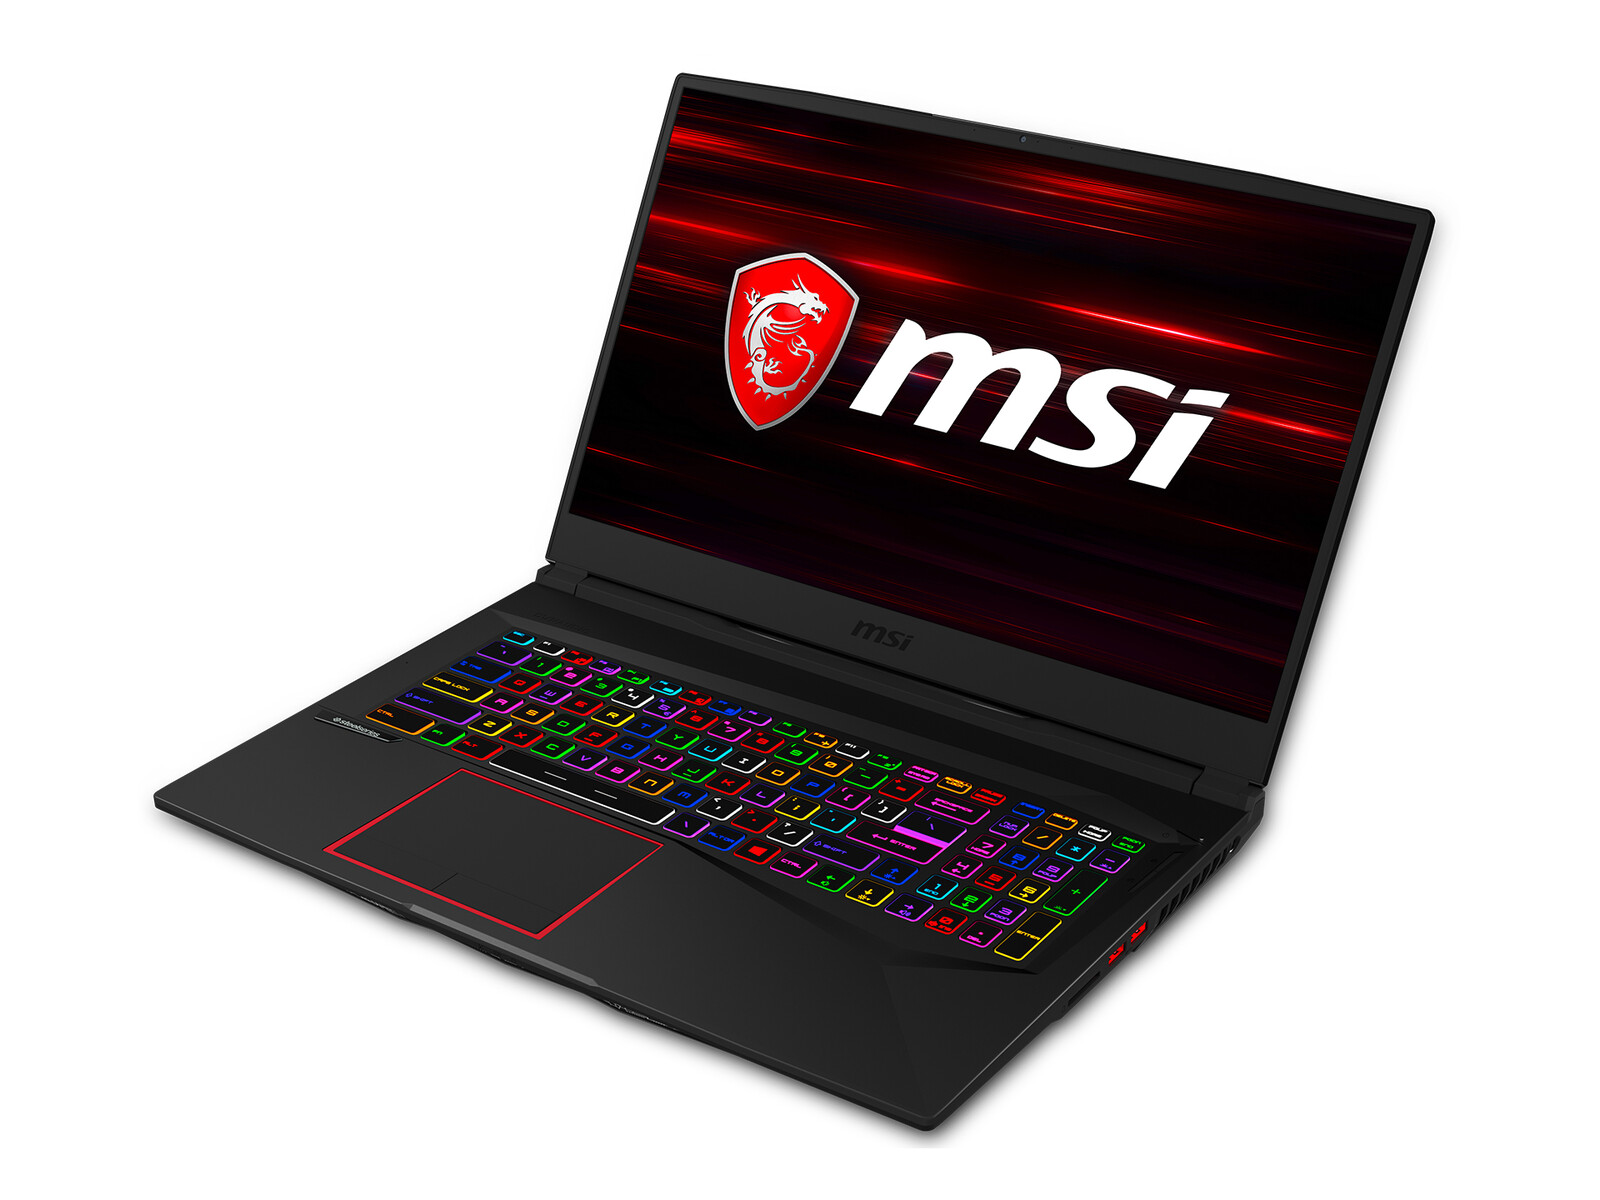
MSI uses a black chassis with red accents on the lid as well as around the touchpad. Contrary to some other gaming laptops, the overall appearance of the GE75 Raider can almost be called restrained. We like the design, but the smooth aluminum surfaces unfortunately attract dirt and grease pretty quickly, so you will have to clean it quite often.
We are not completely convinced by the stability, though, because the top of the base unit can be depressed and we also hear creaking noises. This is also the case for the bottom cover, which uses much more playful design elements compared the the rest of the laptop. Still, there are no limitations for your daily use. The lid leaves a better impression; you can twist it a bit and concentrated pressure from behind also results in picture distortions, but it is hard to criticize when you consider the slim construction. The two hinges at the edges are well adjusted and only allow minor bouncing. You can open the lid with one hand.
It is not a high-end case, but there are no major flaws and the build quality of our test unit did not reveal any issues, either.
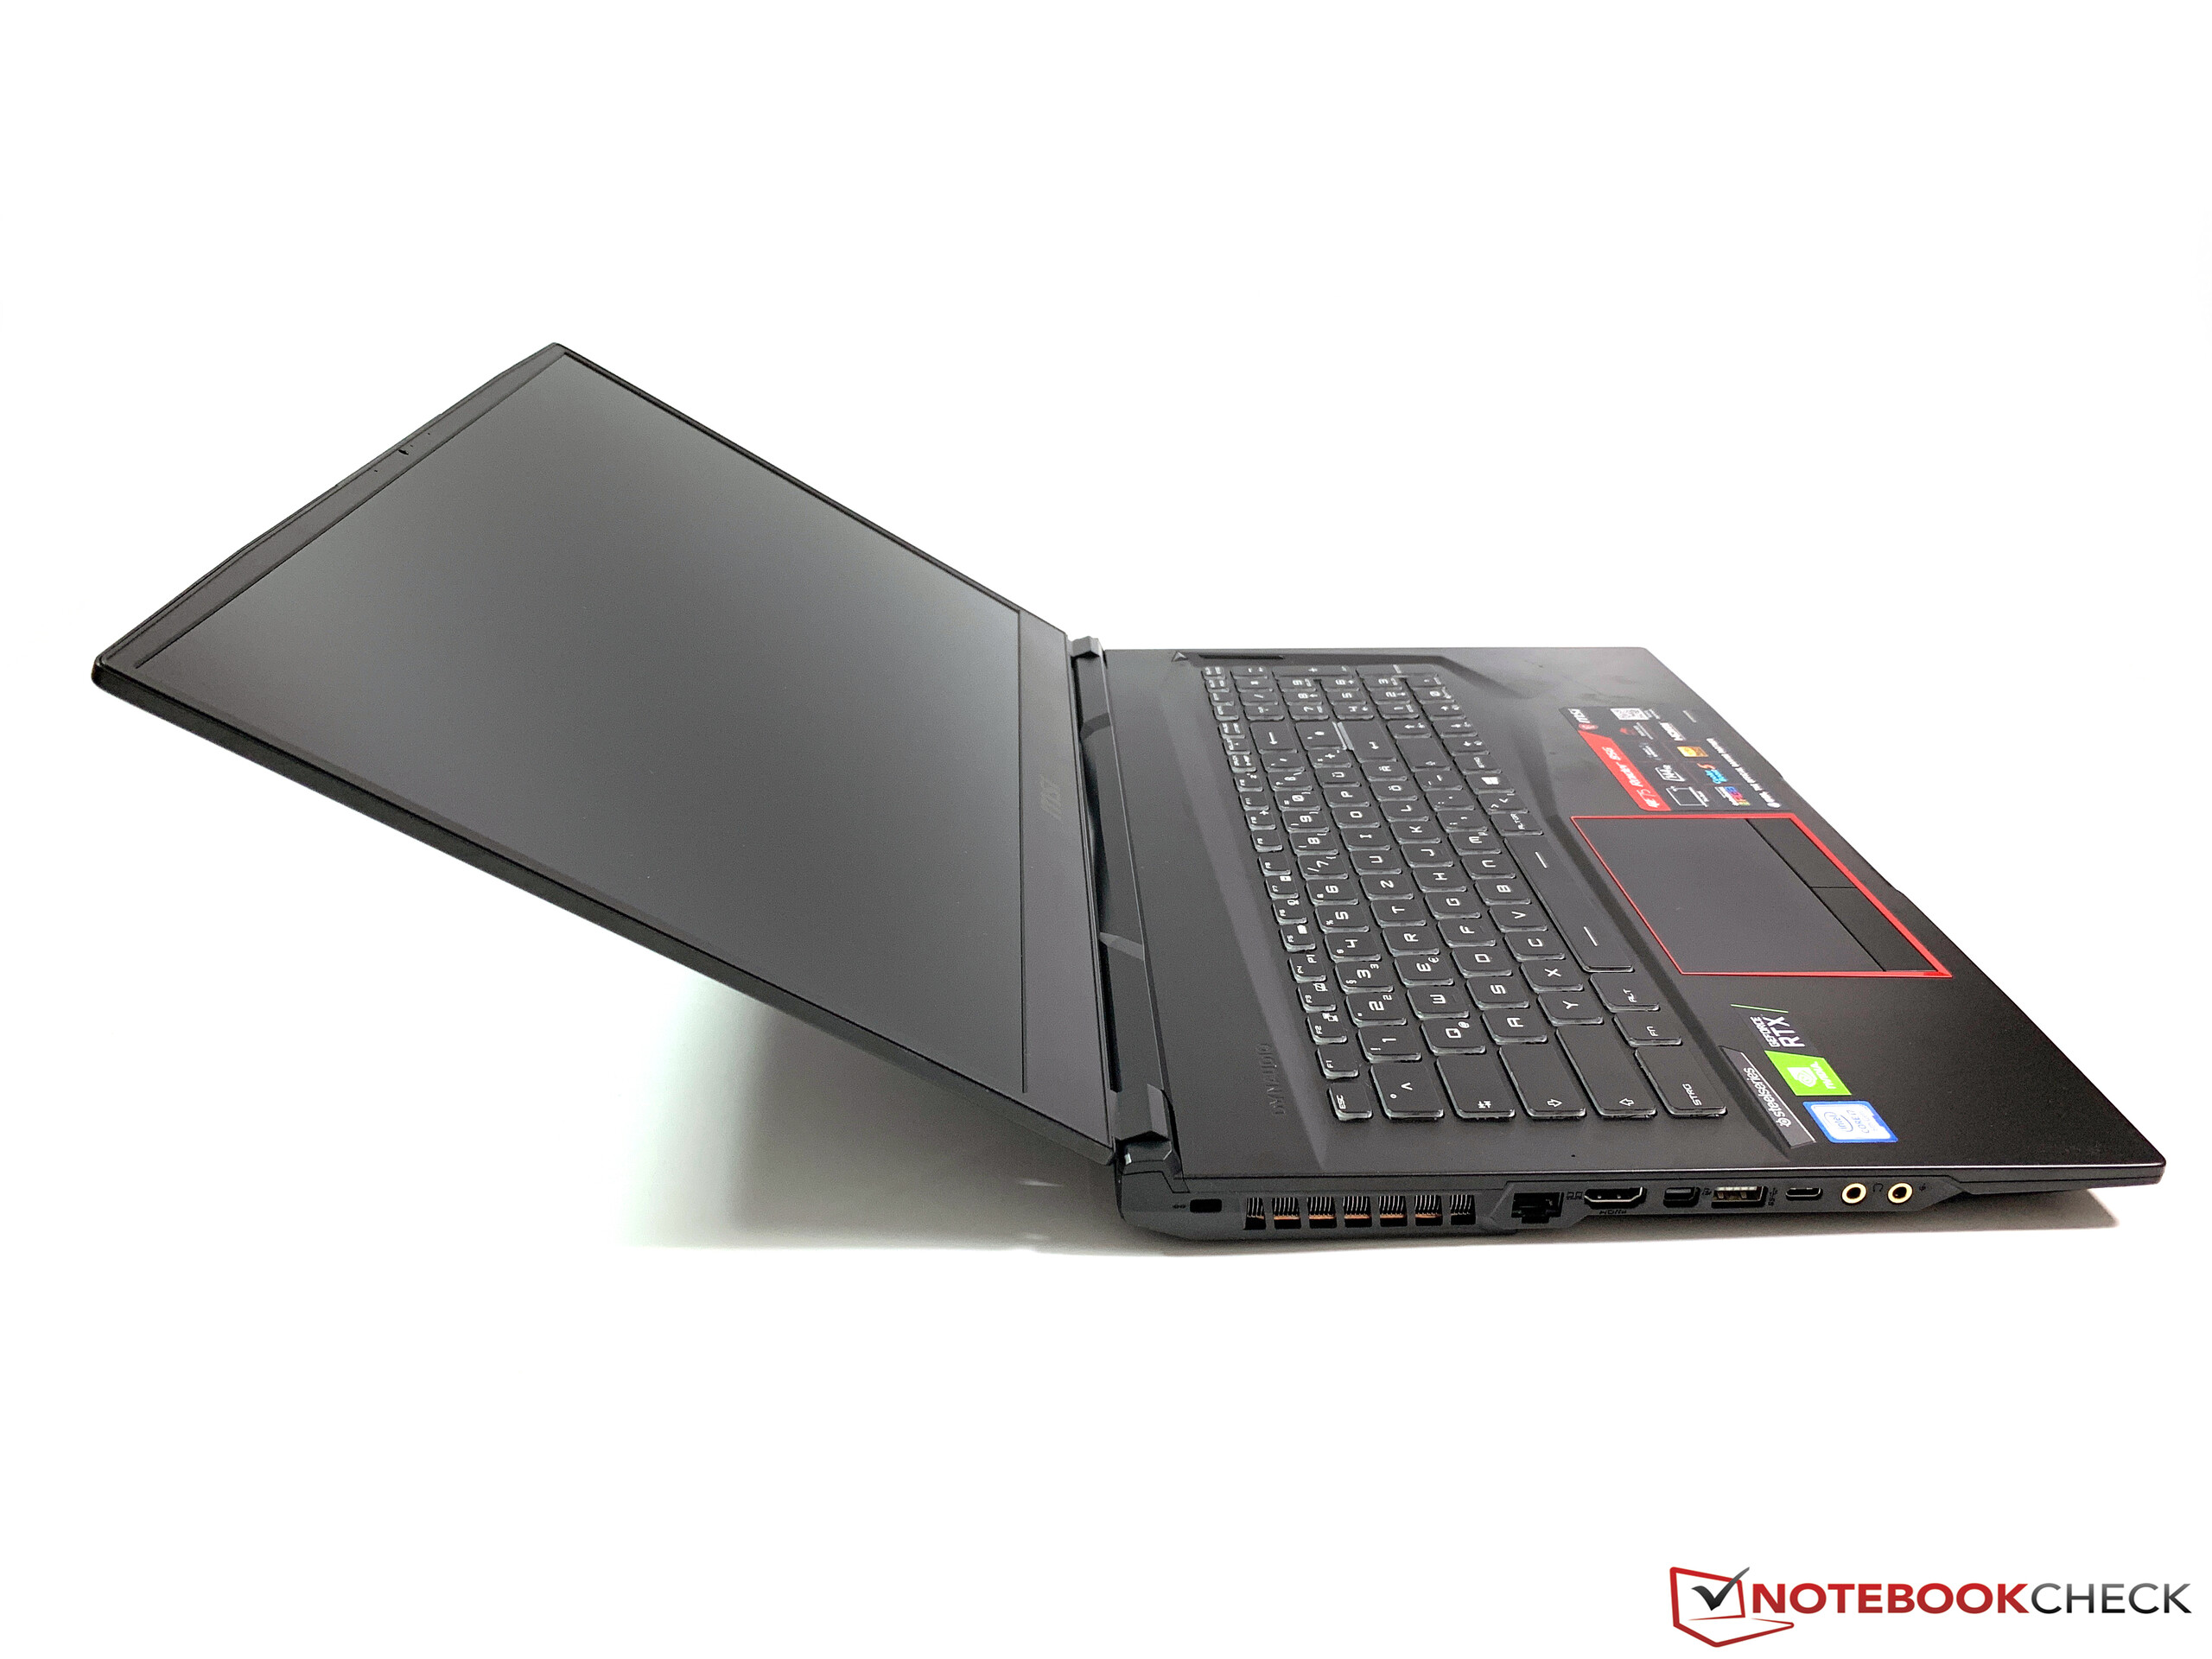
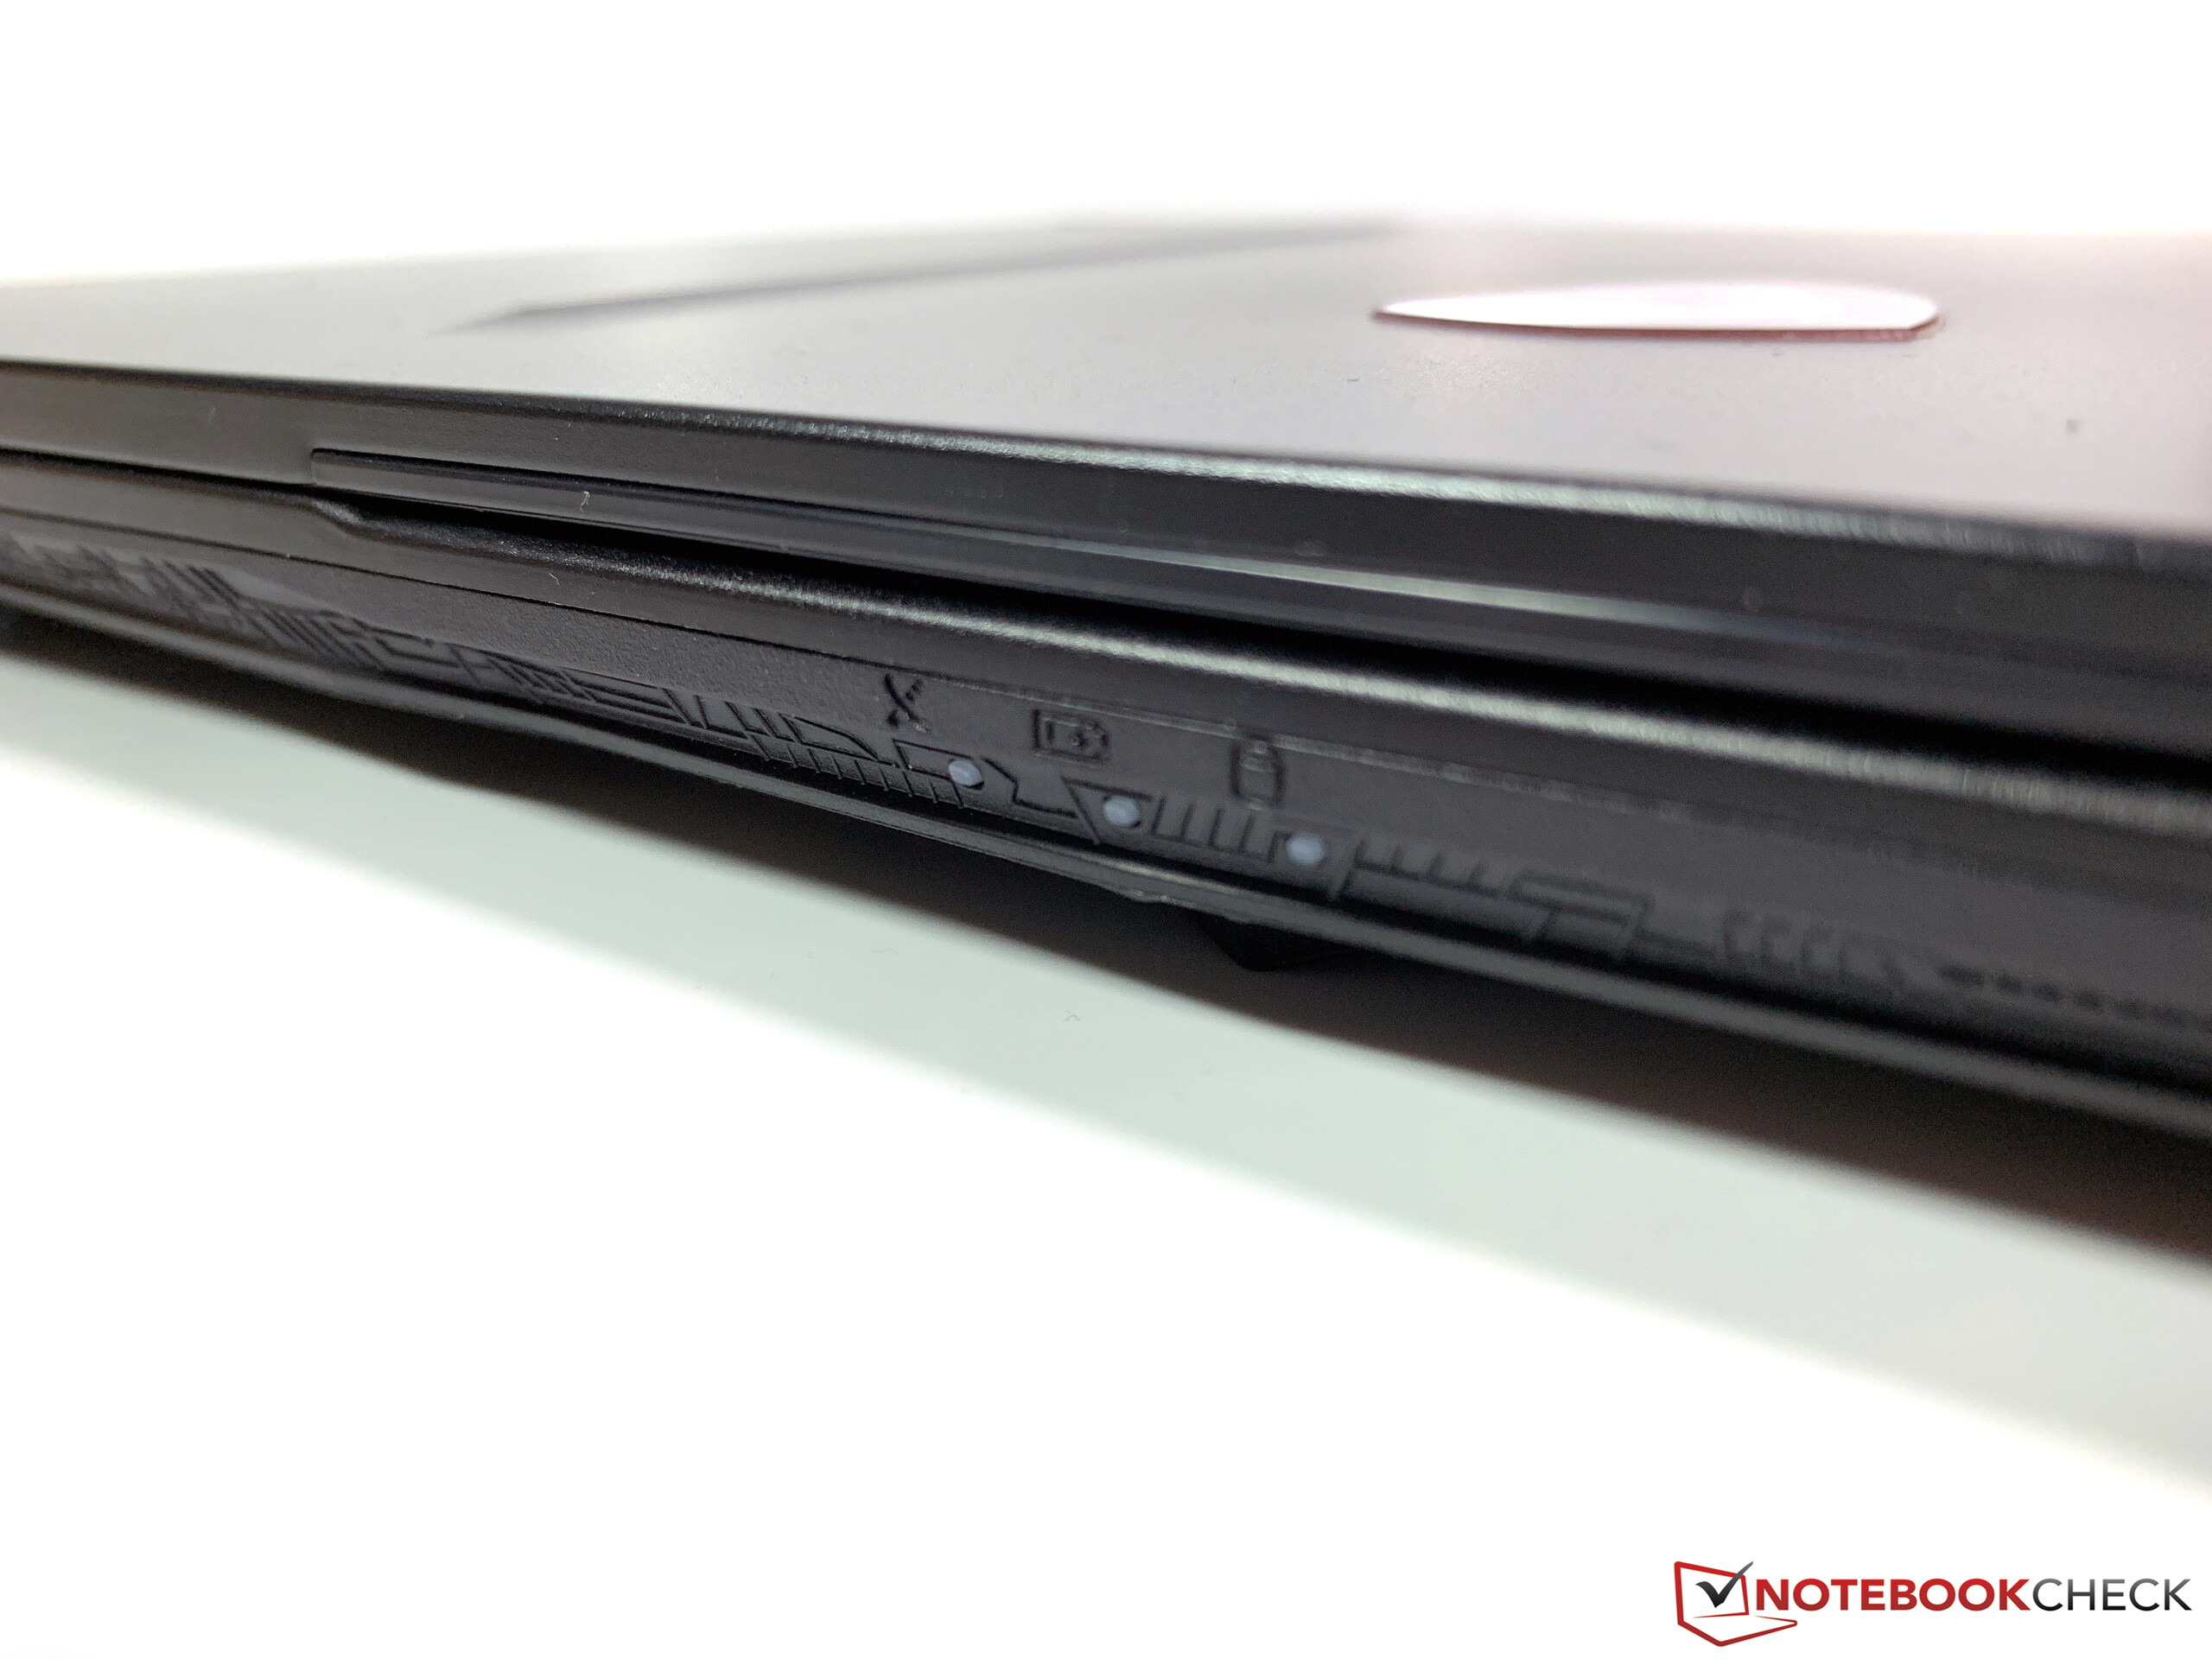
The footprint of the three devices MSI GE75 Raider, Asus ROG Strix SCAR II, and Asus Zephyrus S is very similar, but the Zephyrus is the slimmest device. All three laptops are very compact 17-inch systems. Lenovo's Legion Y740 needs more space on the desk. Our test device is not too heavy at 2.6 kg, either, but you also have to consider about 1 kg for the power adapter when you transport the laptop.
Connectivity – USB-C, but no TB3
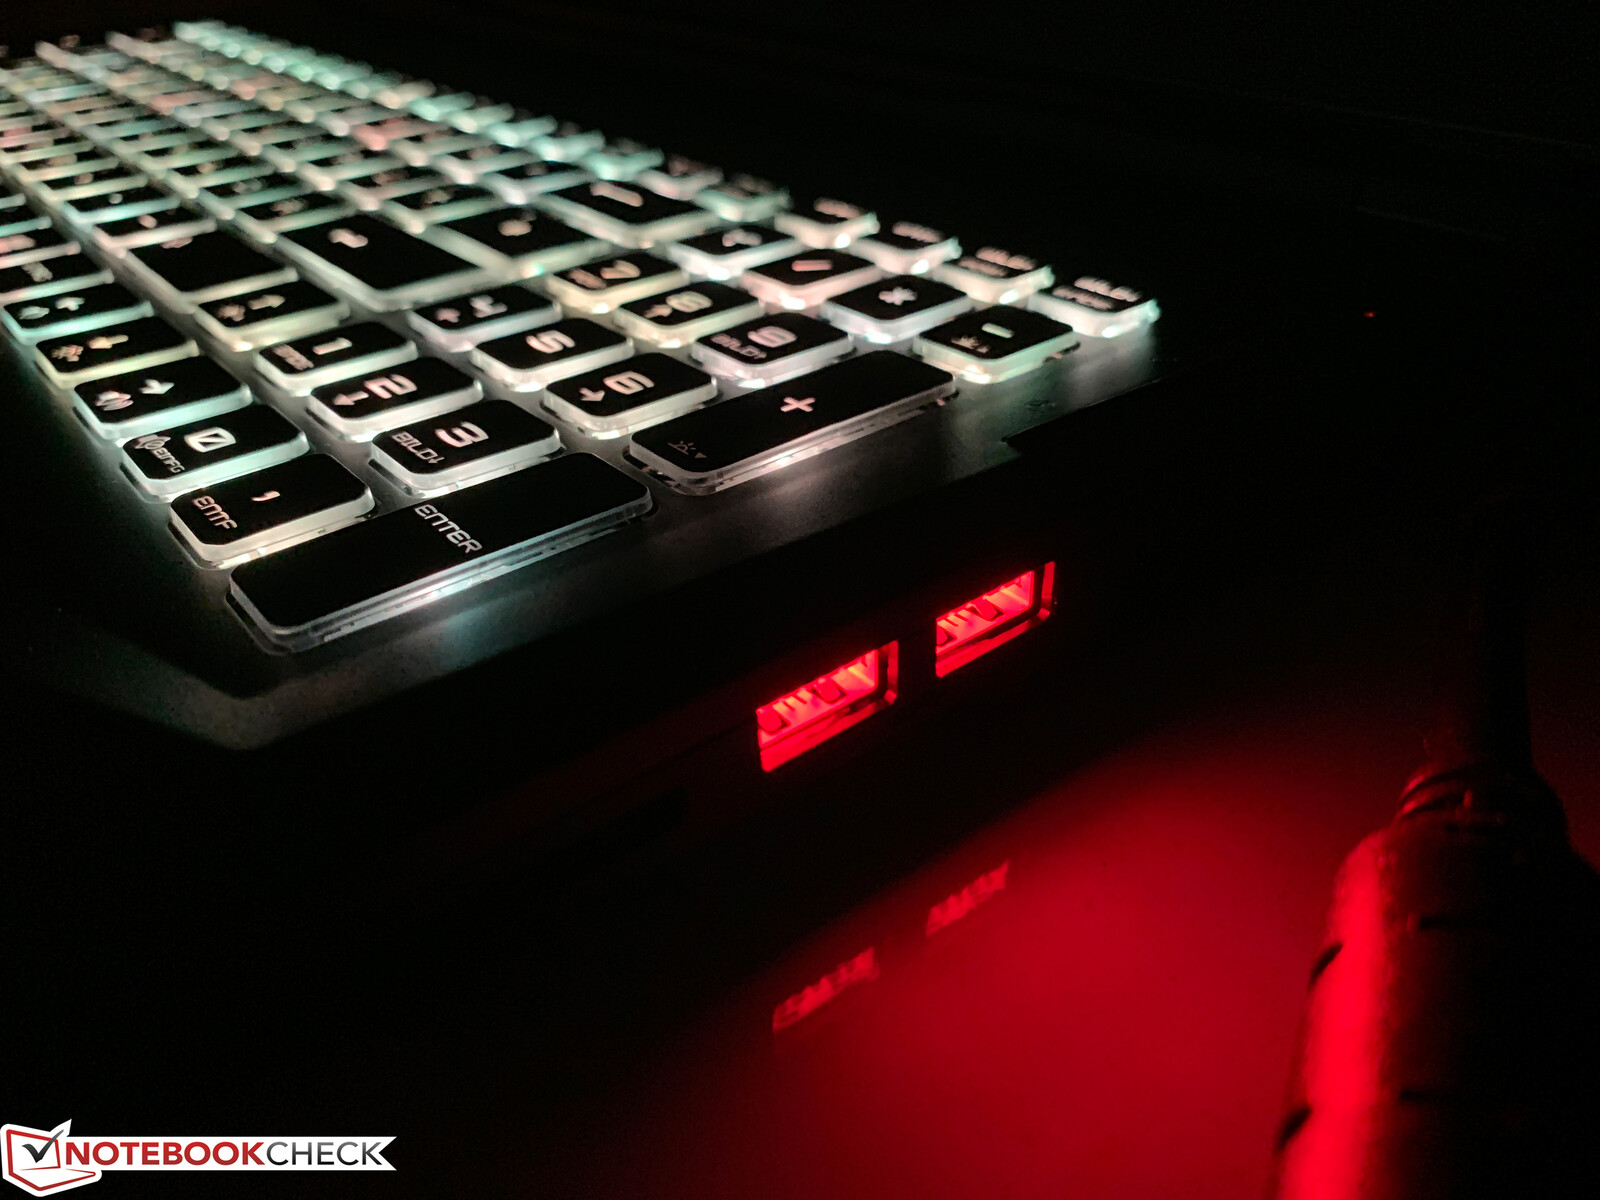
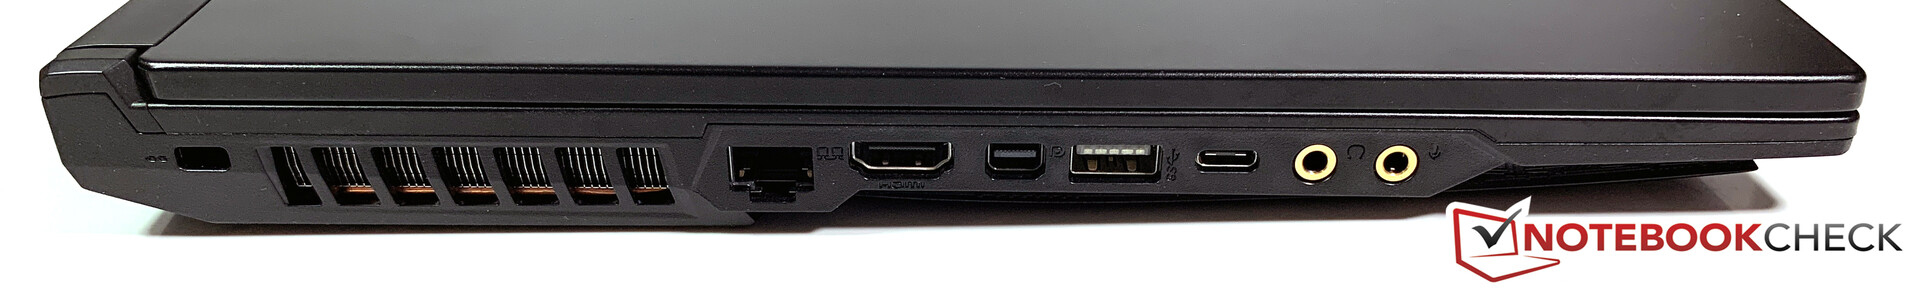
The MSI GE75 Raider offers all common ports including a modern USB-C connector. However, there is no Thunderbolt 3, which is a bit disappointing for the high price. We particularly liked the illuminated USB-A ports when the keyboard illumination is active. The latter makes it really easy to attach peripherals in darker environments.
The HDMI output supports the 2.0 standard and can drive a 4K signal at 60 Hz.
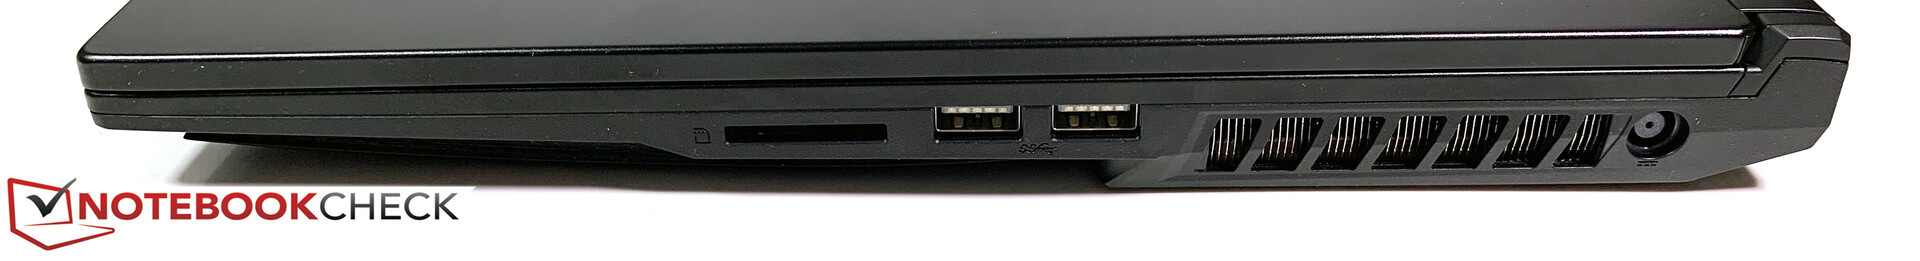
SD Card Reader
MSI includes a full-size SD reader and we check the performance with our reference card from Toshiba (Exceria Pro SDXC 64 GB UHS-II). The reader is unfortunately connected via USB 2.0, which results in very low transfer rates below 30 MB/s. The average value for gaming laptops is around 90 MB/s. We recommend an external card reader if you copy a lot of files/pictures from SD cards.
| SD Card Reader | |
| average JPG Copy Test (av. of 3 runs) | |
| MSI GS73 Stealth 8RF-011 (Toshiba Exceria Pro SDXC 64 GB UHS-II) | |
| Average of class Gaming (20.9 - 210, n=54, last 2 years) | |
| Asus ROG Strix Scar II GL704GW (Toshiba Exceria Pro SDXC 64 GB UHS-II) | |
| MSI GE75 8SG Raider (Toshiba Exceria Pro SDXC 64 GB UHS-II) | |
| maximum AS SSD Seq Read Test (1GB) | |
| MSI GS73 Stealth 8RF-011 (Toshiba Exceria Pro SDXC 64 GB UHS-II) | |
| Average of class Gaming (25.5 - 261, n=51, last 2 years) | |
| Asus ROG Strix Scar II GL704GW (Toshiba Exceria Pro SDXC 64 GB UHS-II) | |
| MSI GE75 8SG Raider (Toshiba Exceria Pro SDXC 64 GB UHS-II) | |
Communication
MSI equips the GE75 Raider with modern communication modules from Killer. Besides the E2500 Gigabit-Ethernet module for wired networks, the Killer 1550i handles all the Wi-Fi connections. All common standards including Bluetooth 5.0 are supported and the transfer rates in our standardized test with the Linksys router EA8500 are very good.
We did not notice any problems/limitations during our time with the device, either. Killer modules offer special features for gamers compared to Intel modules. Please see our dedicated article for more information.
Maintenance
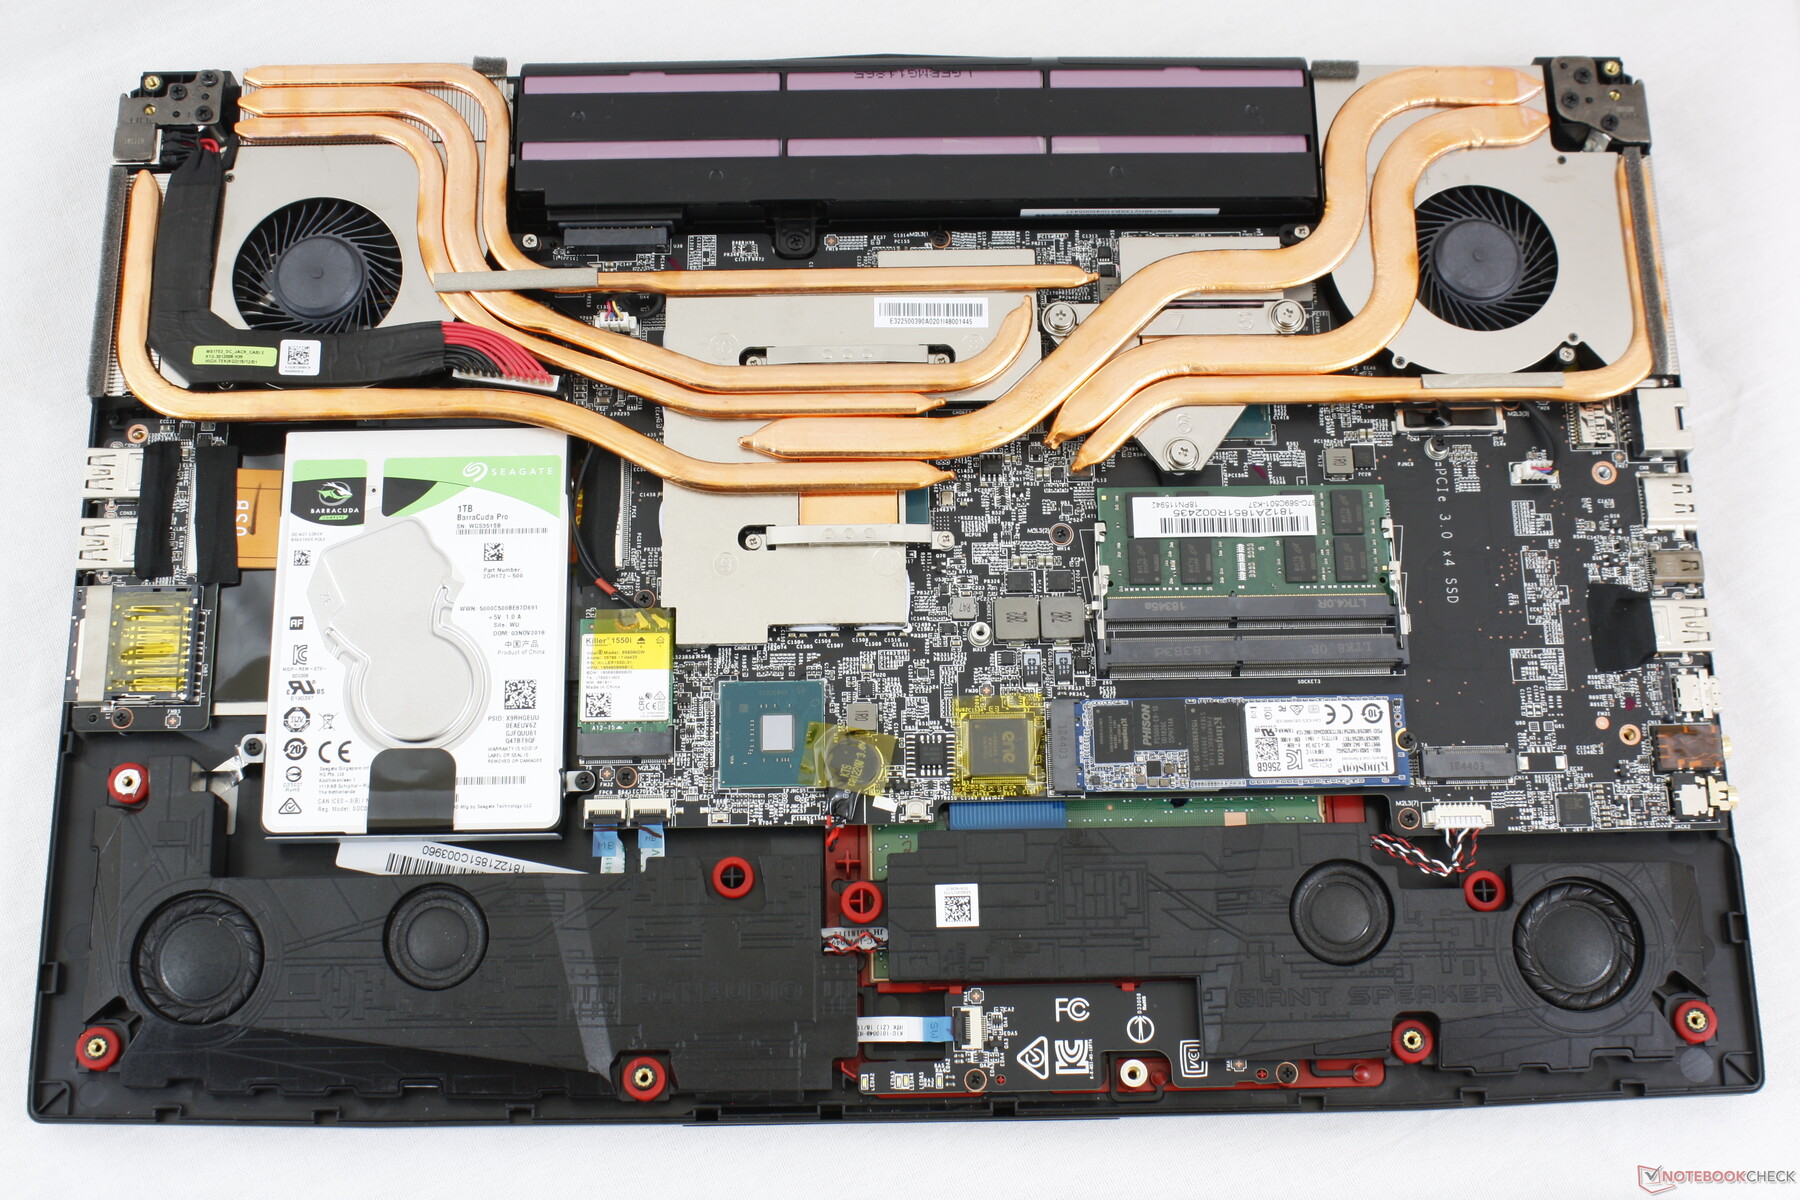
It was a problem to open our test unit. The bottom panel was extremely firmly connected to the base unit in the area of the USB ports, even after the removal of all screws. We did not want to damage the unit, so we stopped our attempt at this point. Instead, we can show you a picture of the GE75 Raider 8SF. The upgradeability is basically not bad with three storage slots (2x M.2-2280 + 1x 2.5") and two RAM slots, which are already in use in our device. You can upgrade the RAM to 32 GB with two 16 GB DDR4 modules.
Warranty
The warranty period in Germany is 2 years and includes a free pickup and return service.
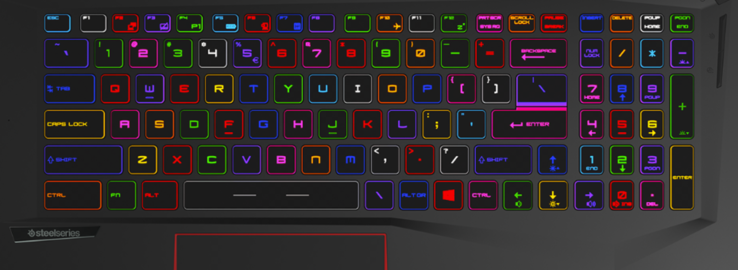
Input Devices – MSI with individual RGB illumination
Keyboard
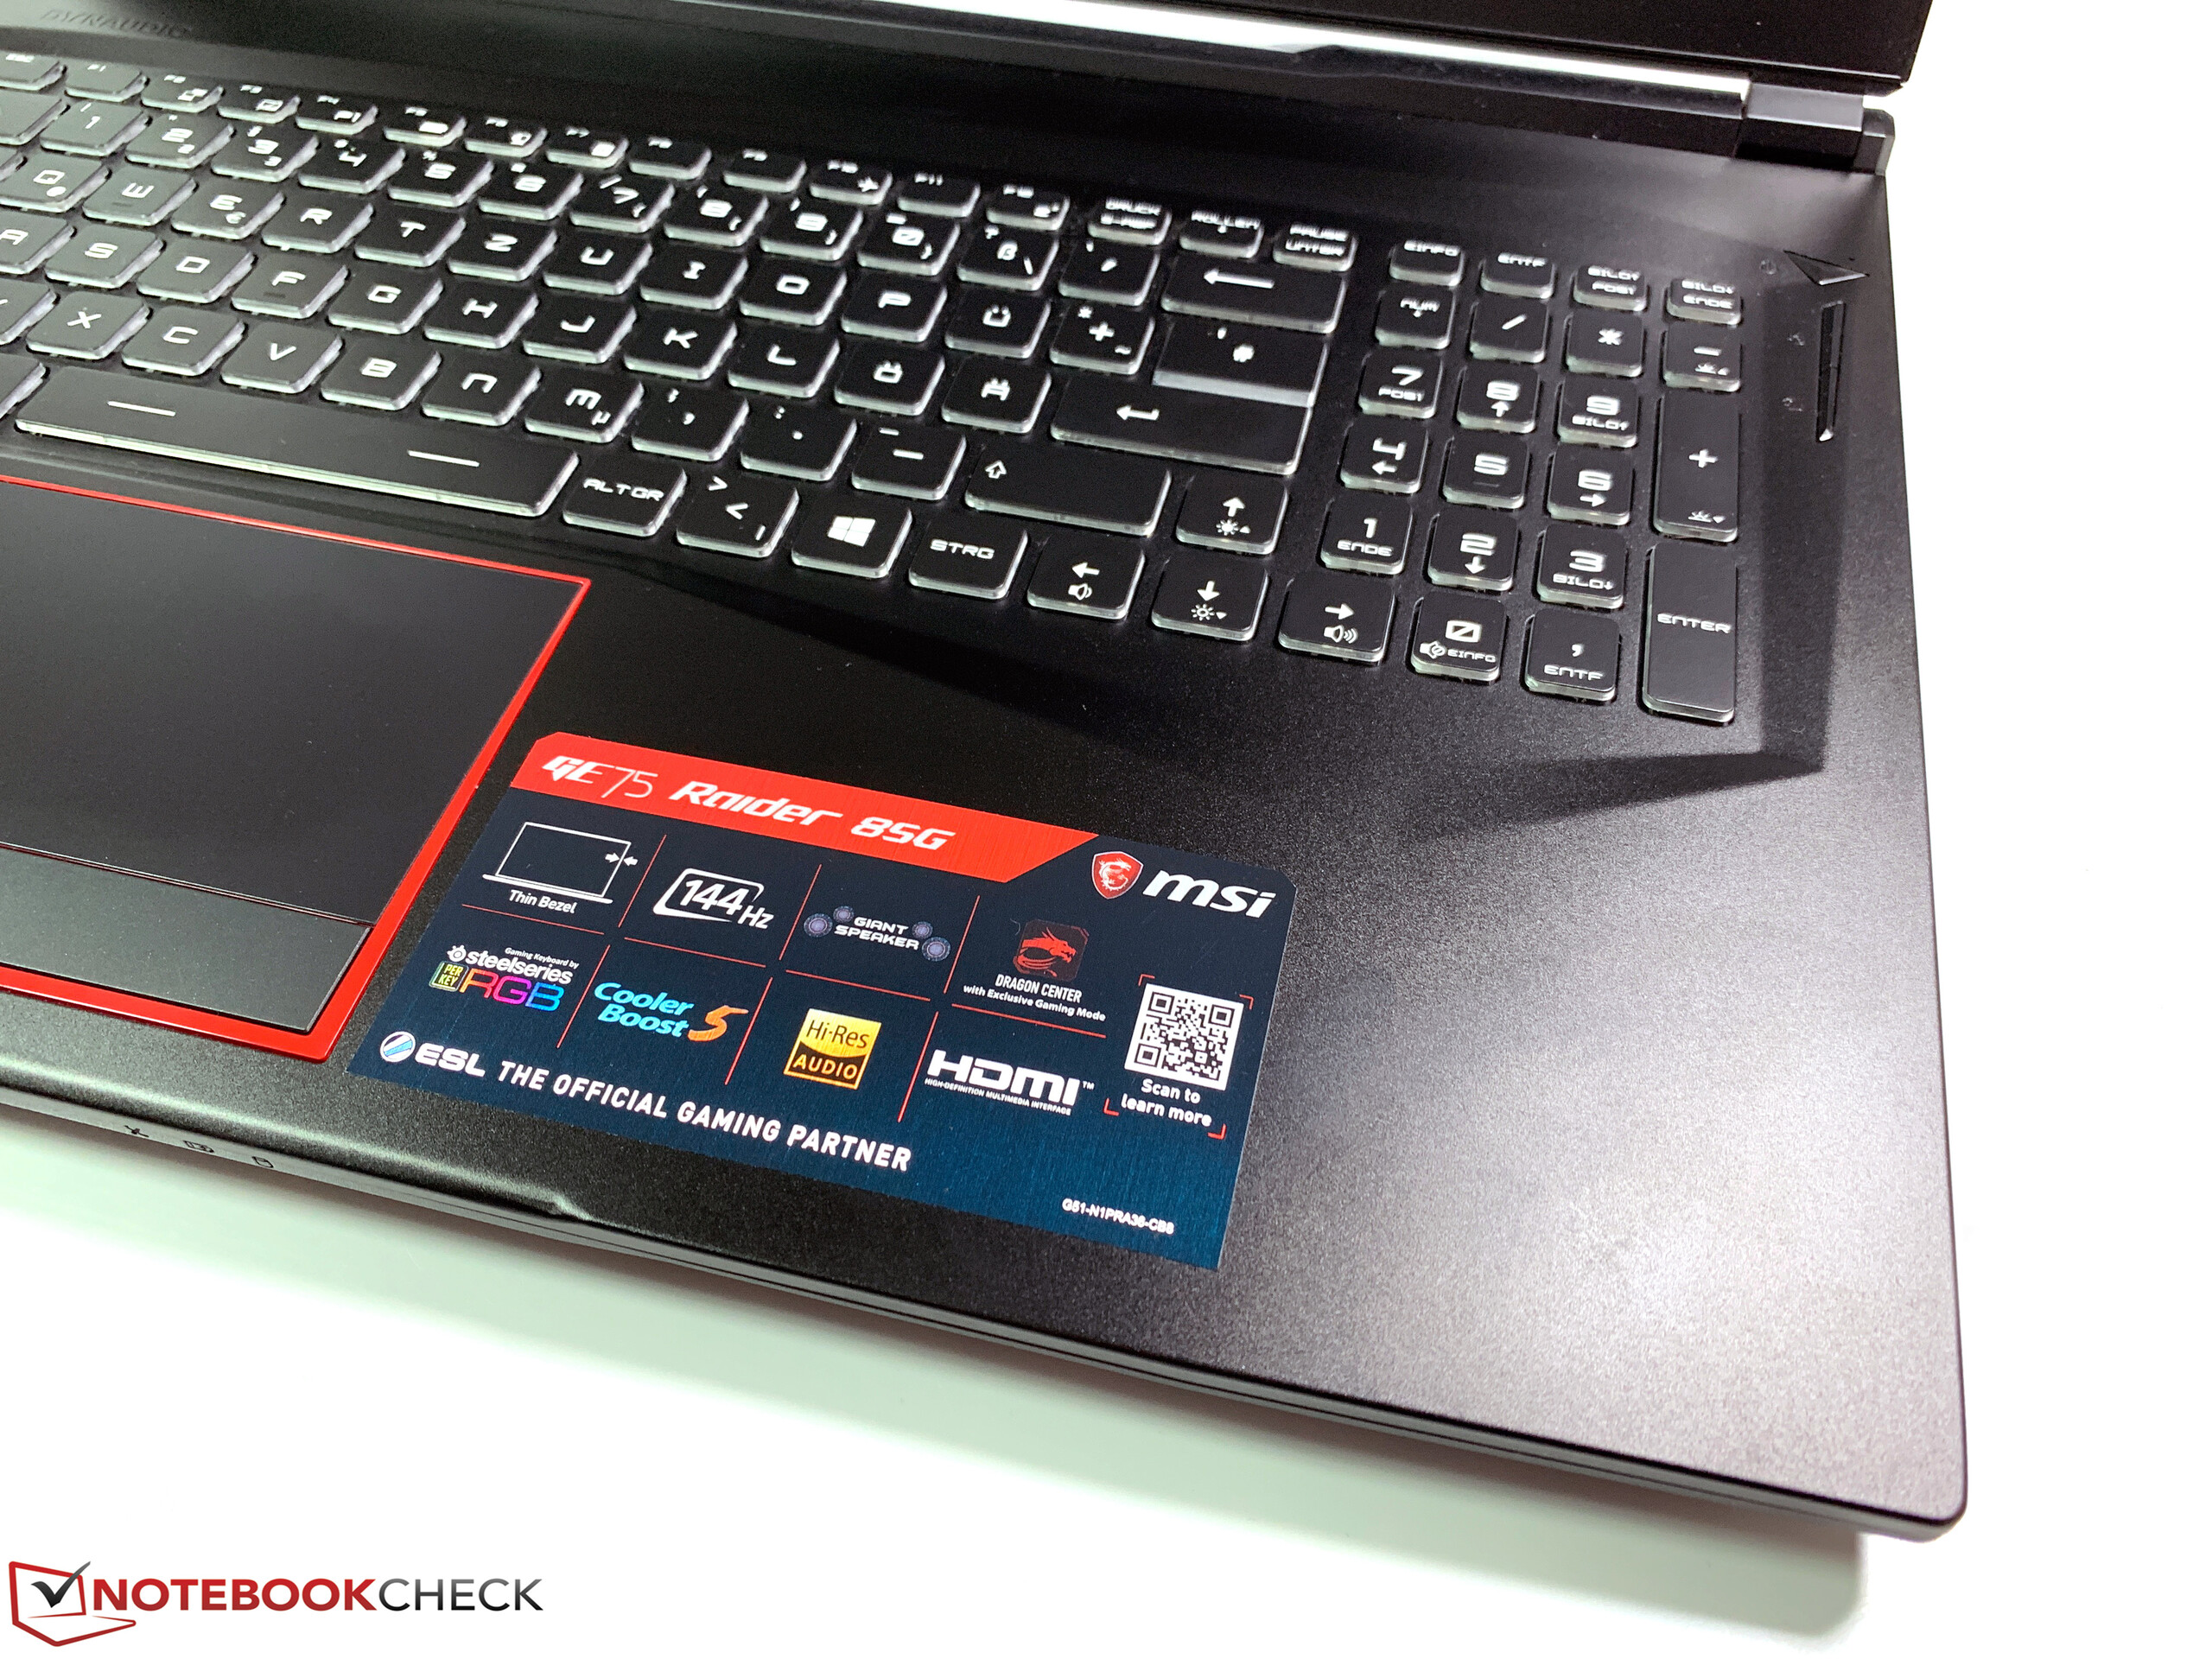
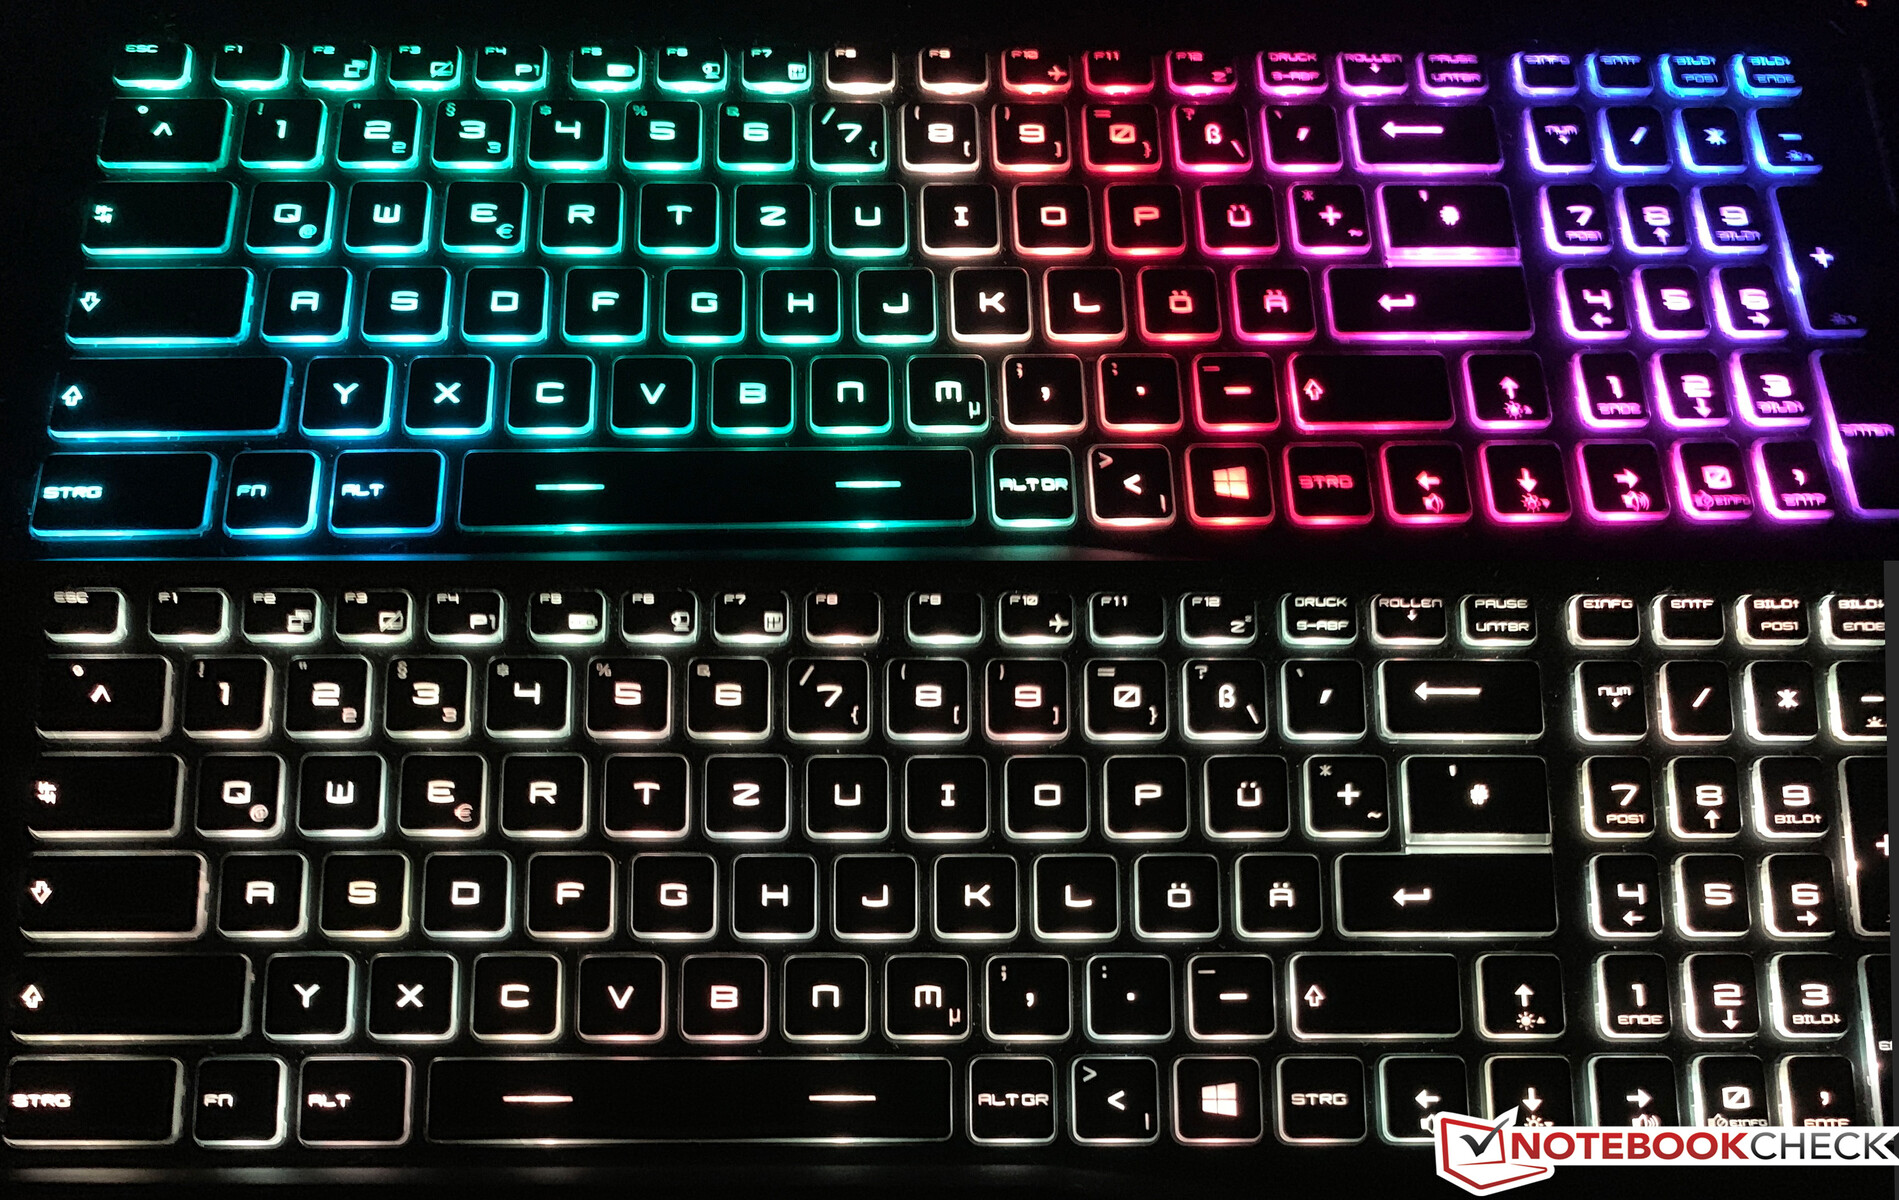
The highlight of the keyboard is obviously the per-key RGB illumination. You also get preconfigured patterns and even a kind or party mode, where the illumination changes all the time. However, these presets are hardly practical. Who needs constantly changing colors or color shifts during gaming? A lot of it is definitely for show, but you can fortunately configure it based on your preferences as well. The corresponding software is a bit fiddly and not always very intuitive.
There is not much left to say about the mechanics of the keyboard. MSI once again uses a SteelSeries keyboard and you will be happy about the very precise feedback with pretty quiet keystrokes, even though the layout takes a while to get used to.
Touchpad
The touchpad offers two dedicated mouse buttons, which are similar to the keyboard with their precise and quiet clicks. We did not experience any issues with the mouse replacement during the review, but the majority of users will probably use an external mouse for gaming.
Display
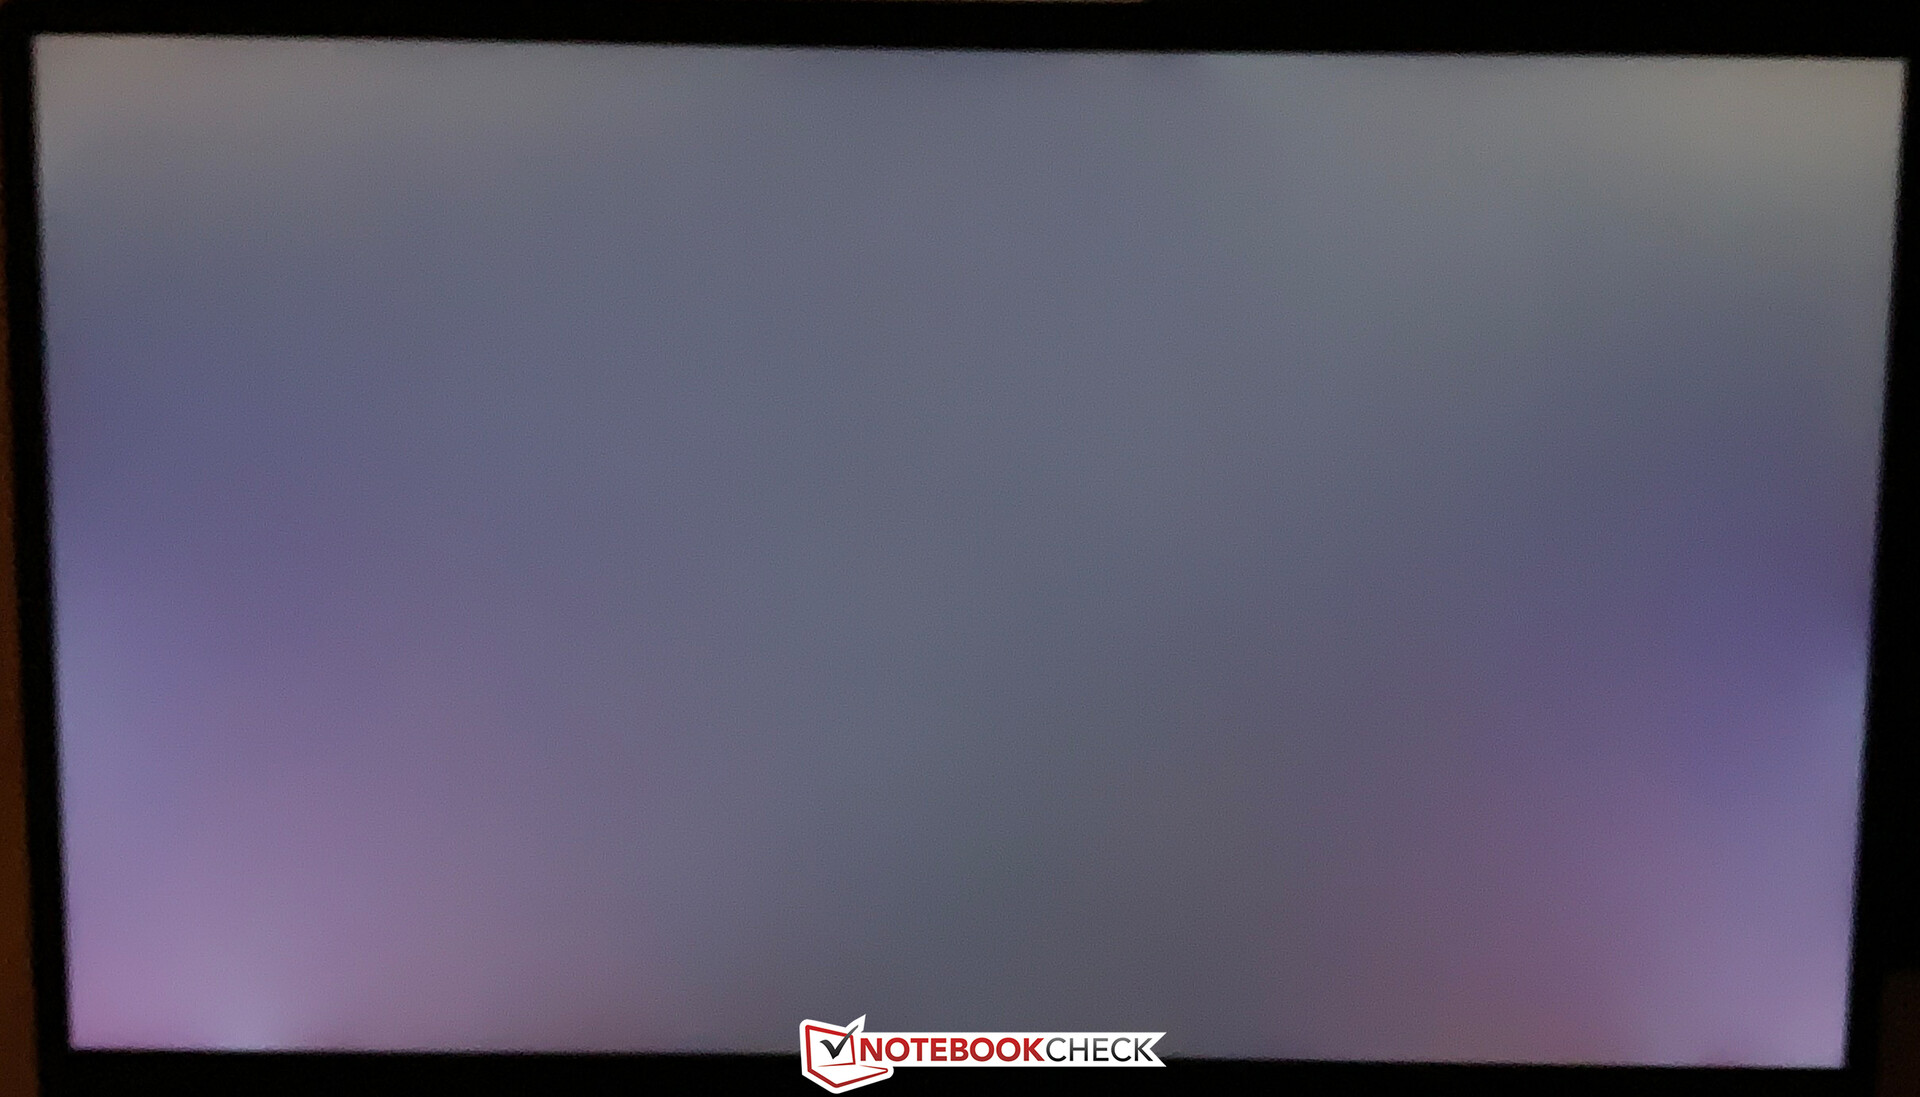
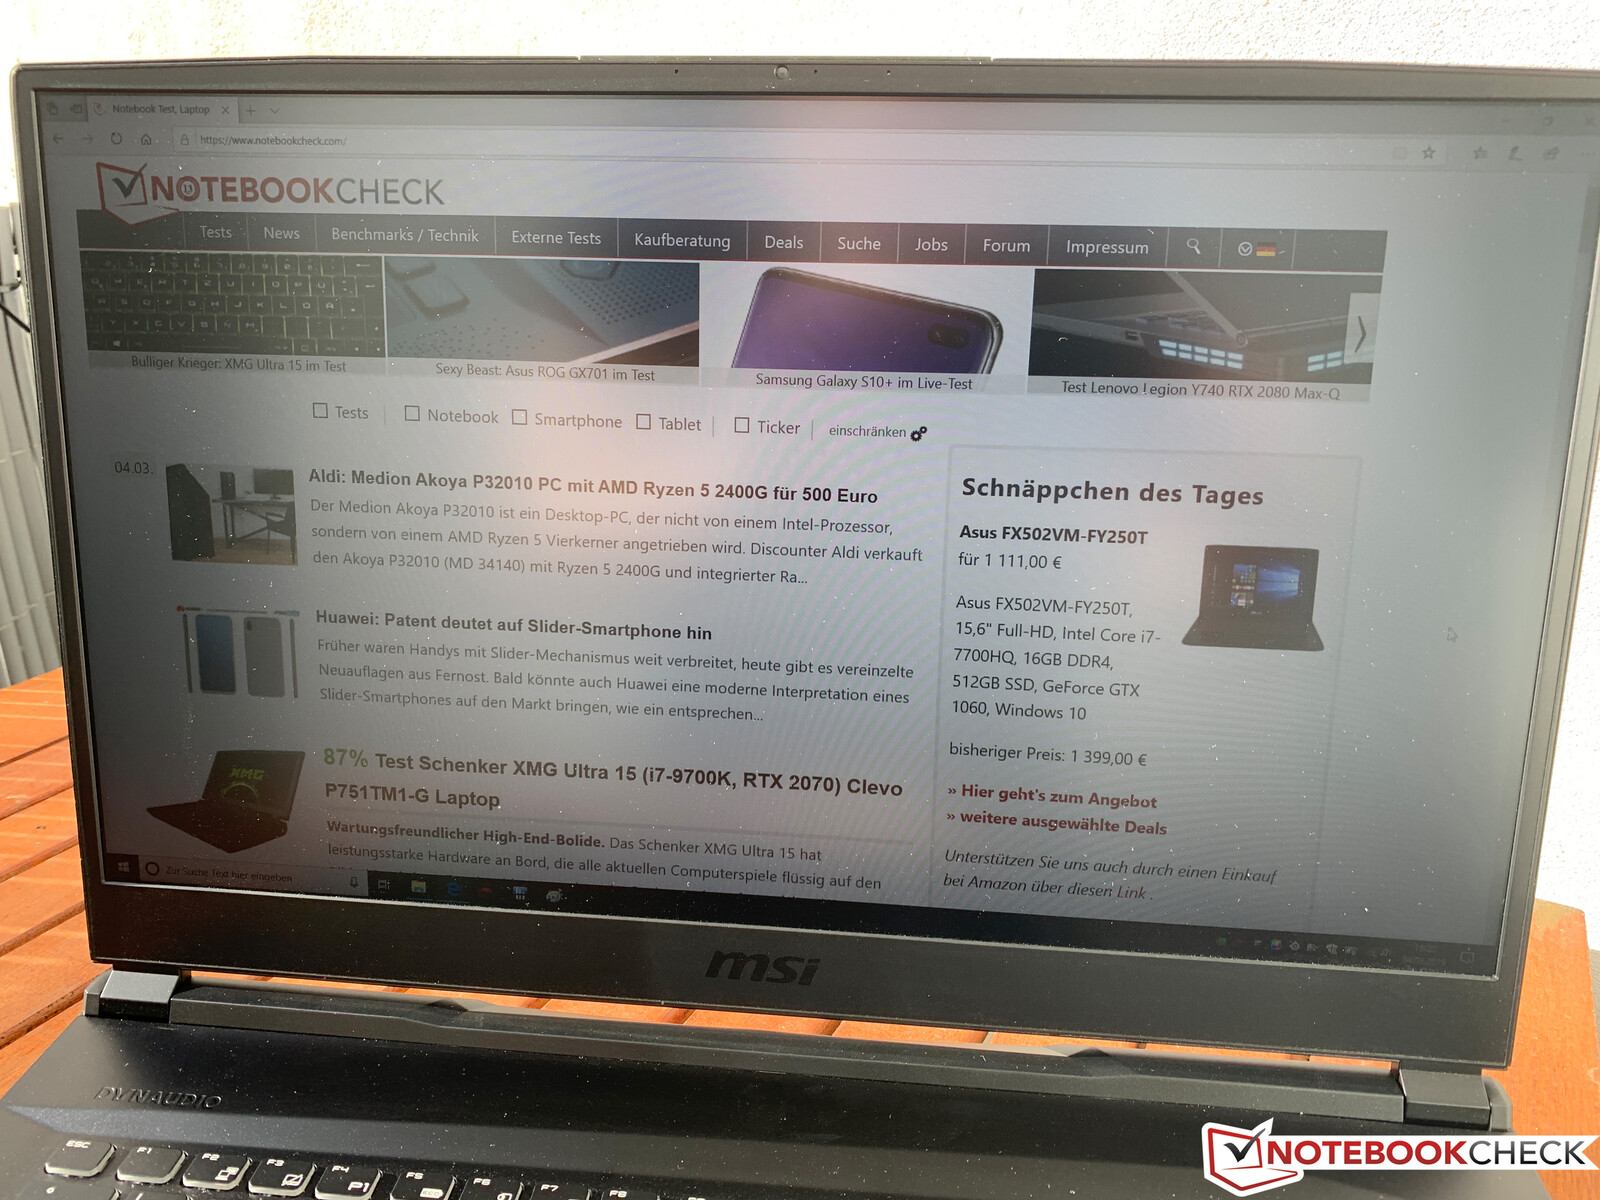
The MSI GE75 raider is only available with a fast 144 Hz panel from Chi Mei. The response times of the 1080p screen are also very good, so you can enjoy a responsive gaming experience. Nvidia's G-Sync technology, however, is not supported. MSI describes the panel as "Wide View (IPS grade)" in the spec sheet, so this is an AHVA panel. The subjective picture quality is excellent and the picture is not too grainy, despite the matte surface. You can set picture parameters or select presets in the provided TrueColor software. We used the preset "Gamer" for the following measurements.
Many gaming laptops typically manage a luminance of around 300 nits, which is confirmed by our comparison table. The MSI is a bit brighter at ~340 nits without noticeably increasing the black value. The resulting contrast ratio is very high and certainly helps with the good picture impression. We determined flickering of the background illumination at very low brightness levels, but the frequency is very high at 26 kHz and should not cause any problems.
| |||||||||||||||||||||||||
Brightness Distribution: 86 %
Center on Battery: 363 cd/m²
Contrast: 1344:1 (Black: 0.27 cd/m²)
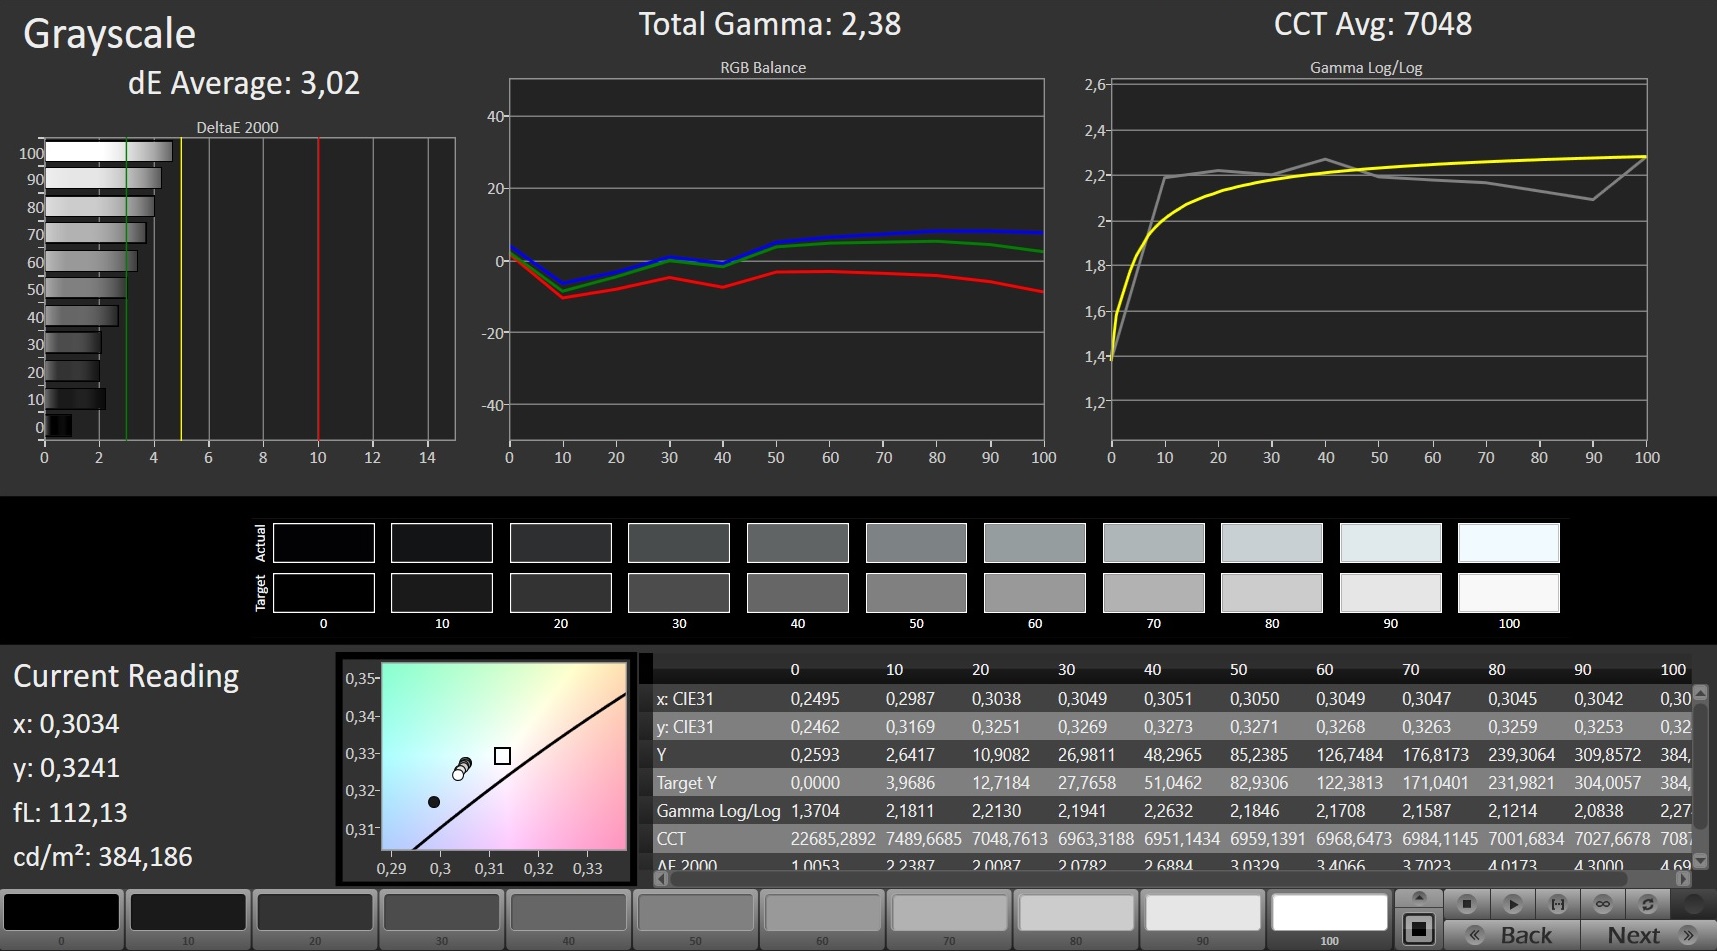
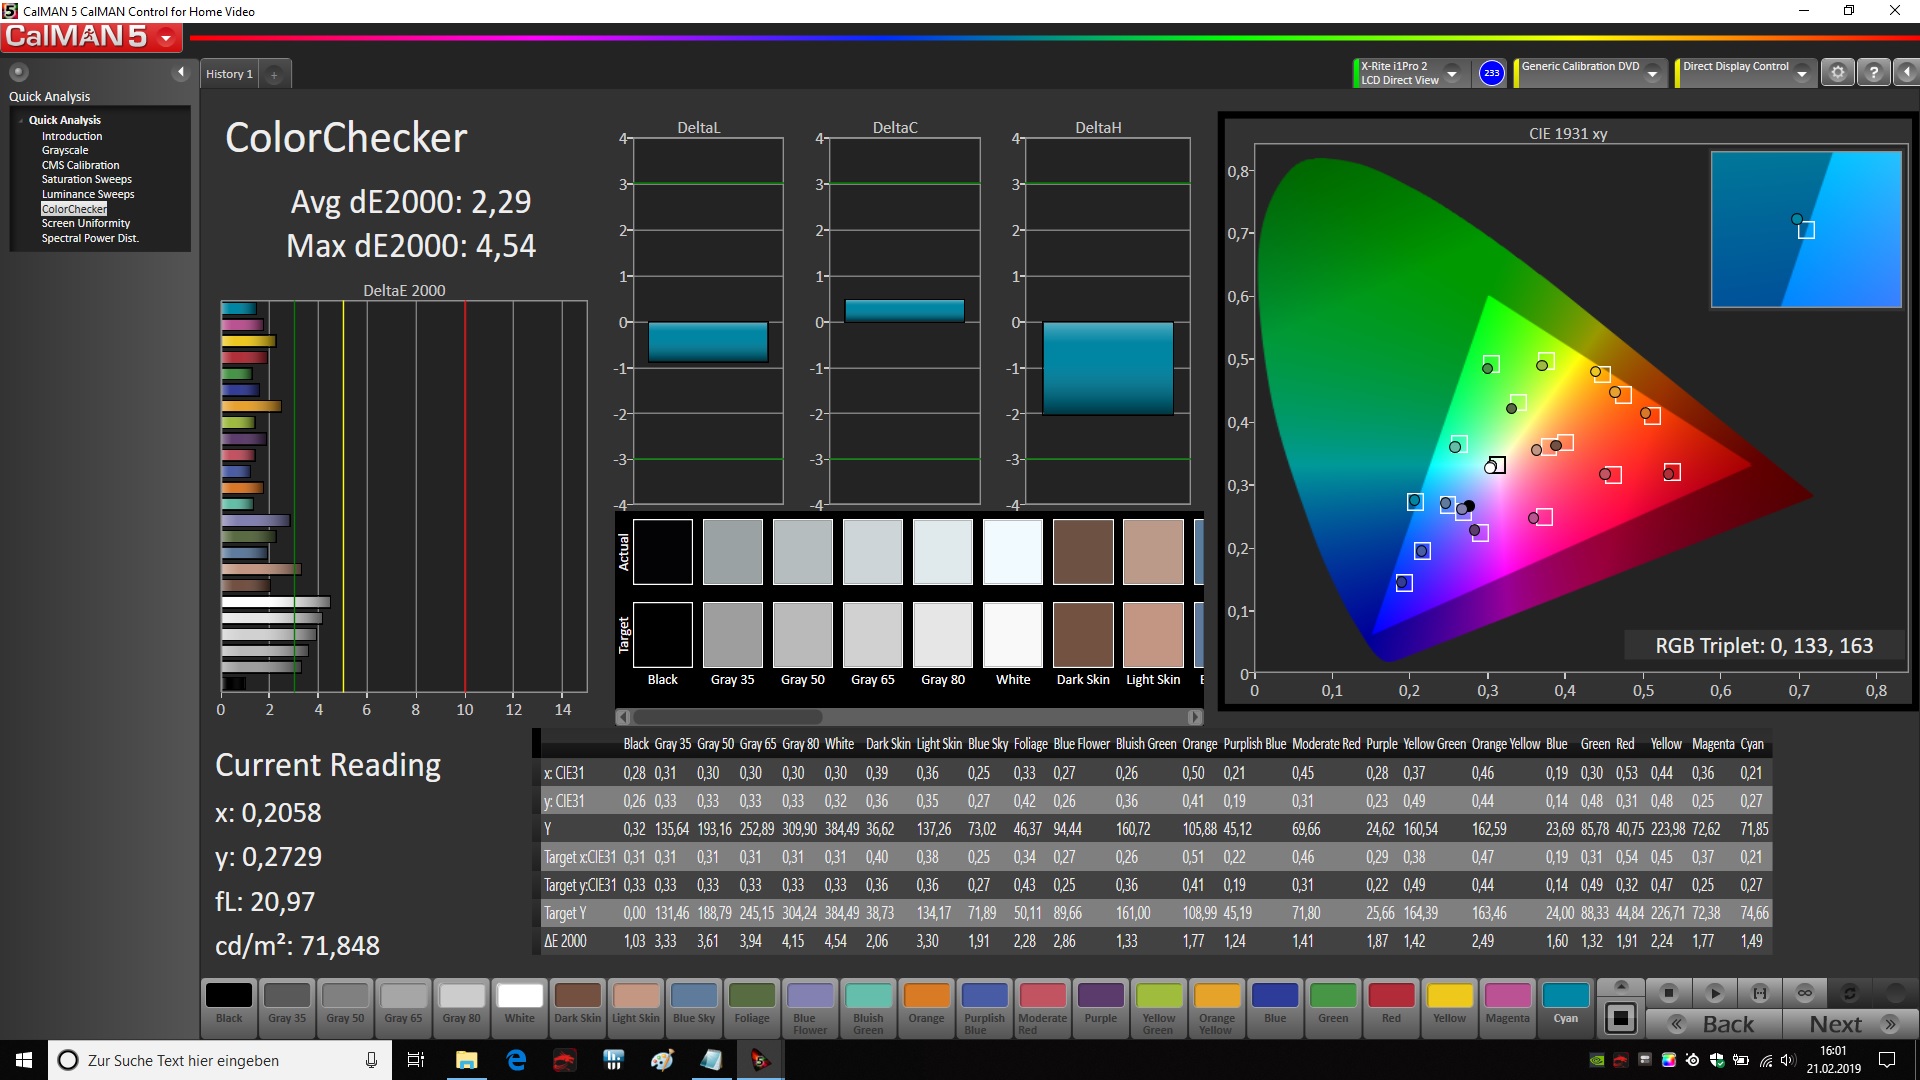
ΔE ColorChecker Calman: 2.29 | ∀{0.5-29.43 Ø4.72}
calibrated: 2.45
ΔE Greyscale Calman: 3.02 | ∀{0.09-98 Ø4.97}
91% sRGB (Argyll 1.6.3 3D)
58% AdobeRGB 1998 (Argyll 1.6.3 3D)
62.6% AdobeRGB 1998 (Argyll 3D)
91.2% sRGB (Argyll 3D)
60.6% Display P3 (Argyll 3D)
Gamma: 2.38
CCT: 7048 K
| MSI GE75 8SG Raider CMN N173HCE-G33 (CMN175C), , 1920x1080, 17.3" | Asus Zephyrus S GX701GX B173HAN04.0 (AUO409D), , 1920x1080, 17.3" | Lenovo Legion Y740-17ICH AU Optronics B173HAN03.2, , 1920x1080, 17.3" | Asus ROG Strix Scar II GL704GW B173HAN04.0 (AUO409D), , 1920x1080, 17.3" | MSI GS73 Stealth 8RF-011 CMN N173HHE-G32 (CMN1747), , 1920x1080, 17.3" | MSI GE75 8SF Chi Mei N173HCE-G33, , 1920x1080, 17.3" | |
|---|---|---|---|---|---|---|
| Display | 1% | 3% | 1% | 32% | 4% | |
| Display P3 Coverage (%) | 60.6 | 62.9 4% | 64 6% | 62.9 4% | 90.8 50% | 63.1 4% |
| sRGB Coverage (%) | 91.2 | 87.8 -4% | 90.4 -1% | 87.1 -4% | 99.9 10% | 94.4 4% |
| AdobeRGB 1998 Coverage (%) | 62.6 | 63.9 2% | 64.8 4% | 63.7 2% | 85.8 37% | 65.2 4% |
| Response Times | 3% | -67% | -71% | 18% | -17% | |
| Response Time Grey 50% / Grey 80% * (ms) | 8 ? | 7.2 ? 10% | 15.6 ? -95% | 17.6 ? -120% | 7.8 ? 2% | 9.6 ? -20% |
| Response Time Black / White * (ms) | 9.2 ? | 9.6 ? -4% | 12.8 ? -39% | 11.2 ? -22% | 6.2 ? 33% | 10.4 ? -13% |
| PWM Frequency (Hz) | 26040 ? | 25510 ? | 25770 ? | |||
| Screen | 3% | -43% | -8% | -9% | 17% | |
| Brightness middle (cd/m²) | 363 | 288 -21% | 299.1 -18% | 295 -19% | 262 -28% | 370.4 2% |
| Brightness (cd/m²) | 342 | 287 -16% | 273 -20% | 291 -15% | 261 -24% | 348 2% |
| Brightness Distribution (%) | 86 | 91 6% | 81 -6% | 96 12% | 94 9% | 89 3% |
| Black Level * (cd/m²) | 0.27 | 0.2 26% | 0.27 -0% | 0.24 11% | 0.2 26% | 0.29 -7% |
| Contrast (:1) | 1344 | 1440 7% | 1108 -18% | 1229 -9% | 1310 -3% | 1277 -5% |
| Colorchecker dE 2000 * | 2.29 | 2.33 -2% | 5.07 -121% | 3.2 -40% | 3.96 -73% | 1.26 45% |
| Colorchecker dE 2000 max. * | 4.54 | 5.34 -18% | 10.55 -132% | 6.64 -46% | 7.29 -61% | 3.02 33% |
| Colorchecker dE 2000 calibrated * | 2.45 | 2.47 -1% | 3.31 -35% | 2.52 -3% | 2.18 11% | 1.21 51% |
| Greyscale dE 2000 * | 3.02 | 1.19 61% | 6.8 -125% | 2.16 28% | 3.09 -2% | 1.4 54% |
| Gamma | 2.38 92% | 2.41 91% | 2.46 89% | 2.46 89% | 2.48 89% | 2.2 100% |
| CCT | 7048 92% | 6710 97% | 7805 83% | 6872 95% | 6977 93% | 6747 96% |
| Color Space (Percent of AdobeRGB 1998) (%) | 58 | 57 -2% | 58.5 1% | 57 -2% | 76 31% | 59.7 3% |
| Color Space (Percent of sRGB) (%) | 91 | 88 -3% | 89.9 -1% | 87 -4% | 100 10% | 94.4 4% |
| Total Average (Program / Settings) | 2% /
3% | -36% /
-38% | -26% /
-14% | 14% /
2% | 1% /
10% |
* ... smaller is better
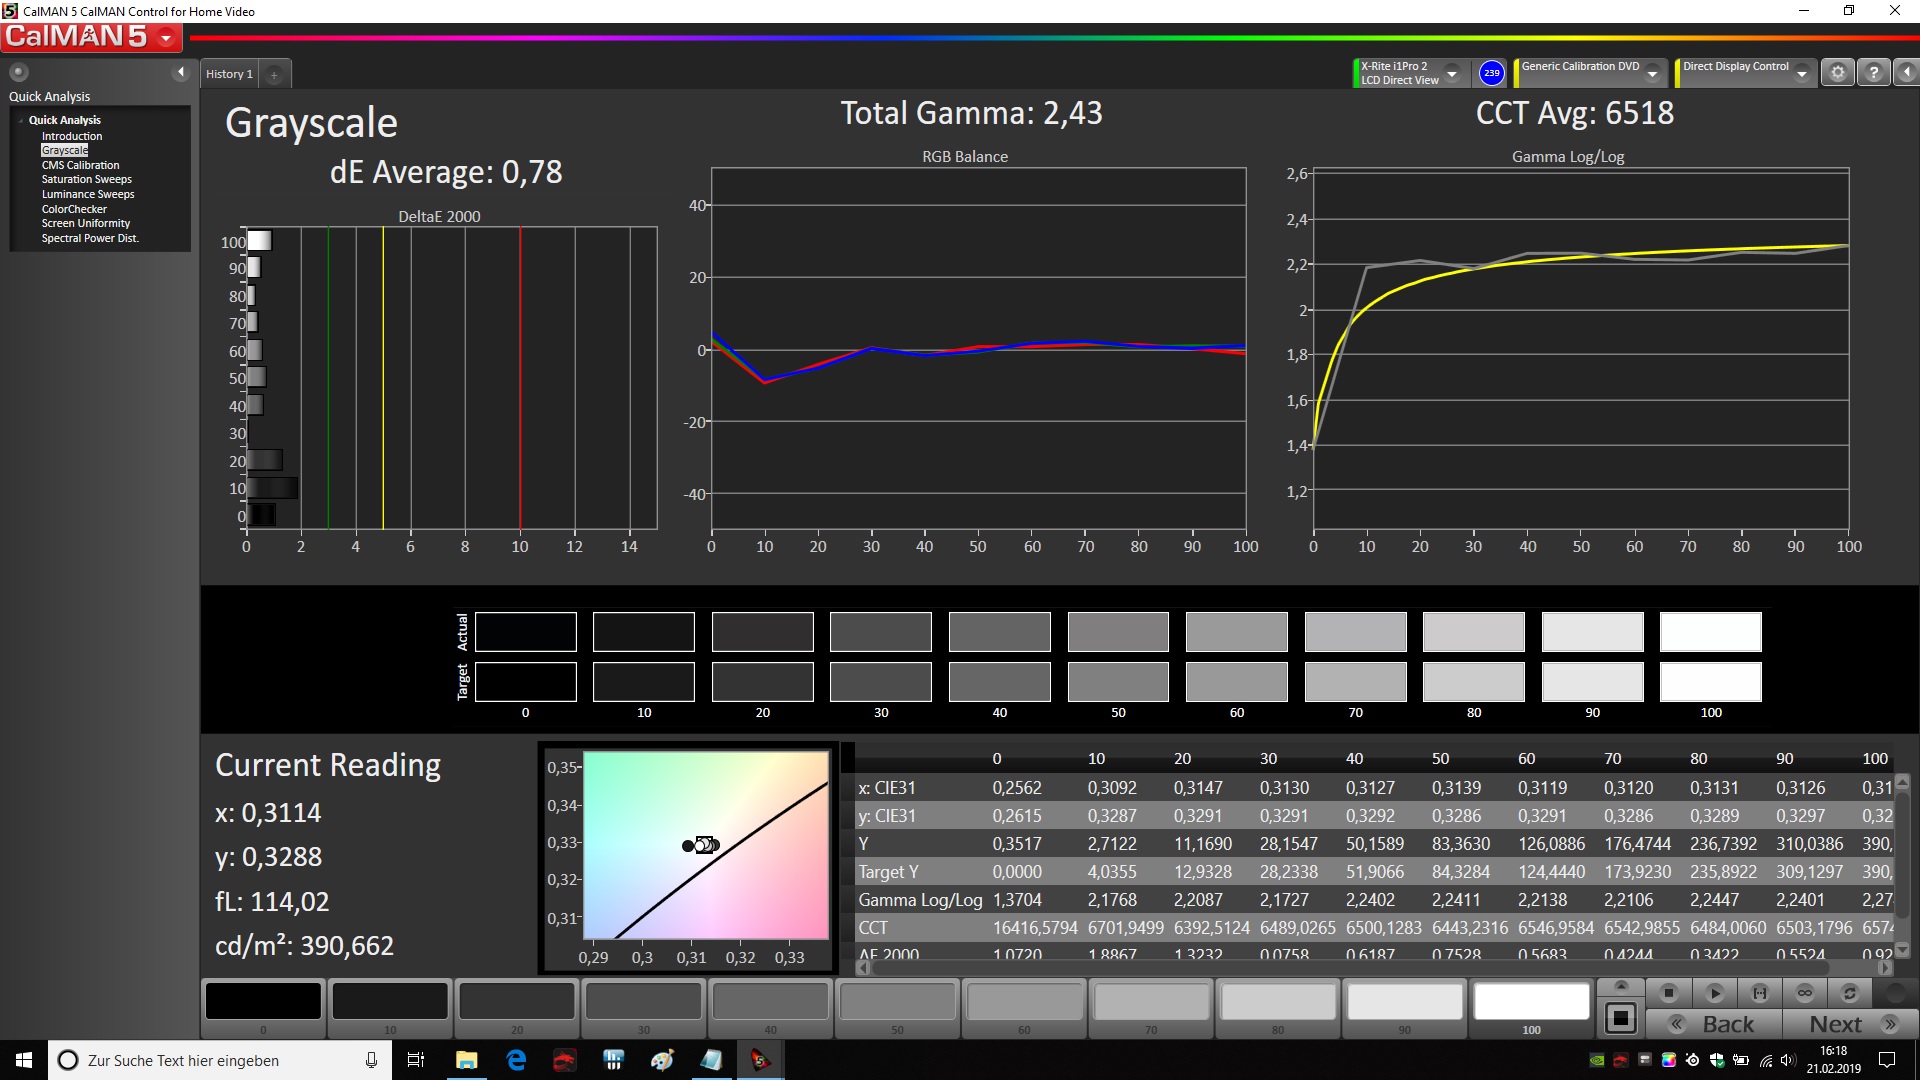
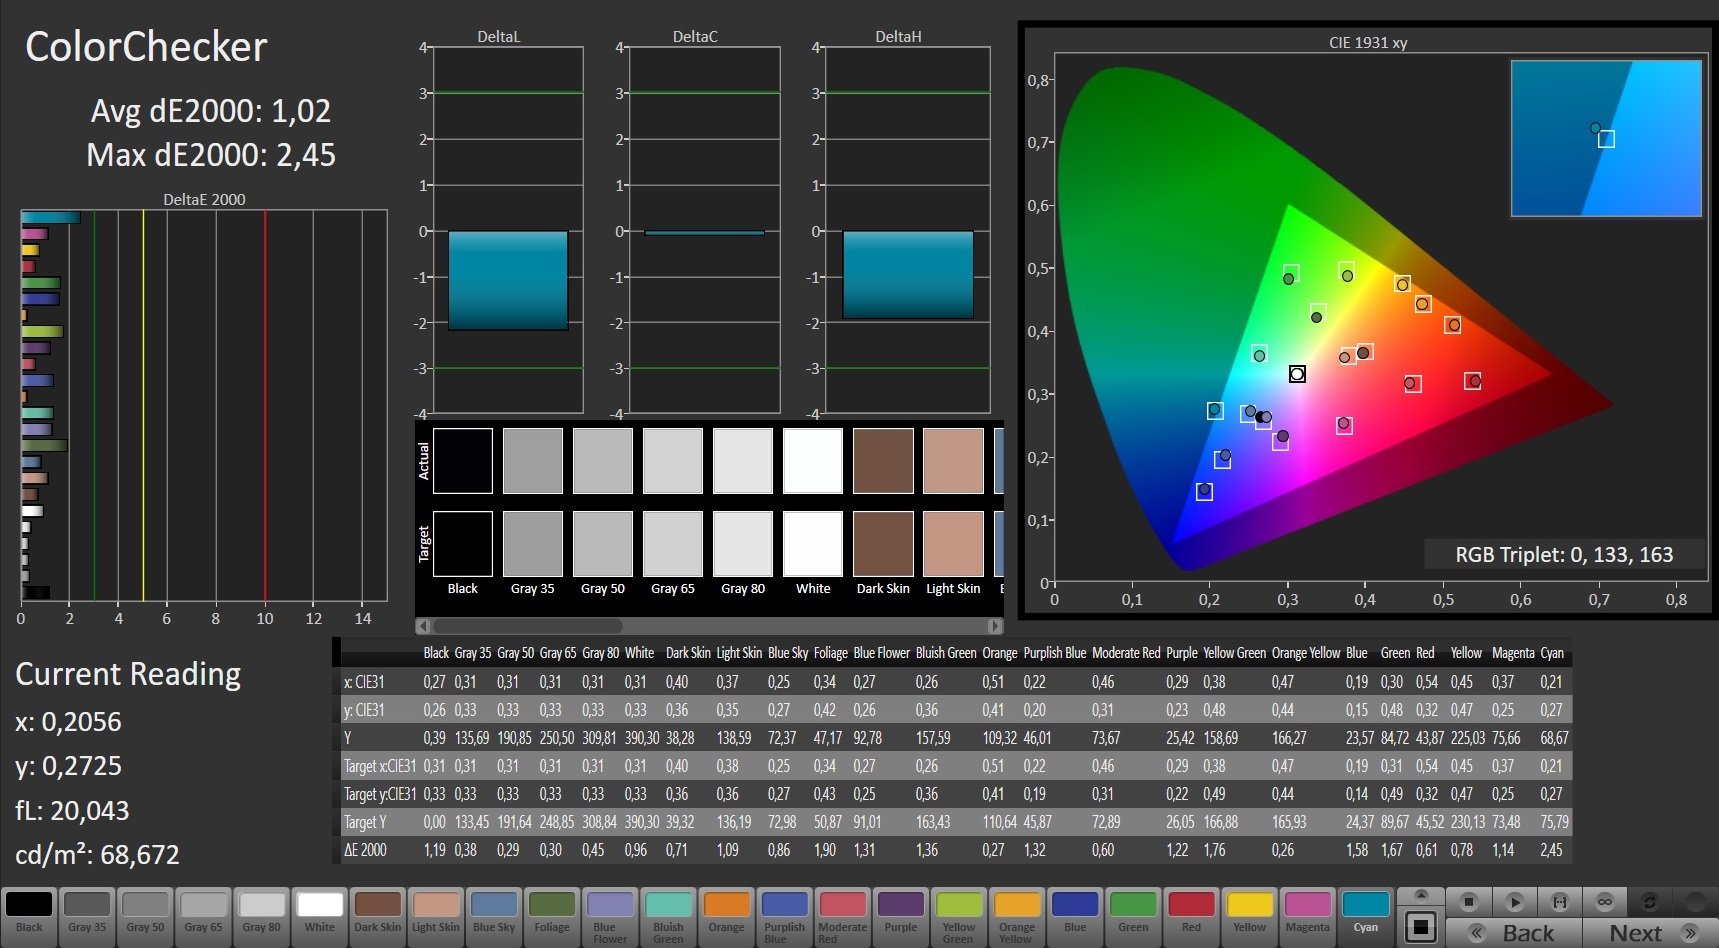
Our additional measurements confirm that this is a high-quality panel. The deviations of the grayscale and the colors are already within the target range and a calibration is not required. There is a slight color cast in the grayscale towards blue/green, but it is only visible when you directly compare it to a calibrated panel. You can further improve the results with a calibration and the corresponding profile is linked in the box above and can be downloaded for free.
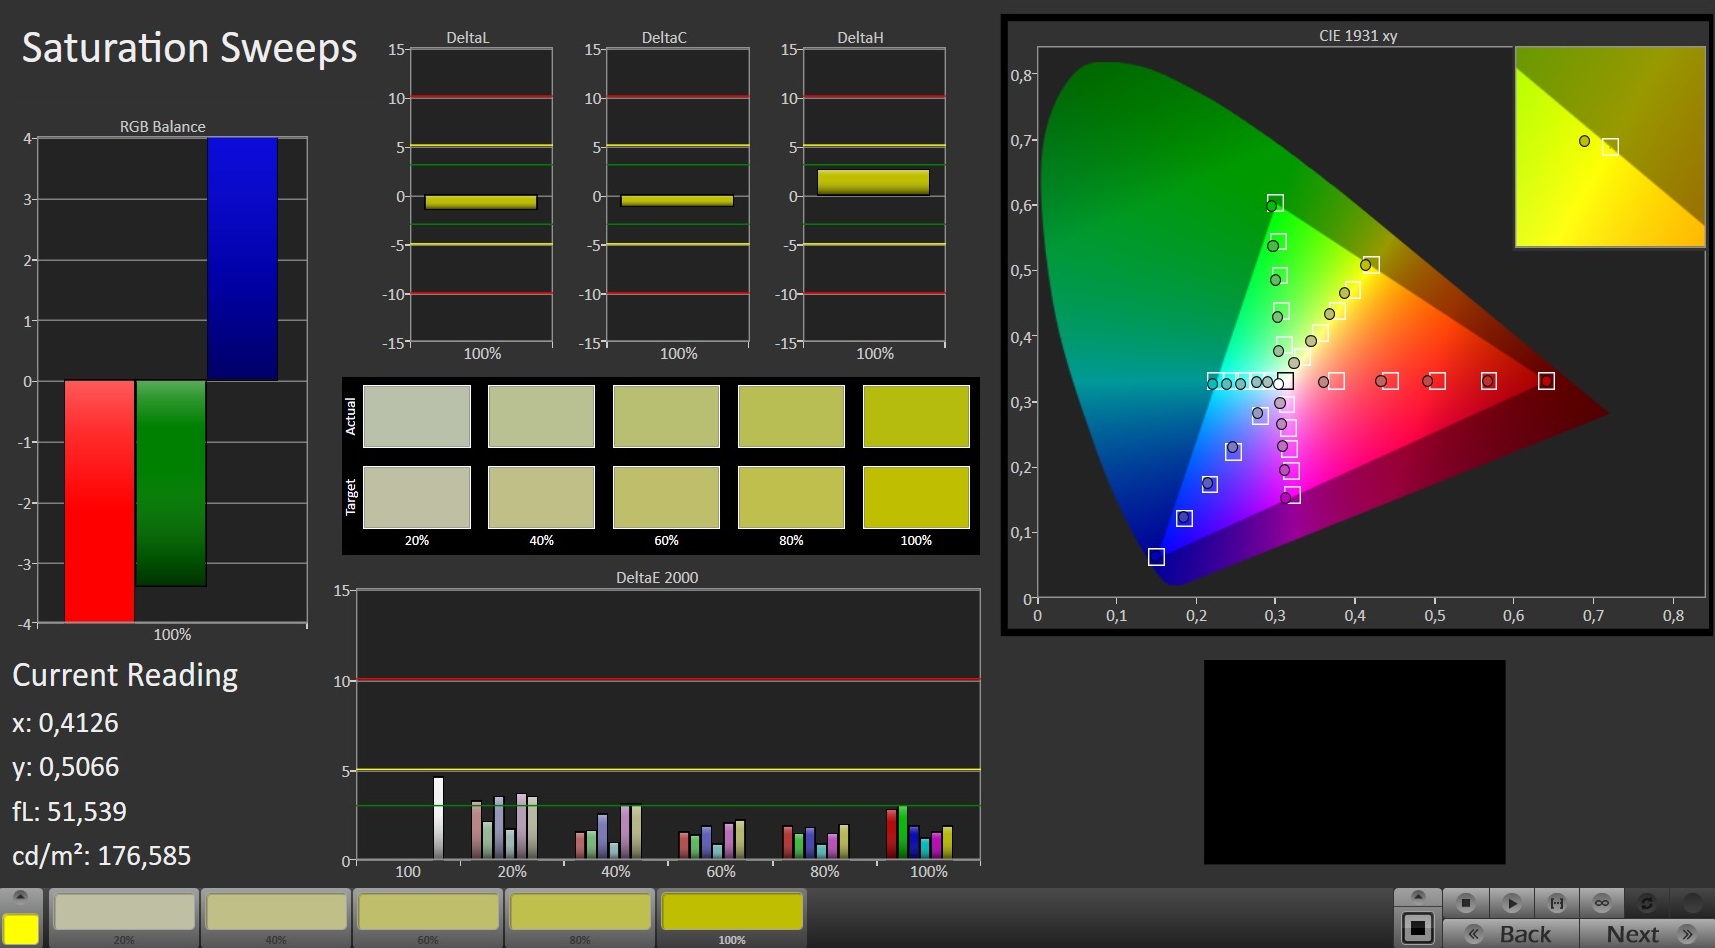
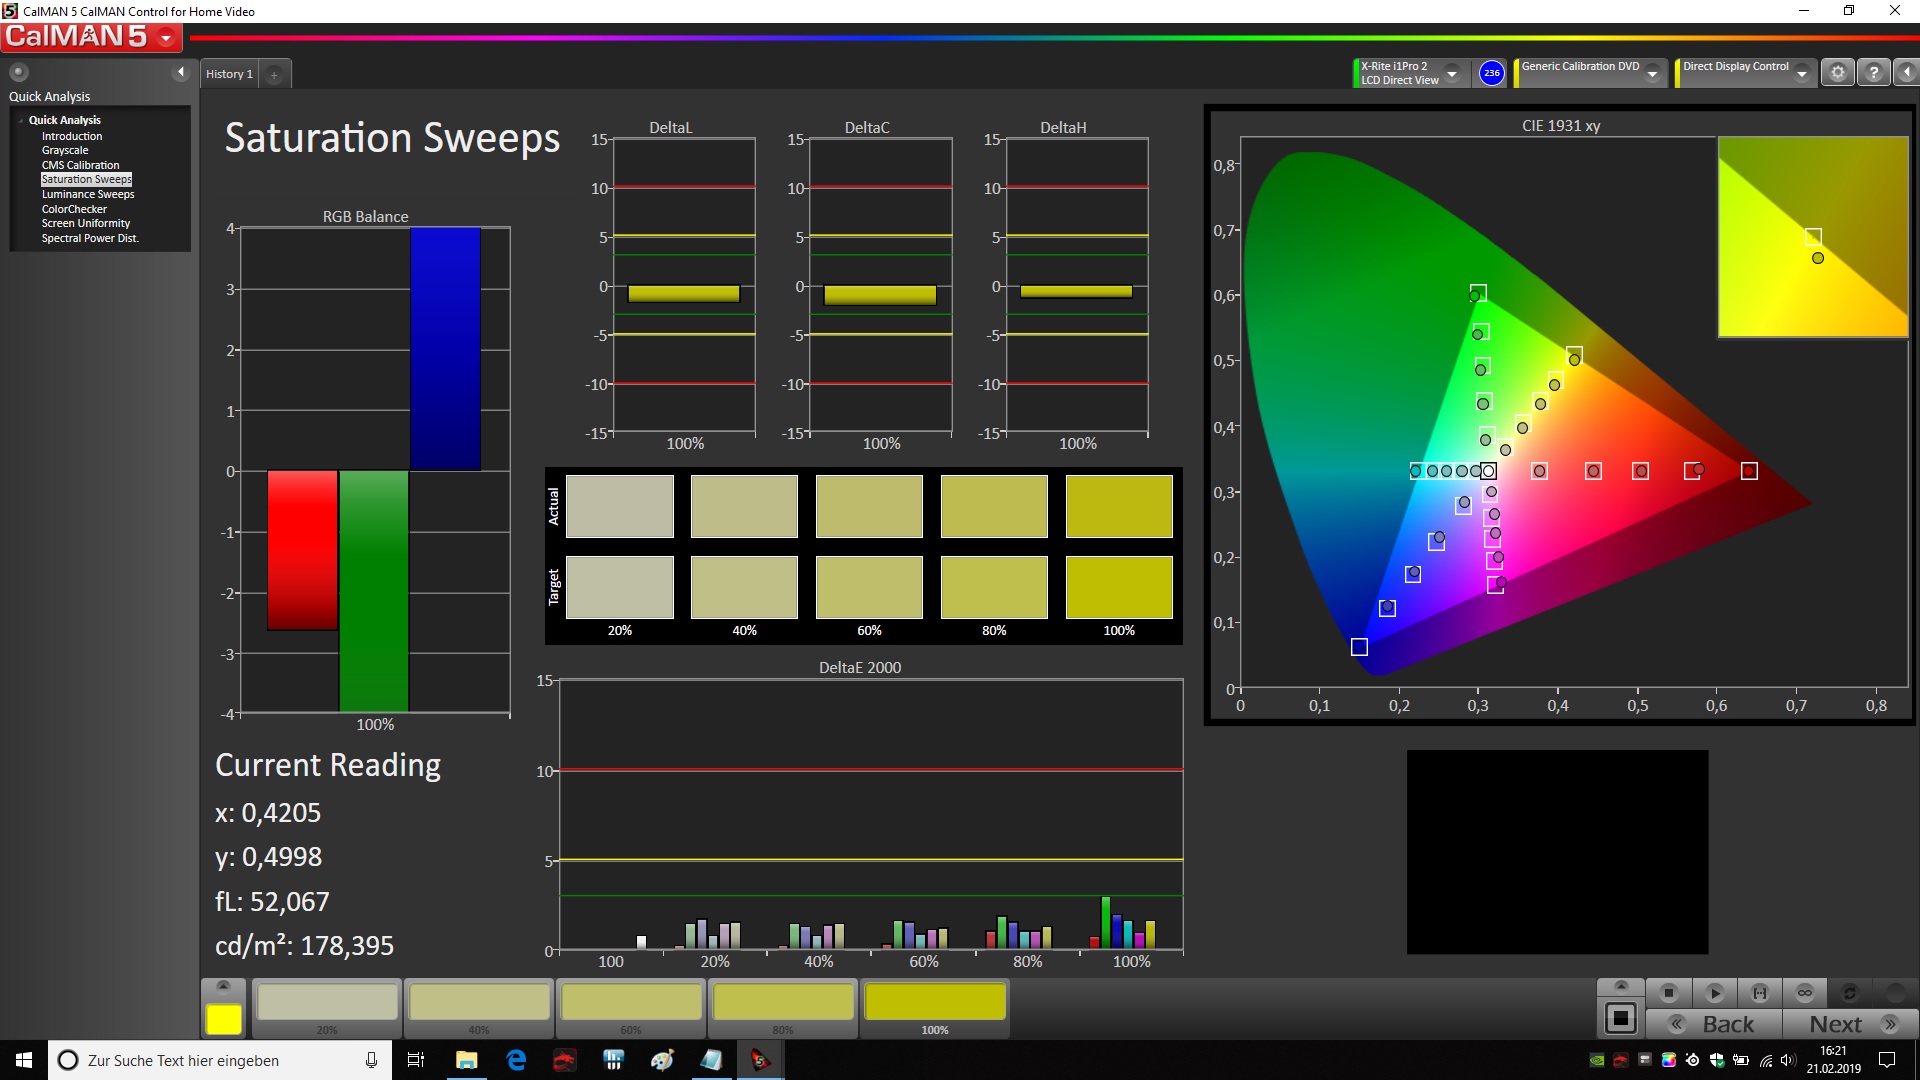
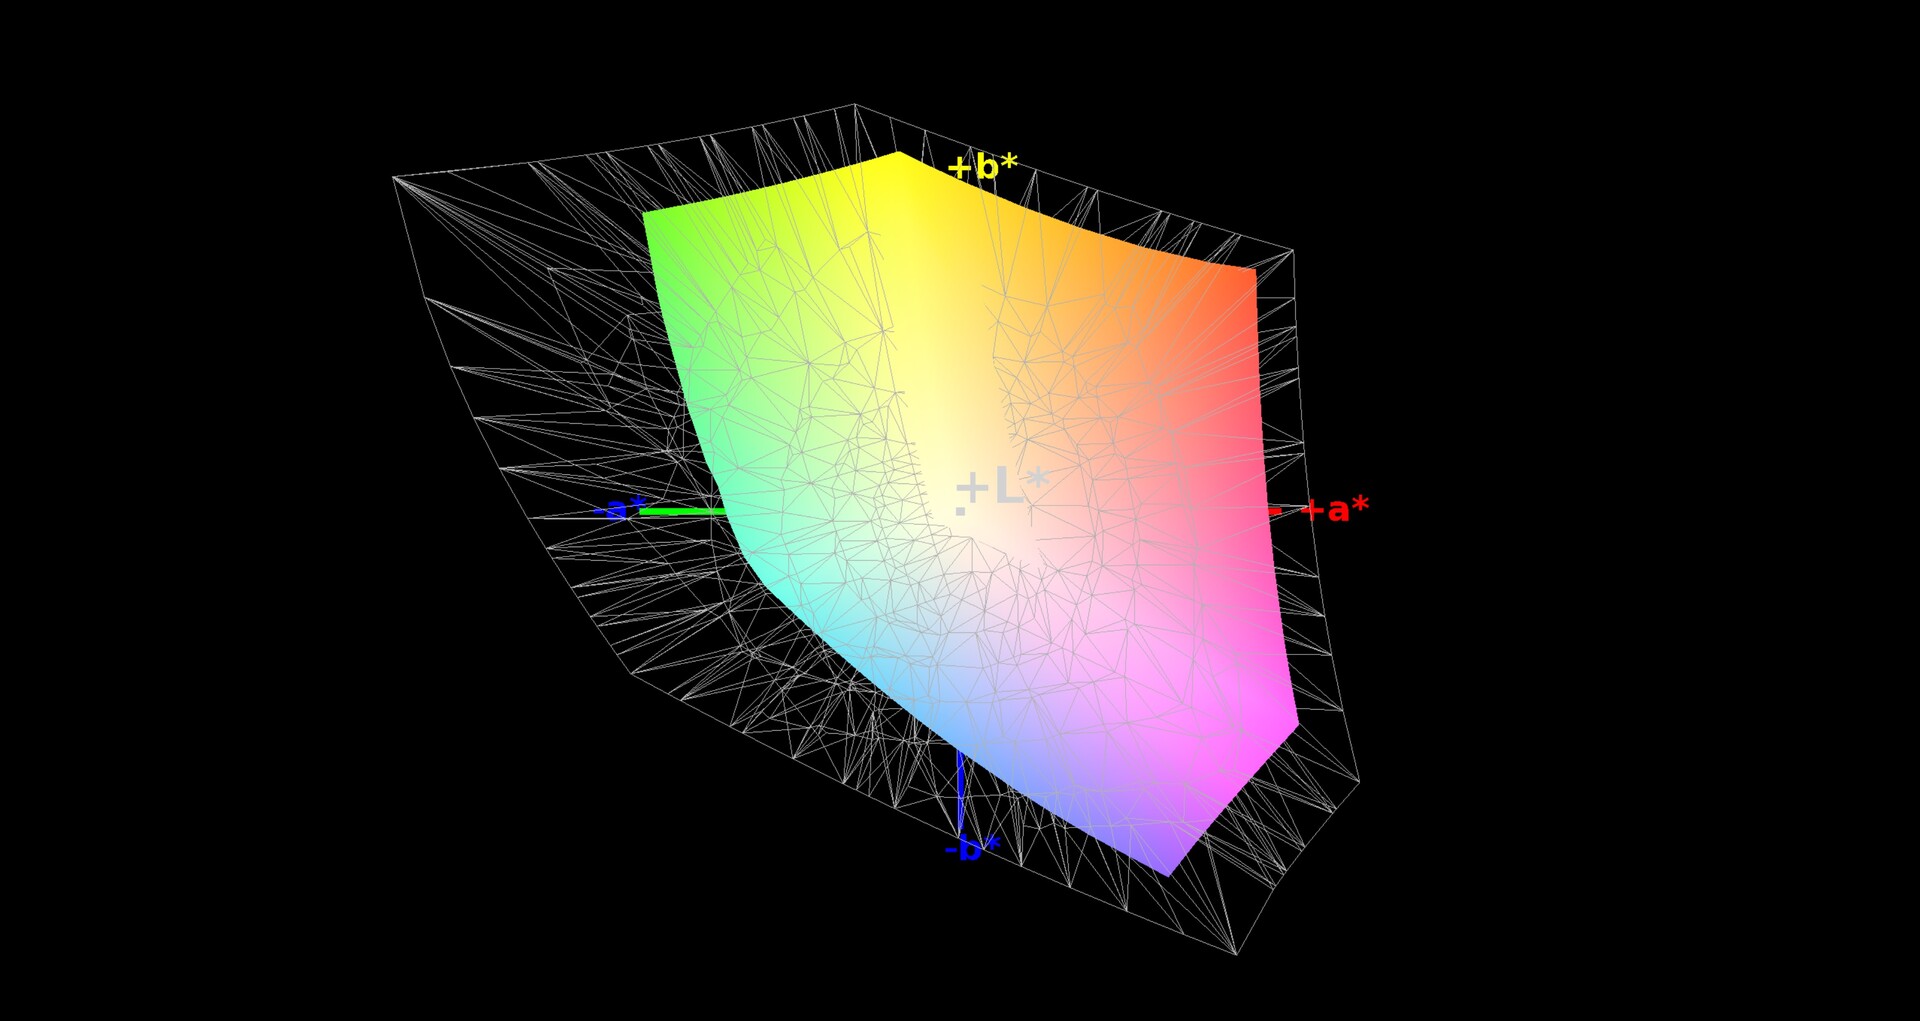
The color gamut is on the usual level and is completely sufficient for gaming. Only graphics artists that want to work in the AdobeRGB color space will require an external display.

Display Response Times
| ↔ Response Time Black to White | ||
|---|---|---|
| 9.2 ms ... rise ↗ and fall ↘ combined | ↗ 4.8 ms rise | 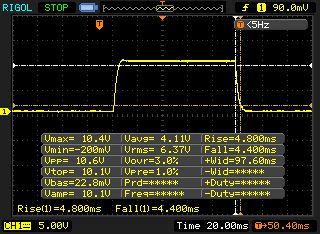 |
| ↘ 4.4 ms fall | ||
| The screen shows fast response rates in our tests and should be suited for gaming. In comparison, all tested devices range from 0.1 (minimum) to 240 (maximum) ms. » 26 % of all devices are better. This means that the measured response time is better than the average of all tested devices (19.8 ms). | ||
| ↔ Response Time 50% Grey to 80% Grey | ||
| 8 ms ... rise ↗ and fall ↘ combined | ↗ 4 ms rise | 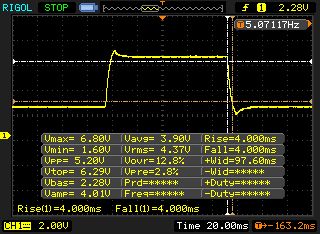 |
| ↘ 4 ms fall | ||
| The screen shows fast response rates in our tests and should be suited for gaming. In comparison, all tested devices range from 0.165 (minimum) to 636 (maximum) ms. » 21 % of all devices are better. This means that the measured response time is better than the average of all tested devices (31 ms). | ||
Screen Flickering / PWM (Pulse-Width Modulation)
| Screen flickering / PWM detected | 26040 Hz | ≤ 17 % brightness setting | 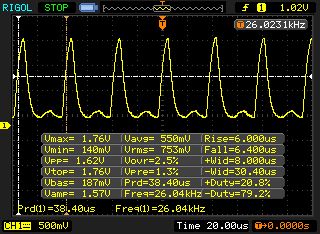 |
The display backlight flickers at 26040 Hz (worst case, e.g., utilizing PWM) Flickering detected at a brightness setting of 17 % and below. There should be no flickering or PWM above this brightness setting. The frequency of 26040 Hz is quite high, so most users sensitive to PWM should not notice any flickering. In comparison: 52 % of all tested devices do not use PWM to dim the display. If PWM was detected, an average of 7750 (minimum: 5 - maximum: 343500) Hz was measured. | |||
The combination of a matte panel and the good luminance obviously helps in bright environments. You can comfortably see the content as long as you can avoid direct reflections from light sources on the panel. There are no major issues with the viewing angle stability, either. You can notice a slightly brighter picture from wide angles, but this is no problem in practice.

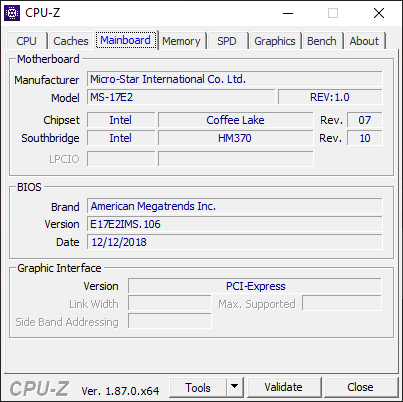
Performance
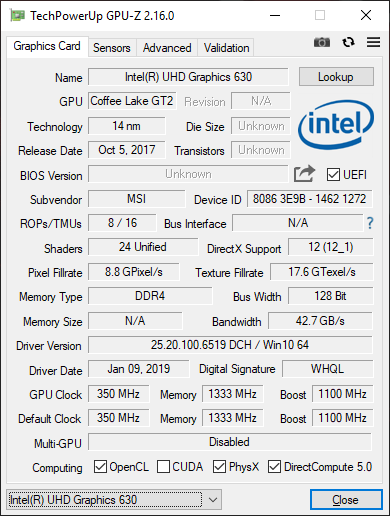
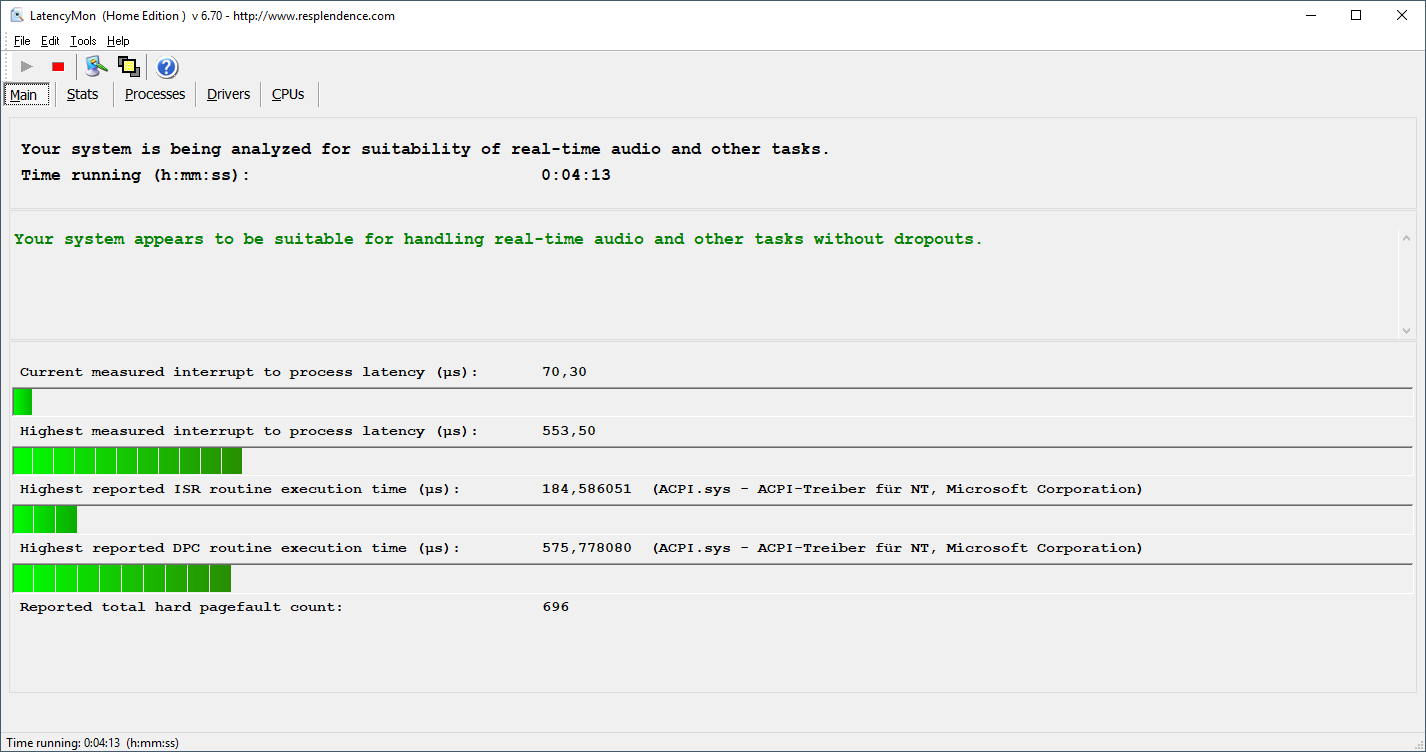
MSI currently offers three SKUs of the GE75 Raider. All of them are equipped with the same Core i7 CPU, but there are differences in terms of storage, memory, and GPU (RTX 2060, RTX 2070 or RTX 2080). There are no latency issues and the lack of G-Sync means that the integrated UHD Graphics 630 takes care of the graphics calculations in less demanding scenarios.
Note: We performed the following benchmarks and emission measurements with the Shift setting "Comfort" as well as the fan setting "Auto" (DragonCenter).
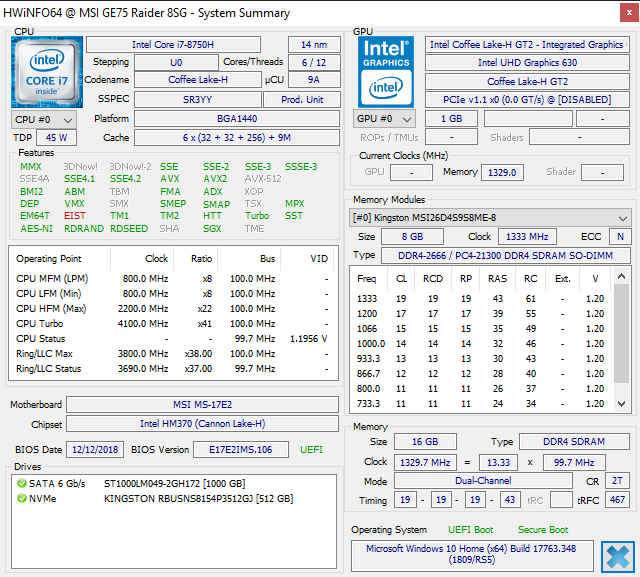
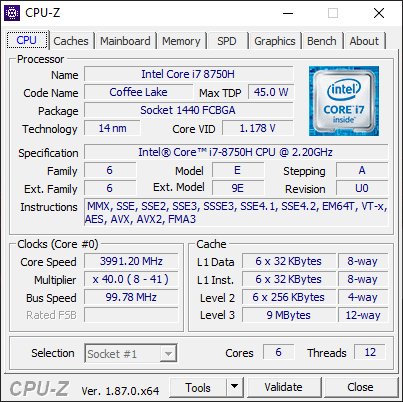
Processor – i7-8750H
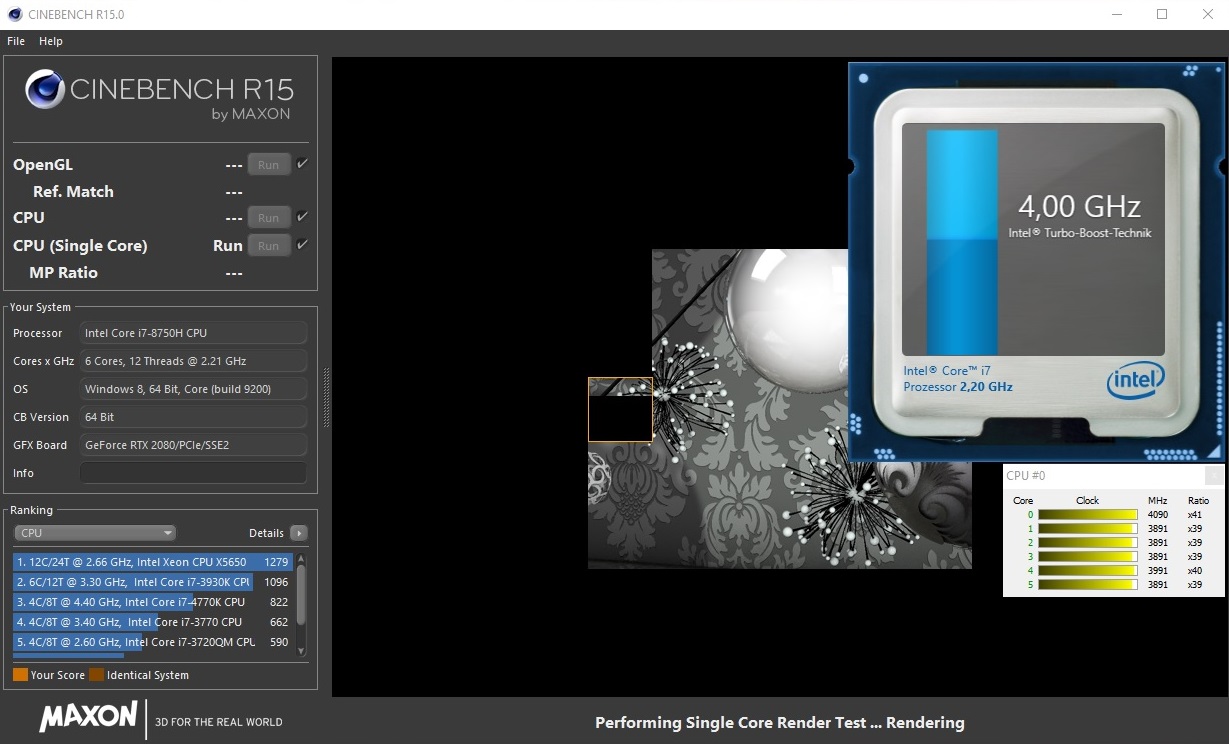
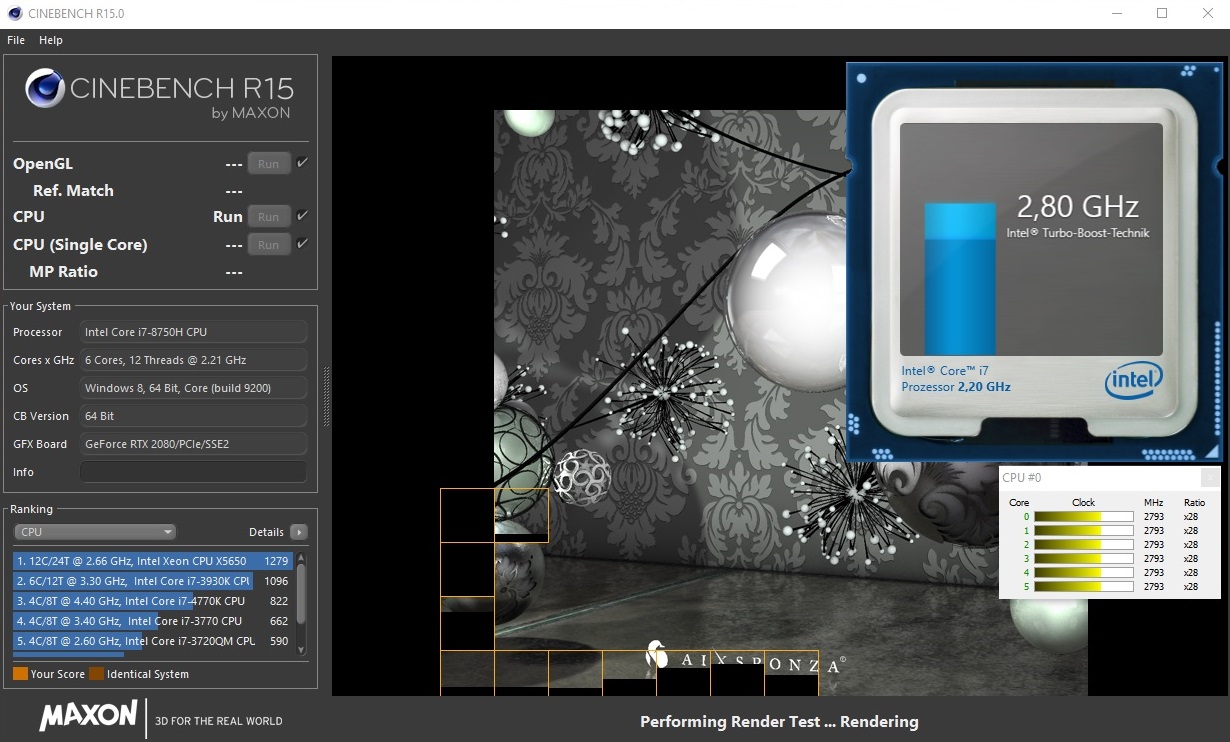
The Intel Core i7-8750H should be familiar by now and is used in pretty much every powerful multimedia or gaming laptop. It offers six processor cores and provides plenty of power for current and modern games. We recommend our tech section for more technical information on this particular CPU.
The performance utilization under load is okay, but the competition is even better. Load for all cores results in a CPU clock of just 2.8 GHz, so the device is similar to the GE75 SKU with the RTX 2070. The performance is reduced on battery power with just 712 points in the Multi test.
System Performance
The GE75 Raider leaves a very good impression, both in the synthetic PCMark benchmarks as well as the daily usage, which is not surprising considering the powerful components. There are no bottlenecks and you can enjoy a responsive system.
| PCMark 8 Home Score Accelerated v2 | 4918 points | |
| PCMark 8 Creative Score Accelerated v2 | 8493 points | |
| PCMark 8 Work Score Accelerated v2 | 5574 points | |
| PCMark 10 Score | 5816 points | |
Help | ||
Storage Devices – NVMe-SSD + HDD
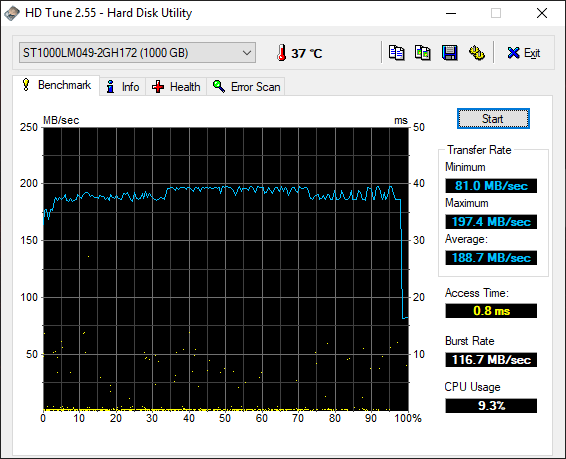
Our test device is equipped with two storage drives, one M.2 NVMe-SSD (512 GB) and a 2.5-inch HDD (1 TB). The SSD is from Kingston and certainly not slow, but the drives from Samsung have an advantage, especially in terms of 4K performance. The SSD provides plenty of space at 512 GB, but you also get the additional hard drive from Seagate for your game library. It is a fast drive (7200 rpm) with an average transfer rate of almost 190 MB/s in the benchmark. The problem is the noise, but more on that later.
Please see our comprehensive SSD/HDD table for comparisons with other hard drives.
| MSI GE75 8SG Raider Kingston RBUSNS8154P3512GJ | Asus Zephyrus S GX701GX Samsung SSD PM981 MZVLB1T0HALR | Lenovo Legion Y740-17ICH Samsung SSD PM981 MZVLB256HAHQ | Asus ROG Strix Scar II GL704GW Intel SSD 660p SSDPEKNW512G8 | MSI GS73 Stealth 8RF-011 Samsung PM961 MZVLW256HEHP | MSI GE75 8SF Kingston RBUSNS8154P3256GJ1 | Average Kingston RBUSNS8154P3512GJ | |
|---|---|---|---|---|---|---|---|
| AS SSD | 88% | 31% | 11% | 38% | -12% | 1% | |
| Seq Read (MB/s) | 888 | 911 3% | 1153 30% | 1315 48% | 1749 97% | 949 7% | 1215 ? 37% |
| Seq Write (MB/s) | 906 | 2347 159% | 1328 47% | 927 2% | 1173 29% | 823 -9% | 897 ? -1% |
| 4K Read (MB/s) | 22.26 | 53 138% | 35.05 57% | 52.4 135% | 42.81 92% | 25.36 14% | 32.4 ? 46% |
| 4K Write (MB/s) | 83 | 122.5 48% | 96 16% | 122.8 48% | 98.4 19% | 67.1 -19% | 87.7 ? 6% |
| 4K-64 Read (MB/s) | 861 | 1577 83% | 727 -16% | 326.5 -62% | 1238 44% | 748 -13% | 796 ? -8% |
| 4K-64 Write (MB/s) | 697 | 1734 149% | 1212 74% | 727 4% | 691 -1% | 650 -7% | 672 ? -4% |
| Access Time Read * (ms) | 0.117 | 0.08 32% | 0.063 46% | 0.11 6% | 0.077 34% | 0.173 -48% | 0.115 ? 2% |
| Access Time Write * (ms) | 0.046 | 0.031 33% | 0.04 13% | 0.045 2% | 0.038 17% | 0.059 -28% | 0.07544 ? -64% |
| Score Read (Points) | 972 | 1721 77% | 878 -10% | 510 -48% | 1456 50% | 869 -11% | 950 ? -2% |
| Score Write (Points) | 870 | 2091 140% | 1441 66% | 942 8% | 906 4% | 799 -8% | 849 ? -2% |
| Score Total (Points) | 2340 | 4771 104% | 2784 19% | 1715 -27% | 3083 32% | 2109 -10% | 2274 ? -3% |
* ... smaller is better

GPU Performance – GeForce RTX 2080
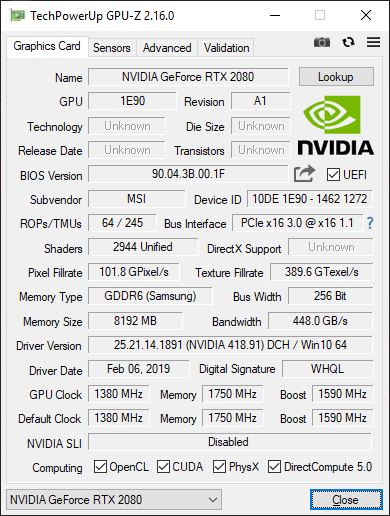
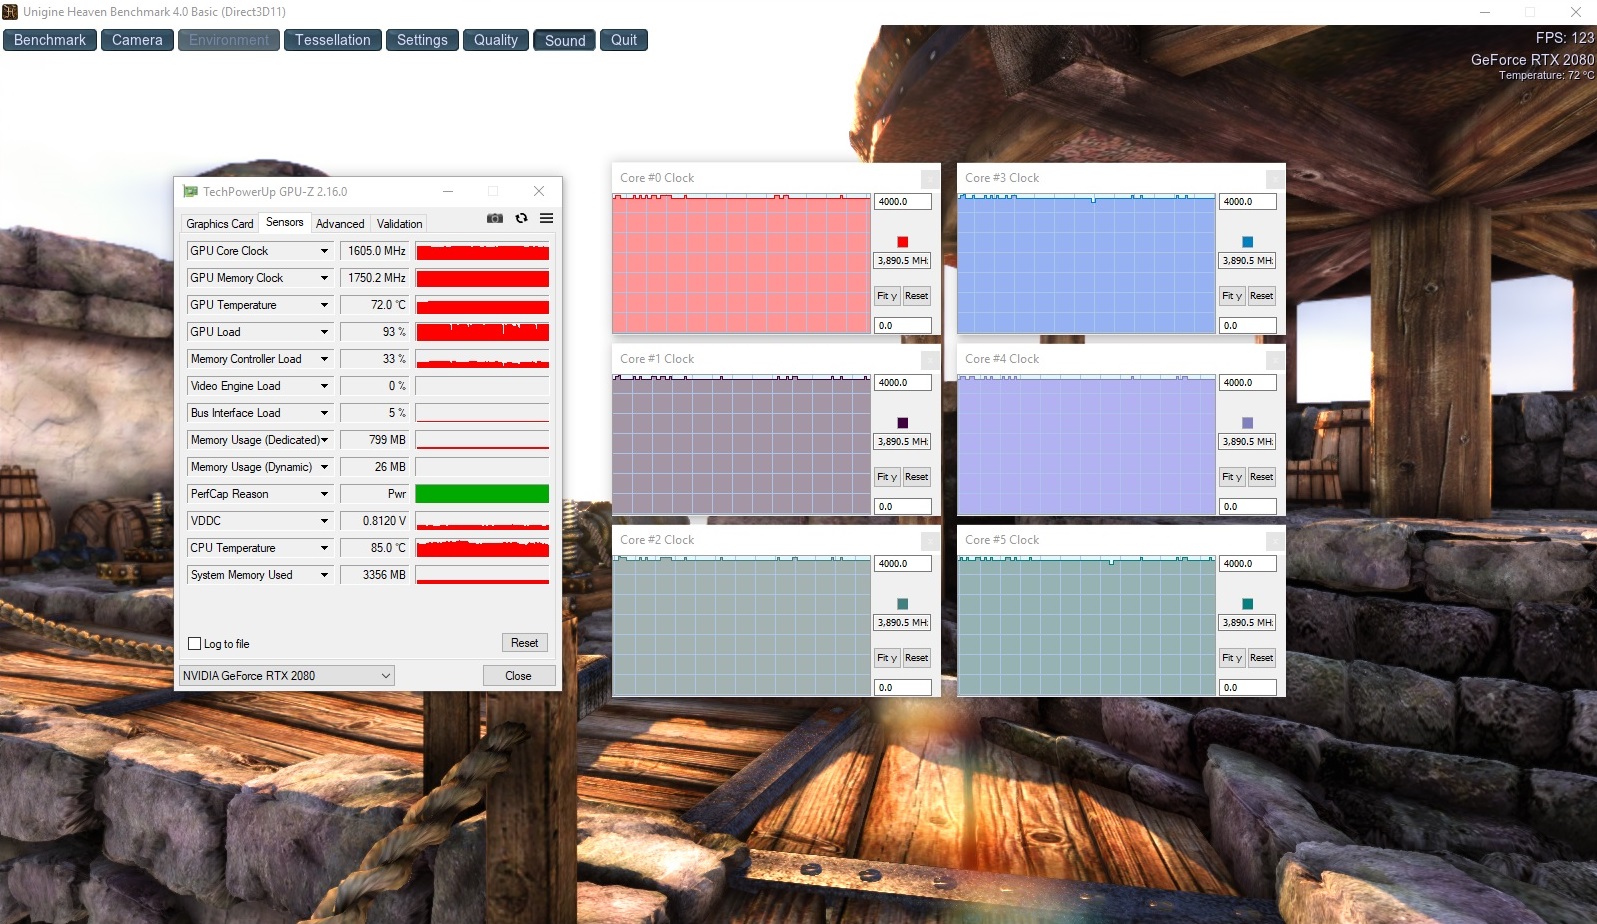
No fiddling around: MSI only uses the regular laptop versions of the new RTX chips from Nvidia and waives the Max-Q models. We already reviewed the GE75 Raider with the RTX 2070 and the results were very good. The GE75 also works well with the RTX 2080 and we can see an advantage of 25-30% in the benchmarks. The Turbo utilization is very good; the base clock of 1380 MHz is clearly surpassed at up to 1920 MHZ and 1605 MHz on average, respectively. The device passes the 3DMark stress tests, so the performance is steady. This is a very good result when you consider the slim construction.
As expected, the GPU performance is significantly reduced on battery power; the 3DMark 11 GPU score drops from 33741 to just 16027 points. More benchmark results of the RTX 2080 are available here.
| 3DMark 11 Performance | 22658 points | |
| 3DMark Cloud Gate Standard Score | 35054 points | |
| 3DMark Fire Strike Score | 19661 points | |
| 3DMark Time Spy Score | 9018 points | |
Help | ||
Gaming Performance
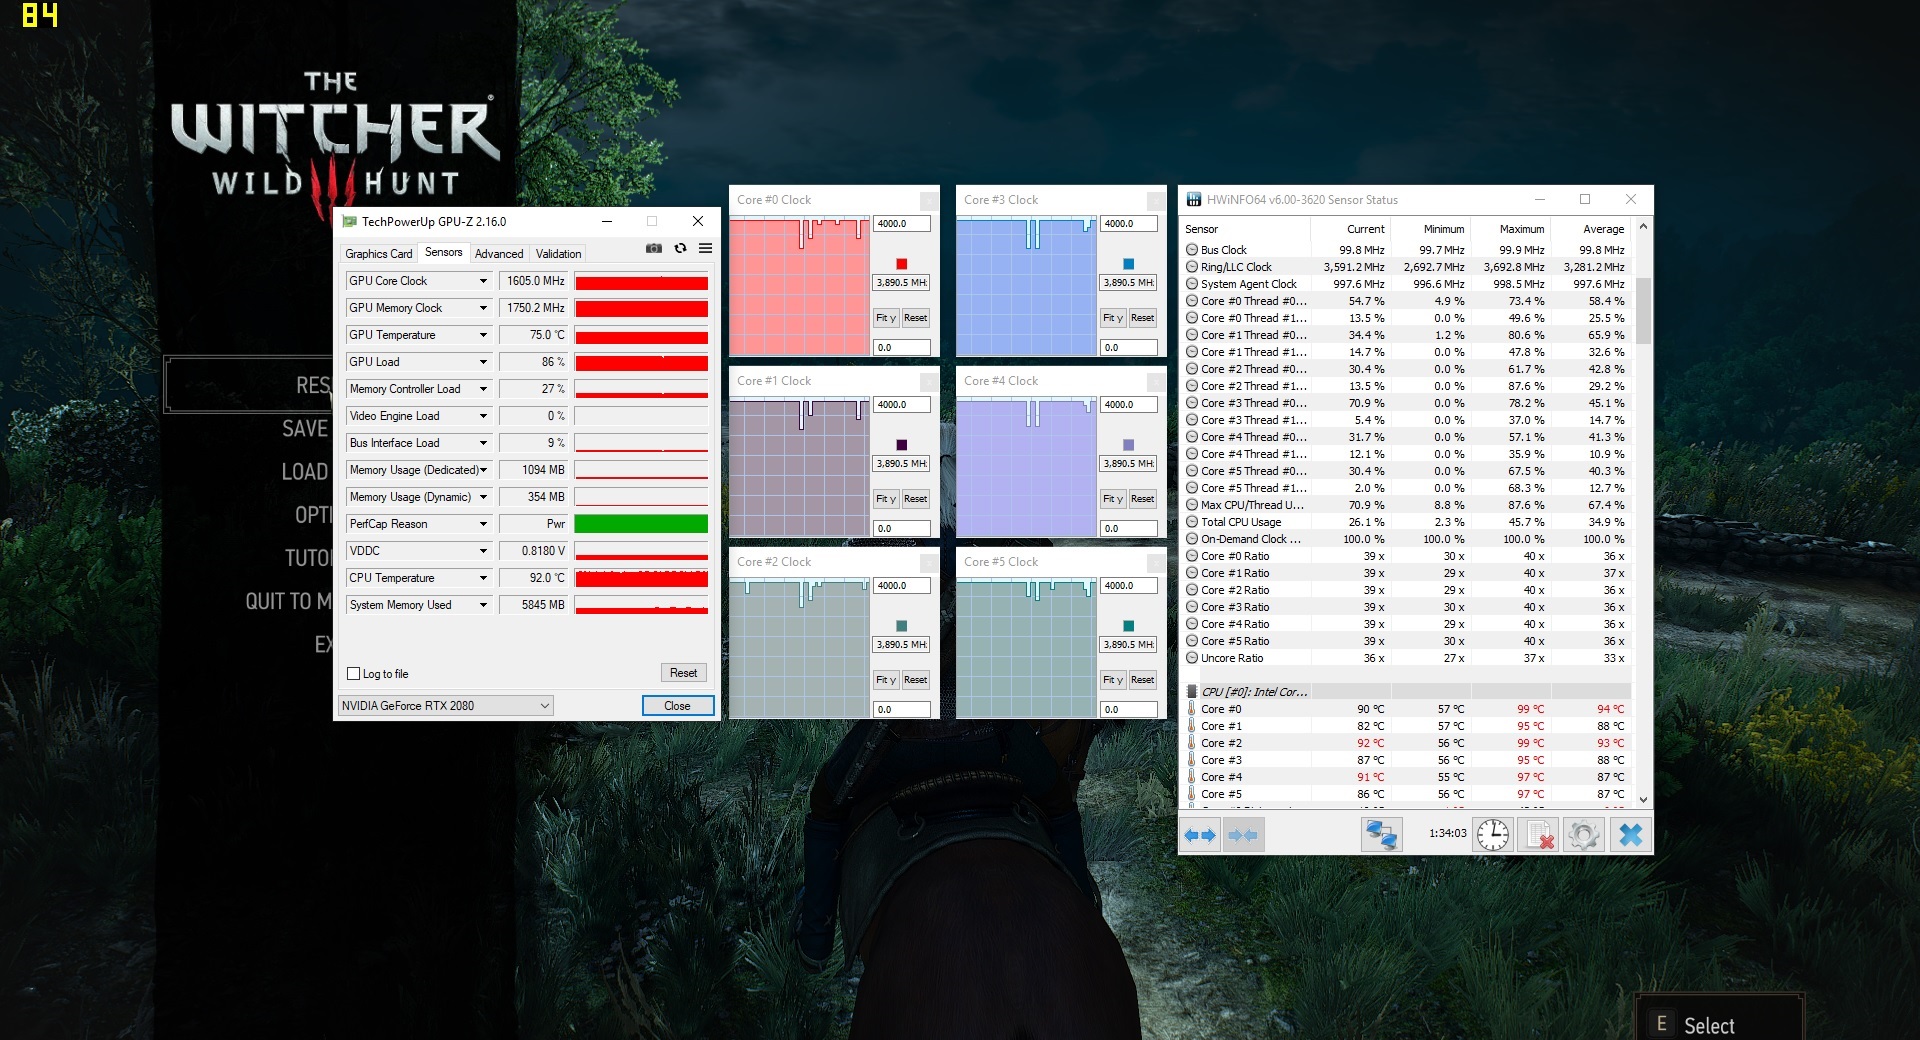
The gaming benchmark results are also excellent and all modern titles run at the highest settings. Considering the limited Turbo utilization of the processor, you might wonder about the influence on the gaming performance. Most modern games are limited by the GPU, which is well illustrated by the Witcher 3 benchmarks. The GPU is the deciding factor in the Ultra preset and the GE75 Raider is basically on par with the two "big" gaming systems, which are equipped with a much faster desktop processor. The further we reduce the details and the resolution, the wider the gap gets. However, there are currently no problem and the slightly lower CPU performance does not have a significant effect when you use high settings.
Similar to the 3DMark stress tests, we also see steady performance figures during our Witcher 3 loop. The gaming performance is significantly reduced on battery power though with 96 vs 38 FPS in Witcher 3 (Ultra). More gaming benchmarks with the RTX 2080 are available here.
| low | med. | high | ultra | |
|---|---|---|---|---|
| The Witcher 3 (2015) | 276 | 230 | 162 | 92.1 |
| Dota 2 Reborn (2015) | 134.8 | 125.5 | 109 | 103.9 |
| Rise of the Tomb Raider (2016) | 236 | 174 | 155 | 145 |
| X-Plane 11.11 (2018) | 102 | 89 | 75 | |
| Shadow of the Tomb Raider (2018) | 126 | 111 | 106 | 99 |
| Assassin´s Creed Odyssey (2018) | 86 | 75 | 73 | 65 |
| Battlefield V (2018) | 144 | 132 | 117 | 111 |
| Darksiders III (2018) | 195 | 129 | 126 | 121 |
| Just Cause 4 (2018) | 181 | 161 | 118 | 116 |
| Far Cry New Dawn (2019) | 109 | 94 | 90 | 82 |
| Dirt Rally 2.0 (2019) | 216 | 159 | 144 | 96 |
Emissions – Loud, but effective
System Noise – Noisy HDD
The MSI GE75 Raider can a silent system, but this is rare. The fans quickly react to load changes and you also notice the drawback of the fast 7200 rpm drive with its constant murmur, which is clearly audible. We recommend an adjustment of the power settings, so the HDD is turned off as quickly as possible when it is inactive.
It gets loud when you start to stress the GPU and we measure up to 54 dB(A). This value can vary a bit depending on the requirements of the game, but the notebook is always audible. We liked the fact that the fans do not pulsate very much under load, despite the loud fan noise. We still recommend a headset for longer gaming sessions. Our test unit also produced some coil whine, but it was very quiet and not annoying.
The Lenovo Legion Y740 with the RTX 2080 Max-Q is much quieter within the comparison group. The old MSI GS73 Stealth was also a bit quieter, but the old GTX 1070 Max-Q was also much slower.
Noise level
| Idle |
| 30 / 34 / 37 dB(A) |
| HDD |
| 33 dB(A) |
| Load |
| 52 / 54 dB(A) |
 | ||
30 dB silent 40 dB(A) audible 50 dB(A) loud |
||
min: | ||
| MSI GE75 8SG Raider GeForce RTX 2080 Mobile, i7-8750H, Kingston RBUSNS8154P3512GJ | Asus Zephyrus S GX701GX GeForce RTX 2080 Max-Q, i7-8750H, Samsung SSD PM981 MZVLB1T0HALR | Lenovo Legion Y740-17ICH GeForce RTX 2080 Max-Q, i7-8750H, Samsung SSD PM981 MZVLB256HAHQ | Asus ROG Strix Scar II GL704GW GeForce RTX 2070 Mobile, i7-8750H, Intel SSD 660p SSDPEKNW512G8 | MSI GS73 Stealth 8RF-011 GeForce GTX 1070 Max-Q, i7-8750H, Samsung PM961 MZVLW256HEHP | MSI GE75 8SF GeForce RTX 2070 Mobile, i7-8750H, Kingston RBUSNS8154P3256GJ1 | |
|---|---|---|---|---|---|---|
| Noise | 7% | 14% | 3% | 7% | 4% | |
| off / environment * (dB) | 30 | 29 3% | 28.3 6% | 29 3% | 30 -0% | 28.3 6% |
| Idle Minimum * (dB) | 30 | 29 3% | 31.5 -5% | 29 3% | 30 -0% | 33.5 -12% |
| Idle Average * (dB) | 34 | 32 6% | 31.6 7% | 32 6% | 34 -0% | 33.6 1% |
| Idle Maximum * (dB) | 37 | 33 11% | 31.6 15% | 40 -8% | 36 3% | 35 5% |
| Load Average * (dB) | 52 | 47 10% | 32.3 38% | 46 12% | 43 17% | 38 27% |
| Witcher 3 ultra * (dB) | 53 | 49 8% | 43 19% | 51 4% | 45 15% | 50 6% |
| Load Maximum * (dB) | 54 | 51 6% | 45.5 16% | 52 4% | 45 17% | 56.9 -5% |
* ... smaller is better
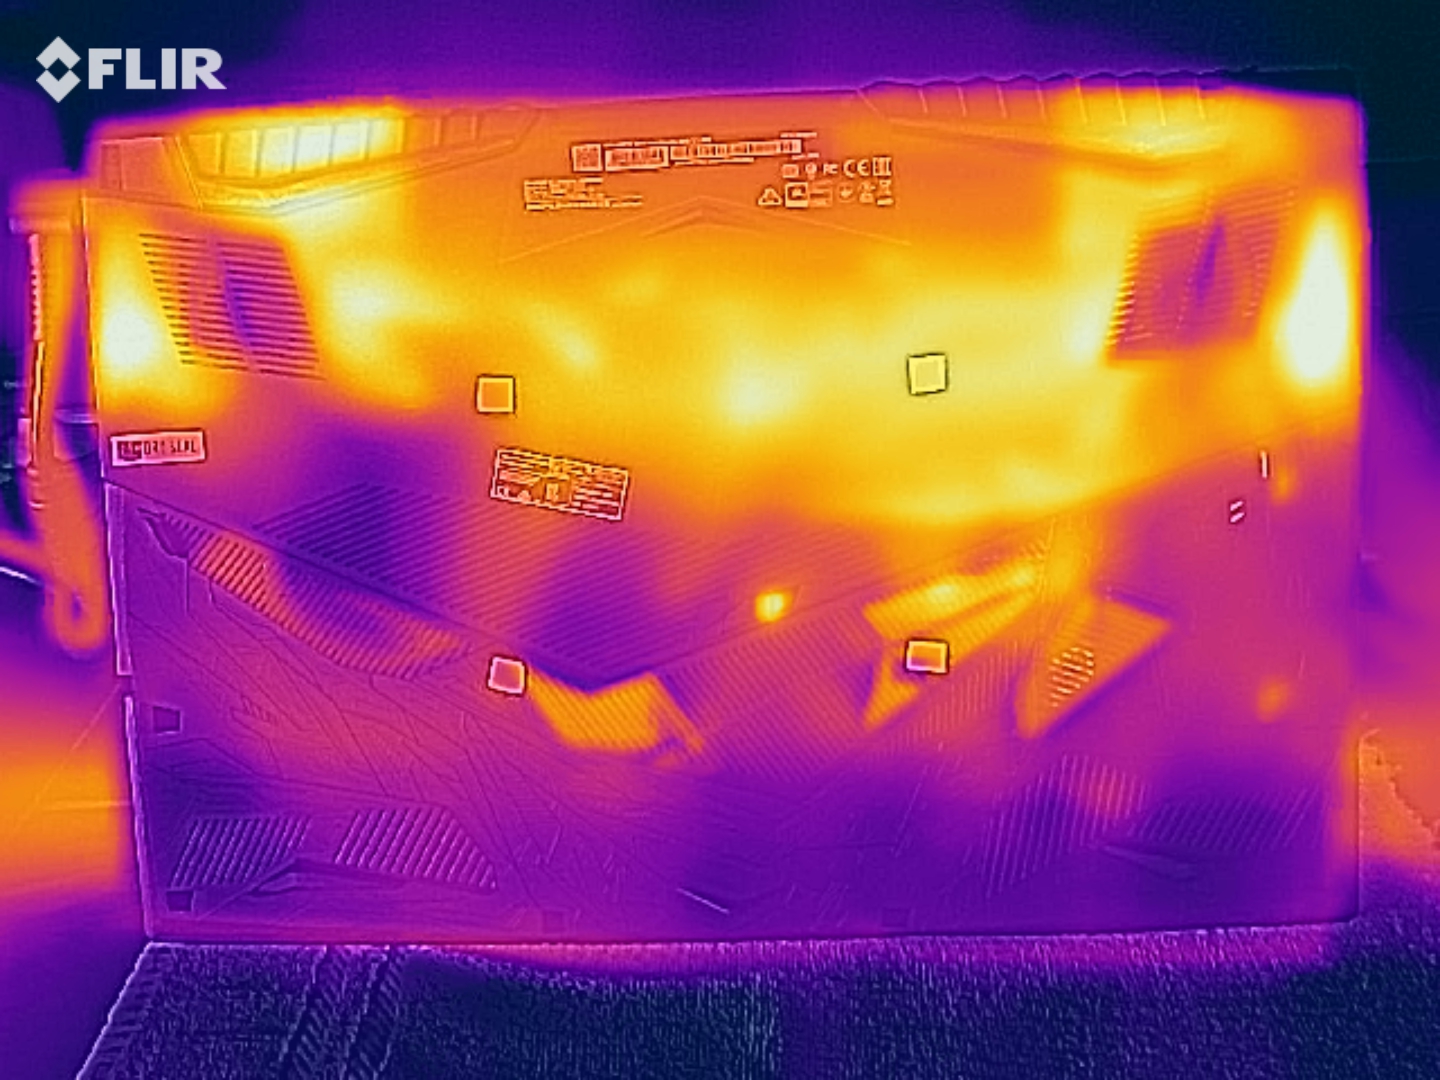
Temperature
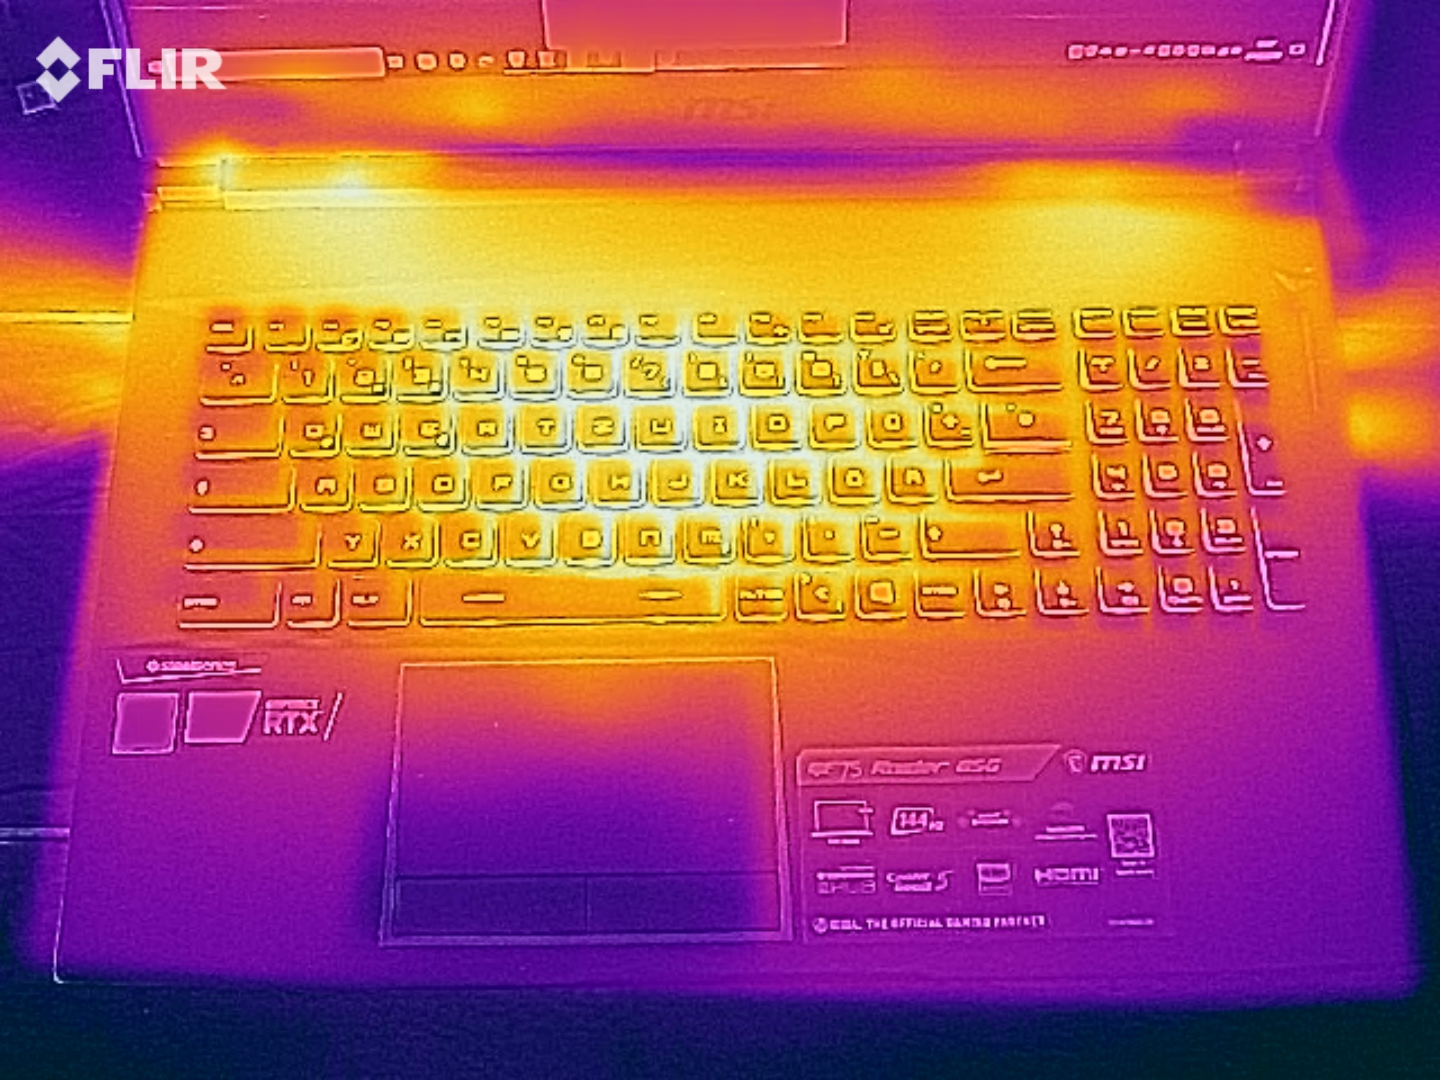
The loud fan noise is not wasted, because the surface temperatures are not critical under load, despite the slim base unit. We measure up to 46 °C on the top – you will notice that, but the result is okay. The competition is often cooler in the area of the palm rests though, where the GE75 Raider also reaches values up to around 40 °C. There are no problems or hot spots while idling or light workloads, respectively.
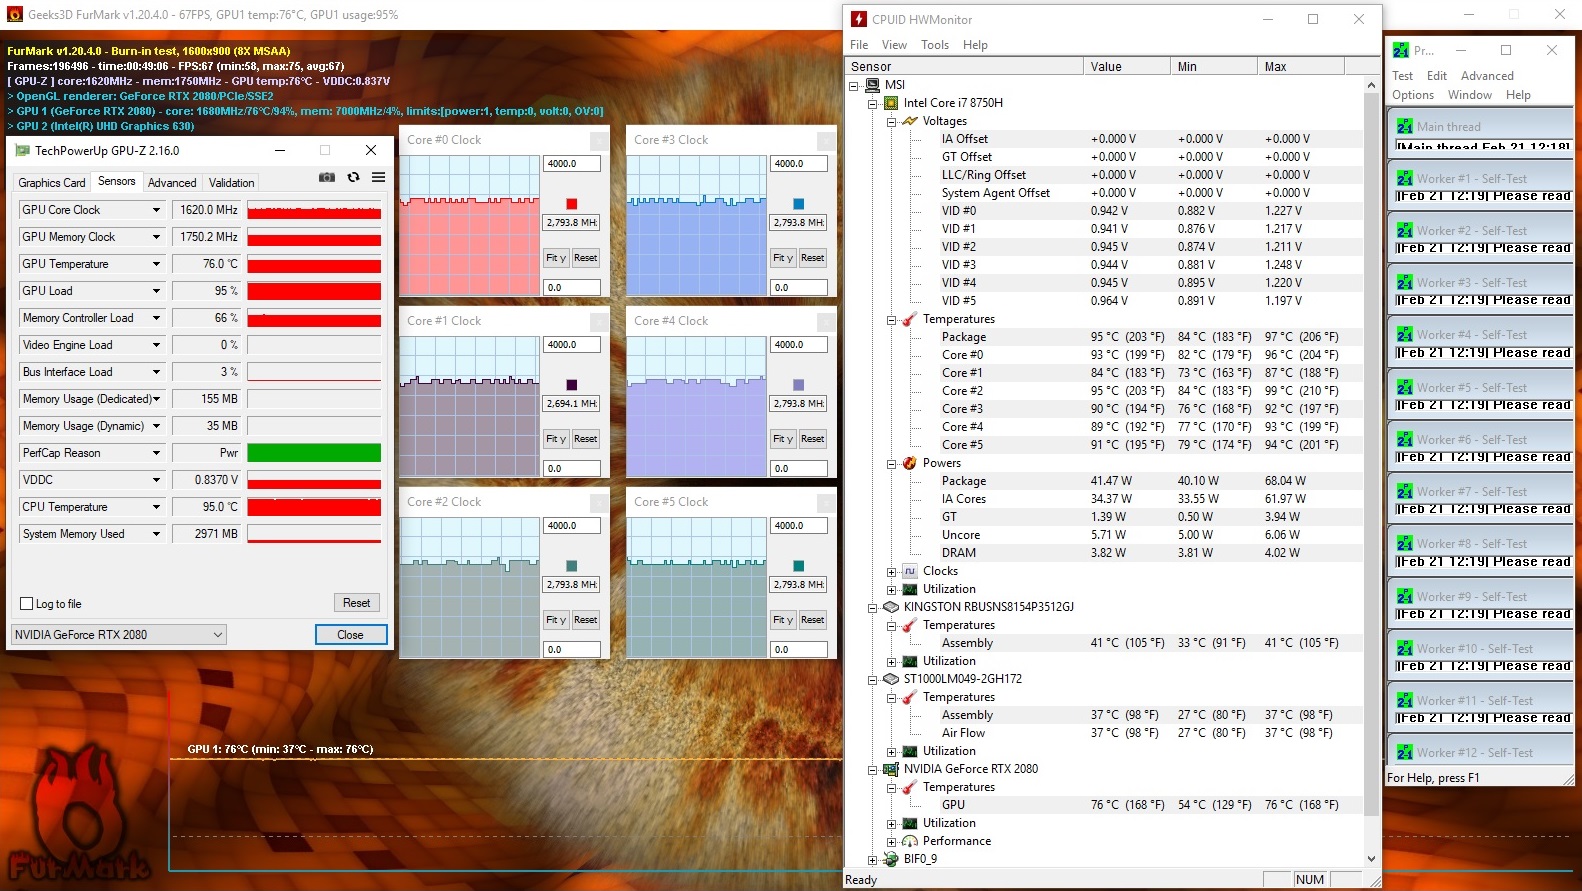
We simulate maximum load with our stress test consisting of the tools Prime95 and FurMark, but this is no problem for the GE75 Raider. We observe a CPU Turbo of 2.7-2.8 GHz similar to the CPU benchmarks. It cannot use its full Turbo potential, but there is no throttling at all. The GPU performs even better with a steady clock above 1600 MHz and therefore clearly above the base frequency of 1380 MHz. All in all, the cooling in the MSI is very effective. The manual activation of the maximum fan speed only has a marginal effect on the performance.
(-) The maximum temperature on the upper side is 46 °C / 115 F, compared to the average of 40.4 °C / 105 F, ranging from 21.2 to 68.8 °C for the class Gaming.
(±) The bottom heats up to a maximum of 45 °C / 113 F, compared to the average of 43.2 °C / 110 F
(+) In idle usage, the average temperature for the upper side is 25.8 °C / 78 F, compared to the device average of 33.9 °C / 93 F.
(-) Playing The Witcher 3, the average temperature for the upper side is 42 °C / 108 F, compared to the device average of 33.9 °C / 93 F.
(-) The palmrests and touchpad can get very hot to the touch with a maximum of 40 °C / 104 F.
(-) The average temperature of the palmrest area of similar devices was 28.8 °C / 83.8 F (-11.2 °C / -20.2 F).
Speakers
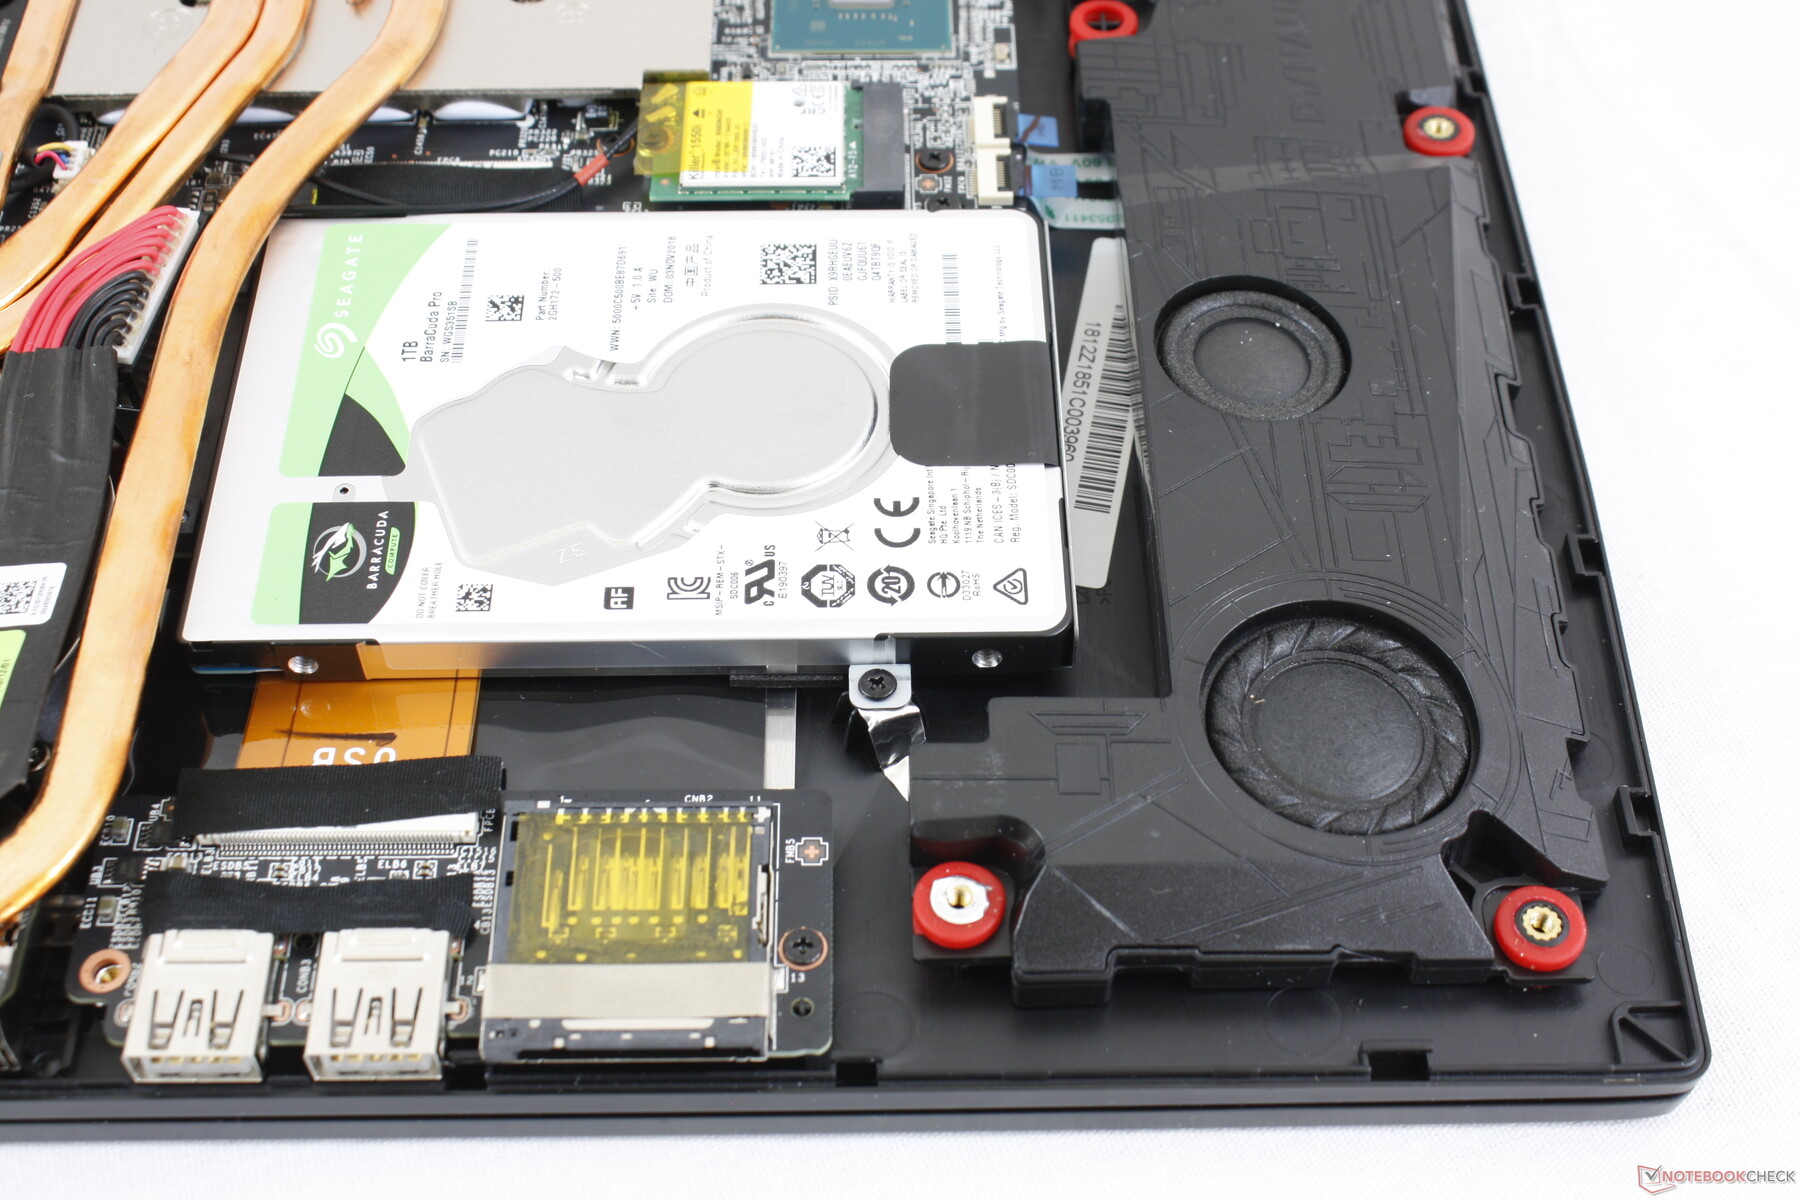
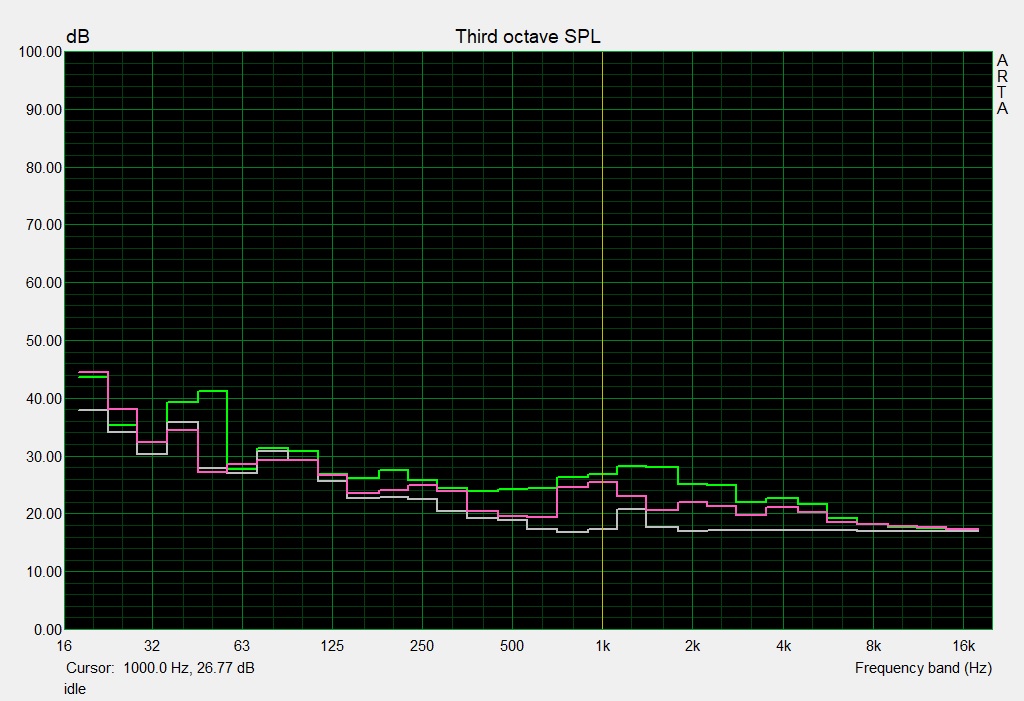
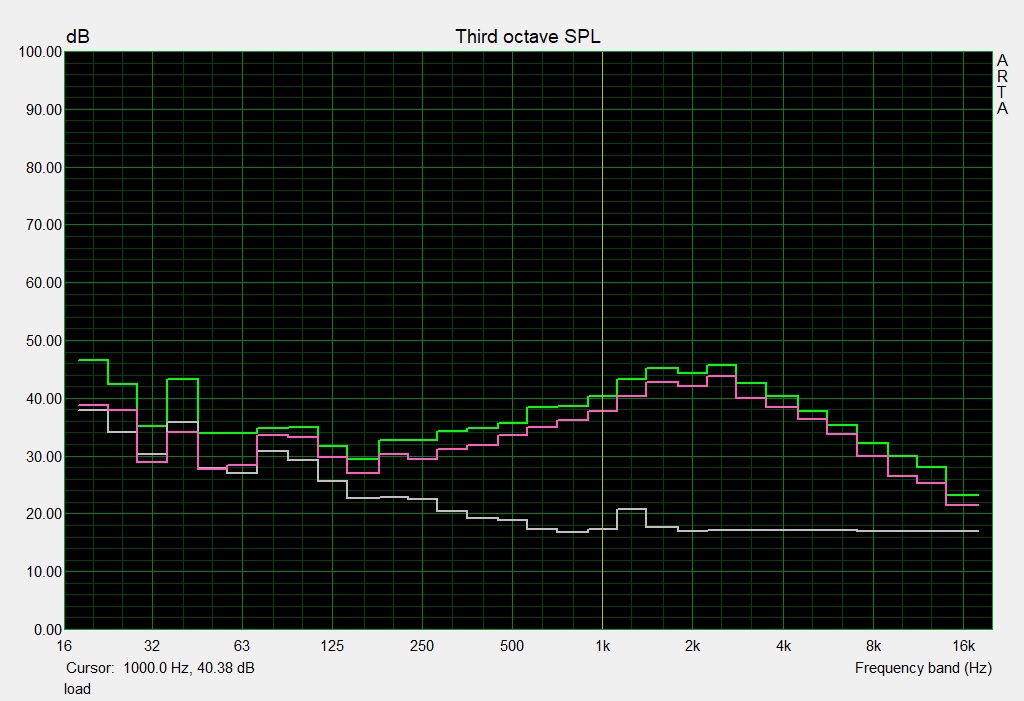
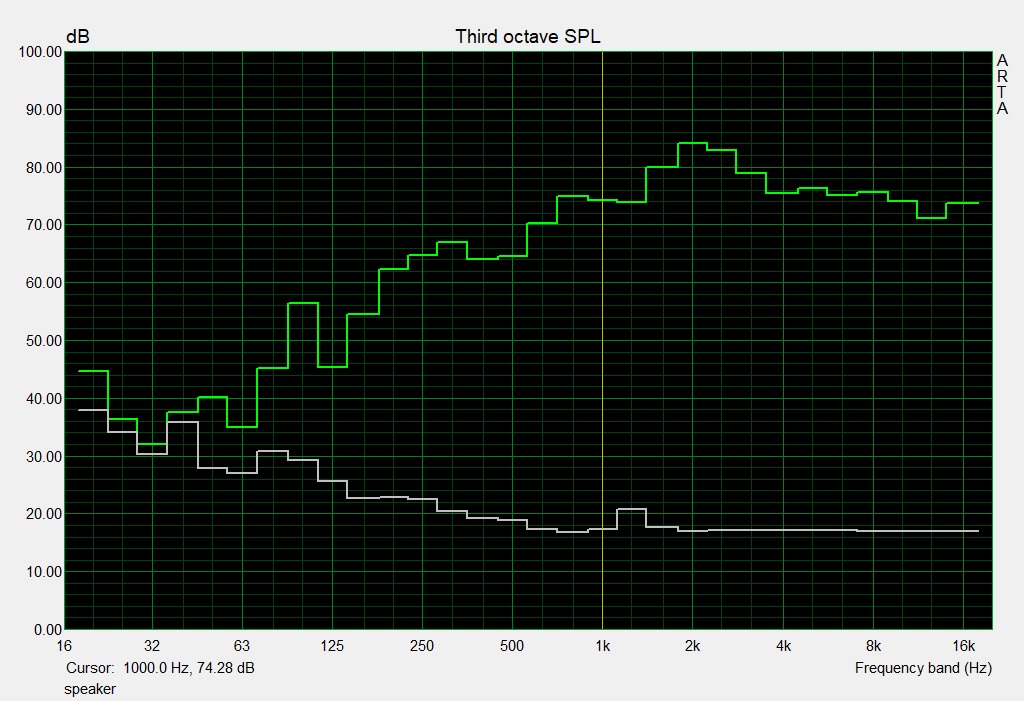
The Dynaudio sound system in the GE75 Raider uses two stereo speakers consisting of two modules each (speaker + subwoofer) in the front area of the bottom. Our measurements determine a very loud maximum volume and very balanced playback of medium and high tones. Music or video playback is really enjoyable, even though the bass could still be stronger. You cannot really use the speakers during gaming since the fans are too loud.
External speakers or headsets can be attached via USB or two stereo jacks.
MSI GE75 8SG Raider audio analysis
(+) | speakers can play relatively loud (91 dB)
Bass 100 - 315 Hz
(-) | nearly no bass - on average 15.7% lower than median
(±) | linearity of bass is average (12.1% delta to prev. frequency)
Mids 400 - 2000 Hz
(±) | reduced mids - on average 5.1% lower than median
(+) | mids are linear (5.8% delta to prev. frequency)
Highs 2 - 16 kHz
(+) | balanced highs - only 2.7% away from median
(+) | highs are linear (3.2% delta to prev. frequency)
Overall 100 - 16.000 Hz
(+) | overall sound is linear (12.8% difference to median)
Compared to same class
» 16% of all tested devices in this class were better, 4% similar, 80% worse
» The best had a delta of 6%, average was 18%, worst was 132%
Compared to all devices tested
» 12% of all tested devices were better, 3% similar, 85% worse
» The best had a delta of 4%, average was 23%, worst was 134%
MSI GS73 Stealth 8RF-011 audio analysis
(+) | speakers can play relatively loud (89 dB)
Bass 100 - 315 Hz
(-) | nearly no bass - on average 21.6% lower than median
(±) | linearity of bass is average (9% delta to prev. frequency)
Mids 400 - 2000 Hz
(±) | higher mids - on average 6.4% higher than median
(+) | mids are linear (6.7% delta to prev. frequency)
Highs 2 - 16 kHz
(±) | reduced highs - on average 5% lower than median
(±) | linearity of highs is average (8.1% delta to prev. frequency)
Overall 100 - 16.000 Hz
(±) | linearity of overall sound is average (19.3% difference to median)
Compared to same class
» 65% of all tested devices in this class were better, 8% similar, 27% worse
» The best had a delta of 6%, average was 18%, worst was 132%
Compared to all devices tested
» 47% of all tested devices were better, 8% similar, 46% worse
» The best had a delta of 4%, average was 23%, worst was 134%
Energy Management
Power Consumption
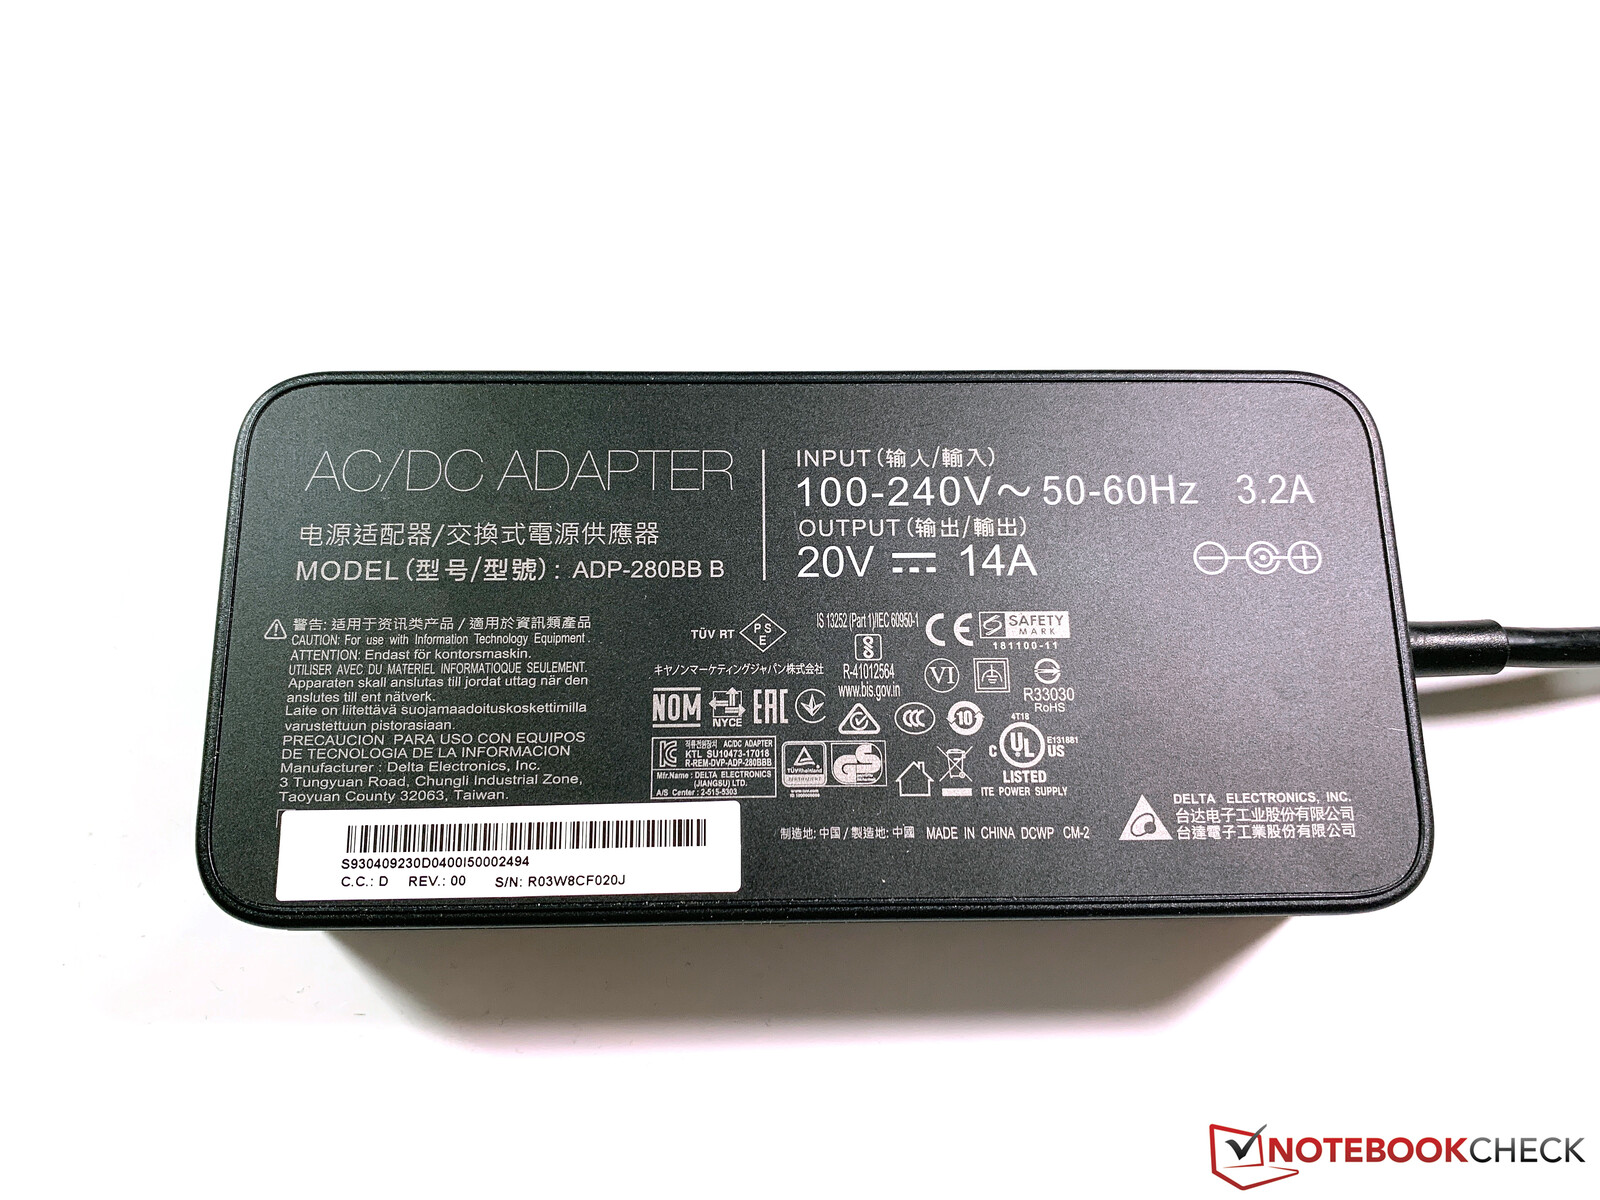
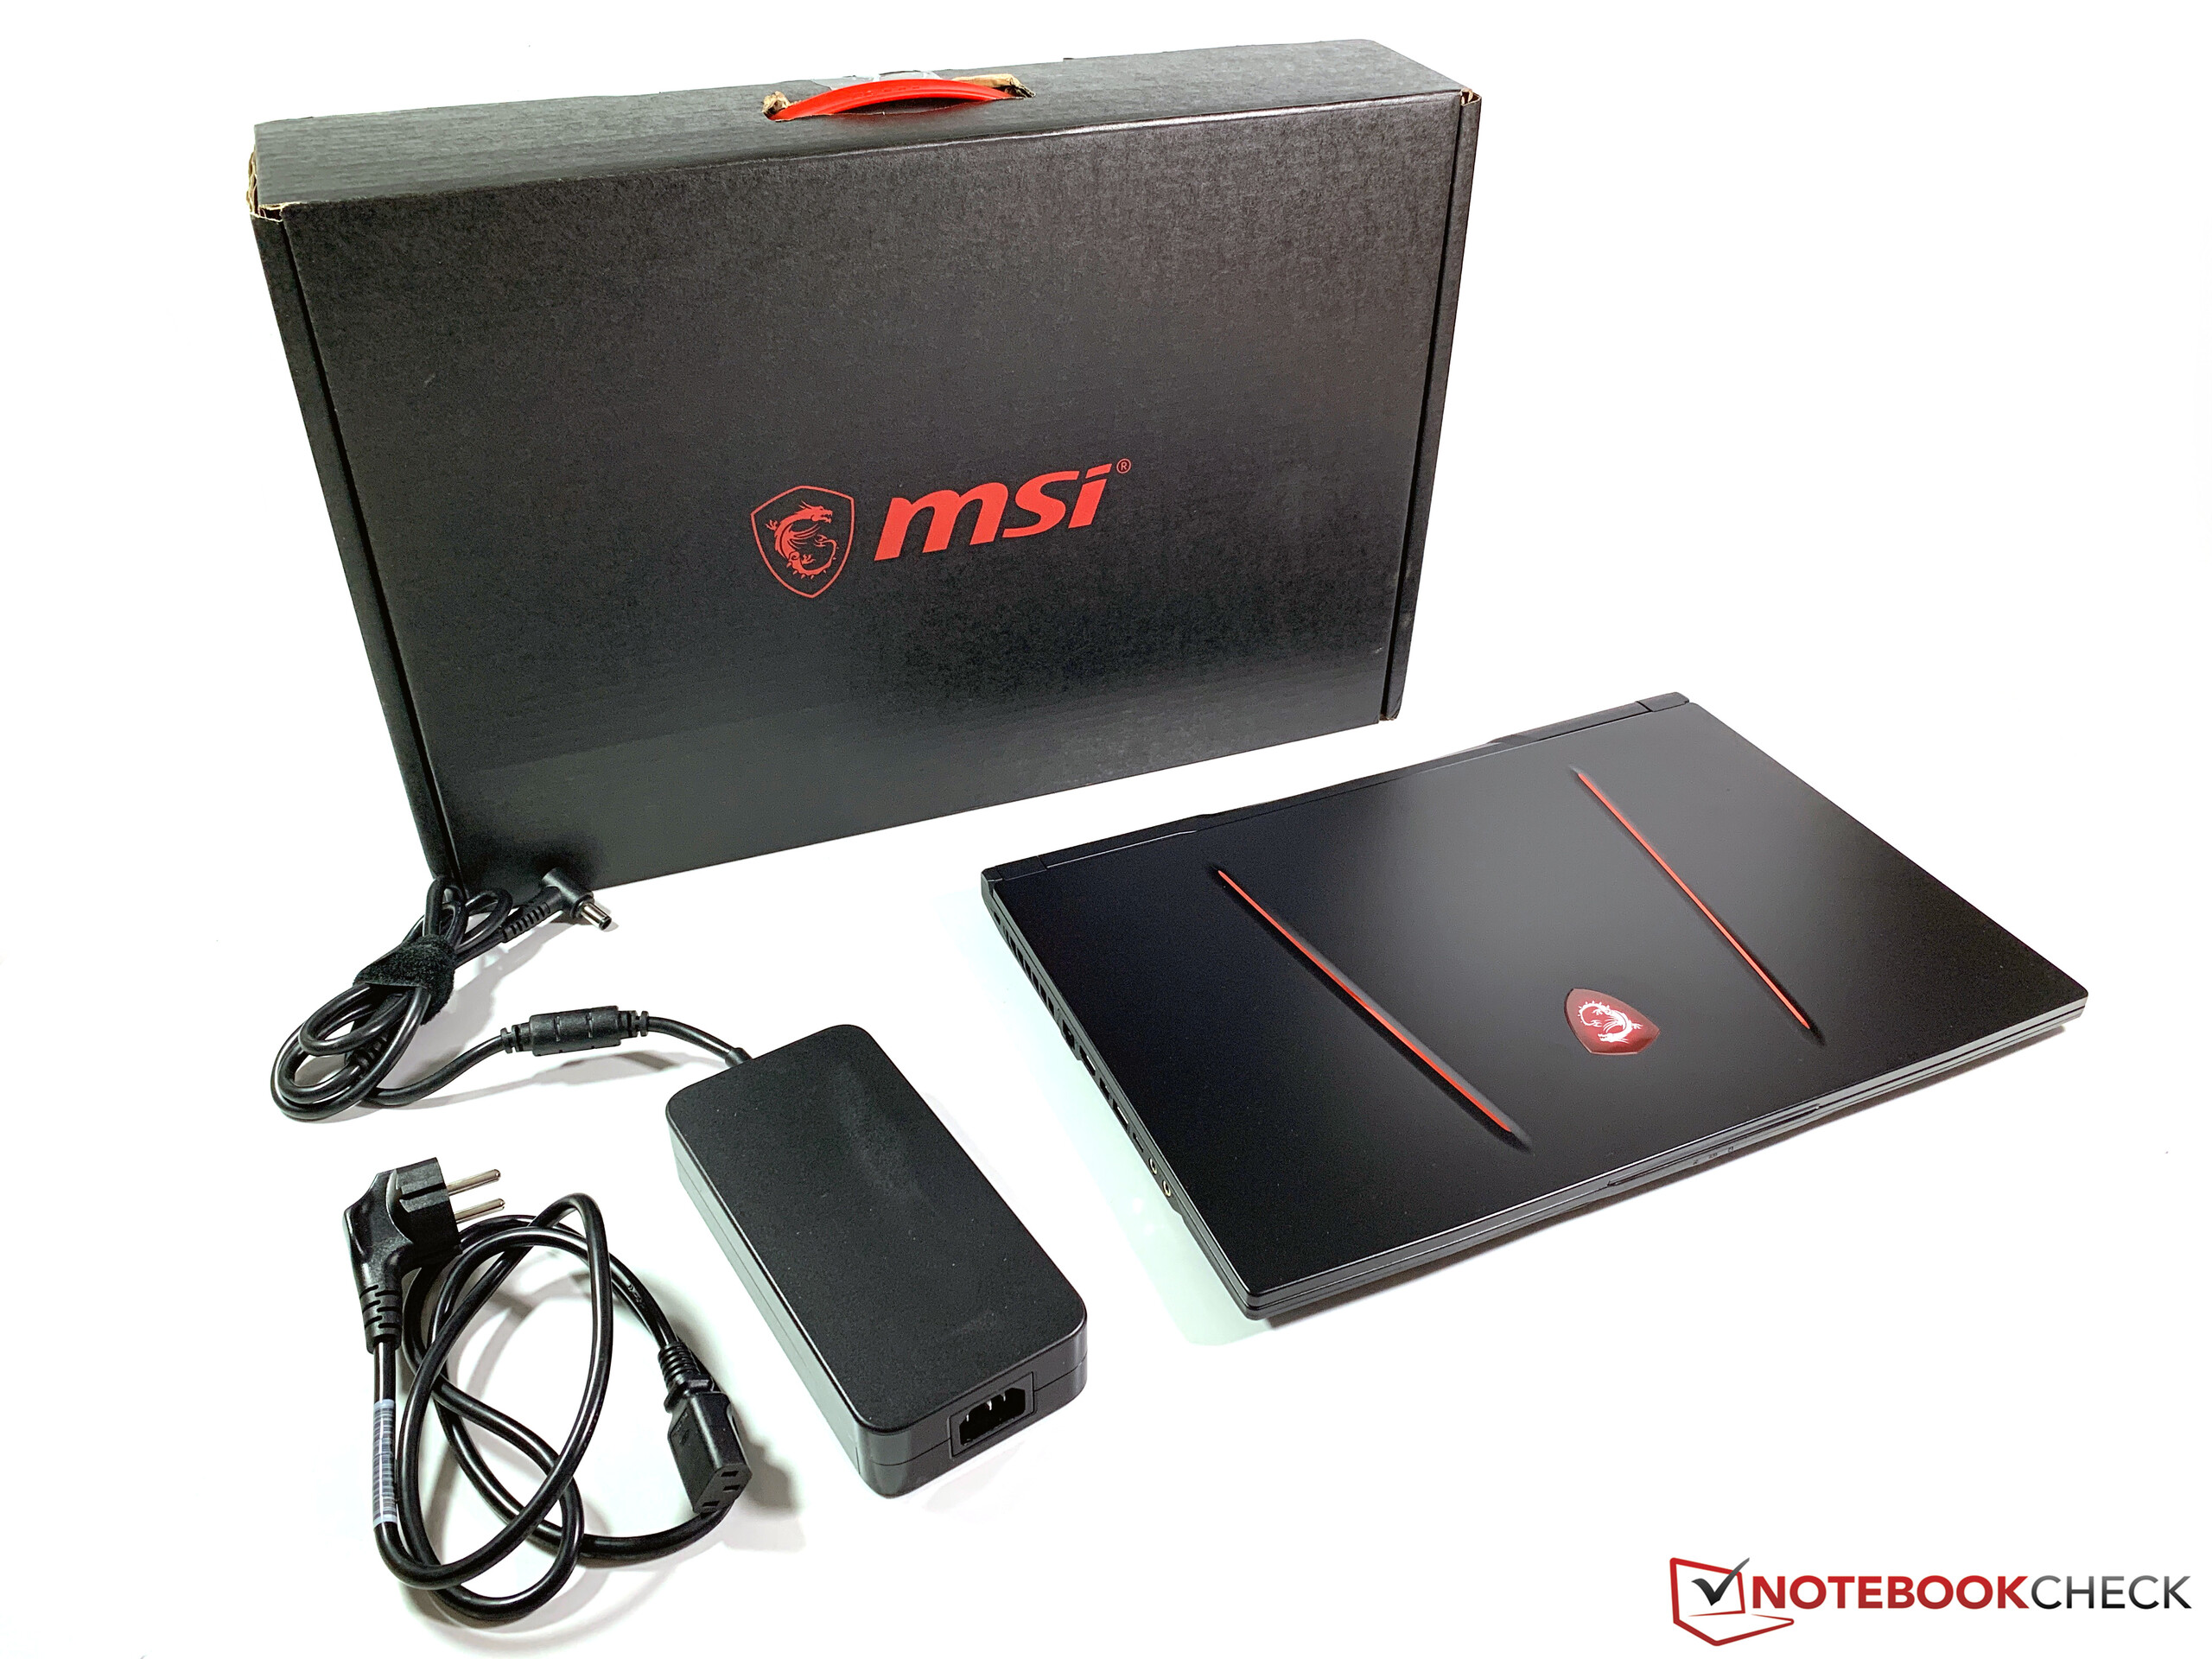
The power consumption of the test unit obviously benefits from the switchable graphics, but you have to decide for yourself how important this is for an – admittedly compact – 17.3-inch gaming laptop. The MSI is the most efficient device of the bunch in our idle tests, but you notice the impact of the RTX 2080 under load. Our GE75 Raider consumes much more power than the RTX 2080 Max-Q while gaming, whereas the difference to the RTX 2070 is comparatively small. Our results are all on the expected level and there are no surprises. The provided 280W power unit is sufficient.
We had one small gripe with the pretty thick and rigid cable (~120 cm) between the PSU and the laptop. Depending on the layout of you desk, the cable can be a bit short.
| Off / Standby | |
| Idle | |
| Load |
|
Key:
min: | |
| MSI GE75 8SG Raider i7-8750H, GeForce RTX 2080 Mobile, Kingston RBUSNS8154P3512GJ, AHVA, 1920x1080, 17.3" | Asus Zephyrus S GX701GX i7-8750H, GeForce RTX 2080 Max-Q, Samsung SSD PM981 MZVLB1T0HALR, IPS, 1920x1080, 17.3" | Lenovo Legion Y740-17ICH i7-8750H, GeForce RTX 2080 Max-Q, Samsung SSD PM981 MZVLB256HAHQ, IPS, 1920x1080, 17.3" | Asus ROG Strix Scar II GL704GW i7-8750H, GeForce RTX 2070 Mobile, Intel SSD 660p SSDPEKNW512G8, AHVA, 1920x1080, 17.3" | MSI GS73 Stealth 8RF-011 i7-8750H, GeForce GTX 1070 Max-Q, Samsung PM961 MZVLW256HEHP, TN, 1920x1080, 17.3" | MSI GE75 8SF i7-8750H, GeForce RTX 2070 Mobile, Kingston RBUSNS8154P3256GJ1, IPS, 1920x1080, 17.3" | Average NVIDIA GeForce RTX 2080 Mobile | Average of class Gaming | |
|---|---|---|---|---|---|---|---|---|
| Power Consumption | -38% | -40% | -41% | 6% | -30% | -101% | -29% | |
| Idle Minimum * (Watt) | 7 | 19 -171% | 20.2 -189% | 19 -171% | 8 -14% | 16.4 -134% | 24.6 ? -251% | 13 ? -86% |
| Idle Average * (Watt) | 15 | 22 -47% | 27.2 -81% | 22 -47% | 14 7% | 21.9 -46% | 31.4 ? -109% | 18.7 ? -25% |
| Idle Maximum * (Watt) | 22 | 30 -36% | 28.7 -30% | 29 -32% | 22 -0% | 25.4 -15% | 41.8 ? -90% | 24.3 ? -10% |
| Load Average * (Watt) | 92 | 104 -13% | 90.8 1% | 102 -11% | 92 -0% | 90.7 1% | 112 ? -22% | 110.2 ? -20% |
| Witcher 3 ultra * (Watt) | 207 | 167 19% | 152.1 27% | 190 8% | 154 26% | 203.3 2% | ||
| Load Maximum * (Watt) | 254 | 203 20% | 165.4 35% | 231 9% | 207 19% | 222.9 12% | 344 ? -35% | 258 ? -2% |
* ... smaller is better
Battery Runtime
The low consumption values are good for the battery runtime. We determined almost 8 hours from the 65Wh battery in an ideal scenario and almost 5 hours during web browsing. These results are better compared to the rivals, but the stamina under load is very similar. You should not expect more than an hour during gaming, despite the reduced performance on battery. In the end it is only sufficient to bridge short periods of time between two sockets.
The charging process requires some patience, despite the powerful PSU: We record a total of 182 minutes before the battery is fully charged (device is turned on). The initial 70% are at least faster at little more than an hour.
| MSI GE75 8SG Raider i7-8750H, GeForce RTX 2080 Mobile, 65 Wh | Asus Zephyrus S GX701GX i7-8750H, GeForce RTX 2080 Max-Q, 76 Wh | Lenovo Legion Y740-17ICH i7-8750H, GeForce RTX 2080 Max-Q, 76 Wh | Asus ROG Strix Scar II GL704GW i7-8750H, GeForce RTX 2070 Mobile, 66 Wh | MSI GS73 Stealth 8RF-011 i7-8750H, GeForce GTX 1070 Max-Q, 51 Wh | MSI GE75 8SF i7-8750H, GeForce RTX 2070 Mobile, 65 Wh | Average of class Gaming | |
|---|---|---|---|---|---|---|---|
| Battery runtime | -18% | -32% | -1% | -15% | -26% | 44% | |
| Reader / Idle (h) | 7.8 | 5 -36% | 6.2 -21% | 5.8 -26% | 8.71 ? 12% | ||
| WiFi v1.3 (h) | 4.7 | 3.8 -19% | 3.2 -32% | 3.9 -17% | 3.3 -30% | 3.5 -26% | 7.15 ? 52% |
| Witcher 3 ultra (h) | 0.8 | 0.9 13% | |||||
| Load (h) | 0.9 | 0.9 0% | 1.1 22% | 1 11% | 1.502 ? 67% |
Pros
Cons
Verdict – The upgrade is a good investment
The new MSI GE75 Raider is noticeably more compact compared to its predecessor, but now features a much more powerful GPU. If you are willing to pay the premium for the RTX 2080, you won't waste your money thanks to the good performance utilization compared to the less expensive SKUs with the RTX 2070 or RTX 2060. The CPU performance could certainly be a bit better, but there are currently no limitation when you play games.
Smaller, thinner, faster – this is a big challenge for the cooling solution. MSI manages an effective heat dissipation without major performance penalties. The drawback is the loud fan noise, and you also hear the murmur of the fast 7200 rpm drive while idling.
Other drawbacks include the surfaces, which quickly attract dirt and fingerprints and have to be cleaned on a regular basis. A laptop for 3000 Euros should also feature Thunderbolt 3. We are not sure about the lack of G-Sync. The notebook is comparatively compact for a 17-inch device, but the mobility is certainly not the most important aspect for potential buyers.
The GPU upgrade for the MSI GE75 Raider is a good investment and you can actually use the additional performance, despite the slim chassis. There are some shortcomings in terms of connectivity, but we cannot find any major issues that would affect the gaming experience.
MSI GE75 8SG Raider
- 03/25/2019 v6 (old)
Andreas Osthoff
Price comparison
