MSI WT75 8SM (Xeon E-2176G, Quadro P5200) Workstation Review
The MSI WT75 is the workstation version of the gaming-centric MSI GT75 series. Swap out the GeForce GPU and Intel Core CPU from the GT75 for a Quadro GPU and Xeon CPU and you have the WT75. MSI has taken this same approach to workstations for years with models like the GS63/WS63, GT72/WT72, and GE73/WE73.
The WT75 we have here today directly succeeds the WT73. Since the GT75 is one of the fastest 17.3-inch gaming laptops available, the WT75 stands to be one of the fastest 17.3-inch workstations currently in the market. Our particular test unit comes equipped with a Xeon E-2176G server processor, Quadro P5200 GPU, and a 4K UHD display. The model is very configurable and so numerous offers exist depending on the reseller or retailer. The WT75 competes directly with other high-power workstations like the Eurocom Tornado F7W, HP ZBook 17, Lenovo ThinkPad P71, and the Dell Precision 7720.
It's important to remember that the WT75 is physically identical to the GT75 and Eurocom Tornado F7W with a few notable exceptions that we'll cover below. Thus, we recommend checking out our existing reviews on the GT75 and Tornado F7W since all three laptops share the same ports and overall chassis design. Our table below summarizes the major hardware differences between the GT75 and WT75 as well.
(Editor's note: We have reached out to MSI to confirm if the system can support 95 W or greater processor upgrades or next-gen Turing-based Quadro GPUs. We will update this page once we have the information.)
| GT75VR 7RF | WT75 | |
| CPU | Soldered, 45 W Core ix mobile | LGA 1151, 80 W Xeon Server |
| Smart Card Reader | No | Yes |
| Rubberized Palm Rests | Yes | No |
| ECC RAM support | No | Yes |
| Keyboard | Mechanical, per-key RGB lighting | Membrane-based, single-zone white lighting |
| Battery | 75 Wh | 90 Wh |
| Storage bays | 3x M.2 2280 1x 2.5-inch SATA III bay | 3x M.2 2280 2x 2.5-inch SATA III bay |
More MSI reviews:
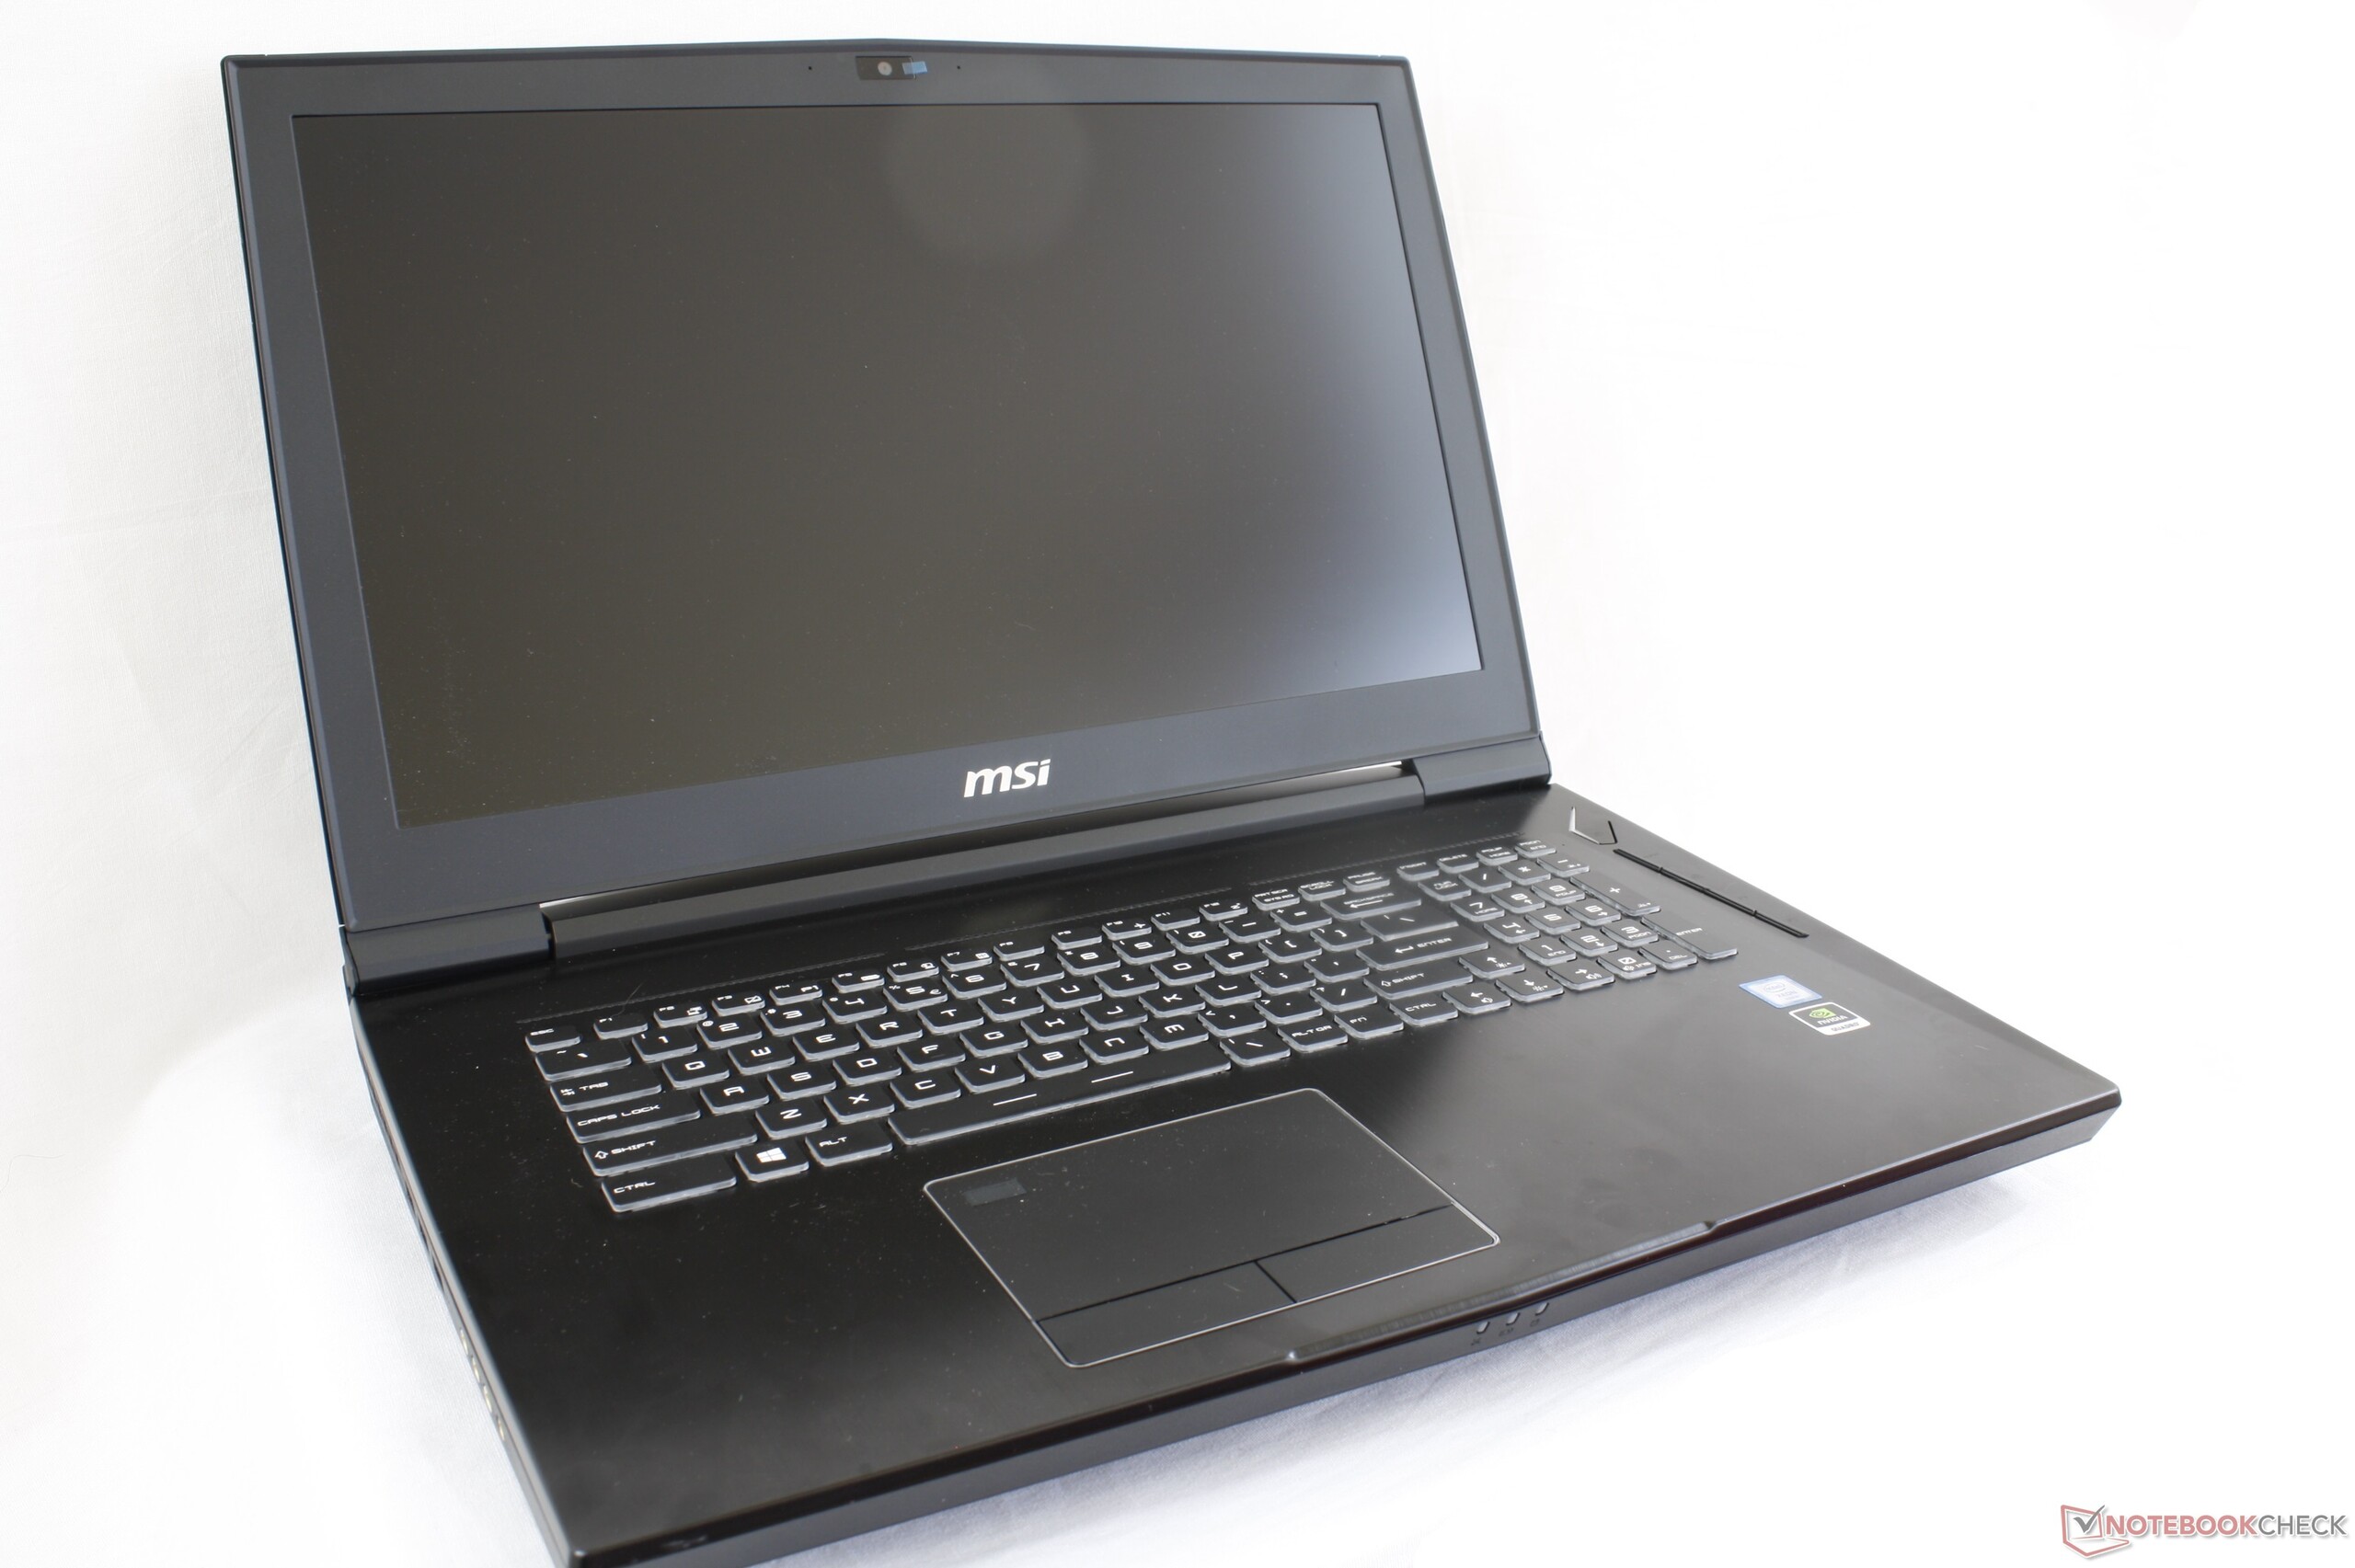
Case
The WT75 chassis is nearly identical to the GT75 and so all our existing comments on the GT75 chassis still apply here. Its two-year old design still leaves a solid, albeit bulky, first impression. When considering that the target professional workstation user is unlikely to be concerned about appearance, however, this shouldn't be a deal breaker. The base is still strong while the hinges and lid could have been firmer for improved longevity. We find the chassis of the Alienware 17 to be tougher overall.
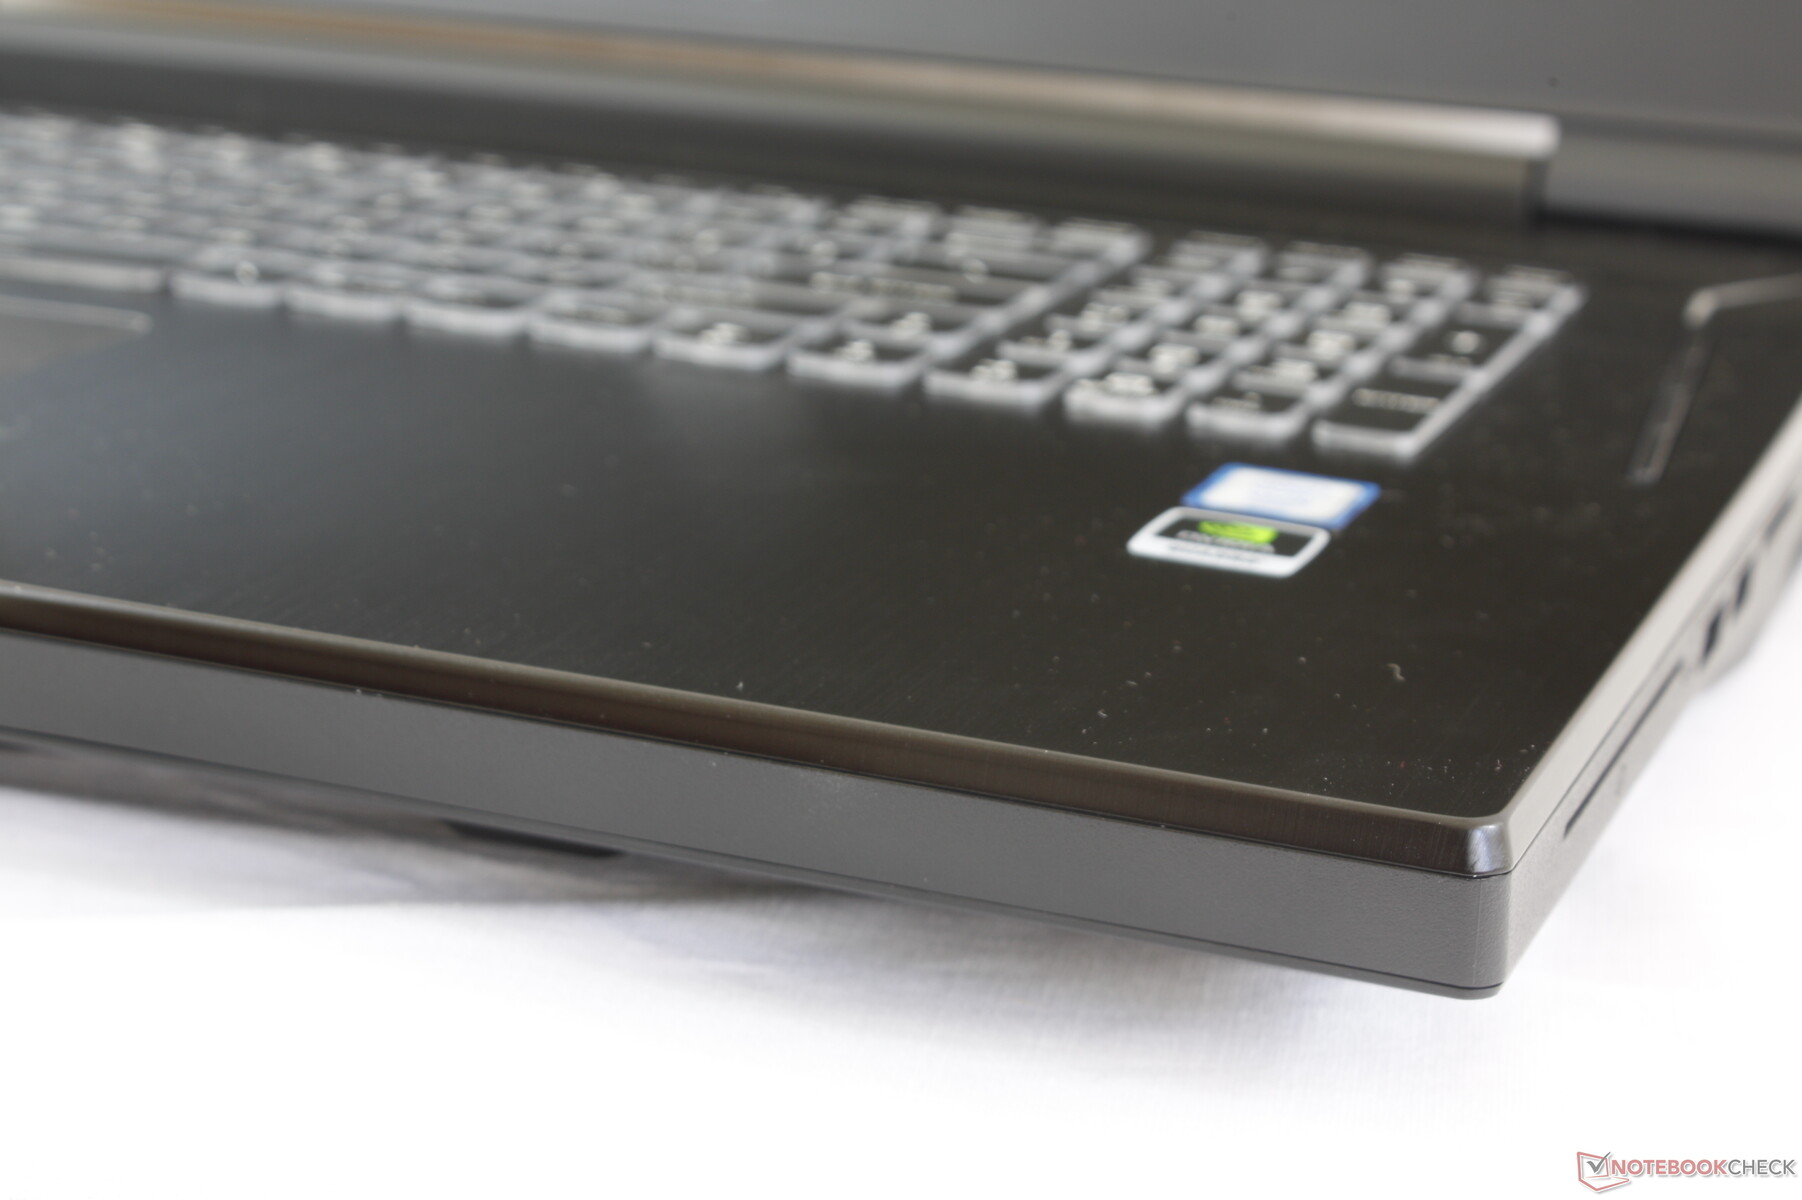
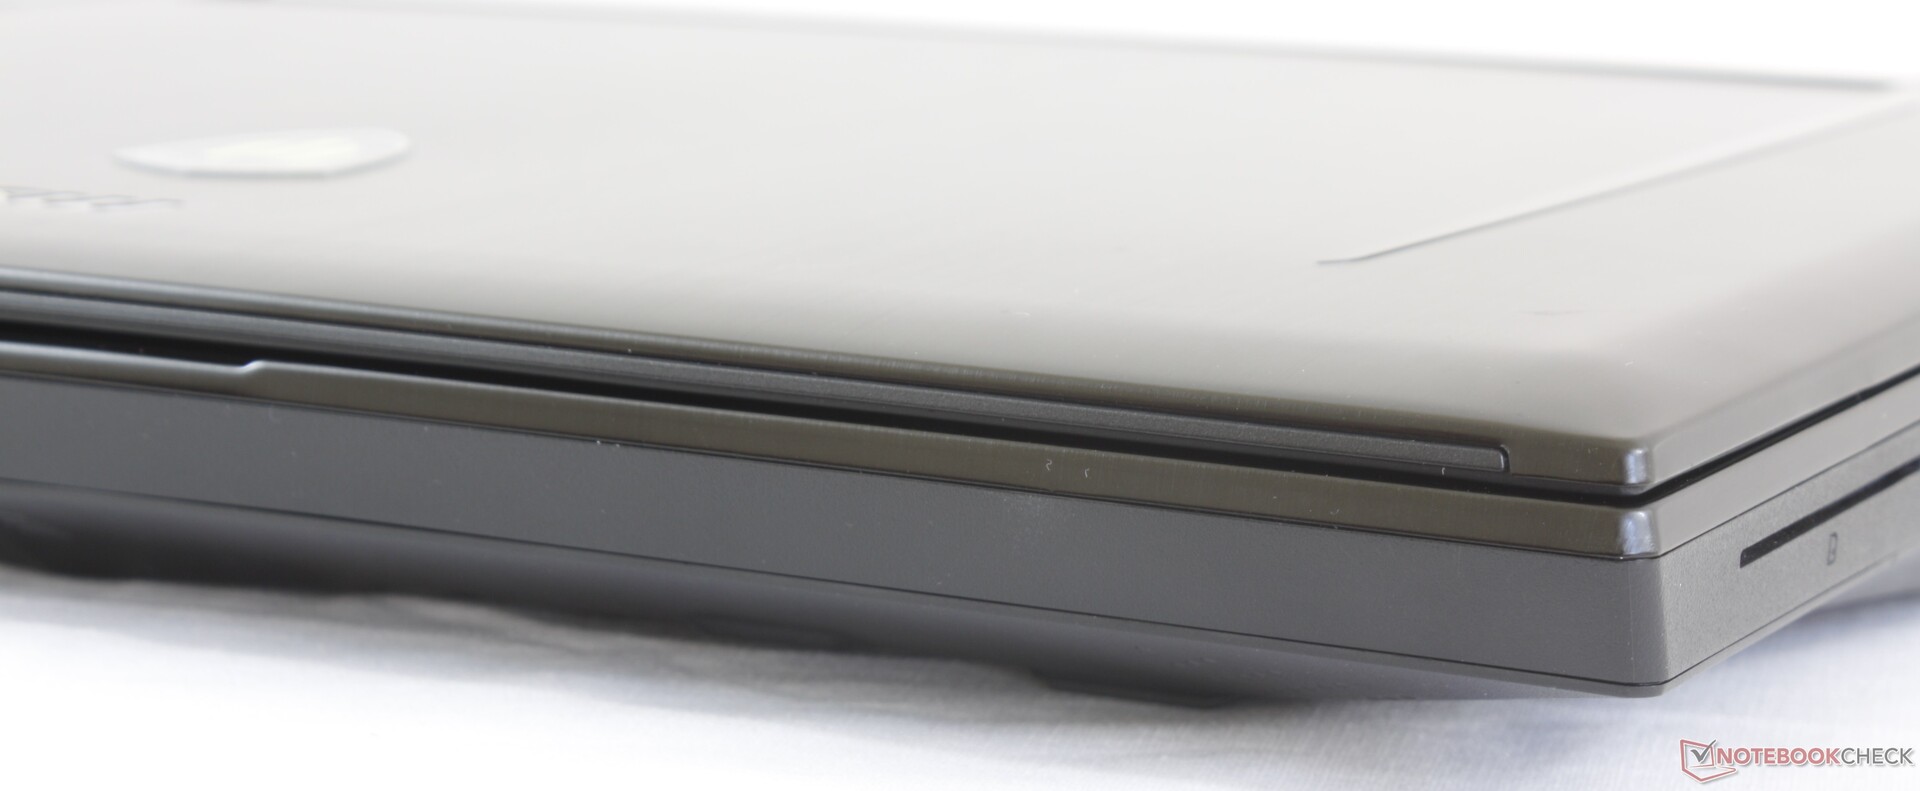
One immediately noticeable difference between the WT75 and GT75 is the lack of rubberized palm rests on the WT75 in favor of smooth brushed aluminum not unlike on the MSI GS75.
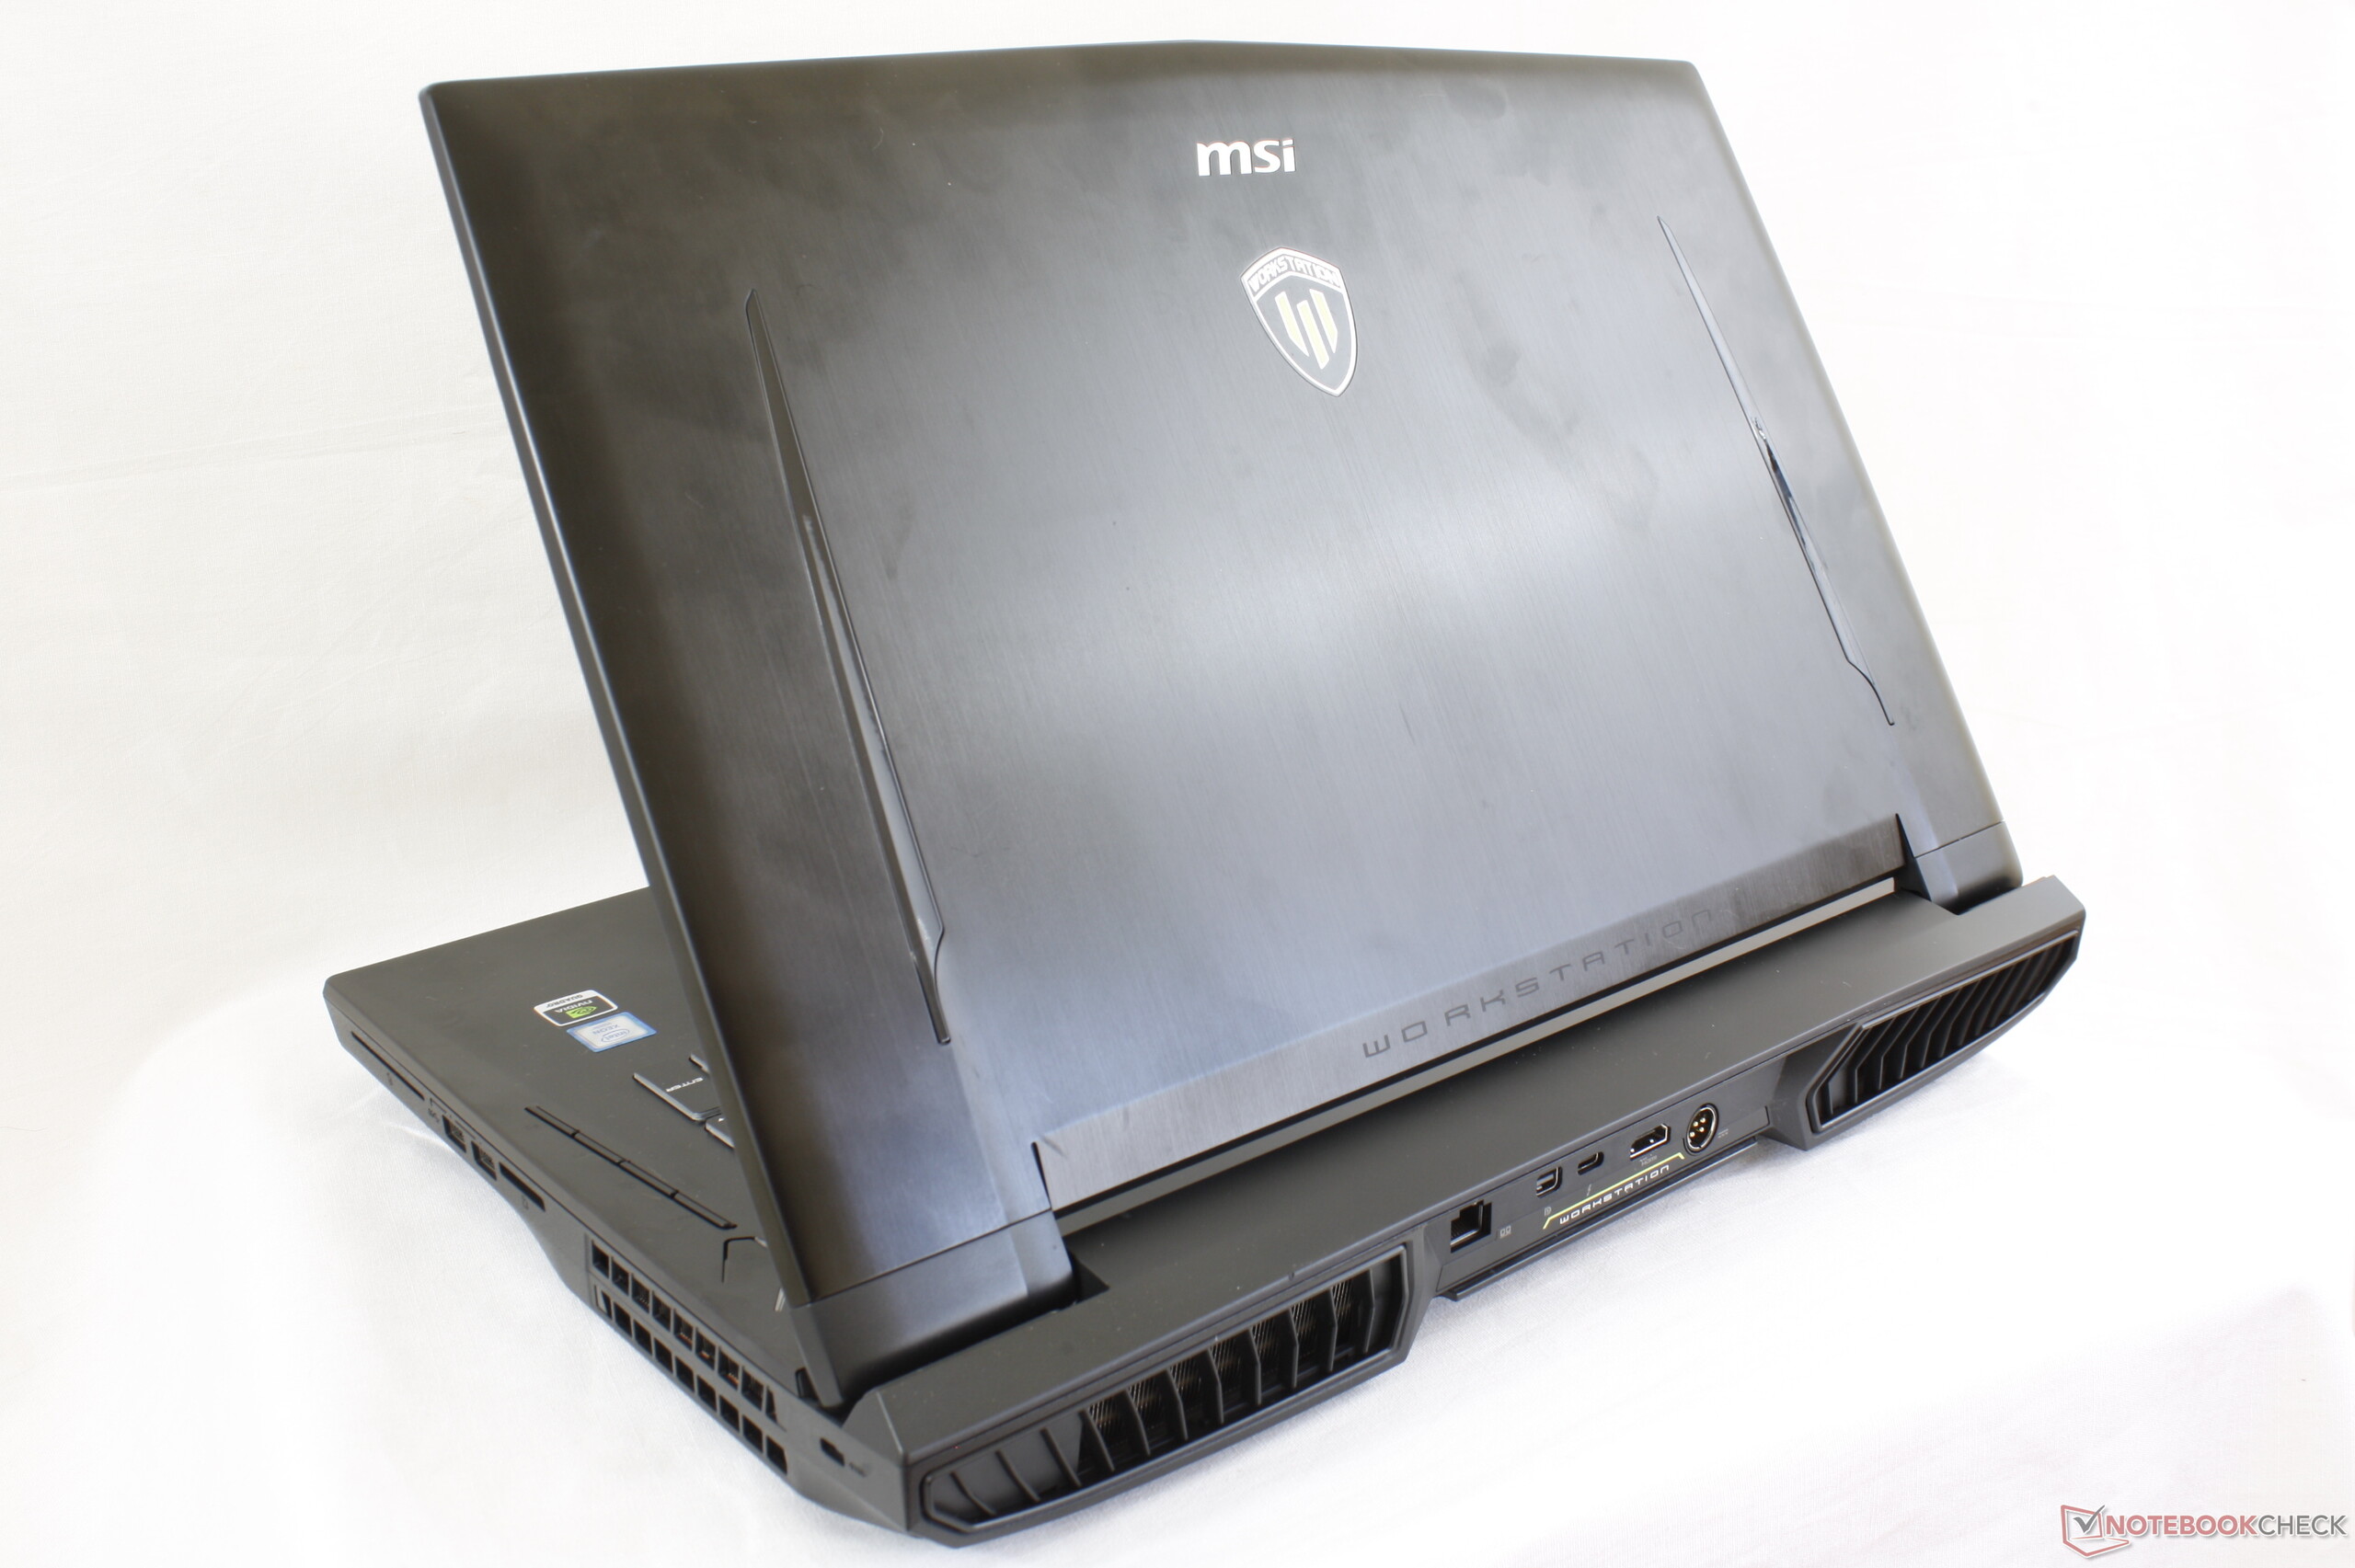
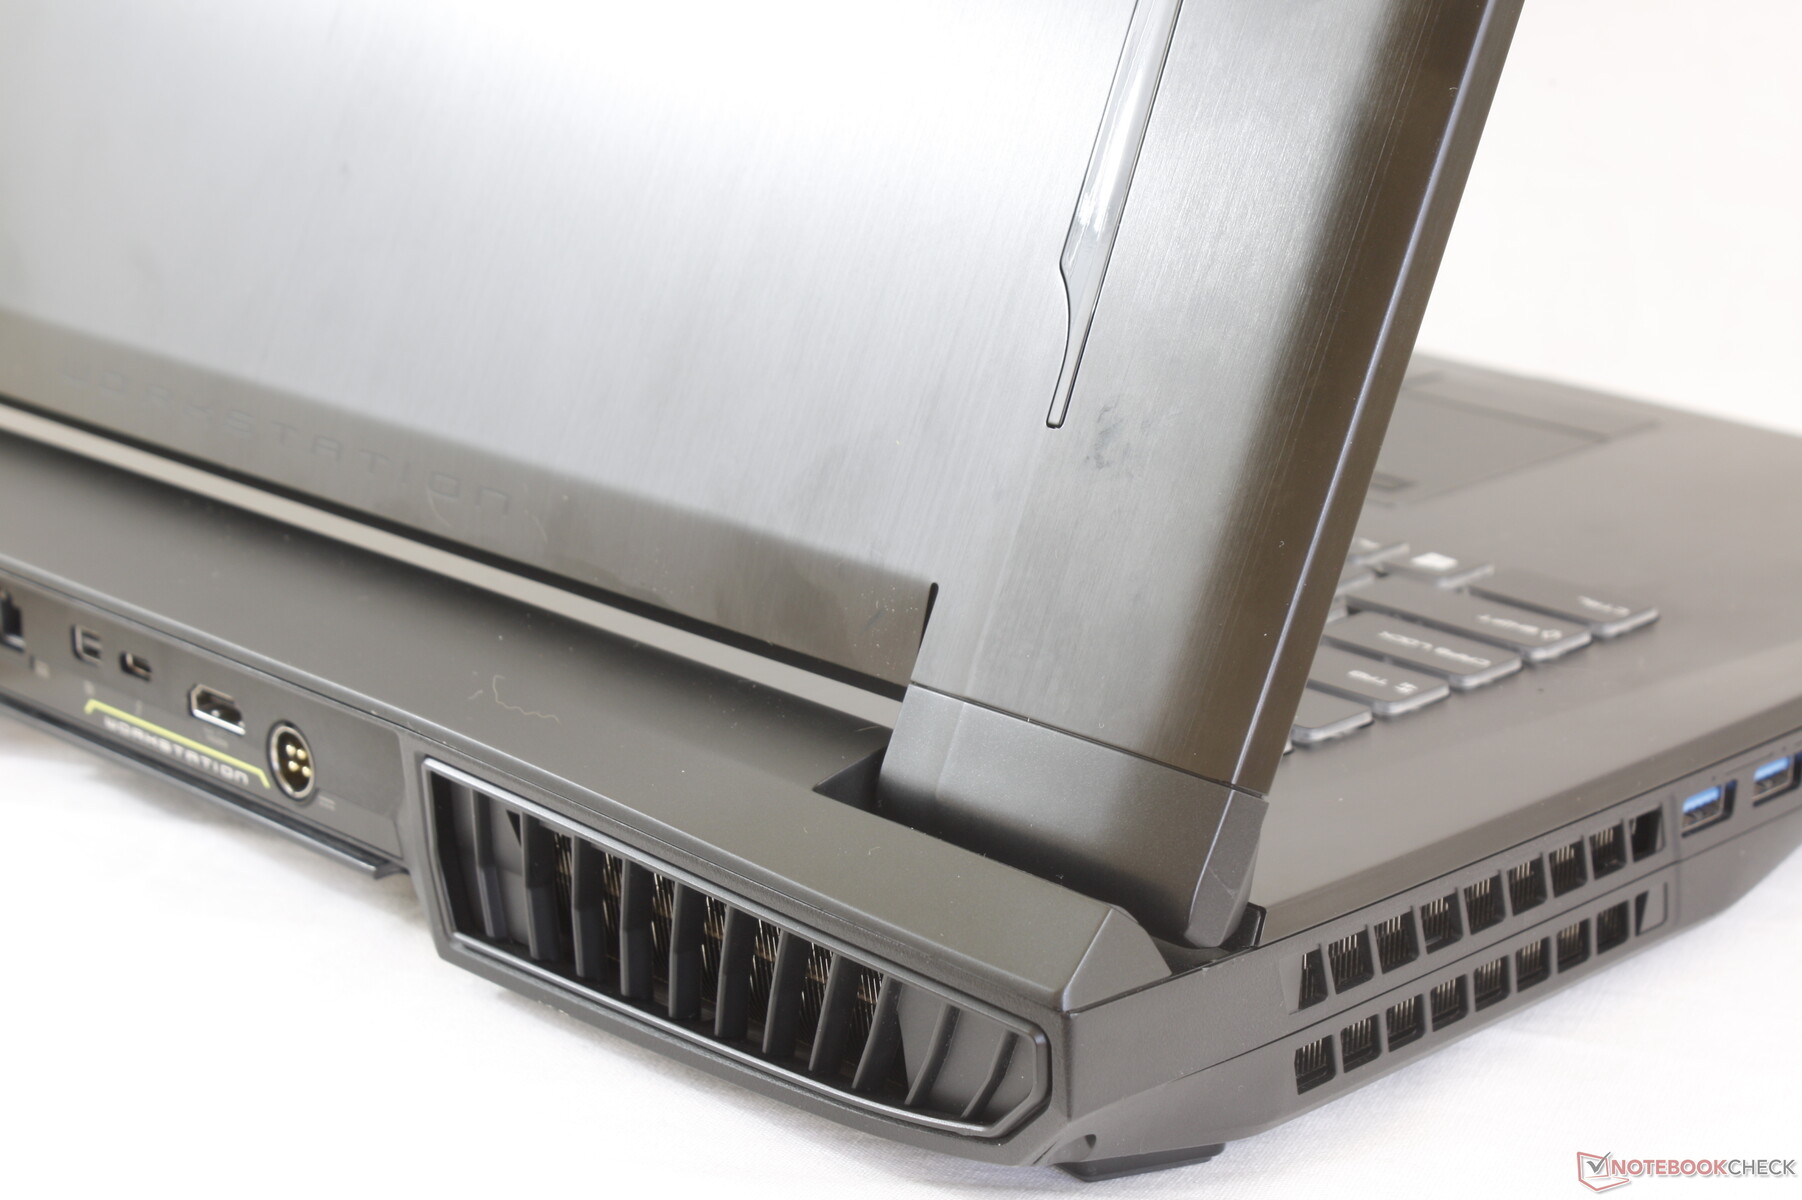
The GT75/WT75 is notable for being larger and heavier than the last generation GT73/WT73 especially in length in order to accommodate a stronger cooling solution. At 4.1 kg, It's one of the heavier 17-inch workstation laptops available although still nowhere near the gaming Asus G703 (4.7 kg) or HP Omen X (4.9 kg) heavyweights.
Dimensions are almost exactly the same as the aforementioned Asus G703 albeit at half a kilogram lighter.
Connectivity
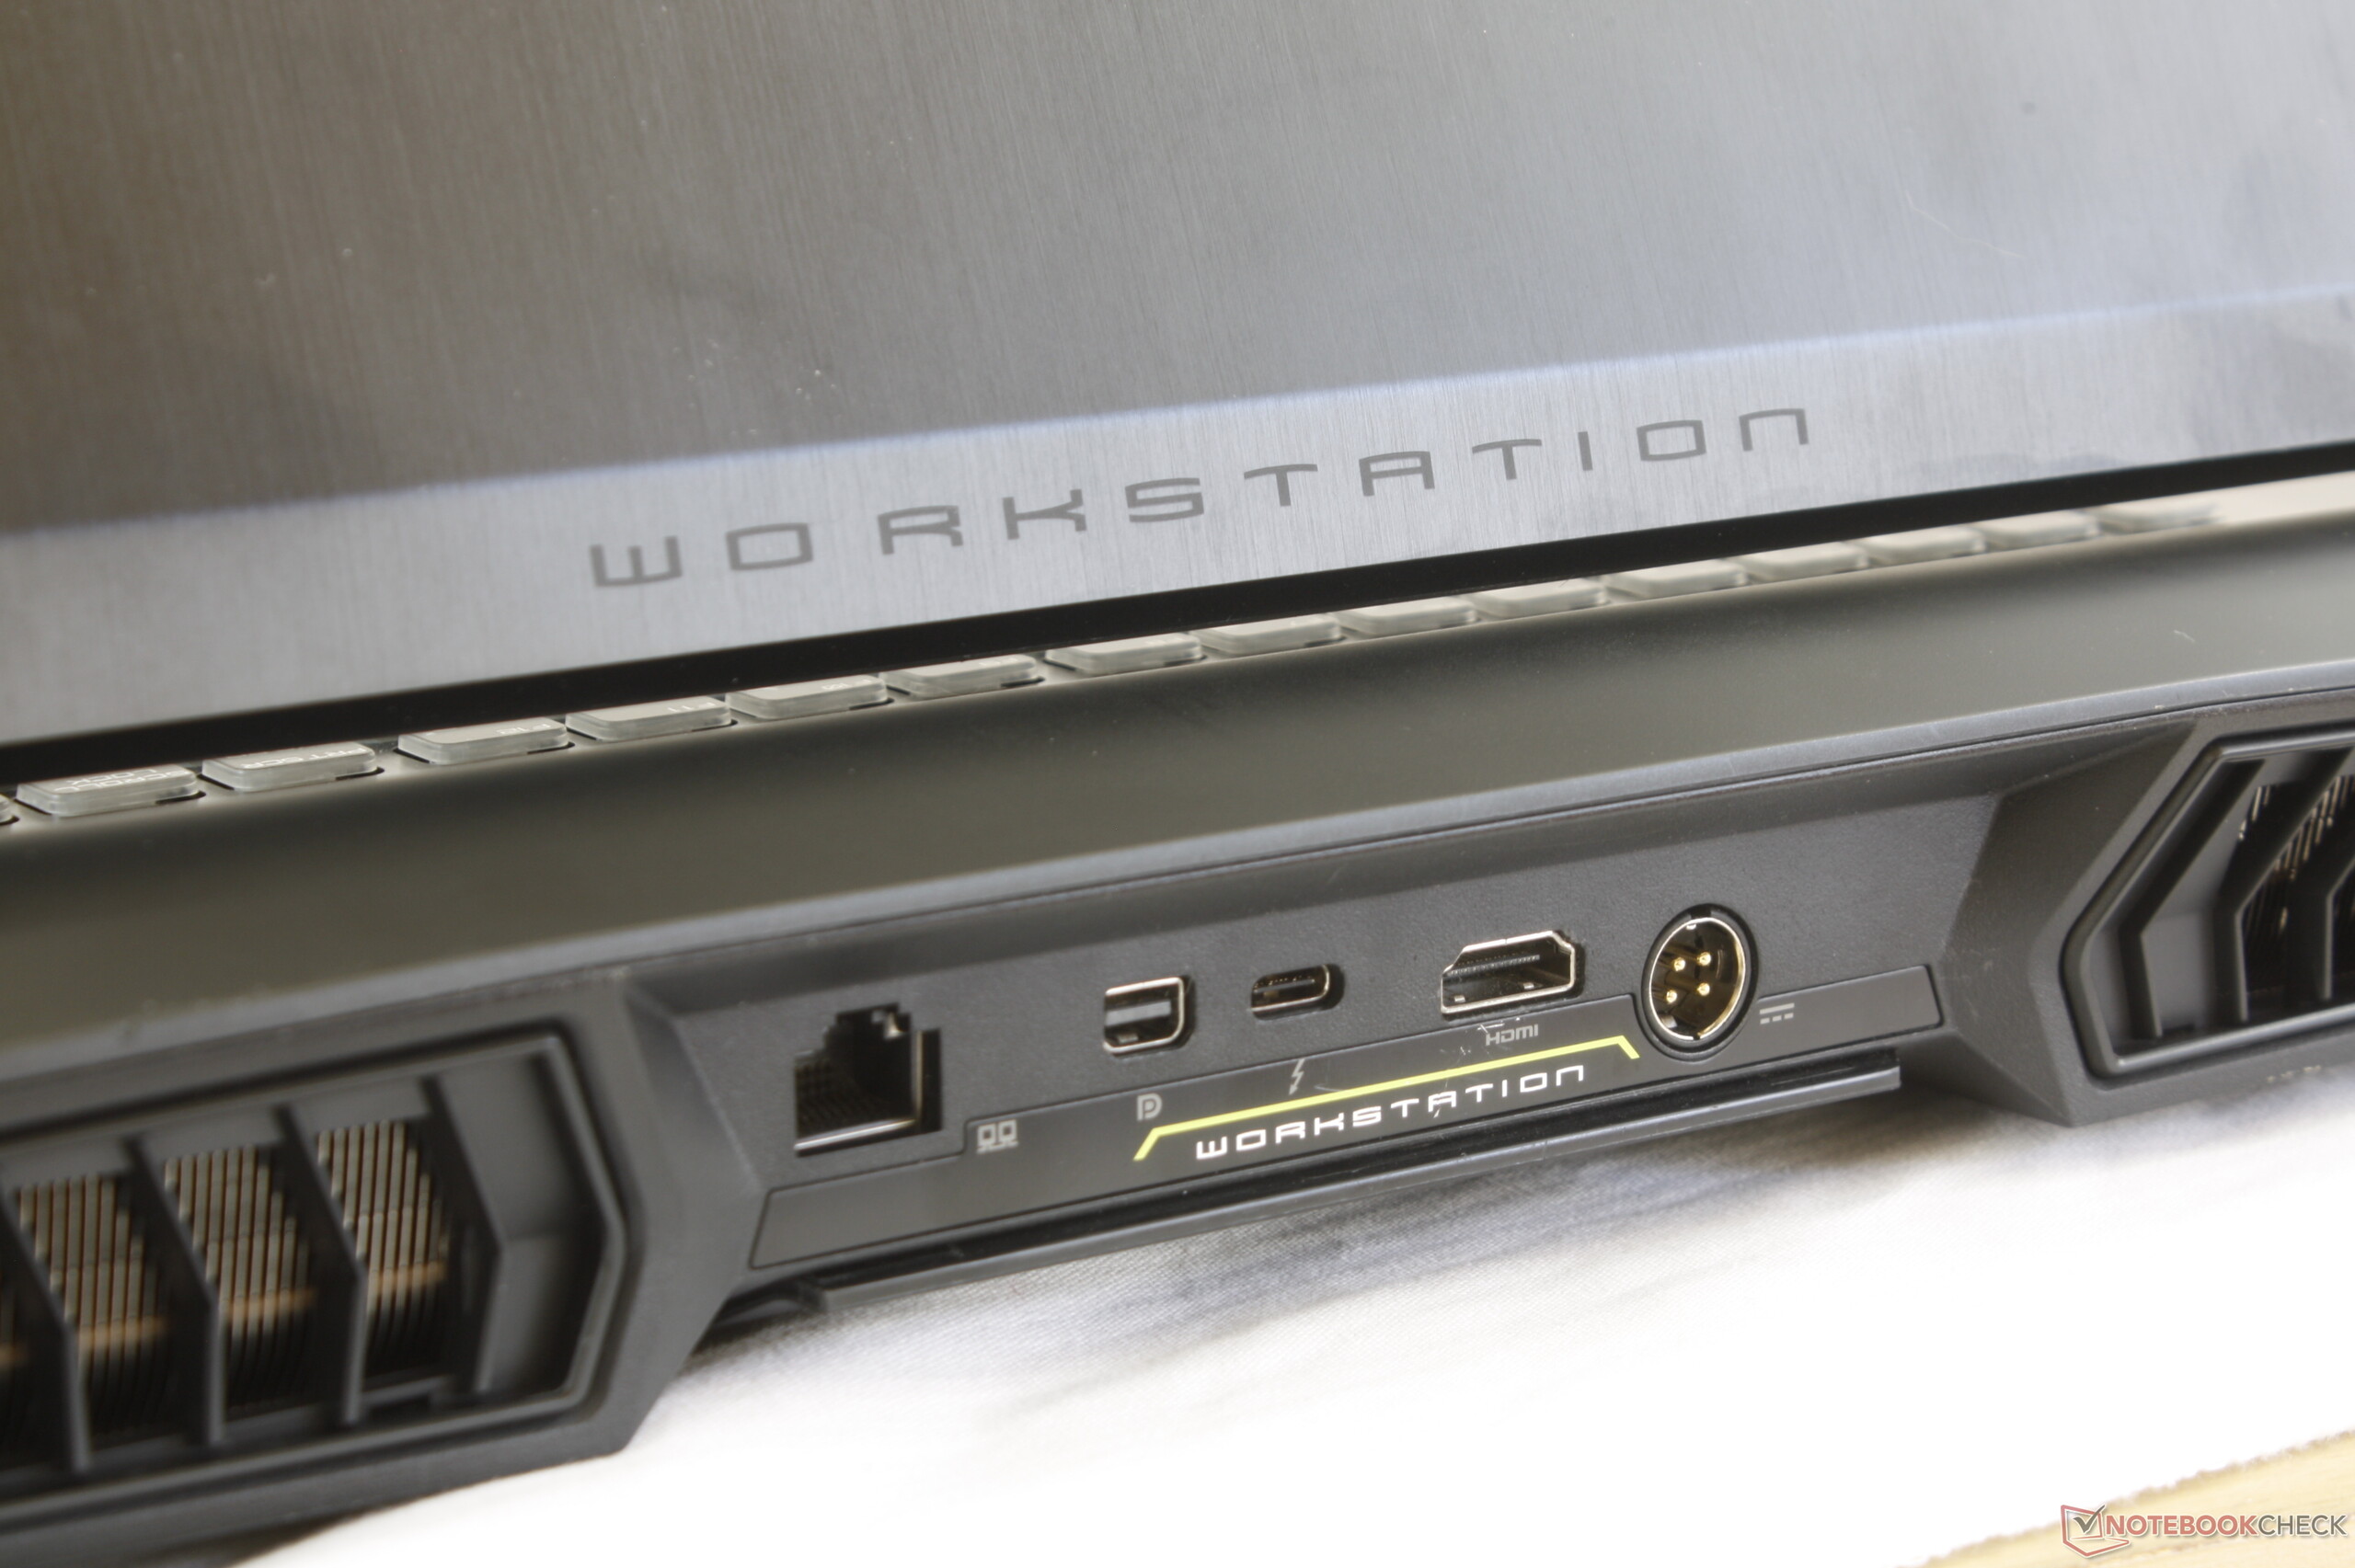
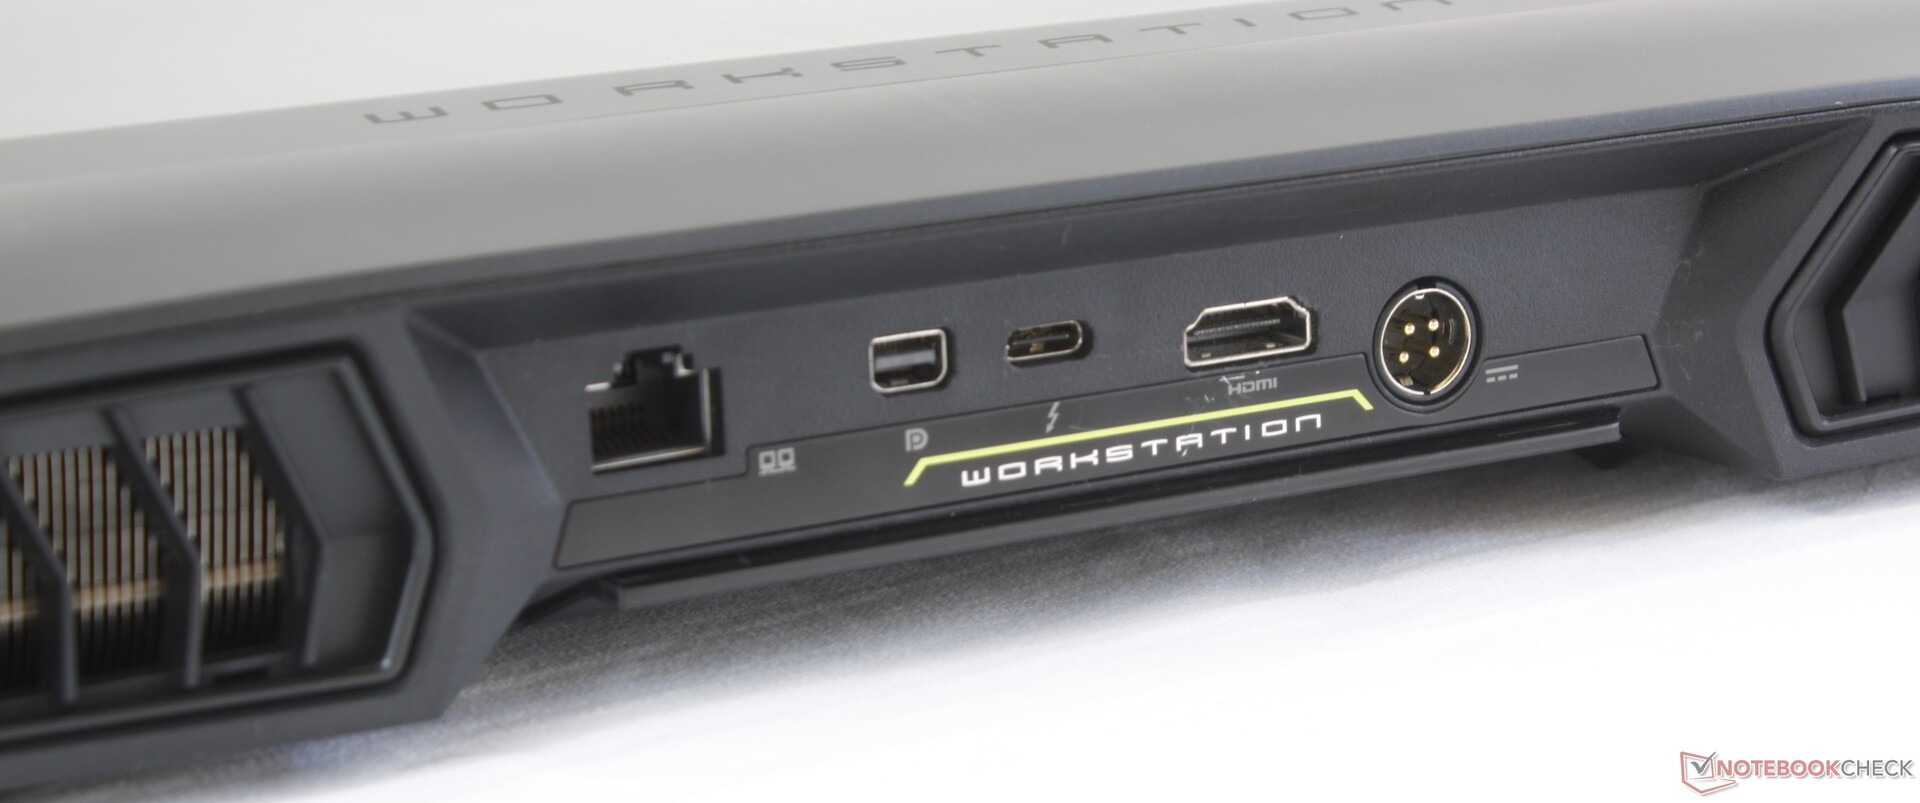
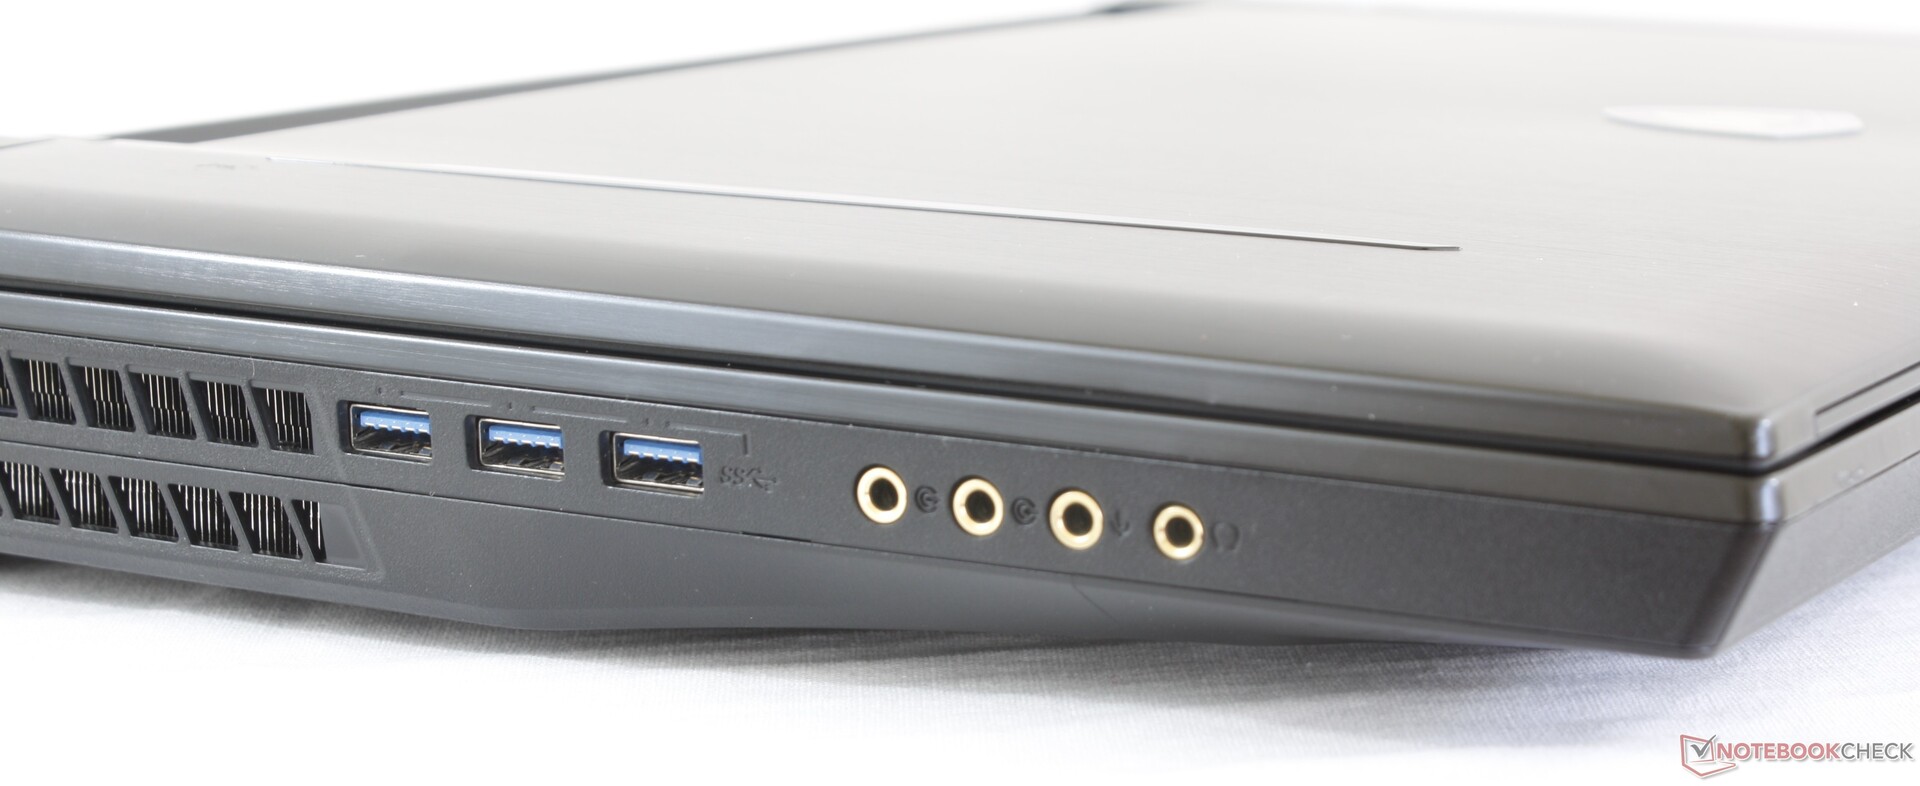
Most ports are available with the exception of VGA and SIM. The competing Fujitsu Celsius H980 includes legacy VGA that some users may appreciate. The wide range of audio options on the WT75 is a remnant of the GT75 that the chassis is derived from. From a professional workstation point-of-view, having four audio jacks is unlikely to be important.
The rear ports are difficult to reach without bowing over for a peek. Lenovo has seemingly solved this issue by integrating LED symbol indicators on its Legion Y740/Y540 series and we hope to see the same from MSI in the future.
Note that the RJ-45 port supports up to 1 Gbps only. The RJ-45 port on the Alienware Area-51m supports up to 2.5 Gbps.
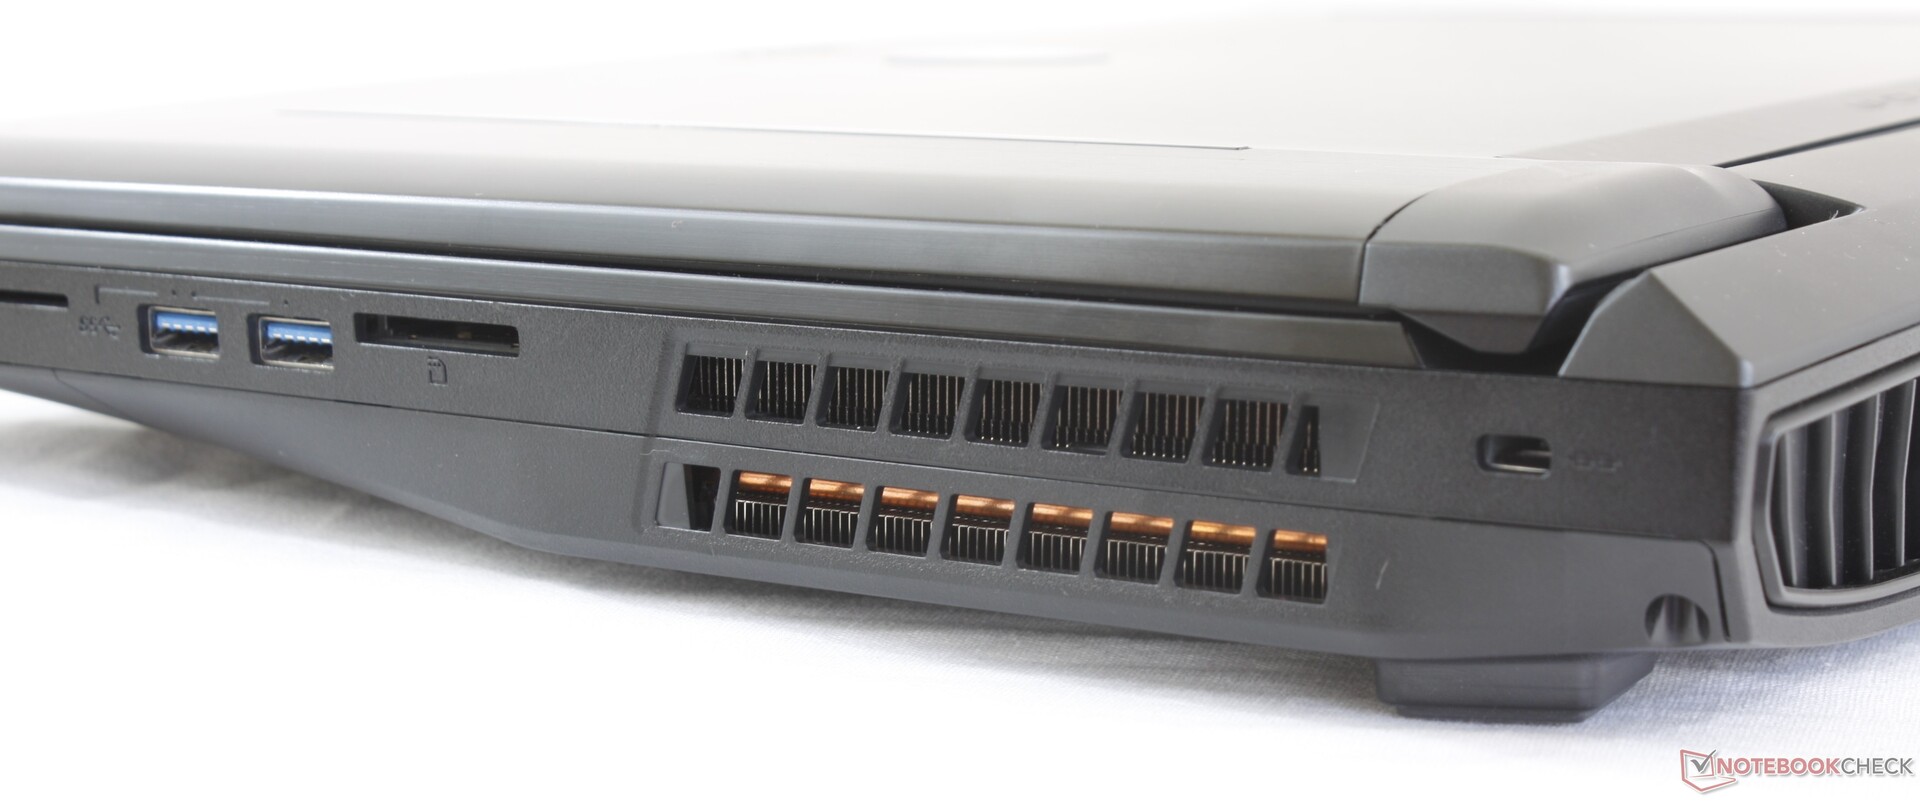
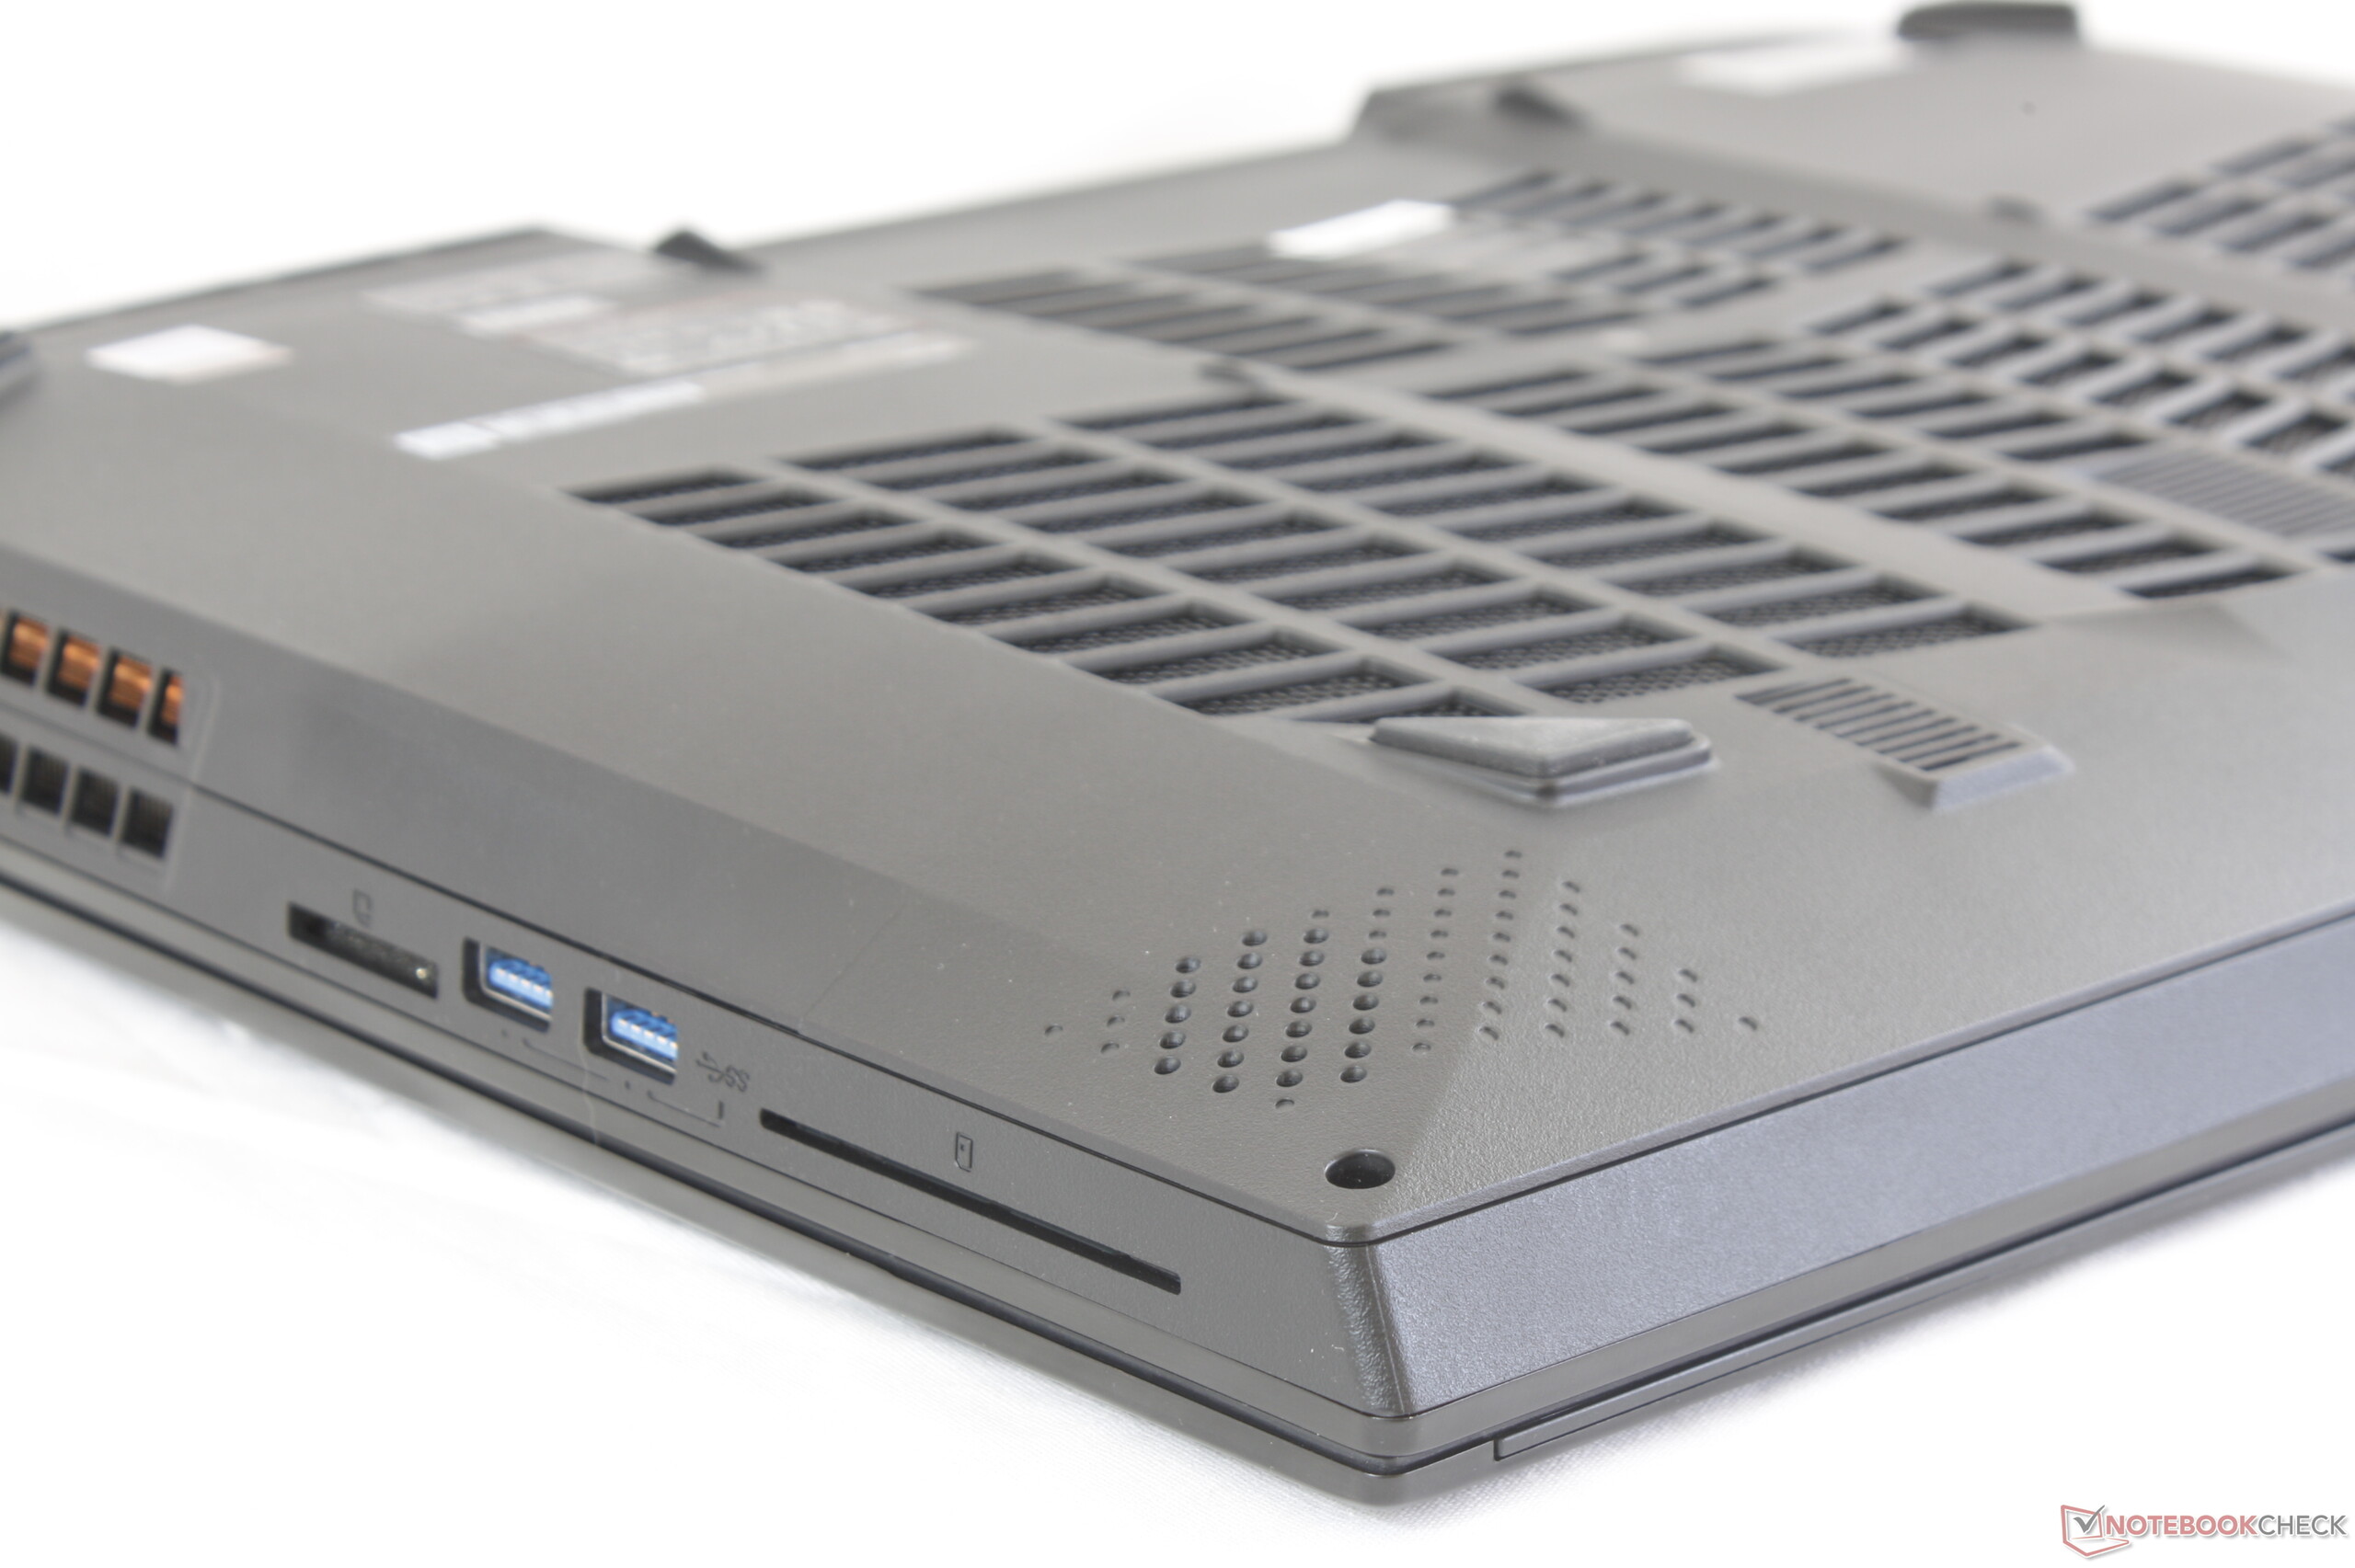
SD Card Reader
The spring-loaded SD card reader returns a transfer rate of 197 MB/s with our UHS-II test card. While fast, it still lags behind the card reader on the Gigabyte Aero 15 by almost 20 percent. Moving 1 GB of pictures from card to desktop takes just under 6 seconds.
A fully inserted SD card protrudes by about 2 mm for safe transporting and easy ejecting.
| SD Card Reader | |
| average JPG Copy Test (av. of 3 runs) | |
| Gigabyte Aero 15-Y9 (Toshiba Exceria Pro SDXC 64 GB UHS-II) | |
| Eurocom Tornado F7W (Toshiba Exceria Pro SDXC 64 GB UHS-II) | |
| MSI WT75 8SM (Toshiba Exceria Pro SDXC 64 GB UHS-II) | |
| Lenovo ThinkPad P72-20MB000EGE (Toshiba Exceria Pro SDXC 64 GB UHS-II) | |
| Fujitsu Celsius H980 (Toshiba Exceria Pro SDXC 64 GB UHS-II) | |
| maximum AS SSD Seq Read Test (1GB) | |
| Gigabyte Aero 15-Y9 (Toshiba Exceria Pro SDXC 64 GB UHS-II) | |
| Lenovo ThinkPad P72-20MB000EGE (Toshiba Exceria Pro SDXC 64 GB UHS-II) | |
| Eurocom Tornado F7W (Toshiba Exceria Pro SDXC 64 GB UHS-II) | |
| MSI WT75 8SM (Toshiba Exceria Pro SDXC 64 GB UHS-II) | |
| Fujitsu Celsius H980 (Toshiba Exceria Pro SDXC 64 GB UHS-II) | |
Communication
Whereas the GT75 ships with a Killer 1535 or 1550 module for gaming-centric features, our WT75 includes a more standard Intel 9260. Average transmit rates are slower than expected at 446 Mbps. Nonetheless, we didn't experience any connectivity issues and the module itself promises theoretical transfer rates of up to 1.73 Gbps.
| Networking | |
| iperf3 transmit AX12 | |
| Fujitsu Celsius H980 | |
| Lenovo ThinkPad P72-20MB000EGE | |
| Dell Precision 7720 | |
| MSI WT75 8SM | |
| iperf3 receive AX12 | |
| Fujitsu Celsius H980 | |
| Lenovo ThinkPad P72-20MB000EGE | |
| MSI WT75 8SM | |
| Dell Precision 7720 | |
Maintenance
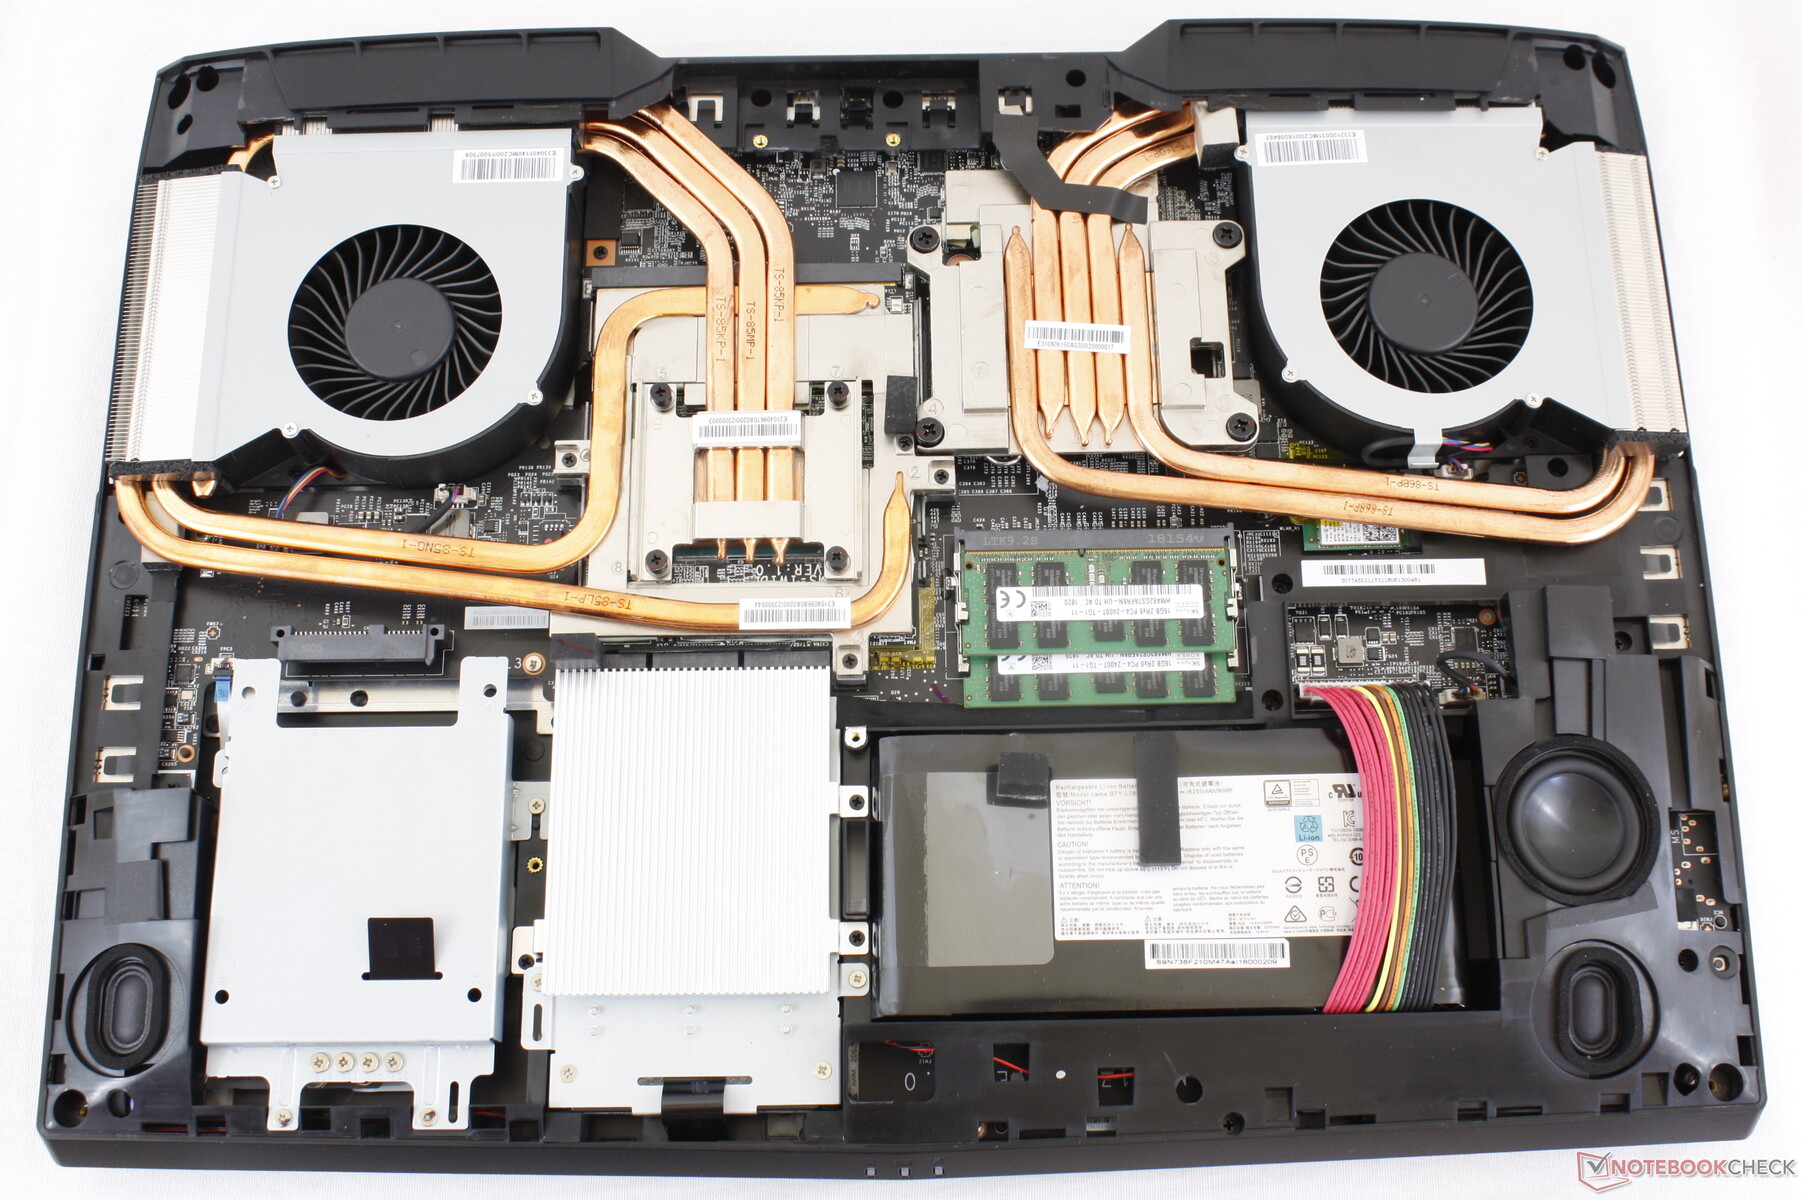
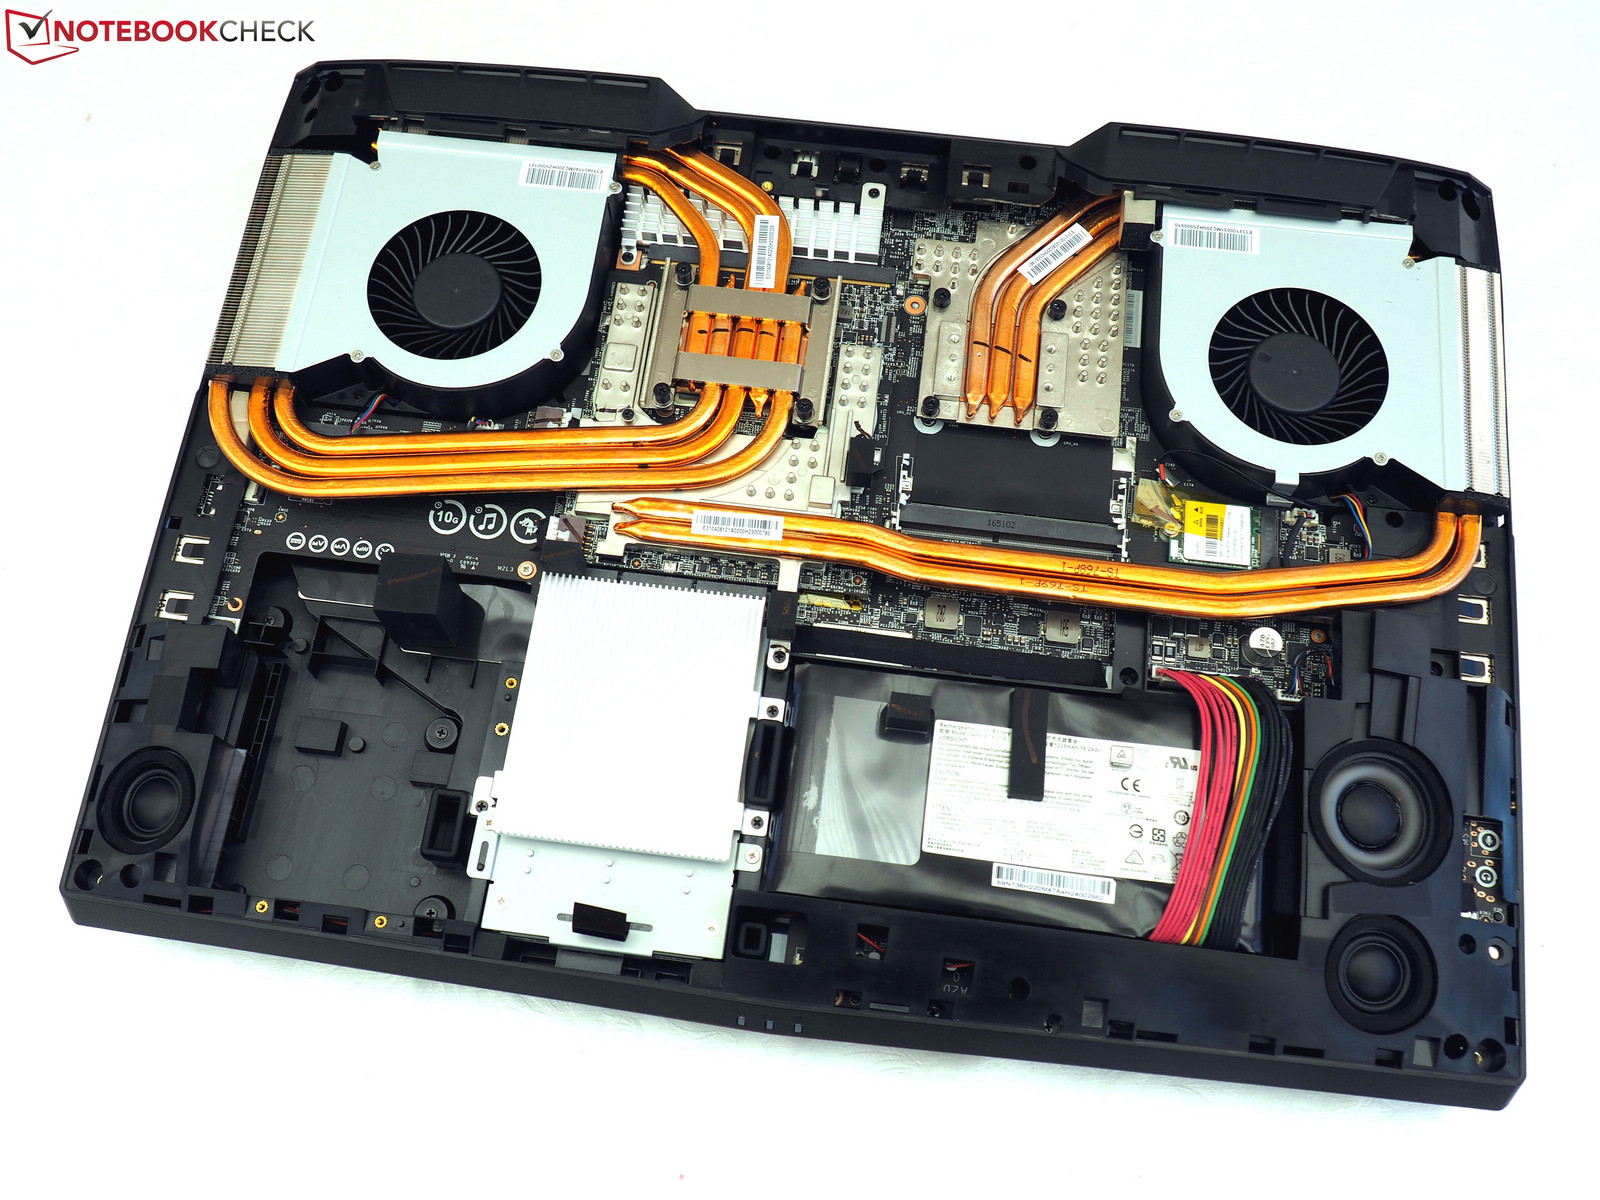
The bottom panel is secured by only five Philips screws for fast servicing. In comparison, the bottom panel on the Alienware m17 is secured by 12 screws.
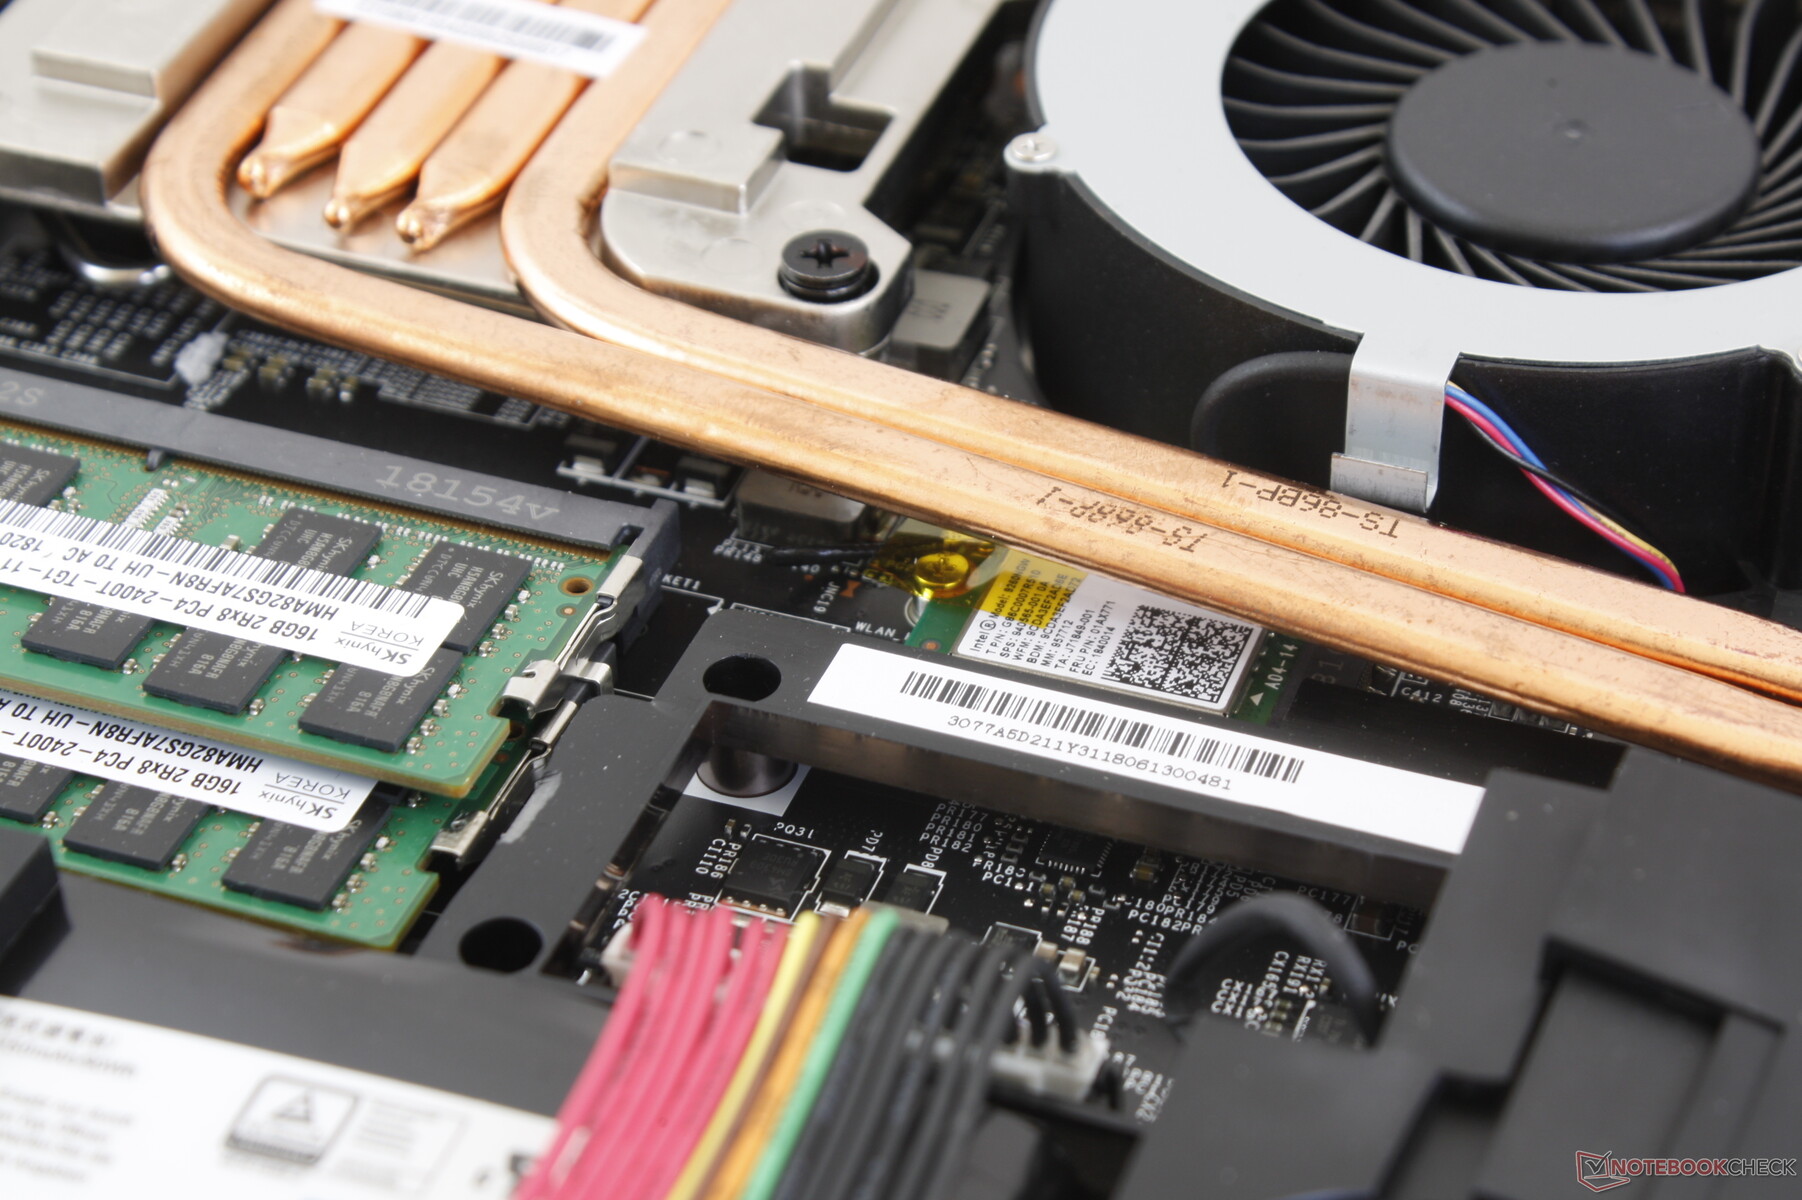
Most components are easy to access with some exceptions. The WLAN module, second 2.5-inch SATA III bay, and two of the four SODIMM slots require additional disassembly.
Accessories and Warranty
There are no included accessories with our test unit other than the usual warranty card and AC adapter.
The standard one-year limited manufacturer warranty applies. Registering the purchase with MSI online may extend the warranty by several months at no additional cost.
Input Devices
Keyboard and Touchpad
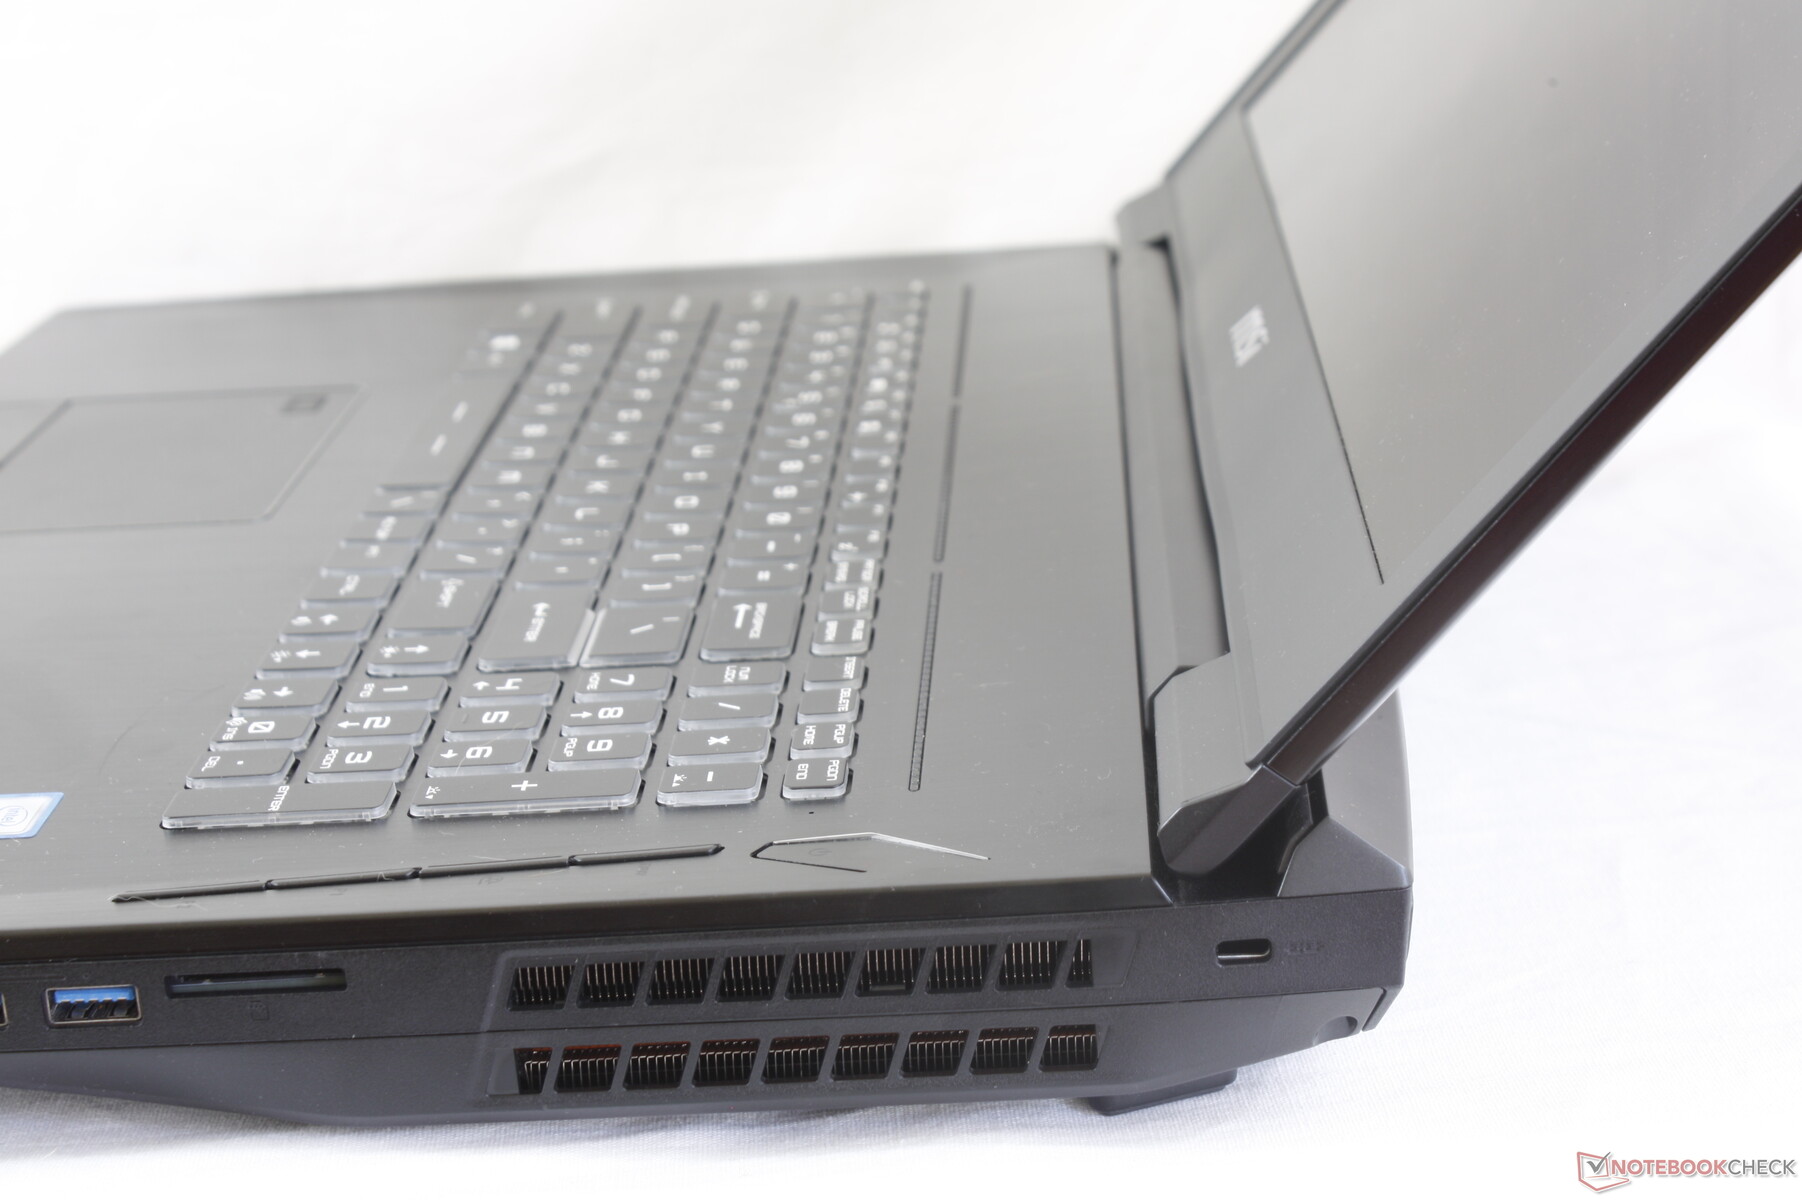
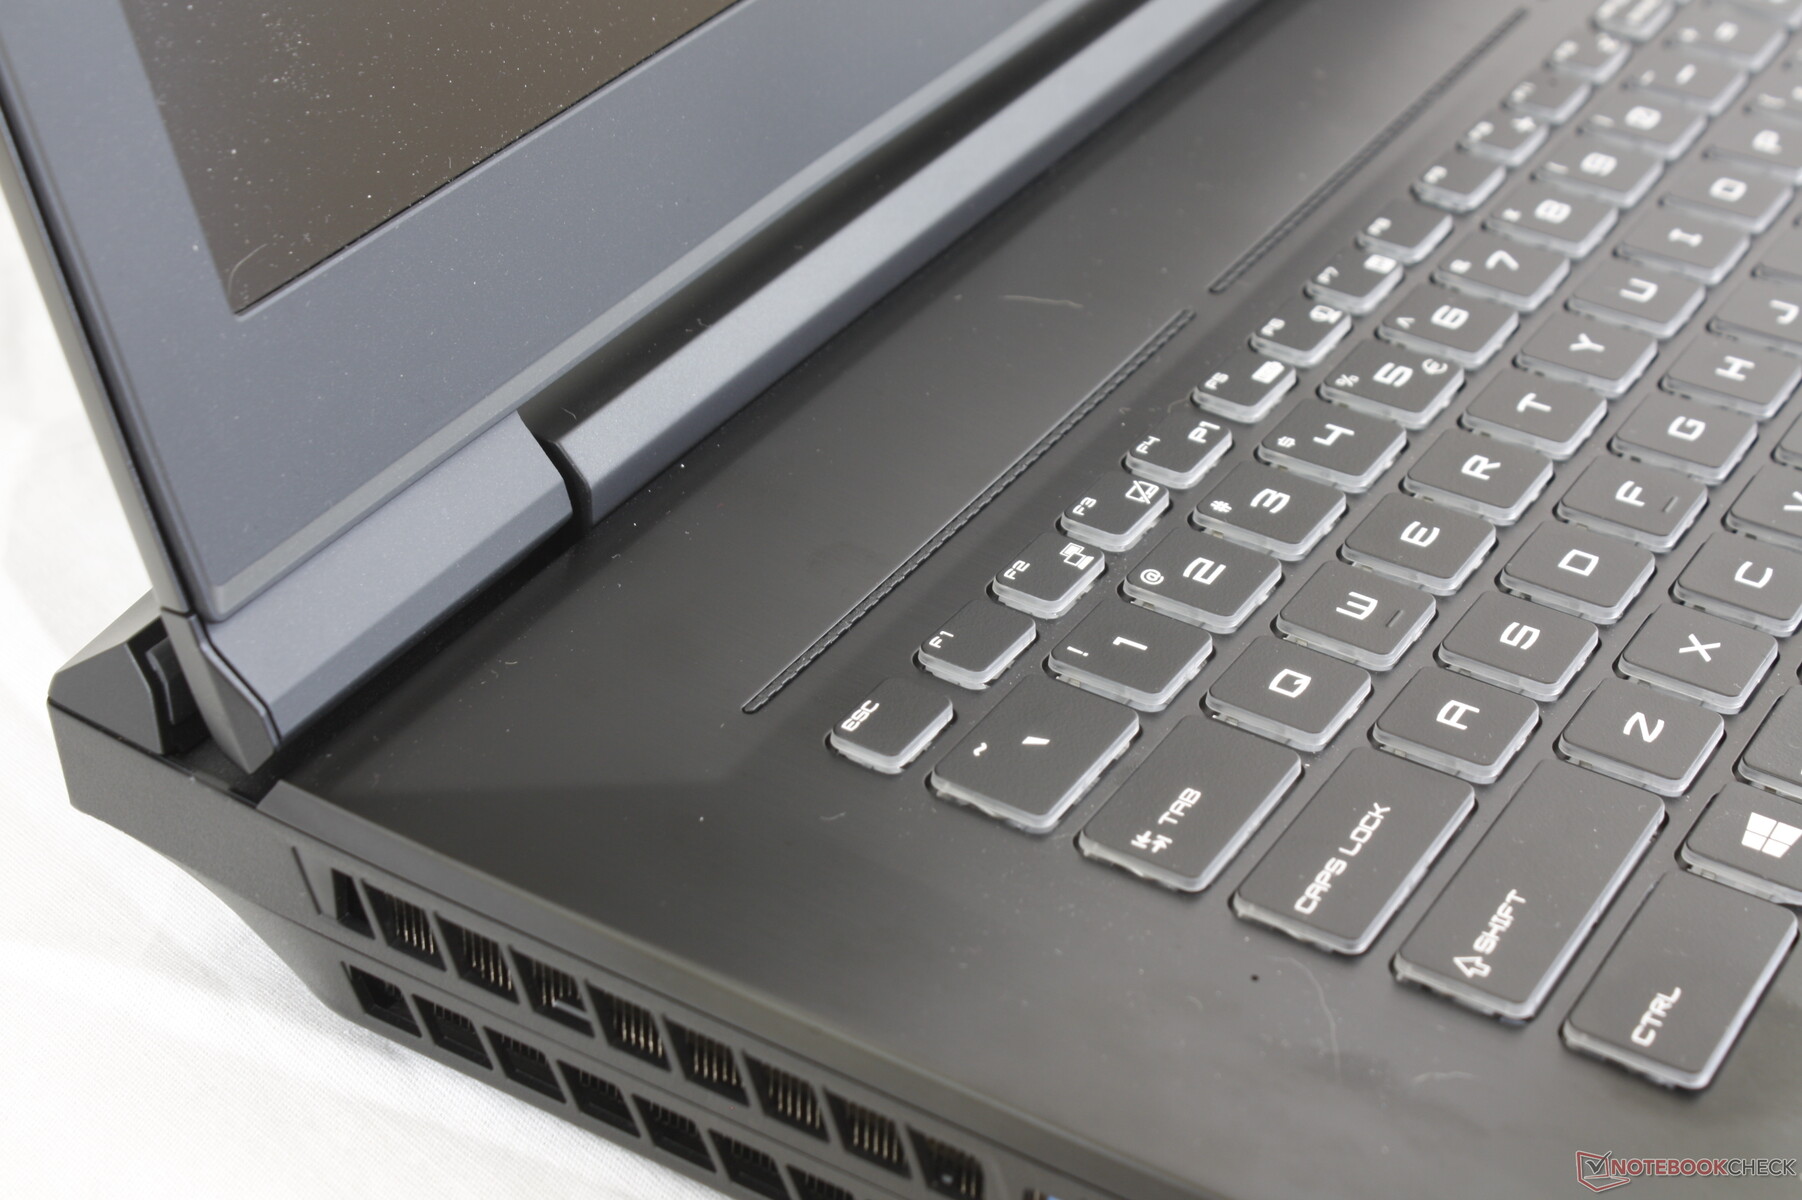
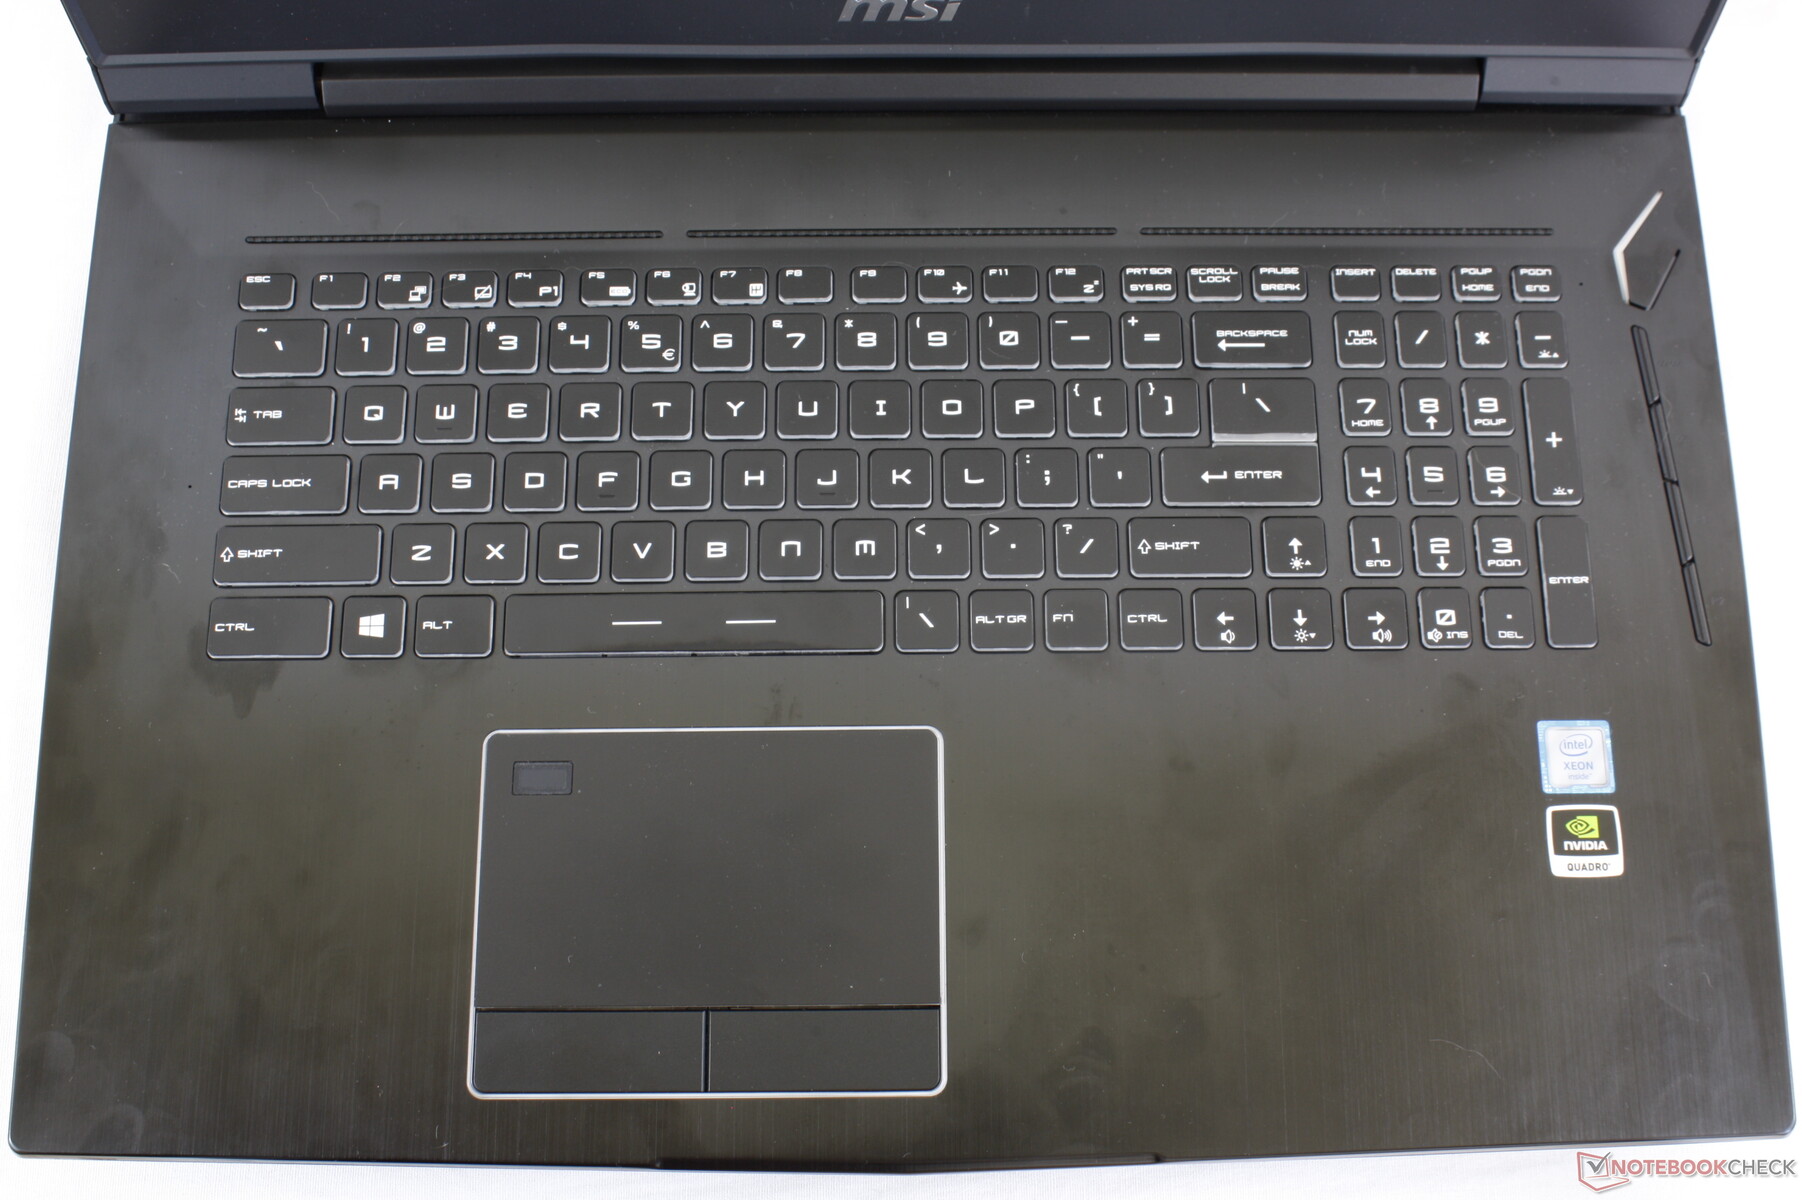
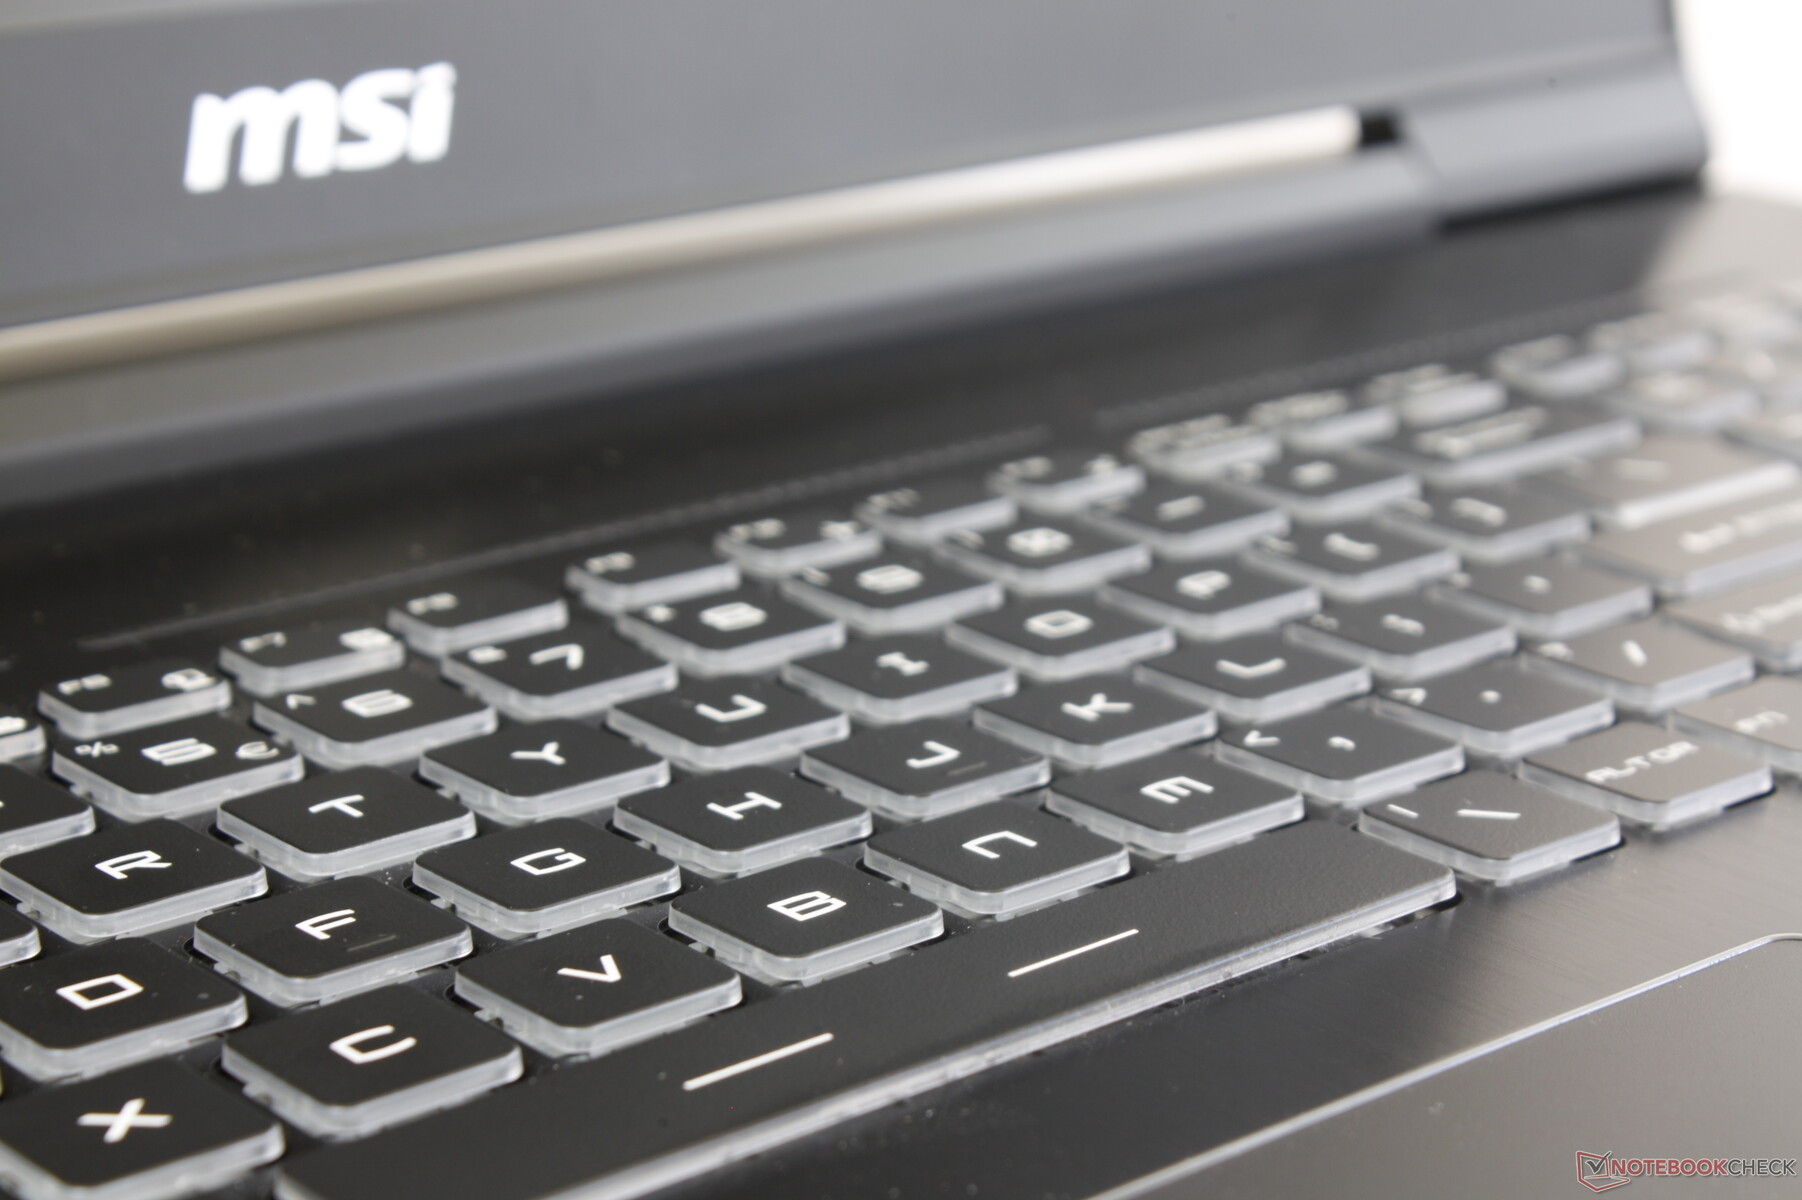
ANother key difference between the WT75 and GT75 is the keyboard. While the latter integrates mechanical keys, the WT75 uses a more traditional membrane-based design. This makes sense considering that gamers may prefer the "clicky" feedback of mechanical keyboards while professional workstations users are more likely to prefer the quieter traditional keyboard. Indeed, feedback is quieter than expected with uniform feedback across all keys including the narrower NumPad keys. It's also not a coincidence that the keys feel like the SteelSeries keys as found on the MSI GS75 or GT73.
Per-key RGB backlight has been removed in favor of a single-zone white backlight for the same reasons as above.
Meanwhile, the trackpad (~11 x 6.7 cm) and dedicated mouse keys have also changed from the transition to a mobile workstation. Whereas the GT75 has rubberized trackpad surfaces and mouse keys, these same surfaces are smooth matte plastic on the WT75 instead. We find this more traditional approach less gimmicky than on the GT75 and far easier to use for cursor control, The mouse keys, however, are too shallow and could have benefited from a firmer click when pressed.
Display
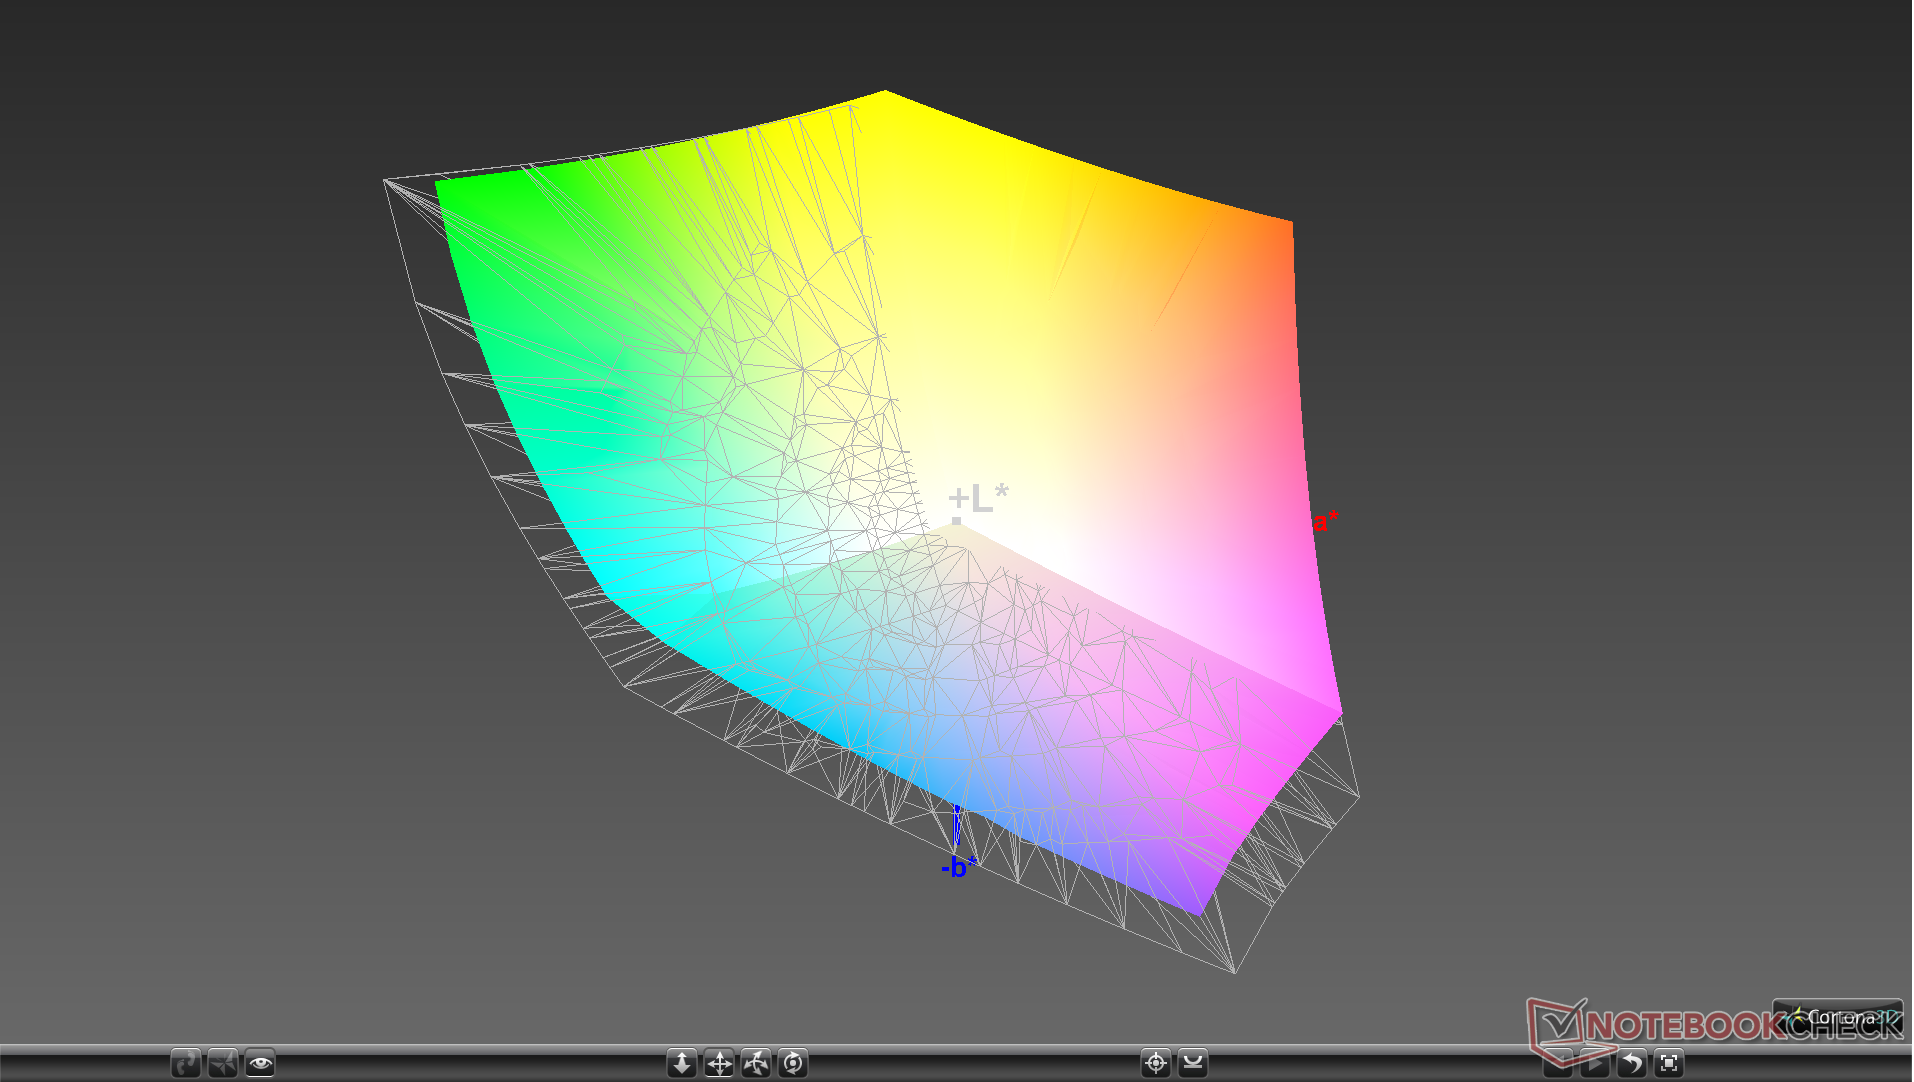
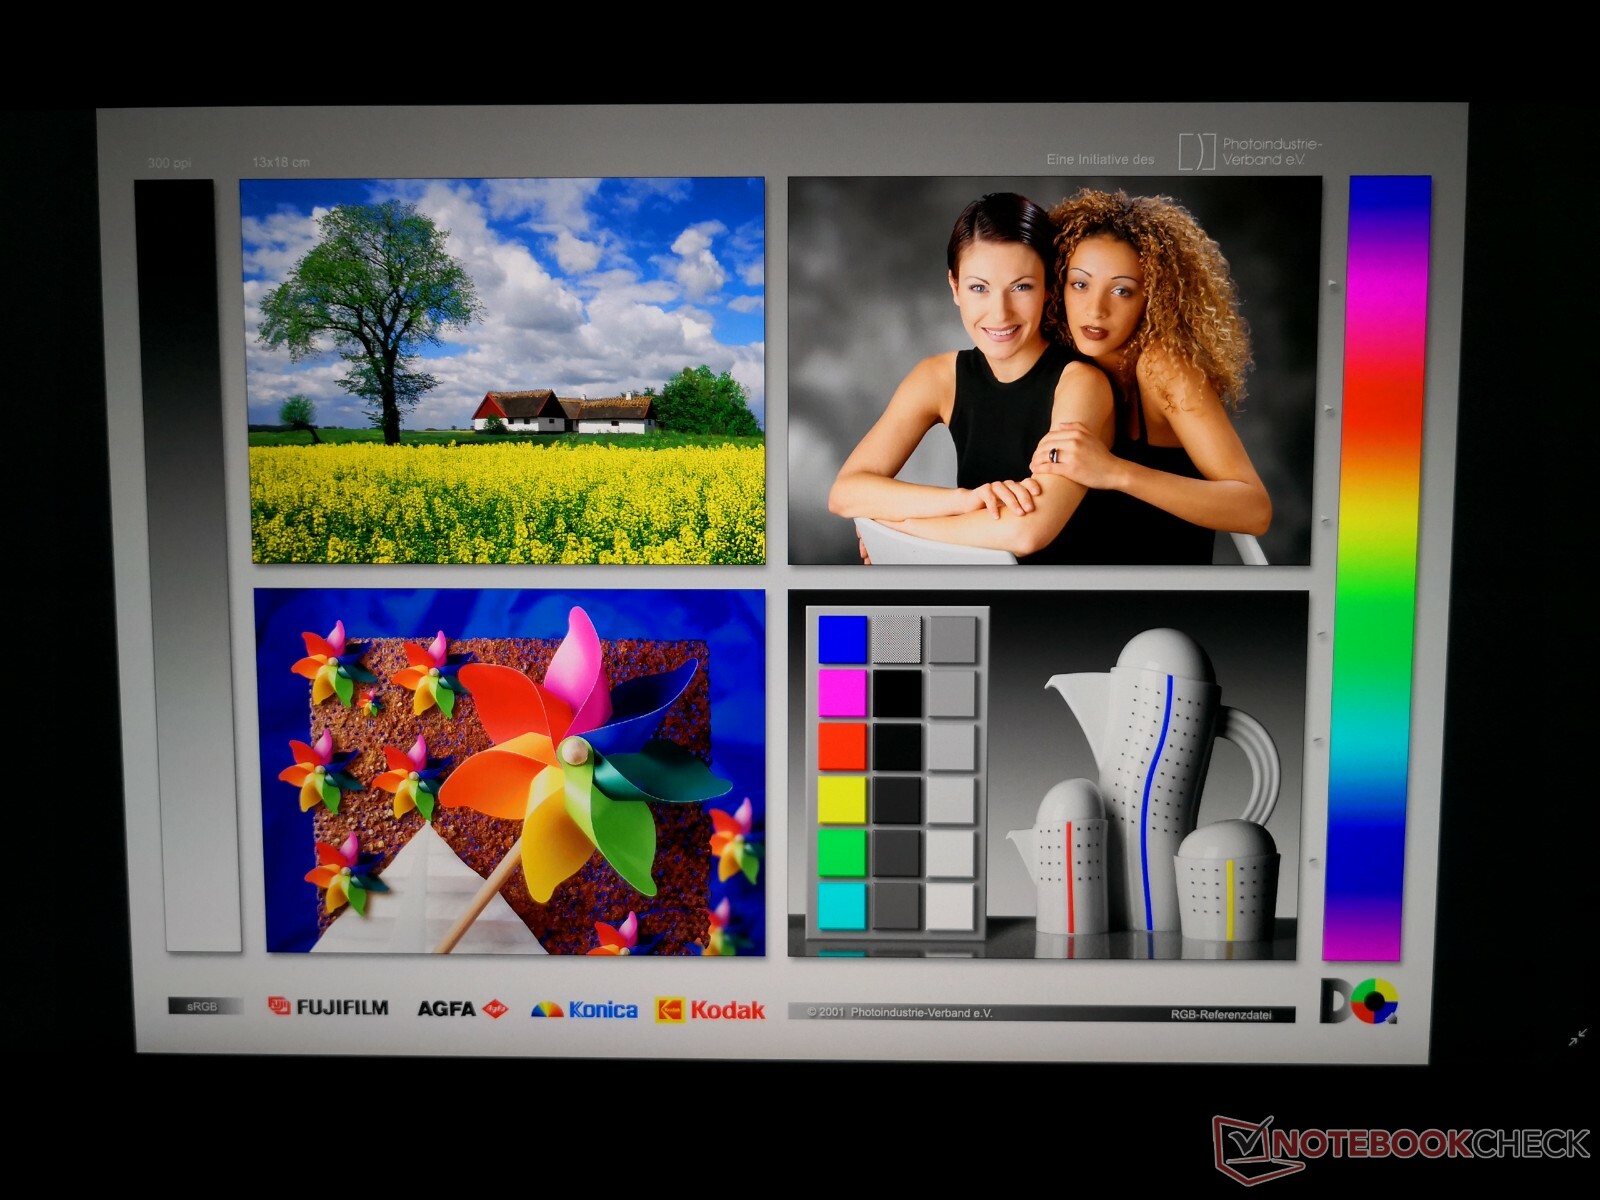
The 4K UHD AU Optronics B173ZAN01.0 IPS panel on our WT75 test unit is common on many other 17-inch laptops including the Eurocom Sky DLX7, Acer Predator 17, and even the recently released Alienware m17. Thus, certain display characteristics are similar between all these laptops including the average black-white response times and contrast ratio when compared to the latest panels with high 144 Hz refresh rates. In return, gamut is wider than on most gaming laptops to appeal to the target workstation user.
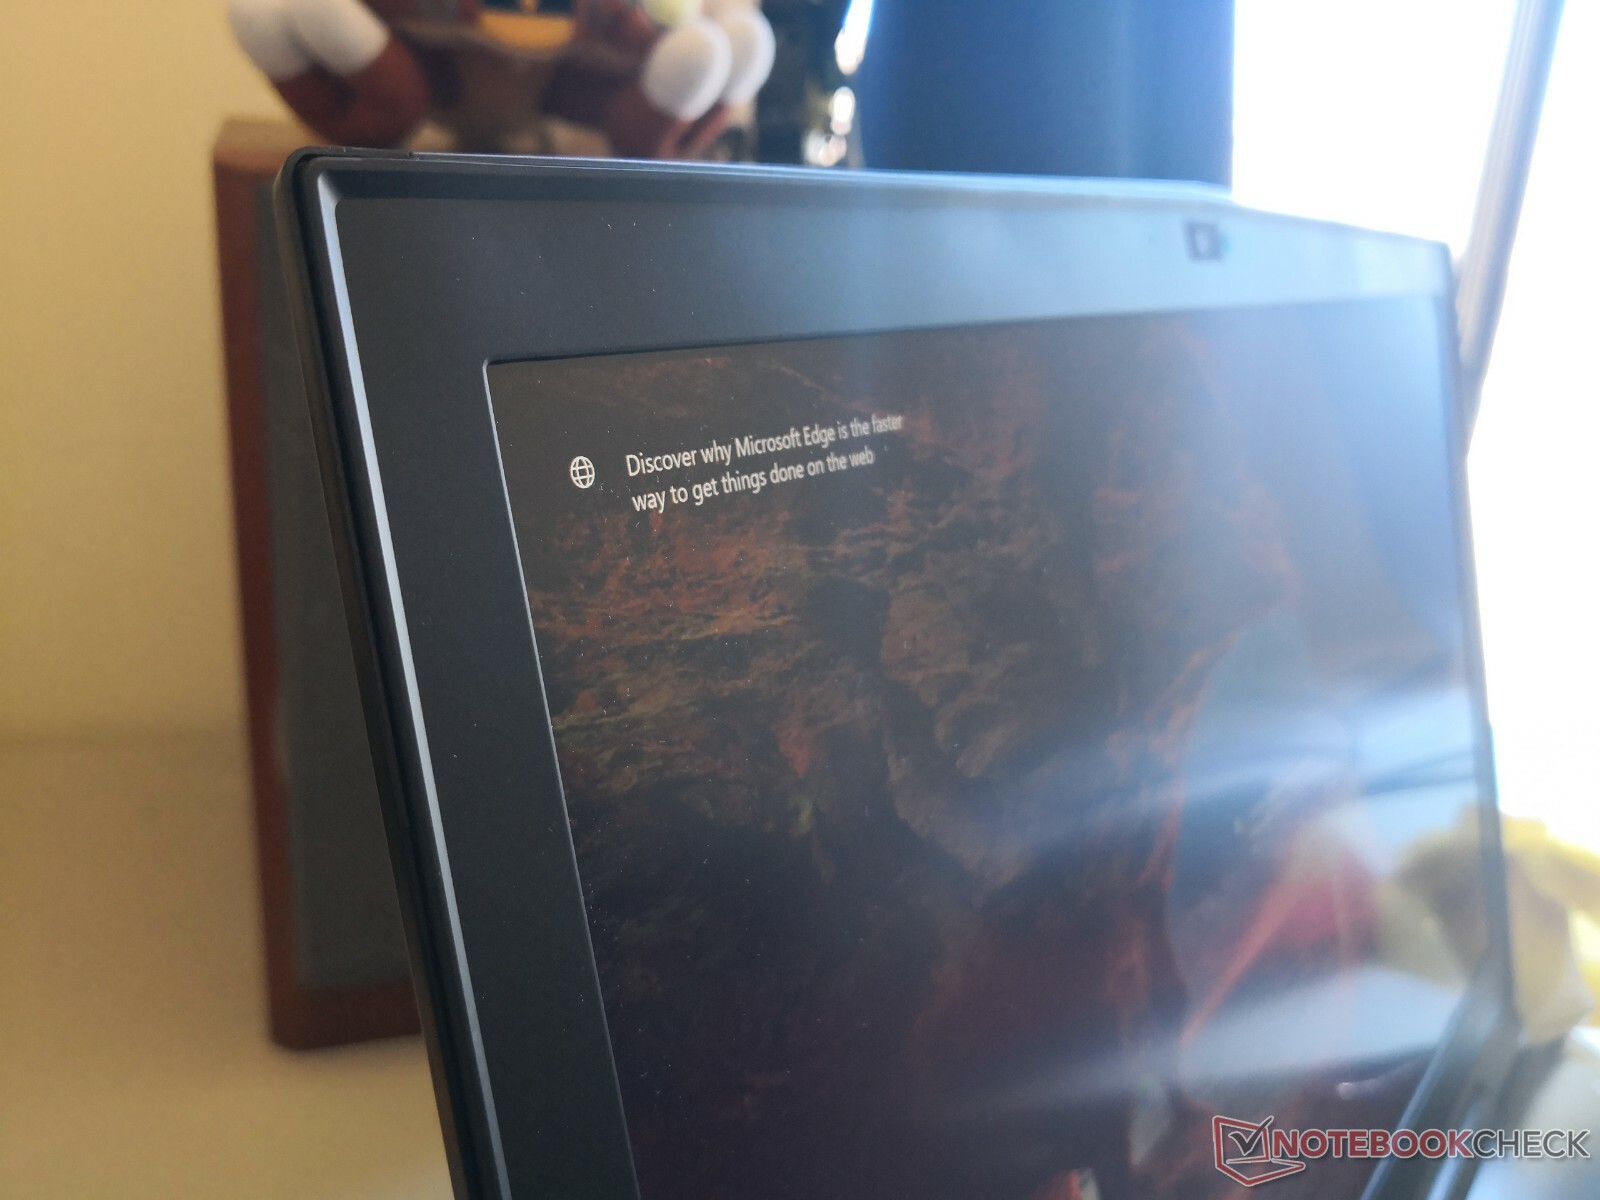
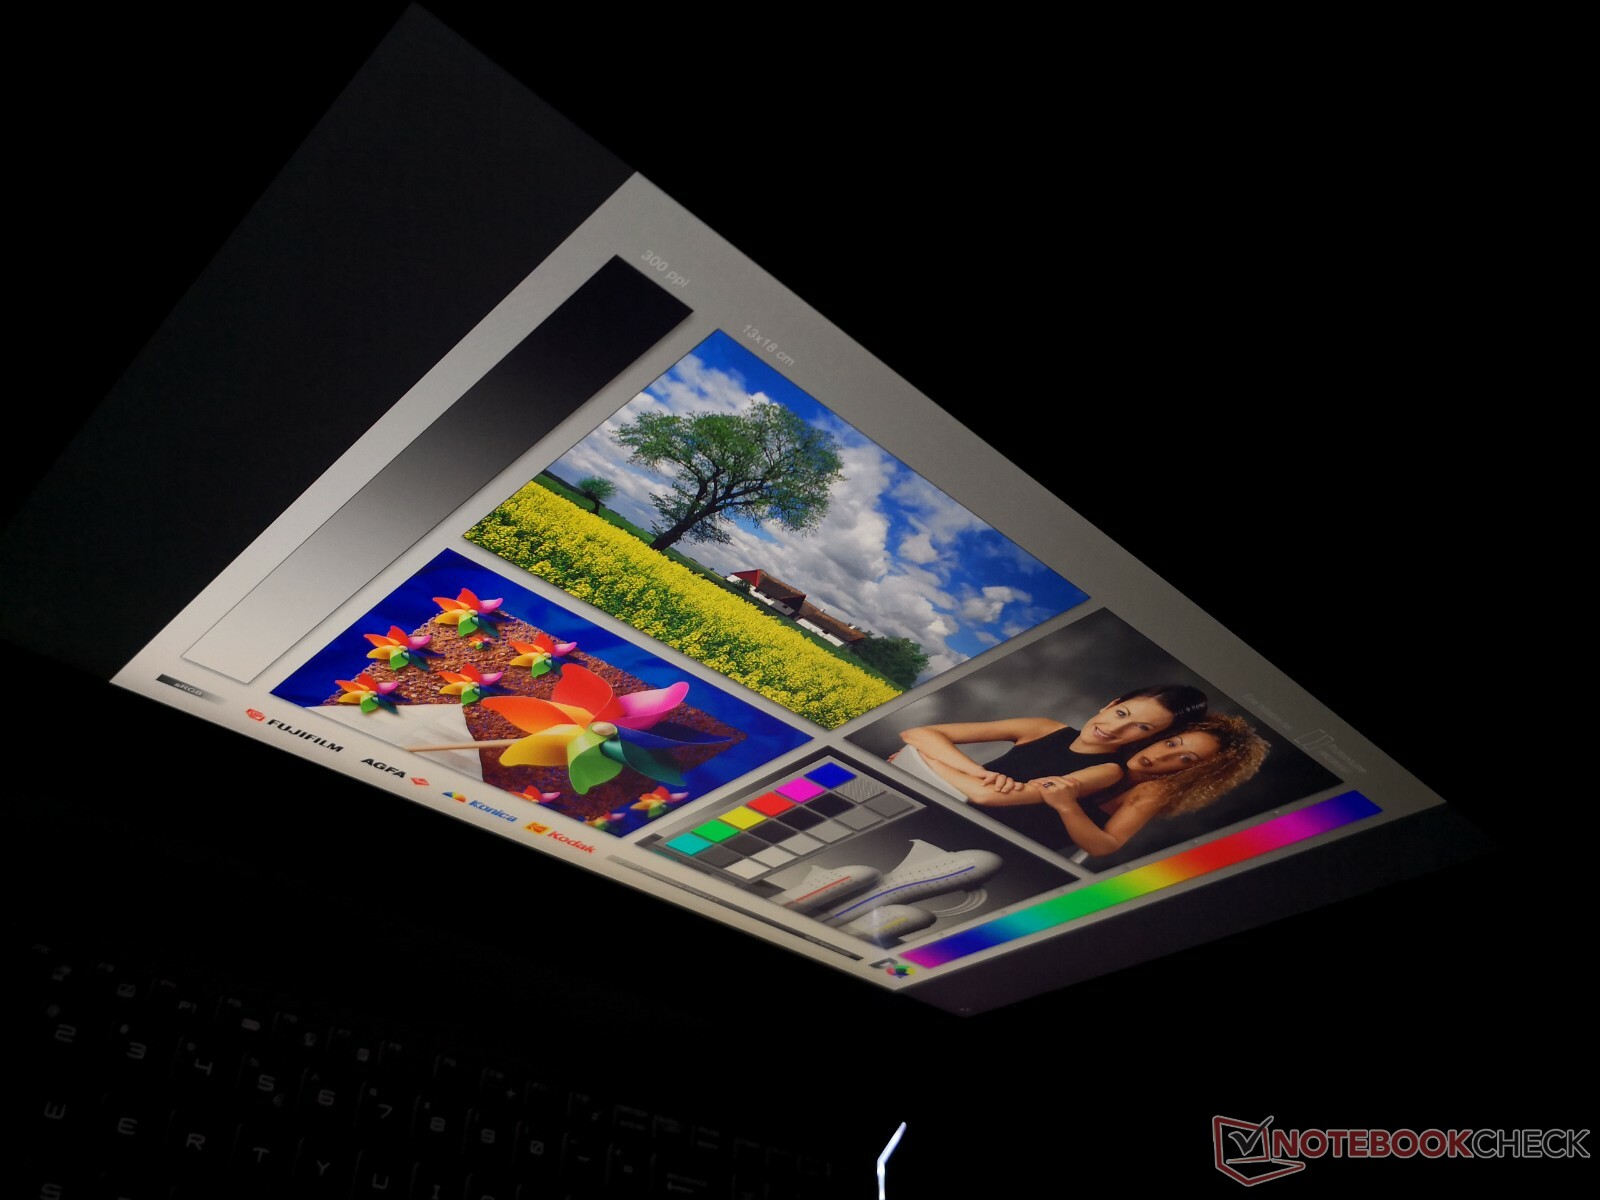
The main issue with the display is its graininess. Color grains are noticeable even when compared to other matte panels and especially when sitting side-by-side to a glossy panel. Small text and details are therefore not as crisp as they could have been despite the high DPI and wide gamut.
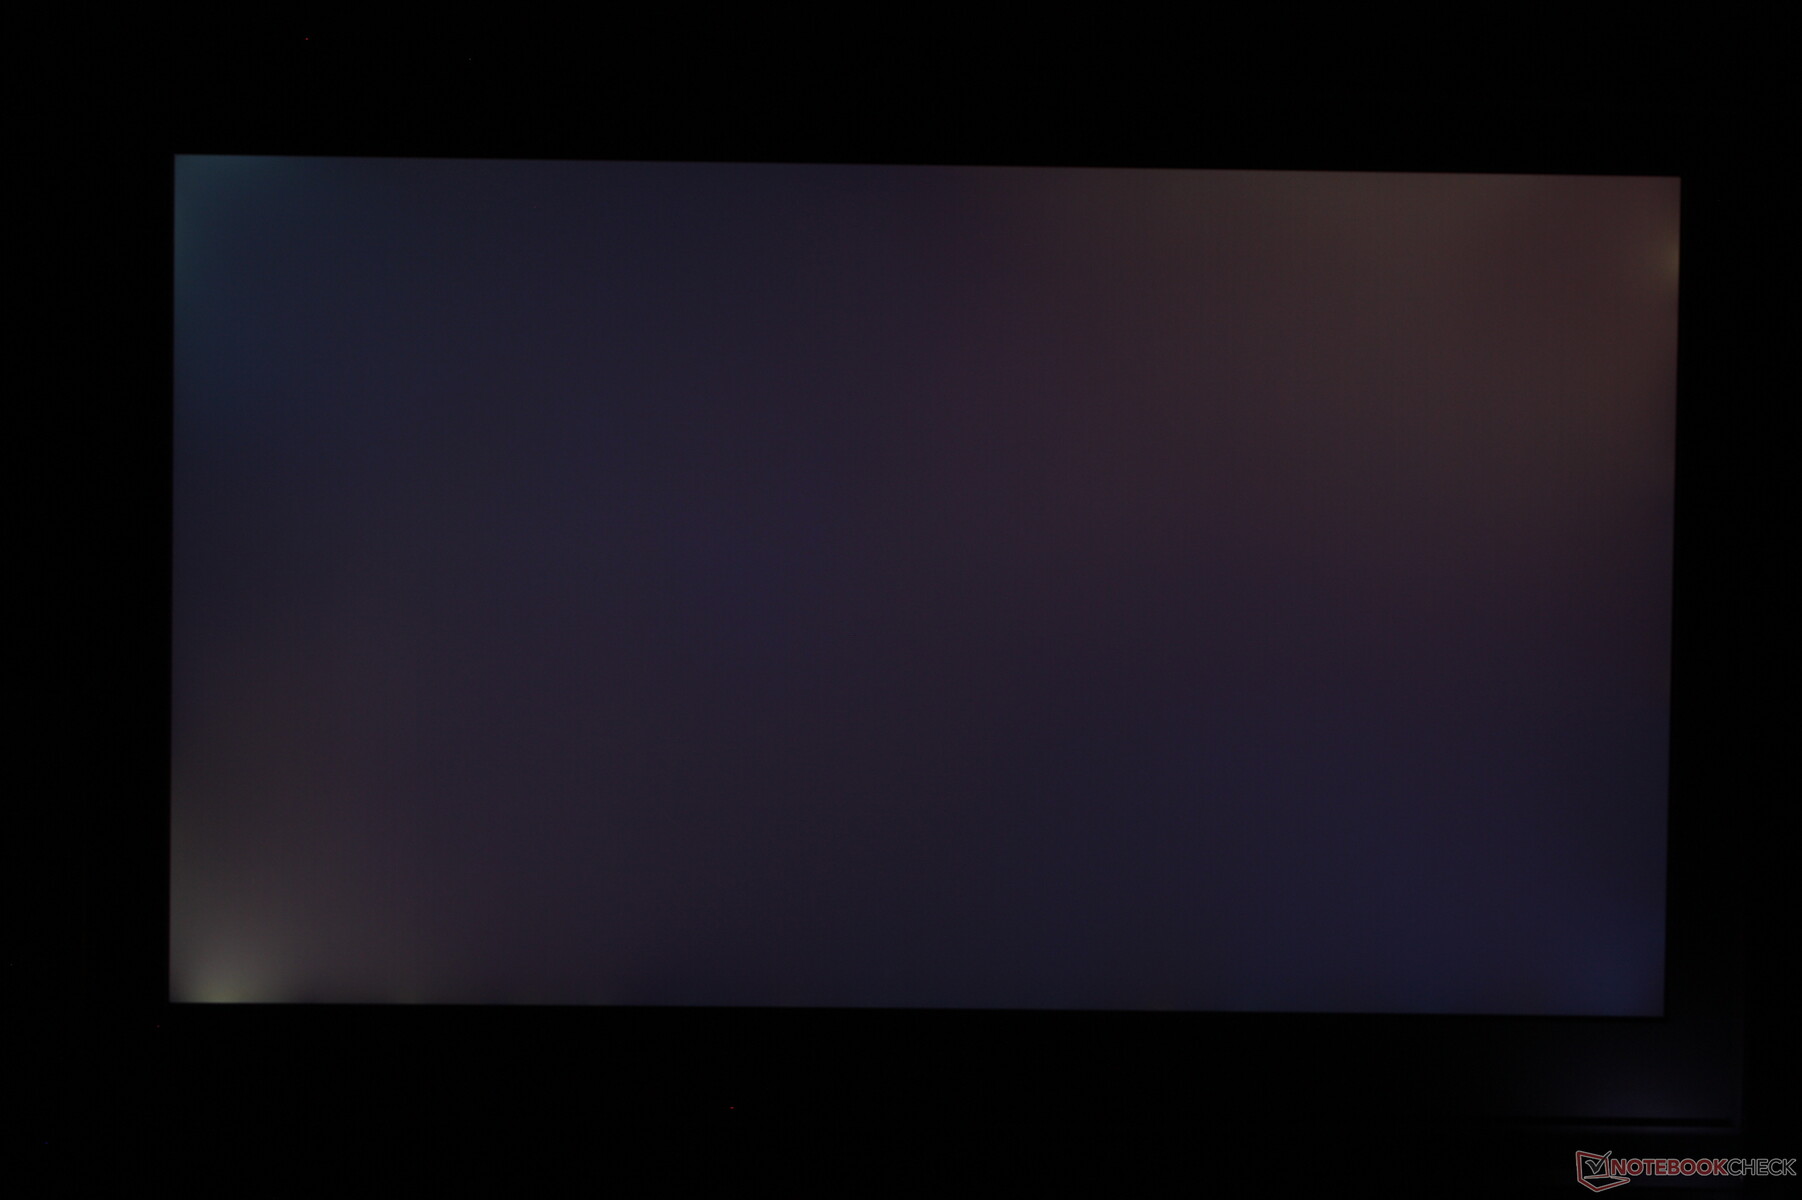
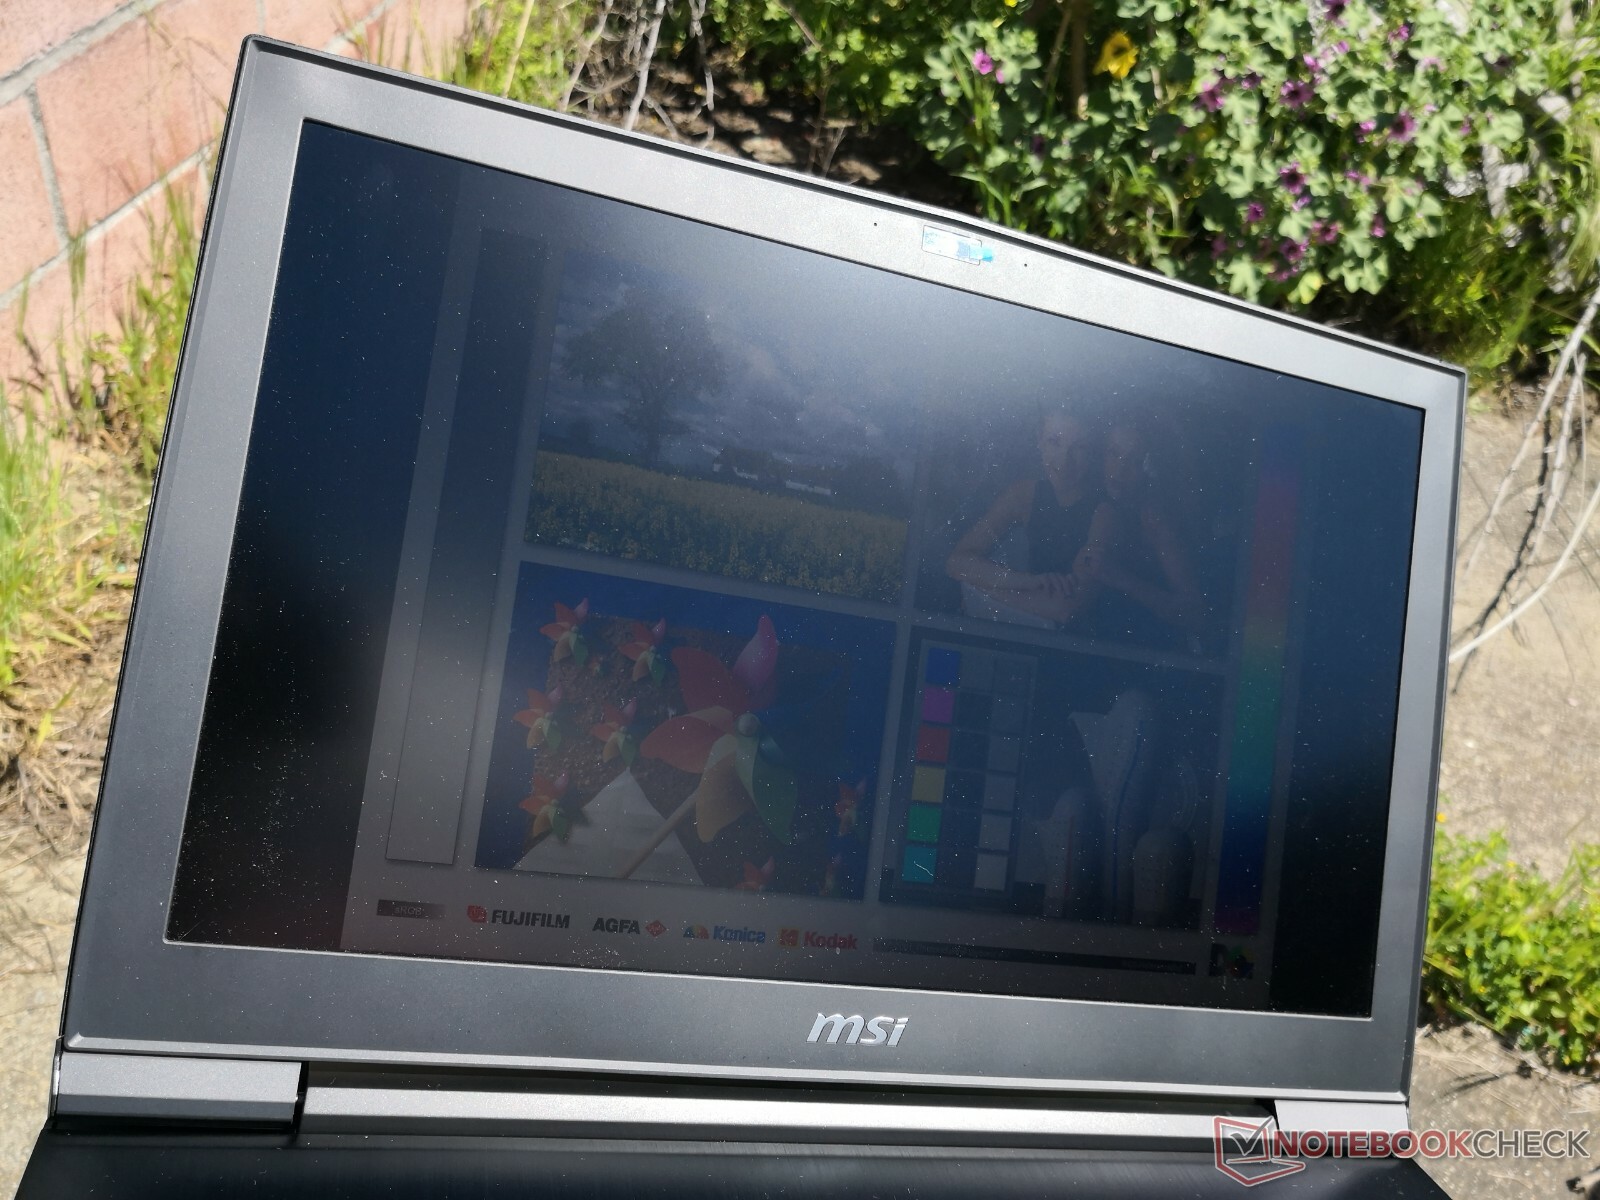
Our specific test unit suffers from moderate backlight bleeding along the bottom left edge as shown by the picture below. It becomes especially easy to spot during the initial boot up stage when powering on the unit.


| |||||||||||||||||||||||||
Brightness Distribution: 88 %
Center on Battery: 327.9 cd/m²
Contrast: 763:1 (Black: 0.43 cd/m²)
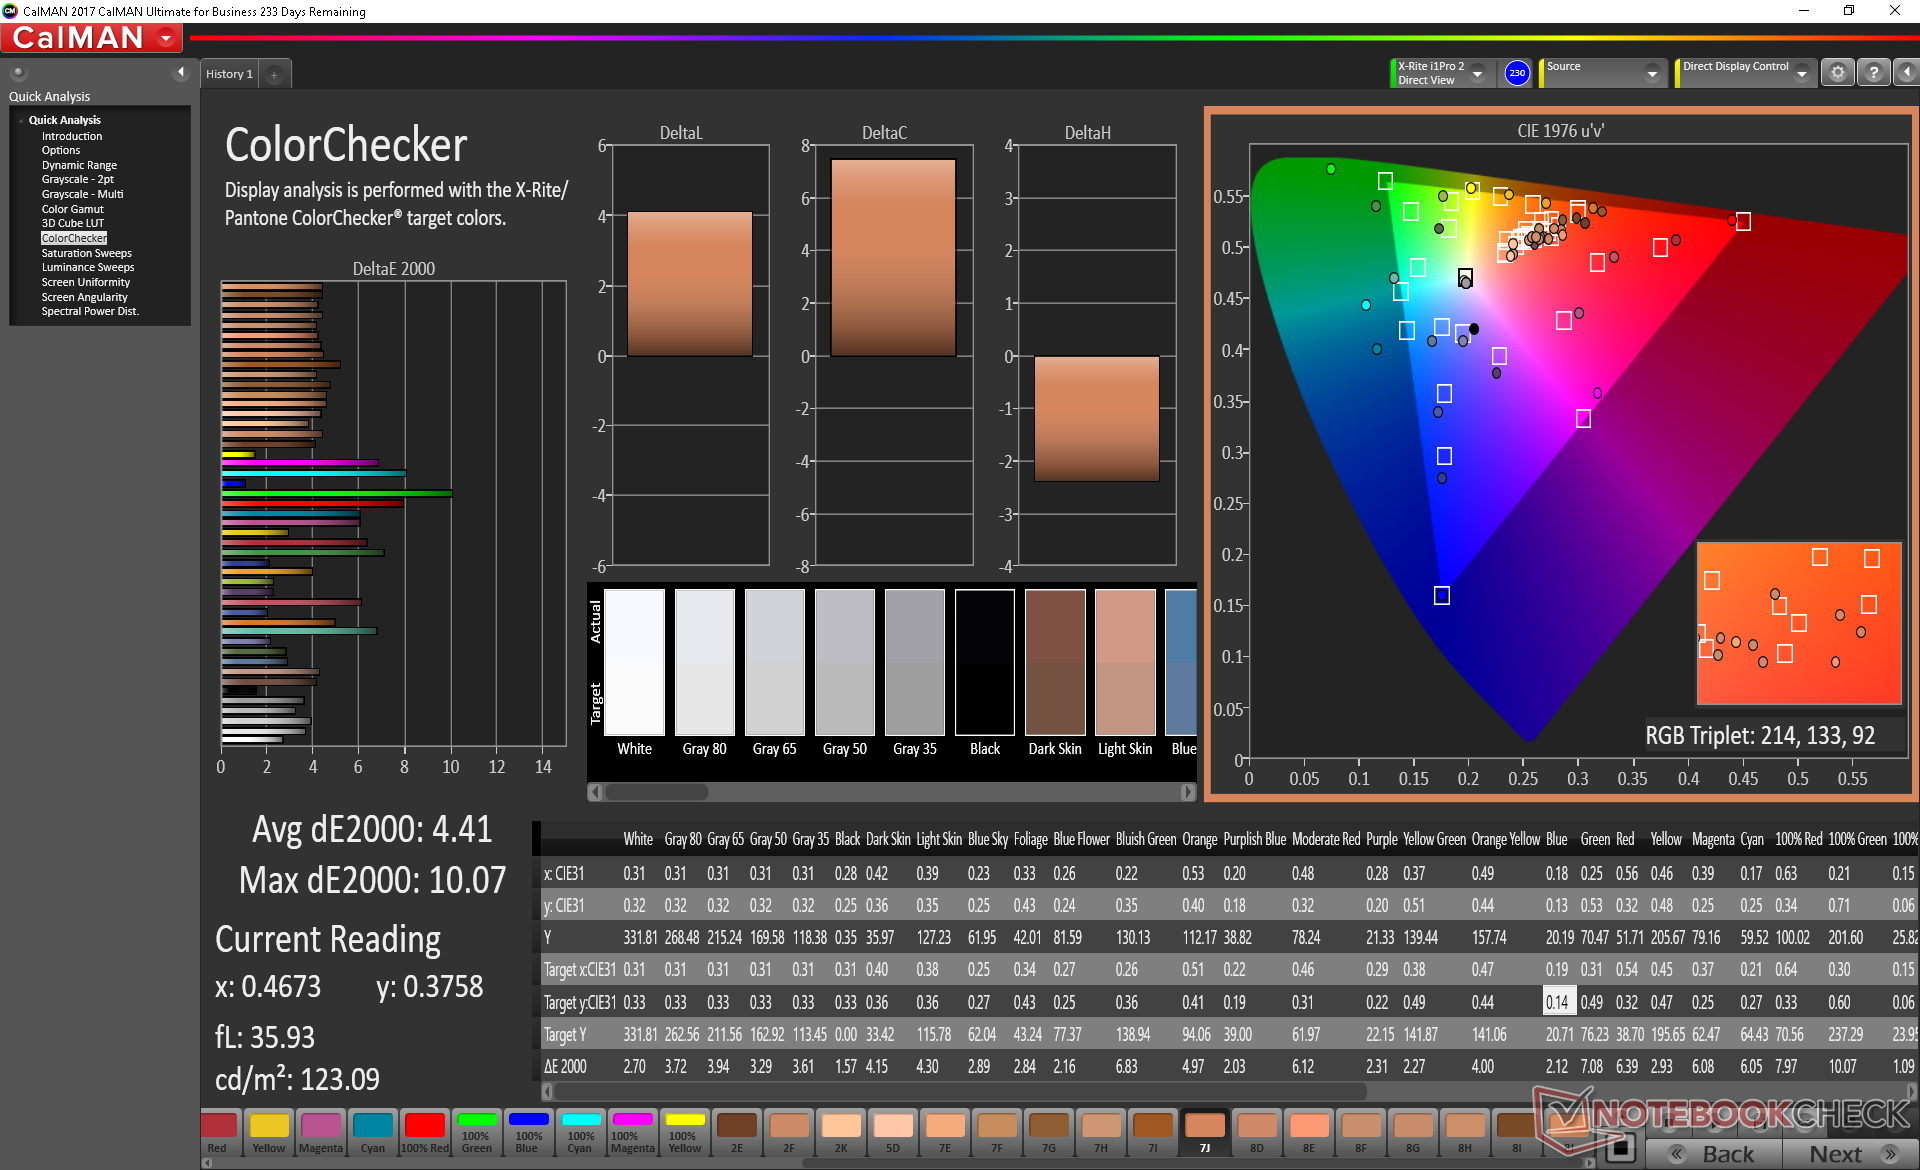
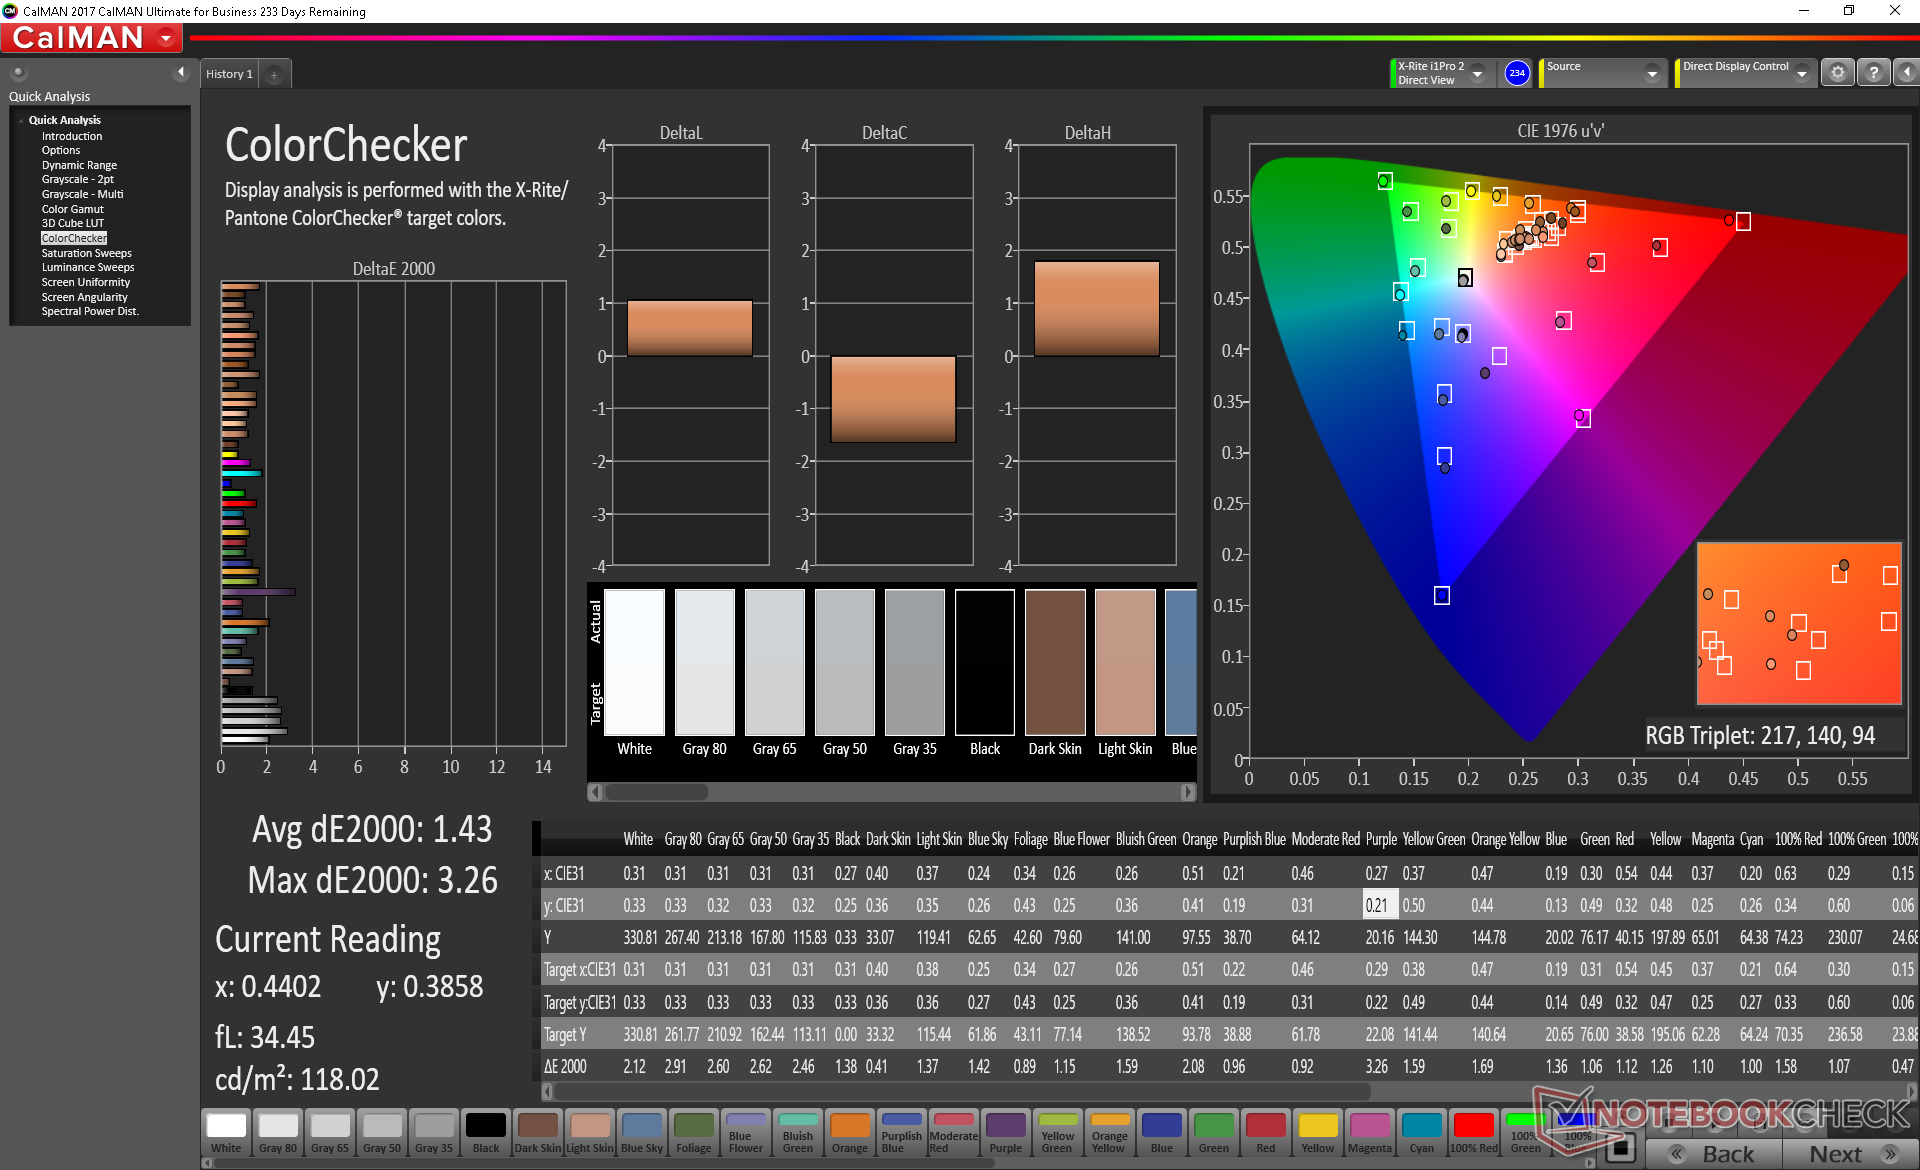
ΔE ColorChecker Calman: 4.41 | ∀{0.5-29.43 Ø4.71}
calibrated: 1.43
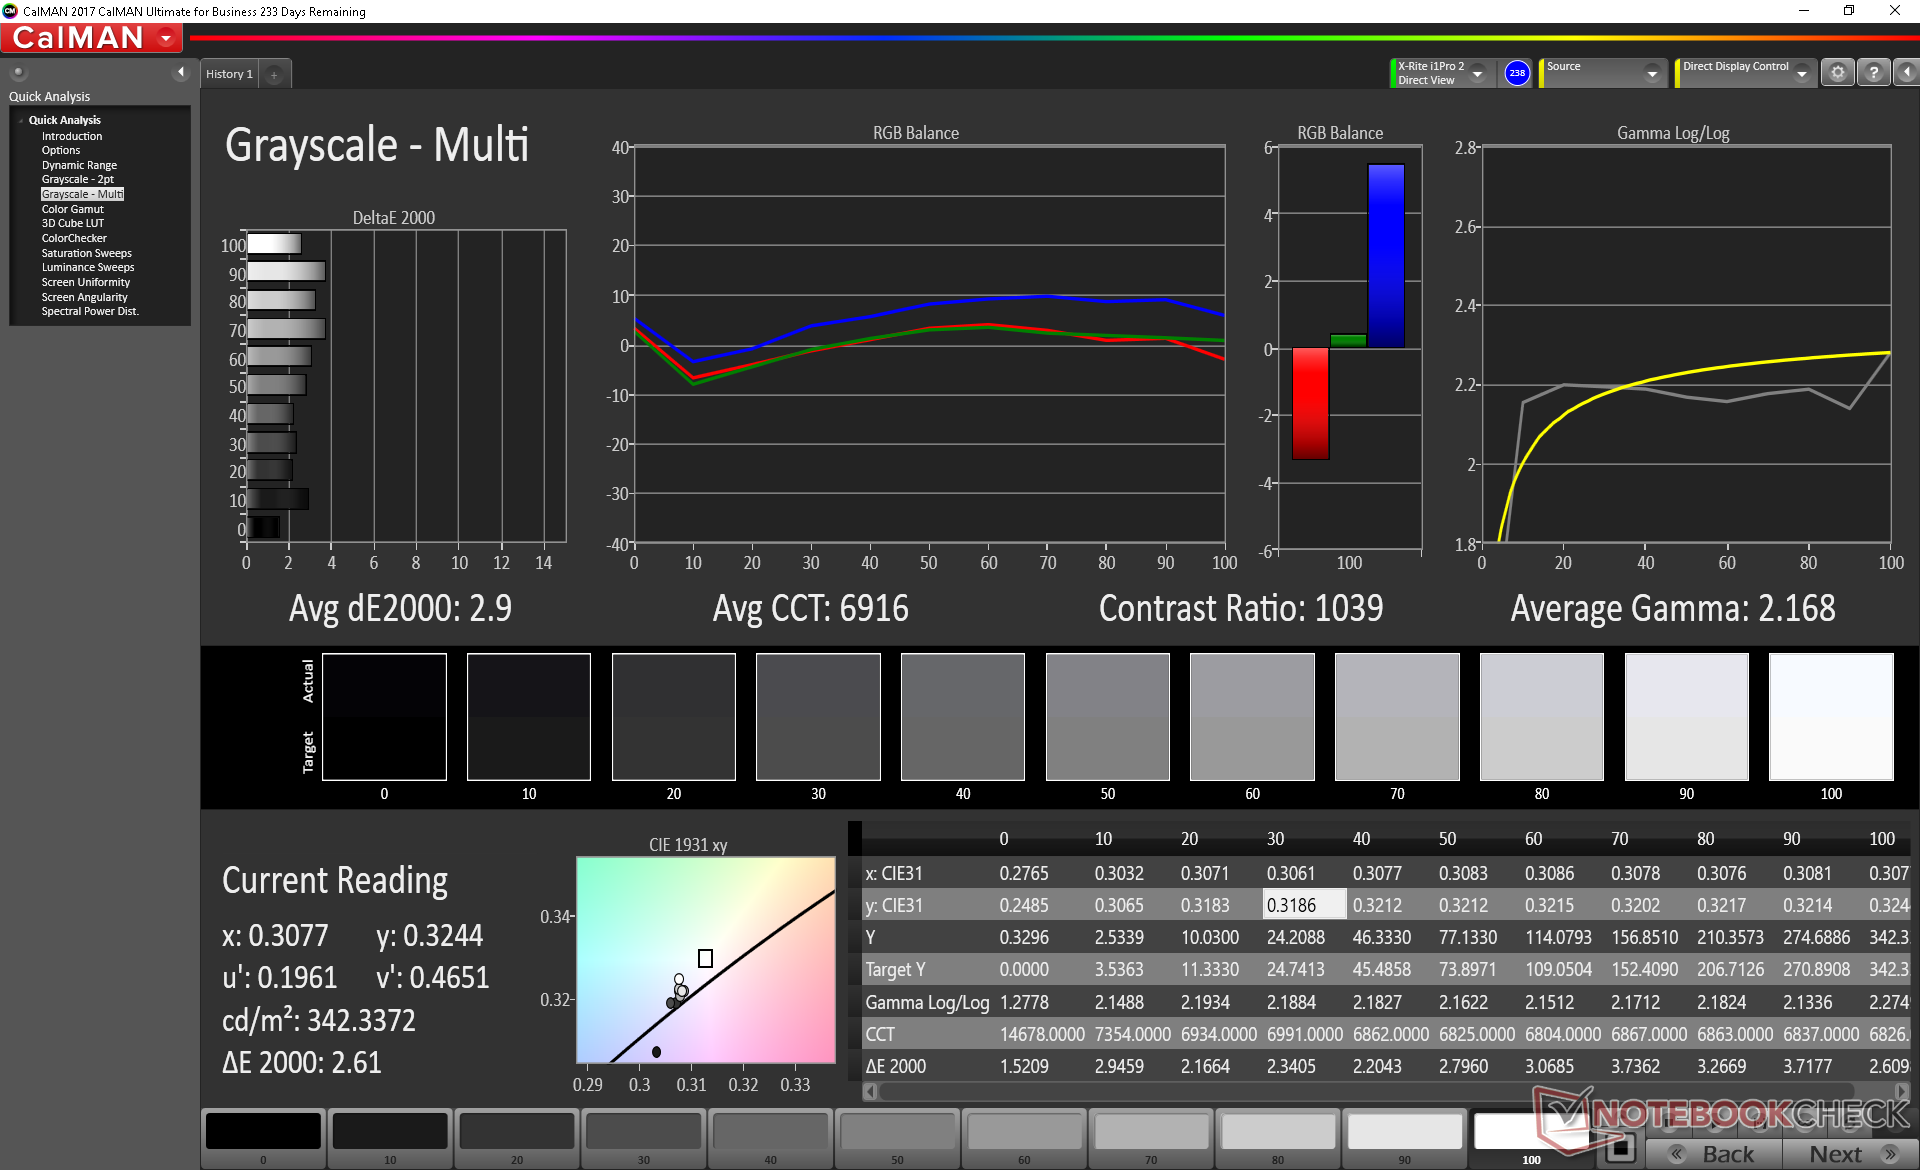
ΔE Greyscale Calman: 2.9 | ∀{0.09-98 Ø4.96}
99% sRGB (Argyll 1.6.3 3D)
84.2% AdobeRGB 1998 (Argyll 1.6.3 3D)
95.3% AdobeRGB 1998 (Argyll 3D)
98.3% sRGB (Argyll 3D)
80.8% Display P3 (Argyll 3D)
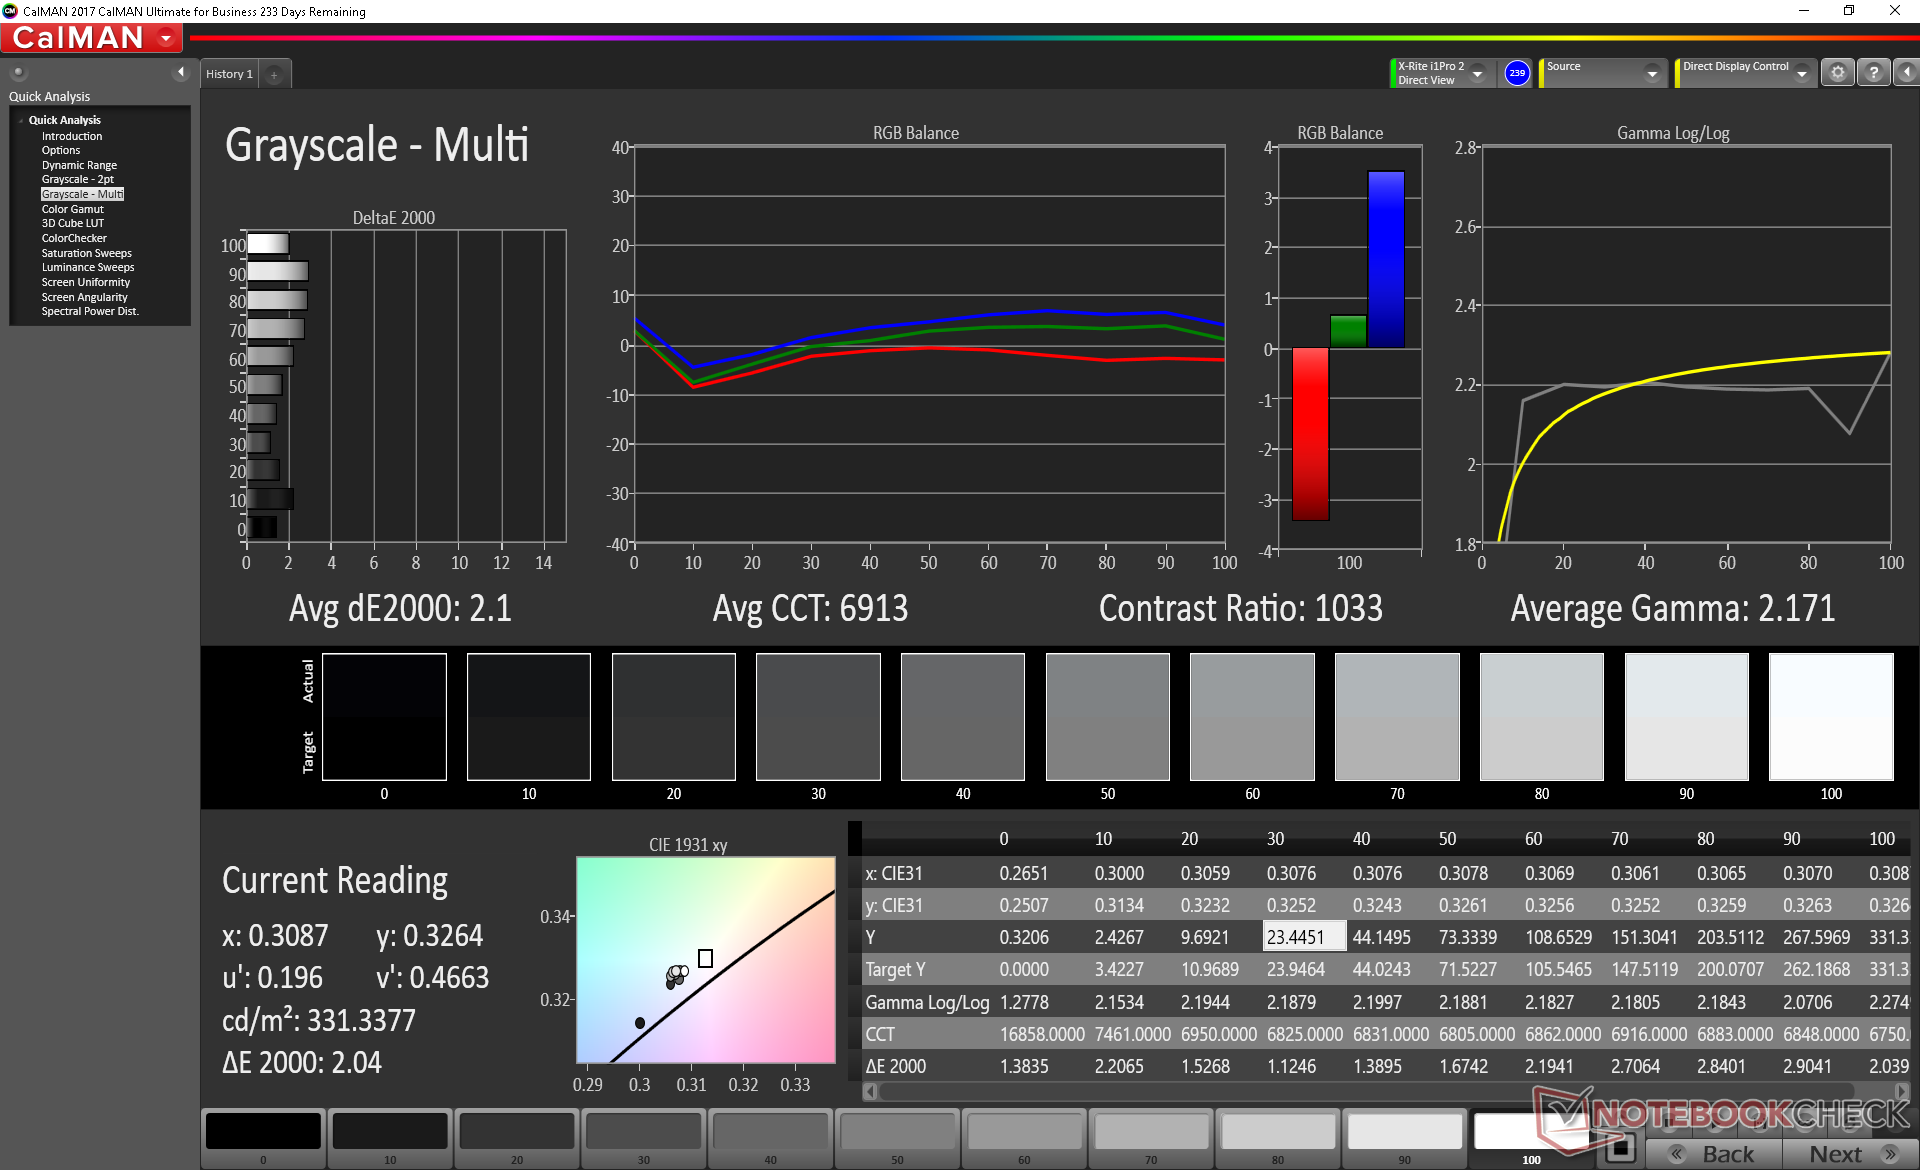
Gamma: 2.17
CCT: 6916 K
| MSI WT75 8SM AU Optronics B173ZAN01.0, IPS, 17.3", 3840x2160 | Fujitsu Celsius H980 LG Philips, LP173WF4-SPF5, IPS, 17.3", 1920x1080 | Eurocom Tornado F7W AU Optronics B173ZAN01.0, IPS, 17.3", 3840x2160 | Dell Precision 7720 SHP1446 (LQ173D1), IGZO, 17.3", 3840x2160 | Lenovo ThinkPad P72-20MB000EGE LP173WF4_SPF7, IPS, 17.3", 1920x1080 | MSI WT72-6QM LG Philips LP173WF4-SPF1, IPS, 17.3", 1920x1080 | |
|---|---|---|---|---|---|---|
| Display | -22% | 4% | 5% | -22% | -21% | |
| Display P3 Coverage (%) | 80.8 | 67.3 -17% | 85.9 6% | 87.6 8% | 67.4 -17% | 67.3 -17% |
| sRGB Coverage (%) | 98.3 | 85 -14% | 100 2% | 100 2% | 85 -14% | 85.4 -13% |
| AdobeRGB 1998 Coverage (%) | 95.3 | 62.2 -35% | 98.3 3% | 99.2 4% | 62.2 -35% | 62.5 -34% |
| Response Times | 0% | -19% | -77% | -15% | -11% | |
| Response Time Grey 50% / Grey 80% * (ms) | 36 ? | 38 ? -6% | 40 ? -11% | 60 ? -67% | 40.8 ? -13% | 42 ? -17% |
| Response Time Black / White * (ms) | 24.8 ? | 23.2 ? 6% | 31.6 ? -27% | 46.4 ? -87% | 28.8 ? -16% | 26 ? -5% |
| PWM Frequency (Hz) | 120500 ? | 1020 ? | 86 ? | |||
| Screen | -25% | -28% | 14% | -8% | -19% | |
| Brightness middle (cd/m²) | 327.9 | 400 22% | 328.2 0% | 464 42% | 338 3% | 303 -8% |
| Brightness (cd/m²) | 311 | 394 27% | 310 0% | 441 42% | 317 2% | 298 -4% |
| Brightness Distribution (%) | 88 | 92 5% | 92 5% | 89 1% | 86 -2% | 94 7% |
| Black Level * (cd/m²) | 0.43 | 0.51 -19% | 0.37 14% | 0.45 -5% | 0.28 35% | 0.46 -7% |
| Contrast (:1) | 763 | 784 3% | 887 16% | 1031 35% | 1207 58% | 659 -14% |
| Colorchecker dE 2000 * | 4.41 | 5.3 -20% | 6.62 -50% | 3.2 27% | 4.3 2% | 5.77 -31% |
| Colorchecker dE 2000 max. * | 10.07 | 9.3 8% | 9.49 6% | 6.1 39% | 10.2 -1% | |
| Colorchecker dE 2000 calibrated * | 1.43 | 3.8 -166% | 3.93 -175% | 3.7 -159% | ||
| Greyscale dE 2000 * | 2.9 | 5.5 -90% | 6.7 -131% | 4.2 -45% | 2.2 24% | 4.87 -68% |
| Gamma | 2.17 101% | 2.17 101% | 2.44 90% | 2.01 109% | 2.17 101% | 1.99 111% |
| CCT | 6916 94% | 6686 97% | 6462 101% | 6736 96% | 6621 98% | 7363 88% |
| Color Space (Percent of AdobeRGB 1998) (%) | 84.2 | 55.8 -34% | 87.9 4% | 88.1 5% | 55.8 -34% | 56.04 -33% |
| Color Space (Percent of sRGB) (%) | 99 | 84.9 -14% | 100 1% | 100 1% | 84.7 -14% | 85.27 -14% |
| Total Average (Program / Settings) | -16% /
-22% | -14% /
-21% | -19% /
0% | -15% /
-11% | -17% /
-18% |
* ... smaller is better
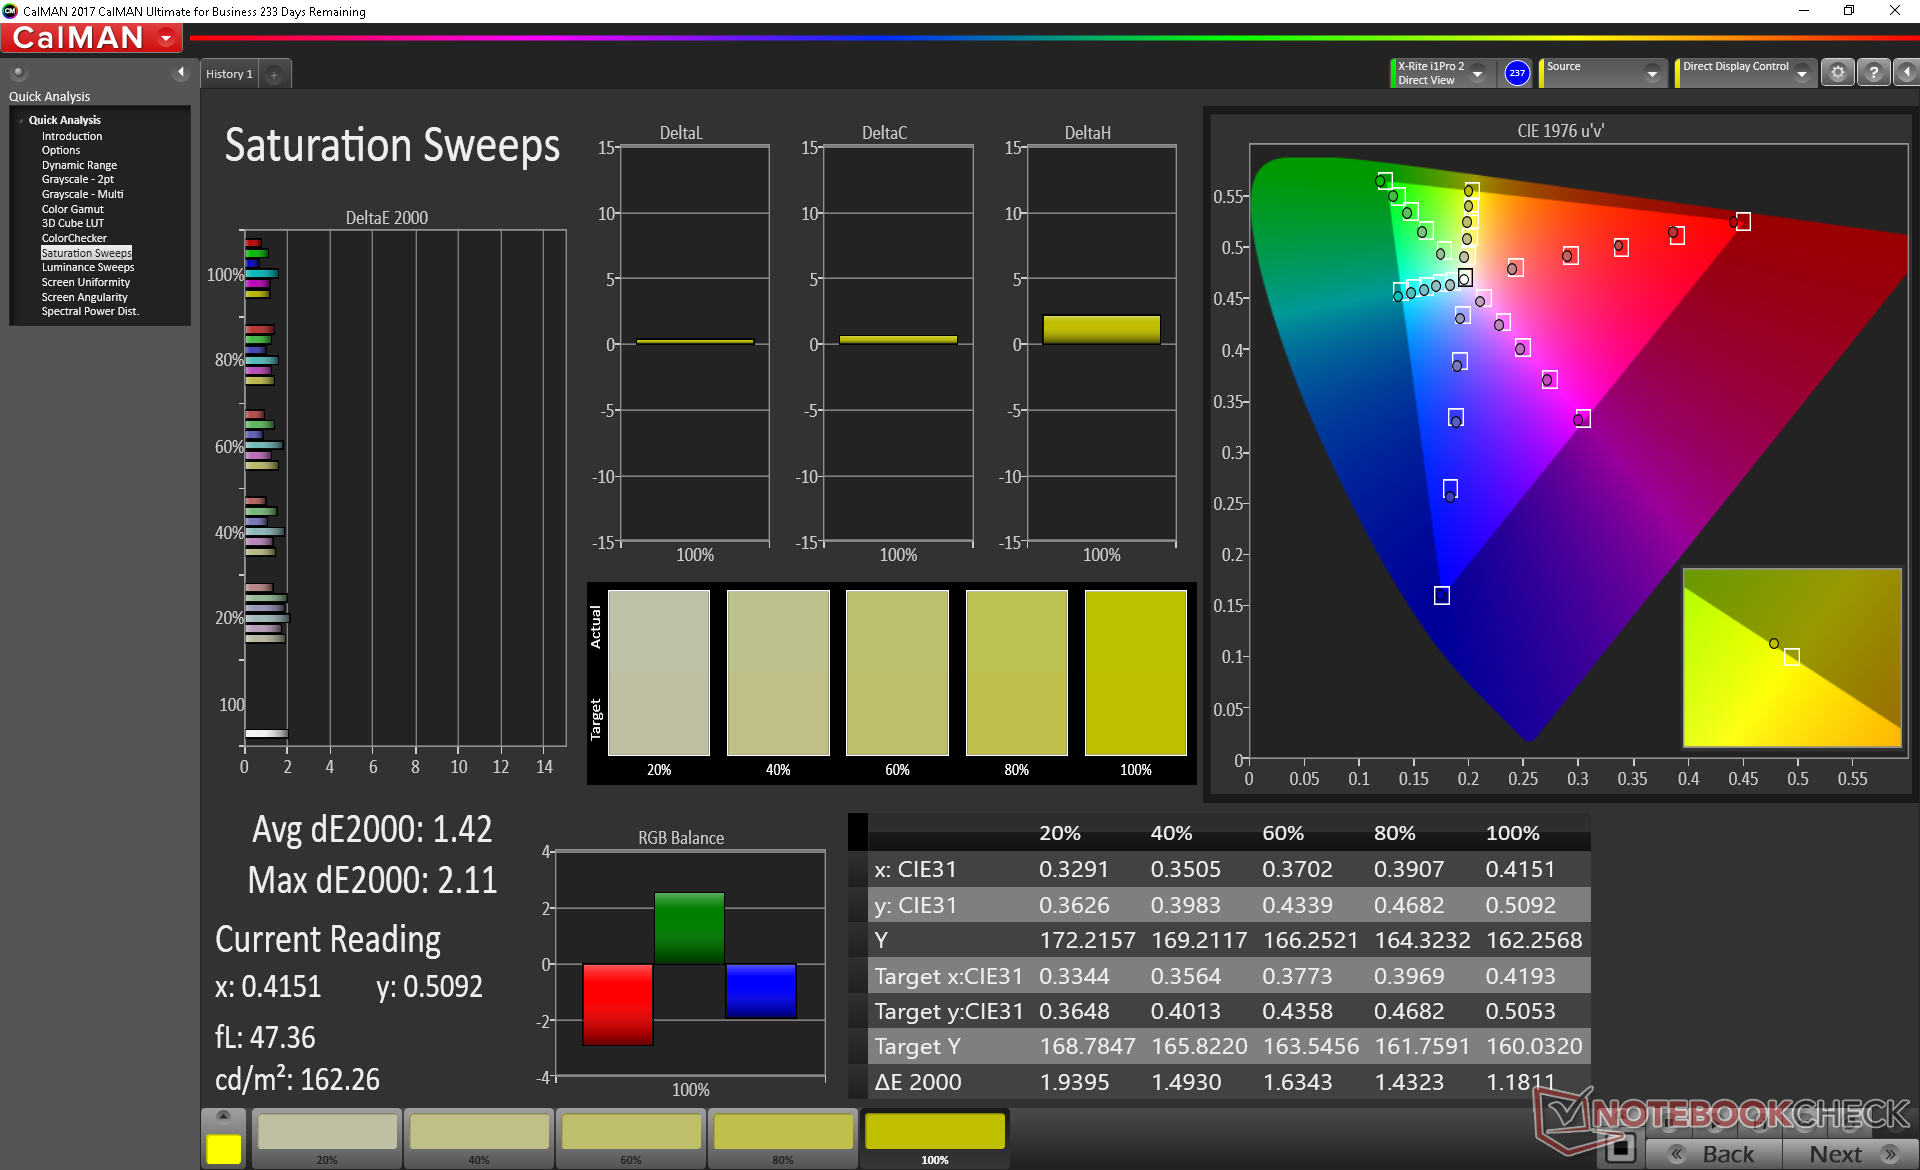
Color space is very wide at about 85 percent of AdobeRGB to be comparable to the Sharp IGZO panel. However, this comes at the price of reduced contrast and a refresh rate of "only" 60 Hz.
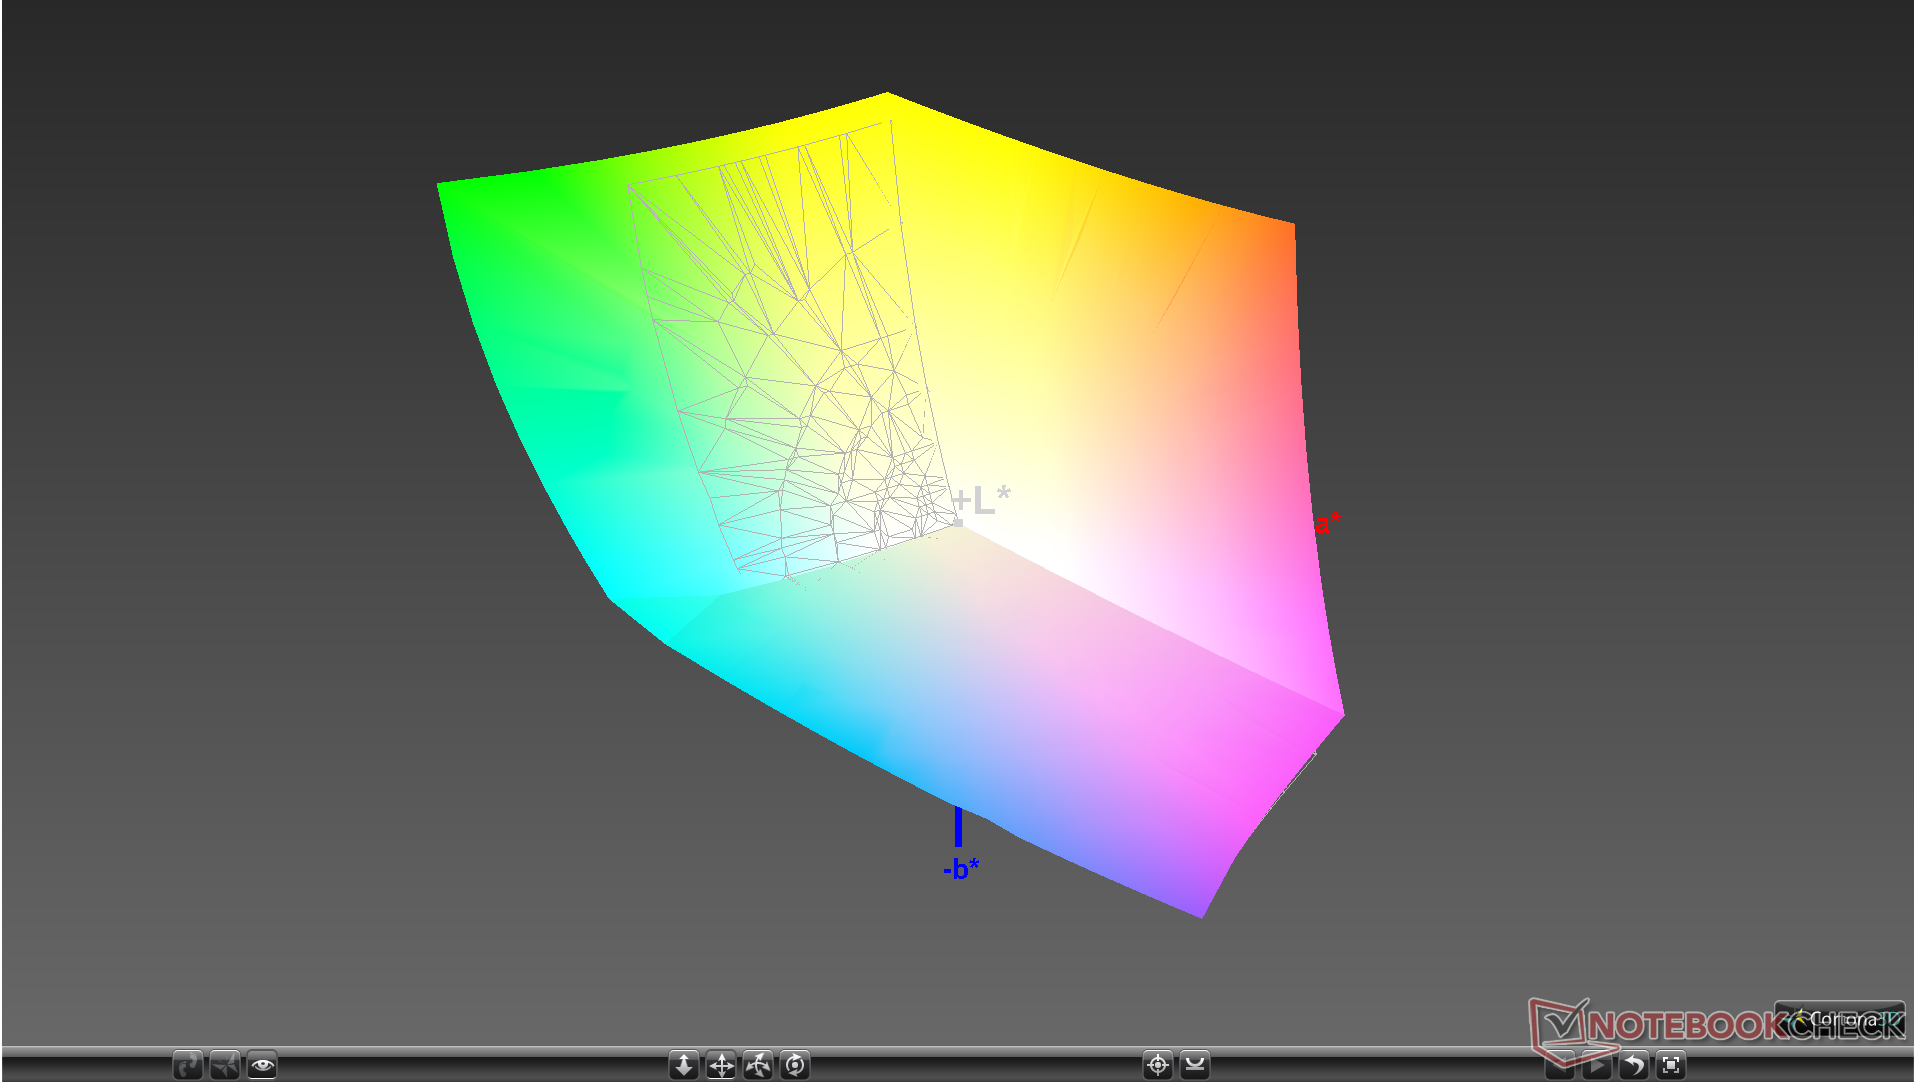
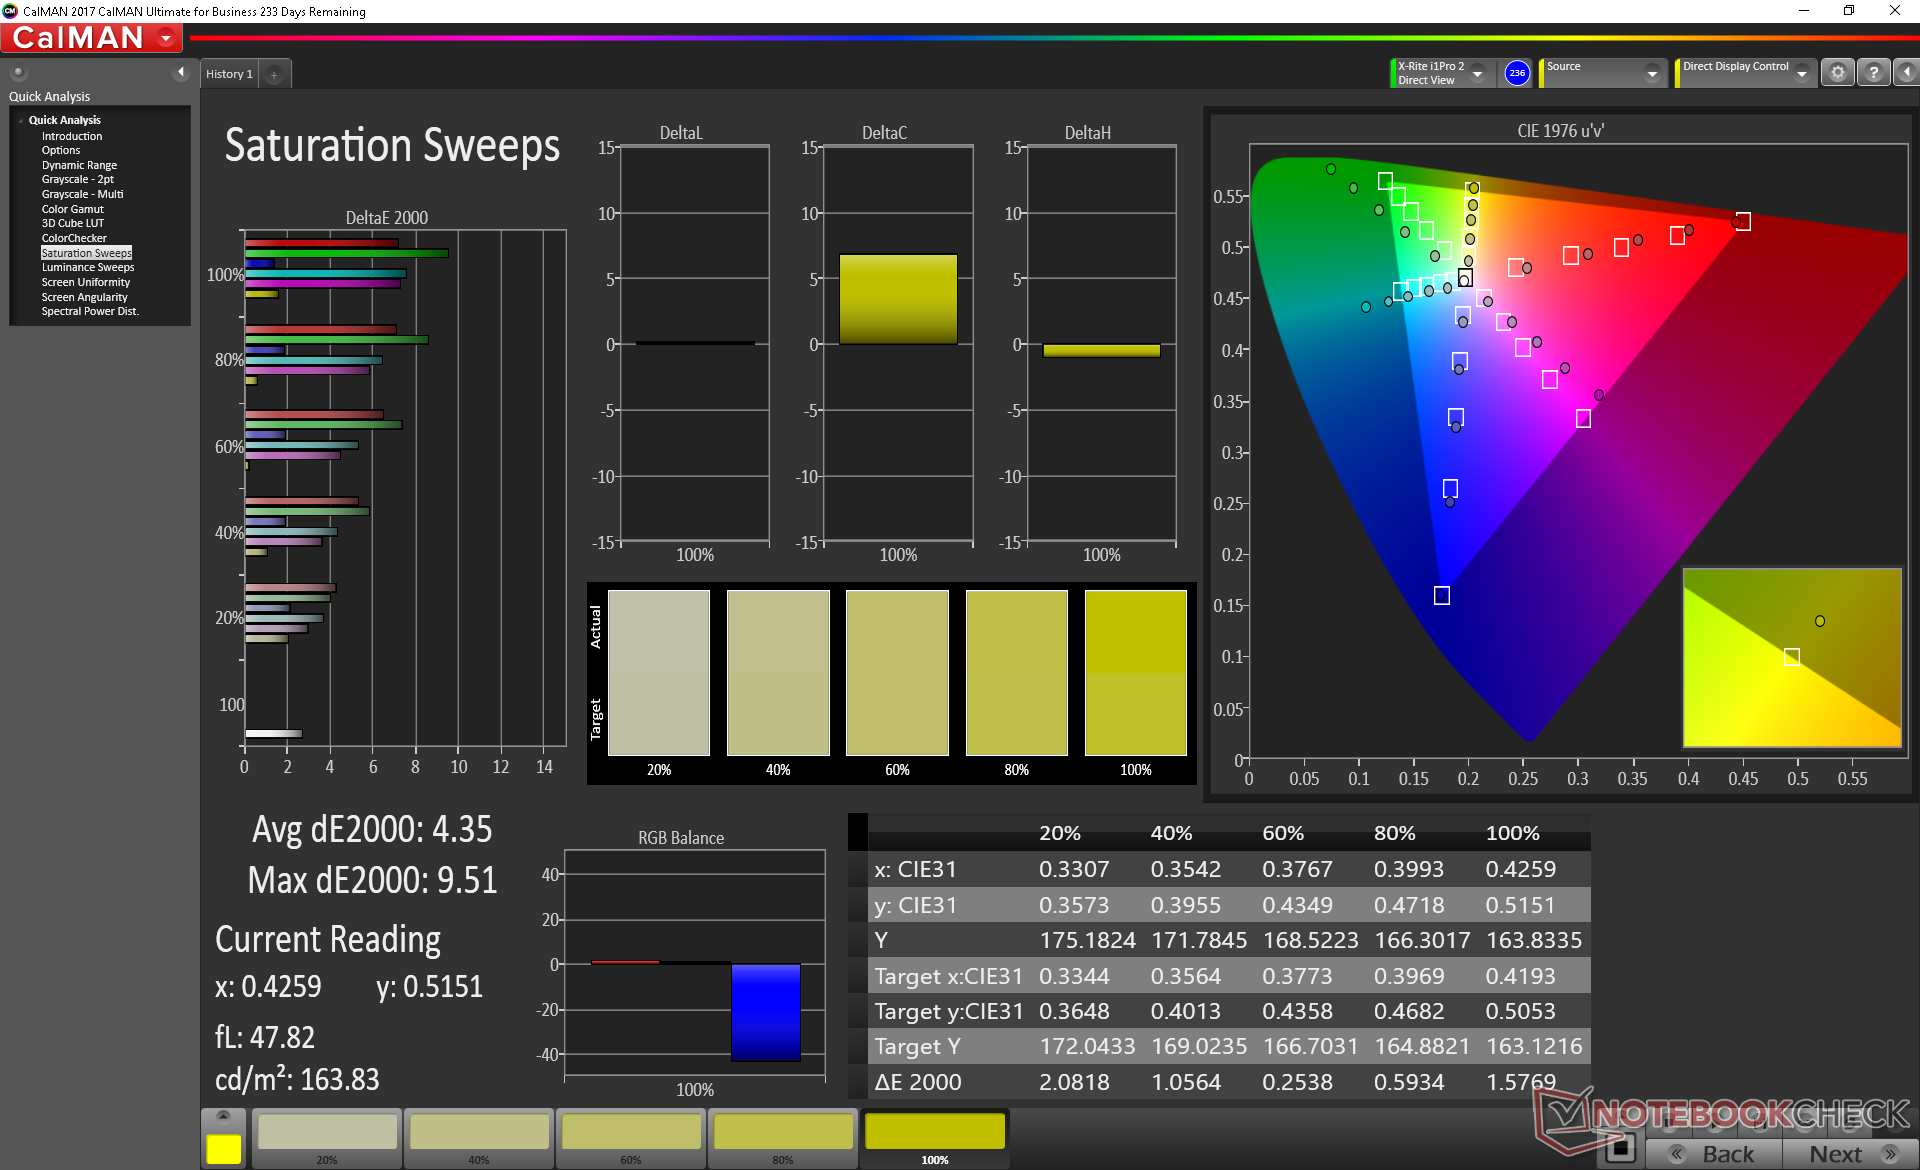
Grayscale and colors are very accurate when targeting the sRGB standard with average DeltaE values of 2.1 and 1.43. Be sure to set the desired color space target either through the pre-installed Dragon Center or MSI True Color applications. These same apps can also be found on MSI G Series laptops.
Display Response Times
| ↔ Response Time Black to White | ||
|---|---|---|
| 24.8 ms ... rise ↗ and fall ↘ combined | ↗ 14.8 ms rise | 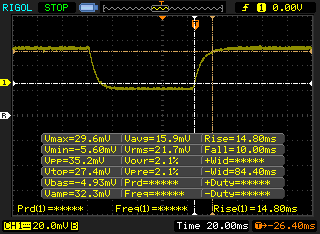 |
| ↘ 10 ms fall | ||
| The screen shows good response rates in our tests, but may be too slow for competitive gamers. In comparison, all tested devices range from 0.1 (minimum) to 240 (maximum) ms. » 58 % of all devices are better. This means that the measured response time is worse than the average of all tested devices (19.8 ms). | ||
| ↔ Response Time 50% Grey to 80% Grey | ||
| 36 ms ... rise ↗ and fall ↘ combined | ↗ 18.8 ms rise |  |
| ↘ 17.2 ms fall | ||
| The screen shows slow response rates in our tests and will be unsatisfactory for gamers. In comparison, all tested devices range from 0.165 (minimum) to 636 (maximum) ms. » 51 % of all devices are better. This means that the measured response time is worse than the average of all tested devices (31 ms). | ||
Screen Flickering / PWM (Pulse-Width Modulation)
| Screen flickering / PWM not detected | 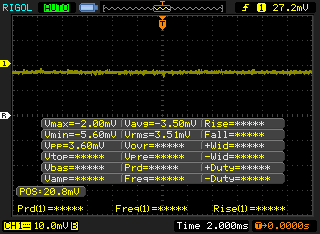 | ||
In comparison: 52 % of all tested devices do not use PWM to dim the display. If PWM was detected, an average of 7754 (minimum: 5 - maximum: 343500) Hz was measured. | |||
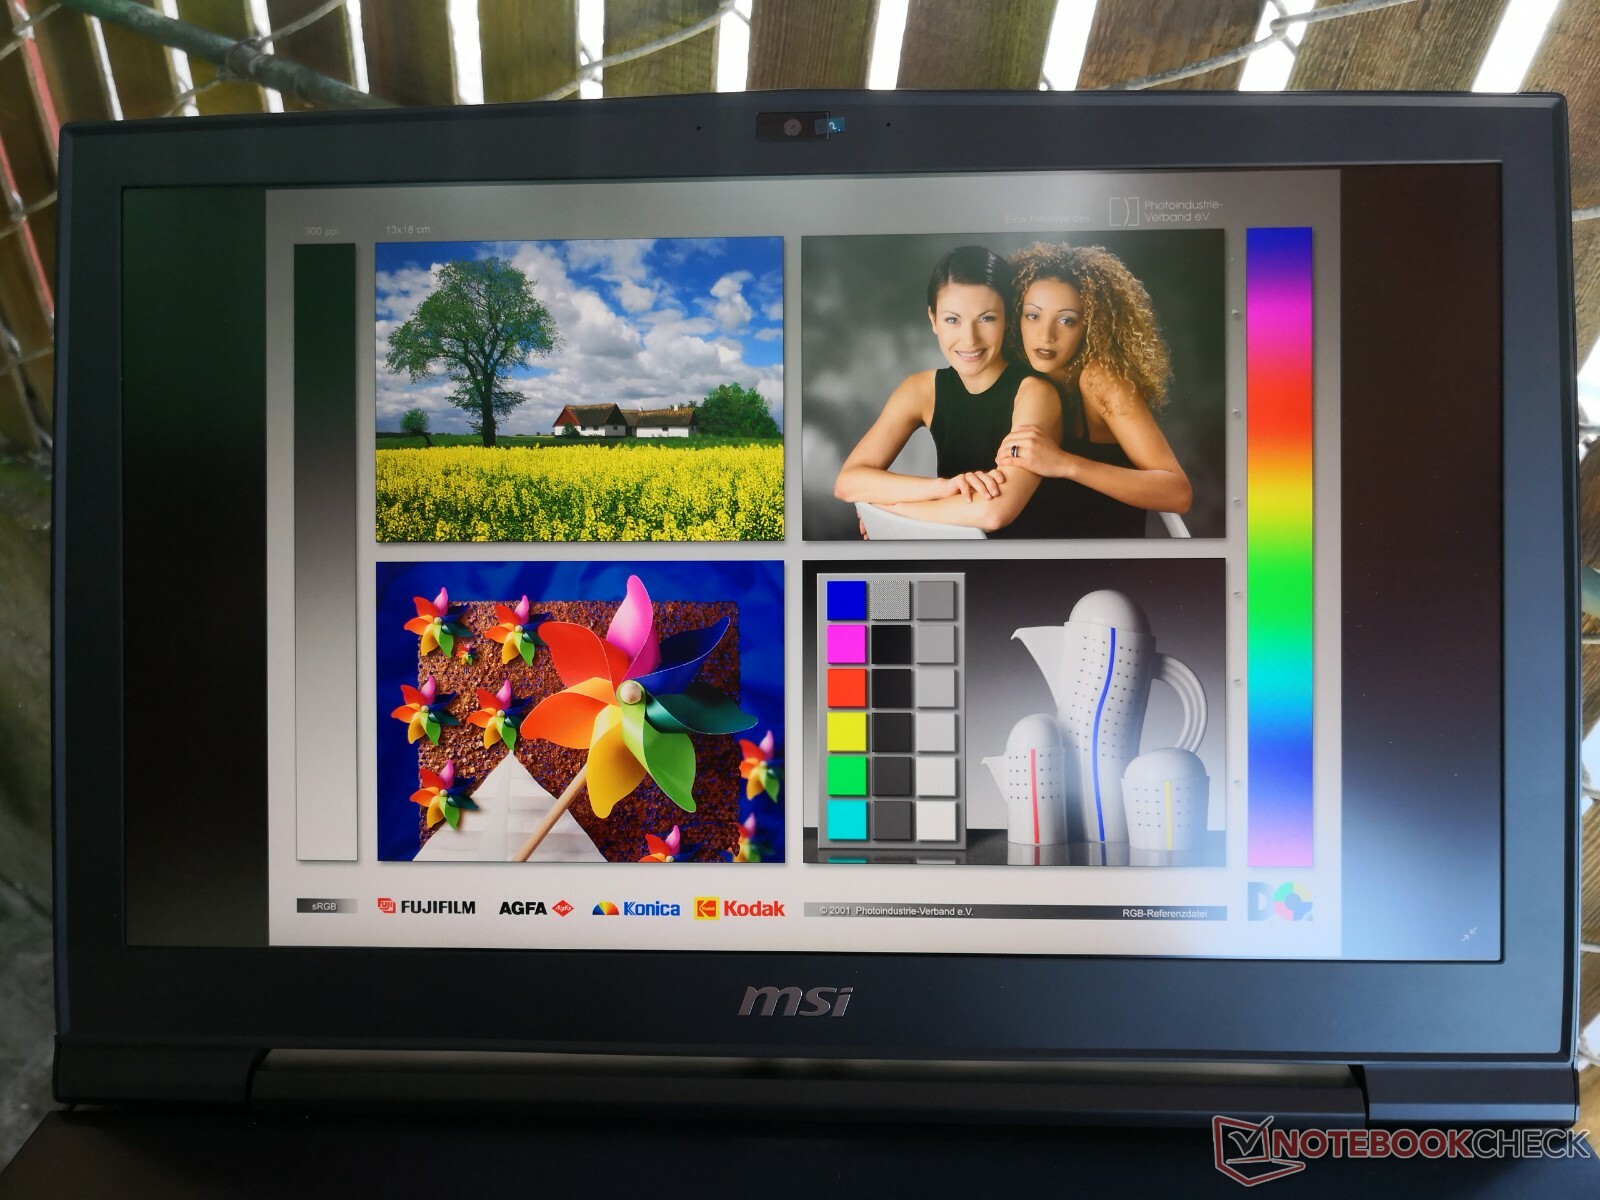
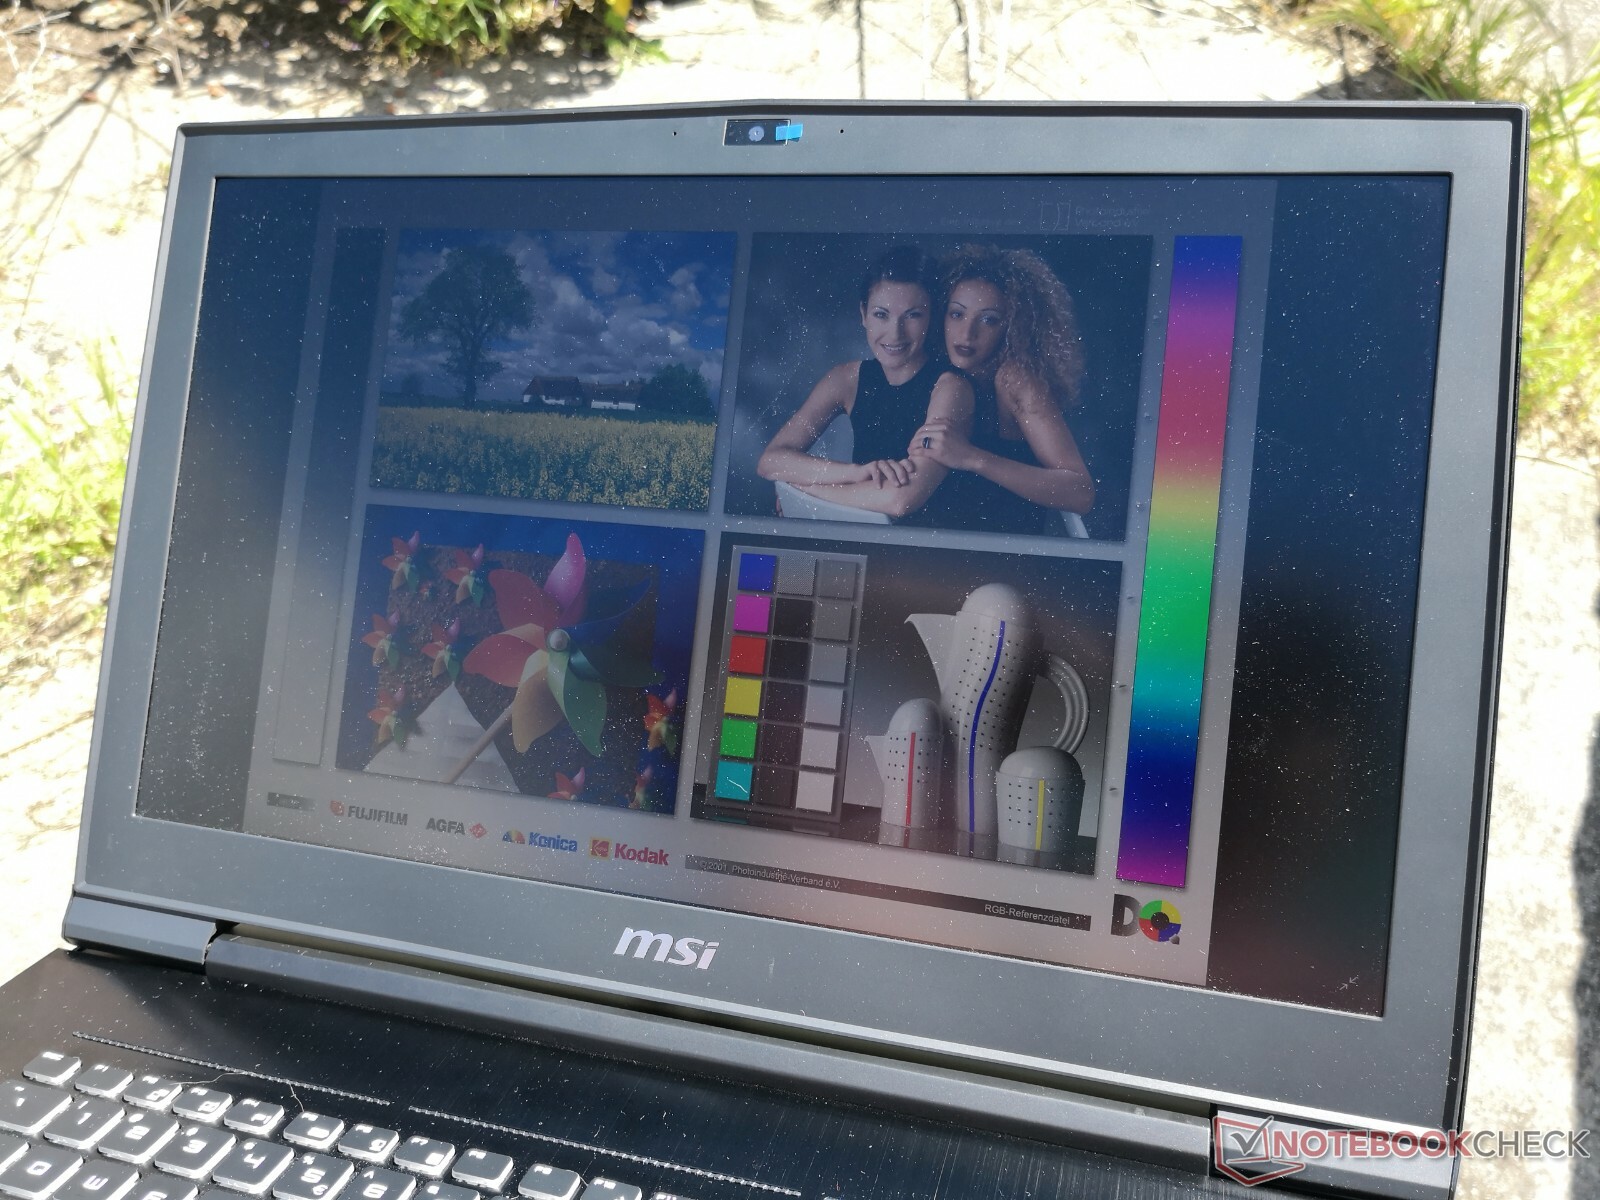
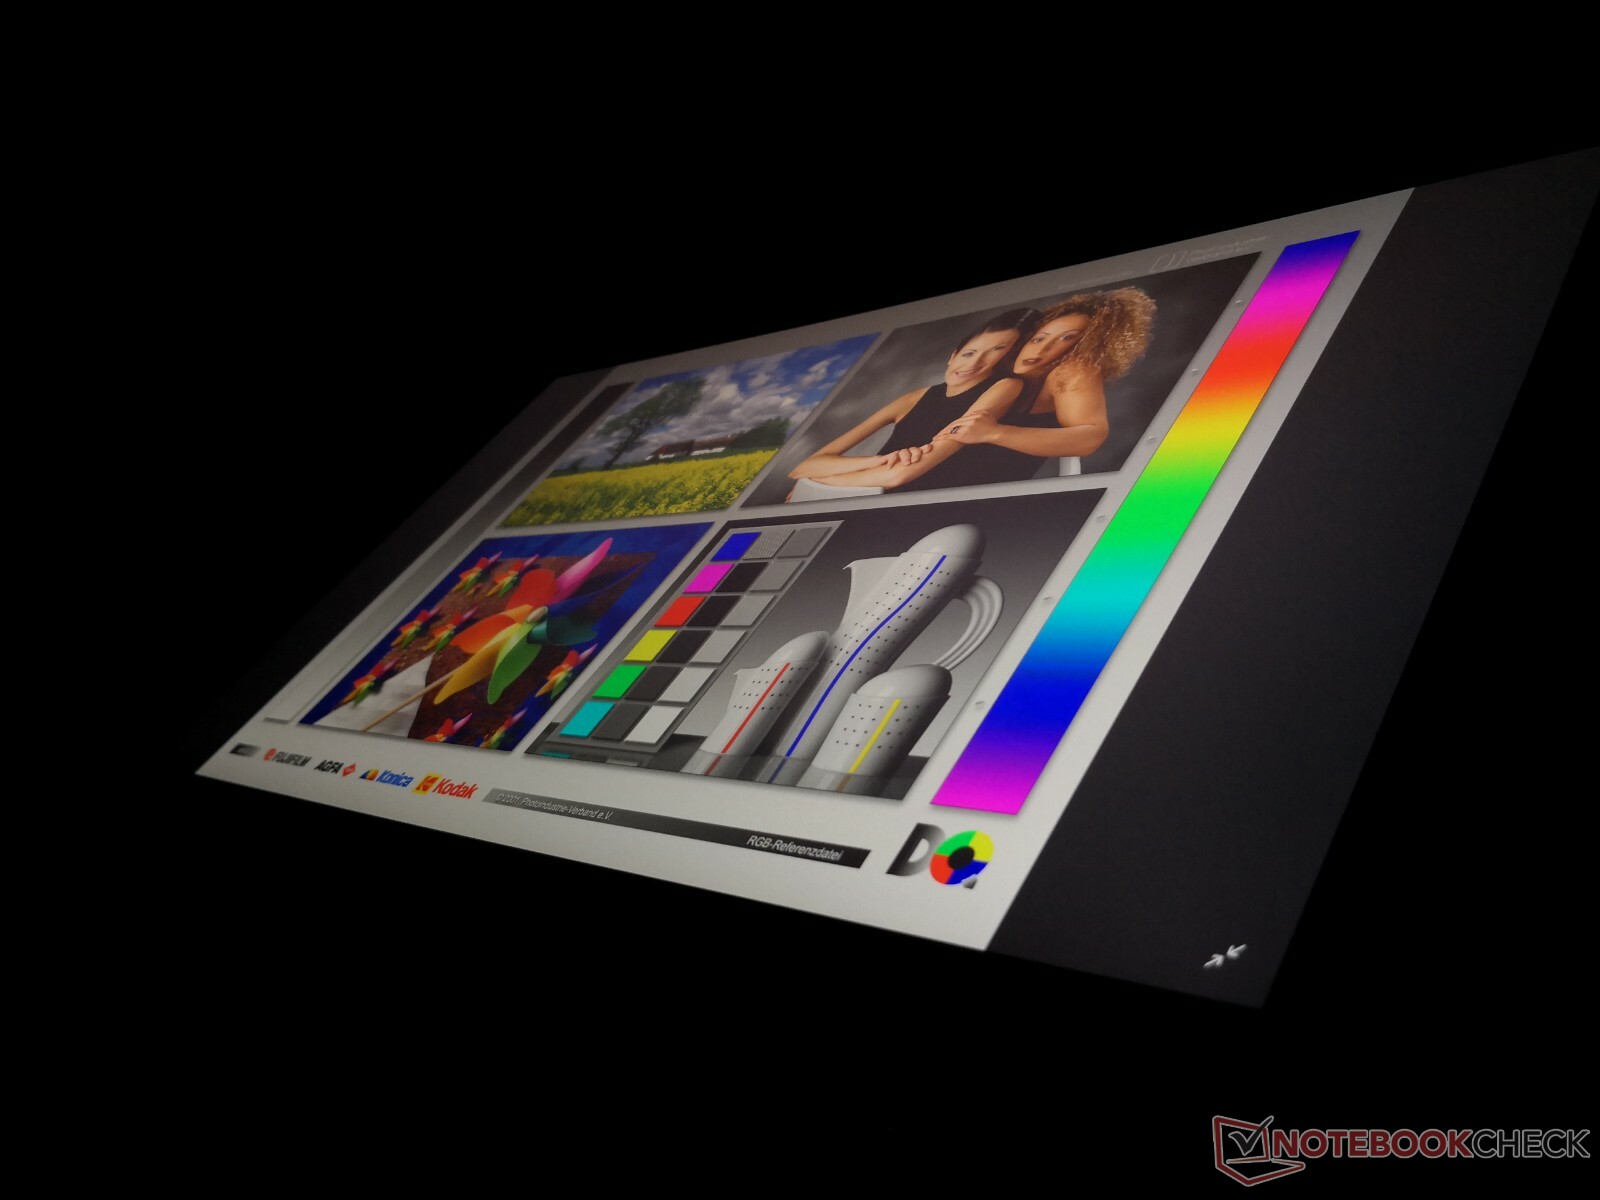
Since the display is about as bright as most other gaming laptops (~300 nits), outdoor visibility is not better or worse than the competition. Colors become washed out if working under sunlight and some glare is inevitable even if under shade. Viewing angles are otherwise very wide with only the usual minor shifts in contrast and colors from obtuse angles.
Performance
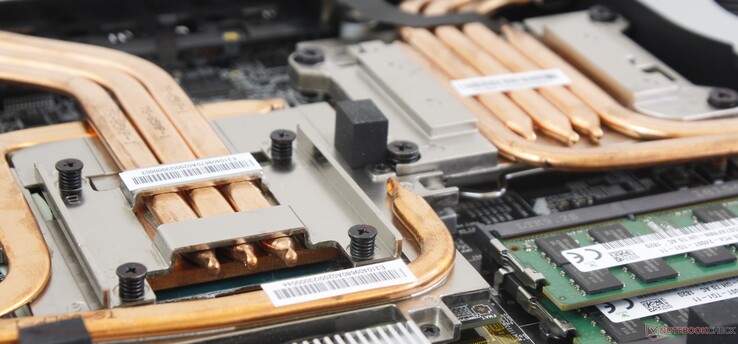
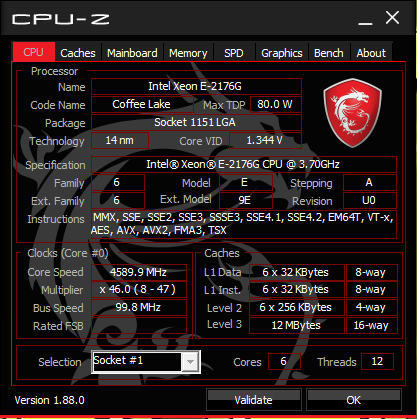
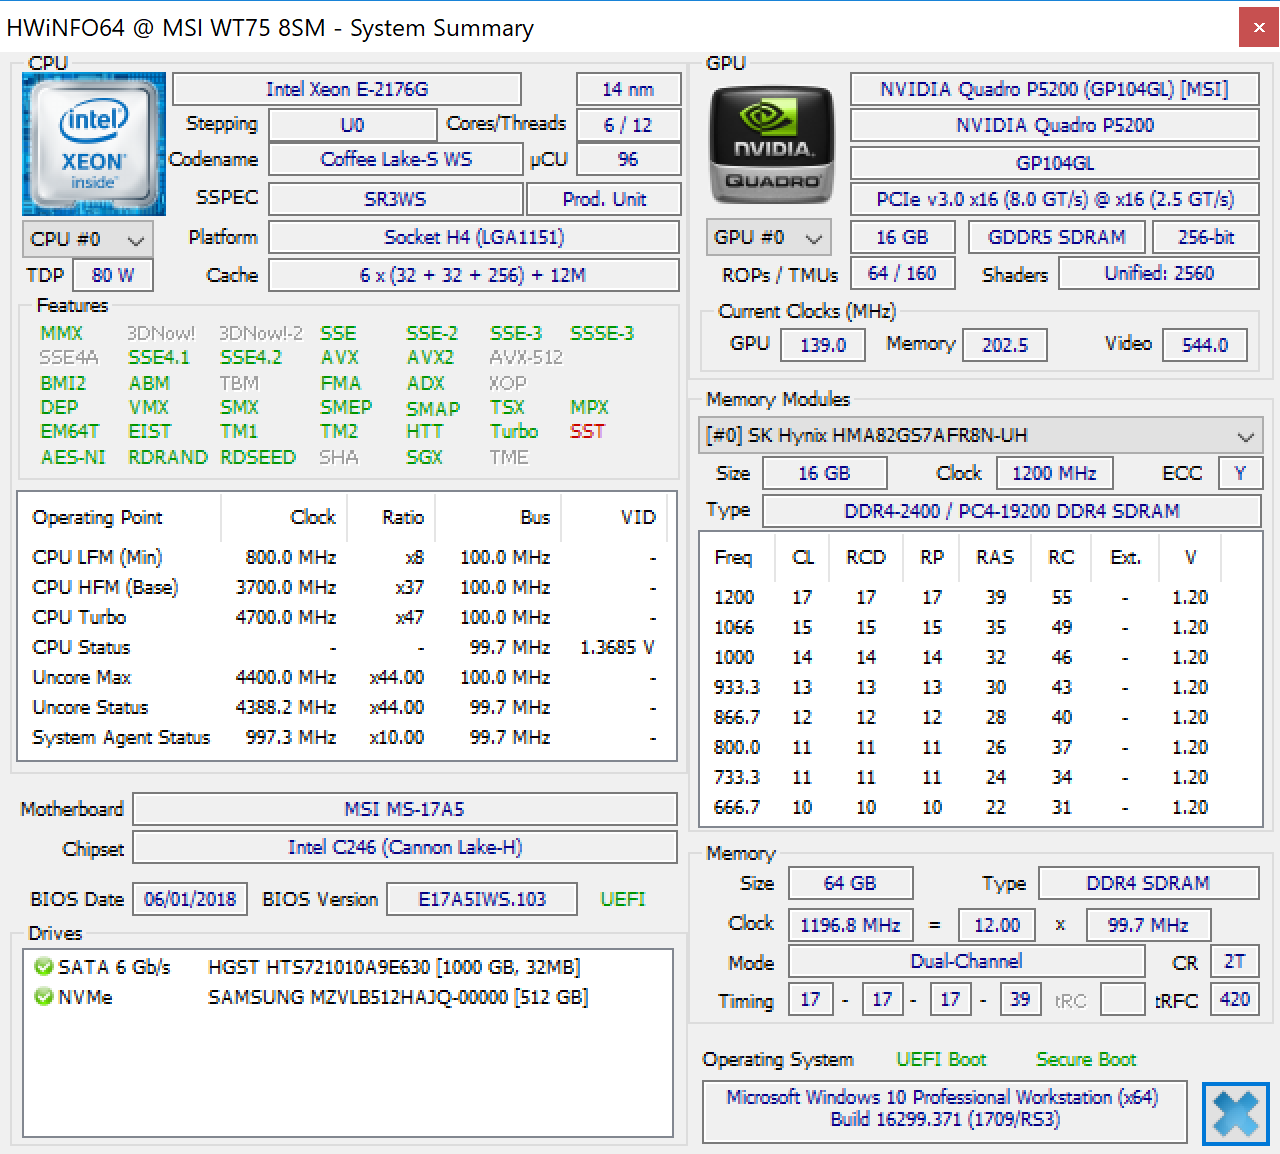
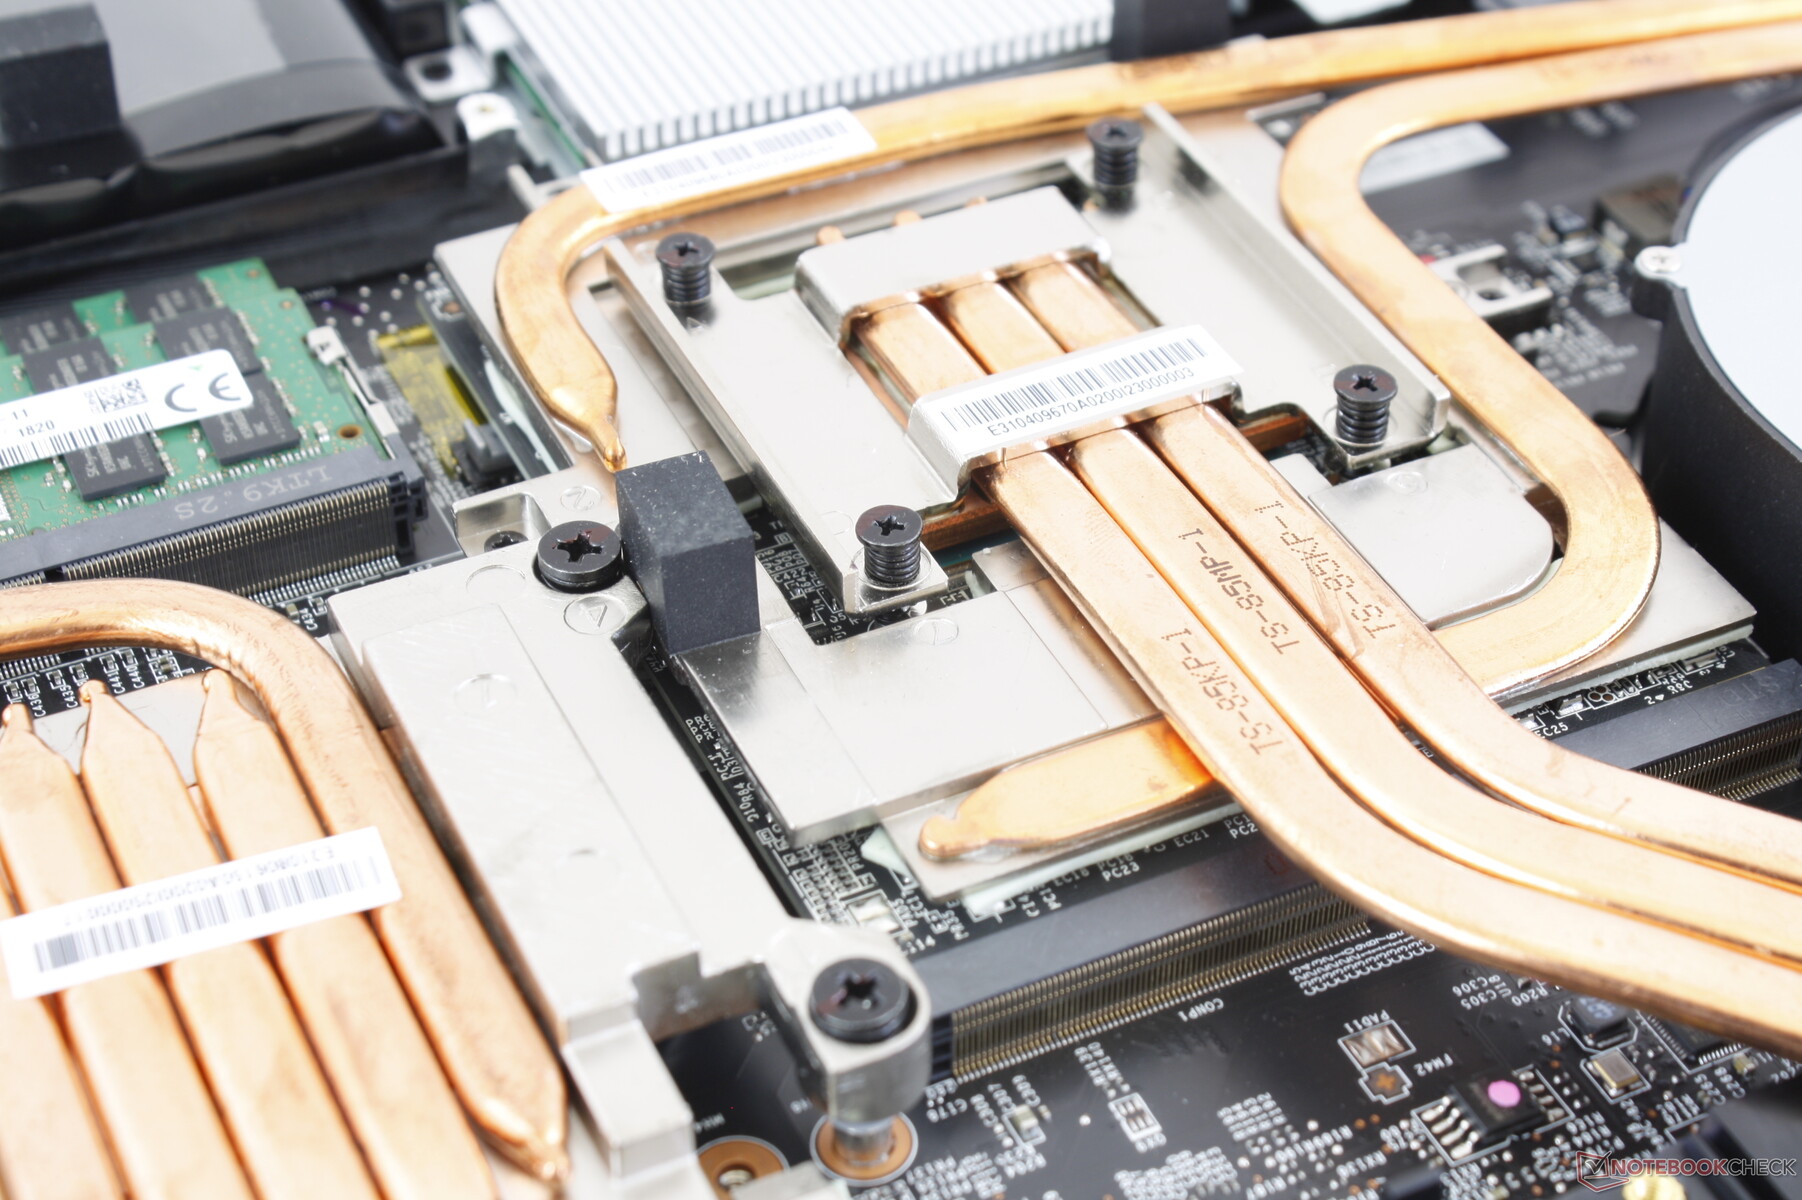
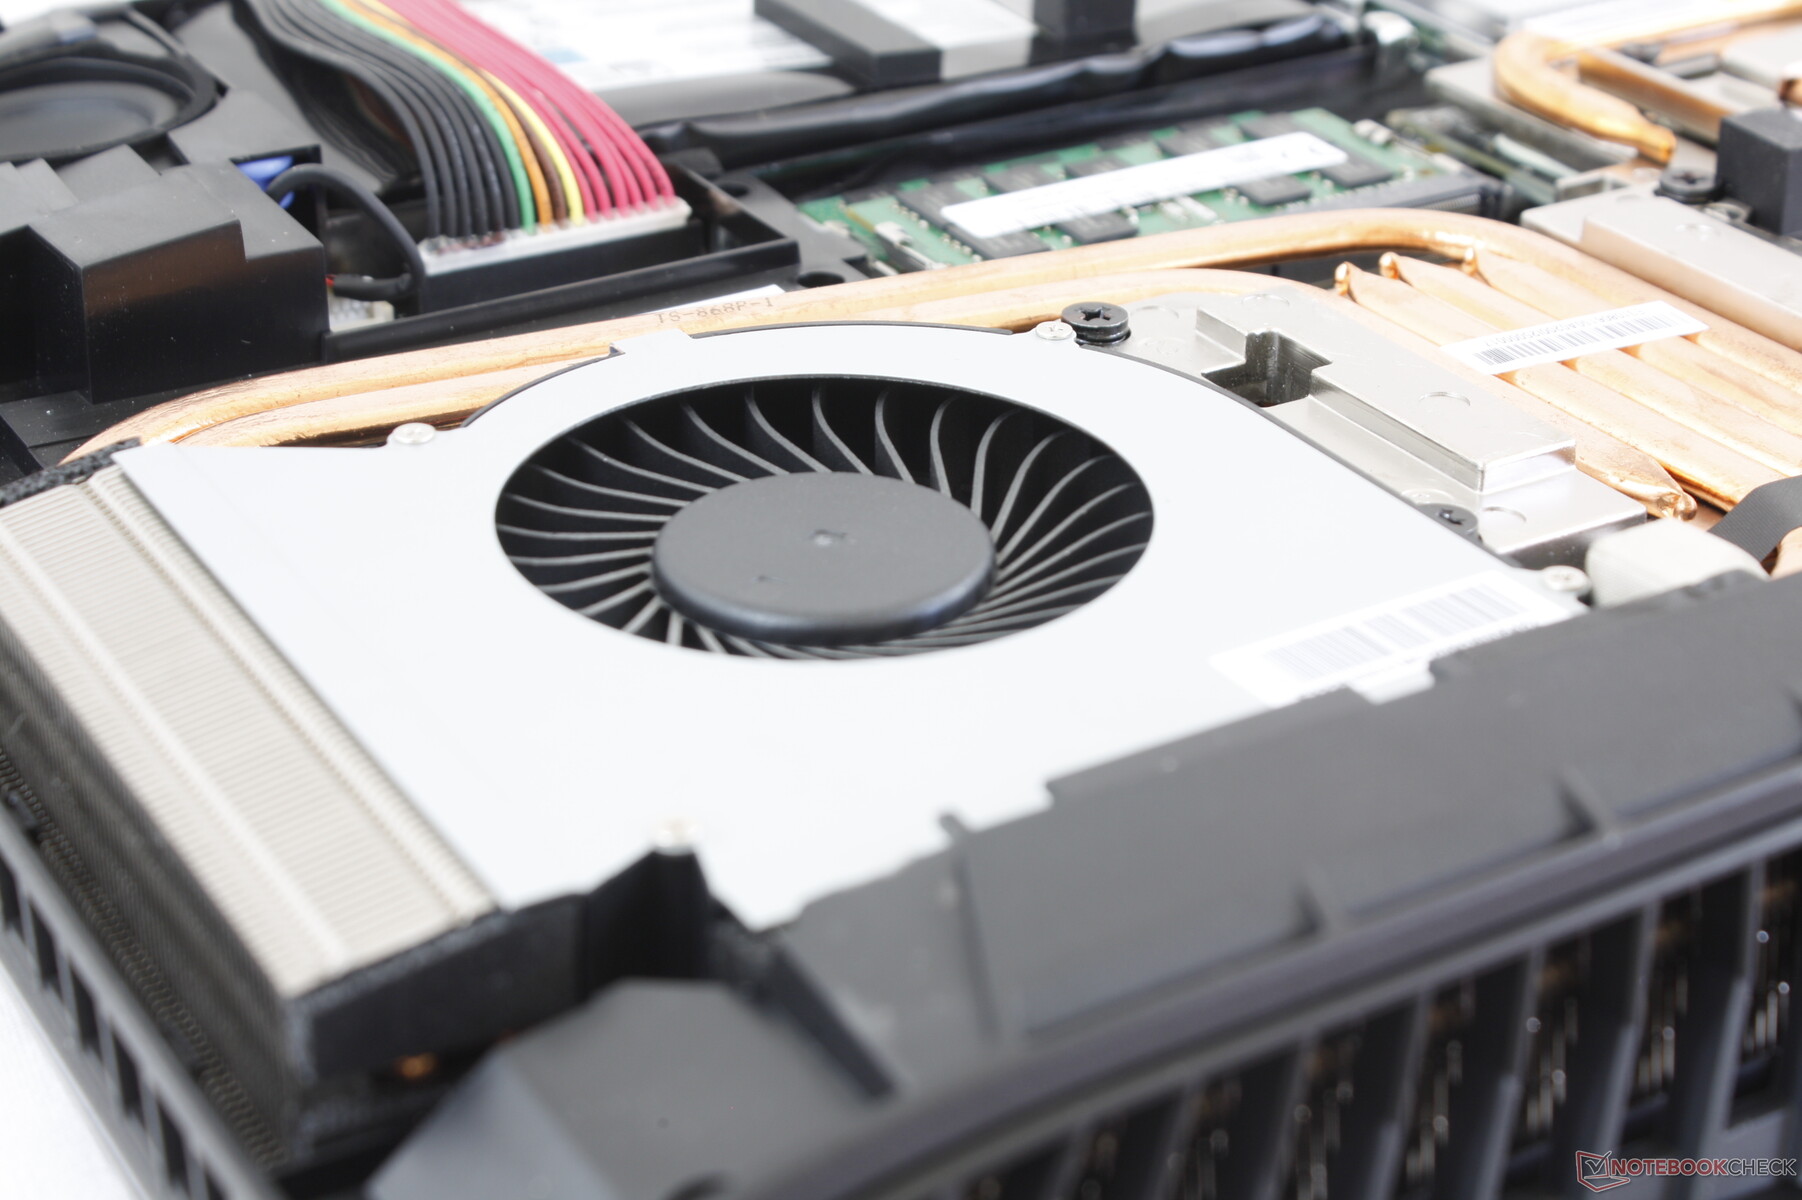
The Xeon E-2176G processor requires a more powerful cooling solution than the Core i9-8950HK in the GT75 (80 W vs. 45 W TDP). We suspect this is why the WT75 dedicates more heat pipes to its CPU when compared to the GT75. The Xeon E-2176G is akin to the Core i7-8700 in terms of raw performance but with added stability and ECC RAM support that professional users can appreciate. Since this is a desktop LGA 1151 CPU, owners can swap out the processor in the WT75 if desired.
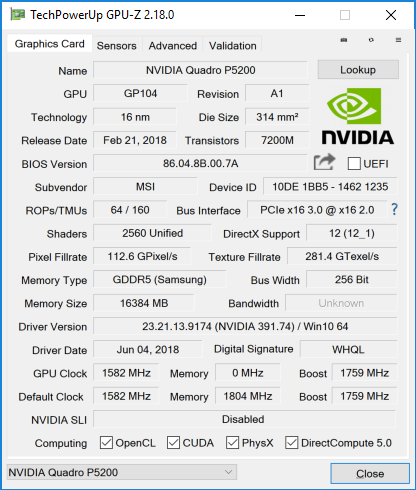
Similarly, the Quadro P5200 is closely related to the consumer GeForce GTX 1080. Its MXM 3.0 module is also removable and upgradeable. A manual graphics switch is available for running on the integrated UHD Graphics P630.
Processor
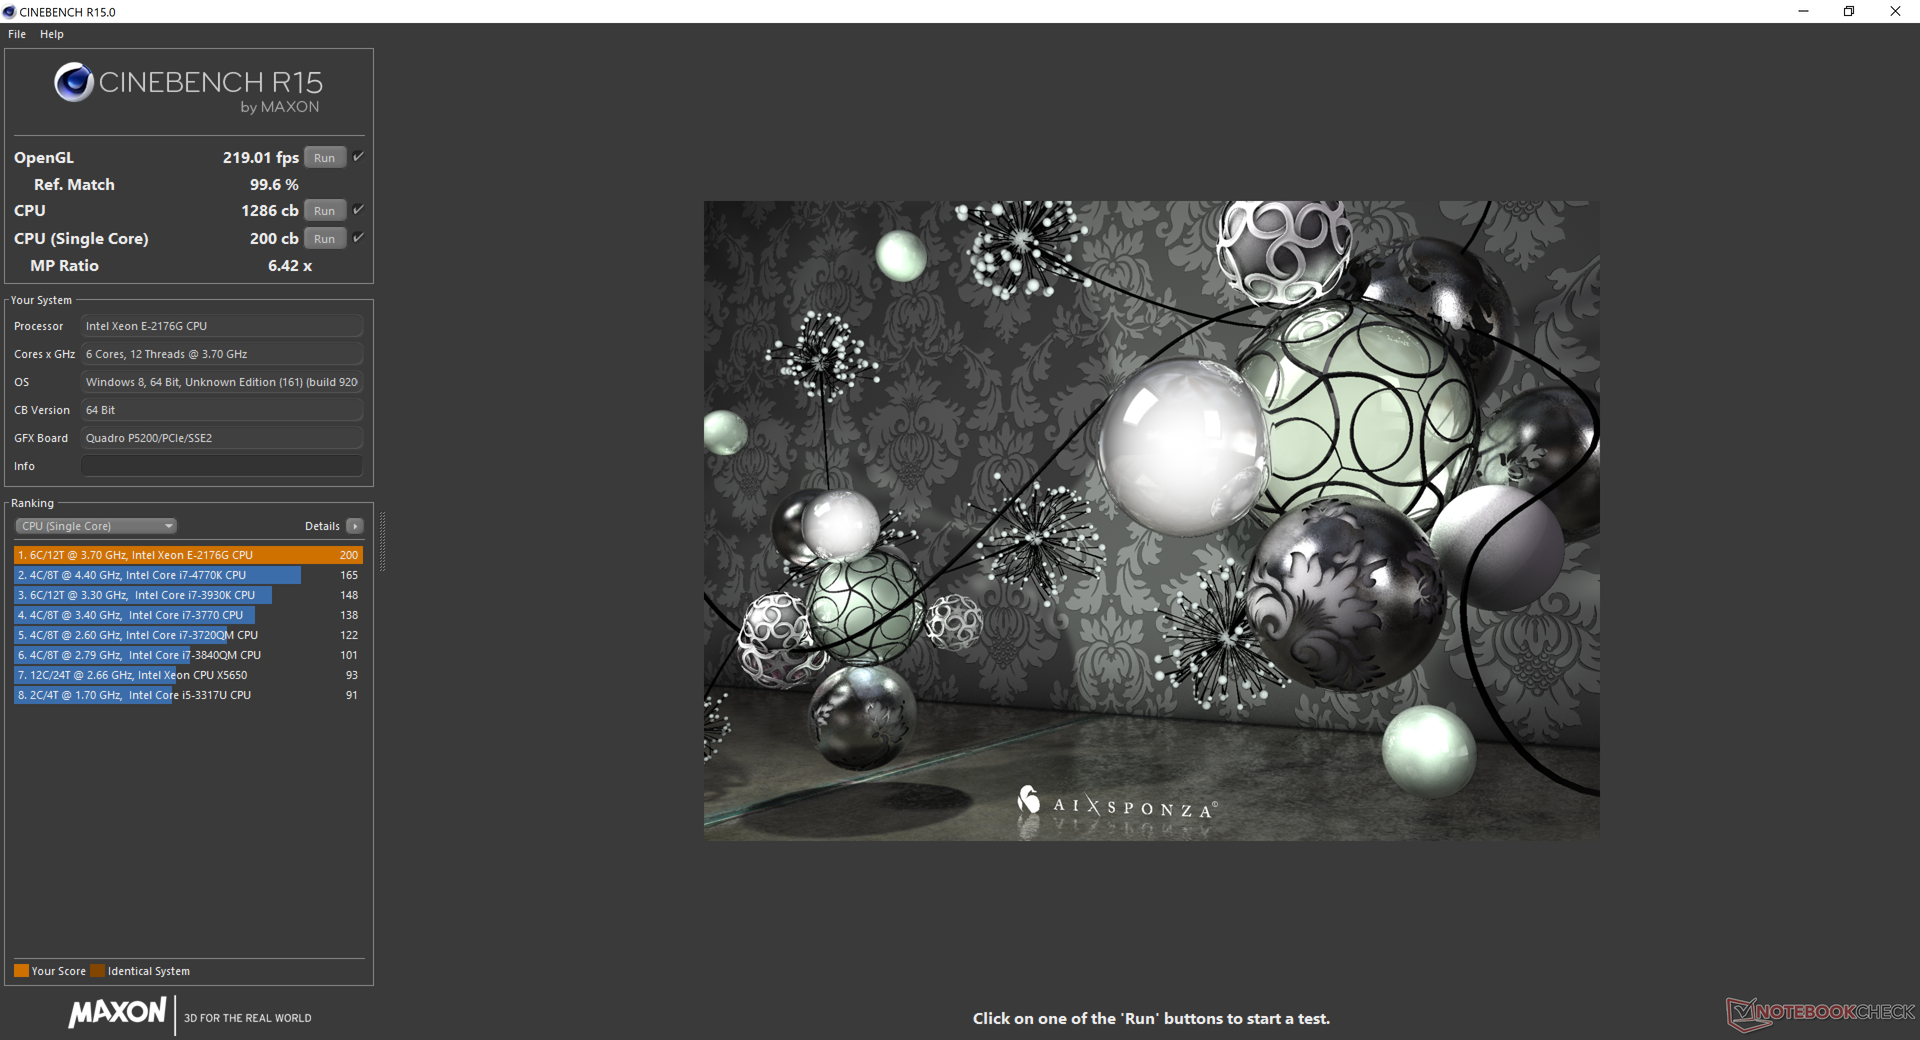
Since the Xeon E-2176G is closely related to the Core i7-8700, CineBench R15 results are similar between them. Our WT75 sits in between the i7-8700K in the Eurocom Sky X9C and i7-8700 in the Schenker XMG Ultra 17. Results are only 15 to 20 percent faster than the i7-8750H or Xeon E-2176M as found on the ThinkPad P1.
Performance sustainability is good but not perfect. When running CineBench R15 Multi-Thread in a loop, the initial score of 1342 points drops to 1276 points over time to represent a performance dip of about 5 percent over time. Performance appears to fluctuate just slightly more than our Eurocom Sky X9C equipped with the i7-8700K.
| Cinebench R11.5 | |
| CPU Single 64Bit | |
| Eurocom Tornado F7W | |
| Eurocom Sky X9C | |
| MSI WT75 8SM | |
| Schenker XMG Ultra 17 | |
| Lenovo ThinkPad P1-20MD002LUS | |
| Fujitsu Celsius H980 | |
| AMD Threadripper 2970WX, AMD Radeon RX Vega 64 | |
| MSI WT72-6QM | |
| NVIDIA Titan X Pascal | |
| CPU Multi 64Bit | |
| NVIDIA Titan X Pascal | |
| AMD Threadripper 2970WX, AMD Radeon RX Vega 64 | |
| Eurocom Tornado F7W | |
| Eurocom Sky X9C | |
| MSI WT75 8SM | |
| Schenker XMG Ultra 17 | |
| Fujitsu Celsius H980 | |
| Lenovo ThinkPad P1-20MD002LUS | |
| MSI WT72-6QM | |
| Cinebench R10 | |
| Rendering Multiple CPUs 32Bit | |
| Lenovo ThinkPad P1-20MD002LUS | |
| NVIDIA Titan X Pascal | |
| Eurocom Sky X9C | |
| MSI WT75 8SM | |
| AMD Threadripper 2970WX, AMD Radeon RX Vega 64 | |
| Eurocom Tornado F7W | |
| Fujitsu Celsius H980 | |
| Schenker XMG Ultra 17 | |
| MSI WT72-6QM | |
| Rendering Single 32Bit | |
| Lenovo ThinkPad P1-20MD002LUS | |
| Eurocom Tornado F7W | |
| Eurocom Sky X9C | |
| MSI WT75 8SM | |
| Schenker XMG Ultra 17 | |
| Fujitsu Celsius H980 | |
| MSI WT72-6QM | |
| AMD Threadripper 2970WX, AMD Radeon RX Vega 64 | |
| NVIDIA Titan X Pascal | |
| wPrime 2.10 - 1024m | |
| MSI WT75 8SM | |
| Eurocom Sky X9C | |
| Eurocom Tornado F7W | |
| NVIDIA Titan X Pascal | |
| AMD Threadripper 2970WX, AMD Radeon RX Vega 64 | |
* ... smaller is better
System Performance
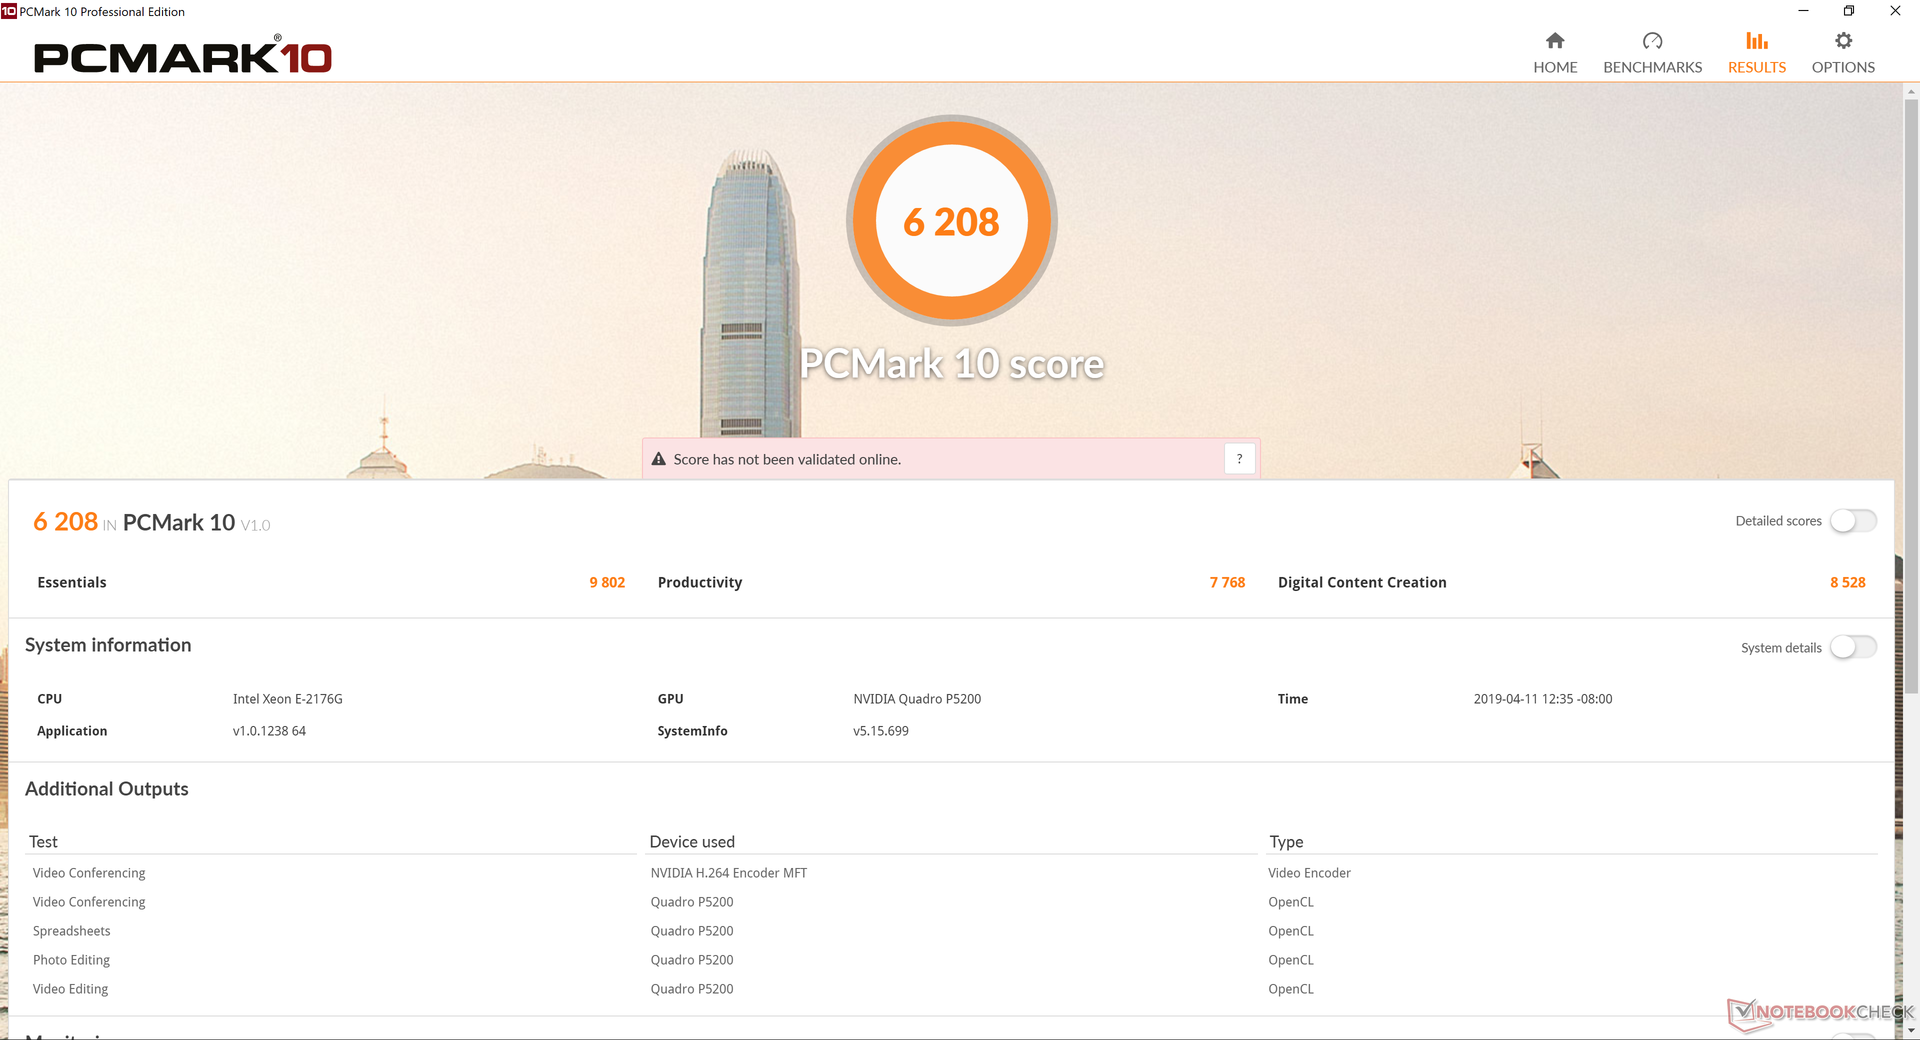
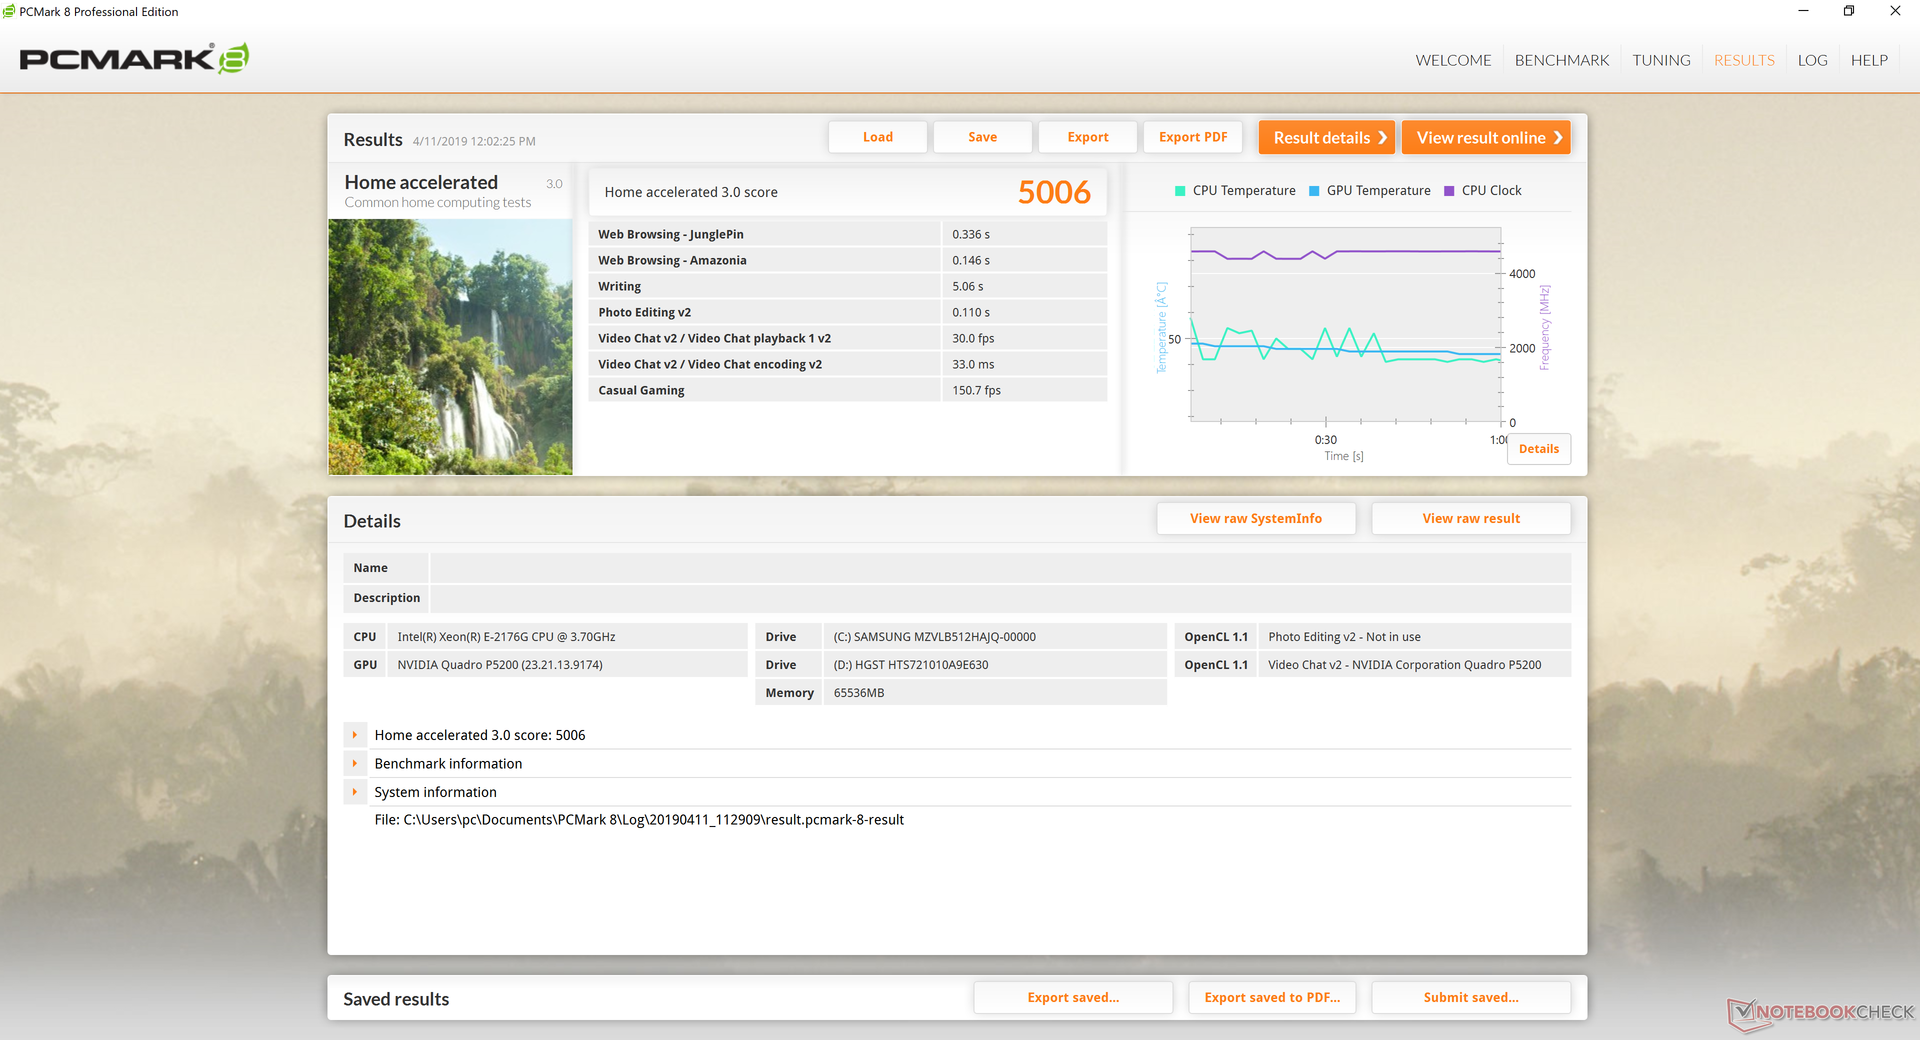
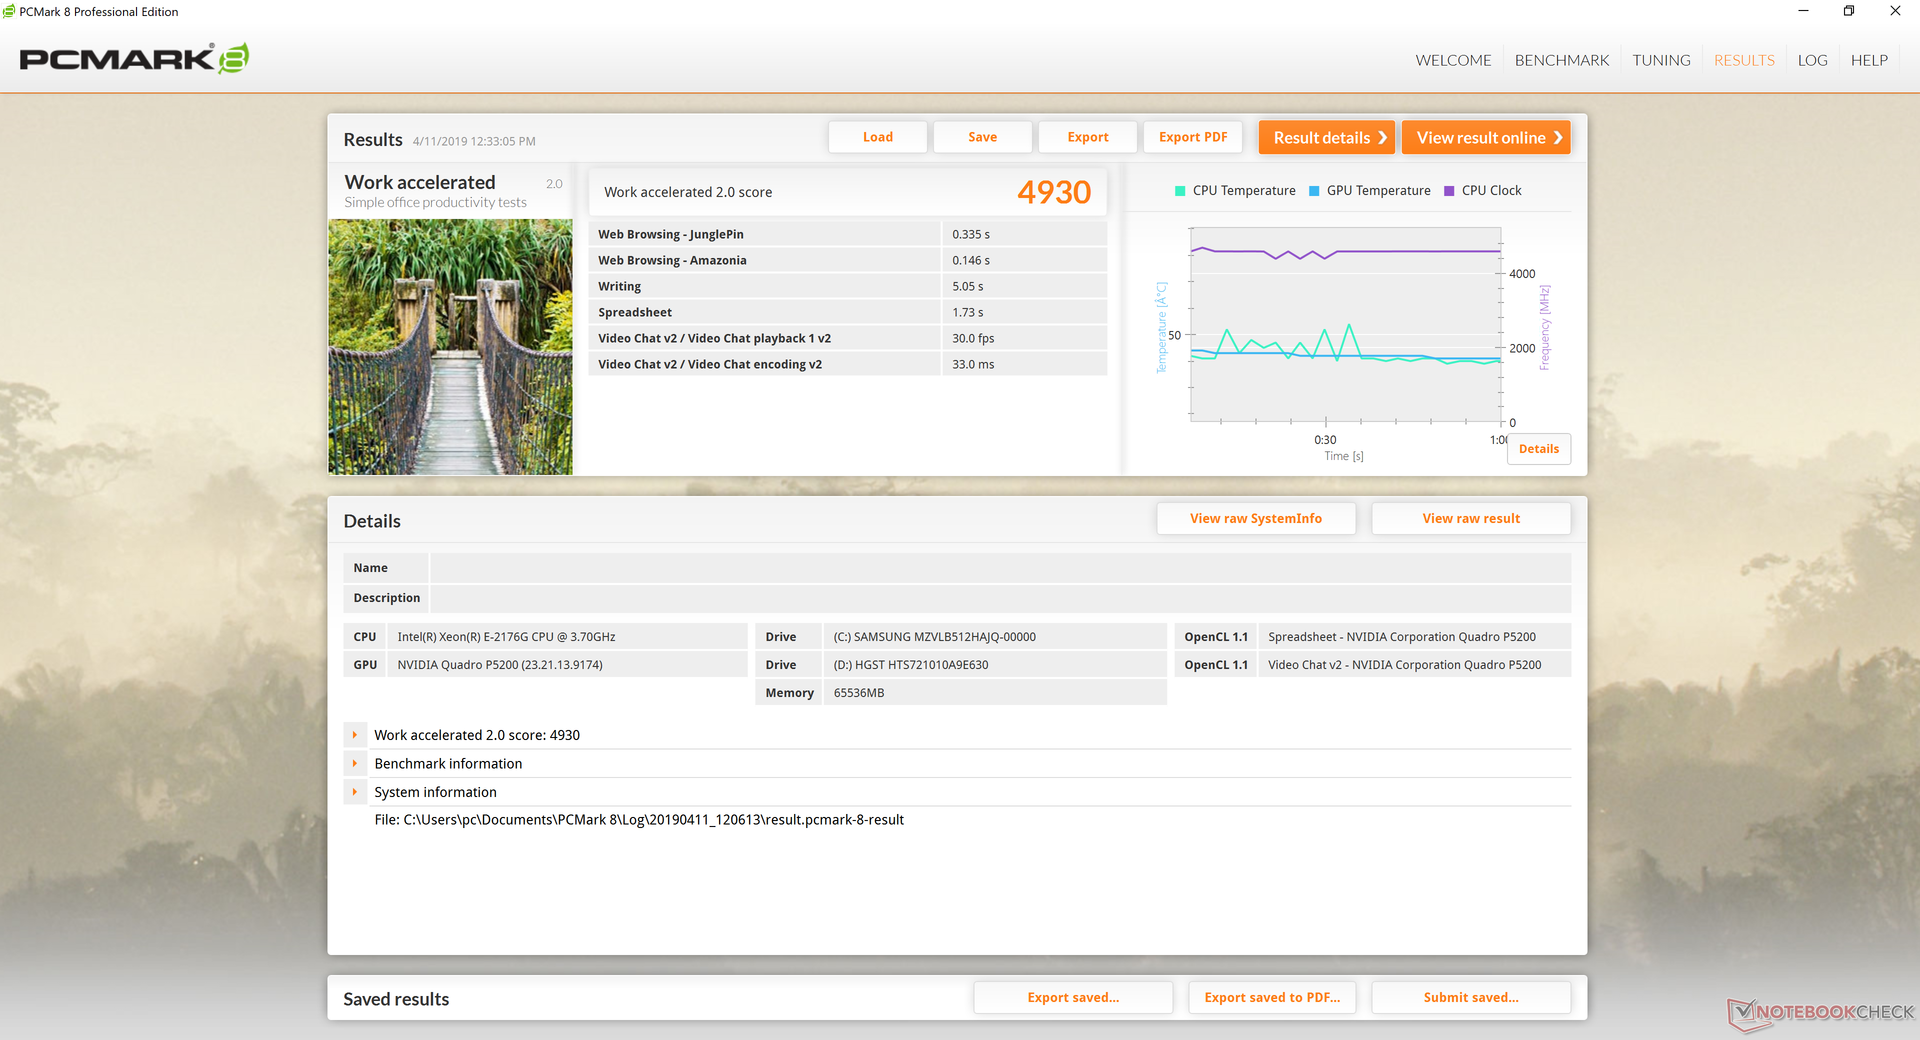
PCMark results are comparable to the Eurocom Tornado F7W but still consistently lower than the Alienware Area-51m with its i9-9900K and RTX 2080 GPU. As far as mobile workstations go, however, the WT75 is one of the highest in our database as of this writing.
| PCMark 10 | |
| Score | |
| Alienware Area-51m i9-9900K RTX 2080 | |
| MSI WT75 8SM | |
| Lenovo ThinkPad P72-20MB000EGE | |
| Dell Precision 7720 | |
| Fujitsu Celsius H980 | |
| Essentials | |
| Alienware Area-51m i9-9900K RTX 2080 | |
| MSI WT75 8SM | |
| Lenovo ThinkPad P72-20MB000EGE | |
| Dell Precision 7720 | |
| Fujitsu Celsius H980 | |
| Productivity | |
| Alienware Area-51m i9-9900K RTX 2080 | |
| MSI WT75 8SM | |
| Dell Precision 7720 | |
| Lenovo ThinkPad P72-20MB000EGE | |
| Fujitsu Celsius H980 | |
| Digital Content Creation | |
| Alienware Area-51m i9-9900K RTX 2080 | |
| MSI WT75 8SM | |
| Fujitsu Celsius H980 | |
| Dell Precision 7720 | |
| Lenovo ThinkPad P72-20MB000EGE | |
| PCMark 8 | |
| Home Score Accelerated v2 | |
| Alienware Area-51m i9-9900K RTX 2080 | |
| MSI WT75 8SM | |
| Lenovo ThinkPad P72-20MB000EGE | |
| Fujitsu Celsius H980 | |
| Dell Precision 7720 | |
| Work Score Accelerated v2 | |
| Alienware Area-51m i9-9900K RTX 2080 | |
| Lenovo ThinkPad P72-20MB000EGE | |
| Fujitsu Celsius H980 | |
| MSI WT75 8SM | |
| Dell Precision 7720 | |
| PCMark 8 Home Score Accelerated v2 | 5006 points | |
| PCMark 8 Work Score Accelerated v2 | 4930 points | |
| PCMark 10 Score | 6208 points | |
Help | ||
Storage Devices
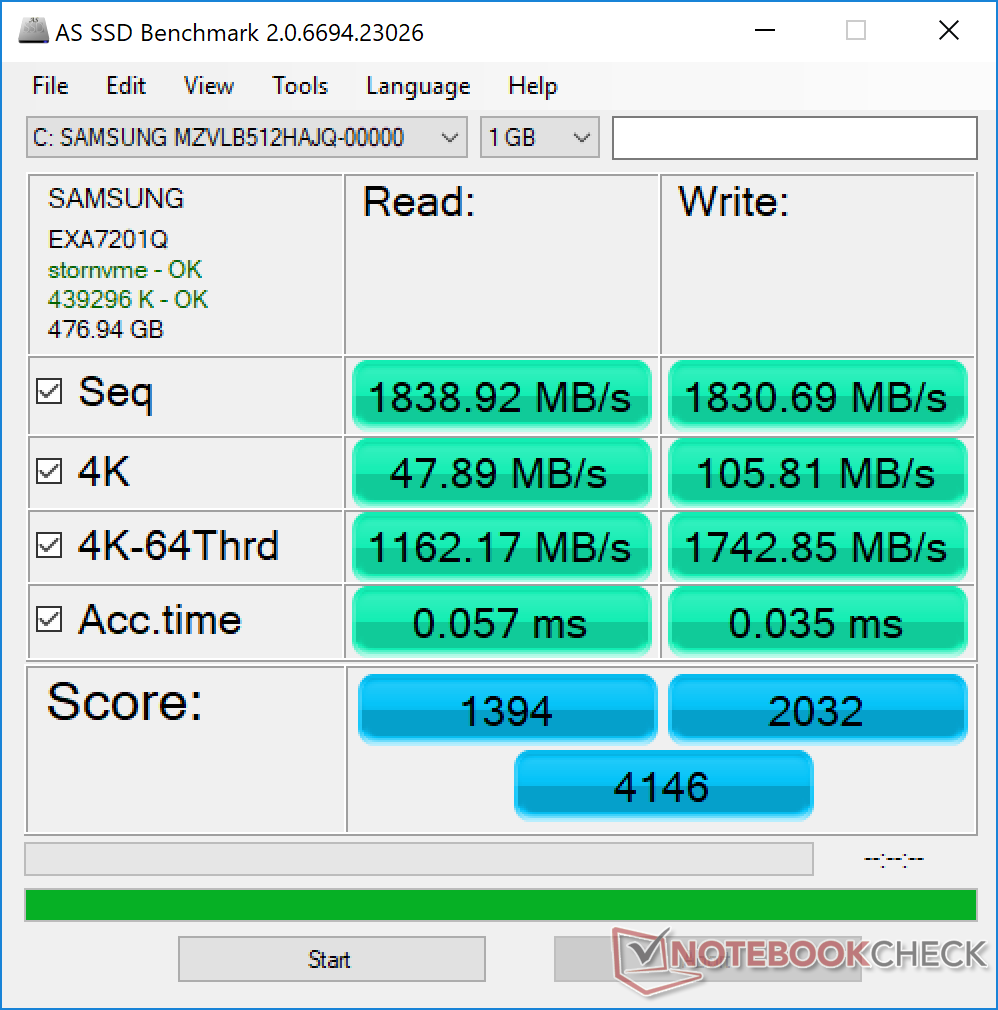
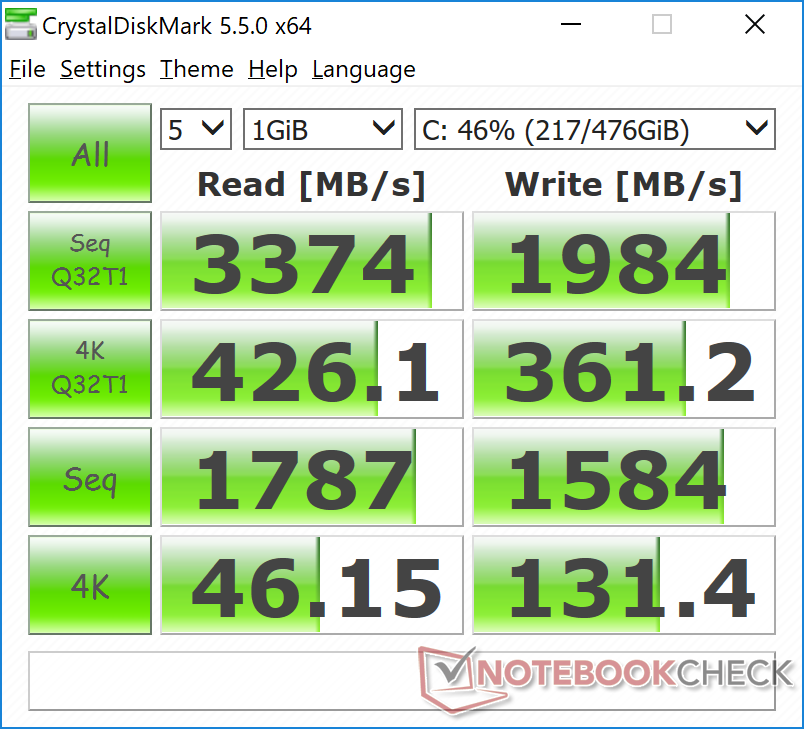
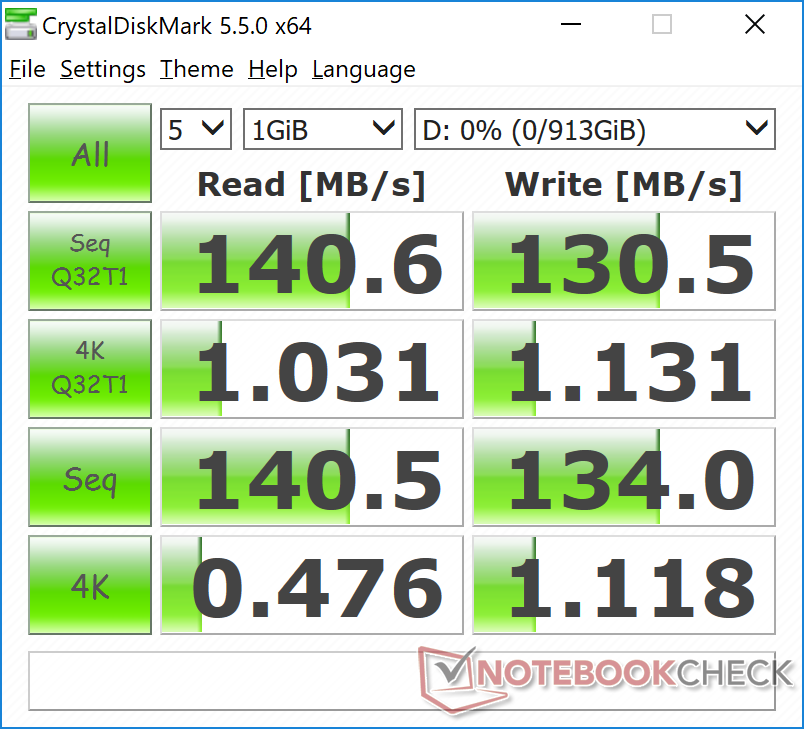
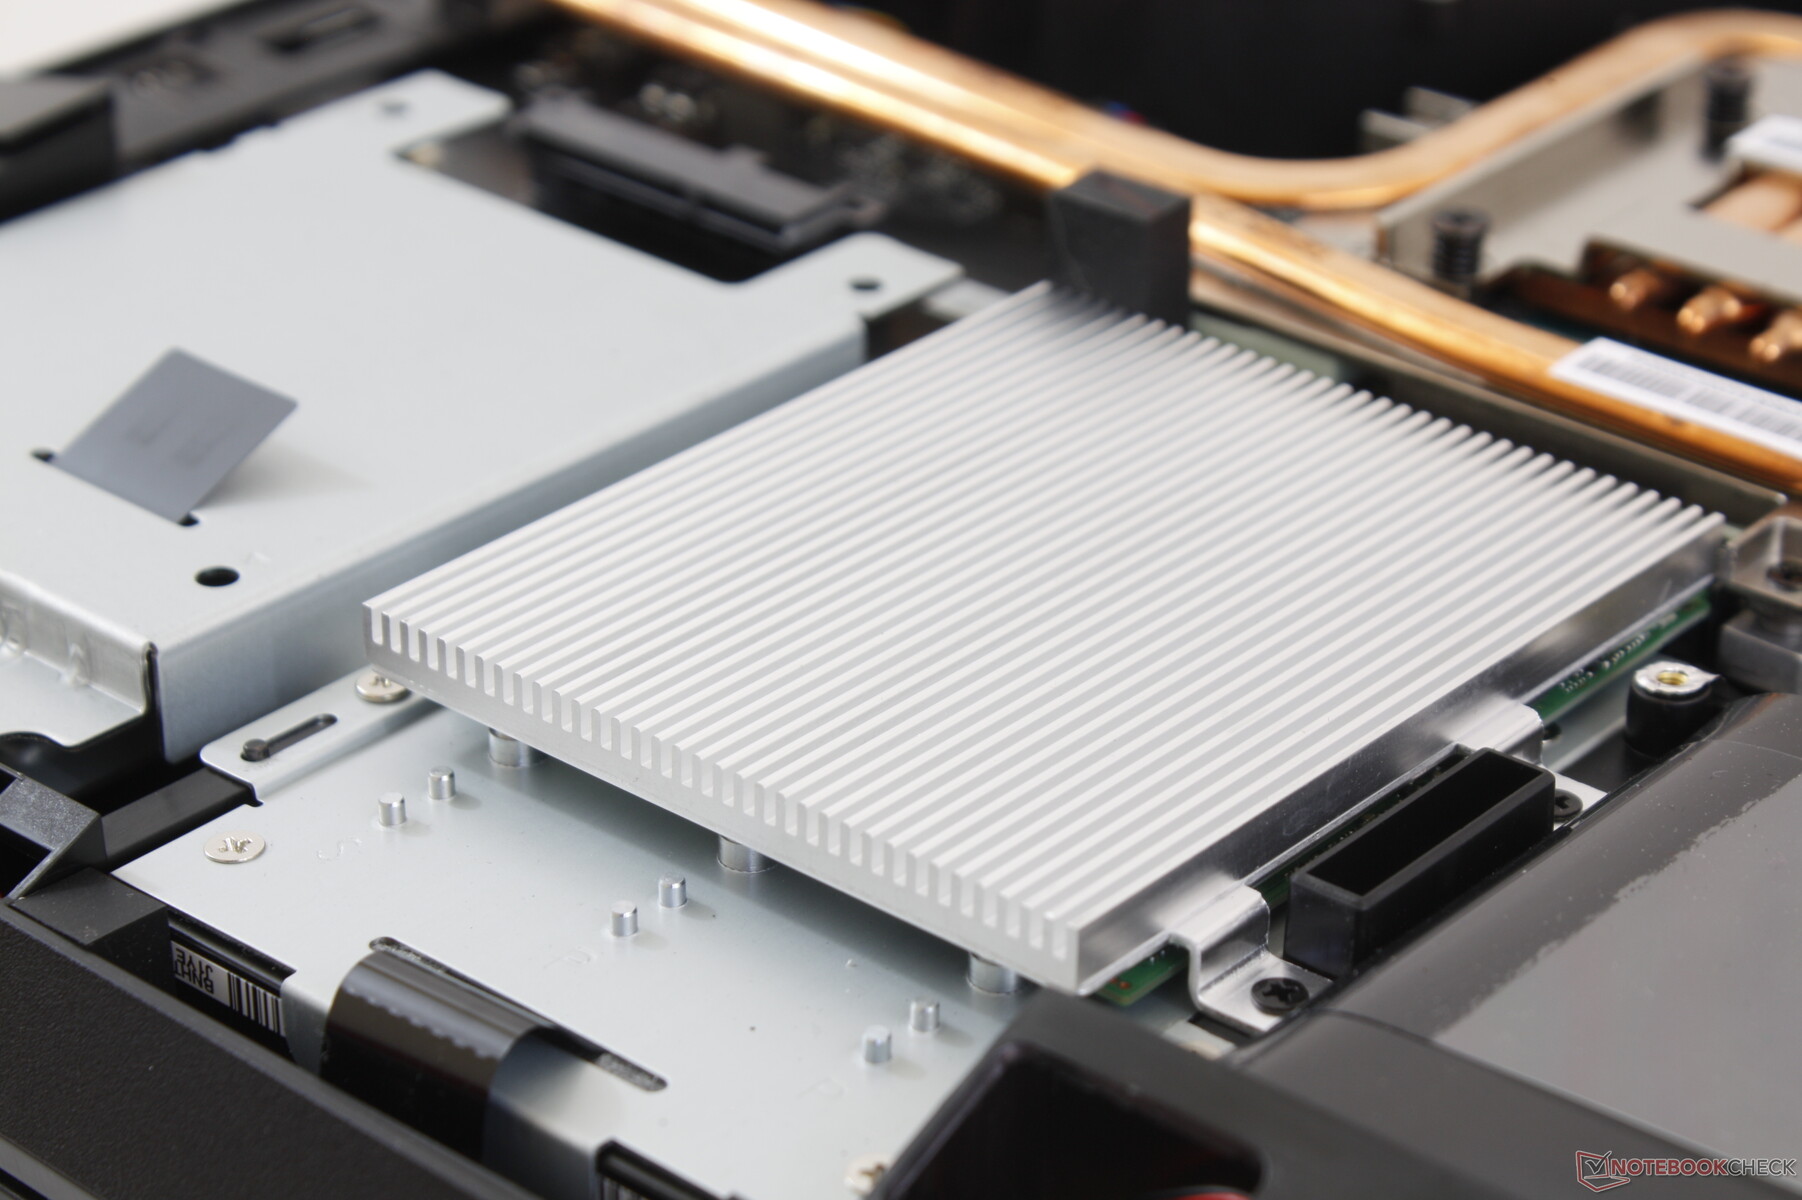
A total of five internal storage bays are available (3x M.2 2280 + 2x 2.5-inch SATA III). Our test unit is equipped with a primary 512 GB Samsung PM981 M.2 NVMe SSD and a secondary 1 TB Hitachi HGST HDD. The PM981 is one of the fastest consumer SSDs with sequential read and write rates of about 1800 MB/s each according to AS SSD. Users who want even faster performance can have up to three M.2 SSDs in RAID configuration. See our table of HDDs and SSDs for more benchmark comparisons.
An aluminum heat sink protects all three M.2 bays as shown by the picture below. This is one of the largest heat sinks we've seen on a laptop that's dedicated to M.2 cooling. NVMe drives are notorious for becoming very warm when under high processing stress.
| MSI WT75 8SM Samsung SSD PM981 MZVLB512HAJQ | Alienware Area-51m i9-9900K RTX 2080 2x SK Hynix PC400 512GB (RAID 0) | Fujitsu Celsius H980 Samsung SSD PM981 MZVLB512HAJQ | Eurocom Tornado F7W 3x Samsung SSD 970 Pro 512GB (RAID 0) | MSI WT72-6QM Toshiba NVMe THNSN5256GPU7 | |
|---|---|---|---|---|---|
| AS SSD | -11% | -6% | 0% | -30% | |
| Seq Read (MB/s) | 1839 | 2082 13% | 1082 -41% | 2139 16% | 2638 43% |
| Seq Write (MB/s) | 1831 | 2335 28% | 1781 -3% | 2447 34% | 810 -56% |
| 4K Read (MB/s) | 47.89 | 24.14 -50% | 46.09 -4% | 29.7 -38% | 37.5 -22% |
| 4K Write (MB/s) | 105.8 | 91.8 -13% | 100.4 -5% | 102.5 -3% | 96.4 -9% |
| 4K-64 Read (MB/s) | 1162 | 1561 34% | 1209 4% | 1299 12% | 935 -20% |
| 4K-64 Write (MB/s) | 1743 | 1350 -23% | 1622 -7% | 1236 -29% | 473.5 -73% |
| Access Time Read * (ms) | 0.057 | 0.121 -112% | 0.053 7% | 0.045 21% | 0.092 -61% |
| Access Time Write * (ms) | 0.035 | 0.039 -11% | 0.037 -6% | 0.033 6% | 0.04 -14% |
| Score Read (Points) | 1394 | 1793 29% | 1363 -2% | 1543 11% | 1237 -11% |
| Score Write (Points) | 2032 | 1675 -18% | 1901 -6% | 1583 -22% | 651 -68% |
| Score Total (Points) | 4146 | 4390 6% | 4003 -3% | 3928 -5% | 2433 -41% |
| Copy ISO MB/s (MB/s) | 2175 | 1396 | 2320 | 1777 | |
| Copy Program MB/s (MB/s) | 582 | 354.3 | 621 | 554 | |
| Copy Game MB/s (MB/s) | 1479 | 691 | 1585 | 1025 |
* ... smaller is better

GPU Performance
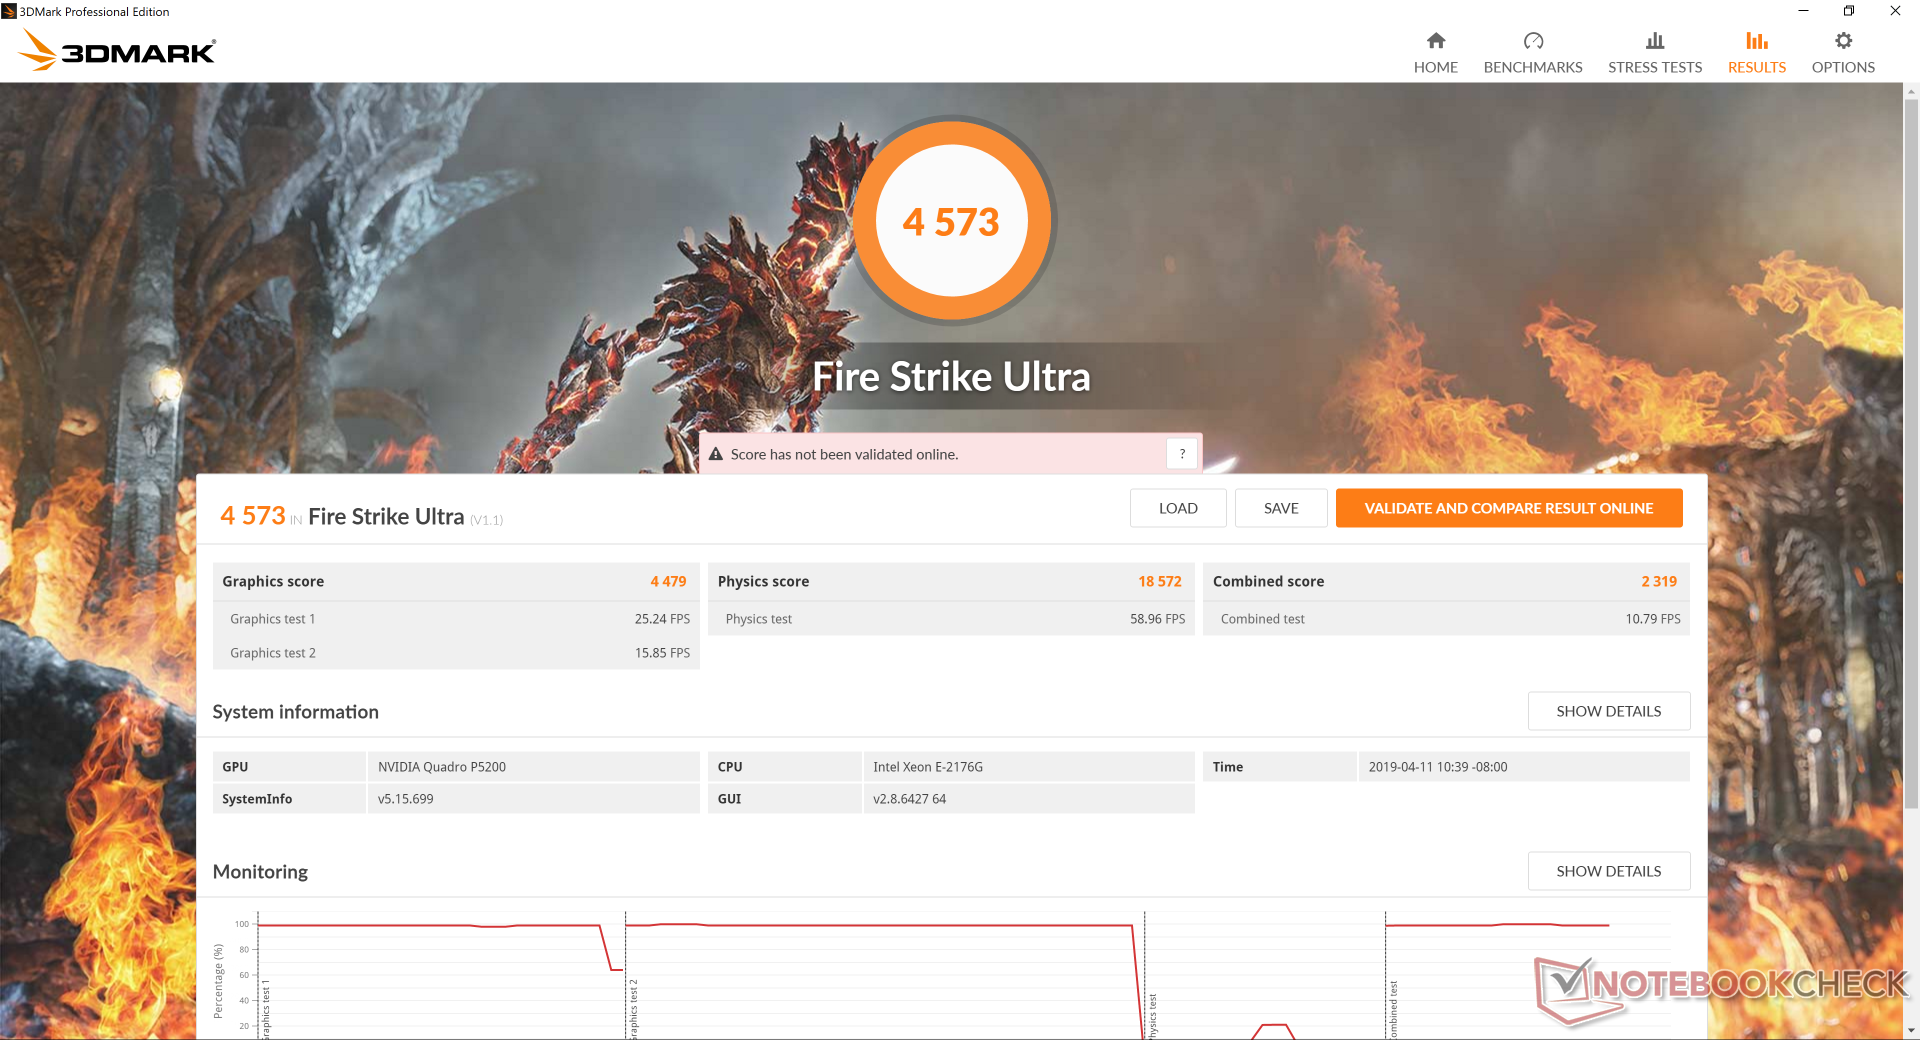
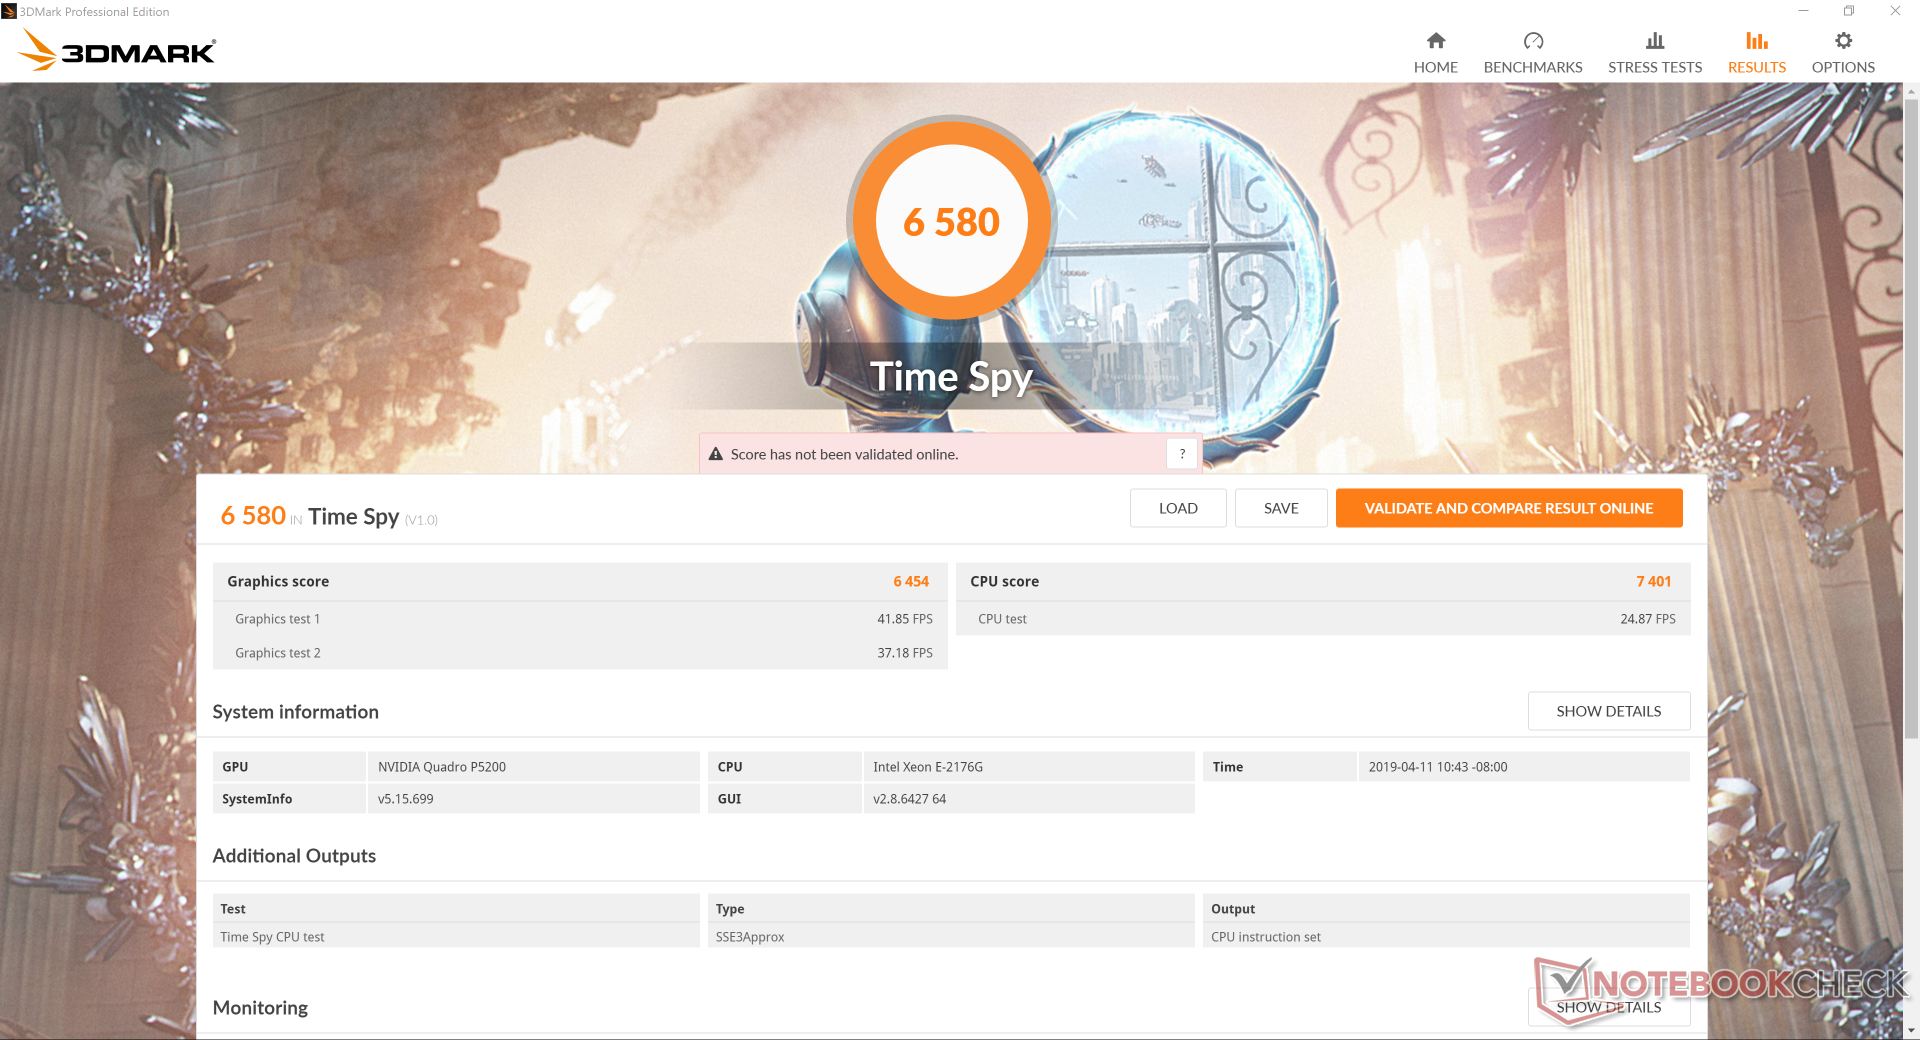
3DMark benchmarks rank the Quadro P5200 almost 50 percent faster than the P3200 while being on par with the Radeon RX Vega 64. SPECViewPerf 12 and 13 results, however, paint a completely different picture as this is a Quadro GPU after all. Our system handily outclasses even the Nvidia Titan X in many of the CAD-based benchmarks.
Gaming performance is most similar to the GTX 1080 albeit just a tad bit slower. Users who intend to game on the WT75 ought to consider the GT75 instead.
See our dedicated page on the Quadro P5200 for more technical information and benchmarks.
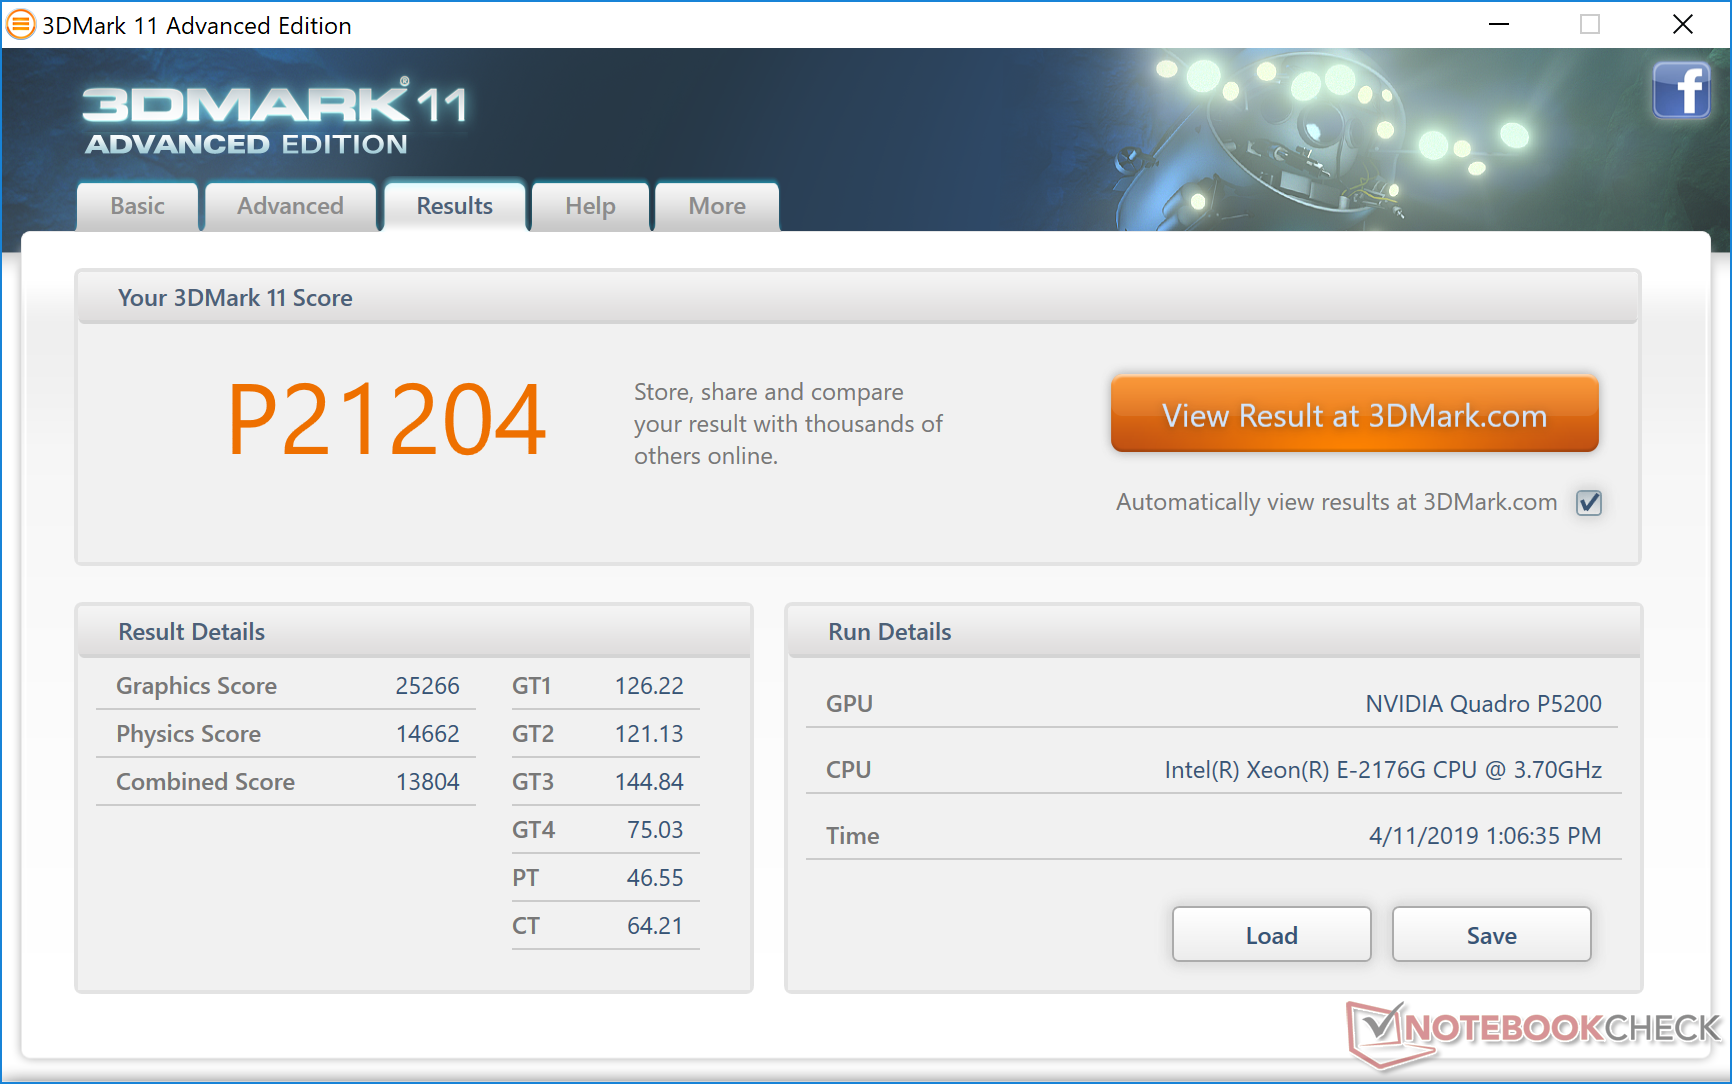
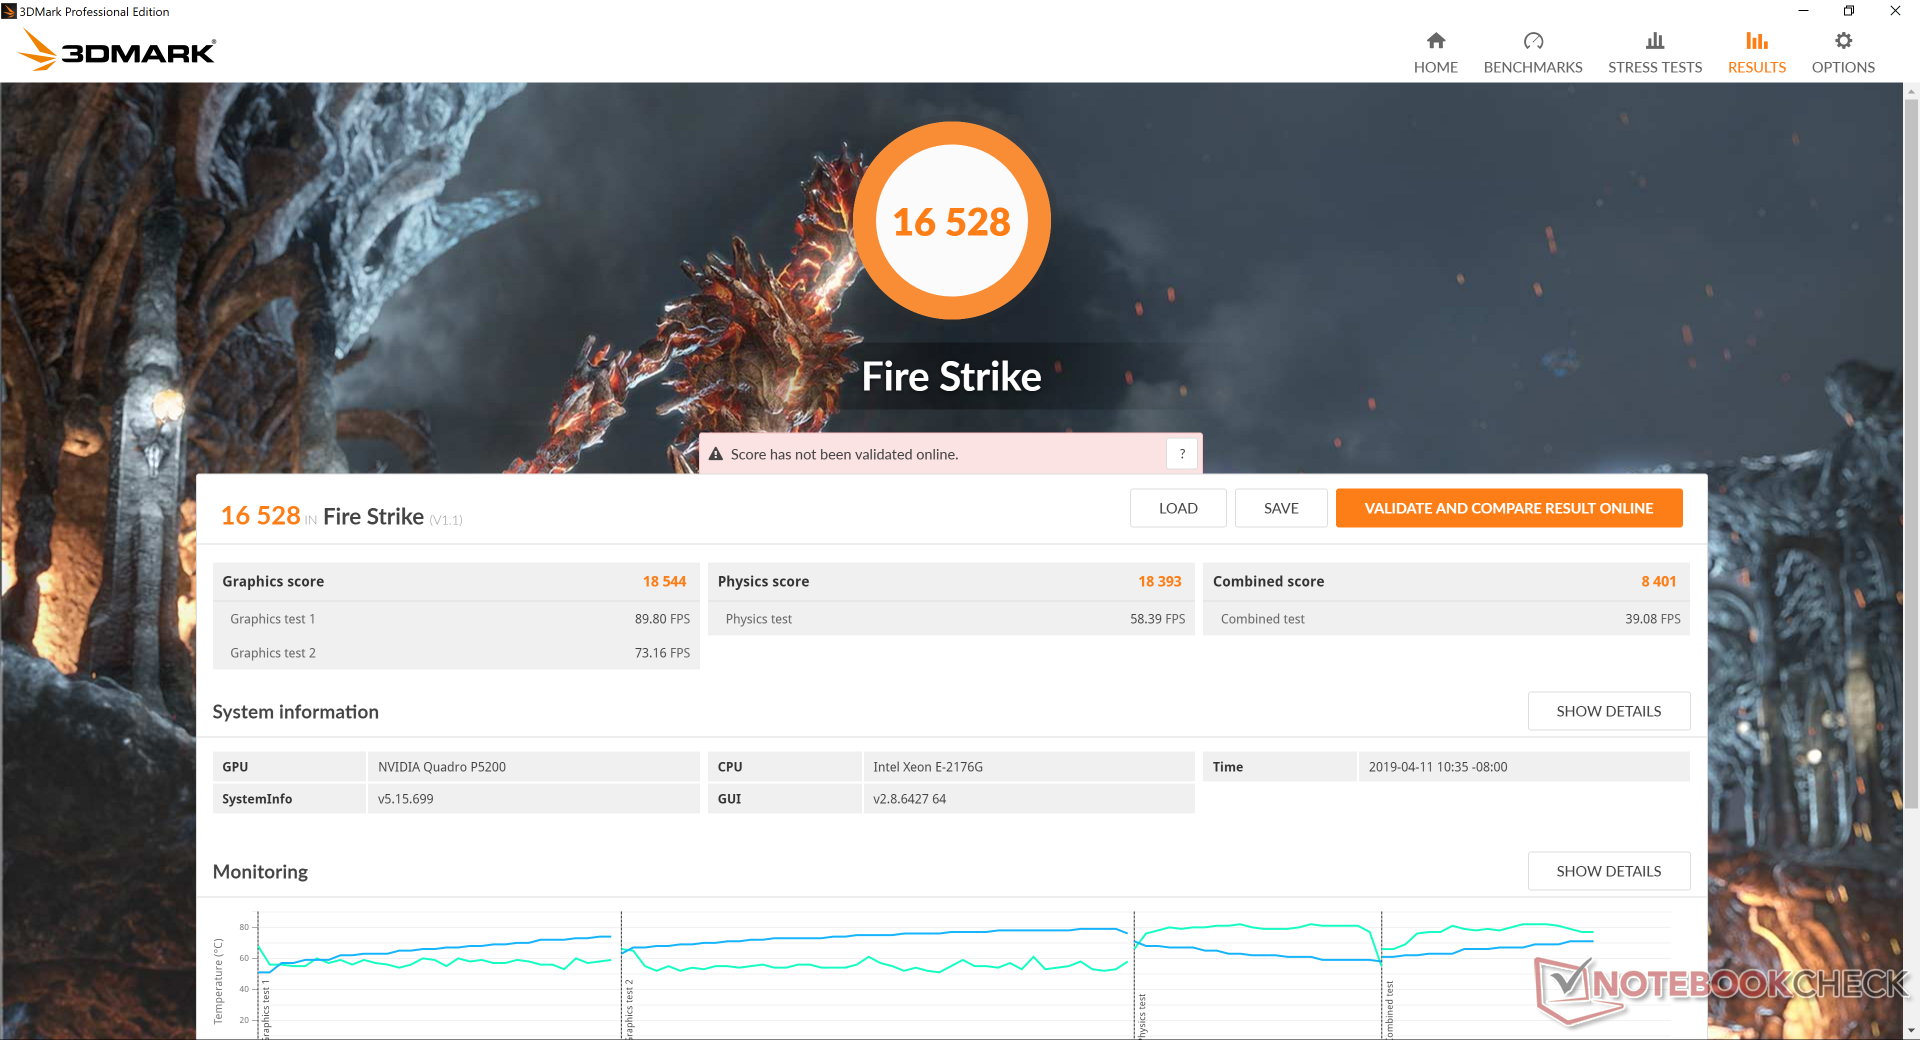
| 3DMark 11 Performance | 21204 points | |
| 3DMark Cloud Gate Standard Score | 39077 points | |
| 3DMark Fire Strike Score | 16528 points | |
| 3DMark Time Spy Score | 6580 points | |
Help | ||
| The Witcher 3 - 1920x1080 Ultra Graphics & Postprocessing (HBAO+) | |
| Eurocom Sky X9C | |
| Alienware Area-51m i9-9900K RTX 2080 | |
| AMD Threadripper 2970WX, AMD Radeon RX Vega 64 | |
| MSI GT75VR 7RF-012 Titan Pro | |
| MSI GS75 8SG Stealth | |
| MSI WT75 8SM | |
| Eurocom Tornado F7W | |
| Dell Precision 7720 | |
| Lenovo ThinkPad P72-20MB000EGE | |
| Lenovo ThinkPad P1-20MD002LUS | |
| Dell Precision 5530 2-in-1 | |
| MSI WT72-6QJ | |
| low | med. | high | ultra | 4K | |
|---|---|---|---|---|---|
| BioShock Infinite (2013) | 395 | 341.6 | 315.1 | ||
| The Witcher 3 (2015) | 327.2 | 228.7 | 120.2 | 66.7 | 47.2 |
| Rise of the Tomb Raider (2016) | 289 | 220.6 | 125.5 | 105.2 | 46.6 |
Emissions
System Noise
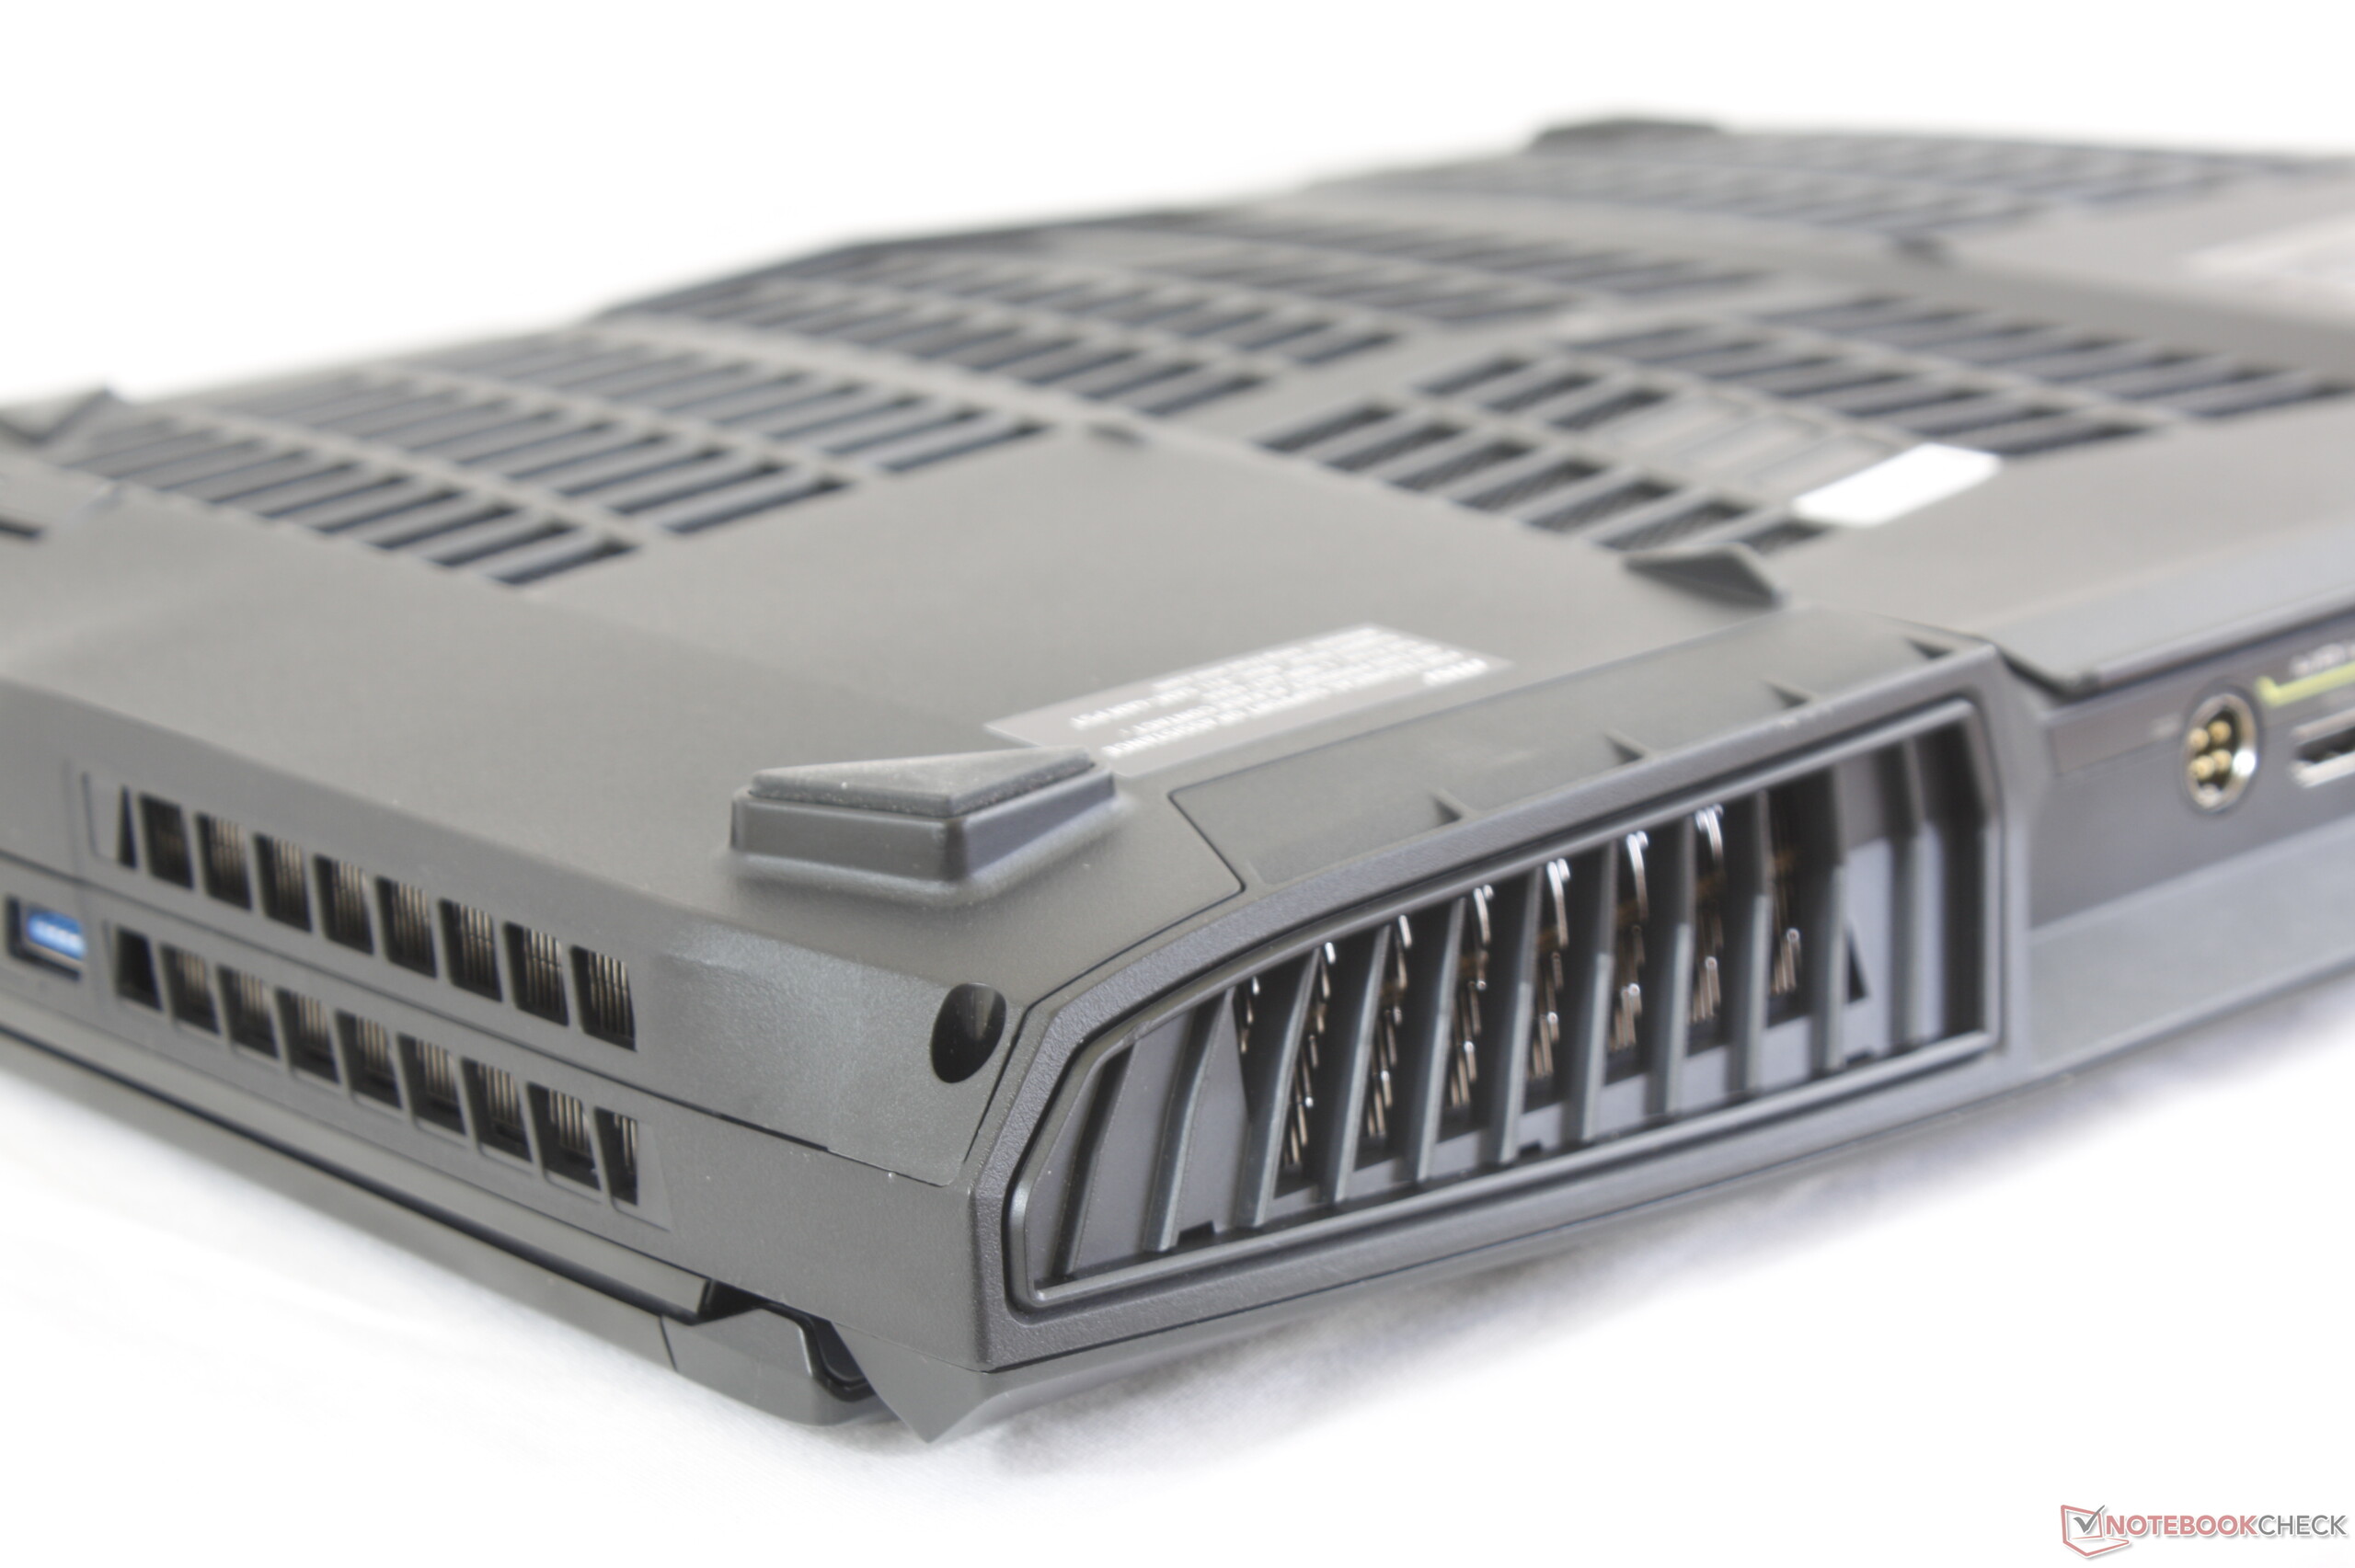
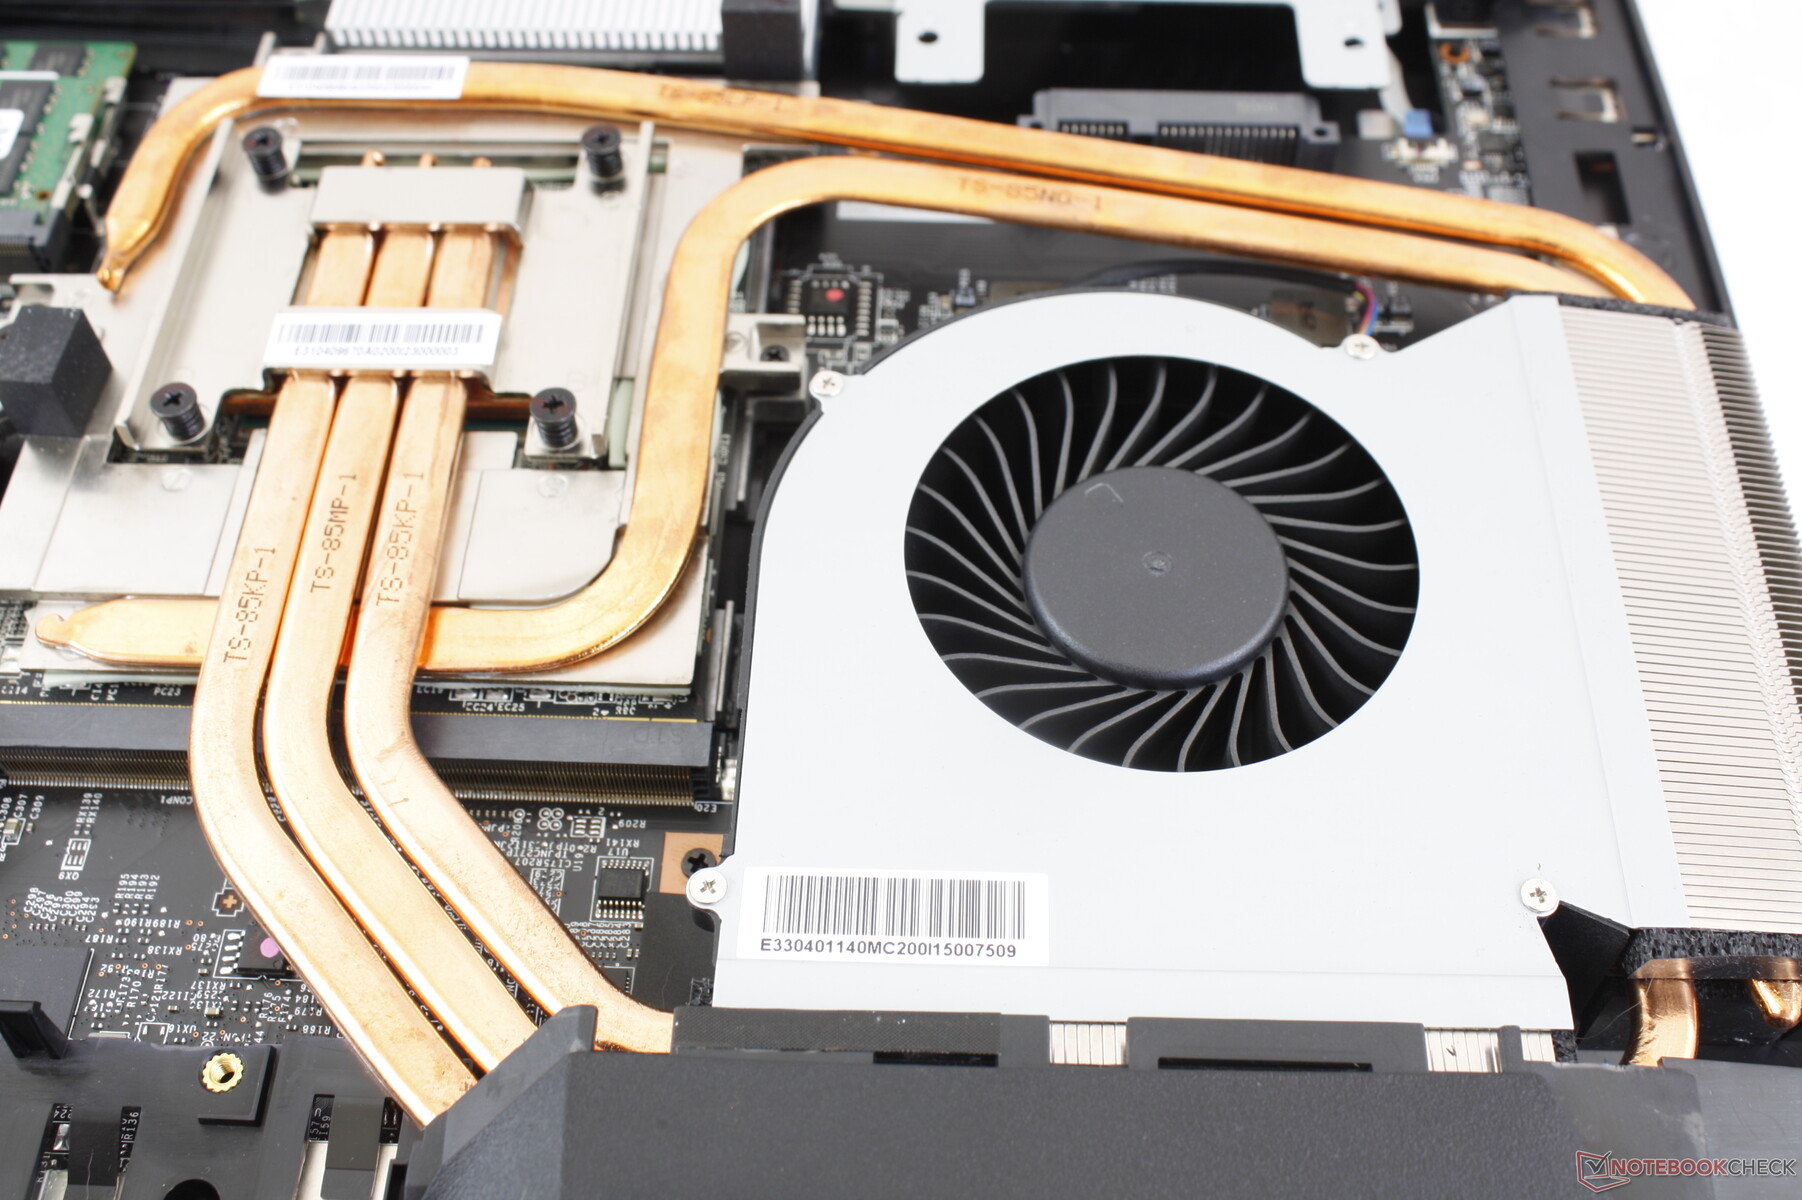
The WT75 has one of the largest cooling solutions we've seen on a laptop. Its twin 60 mm fans and ten heat pipes are over twice as large or long as any gaming laptop with Max-Q graphics. Even so, the fans will always be active at about 33.4 dB(A) no matter the processing load or power setting. The fans do not pulsate and are generally lethargic to changes in onscreen loads for a quiet word processing experience. Ambient office noise will be enough to drown out the fans during thee low loads.
When running demanding loads for longer periods, however, fan noise ramps up. Running Witcher 3 induces a fan noise of 51.4 W not unlike what we measured on the Alienware Area-51m. If Turbo Fan mode is engaged, then fan noise becomes fixed at 64 dB(A) no matter the load. In other words, the WT75 will be loud when under load but it's otherwise generally quiet during short bursts of low-medium loads.
We can notice no coil whine on our test unit.
| MSI WT75 8SM Quadro P5200, E-2176G, Samsung SSD PM981 MZVLB512HAJQ | Alienware Area-51m i9-9900K RTX 2080 GeForce RTX 2080 Mobile, i9-9900K, 2x SK Hynix PC400 512GB (RAID 0) | Fujitsu Celsius H980 Quadro P3200, i7-8750H, Samsung SSD PM981 MZVLB512HAJQ | Eurocom Tornado F7W Quadro P5200, i9-9900K, 3x Samsung SSD 970 Pro 512GB (RAID 0) | Dell Precision 7720 Quadro P5000, E3-1535M v6, Toshiba NVMe THNSN5512GPU7 | MSI WT72-6QM Quadro M5000M, E3-1505M v5, Toshiba NVMe THNSN5256GPU7 | |
|---|---|---|---|---|---|---|
| Noise | -7% | 6% | -5% | 11% | 4% | |
| off / environment * (dB) | 28.6 | 28.1 2% | 29.6 -3% | 28.2 1% | 29.5 -3% | |
| Idle Minimum * (dB) | 33.4 | 28.1 16% | 29.6 11% | 33.2 1% | 29.5 12% | 33.3 -0% |
| Idle Average * (dB) | 33.4 | 28.6 14% | 32.5 3% | 33.2 1% | 29.5 12% | 33.4 -0% |
| Idle Maximum * (dB) | 33.4 | 51 -53% | 32.5 3% | 33.2 1% | 29.5 12% | 33.5 -0% |
| Load Average * (dB) | 33.5 | 51 -52% | 34.9 -4% | 47 -40% | 35 -4% | 38.8 -16% |
| Witcher 3 ultra * (dB) | 51.4 | 51 1% | 52.2 -2% | 41 20% | ||
| Load Maximum * (dB) | 64 | 51 20% | 49.1 23% | 64 -0% | 47.8 25% | 40.2 37% |
* ... smaller is better
Noise level
| Idle |
| 33.4 / 33.4 / 33.4 dB(A) |
| Load |
| 33.5 / 64 dB(A) |
 | ||
30 dB silent 40 dB(A) audible 50 dB(A) loud |
||
min: | ||
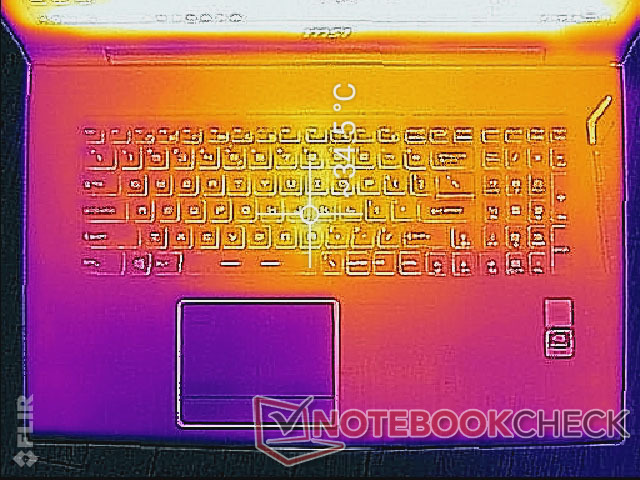
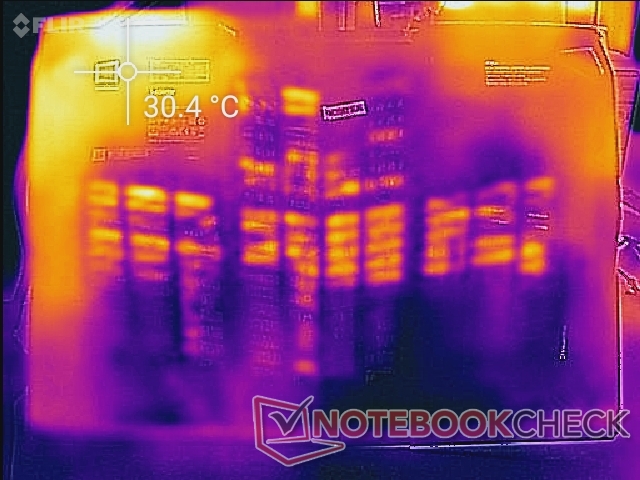
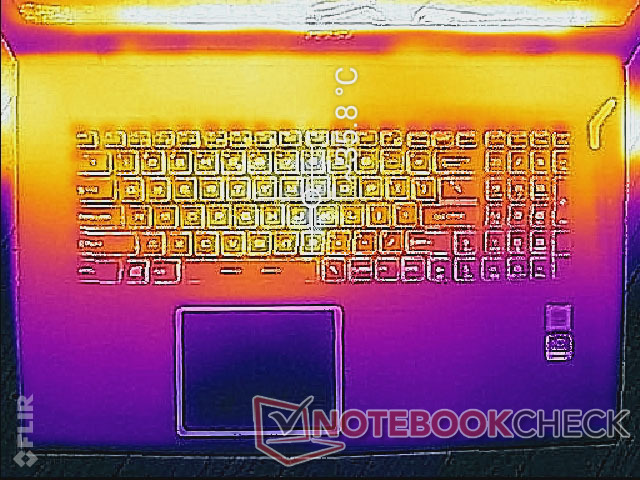
Temperature
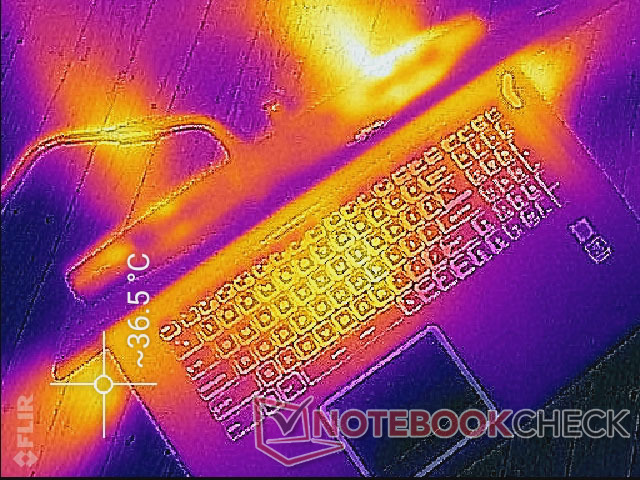
Surface temperatures are generally warmer on the top than the bottom when the system is idling. The center of the keyboard, for example, is 34 C compared to 31 C on the bottom corner. High loads like gaming do not impact surface temperatures nearly as much as ultra-thin gaming laptops or workstations like the MSI GS65 or Alienware m17.
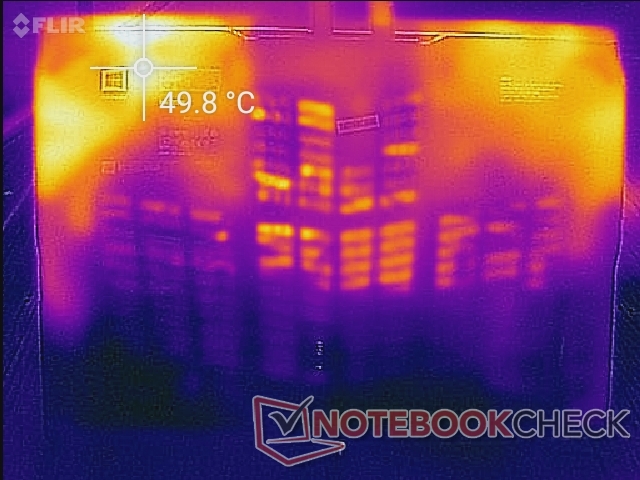
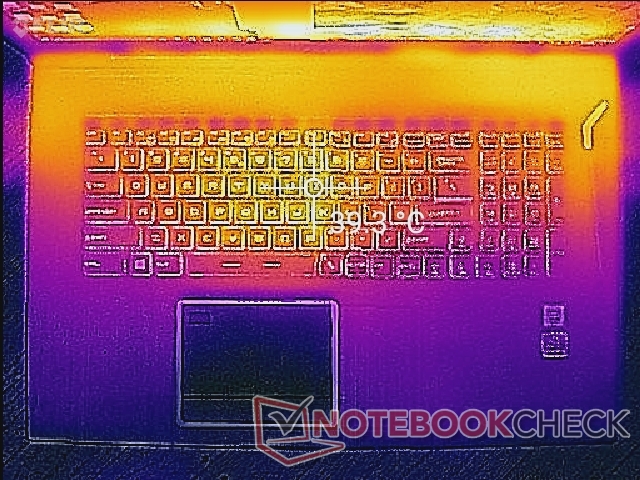
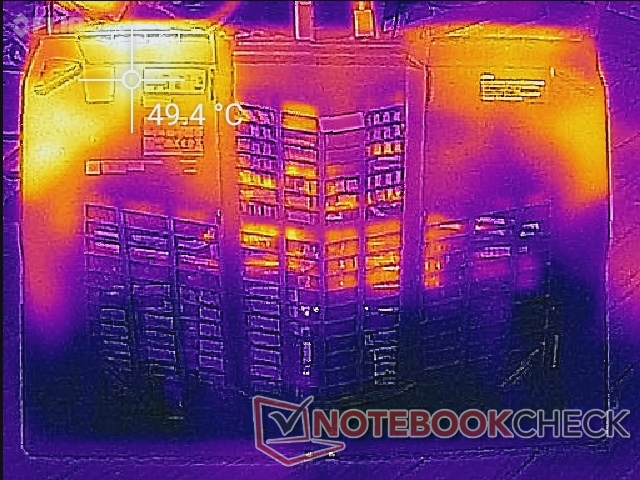
The palm rests, keyboard keys, and bottom surface of the WT75 remain fairly cool considering the demanding CPU and GPU within. The only notable hot spot is the 50 C surface near the bottom rear corner as shown by our temperature maps below. Thankfully, this spot is far away from user hands and palms.
Stress Test
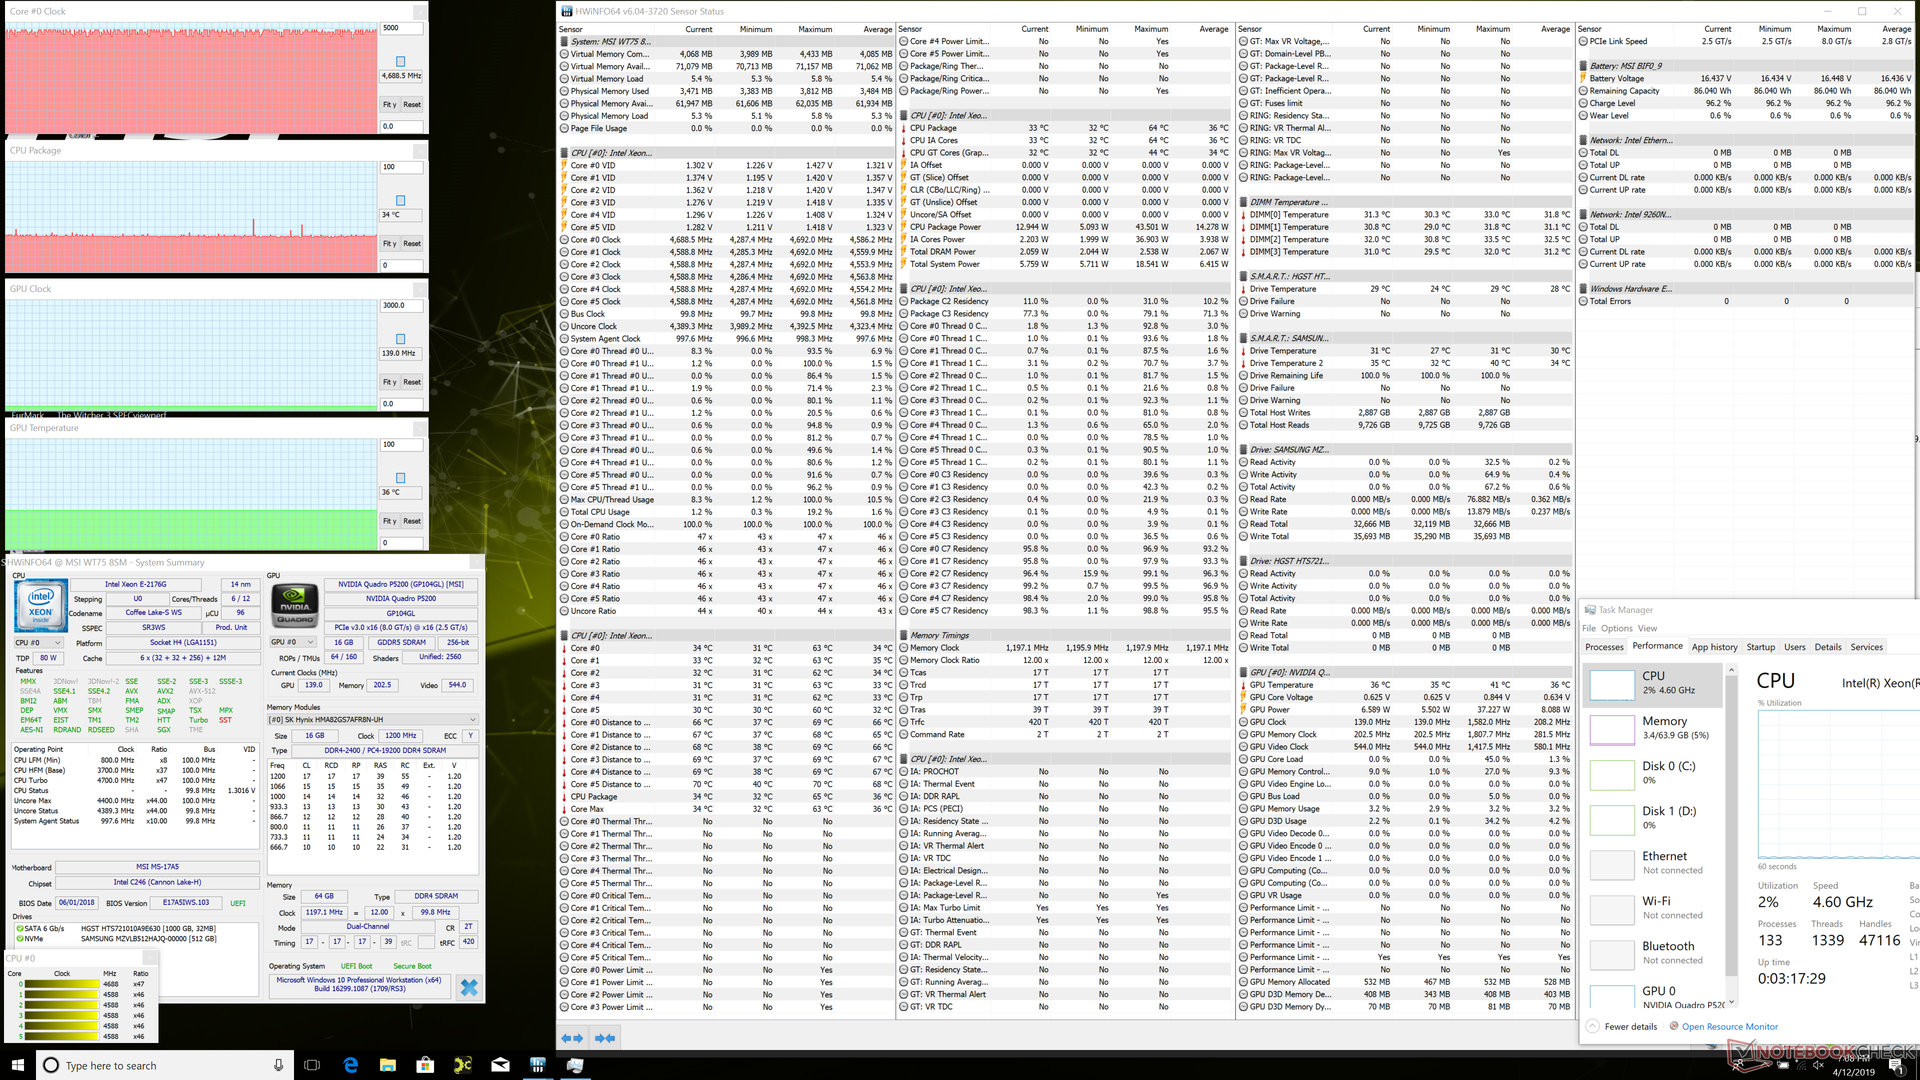
We stress the laptop with synthetic loads to identify for any potential throttling or stability issues. When subjected to Prime95, the CPU will run up to 4.3 GHz for the first 5 to 10 seconds before dropping and settling at the 3.7 to 3.8 GHz range. Since the base clock rate of the Xeon E-2176G is 3.7 GHz, it's disappointing that the Turbo Boost is very short-lived. Core temperature settles at about 80 C which makes us believe that MSI prioritized clock rate stability over higher core temperatures. We find this approach understandable when considering that this is a workstation. Even when under 100 percent utilization, however, CPU and GPU temperatures top out at only 83 C and 76 C, respectively. In comparison, the CPU and GPU of the Alienware Area-51m reach well over 90 C.
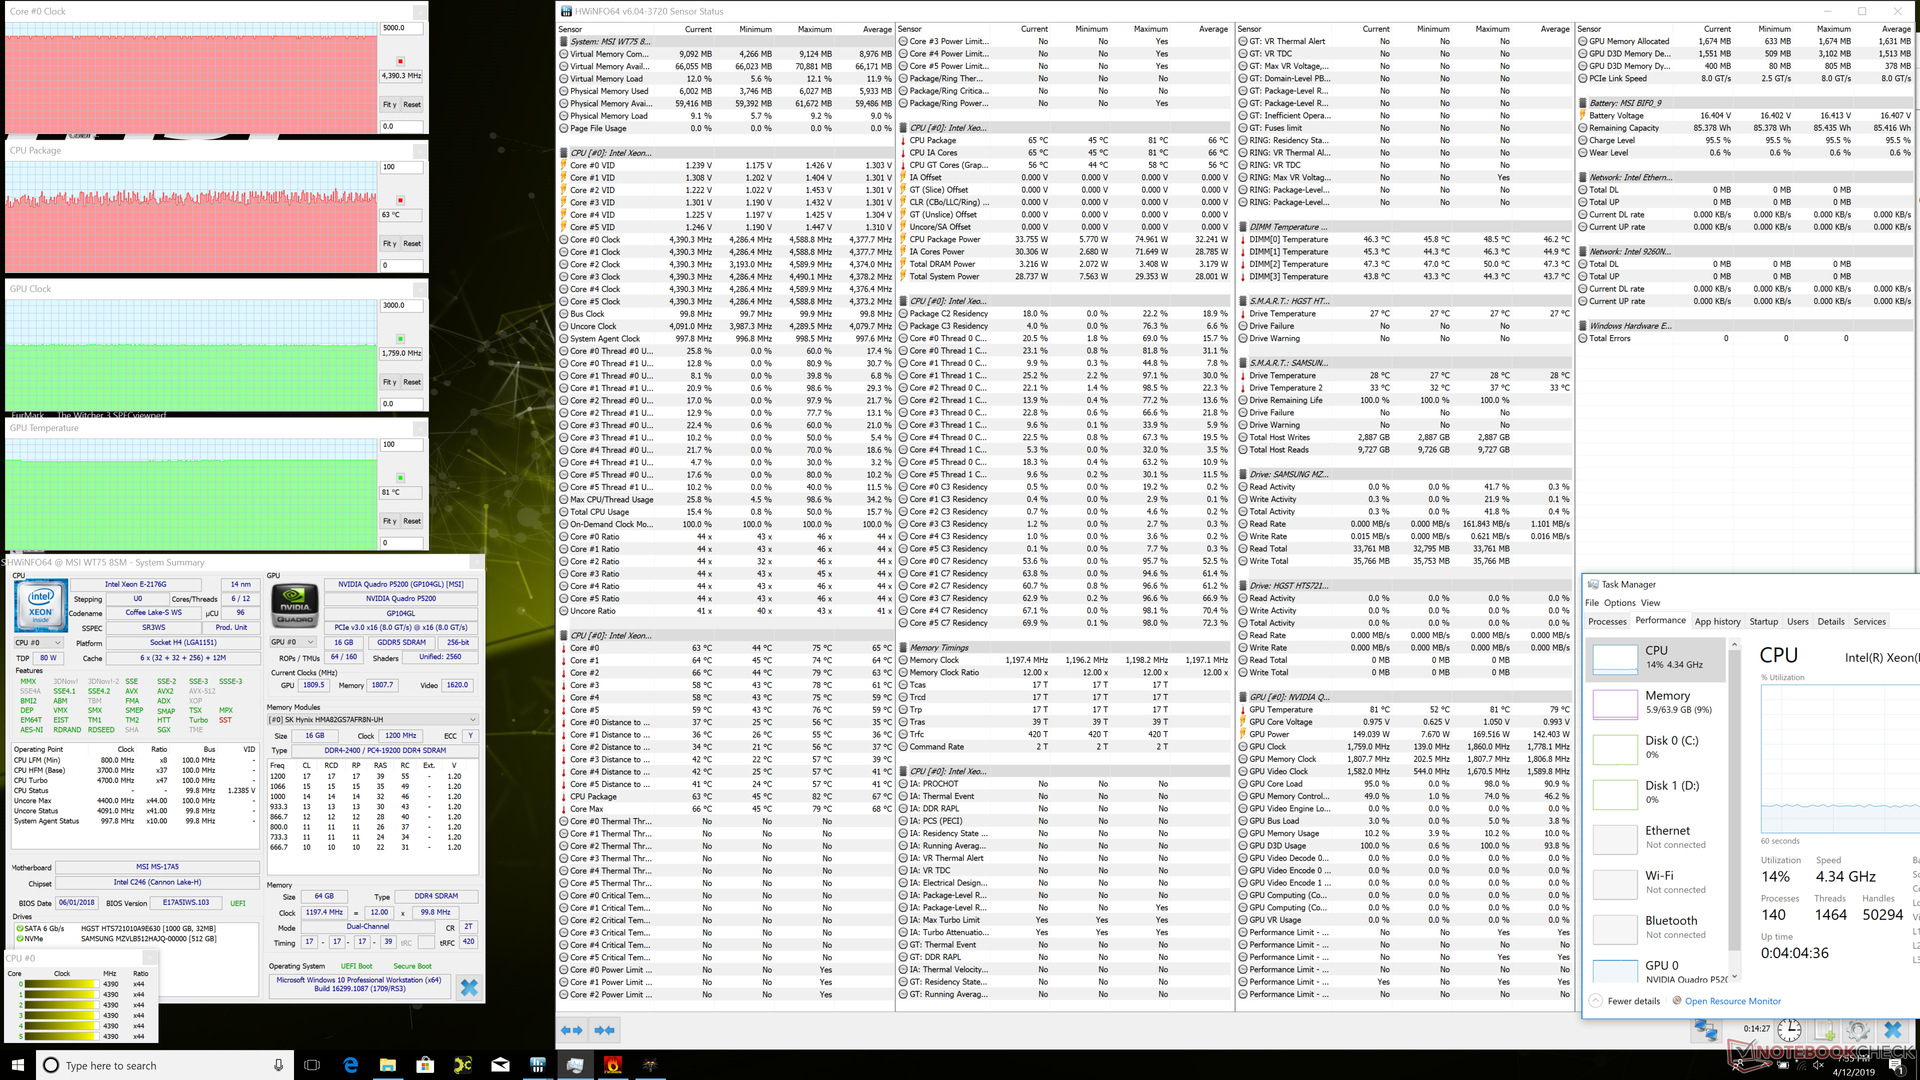
Witcher 3 stress is more representative of real-world load than the above synthetic conditions. CPU and GPU temperature become stable at 63 C and 81 C, respectively. Overall performance is reduced when running on battery power. A 3DMark Fire Strike run on batteries returns Physics and Graphics scores of 11695 and 4695 points, respectively, compared to 18393 and 18544 points when on mains.
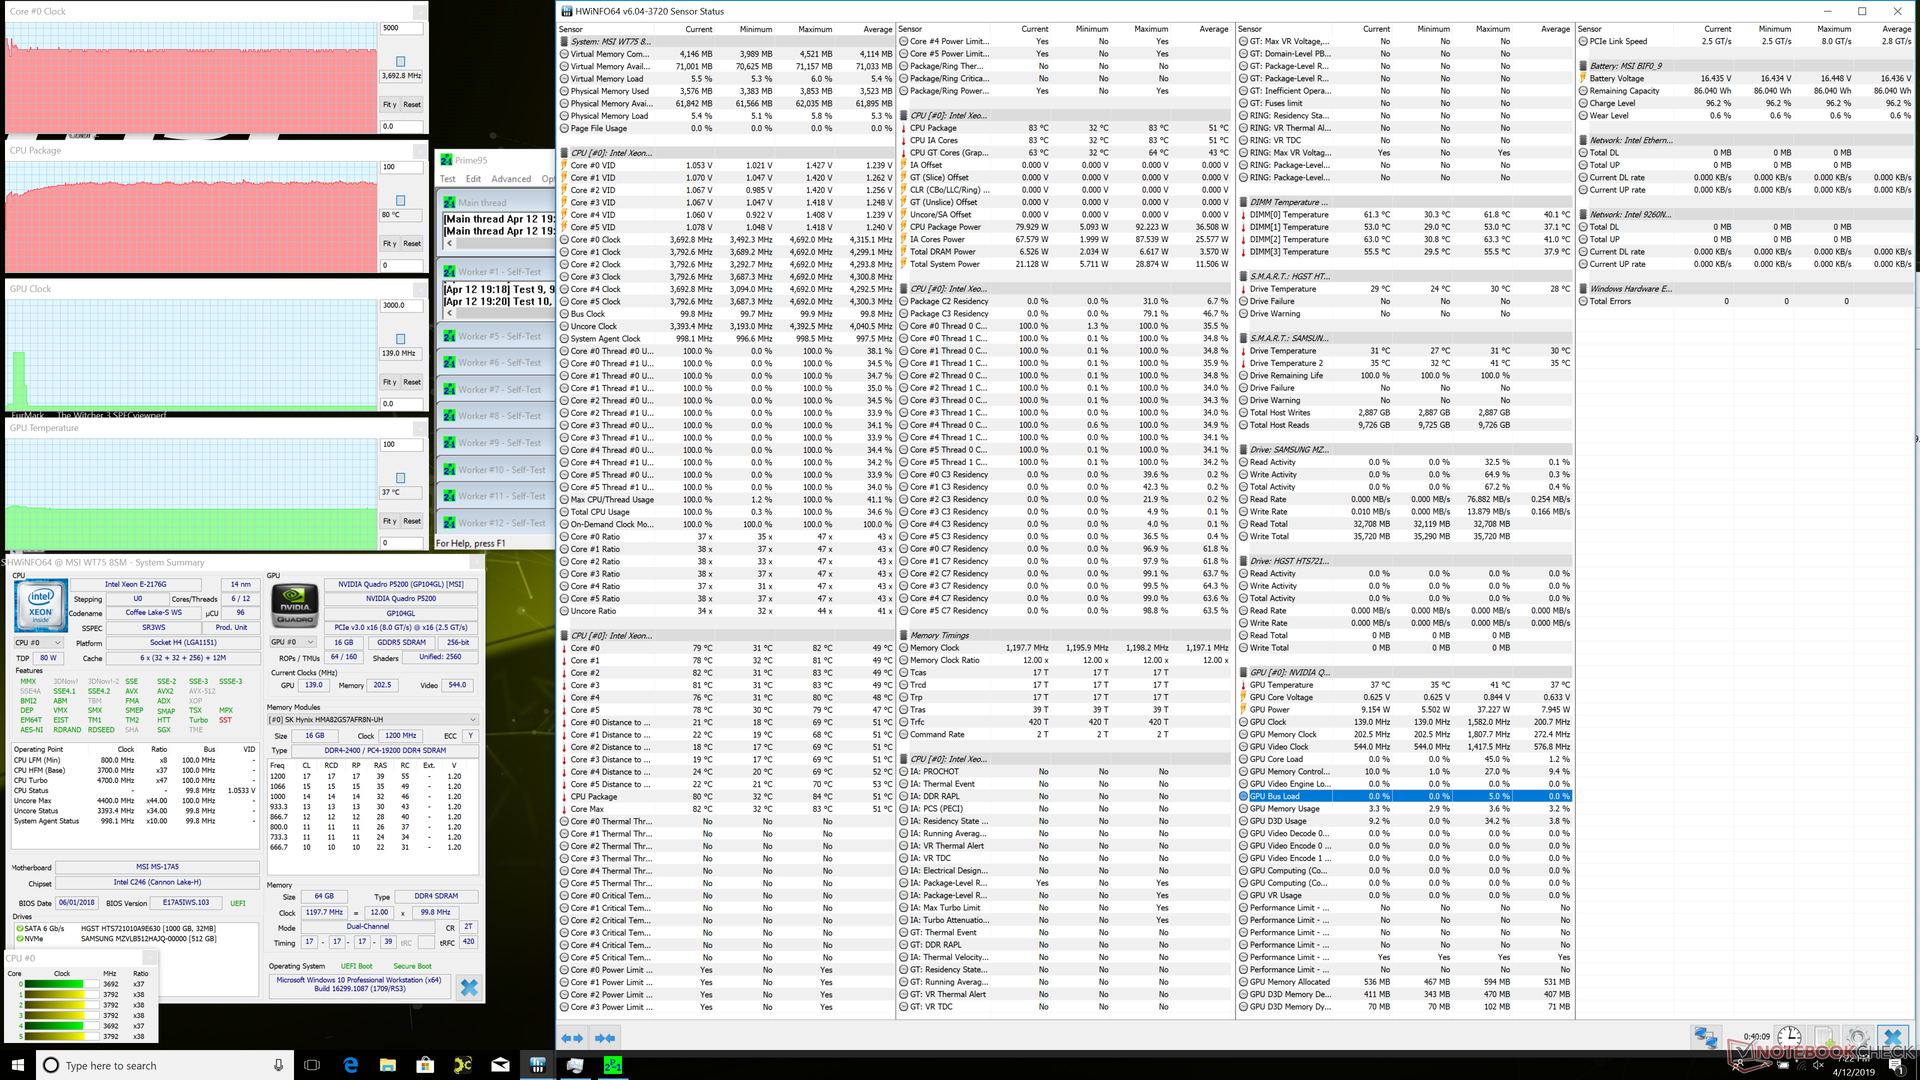
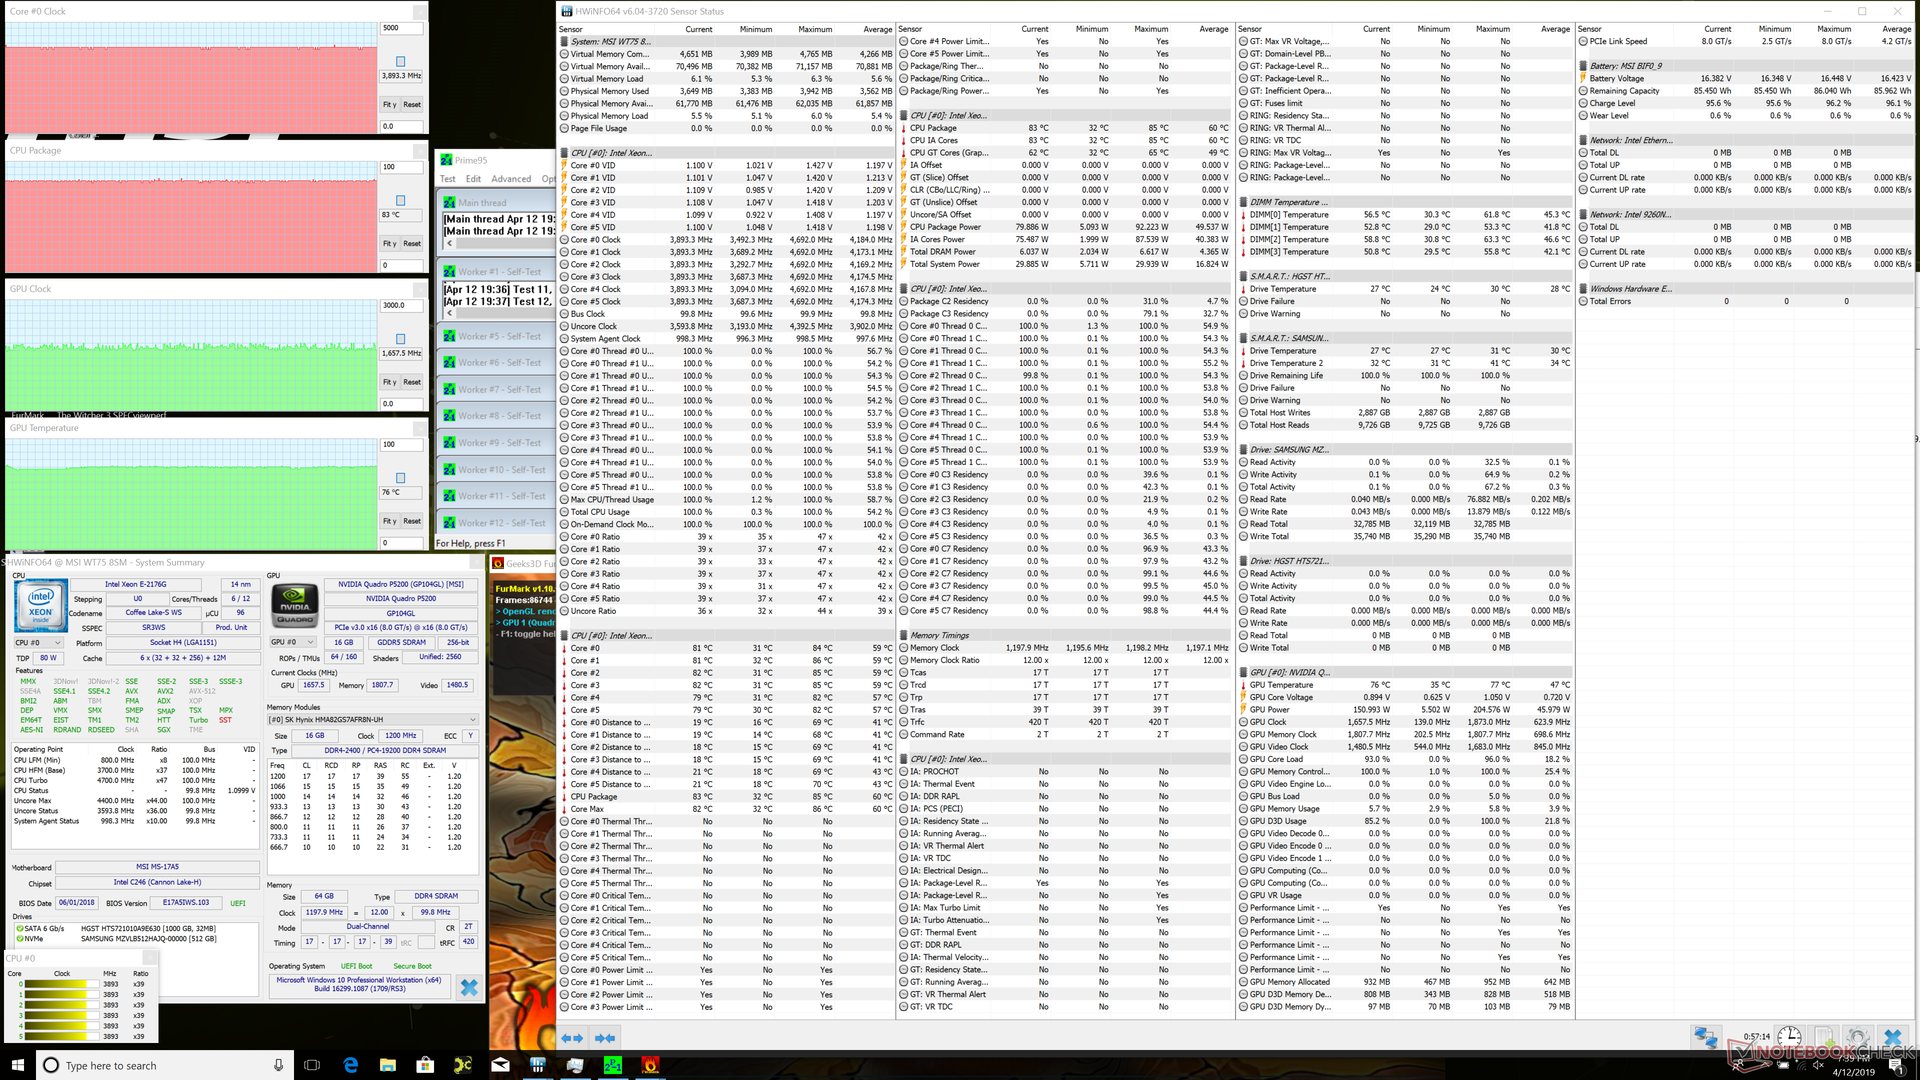
| CPU Clock (GHz) | GPU Clock (MHz) | Average CPU Temperature (°C) | Average GPU Temperature (°C) | |
| System Idle | -- | -- | 34 | 36 |
| Prime95 Stress | 3.7 - 3.8 | -- | 80 | -- |
| Prime95 + FurMark Stress | 3.9 | 1657 | 83 | 76 |
| Witcher 3 Stress | 4.4 | 1759 | 63 | 81 |
(+) The maximum temperature on the upper side is 39.2 °C / 103 F, compared to the average of 38.2 °C / 101 F, ranging from 22.2 to 69.8 °C for the class Workstation.
(-) The bottom heats up to a maximum of 49.2 °C / 121 F, compared to the average of 41.1 °C / 106 F
(+) In idle usage, the average temperature for the upper side is 28.9 °C / 84 F, compared to the device average of 32 °C / 90 F.
(+) Playing The Witcher 3, the average temperature for the upper side is 28.1 °C / 83 F, compared to the device average of 32 °C / 90 F.
(+) The palmrests and touchpad are cooler than skin temperature with a maximum of 27.4 °C / 81.3 F and are therefore cool to the touch.
(±) The average temperature of the palmrest area of similar devices was 27.8 °C / 82 F (+0.4 °C / 0.7 F).
Speakers


MSI WT75 8SM audio analysis
(±) | speaker loudness is average but good (81.3 dB)
Bass 100 - 315 Hz
(±) | reduced bass - on average 11.7% lower than median
(±) | linearity of bass is average (10.1% delta to prev. frequency)
Mids 400 - 2000 Hz
(+) | balanced mids - only 4% away from median
(±) | linearity of mids is average (7.8% delta to prev. frequency)
Highs 2 - 16 kHz
(±) | higher highs - on average 6.1% higher than median
(±) | linearity of highs is average (7.6% delta to prev. frequency)
Overall 100 - 16.000 Hz
(±) | linearity of overall sound is average (18.3% difference to median)
Compared to same class
» 60% of all tested devices in this class were better, 10% similar, 30% worse
» The best had a delta of 7%, average was 17%, worst was 35%
Compared to all devices tested
» 40% of all tested devices were better, 8% similar, 52% worse
» The best had a delta of 4%, average was 23%, worst was 134%
Apple MacBook 12 (Early 2016) 1.1 GHz audio analysis
(+) | speakers can play relatively loud (83.6 dB)
Bass 100 - 315 Hz
(±) | reduced bass - on average 11.3% lower than median
(±) | linearity of bass is average (14.2% delta to prev. frequency)
Mids 400 - 2000 Hz
(+) | balanced mids - only 2.4% away from median
(+) | mids are linear (5.5% delta to prev. frequency)
Highs 2 - 16 kHz
(+) | balanced highs - only 2% away from median
(+) | highs are linear (4.5% delta to prev. frequency)
Overall 100 - 16.000 Hz
(+) | overall sound is linear (10.2% difference to median)
Compared to same class
» 7% of all tested devices in this class were better, 2% similar, 90% worse
» The best had a delta of 5%, average was 18%, worst was 53%
Compared to all devices tested
» 5% of all tested devices were better, 1% similar, 94% worse
» The best had a delta of 4%, average was 23%, worst was 134%
Energy Management
Power Consumption
Power consumption is very similar to the Eurocom Tornado F7W equipped with the same Quadro P5200 GPU. Idling on desktop demands 29 W to 40 W depending on the brightness and power profile. For comparison's sake, a typical Ultrabook like the Samsung Notebook 9 NP930QAA demands 39 W maximum at the very most.
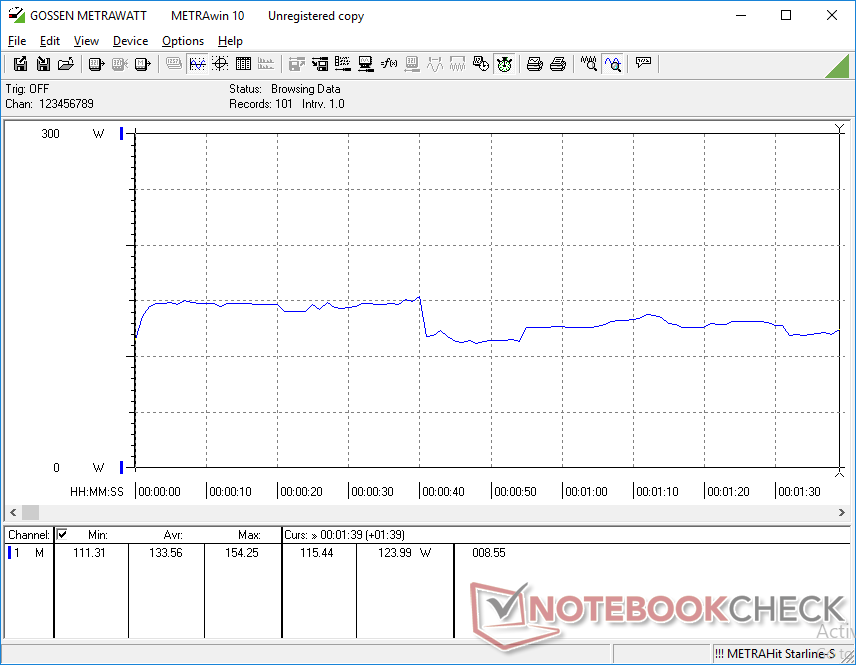
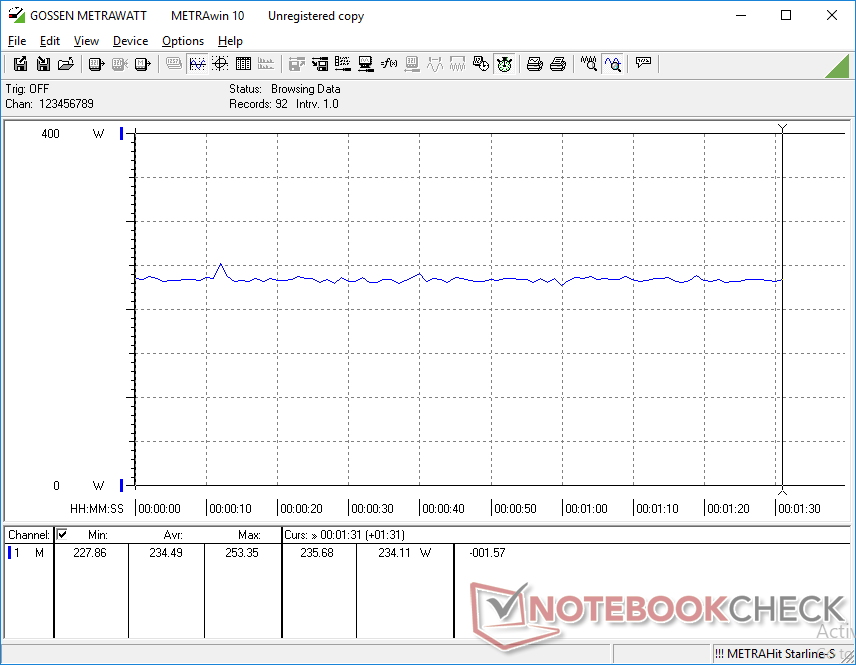
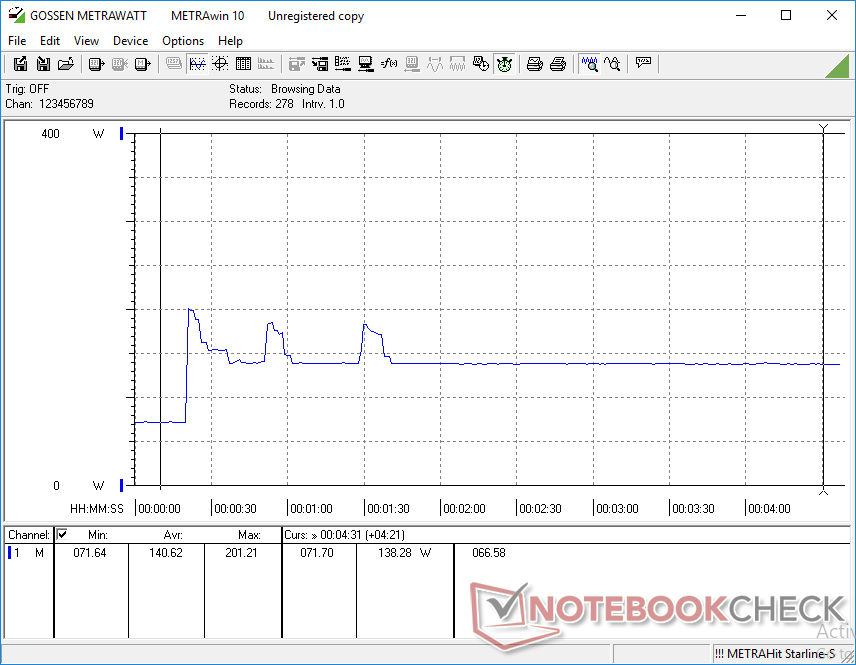
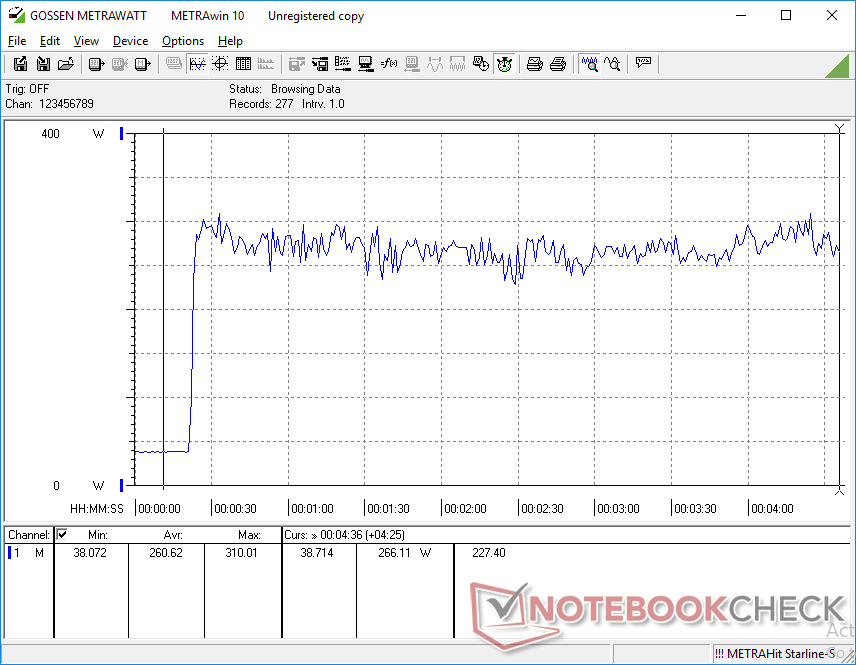
We're able to record a maximum draw of 310 W from the very large (~20 x 10 x 4.4 cm) 330 AC adapter when running both Prime95 and FurMark simultaneously. When running only Prime95, consumption will spike up to 201 W before eventually stabilizing at 138 W as shown by our screenshot below. It's worth noting that a very similar 330 W AC adapter also ships with the MSI Trident 3 GTX 1070.
| Off / Standby | |
| Idle | |
| Load |
|
Key:
min: | |
| MSI WT75 8SM E-2176G, Quadro P5200, Samsung SSD PM981 MZVLB512HAJQ, IPS, 3840x2160, 17.3" | Alienware Area-51m i9-9900K RTX 2080 i9-9900K, GeForce RTX 2080 Mobile, 2x SK Hynix PC400 512GB (RAID 0), IPS, 1920x1080, 17.3" | Fujitsu Celsius H980 i7-8750H, Quadro P3200, Samsung SSD PM981 MZVLB512HAJQ, IPS, 1920x1080, 17.3" | Eurocom Tornado F7W i9-9900K, Quadro P5200, 3x Samsung SSD 970 Pro 512GB (RAID 0), IPS, 3840x2160, 17.3" | Dell Precision 7720 E3-1535M v6, Quadro P5000, Toshiba NVMe THNSN5512GPU7, IGZO, 3840x2160, 17.3" | MSI WT72-6QM E3-1505M v5, Quadro M5000M, Toshiba NVMe THNSN5256GPU7, IPS, 1920x1080, 17.3" | |
|---|---|---|---|---|---|---|
| Power Consumption | -9% | 39% | -0% | 43% | 23% | |
| Idle Minimum * (Watt) | 29 | 23.3 20% | 14.8 49% | 28.5 2% | 9.6 67% | 24.8 14% |
| Idle Average * (Watt) | 37.1 | 33.5 10% | 20.4 45% | 36.7 1% | 20.5 45% | 29.7 20% |
| Idle Maximum * (Watt) | 39.5 | 38.4 3% | 21.5 46% | 37.8 4% | 22.9 42% | 30.1 24% |
| Load Average * (Watt) | 133.6 | 114.1 15% | 98.4 26% | 144.6 -8% | 96.8 28% | 105.2 21% |
| Witcher 3 ultra * (Watt) | 236.3 | 339.5 -44% | 218.9 7% | |||
| Load Maximum * (Watt) | 310 | 485.1 -56% | 213.5 31% | 336 -8% | 202.1 35% | 192.2 38% |
* ... smaller is better
Battery Life
MSI has upped the battery capacity from 75 Wh on the GT75 to 90 Wh for the WT75. Nonetheless, Runtimes from the WT75 are close to what we've recorded on the GT75 as the more demanding Xeon CPU offsets the higher battery capacity. Users can expect just 3 to 4 hours of real-world WLAN use.
Charging from empty to full capacity is slower than usual. The system takes 2.5 to 3 hours to fully charge compared to 1.5 to 2 hours on most other laptops.
| MSI WT75 8SM E-2176G, Quadro P5200, 90 Wh | Alienware Area-51m i9-9900K RTX 2080 i9-9900K, GeForce RTX 2080 Mobile, 90 Wh | Fujitsu Celsius H980 i7-8750H, Quadro P3200, 96 Wh | Eurocom Tornado F7W i9-9900K, Quadro P5200, 90 Wh | Dell Precision 7720 E3-1535M v6, Quadro P5000, 91 Wh | MSI WT72-6QM E3-1505M v5, Quadro M5000M, Wh | |
|---|---|---|---|---|---|---|
| Battery runtime | -29% | 126% | -19% | 85% | 31% | |
| Reader / Idle (h) | 4 | 2.6 -35% | 13.5 238% | 11.4 185% | 6.9 73% | |
| WiFi v1.3 (h) | 3.7 | 2.1 -43% | 8.3 124% | 3 -19% | 6.3 70% | 4.1 11% |
| Load (h) | 1.2 | 1.1 -8% | 1.4 17% | 1.2 0% | 1.3 8% |
Pros
Cons
Verdict
The biggest reason to own an MSI WT75 over other workstations is its ease of serviceability. Its five storage bays, four SODIMM slots, and removable CPU and GPU all give the laptop longer legs when compared to the more "fixed" nature of Lenovo, HP, or Dell solutions. If you plan on tinkering with your workstation often, then the WT75 should serve you well.
Performance is good with reasonable core temperatures of ~80 C and no throttling when under 100 percent utilization. It's too bad, however, that the Xeon CPU is unable to run at Turbo Boost clock rates for extended periods. Expect the CPU to only run just slightly above its base clock rate when under extreme processing stress.
Warranty is another factor to consider. MSI can't quite match the wide array of warranty and service options when compared to the likes of the Lenovo ThinkPad P Series, HP ZBook, or Dell Precision who have the advantage in economies of scale. Again, you should be comfortable servicing the WT75 yourself if need be.
Other smaller complaints are more minor. Audio quality is likely better than what most workstation users would need and the same goes for the extra audio jacks. The 4K UHD panel looks a bit grainy, the rear ports are difficult to see, the lid and hinges could be stiffer, and the overall system is quite large even for a 17-inch laptop. Core performance and serviceability are otherwise superior to what you'll find from the big name OEMs.
Powerful, expandable, and unapologetically thick - The beastly MSI WT75 works best for power users who want the freedom to easily service as many parts of a mobile workstation as possible.
MSI WT75 8SM
- 01/08/2020 v7 (old)
Allen Ngo
Price comparison
