Eurocom Tornado F7W (i9-9900K, Quadro P5200) Workstation Review
")
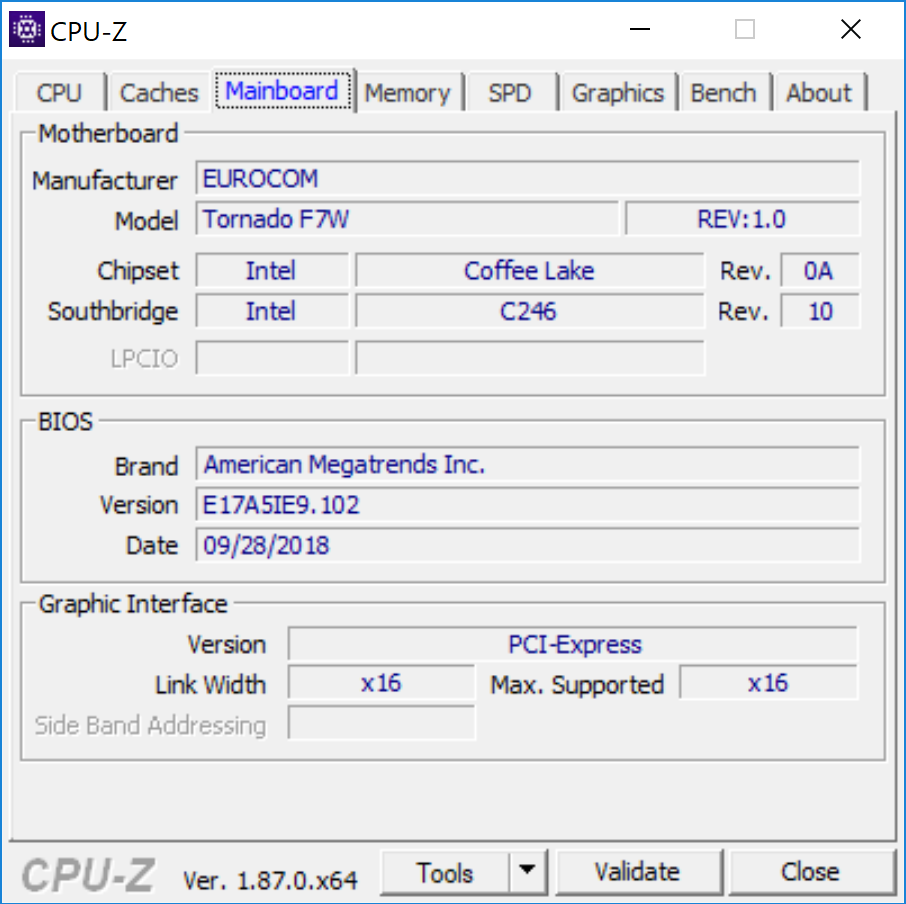
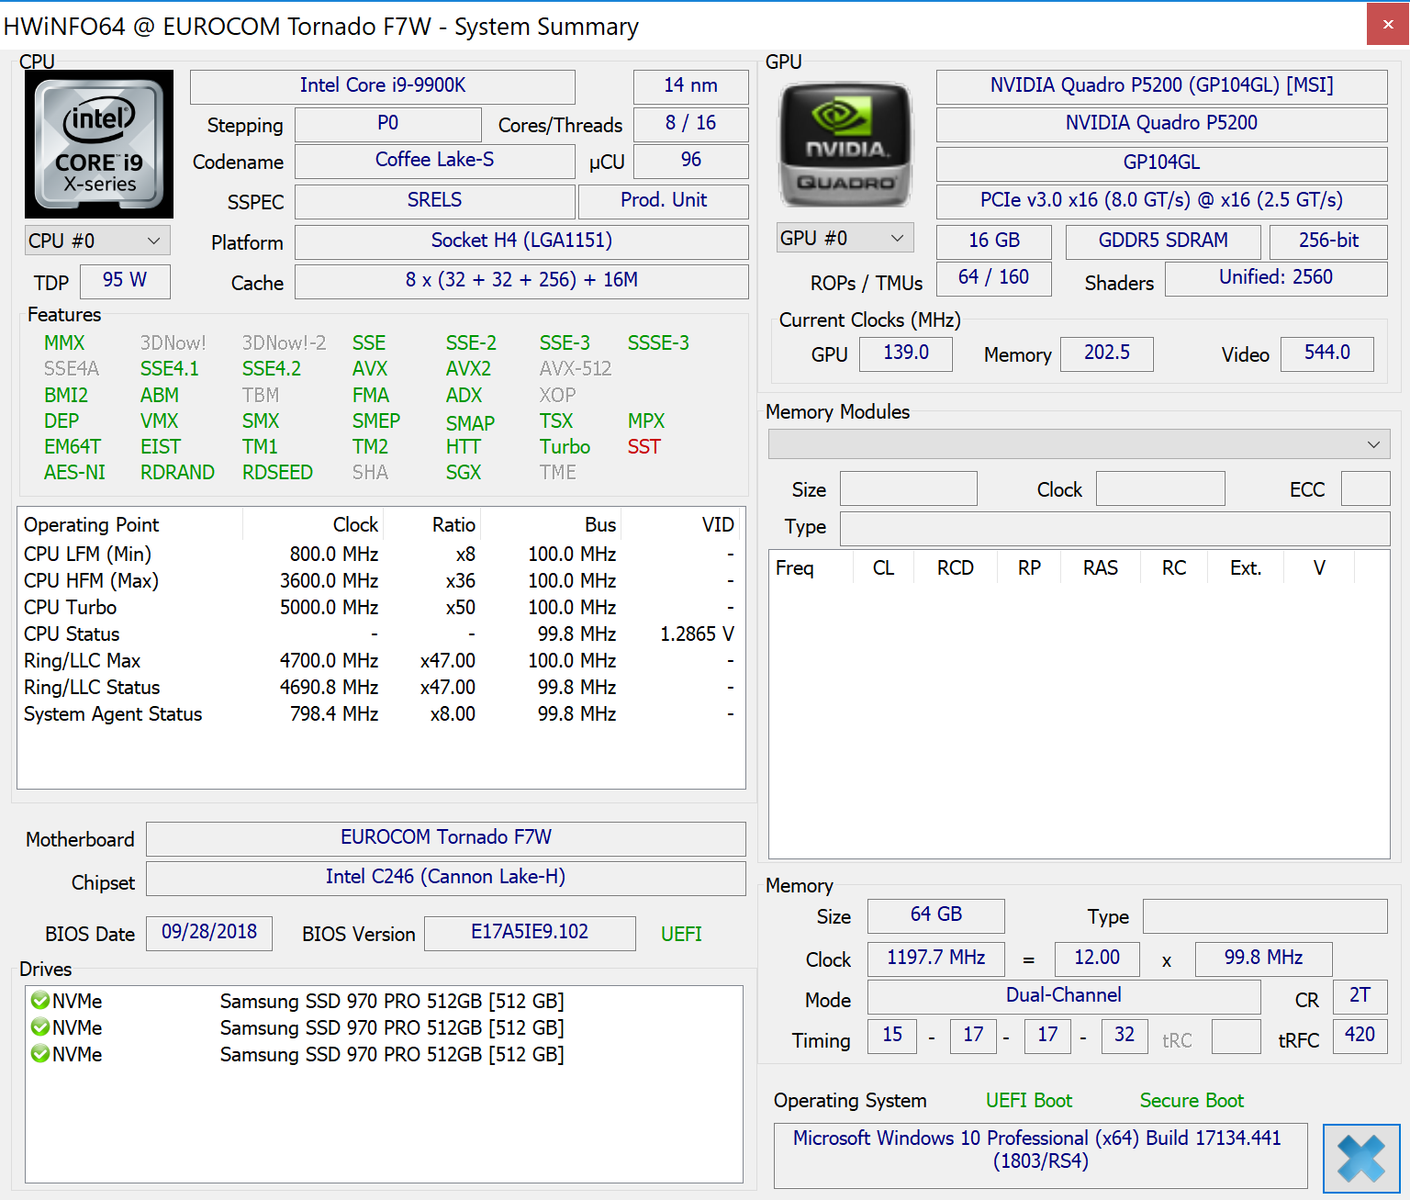
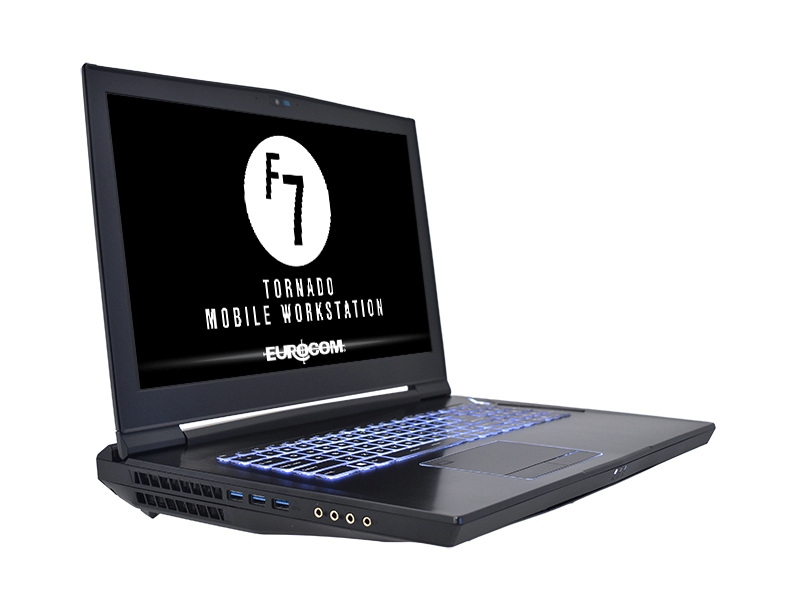
The Eurocom Tornado F7W mobile workstation is the 17.3-inch version of the 15.6-inch Tornado F5W we checked out late last year. Like most Eurocom laptops, the F7W is packed to the brim with the latest hardware features and a wide array of options. Users can choose to go simple with a "basic" Core i7-8700 CPU, Quadro P3000 GPU, and a 120 Hz FHD display or go all out for the Core i9-9900K, Quadro P5200 GPU, and 4K UHS option. RAM can be configured up to 128 GB across four SODIMM slots as initially promised by the reseller. Xeon processors and ECC RAM are also available for added performance stability. We recommend checking out the product page here for the full list of customizable features.
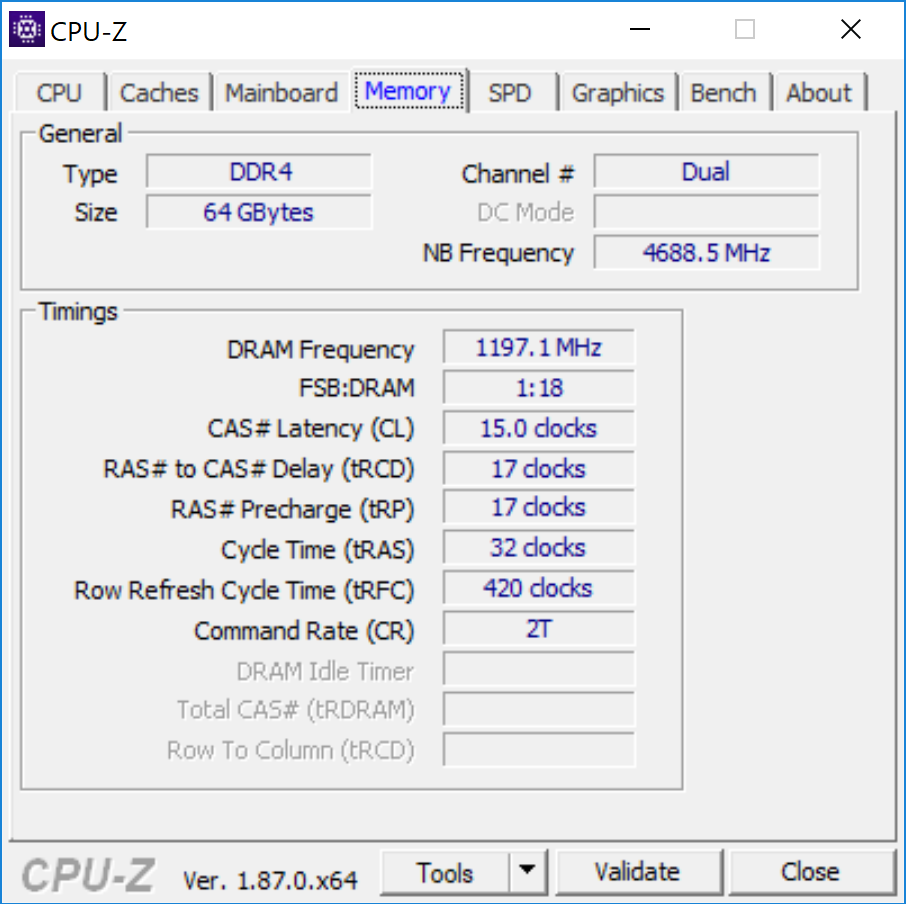
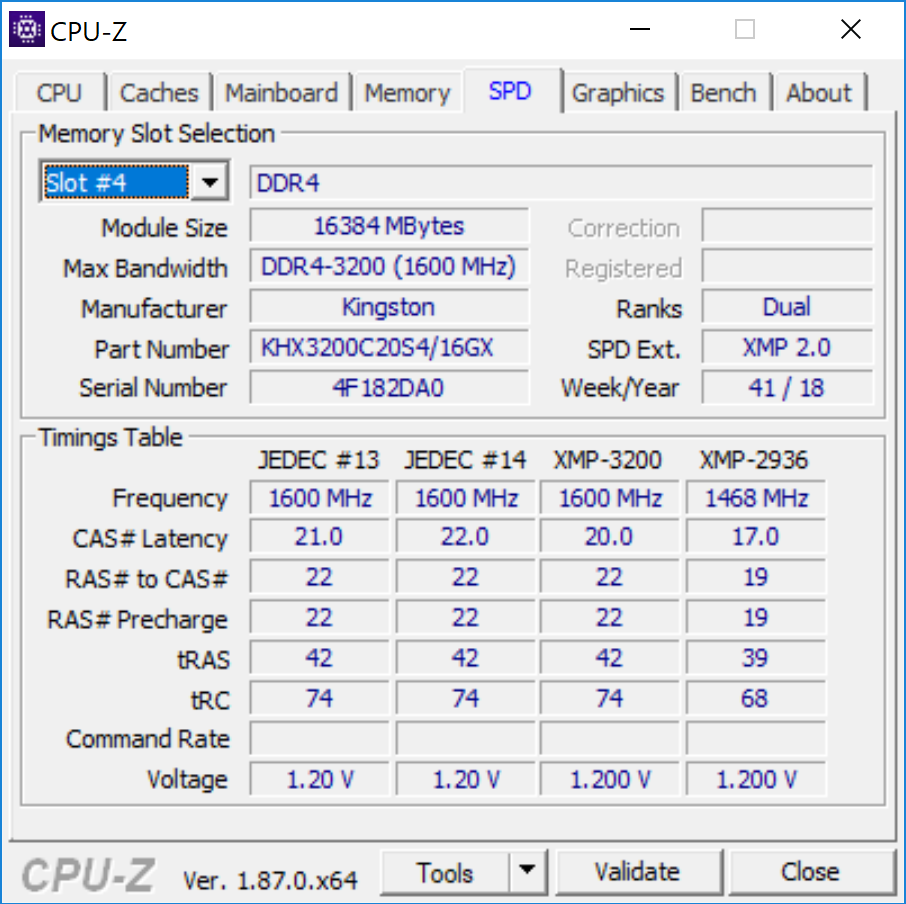
Our test unit today is a high-end configuration retailing for about $7000 USD. Much of the price markup can be attributed to the 3x Samsung SSD 970 PRO SSDs and 64 GB of DDR4 RAM on our unit, so it's possible to get the system for much less by dialing down the storage and RAM. Competitors in the 17.3-inch workstation category include the Dell Precision 7720, Lenovo ThinkPad P71/P72, and the HP ZBook 17 series. Unlike these alternatives, however, the Eurocom is more powerful, serviceable, and upgradeable all in one.
More Eurocom reviews:
Case
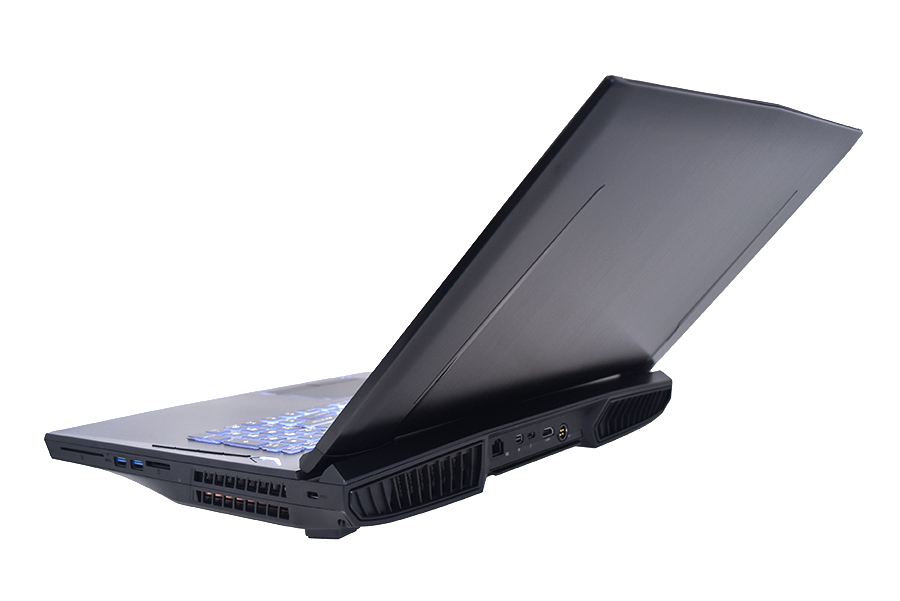
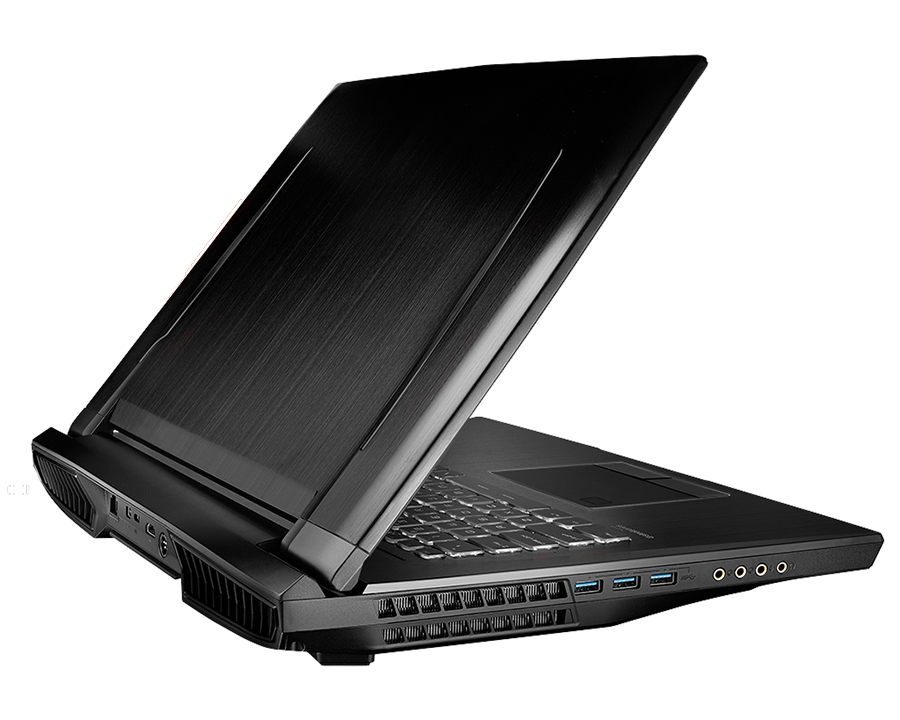
The Tornado F7W is a very large 17.3-inch laptop even by Eurocom standards. The Sky X9C with its GeForce GTX 1080 SLI graphics somehow manages to be smaller than the F7W. It's a thick laptop with dimensions close to that of the Asus ROG G703 but still smaller than the MSI GT75VR. To Eurocom's credit, the system is at least lighter than these aforementioned gaming laptops by several hundred grams.
The design and quality of the chassis are what we've come to expect from Eurocom and Clevo systems. Thus, many of our existing comments on previous Eurocom systems still apply here. The base is rigid with almost no creaking and the new oversized hinges are an improvement over the small hinges of most MSI laptops. We still believe the lid could be stiffer as it feels more flexible than the lids of the Alienware 17, Razer Blade Pro, and the narrow-bezel Asus ROG GL704.
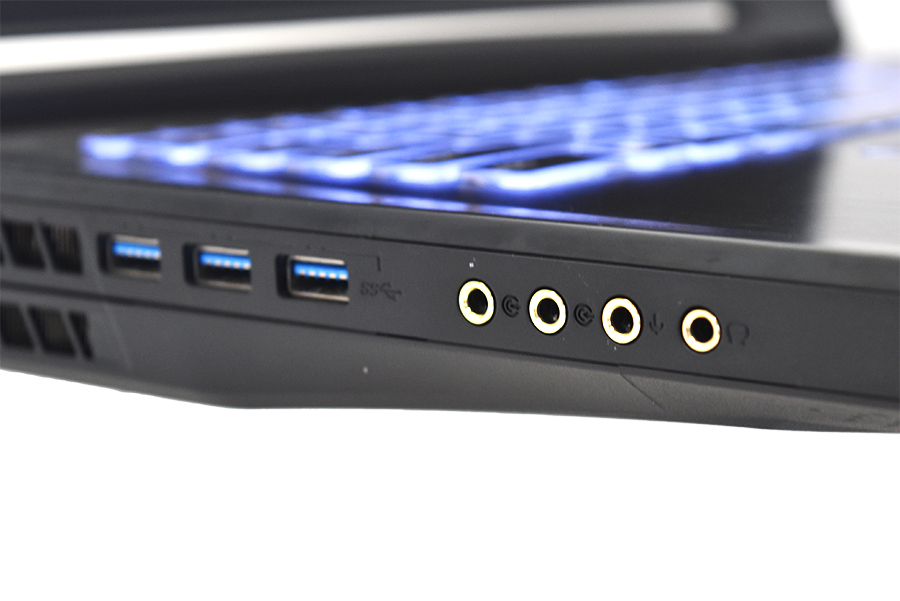
Connectivity
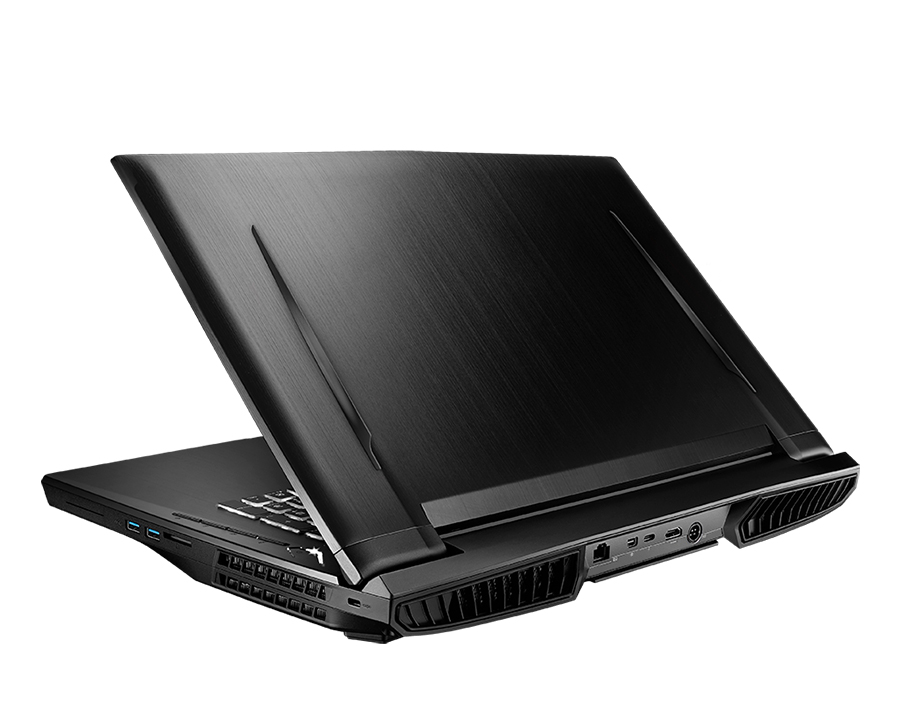
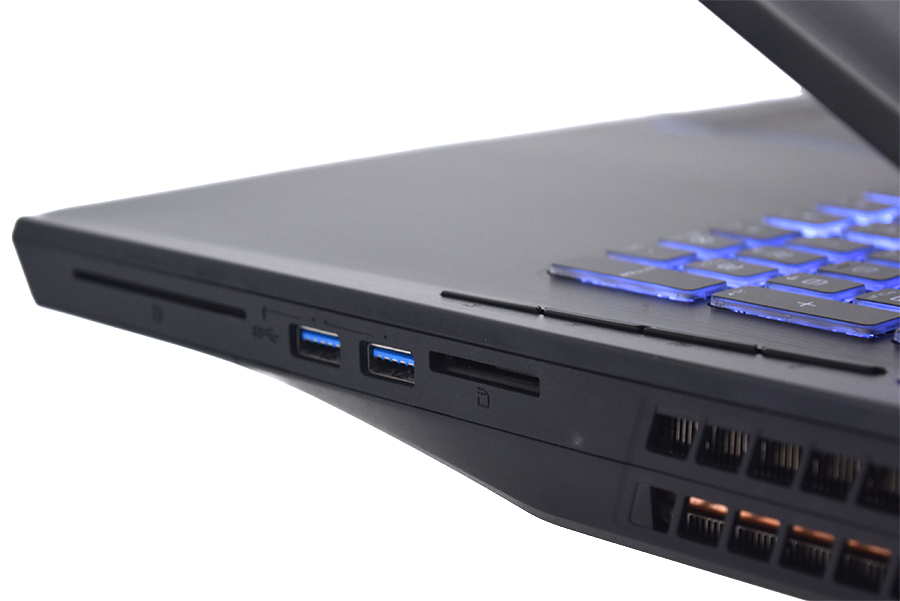
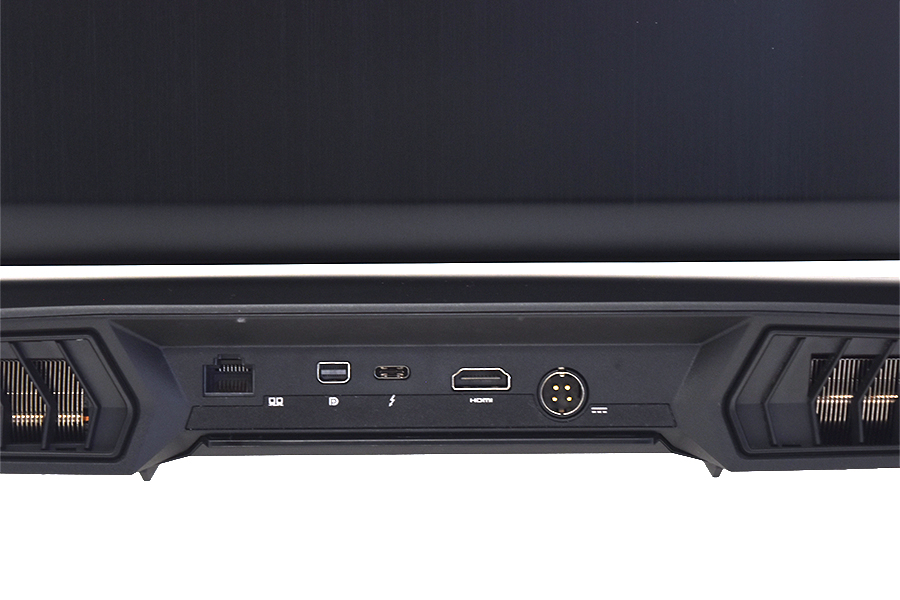
The system carries a wide selection of ports. While the USB Type-A ports are easy enough to reach, the rear ports are more difficult since they are tucked between the protruding ventilation grilles. The competing MSI GT75VR has a 10 Gbps Ethernet port compared to the 1 Gbps port on our Eurocom and, perhaps annoyingly, the HDMI port here is upside-down.
SD Card Reader
| SD Card Reader | |
| average JPG Copy Test (av. of 3 runs) | |
| Asus Chimera G703GI (Toshiba Exceria Pro SDXC 64 GB UHS-II) | |
| Eurocom Sky X7C (Toshiba Exceria Pro SDXC 64 GB UHS-II) | |
| Eurocom Sky X9C (Toshiba Exceria Pro SDXC 64 GB UHS-II) | |
| Eurocom Tornado F7W (Toshiba Exceria Pro SDXC 64 GB UHS-II) | |
| HP Omen X 17-ap0xx (Toshiba Exceria Pro SDXC 64 GB UHS-II) | |
| maximum AS SSD Seq Read Test (1GB) | |
| Asus Chimera G703GI (Toshiba Exceria Pro SDXC 64 GB UHS-II) | |
| Eurocom Sky X7C (Toshiba Exceria Pro SDXC 64 GB UHS-II) | |
| Eurocom Sky X9C (Toshiba Exceria Pro SDXC 64 GB UHS-II) | |
| Eurocom Tornado F7W (Toshiba Exceria Pro SDXC 64 GB UHS-II) | |
| HP Omen X 17-ap0xx (Toshiba Exceria Pro SDXC 64 GB UHS-II) | |
Communication
The Intel 9260 is capable of theoretical transfer rates of up to 1.73 Gbps and it is becoming increasingly common on newer Ultrabooks. Our server setup is limited by a 1 Gbps line and so the numbers below are slower than what the Intel 9260 is capable of.
Transmit rates are unusually slow while receive rates appear to be normal to indicate a potential bug or faulty antenna on our specific test unit.
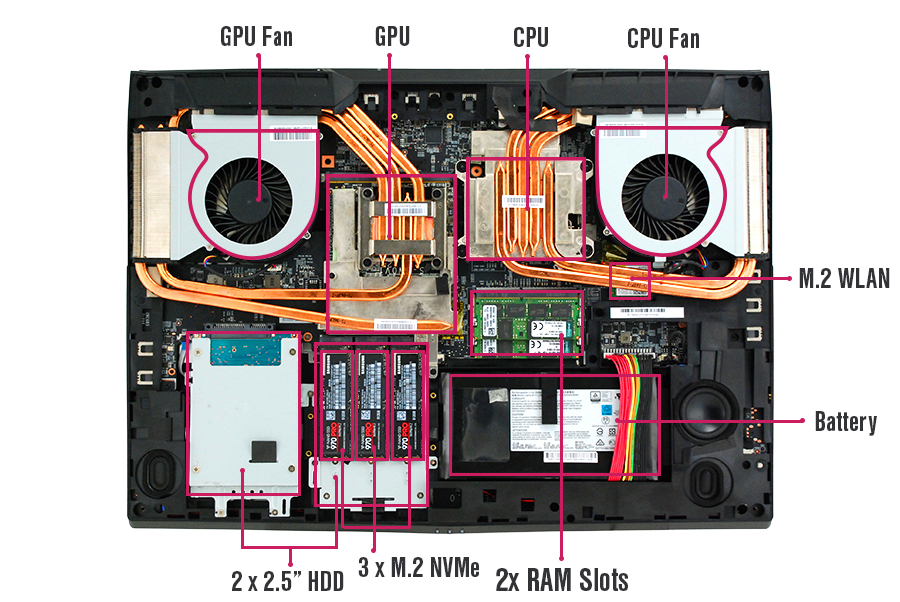
Maintenance
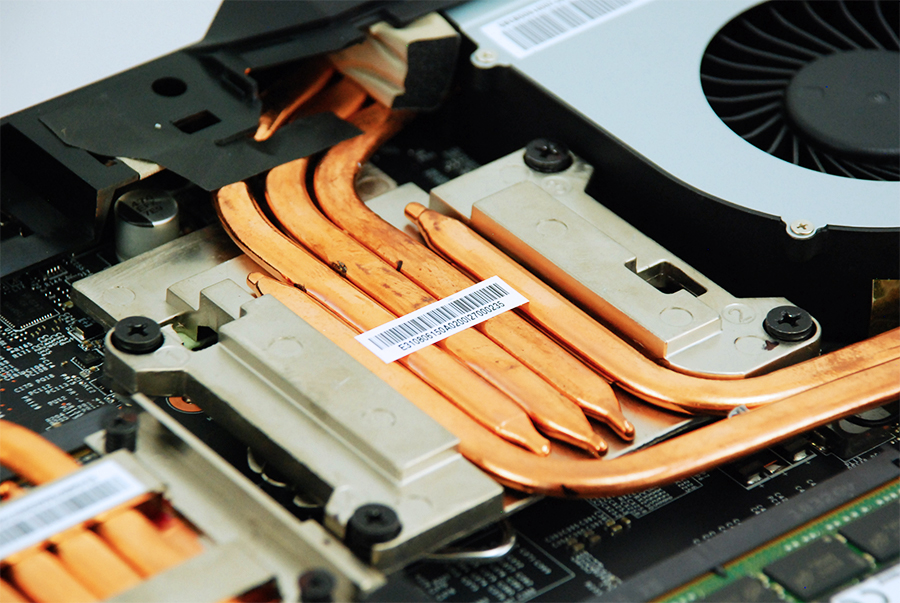
The bottom panel requires only a Philips screwdriver to remove. Users have direct access to most key components including the LGA 1151 socket, MXM 3.1 slot, battery, two SODIMM slots, and all four storage bays. Note that the M.2 WLAN module is inconveniently underneath some heat pipes while the other two SODIMM slots require additional disassembly.
Warranty
The standard one-year limited warranty applies with options to extend up to two or three years. We're hopeful that the base warranty will be upped to two years in the near future to match the base warranties of HP business products and the Aorus series of laptops. Please see our Guarantees, Return policies and Warranties FAQ for country-specific information.
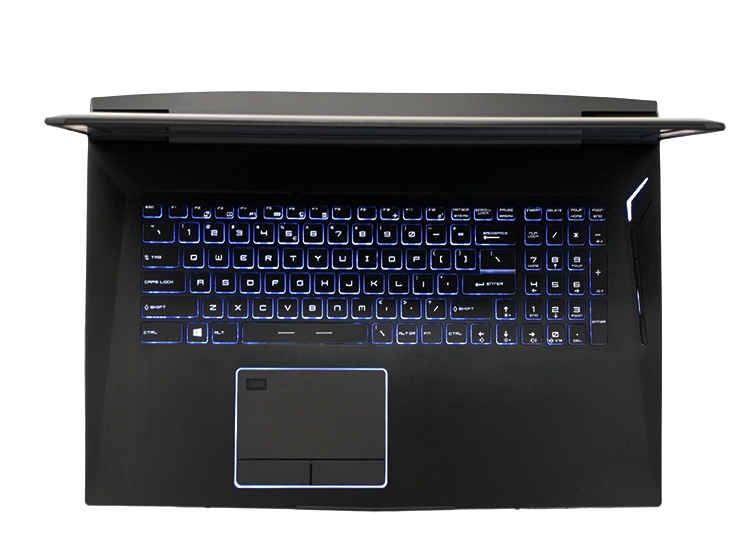
Input Devices
Keyboard and Touchpad
Eurocom keyboards are consistent across nearly all models and it's no different here on the Tornado F7W. Feedback is satisfactorily firm and uniform across the main QWERTY keys. Clatter is also quieter than most notebooks due to the rigid deck and heavy chassis underneath. Our main complaints are the lack of per-key RGB lighting and the reduced size of the NumPad keys. While we can forgive the former, the latter is a slight annoyance since there is space for a full-size NumPad. Inputting numbers can feel a little cramped as a result.
The medium-sized (11.0 x 6.5 cm) trackpad is one of the best we've seen on a 17-inch laptop. It's firm, does not warp to pressure, and it feels smooth with almost no sticking when gliding across slowly. The large dedicated mouse keys are shallow in travel with a loud and satisfying click when pressed. An external mouse is still easier and less straining for longer tasks.
Display
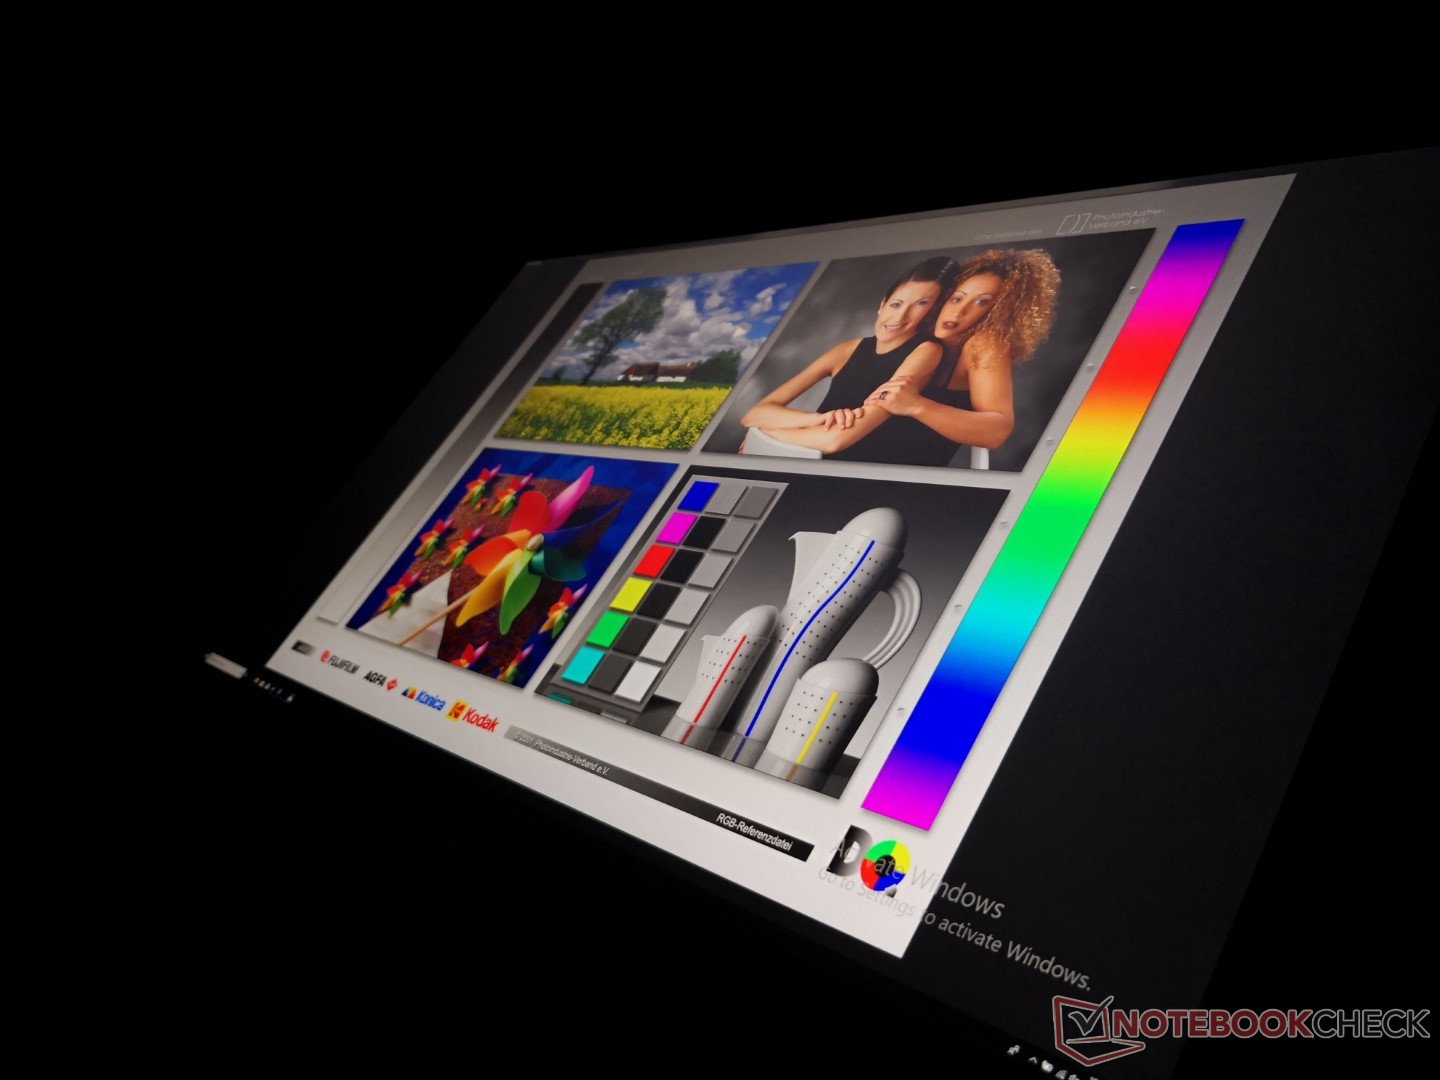
Perhaps unsurprisingly, our Tornado F7W utilizes the same AU Optronics B173ZAN01.0 IPS panel as found on the Sky X7C and Sky X9C. Innate characteristics like response times, color coverage, and contrast are thus nearly the same between these laptops. This particular AUO panel is relatively common on enthusiast 17-inch laptops like the MSI GT73VR or Acer Predator 17.
Strengths of the AUO panel include its 4K UHD native resolution, very wide gamut for deep colors, and faster response times than the competing Sharp LQ173D1JW33 IGZO panel. Even so, response times are still not fast enough for hardcore gaming and contrast ratio is "only" about 900:1 compared to ~1300:1 on the 4K UHD panel of the Dell XPS 15.
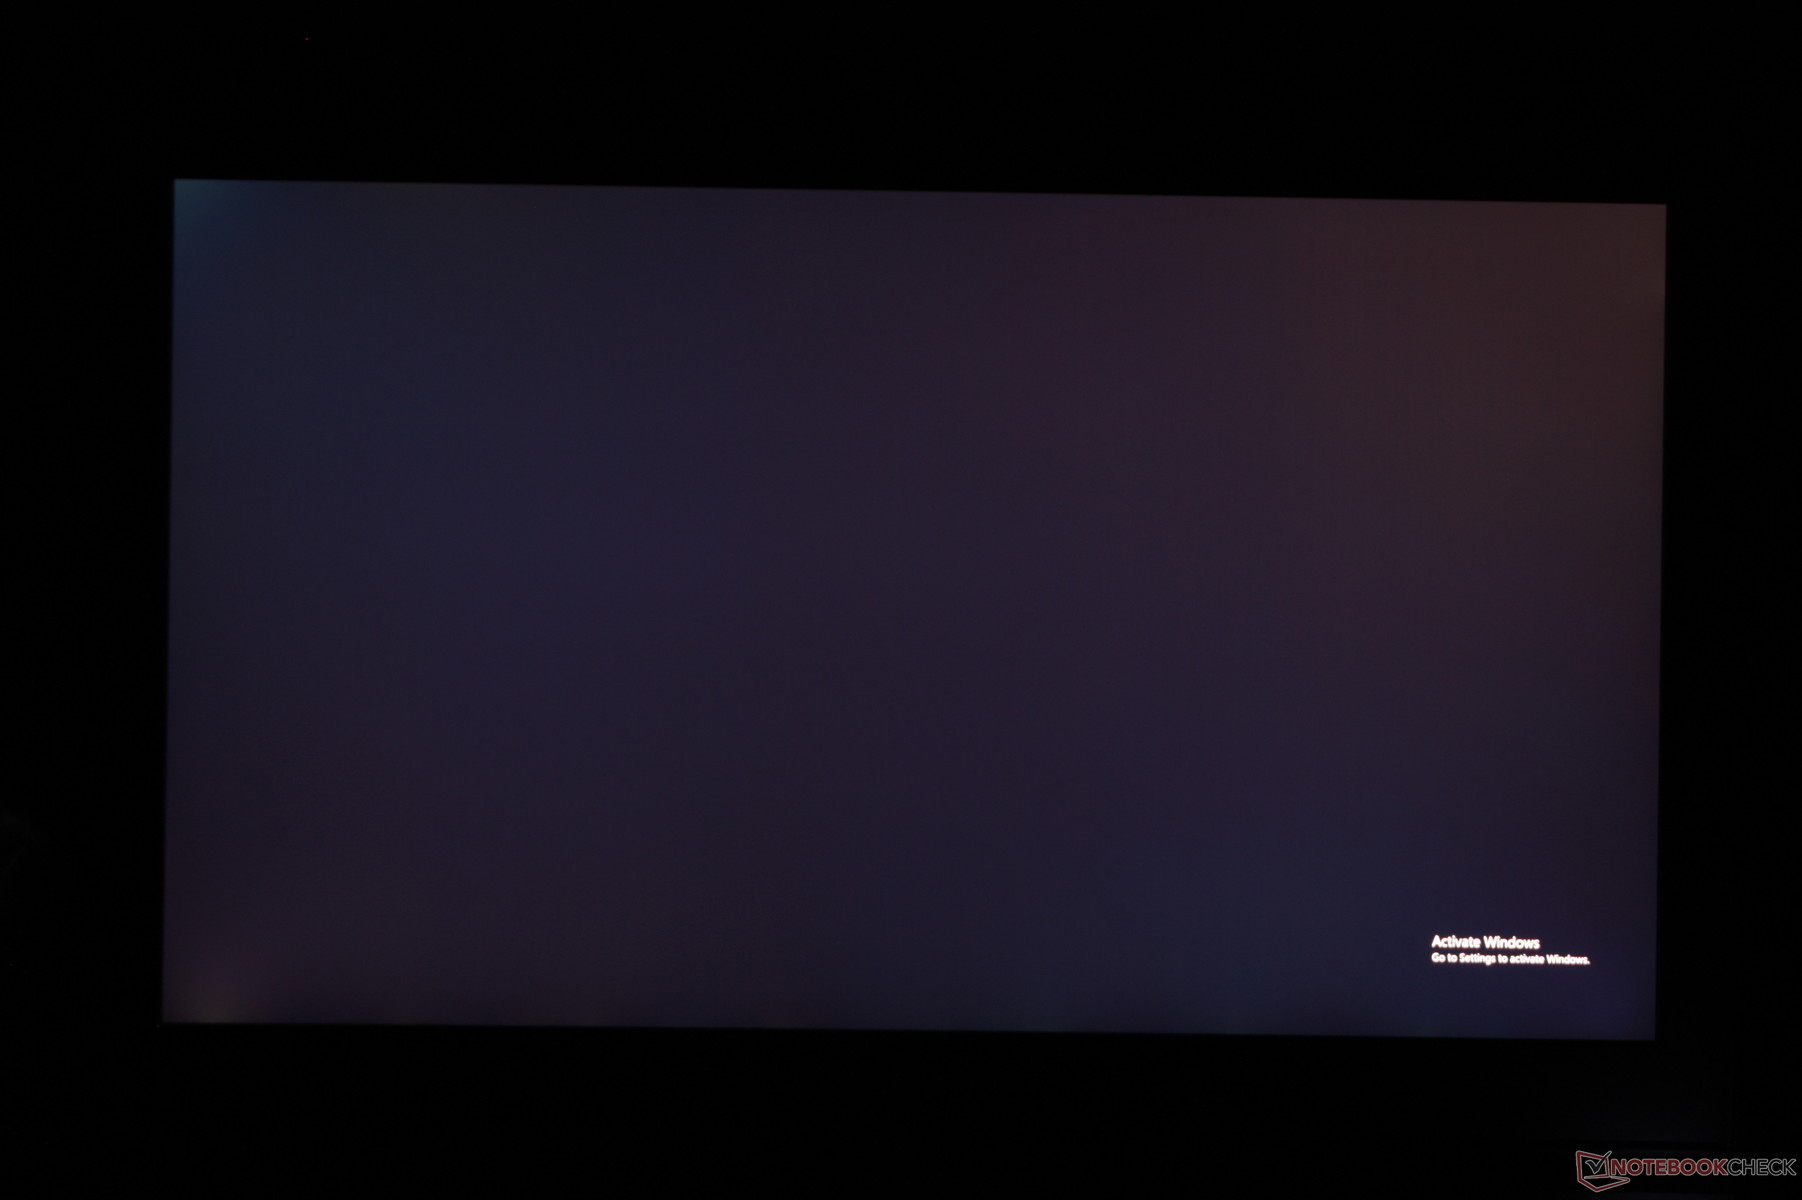
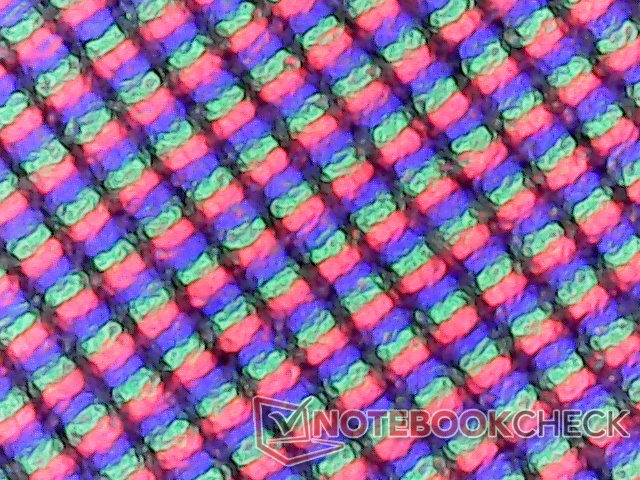
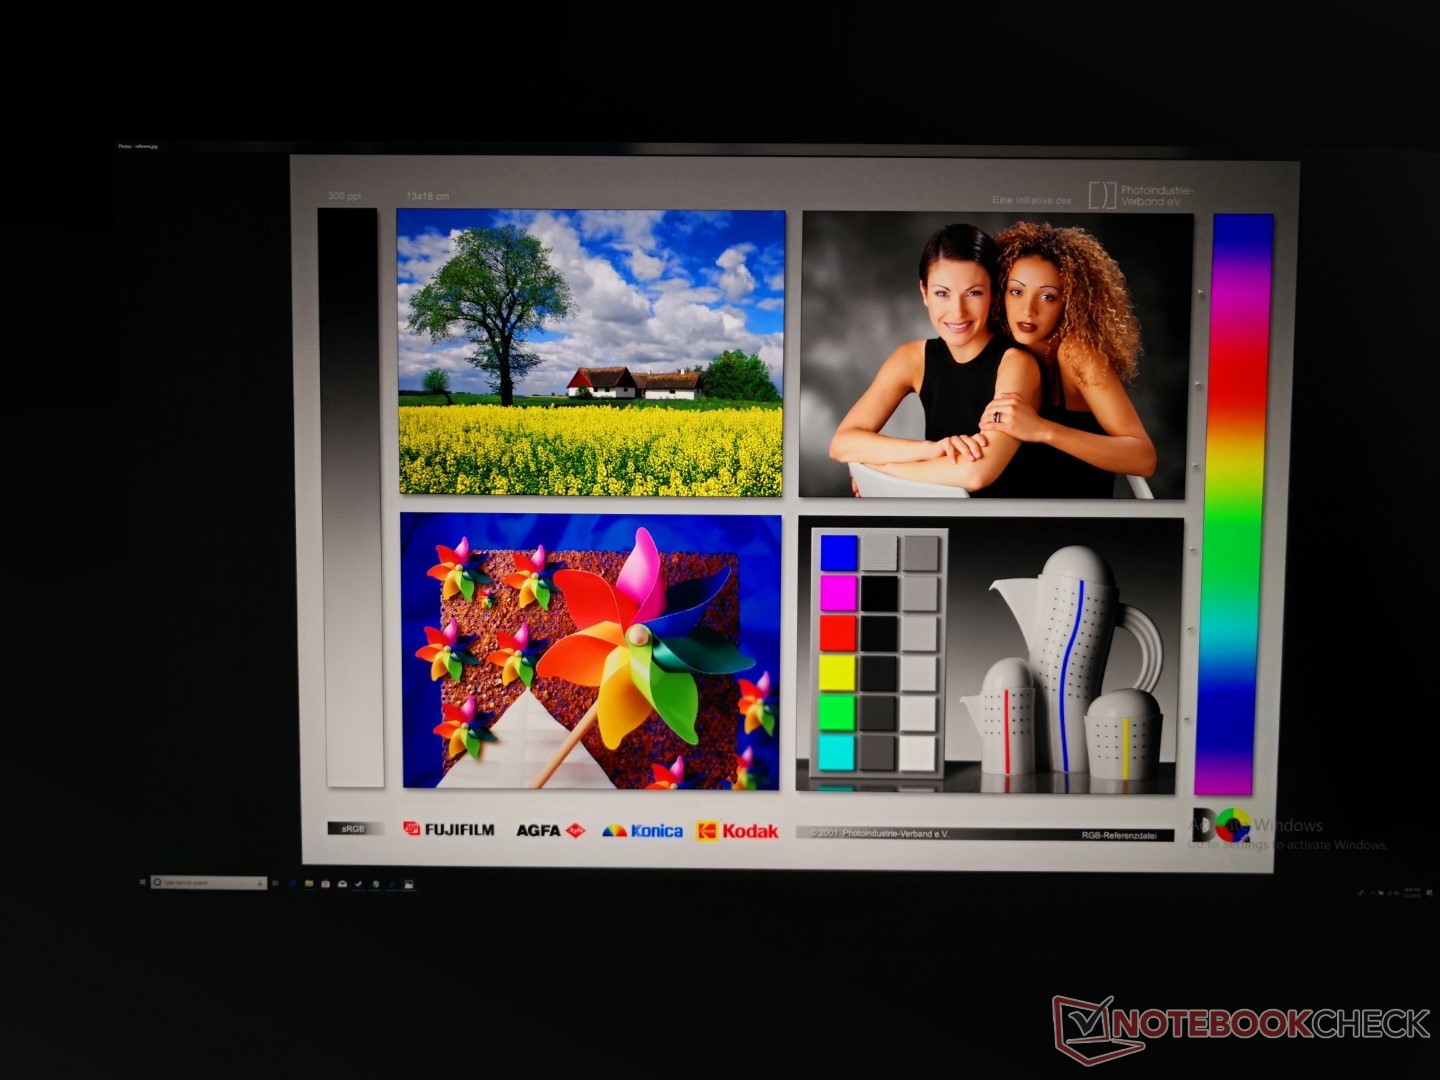
The matte panel of the Tornado F7W suffers from a slight layer of graininess that is otherwise not present on glossy displays. The difference is noticeable when viewing text with no scaling enabled as the letters do not look at crisp or sharp as they could be. There is slight uneven backlight bleeding on the bottom left corner of our screen as shown in the screenshot below.
| |||||||||||||||||||||||||
Brightness Distribution: 92 %
Center on Battery: 328.2 cd/m²
Contrast: 887:1 (Black: 0.37 cd/m²)
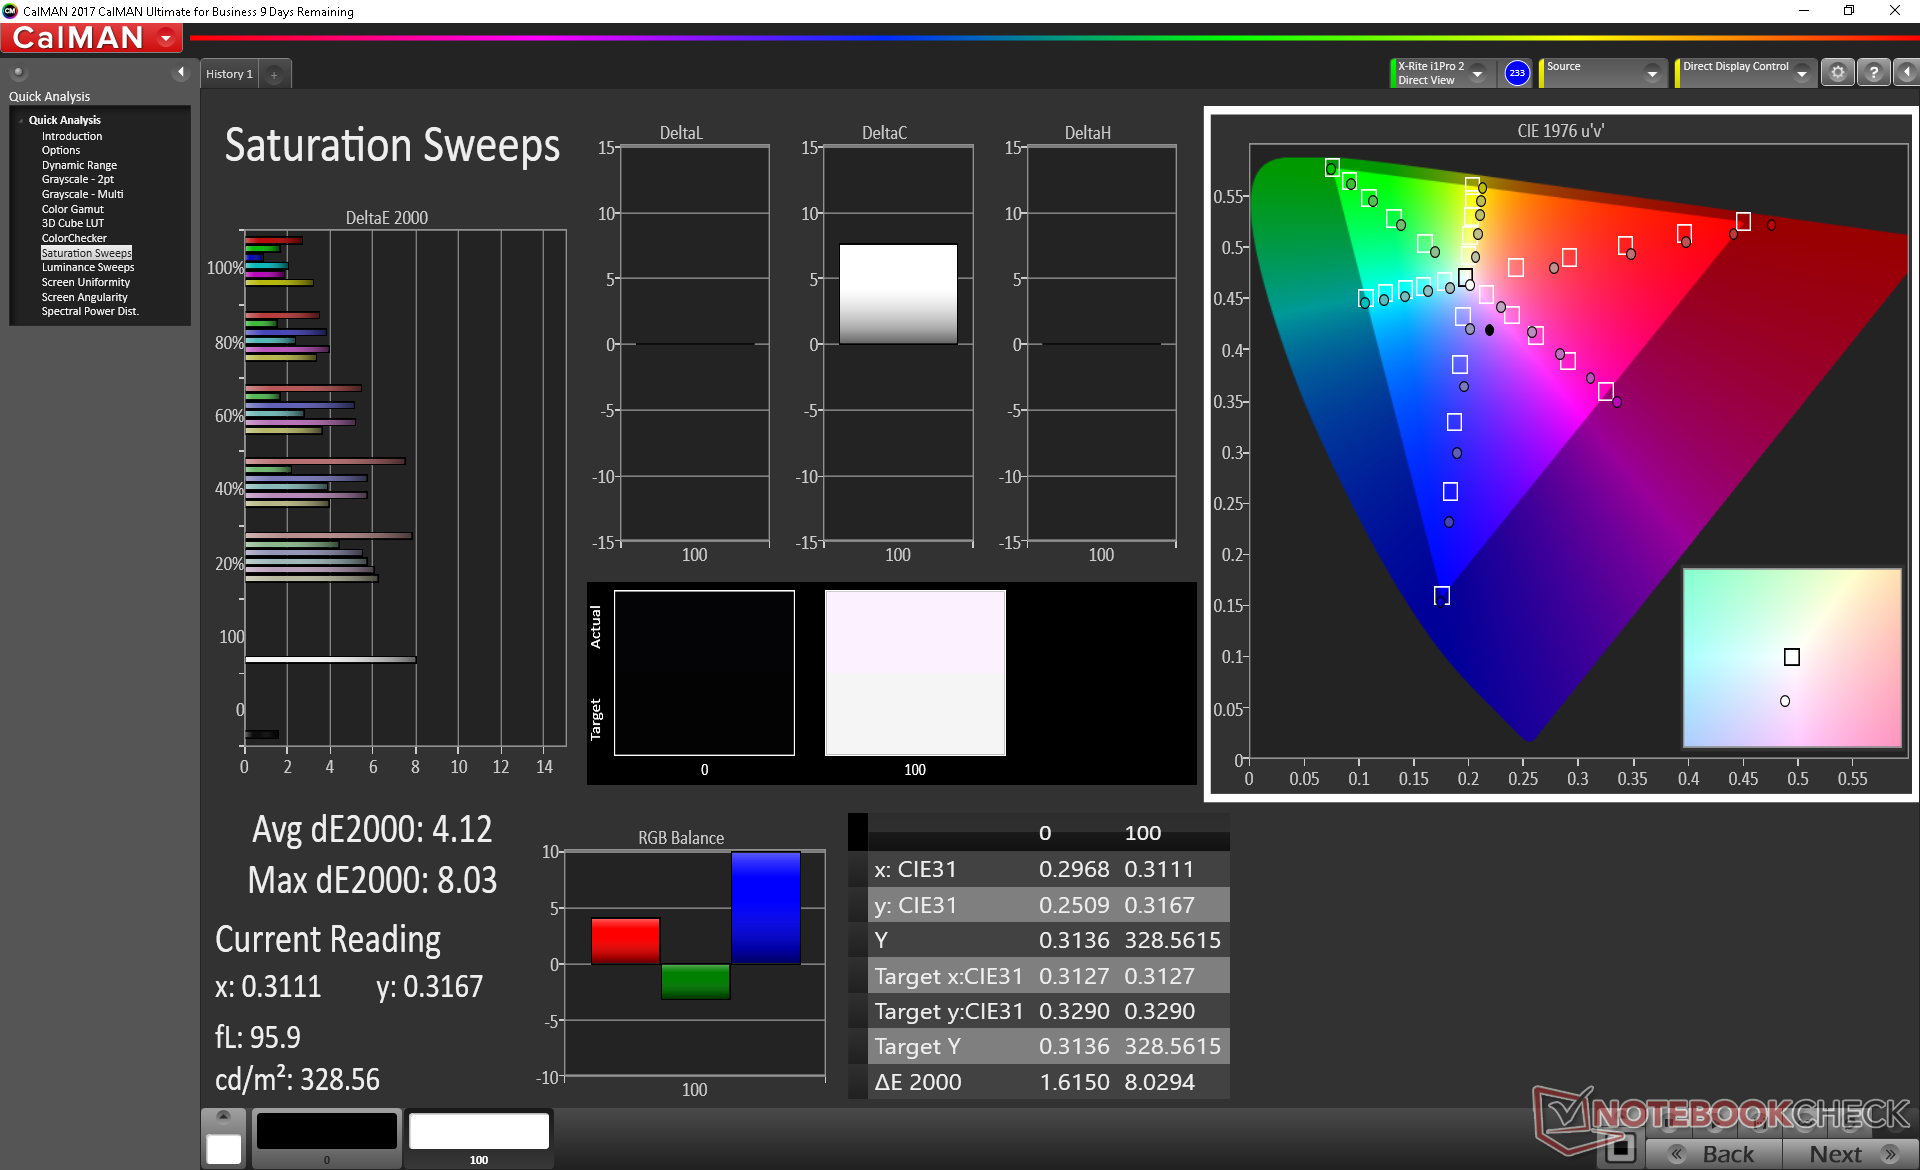
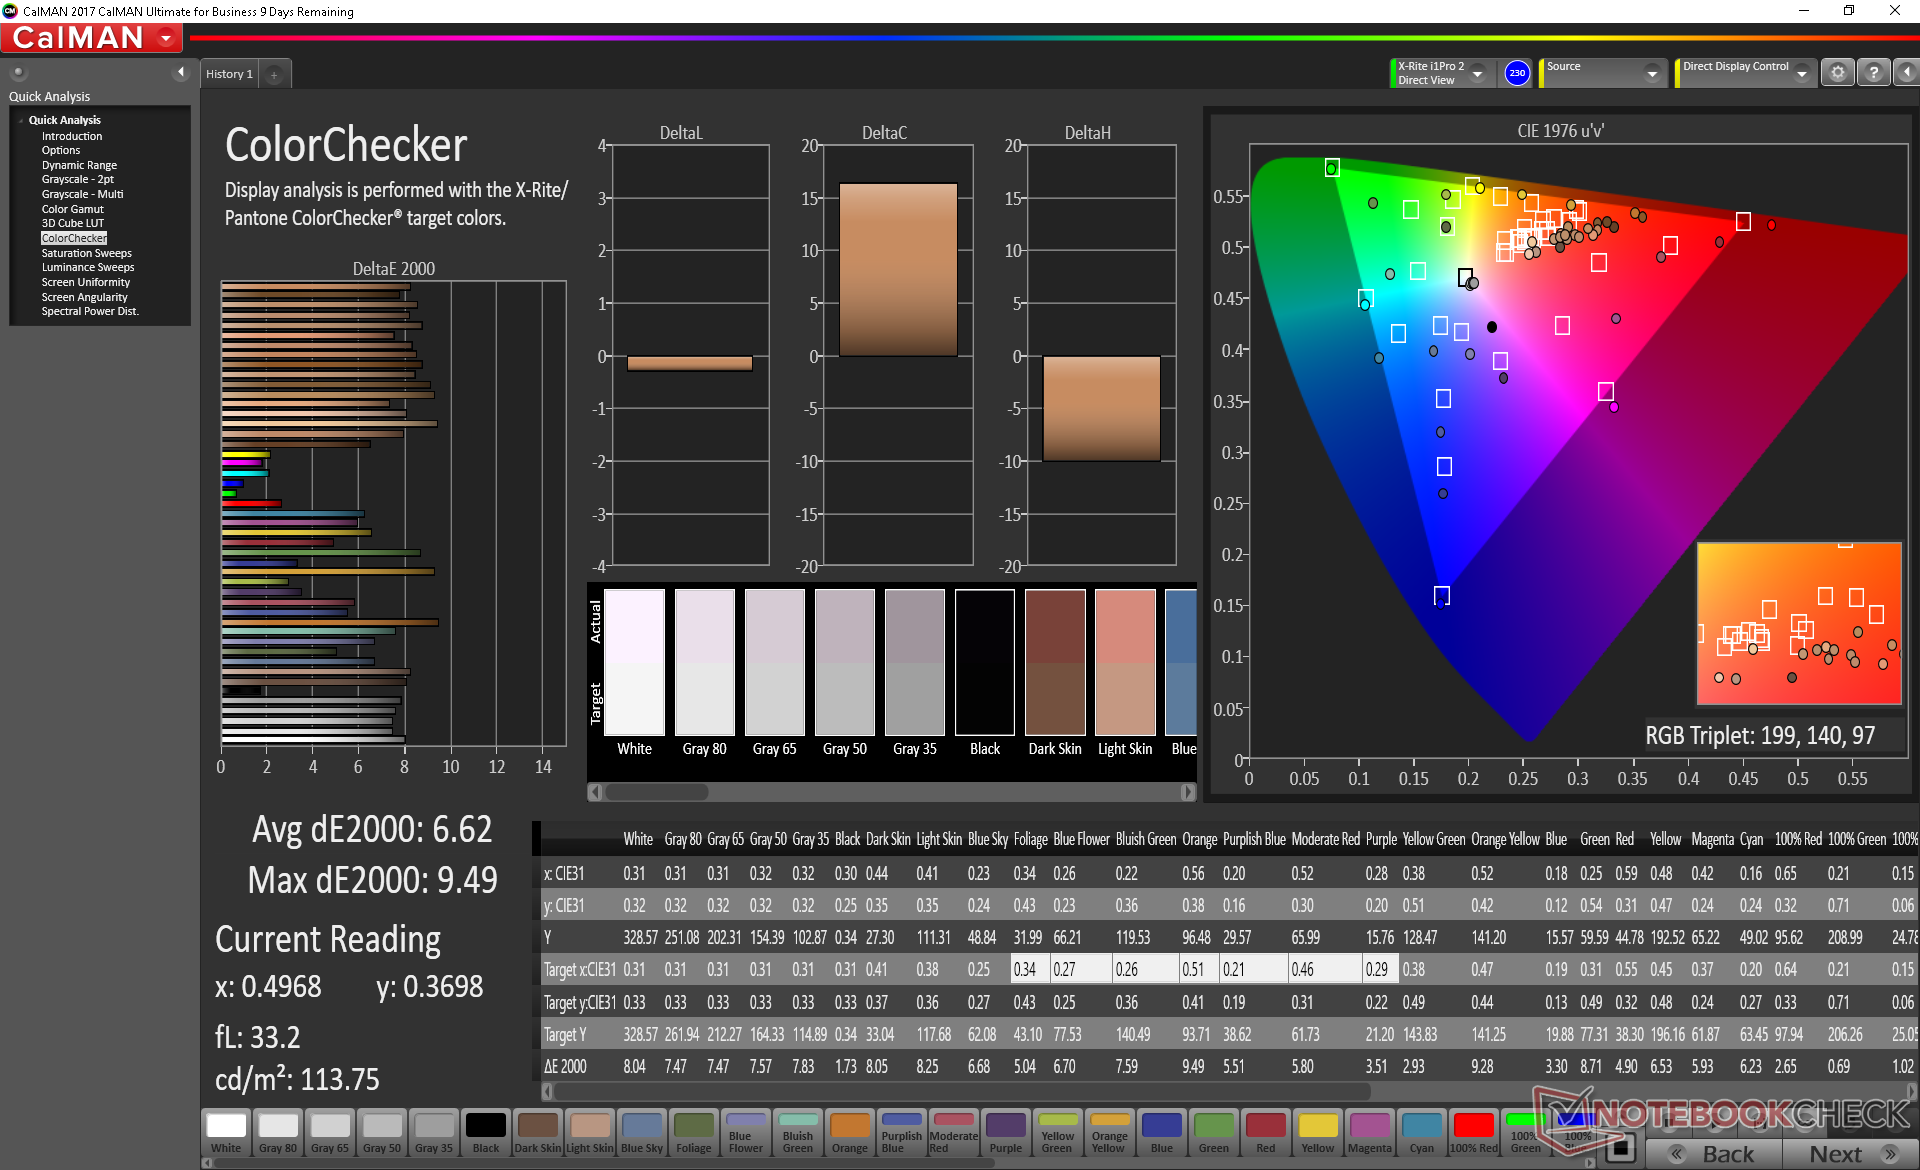
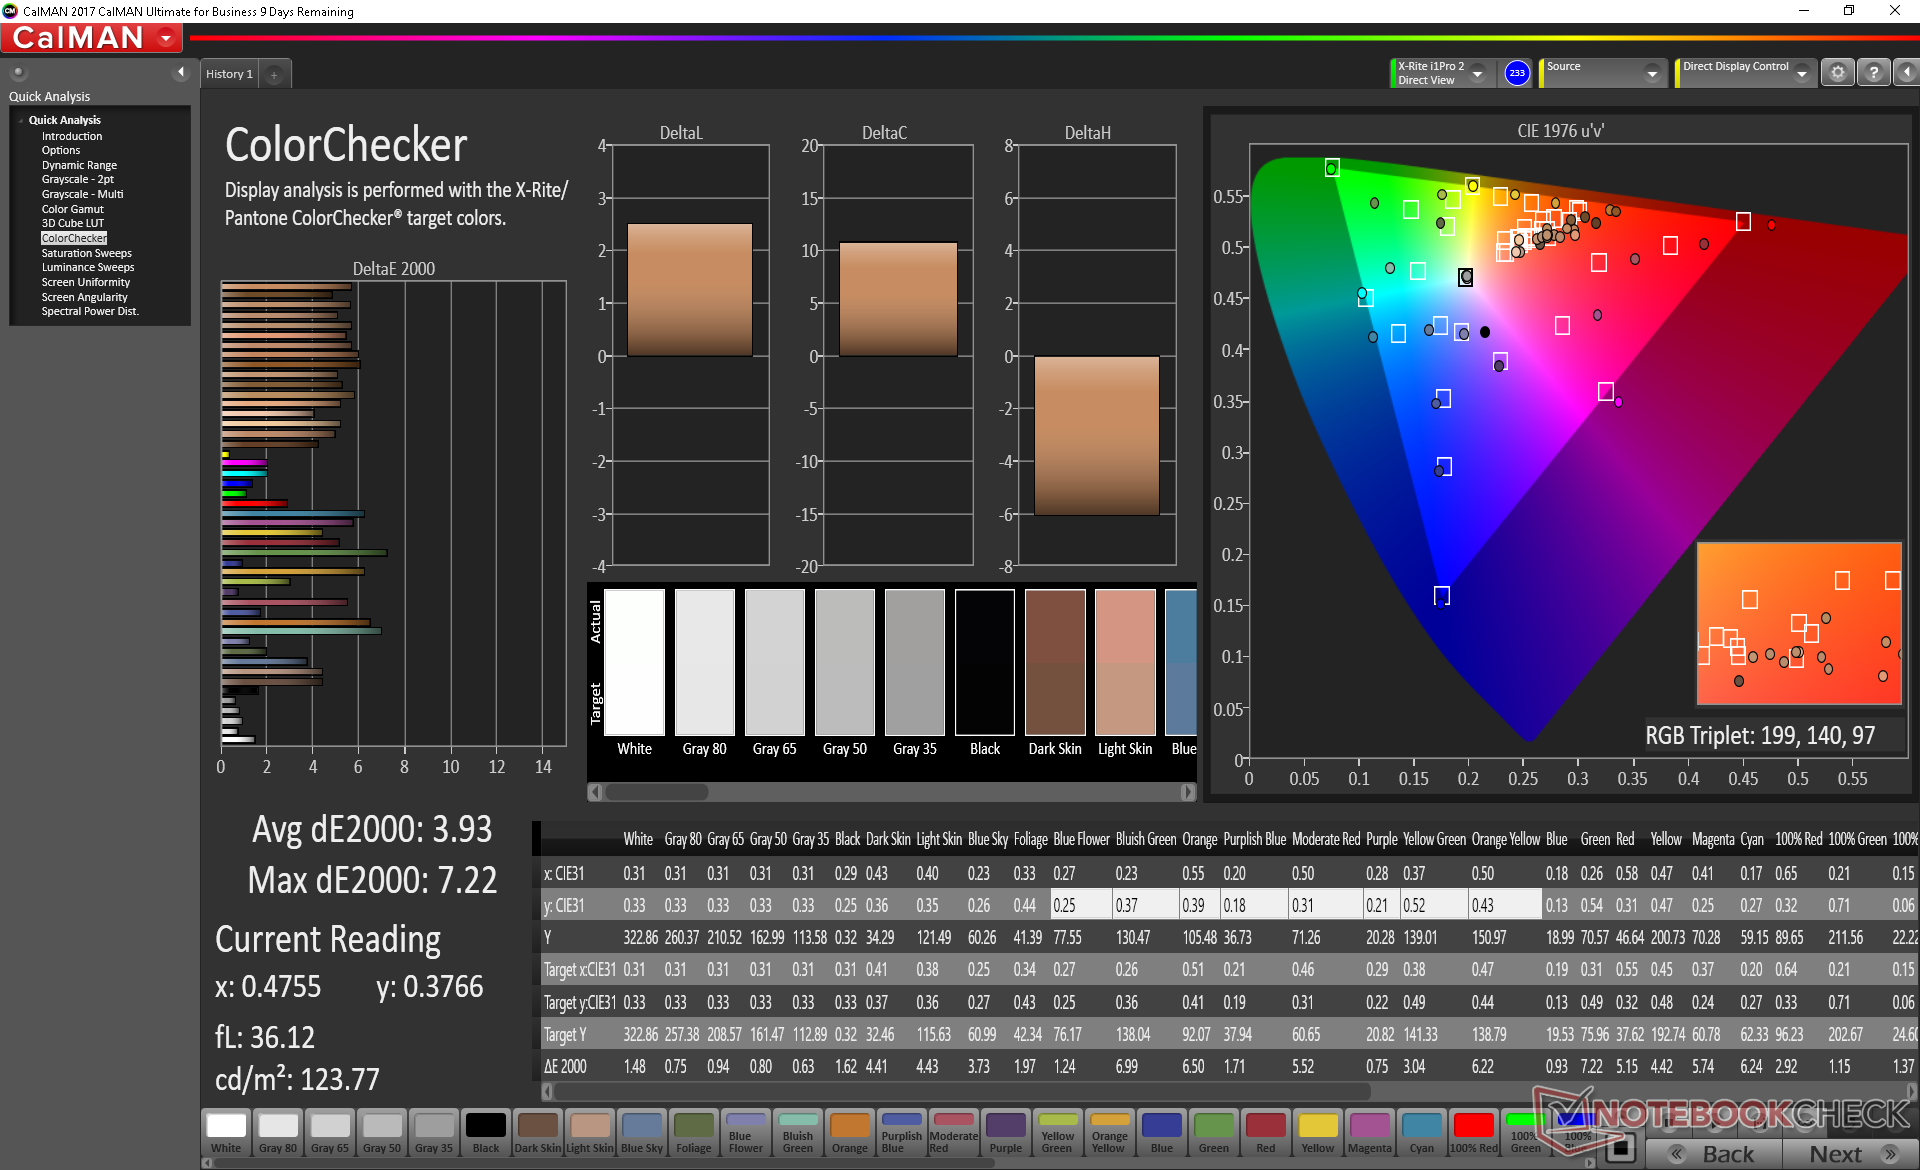
ΔE ColorChecker Calman: 6.62 | ∀{0.5-29.43 Ø4.72}
calibrated: 3.93
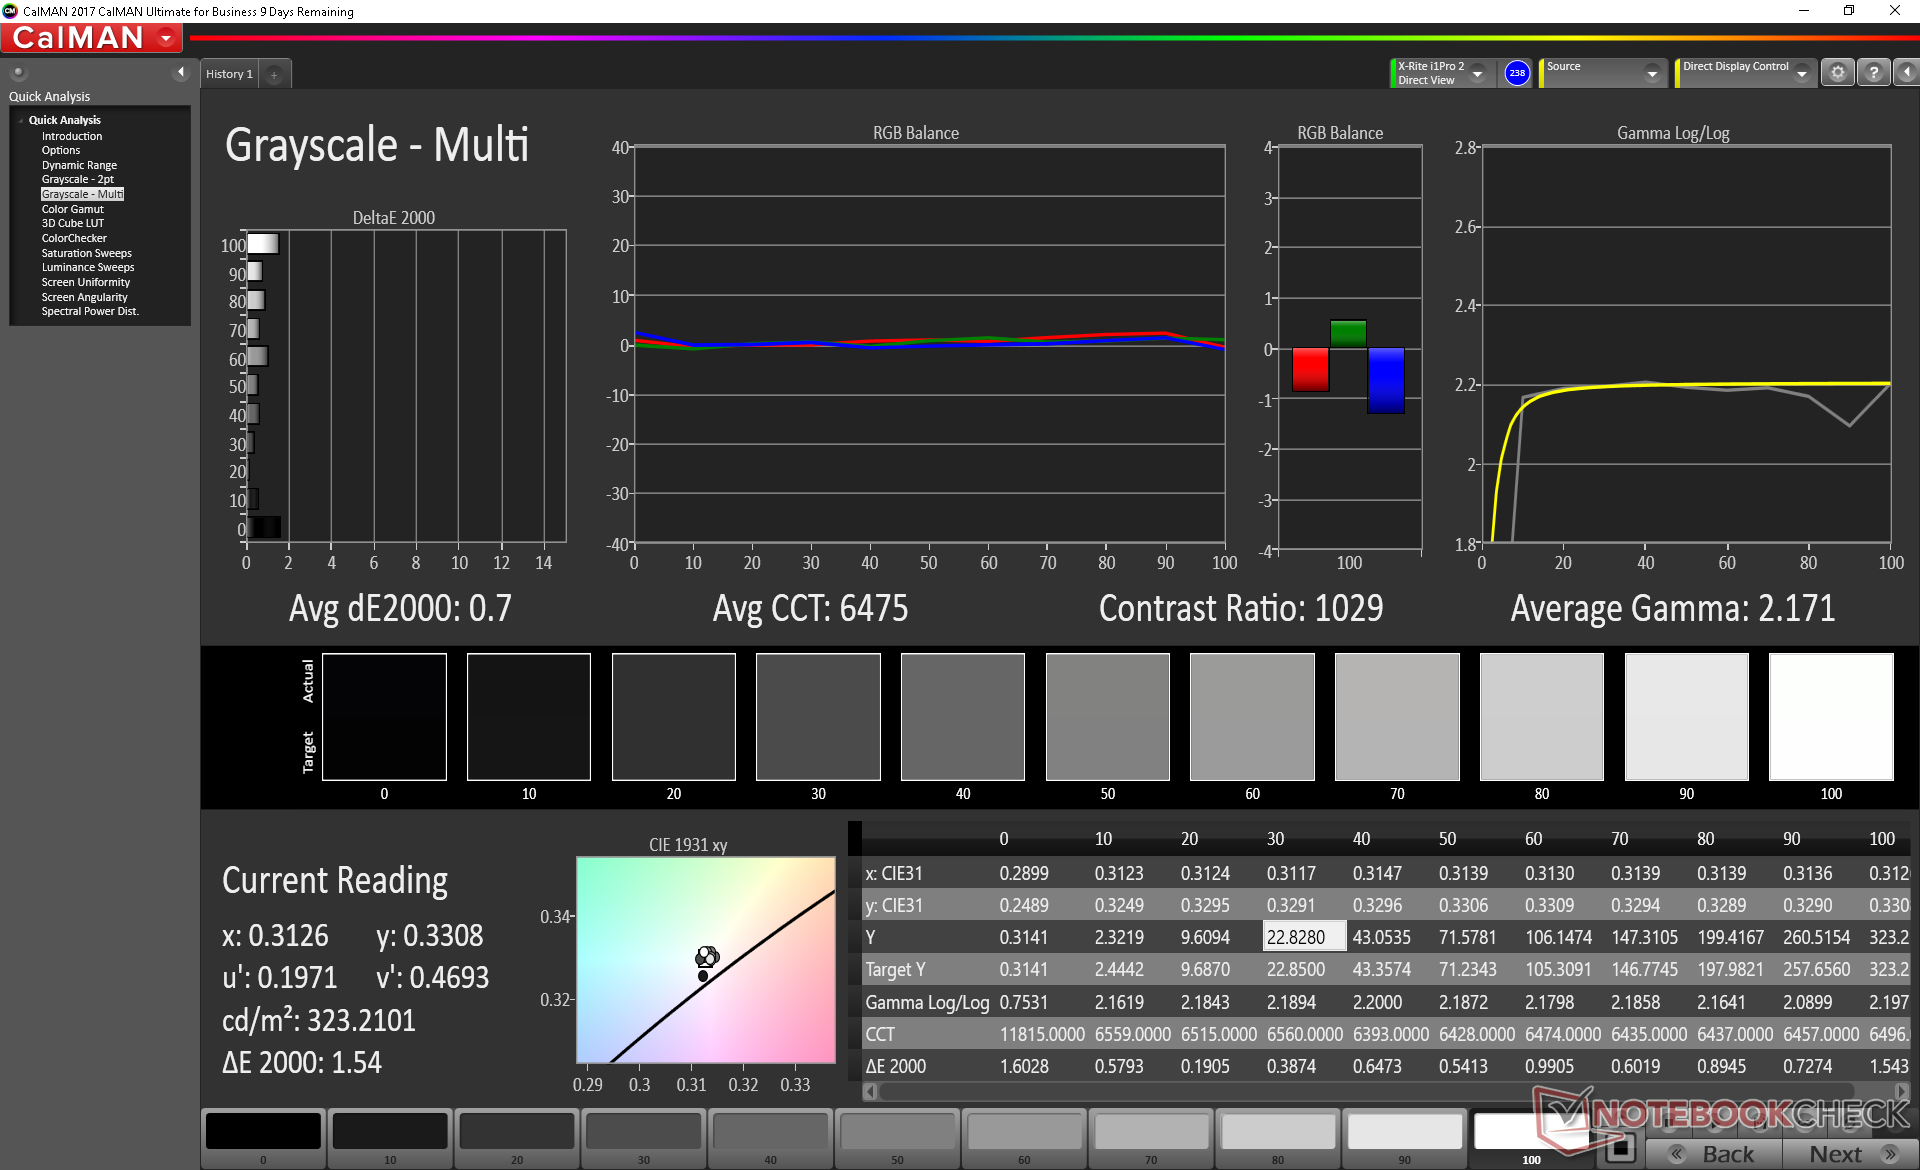
ΔE Greyscale Calman: 6.7 | ∀{0.09-98 Ø4.97}
100% sRGB (Argyll 1.6.3 3D)
87.9% AdobeRGB 1998 (Argyll 1.6.3 3D)
98.3% AdobeRGB 1998 (Argyll 3D)
100% sRGB (Argyll 3D)
85.9% Display P3 (Argyll 3D)
Gamma: 2.44
CCT: 6462 K
| Eurocom Tornado F7W AU Optronics B173ZAN01.0, IPS, 17.3", 3840x2160 | Eurocom Sky X7C AU Optronics B173ZAN01.0, IPS, 17.3", 3840x2160 | Asus Chimera G703GI B173HAN03.2 (AUO329D), IPS, 17.3", 1920x1080 | HP Omen X 17-ap0xx AU Optronics B173HW01, IPS, 17.3", 1920x1080 | Eurocom Sky X9C ID: AUO109B, Name: AU Optronics B173ZAN01.0, IPS, 17.3", 3840x2160 | MSI GT75 8RG-090 Titan CMN N173HHE-G32 (CMN1747), TN, 17.3", 1920x1080 | |
|---|---|---|---|---|---|---|
| Display | 0% | -21% | -24% | 1% | -2% | |
| Display P3 Coverage (%) | 85.9 | 86 0% | 65.8 -23% | 63.7 -26% | 86.6 1% | 90.9 6% |
| sRGB Coverage (%) | 100 | 99.9 0% | 92.6 -7% | 88.2 -12% | 100 0% | 100 0% |
| AdobeRGB 1998 Coverage (%) | 98.3 | 98.9 1% | 67 -32% | 64.2 -35% | 99.4 1% | 86.2 -12% |
| Response Times | 10% | 75% | -5% | 0% | 81% | |
| Response Time Grey 50% / Grey 80% * (ms) | 40 ? | 38.4 ? 4% | 6.4 ? 84% | 44 ? -10% | 43.6 ? -9% | 8 ? 80% |
| Response Time Black / White * (ms) | 31.6 ? | 26.8 ? 15% | 10.8 ? 66% | 31.6 ? -0% | 28.8 ? 9% | 5.6 ? 82% |
| PWM Frequency (Hz) | 26000 ? | |||||
| Screen | 1% | 19% | 15% | 2% | 22% | |
| Brightness middle (cd/m²) | 328.2 | 333 1% | 285 -13% | 343 5% | 347.7 6% | 240 -27% |
| Brightness (cd/m²) | 310 | 330 6% | 275 -11% | 332 7% | 324 5% | 248 -20% |
| Brightness Distribution (%) | 92 | 88 -4% | 82 -11% | 83 -10% | 87 -5% | 83 -10% |
| Black Level * (cd/m²) | 0.37 | 0.4 -8% | 0.22 41% | 0.35 5% | 0.4 -8% | 0.22 41% |
| Contrast (:1) | 887 | 833 -6% | 1295 46% | 980 10% | 869 -2% | 1091 23% |
| Colorchecker dE 2000 * | 6.62 | 5.87 11% | 3.18 52% | 3.35 49% | 6.39 3% | 2.14 68% |
| Colorchecker dE 2000 max. * | 9.49 | 9.74 -3% | 5.99 37% | 5.62 41% | 9.69 -2% | 5.04 47% |
| Colorchecker dE 2000 calibrated * | 3.93 | 4.59 -17% | 1.73 56% | 2.5 36% | 1.54 61% | |
| Greyscale dE 2000 * | 6.7 | 4.5 33% | 2.93 56% | 2.4 64% | 5.4 19% | 1.62 76% |
| Gamma | 2.44 90% | 2.34 94% | 2.45 90% | 2.35 94% | 2.4 92% | 2.28 96% |
| CCT | 6462 101% | 6384 102% | 7165 91% | 6495 100% | 6271 104% | 6846 95% |
| Color Space (Percent of AdobeRGB 1998) (%) | 87.9 | 88 0% | 60 -32% | 57 -35% | 87.8 0% | 77 -12% |
| Color Space (Percent of sRGB) (%) | 100 | 100 0% | 93 -7% | 88 -12% | 100 0% | 100 0% |
| Total Average (Program / Settings) | 4% /
2% | 24% /
19% | -5% /
5% | 1% /
1% | 34% /
25% |
* ... smaller is better
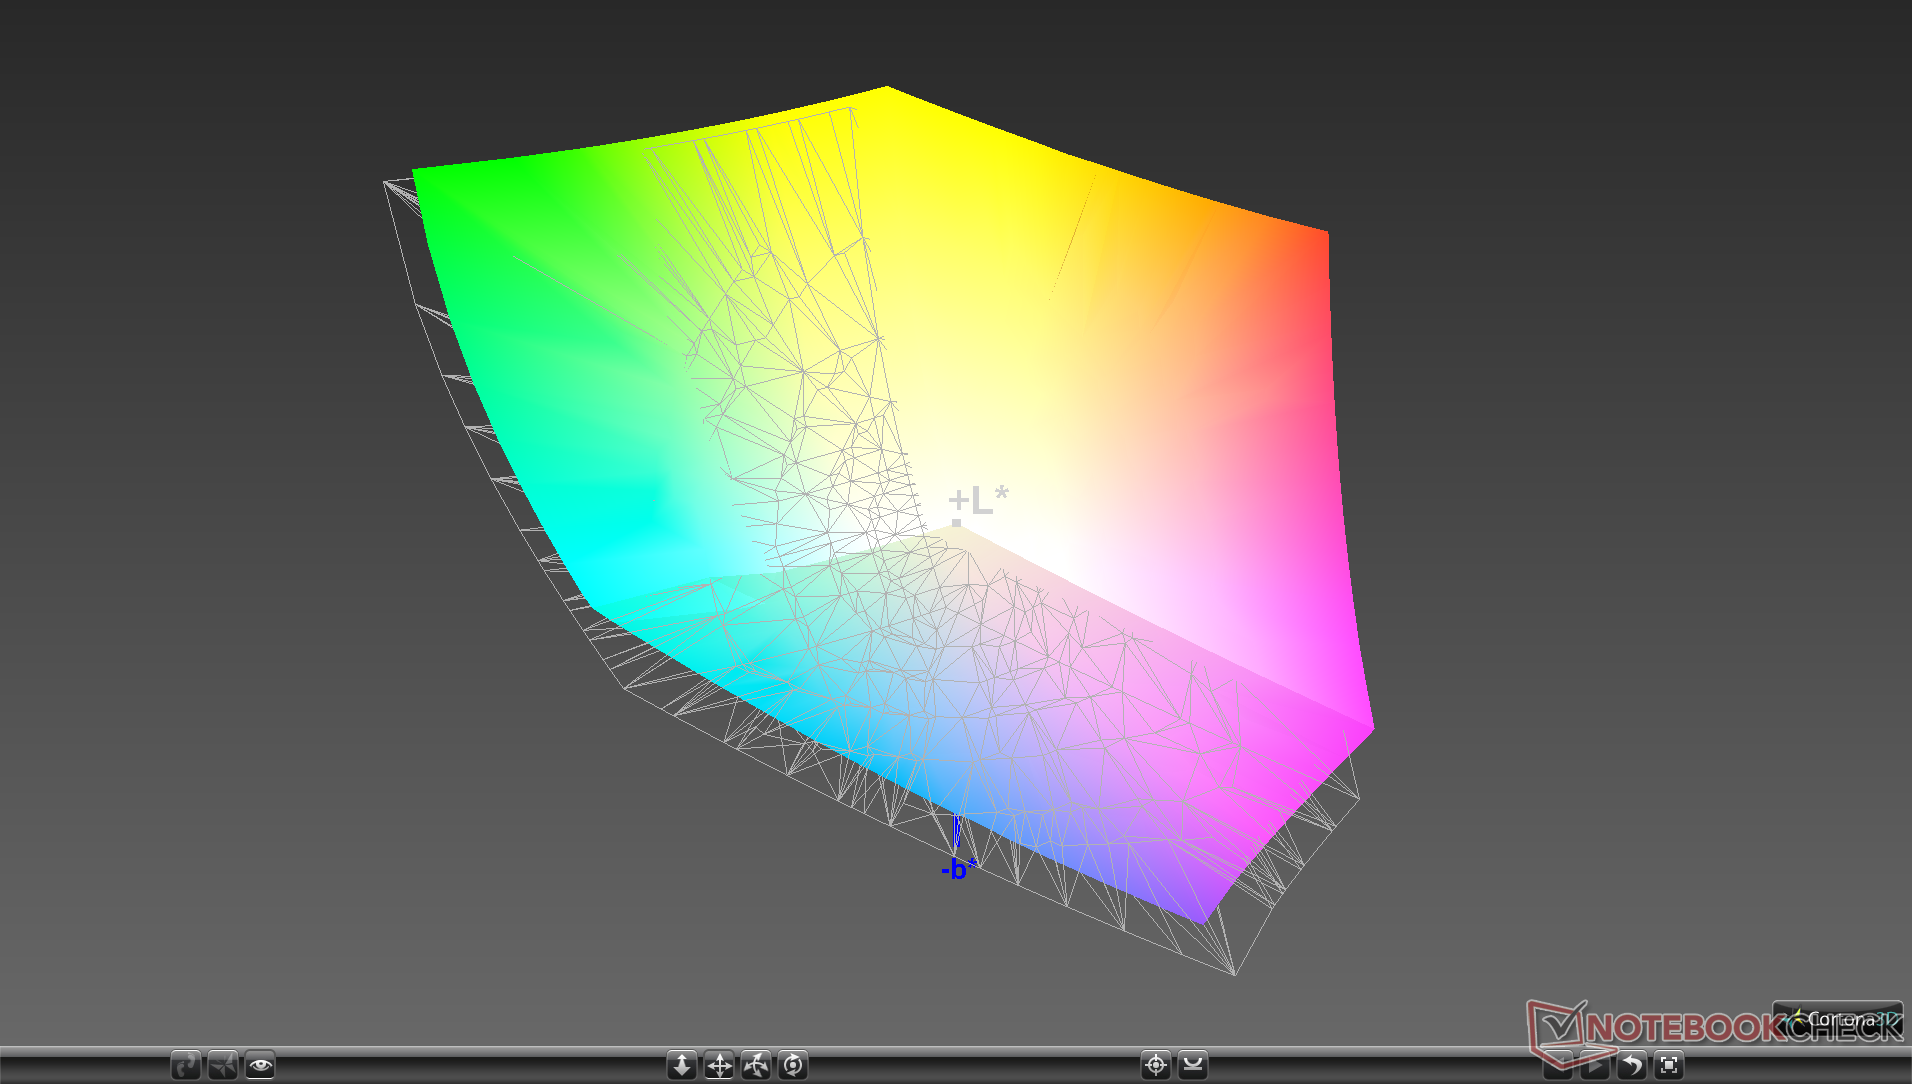
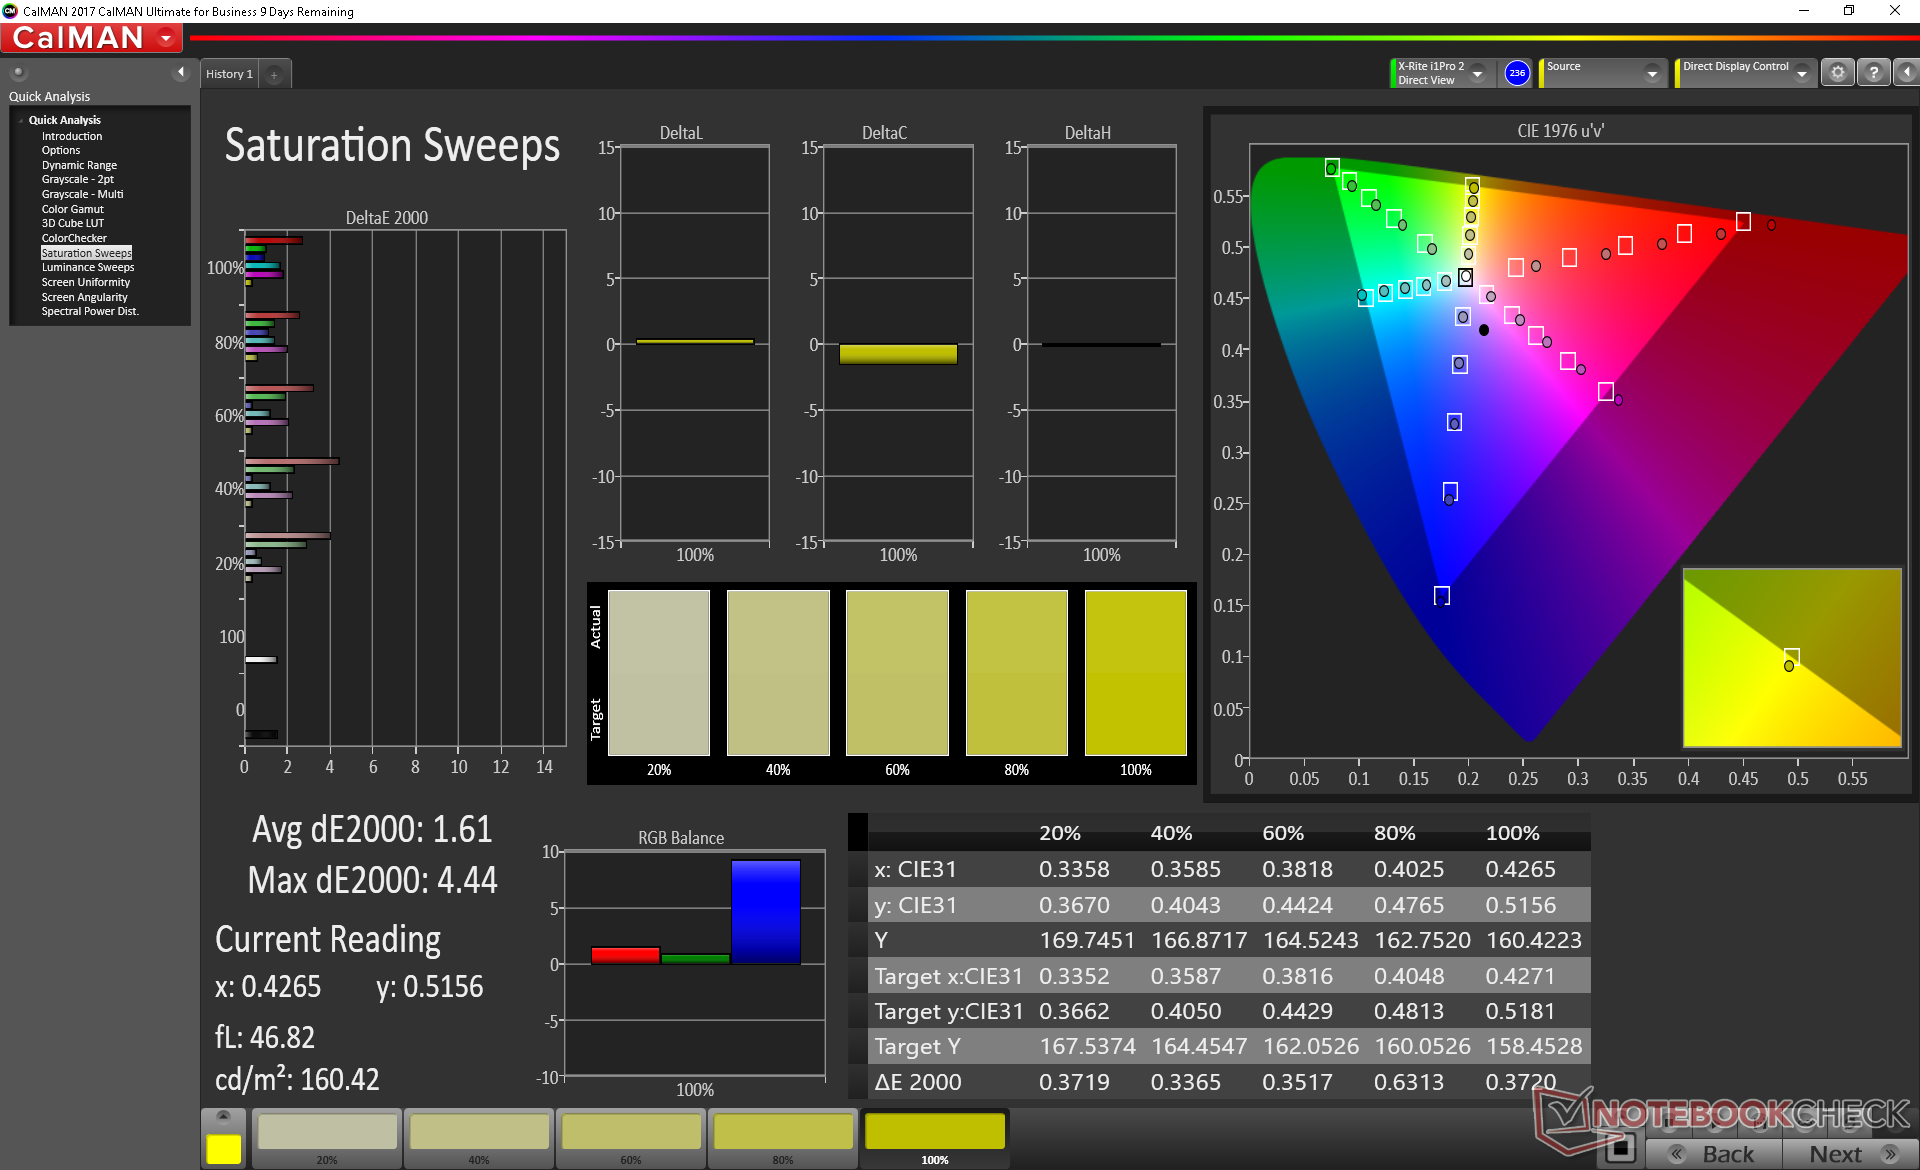
Color space covers sRGB and nearly all of AdobeRGB not unlike on the Sky X7C or Sky X9C. This is a panel fit for professional use where accurate colors take priority over fast response times and refresh rates.
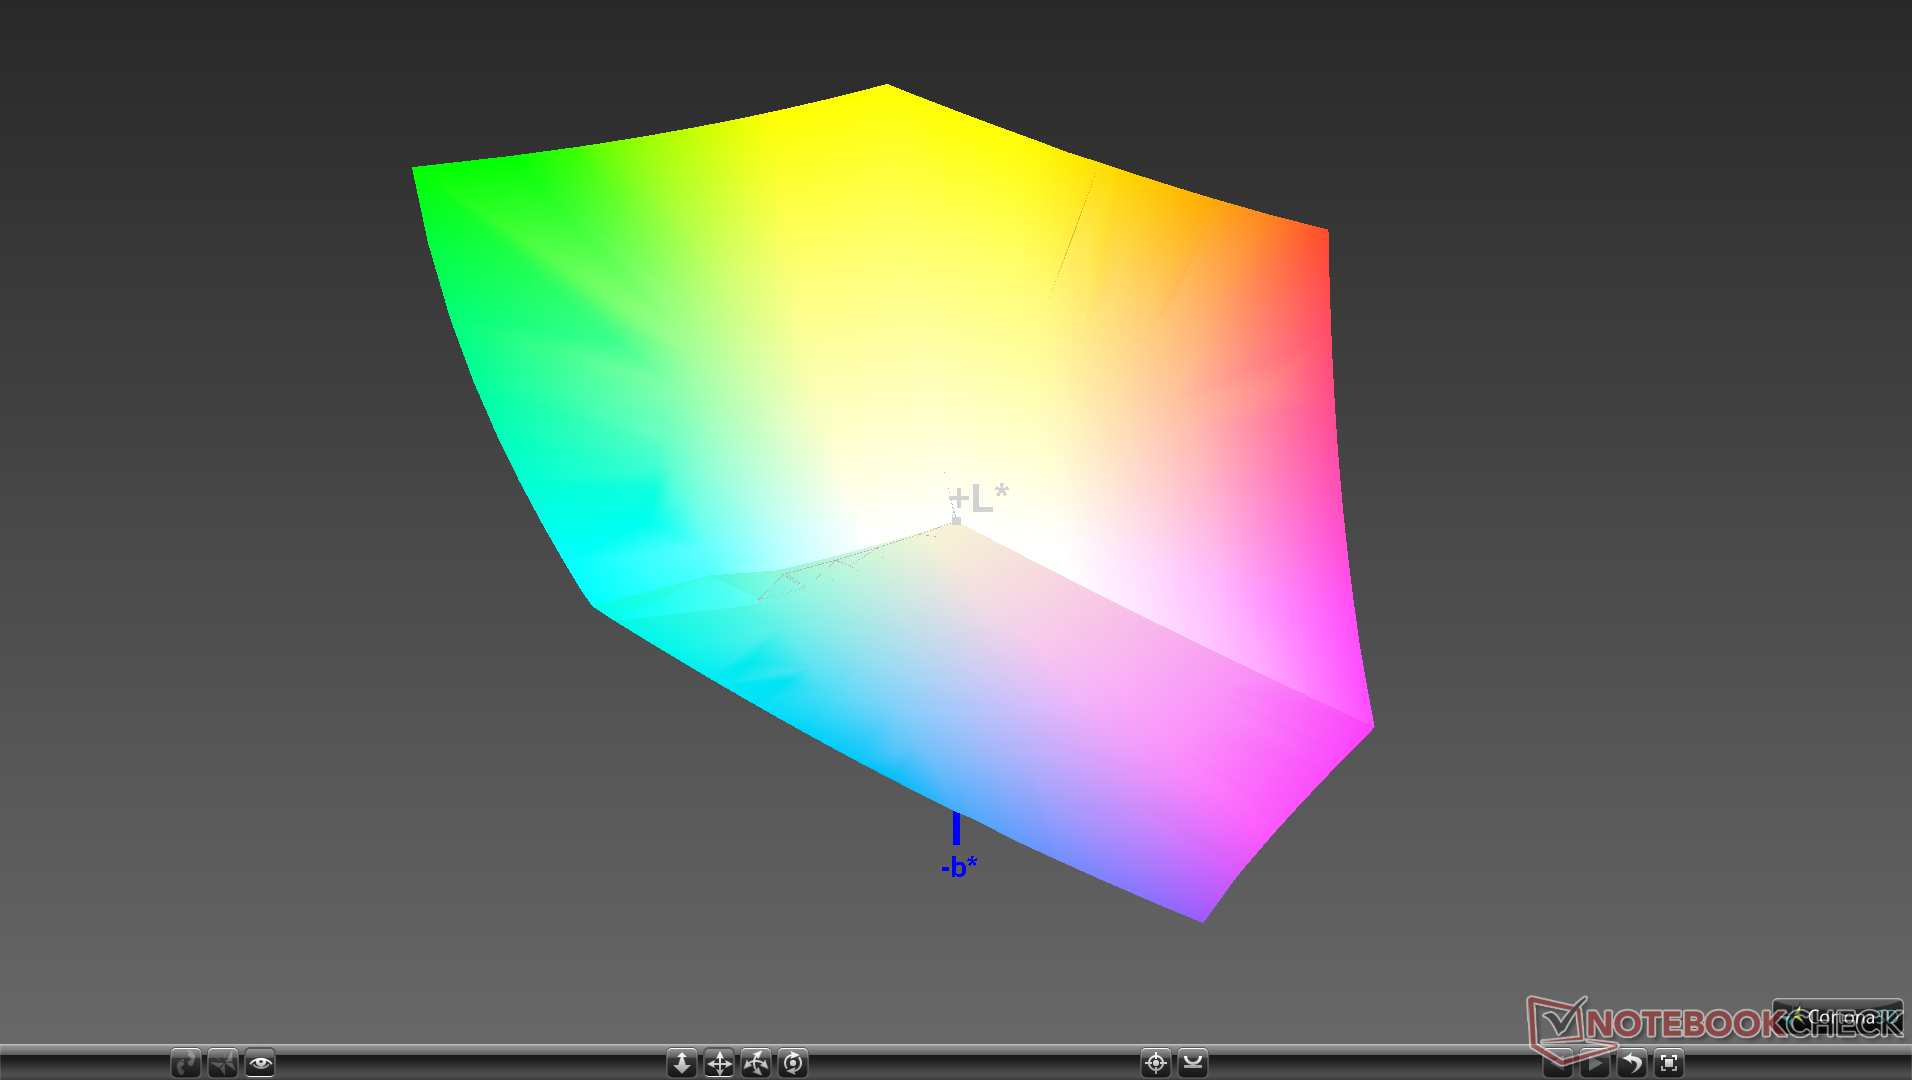
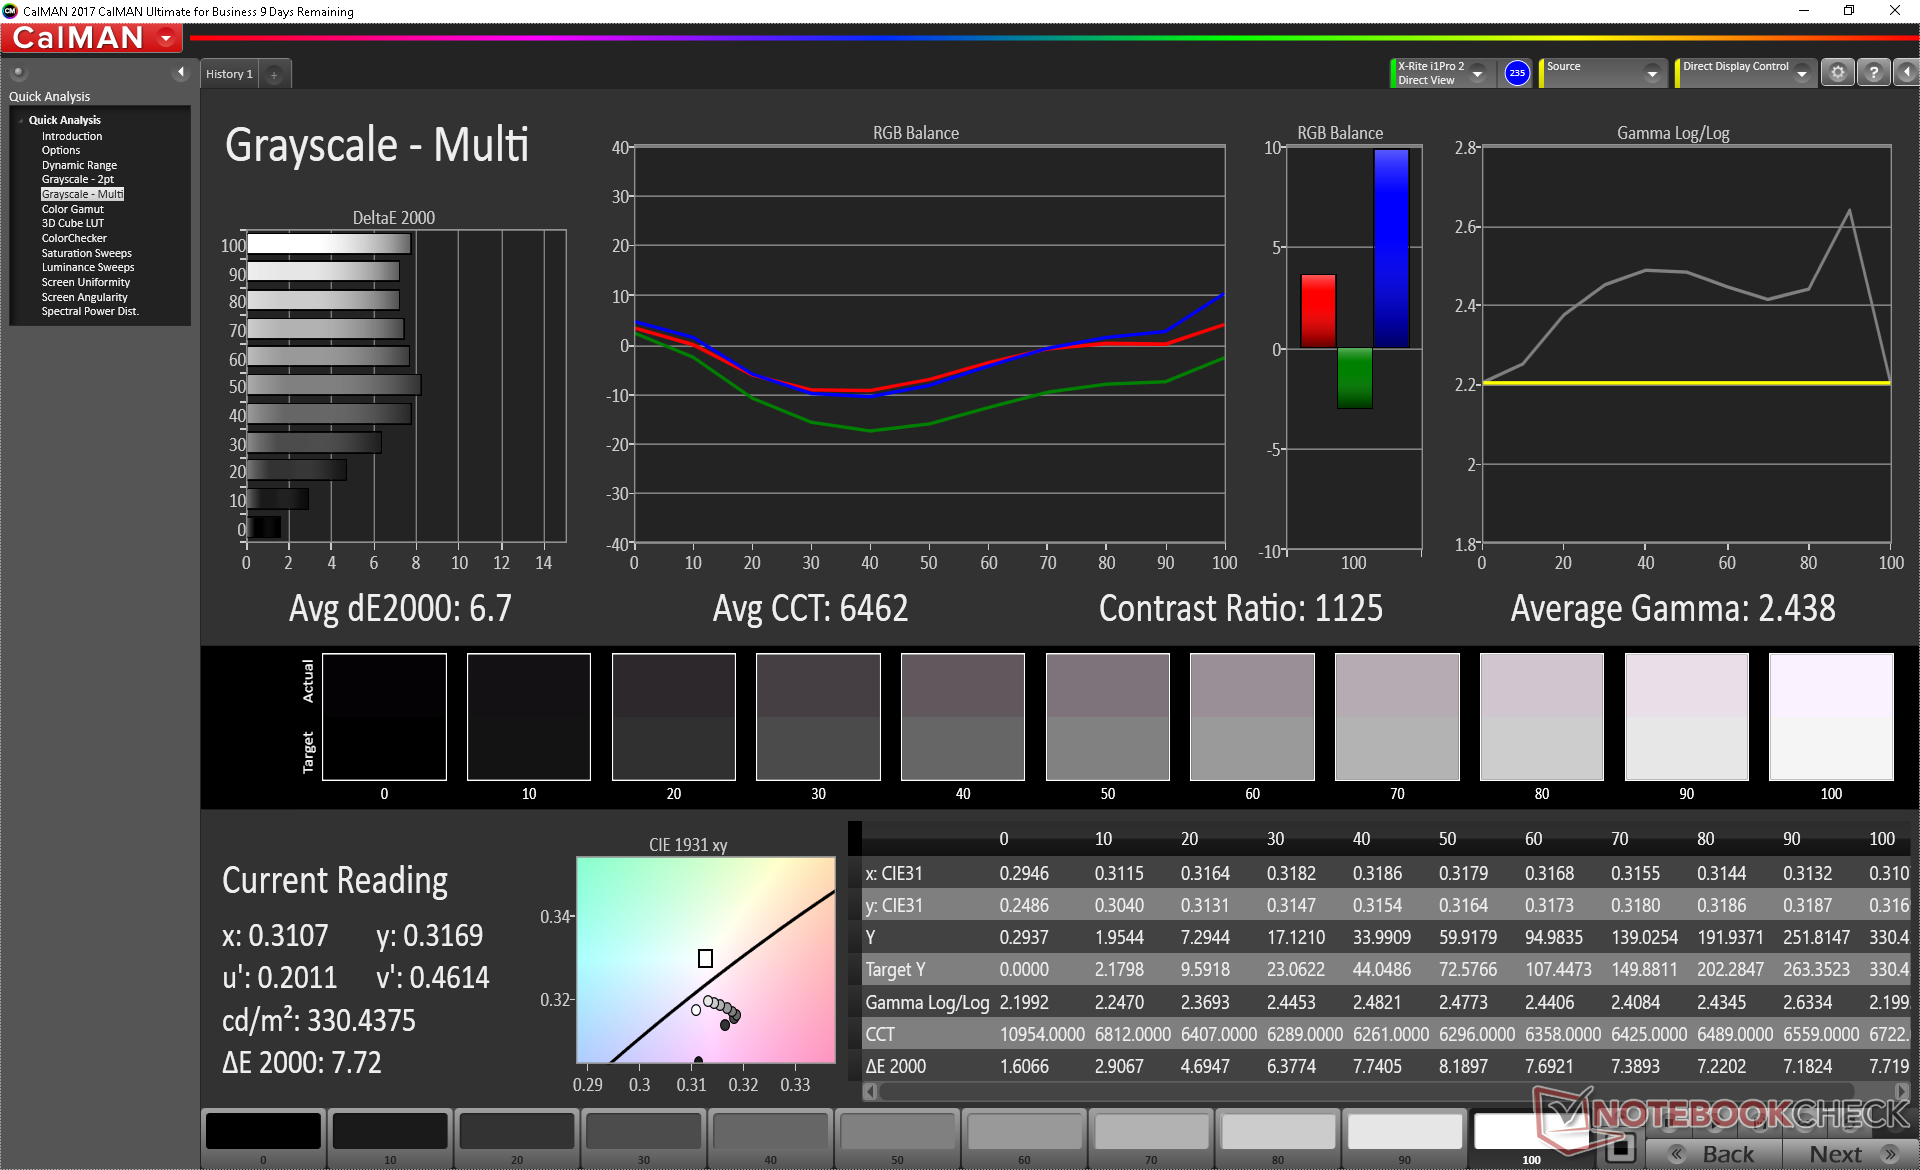
Colors and grayscale are average out of the box against the AdobeRGB standard with grays appearing a bit too red. Our calibration attempt addresses this for a more accurate display overall as shown by our CalMAN results below. A calibration is recommended to get the most out of the high quality panel.
Display Response Times
| ↔ Response Time Black to White | ||
|---|---|---|
| 31.6 ms ... rise ↗ and fall ↘ combined | ↗ 18 ms rise | 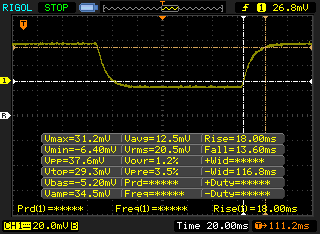 |
| ↘ 13.6 ms fall | ||
| The screen shows slow response rates in our tests and will be unsatisfactory for gamers. In comparison, all tested devices range from 0.1 (minimum) to 240 (maximum) ms. » 85 % of all devices are better. This means that the measured response time is worse than the average of all tested devices (19.8 ms). | ||
| ↔ Response Time 50% Grey to 80% Grey | ||
| 40 ms ... rise ↗ and fall ↘ combined | ↗ 18.8 ms rise | 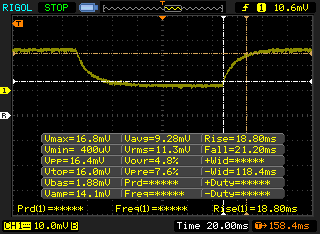 |
| ↘ 21.2 ms fall | ||
| The screen shows slow response rates in our tests and will be unsatisfactory for gamers. In comparison, all tested devices range from 0.165 (minimum) to 636 (maximum) ms. » 61 % of all devices are better. This means that the measured response time is worse than the average of all tested devices (31 ms). | ||
Screen Flickering / PWM (Pulse-Width Modulation)
| Screen flickering / PWM not detected | 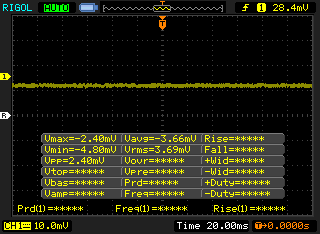 | ||
In comparison: 52 % of all tested devices do not use PWM to dim the display. If PWM was detected, an average of 7769 (minimum: 5 - maximum: 343500) Hz was measured. | |||
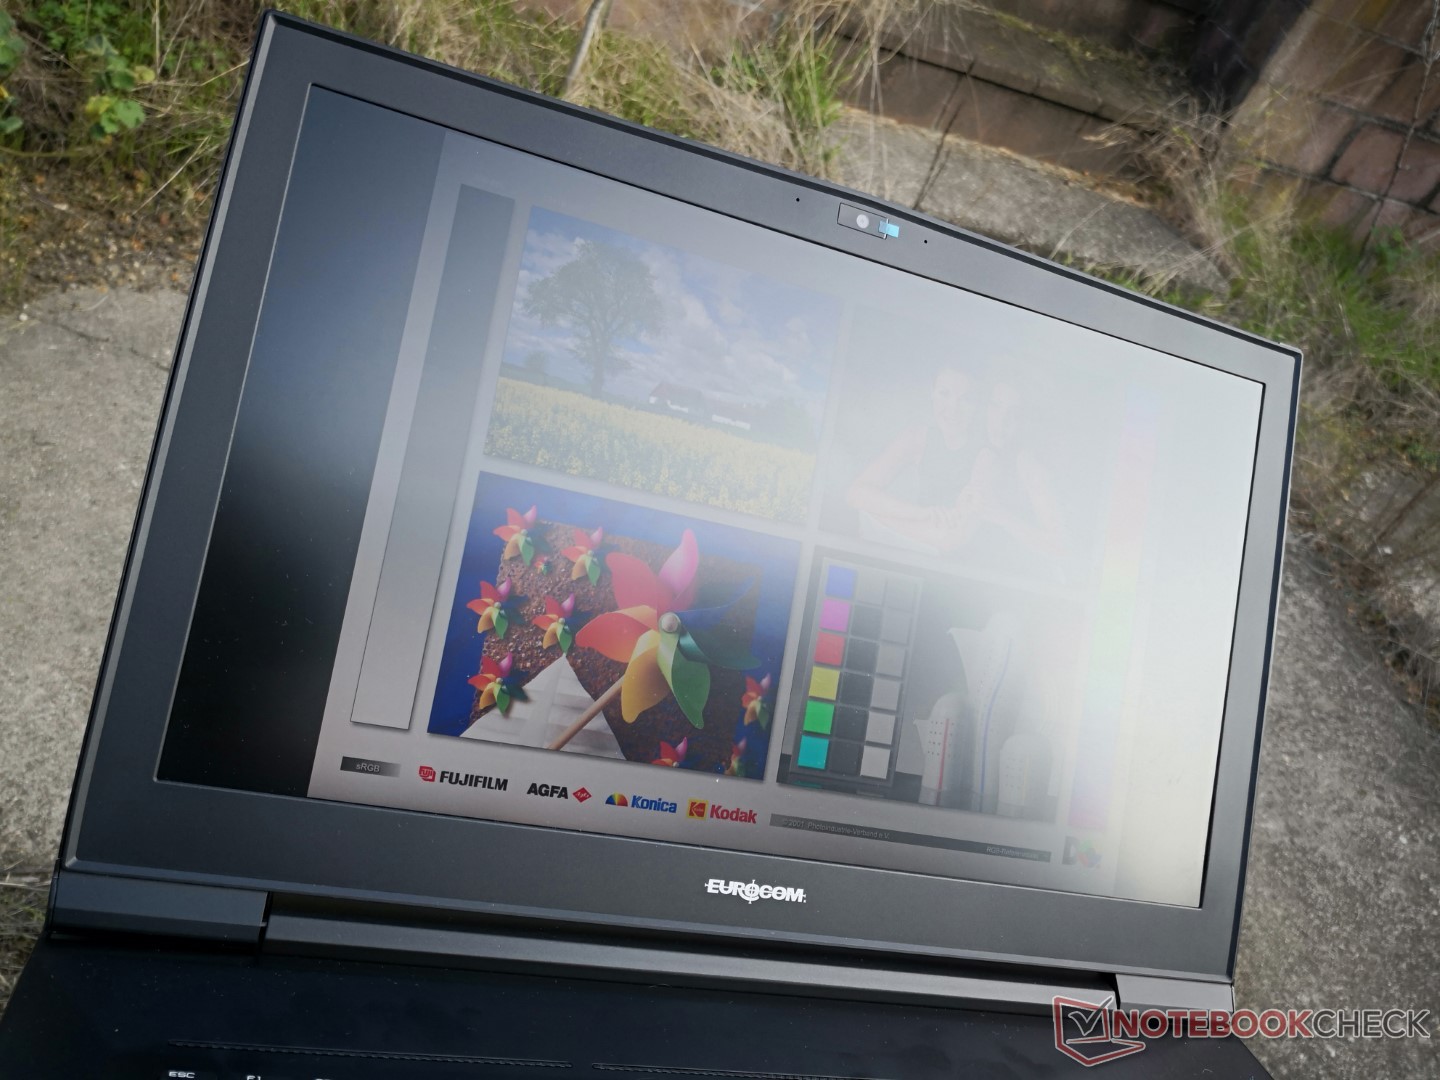
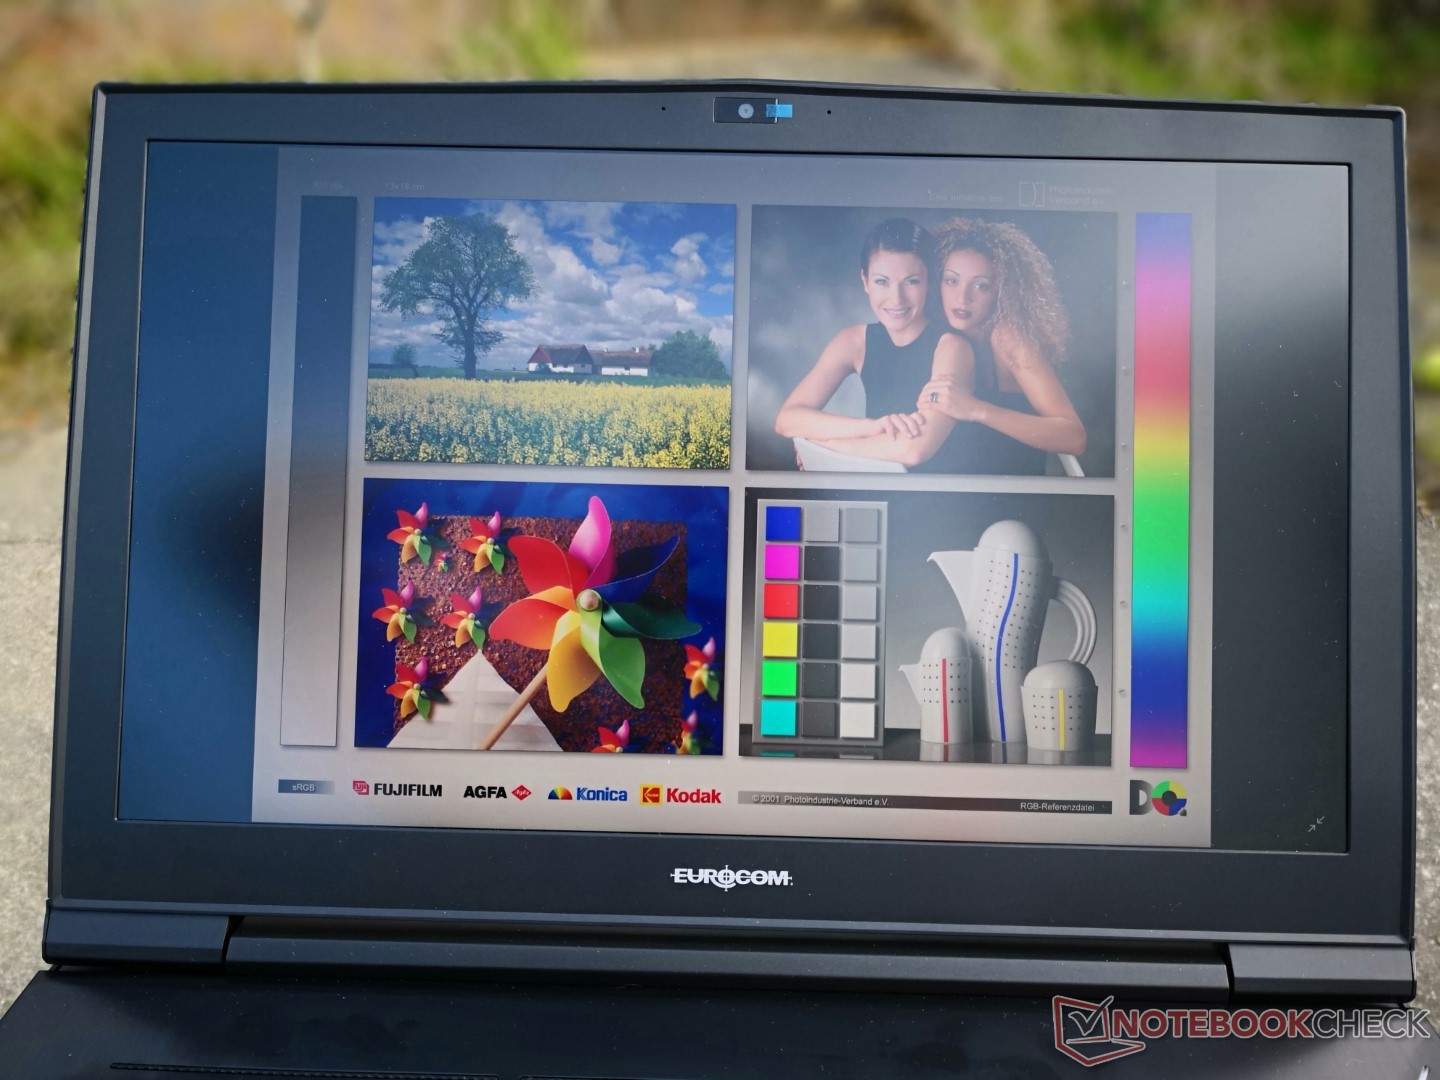
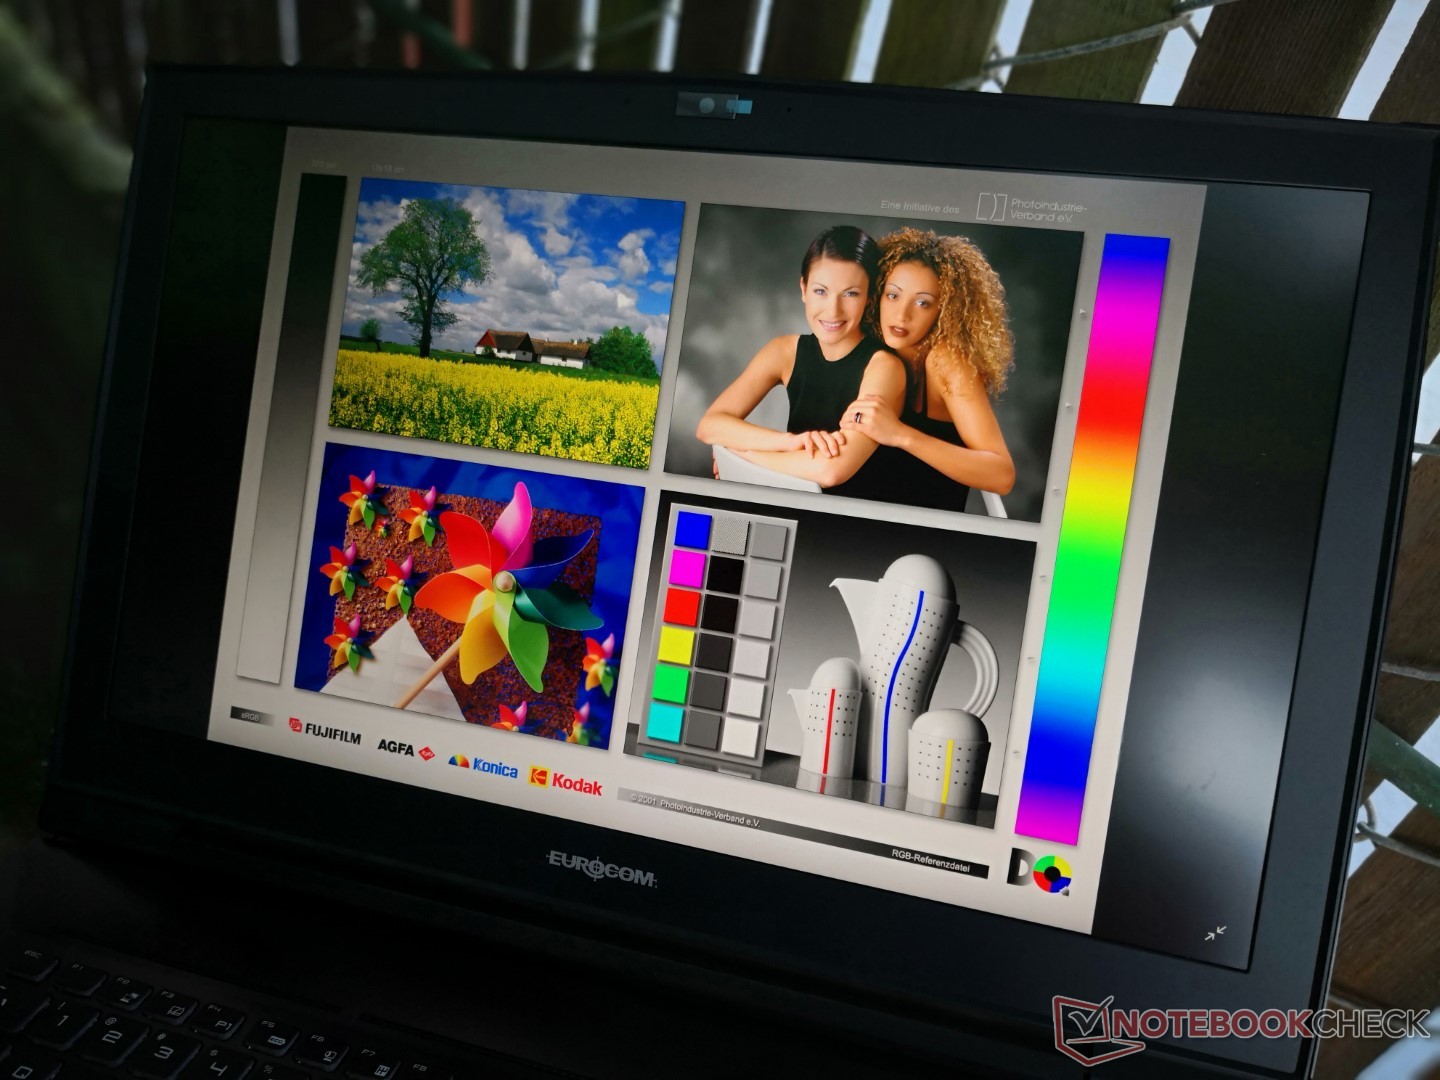
Outdoor visibility is not unlike most other gaming laptops. The matte panel helps to reduce glare, but the backlight is not powerful enough to overcome ambient lighting conditions. Remain under shade if outdoor use is unavoidable.

Performance
Processor
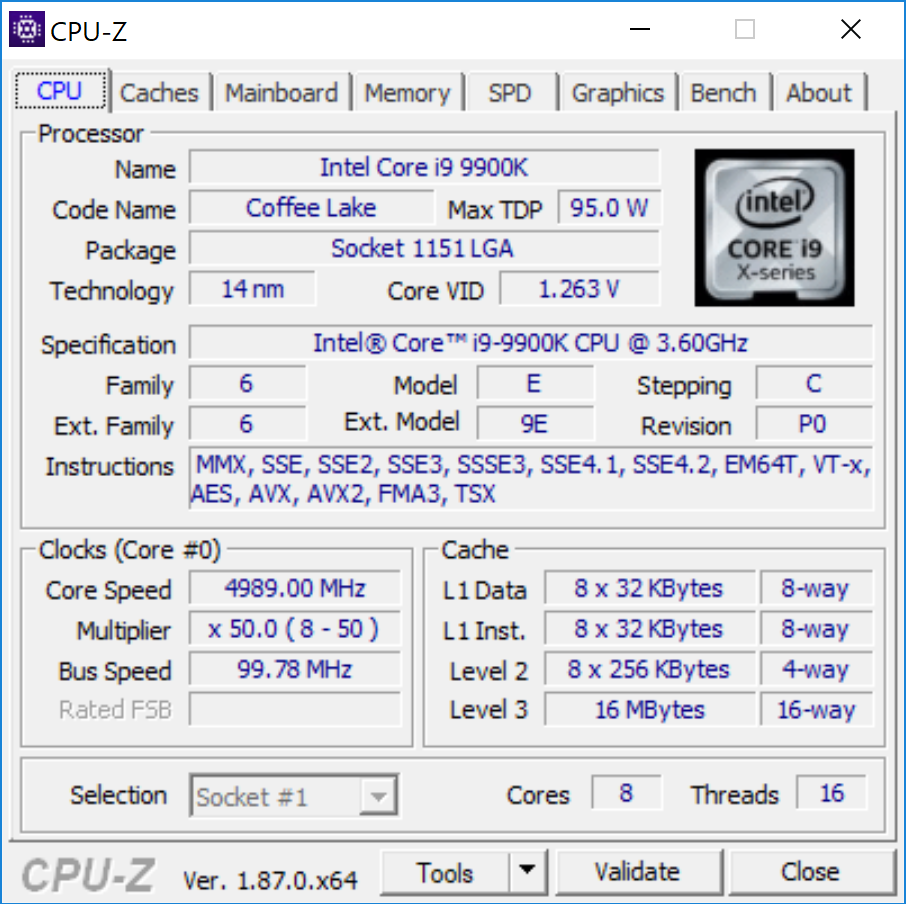
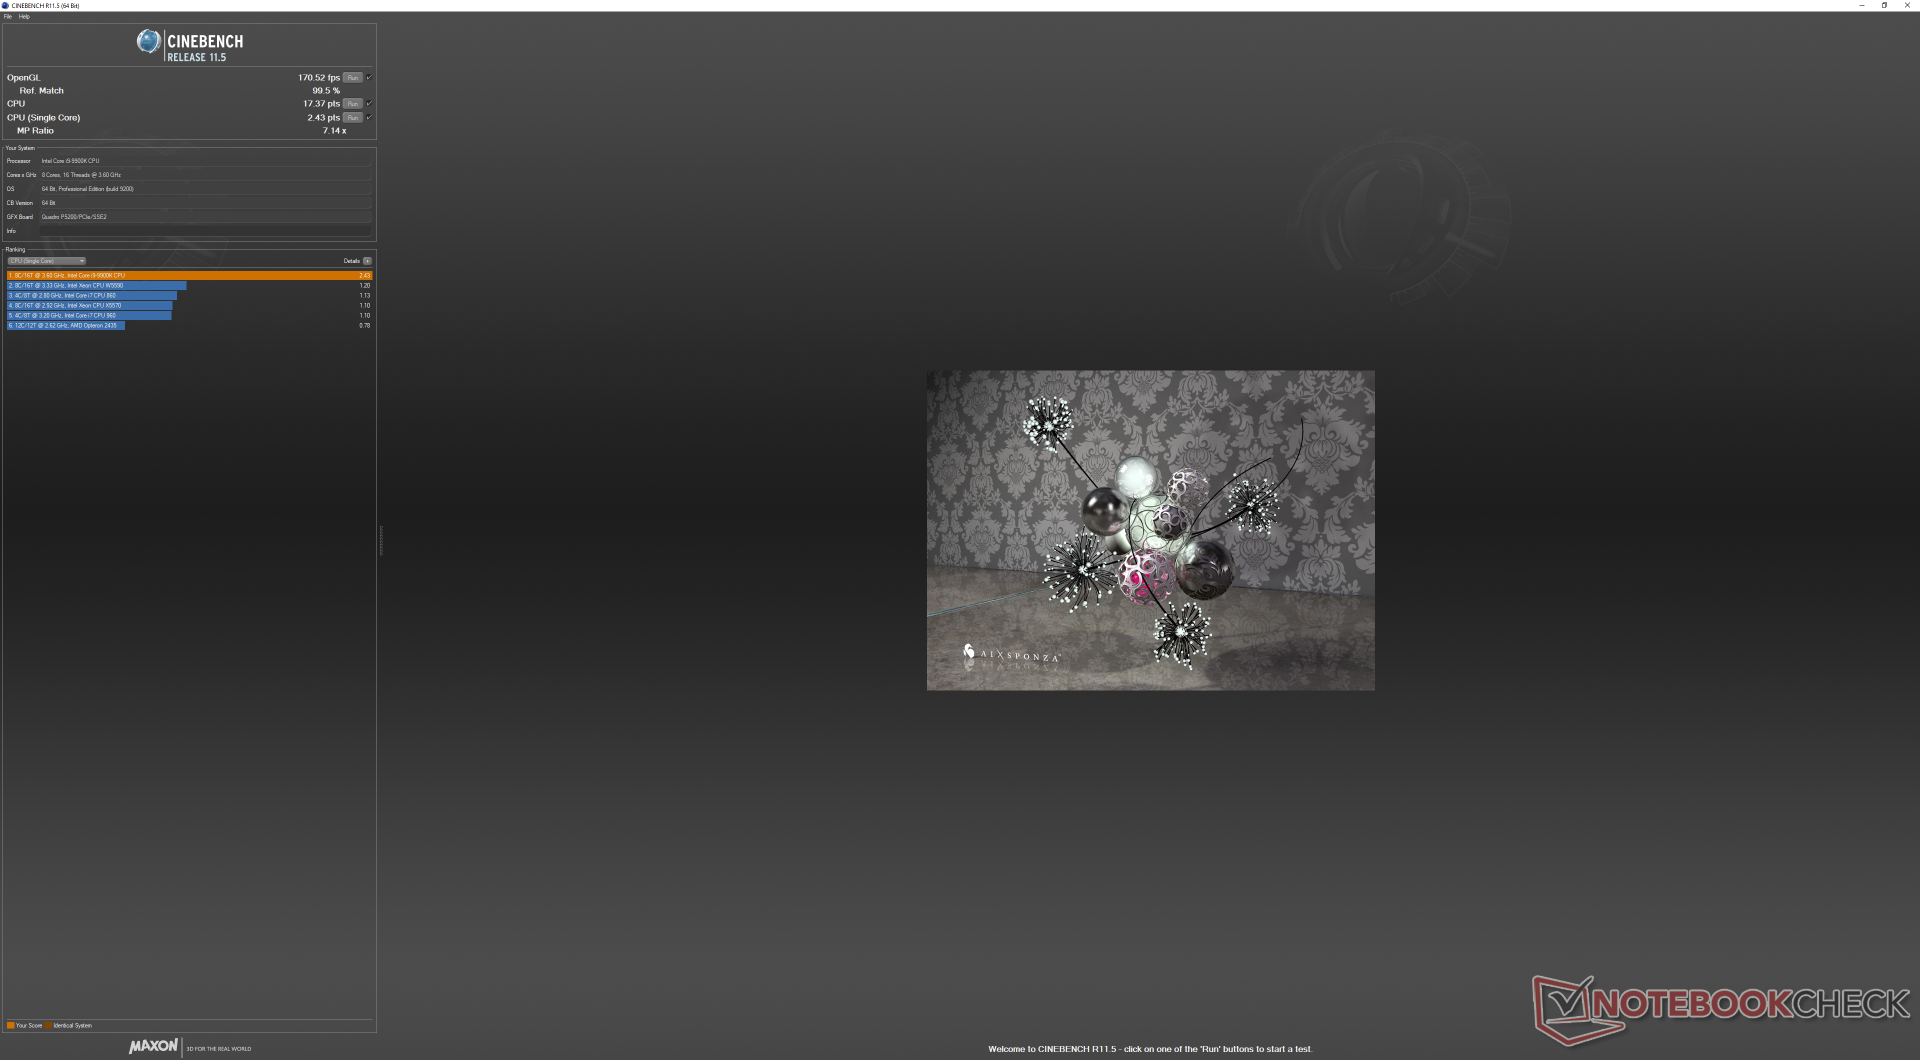
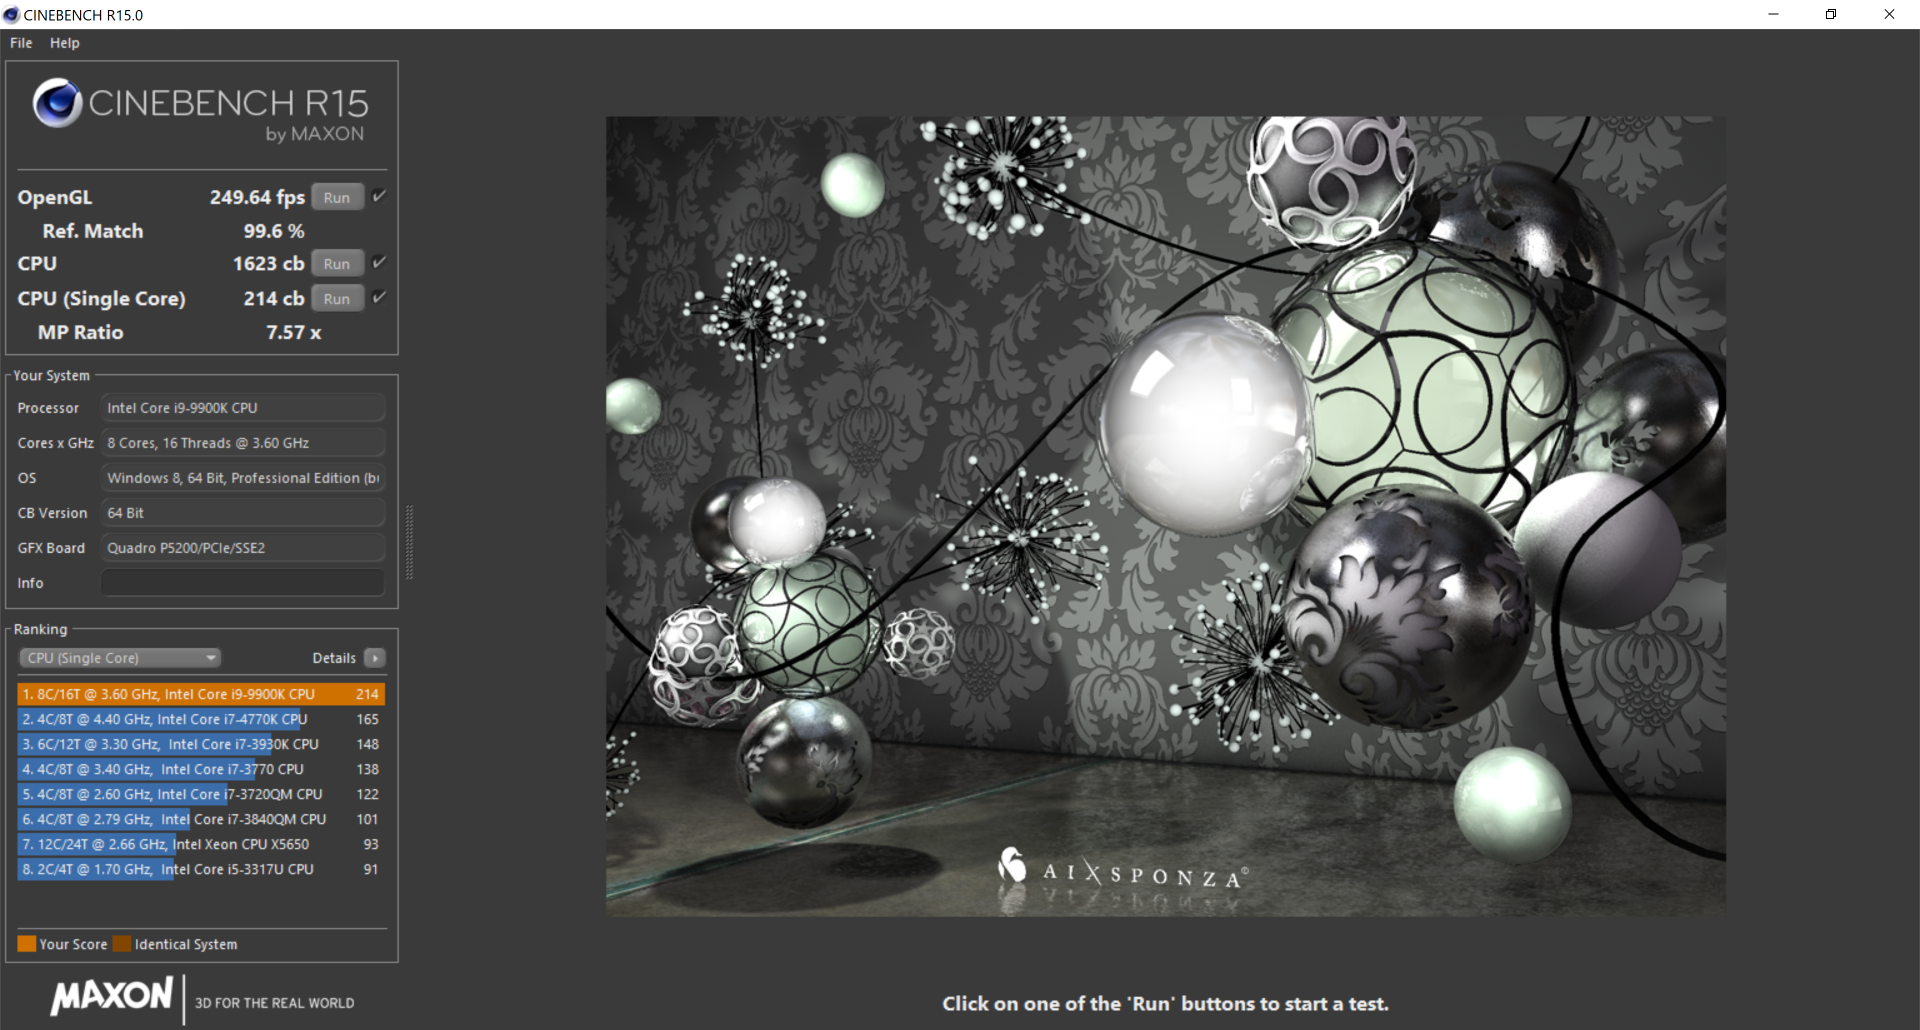
The Core i9-9900K in our Eurocom laptop is approximately 16 to 25 percent slower than the same CPU in our "proper" desktop PC according to CineBench R15 Multi-Thread. Even the Schenker XMG Ultra 17 with the same CPU is able to run faster than our Eurocom as shown by our CineBench R15 loop test below. Activating Turbo Fan mode on our Eurocom does not appear to boost clock rates or performance.
Users upgrading from the Core i7-8700K in the Eurocom Sky X7C will see a 22 percent boost in multi-thread performance.
See our full review on the Core i9-9900K for more technical information and benchmark comparisons.
* ... smaller is better
System Performance
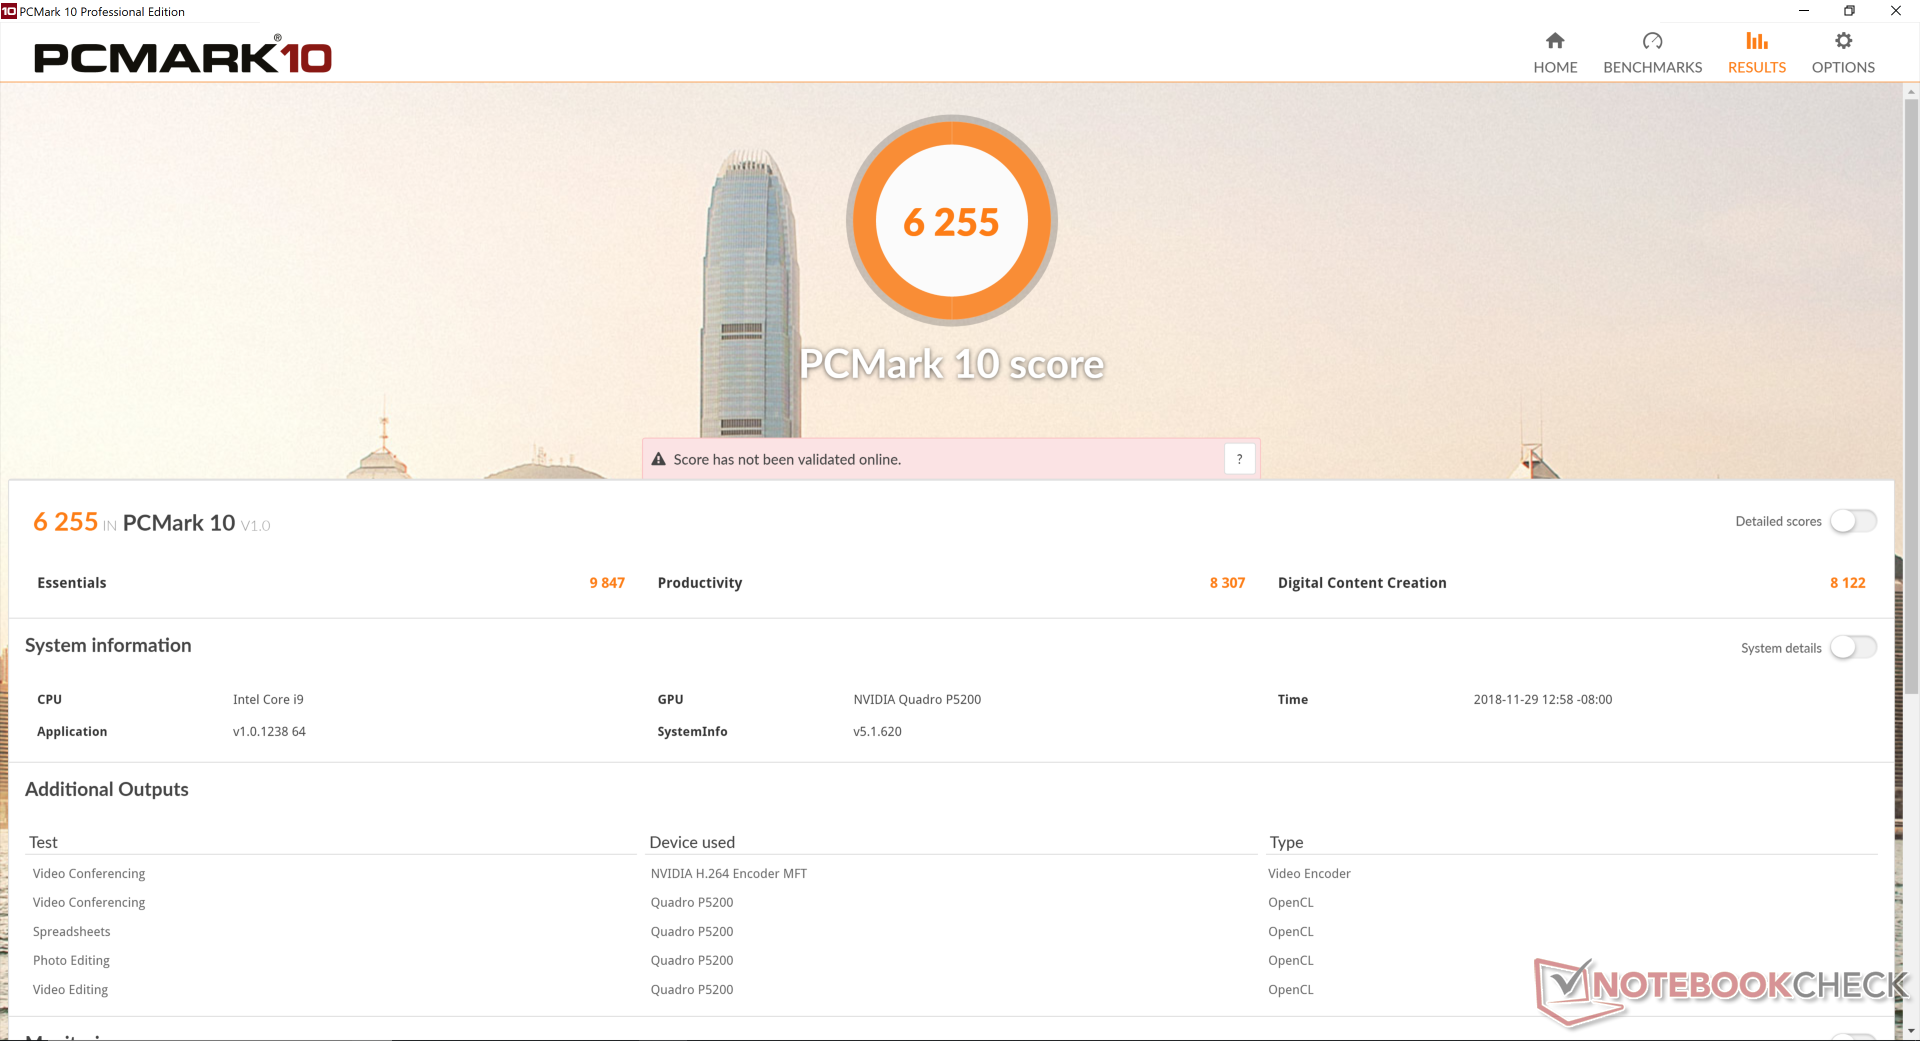
PCMark benchmarks rank our Eurocom just slightly below the Sky X9C and other high-performance laptops with the GTX 1080 GPU. Results are still about 10 to 20 percent better than the Tornado F5W with Quadro P5000 graphics. We didn't experience any software or hardware hiccups during our time with the test unit.
Strangely, our system refuses to enter BIOS during boot up. The first few attempts resulted in errors before ignoring our key inputs entirely.
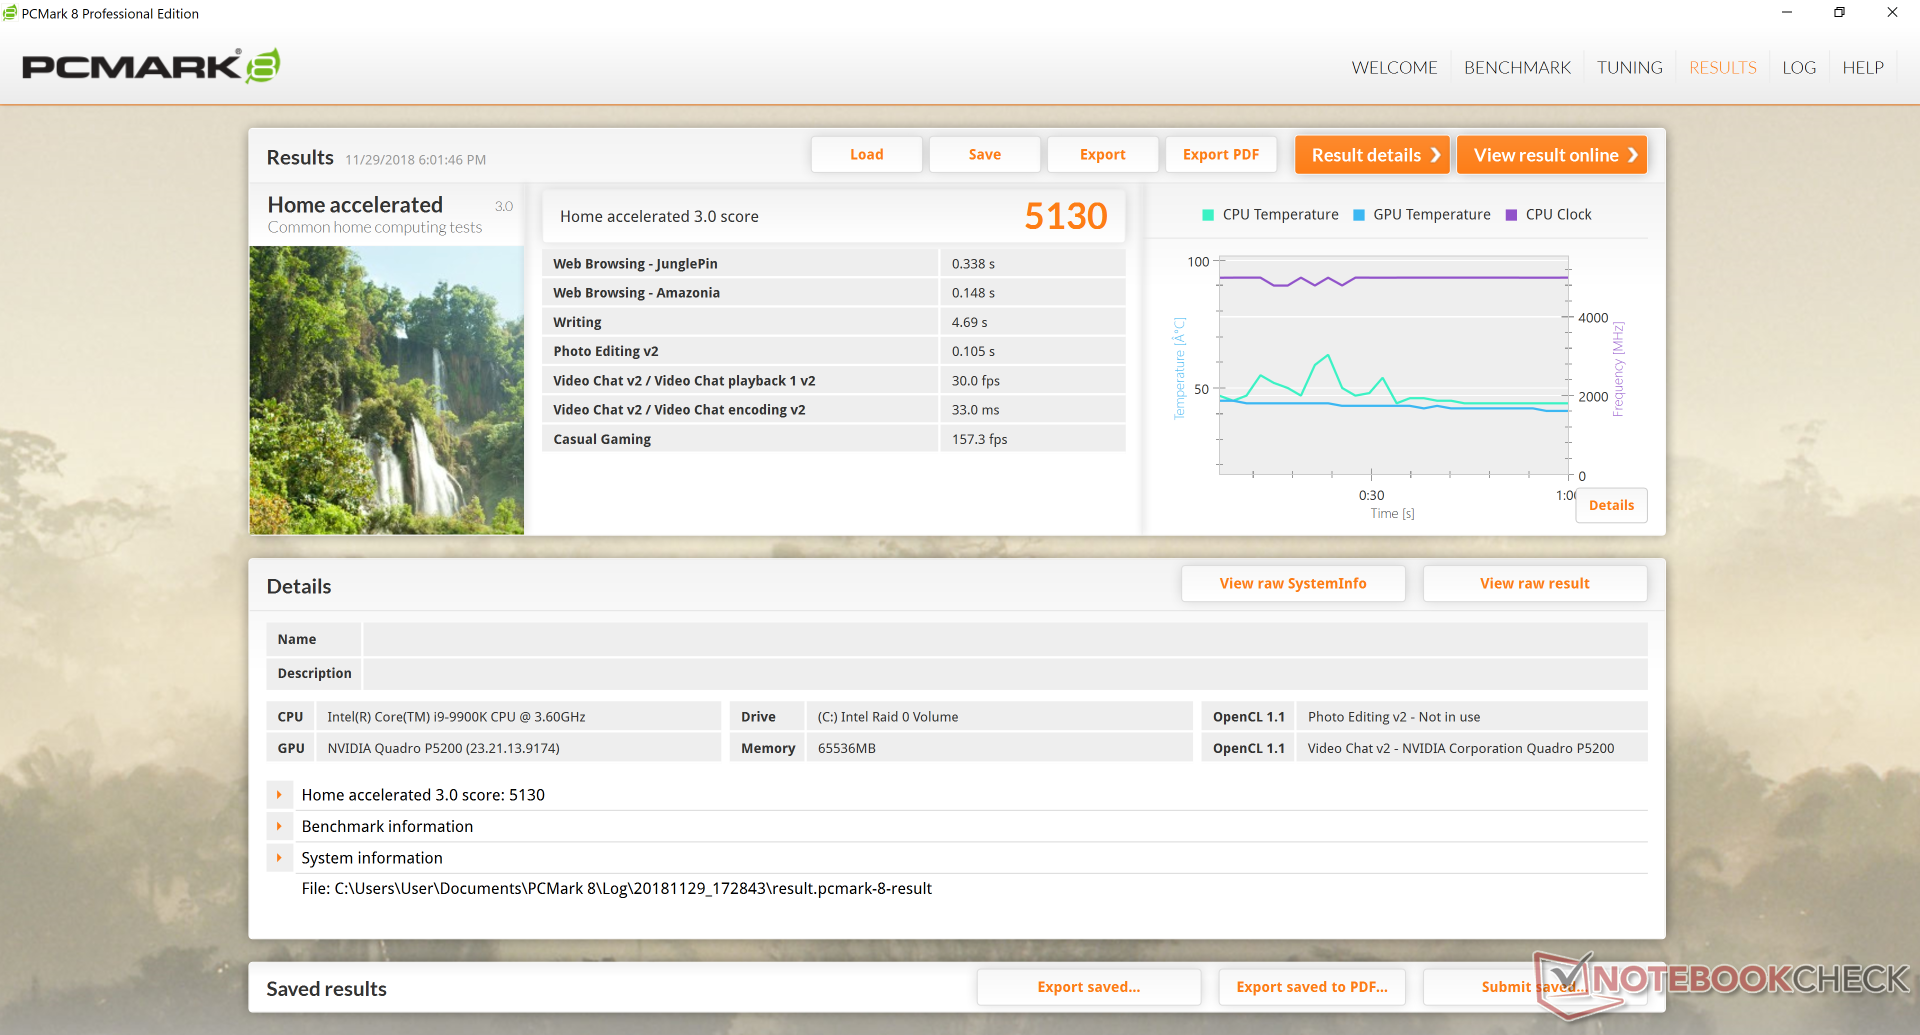
| PCMark 8 Home Score Accelerated v2 | 5130 points | |
| PCMark 10 Score | 6255 points | |
Help | ||
Storage Devices
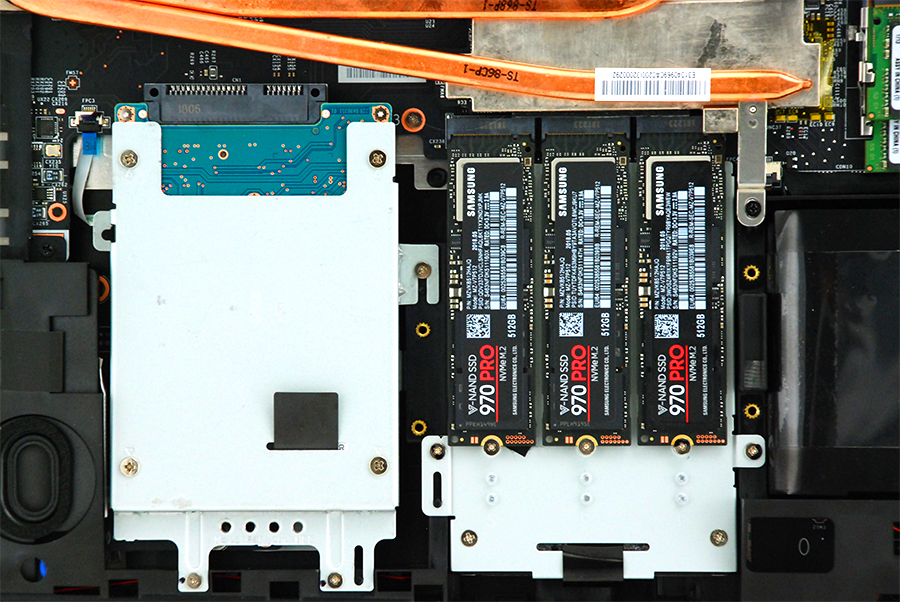
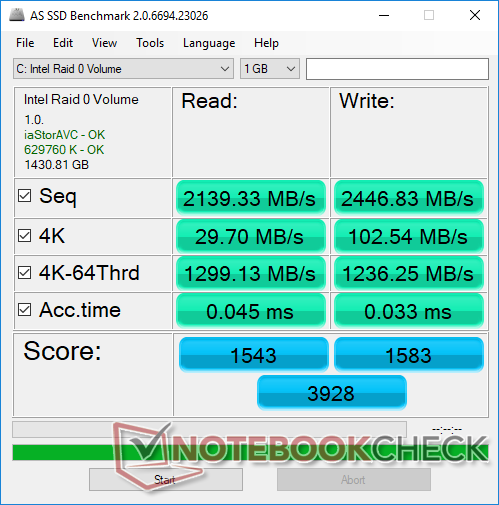
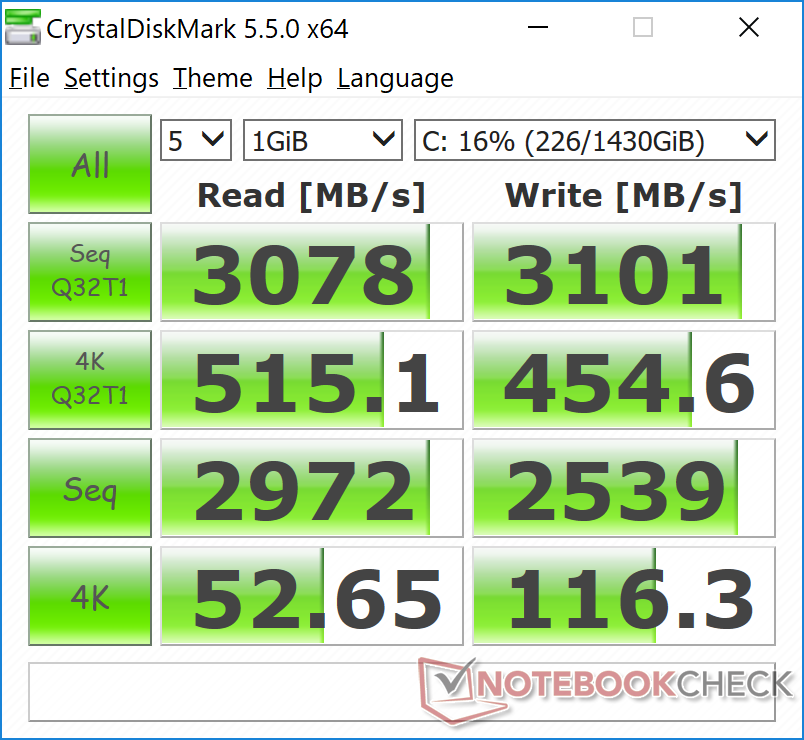
Our test unit is equipped with 3x 512 GB Samsung SSD 970 PRO in RAID 0. Sequential read and write rates are unsurprisingly speedy, but they are only marginally better than 2x Samsung PM961 SSDs in RAID 0. Interestingly, overall performance is slower than our 2x Samsung SSD 970 is RAID 0. Having two Intel SSD 760p SSDs in RAID 0 alongside a single Samsung SM961, like on our Asus Chimera G703GI configuration, is the way to go if extremely high storage performance is desired.
See our table of HDDs and SSDs for more benchmark comparisons.
| Eurocom Tornado F7W 3x Samsung SSD 970 Pro 512GB (RAID 0) | Eurocom Sky X7C 2x Samsung SSD 970 Pro 512GB (RAID 0) | Asus Chimera G703GI 2x Intel 760p 512 GB + 1x Samsung SM961 512 GB (RAID) | MSI GT75 8RG-090 Titan 2x Samsung PM961 MZVLW256HEHP (RAID 0) | Eurocom Tornado F5 Samsung SSD 960 Pro 512 GB m.2 | |
|---|---|---|---|---|---|
| AS SSD | 11% | 43% | 3% | 11% | |
| Seq Read (MB/s) | 2139 | 3147 47% | 4886 128% | 3058 43% | 2819 32% |
| Seq Write (MB/s) | 2447 | 2866 17% | 4110 68% | 2196 -10% | 2046 -16% |
| 4K Read (MB/s) | 29.7 | 48.74 64% | 57.4 93% | 38.37 29% | 51 72% |
| 4K Write (MB/s) | 102.5 | 116.7 14% | 141.3 38% | 97.7 -5% | 150.5 47% |
| 4K-64 Read (MB/s) | 1299 | 1348 4% | 1453 12% | 1347 4% | 1179 -9% |
| 4K-64 Write (MB/s) | 1236 | 1203 -3% | 1303 5% | 1236 0% | 1334 8% |
| Access Time Read * (ms) | 0.045 | 0.034 24% | 0.03 33% | 0.056 -24% | 0.03 33% |
| Access Time Write * (ms) | 0.033 | 0.032 3% | 0.026 21% | 0.038 -15% | 0.024 27% |
| Score Read (Points) | 1543 | 1712 11% | 1999 30% | 1691 10% | 1512 -2% |
| Score Write (Points) | 1583 | 1606 1% | 1855 17% | 1553 -2% | 1689 7% |
| Score Total (Points) | 3928 | 4184 7% | 4843 23% | 4066 4% | 3943 0% |
| Copy ISO MB/s (MB/s) | 2320 | 2330 0% | 1614 -30% | ||
| Copy Program MB/s (MB/s) | 621 | 518 -17% | 635 2% | ||
| Copy Game MB/s (MB/s) | 1585 | 1321 -17% | 1310 -17% | ||
| CrystalDiskMark 5.2 / 6 | 11% | 44% | -11% | ||
| Write 4K (MB/s) | 116.3 | 152.2 31% | 130.2 12% | 111.8 -4% | |
| Read 4K (MB/s) | 52.7 | 60.4 15% | 57.3 9% | 42.09 -20% | |
| Write Seq (MB/s) | 2539 | 3002 18% | 4049 59% | 2288 -10% | |
| Read Seq (MB/s) | 2972 | 3329 12% | 5325 79% | 3321 12% | |
| Write 4K Q32T1 (MB/s) | 454.6 | 432.9 -5% | 383.2 -16% | 308.3 -32% | |
| Read 4K Q32T1 (MB/s) | 515 | 494 -4% | 424.9 -17% | 364.9 -29% | |
| Write Seq Q32T1 (MB/s) | 3101 | 3391 9% | 4316 39% | 2440 -21% | |
| Read Seq Q32T1 (MB/s) | 3078 | 3405 11% | 8905 189% | 3485 13% | |
| Total Average (Program / Settings) | 11% /
11% | 44% /
43% | -4% /
-3% | 11% /
11% |
* ... smaller is better

GPU Performance
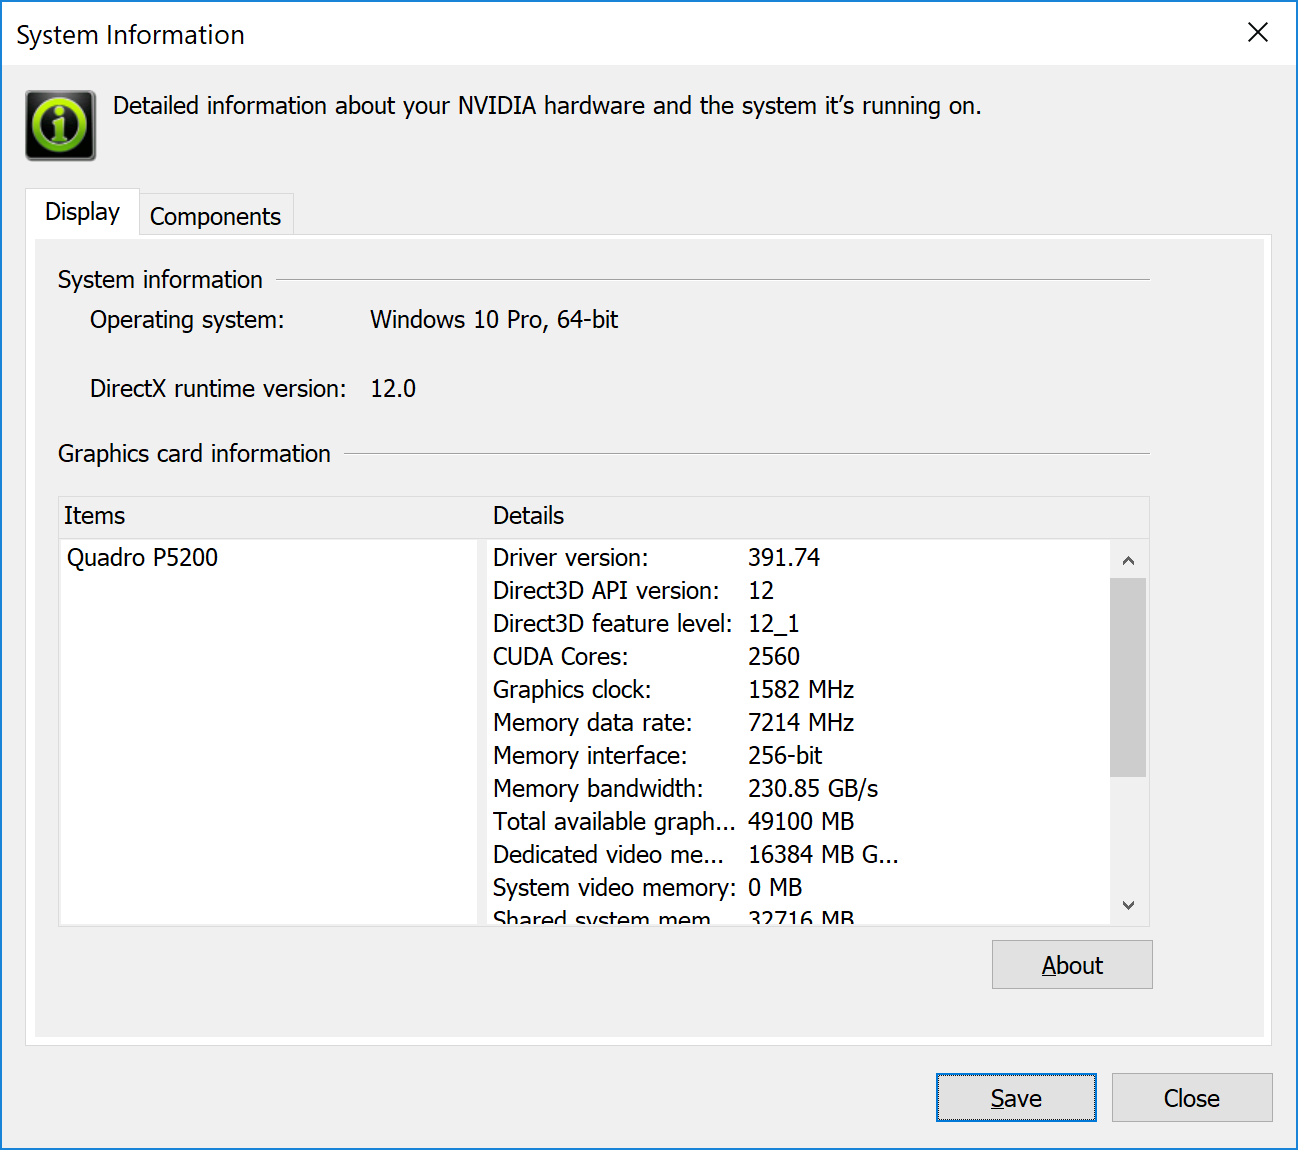
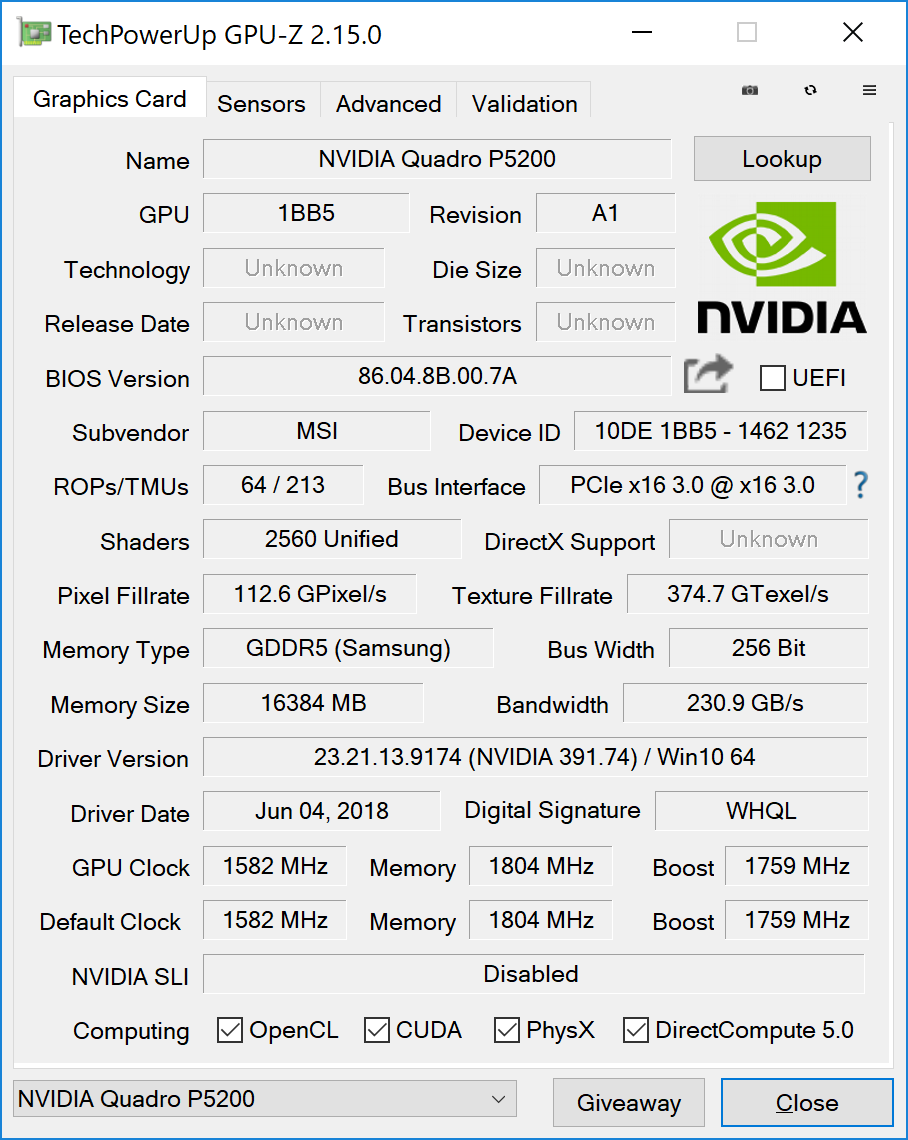
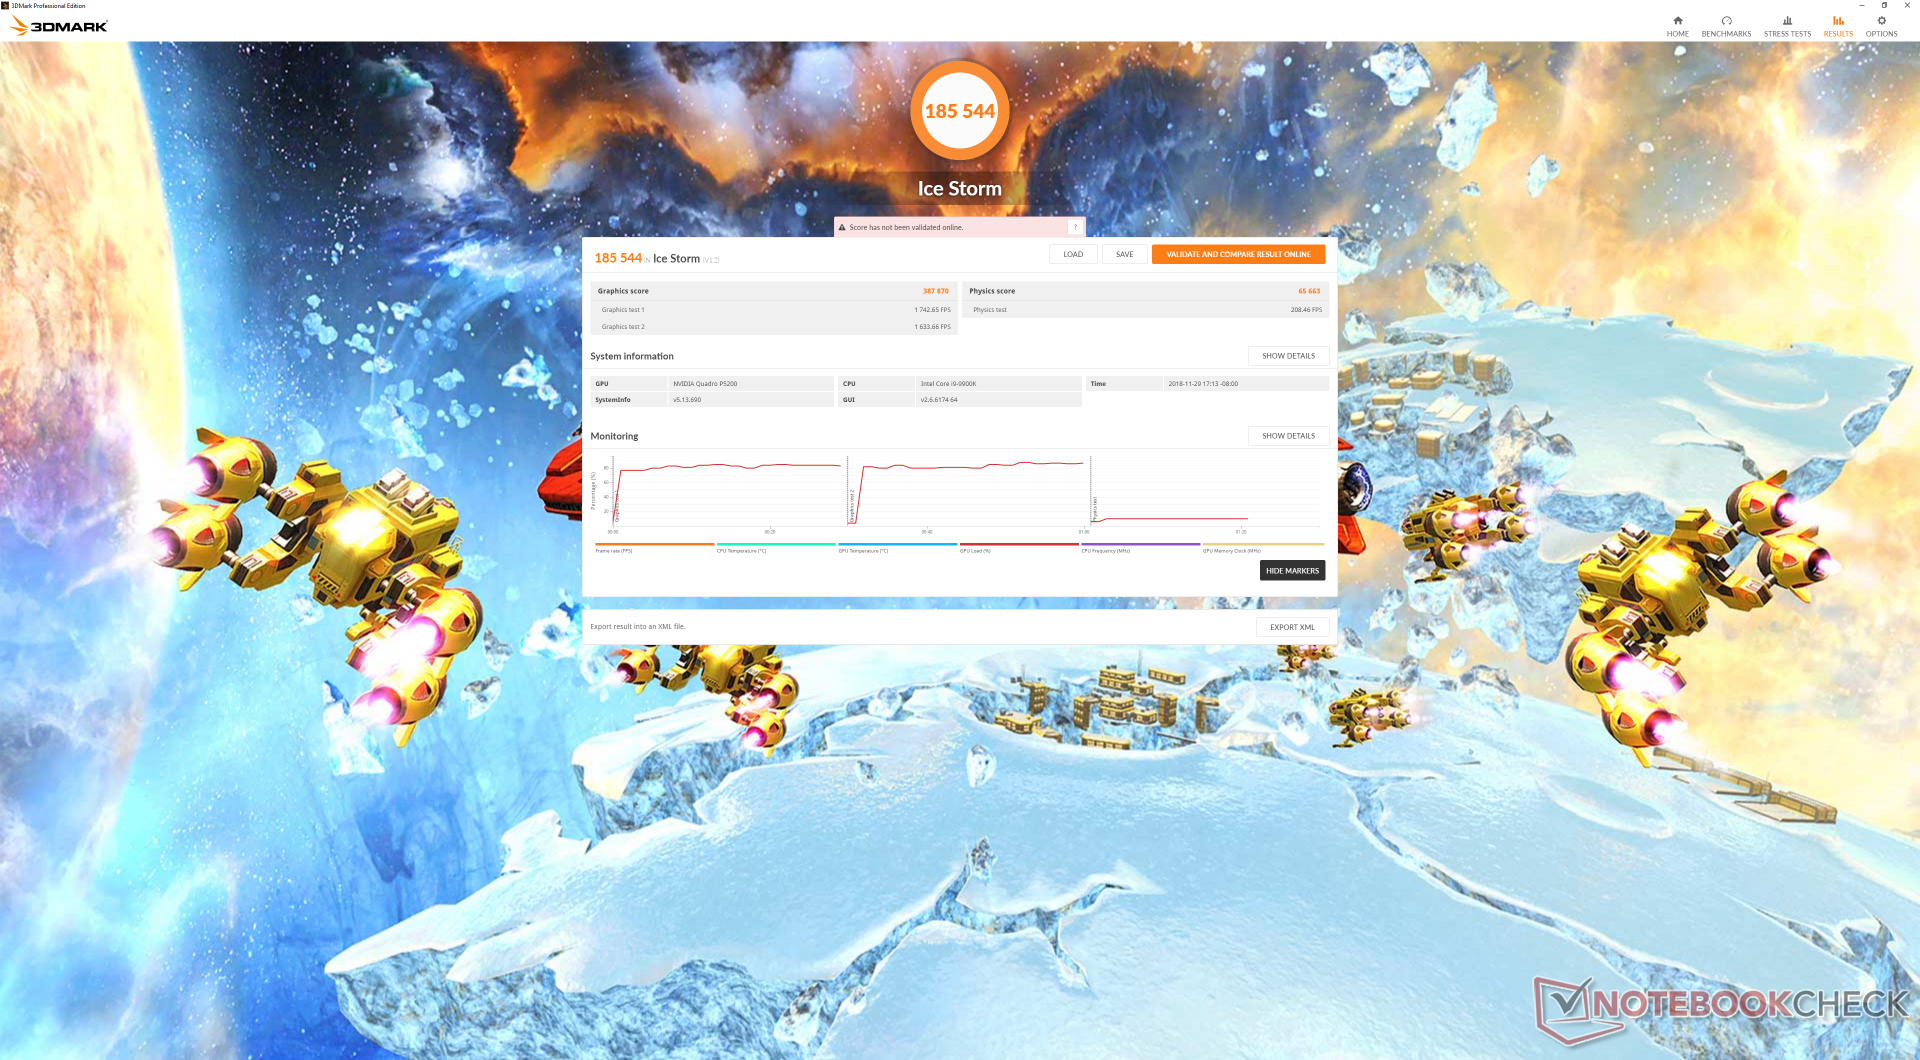
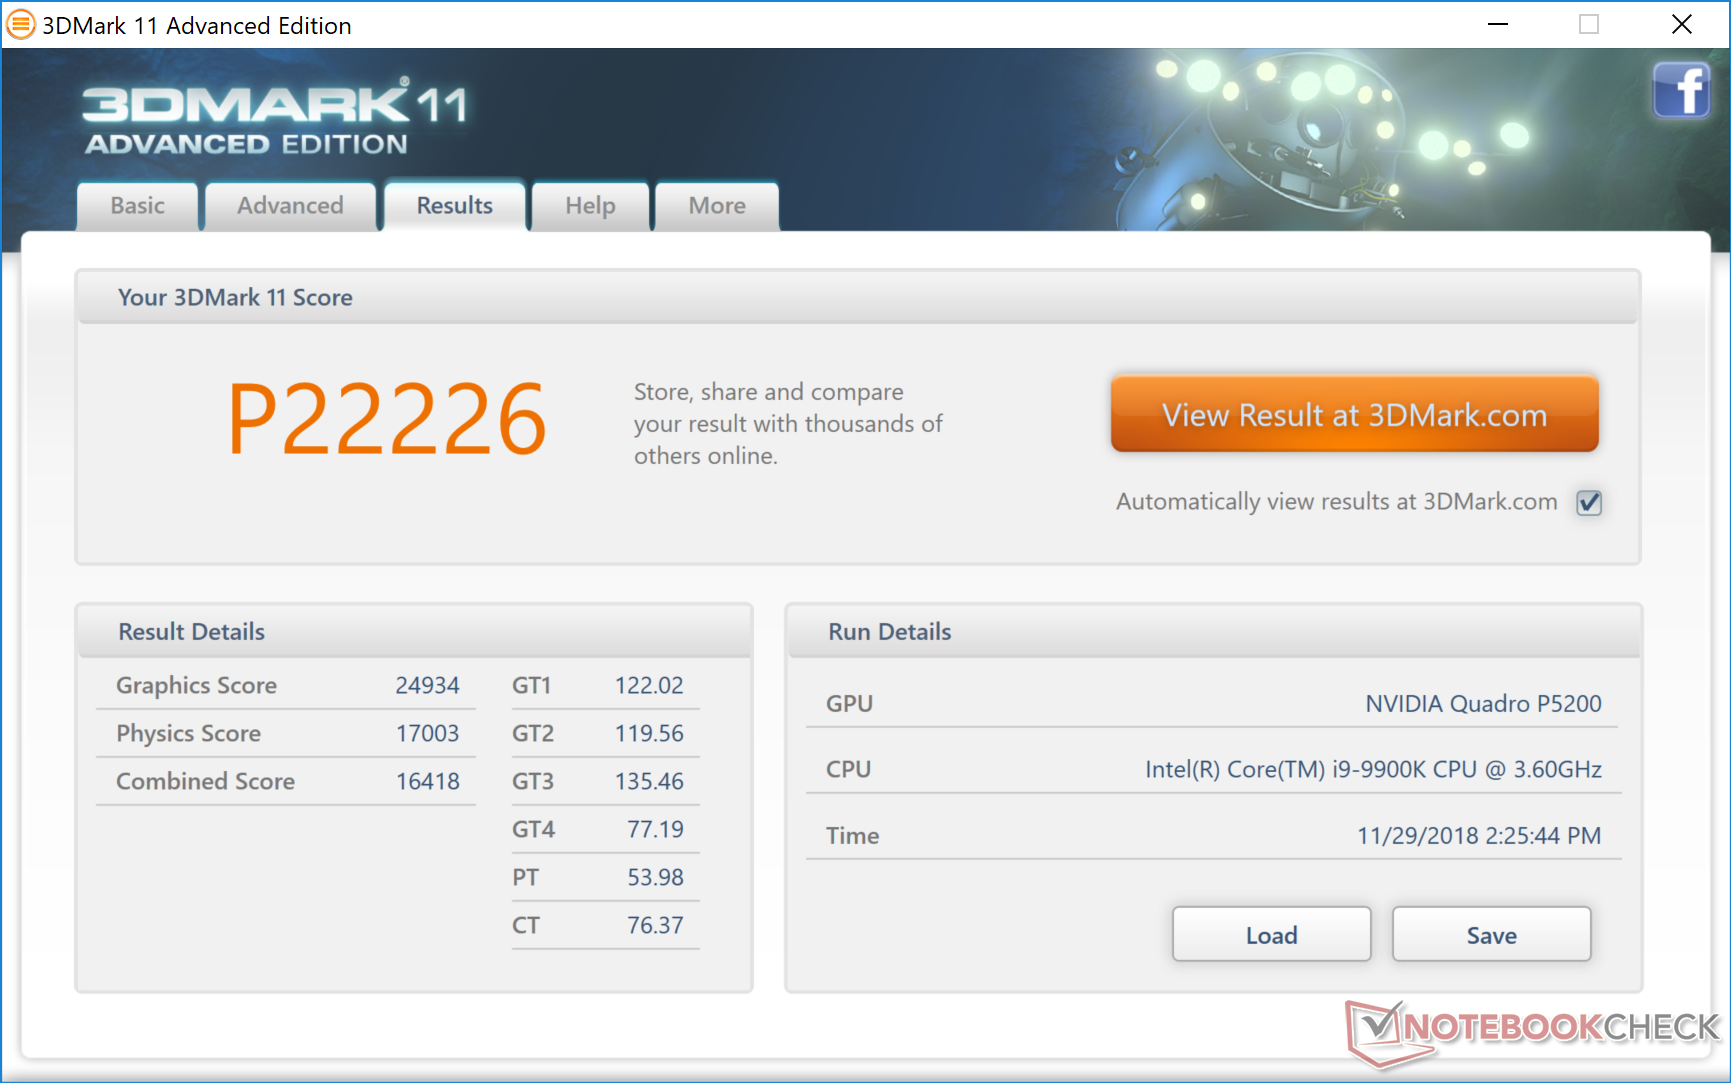
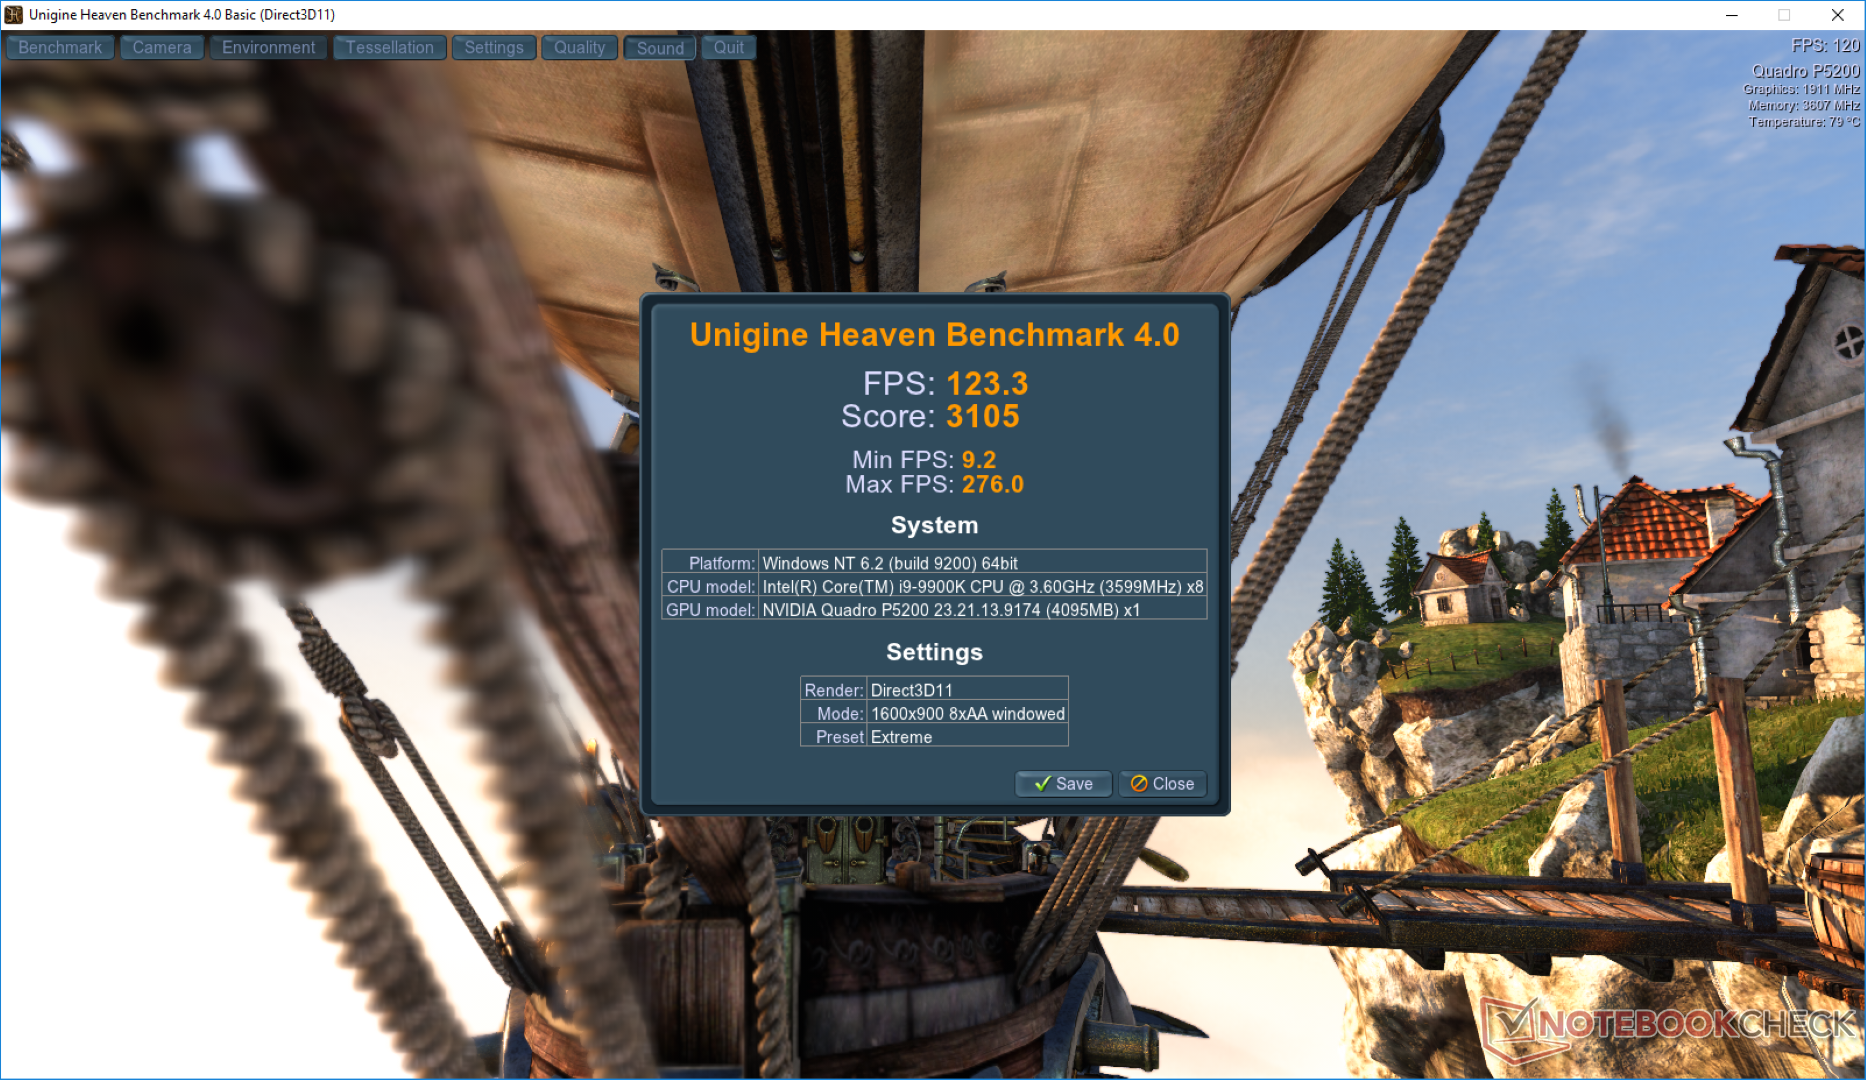
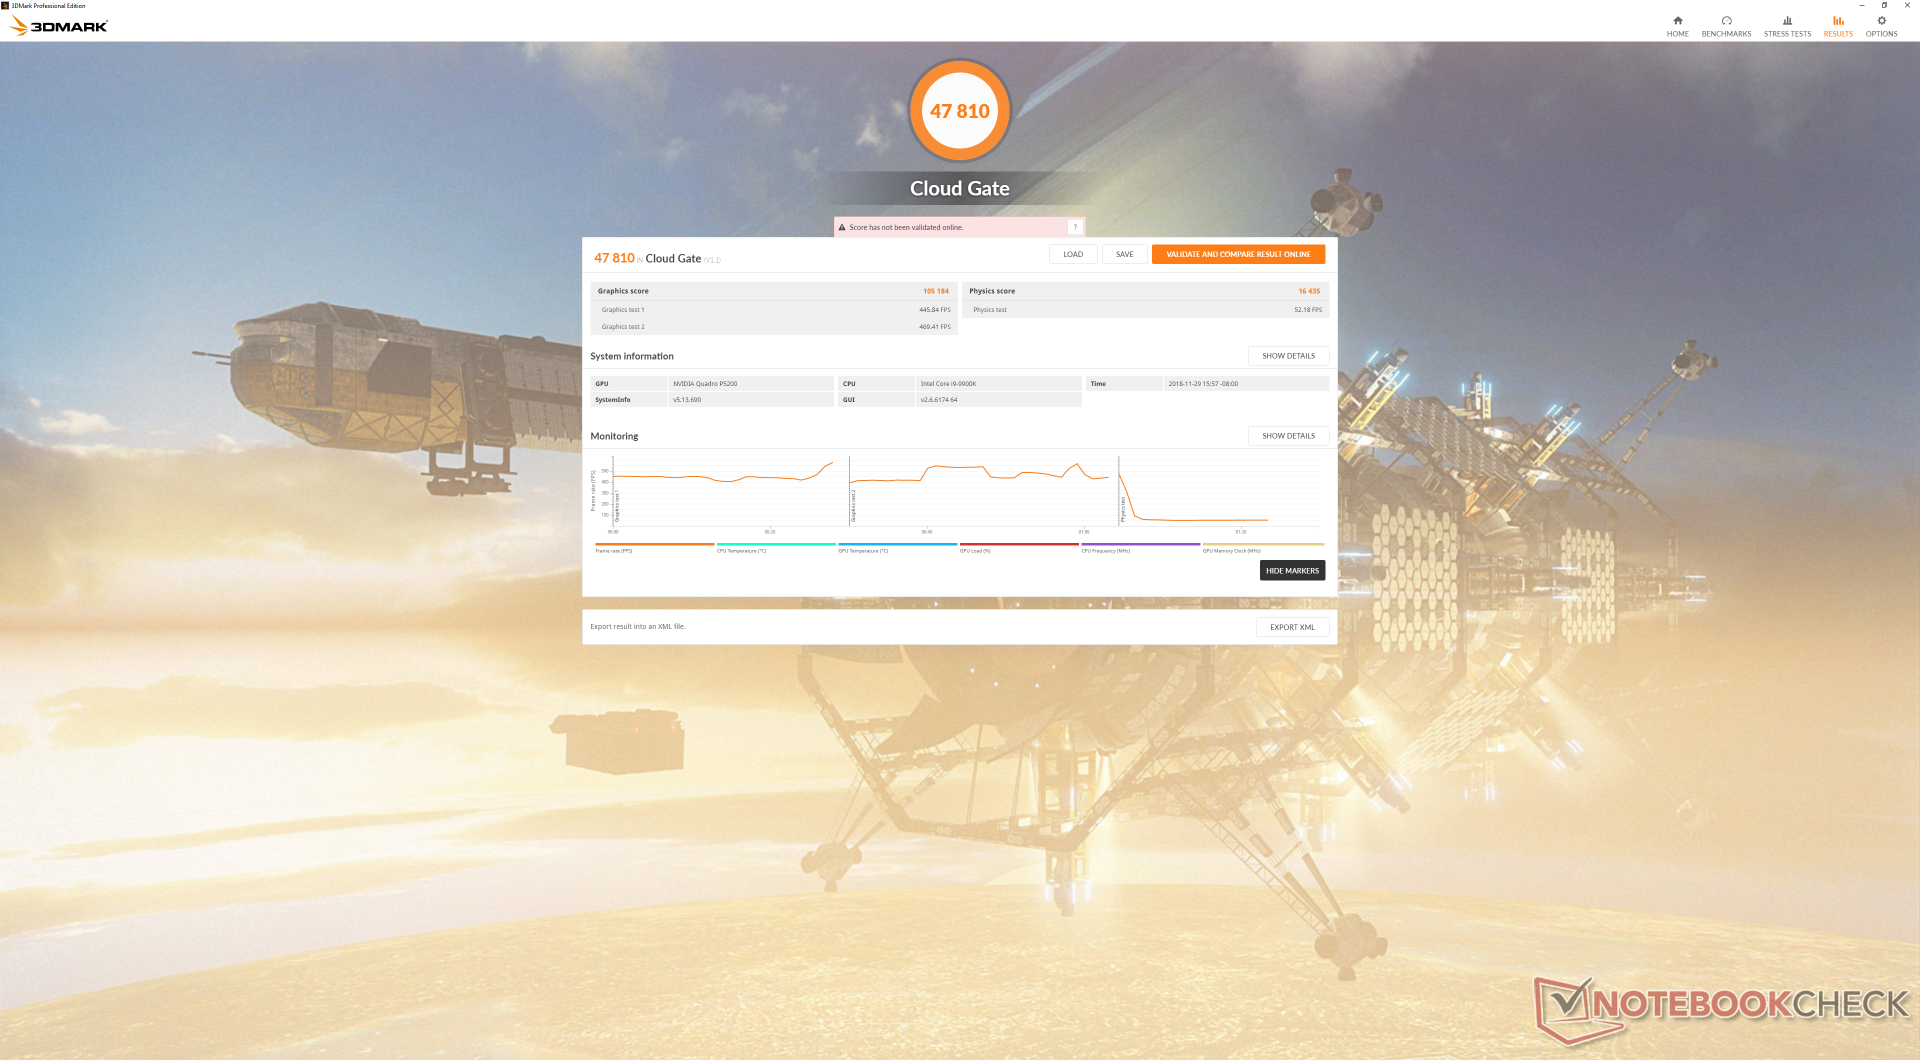
The Quadro P5200 is about 20 to 25 percent faster than the Quadro P5000 according to 3DMark benchmarks. SpecViewPerf scores are as good as or better than the Sky X9C with GTX 1080 SLI graphics since the P5200 is better optimized for CAD use and is equipped with twice the GDDR5 VRAM (16 GB vs. 8 GB).
Gaming performance is respectable even at native 4K resolution. It may not be the most cost-efficient way to play games, but performance is essentially between the GTX 1070 and GTX 1080. Idling on Witcher 3 shows no drops in frame rates over time to represent stable gaming load performance and no interrupting background activity.
The 1080p (16:9) option was grayed out on all games and so we used the 1200p (16:10) option instead. Furthermore, Destiny 2 was the only title we tested that was unable to run at full speed on our Quadro GPU.
| 3DMark 11 | |
| 1280x720 Performance GPU | |
| Eurocom Sky X9C | |
| Eurocom Sky X7C | |
| Eurocom Tornado F7W | |
| Eurocom Tornado F5W | |
| Dell Precision 7720 | |
| Lenovo ThinkPad P72-20MB000EGE | |
| MSI WS63VR 7RL-023US | |
| Dell Precision 5530 2-in-1 | |
| Dell Precision 5530 Xeon E-2176M | |
| 1280x720 Performance Combined | |
| Eurocom Tornado F7W | |
| Eurocom Sky X7C | |
| Eurocom Sky X9C | |
| Lenovo ThinkPad P72-20MB000EGE | |
| Dell Precision 7720 | |
| Eurocom Tornado F5W | |
| MSI WS63VR 7RL-023US | |
| Dell Precision 5530 2-in-1 | |
| Dell Precision 5530 Xeon E-2176M | |
| 3DMark | |
| 1920x1080 Fire Strike Graphics | |
| Eurocom Sky X9C | |
| Eurocom Tornado F7W | |
| Eurocom Tornado F5W | |
| Dell Precision 7720 | |
| Lenovo ThinkPad P72-20MB000EGE | |
| MSI WS63VR 7RL-023US | |
| Dell Precision 5530 2-in-1 | |
| Dell Precision 5530 Xeon E-2176M | |
| 2560x1440 Time Spy Graphics | |
| Eurocom Tornado F7W | |
| Lenovo ThinkPad P72-20MB000EGE | |
| Dell Precision 7720 | |
| Dell Precision 5530 2-in-1 | |
| Dell Precision 5530 Xeon E-2176M | |
| SPECviewperf 13 | |
| 3ds Max (3dsmax-06) | |
| Eurocom Tornado F7W | |
| Lenovo ThinkPad P72-20MB000EGE | |
| Catia (catia-05) | |
| Eurocom Tornado F7W | |
| Lenovo ThinkPad P72-20MB000EGE | |
| Creo (creo-02) | |
| Eurocom Tornado F7W | |
| Lenovo ThinkPad P72-20MB000EGE | |
| Energy (energy-02) | |
| Eurocom Tornado F7W | |
| Lenovo ThinkPad P72-20MB000EGE | |
| Maya (maya-05) | |
| Eurocom Tornado F7W | |
| Lenovo ThinkPad P72-20MB000EGE | |
| Medical (medical-02) | |
| Eurocom Tornado F7W | |
| Lenovo ThinkPad P72-20MB000EGE | |
| Showcase (showcase-02) | |
| Eurocom Tornado F7W | |
| Lenovo ThinkPad P72-20MB000EGE | |
| Siemens NX (snx-03) | |
| Eurocom Tornado F7W | |
| Lenovo ThinkPad P72-20MB000EGE | |
| Solidworks (sw-04) | |
| Eurocom Tornado F7W | |
| Lenovo ThinkPad P72-20MB000EGE | |
| 3DMark 06 Standard Score | 44390 points | |
| 3DMark Vantage P Result | 65844 points | |
| 3DMark 11 Performance | 22226 points | |
| 3DMark Ice Storm Standard Score | 185544 points | |
| 3DMark Cloud Gate Standard Score | 47810 points | |
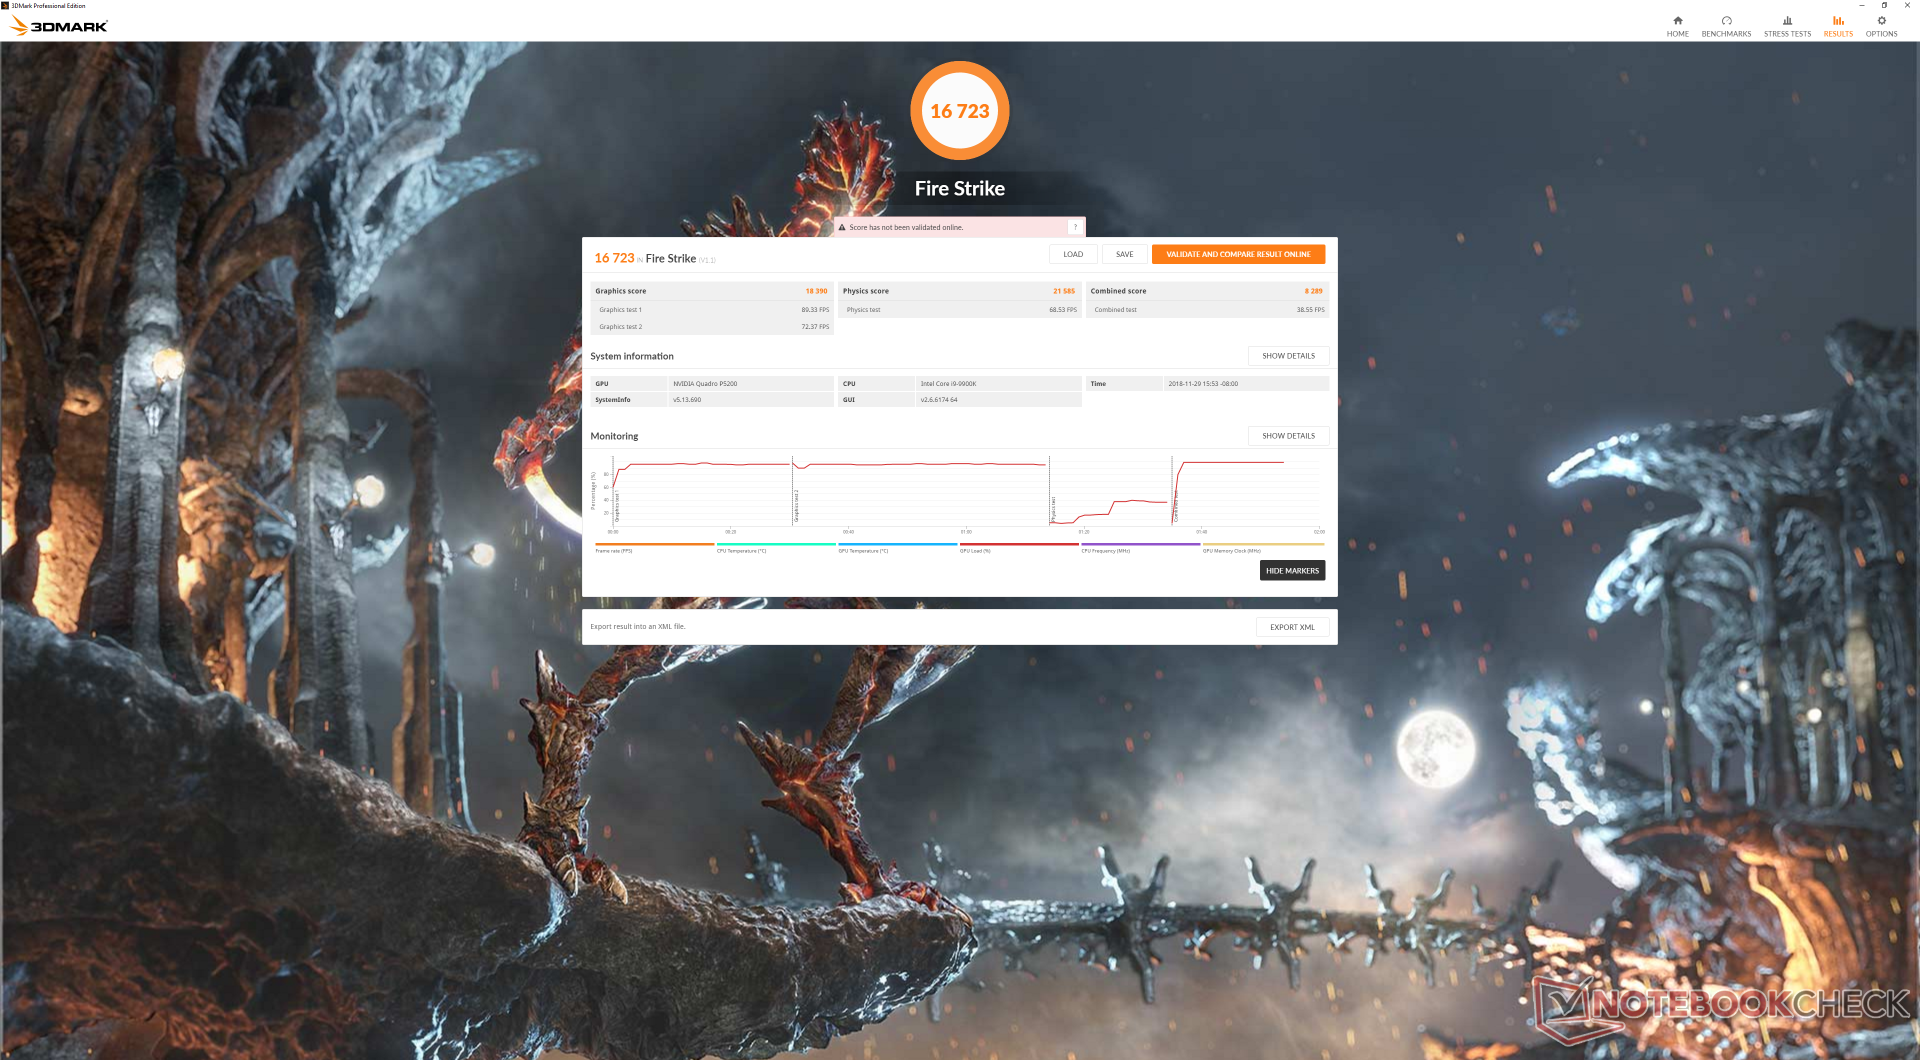
| 3DMark Fire Strike Score | 16723 points | |
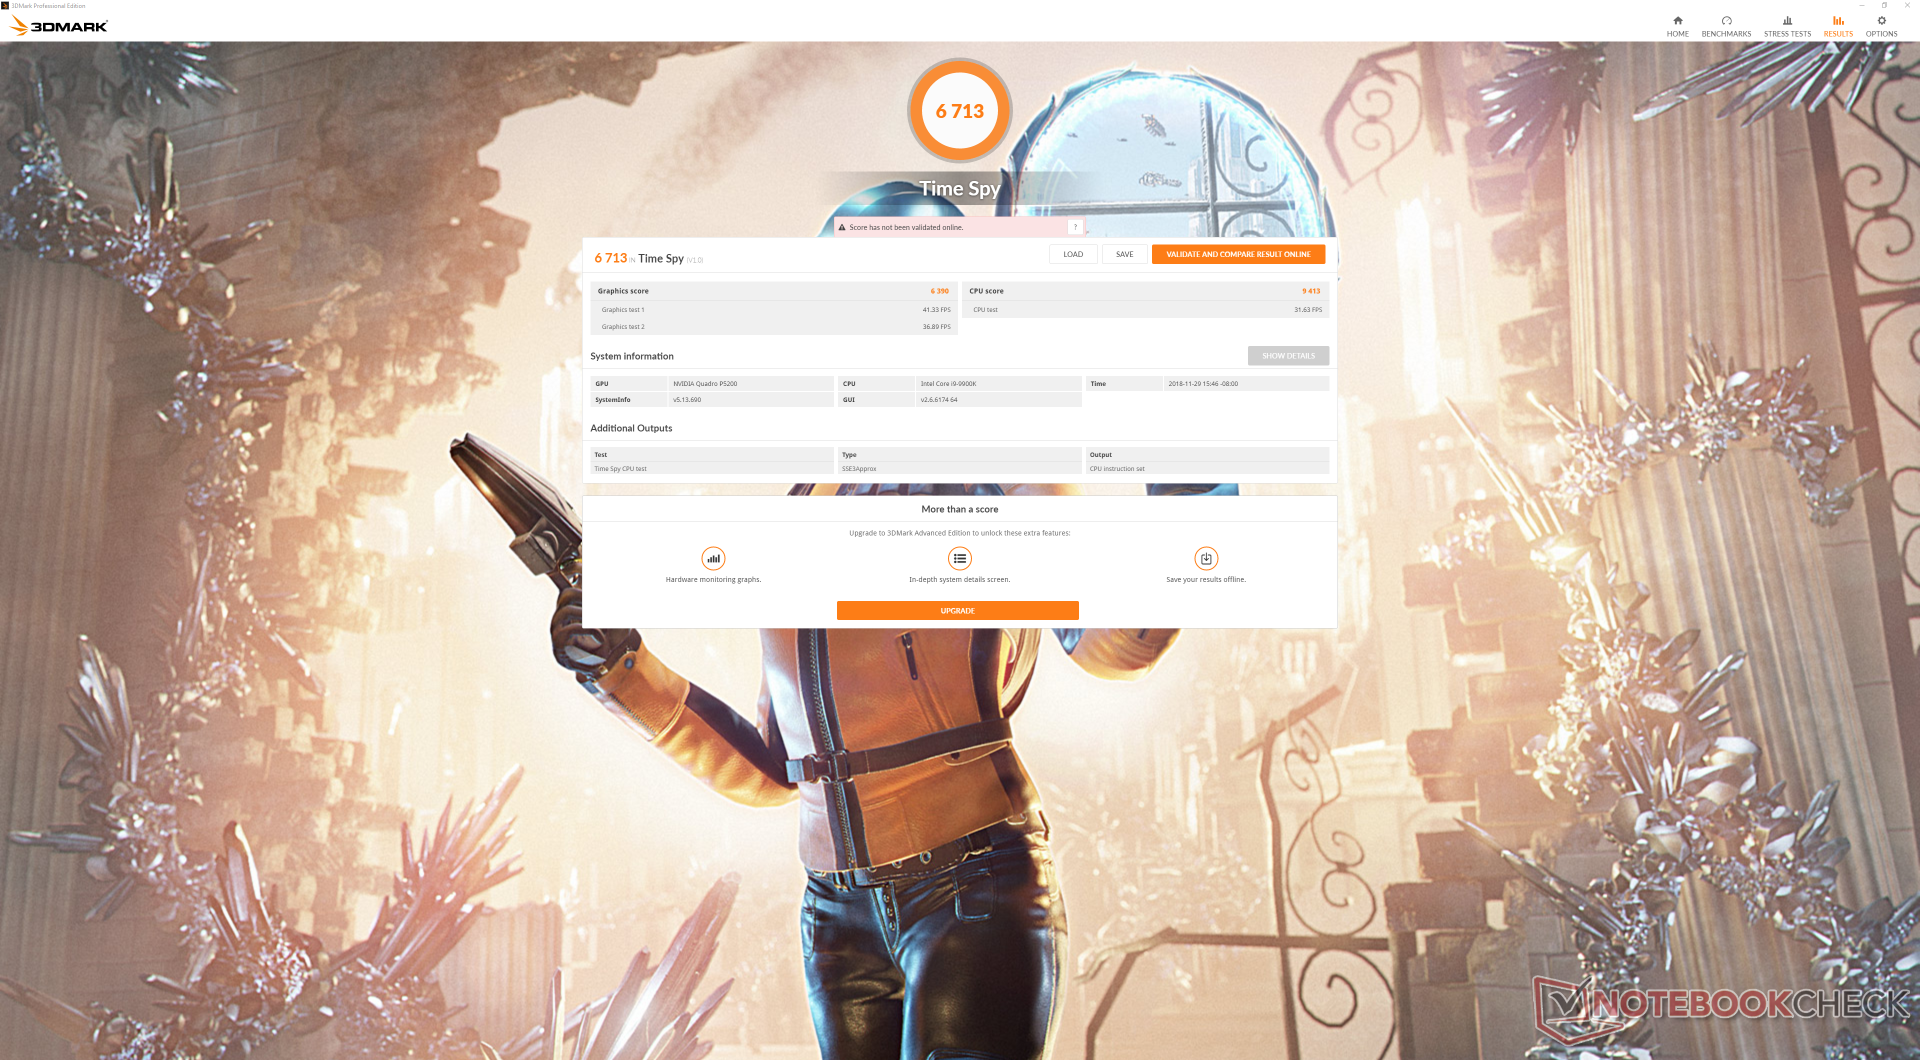
| 3DMark Time Spy Score | 6713 points | |
Help | ||
| low | med. | high | ultra | 4K | |
|---|---|---|---|---|---|
| Sleeping Dogs (2012) | 344.2 | 288.1 | 267.3 | 118.8 | |
| Guild Wars 2 (2012) | 145.1 | 83.5 | 85.4 | ||
| StarCraft II: Heart of the Swarm (2013) | 753 | 346.2 | 296.6 | 218.9 | |
| BioShock Infinite (2013) | 435 | 375.5 | 346.5 | ||
| Metro: Last Light (2013) | 177.5 | 175.2 | 171.6 | 119.2 | |
| Thief (2014) | 149.4 | 145.1 | 145.7 | 114.2 | |
| The Witcher 3 (2015) | 303.5 | 211.6 | 116.1 | 63.4 | 43.9 |
| Batman: Arkham Knight (2015) | 186 | 176 | 131 | 90 | 50 |
| Metal Gear Solid V (2015) | 60 | 60 | 60 | 60 | 60 |
| Fallout 4 (2015) | 241.9 | 236.3 | 46.8 | ||
| Rise of the Tomb Raider (2016) | 292.9 | 210.1 | 121.5 | 101 | 44.9 |
| Ashes of the Singularity (2016) | 113 | 99.1 | 97.8 | 43.5 | |
| Overwatch (2016) | 300 | 300 | 252.2 | 174.1 | 88.7 |
| Prey (2017) | 145 | 144.6 | 145 | 144.1 | 60.9 |
| Rocket League (2017) | 248.5 | 247 | 185.8 | 92.5 | |
| Dirt 4 (2017) | 354.1 | 221.2 | 126 | 84.4 | 56.8 |
| Middle-earth: Shadow of War (2017) | 219 | 137 | 106 | 84 | 33 |
| Destiny 2 (2017) | 13 | 12.7 | 12.6 | 12.2 | 12.3 |
| Monster Hunter World (2018) | 183.5 | 110.1 | 100.4 | 77.4 | 24.1 |
| F1 2018 (2018) | 212 | 152 | 125 | 83 | 46 |
| Shadow of the Tomb Raider (2018) | 147 | 91 | 84 | 72 | 26 |
Emissions
System Noise
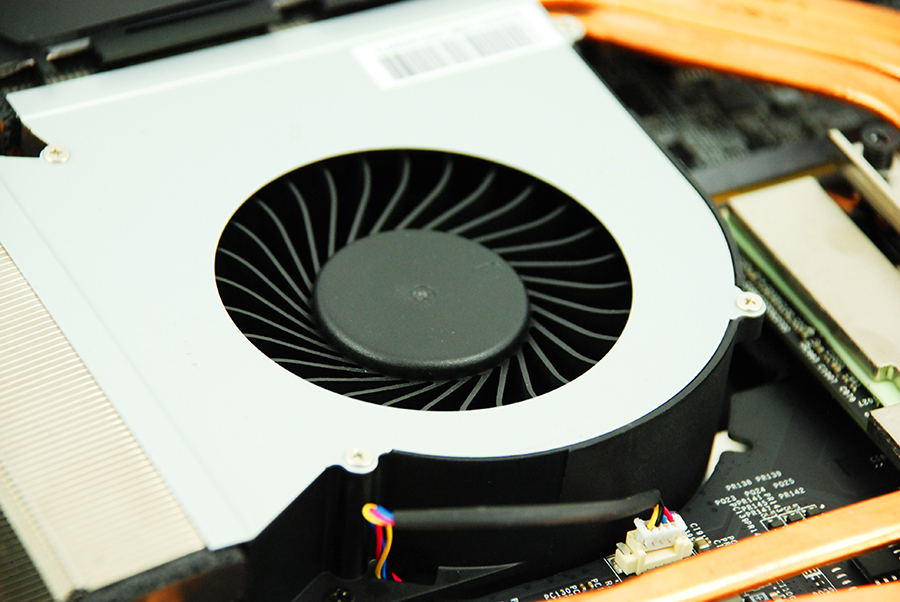
The cooling solution is one of the largest we've seen as it consists of twin fans and 10 copper heat pipes compared to less than half that for many gaming laptops. Fan noise is relatively low and steady during undemanding loads like video playback or word processing. The main problem is that the fans in the actively-cooled AC adapter are much smaller and thus higher-pitched than the laptop fans. Higher loads will bump up not only the fans in the laptop, but also the fans in the AC adapter for a louder experience than most other laptops in the market.
If Turbo Fan is enabled, fan noise jumps to about 64 dB(A) to be very close to the MSI GT75VR when under similar conditions. We can notice no coil whine from our test unit.

| Eurocom Tornado F7W Quadro P5200, i9-9900K, 3x Samsung SSD 970 Pro 512GB (RAID 0) | Acer Predator Helios 500 PH517-51-93LS GeForce GTX 1070 Mobile, i9-8950HK, Liteon CA1-8D512 | Asus Chimera G703GI GeForce GTX 1080 Mobile, i9-8950HK, 2x Intel 760p 512 GB + 1x Samsung SM961 512 GB (RAID) | HP Omen X 17-ap0xx GeForce GTX 1080 Mobile, i7-7820HK, Samsung PM961 MZVLW256HEHP | Eurocom Sky X9C GeForce GTX 1080 SLI (Laptop), i7-8700K, 2x Samsung SSD 960 Pro 1TB m.2 NVMe (RAID 0) | MSI GT75 8RG-090 Titan GeForce GTX 1080 Mobile, i9-8950HK, 2x Samsung PM961 MZVLW256HEHP (RAID 0) | |
|---|---|---|---|---|---|---|
| Noise | 16% | -2% | 9% | -5% | -2% | |
| off / environment * (dB) | 28.2 | 29.4 -4% | 29 -3% | 28.3 -0% | 28.4 -1% | 30 -6% |
| Idle Minimum * (dB) | 33.2 | 29.4 11% | 30 10% | 31.5 5% | 34.2 -3% | 32 4% |
| Idle Average * (dB) | 33.2 | 29.4 11% | 34 -2% | 31.6 5% | 39.6 -19% | 34 -2% |
| Idle Maximum * (dB) | 33.2 | 30.1 9% | 42 -27% | 31.6 5% | 39.6 -19% | 37 -11% |
| Load Average * (dB) | 47 | 36 23% | 53 -13% | 36.8 22% | 48.5 -3% | 43 9% |
| Witcher 3 ultra * (dB) | 52.2 | 37.6 28% | 51 2% | 48.2 8% | 54 -3% | 57 -9% |
| Load Maximum * (dB) | 64 | 42.2 34% | 53 17% | 52.1 19% | 56.5 12% | 62 3% |
* ... smaller is better
Noise level
| Idle |
| 33.2 / 33.2 / 33.2 dB(A) |
| Load |
| 47 / 64 dB(A) |
 | ||
30 dB silent 40 dB(A) audible 50 dB(A) loud |
||
min: | ||
Temperature
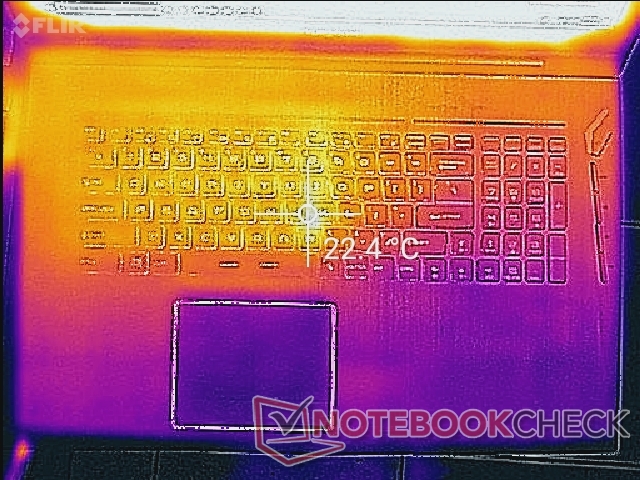
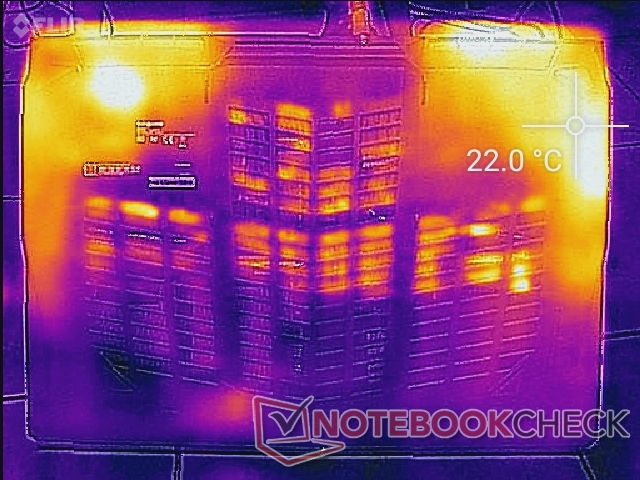
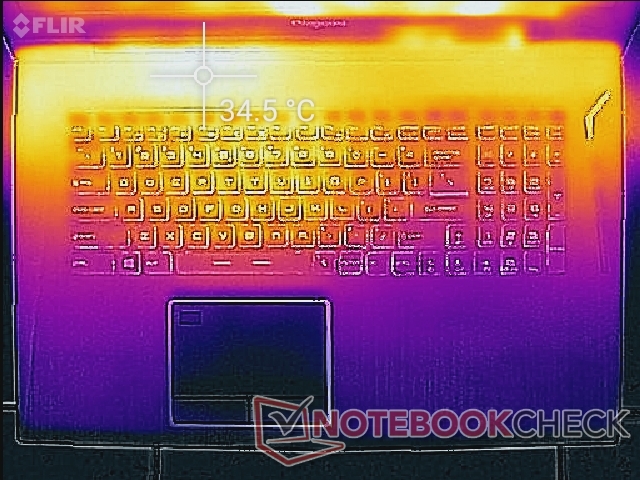
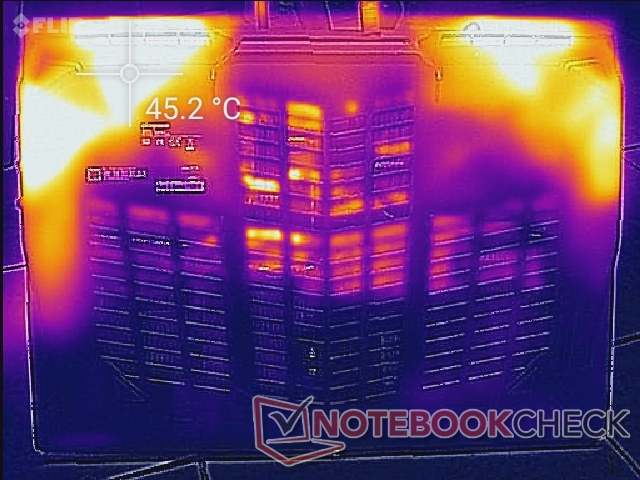
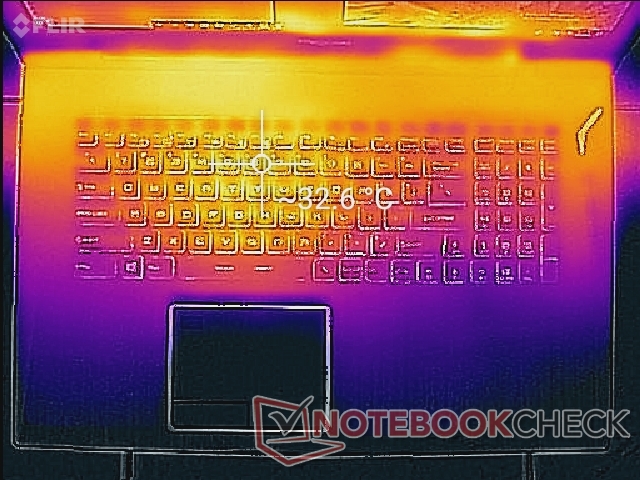
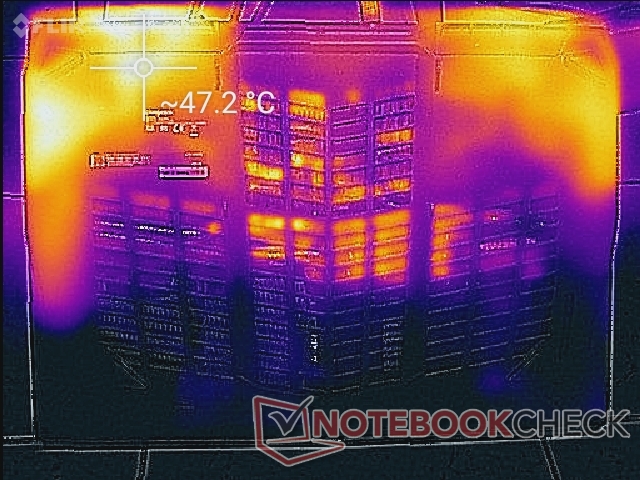
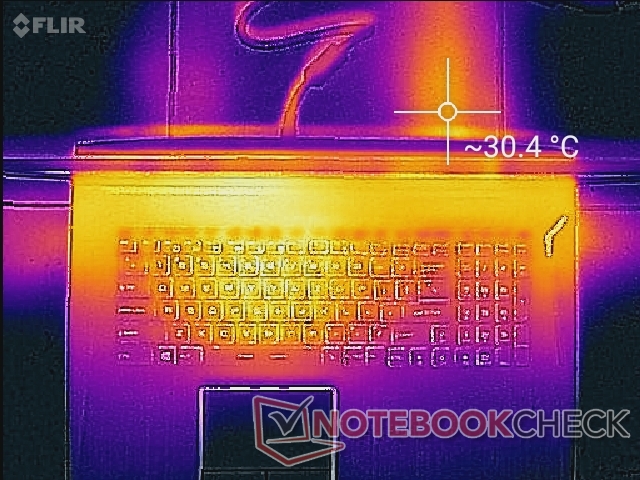
Surface temperatures are cool when considering the immense power and demanding hardware within. Palm rests and keyboard keys remain comfortable in the low 30 C range at worst. The hot spots are only on the bottom areas towards the rear where the heat sinks and heat pipes are concentrated.
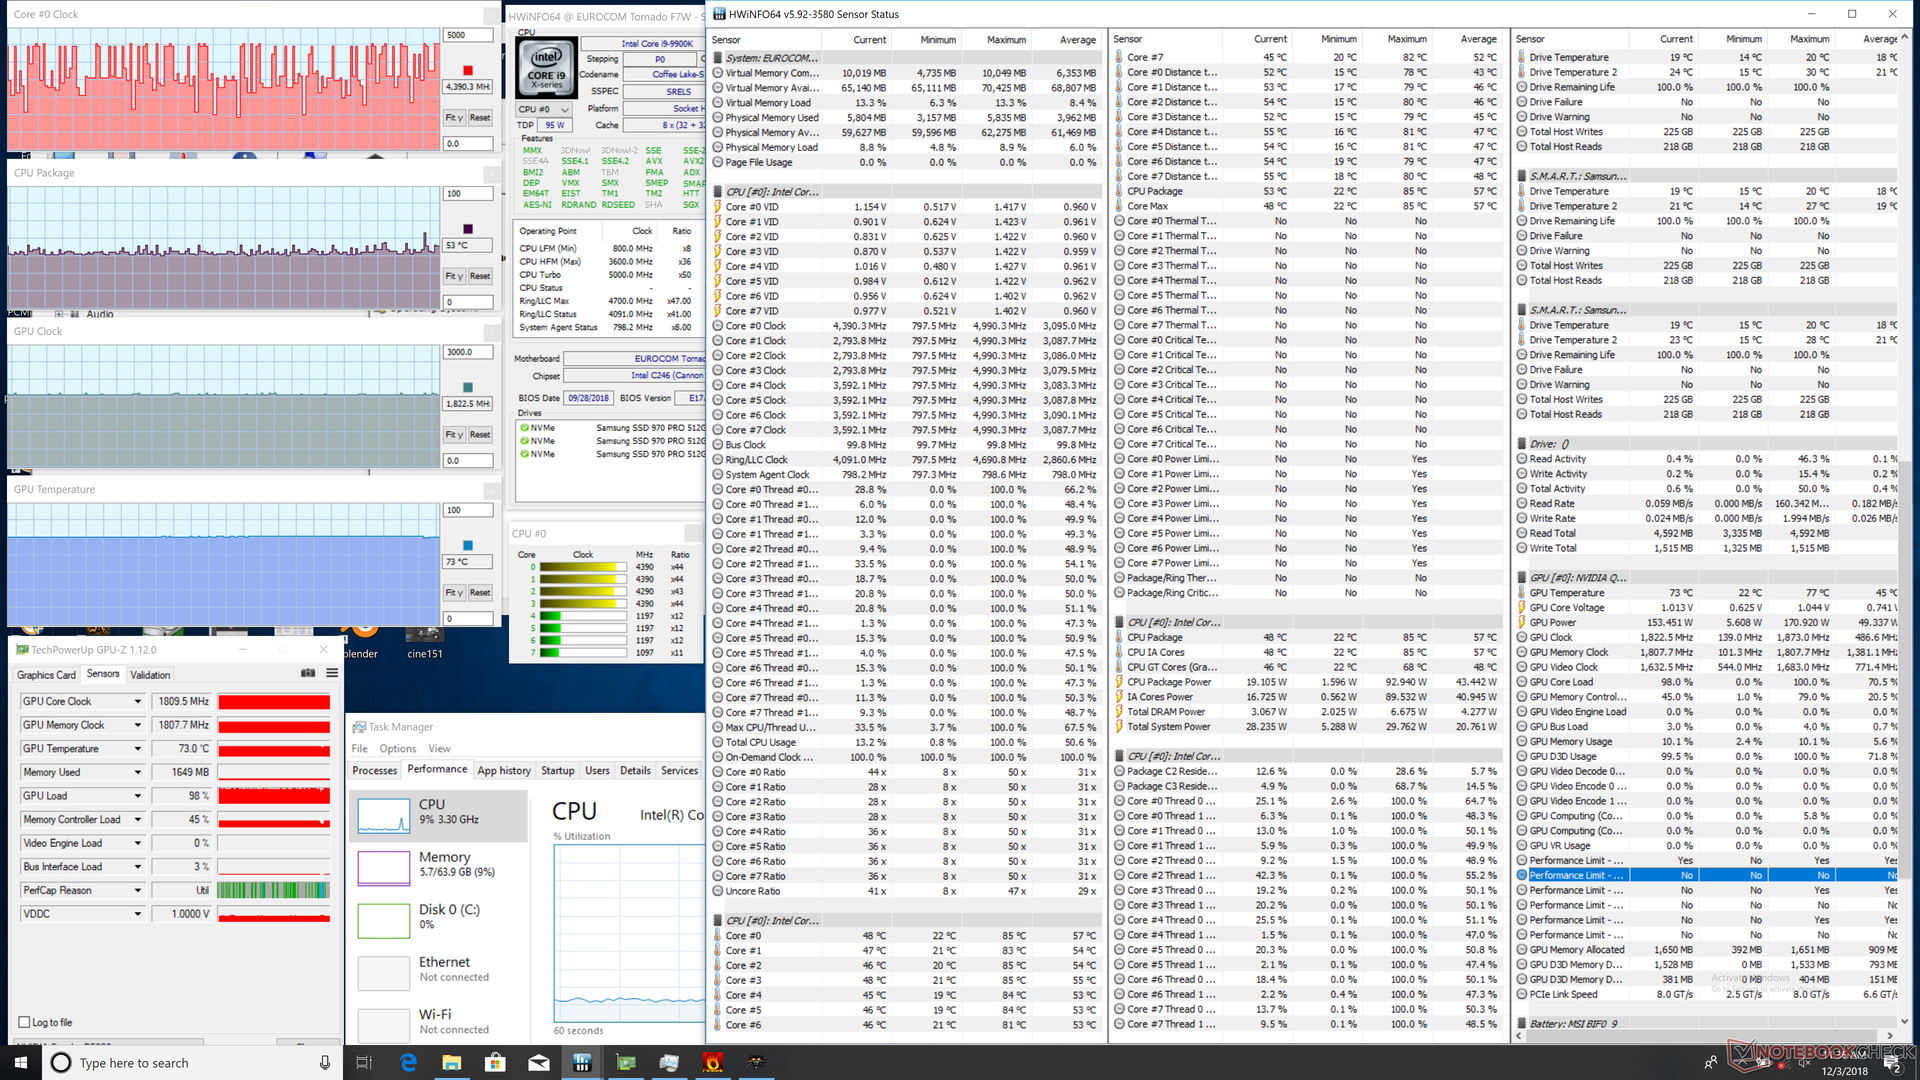
When under Prime95 load, the CPU can be observed running at 4.4 GHz for the first few seconds before falling and settling in the 3.9 GHz to 4.0 GHz range as shown by our screenshot below. Since the base clock rate of the i9-9900K is 3.6 GHz, this means that the Eurocom system is able to sustain a Turbo Boost of +300 to +400 MHz when under extreme CPU stress. A standard PC tower with the same processor would likely sustain higher clock rates for longer than our Eurocom as exemplified by our CineBench loop test from above.
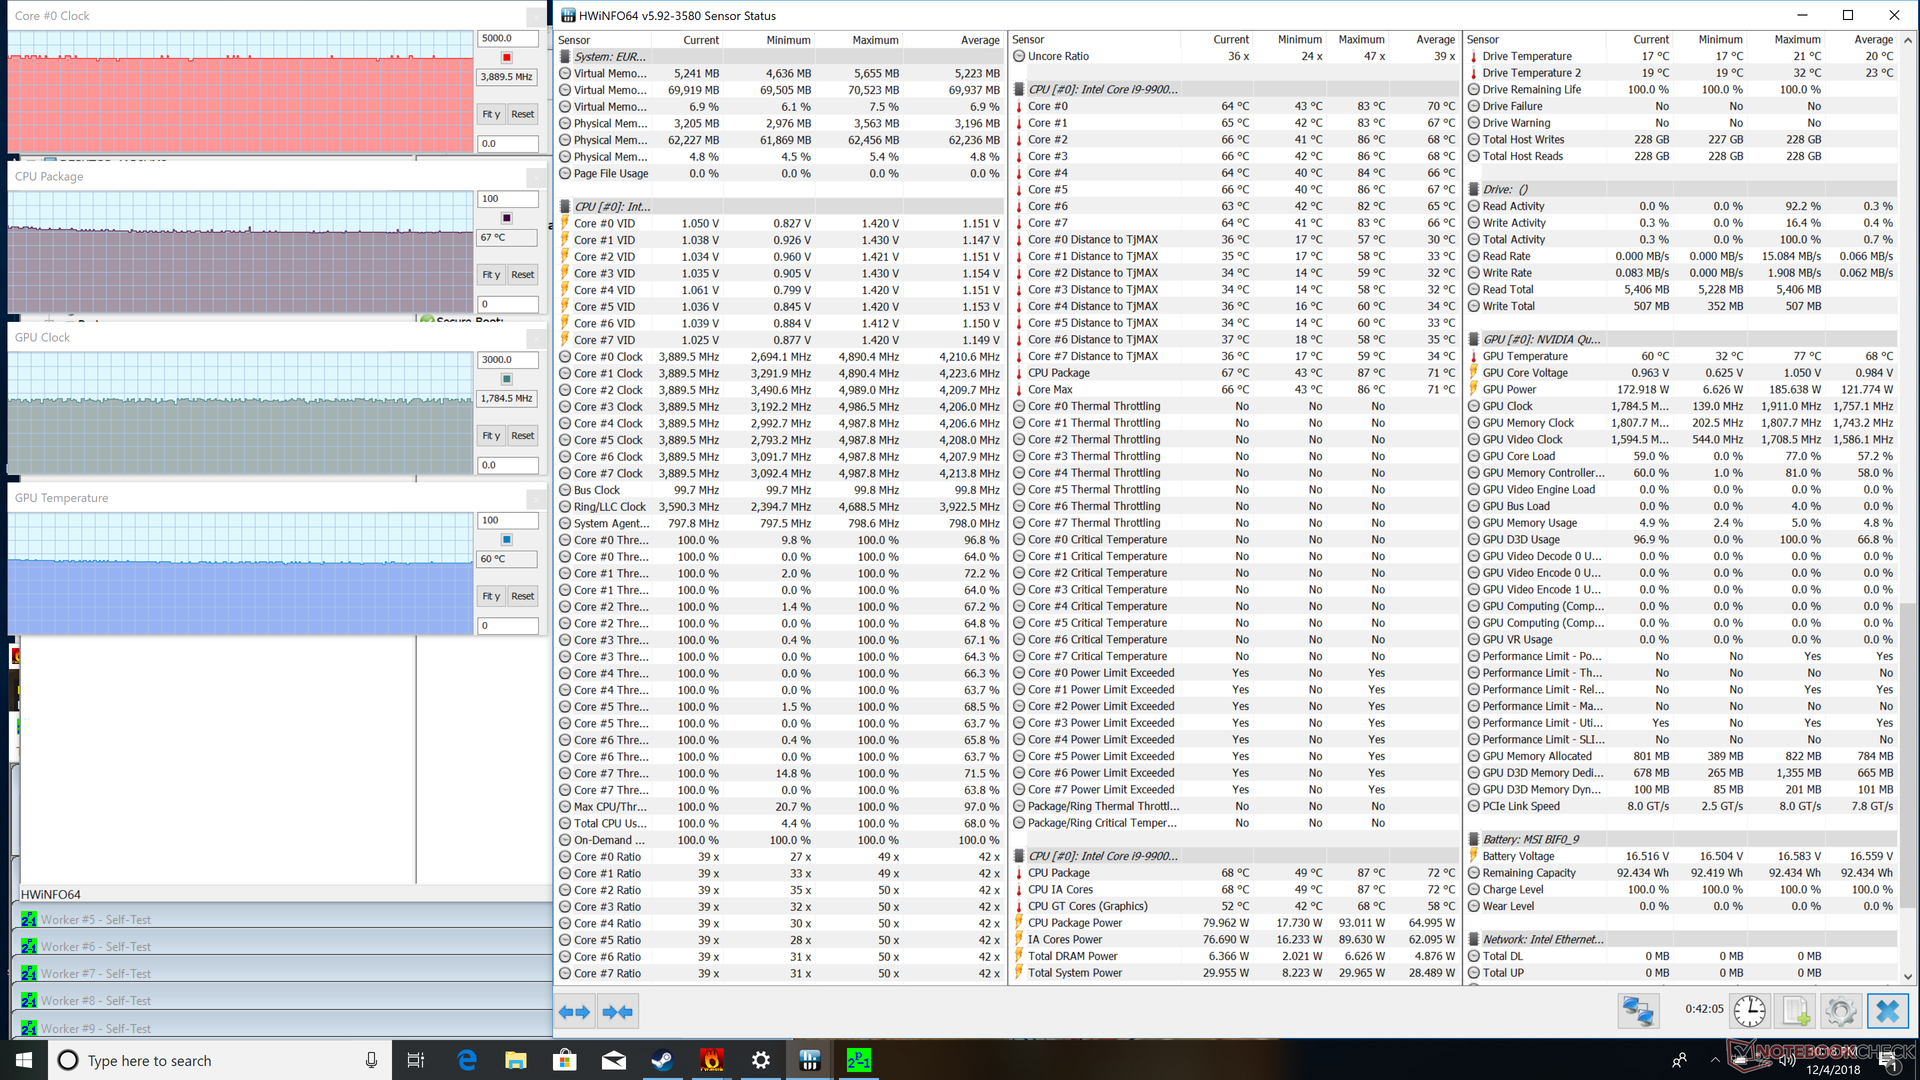
When under maximum processing load (Prime95+FurMark), the CPU and GPU stabilize at about 80 C and 72 C, respectively. Activating Turbo Fan will bump the core temperature down by about 12 C for each processor without impacting clock rate.
Running on battery power will impact performance. A 3DMark Fire Strike run on batteries returns Physics and Graphics scores of 12068 points and 4701 points, respectively, compared to 21585 points and 18390 points when on mains.
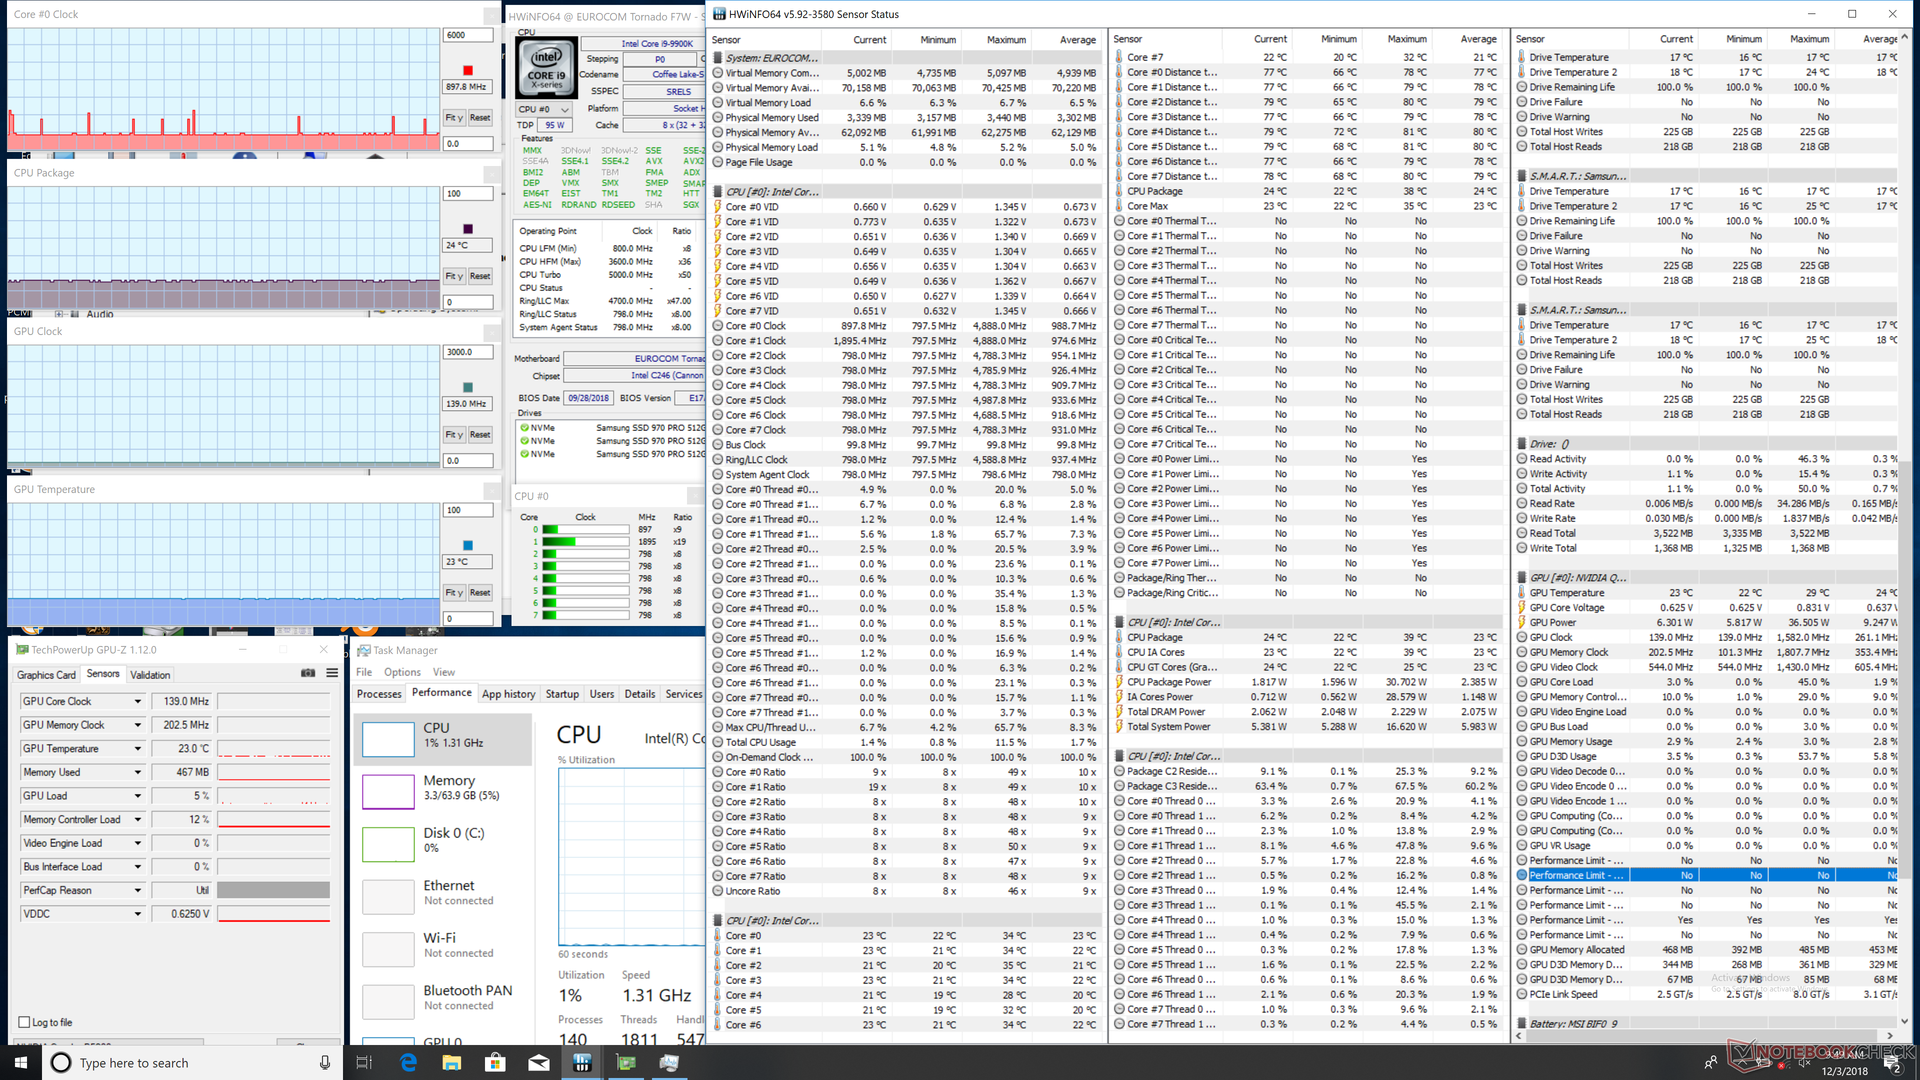

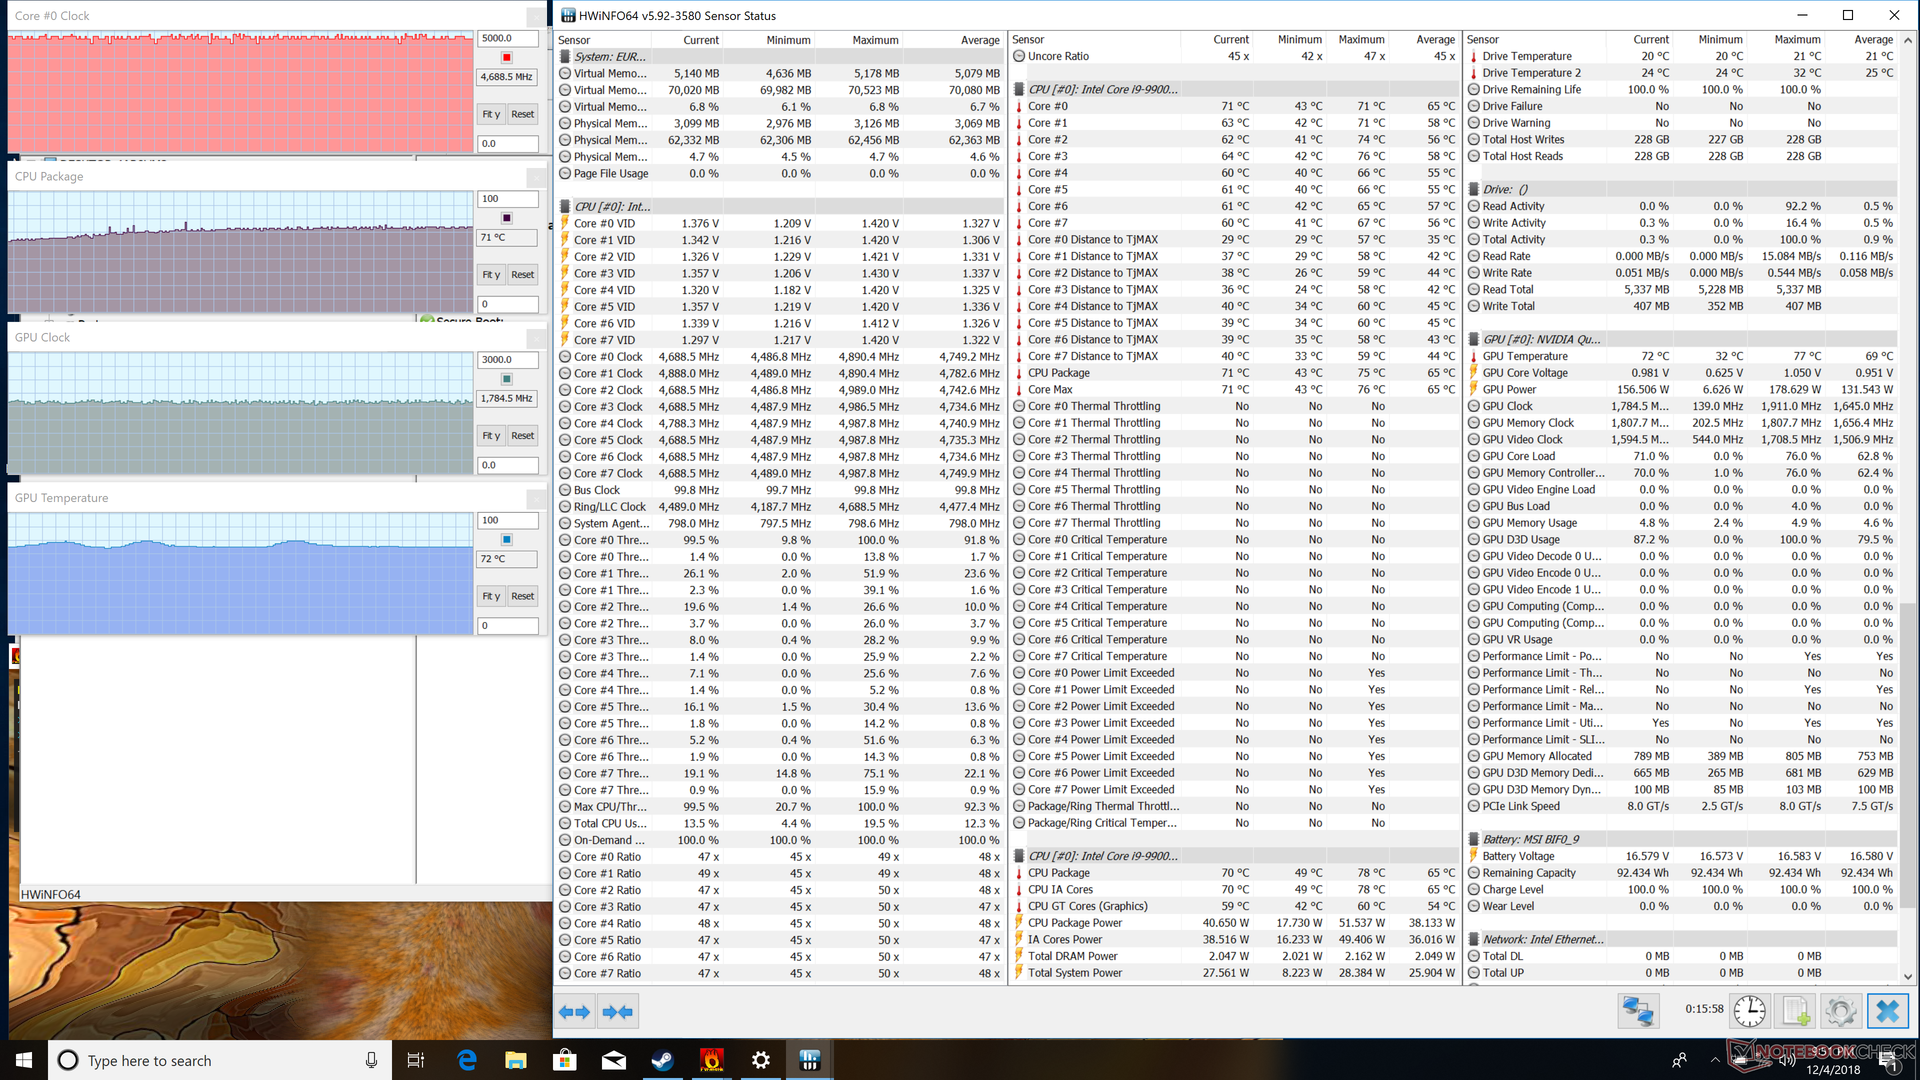
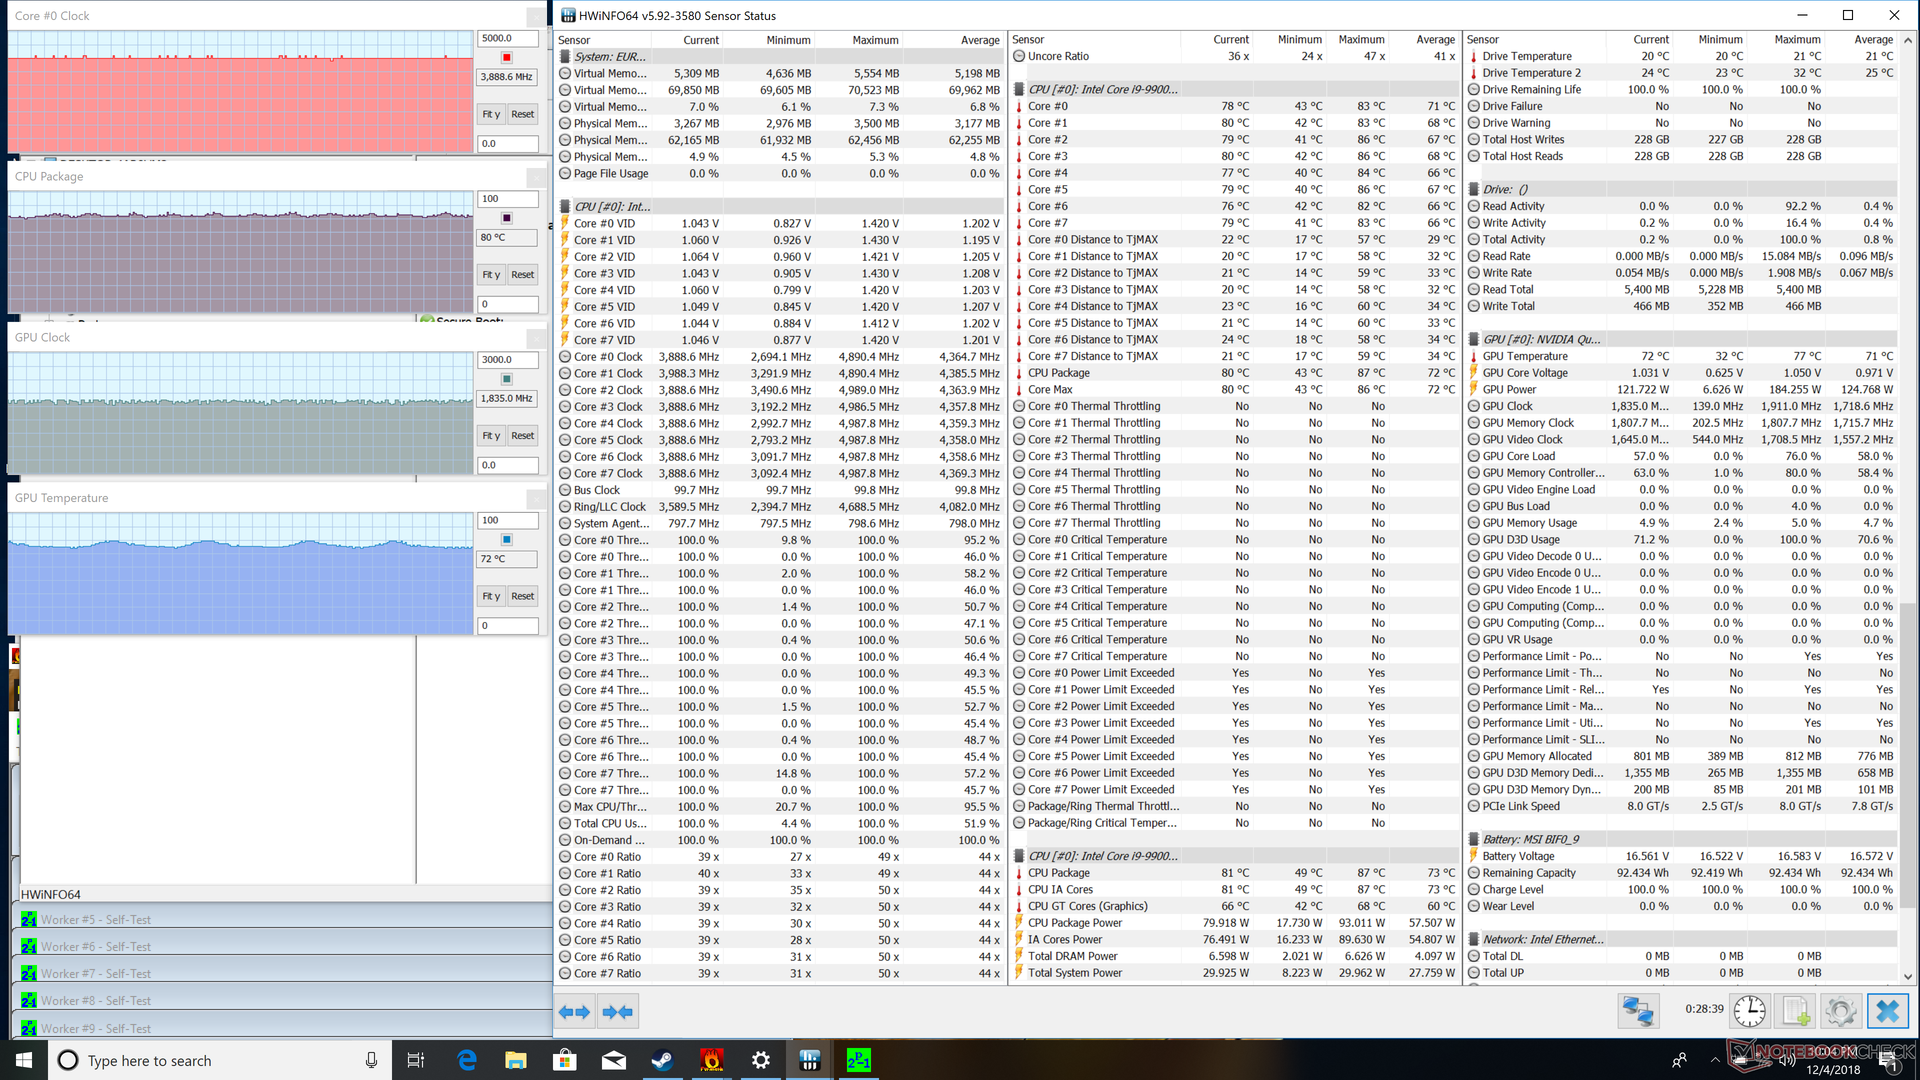
| CPU Clock (GHz) | GPU Clock (MHz) | Average CPU Temperature (°C) | Average GPU Temperature (°C) | |
| System Idle | -- | -- | 24 | 23 |
| Prime95 Stress | 3.9 | -- | 80 | 23 |
| FurMark Stress | -- | 1785 | 71 | 72 |
| Prime95 + FurMark Stress | 3.9 | 1835 | 80 | 72 |
| Prime95 + FurMark Stress (Turbo Fan on) | 3.9 | 1785 | 67 | 60 |
| Witcher 3 Stress | ~4.0 | 1823 | 53 | 73 |
(+) The maximum temperature on the upper side is 34 °C / 93 F, compared to the average of 38.2 °C / 101 F, ranging from 22.2 to 69.8 °C for the class Workstation.
(-) The bottom heats up to a maximum of 47.6 °C / 118 F, compared to the average of 41.1 °C / 106 F
(+) In idle usage, the average temperature for the upper side is 21.3 °C / 70 F, compared to the device average of 32 °C / 90 F.
(+) Playing The Witcher 3, the average temperature for the upper side is 28.6 °C / 83 F, compared to the device average of 32 °C / 90 F.
(+) The palmrests and touchpad are cooler than skin temperature with a maximum of 22.6 °C / 72.7 F and are therefore cool to the touch.
(+) The average temperature of the palmrest area of similar devices was 27.8 °C / 82 F (+5.2 °C / 9.3 F).
Speakers

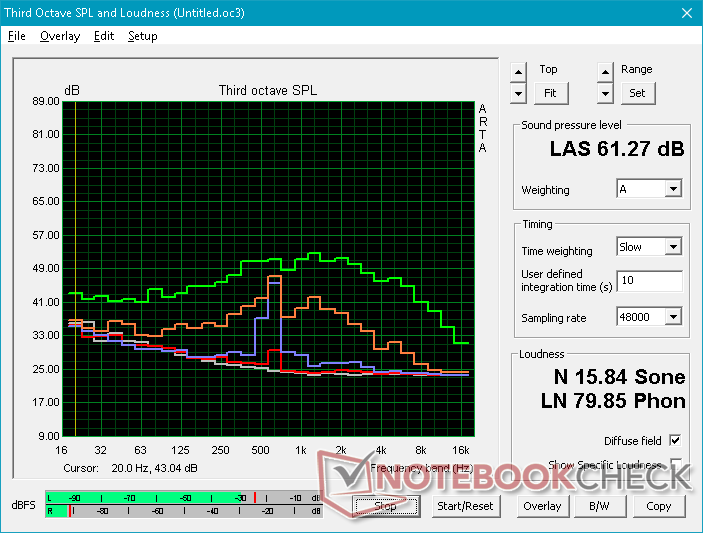
The integrated 2 W stereo speakers include a dedicated subwoofer. Maximum volume is louder than on most other laptops, but the palm rests will vibrate much more as well even when under 50 percent volume.
Eurocom Tornado F7W audio analysis
(±) | speaker loudness is average but good (80.7 dB)
Bass 100 - 315 Hz
(±) | reduced bass - on average 12% lower than median
(±) | linearity of bass is average (9% delta to prev. frequency)
Mids 400 - 2000 Hz
(+) | balanced mids - only 4.8% away from median
(±) | linearity of mids is average (7.7% delta to prev. frequency)
Highs 2 - 16 kHz
(+) | balanced highs - only 4.5% away from median
(+) | highs are linear (5.7% delta to prev. frequency)
Overall 100 - 16.000 Hz
(±) | linearity of overall sound is average (15.9% difference to median)
Compared to same class
» 39% of all tested devices in this class were better, 10% similar, 51% worse
» The best had a delta of 7%, average was 17%, worst was 35%
Compared to all devices tested
» 25% of all tested devices were better, 5% similar, 70% worse
» The best had a delta of 4%, average was 24%, worst was 134%
Apple MacBook 12 (Early 2016) 1.1 GHz audio analysis
(+) | speakers can play relatively loud (83.6 dB)
Bass 100 - 315 Hz
(±) | reduced bass - on average 11.3% lower than median
(±) | linearity of bass is average (14.2% delta to prev. frequency)
Mids 400 - 2000 Hz
(+) | balanced mids - only 2.4% away from median
(+) | mids are linear (5.5% delta to prev. frequency)
Highs 2 - 16 kHz
(+) | balanced highs - only 2% away from median
(+) | highs are linear (4.5% delta to prev. frequency)
Overall 100 - 16.000 Hz
(+) | overall sound is linear (10.2% difference to median)
Compared to same class
» 7% of all tested devices in this class were better, 2% similar, 91% worse
» The best had a delta of 5%, average was 18%, worst was 53%
Compared to all devices tested
» 5% of all tested devices were better, 1% similar, 94% worse
» The best had a delta of 4%, average was 24%, worst was 134%
Energy Management
Power Consumption
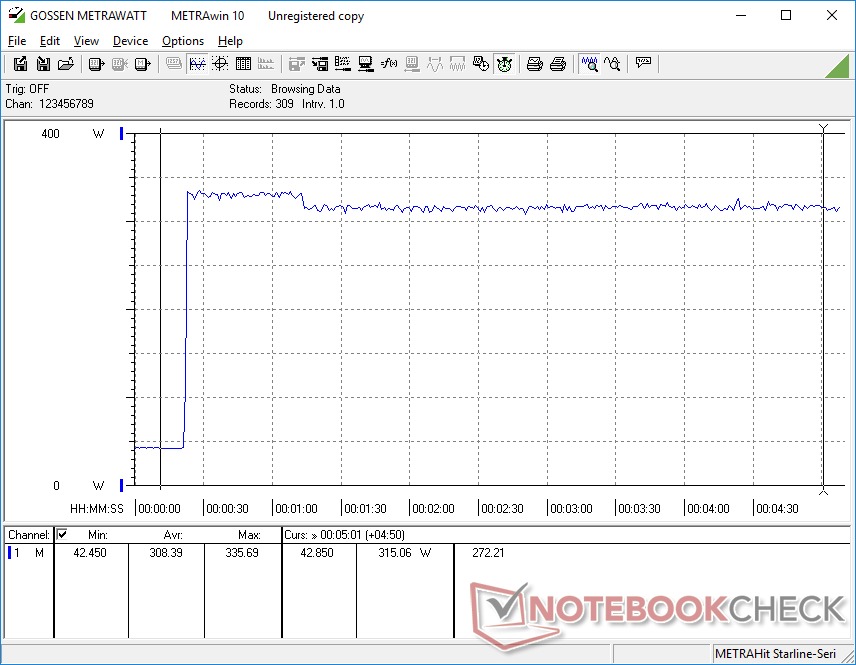
Power consumption is high but not unusual for its category. Idling demands anywhere between 28 W and 38 W depending on the power profile whereas Ultrabooks just barely crack the double-digit mark. When gaming, consumption is noticeably lower than the MSI GT75 despite having similar graphics potential.
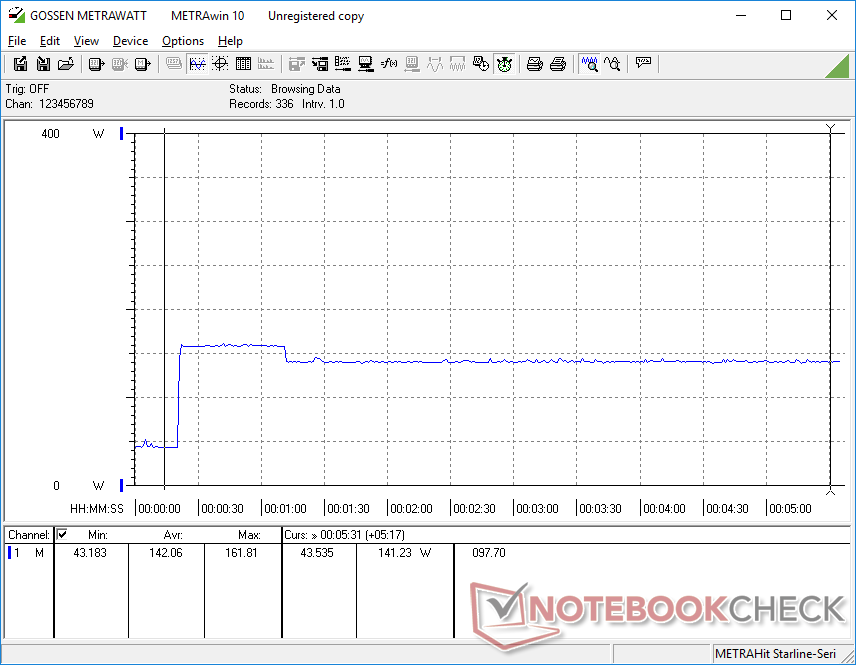
Peak consumption is about 336 W when running both Prime95 and FurMark simultaneously. Our graph below, however, shows this to be short-lived as consumption eventually drops and stabilizes at 315 W instead. The slight dip in power consumption matches our Stress Test observations above and it is common amongst laptops albeit much less severe on our Eurocom. Power consumption is also significantly more stable this time around unlike what we saw on the Eurocom Sky X9C.
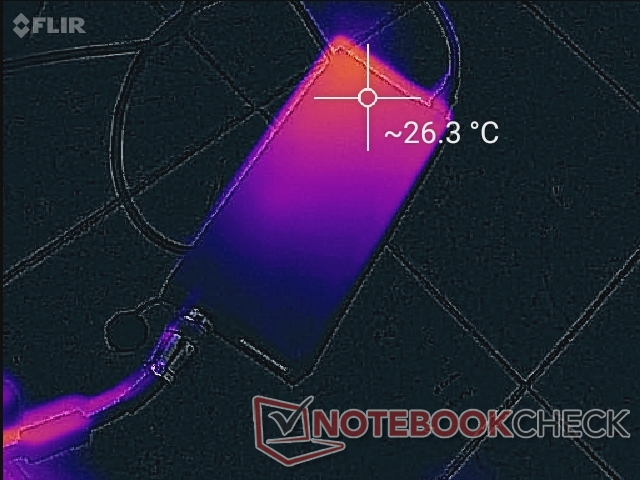
The large (25 x 11 x 4 cm) 780 W AC adapter from the Sky X9C can be found here for the Tornado F7W. Its twin fans are always active and so surface temperatures are always comfortable unlike on other AC adapters where temperatures can reach over 50 C. The major downsides to the powerful adapter are its heavy weight (1.9 kg) and annoyingly thick and rigid cables that make transporting a hassle.
| Off / Standby | |
| Idle | |
| Load |
|
Key:
min: | |
| Eurocom Tornado F7W i9-9900K, Quadro P5200, 3x Samsung SSD 970 Pro 512GB (RAID 0), IPS, 3840x2160, 17.3" | Eurocom Sky X7C i7-8086K, GeForce GTX 1080 Mobile, 2x Samsung SSD 970 Pro 512GB (RAID 0), IPS, 3840x2160, 17.3" | Asus Chimera G703GI i9-8950HK, GeForce GTX 1080 Mobile, 2x Intel 760p 512 GB + 1x Samsung SM961 512 GB (RAID), IPS, 1920x1080, 17.3" | Eurocom Sky X9C i7-8700K, GeForce GTX 1080 SLI (Laptop), 2x Samsung SSD 960 Pro 1TB m.2 NVMe (RAID 0), IPS, 3840x2160, 17.3" | MSI GT75 8RG-090 Titan i9-8950HK, GeForce GTX 1080 Mobile, 2x Samsung PM961 MZVLW256HEHP (RAID 0), TN, 1920x1080, 17.3" | Eurocom Tornado F5 i7-7700K, GeForce GTX 1070 Mobile, Samsung SSD 960 Pro 512 GB m.2, IPS, 1920x1080, 15.6" | |
|---|---|---|---|---|---|---|
| Power Consumption | 10% | -7% | -54% | -8% | 22% | |
| Idle Minimum * (Watt) | 28.5 | 33.3 -17% | 29 -2% | 54.7 -92% | 31 -9% | 21.2 26% |
| Idle Average * (Watt) | 36.7 | 40.1 -9% | 37 -1% | 55.7 -52% | 35 5% | 25.1 32% |
| Idle Maximum * (Watt) | 37.8 | 42.1 -11% | 46 -22% | 56.8 -50% | 45 -19% | 26.3 30% |
| Load Average * (Watt) | 144.6 | 95.6 34% | 156 -8% | 183.7 -27% | 130 10% | 169.4 -17% |
| Witcher 3 ultra * (Watt) | 218.9 | 152.9 30% | 252 -15% | 454.8 -108% | 268 -22% | |
| Load Maximum * (Watt) | 336 | 220 35% | 314 7% | 321.8 4% | 374 -11% | 202.4 40% |
* ... smaller is better
Battery Life
Battery life is longer than we expected at 3 hours of real-world WLAN use. Charging from empty to full capacity is disappointingly slow at about 2.5 hours despite the large AC adapter.
| Eurocom Tornado F7W i9-9900K, Quadro P5200, 90 Wh | Eurocom Sky X7C i7-8086K, GeForce GTX 1080 Mobile, 82 Wh | Asus Chimera G703GI i9-8950HK, GeForce GTX 1080 Mobile, 71 Wh | Eurocom Sky X9C i7-8700K, GeForce GTX 1080 SLI (Laptop), 89 Wh | MSI GT75 8RG-090 Titan i9-8950HK, GeForce GTX 1080 Mobile, 75 Wh | Eurocom Tornado F5 i7-7700K, GeForce GTX 1070 Mobile, 75.24 Wh | |
|---|---|---|---|---|---|---|
| Battery runtime | -20% | -27% | -57% | 20% | ||
| WiFi v1.3 (h) | 3 | 2.4 -20% | 2.2 -27% | 1.3 -57% | 3.6 20% | |
| Reader / Idle (h) | 2.8 | 1.4 | 3.8 | 4.9 | ||
| Load (h) | 0.9 | 0.8 | 1.1 | 1.1 |
Verdict
Pros
Cons
The biggest reasons to choose a Eurocom workstation are for its performance, configurable options, and end-user serviceability. Competing systems from more well-known brands like Lenovo, Dell, or HP tend to have slower hardware, fewer upgrade options, and a dislike for end-user tinkering. Users who intend to exploit these three advantages will find a lot to like about the Tornado F7W.
There are a lot of improvements to still be made when diving deeper into the details. CPU performance in particular could be better as users aren't getting the full potential out of the Core i9-9900K from this chassis. The 4K UHD panel is slightly grainier than we're used to even for a matte panel and the actively-cooled AC adapter can sometimes be louder than the laptop under medium loads. The seemingly buggy BIOS and WLAN we experienced are likely issues with our specific unit only, but they're worth a mention nonetheless. Finally, more minor complaints like the smaller NumPad keys, lack of RGB backlight and 10 Gbit Ethernet, difficult-to-reach rear ports, and thick power cable certainly add up. Many of these can be excused from cheaper and more mainstream alternatives, but users will be expecting everything and the kitchen sink considering the price of this system.
The Eurocom Tornado F7W has no equal in the 17-inch mobile workstation world. Its extreme performance and hardware versatility should satisfy professionals who are comfortable with swapping components and troubleshooting on their own. Even so, there are a handful of smaller annoyances and omissions that we hope future iterations will address.
Eurocom Tornado F7W
- 12/06/2018 v6 (old)
Allen Ngo
Price comparison
