Schenker XMG Ultra 17 (i9-9900K, GTX 1080, UHD) Clevo P775TM1-G Laptop Review

Similar to other Barebone suppliers, Schenker Technologies scores with ample configuration options. In the mysn.de online shop (which is currently transferred to bestware.com) the XMG Ultra 17 starts from 1749 Euros (~$1990) but can become considerably more expensive with the corresponding components.
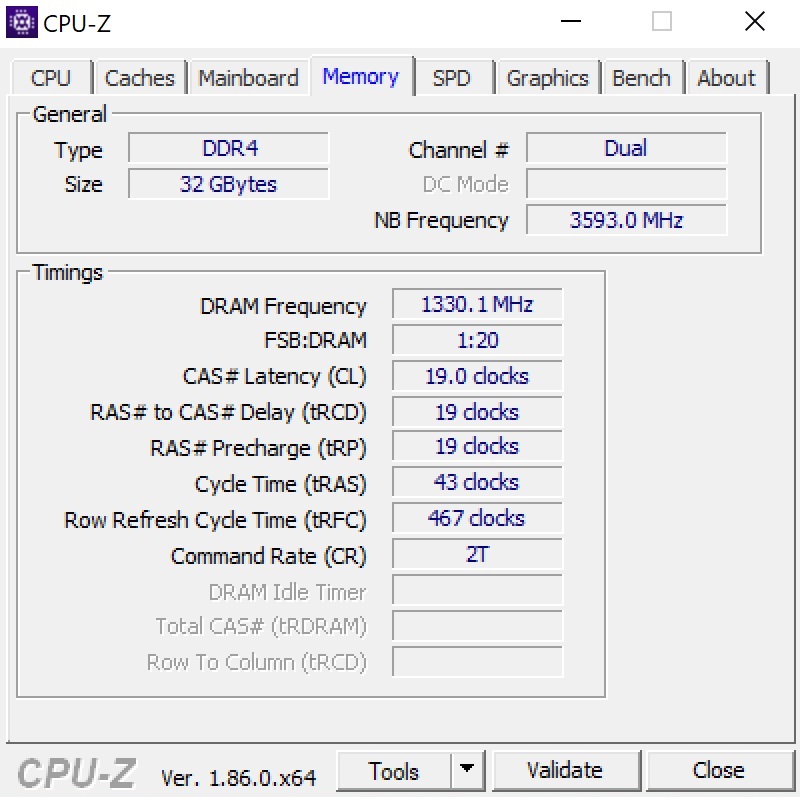
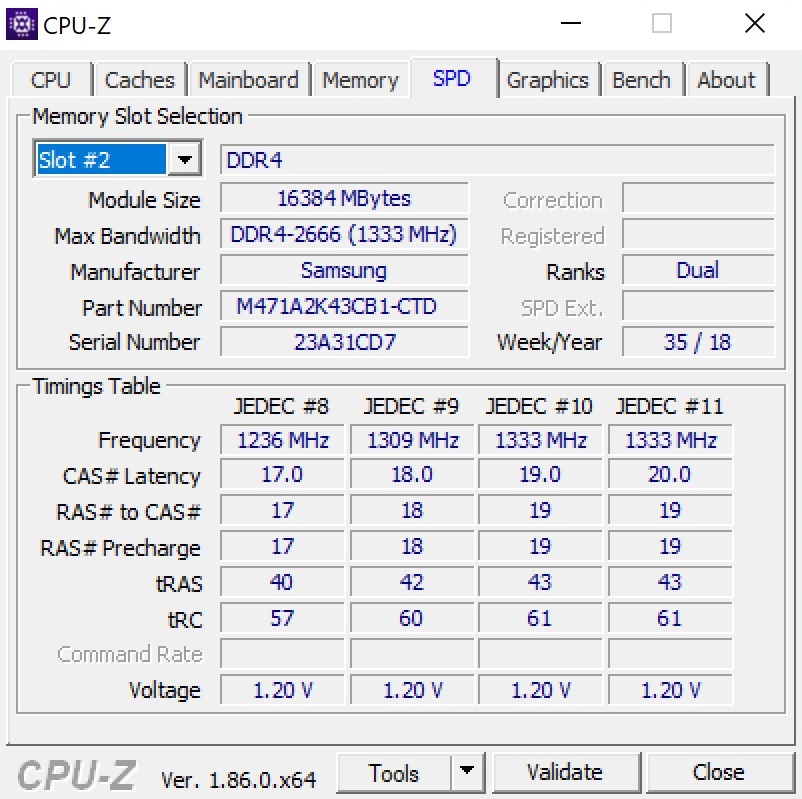
The best example for this is our test unit, which is equipped with 32 GB of DDR4-RAM (2x 16 GB @2666 MHz), a 1000 GB NVMe-SSD, and Nvidia's currently fastest laptop GPU, the GeForce GTX 1080. In combination with the Pascal chip, you can get an Intel processor from the i5, i7, or i9 series.
The kicker is that since Schenker uses desktop models, the processor is not – as we know it from most notebooks – soldered in, but can be replaced if needed. The same goes for the graphics card. However, there are some limits in the upgrade options (software support, availability of the hardware, power supply, cooling, etc.). Of course, all this technology has its price: With the Core i9-9900K, 4K display, and Windows 10 Home 64 Bit, our test unit costs almost 4000 Euros (~$4553).
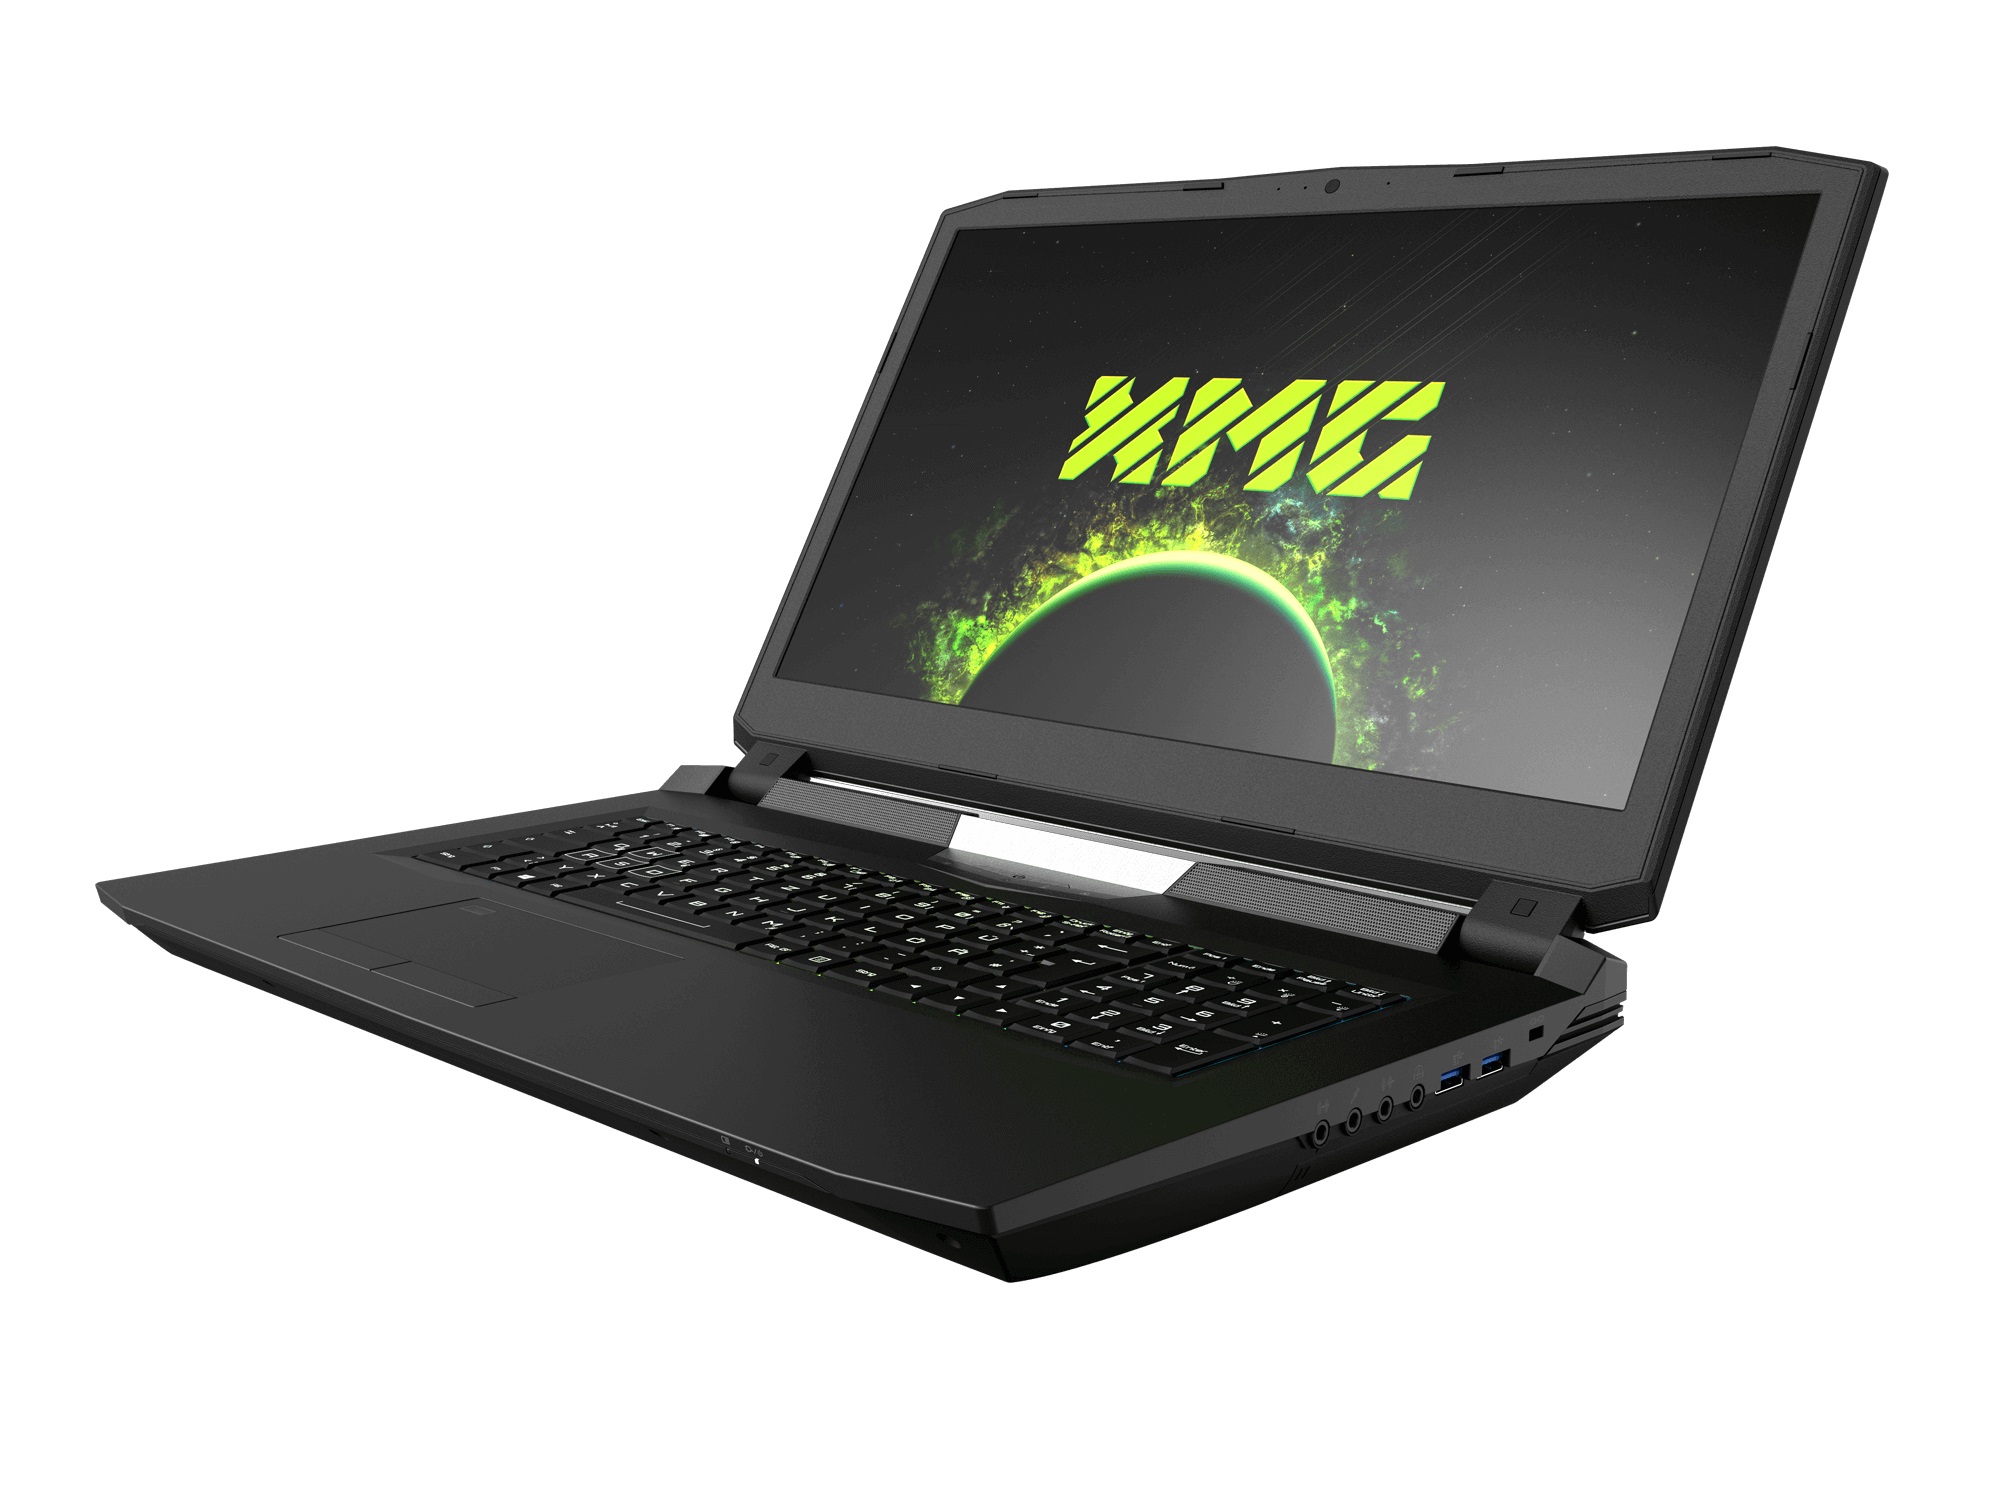
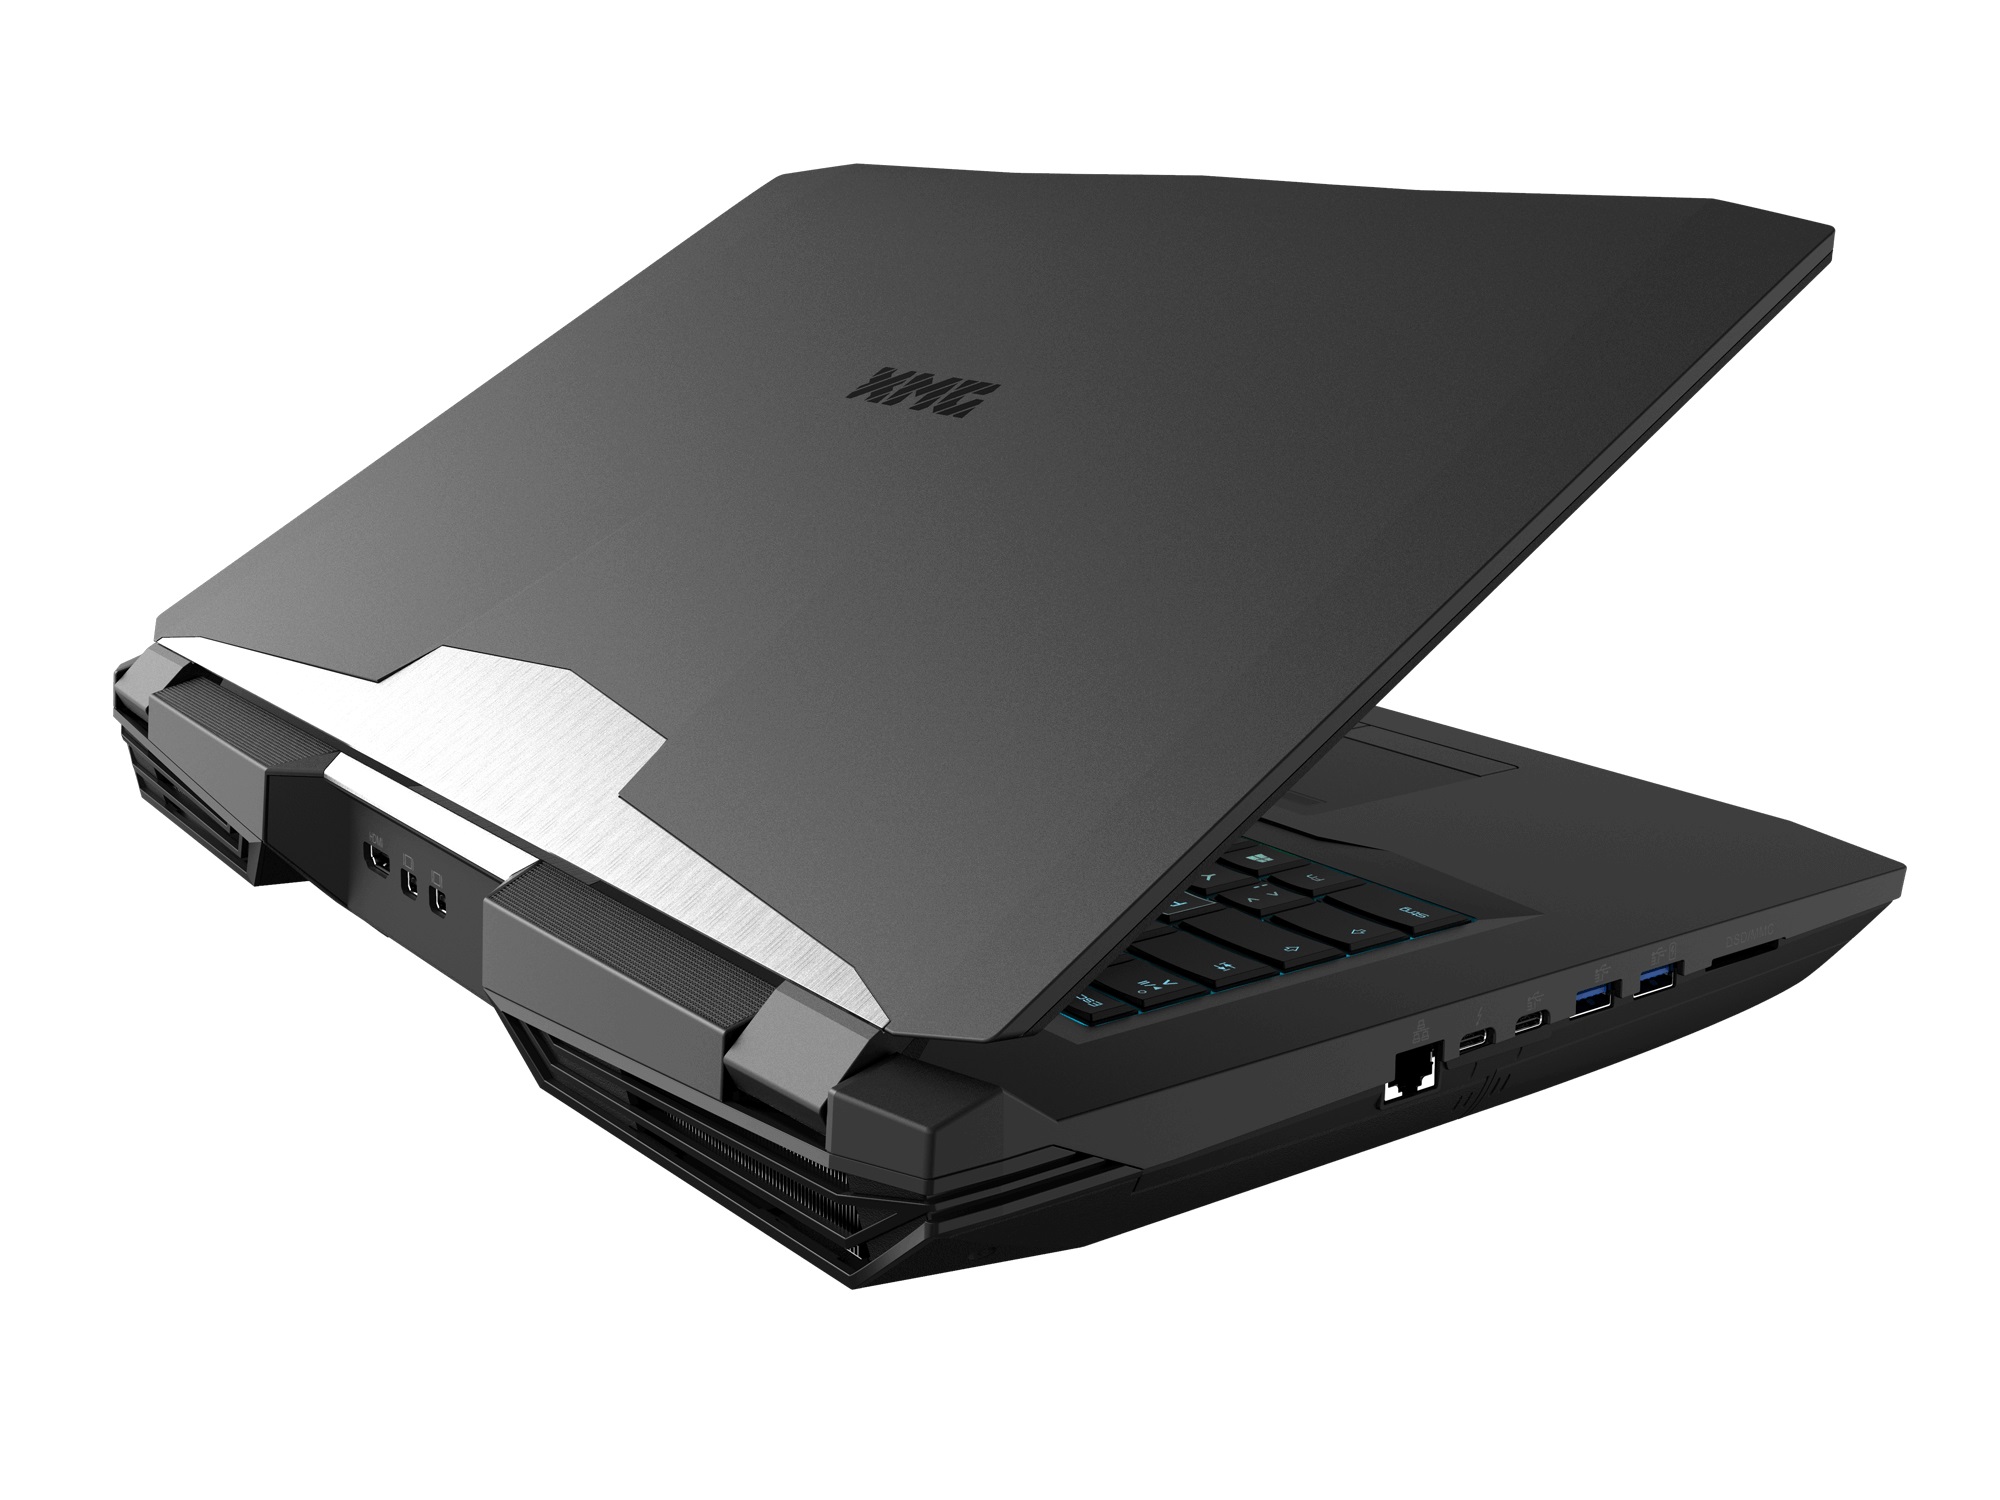
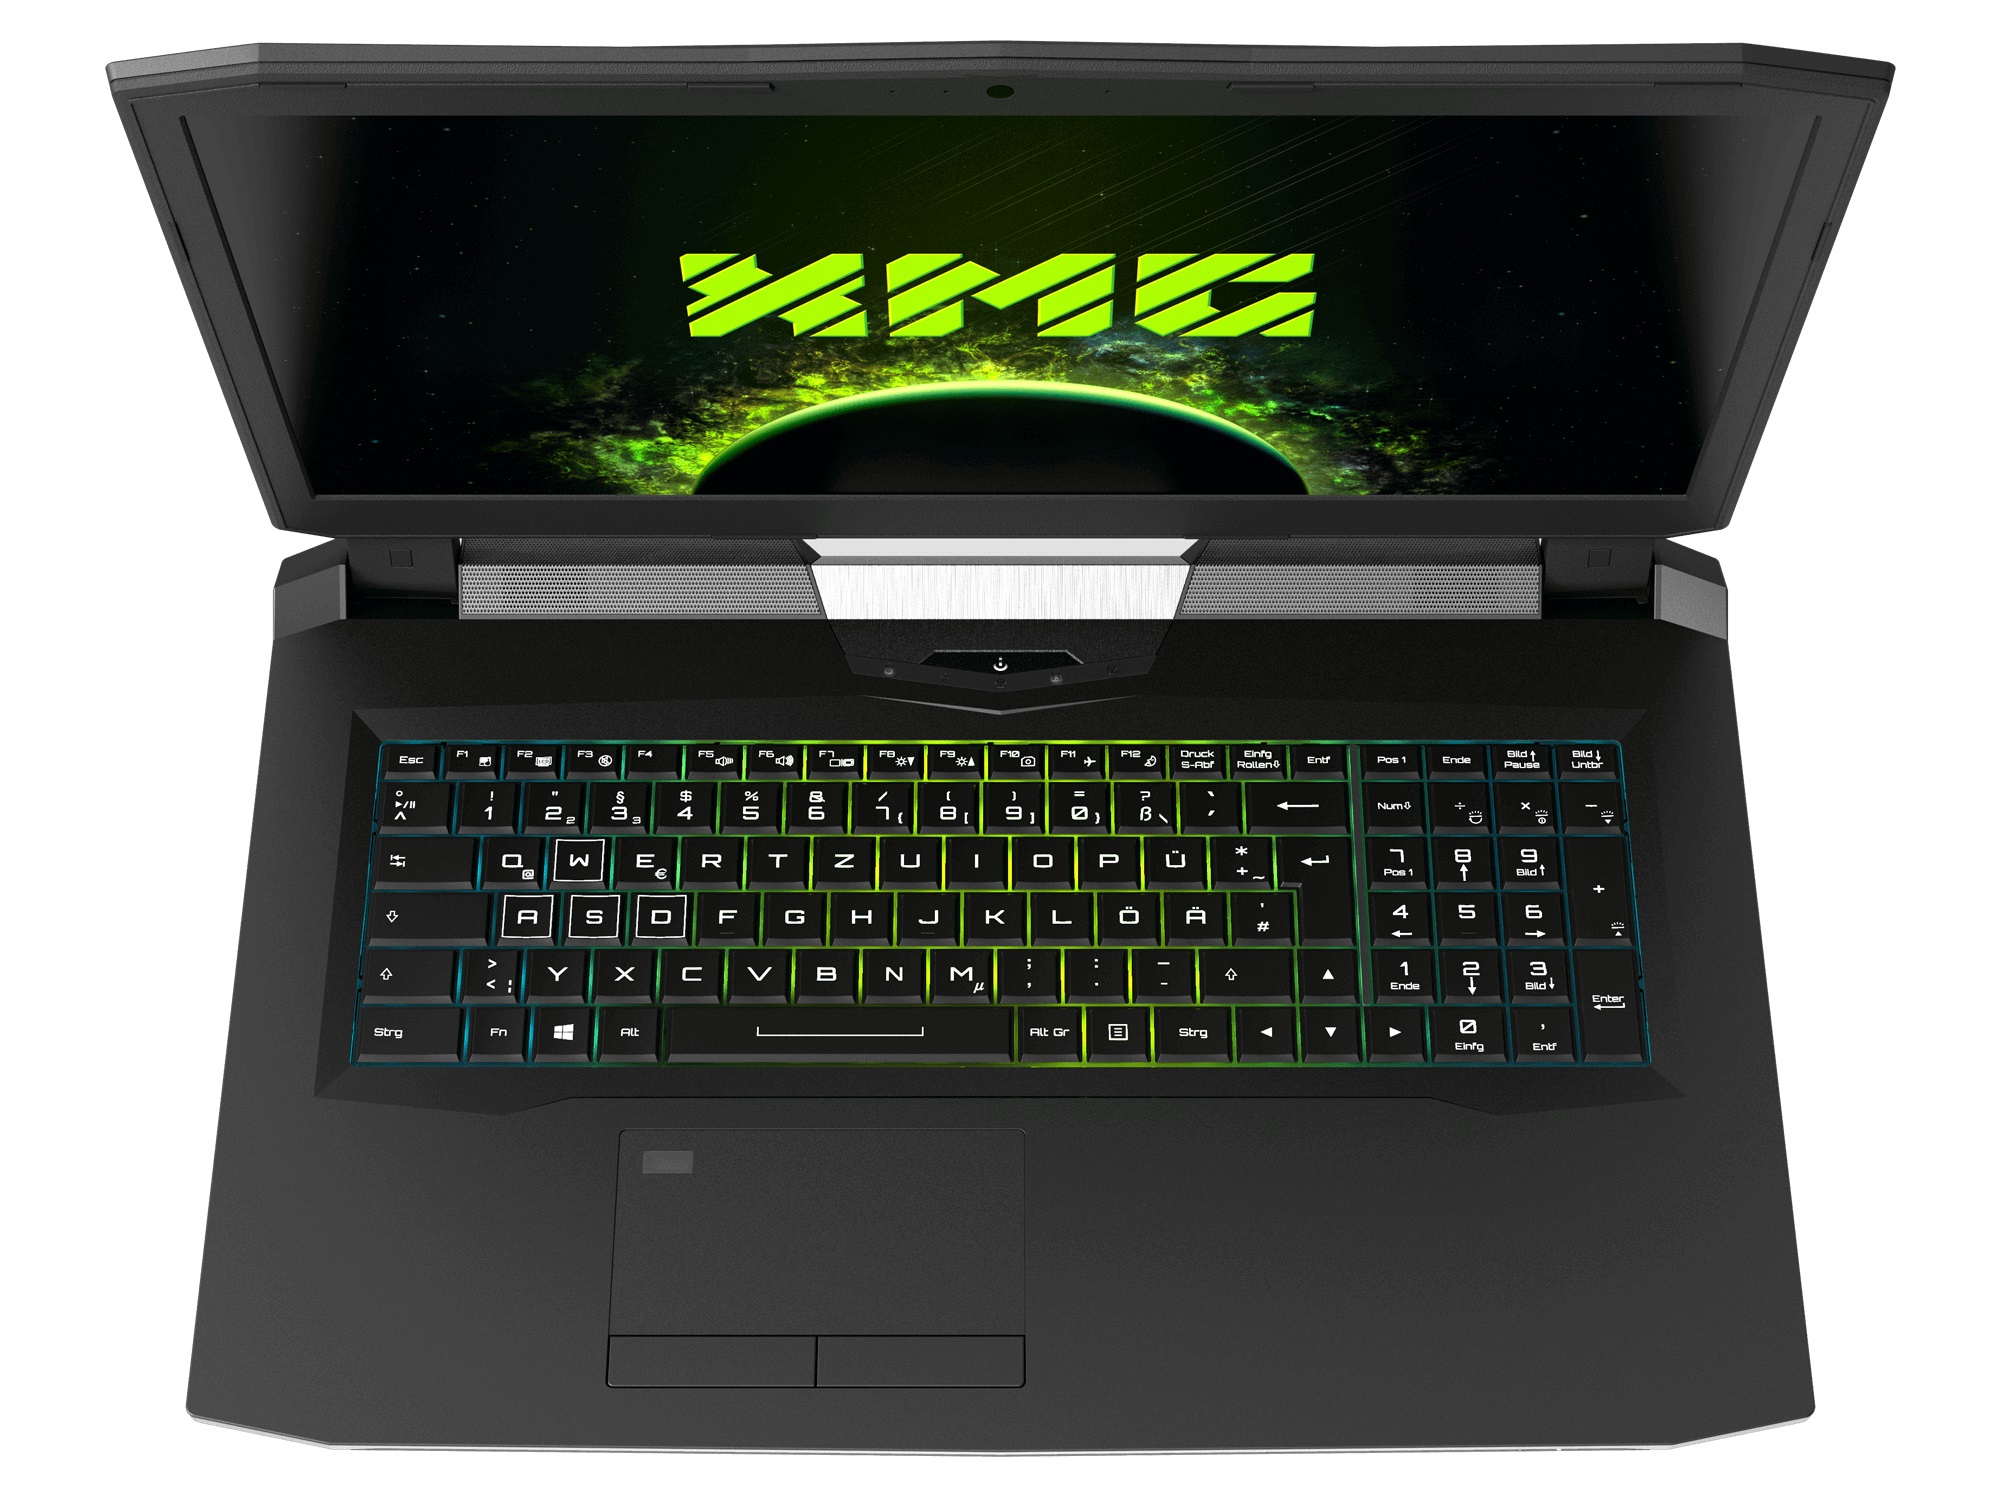
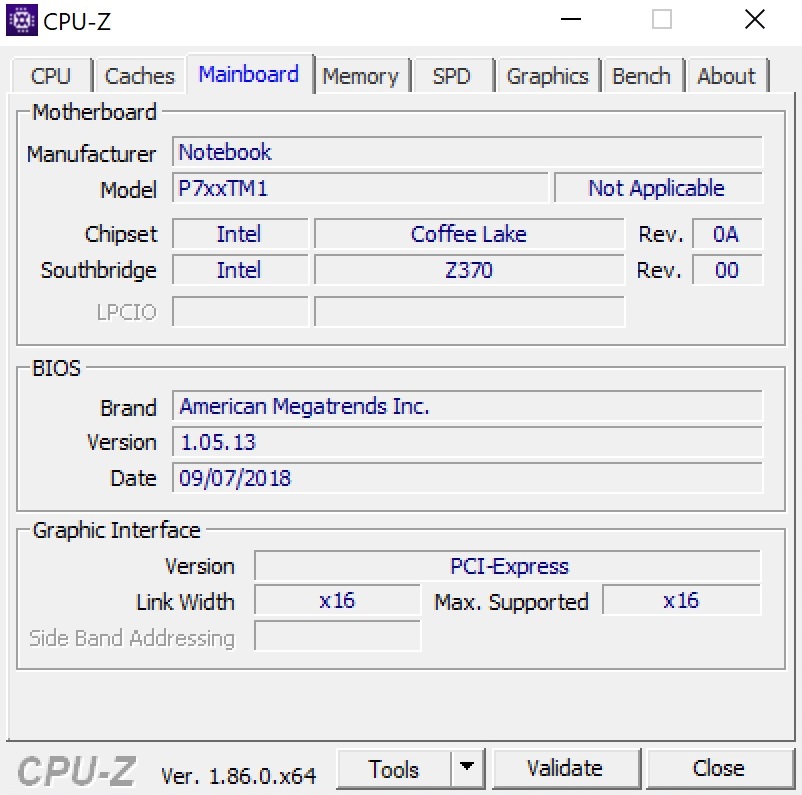
Schenker has not made any changes to the case. The label of the Clevo Barebone used is the same as that of our previous test unit (P775TM1-G), which showed strong similarities to the Guru Mars K (P775DM3-G) we evaluated in 2017. You can find all the information on the case, the connections, and input devices in the previous review.
The primary competitors of the XMG Ultra 17 include other 17-inch gaming notebooks from our Top 10 List with the GeForce GTX 1080 and a Coffee-Lake CPU such as the Asus ROG Chimera G703GI and the Aorus X7 DT v8, which we use as comparison devices in our test here.
| SD Card Reader | |
| average JPG Copy Test (av. of 3 runs) | |
| Asus Chimera G703GI (Toshiba Exceria Pro SDXC 64 GB UHS-II) | |
| Aorus X7 DT v8 (Toshiba Exceria Pro SDXC 64 GB UHS-II) | |
| Schenker XMG Ultra 17 Coffee Lake Refresh (Toshiba Exceria Pro SDXC 64 GB UHS-II) | |
| Schenker XMG Ultra 17 (Toshiba Exceria Pro SDXC 64 GB UHS-II) | |
| Average of class Gaming (20.9 - 210, n=55, last 2 years) | |
| maximum AS SSD Seq Read Test (1GB) | |
| Asus Chimera G703GI (Toshiba Exceria Pro SDXC 64 GB UHS-II) | |
| Aorus X7 DT v8 (Toshiba Exceria Pro SDXC 64 GB UHS-II) | |
| Schenker XMG Ultra 17 (Toshiba Exceria Pro SDXC 64 GB UHS-II) | |
| Schenker XMG Ultra 17 Coffee Lake Refresh (Toshiba Exceria Pro SDXC 64 GB UHS-II) | |
| Average of class Gaming (25.5 - 261, n=52, last 2 years) | |
| Networking | |
| iperf3 transmit AX12 | |
| Asus Chimera G703GI | |
| Schenker XMG Ultra 17 Coffee Lake Refresh | |
| Aorus X7 DT v8 | |
| Schenker XMG Ultra 17 | |
| iperf3 receive AX12 | |
| Schenker XMG Ultra 17 | |
| Schenker XMG Ultra 17 Coffee Lake Refresh | |
| Asus Chimera G703GI | |
| Aorus X7 DT v8 | |
Display
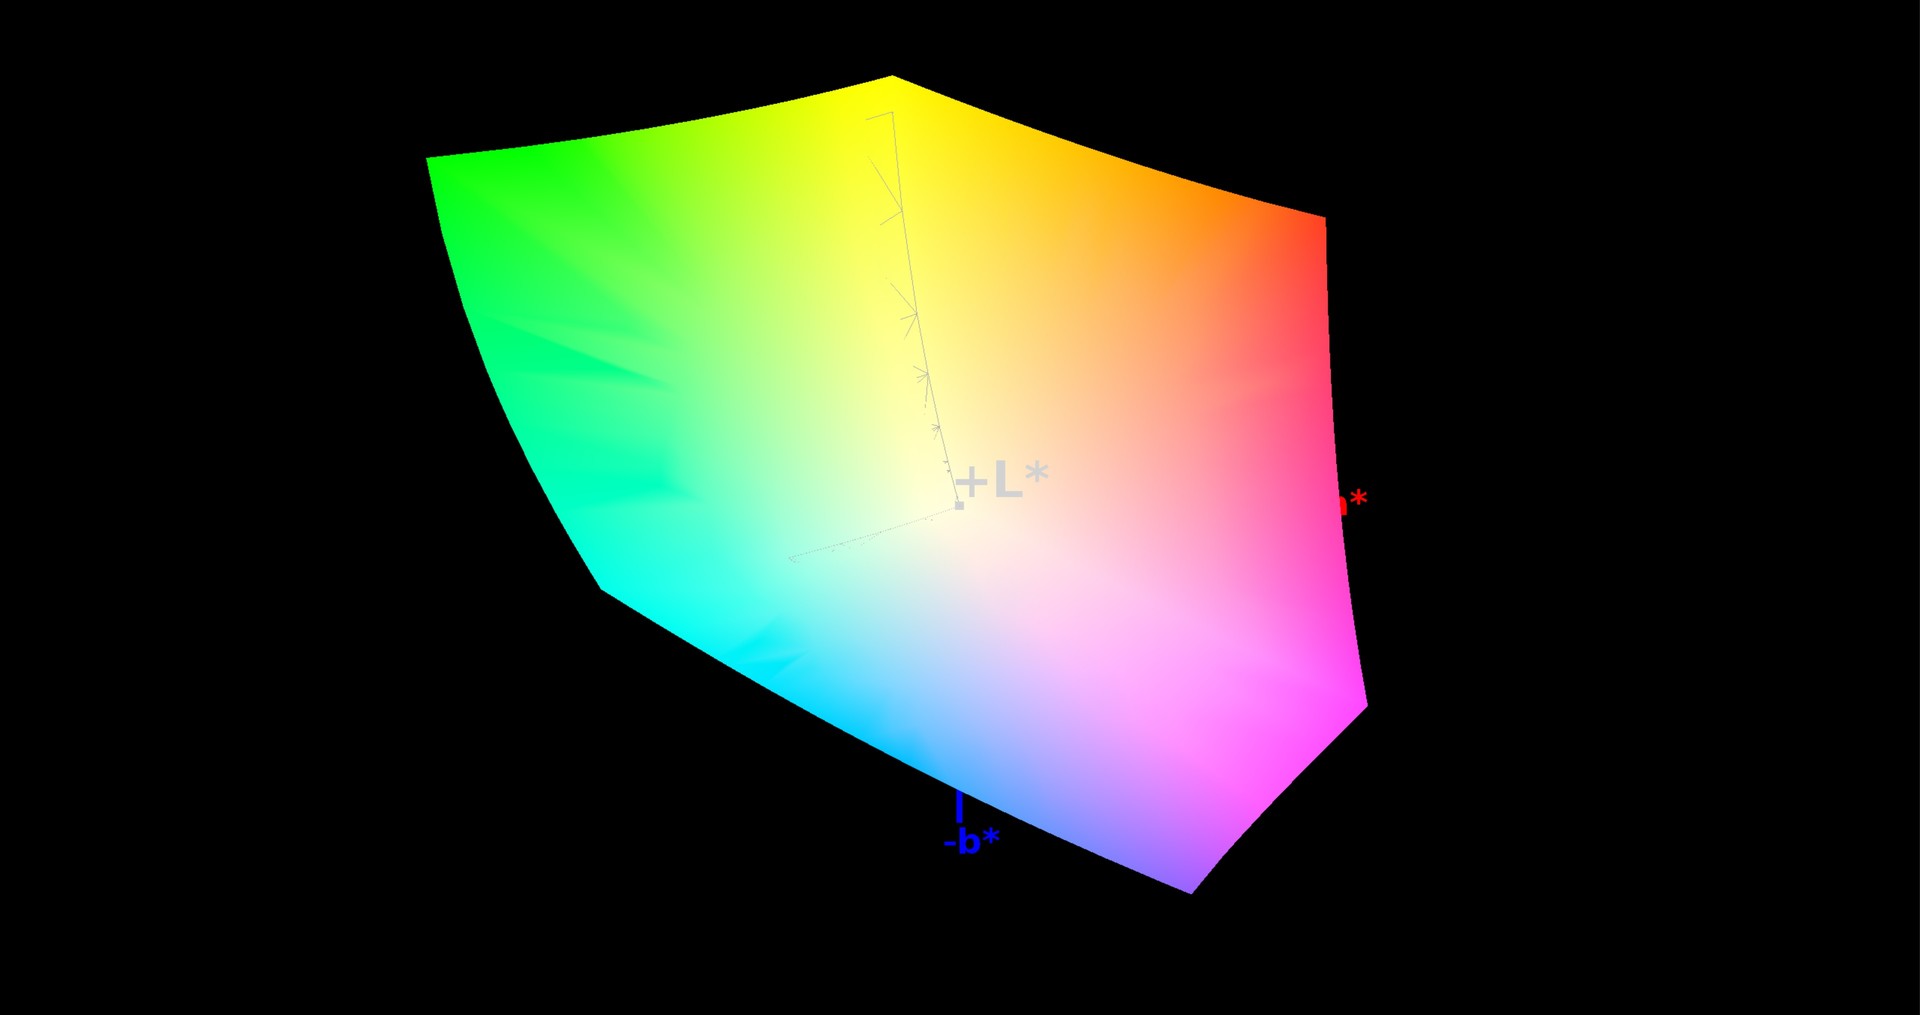
Like the Barebone case, the display is also the same as in our old test unit. The UHD panel from AU Optronics (B173ZAN) that you can get for an additional premium captivates primarily with its large color space. Only a few laptops can reach a 100% sRGB and 87% AdobeRGB color space coverage.
| |||||||||||||||||||||||||
Brightness Distribution: 87 %
Center on Battery: 349 cd/m²
Contrast: 851:1 (Black: 0.41 cd/m²)
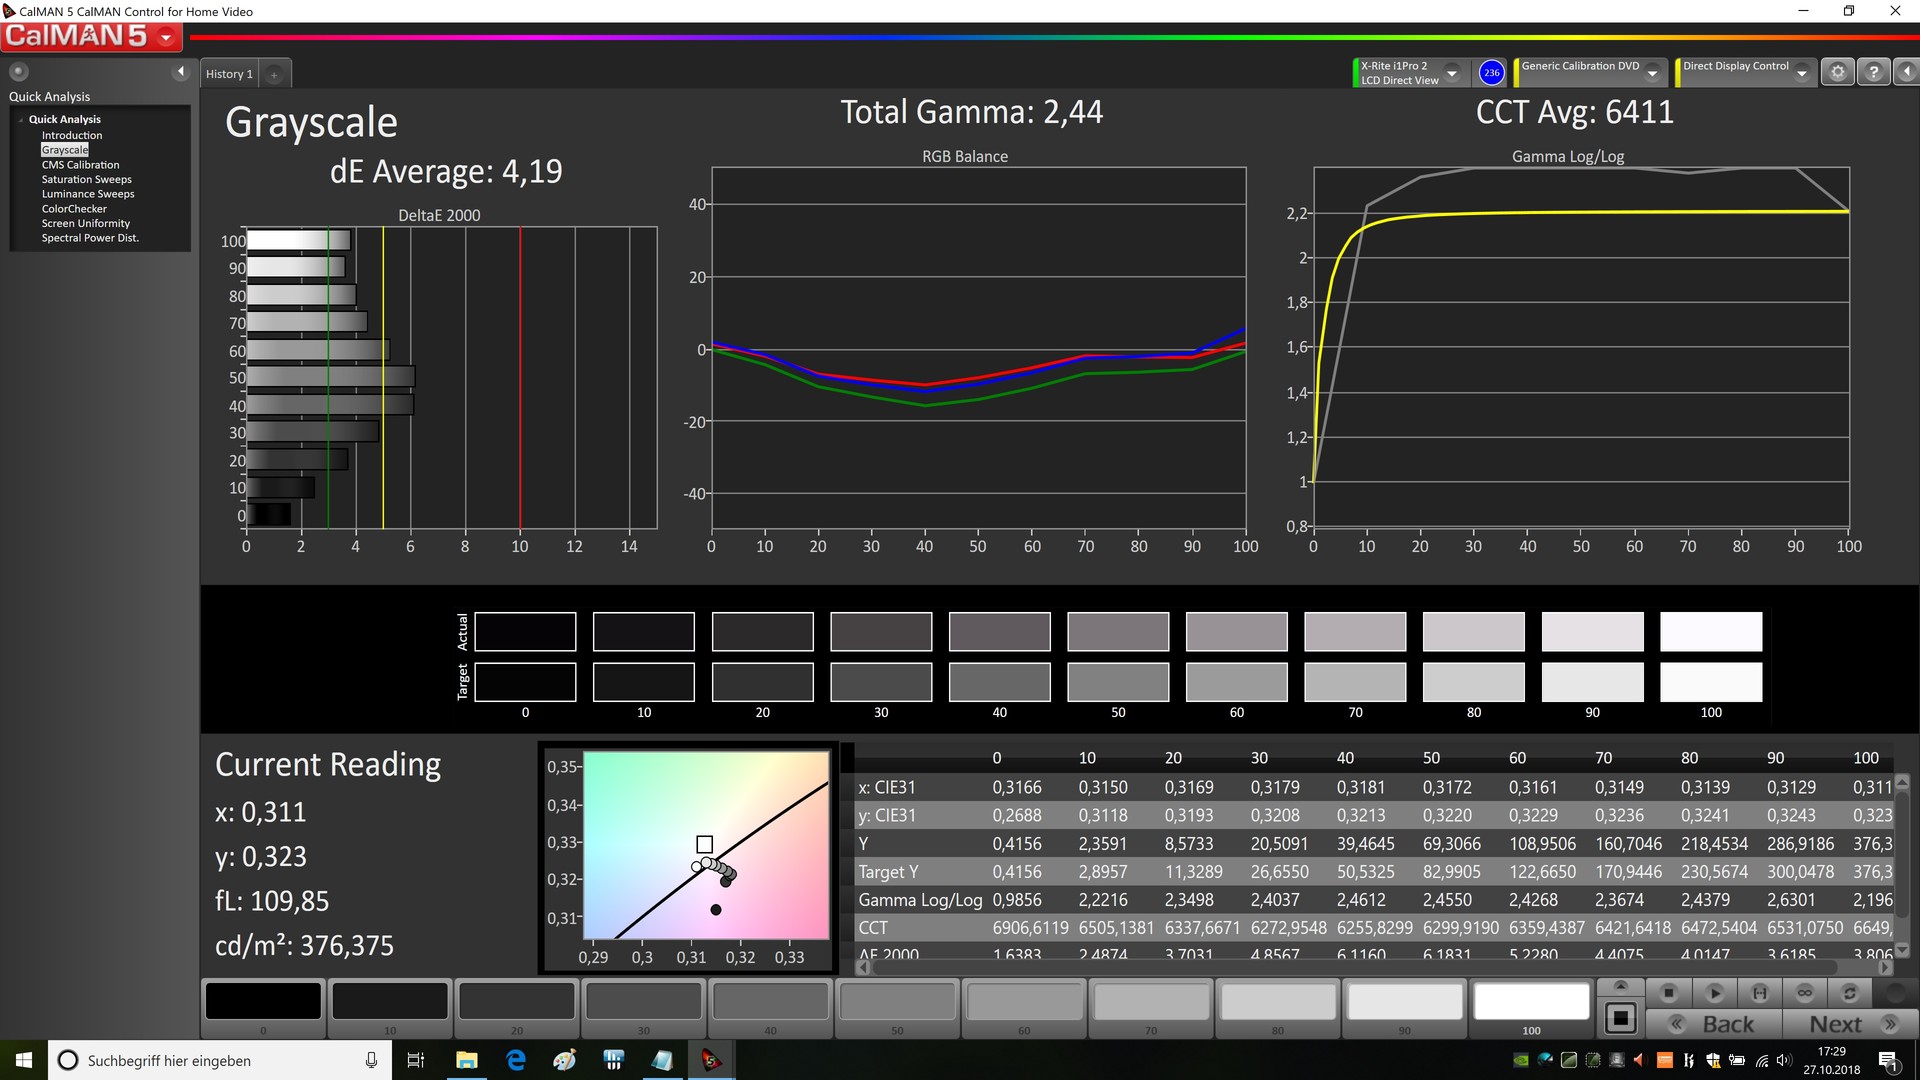
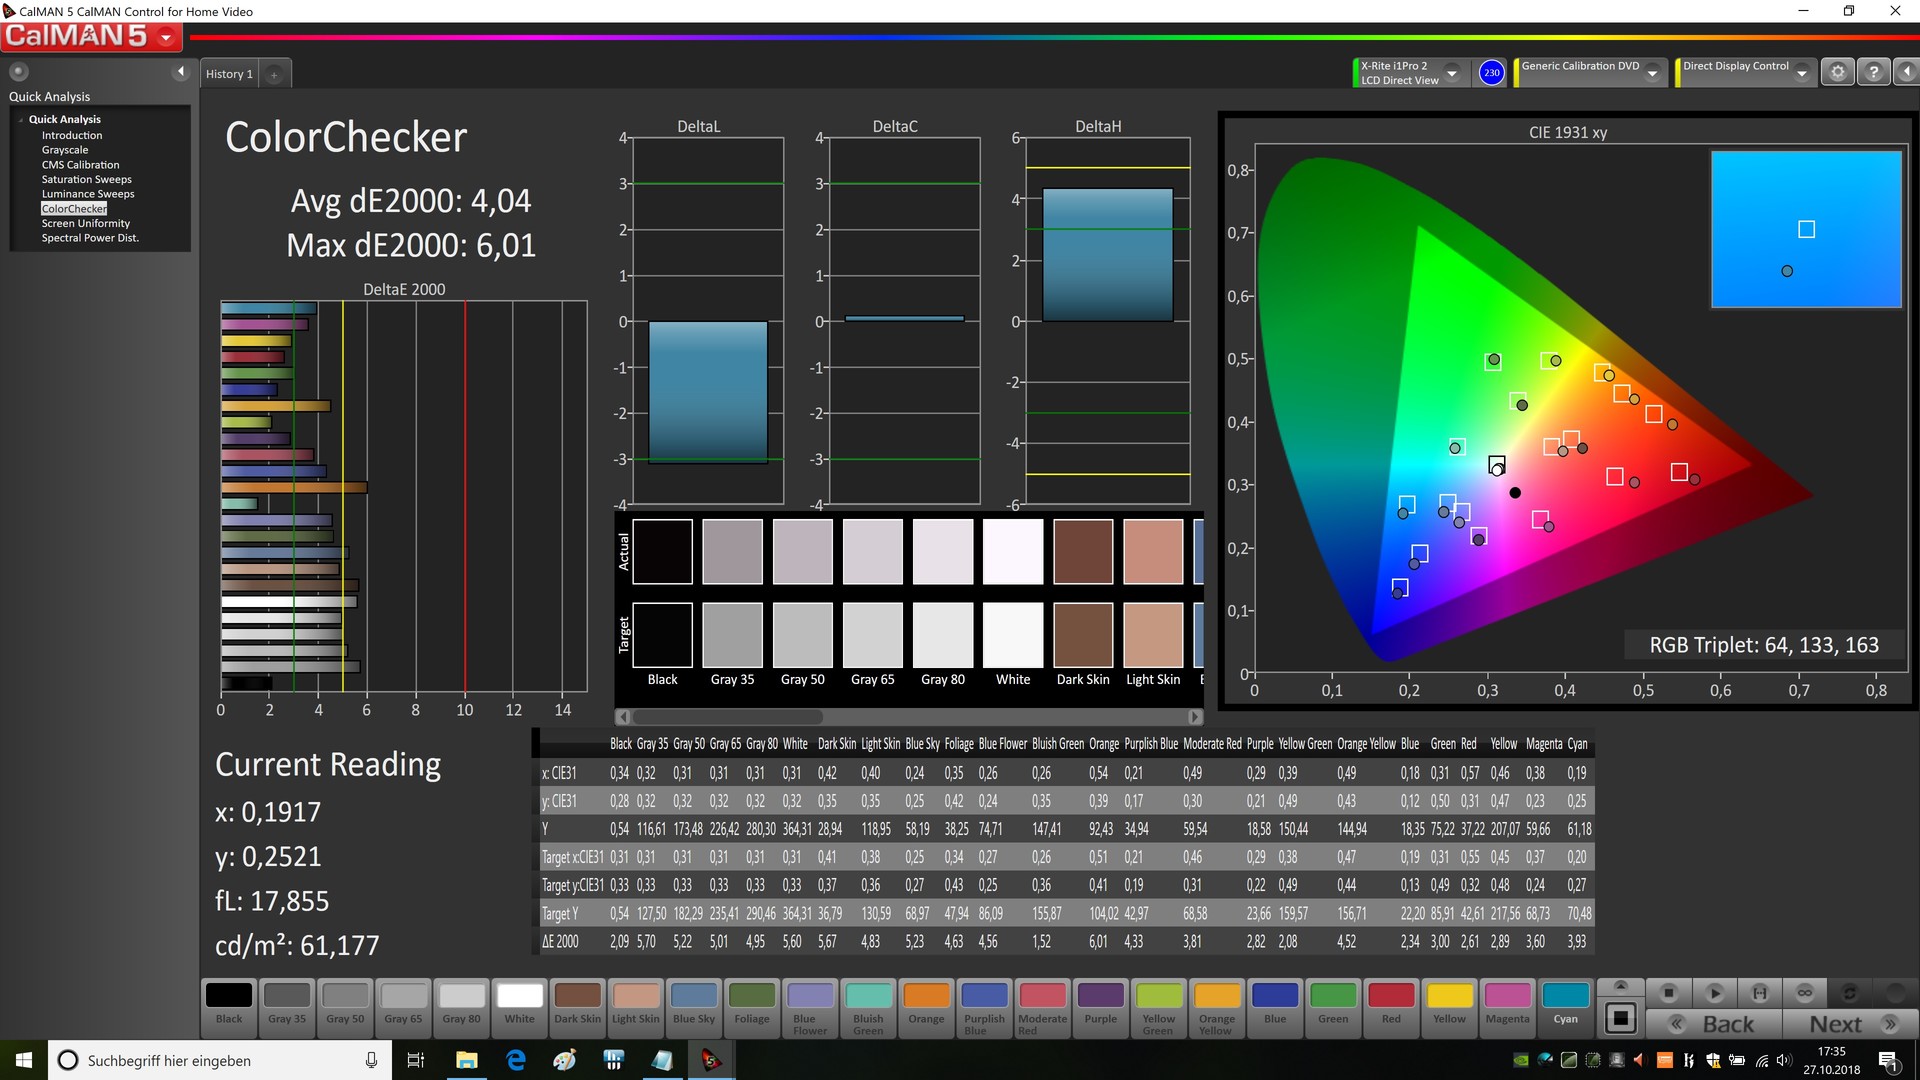
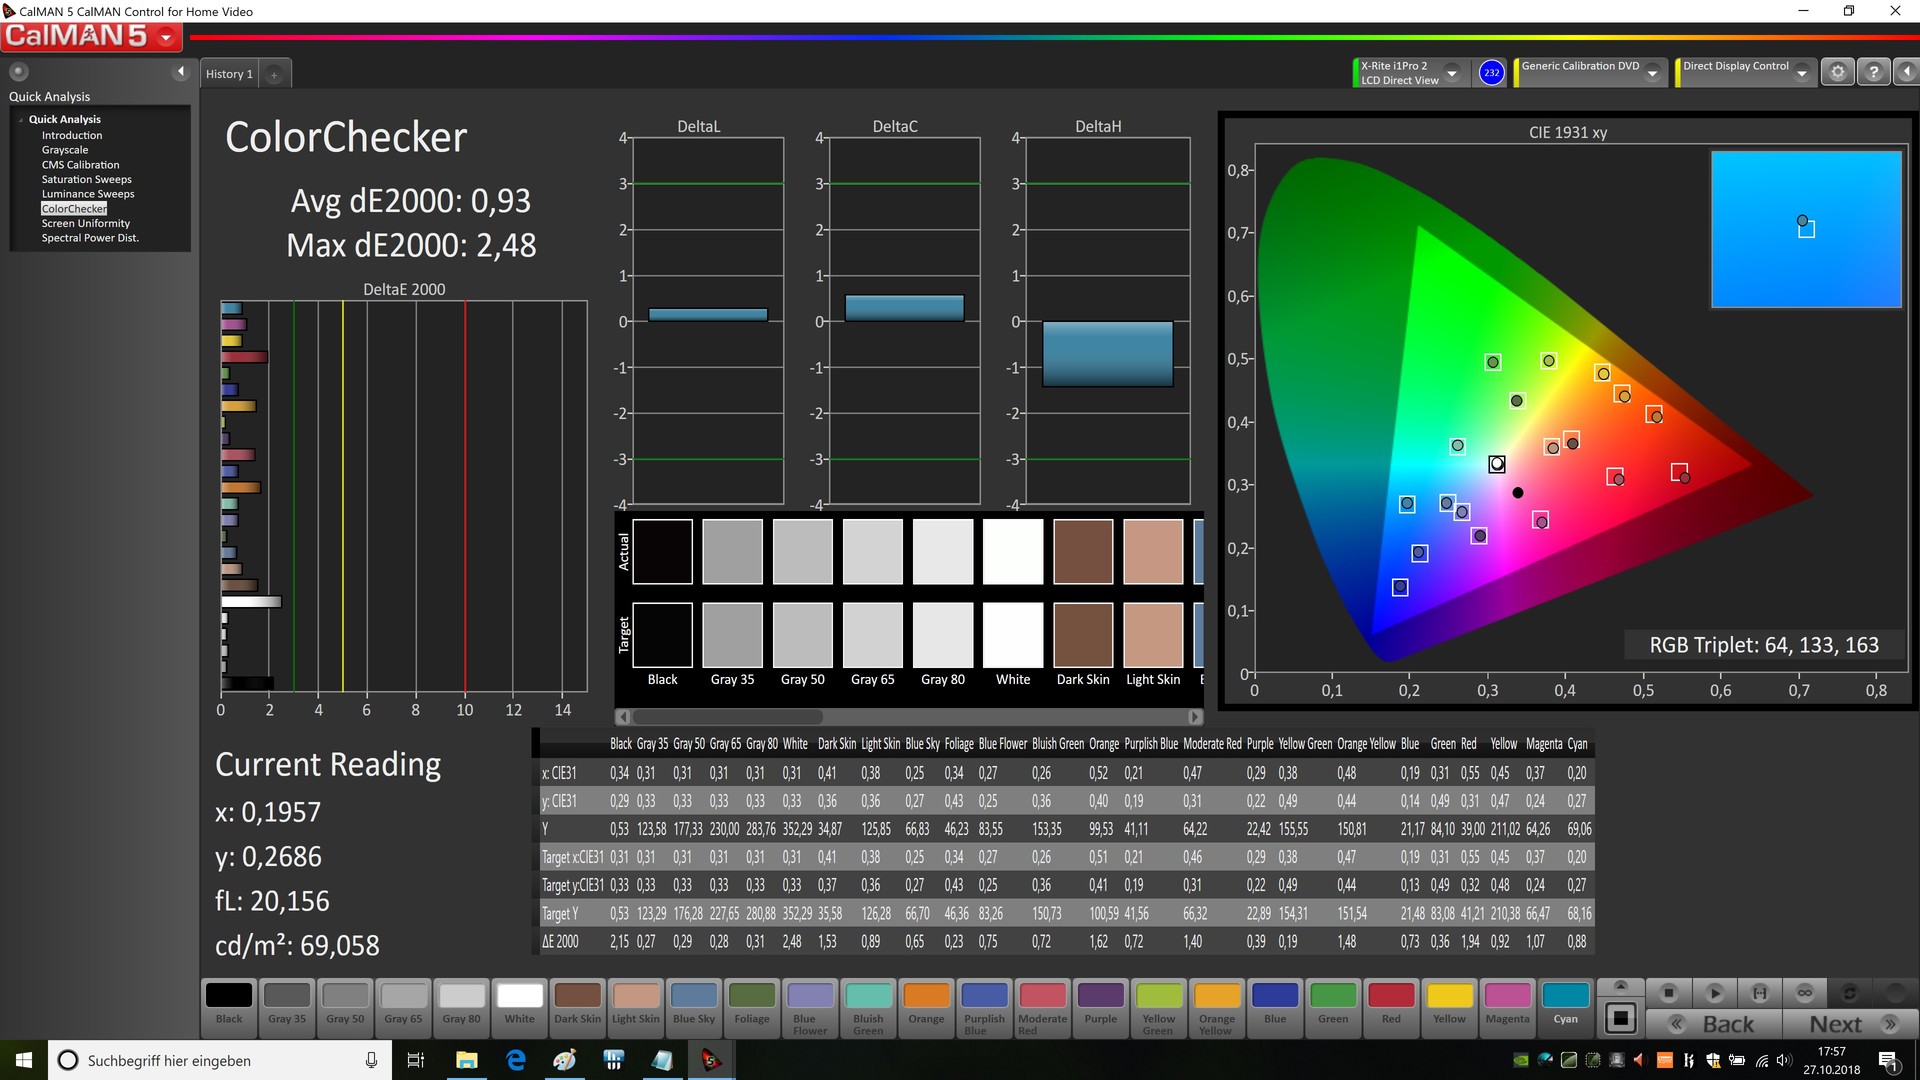
ΔE ColorChecker Calman: 4.04 | ∀{0.5-29.43 Ø4.73}
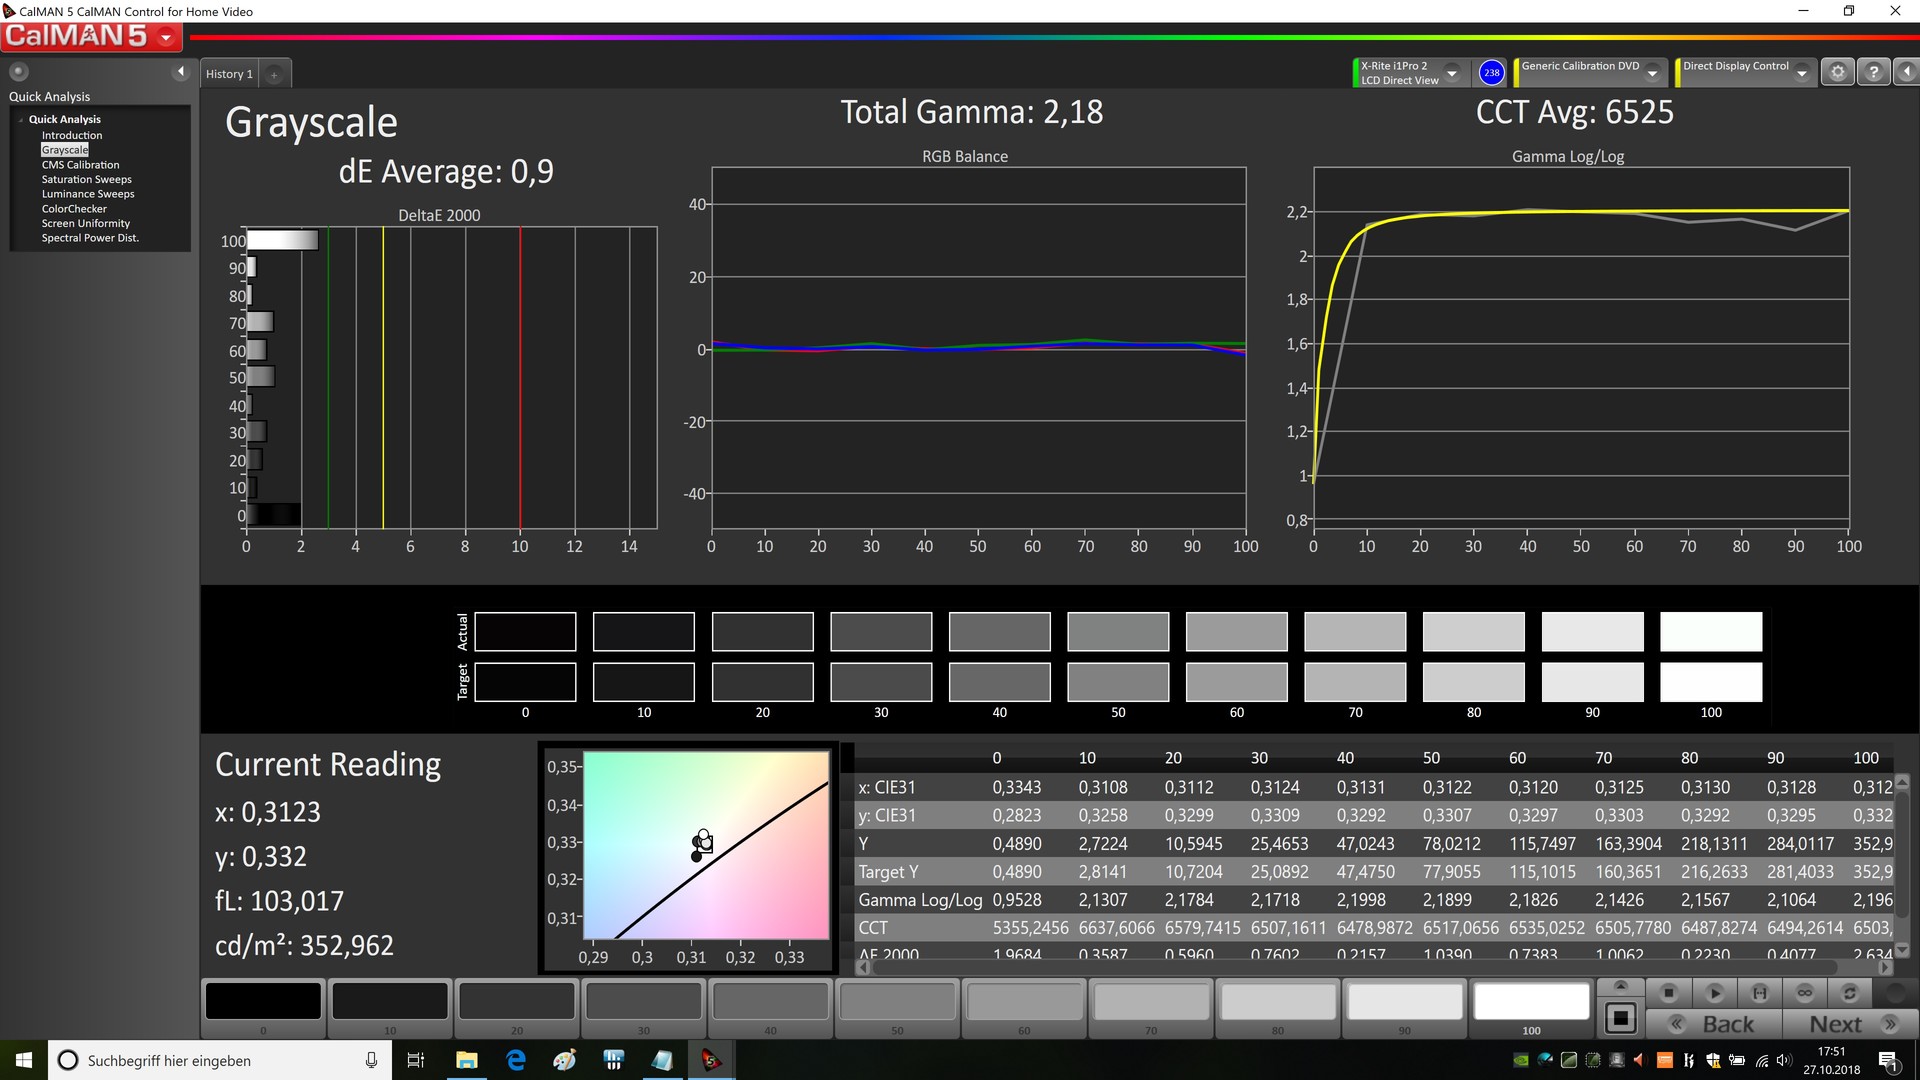
calibrated: 0.93
ΔE Greyscale Calman: 4.19 | ∀{0.09-98 Ø4.97}
100% sRGB (Argyll 1.6.3 3D)
87% AdobeRGB 1998 (Argyll 1.6.3 3D)
98.9% AdobeRGB 1998 (Argyll 3D)
99.9% sRGB (Argyll 3D)
85.8% Display P3 (Argyll 3D)
Gamma: 2.44
CCT: 6411 K
| Schenker XMG Ultra 17 Coffee Lake Refresh AU Optronics B173ZAN (AUO109B), IPS, 3840x2160 | Schenker XMG Ultra 17 AU Optronics B173ZAN01.0 (AUO109B), IPS, 3840x2160 | Asus Chimera G703GI B173HAN03.2 (AUO329D), IPS, 1920x1080 | Aorus X7 DT v8 AU Optronics B173HAN03.0 (AUO309D), IPS, 1920x1080 | |
|---|---|---|---|---|
| Display | 0% | -21% | -22% | |
| Display P3 Coverage (%) | 85.8 | 86.4 1% | 65.8 -23% | 65.3 -24% |
| sRGB Coverage (%) | 99.9 | 100 0% | 92.6 -7% | 91.2 -9% |
| AdobeRGB 1998 Coverage (%) | 98.9 | 99.1 0% | 67 -32% | 66.3 -33% |
| Response Times | -9% | 68% | 51% | |
| Response Time Grey 50% / Grey 80% * (ms) | 41.2 ? | 44 ? -7% | 6.4 ? 84% | 18 ? 56% |
| Response Time Black / White * (ms) | 22.4 ? | 24.8 ? -11% | 10.8 ? 52% | 12 ? 46% |
| PWM Frequency (Hz) | ||||
| Screen | 6% | -2% | 16% | |
| Brightness middle (cd/m²) | 349 | 332 -5% | 285 -18% | 297 -15% |
| Brightness (cd/m²) | 339 | 313 -8% | 275 -19% | 281 -17% |
| Brightness Distribution (%) | 87 | 88 1% | 82 -6% | 84 -3% |
| Black Level * (cd/m²) | 0.41 | 0.28 32% | 0.22 46% | 0.23 44% |
| Contrast (:1) | 851 | 1186 39% | 1295 52% | 1291 52% |
| Colorchecker dE 2000 * | 4.04 | 3.86 4% | 3.18 21% | 2.19 46% |
| Colorchecker dE 2000 max. * | 6.01 | 5.88 2% | 5.99 -0% | 4.81 20% |
| Colorchecker dE 2000 calibrated * | 0.93 | 1.73 -86% | ||
| Greyscale dE 2000 * | 4.19 | 4.33 -3% | 2.93 30% | 1.31 69% |
| Gamma | 2.44 90% | 2.41 91% | 2.45 90% | 2.42 91% |
| CCT | 6411 101% | 6595 99% | 7165 91% | 6464 101% |
| Color Space (Percent of AdobeRGB 1998) (%) | 87 | 88 1% | 60 -31% | 59 -32% |
| Color Space (Percent of sRGB) (%) | 100 | 100 0% | 93 -7% | 91 -9% |
| Total Average (Program / Settings) | -1% /
3% | 15% /
4% | 15% /
13% |
* ... smaller is better
The 4K screen also fares well in the remaining disciplines, even though it is not always sufficient for the top position. The fact that the contrast and black value are different than in the previous test despite being identical panels should have to do with the normal manufacturing variations across the panel series.
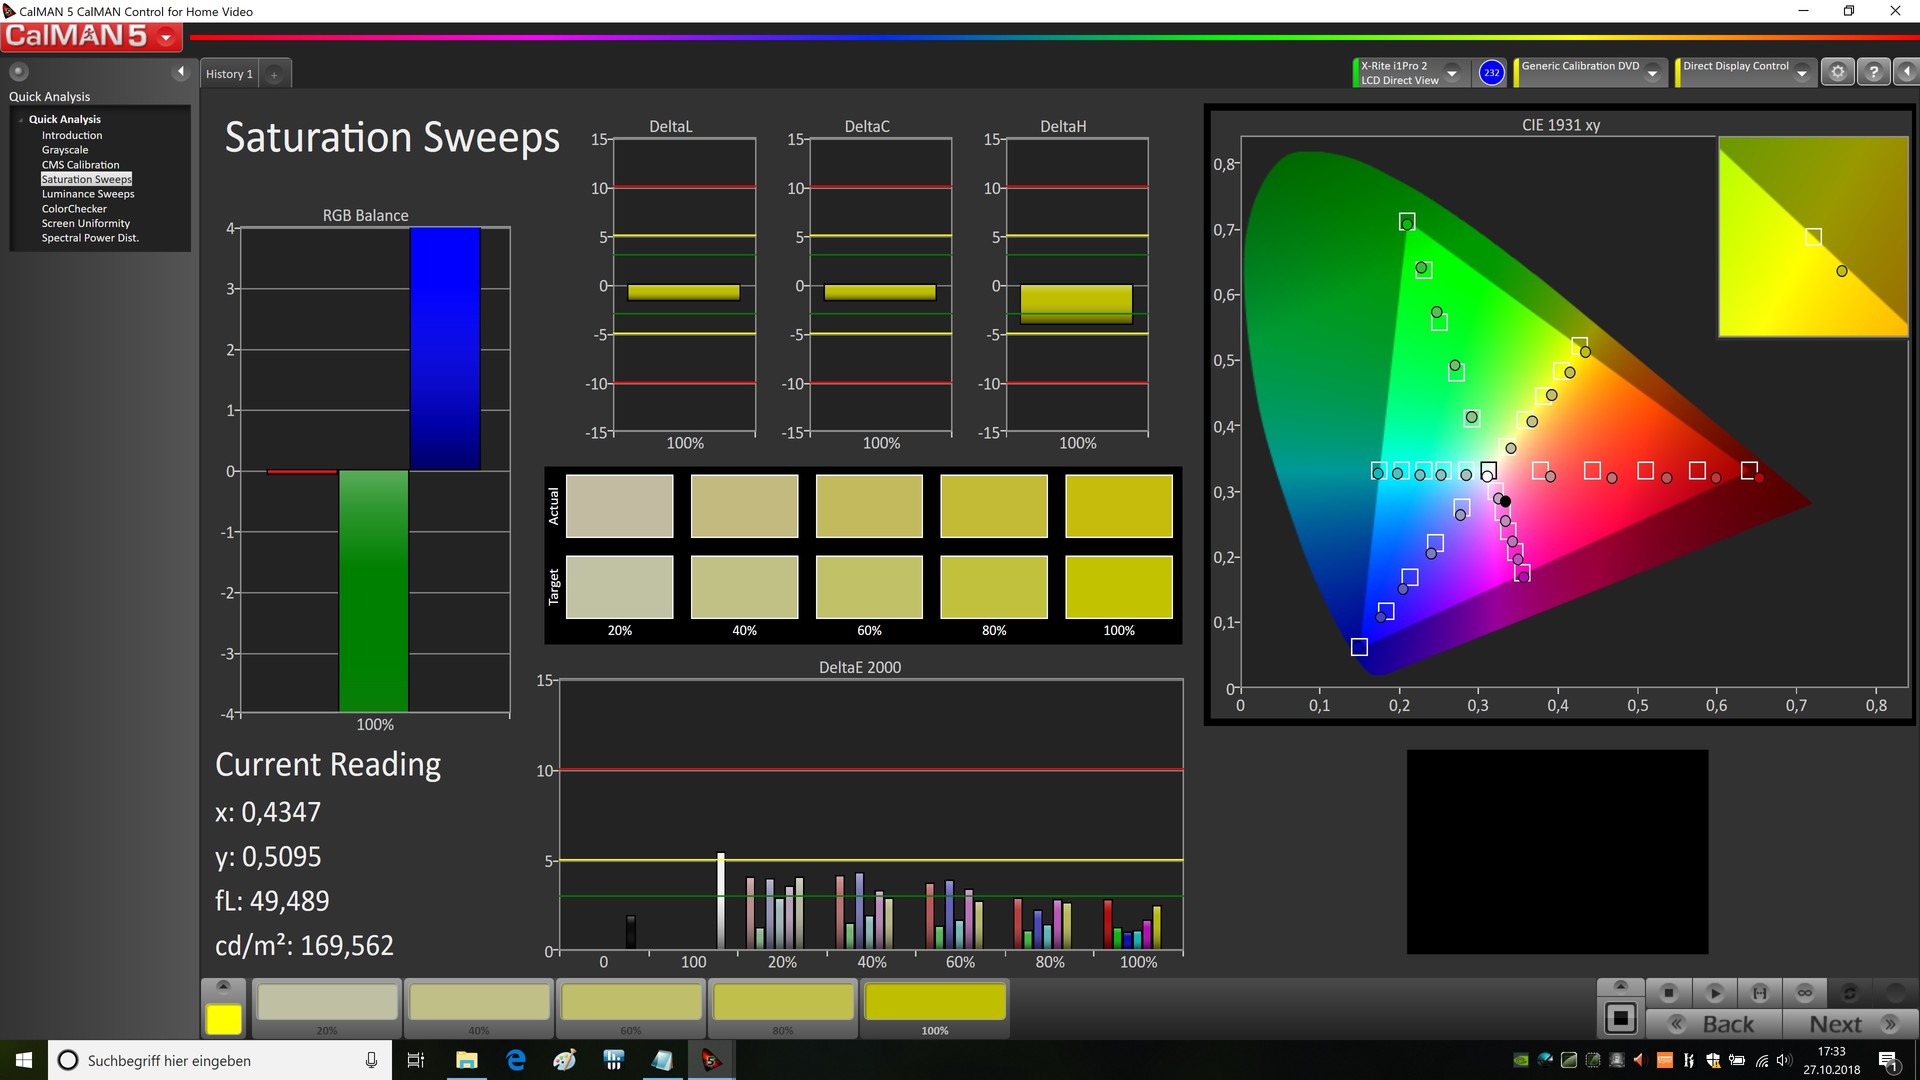
By the way, we recommend a calibration for perfect image quality. Although the colors and grayscale do not deviate too much from the ideal range at the time of delivery, professional users can still get more from the display with the corresponding methods (our ICC file is linked above).

Since it is an IPS panel, the UHD screen offers a high viewing angle stability. In return, buyers have to live with a mediocre response time. 22 ms when changing from black to white and 41 ms changing gray to gray can lead to some smudging in extremely fast games (such as FIFA 19).

In the times associated with 120 Hz and 144 Hz panels (also available alternatively), 60 Hz for the image refresh rate are also meager. On the other hand, the UHD model at least can master G-Sync.
Display Response Times
| ↔ Response Time Black to White | ||
|---|---|---|
| 22.4 ms ... rise ↗ and fall ↘ combined | ↗ 10 ms rise | 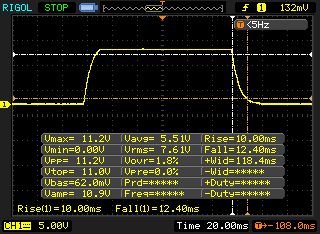 |
| ↘ 12.4 ms fall | ||
| The screen shows good response rates in our tests, but may be too slow for competitive gamers. In comparison, all tested devices range from 0.1 (minimum) to 240 (maximum) ms. » 50 % of all devices are better. This means that the measured response time is worse than the average of all tested devices (19.9 ms). | ||
| ↔ Response Time 50% Grey to 80% Grey | ||
| 41.2 ms ... rise ↗ and fall ↘ combined | ↗ 20.8 ms rise | 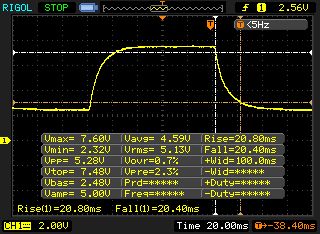 |
| ↘ 20.4 ms fall | ||
| The screen shows slow response rates in our tests and will be unsatisfactory for gamers. In comparison, all tested devices range from 0.165 (minimum) to 636 (maximum) ms. » 66 % of all devices are better. This means that the measured response time is worse than the average of all tested devices (31.1 ms). | ||
Screen Flickering / PWM (Pulse-Width Modulation)
| Screen flickering / PWM not detected |  | ||
In comparison: 52 % of all tested devices do not use PWM to dim the display. If PWM was detected, an average of 7798 (minimum: 5 - maximum: 343500) Hz was measured. | |||
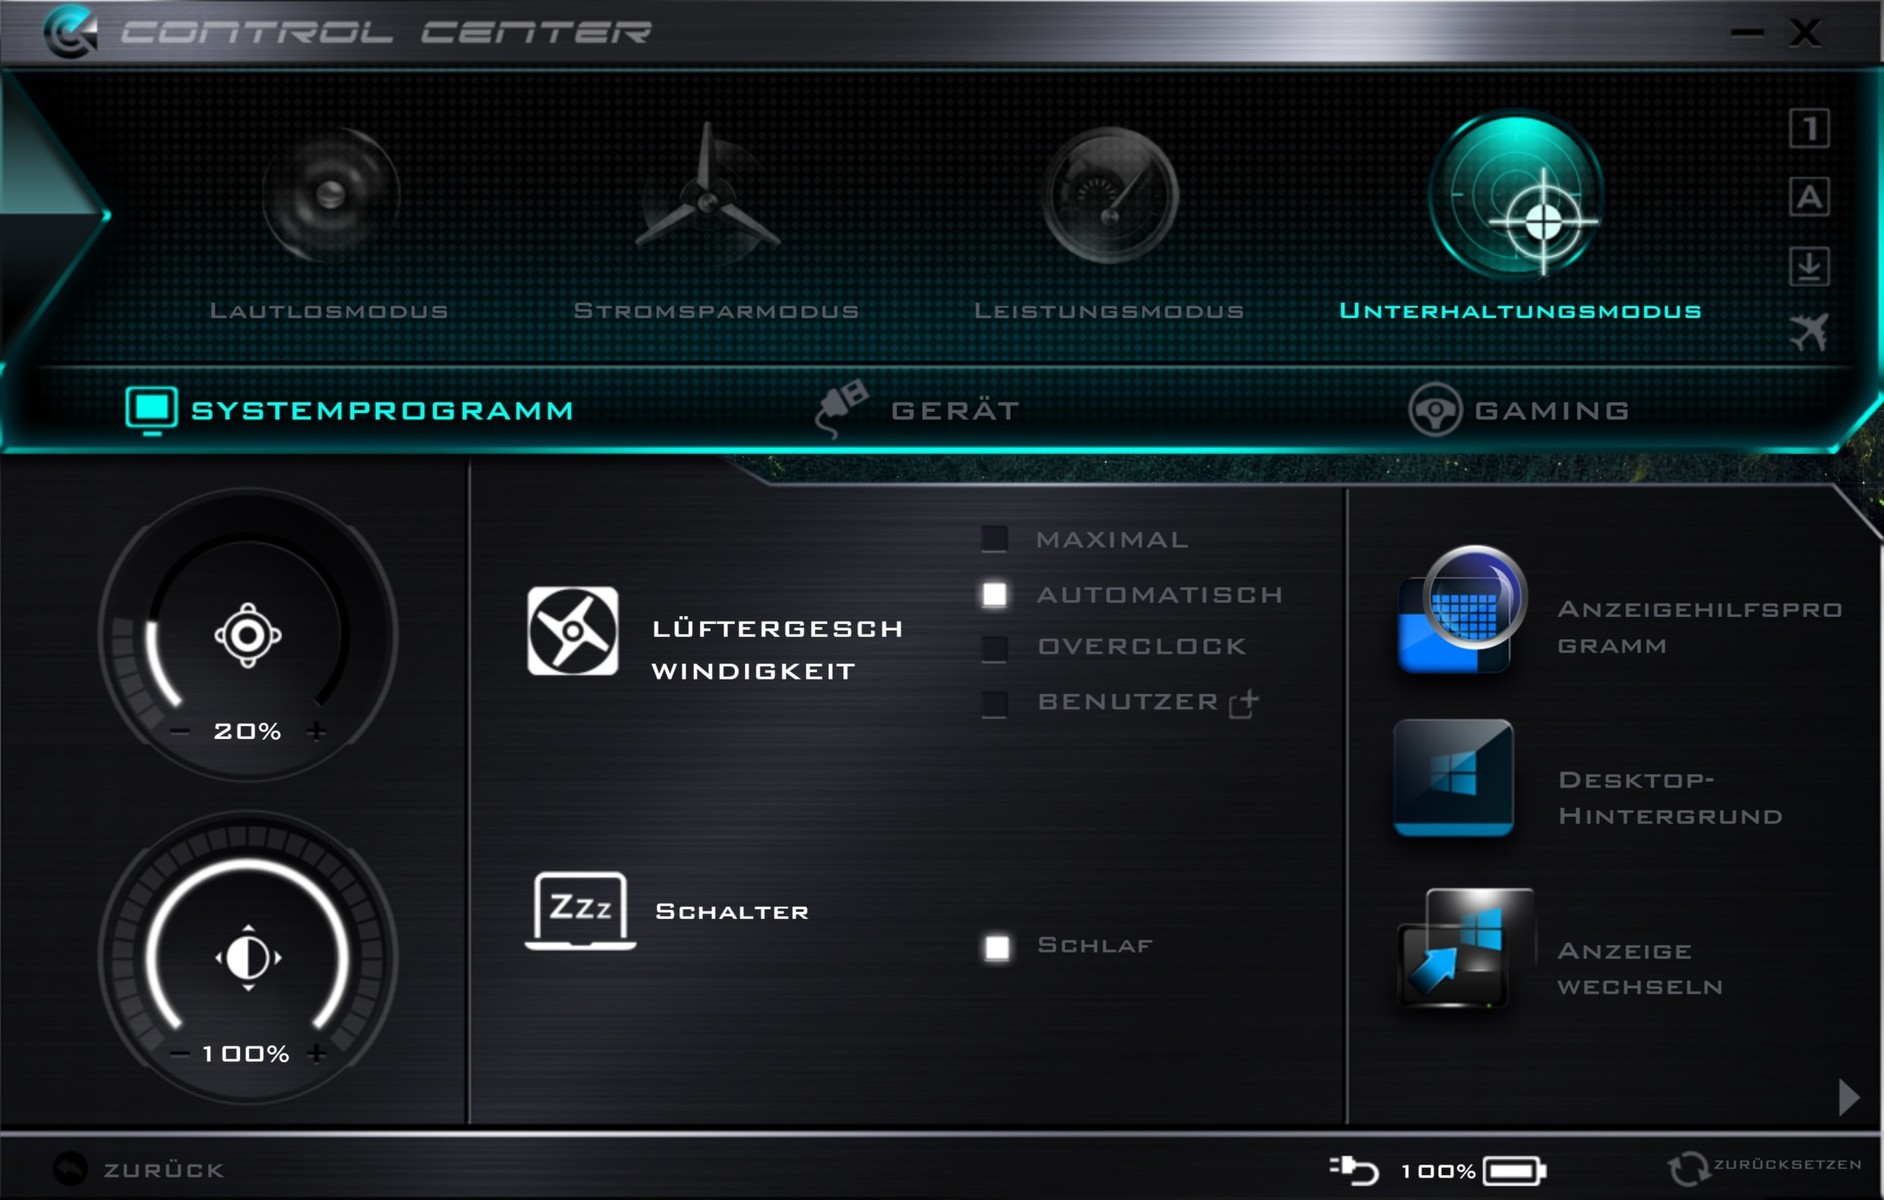
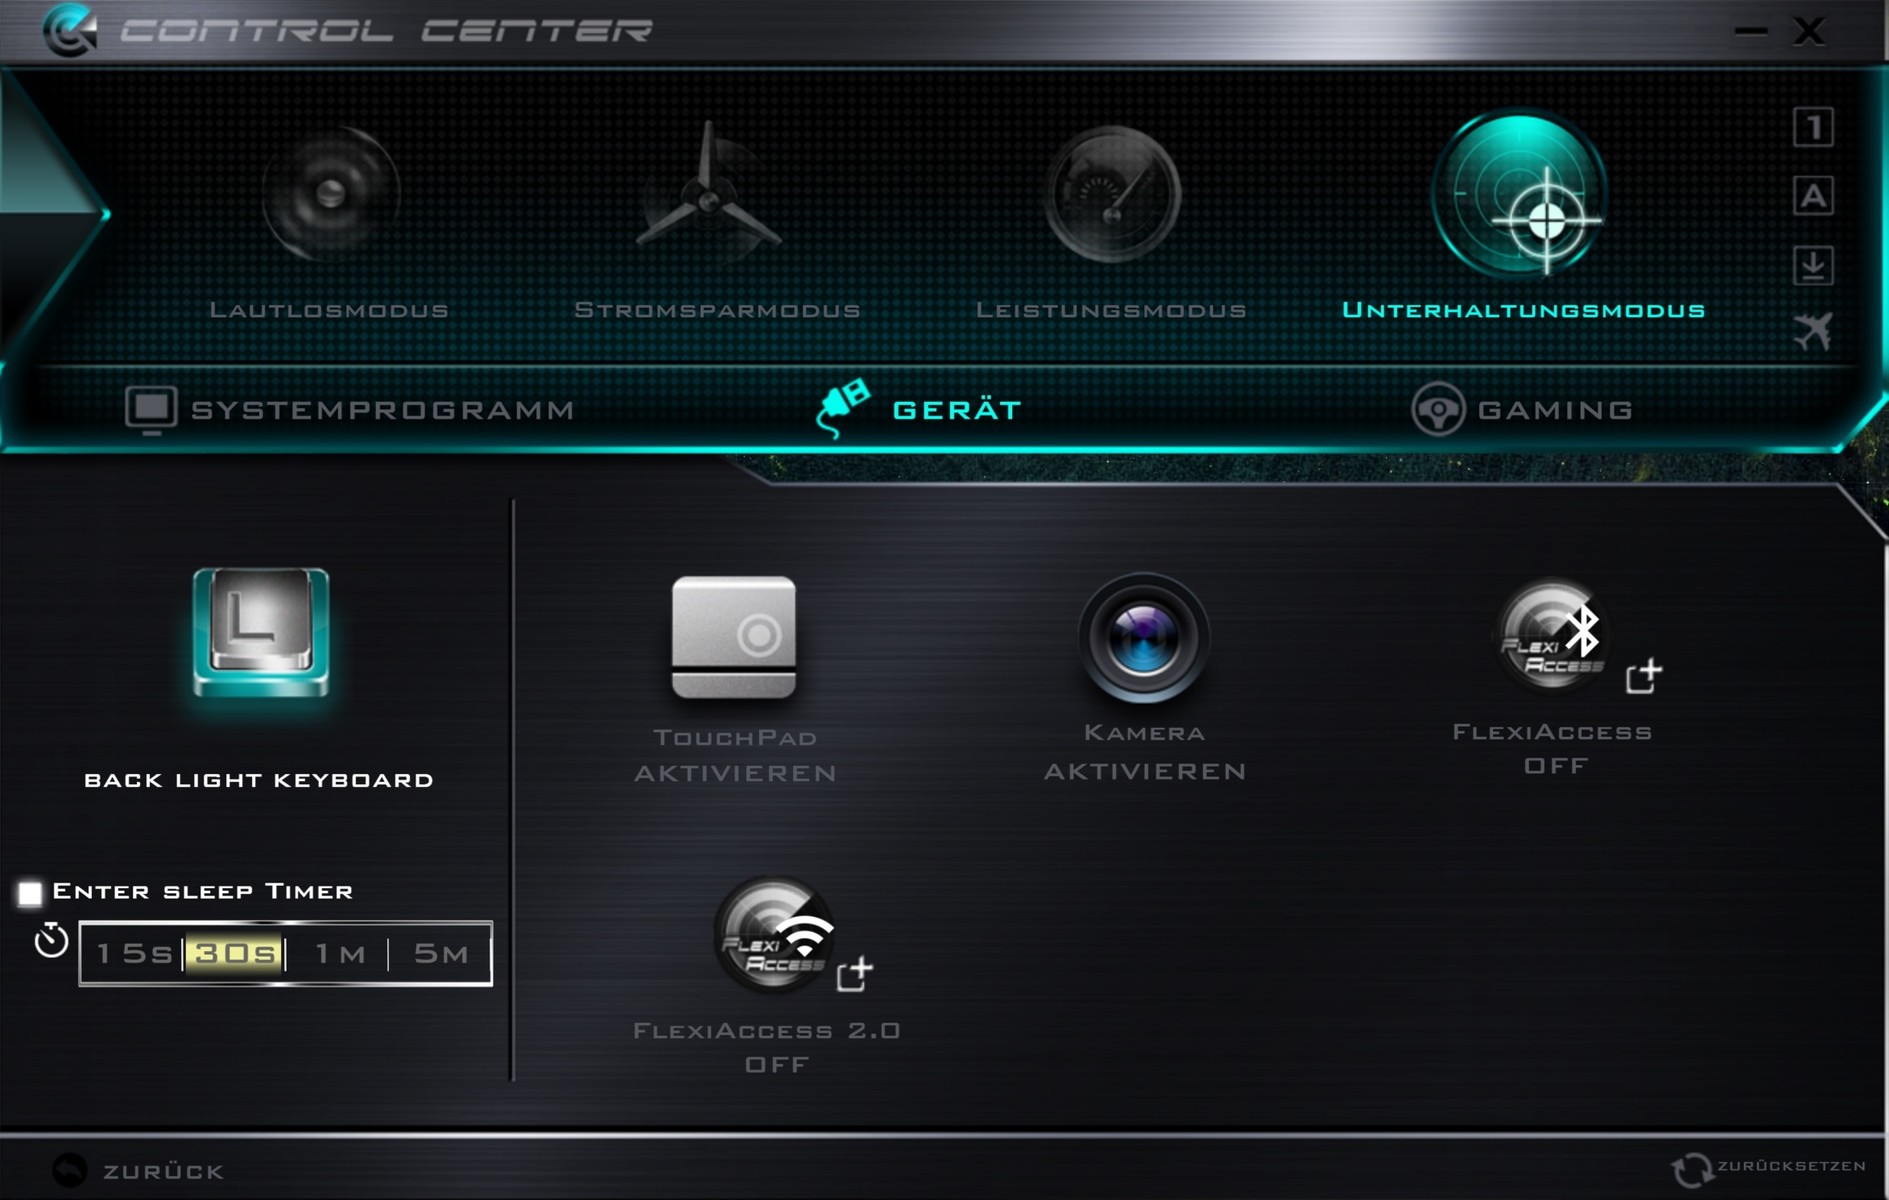
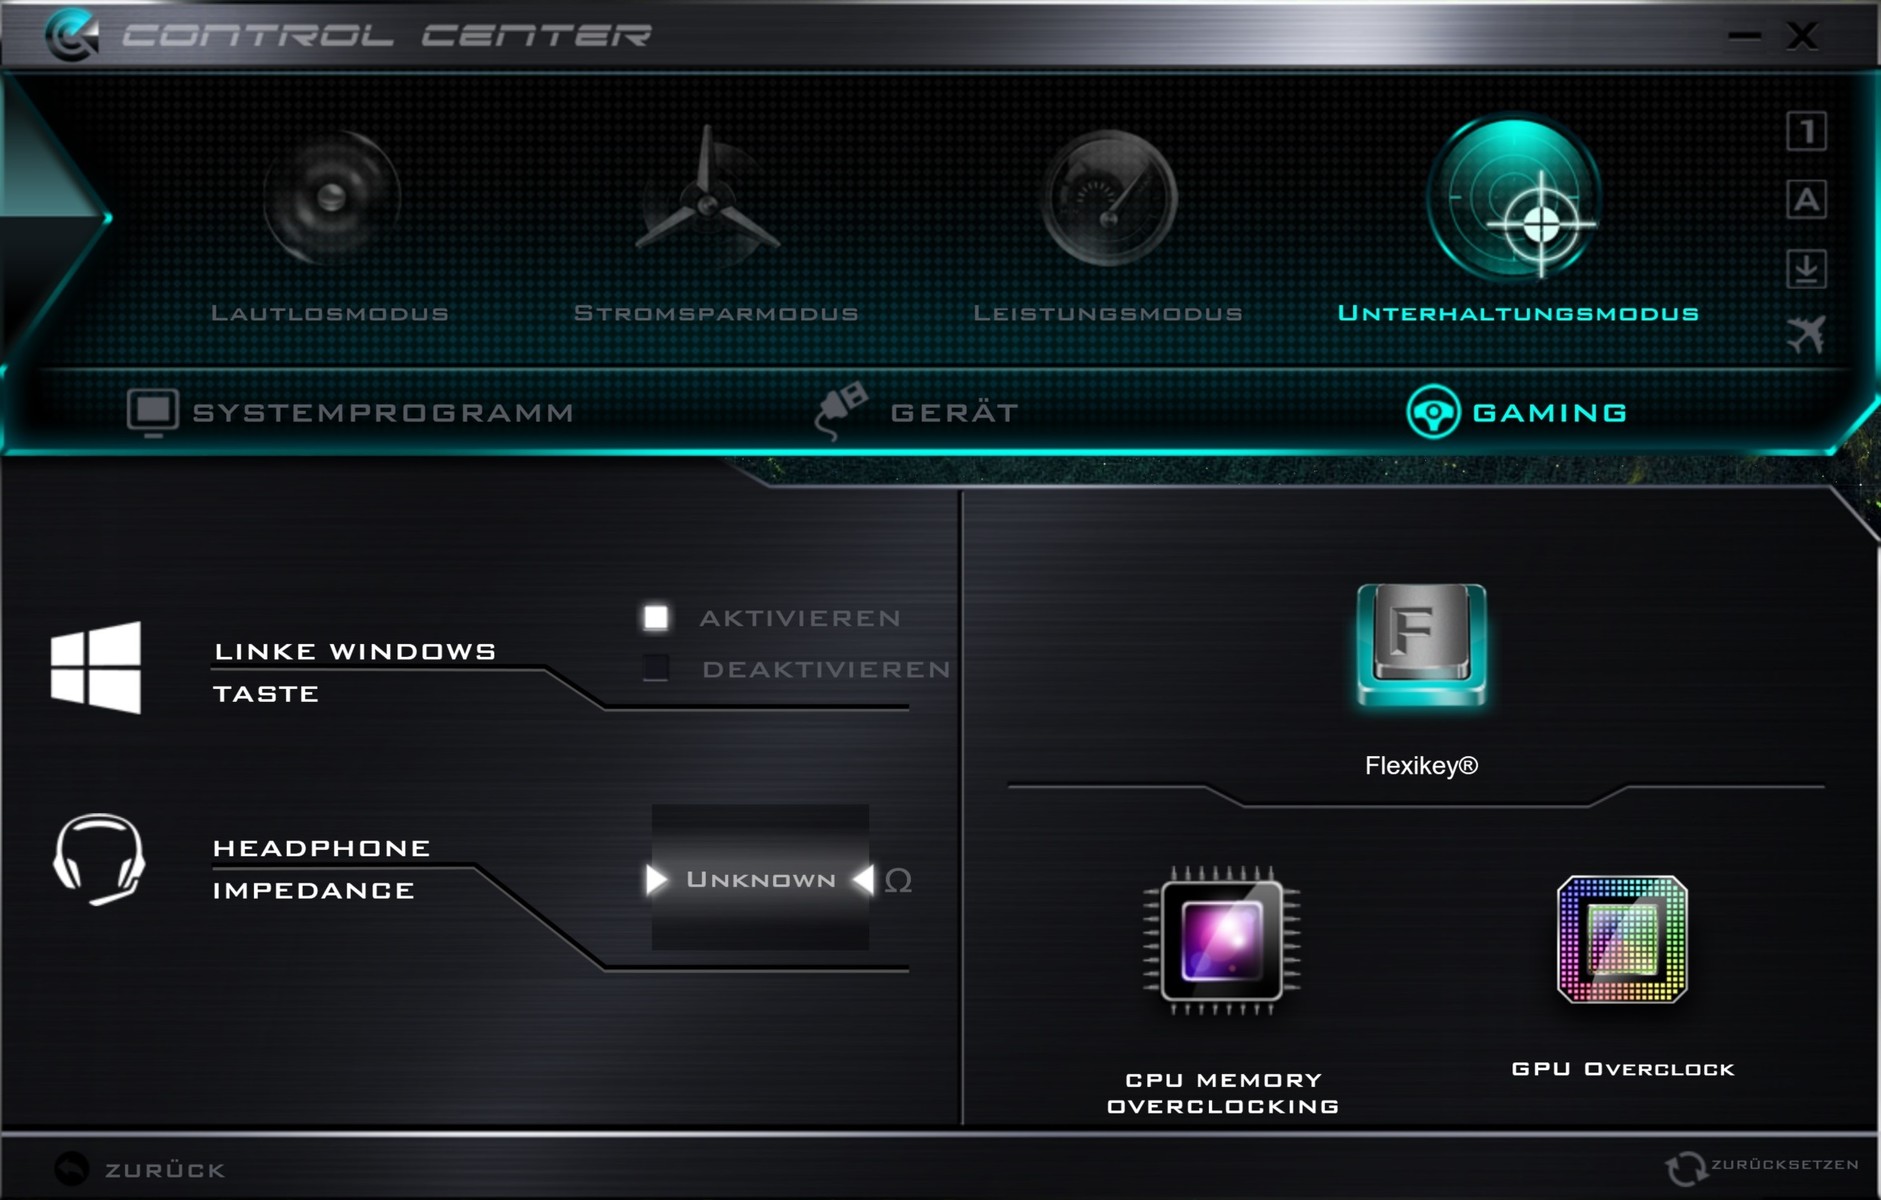
Software
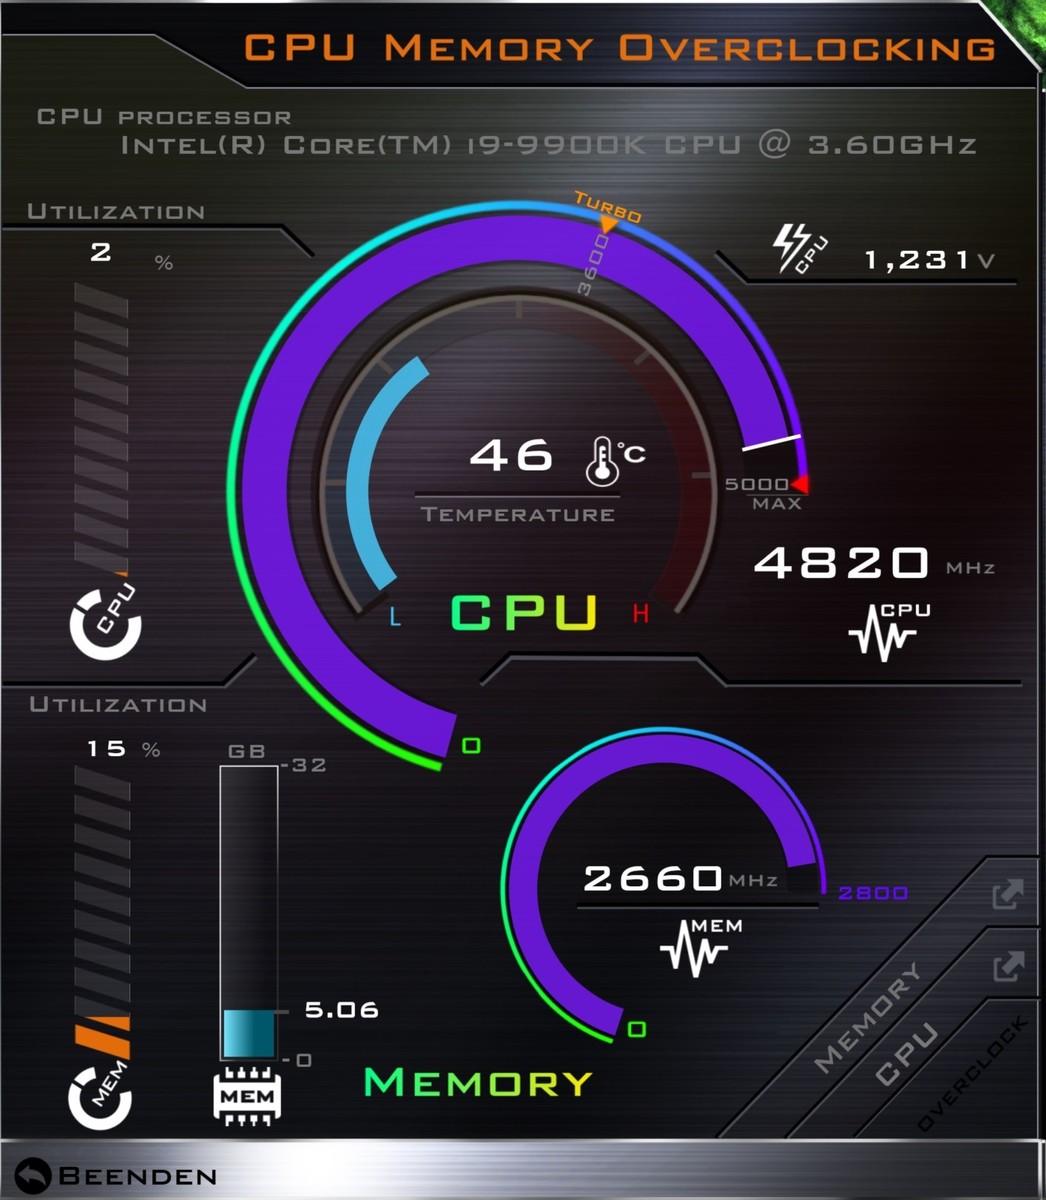
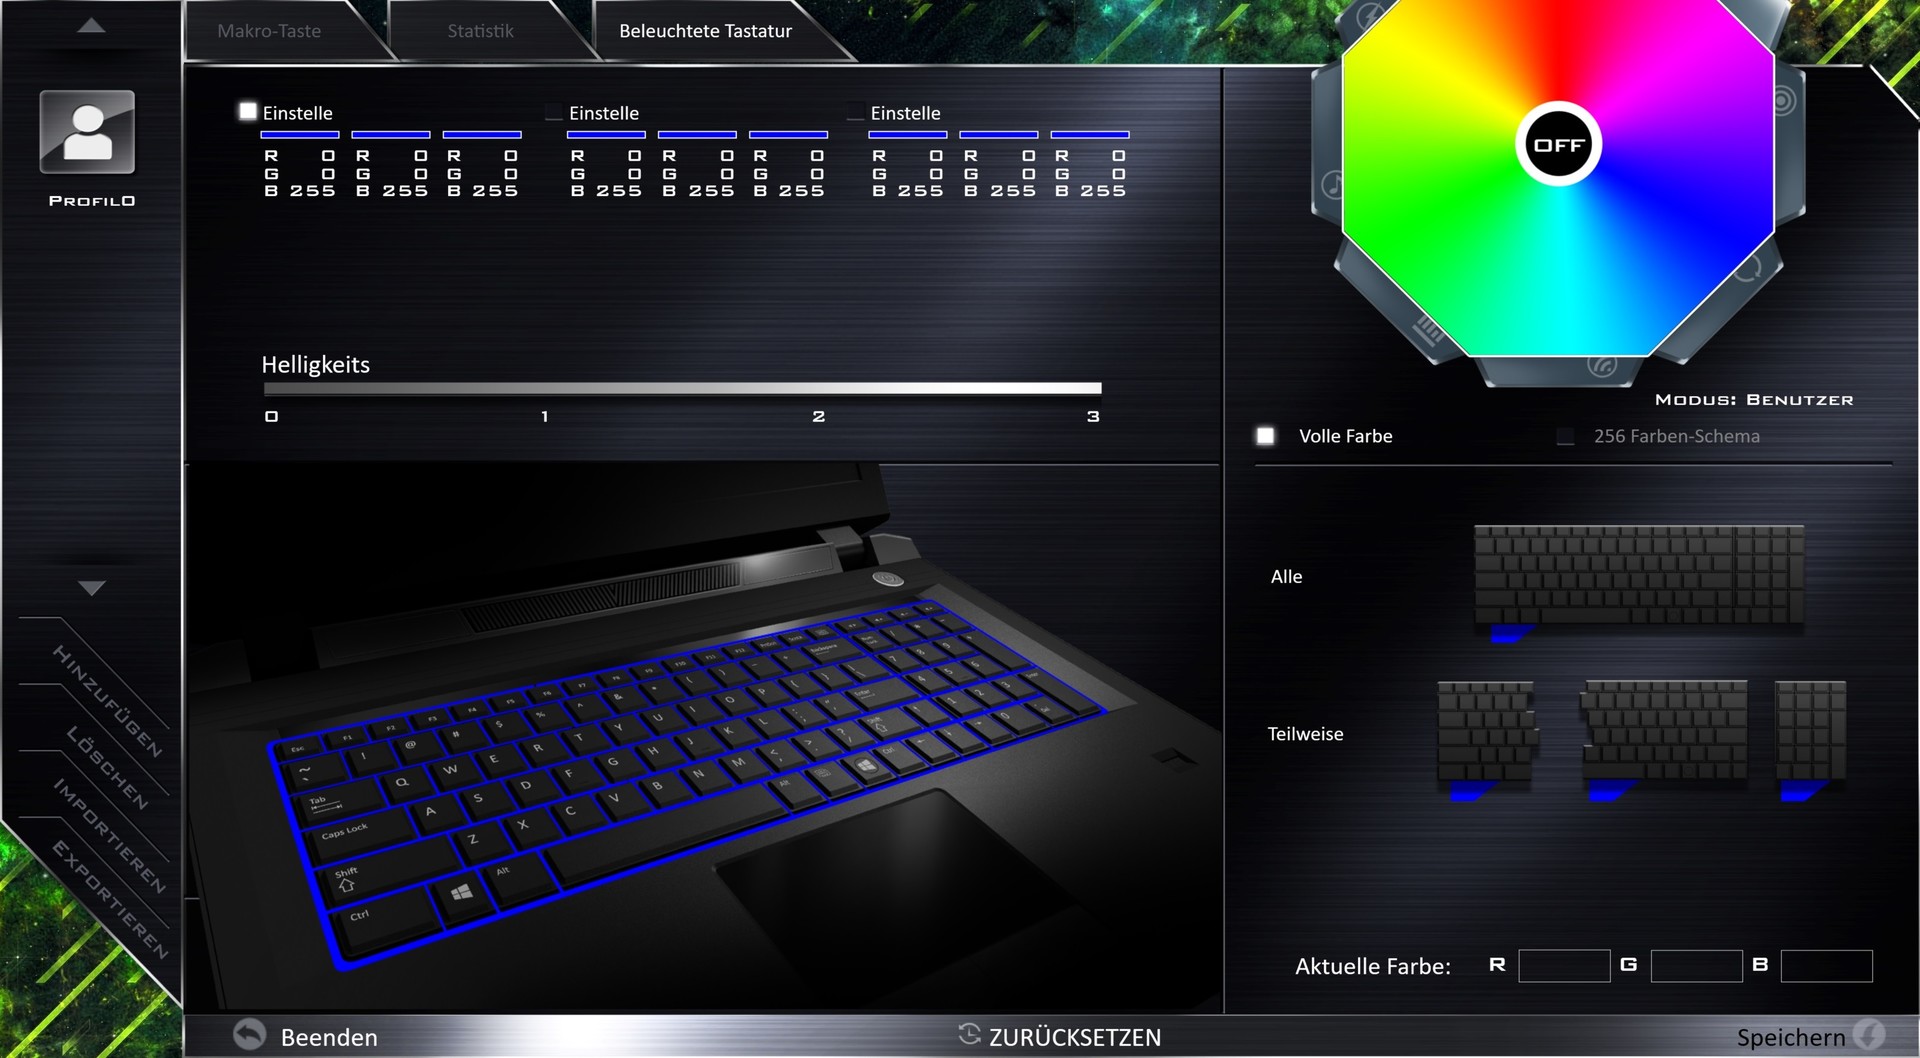
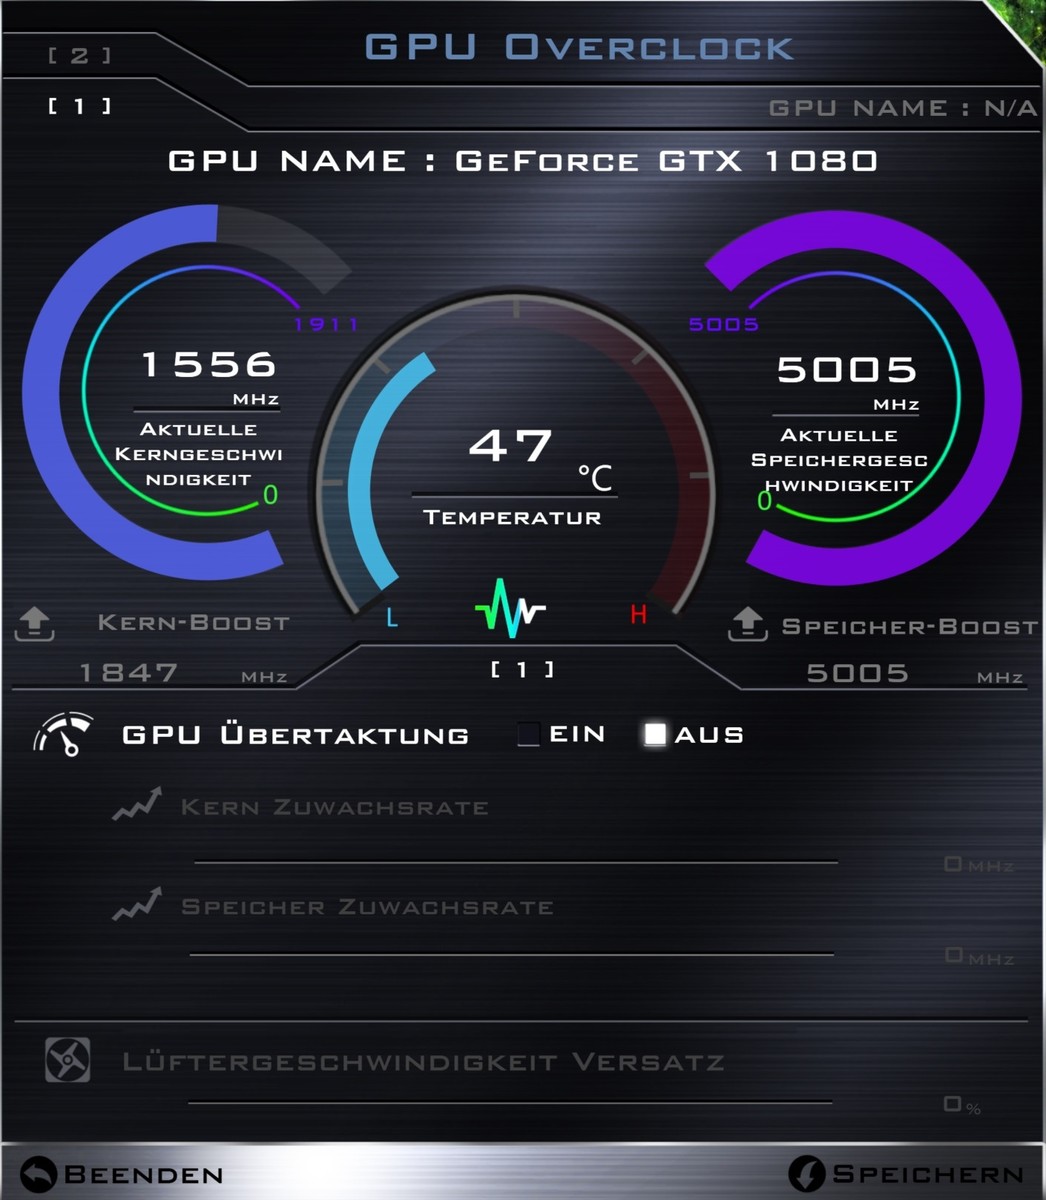
We did not modify the software installed on our test unit. Not only can you modify the fan control via the Control Center if you like, but you can also overclock the processor, the graphics card, and the working memory. In addition, you can also tune the RGB illumination, which is arranged into three separate zones.
Performance
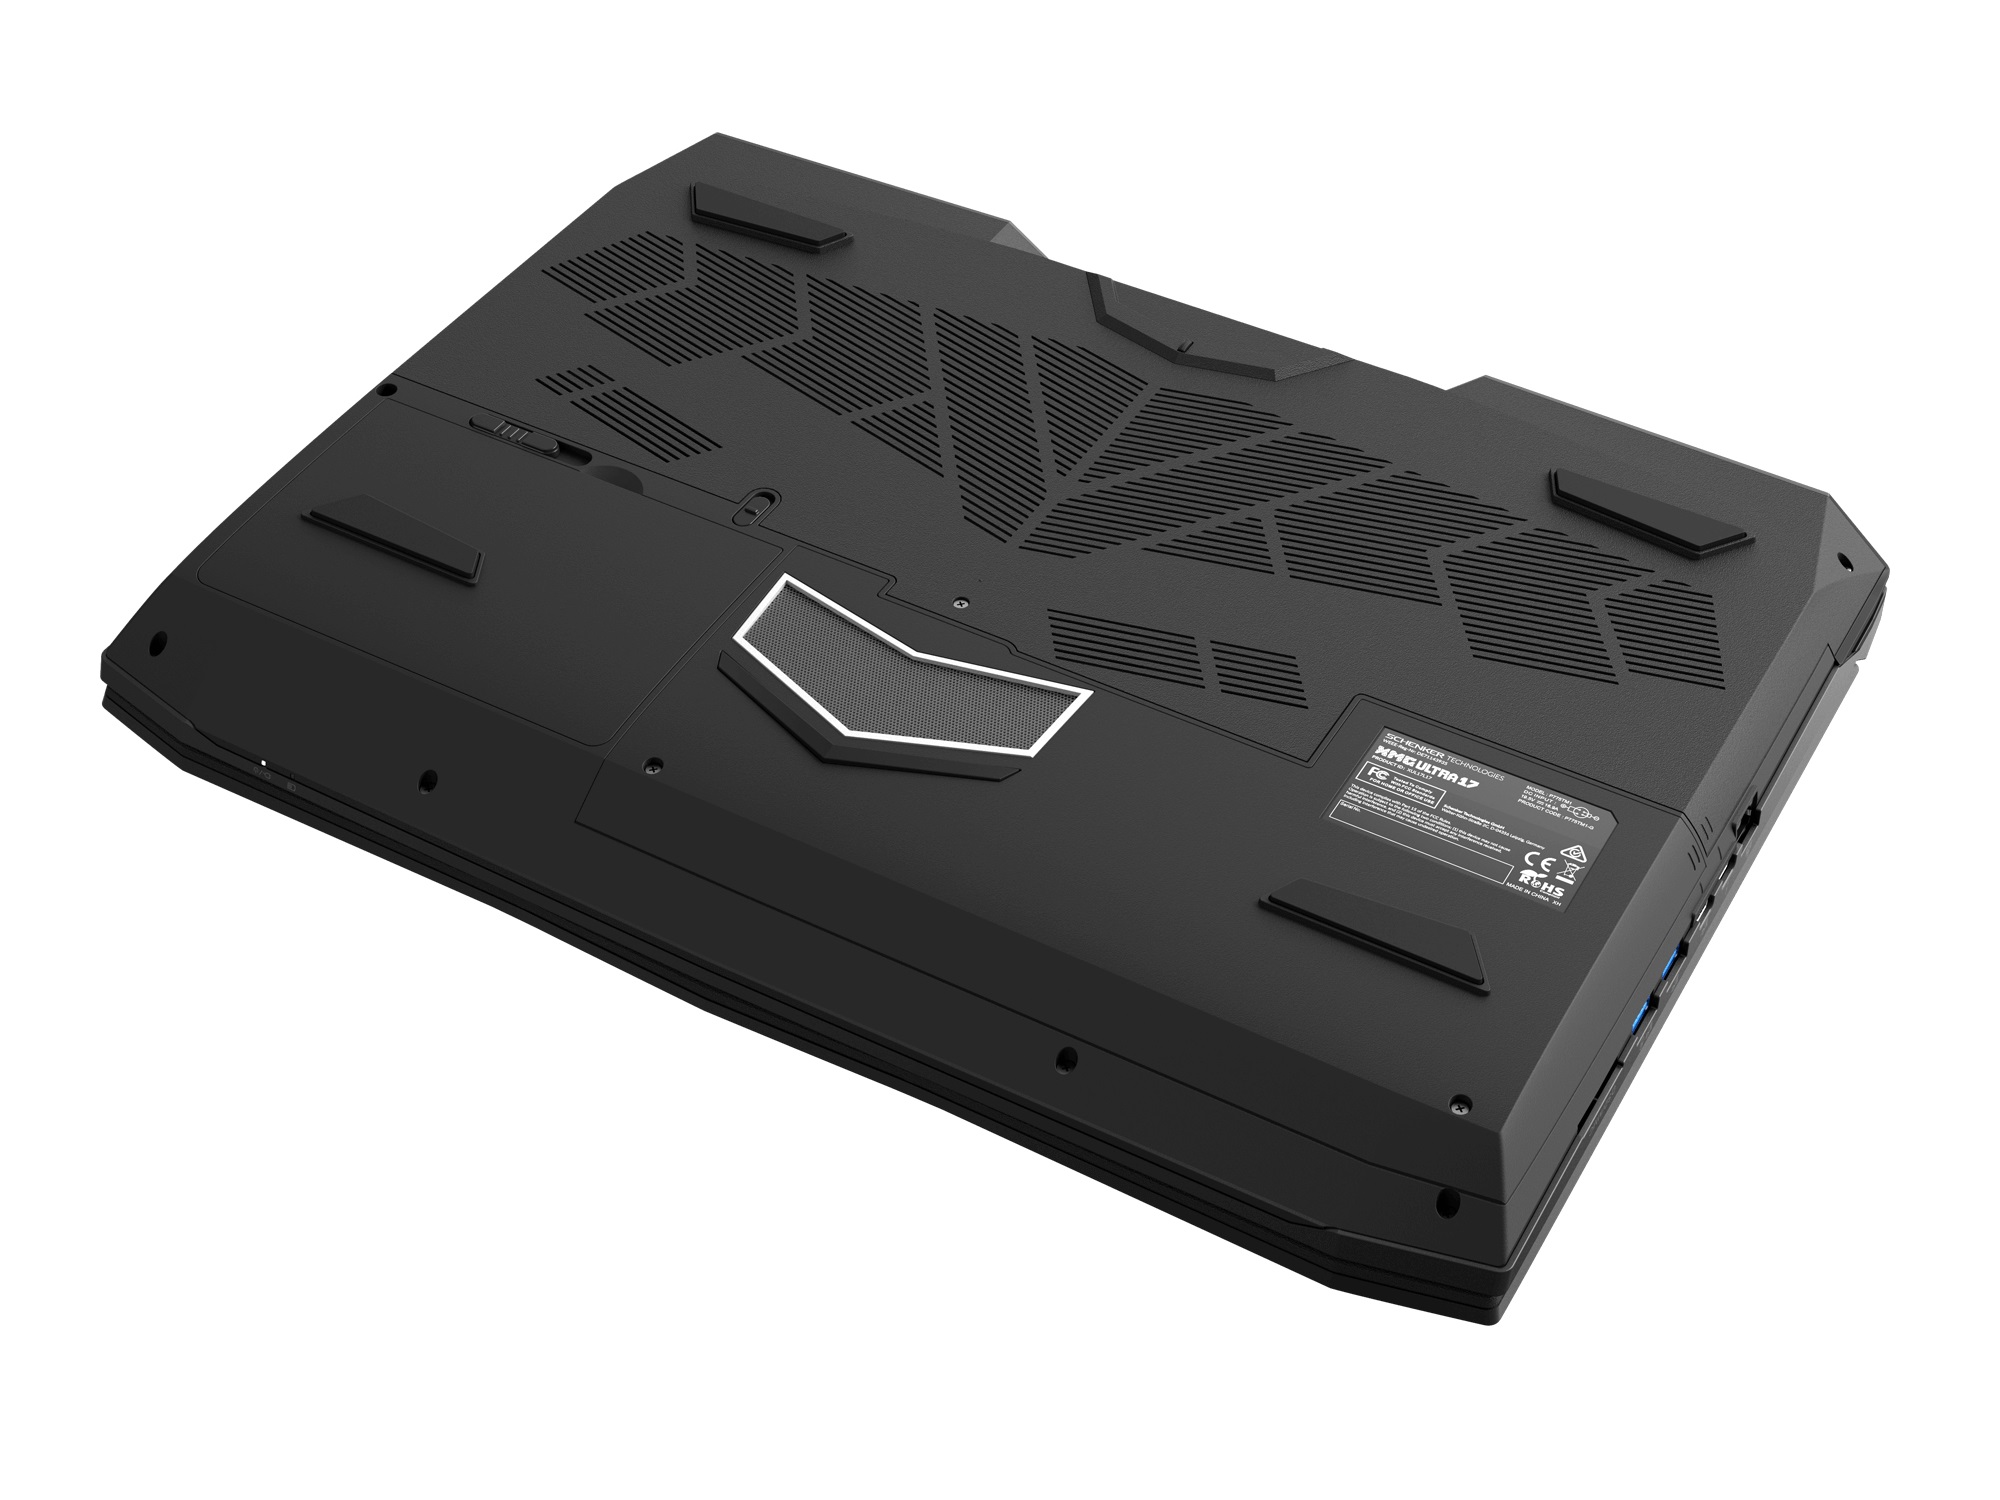
Due to its desktop features (replaceable CPU and GPU), the XMG Ultra 17 promises a high degree of being future proof. Upgrade enthusiasts should also be pleased with four RAM slots, two M.2 slots, and two 2.5-inch slots.
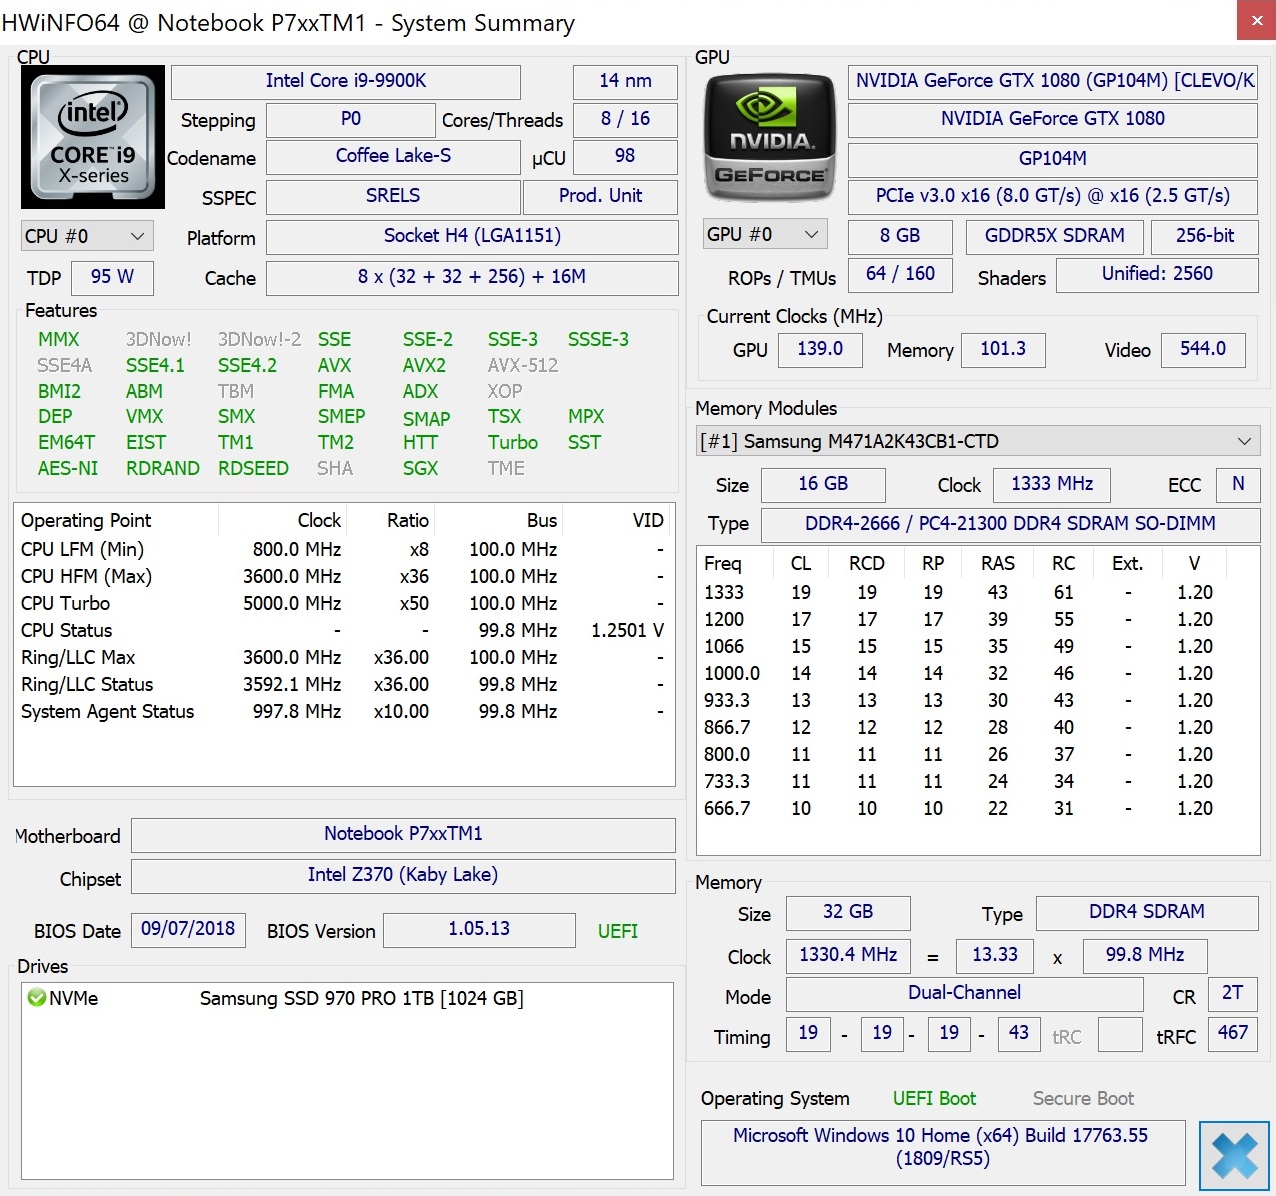
Processor
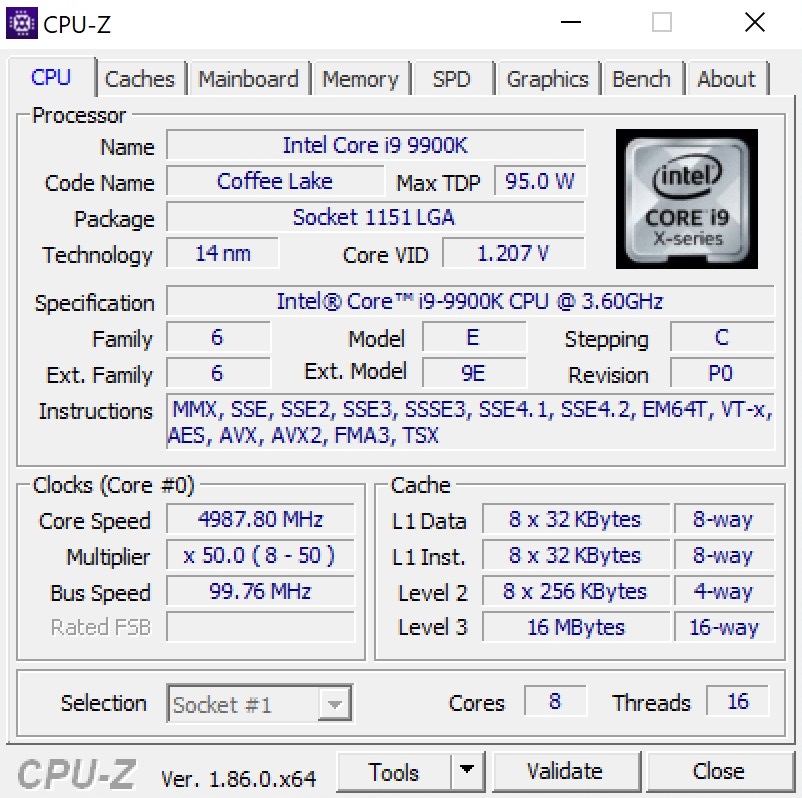
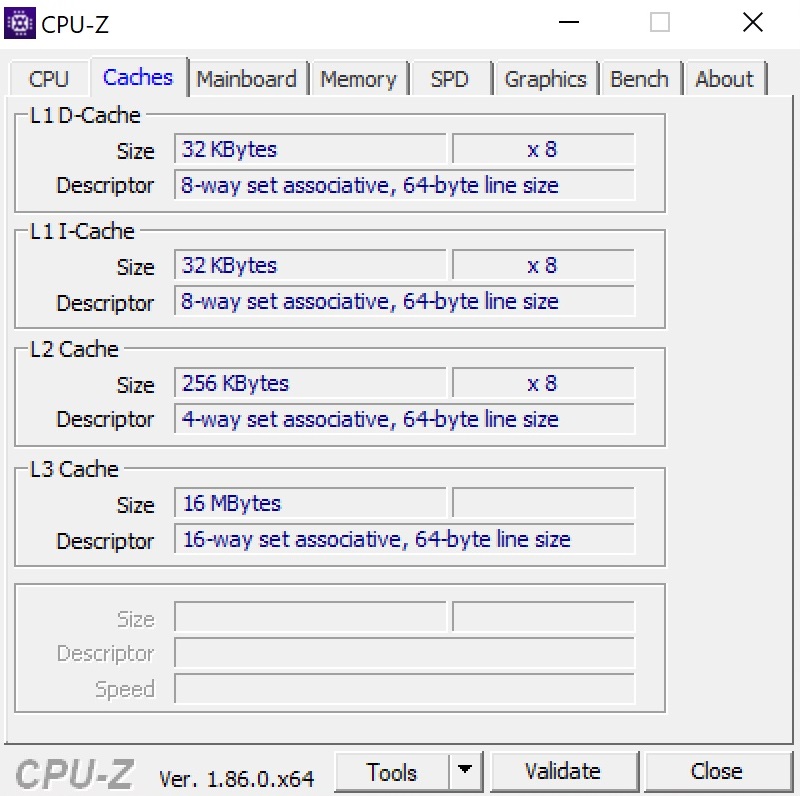
One of the biggest highlights of our test unit is Intel's brand-new Core i9-9900K octa-core chip that was developed as a response to AMD's Ryzen architecture and literally wipes the floor with most processors of recent years. No wonder, since the octa-core has 16 MB of L3 cache and a clock speed of 3.6 to 5.0 GHz. For comparison, the current Core i7-8750H notebook darling that has six cores must be content with 9 MB of L3 cache and a clock speed of 2.2 to 4.1 GHz. On the other hand, its TDP is also significantly lower (45 vs. 95 watts), which should have a strong effect on the cooling requirements.
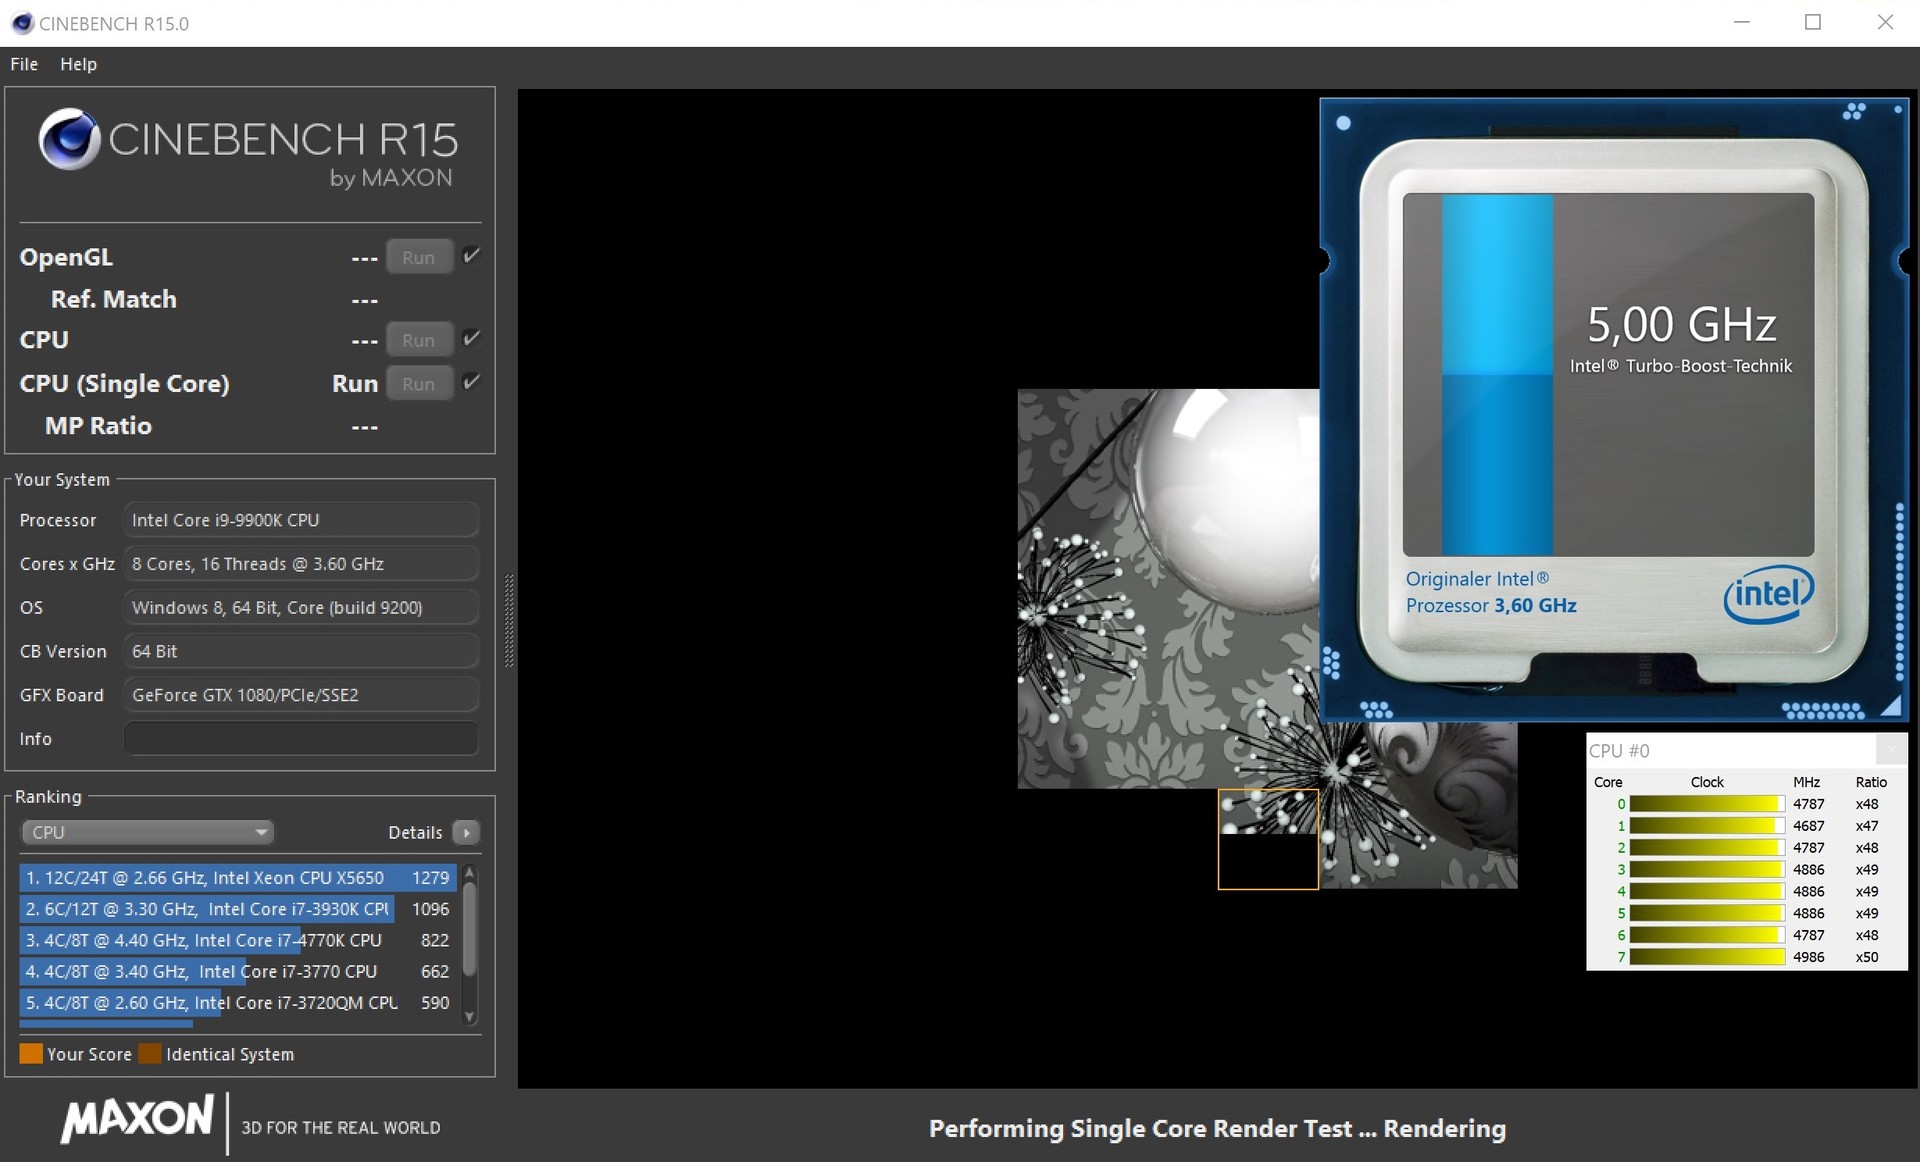
In return, buyers of the XMG Ultra 17 receive an unmatched performance that has not been available before now, at least for a laptop. With 1865 points, the Core i9-9900K sprints ahead of the mobile Core i9-8950H (Asus ROG G703GI) and Core i7-8850H (Aorus X7 DT v8) Coffee-Lake top-guns by more than 40% in the multi-core test of CineBench R15. Against the Core i7-8700 of the old XMG Ultra 17, it is even +60%.
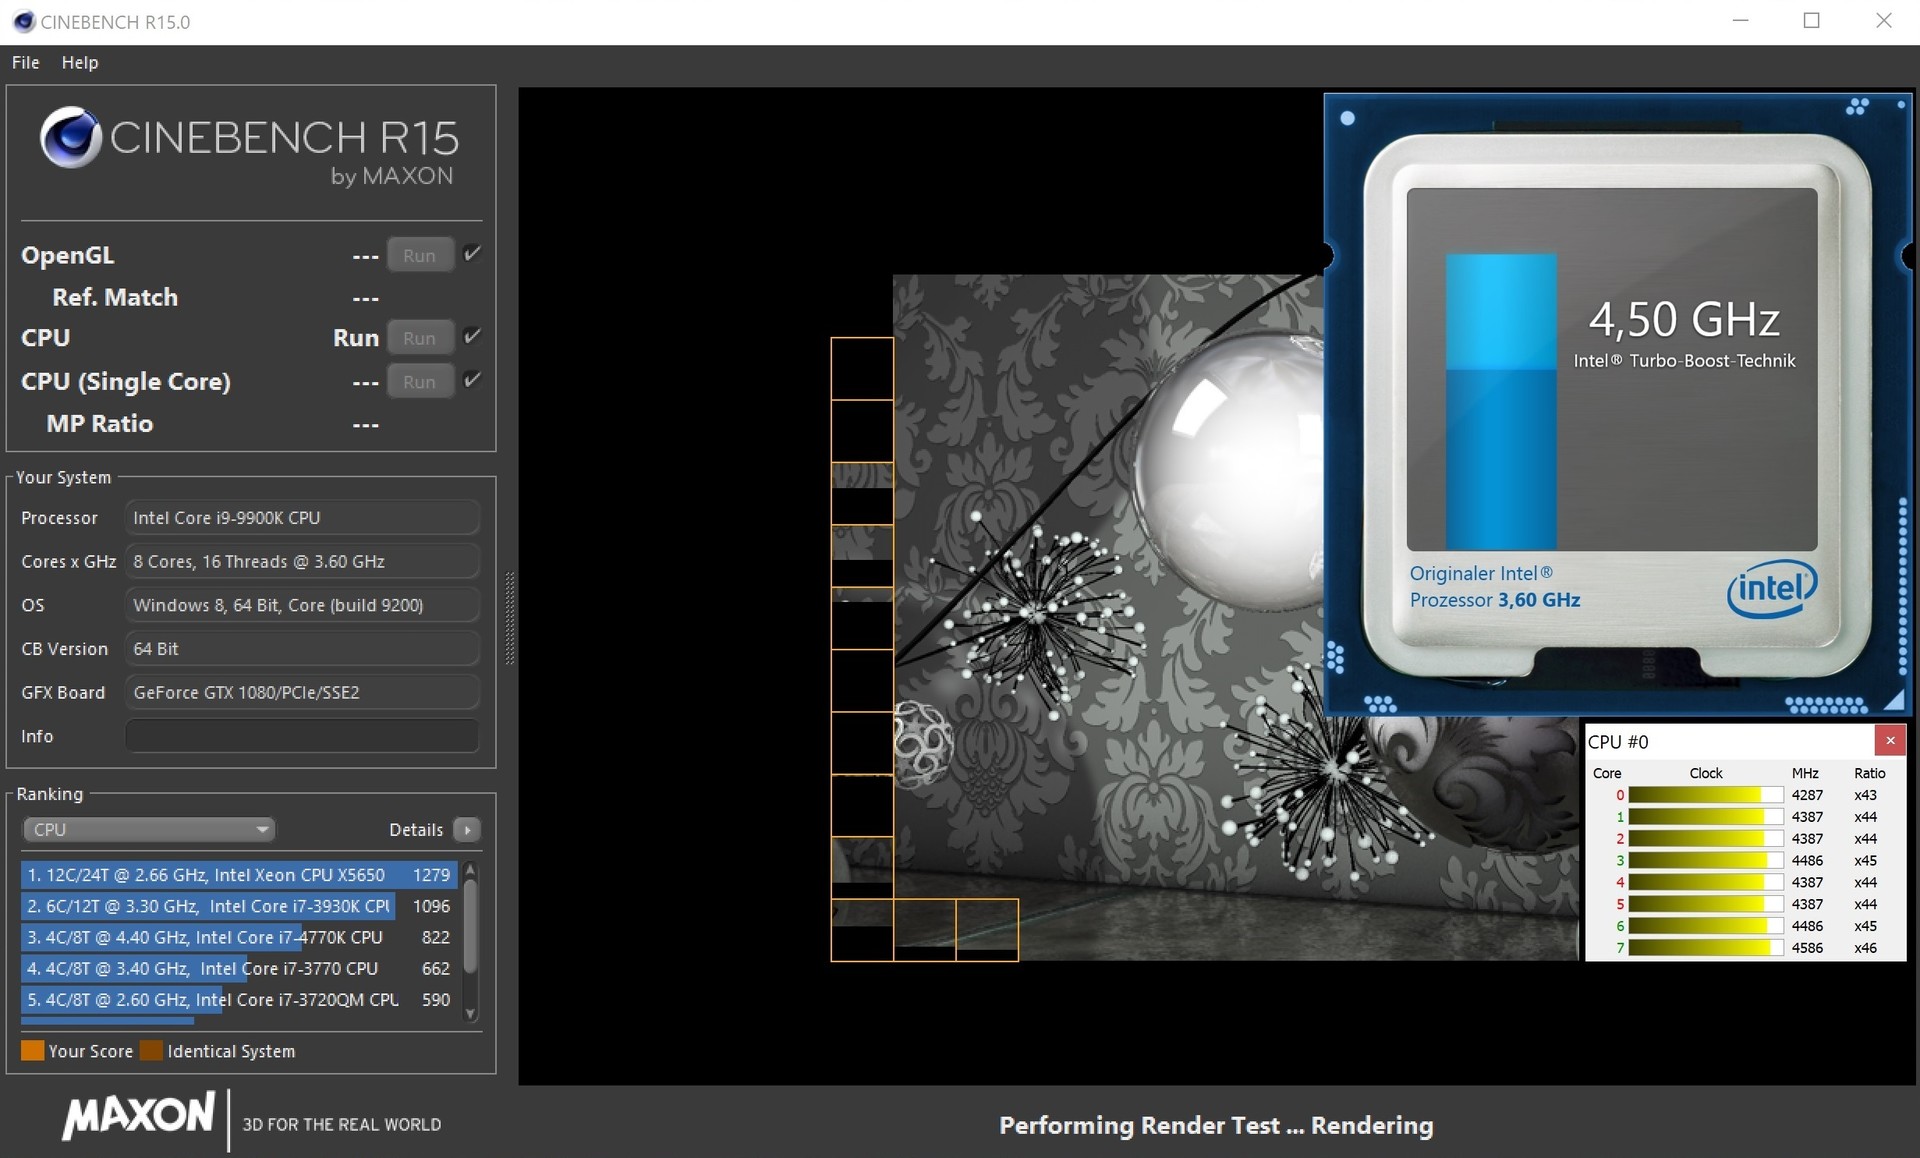
Unfortunately, the Core i9-9900K inherits a typical shortcoming of the Coffee-Lake generation, which is the limited clock speed behavior. In contrast to the Kaby-Lake chips, which have up to four cores, the current six and eight-core chips can only maintain their full Turbo over a limited time period. You can see this behavior playing out in our CineBench loop, in the course of which the performance of the XMG Ultra 17 drops by almost 5 to 10%.
Due to its huge number of cores (handling 16 threads via Hyper-threading), regardless of whether in a desktop or notebook, the Core i9-9900K is still a good investment for anyone who uses applications that rely on parallel processing a lot in their home or office. We will evaluate next, whether the purchase is worthwhile for gamers as well.
System Performance
The combination of a high-end GPU, octa-core CPU, and NVMe SSD has a particularly noticeable effect on the system performance. 6959 points in PCMark 10 are first-rate are some of the best results we have ever measured. Subjectively, the performance also knows how to please, be it during boot ups, program starts, or data transfer.
| PCMark 10 - Score | |
| Average of class Gaming (5828 - 11574, n=96, last 2 years) | |
| Schenker XMG Ultra 17 Coffee Lake Refresh | |
| Asus Chimera G703GI | |
| Schenker XMG Ultra 17 | |
| Aorus X7 DT v8 | |
| PCMark 8 | |
| Home Score Accelerated v2 | |
| Asus Chimera G703GI | |
| Aorus X7 DT v8 | |
| Average of class Gaming (n=1last 2 years) | |
| Schenker XMG Ultra 17 Coffee Lake Refresh | |
| Schenker XMG Ultra 17 | |
| Work Score Accelerated v2 | |
| Asus Chimera G703GI | |
| Schenker XMG Ultra 17 Coffee Lake Refresh | |
| Schenker XMG Ultra 17 | |
| Average of class Gaming (n=1last 2 years) | |
| PCMark 8 Home Score Accelerated v2 | 5243 points | |
| PCMark 8 Work Score Accelerated v2 | 5123 points | |
| PCMark 10 Score | 6959 points | |
Help | ||
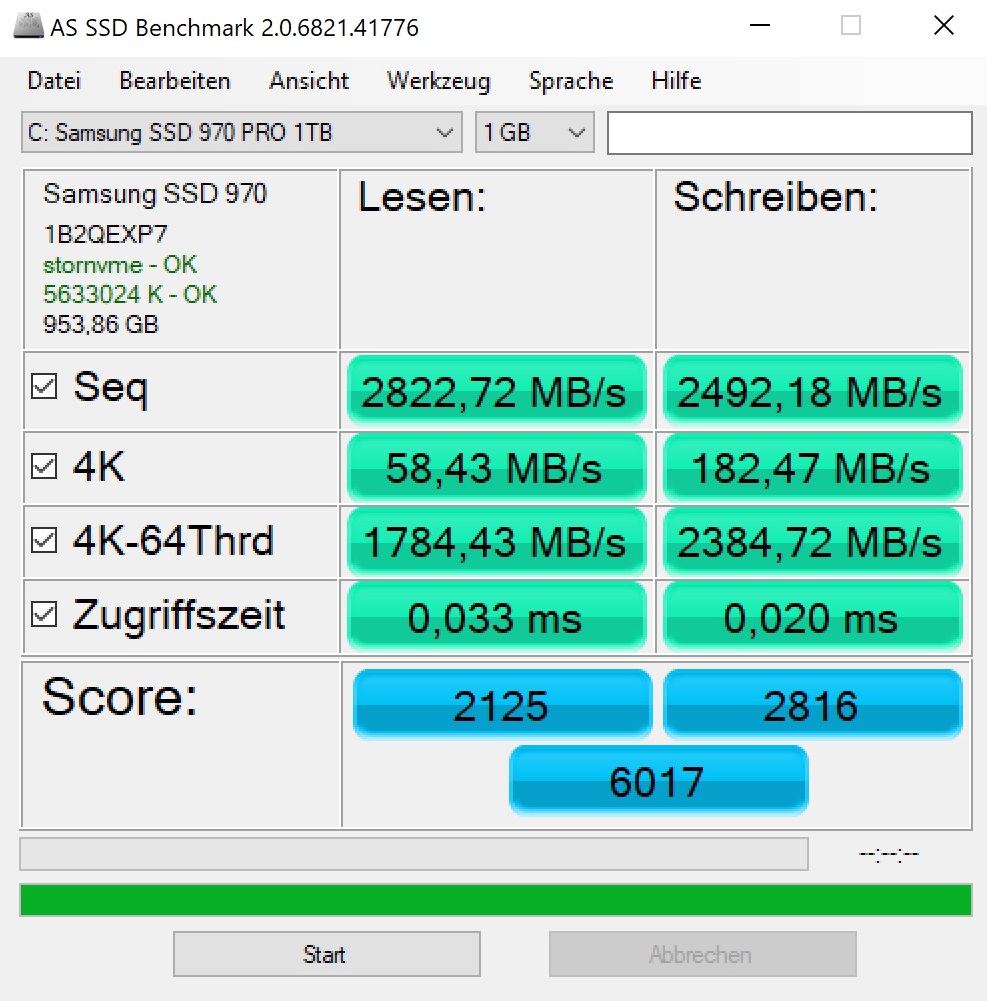
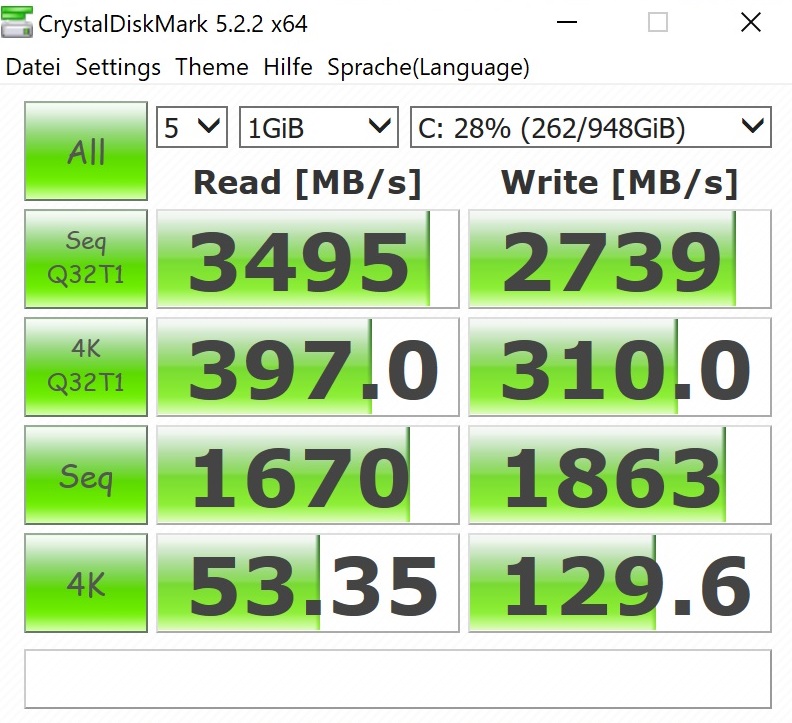
Storage Solution
In order to really score in the storage category, Schenker Technologies has used an NVMe-SSD from Samsung with a 1 TB capacity in our test configuration. While the 970 PRO is quite expensive for an SSD, in return it achieves a position at the top. According to the AS SSD benchmark, the 500-GB drive of the Aorus X7 DT v8, which is also based on the PCIe technology (Toshiba THNSN5512GPU7), falls behind by about 50%. Even the RAID system of the Asus G703GI is unable to move ahead in the overall score, despite its higher values in the sequential area.
| Schenker XMG Ultra 17 Coffee Lake Refresh Samsung SSD 970 Pro 1TB | Schenker XMG Ultra 17 Samsung SSD 960 Evo 500GB m.2 NVMe | Asus Chimera G703GI 2x Intel 760p 512 GB + 1x Samsung SM961 512 GB (RAID) | Aorus X7 DT v8 Toshiba NVMe THNSN5512GPU7 | |
|---|---|---|---|---|
| AS SSD | -26% | 8% | -50% | |
| Seq Read (MB/s) | 2823 | 2533 -10% | 4886 73% | 2182 -23% |
| Seq Write (MB/s) | 2492 | 1771 -29% | 4110 65% | 1342 -46% |
| 4K Read (MB/s) | 58.4 | 43.65 -25% | 57.4 -2% | 23.28 -60% |
| 4K Write (MB/s) | 182.5 | 139.5 -24% | 141.3 -23% | 89.9 -51% |
| Score Read (Points) | 2125 | 1716 -19% | 1999 -6% | 1058 -50% |
| Score Write (Points) | 2816 | 1615 -43% | 1855 -34% | 981 -65% |
| Score Total (Points) | 6017 | 4173 -31% | 4843 -20% | 2539 -58% |

Graphics Card
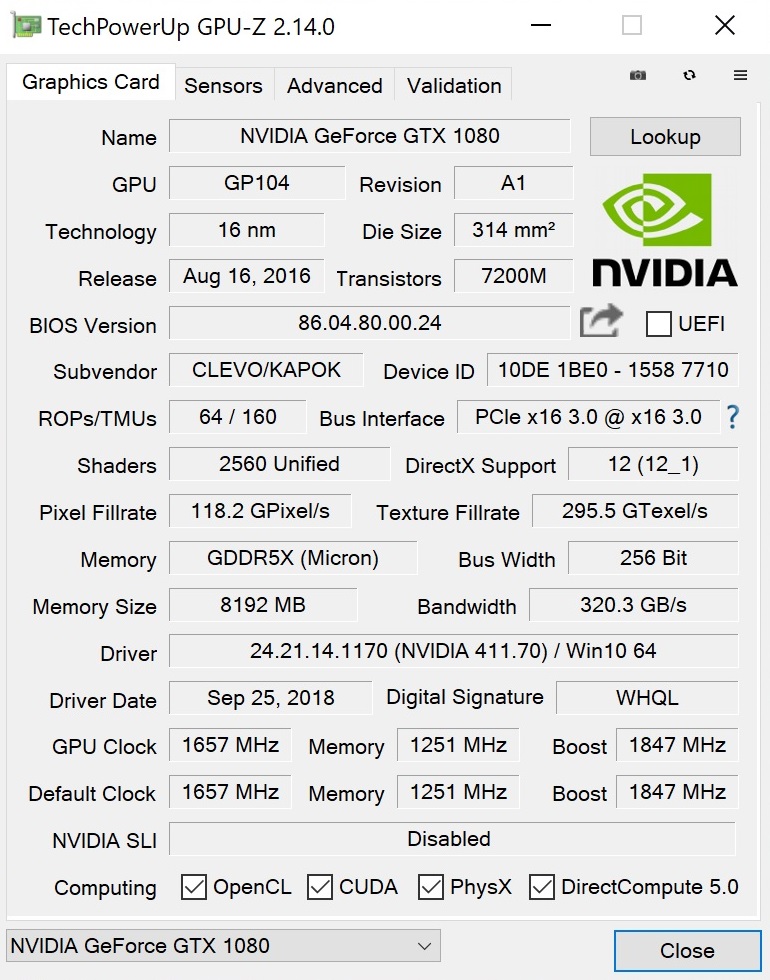
As long as your budget does not play any role, the GeForce GTX 1080 is currently the best choice for gamers, since you hardly need to make any compromises in terms of image quality even at higher resolutions. The DirectX-12 model from Nvidia's Pascal series is equipped with 2560 shader units and 8 GB of GDDR5X storage (256-bit interface). Nvidia specifies a clock speed of 1657 MHz, with the GPU boost ideally being able to accelerate the core up to 1886 MHz.
| 3DMark | |
| 1920x1080 Fire Strike Graphics | |
| Average of class Gaming (12242 - 62849, n=121, last 2 years) | |
| Asus Chimera G703GI | |
| Schenker XMG Ultra 17 | |
| Schenker XMG Ultra 17 Coffee Lake Refresh | |
| Aorus X7 DT v8 | |
| 2560x1440 Time Spy Graphics | |
| Average of class Gaming (5012 - 26212, n=120, last 2 years) | |
| Schenker XMG Ultra 17 | |
| Schenker XMG Ultra 17 Coffee Lake Refresh | |
| 3DMark 11 - 1280x720 Performance GPU | |
| Average of class Gaming (21841 - 80022, n=109, last 2 years) | |
| Asus Chimera G703GI | |
| Schenker XMG Ultra 17 | |
| Schenker XMG Ultra 17 Coffee Lake Refresh | |
| Aorus X7 DT v8 | |
During benchmark testing, there were no abnormalities in terms of its performance capabilities. In 3DMark 11 as well as the Fire-Strike test of 3DMark 13, the XMG Ultra 17 scores at the level of the Aorus X7 DT v8 and the old test equipment, while the Asus G703GI can work out a slight advantage due to its factory overclocking.
| 3DMark 06 Standard Score | 35252 points | |
| 3DMark 11 Performance | 24503 points | |
| 3DMark Ice Storm Standard Score | 175460 points | |
| 3DMark Cloud Gate Standard Score | 51972 points | |
| 3DMark Fire Strike Score | 19041 points | |
| 3DMark Time Spy Score | 7260 points | |
Help | ||
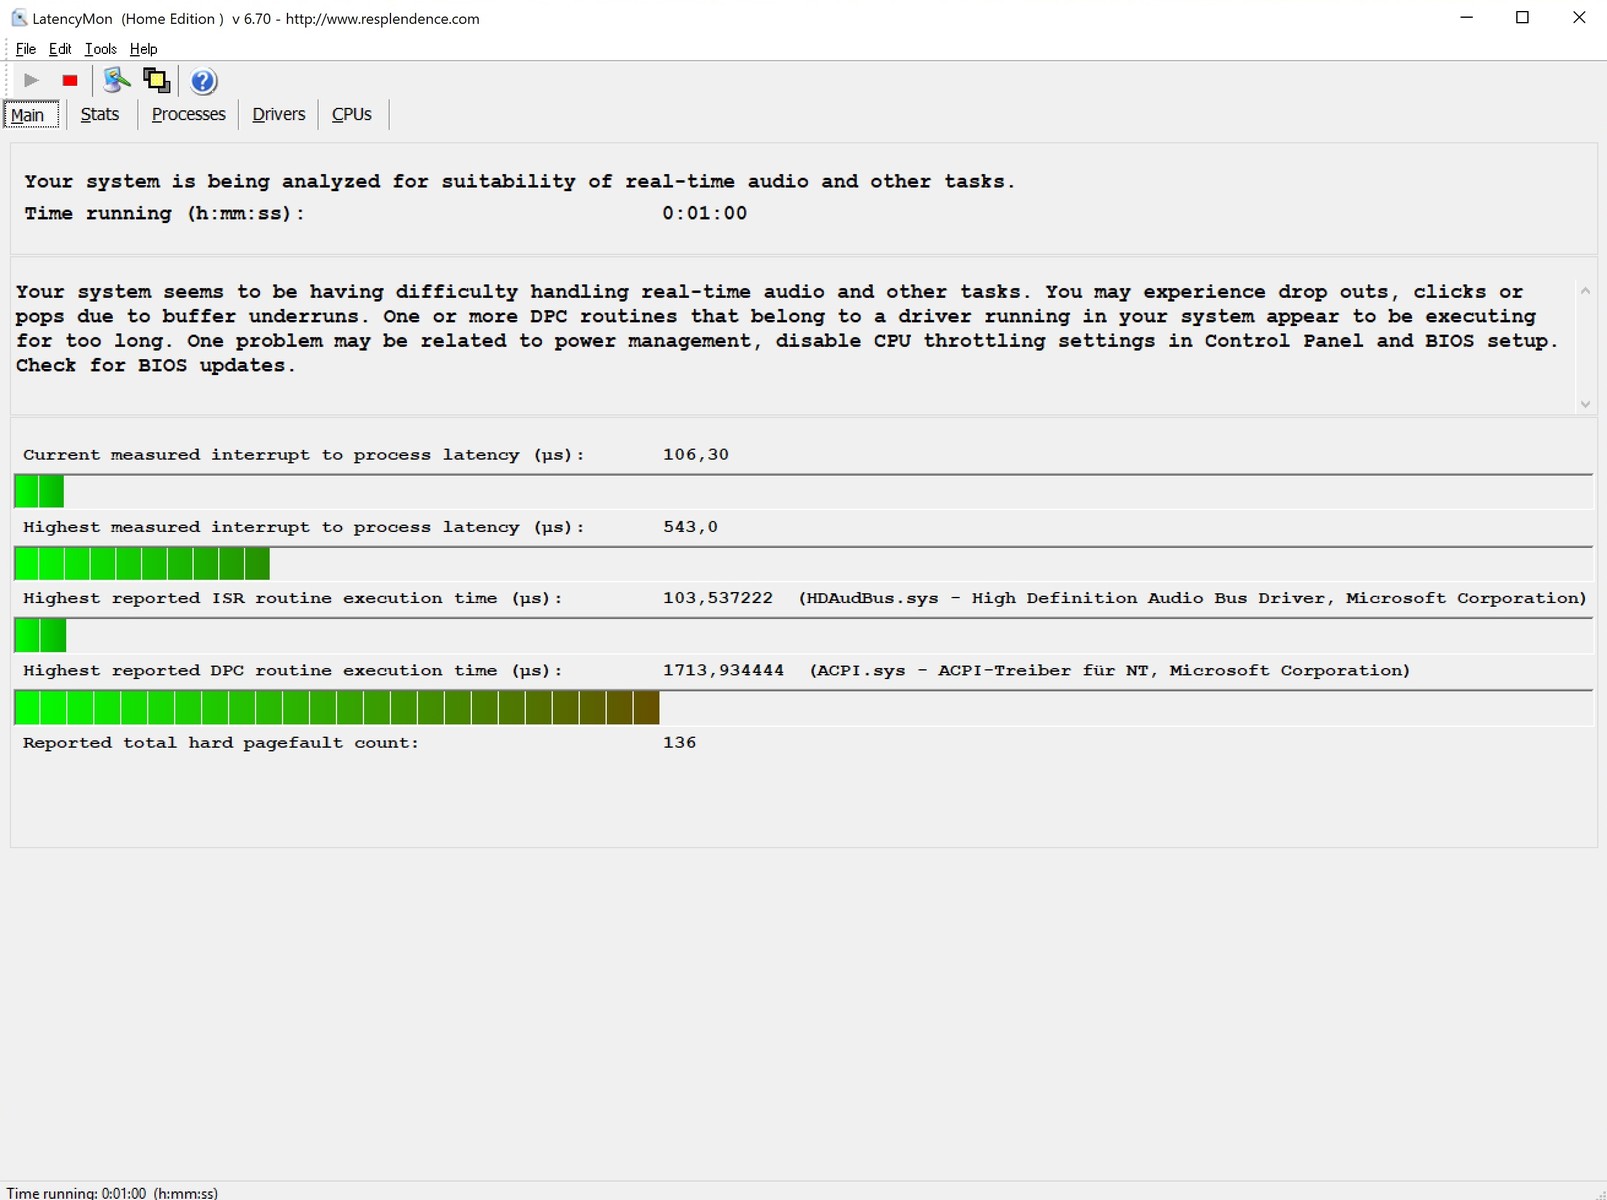
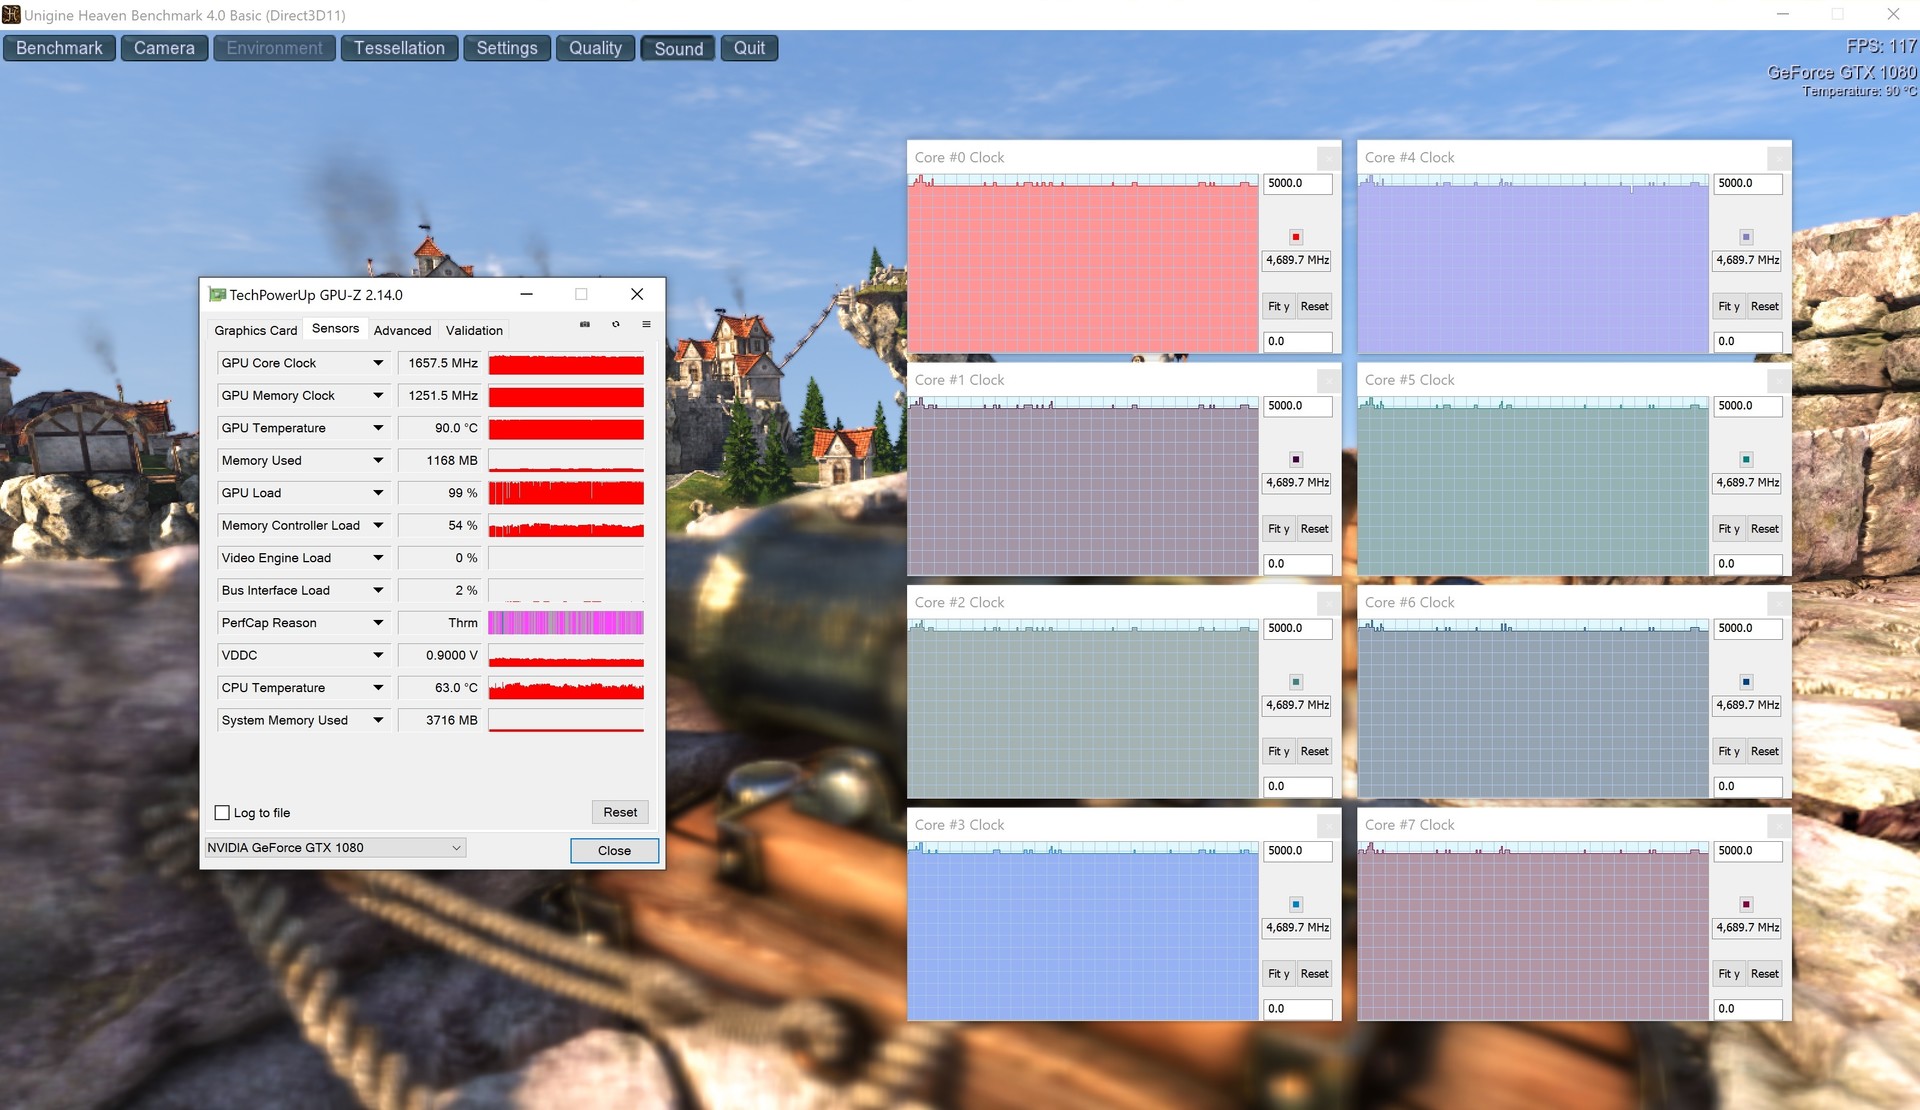
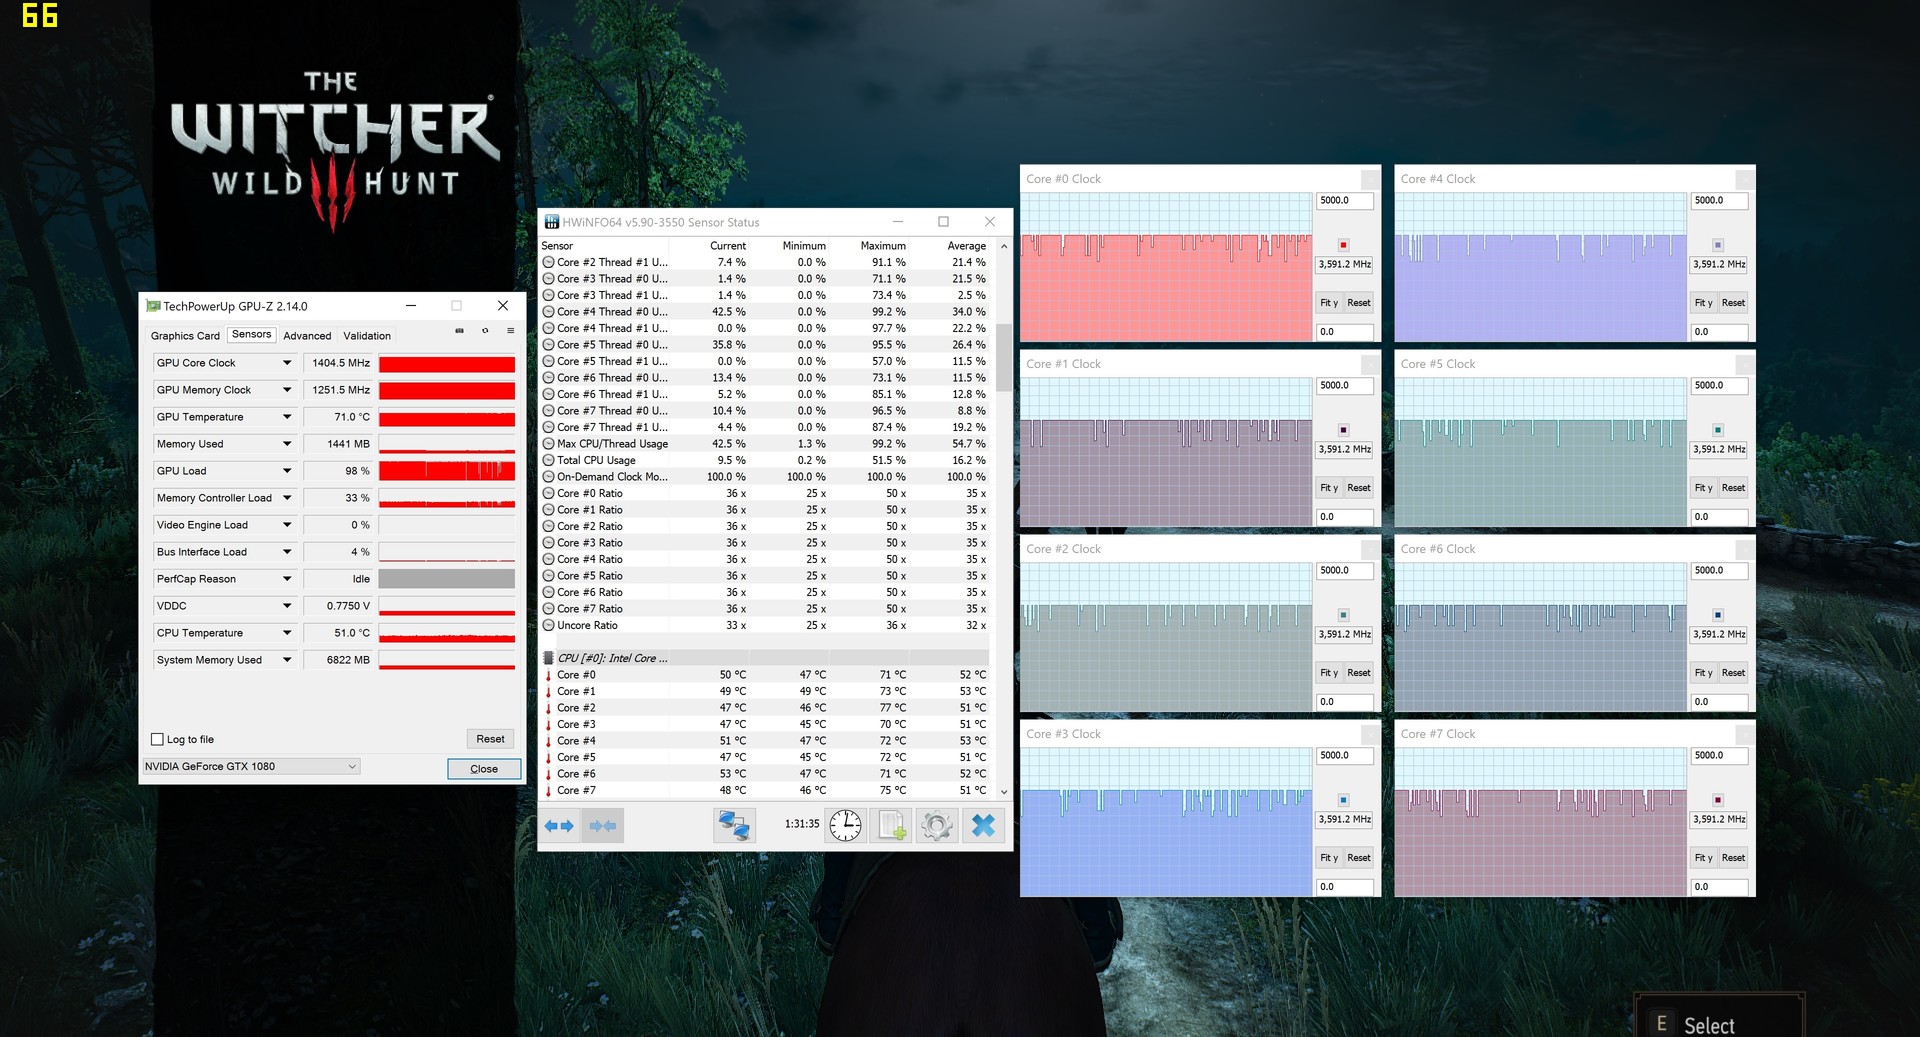
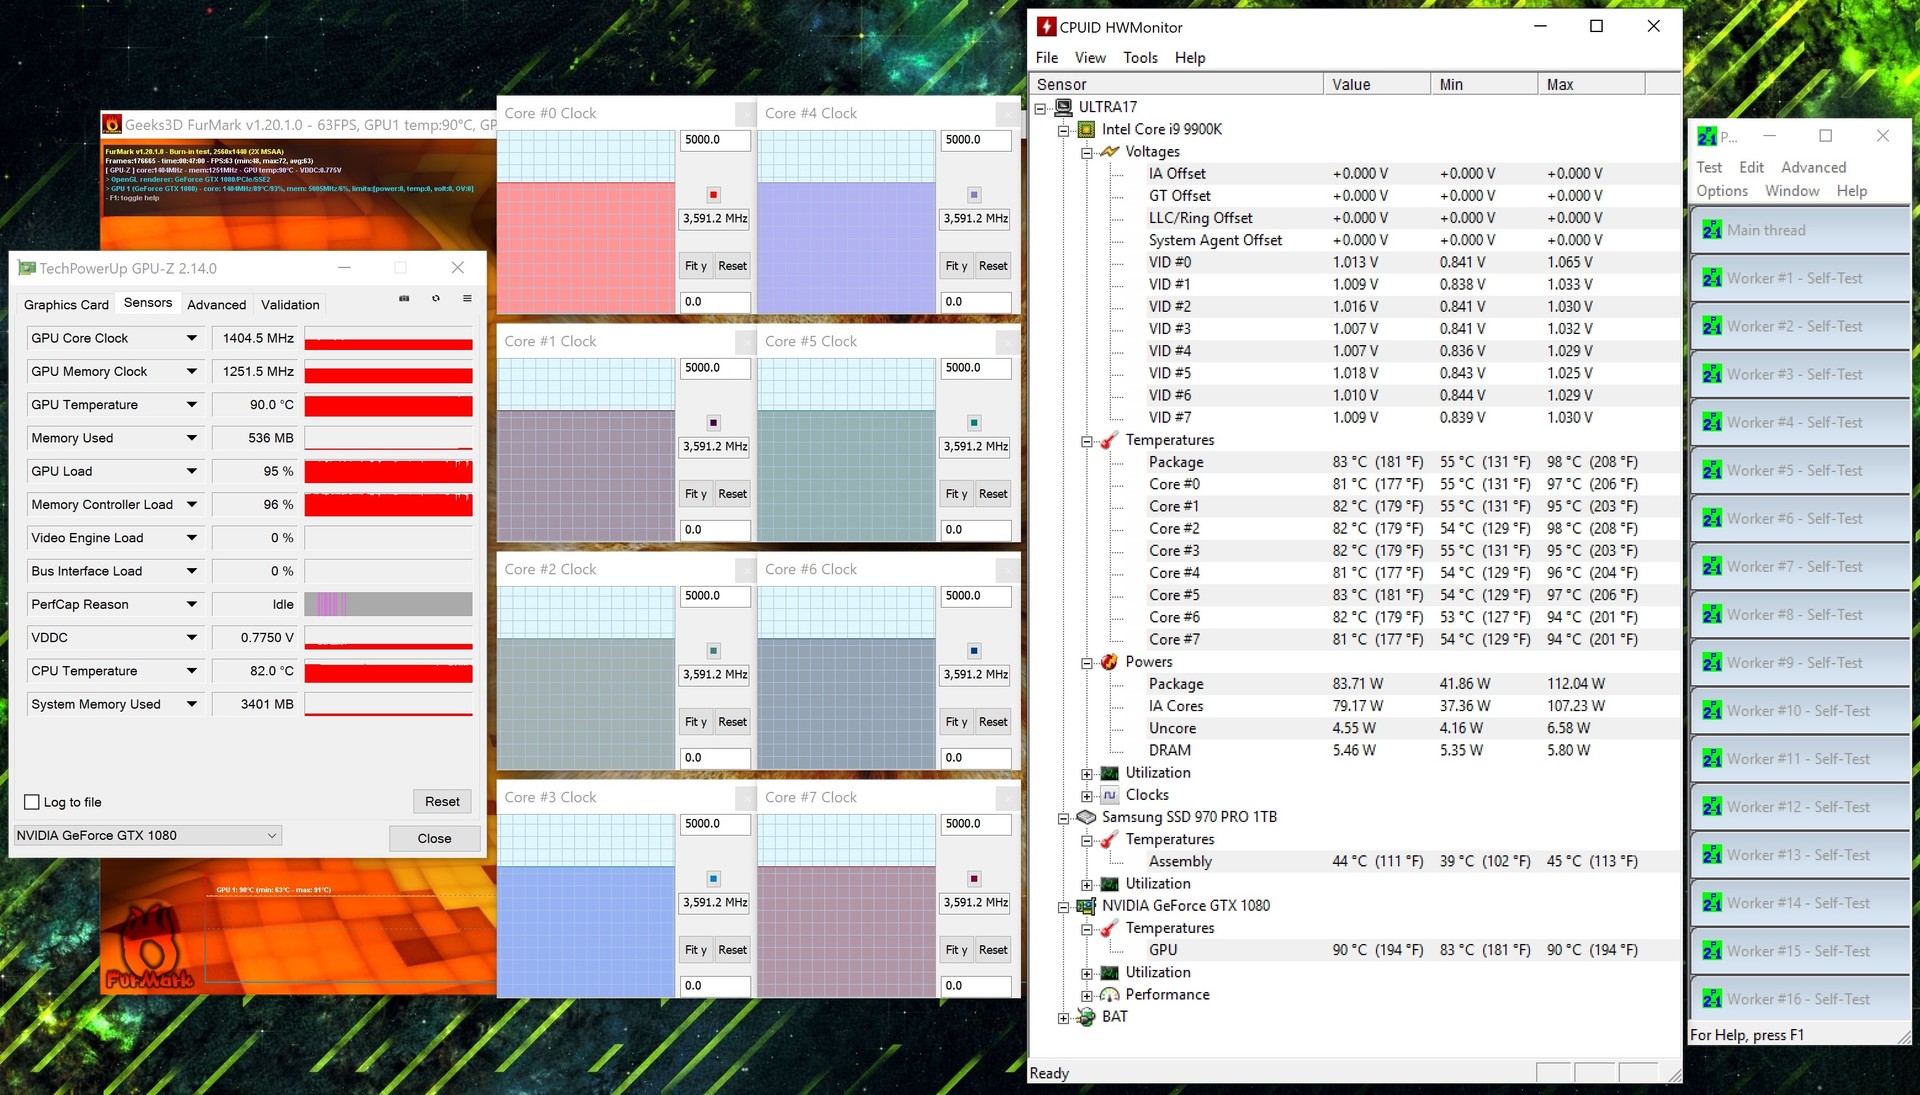
However, a more detailed analysis of the GPU performance reveals a huge problem. While the GeForce GTX 1080 still clocked at its standard 1657 MHz in the Unigine Heaven 4.0 benchmark, the endurance test of "The Witcher 3" (FHD/Ultra) produced a throttling down to around 1404 MHz, which corresponds to a decrease of 15%. Such throttling should not occur during gaming operation and is quite incomprehensible considering the harmless temperatures (GPU: ~70 °C/158 °F; CPU: ~50 °C/122 °F).
We guess that this might be a bug of the Control Center that has been known for months that only effects particular applications and can be fixed with a software update. Besides the Key 15, in the past the XMG A517 and XMG A707, for example, were also affected. We will perform the corresponding tests of the XMG Ultra 17 later and update this article accordingly. In its current state, we unfortunately feel compelled to reduce the gaming performance evaluation by several percentage points.
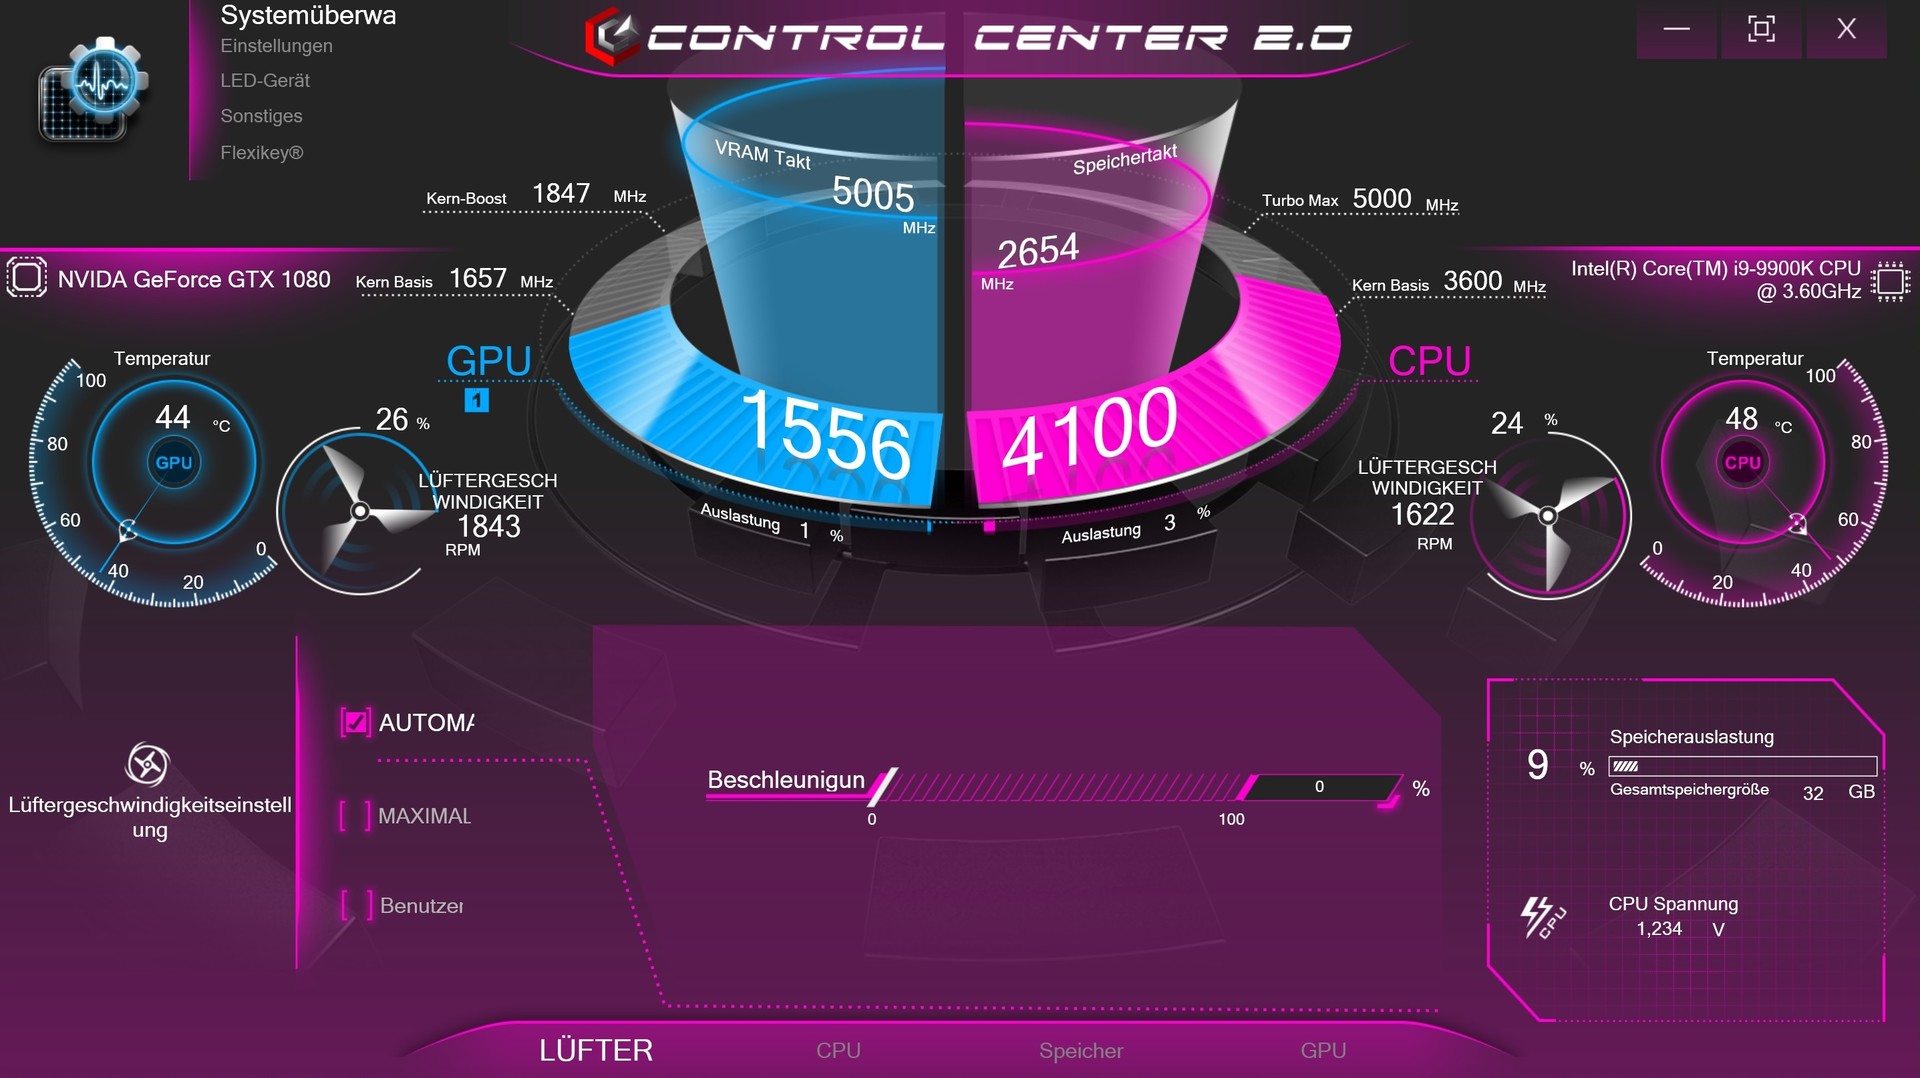
Update 10/30/18: As we had guessed, the Control Center is the reason for the GPU throttling. An update from version 5.0001.1.72 to the graphically redesigned Control Center 2.0 (v1.0.34) makes the problem disappear. Thanks to the better performance, the XMG Ultra 17 now attains 88% instead of 86%, resulting in an overall score of "Very Good."
Update 11/02/18: The Control Center 2.0 is not really meant (yet) for the XMG Ultra 17. However, Schenker has published a new EC and an update for the Control Center 1.0 which should also eliminate the throttling bug.
Gaming Performance
Just from a gaming point of view, the Core i9-9900K makes only a limited amount of sense. While extremely CPU-hungry games such as "Assassin's Creed Odyssey" can really benefit from the additional cores, at the end of the day a notebook with a quad or hexa-core will also be completely sufficient, since most games are GPU limited, at least at higher resolutions and settings.
| The Witcher 3 - 1920x1080 Ultra Graphics & Postprocessing (HBAO+) | |
| Average of class Gaming (95 - 240, n=8, last 2 years) | |
| Asus Chimera G703GI | |
| Schenker XMG Ultra 17 | |
| Aorus X7 DT v8 | |
| Schenker XMG Ultra 17 Coffee Lake Refresh | |
If you also consider the power consumption, excess heat, and purchase price, we would tend to advise gamers against purchasing the Core i9-9900K. The more affordable Core-i5 and Core-i7 models should also offer sufficient performance for the coming years.
| low | med. | high | ultra | 4K | |
|---|---|---|---|---|---|
| The Witcher 3 (2015) | 61.7 | 44.4 | |||
| The Crew 2 (2018) | 59.9 | 40.8 | |||
| Monster Hunter World (2018) | 83.6 | 25.8 | |||
| F1 2018 (2018) | 108 | 53 | |||
| Shadow of the Tomb Raider (2018) | 87 | 29 | |||
| FIFA 19 (2018) | 276 | 167 | |||
| Forza Horizon 4 (2018) | 105 | 60 | |||
| Assassin´s Creed Odyssey (2018) | 60 | 31 | |||
| Call of Duty Black Ops 4 (2018) | 121 | 39.1 |
Emissions
Noise Emissions
Regardless of their thickness, notebooks with the GTX 1080 become fairly loud in 3D operation. The same also goes for the XMG Ultra 17, which in spite of the cooling system that appears to be massive still reaches 43 dB (3DMark 06) and 59 dB (stress test) under load. Around 53 dB after an hour of playing "The Witcher 3" are also hefty. However, the Asus G703GI and the Aorus X7 DT v8 settle on a similar level.
In idle mode and during low loads, the 17-incher has to struggle with a typical problem of the Clevo Barebones: the fan control is sub-optimal, to express it mildly. During rather smaller tasks such as installations or Windows Updates, the fans like to rev up above 40 dB, which can be very annoying in practice. Sometimes they even rev up without any reason when the system does not really have anything to do. Tip: Tuning experts can try their hands in controlling the fan manually via the Control Center.
Noise level
| Idle |
| 33 / 35 / 43 dB(A) |
| Load |
| 43 / 59 dB(A) |
 | ||
30 dB silent 40 dB(A) audible 50 dB(A) loud |
||
min: | ||
| Schenker XMG Ultra 17 Coffee Lake Refresh i9-9900K, GeForce GTX 1080 Mobile | Schenker XMG Ultra 17 i7-8700, GeForce GTX 1080 Mobile | Asus Chimera G703GI i9-8950HK, GeForce GTX 1080 Mobile | Aorus X7 DT v8 i7-8850H, GeForce GTX 1080 Mobile | Average of class Gaming | |
|---|---|---|---|---|---|
| Noise | -0% | 1% | 1% | 17% | |
| off / environment * (dB) | 30 | 30 -0% | 29 3% | 29 3% | 24.1 ? 20% |
| Idle Minimum * (dB) | 33 | 34 -3% | 30 9% | 35 -6% | 25.8 ? 22% |
| Idle Average * (dB) | 35 | 35 -0% | 34 3% | 36 -3% | 27.5 ? 21% |
| Idle Maximum * (dB) | 43 | 40 7% | 42 2% | 41 5% | 30 ? 30% |
| Load Average * (dB) | 43 | 45 -5% | 53 -23% | 43 -0% | 43.1 ? -0% |
| Witcher 3 ultra * (dB) | 53 | 52 2% | 51 4% | 53 -0% | |
| Load Maximum * (dB) | 59 | 60 -2% | 53 10% | 54 8% | 54 ? 8% |
* ... smaller is better
Temperature
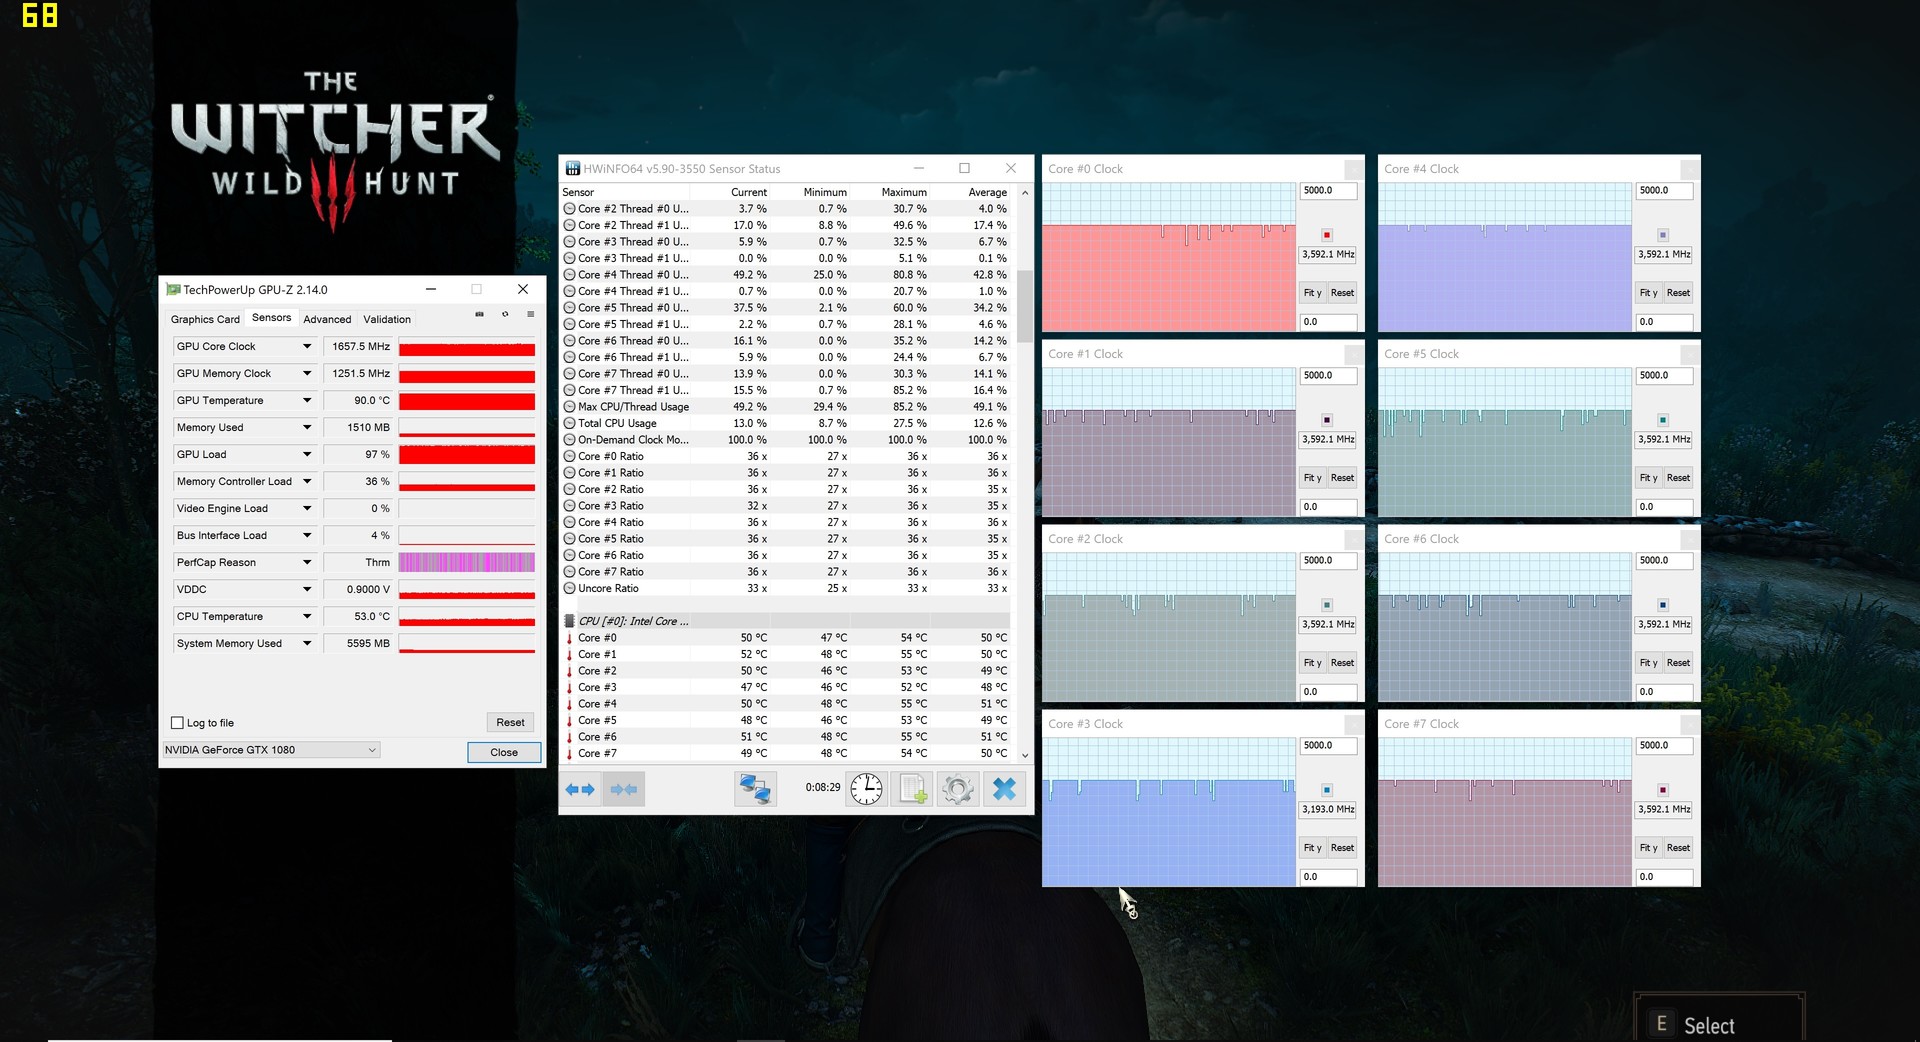
The low temperature development of the case deserves some praise. Even under full load with the FurMark and Prime95 tools, the base unit only heats up to a maximum of 44 °C (112 °F, top) and 45 °C (113 °F, bottom). However, in extreme situations the hardware is also getting throttled. For example, the Core i9-9900K only ran at its standard core speed of 3.6 GHz in the stress test (similar to "The Witcher 3"), whereas the GeForce GTX 1080 was throttled again to 1400 MHz. The fact that the GPU still heated up to 90 °C (194 °F) does not speak for the quality of the cooling system.

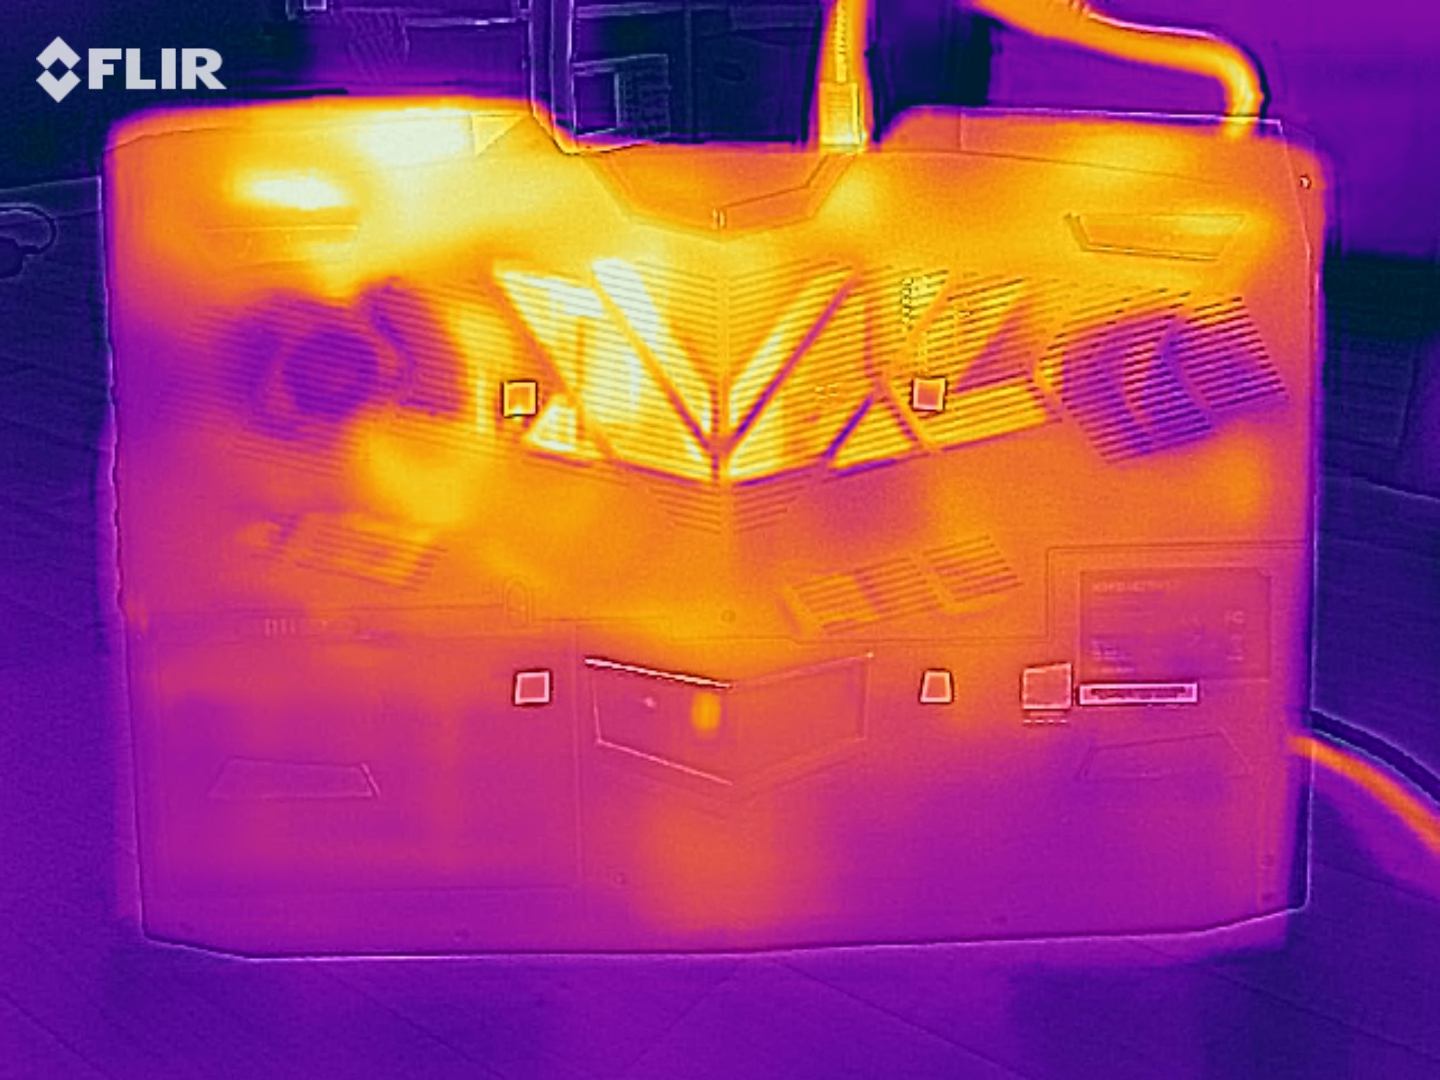
In short, the combination of the Core i9-9900K and GTX 1080 seems to bring the Barebone to its limits and even slightly overextend it. Schenker has told us that in the XMG Ultra 17 the CPUs are even undervolted in the state of delivery, which is definitely necessary in this case.
(±) The maximum temperature on the upper side is 44 °C / 111 F, compared to the average of 40.4 °C / 105 F, ranging from 21.2 to 68.8 °C for the class Gaming.
(±) The bottom heats up to a maximum of 45 °C / 113 F, compared to the average of 43.2 °C / 110 F
(+) In idle usage, the average temperature for the upper side is 29.1 °C / 84 F, compared to the device average of 33.9 °C / 93 F.
(±) Playing The Witcher 3, the average temperature for the upper side is 32.4 °C / 90 F, compared to the device average of 33.9 °C / 93 F.
(+) The palmrests and touchpad are reaching skin temperature as a maximum (35 °C / 95 F) and are therefore not hot.
(-) The average temperature of the palmrest area of similar devices was 28.8 °C / 83.8 F (-6.2 °C / -11.2 F).
| Schenker XMG Ultra 17 Coffee Lake Refresh i9-9900K, GeForce GTX 1080 Mobile | Schenker XMG Ultra 17 i7-8700, GeForce GTX 1080 Mobile | Asus Chimera G703GI i9-8950HK, GeForce GTX 1080 Mobile | Aorus X7 DT v8 i7-8850H, GeForce GTX 1080 Mobile | Average of class Gaming | |
|---|---|---|---|---|---|
| Heat | 0% | -6% | -6% | -3% | |
| Maximum Upper Side * (°C) | 44 | 41 7% | 50 -14% | 51 -16% | 45.2 ? -3% |
| Maximum Bottom * (°C) | 45 | 48 -7% | 50 -11% | 63 -40% | 48.2 ? -7% |
| Idle Upper Side * (°C) | 32 | 30 6% | 32 -0% | 27 16% | 31.1 ? 3% |
| Idle Bottom * (°C) | 33 | 35 -6% | 33 -0% | 28 15% | 34.3 ? -4% |
* ... smaller is better
Speakers
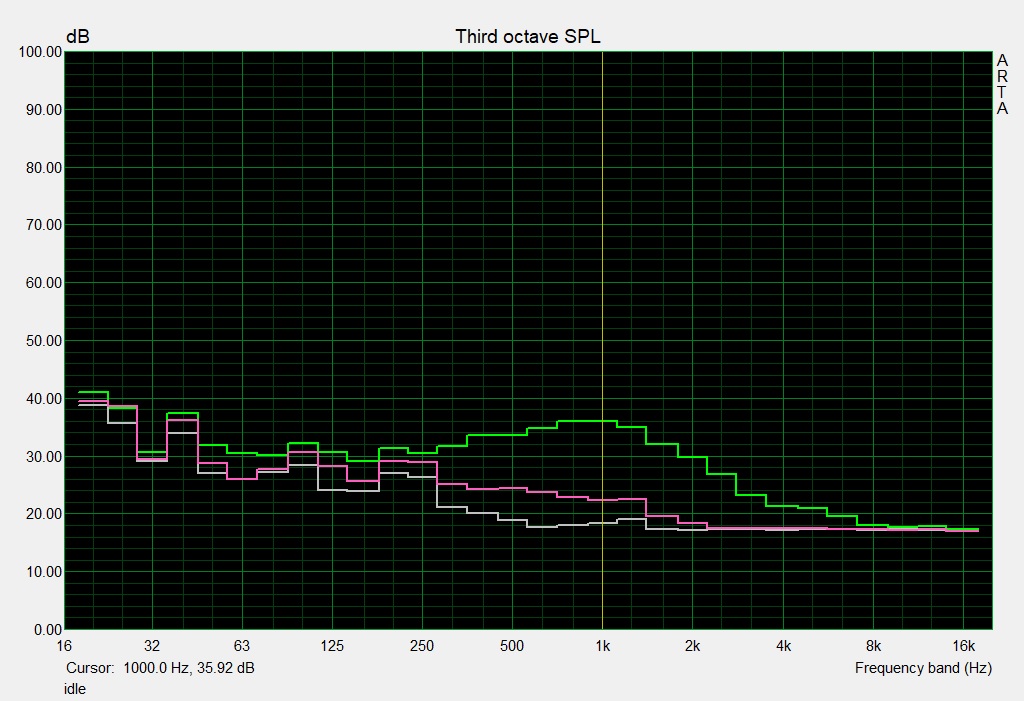
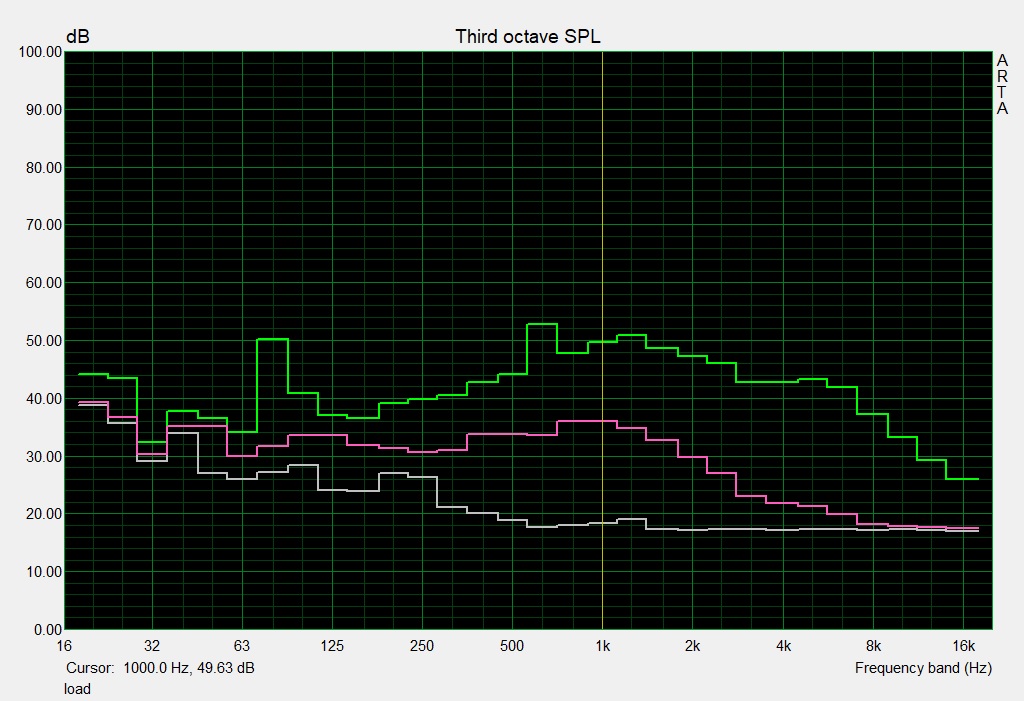
Schenker XMG Ultra 17 Coffee Lake Refresh audio analysis
(±) | speaker loudness is average but good (80 dB)
Bass 100 - 315 Hz
(±) | reduced bass - on average 5.4% lower than median
(±) | linearity of bass is average (13% delta to prev. frequency)
Mids 400 - 2000 Hz
(±) | higher mids - on average 7.1% higher than median
(±) | linearity of mids is average (8% delta to prev. frequency)
Highs 2 - 16 kHz
(+) | balanced highs - only 1.9% away from median
(+) | highs are linear (3.2% delta to prev. frequency)
Overall 100 - 16.000 Hz
(+) | overall sound is linear (13.2% difference to median)
Compared to same class
» 19% of all tested devices in this class were better, 4% similar, 77% worse
» The best had a delta of 6%, average was 18%, worst was 132%
Compared to all devices tested
» 13% of all tested devices were better, 3% similar, 84% worse
» The best had a delta of 4%, average was 24%, worst was 134%
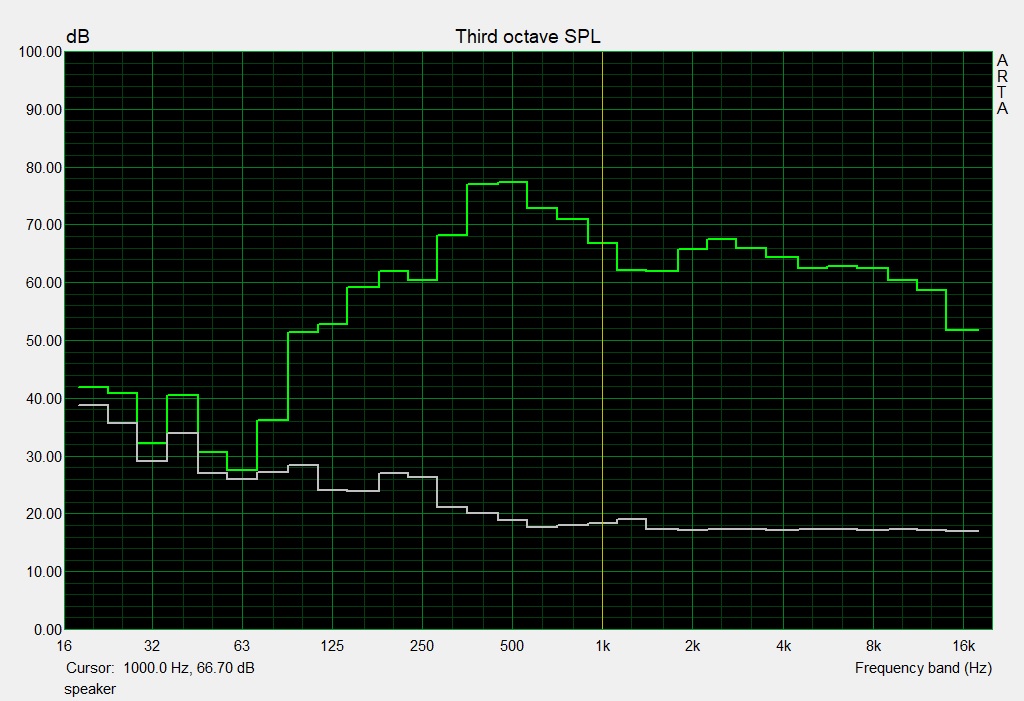
Asus Chimera G703GI audio analysis
(+) | speakers can play relatively loud (89 dB)
Bass 100 - 315 Hz
(±) | reduced bass - on average 8.9% lower than median
(+) | bass is linear (6.4% delta to prev. frequency)
Mids 400 - 2000 Hz
(+) | balanced mids - only 3.1% away from median
(+) | mids are linear (2.4% delta to prev. frequency)
Highs 2 - 16 kHz
(+) | balanced highs - only 4.4% away from median
(+) | highs are linear (3.2% delta to prev. frequency)
Overall 100 - 16.000 Hz
(+) | overall sound is linear (11.8% difference to median)
Compared to same class
» 11% of all tested devices in this class were better, 4% similar, 85% worse
» The best had a delta of 6%, average was 18%, worst was 132%
Compared to all devices tested
» 8% of all tested devices were better, 3% similar, 89% worse
» The best had a delta of 4%, average was 24%, worst was 134%
Power Management
Power Consumption
Due to the occasional throttling, the measurements of the power consumption are not 100% comparable with that of the competitors – at least in 3D operation. During idle operation, the 17-incher consumes between 33 and 49 watts, which is a lot, even for a gaming notebook. Thanks to their notebook CPU, the Asus G703GI (29-46 watts) and the Aorus X9 DT v8 (23-37 watts) consume much less power. By the way, all of these devices drop Nvidia's Optimus technology in favor of G-Sync.
| Off / Standby | |
| Idle | |
| Load |
|
Key:
min: | |
| Schenker XMG Ultra 17 Coffee Lake Refresh i9-9900K, GeForce GTX 1080 Mobile | Schenker XMG Ultra 17 i7-8700, GeForce GTX 1080 Mobile | Asus Chimera G703GI i9-8950HK, GeForce GTX 1080 Mobile | Aorus X7 DT v8 i7-8850H, GeForce GTX 1080 Mobile | Average of class Gaming | |
|---|---|---|---|---|---|
| Power Consumption | -8% | -18% | 2% | 32% | |
| Idle Minimum * (Watt) | 33 | 32 3% | 29 12% | 23 30% | 13.3 ? 60% |
| Idle Average * (Watt) | 42 | 38 10% | 37 12% | 33 21% | 19 ? 55% |
| Idle Maximum * (Watt) | 49 | 45 8% | 46 6% | 37 24% | 24.5 ? 50% |
| Load Average * (Watt) | 93 | 96 -3% | 156 -68% | 115 -24% | 108.1 ? -16% |
| Witcher 3 ultra * (Watt) | 156 | 237 -52% | 252 -62% | 225 -44% | |
| Load Maximum * (Watt) | 293 | 331 -13% | 314 -7% | 281 4% | 254 ? 13% |
* ... smaller is better
Battery Life
Since the XMG Ultra 17 has to make do without graphics switching, the battery life is extremely poor. Even at minimum brightness, you cannot squeeze more than 3 hours out of the 82-Wh battery. On the other hand, the battery can be accessed from the outside, so you can replace it.
| Schenker XMG Ultra 17 Coffee Lake Refresh i9-9900K, GeForce GTX 1080 Mobile, 82 Wh | Schenker XMG Ultra 17 i7-8700, GeForce GTX 1080 Mobile, 82 Wh | Asus Chimera G703GI i9-8950HK, GeForce GTX 1080 Mobile, 71 Wh | Aorus X7 DT v8 i7-8850H, GeForce GTX 1080 Mobile, 94.24 Wh | Average of class Gaming | |
|---|---|---|---|---|---|
| Battery runtime | 6% | -4% | 59% | 164% | |
| Reader / Idle (h) | 2.9 | 2.7 -7% | 2.8 -3% | 4.9 69% | 8.71 ? 200% |
| WiFi v1.3 (h) | 1.9 | 2.4 26% | 2.2 16% | 3.8 100% | 7.01 ? 269% |
| Load (h) | 1.2 | 1.2 0% | 0.9 -25% | 1.3 8% | 1.47 ? 23% |
| H.264 (h) | 2.5 | 8.26 ? |
Verdict
Pros
Cons
An impressive performance that is only worthwhile for very few users - This is how you could summarize the Core i9-9900K in a single sentence.
While eight cores and sixteen threads may bring a great advantage in some particular usage scenarios, gamers can relax and continue to rely on a quad or hexa-core laptop (with Hyper-theading).
The notebook itself leaves a good impression. However, as customary in the absolute high-end range, you are confronted with a high noise level and low mobility (keywords: dimensions, weight, and battery life).
Besides these weaknesses, the 17-incher does not deserve that many complaints. In addition to the connection equipment and the configuration and upgrade options, the sound and input devices also succeed in convincing us to a large extent.
The Clevo Barebone P775TM1-G it is based on is a real desktop replacement that could easily go against a well-equipped PC tower.
Schenker XMG Ultra 17 Coffee Lake Refresh
- 10/30/2018 v6 (old)
Florian Glaser
Price comparison

