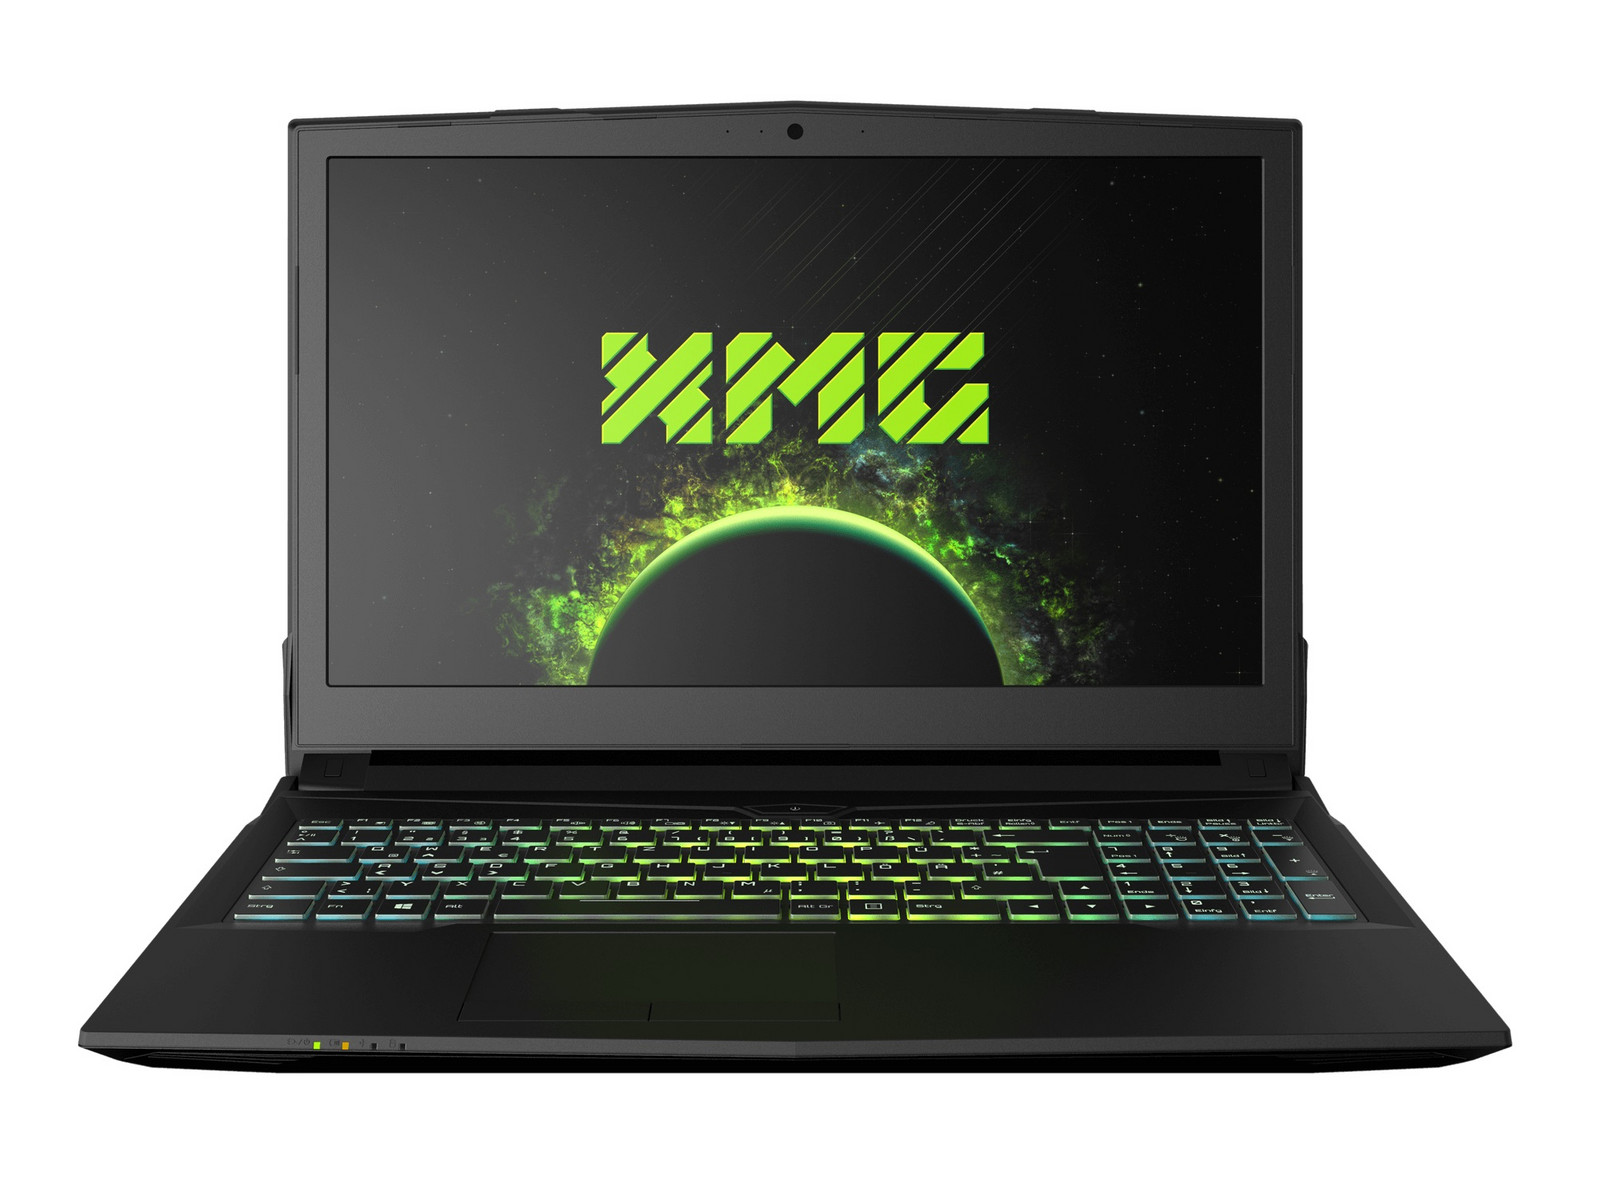
Schenker XMG A517 (Clevo N850EP6) Laptop Review

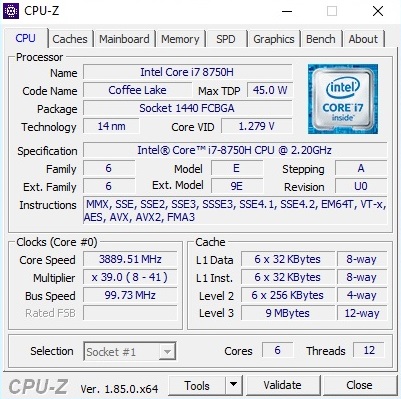
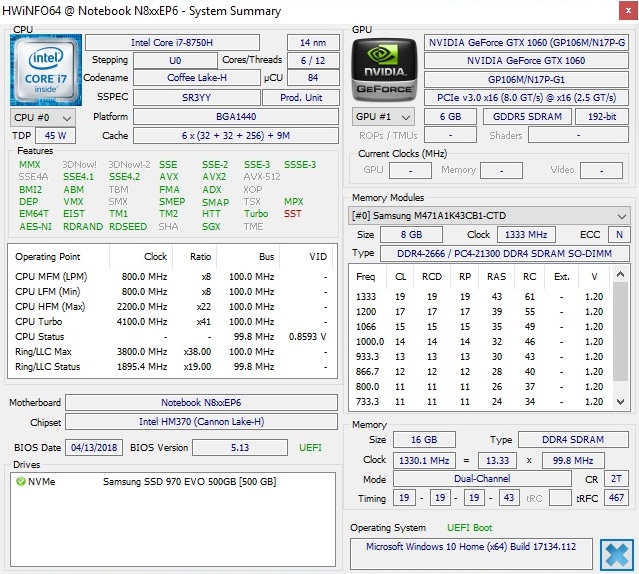
While the similarly named predecessor was equipped with a CPU from Intel's Kaby-Lake series, the new XMG A517 uses a Coffee-Lake processor. Besides the quad-core Core i5-8300H, the configurator on the manufacturer's website also includes the Core i7-8750H hexa-core model, which can run 12 threads in parallel via Hyper-Threading.
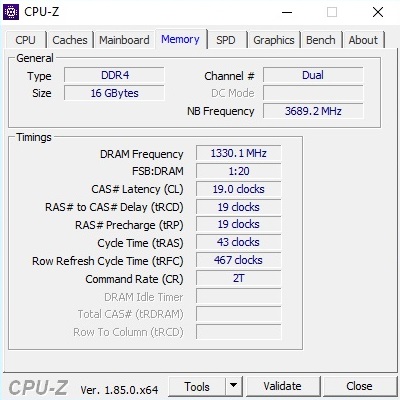
With the exception of the GPU (GeForce GTX 1060), all the other components can be configured as well, be it the working memory (8-32 GB DDR4) or the storage solution (1x M.2 and 1x 2.5 in). You also have the choice of the wireless module, the operating system, and the keyboard language. As the display, there is a 60, a 120, or a 144-Hz screen, with all the choices having a 1920x1080 pixel resolution.
The price of the XMG A517 starts at 1179 Euros (~$1373), but it quickly starts to rise with a few upgrades. Our test unit which has 16 GB RAM, a 500 GB NVMe SSD, the Core i7-8750H, and the 144-Hz panel would currently cost 1767 Euros (~$2059).
If you take a look on some other online shops, you can save a lot of money with a similar configuration. For example, you can get a model with an SSD-HDD combo for about 1500 Euros (~$1748, see link below the article).
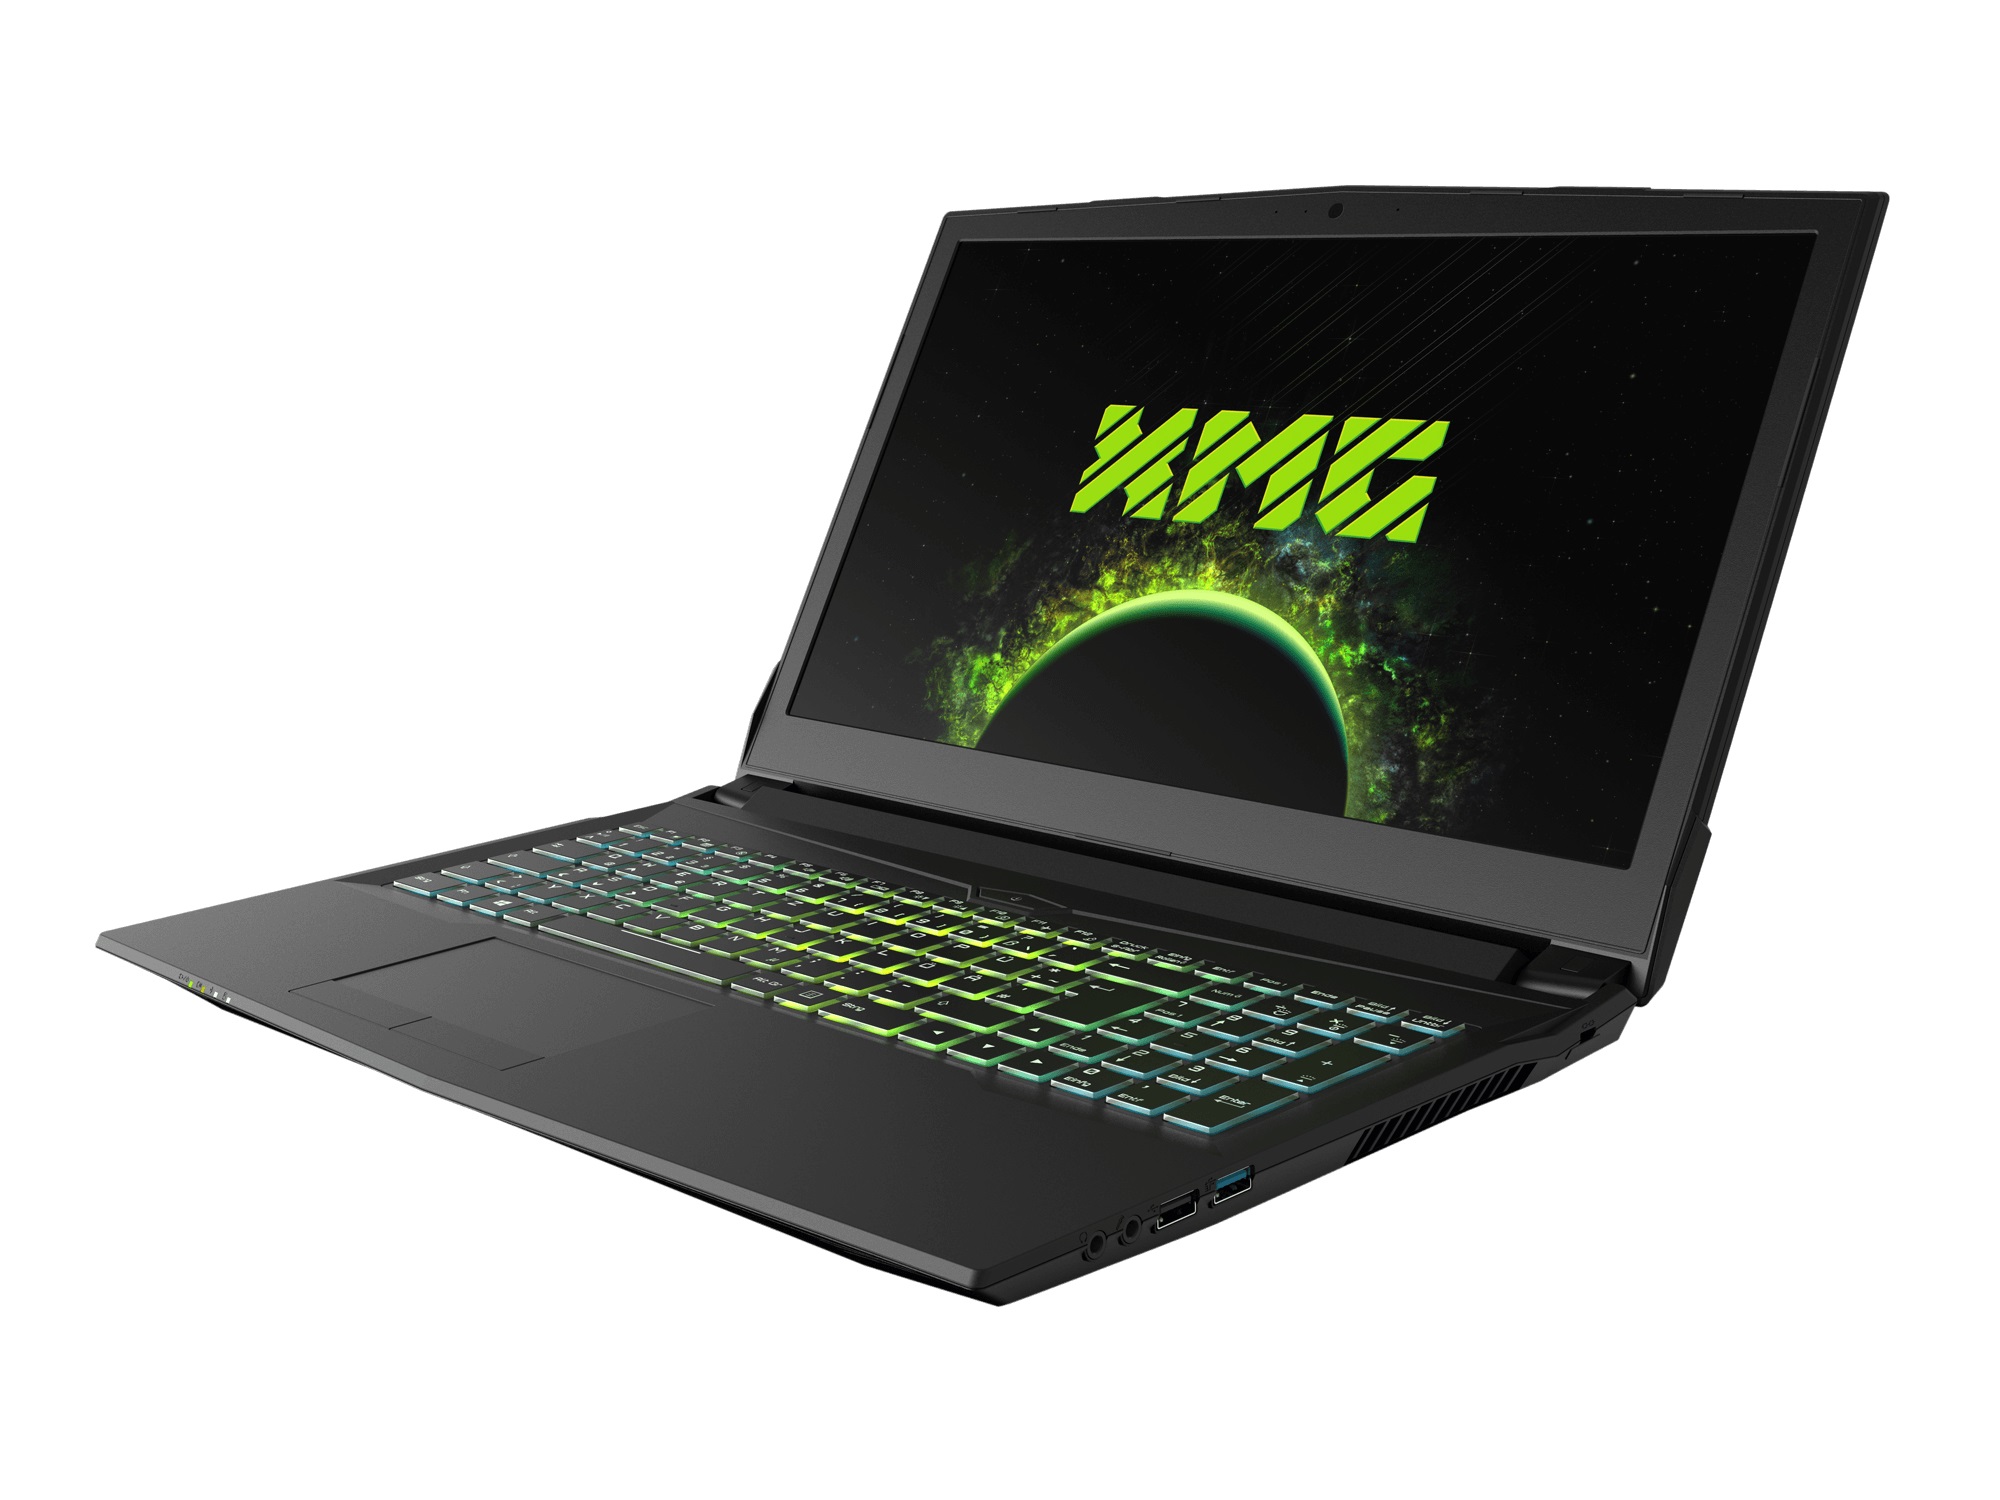
The case of the XMG A517 comes from the bare-bone manufacturer Clevo, like most of the Schenker laptops. Since there were no external modifications, we will not discuss the case, the equipment, and the input devices in this article again. You can find this information in the previous review.
The competitors of the XMG A517 include other 15-inch gaming notebooks with the Core i7-8750H such as the Asus ROG GU501GM, the MSI GP63 Leopard 8RE, and the Eurocom Q6. You can find these notebooks as comparison devices in the charts.
| SD Card Reader | |
| average JPG Copy Test (av. of 3 runs) | |
| Eurocom Q6 (Toshiba Exceria Pro SDXC 64 GB UHS-II) | |
| Average of class Gaming (20.9 - 210, n=54, last 2 years) | |
| Schenker XMG A517 (Toshiba Exceria Pro SDXC 64 GB UHS-II) | |
| Schenker XMG A517 Coffee Lake (Toshiba Exceria Pro SDXC 64 GB UHS-II) | |
| MSI GP63 Leopard 8RE-013US (Toshiba Exceria Pro SDXC 64 GB UHS-II) | |
| maximum AS SSD Seq Read Test (1GB) | |
| Eurocom Q6 (Toshiba Exceria Pro SDXC 64 GB UHS-II) | |
| Average of class Gaming (25.5 - 261, n=51, last 2 years) | |
| Schenker XMG A517 (Toshiba Exceria Pro SDXC 64 GB UHS-II) | |
| Schenker XMG A517 Coffee Lake (Toshiba Exceria Pro SDXC 64 GB UHS-II) | |
| MSI GP63 Leopard 8RE-013US (Toshiba Exceria Pro SDXC 64 GB UHS-II) | |
Display - 60, 120, or 144 Hz
The optional 144-Hz display is definitely one of the main strengths of the XMG A517. We already know the matte LGD05C0 Full HD screen from the Gigabyte Aero 15X and the recently tested Schenker Key 15.
| |||||||||||||||||||||||||
Brightness Distribution: 81 %
Center on Battery: 298 cd/m²
Contrast: 1104:1 (Black: 0.27 cd/m²)
ΔE ColorChecker Calman: 2.88 | ∀{0.5-29.43 Ø4.72}
calibrated: 1.25
ΔE Greyscale Calman: 3.44 | ∀{0.09-98 Ø4.97}
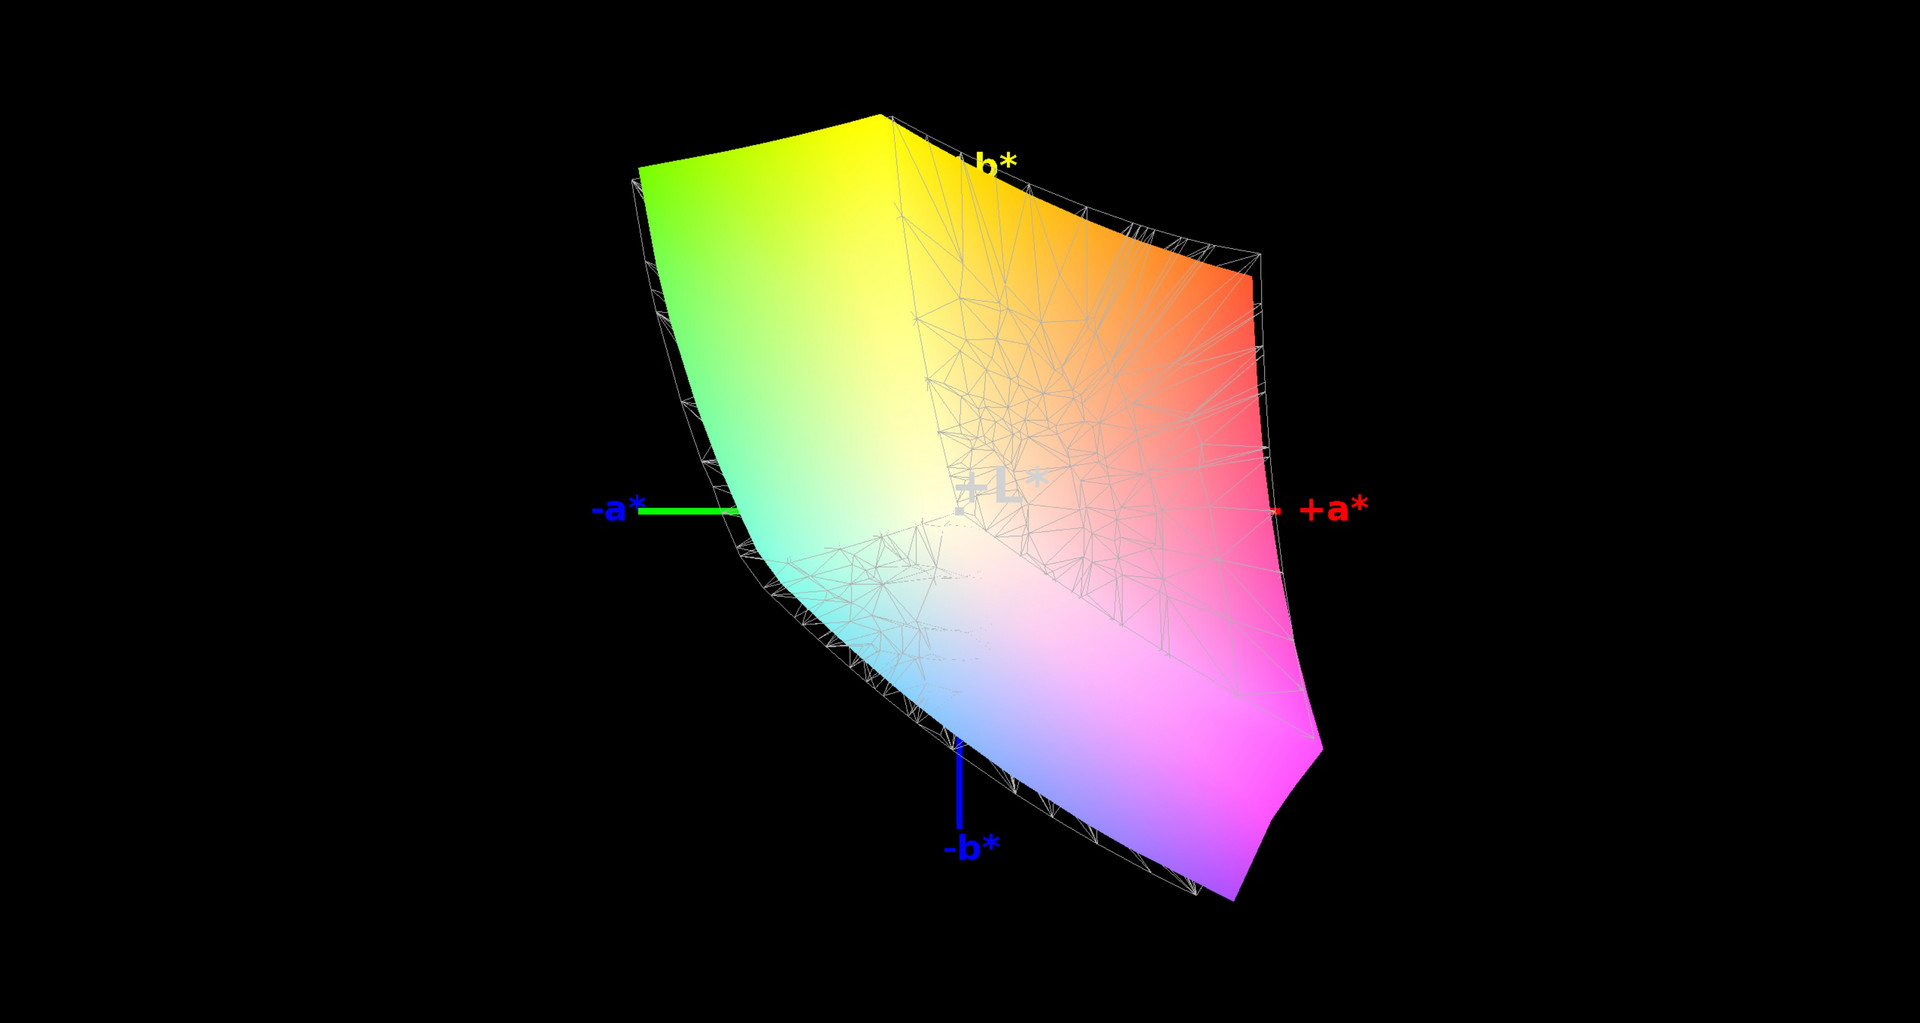
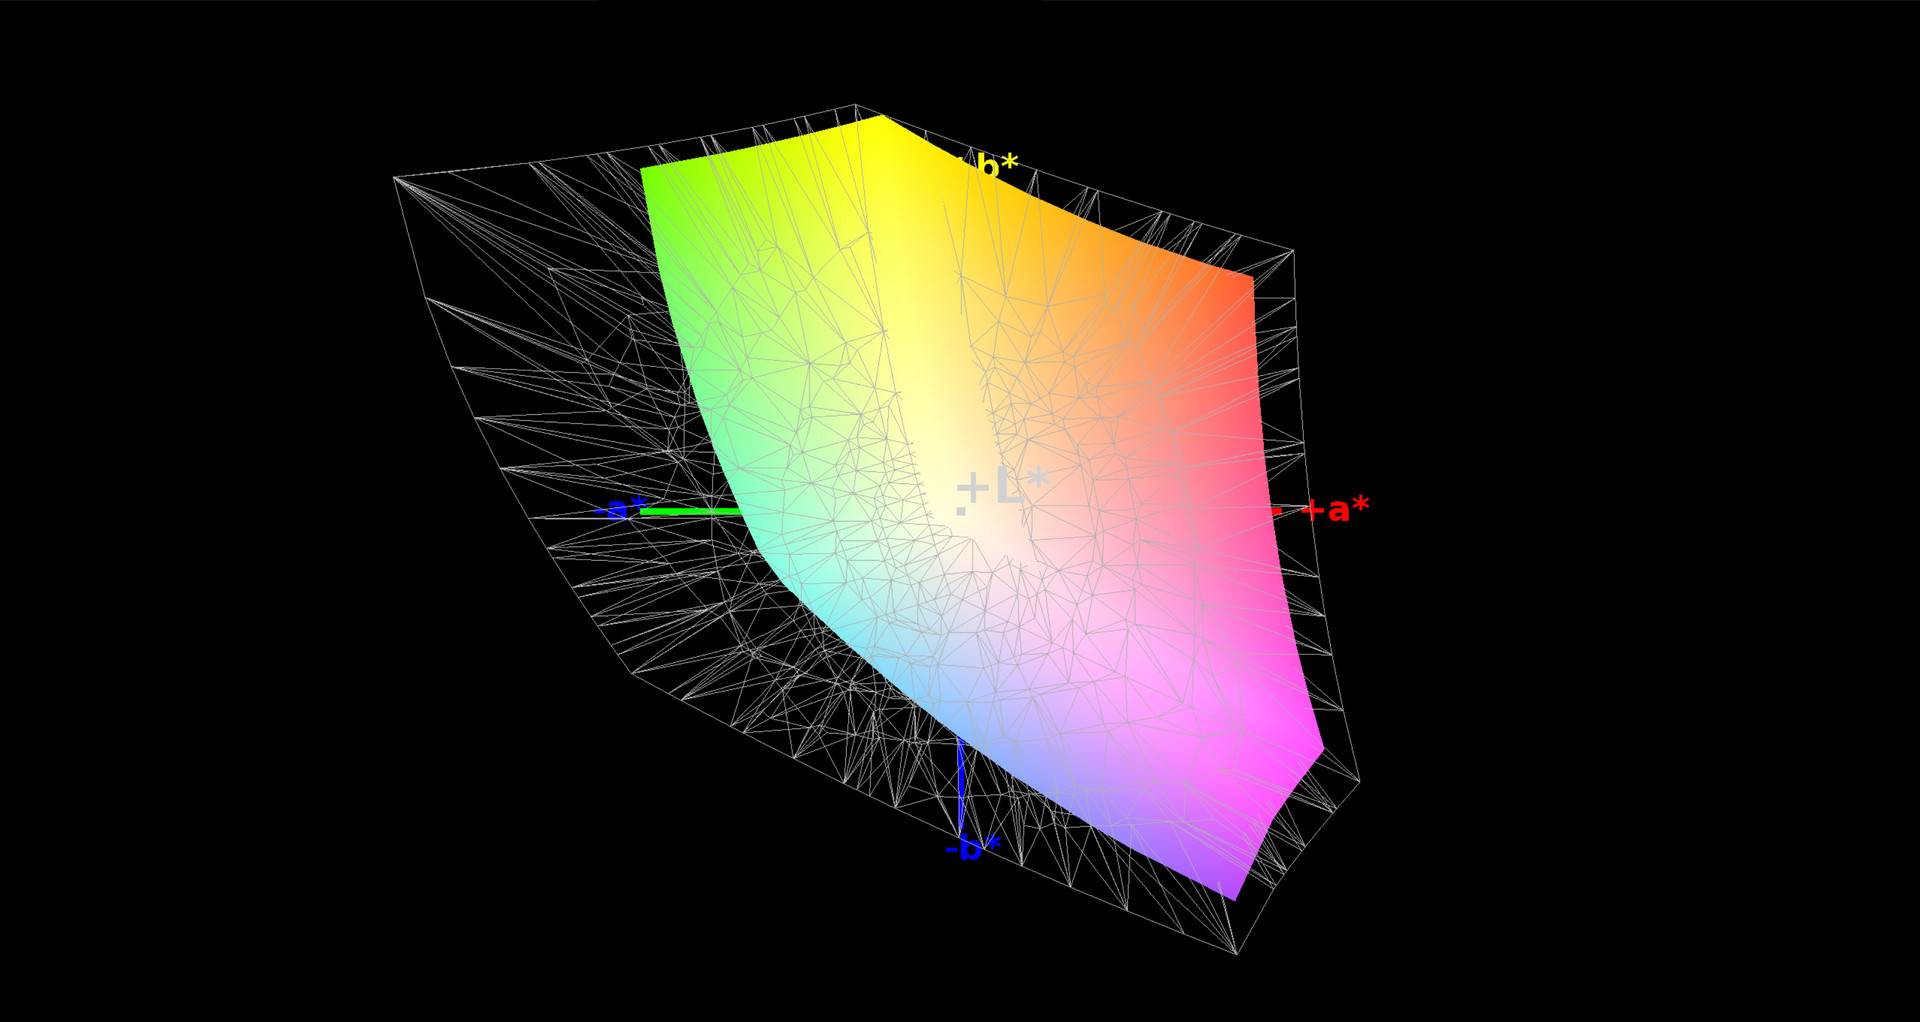
93% sRGB (Argyll 1.6.3 3D)
60% AdobeRGB 1998 (Argyll 1.6.3 3D)
64.6% AdobeRGB 1998 (Argyll 3D)
93.7% sRGB (Argyll 3D)
63.5% Display P3 (Argyll 3D)
Gamma: 2.45
CCT: 7042 K
| Schenker XMG A517 Coffee Lake LGD05C0, IPS, 1920x1080 | Schenker XMG A517 LG Philips LP156WF6 (LGD046F), IPS, 1920x1080 | Asus ROG GU501GM-BI7N8 AU Optronics AUO45ED, IPS, 1920x1080 | MSI GP63 Leopard 8RE-013US Chi Mei CMN15F4 (N156HHE-GA1 CMN), TN LED, 120 Hz, 1920x1080 | Eurocom Q6 LG Philips LGD05C0, IPS, 1920x1080 | |
|---|---|---|---|---|---|
| Display | -4% | -3% | 28% | 2% | |
| Display P3 Coverage (%) | 63.5 | 65 2% | 63.4 0% | 91.5 44% | 65.1 3% |
| sRGB Coverage (%) | 93.7 | 85.1 -9% | 87.7 -6% | 100 7% | 94.4 1% |
| AdobeRGB 1998 Coverage (%) | 64.6 | 62.2 -4% | 85.9 33% | 66.2 2% | |
| Response Times | -111% | -111% | -8% | 10% | |
| Response Time Grey 50% / Grey 80% * (ms) | 16.8 ? | 36 ? -114% | 30.8 ? -83% | 24 ? -43% | 15.2 ? 10% |
| Response Time Black / White * (ms) | 11.6 ? | 24 ? -107% | 27.6 ? -138% | 8.4 ? 28% | 10.4 ? 10% |
| PWM Frequency (Hz) | 21000 ? | 26040 ? | |||
| Screen | -20% | -11% | -58% | 0% | |
| Brightness middle (cd/m²) | 298 | 320 7% | 286.7 -4% | 368.5 24% | 326.6 10% |
| Brightness (cd/m²) | 281 | 311 11% | 281 0% | 341 21% | 312 11% |
| Brightness Distribution (%) | 81 | 90 11% | 92 14% | 87 7% | 88 9% |
| Black Level * (cd/m²) | 0.27 | 0.36 -33% | 0.39 -44% | 0.34 -26% | 0.42 -56% |
| Contrast (:1) | 1104 | 889 -19% | 735 -33% | 1084 -2% | 778 -30% |
| Colorchecker dE 2000 * | 2.88 | 5.08 -76% | 4.17 -45% | 8.91 -209% | 2.54 12% |
| Colorchecker dE 2000 max. * | 6.48 | 10.73 -66% | 7.22 -11% | 14.39 -122% | 4.7 27% |
| Colorchecker dE 2000 calibrated * | 1.25 | 2.87 -130% | 1.63 -30% | ||
| Greyscale dE 2000 * | 3.44 | 4.04 -17% | 2.5 27% | 12 -249% | 1.9 45% |
| Gamma | 2.45 90% | 2.34 94% | 2.274 97% | 1.825 121% | 2.14 103% |
| CCT | 7042 92% | 7029 92% | 6885 94% | 11519 56% | 6562 99% |
| Color Space (Percent of AdobeRGB 1998) (%) | 60 | 56 -7% | 57 -5% | 85.94 43% | 60.9 1% |
| Color Space (Percent of sRGB) (%) | 93 | 85 -9% | 87 -6% | 99.98 8% | 94.5 2% |
| Total Average (Program / Settings) | -45% /
-29% | -42% /
-24% | -13% /
-35% | 4% /
2% |
* ... smaller is better
Primarily, there are some positive points for the fast response times. 11.6 ms when changing from black to white and 16.8 ms when changing from gray to gray are surprisingly good for an IPS model. The 60-Hz panel of the old XMG A517 only managed 24 and 36 ms here. Granted, some gaming notebooks offer even shorter response times via TN technology, but this goes at the expense of the viewing-angle stability, which we would not appreciate.
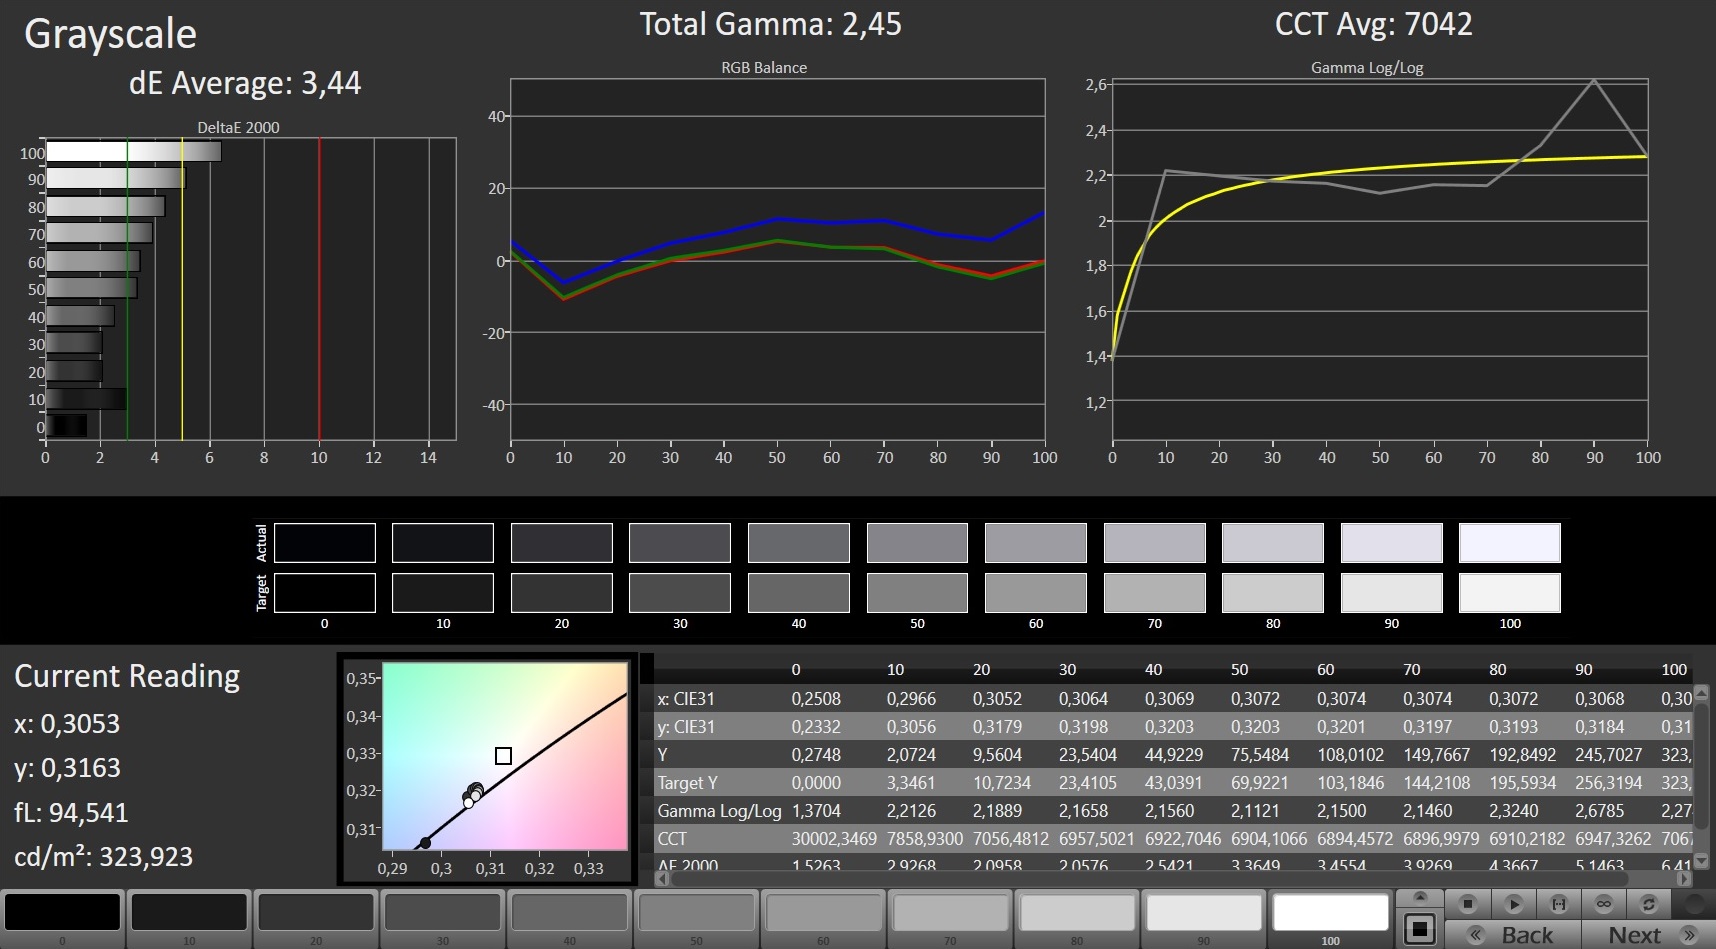
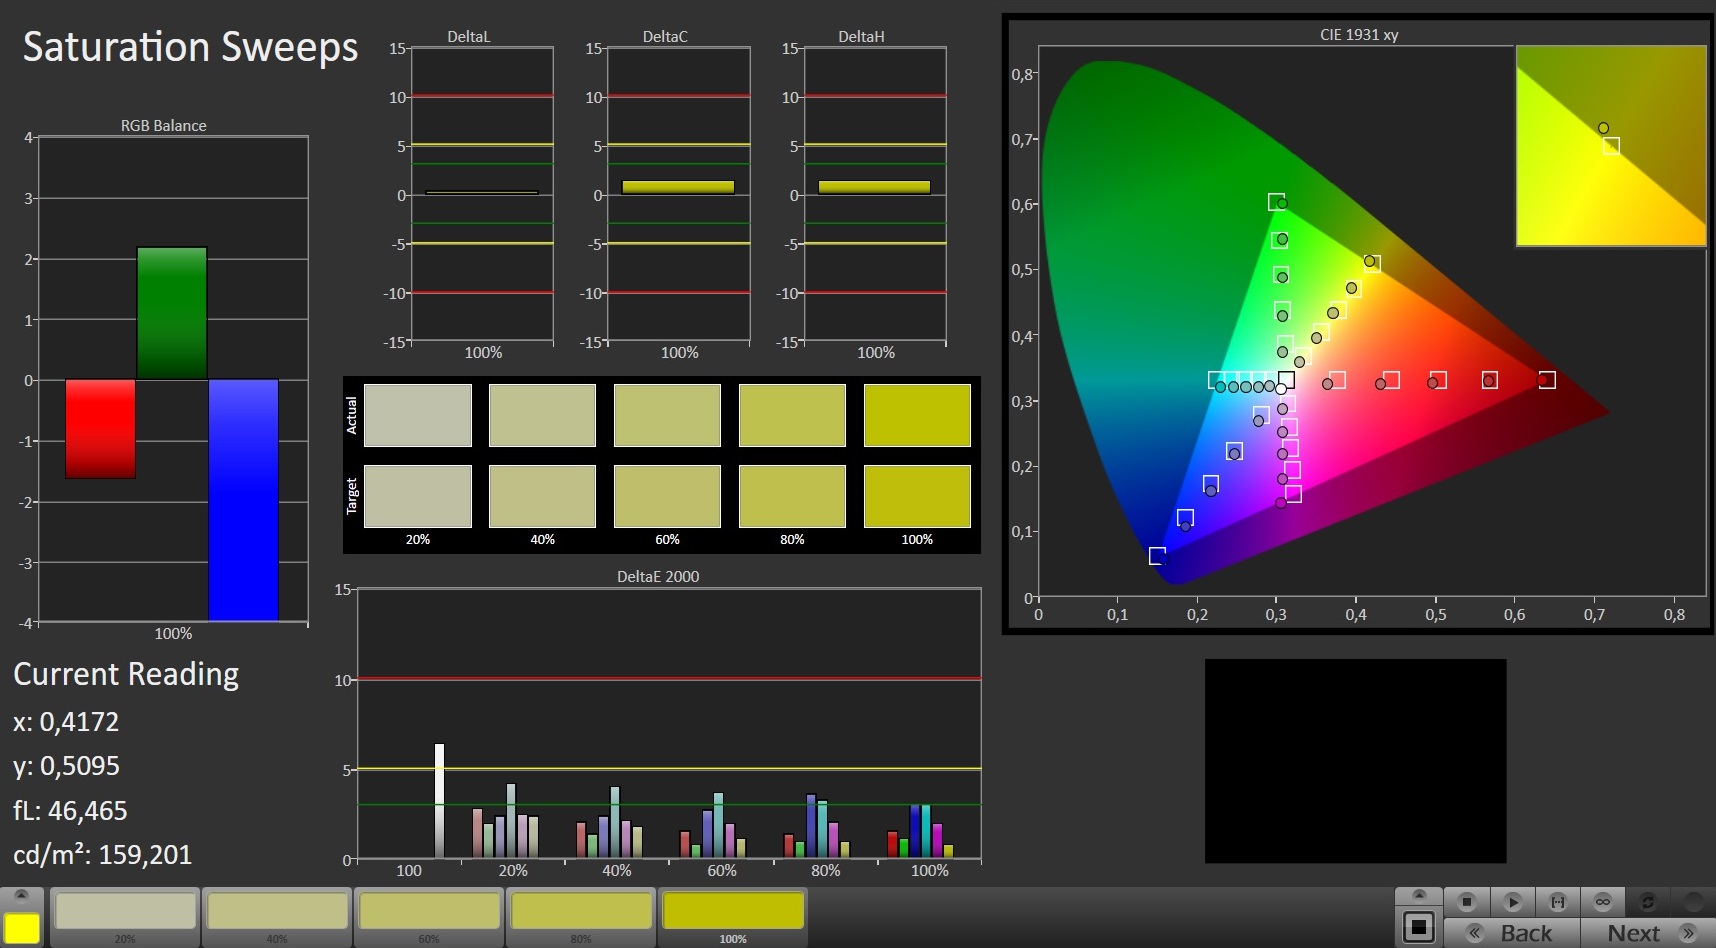
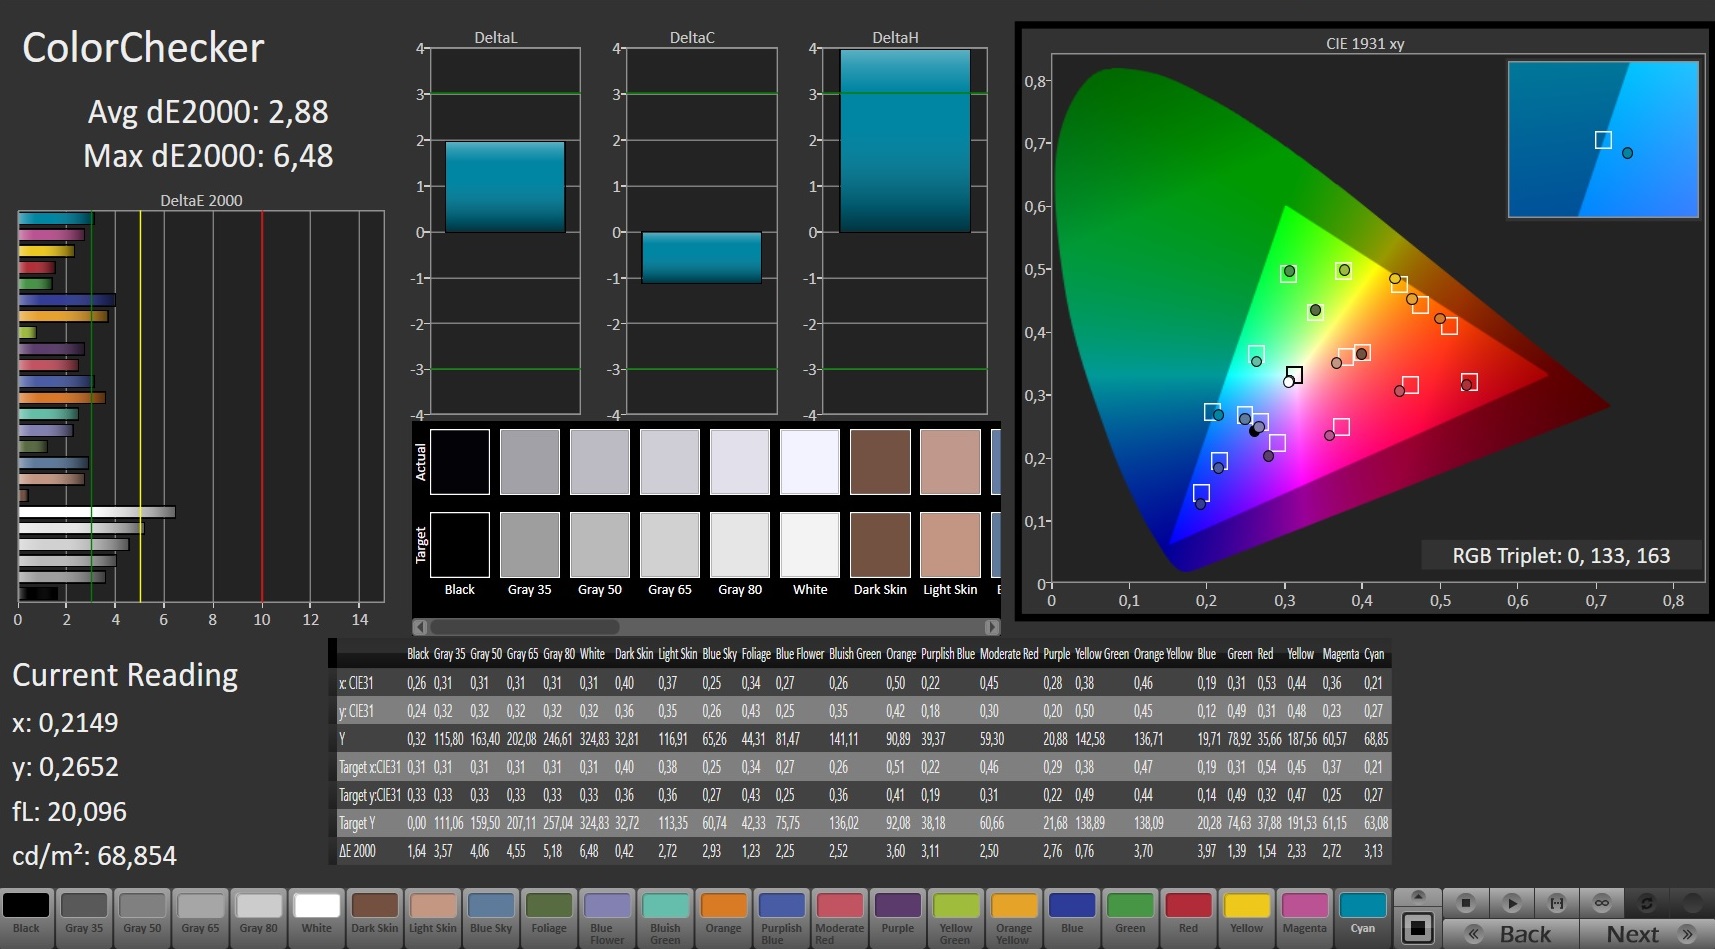
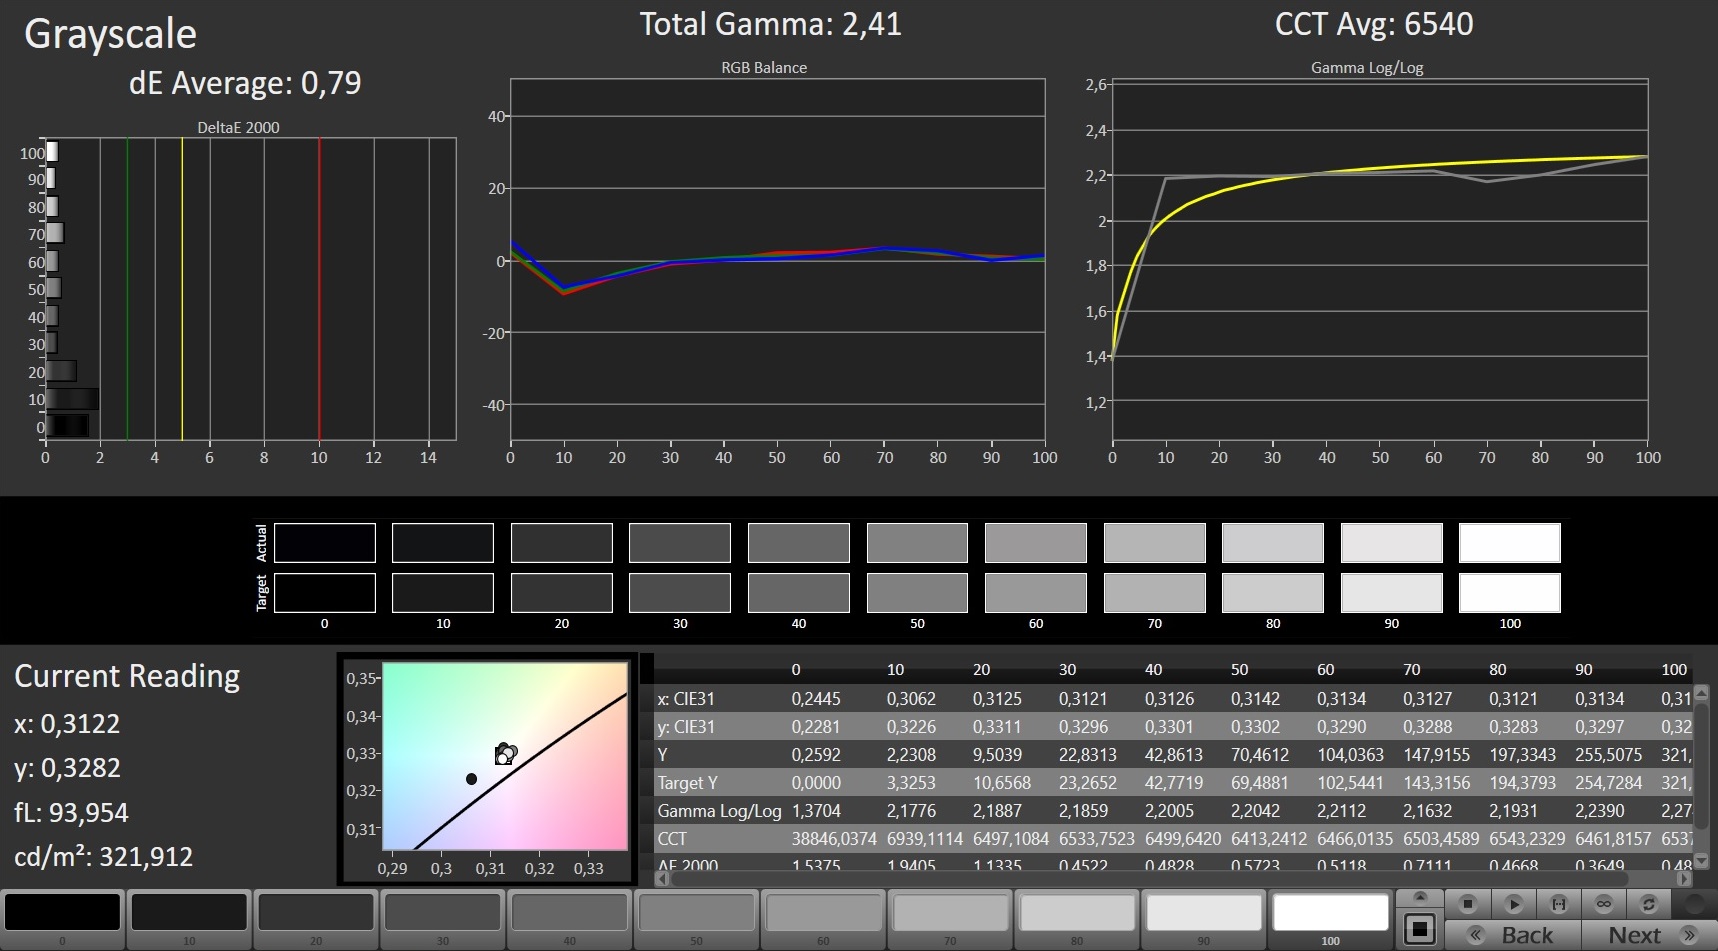
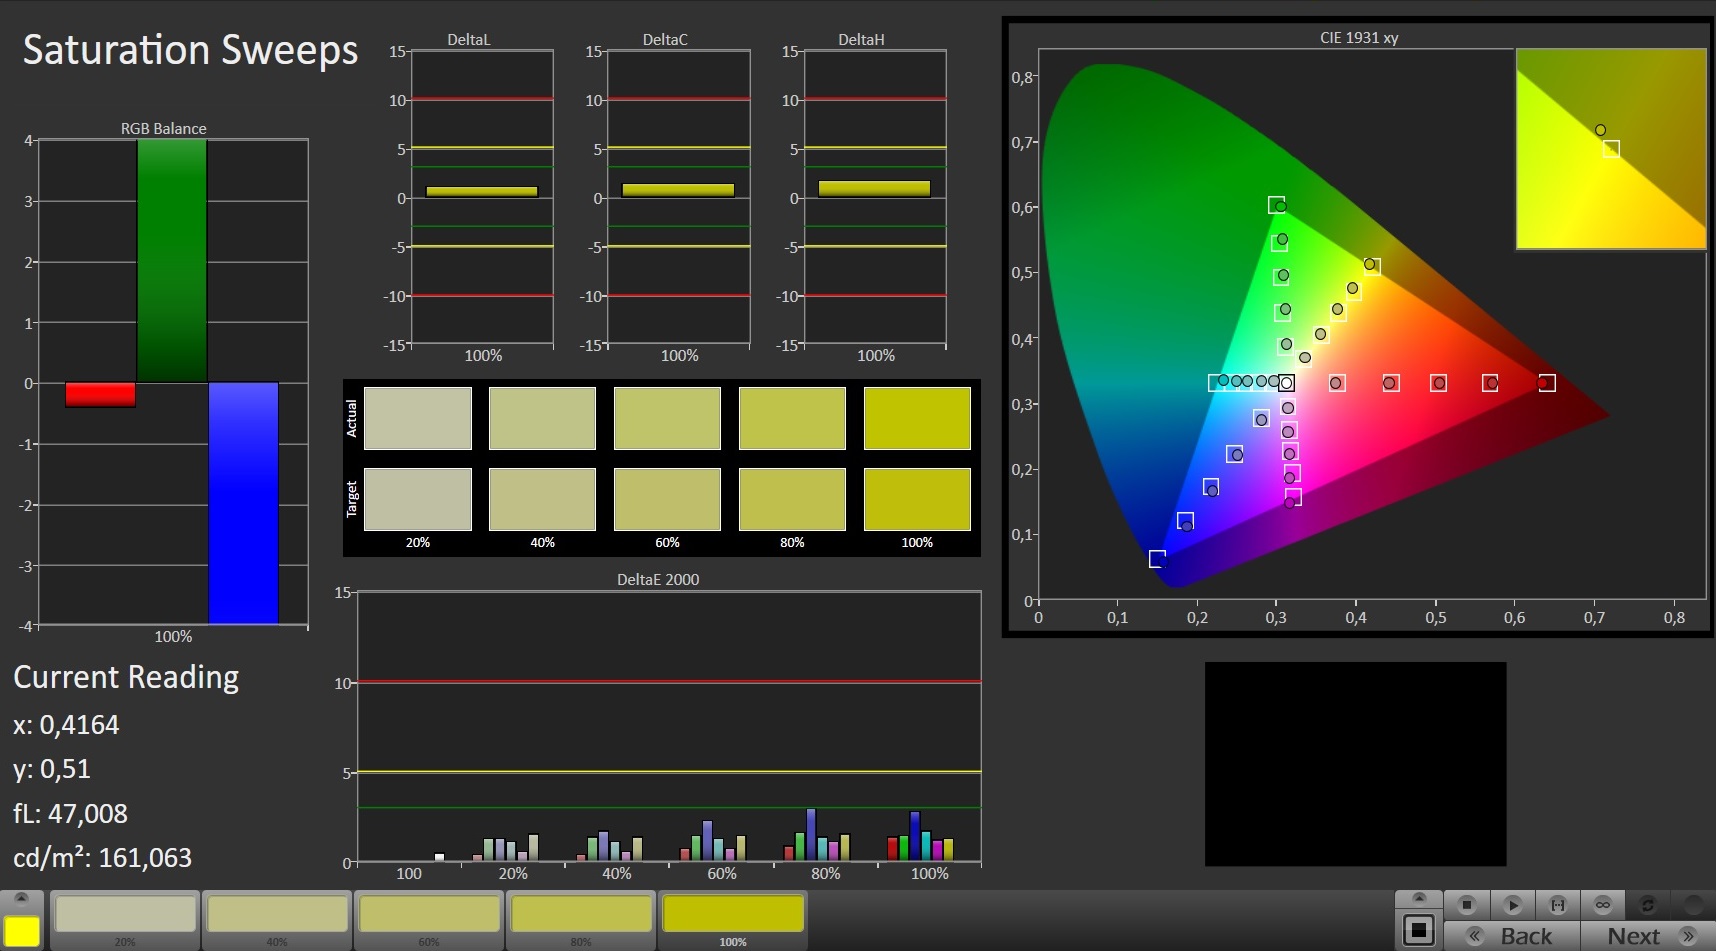
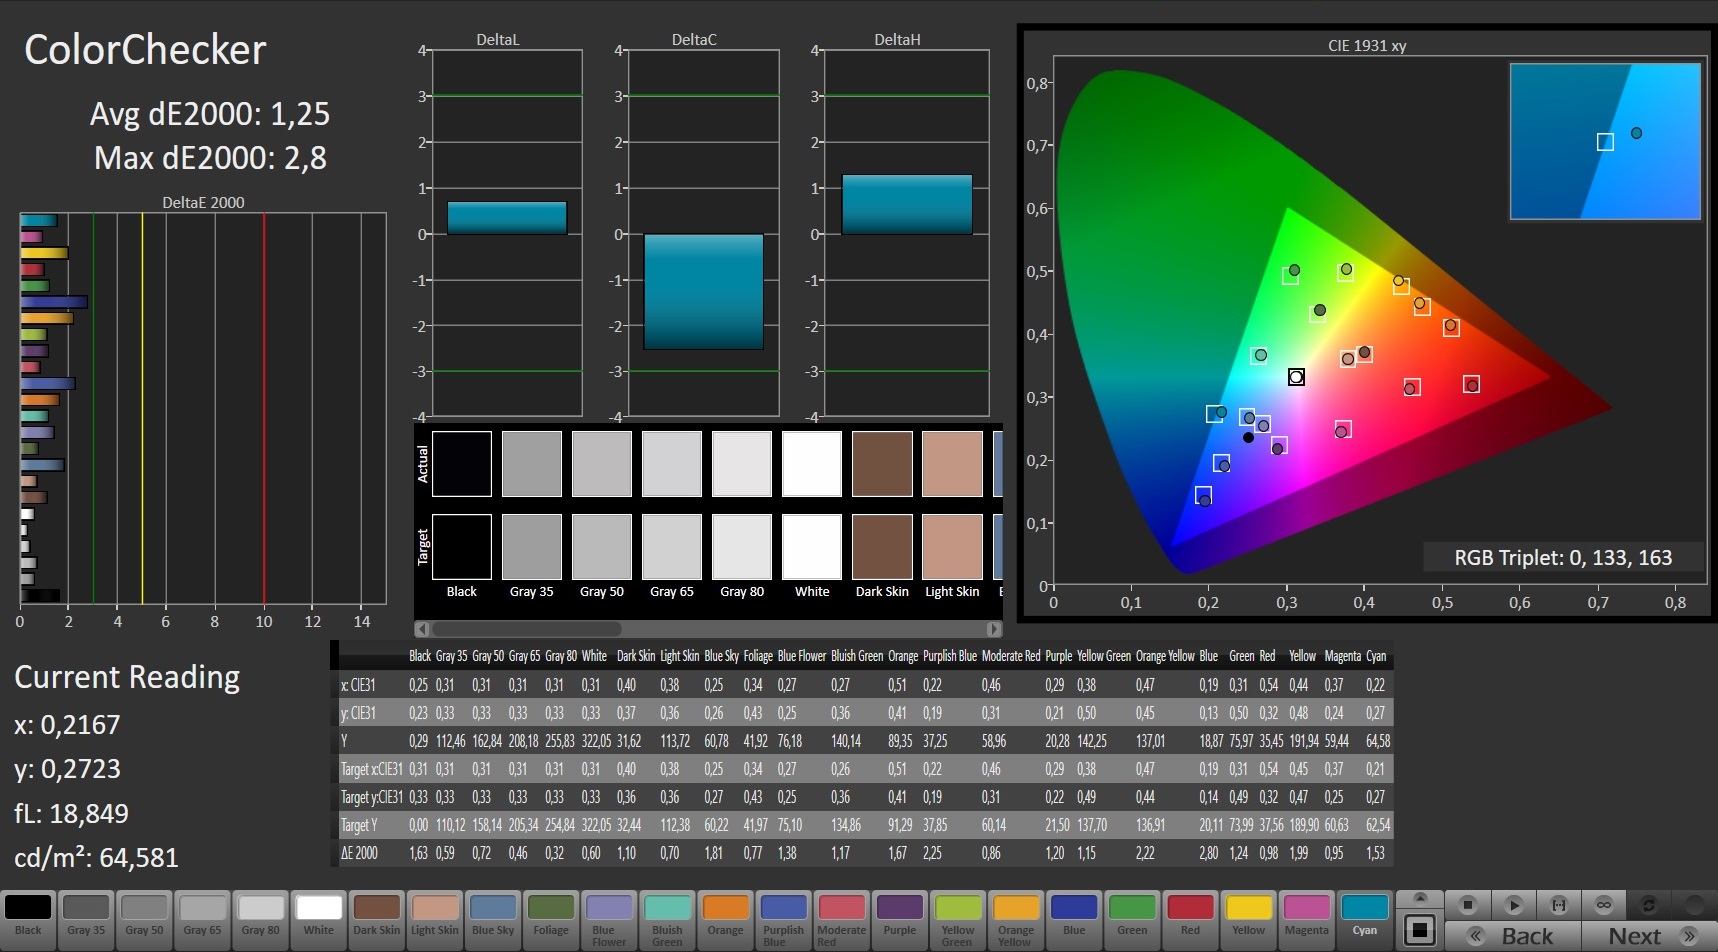
The other display values are to a large extent unspectacular. As required at this price range, at around 1100:1 the contrast is more than decent. The black value (0.27 cd/m²), the color accuracy, and the color space (93% sRGB) do not need to hide from the competitors either.
Only the brightness could have been better. While an average of 281 cd/m² might be sufficient indoors, we often wish for more brightness in outdoor areas. It is also a little annoying that the screen tends to have halos on the edges.
Display Response Times
| ↔ Response Time Black to White | ||
|---|---|---|
| 11.6 ms ... rise ↗ and fall ↘ combined | ↗ 6.8 ms rise | 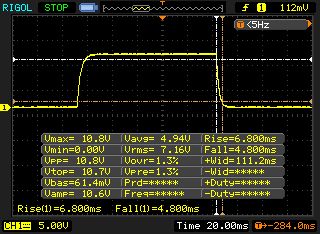 |
| ↘ 4.8 ms fall | ||
| The screen shows good response rates in our tests, but may be too slow for competitive gamers. In comparison, all tested devices range from 0.1 (minimum) to 240 (maximum) ms. » 31 % of all devices are better. This means that the measured response time is better than the average of all tested devices (19.8 ms). | ||
| ↔ Response Time 50% Grey to 80% Grey | ||
| 16.8 ms ... rise ↗ and fall ↘ combined | ↗ 8.4 ms rise | 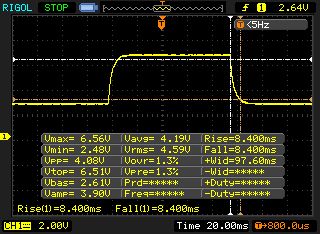 |
| ↘ 8.4 ms fall | ||
| The screen shows good response rates in our tests, but may be too slow for competitive gamers. In comparison, all tested devices range from 0.165 (minimum) to 636 (maximum) ms. » 31 % of all devices are better. This means that the measured response time is better than the average of all tested devices (31 ms). | ||
Screen Flickering / PWM (Pulse-Width Modulation)
| Screen flickering / PWM not detected | 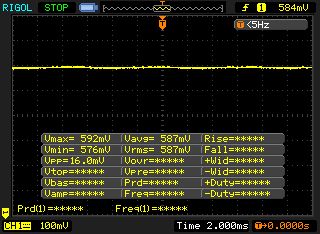 | ||
In comparison: 52 % of all tested devices do not use PWM to dim the display. If PWM was detected, an average of 7747 (minimum: 5 - maximum: 343500) Hz was measured. | |||
Performance - The devil is in the details
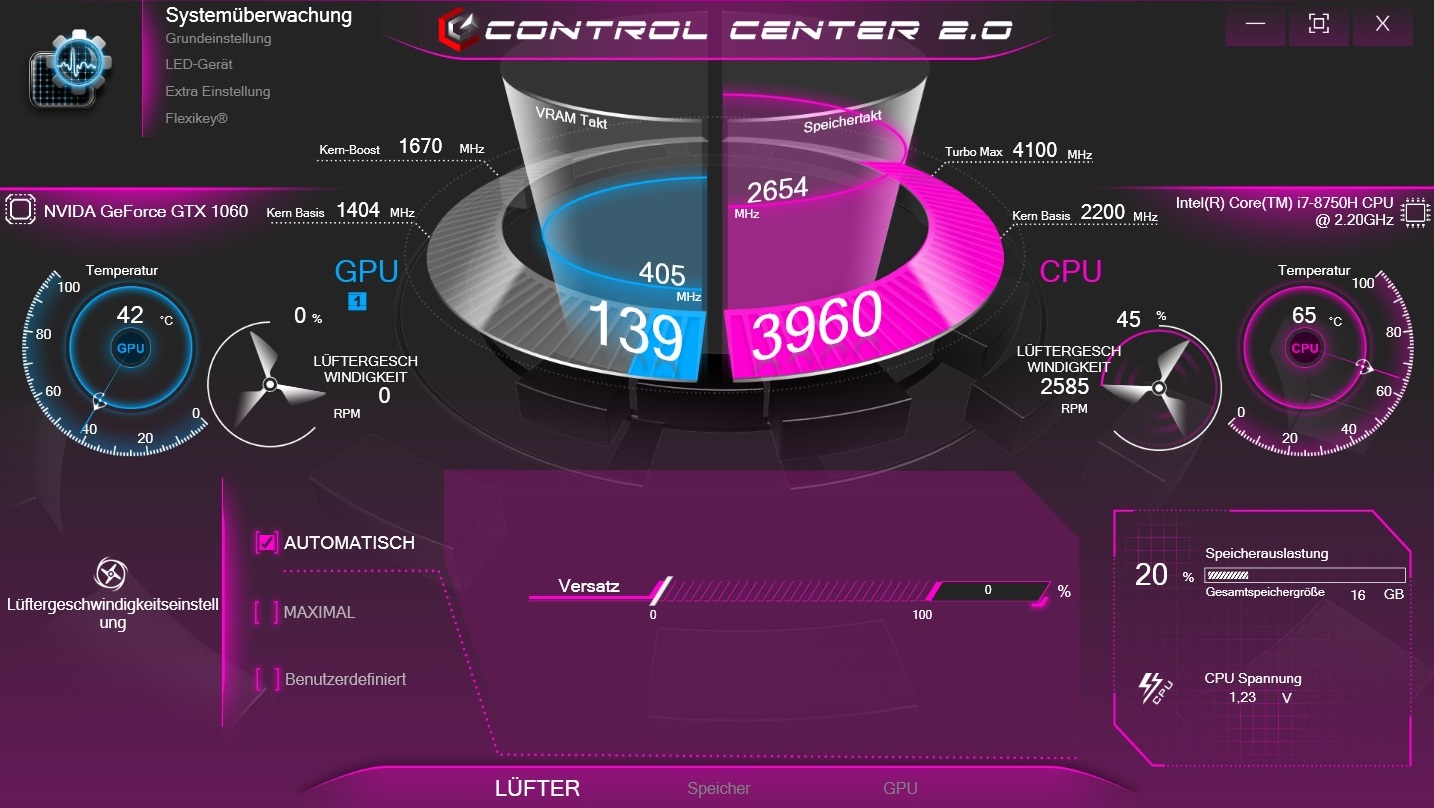
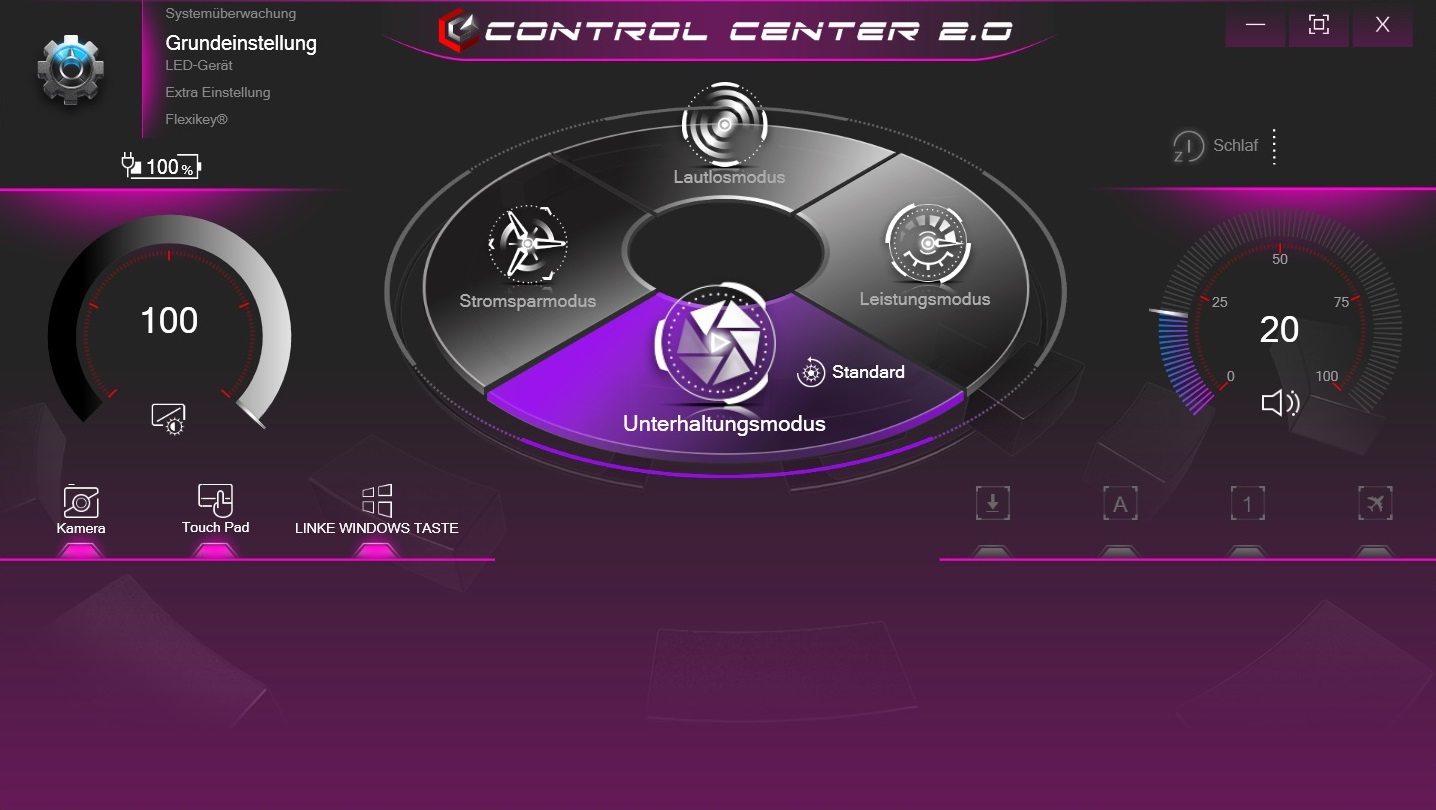
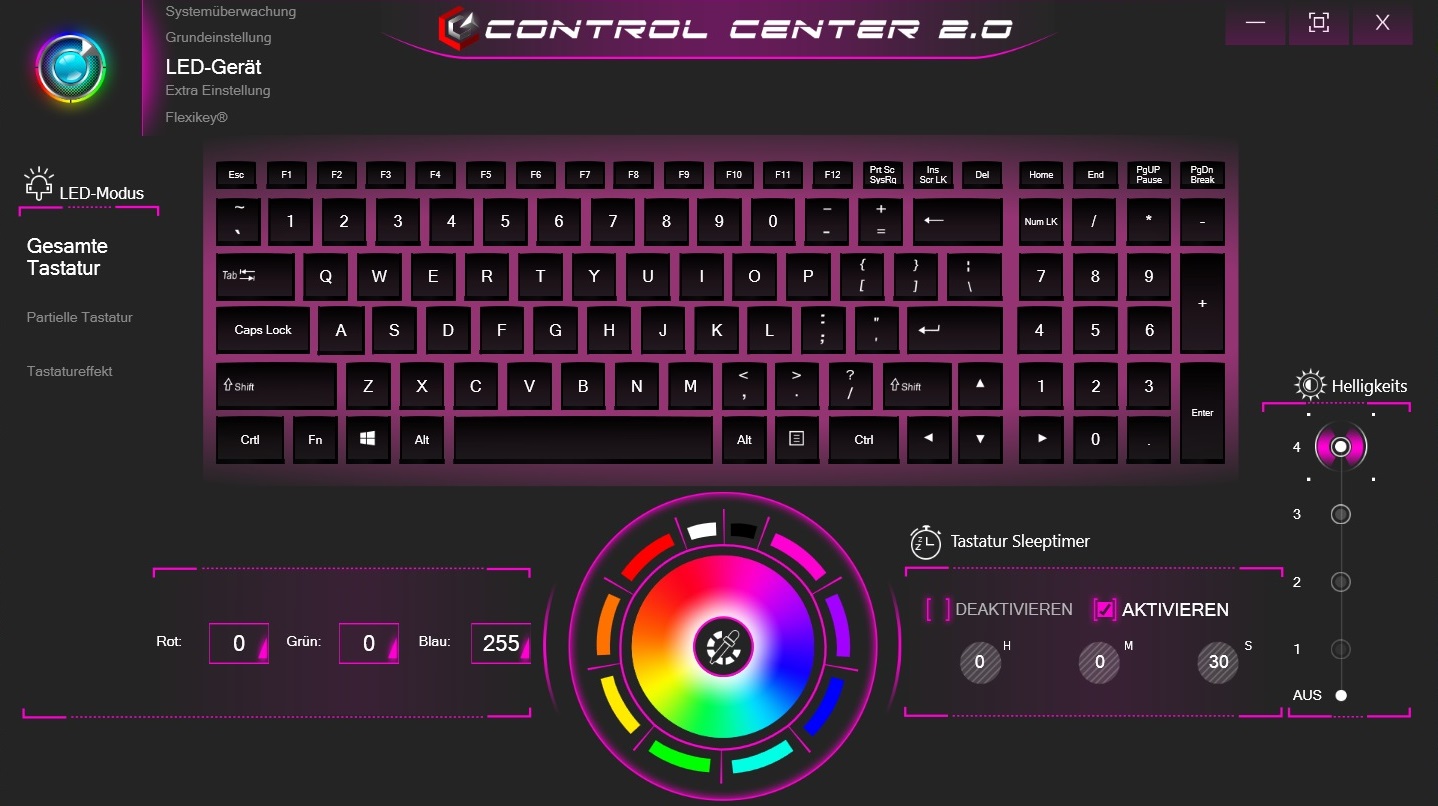
In contrast to the case, the insides and the software have in parts been tuned significantly. Most prominent is probably the change in the Control Center, the central settings app of the XMG A517. It not only has changed visually but also offers more features and functions now. Similar to the predecessor, we ran the test in the Entertainment mode with the fan speed set to Automatic.
Processor
Even though computer games have not profited much from more than four CPU cores until now, Intel takes a big step forward with the Coffee-Lake architecture.
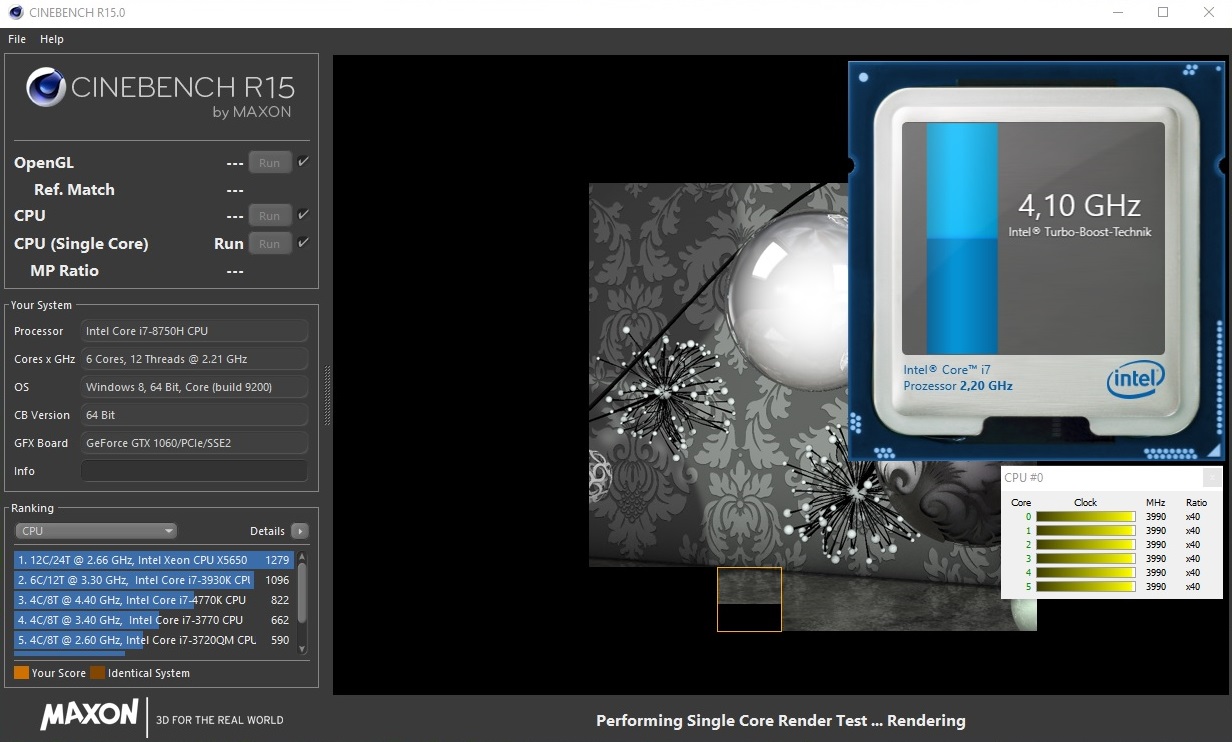
The best example is the comparison between the Core i7-7700HQ and the Core i7-8750H. While the old XMG A517 "only" achieved 710 points in the multi-core test of Cinebench R15, the successor achieves a full 1176 points, which is 66% more. On one hand, this is due to the higher number of cores and on the other, to the higher clock speed. Instead of a maximum of 3.4 GHz, the Core i7-8750H achieves up to 3.9 GHz while loading all cores.
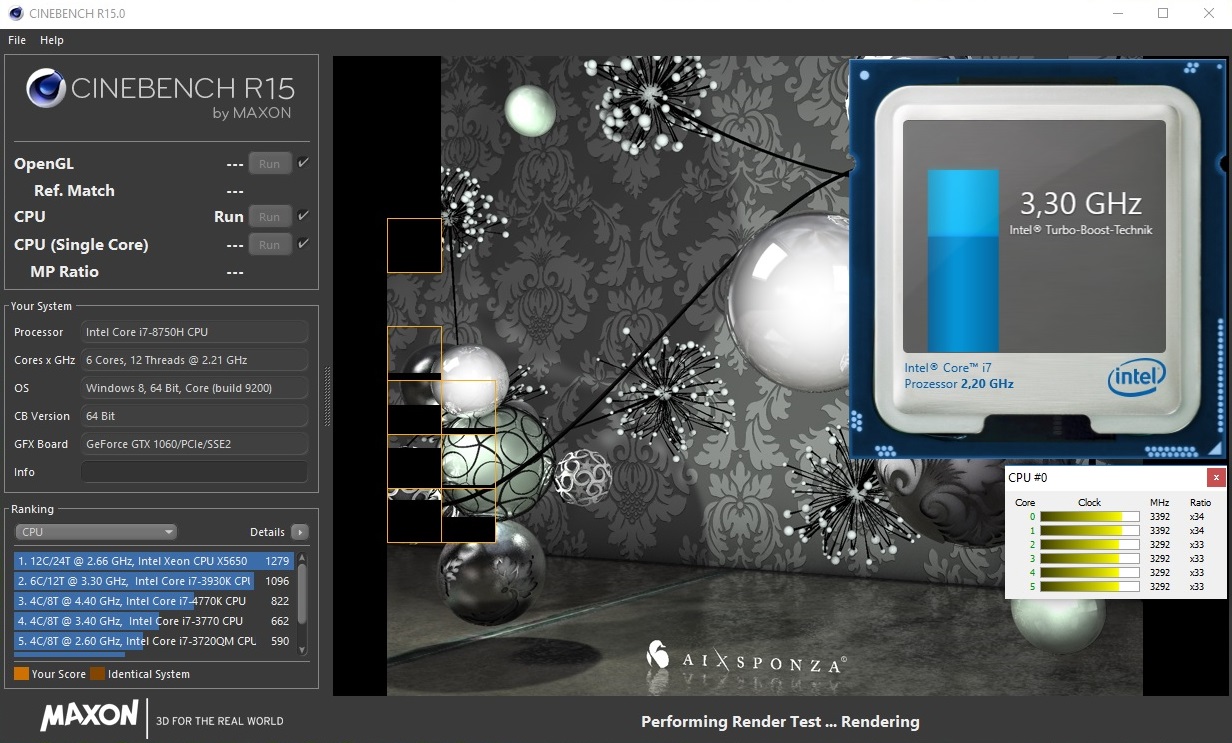
Unfortunately, the CPU is unable to maintain its Turbo speed over longer periods. Already in the first run of our Cinebench loop, the clock speed varies between 3.5 and 3.9 GHz, and it finally drops to an average of 3.3 GHz towards the end, which was also often the case in the Coffee-Lake notebooks we have tested so far. Some devices even directly show a worse performance, as the chart on top shows.
System Performance
The system performance fulfills the expectations to a large extent. The XMG A517 could boot a little faster in light of the SSD, but otherwise the notebook responds pleasantly fast. This subjective impression is confirmed by the benchmark tests. In PCMark 8 as well as in PCMark 10, the 15-incher does not break ranks but remains at the level of the competitors.
| PCMark 10 - Score | |
| Average of class Gaming (5828 - 11730, n=92, last 2 years) | |
| Eurocom Q6 | |
| Asus ROG GU501GM-BI7N8 | |
| Schenker XMG A517 Coffee Lake | |
| Schenker XMG A517 | |
| PCMark 8 Home Score Accelerated v2 | 4523 points | |
| PCMark 8 Work Score Accelerated v2 | 5697 points | |
| PCMark 10 Score | 5019 points | |
Help | ||
Storage Solution
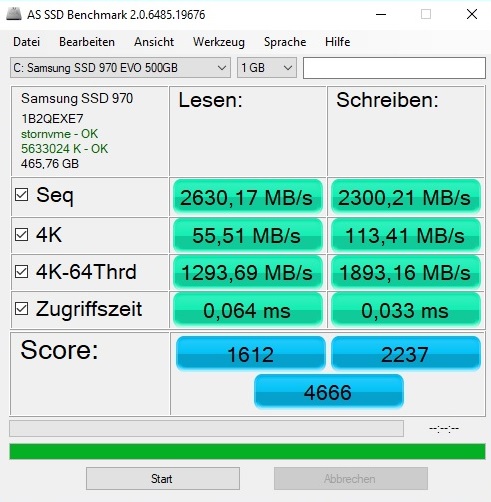
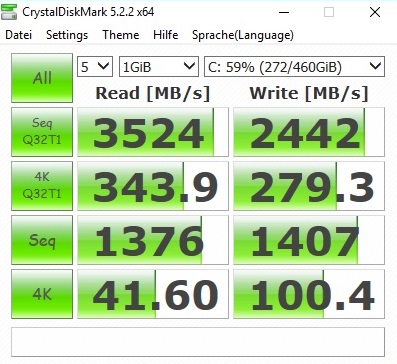
Anyone often working with large amounts of data should choose an NVMe-SSD during the purchase. The Samsung 970 EVO built into our test unit is a particularly fast example that wipes the floor with other SSDs, so to speak. More than 2000 MB/s during sequential reads and writes (AS SSD benchmark) are excellent values which initially make us think of a RAID system. In addition to the M.2 slot, there is also a classical 2.5-inch slot to expand the storage.
| Schenker XMG A517 Coffee Lake Samsung SSD 970 EVO 500GB | Schenker XMG A517 Samsung SSD 960 Evo 500GB m.2 NVMe | Asus ROG GU501GM-BI7N8 Kingston RBUSNS8154P3128GJ | MSI GP63 Leopard 8RE-013US Samsung PM871b MZNLN128HAHQ | Eurocom Q6 Samsung SSD 960 Pro 512 GB m.2 | |
|---|---|---|---|---|---|
| AS SSD | -7% | -70% | -74% | -19% | |
| Seq Read (MB/s) | 2630 | 2694 2% | 841 -68% | 504 -81% | 2523 -4% |
| Seq Write (MB/s) | 2300 | 1662 -28% | 404.7 -82% | 462.9 -80% | 1943 -16% |
| 4K Read (MB/s) | 55.5 | 48 -14% | 22.62 -59% | 21.88 -61% | 29.62 -47% |
| 4K Write (MB/s) | 113.4 | 147 30% | 67.1 -41% | 60.8 -46% | 96.2 -15% |
| Score Read (Points) | 1612 | 1677 4% | 377 -77% | 325 -80% | 1477 -8% |
| Score Write (Points) | 2237 | 1575 -30% | 345 -85% | 245 -89% | 1693 -24% |
| Score Total (Points) | 4666 | 4063 -13% | 900 -81% | 742 -84% | 3894 -17% |

Graphics Card
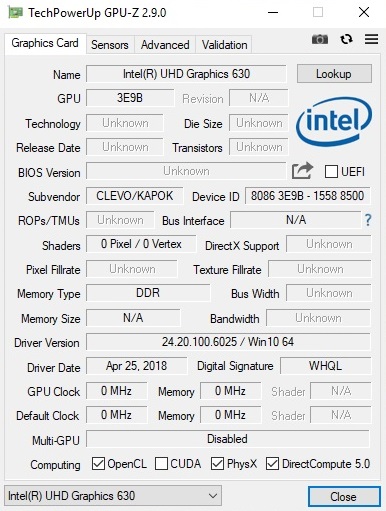
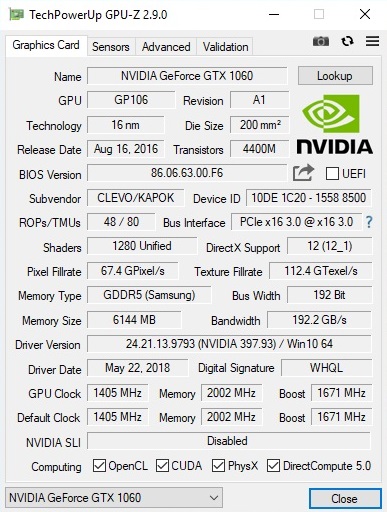
While simple tasks in the office, video, and web areas are handled by the GPU integrated into the processor (Intel UHD Graphics 630), Nvidia's high-end GeForce GTX 1060 chip takes care of demanding 3D programs. The DirectX-12 model from the Pascal series brings 6 GB of GDDR5-VRAM and is the perfect companion for 1920x1080 pixels.
| 3DMark - 1920x1080 Fire Strike Graphics | |
| Average of class Gaming (12242 - 62849, n=114, last 2 years) | |
| Eurocom Q6 | |
| MSI GP63 Leopard 8RE-013US | |
| Schenker XMG A517 Coffee Lake | |
| Asus ROG GU501GM-BI7N8 | |
| Schenker XMG A517 | |
In the benchmarks, the performance of the XMG A517 settles on the level of other GTX-1060 notebooks, be it in 3DMark 11 or the Fire-Strike test of 3DMark 13. The disadvantage to the more expensive GeForce GTX 1070 Max-Q is about 20%.
| 3DMark 11 Performance | 13684 points | |
| 3DMark Cloud Gate Standard Score | 33942 points | |
| 3DMark Fire Strike Score | 10451 points | |
Help | ||
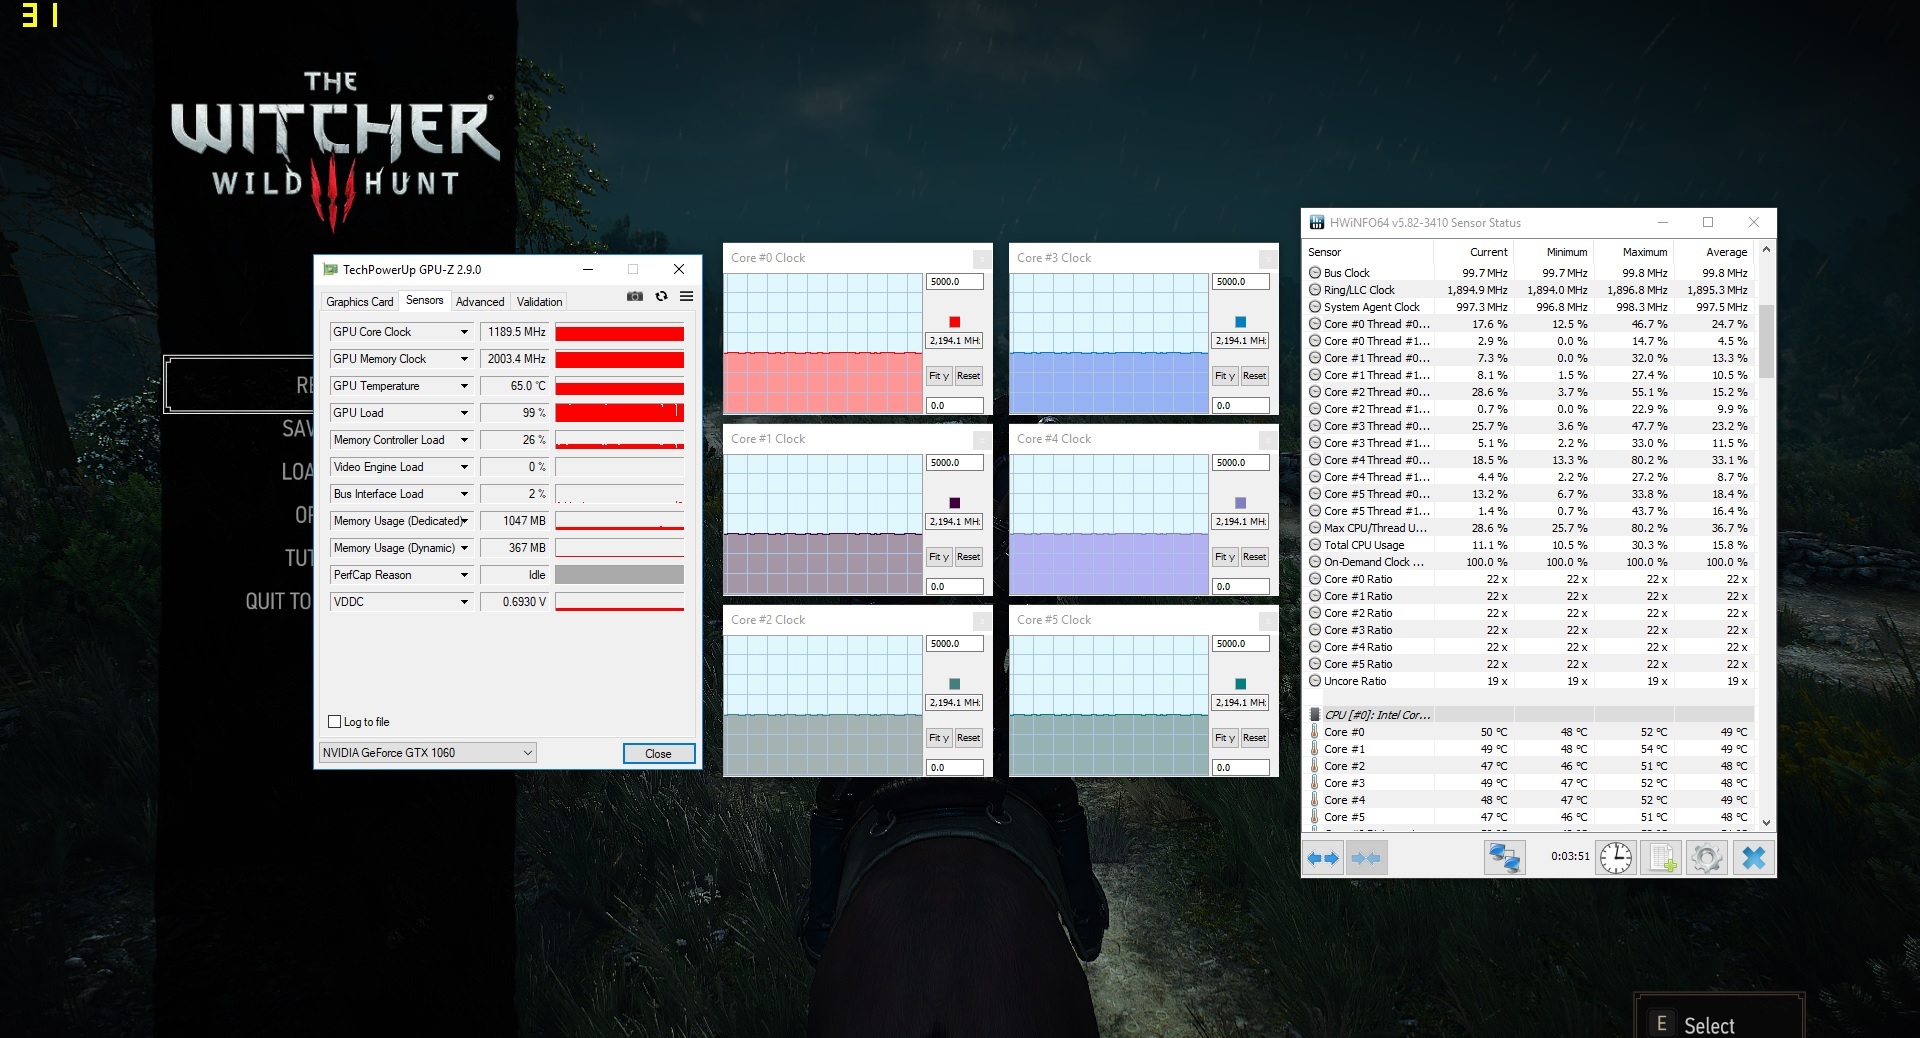
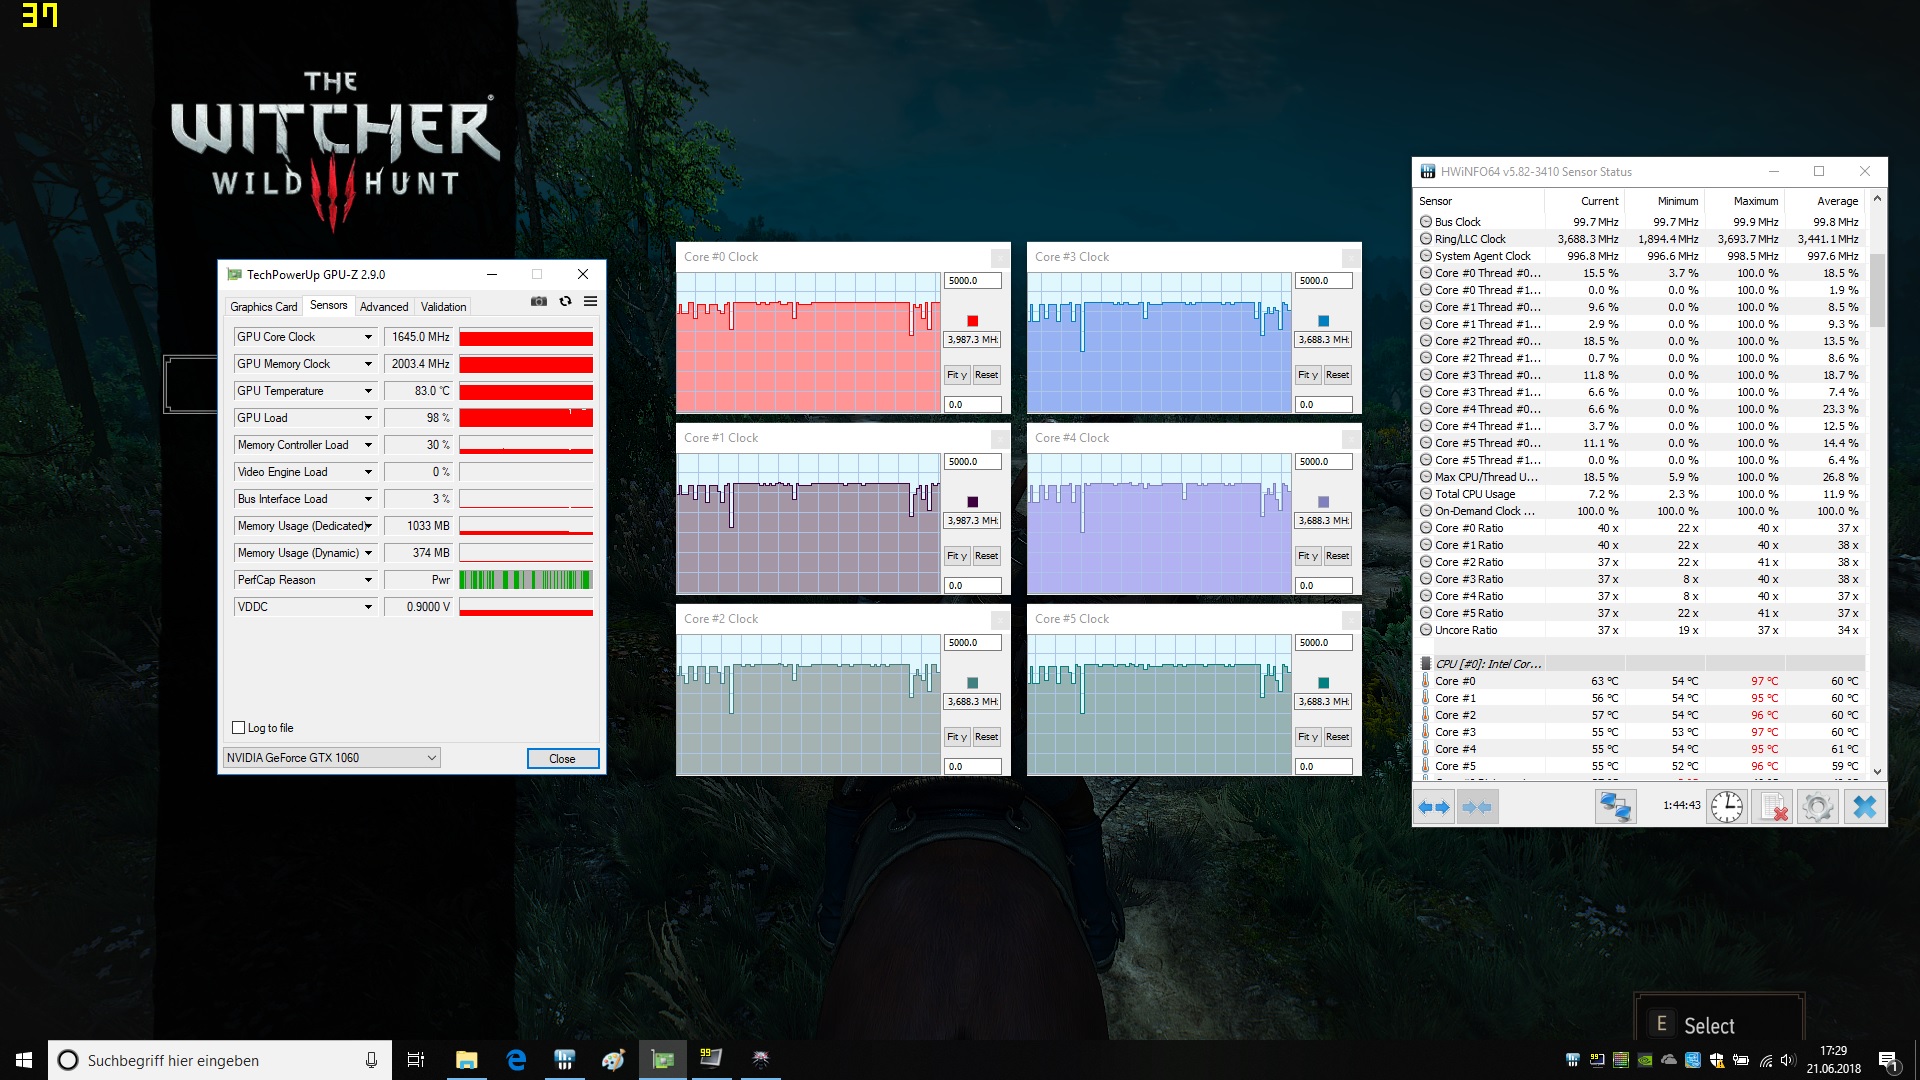
With the help of The Witcher 3 (60 minutes @ Full HD/Ultra), we tested whether the graphics card can maintain its performance over a longer period of time. Unfortunately, as in the Key 15, there was an unpleasant surprise. Despite moderate temperatures, the CPU deactivated its Turbo, so that the Core i7-8750H only ran at its base core speed (2.2 GHz). The GPU got hit even worse, being throttled even below its base speed (1190 instead of 1405 MHz). Such a thing should not occur in a gaming notebook.
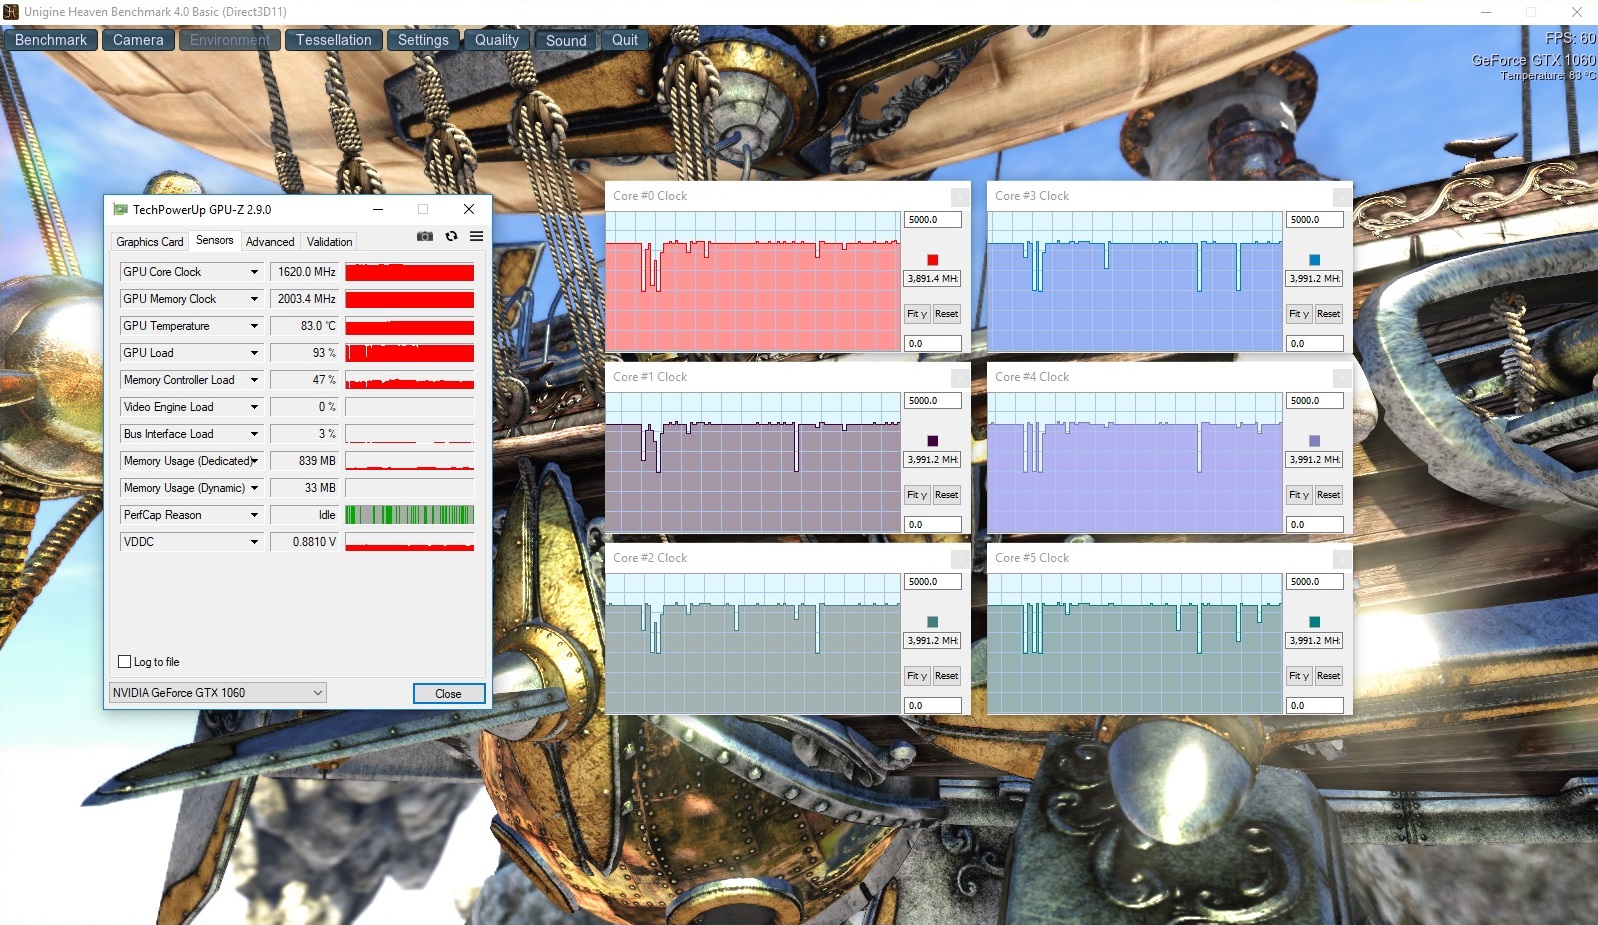
Apart from 3DMark06 and the stress test, no other applications or games were affected by throttling (for example in the Unigine Heaven 4.0 benchmark the GTX 1060 had a clock speed of about 1620 MHz), so we assume that this is a bug. However, in its current state the XMG A517 has to still accept a corresponding lowering of the evaluation in the 3D performance.
Update 06/23/18: after much fiddling around we were able to discover that the Control Center was the culprit behind our GPU throttling issues. Killing the program via task manager immediately restores regular behavior of our GeForce GTX 1060. In "The Witcher 3", the GPU ran with enabled turbo boost at around 1,645 MHz, as can be seen in the graphs and screenshots. Given that we saw the same behavior on the Key 15 and the XMG A707 (currently in review) this particular bug seems to be affecting all Clevo barebones with preloaded Control Center.
Gaming Performance
As already indicated, the GTX 1060 has no problems with the native Full HD resolution. High and maximum settings ran smoothly in all the tested games. Anyone who connects a WQHD panel (2560x1440 pixels) should in most cases also be satisfied with the frame rates.
| The Witcher 3 - 1920x1080 Ultra Graphics & Postprocessing (HBAO+) | |
| Average of class Gaming (104.7 - 240, n=6, last 2 years) | |
| Eurocom Q6 | |
| MSI GP63 Leopard 8RE-013US | |
| Schenker XMG A517 | |
| Asus ROG GU501GM-BI7N8 | |
| Schenker XMG A517 Coffee Lake | |
| Schenker XMG A517 Coffee Lake | |
| low | med. | high | ultra | |
|---|---|---|---|---|
| The Witcher 3 (2015) | 70 | 37.8 | ||
| FIFA 18 (2017) | 250 | 247 | ||
| Wolfenstein II: The New Colossus (2017) | 83.4 | 76.3 | ||
| Call of Duty WWII (2017) | 96.3 | 70.5 | ||
| Need for Speed Payback (2017) | 84.8 | 77 | ||
| Star Wars Battlefront 2 (2017) | 74.3 | 62 | ||
| Fortnite (2018) | 114 | 81.2 | ||
| Far Cry 5 (2018) | 69 | 65 |
Emissions - On the level of the competition
Noise Emissions
The fan control has always been one of the biggest weaknesses of the Clevo barebones. In terms of the fan behavior, the N850EP6 case can hardly convince here either. Granted that at a maximum of 51 dB under load, the 15-inch notebook does not run any louder than the competitors from Asus, MSI, and Eurocom, there is room for improvement in the idle mode. Instead of remaining at a constant level, the fans are either almost quiet or intermittently rev up to a high speed, which will annoy some users.
This behavior is typical for Clevo cases, and the cooling often makes a lot of noise even during small to medium tasks (Windows updates, starting up programs, installations, etc.). Fortunately, the situation is more relaxed in battery operation. Tuning the power settings can also alleviate the issue, or you can just use the manual fan control.
Noise level
| Idle |
| 30 / 31 / 42 dB(A) |
| Load |
| 45 / 51 dB(A) |
 | ||
30 dB silent 40 dB(A) audible 50 dB(A) loud |
||
min: | ||
| Schenker XMG A517 Coffee Lake i7-8750H, GeForce GTX 1060 Mobile | Schenker XMG A517 i7-7700HQ, GeForce GTX 1060 Mobile | Asus ROG GU501GM-BI7N8 i7-8750H, GeForce GTX 1060 Mobile | MSI GP63 Leopard 8RE-013US i7-8750H, GeForce GTX 1060 Mobile | Eurocom Q6 i7-8750H, GeForce GTX 1070 Max-Q | Average of class Gaming | |
|---|---|---|---|---|---|---|
| Noise | 1% | 2% | 3% | 6% | 12% | |
| off / environment * (dB) | 30 | 30 -0% | 28.6 5% | 28.4 5% | 28.3 6% | 24.1 ? 20% |
| Idle Minimum * (dB) | 30 | 30 -0% | 31.4 -5% | 32.8 -9% | 30.4 -1% | 25.9 ? 14% |
| Idle Average * (dB) | 31 | 35 -13% | 31.4 -1% | 32.8 -6% | 30.5 2% | 27.4 ? 12% |
| Idle Maximum * (dB) | 42 | 40 5% | 34.2 19% | 33 21% | 33.3 21% | 30.1 ? 28% |
| Load Average * (dB) | 45 | 43 4% | 42.8 5% | 35.8 20% | 42.3 6% | 43.6 ? 3% |
| Witcher 3 ultra * (dB) | 48 | 43 10% | 50.9 -6% | 51 -6% | 43.3 10% | |
| Load Maximum * (dB) | 51 | 49 4% | 50.9 -0% | 52.3 -3% | 50.8 -0% | 54.2 ? -6% |
* ... smaller is better
Temperature
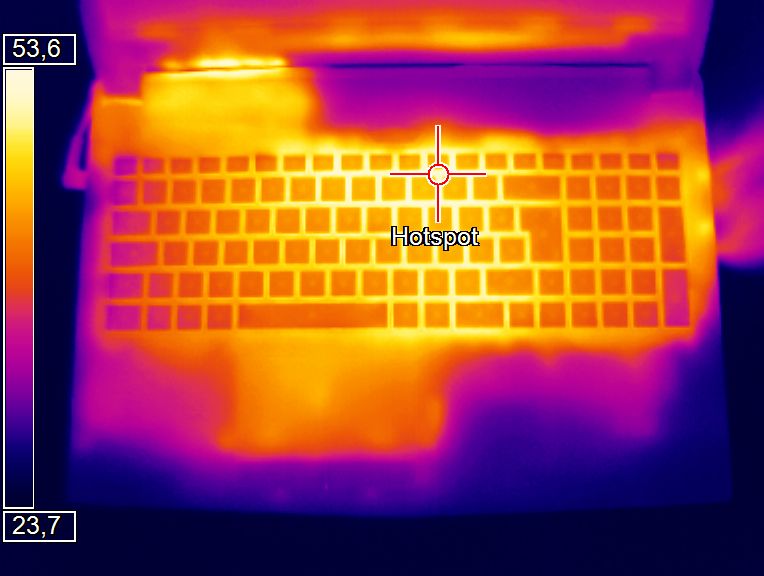
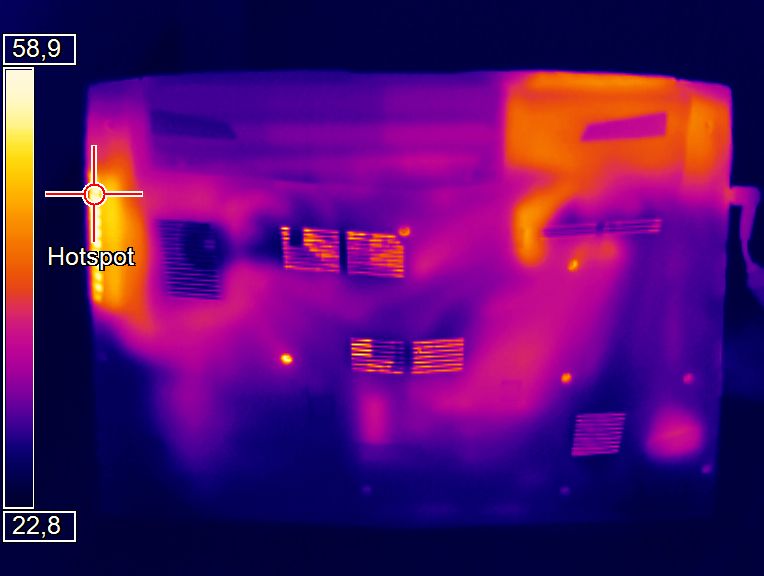
Due to the GPU throttling and the inactive CPU Turbo, our test unit did not get particularly hot in the load scenarios. A maximum of 47 °C (117 °F) on the top and bottom are no reason for complaint. However, the palm rests could have stayed a bit cooler for our tastes.
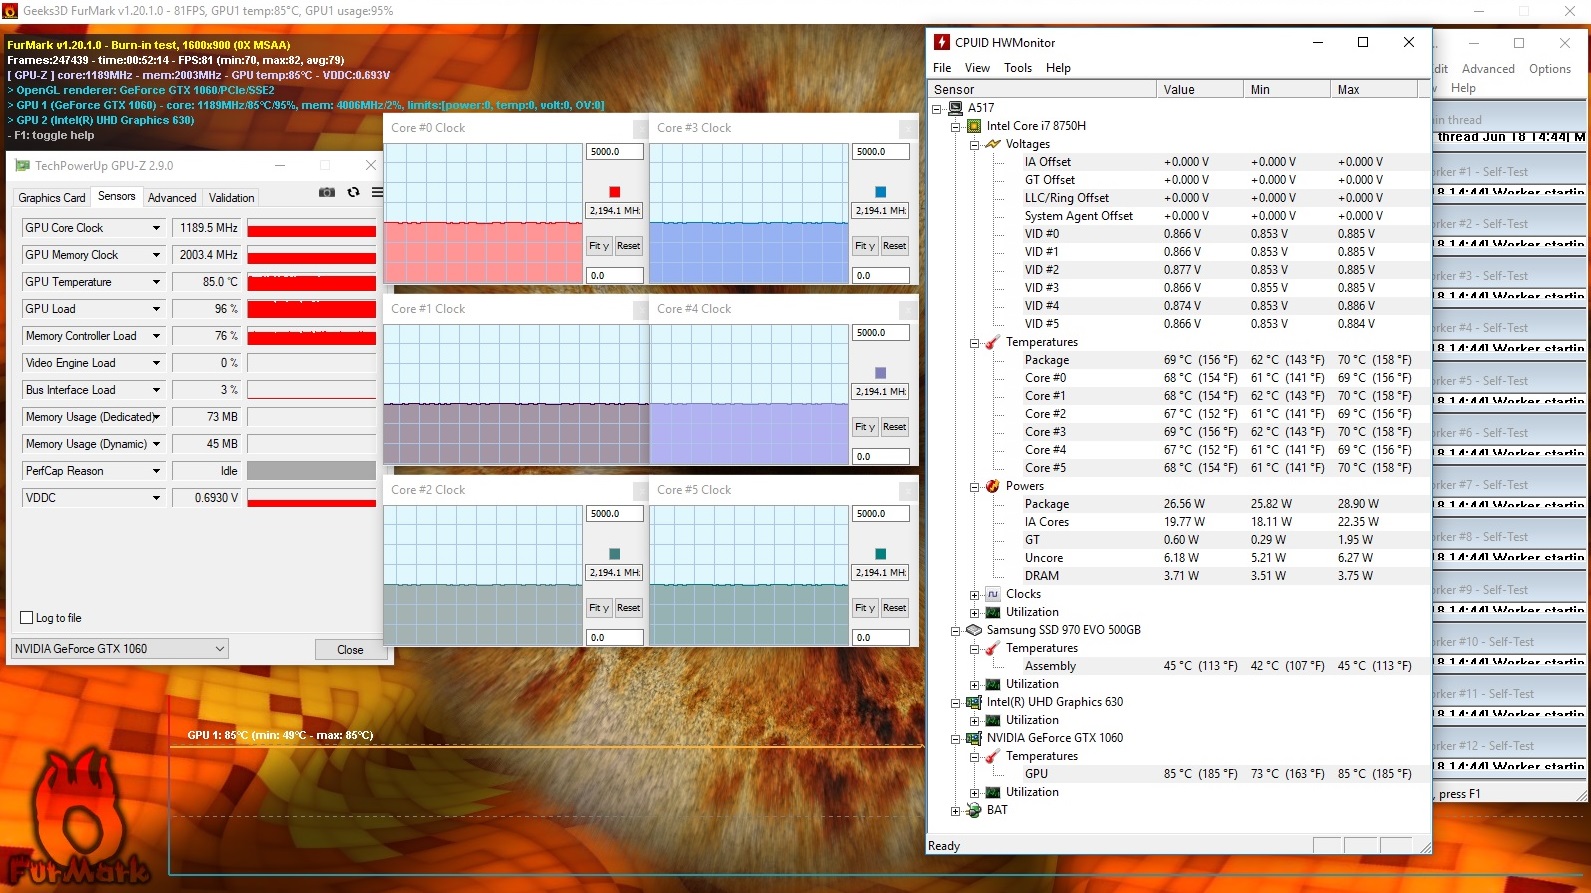
The temperature development of the components is also limited by the throttling. Even 60 minutes of the stress test with the Furmark and Prime95 tools was only able to heat up the Core i7-8750H to 70 °C (158 °F). The GeForce GTX 1060 heated up to 85 °C (185 °F).
(-) The maximum temperature on the upper side is 47 °C / 117 F, compared to the average of 40.4 °C / 105 F, ranging from 21.2 to 68.8 °C for the class Gaming.
(-) The bottom heats up to a maximum of 47 °C / 117 F, compared to the average of 43.2 °C / 110 F
(+) In idle usage, the average temperature for the upper side is 28 °C / 82 F, compared to the device average of 33.9 °C / 93 F.
(-) Playing The Witcher 3, the average temperature for the upper side is 42.7 °C / 109 F, compared to the device average of 33.9 °C / 93 F.
(-) The palmrests and touchpad can get very hot to the touch with a maximum of 44 °C / 111.2 F.
(-) The average temperature of the palmrest area of similar devices was 28.8 °C / 83.8 F (-15.2 °C / -27.4 F).
| Schenker XMG A517 Coffee Lake i7-8750H, GeForce GTX 1060 Mobile | Schenker XMG A517 i7-7700HQ, GeForce GTX 1060 Mobile | Asus ROG GU501GM-BI7N8 i7-8750H, GeForce GTX 1060 Mobile | MSI GP63 Leopard 8RE-013US i7-8750H, GeForce GTX 1060 Mobile | Eurocom Q6 i7-8750H, GeForce GTX 1070 Max-Q | Average of class Gaming | |
|---|---|---|---|---|---|---|
| Heat | -2% | 5% | 5% | -5% | 1% | |
| Maximum Upper Side * (°C) | 47 | 53 -13% | 43 9% | 42.2 10% | 49 -4% | 45.2 ? 4% |
| Maximum Bottom * (°C) | 47 | 49 -4% | 46.6 1% | 47.8 -2% | 53 -13% | 48.2 ? -3% |
| Idle Upper Side * (°C) | 32 | 33 -3% | 29.2 9% | 29.6 7% | 32.4 -1% | 31 ? 3% |
| Idle Bottom * (°C) | 34 | 30 12% | 34 -0% | 32.6 4% | 34 -0% | 34.3 ? -1% |
* ... smaller is better
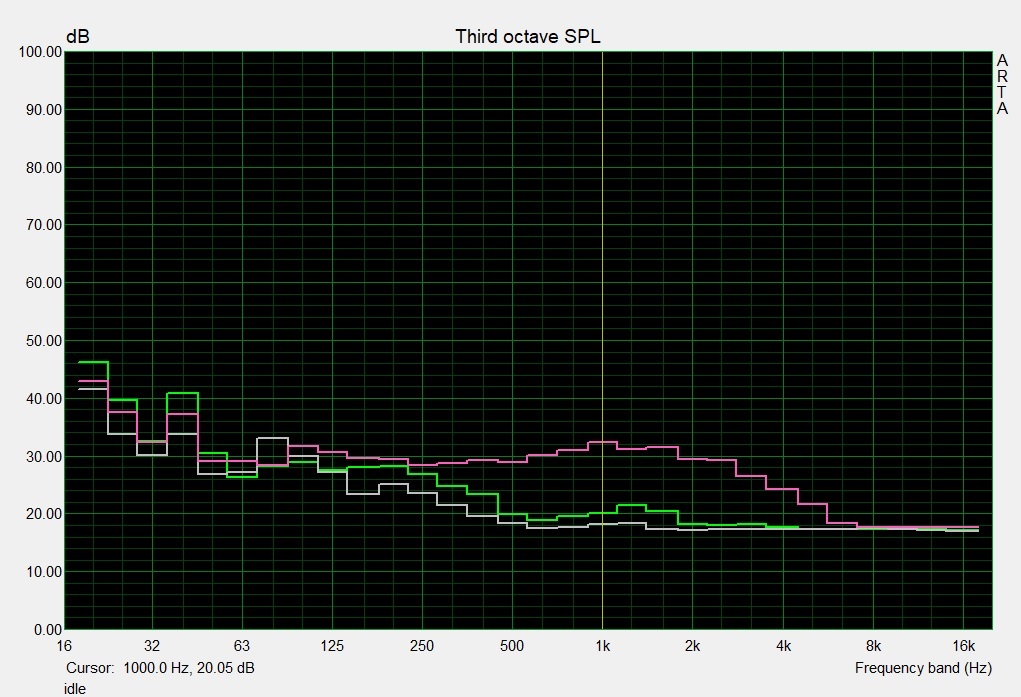
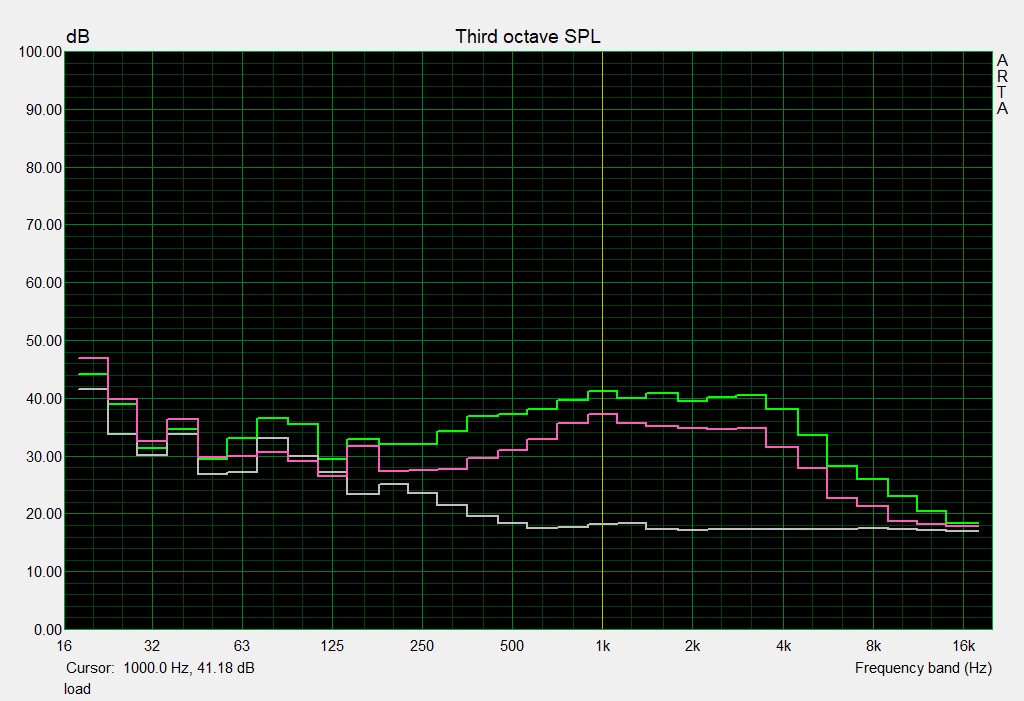
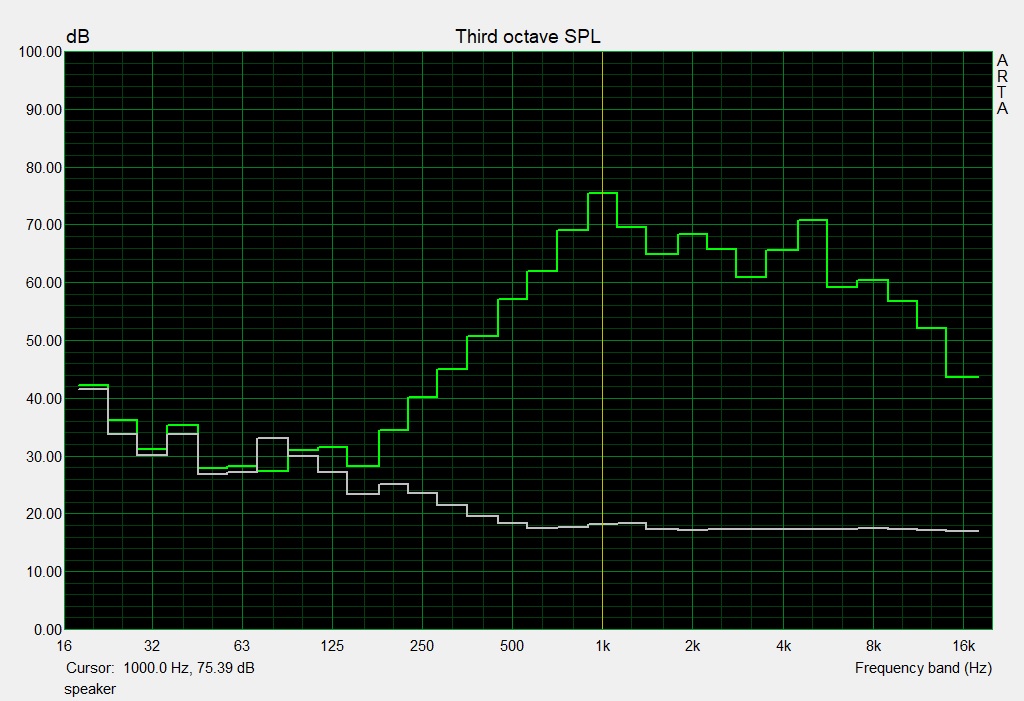
Speakers
Schenker XMG A517 Coffee Lake audio analysis
(±) | speaker loudness is average but good (80 dB)
Bass 100 - 315 Hz
(-) | nearly no bass - on average 24.1% lower than median
(±) | linearity of bass is average (9.7% delta to prev. frequency)
Mids 400 - 2000 Hz
(±) | higher mids - on average 8.1% higher than median
(±) | linearity of mids is average (13.4% delta to prev. frequency)
Highs 2 - 16 kHz
(+) | balanced highs - only 4.3% away from median
(±) | linearity of highs is average (11.6% delta to prev. frequency)
Overall 100 - 16.000 Hz
(±) | linearity of overall sound is average (28.7% difference to median)
Compared to same class
» 95% of all tested devices in this class were better, 1% similar, 4% worse
» The best had a delta of 6%, average was 18%, worst was 132%
Compared to all devices tested
» 86% of all tested devices were better, 3% similar, 11% worse
» The best had a delta of 4%, average was 23%, worst was 134%
Asus ROG GU501GM-BI7N8 audio analysis
(±) | speaker loudness is average but good (74.3 dB)
Bass 100 - 315 Hz
(+) | good bass - only 3.8% away from median
(±) | linearity of bass is average (10.3% delta to prev. frequency)
Mids 400 - 2000 Hz
(+) | balanced mids - only 2.3% away from median
(+) | mids are linear (5.1% delta to prev. frequency)
Highs 2 - 16 kHz
(+) | balanced highs - only 4.6% away from median
(+) | highs are linear (6.8% delta to prev. frequency)
Overall 100 - 16.000 Hz
(+) | overall sound is linear (12.6% difference to median)
Compared to same class
» 16% of all tested devices in this class were better, 4% similar, 81% worse
» The best had a delta of 6%, average was 18%, worst was 132%
Compared to all devices tested
» 11% of all tested devices were better, 3% similar, 86% worse
» The best had a delta of 4%, average was 23%, worst was 134%
Power Management - Optimus instead of G-Sync
Power Consumption
During idle mode, the power consumption is inconspicuous. Thanks to Nvidia's Optimus technology, the 15-incher only uses 12-23 watts, which is almost equivalent to the values of the Eurocom Q6 and the Asus GU501GM. Due to throttling, the values are not comparable with the competition under load anymore.
| Off / Standby | |
| Idle | |
| Load |
|
Key:
min: | |
| Schenker XMG A517 Coffee Lake i7-8750H, GeForce GTX 1060 Mobile | Schenker XMG A517 i7-7700HQ, GeForce GTX 1060 Mobile | Asus ROG GU501GM-BI7N8 i7-8750H, GeForce GTX 1060 Mobile | MSI GP63 Leopard 8RE-013US i7-8750H, GeForce GTX 1060 Mobile | Eurocom Q6 i7-8750H, GeForce GTX 1070 Max-Q | Average of class Gaming | |
|---|---|---|---|---|---|---|
| Power Consumption | 4% | -13% | 3% | -8% | -28% | |
| Idle Minimum * (Watt) | 12 | 8 33% | 12.35 -3% | 7.99 33% | 11.6 3% | 13 ? -8% |
| Idle Average * (Watt) | 16 | 12 25% | 19.98 -25% | 12.15 24% | 16.3 -2% | 18.7 ? -17% |
| Idle Maximum * (Watt) | 23 | 25 -9% | 25.44 -11% | 13.4 42% | 21.5 7% | 24.3 ? -6% |
| Load Average * (Watt) | 64 | 85 -33% | 94.28 -47% | 103.62 -62% | 100.7 -57% | 110.2 ? -72% |
| Witcher 3 ultra * (Watt) | 117 | 110 6% | 132.9 -14% | 156.1 -33% | 140.1 -20% | |
| Load Maximum * (Watt) | 188 | 180 4% | 140.63 25% | 164.29 13% | 150.3 20% | 258 ? -37% |
* ... smaller is better
Battery Life
Together with the graphics switching, the 62-Wh battery ensures a decent battery life. In our Wi-Fi test, which all notebooks undergo with reduced brightness, the XMG A517 lasted 4:41 hours. The devices from the competitors often have to make do with smaller batteries and a correspondingly shorter battery life.
| Schenker XMG A517 Coffee Lake i7-8750H, GeForce GTX 1060 Mobile, 62 Wh | Schenker XMG A517 i7-7700HQ, GeForce GTX 1060 Mobile, 62 Wh | Asus ROG GU501GM-BI7N8 i7-8750H, GeForce GTX 1060 Mobile, 55 Wh | MSI GP63 Leopard 8RE-013US i7-8750H, GeForce GTX 1060 Mobile, 51 Wh | Eurocom Q6 i7-8750H, GeForce GTX 1070 Max-Q, 55 Wh | Average of class Gaming | |
|---|---|---|---|---|---|---|
| Battery runtime | 13% | -30% | -4% | -20% | 31% | |
| Reader / Idle (h) | 5.7 | 7.5 32% | 4.5 -21% | 7.5 32% | 5.1 -11% | 8.71 ? 53% |
| WiFi v1.3 (h) | 4.7 | 5 6% | 4 -15% | 4.8 2% | 3.7 -21% | 7.15 ? 52% |
| Load (h) | 1.7 | 1.7 0% | 0.8 -53% | 0.9 -47% | 1.2 -29% | 1.502 ? -12% |
| H.264 (h) | 5.2 | 8.64 ? |
Verdict - A difficult case
Pros
Cons
The Schenker XMG A517 is currently not in an easy place. While the input devices, maintenance options, the connections, and the equipment know how to please, the sound and the quality of the case don't do justice to the purchase price.
The case feels very plastic-like (keyword: rattling noises) and shows some weaknesses in the workmanship and stability upon taking a closer look.
There is good and bad in the remaining categories as well. For example, the very responsive 144-Hz panel with stable viewing angles only makes up to a limited extent for the lack of performance. Regardless of whether it is a software bug or insufficient cooling, the quality assurance department should have caught the fact that the GPU throttles in some 3D game applications.
Without this flaw, the XMG A517 would be a decent gaming laptop and a serious alternative to the Asus ROG GU501GM and MSI GP63 8RE.
Update 06/23/18: with the Control Center deactivated, the GPU throttling issues all but disappeared. Apparently, there is a bug present in Clevo’s Control Center application that causes this behavior. See above for details.
Schenker XMG A517 Coffee Lake
- 07/07/2018 v6 (old)
Florian Glaser
Price comparison
