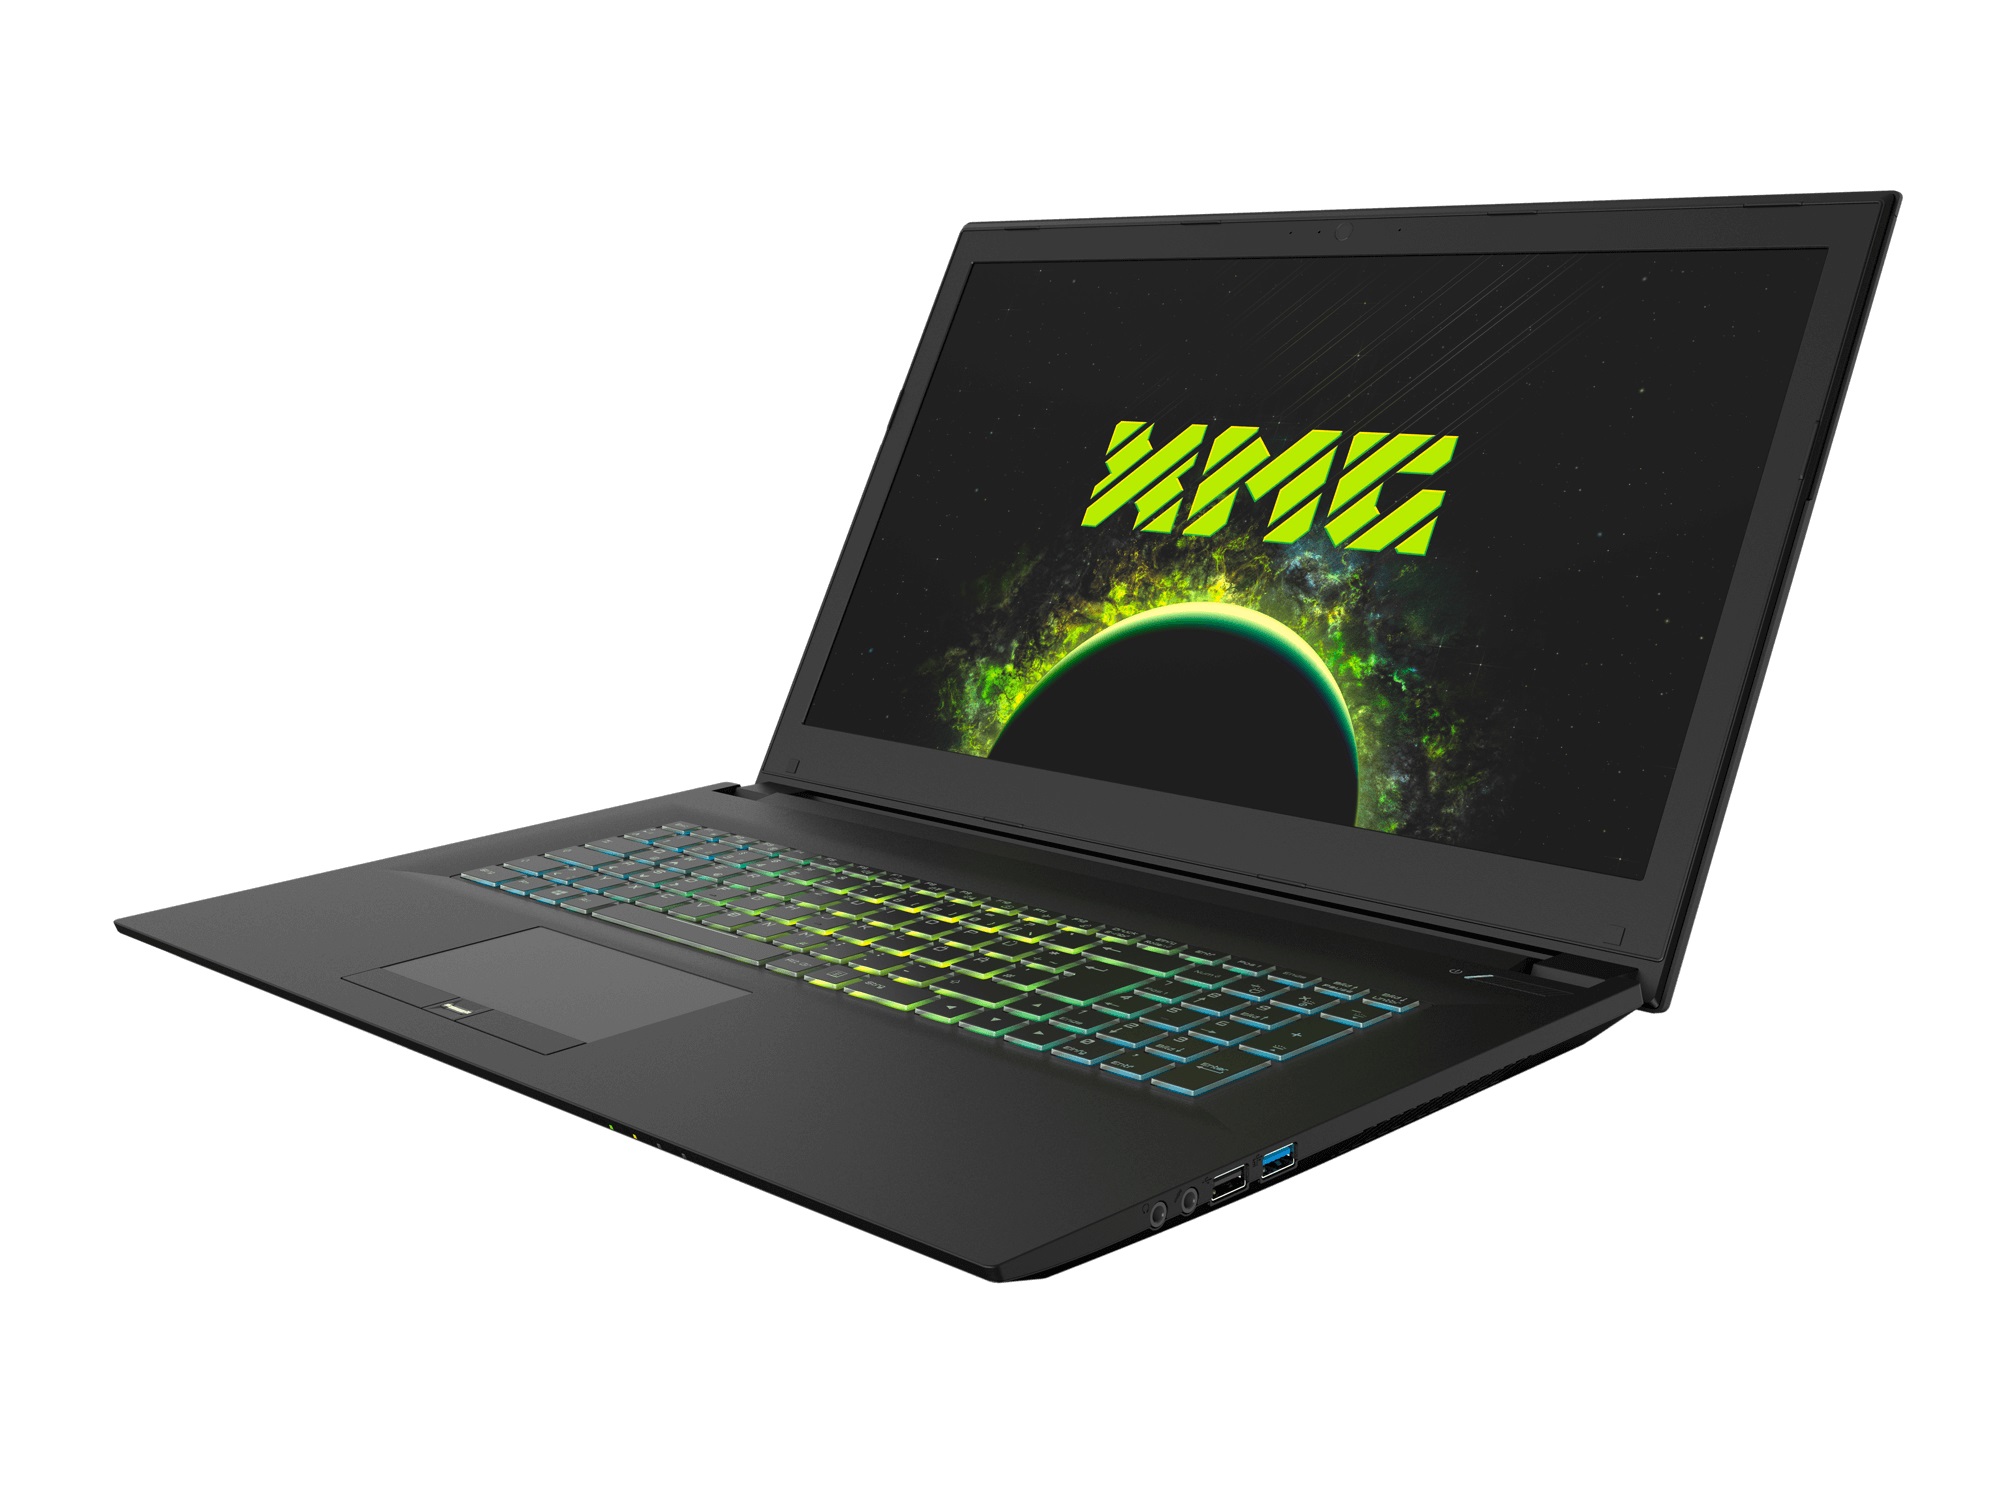
Schenker XMG A707 (Clevo N871EK1) Laptop Review

One of the Schenker laptop's strengths is the fact that its configuration can be freely customized. On the mysn.de homepage, the customization options available for the XMG A707 are quite comprehensive. Starting with the display, the user can choose between IPS technology (60 Hz) or TN technology (120 Hz). Both screens have a resolution of 1920x1080 pixels. Two options are listed for both the CPU and the GPU. Schenker Technologies gives the buyer a choice between the quad-core Core i5-8300H and the hexa-core Core i7-8750H—the latter of which is almost too powerful for either integrated graphics chip. Nvidia's GeForce GTX 1050 and GTX 1050 Ti Pascal models are (upper) mid-range GPUs.
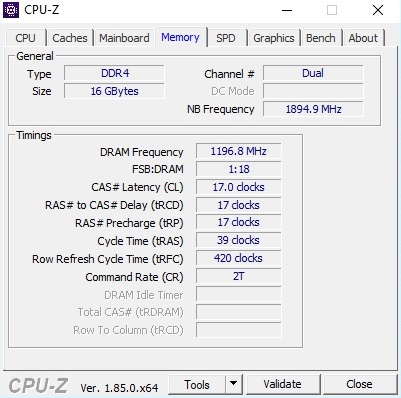
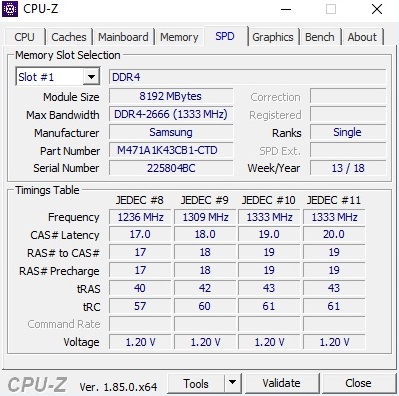
A considerably wider range of options is available in terms of RAM and storage solution. Up to 32 GB of DDR4 RAM, an M.2 SSD (PCIe or SATA III) and a 2.5-inch hard drive are tucked under the hood of the XMG A707. Schenker has also tailored the wireless module, keyboard language and operating system according to the customer's preference.
The device's pricing starts at 999 Euros (~$1175). Our configuration with a Core i7-8750H, GeForce GTX 1050 Ti, SSD-HDD combo (256 GB + 1 TB) and Windows 10 Home 64 Bit currently costs over 1400 Euros (~$1640). Some quite similar configurations are available at lower prices in popular online stores (see our price comparison at the end of this review).
The XMG A707's competition consists of other 17-inch gaming laptops with Coffee Lake CPUs and Pascal GPUs that cost less than 1500 Euros (~$1750), including the Acer Predator Helios 300 and the Asus ROG Strix GL703GE.
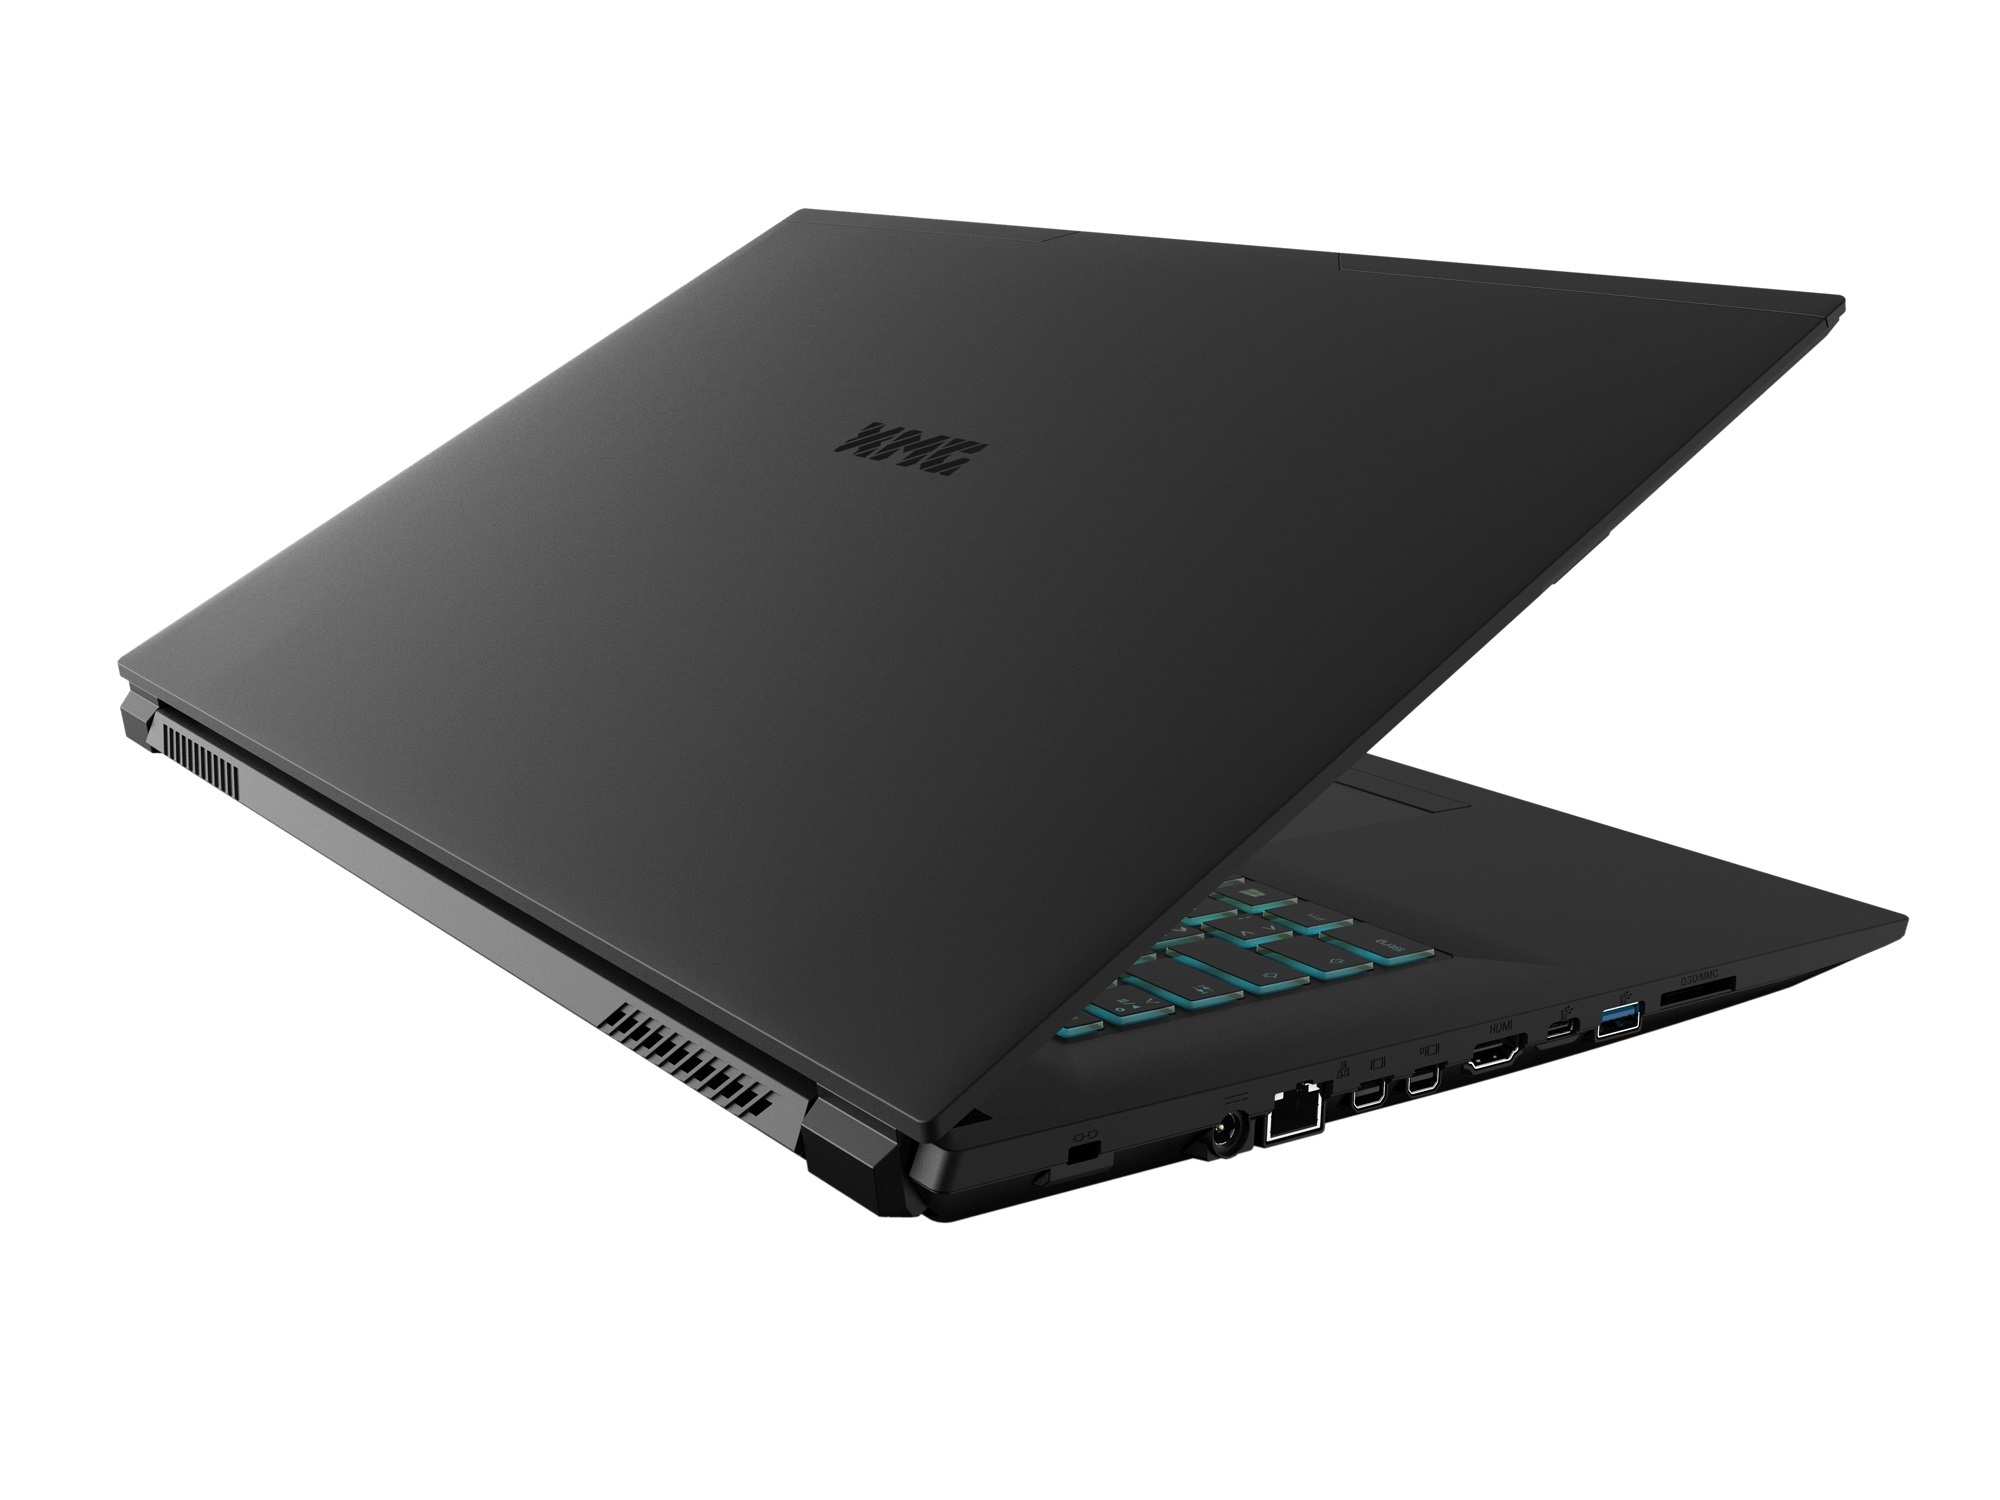
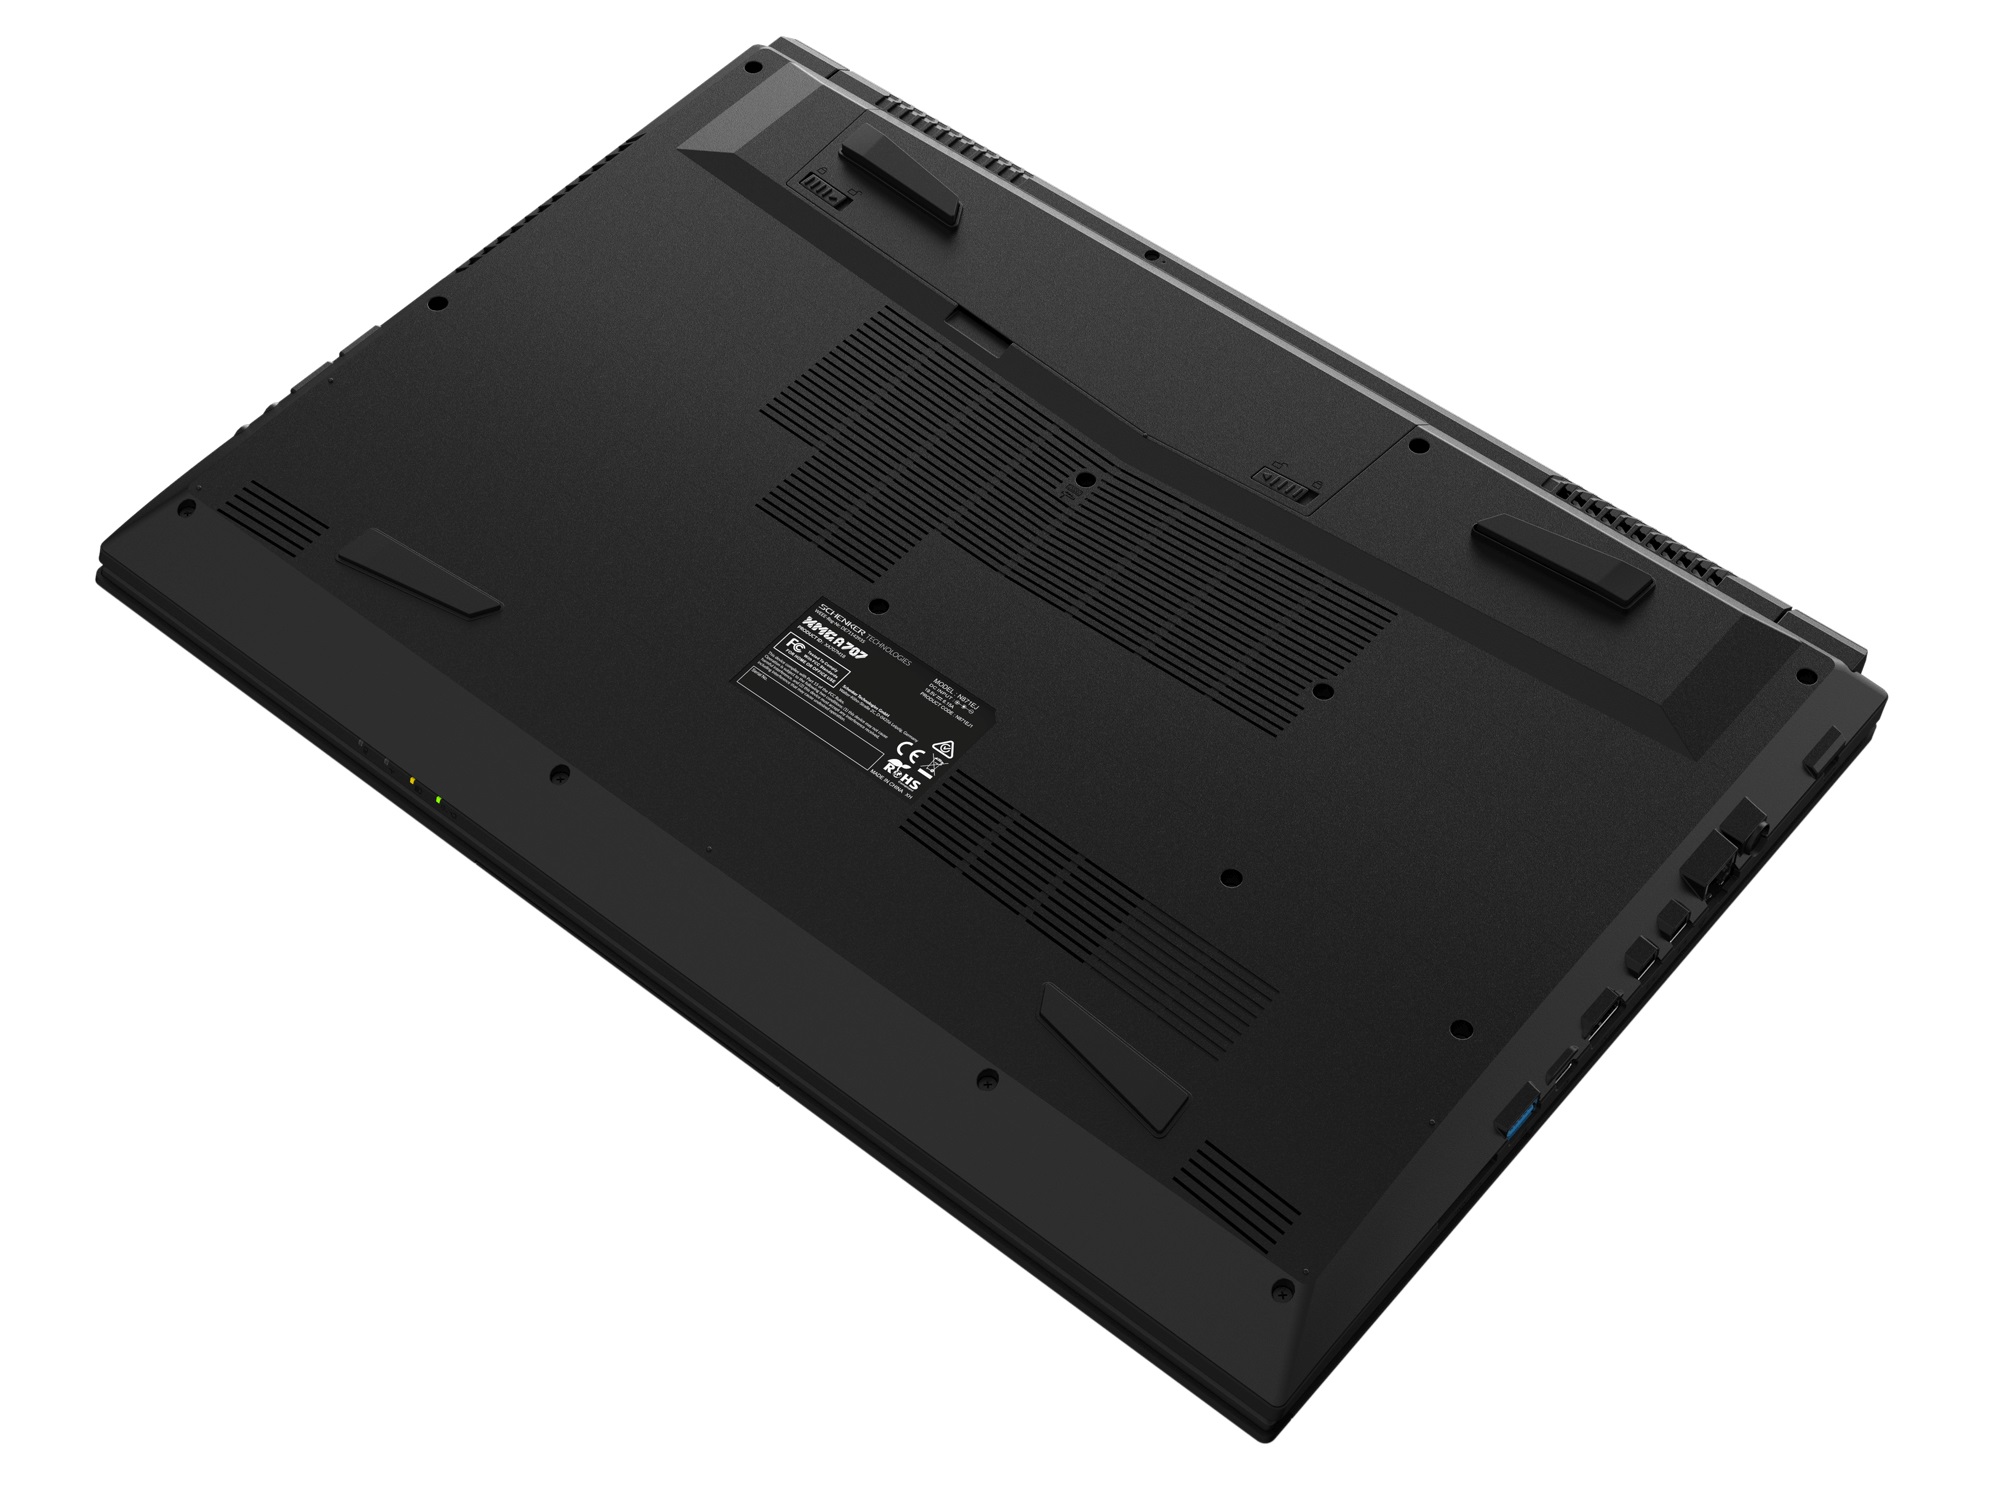
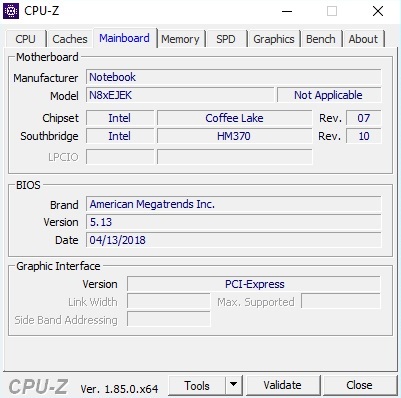
The Clevo N871EK1 Barebone houses the Schenker laptop's components. With the exception of the modernized USB ports (now 2x 3.1 Gen2), this case is identical to its predecessor model, the N870HK1, which we reviewed in 2017. As a result, we will not cover the case, connectivity or input devices at length in this article. Please see our review of the Nexoc G739 for more information on these subjects.
| SD Card Reader | |
| average JPG Copy Test (av. of 3 runs) | |
| Average of class Gaming (20.9 - 210, n=55, last 2 years) | |
| Asus GL703GE-ES73 (Toshiba Exceria Pro SDXC 64 GB UHS-II) | |
| Nexoc G739 (Toshiba Exceria Pro SDXC 64 GB UHS-II) | |
| Acer Predator Helios 300 PH317-52-51M6 (Toshiba Exceria Pro SDXC 64 GB UHS-II) | |
| Schenker XMG A707 Coffee Lake (Toshiba Exceria Pro SDXC 64 GB UHS-II) | |
| maximum AS SSD Seq Read Test (1GB) | |
| Average of class Gaming (25.5 - 261, n=52, last 2 years) | |
| Asus GL703GE-ES73 (Toshiba Exceria Pro SDXC 64 GB UHS-II) | |
| Nexoc G739 (Toshiba Exceria Pro SDXC 64 GB UHS-II) | |
| Acer Predator Helios 300 PH317-52-51M6 (Toshiba Exceria Pro SDXC 64 GB UHS-II) | |
| Schenker XMG A707 Coffee Lake (Toshiba Exceria Pro SDXC 64 GB UHS-II) | |
| Networking | |
| iperf3 transmit AX12 | |
| Schenker XMG A707 Coffee Lake | |
| Acer Predator Helios 300 PH317-52-51M6 | |
| Asus GL703GE-ES73 | |
| Nexoc G739 | |
| iperf3 receive AX12 | |
| Schenker XMG A707 Coffee Lake | |
| Acer Predator Helios 300 PH317-52-51M6 | |
| Asus GL703GE-ES73 | |
| Nexoc G739 | |
Display - Bright and high-contrast
Those who want to be able to view the screen from any angle should select the 60 Hz panel. Thanks to its IPS technology, the image remains stable even at relatively oblique angles. The 120 Hz TN display lacks this viewing angle stability. A disadvantage of the IPS screen is its mediocre reaction time. While Schenker advertises the 120 Hz option as having a reaction time of 3 ms, we measured the 60 Hz display's reaction time at 23 ms (black to white) and 39 ms (gray to gray). Fortunately, we did not see any striation (streaking).
| |||||||||||||||||||||||||
Brightness Distribution: 91 %
Center on Battery: 362 cd/m²
Contrast: 1248:1 (Black: 0.29 cd/m²)
ΔE ColorChecker Calman: 6.06 | ∀{0.5-29.43 Ø4.73}
calibrated: 3.13
ΔE Greyscale Calman: 7.22 | ∀{0.09-98 Ø4.97}
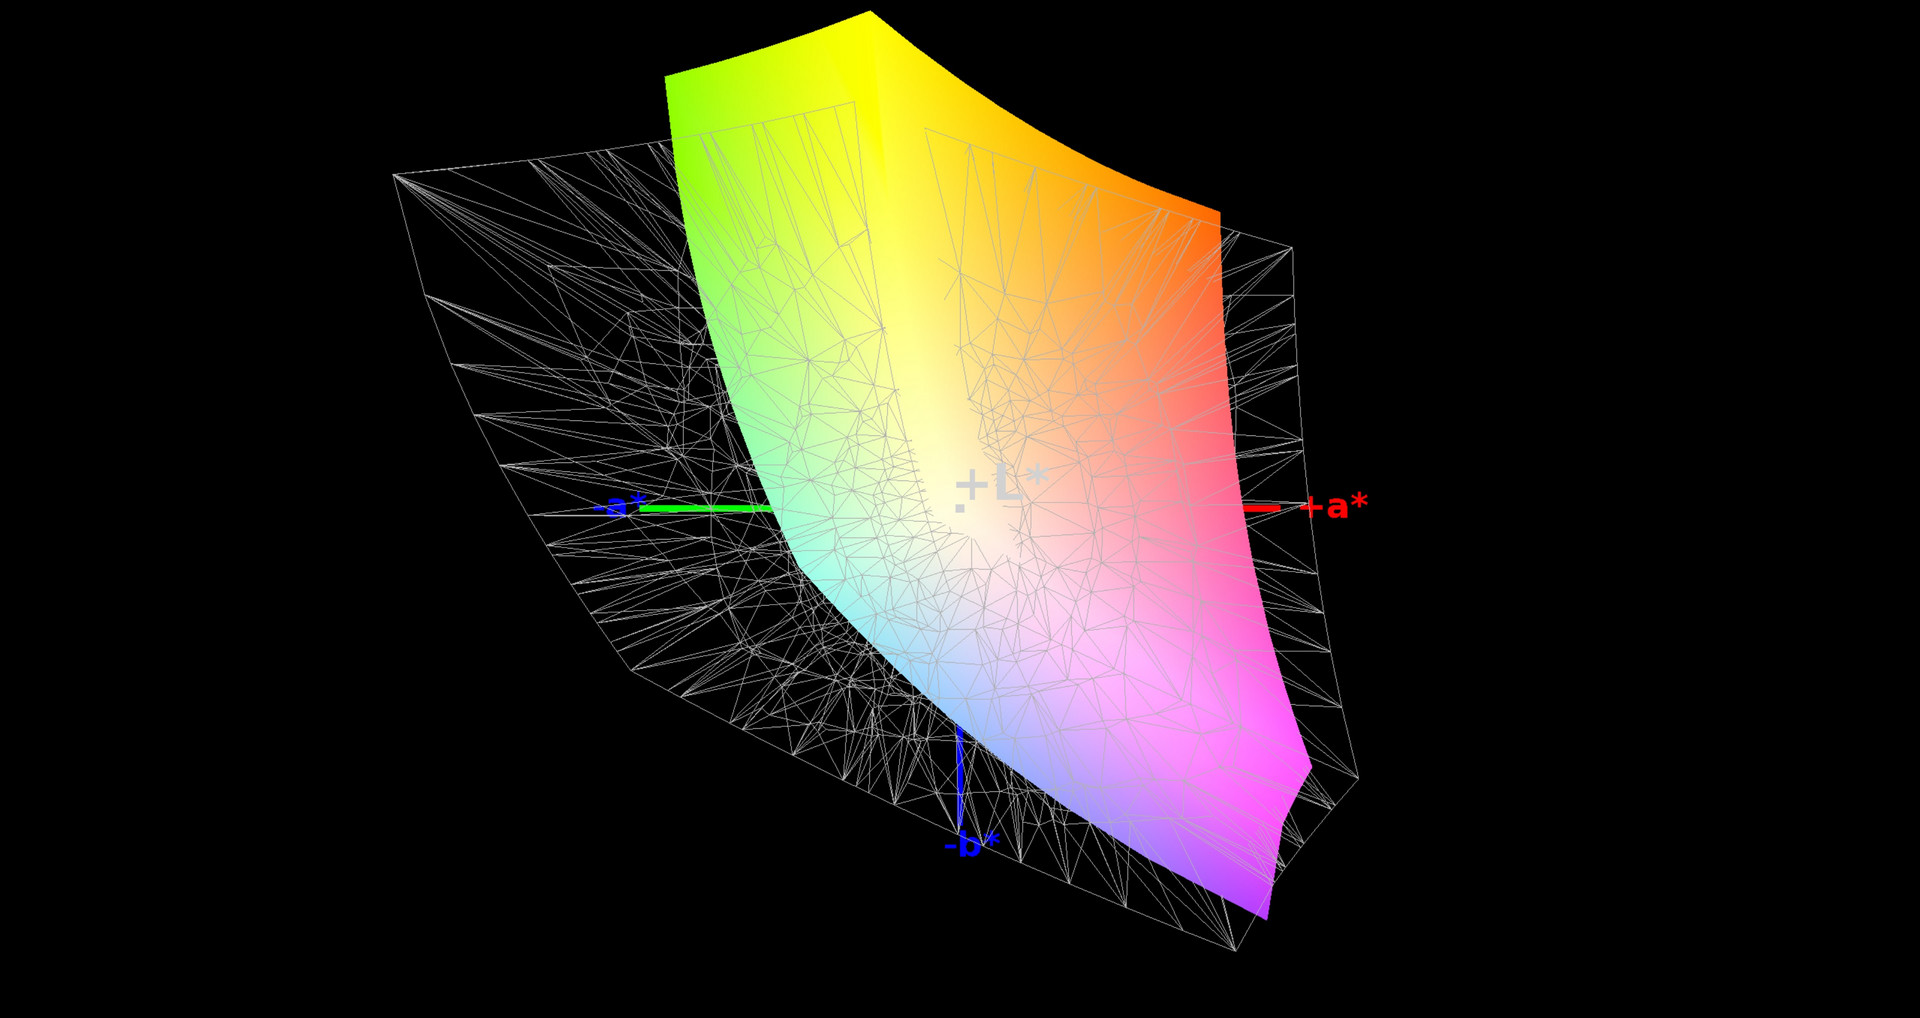
84% sRGB (Argyll 1.6.3 3D)
55% AdobeRGB 1998 (Argyll 1.6.3 3D)
61.7% AdobeRGB 1998 (Argyll 3D)
84.4% sRGB (Argyll 3D)
66.1% Display P3 (Argyll 3D)
Gamma: 2.51
CCT: 7659 K
| Schenker XMG A707 Coffee Lake LG Philips LP173WF4-SPF5 (LGD056D), IPS, 1920x1080 | Nexoc G739 CMN1738, IPS, 1920x1080 | Acer Predator Helios 300 PH317-52-51M6 LG Philips LP173WF4-SPF5 (LGD056D), IPS, 1920x1080 | Asus GL703GE-ES73 Chi Mei CMN1747, TN, 1920x1080 | |
|---|---|---|---|---|
| Display | 6% | 2% | 30% | |
| Display P3 Coverage (%) | 66.1 | 66.7 1% | 67.1 2% | 90.1 36% |
| sRGB Coverage (%) | 84.4 | 91 8% | 86.1 2% | 99.8 18% |
| AdobeRGB 1998 Coverage (%) | 61.7 | 66.4 8% | 63 2% | 83.1 35% |
| Response Times | -18% | 7% | 66% | |
| Response Time Grey 50% / Grey 80% * (ms) | 39.2 ? | 45 ? -15% | 36 ? 8% | 11.6 ? 70% |
| Response Time Black / White * (ms) | 23.2 ? | 28 ? -21% | 22 ? 5% | 8.8 ? 62% |
| PWM Frequency (Hz) | 119000 ? | 450 ? | 122000 ? | 26040 ? |
| Screen | 12% | -3% | 15% | |
| Brightness middle (cd/m²) | 362 | 312 -14% | 365 1% | 331.1 -9% |
| Brightness (cd/m²) | 350 | 304 -13% | 341 -3% | 312 -11% |
| Brightness Distribution (%) | 91 | 85 -7% | 89 -2% | 86 -5% |
| Black Level * (cd/m²) | 0.29 | 0.23 21% | 0.32 -10% | 0.31 -7% |
| Contrast (:1) | 1248 | 1357 9% | 1141 -9% | 1068 -14% |
| Colorchecker dE 2000 * | 6.06 | 4.19 31% | 6.51 -7% | 2.86 53% |
| Colorchecker dE 2000 max. * | 11.6 | 8.7 25% | 12.32 -6% | 6.35 45% |
| Colorchecker dE 2000 calibrated * | 3.13 | 2.9 7% | 2.66 15% | |
| Greyscale dE 2000 * | 7.22 | 3.72 48% | 7.65 -6% | 4.3 40% |
| Gamma | 2.51 88% | 2.29 96% | 2.64 83% | 2.268 97% |
| CCT | 7659 85% | 7104 91% | 8066 81% | 7034 92% |
| Color Space (Percent of AdobeRGB 1998) (%) | 55 | 59 7% | 56 2% | 75 36% |
| Color Space (Percent of sRGB) (%) | 84 | 91 8% | 86 2% | 100 19% |
| Total Average (Program / Settings) | 0% /
6% | 2% /
-1% | 37% /
24% |
* ... smaller is better
For the most part, the rest of the IPS panel's results were good to very good. Both the brightness (~350 cd/m²) and the contrast (~1250:1) are attractive features. The color space coverage is also reasonably good for a multimedia/gaming laptop. 84% sRGB and 55% Adobe RGB is more or less on par with the Acer Predator Helios 300's results - understandably, given that it has the same monitor (LG Philips LP173WF4-SPF5). Professionals are better off with the Asus GL703GE, which covers 100% of the sRGB color space.
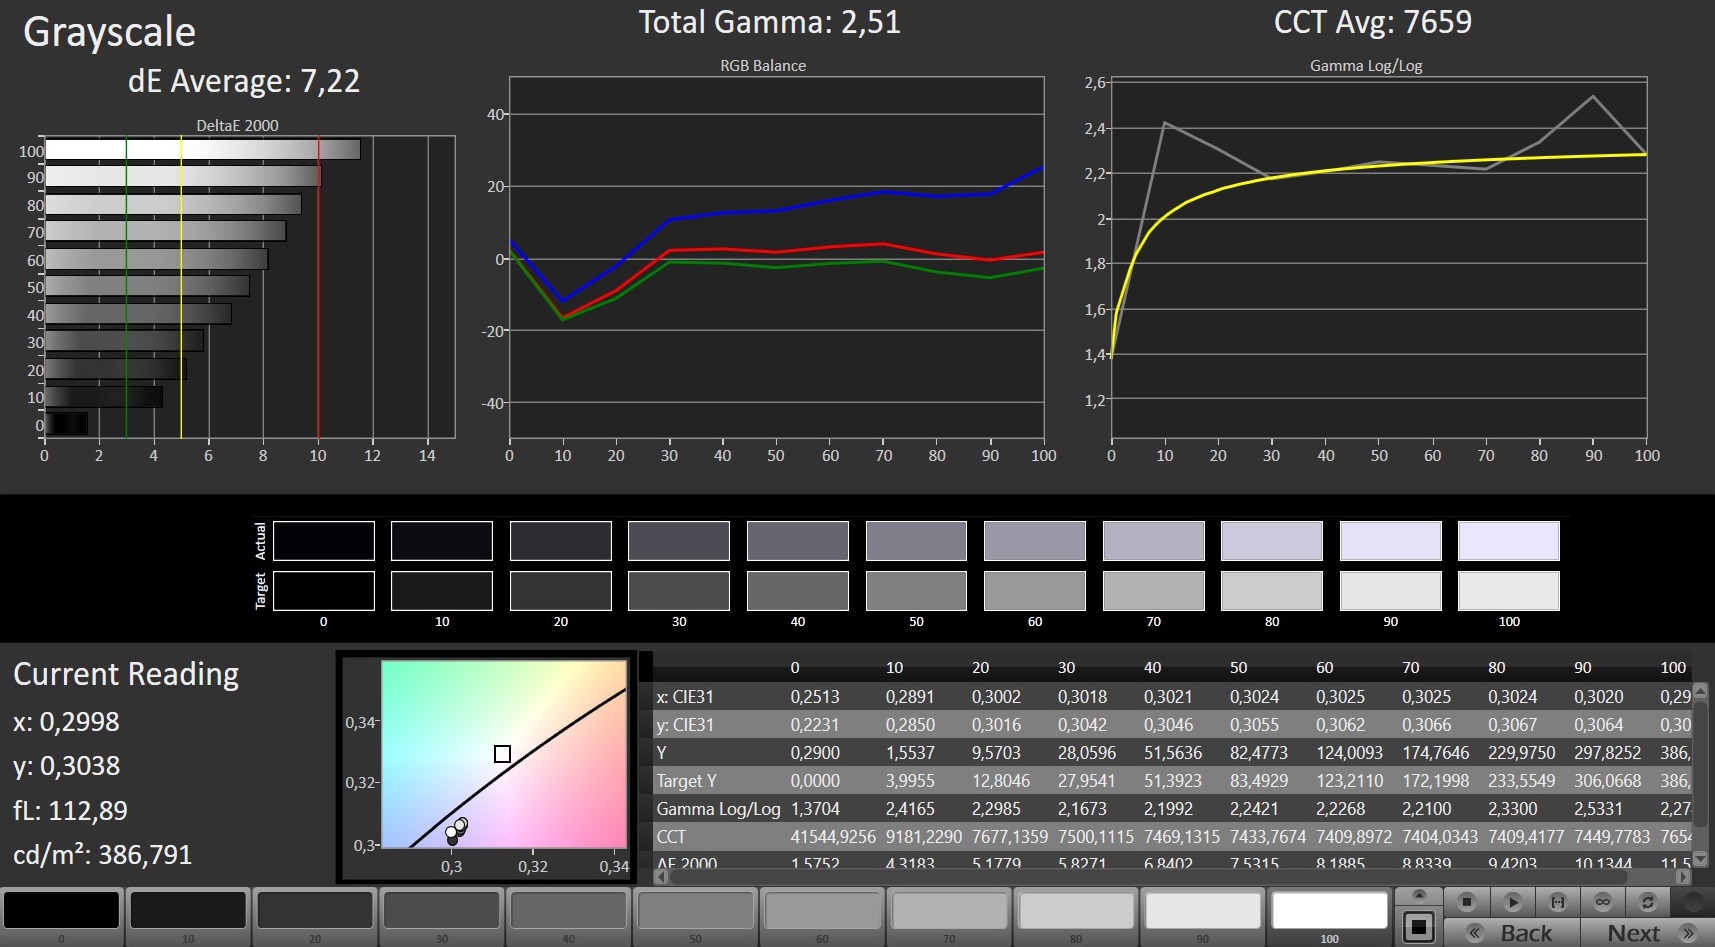
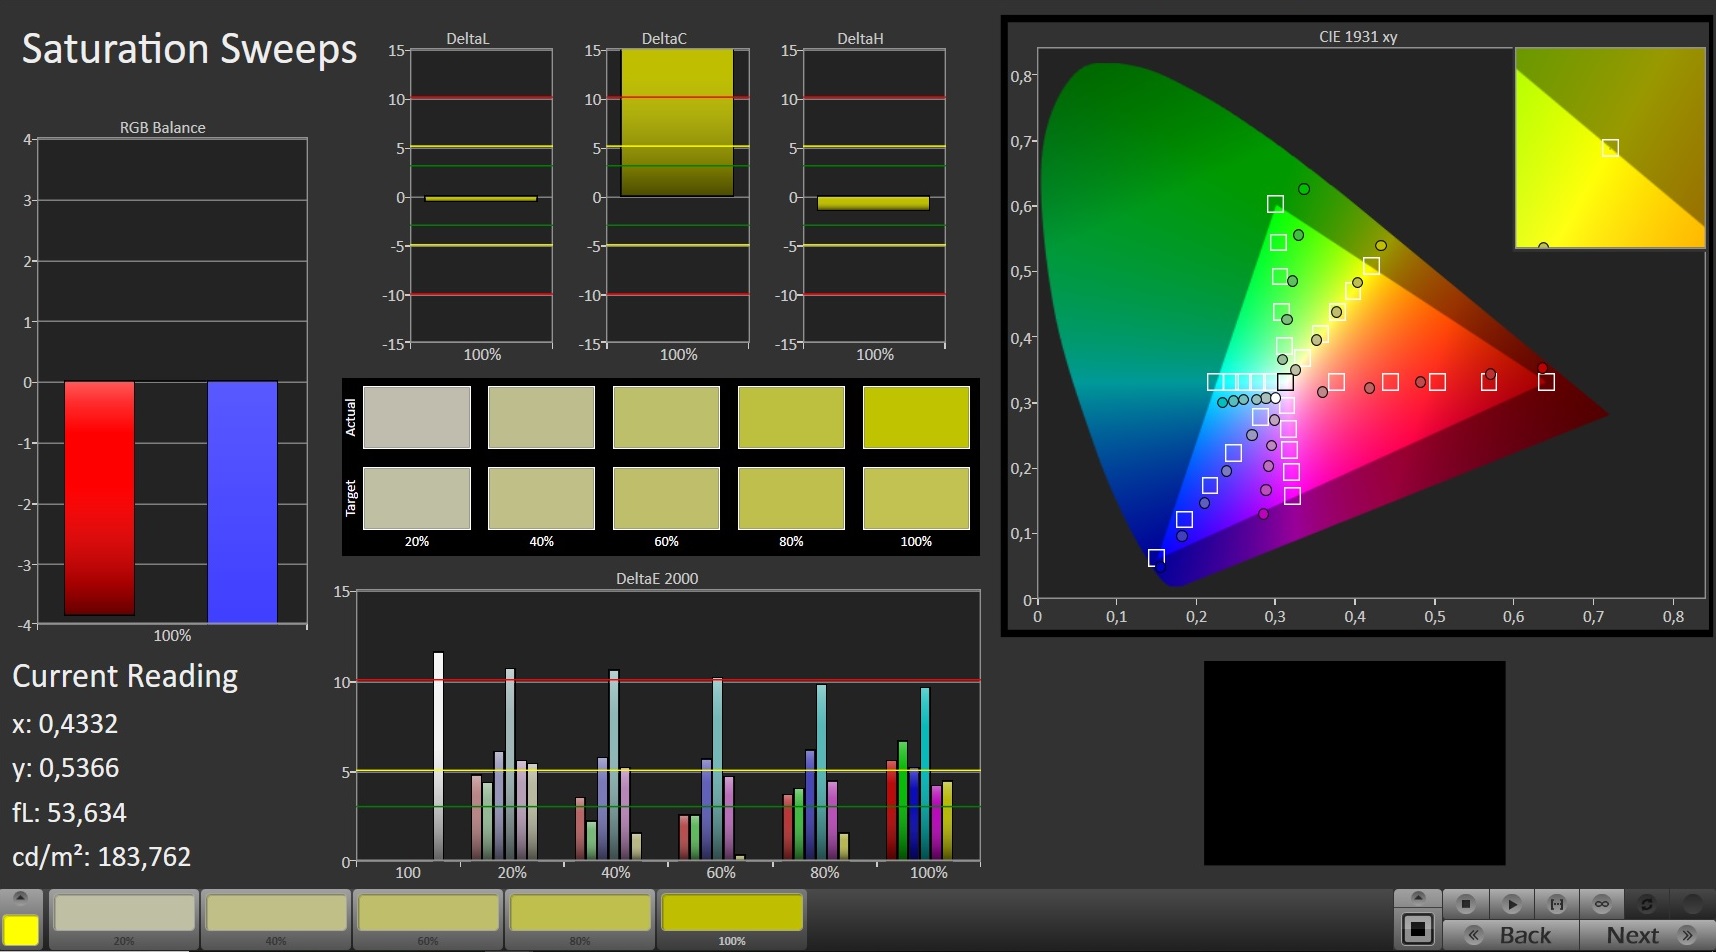
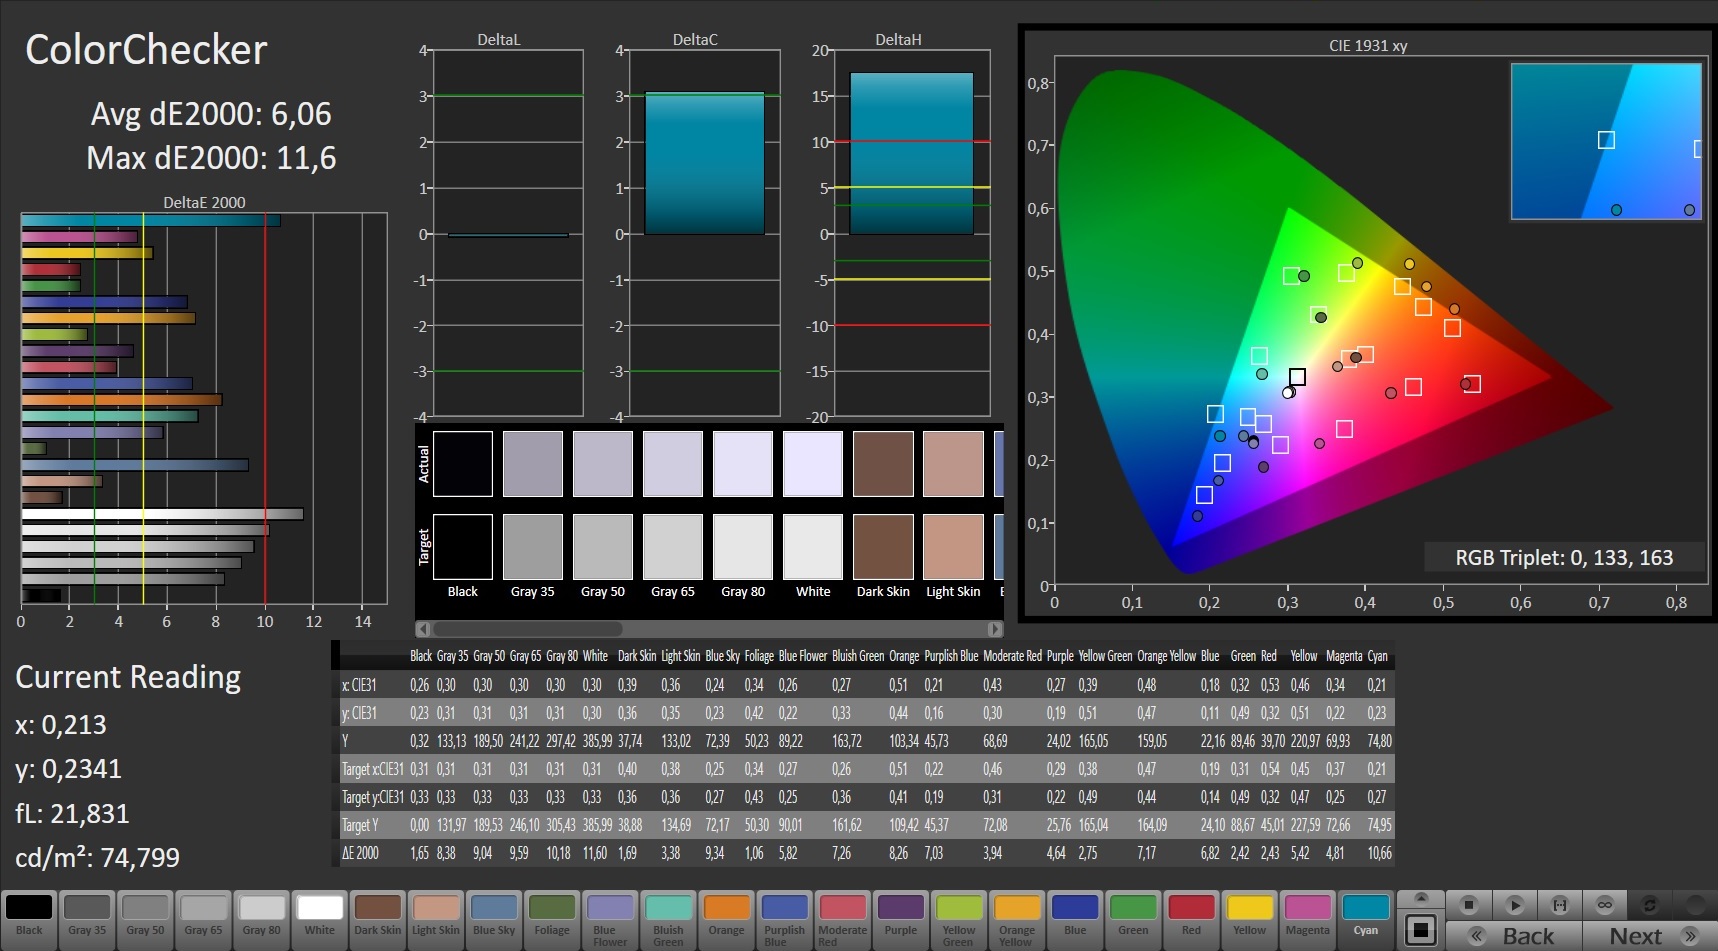
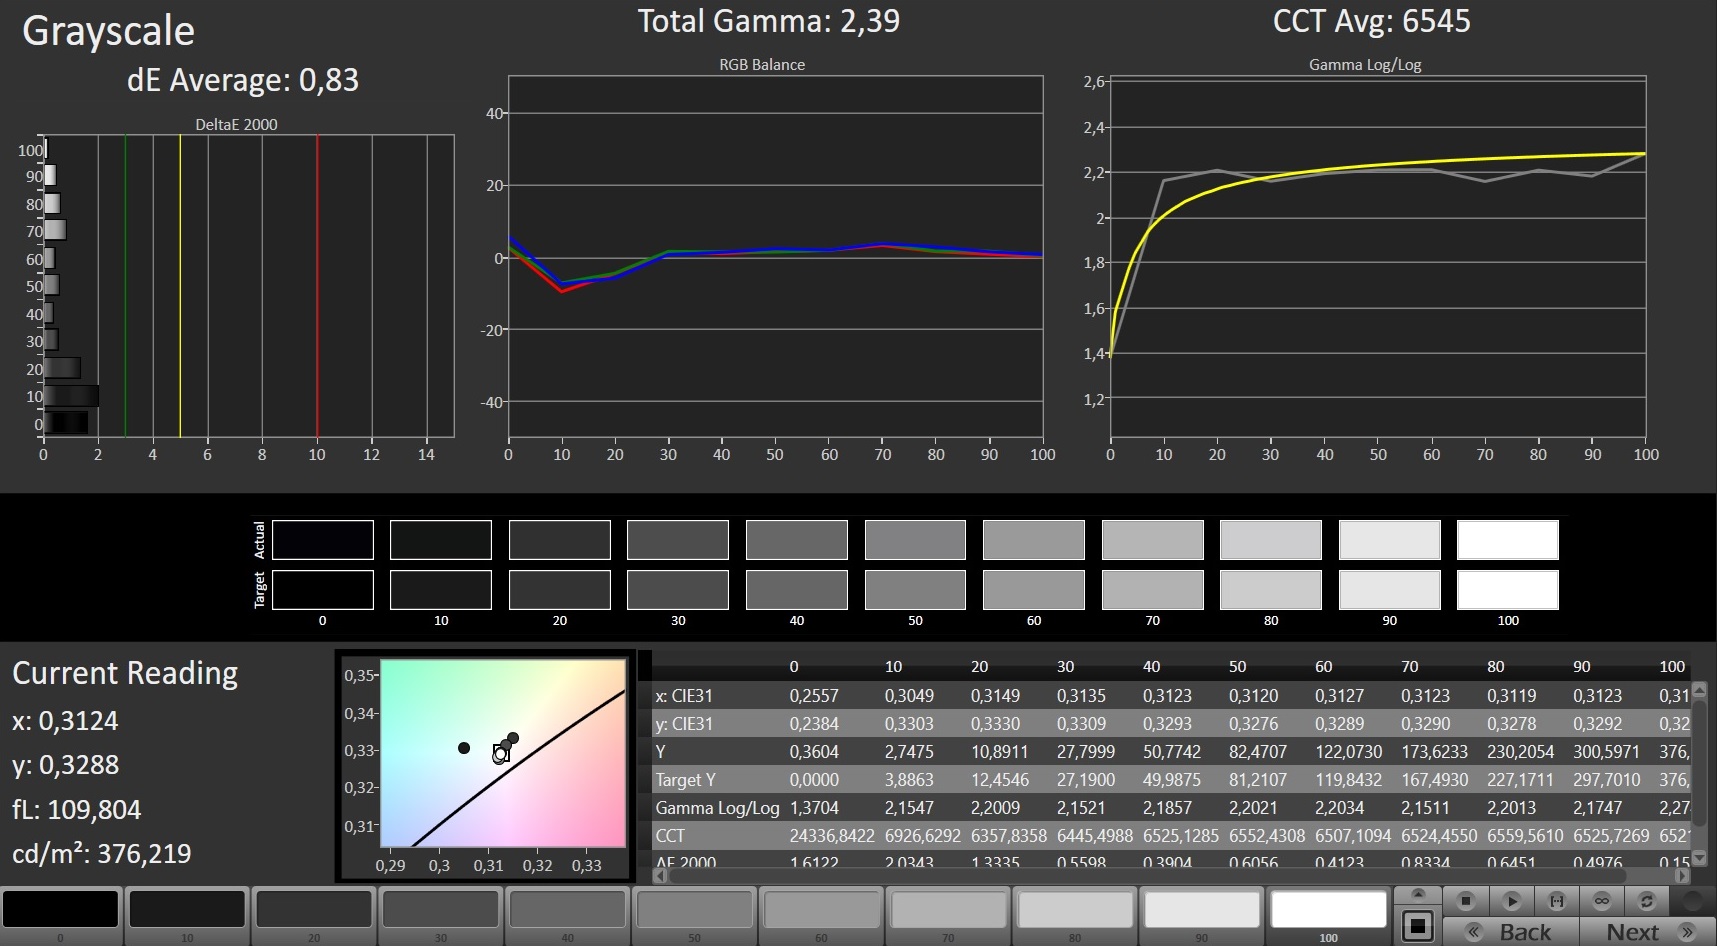
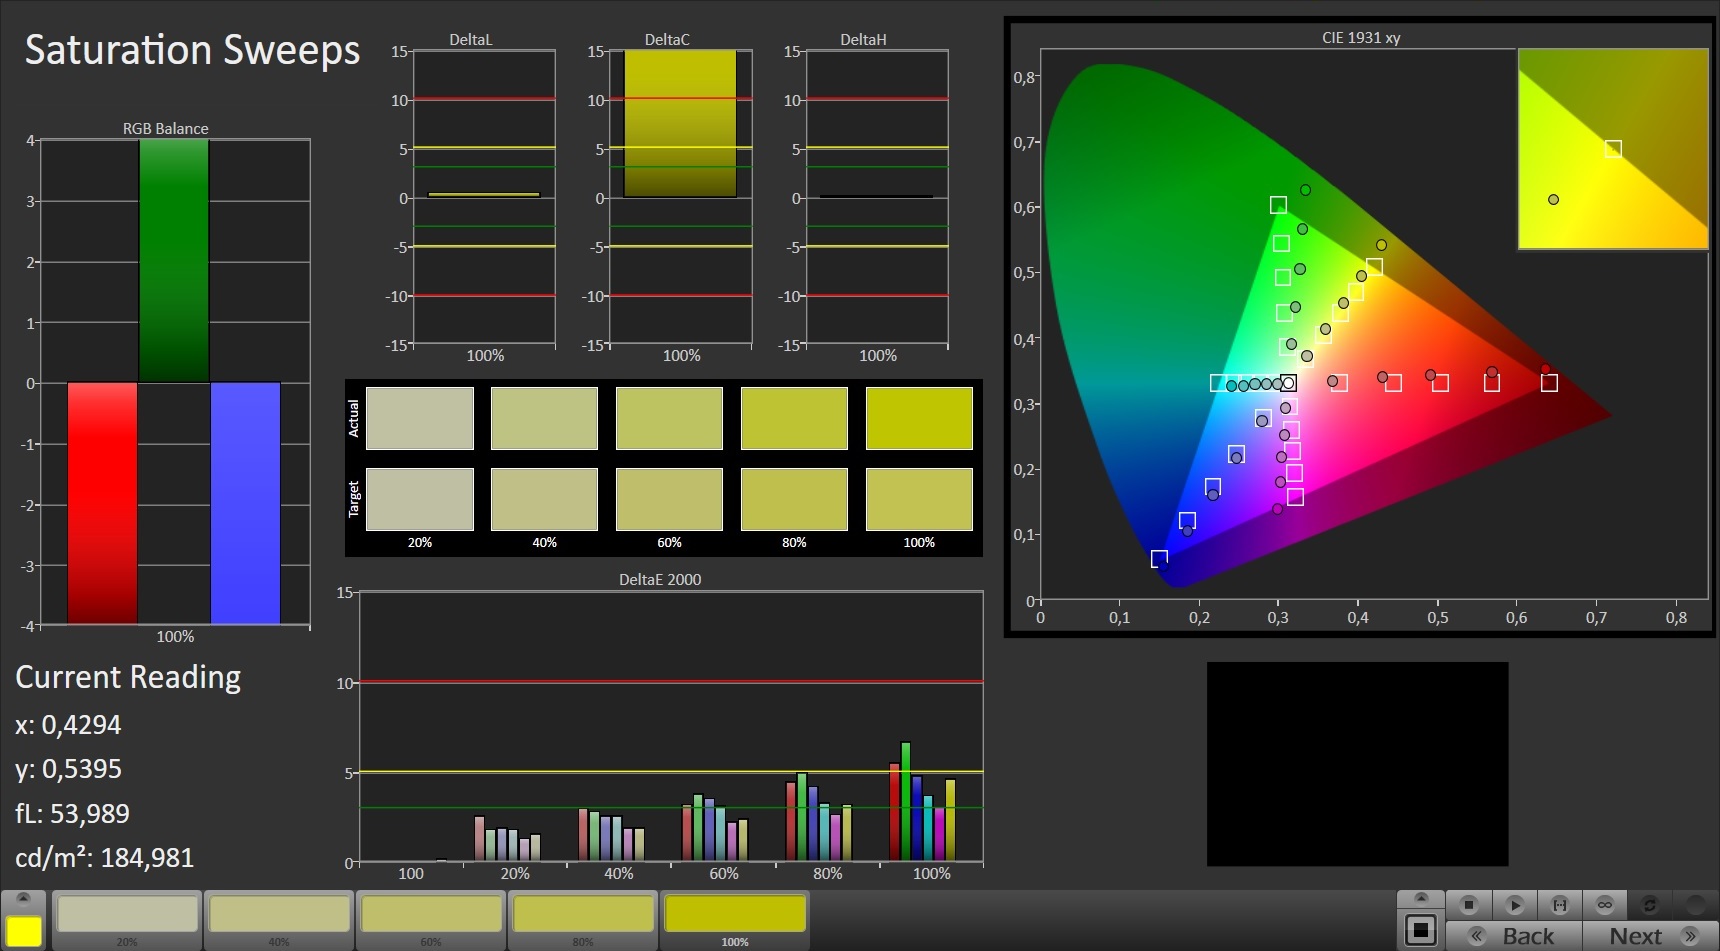
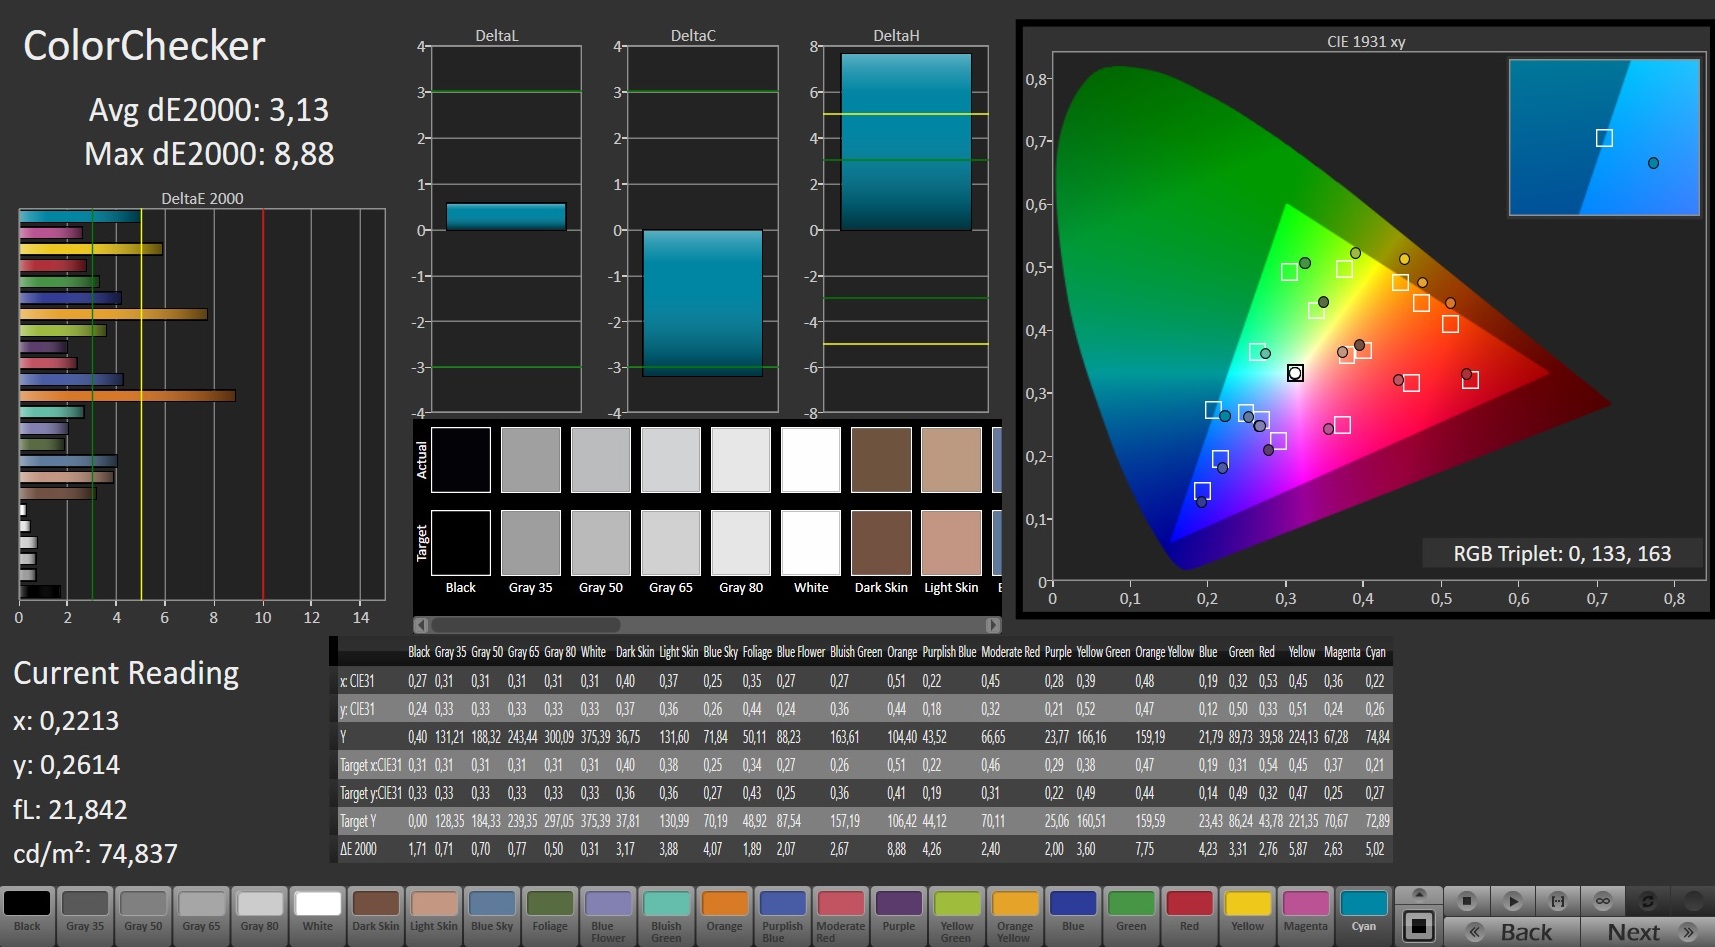
In terms of color accuracy, the panel has room for improvement. In factory default, the display image has a faint blue cast - though it can be eliminated by calibration (see the link to our ICC file above).

The panel's brightness distribution proves to be another minor drawback. Like many other laptops, our test device exhibits halation along the edges of the screen. Fortunately, here the halation is contained to a very narrow area and the effect is fairly subtle.
Display Response Times
| ↔ Response Time Black to White | ||
|---|---|---|
| 23.2 ms ... rise ↗ and fall ↘ combined | ↗ 10.8 ms rise | 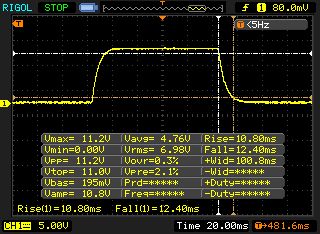 |
| ↘ 12.4 ms fall | ||
| The screen shows good response rates in our tests, but may be too slow for competitive gamers. In comparison, all tested devices range from 0.1 (minimum) to 240 (maximum) ms. » 53 % of all devices are better. This means that the measured response time is worse than the average of all tested devices (19.9 ms). | ||
| ↔ Response Time 50% Grey to 80% Grey | ||
| 39.2 ms ... rise ↗ and fall ↘ combined | ↗ 20.4 ms rise | 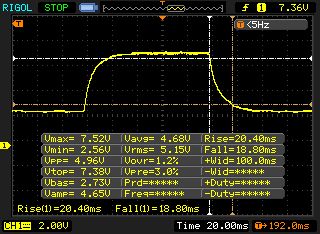 |
| ↘ 18.8 ms fall | ||
| The screen shows slow response rates in our tests and will be unsatisfactory for gamers. In comparison, all tested devices range from 0.165 (minimum) to 636 (maximum) ms. » 60 % of all devices are better. This means that the measured response time is worse than the average of all tested devices (31.1 ms). | ||
Screen Flickering / PWM (Pulse-Width Modulation)
| Screen flickering / PWM detected | 119000 Hz | ≤ 90 % brightness setting | 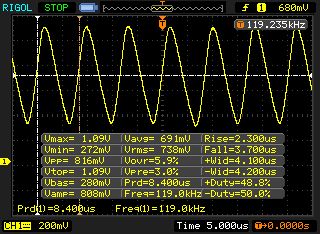 |
The display backlight flickers at 119000 Hz (worst case, e.g., utilizing PWM) Flickering detected at a brightness setting of 90 % and below. There should be no flickering or PWM above this brightness setting. The frequency of 119000 Hz is quite high, so most users sensitive to PWM should not notice any flickering. In comparison: 52 % of all tested devices do not use PWM to dim the display. If PWM was detected, an average of 7801 (minimum: 5 - maximum: 343500) Hz was measured. | |||
Performance - Entry-level gaming
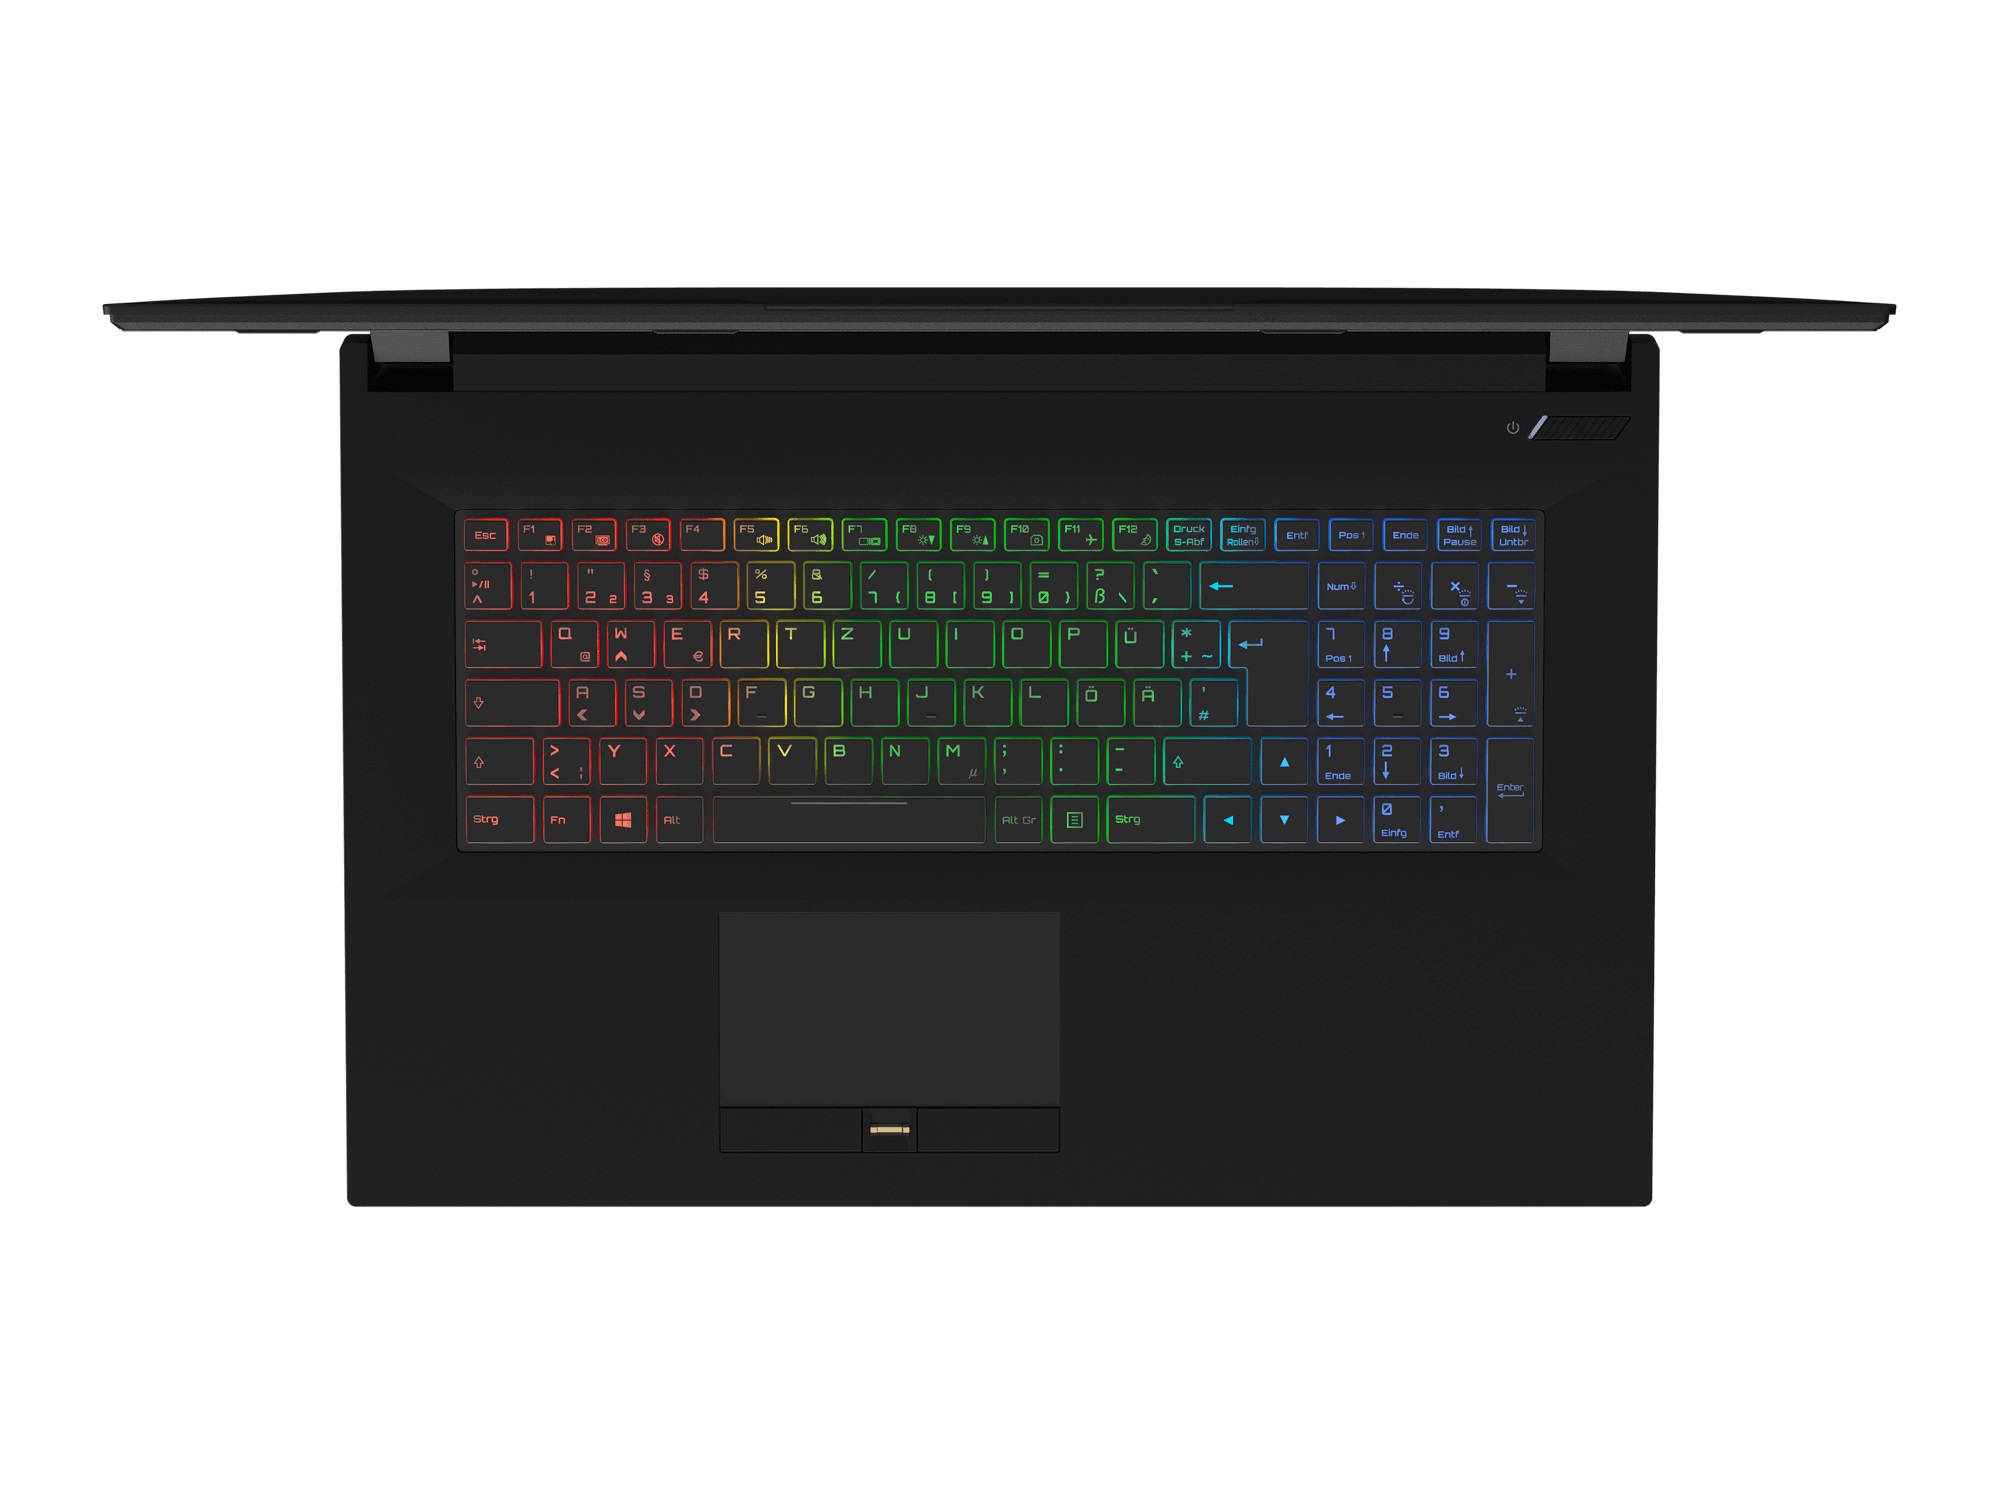
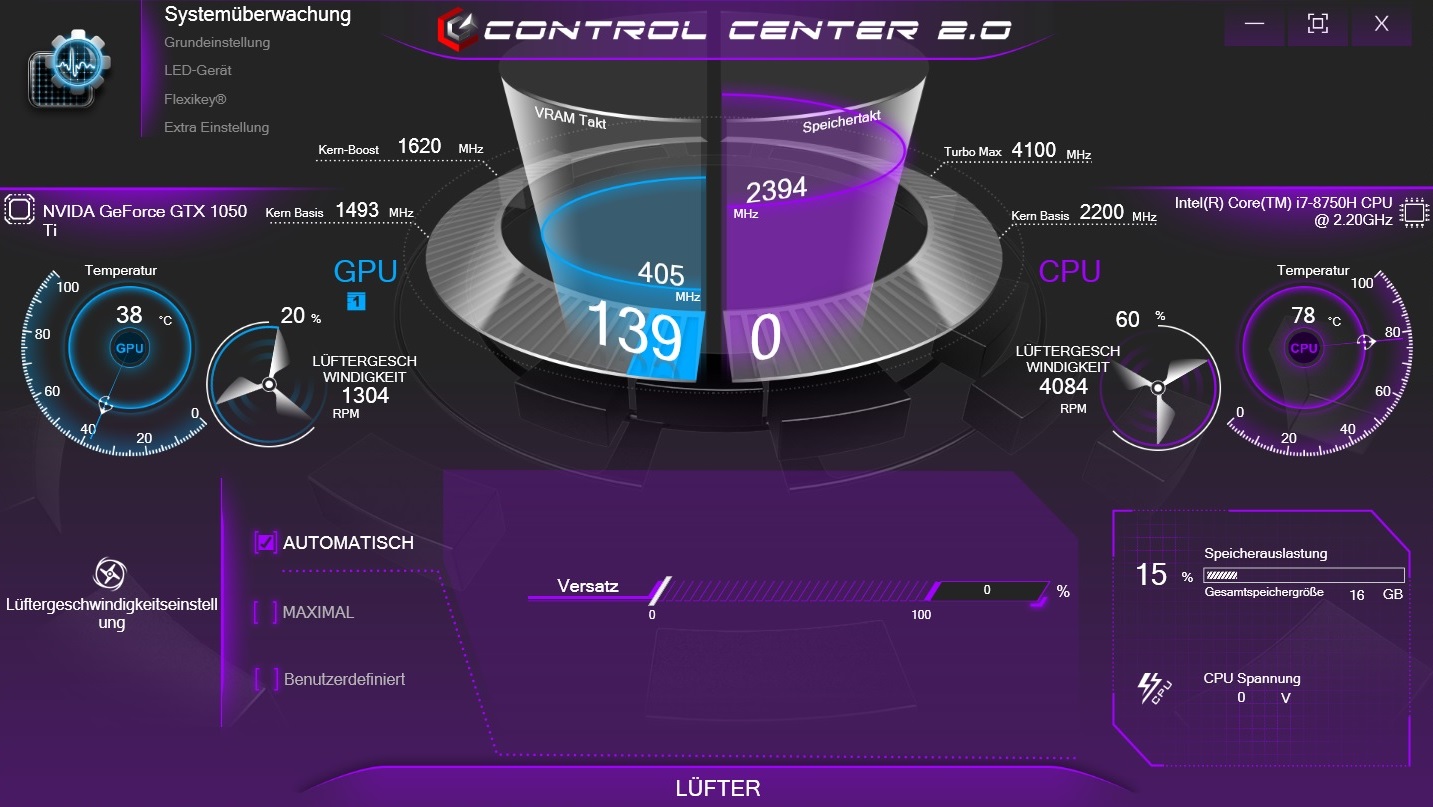
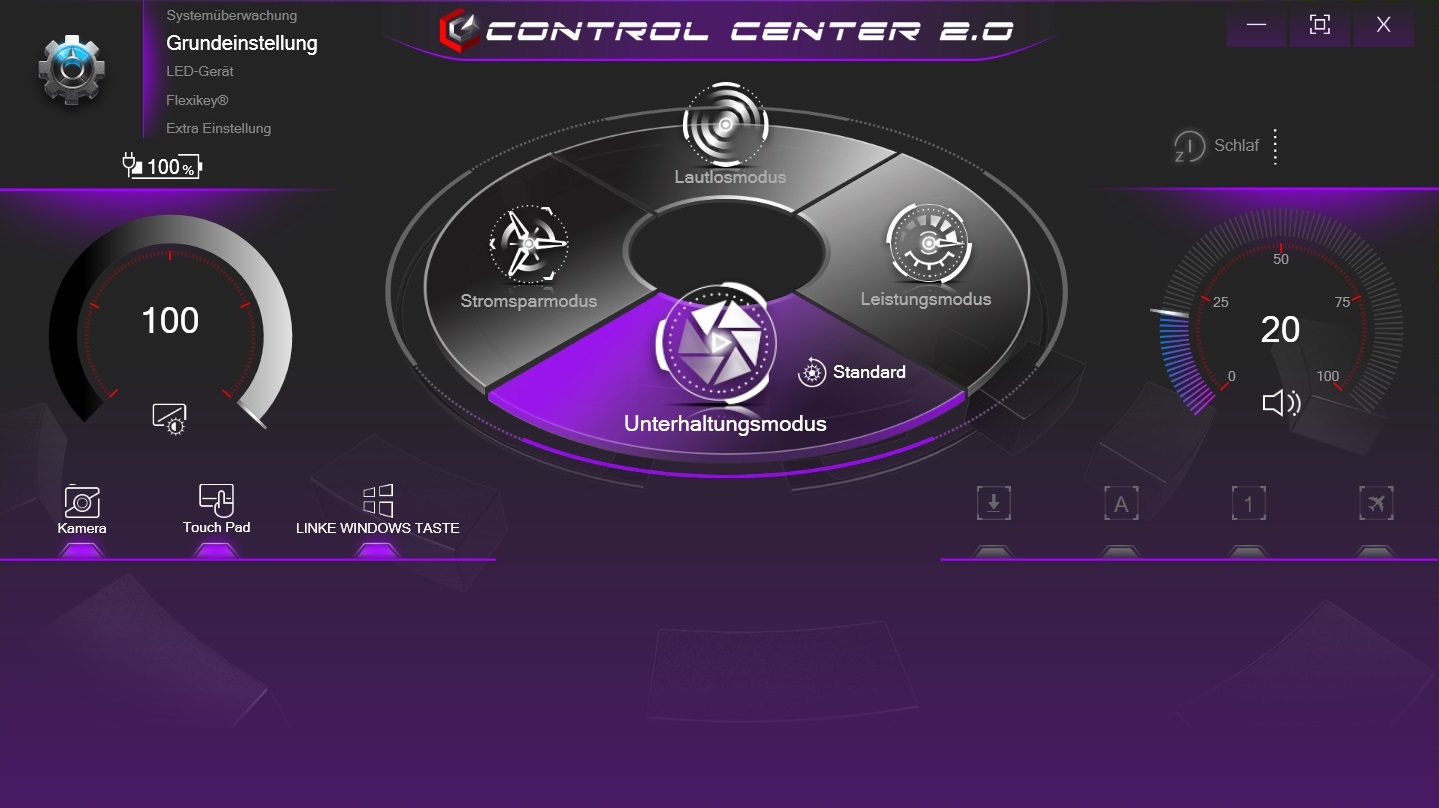
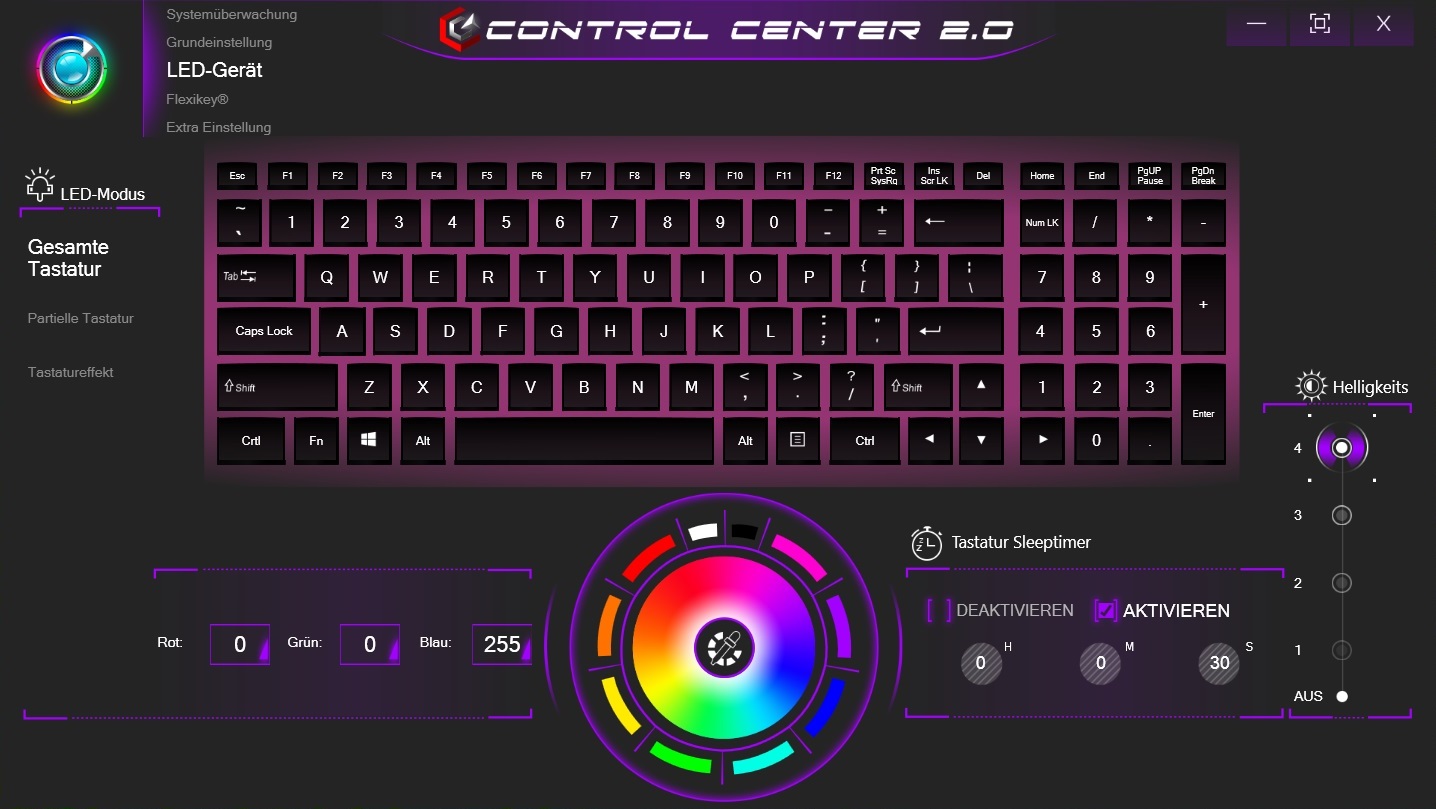
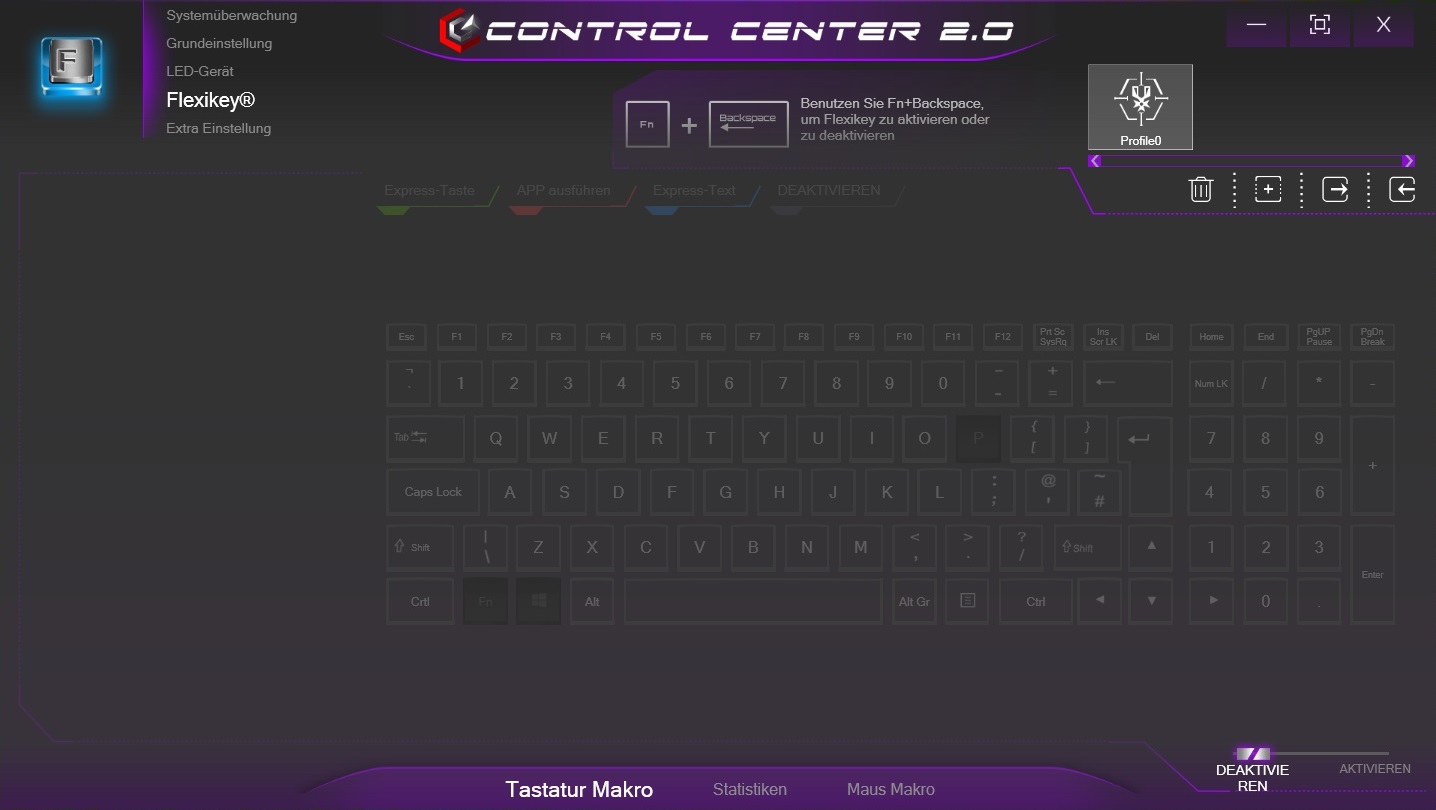
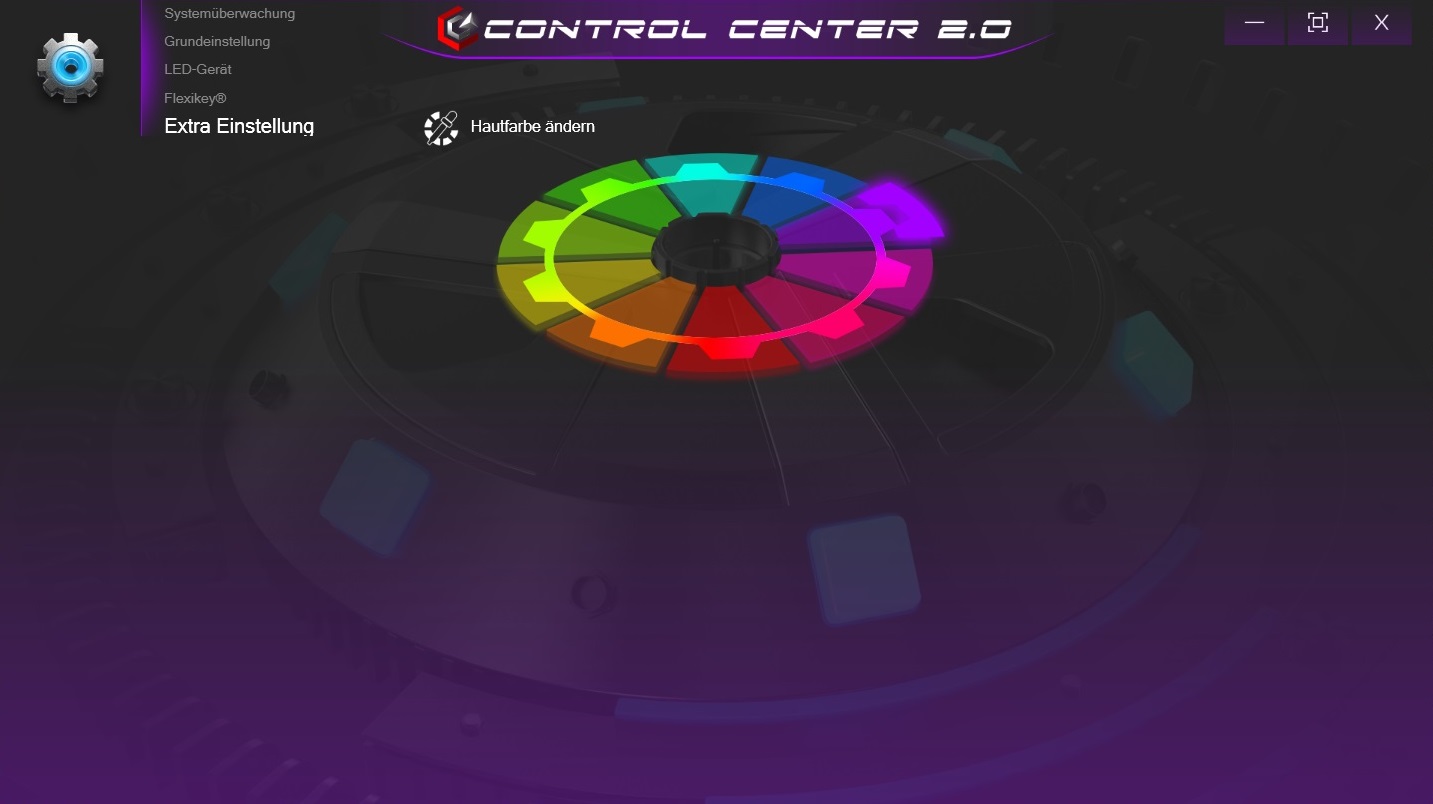
After the Coffee Lake upgrade, the Barebone manufacturer Clevo has made some changes to the Control Center, i.e. the laptop's central security and tuning software. The center controls the keyboard backlighting, among other things. Importantly, the fan control can be set manually. We used the Auto fan setting in our tests.
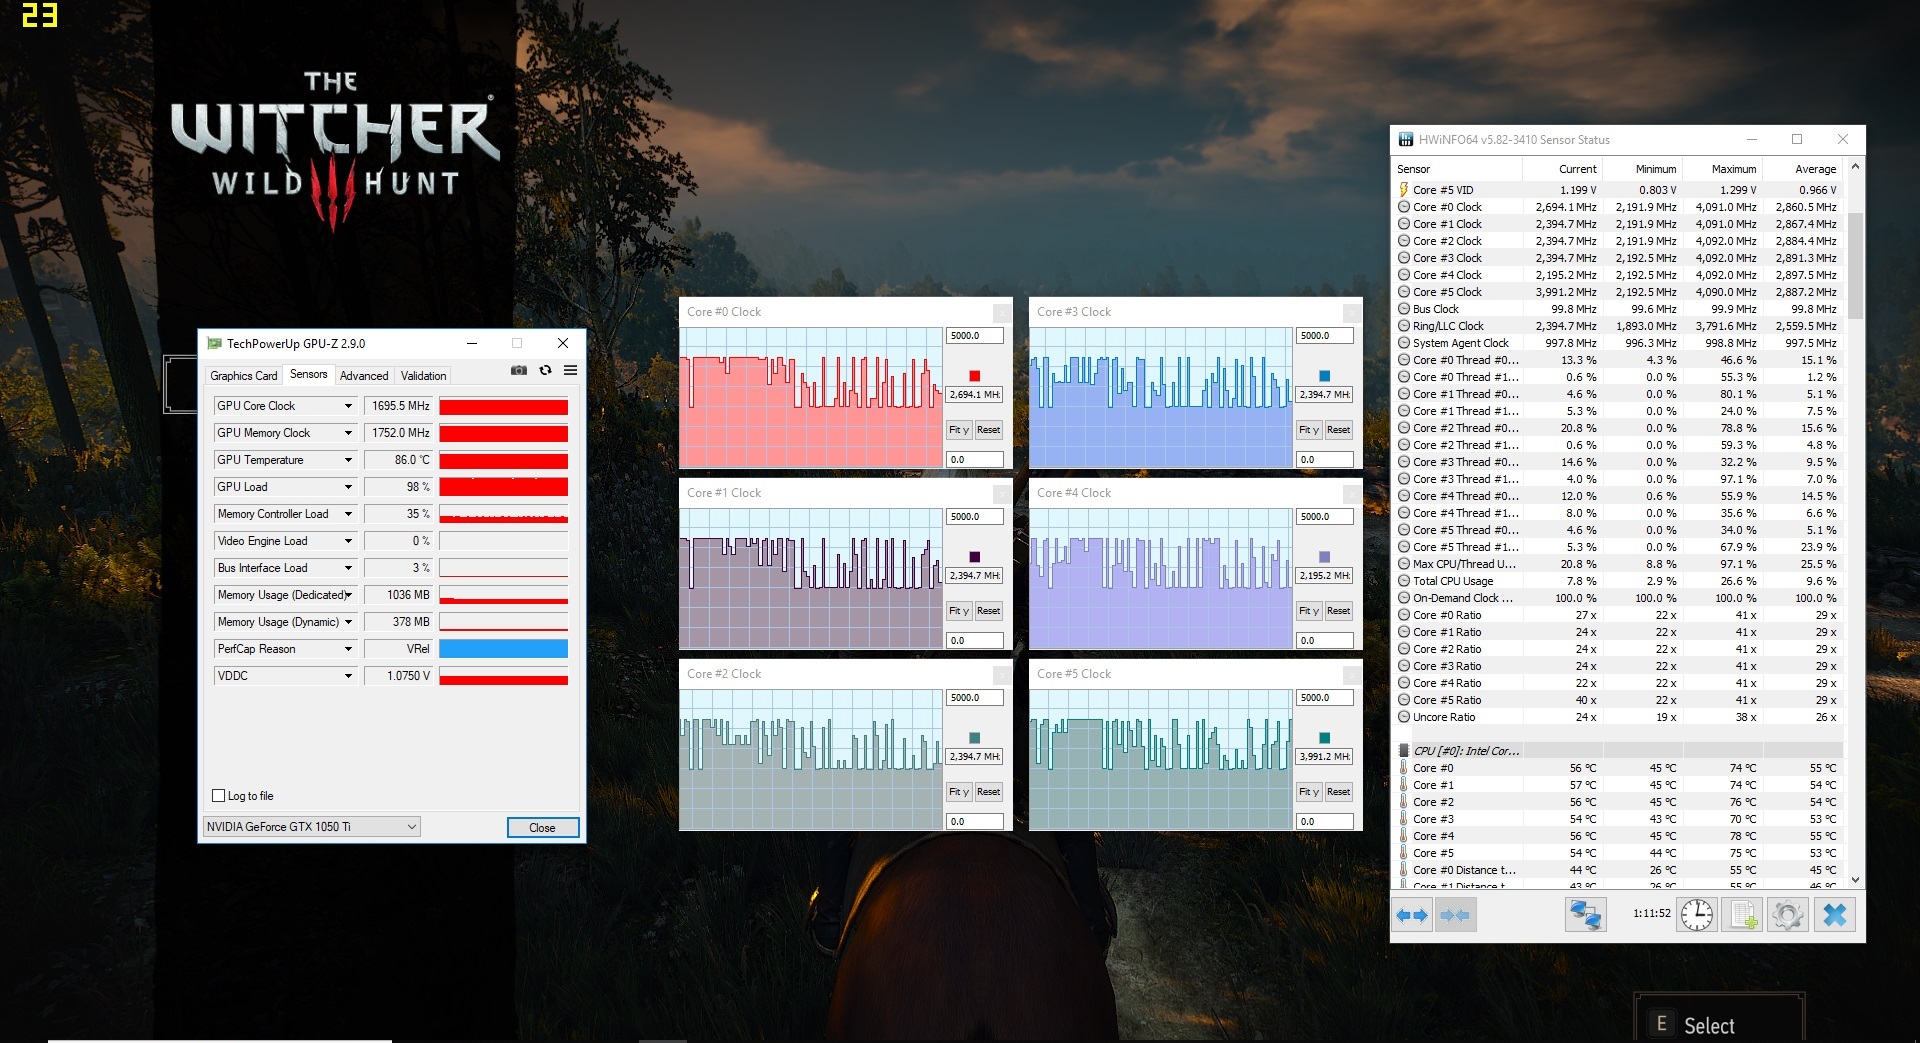
Unfortunately, the new Control Center currently has a serious bug that is affecting not only the XMG A707, but also the XMG A517, the Key 15, and all the other Clevo Barebones with this software. If the user does not kill the program via the task manager, the GPU throttles when running some 3D applications and games (“The Witcher 3” is a prominent case). According to Schenker, the problem should be solved soon through a BIOS update. We will probably re-test when possible. Until that point, each device affected loses 1% in our ratings.
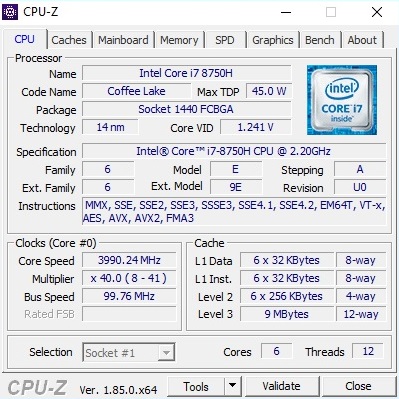
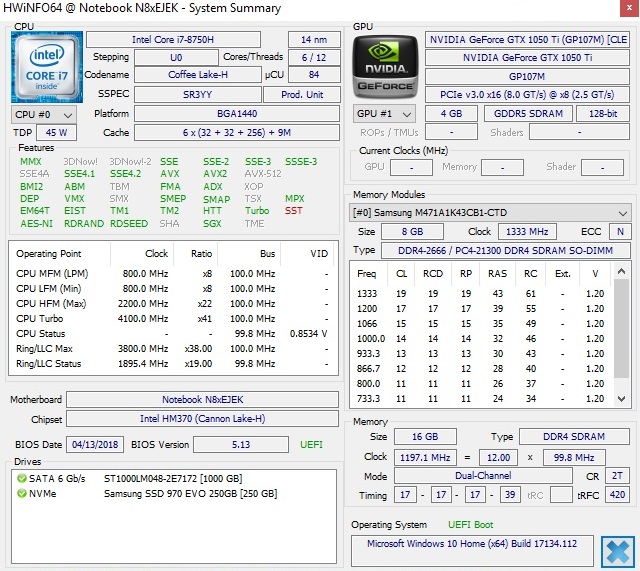
Processor
Although the Core i7-8750H often achieves significantly higher scores than the Core i5-8300H in our benchmark tests (+38% @Cinebench R15), considering the laptop's limited graphics performance, we would more likely recommend the less expensive Coffee Lake model.
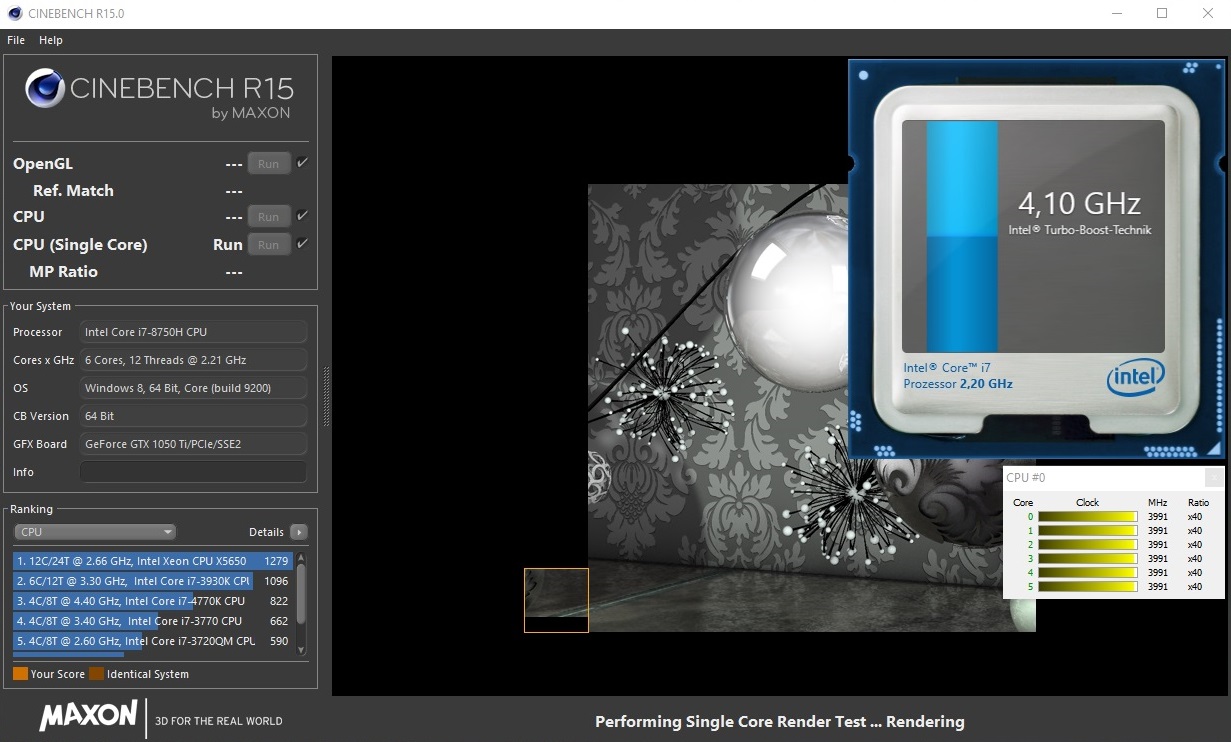
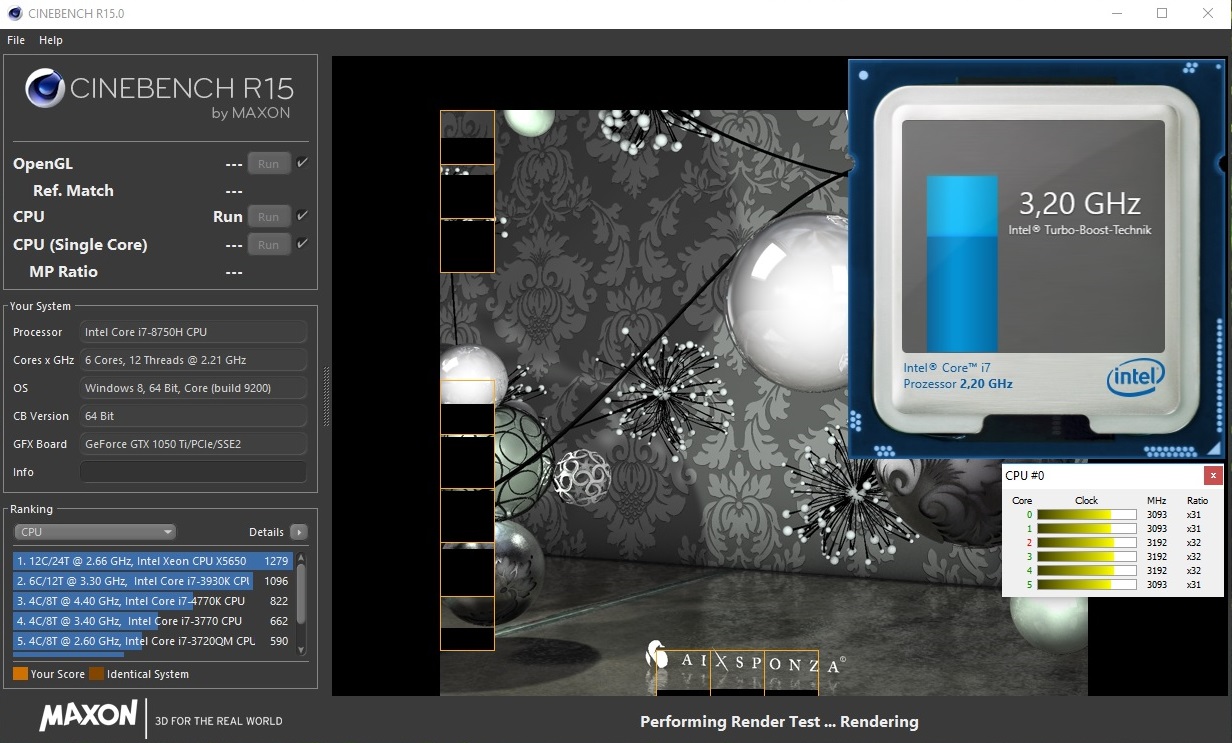
At this point, gaming performance hardly benefits from more than four cores and is almost always limited by the GPU. As a result, the Core i7-8750H will only be worth the investment for a small number of buyers - especially given that the XMG A707's cooling system is pushed to its limits by the hexa-core processor.
The latter was very clearly visible in our Cinebench loop test. Starting with the second cycle, the performance fell by around 10%. This is because the CPU cannot maintain its theoretical maximum multi-core turbo speed of 3.9 GHz. To be fair, we have observed a similar phenomenon in our tests of numerous Coffee Lake devices.
System Performance
With its SSD, the XMG A707's system performance can be described as excellent. In both PCMark 8 and PCMark 10, the 17-inch laptop performs in no way inferior to the competition—quite the opposite, in fact. Without its solid state drive, the Windows OS would run significantly slower when launching or installing programs, loading content or booting. As a result, we strongly recommend upgrading from the base configuration here.
| PCMark 10 - Score | |
| Average of class Gaming (5828 - 11574, n=96, last 2 years) | |
| Schenker XMG A707 Coffee Lake | |
| Asus GL703GE-ES73 | |
| PCMark 8 | |
| Home Score Accelerated v2 | |
| Average of class Gaming (n=1last 2 years) | |
| Nexoc G739 | |
| Acer Predator Helios 300 PH317-52-51M6 | |
| Schenker XMG A707 Coffee Lake | |
| Asus GL703GE-ES73 | |
| Work Score Accelerated v2 | |
| Schenker XMG A707 Coffee Lake | |
| Acer Predator Helios 300 PH317-52-51M6 | |
| Asus GL703GE-ES73 | |
| Nexoc G739 | |
| Average of class Gaming (n=1last 2 years) | |
| PCMark 8 Home Score Accelerated v2 | 4196 points | |
| PCMark 8 Work Score Accelerated v2 | 5389 points | |
| PCMark 10 Score | 4734 points | |
Help | ||
Storage Solution
Schenker has equipped our test device with a 256 GB SSD and 1 TB HDD combo. While the solid-state disk is manufactured by Samsung (970 EVO), the hard drive is a Seagate product (ST1000LM048).
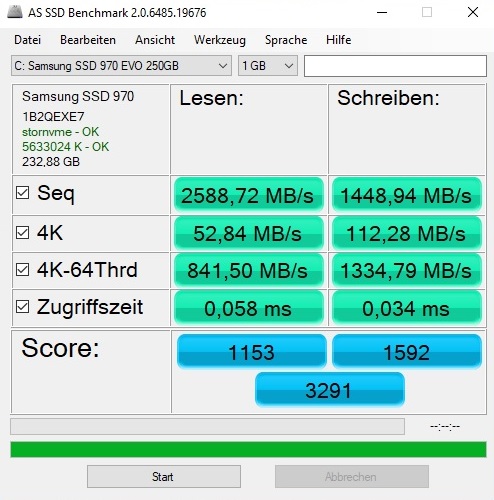
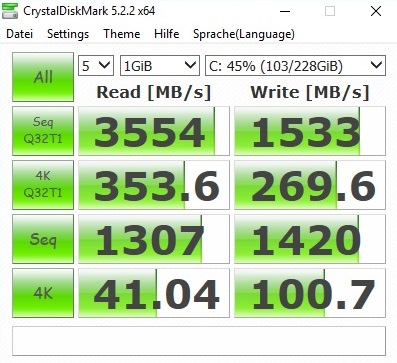
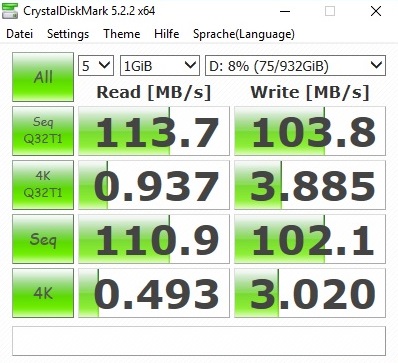
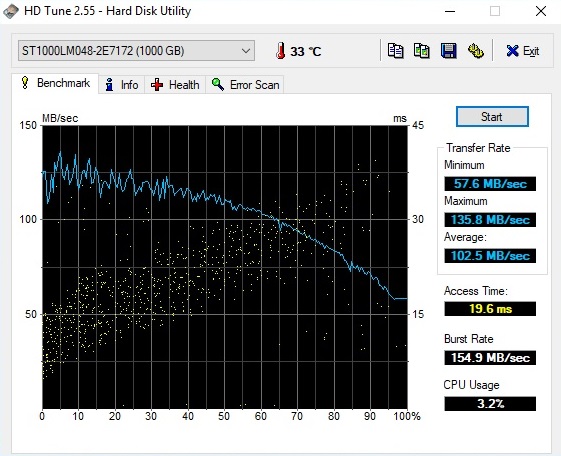
The former truly impressed us with its excellent read and write speeds. No wonder, given that the 970 EVO is one of the newest and most powerful PCIe/NVMe models in M.2 format. The relatively small 128 GB SSDs at work in the Acer Predator Helios 300 (Hynix) and the Asus ROG Strix GL703GE (Kingston) cannot hold a candle to our test device's SSD, even if we put the difference in capacity aside. The HDD's performance is unspectacular and typical of a 2.5-inch 5400 RPM drive.
| Schenker XMG A707 Coffee Lake Samsung SSD 970 EVO 250GB | Nexoc G739 Samsung PM961 MZVLW256HEHP | Acer Predator Helios 300 PH317-52-51M6 Hynix HFS128G39TND | Asus GL703GE-ES73 Kingston RBUSNS8154P3128GJ | |
|---|---|---|---|---|
| AS SSD | -3% | -70% | -71% | |
| Seq Read (MB/s) | 2589 | 2628 2% | 513 -80% | 993 -62% |
| Seq Write (MB/s) | 1449 | 1164 -20% | 128.2 -91% | 212.8 -85% |
| 4K Read (MB/s) | 52.8 | 47.68 -10% | 26.5 -50% | 18.93 -64% |
| 4K Write (MB/s) | 112.3 | 148.5 32% | 62.7 -44% | 59.1 -47% |
| Score Read (Points) | 1153 | 1619 40% | 414 -64% | 311 -73% |
| Score Write (Points) | 1592 | 651 -59% | 196 -88% | 196 -88% |
| Score Total (Points) | 3291 | 3031 -8% | 811 -75% | 634 -81% |

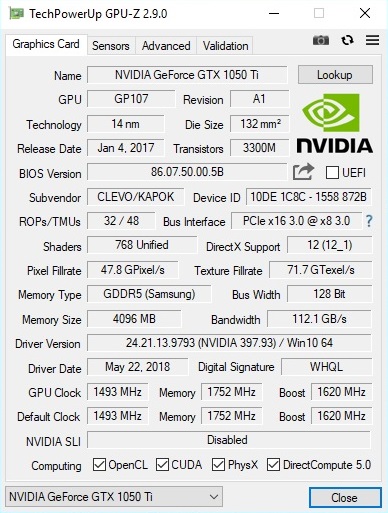
Graphics Card
As mentioned at the outset, buyers have to choose between a GeForce GTX 1050 and a GTX 1050 Ti. Unlike the hexa-core CPU, which will only be advantageous to a small number of users in specific circumstances, the GPU upgrade is certainly worth considering. Despite the fact that the amount of VRAM is identical (4 GB GDDR5), the GTX 1050 Ti is noticeably faster in almost every game and 3D application.
| 3DMark - 1920x1080 Fire Strike Graphics | |
| Average of class Gaming (12242 - 62849, n=121, last 2 years) | |
| Nexoc G739 | |
| Asus GL703GE-ES73 | |
| Schenker XMG A707 Coffee Lake | |
| Acer Predator Helios 300 PH317-52-51M6 | |
| 3DMark 11 - 1280x720 Performance GPU | |
| Average of class Gaming (21841 - 80022, n=109, last 2 years) | |
| Nexoc G739 | |
| Schenker XMG A707 Coffee Lake | |
| Acer Predator Helios 300 PH317-52-51M6 | |
| Asus GL703GE-ES73 | |
Need an example? In the 3DMark 13 Fire Strike Test, the stronger GPU came in 30% ahead (+25% @3DMark 11).
| 3DMark 11 Performance | 9585 points | |
| 3DMark Cloud Gate Standard Score | 27238 points | |
| 3DMark Fire Strike Score | 6956 points | |
Help | ||
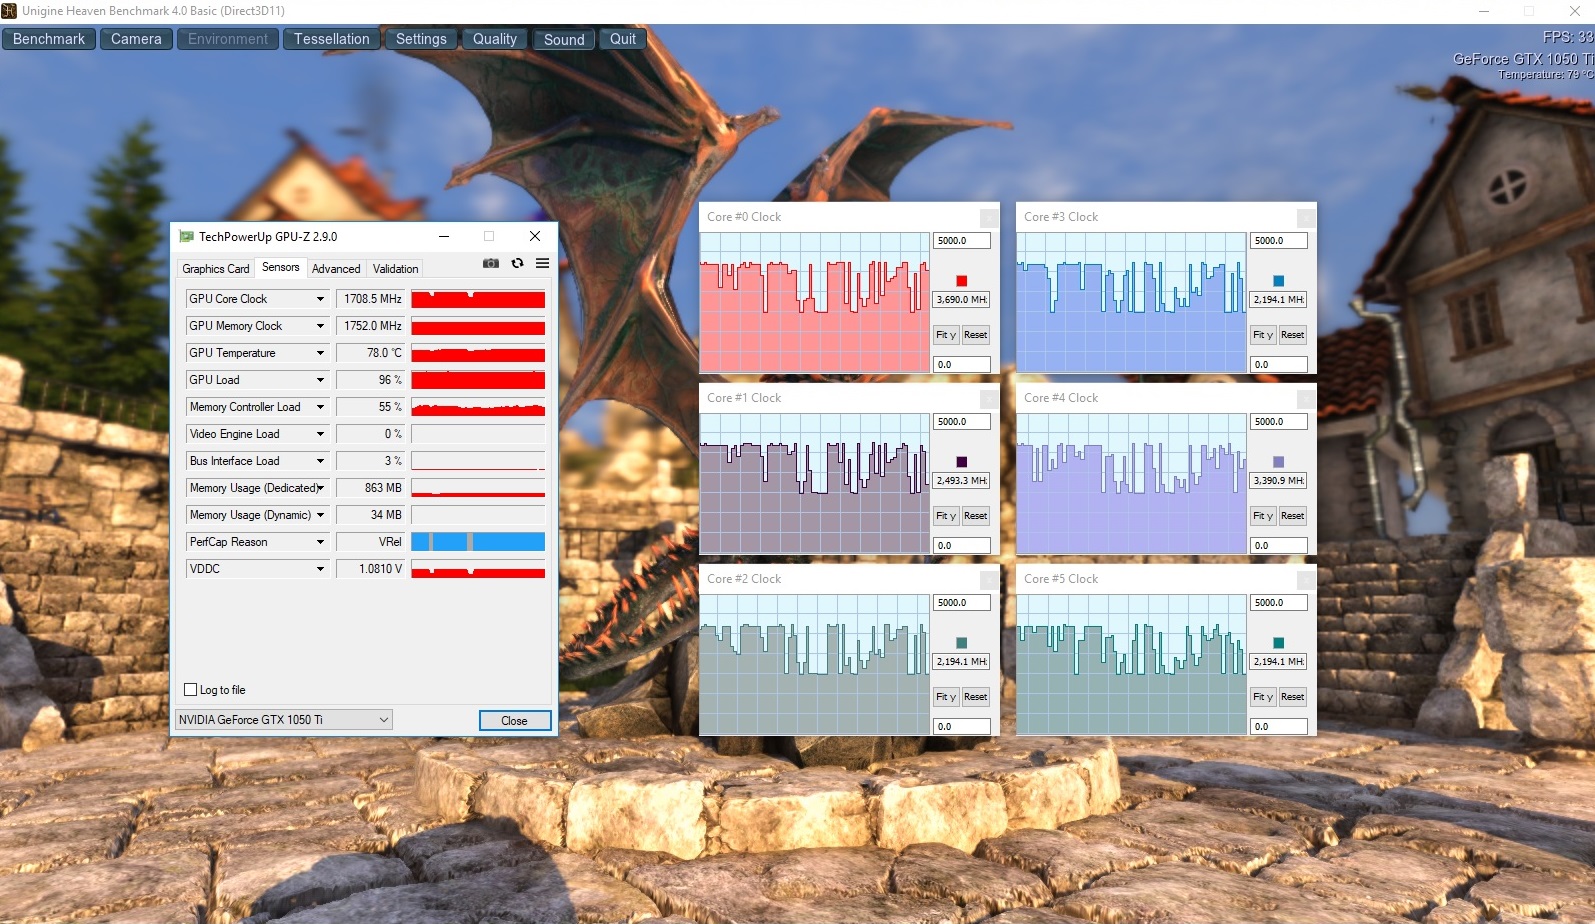
To determine whether the XMG A707 can maintain its performance over a longer period, as usual, we ran the RPG game “The Witcher 3” (FHD/Ultra) for around 60 minutes. The result: The GeForce GTX 1050 Ti achieves very consistent frame rates. Like the Intel CPU, the Nvidia GPU overclocks automatically. In 3D-mode, the chip surpasses its base clock speed by a substantial margin. Instead of 1493 MHz, in “The Witcher 3” we recorded a speed of 1700 MHz.
Gaming Performance
The GeForce GTX 1050 Ti is usually fast enough to play current games in the laptop's native Full HD resolution at high settings; occasionally it is even possible to play at maximum details. Only games with extremely high performance demands, ex. “The Division” or “Watch Dogs 2”, come to an average frame rate of under 40 FPS.
| The Witcher 3 | |
| 1920x1080 Ultra Graphics & Postprocessing (HBAO+) | |
| Average of class Gaming (95 - 240, n=8, last 2 years) | |
| Nexoc G739 | |
| Asus GL703GE-ES73 | |
| Acer Predator Helios 300 PH317-52-51M6 | |
| Schenker XMG A707 Coffee Lake | |
| 1920x1080 High Graphics & Postprocessing (Nvidia HairWorks Off) | |
| Average of class Gaming (181 - 341, n=3, last 2 years) | |
| Nexoc G739 | |
| Acer Predator Helios 300 PH317-52-51M6 | |
| Schenker XMG A707 Coffee Lake | |
With a GTX 1050, users would have to make many more sacrifices in terms of resolution and/or quality settings. Those who would identify themselves as passionate gamers, on the other hand, will not be happy with either of the available GPUs. Core gaming starts with the GeForce GTX 1060 (Max-Q). Anything less does not have enough performance power to handle future generations of games and higher resolutions.
| low | med. | high | ultra | |
|---|---|---|---|---|
| The Witcher 3 (2015) | 44.6 | 24.7 | ||
| The Division (2016) | 43.7 | 33.5 | ||
| Mirror's Edge Catalyst (2016) | 49.3 | 44.9 | ||
| Dishonored 2 (2016) | 47 | 41.2 | ||
| Watch Dogs 2 (2016) | 40.1 | 27.9 | ||
| FIFA 18 (2017) | 205 | 194 | ||
| Wolfenstein II: The New Colossus (2017) | 54.4 | |||
| Need for Speed Payback (2017) | 56.1 | 51.2 | ||
| Star Wars Battlefront 2 (2017) | 50.3 | 40.8 | ||
| The Crew 2 (2018) | 46.7 | 42.2 |
Emissions - A sound to forget
When it comes to fan control, most Clevo Barebones do not perform particularly well. The N871EK1 case is no exception. In idle mode and when the computer is running lightweight applications (office, video, web), the fan seems to always run in one of two ways. Either the laptop is almost entirely inaudible (GPU fan inactive, CPU fan noise unobtrusive), or it hums at an unmistakably noticeable volume. The increases in fan speed occur without any traceable cause and thus appear to be random. Fortunately, optimizing the energy-saving settings can moderate the erratic changes in fan speed. In battery mode, the problem generally arises less often.
Under load, the XMG A707 performs reasonably well: 42-46 dB(A) is neither quiet nor especially loud. The other competitors equipped with a GTX 1050 Ti - the Acer Helios 300 and the Asus GL703GE - are often louder in 3D-mode.
Noise level
| Idle |
| 31 / 32 / 44 dB(A) |
| HDD |
| 32 dB(A) |
| Load |
| 44 / 46 dB(A) |
 | ||
30 dB silent 40 dB(A) audible 50 dB(A) loud |
||
min: | ||
| Schenker XMG A707 Coffee Lake i7-8750H, GeForce GTX 1050 Ti Mobile | Nexoc G739 i7-7700HQ, GeForce GTX 1050 Ti Mobile | Acer Predator Helios 300 PH317-52-51M6 i5-8300H, GeForce GTX 1050 Ti Mobile | Asus GL703GE-ES73 i7-8750H, GeForce GTX 1050 Ti Mobile | Average of class Gaming | |
|---|---|---|---|---|---|
| Noise | 0% | 2% | 6% | 11% | |
| off / environment * (dB) | 29 | 30 -3% | 29 -0% | 28.2 3% | 24.1 ? 17% |
| Idle Minimum * (dB) | 31 | 31 -0% | 29 6% | 28.2 9% | 25.8 ? 17% |
| Idle Average * (dB) | 32 | 32 -0% | 31 3% | 30 6% | 27.5 ? 14% |
| Idle Maximum * (dB) | 44 | 38 14% | 33 25% | 32 27% | 30 ? 32% |
| Load Average * (dB) | 44 | 44 -0% | 45 -2% | 36 18% | 43.1 ? 2% |
| Witcher 3 ultra * (dB) | 42 | 45 -7% | 48.8 -16% | ||
| Load Maximum * (dB) | 46 | 50 -9% | 51 -11% | 48.8 -6% | 54 ? -17% |
* ... smaller is better
Temperature
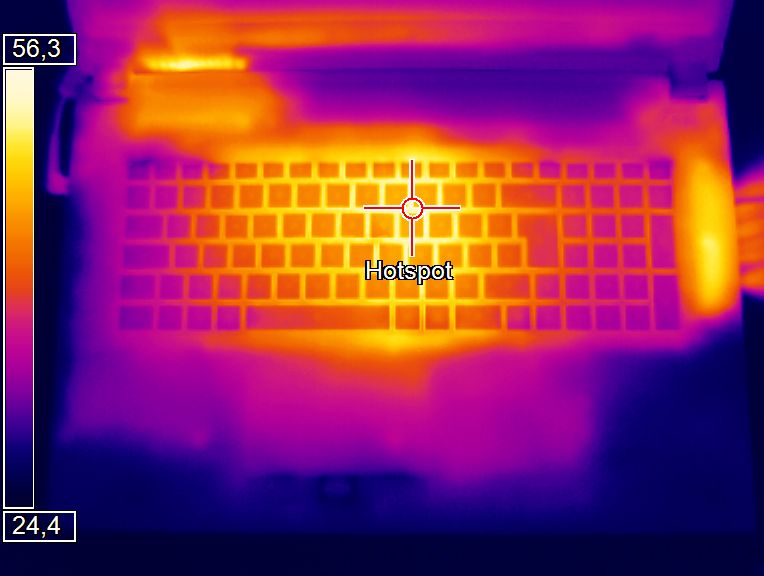
Like the background noise, the laptop's temperatures also prove to remain moderate. Truth be told, in extreme situations the case does exceed 50°C (122°F) in one spot, but the WASD keys and the palm rest do not heat up immoderately. In idle mode, most of the case remains pleasantly cool; only a few spots warm up past 30°C (86°F).
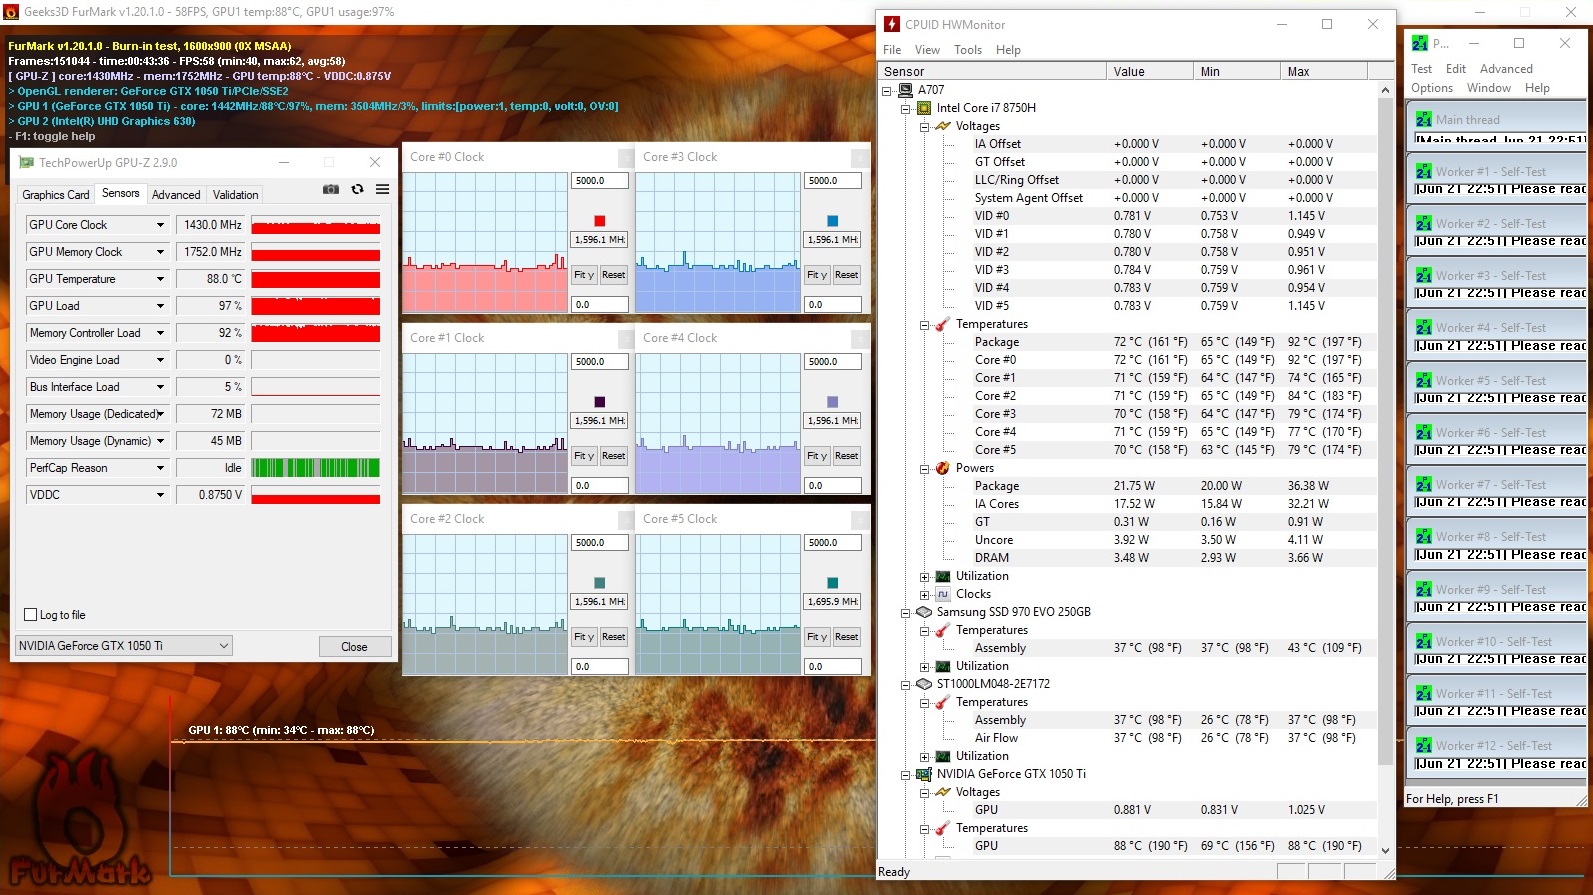
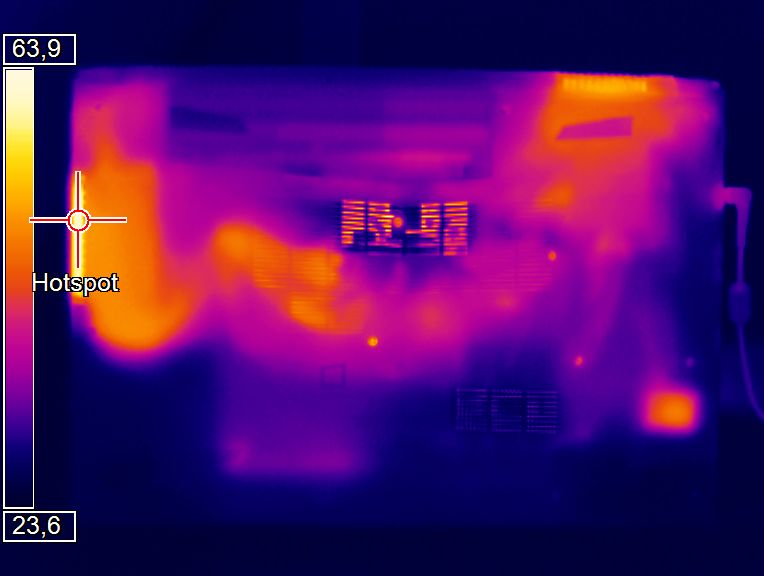
As usual, the components get substantially hotter. After 60 minutes in the stress test with FurMark and Prime95, the mildly throttling GeForce GTX 1050 Ti heats to 88°C (190.4°F) – rather a high temperature. The Core i7-8750H, which throttles to around 1.6 GHz, reaches an average temperature of just 70°C (158°F).
(-) The maximum temperature on the upper side is 55 °C / 131 F, compared to the average of 40.4 °C / 105 F, ranging from 21.2 to 68.8 °C for the class Gaming.
(-) The bottom heats up to a maximum of 49 °C / 120 F, compared to the average of 43.2 °C / 110 F
(+) In idle usage, the average temperature for the upper side is 27.9 °C / 82 F, compared to the device average of 33.9 °C / 93 F.
(-) Playing The Witcher 3, the average temperature for the upper side is 42.1 °C / 108 F, compared to the device average of 33.9 °C / 93 F.
(±) The palmrests and touchpad can get very hot to the touch with a maximum of 39 °C / 102.2 F.
(-) The average temperature of the palmrest area of similar devices was 28.8 °C / 83.8 F (-10.2 °C / -18.4 F).
| Schenker XMG A707 Coffee Lake i7-8750H, GeForce GTX 1050 Ti Mobile | Nexoc G739 i7-7700HQ, GeForce GTX 1050 Ti Mobile | Acer Predator Helios 300 PH317-52-51M6 i5-8300H, GeForce GTX 1050 Ti Mobile | Asus GL703GE-ES73 i7-8750H, GeForce GTX 1050 Ti Mobile | Average of class Gaming | |
|---|---|---|---|---|---|
| Heat | 9% | 3% | -12% | 6% | |
| Maximum Upper Side * (°C) | 55 | 50.6 8% | 50 9% | 58.6 -7% | 45.2 ? 18% |
| Maximum Bottom * (°C) | 49 | 50.8 -4% | 52 -6% | 59.4 -21% | 48.2 ? 2% |
| Idle Upper Side * (°C) | 32 | 28.7 10% | 33 -3% | 35 -9% | 31.1 ? 3% |
| Idle Bottom * (°C) | 34 | 27.1 20% | 30 12% | 37 -9% | 34.3 ? -1% |
* ... smaller is better
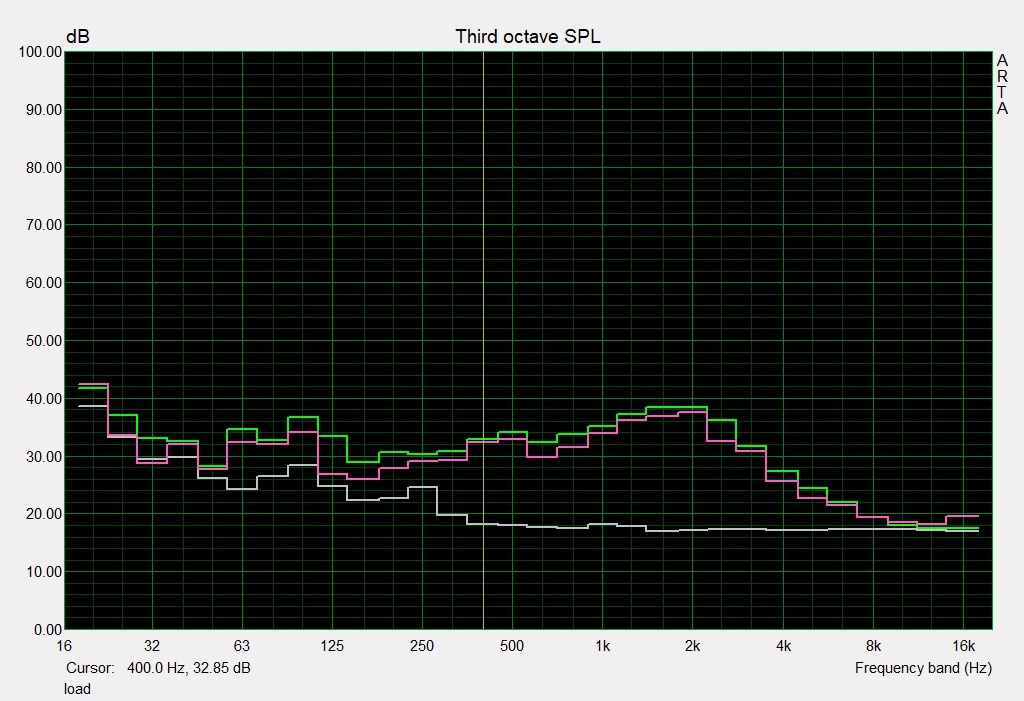
Speakers
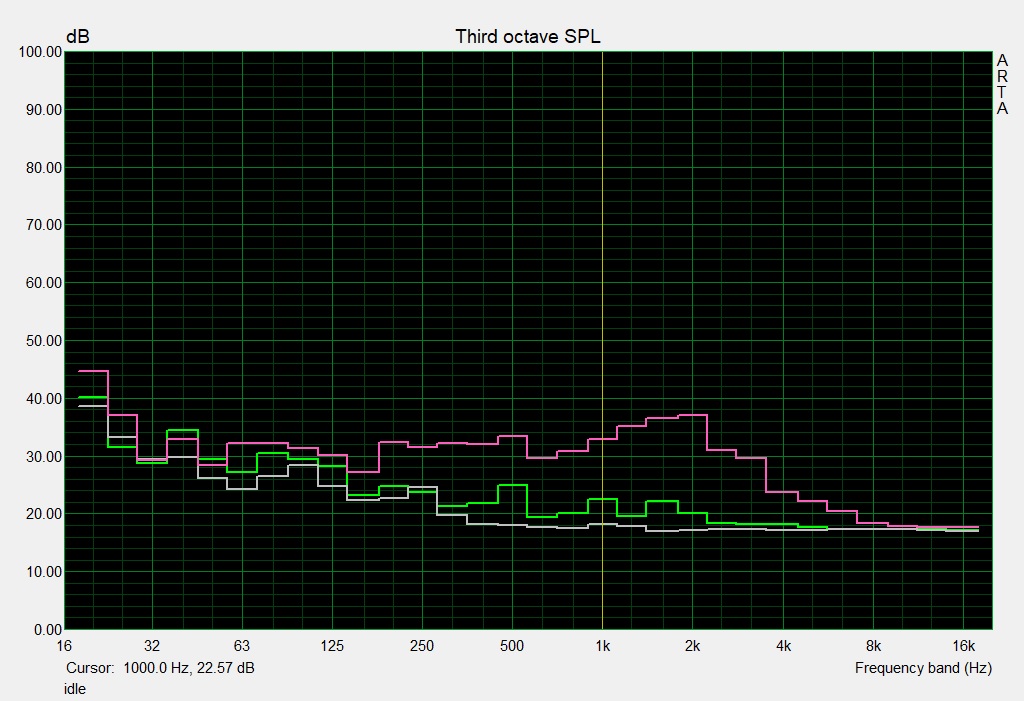
Schenker XMG A707 Coffee Lake audio analysis
(±) | speaker loudness is average but good (77 dB)
Bass 100 - 315 Hz
(-) | nearly no bass - on average 26.4% lower than median
(±) | linearity of bass is average (12.6% delta to prev. frequency)
Mids 400 - 2000 Hz
(±) | higher mids - on average 6.9% higher than median
(±) | linearity of mids is average (9.4% delta to prev. frequency)
Highs 2 - 16 kHz
(±) | higher highs - on average 6.4% higher than median
(±) | linearity of highs is average (8.5% delta to prev. frequency)
Overall 100 - 16.000 Hz
(-) | overall sound is not linear (31.1% difference to median)
Compared to same class
» 97% of all tested devices in this class were better, 2% similar, 2% worse
» The best had a delta of 6%, average was 18%, worst was 132%
Compared to all devices tested
» 90% of all tested devices were better, 2% similar, 8% worse
» The best had a delta of 4%, average was 24%, worst was 134%
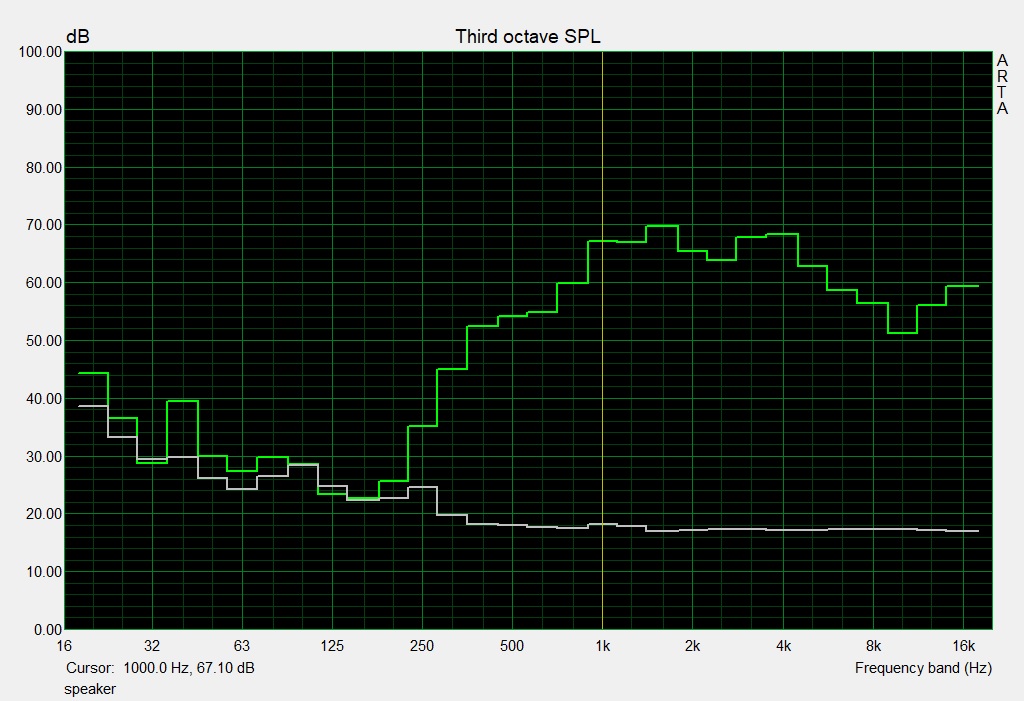
Acer Predator Helios 300 PH317-52-51M6 audio analysis
(+) | speakers can play relatively loud (82 dB)
Bass 100 - 315 Hz
(±) | reduced bass - on average 10.8% lower than median
(-) | bass is not linear (15.2% delta to prev. frequency)
Mids 400 - 2000 Hz
(±) | higher mids - on average 9.7% higher than median
(+) | mids are linear (6.7% delta to prev. frequency)
Highs 2 - 16 kHz
(+) | balanced highs - only 3.2% away from median
(+) | highs are linear (5.6% delta to prev. frequency)
Overall 100 - 16.000 Hz
(±) | linearity of overall sound is average (18.4% difference to median)
Compared to same class
» 59% of all tested devices in this class were better, 9% similar, 33% worse
» The best had a delta of 6%, average was 18%, worst was 132%
Compared to all devices tested
» 41% of all tested devices were better, 8% similar, 52% worse
» The best had a delta of 4%, average was 24%, worst was 134%
Energy Management - More stamina thanks to Optimus
Because the XMG A707 supports Nvidia's Optimus graphics switching, the 17-inch laptop needs very little power in idle mode. 11-20 watts places our test device right in between the Helios 300 (6-13 watts) and the Asus GL703GE (13-25 watts). A maximum of 136 watts under load indicates that laptop's 150-watt power supply provides enough energy in any circumstance (120 watts @GTX1050).
| Off / Standby | |
| Idle | |
| Load |
|
Key:
min: | |
| Schenker XMG A707 Coffee Lake i7-8750H, GeForce GTX 1050 Ti Mobile | Nexoc G739 i7-7700HQ, GeForce GTX 1050 Ti Mobile | Acer Predator Helios 300 PH317-52-51M6 i5-8300H, GeForce GTX 1050 Ti Mobile | Asus GL703GE-ES73 i7-8750H, GeForce GTX 1050 Ti Mobile | Average of class Gaming | |
|---|---|---|---|---|---|
| Power Consumption | 3% | 19% | -14% | -36% | |
| Idle Minimum * (Watt) | 11 | 7 36% | 6 45% | 12.8 -16% | 13.3 ? -21% |
| Idle Average * (Watt) | 14 | 14 -0% | 9 36% | 18.1 -29% | 19 ? -36% |
| Idle Maximum * (Watt) | 20 | 23 -15% | 13 35% | 24.7 -23% | 24.5 ? -23% |
| Load Average * (Watt) | 96 | 82 15% | 95 1% | 98.4 -3% | 108.1 ? -13% |
| Witcher 3 ultra * (Watt) | 97 | 102 -5% | 122.5 -26% | ||
| Load Maximum * (Watt) | 136 | 163 -20% | 134 1% | 114.6 16% | 254 ? -87% |
* ... smaller is better
Battery Life
Although the battery only provides 62 Wh, the system scores points for its surprisingly long battery life. Over 2 hours in 3D-mode (Battery Eater Classic Test at maximum brightness) is just as respectable as around 12 hours in idle mode (Battery Eater Reader's Test at minimum brightness). If the user sets the brightness to around 150 cd/m² and surfs the internet via WLAN, one charge provides 6-6.5 hours of battery life. Compared to the competition, only the Acer Helios 300 can keep up with this run time. The Helios 300's weaker battery (48 Wh) is counterbalanced by its more feeble CPU.
| Schenker XMG A707 Coffee Lake i7-8750H, GeForce GTX 1050 Ti Mobile, 62 Wh | Nexoc G739 i7-7700HQ, GeForce GTX 1050 Ti Mobile, 62 Wh | Acer Predator Helios 300 PH317-52-51M6 i5-8300H, GeForce GTX 1050 Ti Mobile, 48 Wh | Asus GL703GE-ES73 i7-8750H, GeForce GTX 1050 Ti Mobile, 64 Wh | Average of class Gaming | |
|---|---|---|---|---|---|
| Battery runtime | -16% | -11% | -47% | -18% | |
| Reader / Idle (h) | 11.7 | 10.2 -13% | 11.8 1% | 5.8 -50% | 8.71 ? -26% |
| WiFi v1.3 (h) | 6.3 | 4.8 -24% | 5.9 -6% | 4.8 -24% | 7.01 ? 11% |
| Load (h) | 2.4 | 2.1 -12% | 1.7 -29% | 0.8 -67% | 1.47 ? -39% |
| H.264 (h) | 5.4 | 8.26 ? |
Pros
Cons
Verdict - Garden-variety 17-inch laptop
All things considered, the Schenker XMG A707 is a well-designed budget gaming laptop that is more or less on par with the Acer Predator Helios 300.
Advantages include not only the high-contrast Full HD panel, but also the comparatively good battery life. The laptop can hold its own in terms of performance as well. Within the device's price bracket (less than 1500 Euros/~$1750), the Core i7-8750H and GeForce GTX 1050 Ti represent one of the most potent teams on the market.
The input devices, case, and wide array of connections are satisfactory as well, although they are more or less average compared to the competition. Clevo, the Barebone manufacturer, could substantially improve the laptop's sound. The sound generated by the speakers is a dead loss.
Those who simply plug in a headset or external speakers will end up with a good overall package.
Schenker XMG A707 Coffee Lake
- 07/07/2018 v6 (old)
Florian Glaser
Price comparison
