Asus GL703GE (Core i7-8750H, GTX 1050 Ti) Laptop Review
Coffee Lake is here, and with new processors come several new changes. Intel's six-core Core i7-8750H replaces the venerable Core i7-7700HQ. The new CPU adds two more cores and four more threads. As usual, Asus is among the first to push Intel’s new silicon with their ROG line of gaming laptops. The GL703GE under review today is reflective of what is sure to become the standard configuration for mid-tier gaming laptops this year (at least until Nvidia's new Volta GPUs hit the market).
One would expect to see a 50% increase in processor performance to match the 50% increase in core count. We'll see whether or not this hypothesis holds true. In addition to the Core i7-8750H, the GL703GE packs a GeForce GTX 1050 Ti and 120 Hz panel, which may be enticing to competitive gamers looking for a decisive edge in popular multiplayer titles like DOTA 2 and CS: GO.
Since the GL703GE is essentially a retooling of the GL703VM, we will forego discussion of the exterior factors of the notebook in favor of focusing on the performance benefits brought by Coffee Lake. For details on the case and keyboard, please refer to our review of the Asus ROG Strix GL703VM.
At $1250 MSRP, consumers are definitely paying for the new and improved CPU. We will see how the GL703GE compares to its older brother, the Asus Strix GL703VM. Some other competitors include the HP Omen 17 (GTX 1050 Ti), MSI GE72, and MSI GP62. We'll also examine how the Core i7-8750H compares to other high-end CPUs like AMD's Ryzen 7 1700 and Intel's Kaby Lake G Core i5-8305G. Let's down this cup of joe and see if the premium is worth it.
| SD Card Reader | |
| average JPG Copy Test (av. of 3 runs) | |
| Average of class Gaming (20.9 - 210, n=54, last 2 years) | |
| Asus GL703GE-ES73 (Toshiba Exceria Pro SDXC 64 GB UHS-II) | |
| HP Omen 17-w206ng (Toshiba Exceria Pro SDXC 64 GB UHS-II) | |
| Asus Strix GL703VM-DB74 (Toshiba Exceria Pro SDXC 64 GB UHS-II) | |
| MSI GE72 7RE-046 (Toshiba Exceria Pro SDXC 64 GB UHS-II) | |
| maximum AS SSD Seq Read Test (1GB) | |
| Average of class Gaming (25.5 - 261, n=51, last 2 years) | |
| Asus Strix GL703VM-DB74 (Toshiba Exceria Pro SDXC 64 GB UHS-II) | |
| Asus GL703GE-ES73 (Toshiba Exceria Pro SDXC 64 GB UHS-II) | |
| HP Omen 17-w206ng (Toshiba Exceria Pro SDXC 64 GB UHS-II) | |
| MSI GE72 7RE-046 (Toshiba Exceria Pro SDXC 64 GB UHS-II) | |
| Networking | |
| iperf3 transmit AX12 | |
| Asus GL703GE-ES73 | |
| HP Omen 17-w206ng | |
| Asus Strix GL703VM-DB74 | |
| MSI GE72 7RE-046 | |
| iperf3 receive AX12 | |
| HP Omen 17-w206ng | |
| Asus GL703GE-ES73 | |
| Asus Strix GL703VM-DB74 | |
| MSI GE72 7RE-046 | |
Display
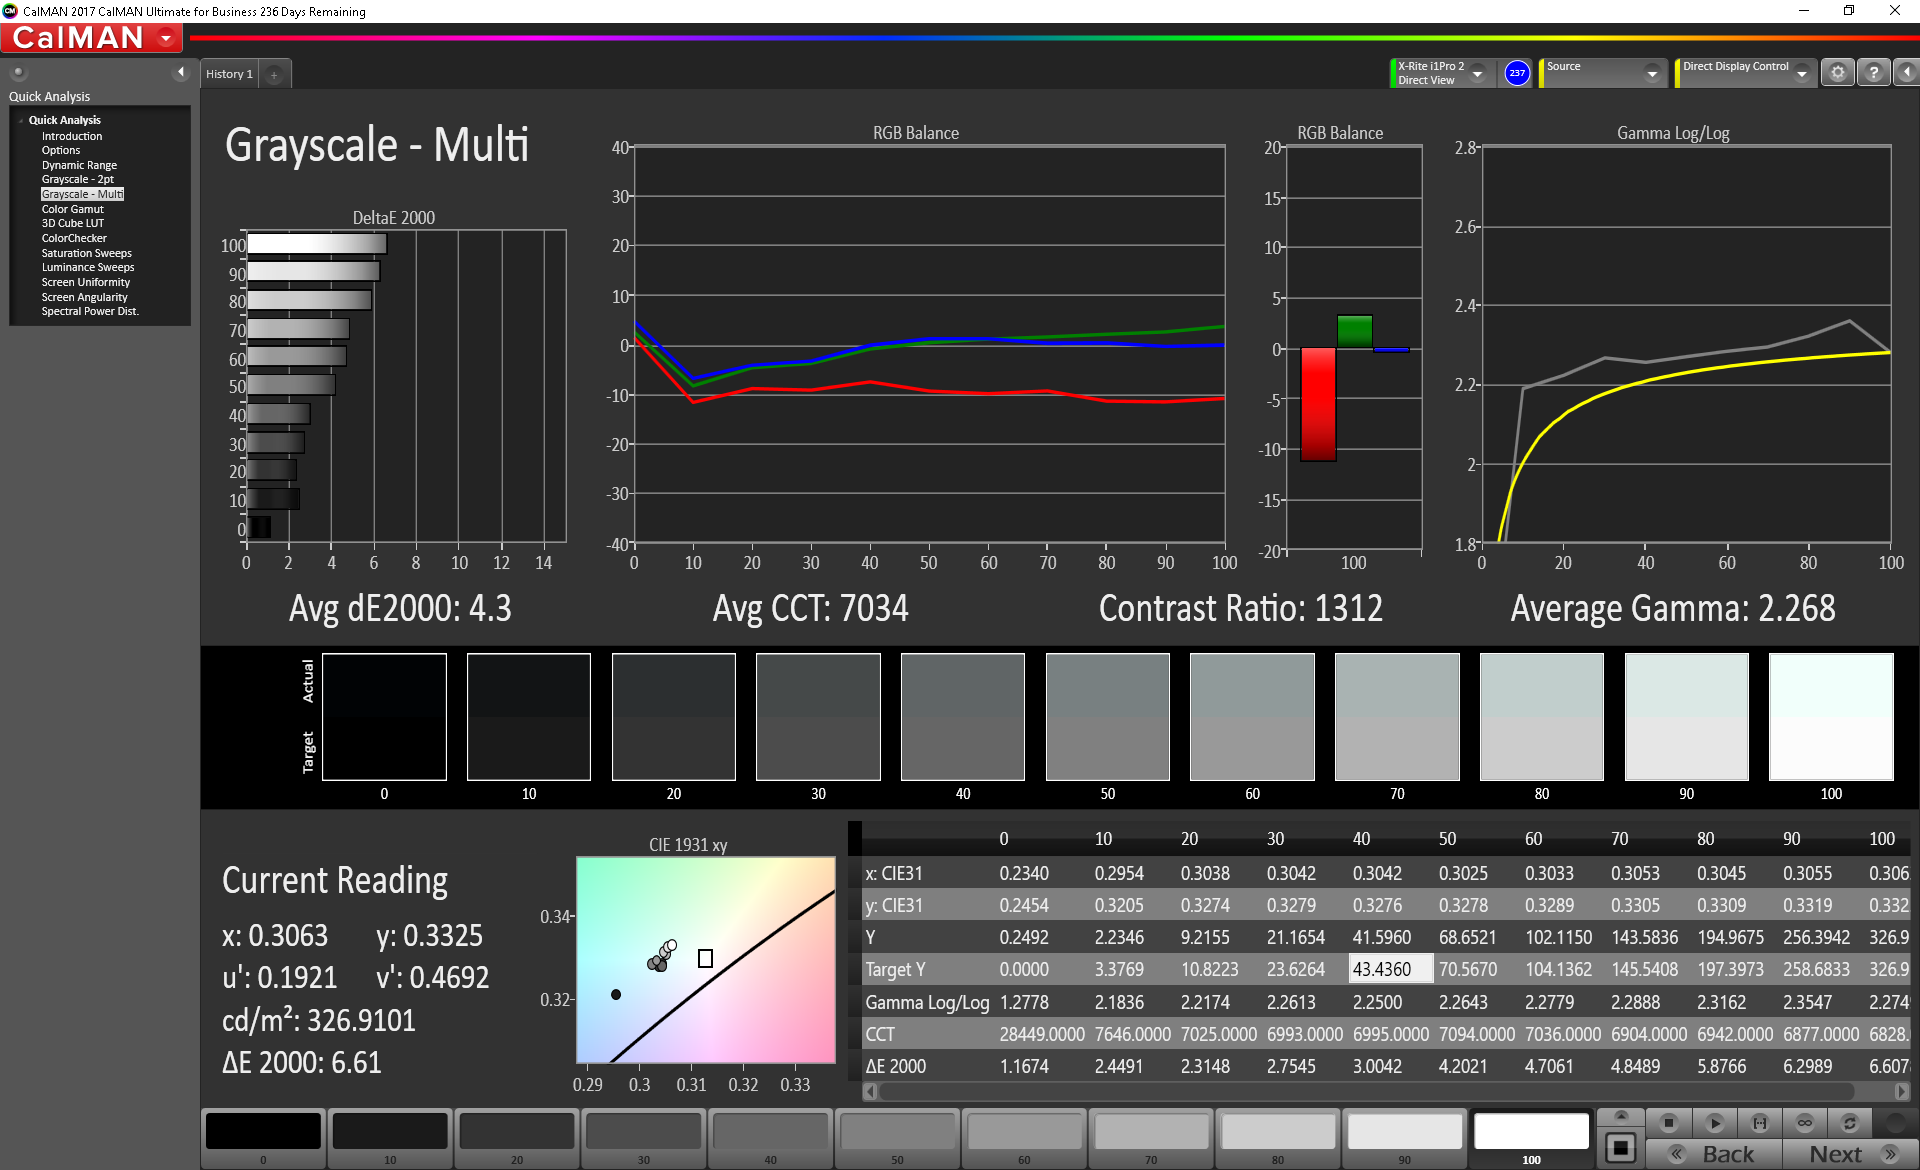
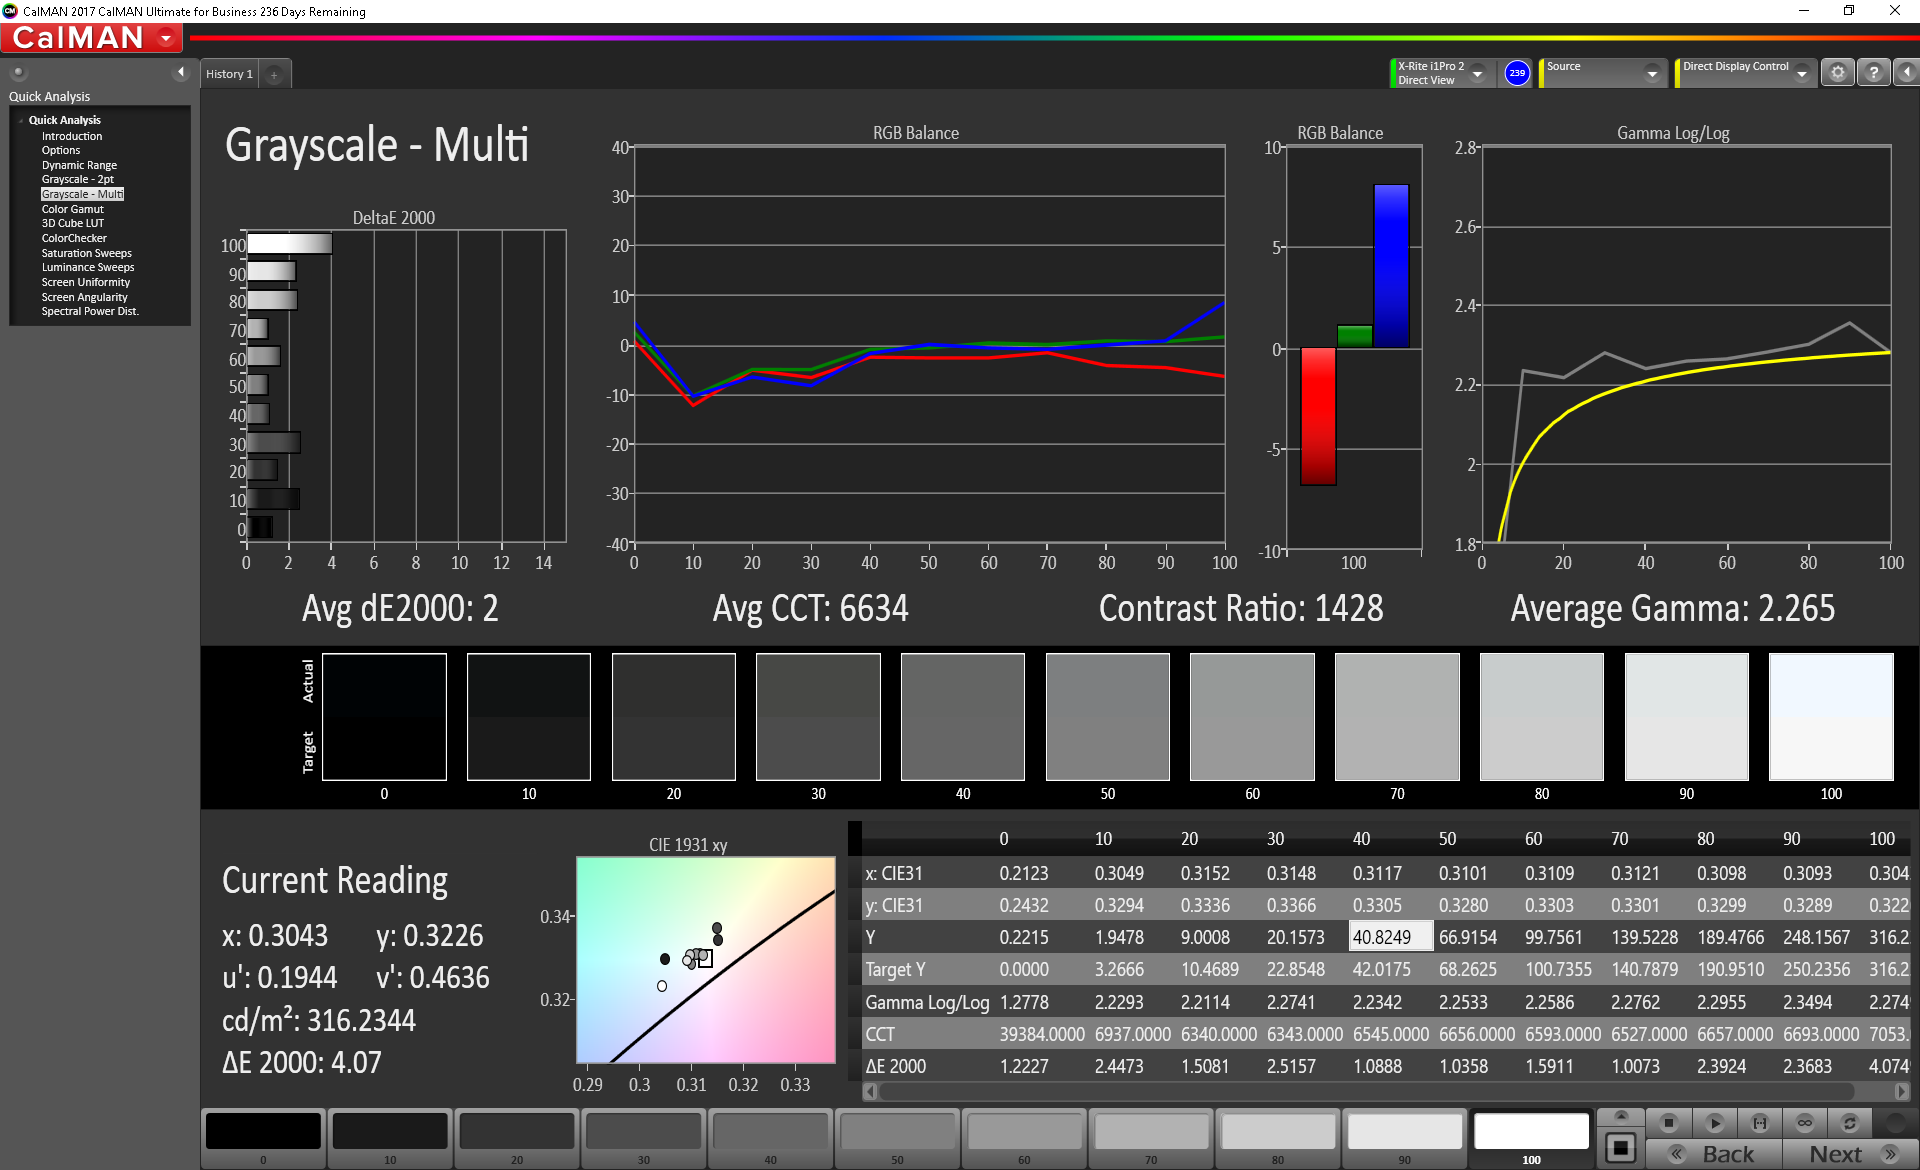
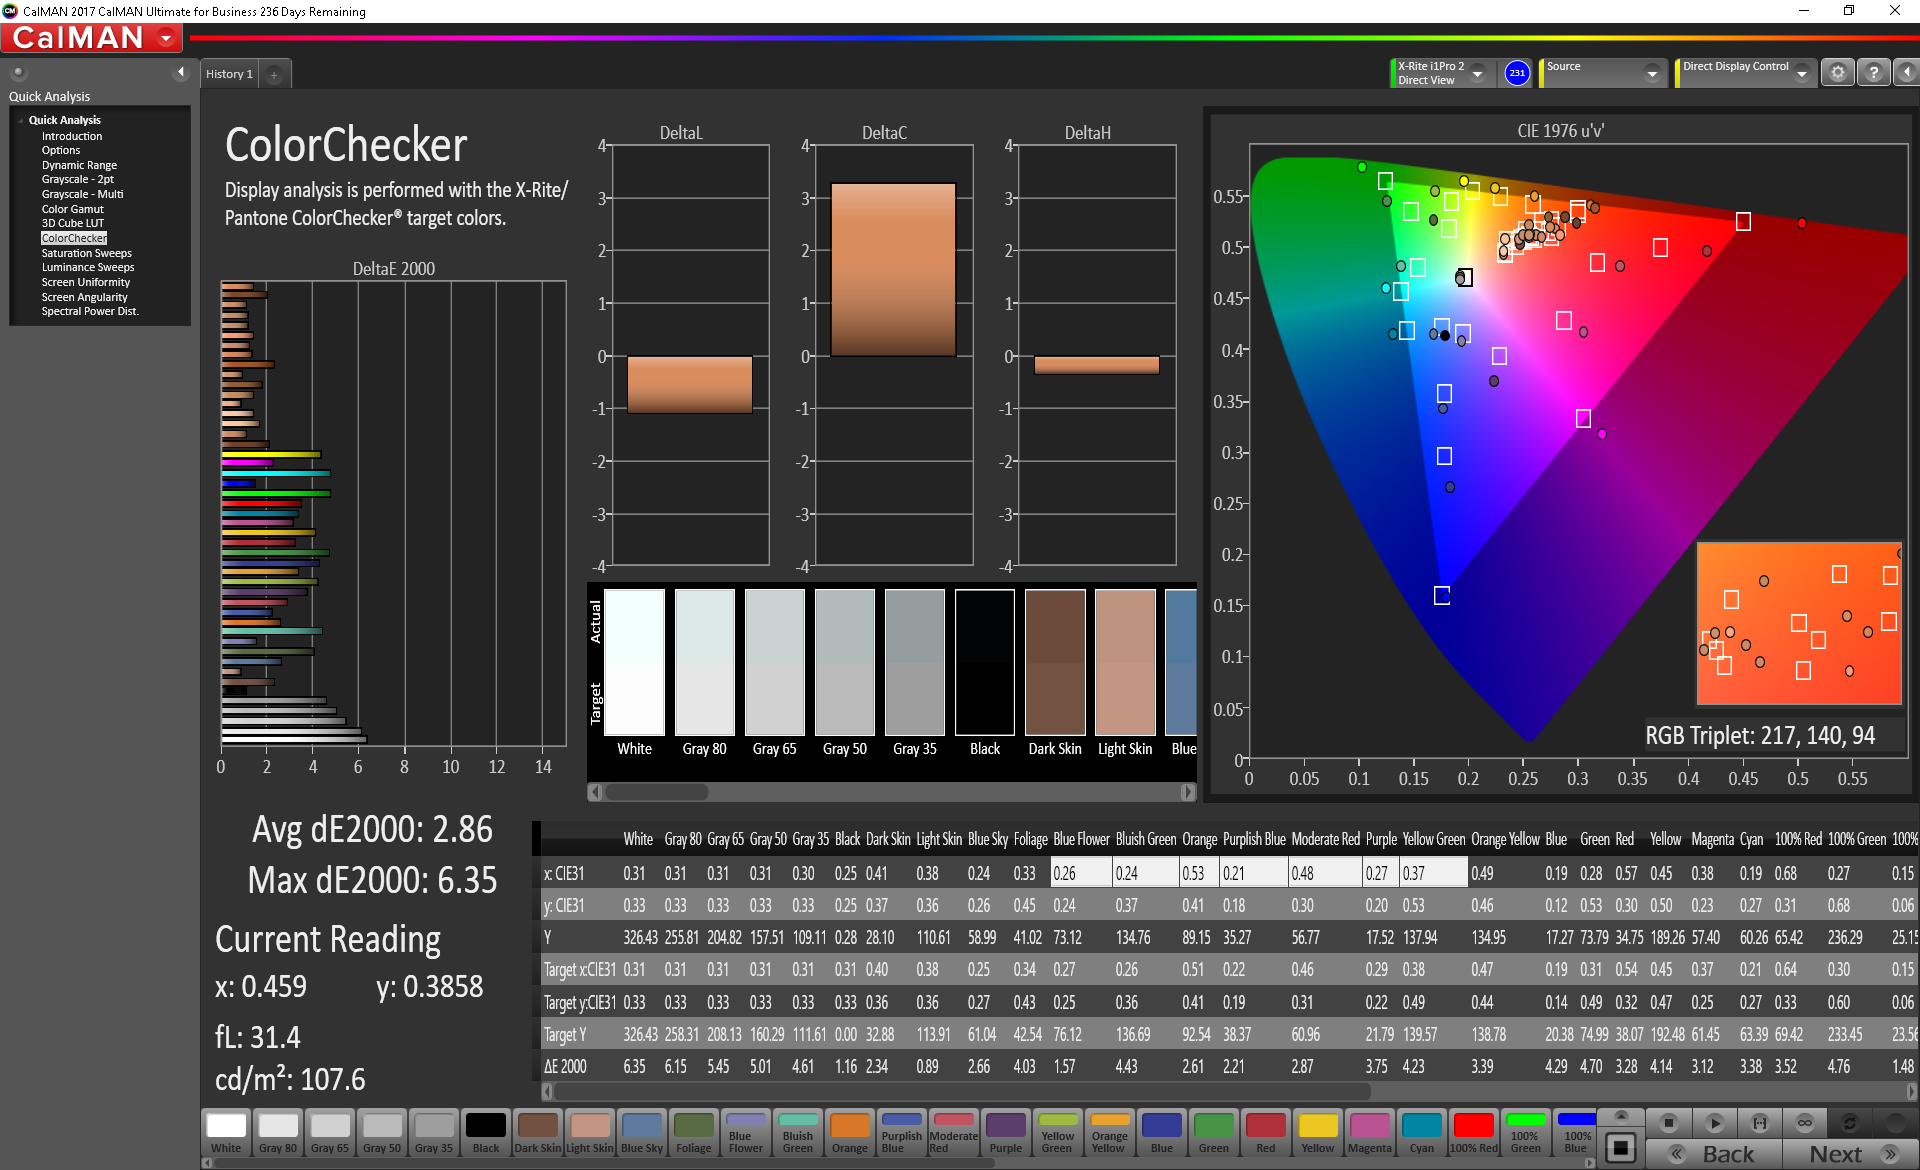
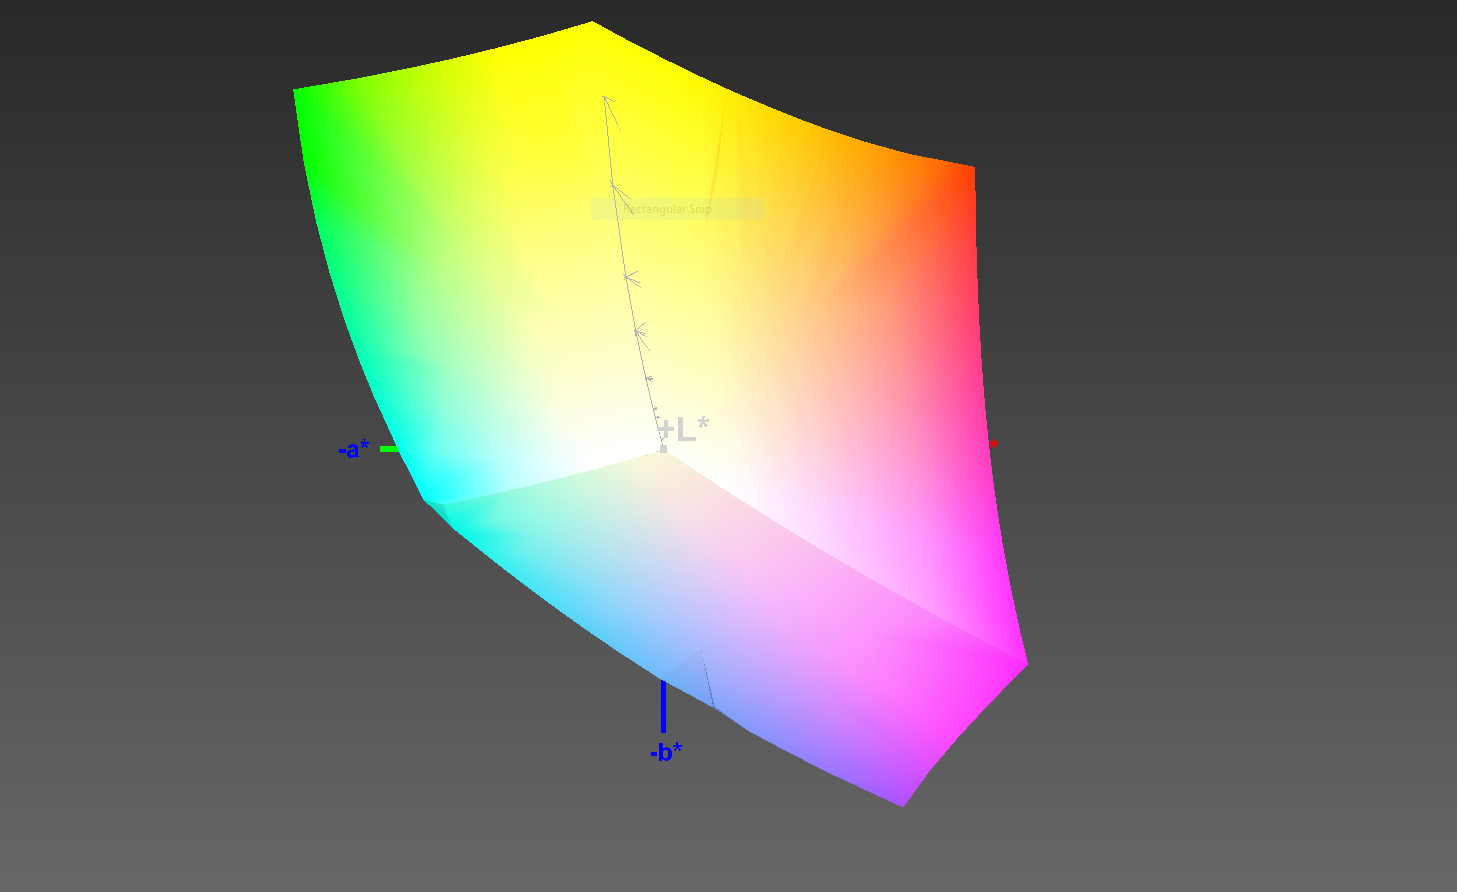
The AU Optronics panel is a definite improvement over the older GL703VM's. While it keeps the same 120 Hz refresh rate, color accuracy and coverage are much better. The GL703GE manages to capture almost the entire sRGB gamut (99.81%) and about 75% of the AdobeRGB gamut. Colors look vibrant across the panel. Most colors are accurate, although greens have a bit of a wider variance. Color temperature also has a slight blue shift to it. This isn't noticeable in most images, but whites have an aqua hue. There is also a slight graininess visible on white screens, something that is common to matte displays. This isn't distracting unless viewing the screen from about 8 inches or closer. In sum, the panel is excellent for a mid-tier laptop. Users can benefit from a fast refresh rate without the sacrifices to color accuracy and picture quality typically seen in cheaper HFR displays.
| |||||||||||||||||||||||||
Brightness Distribution: 86 %
Center on Battery: 331.1 cd/m²
Contrast: 1068:1 (Black: 0.31 cd/m²)
ΔE ColorChecker Calman: 2.86 | ∀{0.5-29.43 Ø4.72}
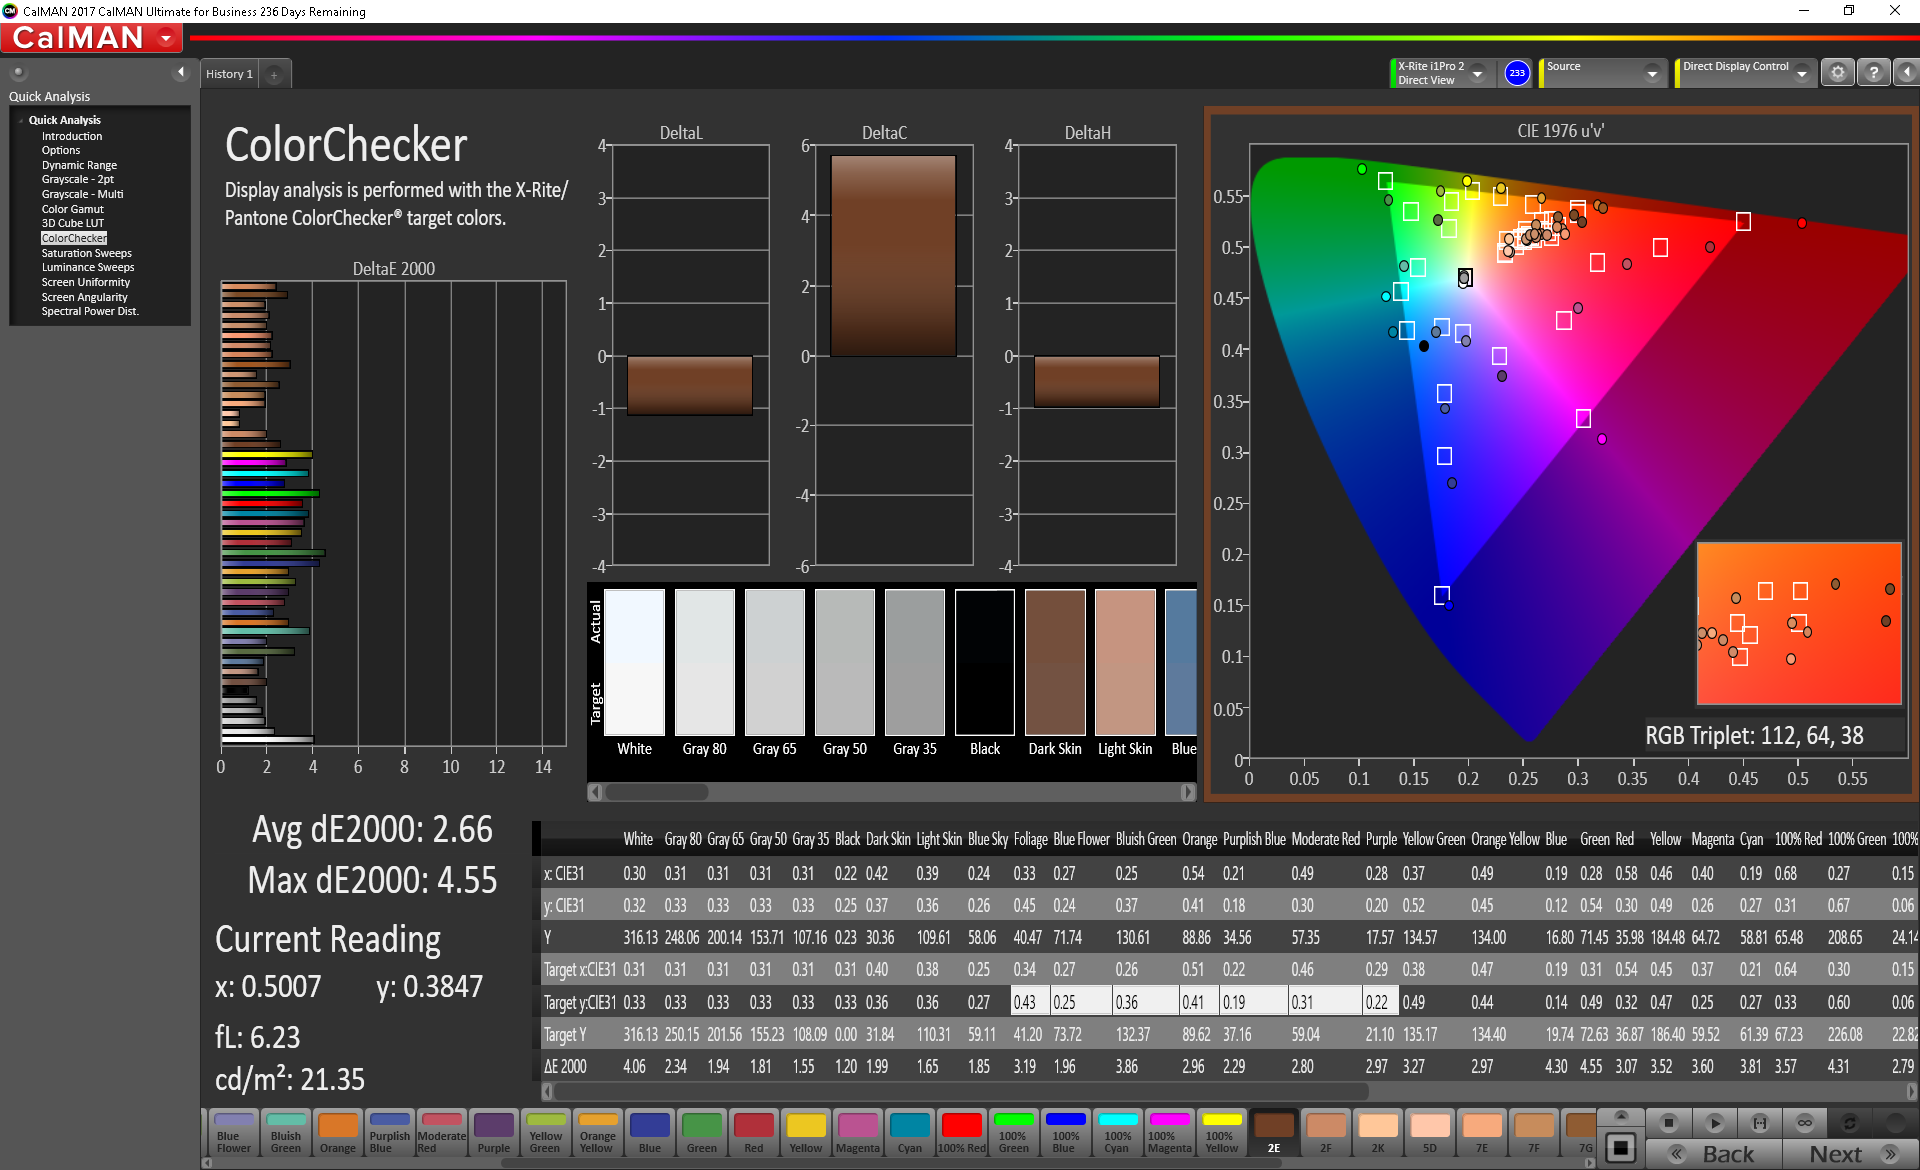
calibrated: 2.66
ΔE Greyscale Calman: 4.3 | ∀{0.09-98 Ø4.97}
100% sRGB (Argyll 1.6.3 3D)
75% AdobeRGB 1998 (Argyll 1.6.3 3D)
83.1% AdobeRGB 1998 (Argyll 3D)
99.8% sRGB (Argyll 3D)
90.1% Display P3 (Argyll 3D)
Gamma: 2.268
CCT: 7034 K
| Asus GL703GE-ES73 Chi Mei CMN1747, TN, 17.3", 1920x1080 | Asus Strix GL703VM-DB74 AU Optronics B173HAN01.1, IPS, 17.3", 1920x1080 | HP Omen 17-w206ng Chi Mei CMN1738, IPS, 17.3", 1920x1080 | MSI GE72 7RE-046 N173HHE-G32 (CMN1747), TN LED, 17.3", 1920x1080 | |
|---|---|---|---|---|
| Display | -23% | -17% | 1% | |
| Display P3 Coverage (%) | 90.1 | 61.5 -32% | 67.2 -25% | 90.7 1% |
| sRGB Coverage (%) | 99.8 | 87.2 -13% | 93.1 -7% | 99.9 0% |
| AdobeRGB 1998 Coverage (%) | 83.1 | 62.7 -25% | 67.4 -19% | 85.2 3% |
| Response Times | -172% | -212% | -68% | |
| Response Time Grey 50% / Grey 80% * (ms) | 11.6 ? | 30.8 ? -166% | 38 ? -228% | 27 ? -133% |
| Response Time Black / White * (ms) | 8.8 ? | 24.4 ? -177% | 26 ? -195% | 9 ? -2% |
| PWM Frequency (Hz) | 26040 ? | 200 ? | ||
| Screen | -17% | -12% | -24% | |
| Brightness middle (cd/m²) | 331.1 | 319.5 -4% | 318 -4% | 253 -24% |
| Brightness (cd/m²) | 312 | 293 -6% | 295 -5% | 230 -26% |
| Brightness Distribution (%) | 86 | 67 -22% | 79 -8% | 86 0% |
| Black Level * (cd/m²) | 0.31 | 0.65 -110% | 0.25 19% | 0.24 23% |
| Contrast (:1) | 1068 | 492 -54% | 1272 19% | 1054 -1% |
| Colorchecker dE 2000 * | 2.86 | 3.17 -11% | 4.7 -64% | 5.01 -75% |
| Colorchecker dE 2000 max. * | 6.35 | 5.32 16% | 8.8 -39% | 10.4 -64% |
| Colorchecker dE 2000 calibrated * | 2.66 | |||
| Greyscale dE 2000 * | 4.3 | 1.6 63% | 5 -16% | 7.26 -69% |
| Gamma | 2.268 97% | 2.22 99% | 2.28 96% | 2.09 105% |
| CCT | 7034 92% | 6668 97% | 7374 88% | 6329 103% |
| Color Space (Percent of AdobeRGB 1998) (%) | 75 | 56 -25% | 61 -19% | 76 1% |
| Color Space (Percent of sRGB) (%) | 100 | 87 -13% | 93 -7% | 100 0% |
| Total Average (Program / Settings) | -71% /
-39% | -80% /
-40% | -30% /
-24% |
* ... smaller is better
Display Response Times
| ↔ Response Time Black to White | ||
|---|---|---|
| 8.8 ms ... rise ↗ and fall ↘ combined | ↗ 6 ms rise | 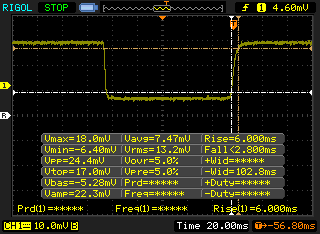 |
| ↘ 2.8 ms fall | ||
| The screen shows fast response rates in our tests and should be suited for gaming. In comparison, all tested devices range from 0.1 (minimum) to 240 (maximum) ms. » 25 % of all devices are better. This means that the measured response time is better than the average of all tested devices (19.8 ms). | ||
| ↔ Response Time 50% Grey to 80% Grey | ||
| 11.6 ms ... rise ↗ and fall ↘ combined | ↗ 6 ms rise | 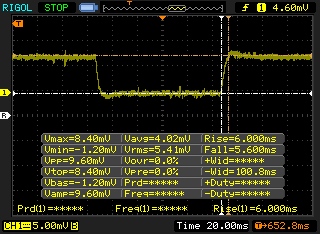 |
| ↘ 5.6 ms fall | ||
| The screen shows good response rates in our tests, but may be too slow for competitive gamers. In comparison, all tested devices range from 0.165 (minimum) to 636 (maximum) ms. » 25 % of all devices are better. This means that the measured response time is better than the average of all tested devices (31 ms). | ||
Screen Flickering / PWM (Pulse-Width Modulation)
| Screen flickering / PWM detected | 26040 Hz | ≤ 25 % brightness setting | 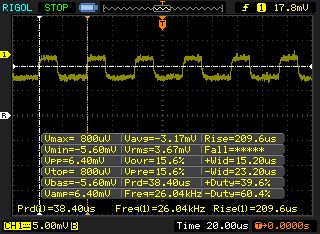 |
The display backlight flickers at 26040 Hz (worst case, e.g., utilizing PWM) Flickering detected at a brightness setting of 25 % and below. There should be no flickering or PWM above this brightness setting. The frequency of 26040 Hz is quite high, so most users sensitive to PWM should not notice any flickering. In comparison: 52 % of all tested devices do not use PWM to dim the display. If PWM was detected, an average of 7747 (minimum: 5 - maximum: 343500) Hz was measured. | |||
Performance
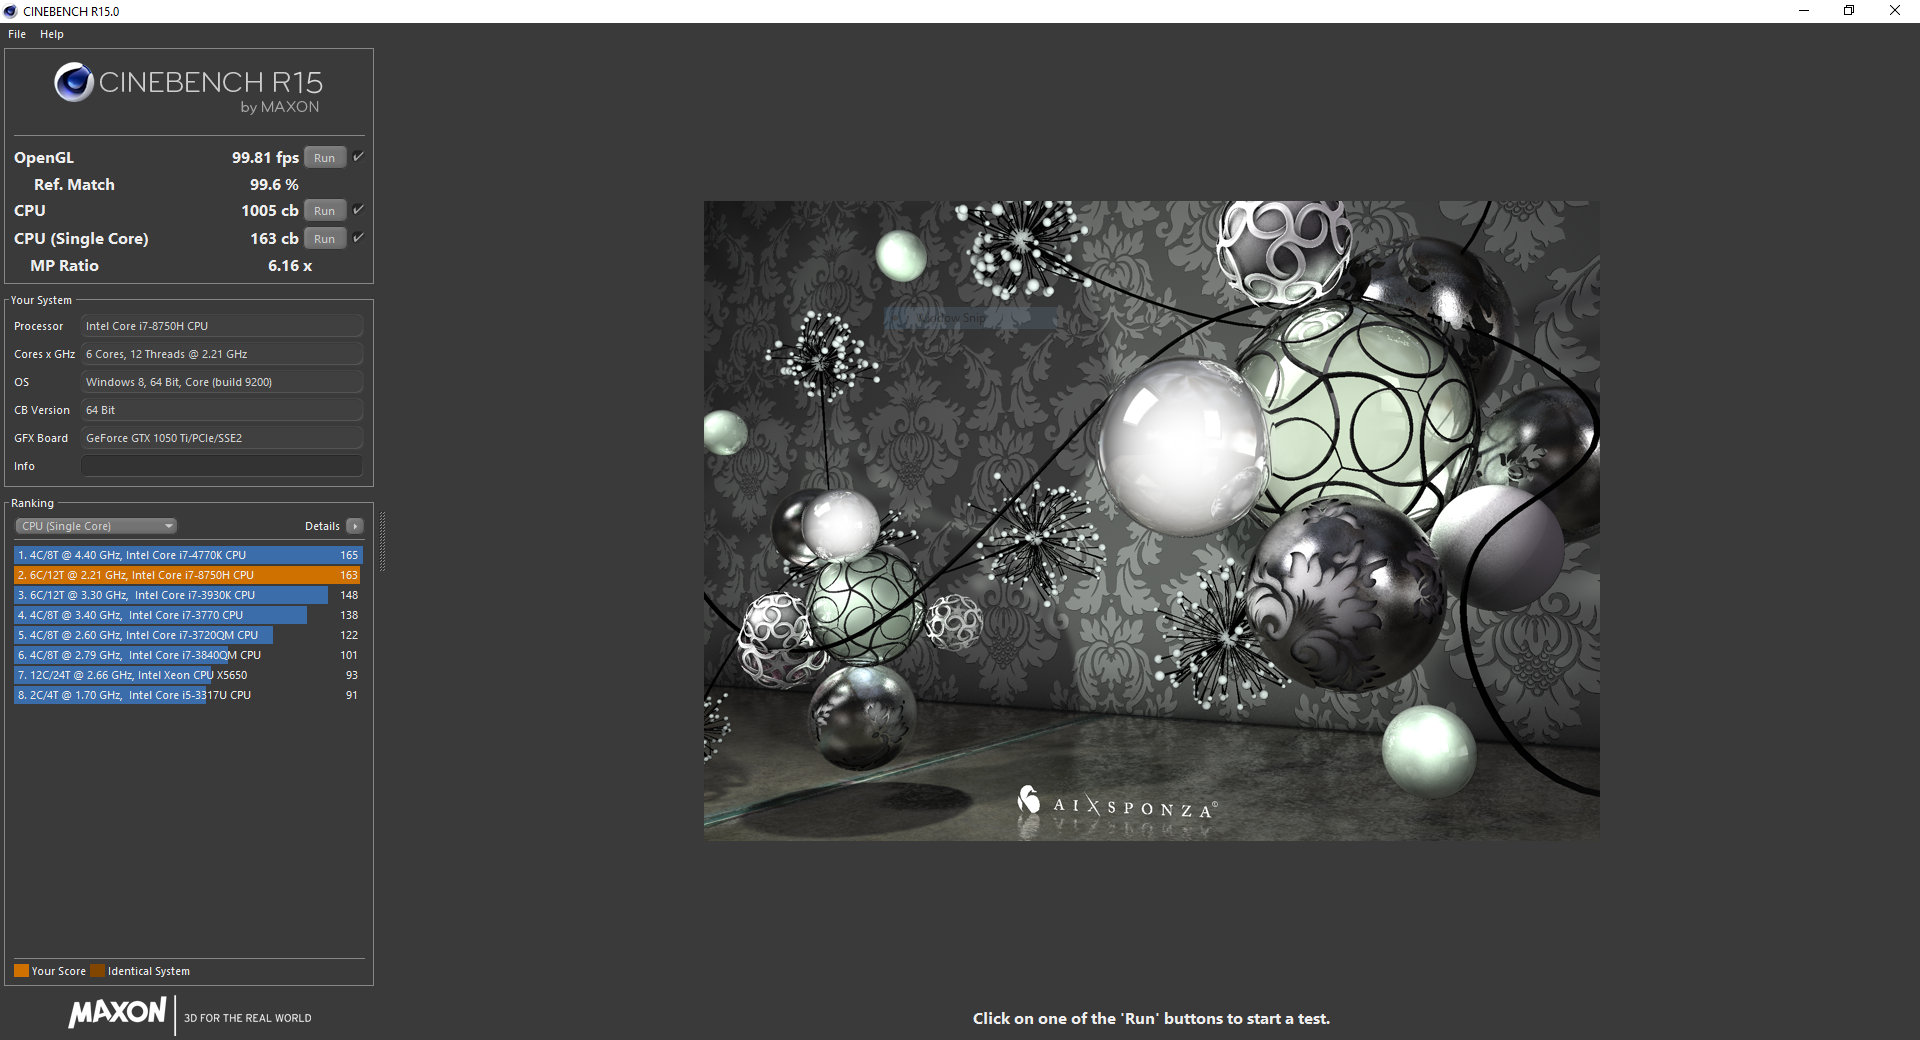
Hexa-core is the new quad-core; similar to how most gaming laptops used Intel's quad-core Core i7-7700HQ throughout last year, we can expect most new gaming devices to come with the six-core Core i7-8750H. Does a 50% bump in core count equal a 50% bump in multi-threaded performance? Not quite, but CPU tasks finish faster, particularly those that demand multiple threads. Additionally, the GeForce GTX 1050 Ti is a solid choice to match the other components; while it struggles to push 60 fps in demanding games at the highest settings, it is poised to take advantage of the 120 Hz display in certain competitive multiplayer titles.


Processor
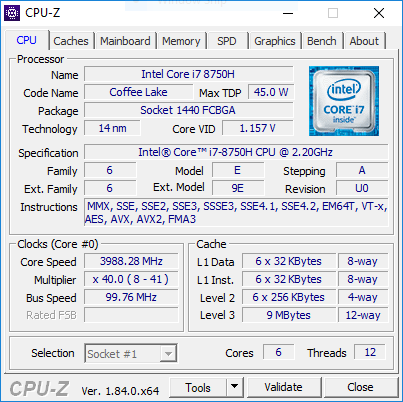
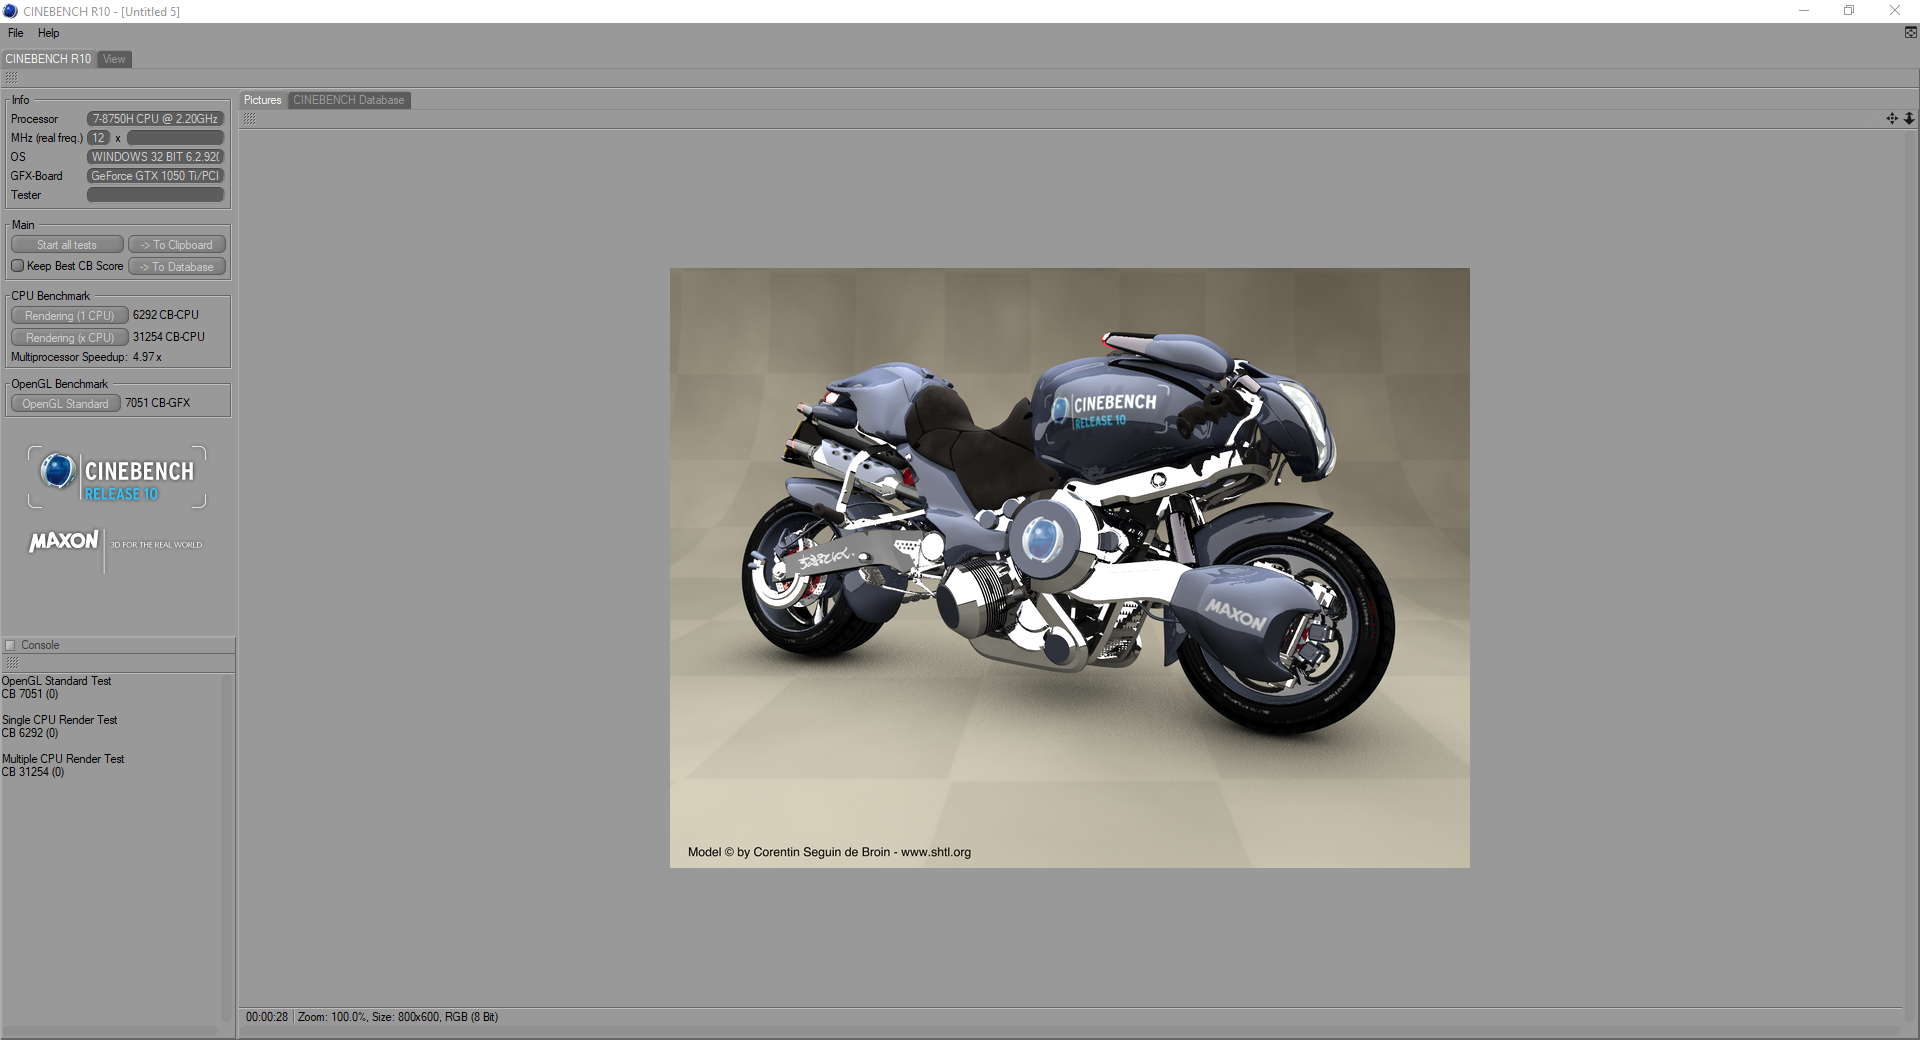
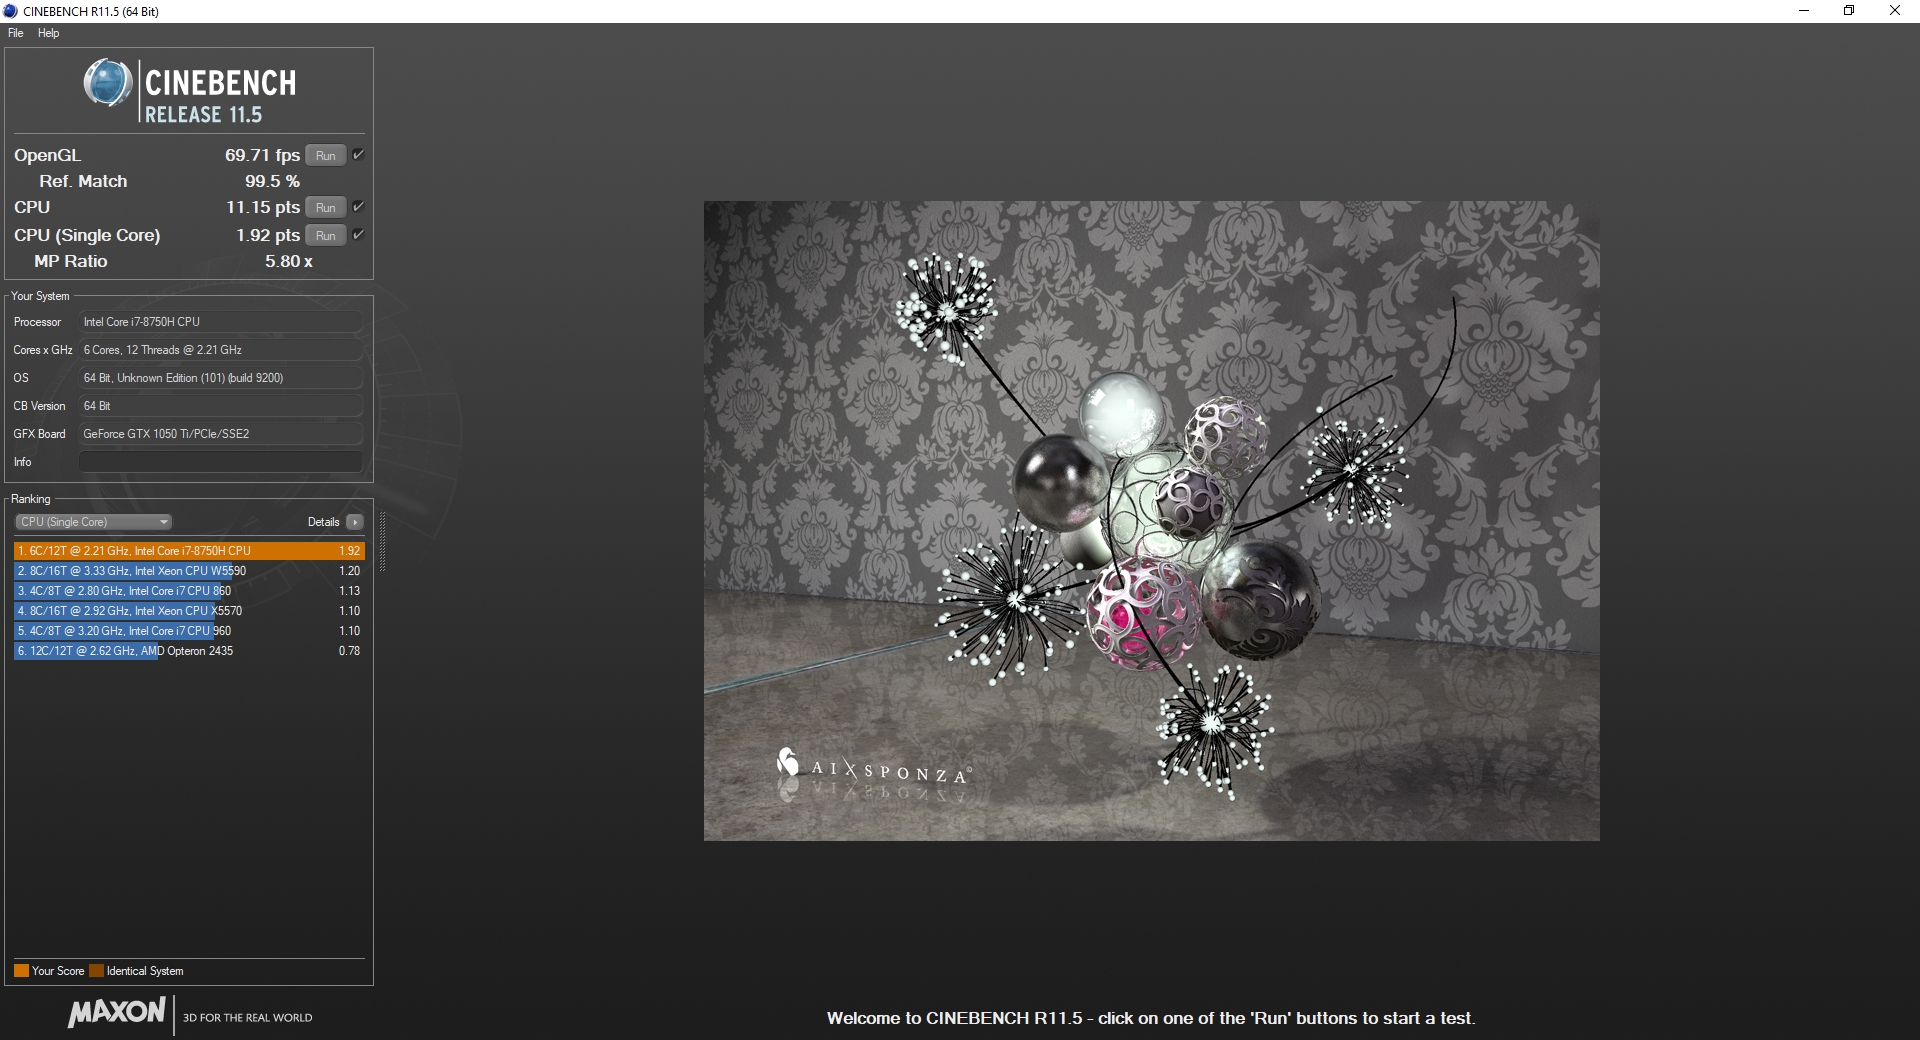
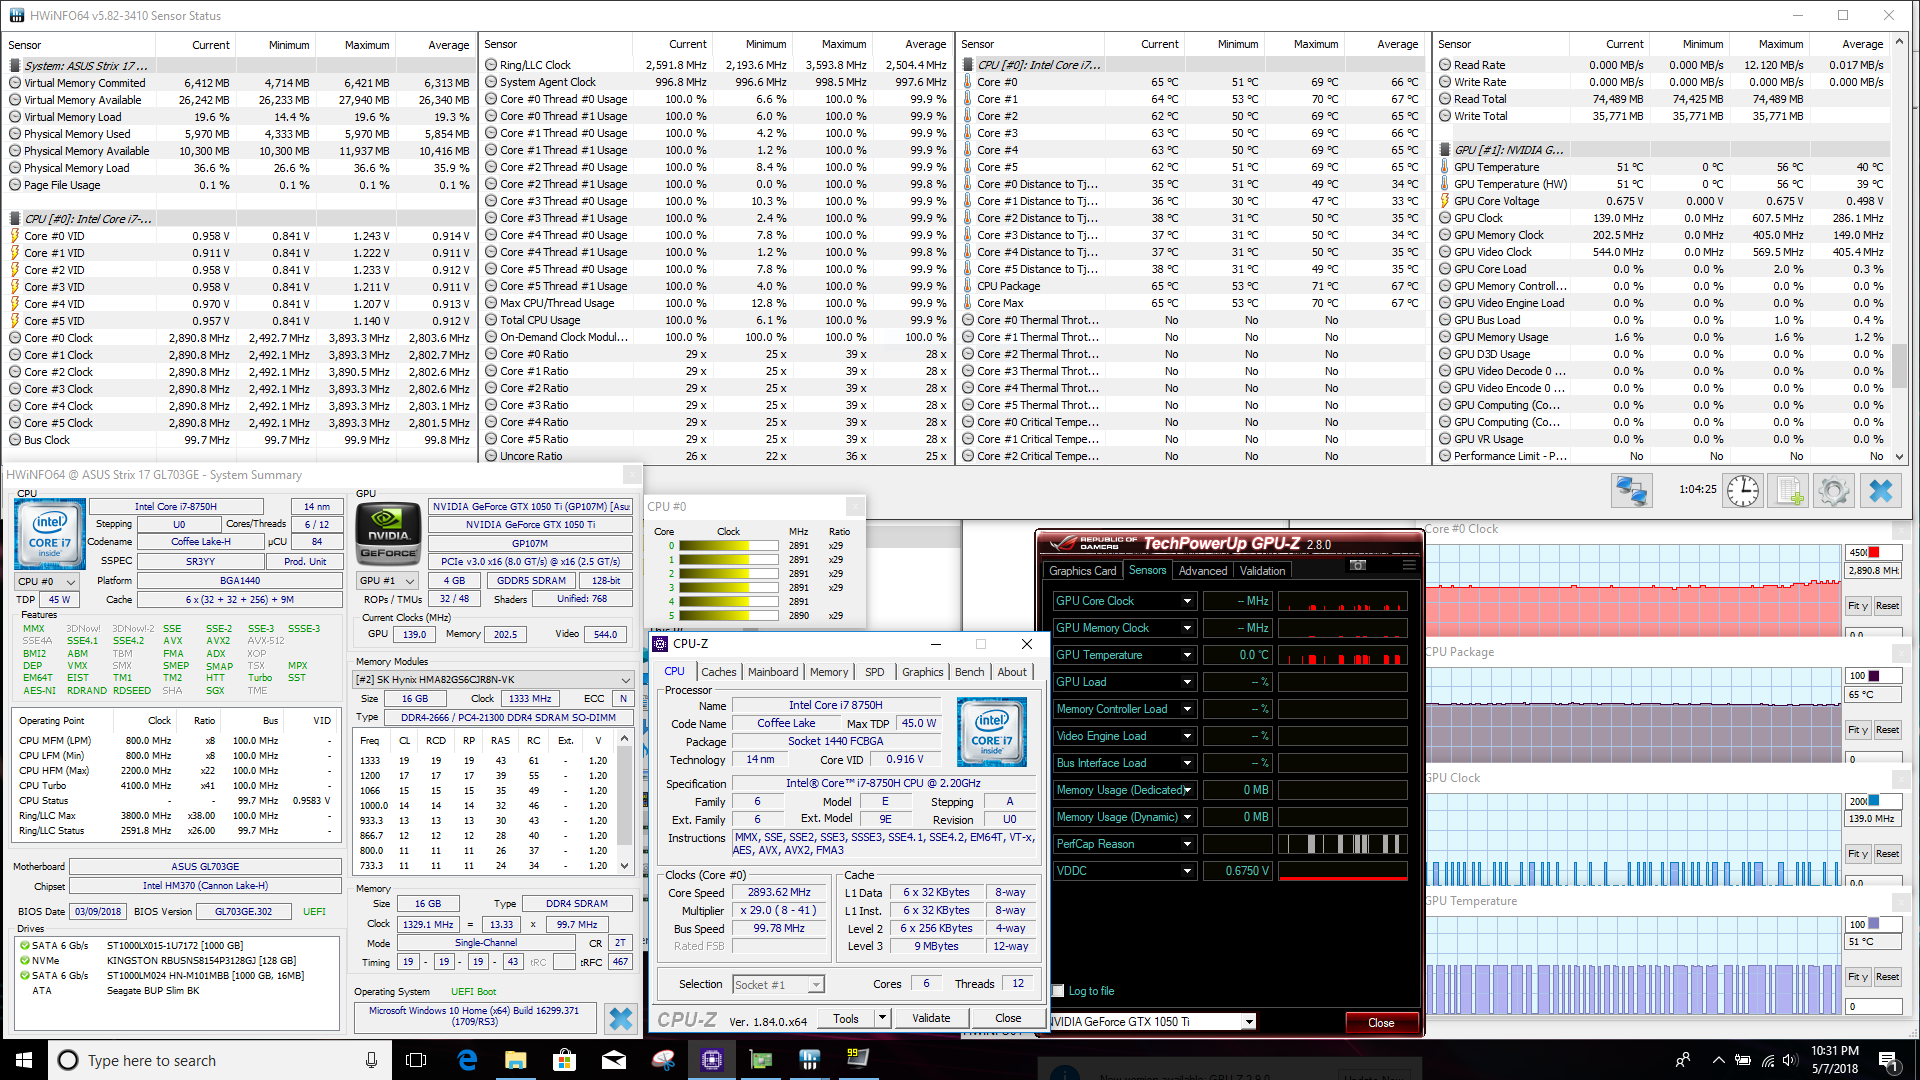
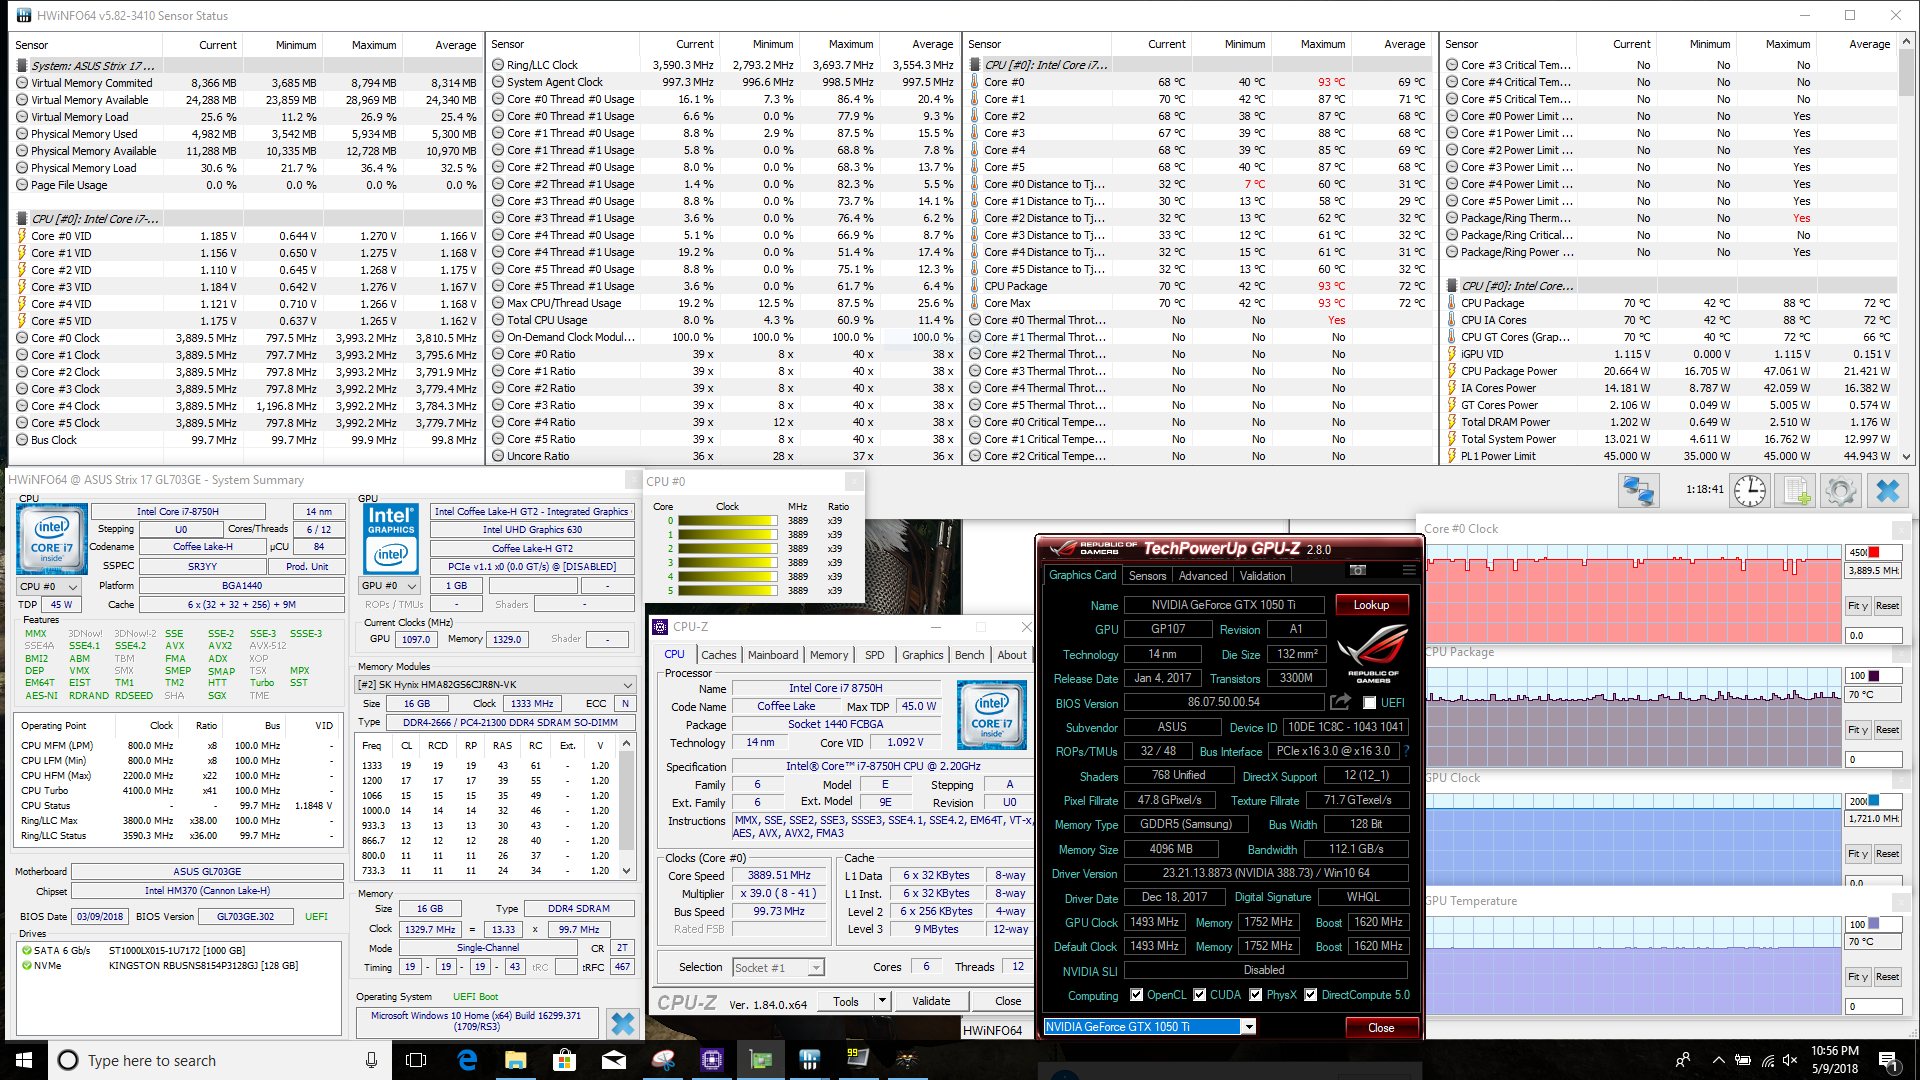
Without a doubt, the GL703GE's headliner is the Core i7-8750H, a new hexa-core chip from Intel. The 45 W TDP matches that of the previous generation i7-7700HQ, but clock speeds have been tweaked. The 8750H has a lower base clock than its older brother (2.2 GHz vs 2.8 GHz) but is able to boost a fair bit higher on a single core (4.1 GHz vs. 3.8 GHz). That should make for better single core performance, and that is indeed what we see in Cinebench R15: the 8750H edges out the 7700HQ by about 15%. Multi-threaded performance is, as expected, a blowout. The 8750H trumps the 7700HQ by about 40%, which closely matches the bump in physical cores.
Interestingly, the Asus GL703GE comes in about 7% lower in multi-threaded tests than other 8750H-based systems. This could be due to either throttling in our system or performance-focused tweaking in others; as of this writing, the chip is too new to make that call. This may be something to watch.
Over the long term, the 8750H has a performance curve akin to what we're used to seeing in our Cinebench R15 loop test. The machine comes charging out of the gates for the first pass only to dip during the second. Performance is henceforth stable with no noteworthy variance.
For more information about the Intel Core i7-8750H, please see our dedicated CPU page here.
* ... smaller is better
System Performance
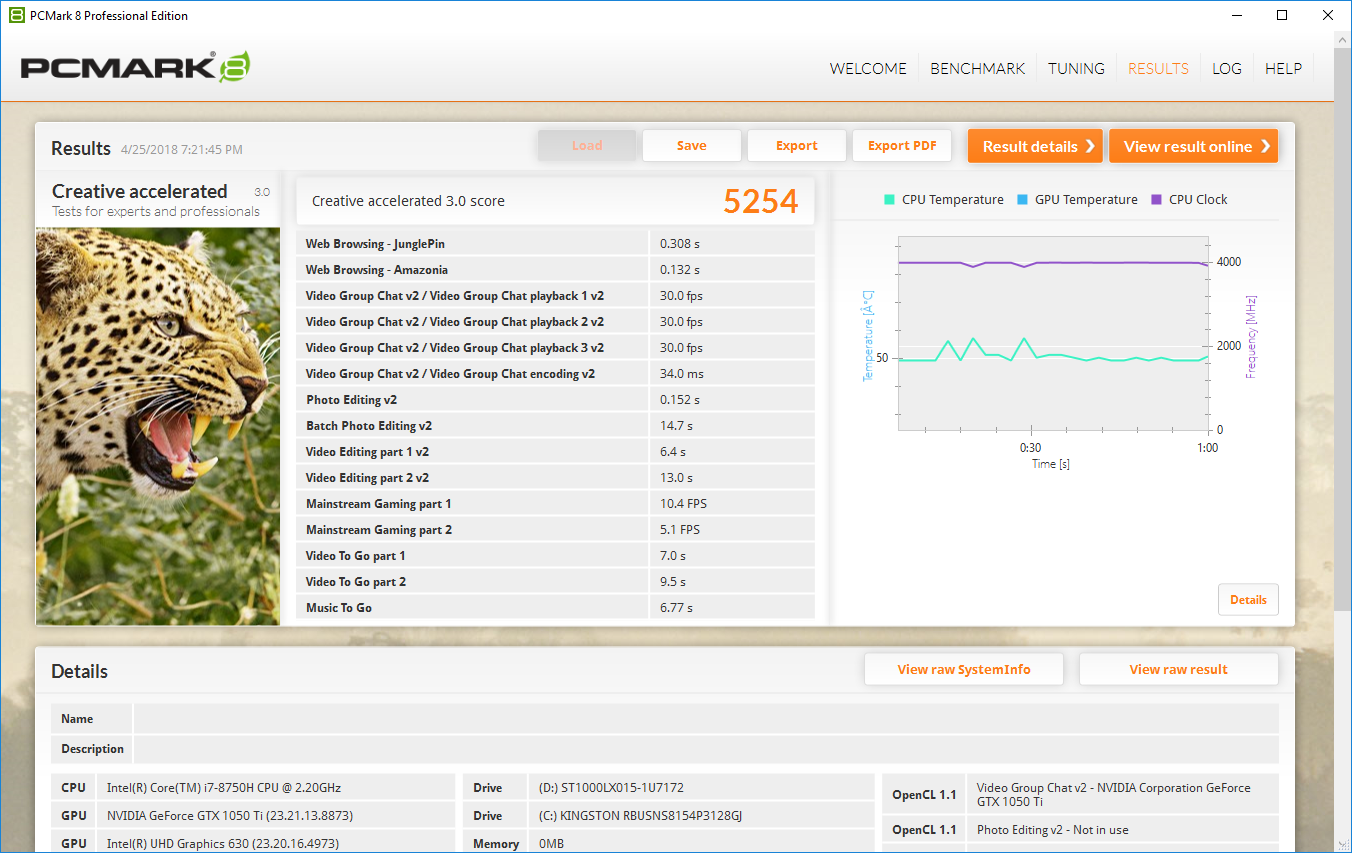
Overall system performance is good. The GL703GE keeps up with other devices in its class. There is a noticeable hiccup when opening a new Windows Explorer window; the process takes almost a full second. Otherwise, every app opens without pause, and the rest of the system responds immediately.
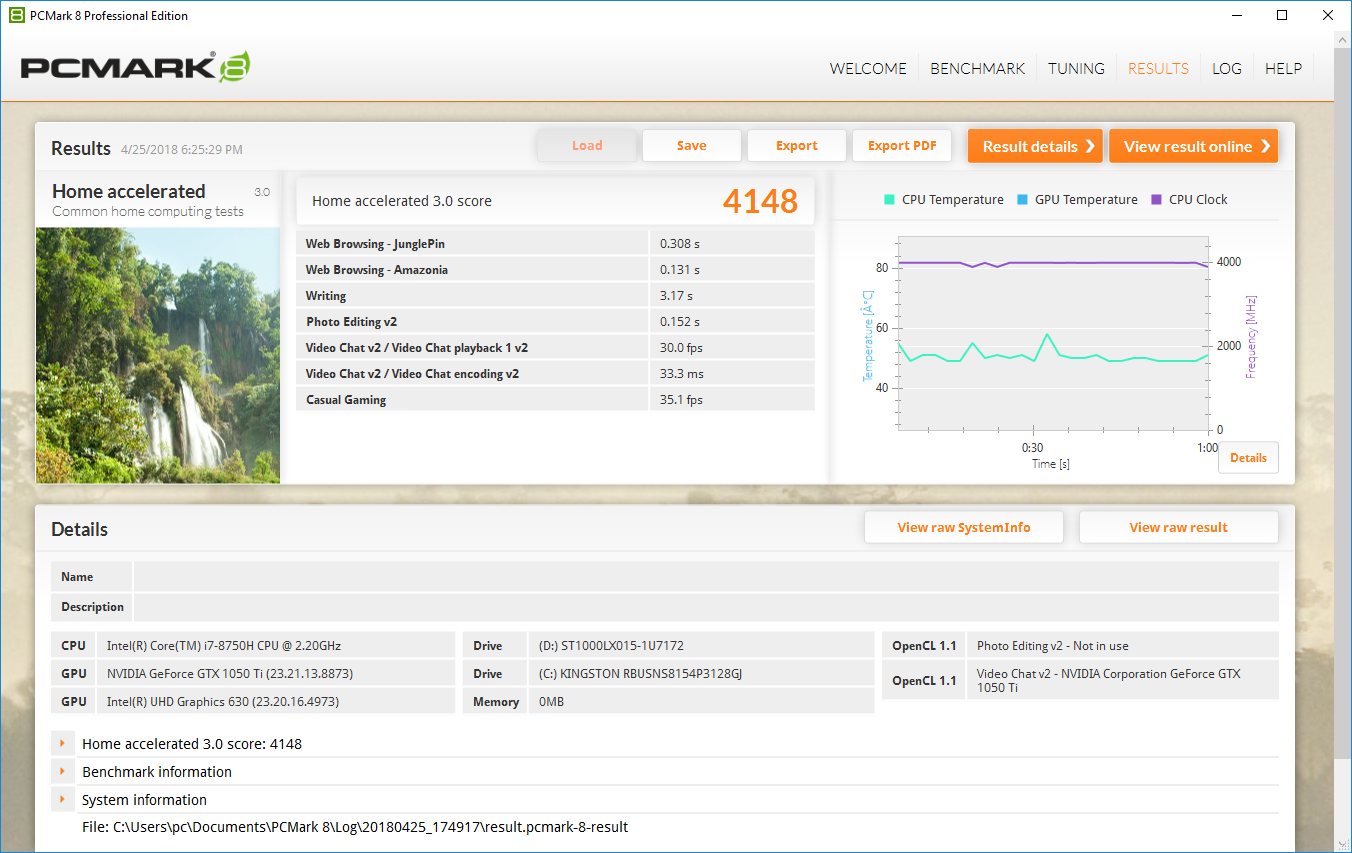

| PCMark 8 Home Score Accelerated v2 | 4148 points | |
| PCMark 8 Creative Score Accelerated v2 | 5254 points | |
| PCMark 8 Work Score Accelerated v2 | 5288 points | |
| PCMark 10 Score | 4532 points | |
Help | ||
Storage Devices
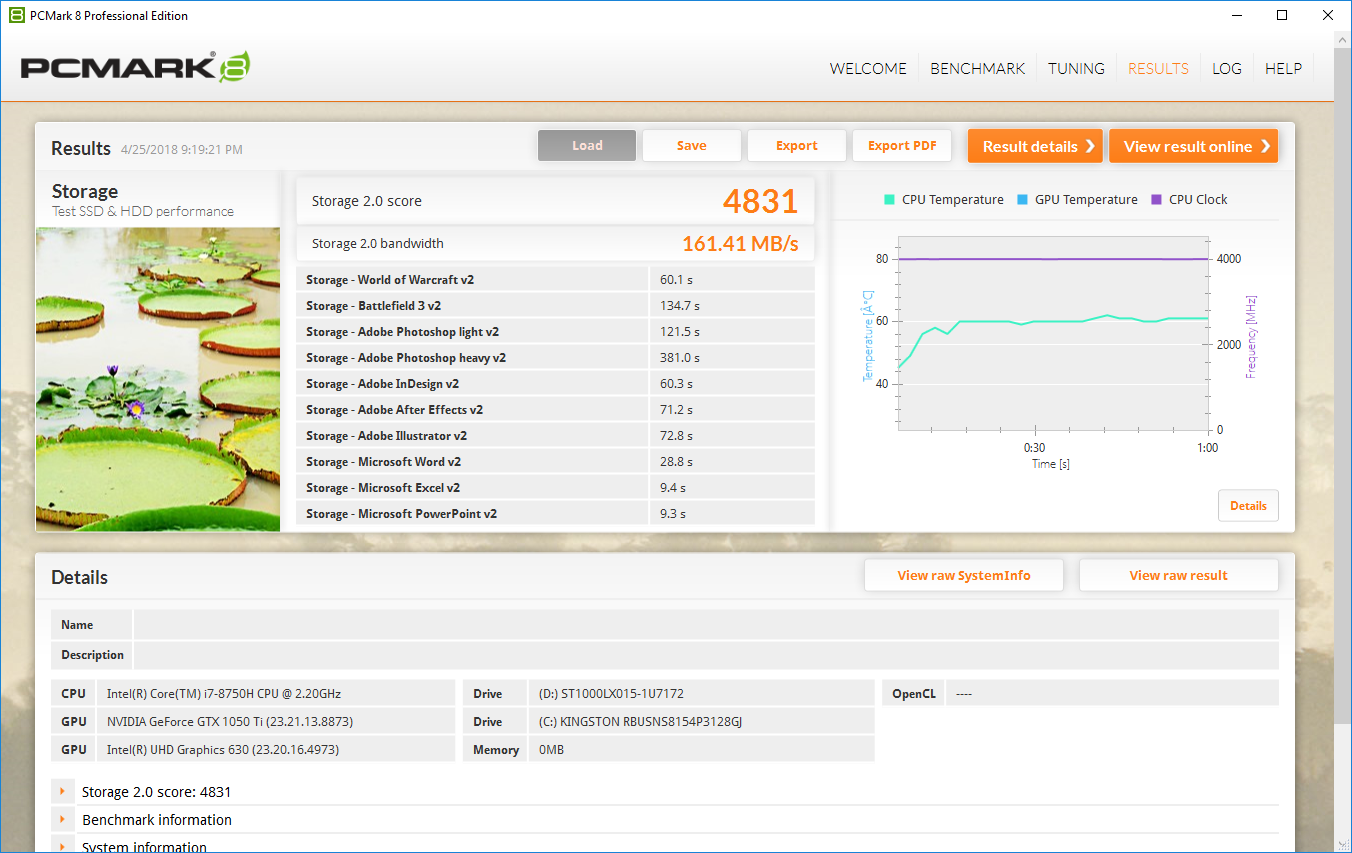
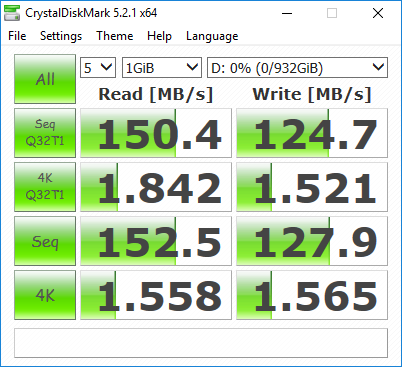
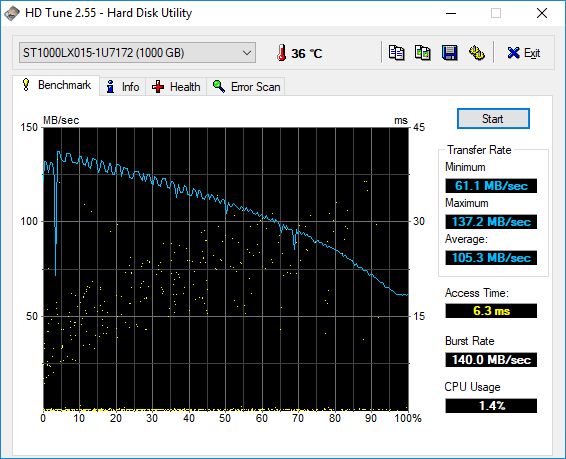
Drive speeds are adequate. The 128 GB SSD has good read times but is surprisingly sluggish when writing data. Despite being connected via a PCIe bridge, the SSD is more akin to a SATA drive than one using the NVMe protocol. In light of other options, like the Samsung PM961, the SSD is decent but will seem slow to some. The paltry 128 GB of storage also fills up incredibly quickly and might become a headache to manage. There is a 2.5" drive bay that our model uses to house a 1 TB HDD. This mechanical drive is reliable and fairly quick for an HDD.
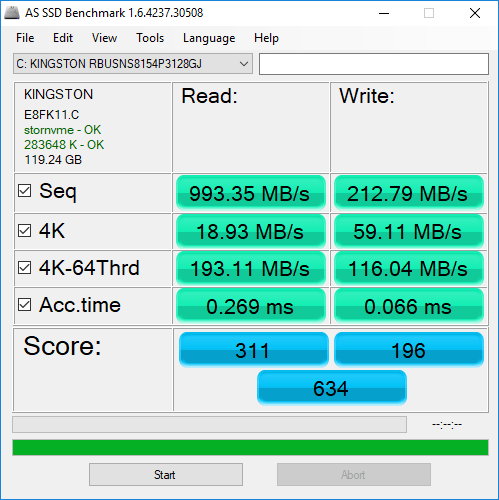

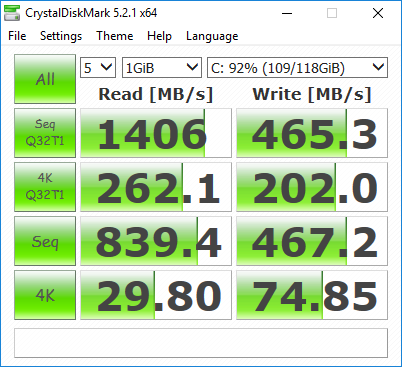
| Asus GL703GE-ES73 Kingston RBUSNS8154P3128GJ | HP Omen 17-w206ng Samsung PM961 MZVLW256HEHP | MSI GE72 7RE-046 Toshiba HG6 THNSNJ256G8NY | Gigabyte Aero 15X v8 Toshiba NVMe THNSN5512GPU7 | Dell XPS 15 9575 i5-8305G Toshiba XG5 KXG50ZNV256G | |
|---|---|---|---|---|---|
| AS SSD | |||||
| Copy Game MB/s (MB/s) | 343.5 | 250.5 -27% | |||
| Copy Program MB/s (MB/s) | 101.8 | 174.9 72% | |||
| Copy ISO MB/s (MB/s) | 443.6 | 392.7 -11% | |||
| Score Total (Points) | 634 | 2172 243% | 969 53% | 2536 300% | 1113 76% |
| Score Write (Points) | 196 | 165 -16% | 324 65% | 939 379% | 307 57% |
| Score Read (Points) | 311 | 1390 347% | 424 36% | 1092 251% | 595 91% |
| Access Time Write * (ms) | 0.07 | 1.881 -2587% | 0.032 54% | 0.046 34% | 0.056 20% |
| Access Time Read * (ms) | 0.27 | 0.056 79% | 0.119 56% | 0.119 56% | 0.146 46% |
| 4K-64 Write (MB/s) | 116 | 129.5 12% | 175.3 51% | 742 540% | 181.2 56% |
| 4K-64 Read (MB/s) | 193.1 | 1101 470% | 351.1 82% | 847 339% | 337.1 75% |
| 4K Write (MB/s) | 59.1 | 1.31 -98% | 101.5 72% | 80.4 36% | 92.7 57% |
| 4K Read (MB/s) | 18.93 | 48.92 158% | 21.41 13% | 23.36 23% | 24.78 31% |
| Seq Write (MB/s) | 212.8 | 346.2 63% | 475.5 123% | 1163 447% | 334.3 57% |
| Seq Read (MB/s) | 993 | 2399 142% | 515 -48% | 2213 123% | 2335 135% |
* ... smaller is better

GPU Performance
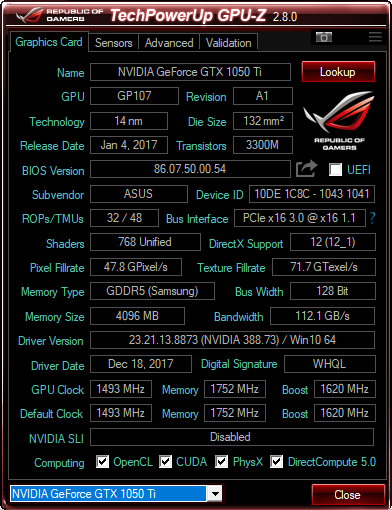
Nvidia's GeForce GTX 1050 Ti has made several appearances in mid-tier gaming laptops and has frequently shown itself to be an excellent value for the performance it offers. The GL703GE performs about as well as other devices sporting the 1050 Ti and hits similar numbers in Fire Strike. As a result, the story here is largely the same; the 1050 Ti is well-suited for moderately demanding 3D workloads but hits its limits when details are turned up. Full HD is as far as the GPU should be pushed. Users that need more power from their GPU should look to the GTX 1060, which is about 50% faster, or the GTX 1070 Max-Q, which is almost twice as fast. However, both of these GPUs will pull more power and generate more heat than the 75 Watt 1050 Ti. On battery, the GL703GE sees a 10% drop in GPU performance.
For more information about the GTX 1050 Ti, please refer to our GPU page here.
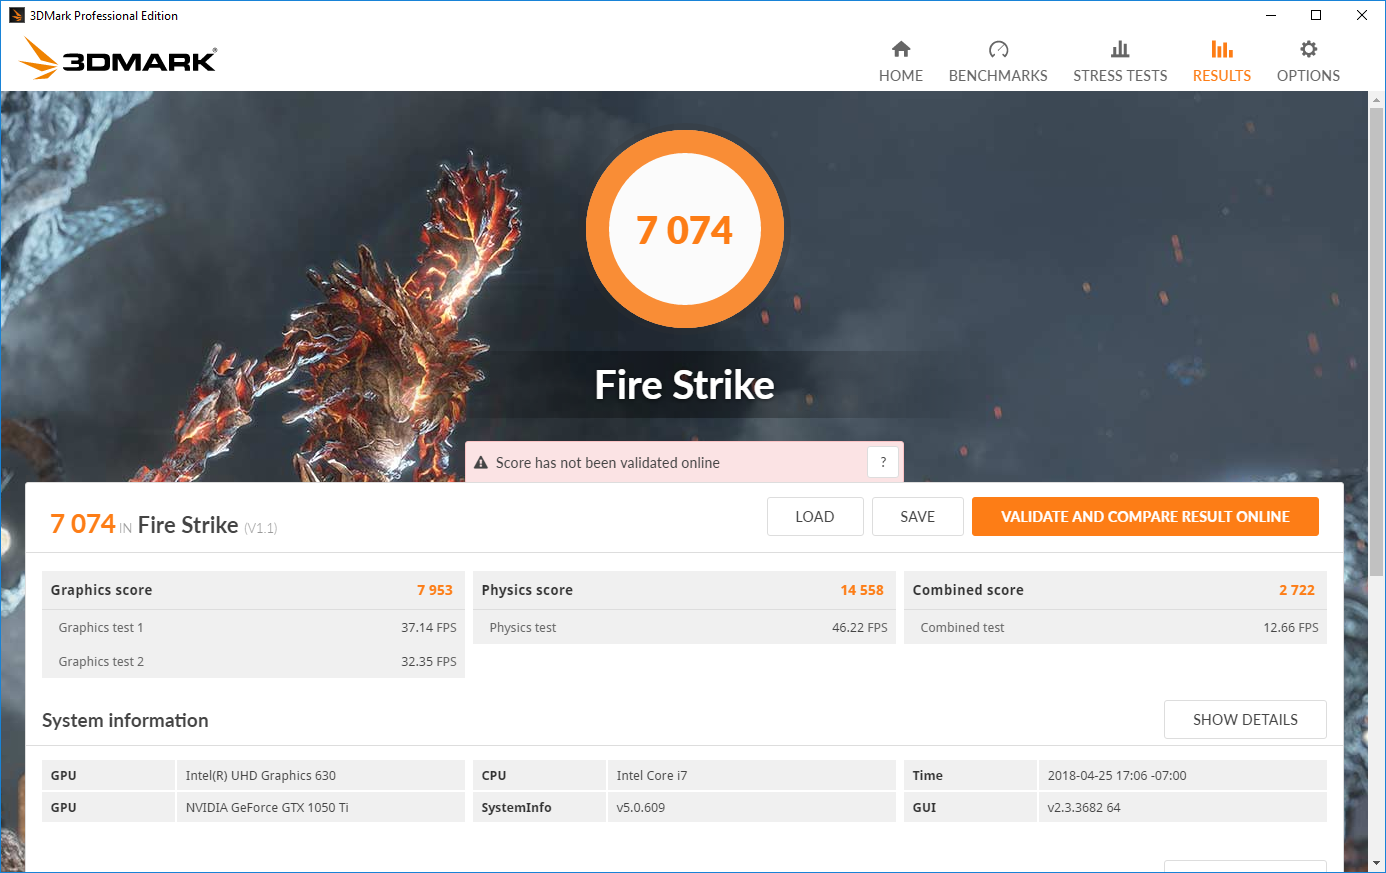
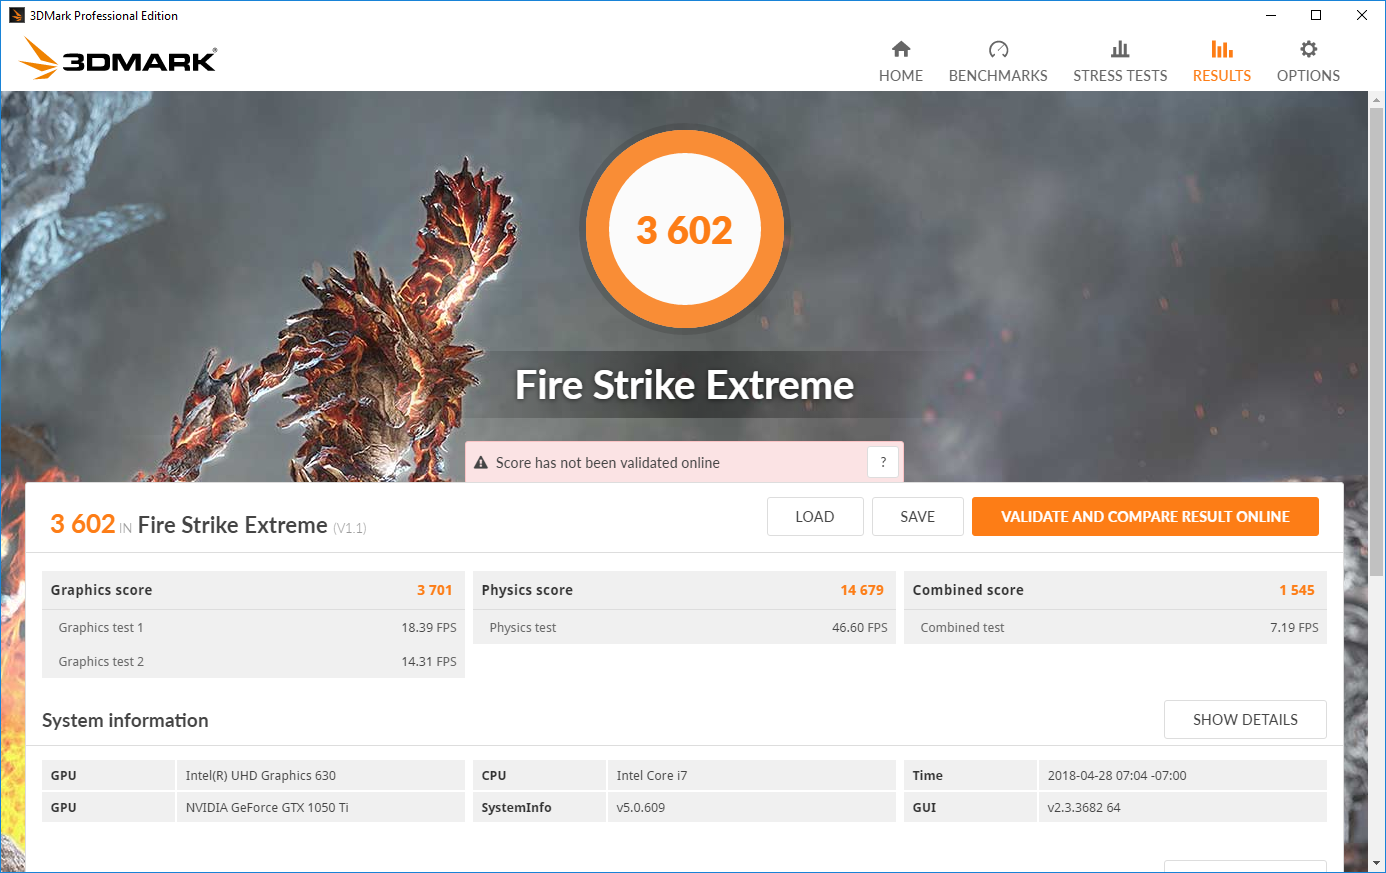
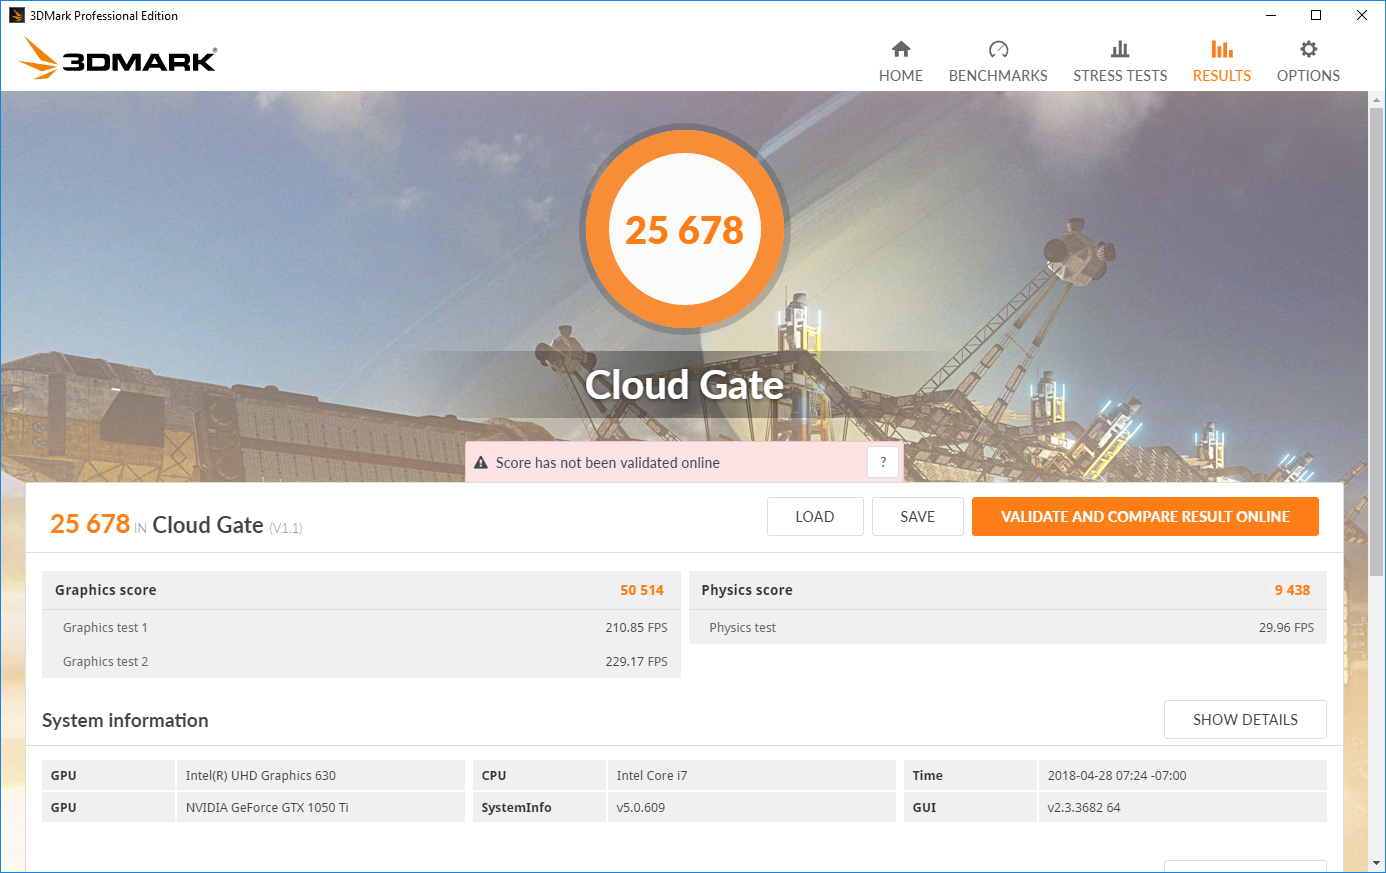
| 3DMark 06 Standard Score | 32246 points | |
| 3DMark 11 Performance | 9097 points | |
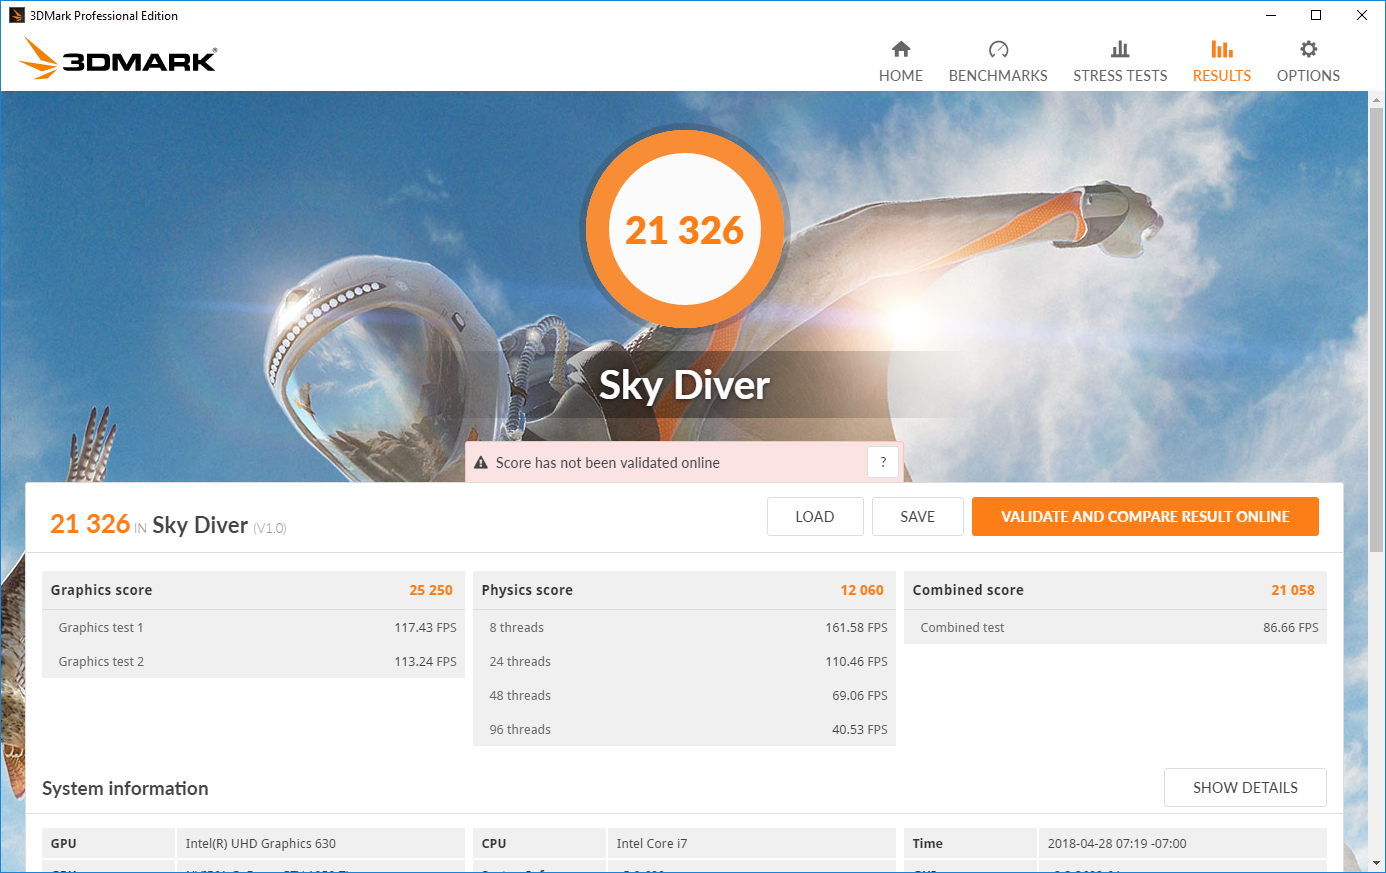
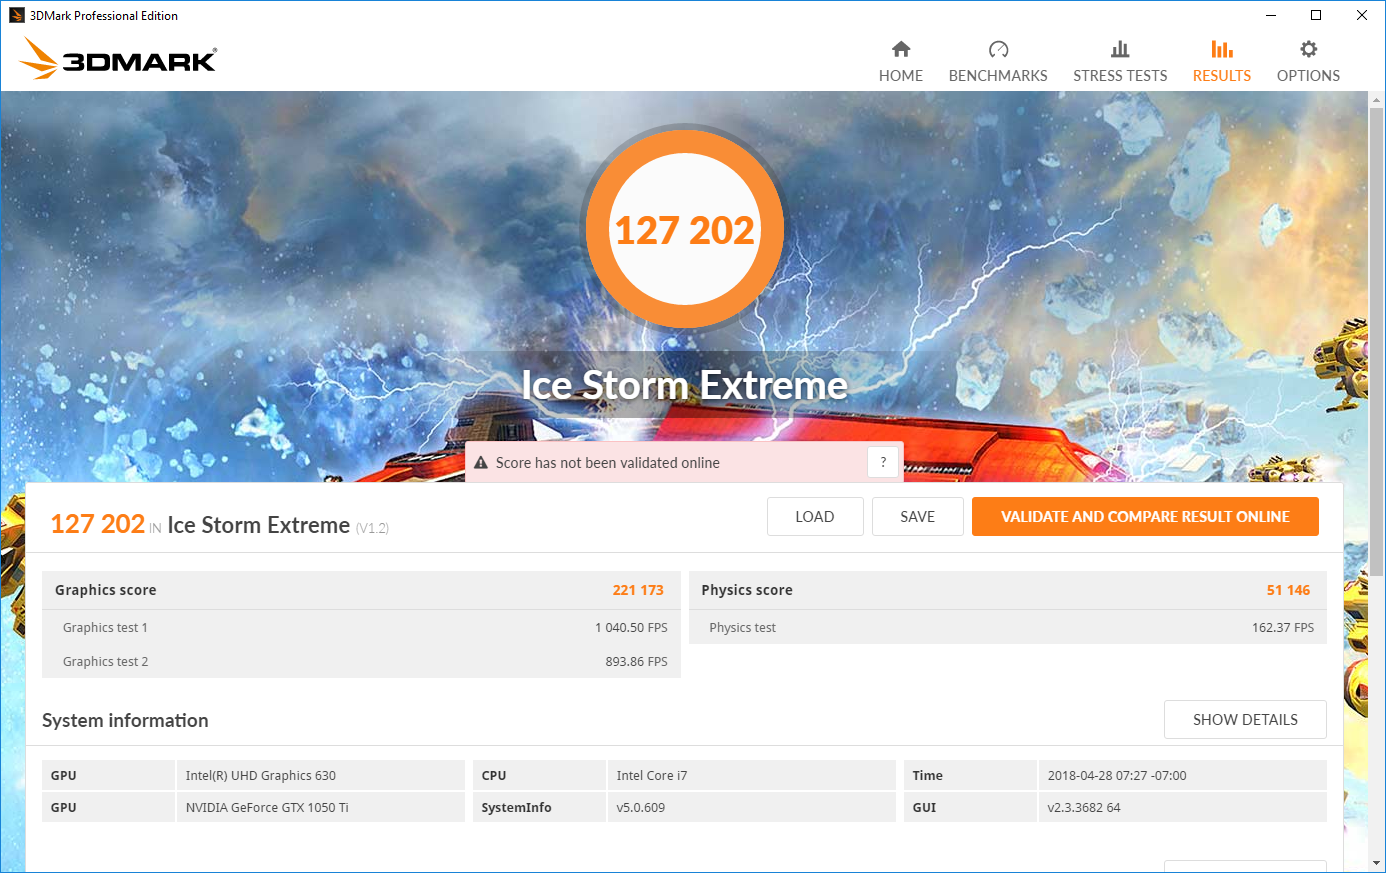
| 3DMark Ice Storm Standard Score | 131234 points | |
| 3DMark Cloud Gate Standard Score | 25678 points | |
| 3DMark Fire Strike Score | 7074 points | |
| 3DMark Fire Strike Extreme Score | 3602 points | |
Help | ||
Gaming Performance
As stated, the GTX 1050 Ti is a popular choice for mid-tier gaming laptops, and with good reason. The 1050 Ti can push through most titles at FHD/Medium settings. The GL703GE seems particularly aimed at competitive gamers, and the 1050 Ti is a good step toward that goal. Most AAA games will need reduced settings to hit 60 frames per second, but competitive games (which are typically lighter on system resources) can easily exceed 60 fps with everything turned up. This is where the other killer feature of the GL703GE, the 120 Hz display, steps in. Games like Counter-Strike: GO and Rocket League can be pushed past 100 fps, taking full advantage of the panel's higher refresh rate. These games look and feel buttery smooth, and the twitch reactions needed to remain competitive in these games come that much easier.
| Counter-Strike: GO - 1920x1080 (Very) High, FXAA AA:4x MS AF:8x (sort by value) | |
| Asus GL703GE-ES73 | |
| Average NVIDIA GeForce GTX 1050 Ti Mobile (n=1) | |
| The Witcher 3 - 1920x1080 Ultra Graphics & Postprocessing (HBAO+) (sort by value) | |
| Asus GL703GE-ES73 | |
| Average NVIDIA GeForce GTX 1050 Ti Mobile (14 - 38, n=31) | |
| Average of class Gaming (104.7 - 240, n=6, last 2 years) | |
| Rocket League - 1920x1080 High Quality AA:High FX (sort by value) | |
| Asus GL703GE-ES73 | |
| Average NVIDIA GeForce GTX 1050 Ti Mobile (106 - 158, n=4) | |
| low | med. | high | ultra | |
|---|---|---|---|---|
| Counter-Strike: GO (2012) | 124 | |||
| Dota 2 (2013) | 65 | |||
| The Witcher 3 (2015) | 26 | |||
| Hitman 2016 (2016) | 42 | 41 | ||
| Deus Ex Mankind Divided (2016) | 38 | 19 | ||
| Rocket League (2017) | 108 | |||
| Dirt 4 (2017) | 41 | |||
| Middle-earth: Shadow of War (2017) | 60 | 44 | 37 |
Stress Test
The GL703GE's components perform remarkably well under both synthetic and real-world testing. During Prime95, the CPU does reasonably well, averaging 2.8 GHz across all cores. CPU Temperatures are impressive and never eclipse 70° C during the test. Furmark is also handled well; the GPU hovers around 1450 MHz while staying relatively cool at 68° C. While CPU and GPU performance seems a bit restrictive under synthetic load, the lower temperatures may be a worthy payoff.
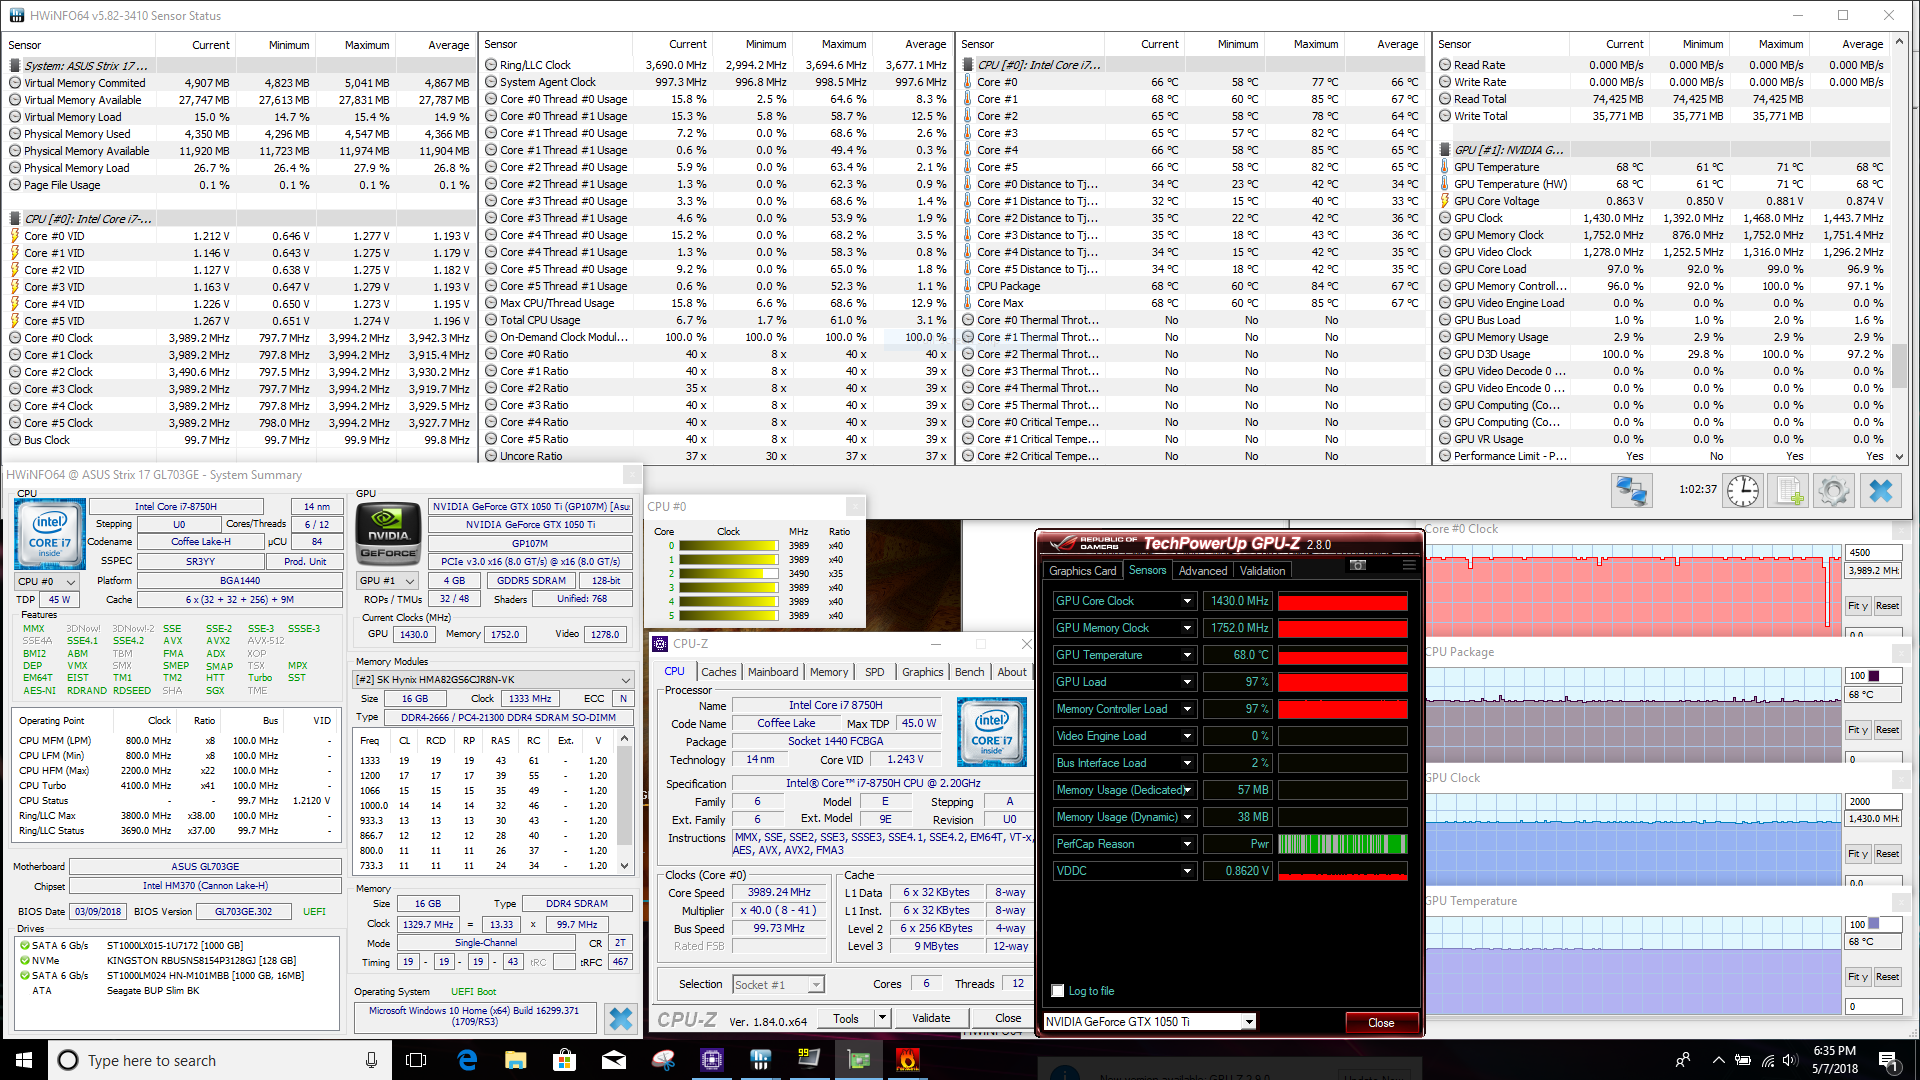
Under real-world stress (running The Witcher 3 for an hour), the system still keeps its cool. Both the CPU and GPU perform admirably. The CPU hangs at about 3.9 GHz with intermittent spikes up to 4 GHz. Temperatures average at 70° C, but we did observe occasional pops to 87° C. The GPU holds at a rock solid 1721 MHz throughout the test and consistently remains at 70° C. Both of these metrics are excellent. Performance over the hour-long run is stable and follows the same FPS curve we've seen in other machines.

| CPU Clock (GHz) | GPU Clock (MHz) | Average CPU Temperature (°C) | Average GPU Temperature (°C) | |
| Prime95 Stress | 2.8 | - | 66 | - |
| FurMark Stress | 3.94 | 1444 | 64 | 68 |
| Prime95 + FurMark Stress | 2.7 | 1425 | 85 | 82 |
| Witcher 3 Stress | 3.9 | 1721 | 70 | 70 |
Emissions
System Noise
In order to keep the components as cool as it does under load, the GL703GE has to expel quite a bit of heat from its thin chassis. Fan noise, as a consequence, can get loud. Under full stress, the dual fan setup hits 49 dB(A), which is noticeable across a room. However, the level pitch makes the noise less grating than other thin gaming notebooks, which typically sound shrill under load. The GL703GE's fan curve is fairly aggressive; the fans ramp up quickly, usually within 5 minutes of starting a game, and stay at a constant "full blast" until several minutes after the system returns to idle. Even so, the GL703GE's fans are quieter than many other thin gaming laptops; of note, the HP Omen 17 hits 52 dB(A) during long gaming sessions. There is no noticeable coil whine or other system noise.
Noise level
| Idle |
| 28.2 / 30 / 32 dB(A) |
| Load |
| 36 / 48.8 dB(A) |
 | ||
30 dB silent 40 dB(A) audible 50 dB(A) loud |
||
min: | ||
| Asus GL703GE-ES73 GeForce GTX 1050 Ti Mobile, i7-8750H, Kingston RBUSNS8154P3128GJ | Asus Strix GL703VM-DB74 GeForce GTX 1060 Mobile, i7-7700HQ, Seagate Mobile HDD 1TB ST1000LX015-1U7172 | HP Omen 17-w206ng GeForce GTX 1050 Ti Mobile, i7-7700HQ, Samsung PM961 MZVLW256HEHP | MSI GE72 7RE-046 GeForce GTX 1050 Ti Mobile, i7-7700HQ, Toshiba HG6 THNSNJ256G8NY | MSI GS65 8RF-019DE Stealth Thin GeForce GTX 1070 Max-Q, i7-8750H, Samsung SSD PM981 MZVLB512HAJQ | Gigabyte Aero 15X v8 GeForce GTX 1070 Max-Q, i7-8750H, Toshiba NVMe THNSN5512GPU7 | MSI GV72 7RD-1048XPL GeForce GTX 1050 Mobile, i5-7300HQ, ADATA SX7000NP 128 GB | Dell XPS 15 9575 i5-8305G Vega M GL / 870, i5-8305G, Toshiba XG5 KXG50ZNV256G | Acer Nitro 5 AN515-52 GeForce GTX 1050 Ti Mobile, i5-8300H | |
|---|---|---|---|---|---|---|---|---|---|
| Noise | -3% | -13% | -12% | -2% | -10% | -1% | 6% | ||
| off / environment * (dB) | 28.2 | 28.4 -1% | 30 -6% | 30 -6% | 30 -6% | 29 -3% | 27.8 1% | ||
| Idle Minimum * (dB) | 28.2 | 30.2 -7% | 34 -21% | 34 -21% | 30 -6% | 30 -6% | 31.1 -10% | 27.8 1% | |
| Idle Average * (dB) | 30 | 30.2 -1% | 35 -17% | 35 -17% | 31 -3% | 31 -3% | 31.1 -4% | 27.8 7% | |
| Idle Maximum * (dB) | 32 | 30.2 6% | 36 -13% | 36 -13% | 34 -6% | 35 -9% | 31.1 3% | 27.8 13% | |
| Load Average * (dB) | 36 | 38.4 -7% | 47 -31% | 41 -14% | 43 -19% | 49 -36% | 38.7 -8% | 35 3% | |
| Witcher 3 ultra * (dB) | 48.8 | 49.7 -2% | 48 2% | 42 14% | 51 -5% | 44.2 9% | |||
| Load Maximum * (dB) | 48.8 | 54.5 -12% | 52 -7% | 49 -0% | 44 10% | 54 -11% | 42.5 13% | 44.2 9% |
* ... smaller is better
Temperature
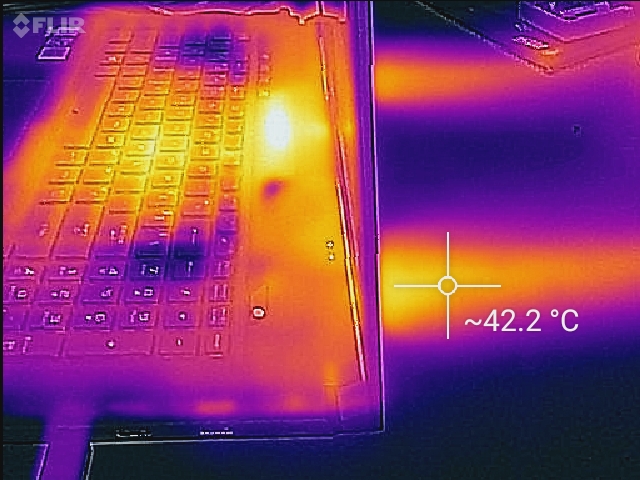
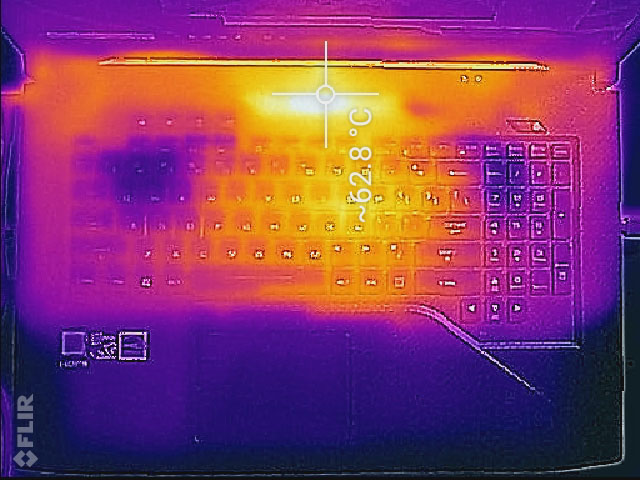
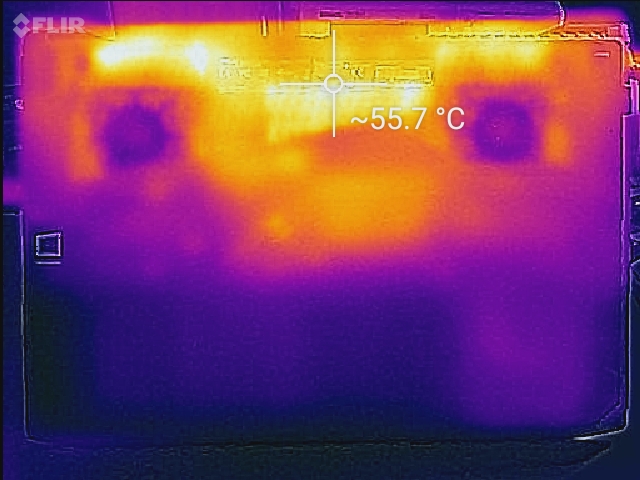
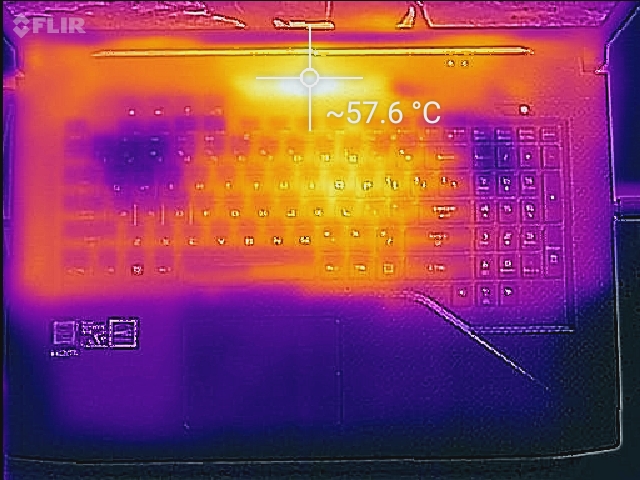
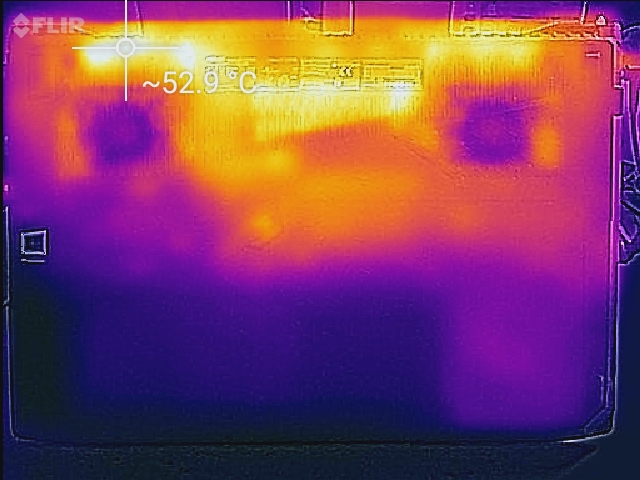
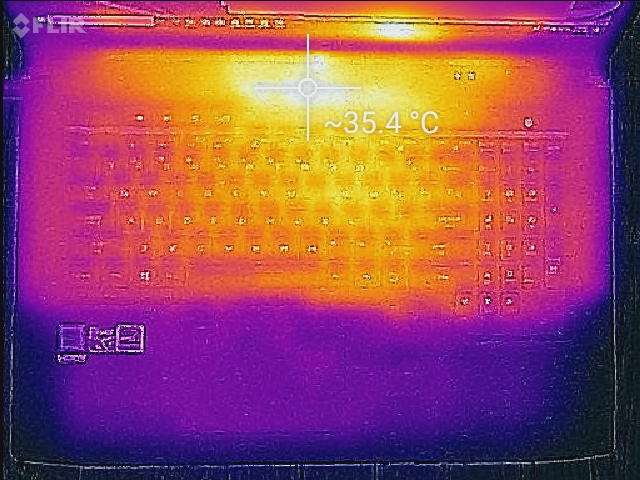
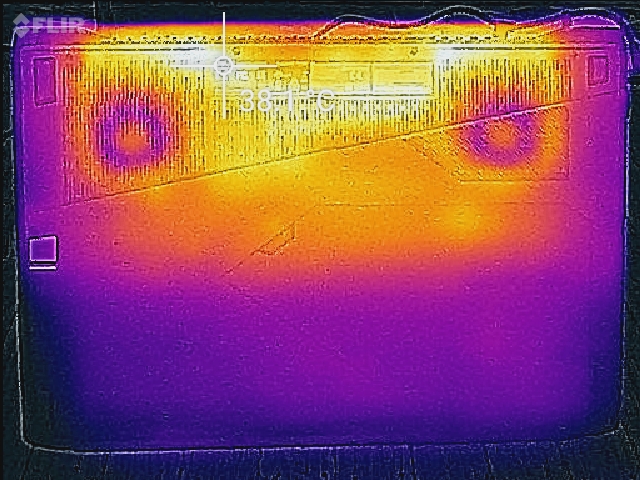
Exterior temperatures paint an interesting picture. There are a few hot spots that quickly grow uncomfortably warm during heavy workloads, but these spots shouldn't come into contact with the user. For instance, the vent above the keyboard hits 63° C, but unless a hand is intentionally placed on this spot, this heat won't be felt. The center of the keyboard (around the "I," "O," and "9" keys) can feel a bit toasty, but these aren't keys typically used during gameplay. The bottom panel near the rear vents will be uncomfortable, so gaming on a desk is recommended. When idle or during light workloads, the machine remains close to room temperature with no noticeable warm spots.
(-) The maximum temperature on the upper side is 58.6 °C / 137 F, compared to the average of 40.4 °C / 105 F, ranging from 21.2 to 68.8 °C for the class Gaming.
(-) The bottom heats up to a maximum of 59.4 °C / 139 F, compared to the average of 43.2 °C / 110 F
(+) In idle usage, the average temperature for the upper side is 27.3 °C / 81 F, compared to the device average of 33.9 °C / 93 F.
(±) Playing The Witcher 3, the average temperature for the upper side is 35.6 °C / 96 F, compared to the device average of 33.9 °C / 93 F.
(+) The palmrests and touchpad are cooler than skin temperature with a maximum of 25.8 °C / 78.4 F and are therefore cool to the touch.
(+) The average temperature of the palmrest area of similar devices was 28.8 °C / 83.8 F (+3 °C / 5.4 F).
| Asus GL703GE-ES73 GeForce GTX 1050 Ti Mobile, i7-8750H, Kingston RBUSNS8154P3128GJ | Asus Strix GL703VM-DB74 GeForce GTX 1060 Mobile, i7-7700HQ, Seagate Mobile HDD 1TB ST1000LX015-1U7172 | HP Omen 17-w206ng GeForce GTX 1050 Ti Mobile, i7-7700HQ, Samsung PM961 MZVLW256HEHP | MSI GE72 7RE-046 GeForce GTX 1050 Ti Mobile, i7-7700HQ, Toshiba HG6 THNSNJ256G8NY | MSI GS65 8RF-019DE Stealth Thin GeForce GTX 1070 Max-Q, i7-8750H, Samsung SSD PM981 MZVLB512HAJQ | Gigabyte Aero 15X v8 GeForce GTX 1070 Max-Q, i7-8750H, Toshiba NVMe THNSN5512GPU7 | MSI GV72 7RD-1048XPL GeForce GTX 1050 Mobile, i5-7300HQ, ADATA SX7000NP 128 GB | Dell XPS 15 9575 i5-8305G Vega M GL / 870, i5-8305G, Toshiba XG5 KXG50ZNV256G | |
|---|---|---|---|---|---|---|---|---|
| Heat | -7% | 11% | 19% | 18% | 12% | 32% | 25% | |
| Maximum Upper Side * (°C) | 58.6 | 64.6 -10% | 55.6 5% | 45.8 22% | 49 16% | 53 10% | 42.7 27% | 44.8 24% |
| Maximum Bottom * (°C) | 59.4 | 57.2 4% | 57.7 3% | 45.2 24% | 63 -6% | 65 -9% | 38.8 35% | 40 33% |
| Idle Upper Side * (°C) | 35 | 37.6 -7% | 32.2 8% | 31.7 9% | 24 31% | 26 26% | 24.4 30% | 28 20% |
| Idle Bottom * (°C) | 37 | 43 -16% | 27.2 26% | 29.9 19% | 25 32% | 30 19% | 23.2 37% | 29.4 21% |
* ... smaller is better
Speakers

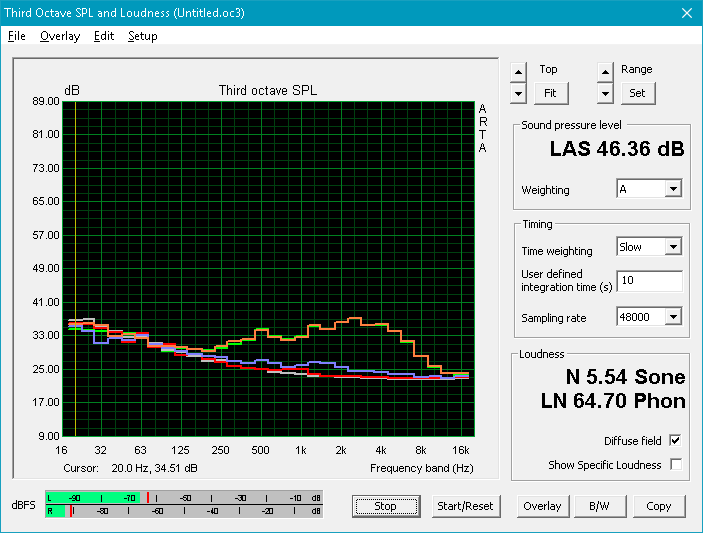
The speakers are surprisingly good for a laptop. At their maximum volume (just under 70 dB), the speakers remain clear, if quiet. The overall sound profile is also generally level. The weakest point is bass, which is anemic. A subwoofer would go a long way to completing the aural experience, but that would likely add some unwanted bulk. There is no unwarranted rattle or distortion, even at the highest volume. The speakers are pleasant enough that headphones may be optional for most users, but the volume will need to maxed to hear movies or games over the fans.
Asus GL703GE-ES73 audio analysis
(-) | not very loud speakers (69.6 dB)
Bass 100 - 315 Hz
(±) | reduced bass - on average 6.9% lower than median
(±) | linearity of bass is average (11.6% delta to prev. frequency)
Mids 400 - 2000 Hz
(+) | balanced mids - only 3% away from median
(+) | mids are linear (4.9% delta to prev. frequency)
Highs 2 - 16 kHz
(+) | balanced highs - only 1.4% away from median
(+) | highs are linear (5.5% delta to prev. frequency)
Overall 100 - 16.000 Hz
(+) | overall sound is linear (13.2% difference to median)
Compared to same class
» 19% of all tested devices in this class were better, 4% similar, 77% worse
» The best had a delta of 6%, average was 18%, worst was 132%
Compared to all devices tested
» 13% of all tested devices were better, 3% similar, 84% worse
» The best had a delta of 4%, average was 23%, worst was 134%
MSI GE72 7RE-046 audio analysis
(+) | speakers can play relatively loud (91 dB)
Bass 100 - 315 Hz
(-) | nearly no bass - on average 17.2% lower than median
(±) | linearity of bass is average (9.2% delta to prev. frequency)
Mids 400 - 2000 Hz
(+) | balanced mids - only 3.3% away from median
(+) | mids are linear (4.7% delta to prev. frequency)
Highs 2 - 16 kHz
(+) | balanced highs - only 3.3% away from median
(+) | highs are linear (4% delta to prev. frequency)
Overall 100 - 16.000 Hz
(+) | overall sound is linear (13.7% difference to median)
Compared to same class
» 21% of all tested devices in this class were better, 7% similar, 72% worse
» The best had a delta of 6%, average was 18%, worst was 132%
Compared to all devices tested
» 15% of all tested devices were better, 4% similar, 81% worse
» The best had a delta of 4%, average was 23%, worst was 134%
Energy Management
Power Consumption
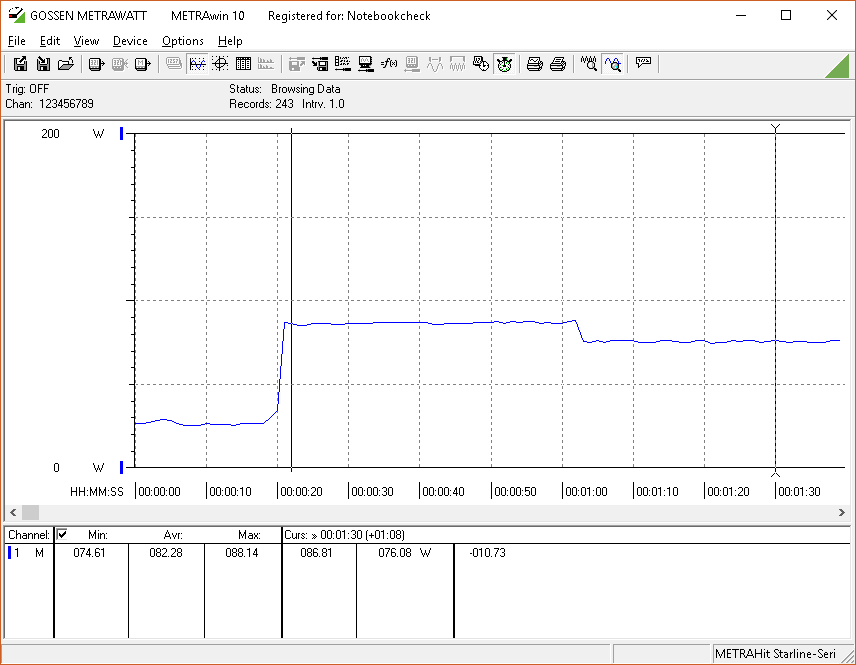
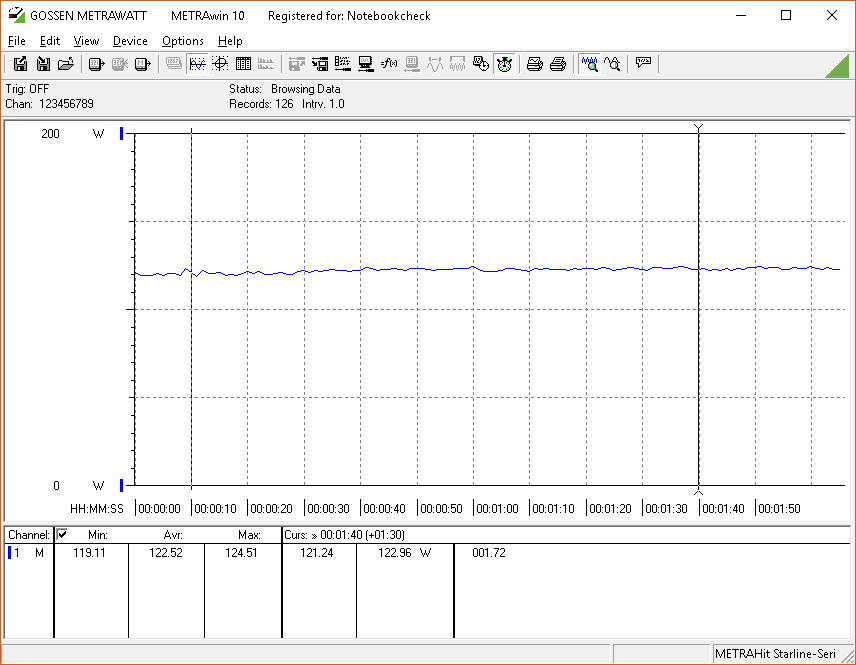
When it comes to power consumption, the Asus GL703GE is a frugal device. Under full synthetic load, the machine pulls only 115 Watts from the wall. Even while gaming, power management is still good; power draw hovers around 123 Watts when playing demanding titles like The Witcher 3. Interestingly, the Omen 17 only pulls about 100 Watts during gameplay (an 18% reduction) but draws close to 150 Watts under full load. The included 180 Watt power brick is more than adequate.
| Off / Standby | |
| Idle | |
| Load |
|
Key:
min: | |
| Asus GL703GE-ES73 i7-8750H, GeForce GTX 1050 Ti Mobile, Kingston RBUSNS8154P3128GJ, TN, 1920x1080, 17.3" | Asus Strix GL703VM-DB74 i7-7700HQ, GeForce GTX 1060 Mobile, Seagate Mobile HDD 1TB ST1000LX015-1U7172, IPS, 1920x1080, 17.3" | HP Omen 17-w206ng i7-7700HQ, GeForce GTX 1050 Ti Mobile, Samsung PM961 MZVLW256HEHP, IPS, 1920x1080, 17.3" | MSI GE72 7RE-046 i7-7700HQ, GeForce GTX 1050 Ti Mobile, Toshiba HG6 THNSNJ256G8NY, TN LED, 1920x1080, 17.3" | Gigabyte Aero 15X v8 i7-8750H, GeForce GTX 1070 Max-Q, Toshiba NVMe THNSN5512GPU7, IPS, 1920x1080, 15.6" | |
|---|---|---|---|---|---|
| Power Consumption | -13% | 4% | -4% | -9% | |
| Idle Minimum * (Watt) | 12.8 | 17.3 -35% | 11 14% | 14 -9% | 14 -9% |
| Idle Average * (Watt) | 18.1 | 21.8 -20% | 18 1% | 20 -10% | 18 1% |
| Idle Maximum * (Watt) | 24.7 | 23 7% | 24 3% | 25 -1% | 22 11% |
| Load Average * (Watt) | 98.4 | 79.2 20% | 84 15% | 82 17% | 91 8% |
| Witcher 3 ultra * (Watt) | 122.5 | 101 18% | 142 -16% | ||
| Load Maximum * (Watt) | 114.6 | 158.2 -38% | 146 -27% | 135 -18% | 173 -51% |
* ... smaller is better
Battery Life
Perhaps the weakest point of the GL703GE is its battery life. While not traditionally a strength of gaming laptops, recent devices like the Aero 15X v8 show that gaming laptops can be portable productivity machines as well. During our WiFi v1.3 test, the GL703GE dies just before hitting the 5-hour mark. In contrast, the HP Omen 17 lasts over 6 hours with a similar battery. The GL703GE can be used when out and about, but you'll need to bring the power adapter along.
| Asus GL703GE-ES73 i7-8750H, GeForce GTX 1050 Ti Mobile, 64 Wh | Asus Strix GL703VM-DB74 i7-7700HQ, GeForce GTX 1060 Mobile, 64 Wh | HP Omen 17-w206ng i7-7700HQ, GeForce GTX 1050 Ti Mobile, 62 Wh | MSI GE72 7RE-046 i7-7700HQ, GeForce GTX 1050 Ti Mobile, 51.4 Wh | Gigabyte Aero 15X v8 i7-8750H, GeForce GTX 1070 Max-Q, 94.24 Wh | MSI GV72 7RD-1048XPL i5-7300HQ, GeForce GTX 1050 Mobile, 41.4 Wh | Dell XPS 15 9575 i5-8305G i5-8305G, Vega M GL / 870, 75 Wh | |
|---|---|---|---|---|---|---|---|
| Battery runtime | -17% | 87% | -35% | 141% | 0% | 83% | |
| Reader / Idle (h) | 5.8 | 4 -31% | 13.3 129% | 12.7 119% | 5.8 0% | 11.1 91% | |
| WiFi v1.3 (h) | 4.8 | 3.2 -33% | 6.3 31% | 3.1 -35% | 8.6 79% | 9.4 96% | |
| Load (h) | 0.8 | 0.9 13% | 1.6 100% | 2.6 225% | 1.3 63% | ||
| WiFi (h) | 3.3 |
Pros
Cons
Verdict

The Asus GL703GE is, in essence, a refinement of Asus' 17-inch ROG Strix line. The GTX 1050 Ti variant checks a lot of boxes without leaving many things to slip through the cracks. The star of the show is without a doubt the Intel Core i7-8750H. The new hexa-core CPU is sure to make its way into most gaming notebooks this year, and while the GL703GE is a decent showing of the new processor's capabilities, it may not be the best. There is substantial improvement over the quad-core i7-7700HQ, but the GL703GE lags a bit behind other 8750H machines. Still, Coffee Lake brings the refresh that Intel's 45 Watt CPUs have needed for years and is sure to be hailed by gamers and other power users.
While the GeForce GTX 1050 Ti isn't fully able to take advantage of the 8750H, it strikes a good balance between performance and efficiency. The 120 Hz display makes for an enticing device well-aimed at competitive gamers. Games look sharp and smooth, and some competitive titles can be pushed past 100 FPS to fully take advantage of the higher refresh rate. A GTX 1060 would offer better results at the expense of more heat and higher energy draw. The rest of the device remains an excellent package.
All said, Intel's new Coffee Lake Core i7-8750H is a boon for processor-intensive tasks. However, despite the new CPU being positioned as the selling point, the GTX 1050 Ti isn't quite the GPU the 8750H deserves. Unless you need the upgraded CPU for processor-heavy work, there is little reason to upgrade. At its MSRP of USD $1250, the GL703GE is a poor value for what it offers; the GPU seems a poor pairing for the processor. The GL703VM, which combines a GTX 1060 and Core i7-7700HQ, may be a better value at only $100 more.
Asus GL703GE-ES73
- 05/12/2018 v6 (old)
Sam Medley
Price comparison
