Microsoft Surface Book 2 15 (i7, GTX 1060) Laptop Review
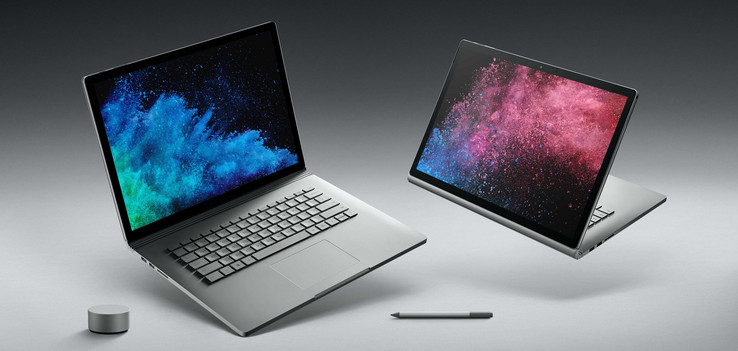
A few months after the launch of the Surface Book 2, Microsoft brings the larger and more capable variant with a 15-inch screen over to Germany. Besides a larger screen, when compared to the Surface Book 2 13, which we already reviewed, what really differentiates the two models is the dedicated graphics card in the keyboard dock of the 15-inch model. Instead of the Nvidia GeForce GTX 1050 with 2 GB of VRAM, Microsoft outfits the bigger brother with the Nvidia GeForce GTX 1060 with 6 GB of VRAM. The processor is again a modern quad-core ULV chip from Intel, which, in this case, is not cooled passively. Here, it is cooled with a small dedicated fan.
After the launch in the USA, there were reports about problems with the power management under high load. We encountered similar problems in our review of the smaller Surface Book 2 13. Microsoft supplies both versions with the same AC adapter (95 W according to Microsoft, 102 W in both of our review devices), which does not bode well at all, considering the higher energy demands of the GTX 1060. But of course, we will still examine in great detail what kind of impact this has on the energy management.
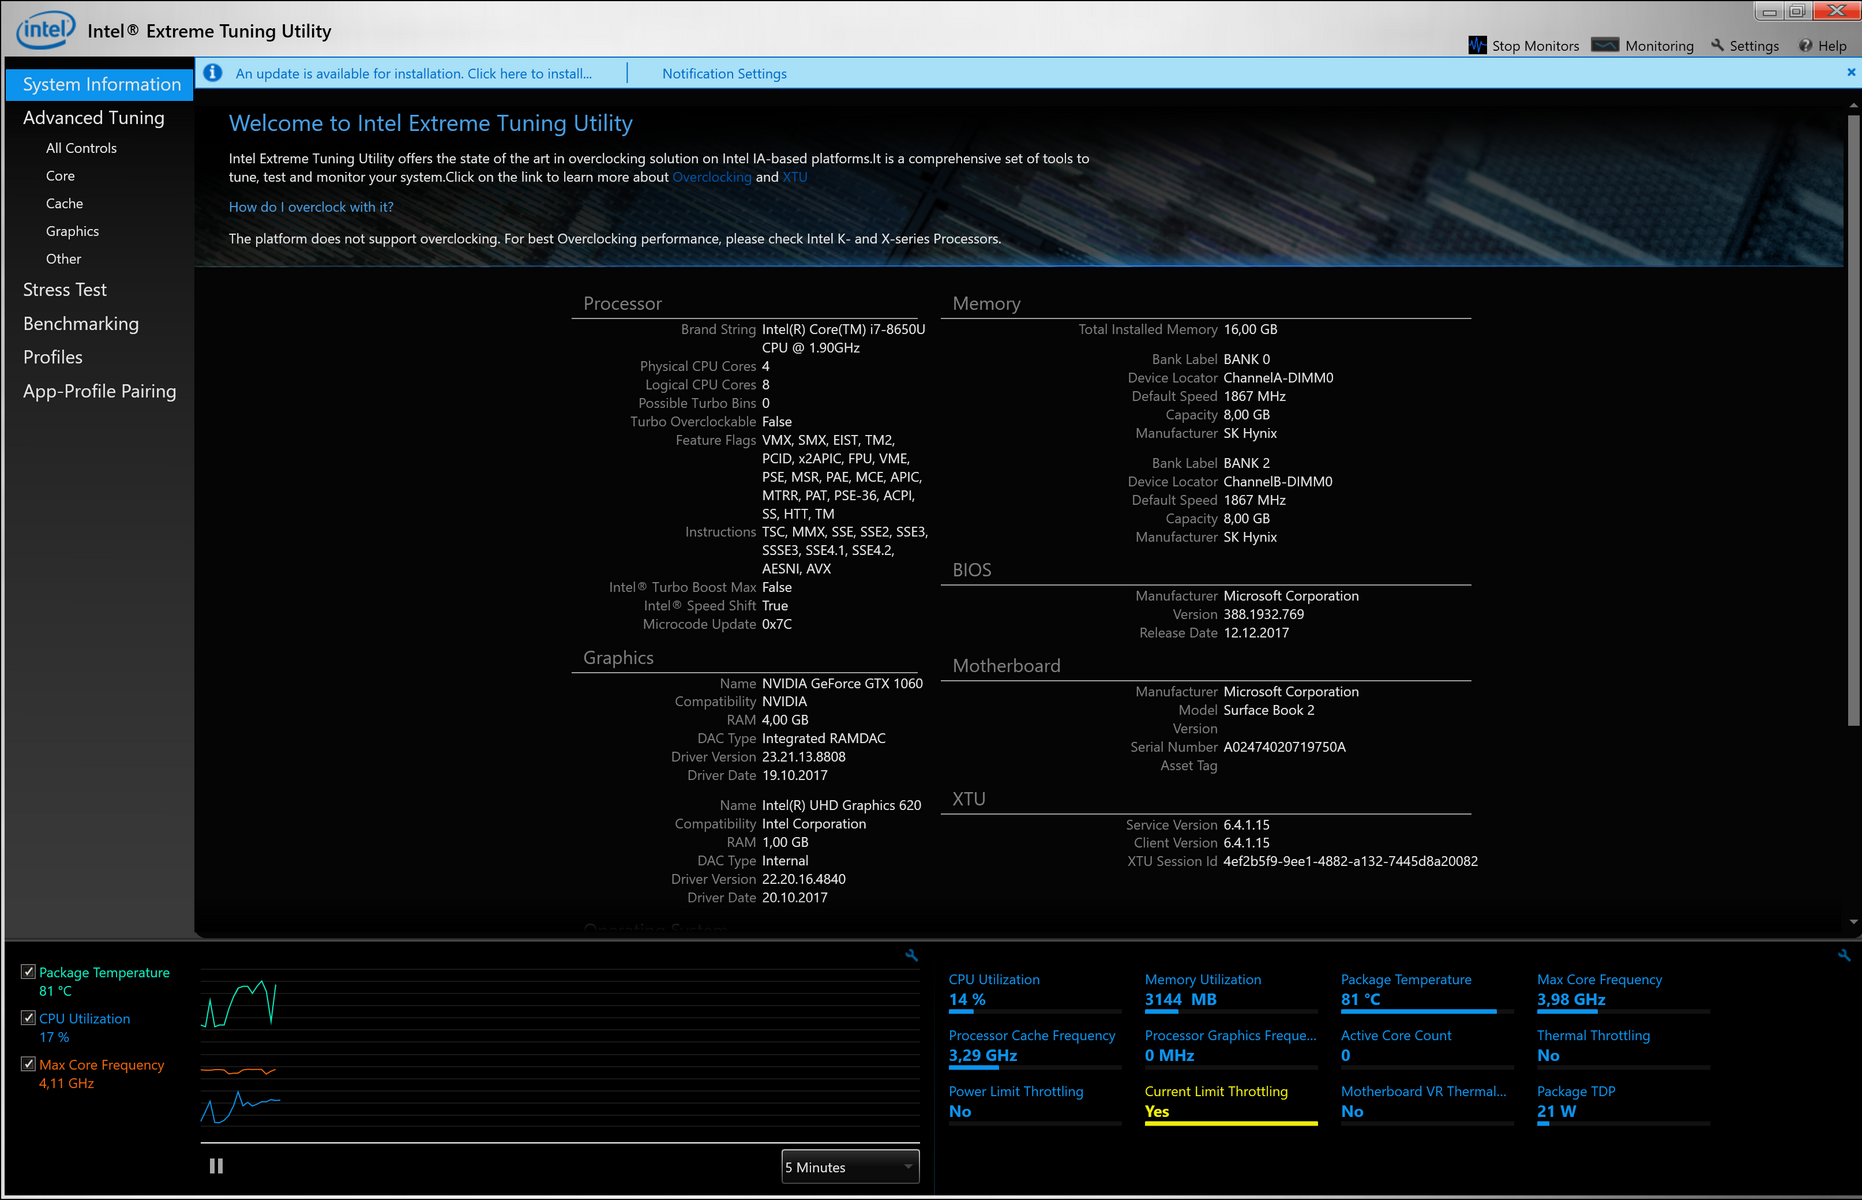
Right now, there are three different versions of the Surface Book 2 15, each of them differentiated by the amount of storage space. The 2799-Euro ($3472) base model, which we are currently reviewing, has a 256 GB SSD. You will have to fork out 3299 Euros ($4093) for the 512 GB model and 3799 Euros ($4713) for the 1 TB model - these are some hefty surcharges. Above all, the 500-Euro ($620) jump in price between the 256 GB and the 512 GB models is unreasonably high. All three models come with the refreshed Kaby Lake processor Core i7-8650U, 16 GB of RAM and the GTX 1060 with 6 GB of VRAM.
The Surface Book 2 is a very versatile device, and, therefore, it is hard to categorize. This applies more to the 15-inch model than the small brother, because the GTX 1060 is mainly reserved for gaming or very powerful multimedia notebooks. In the convertible space, there are really no alternatives to speak of, either in terms of price or performance. And this is why we have chosen the following devices for comparison purposes: the Dell XPS 15, the Razer Blade 2017, the Apple MacBook Pro 15. We will also compare the smaller Surface Book 2 13 with the 15-inch model.
Below you will find our first review results. As usual, the rest is to follow in the next couple of days.
- 02/18: additional display data, Witcher 3 analysis, temperatures & stress test, video playback battery life.
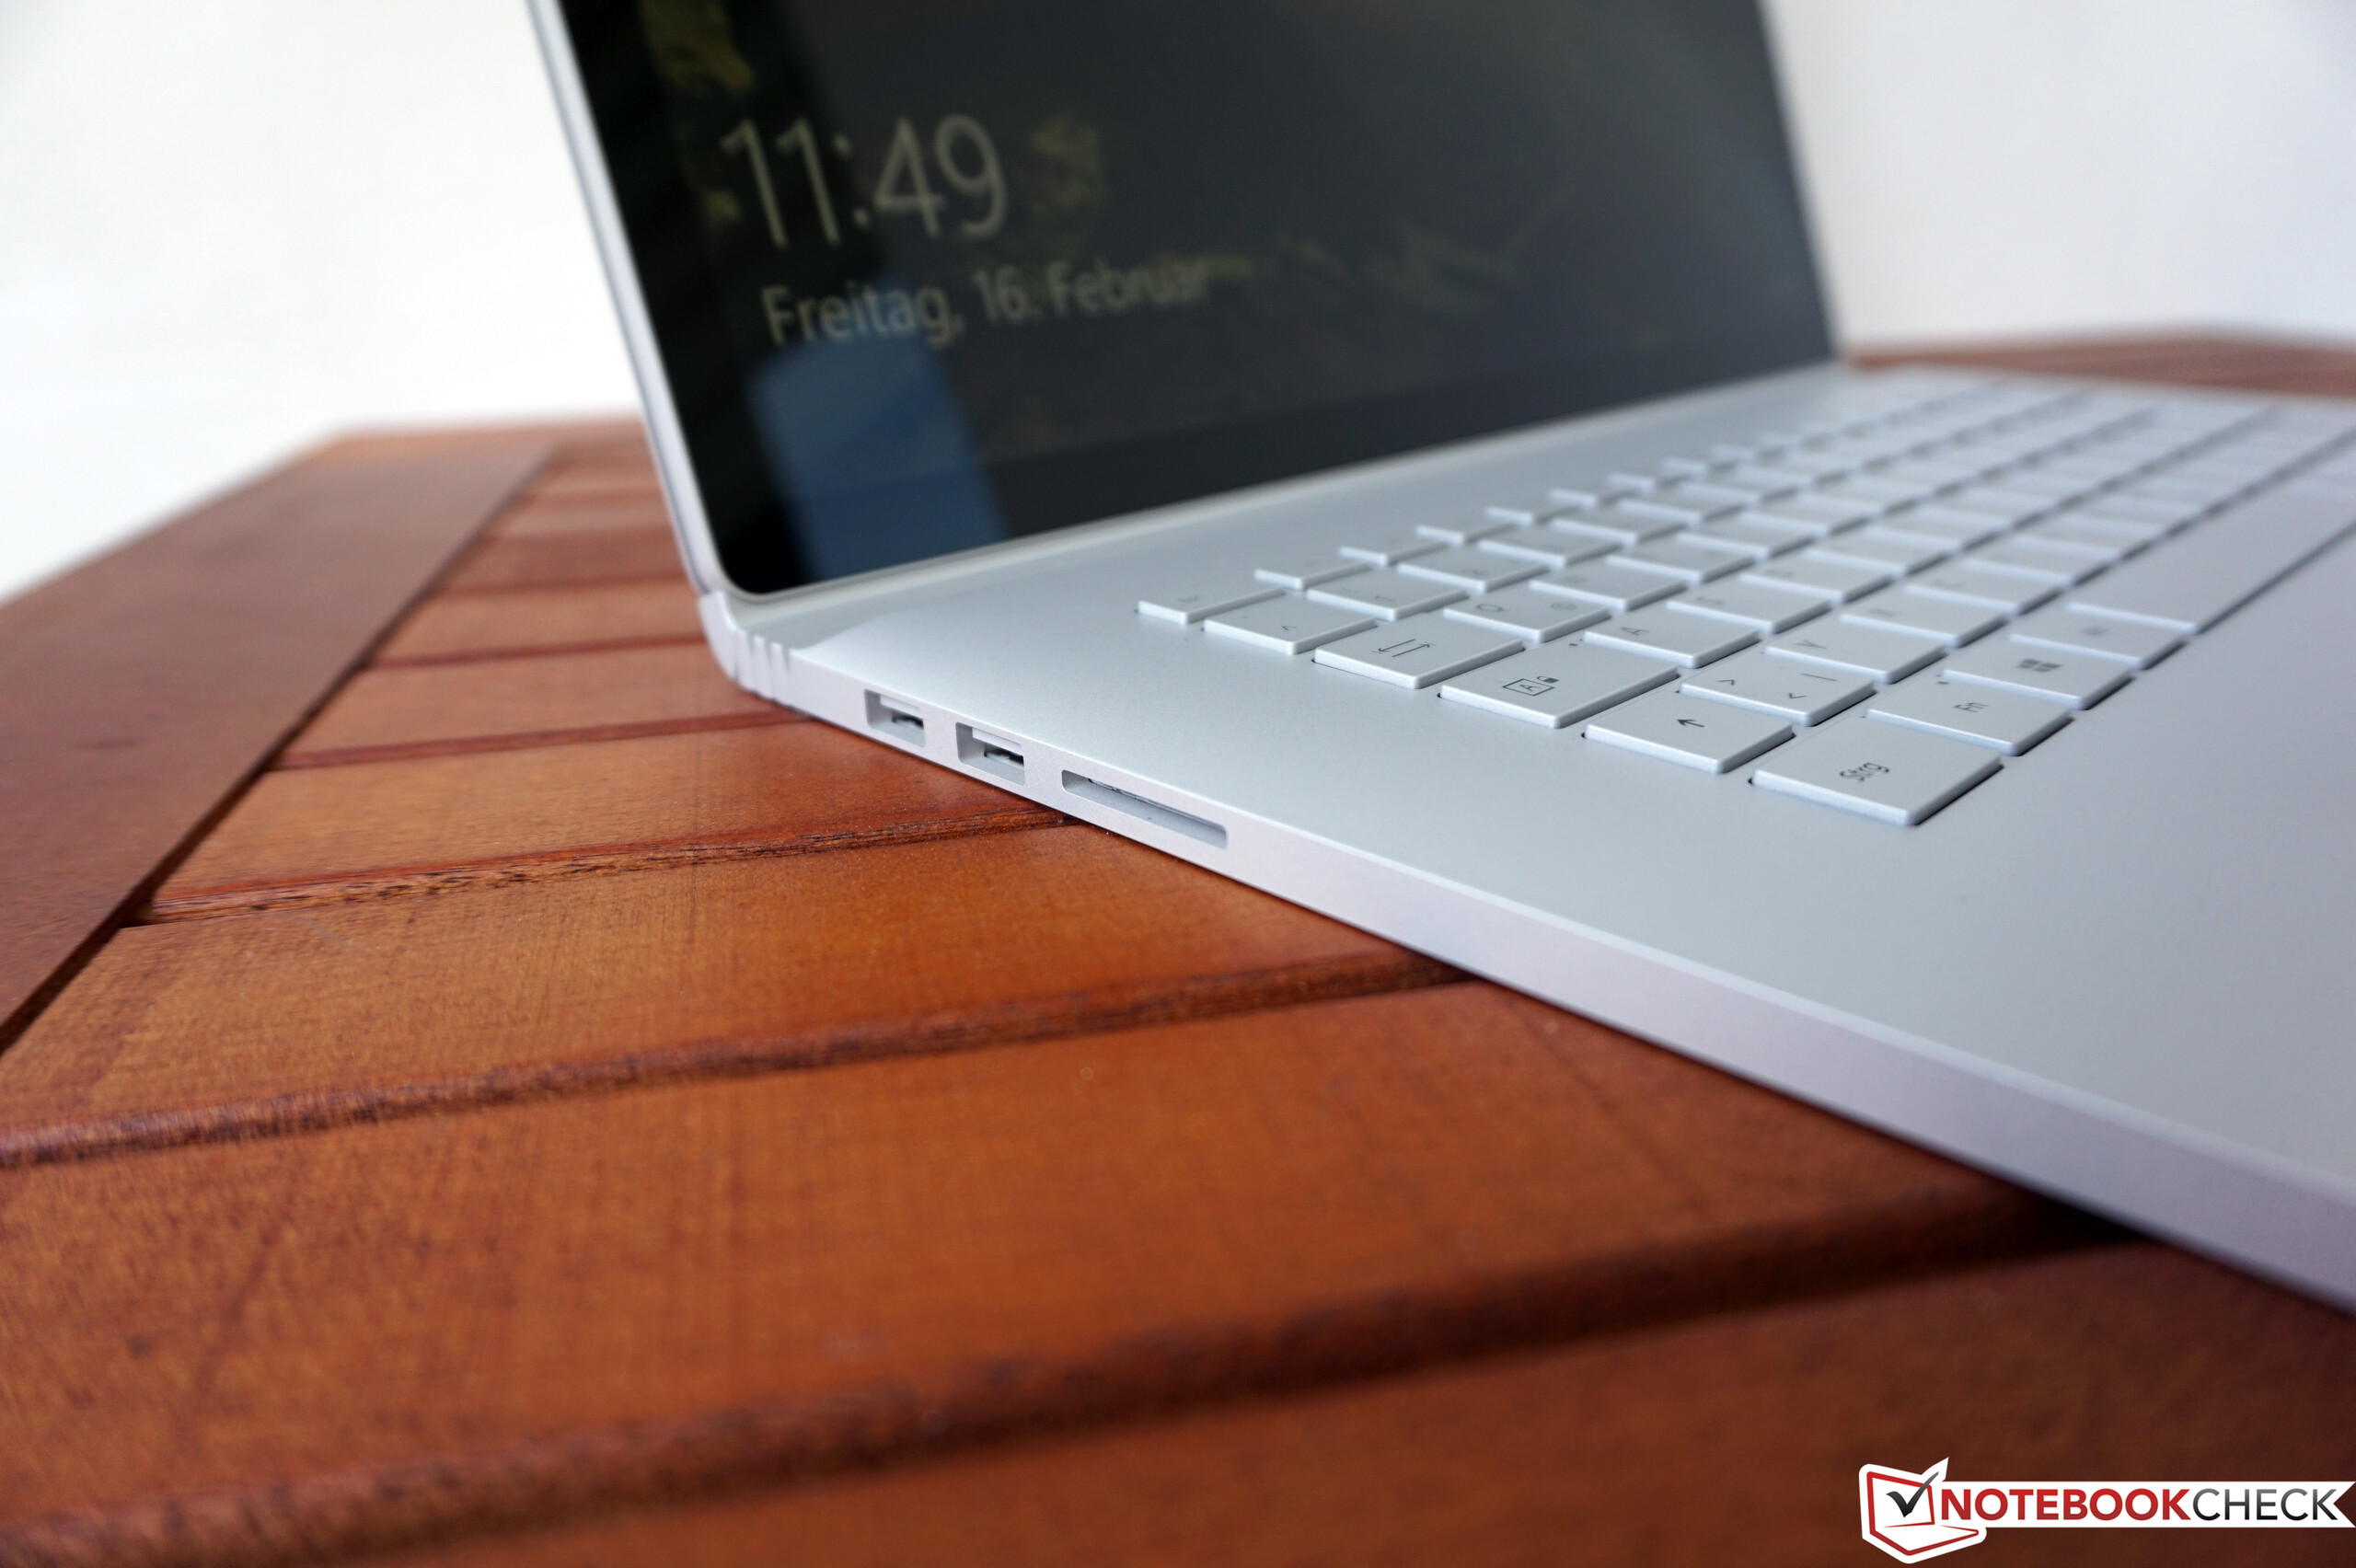
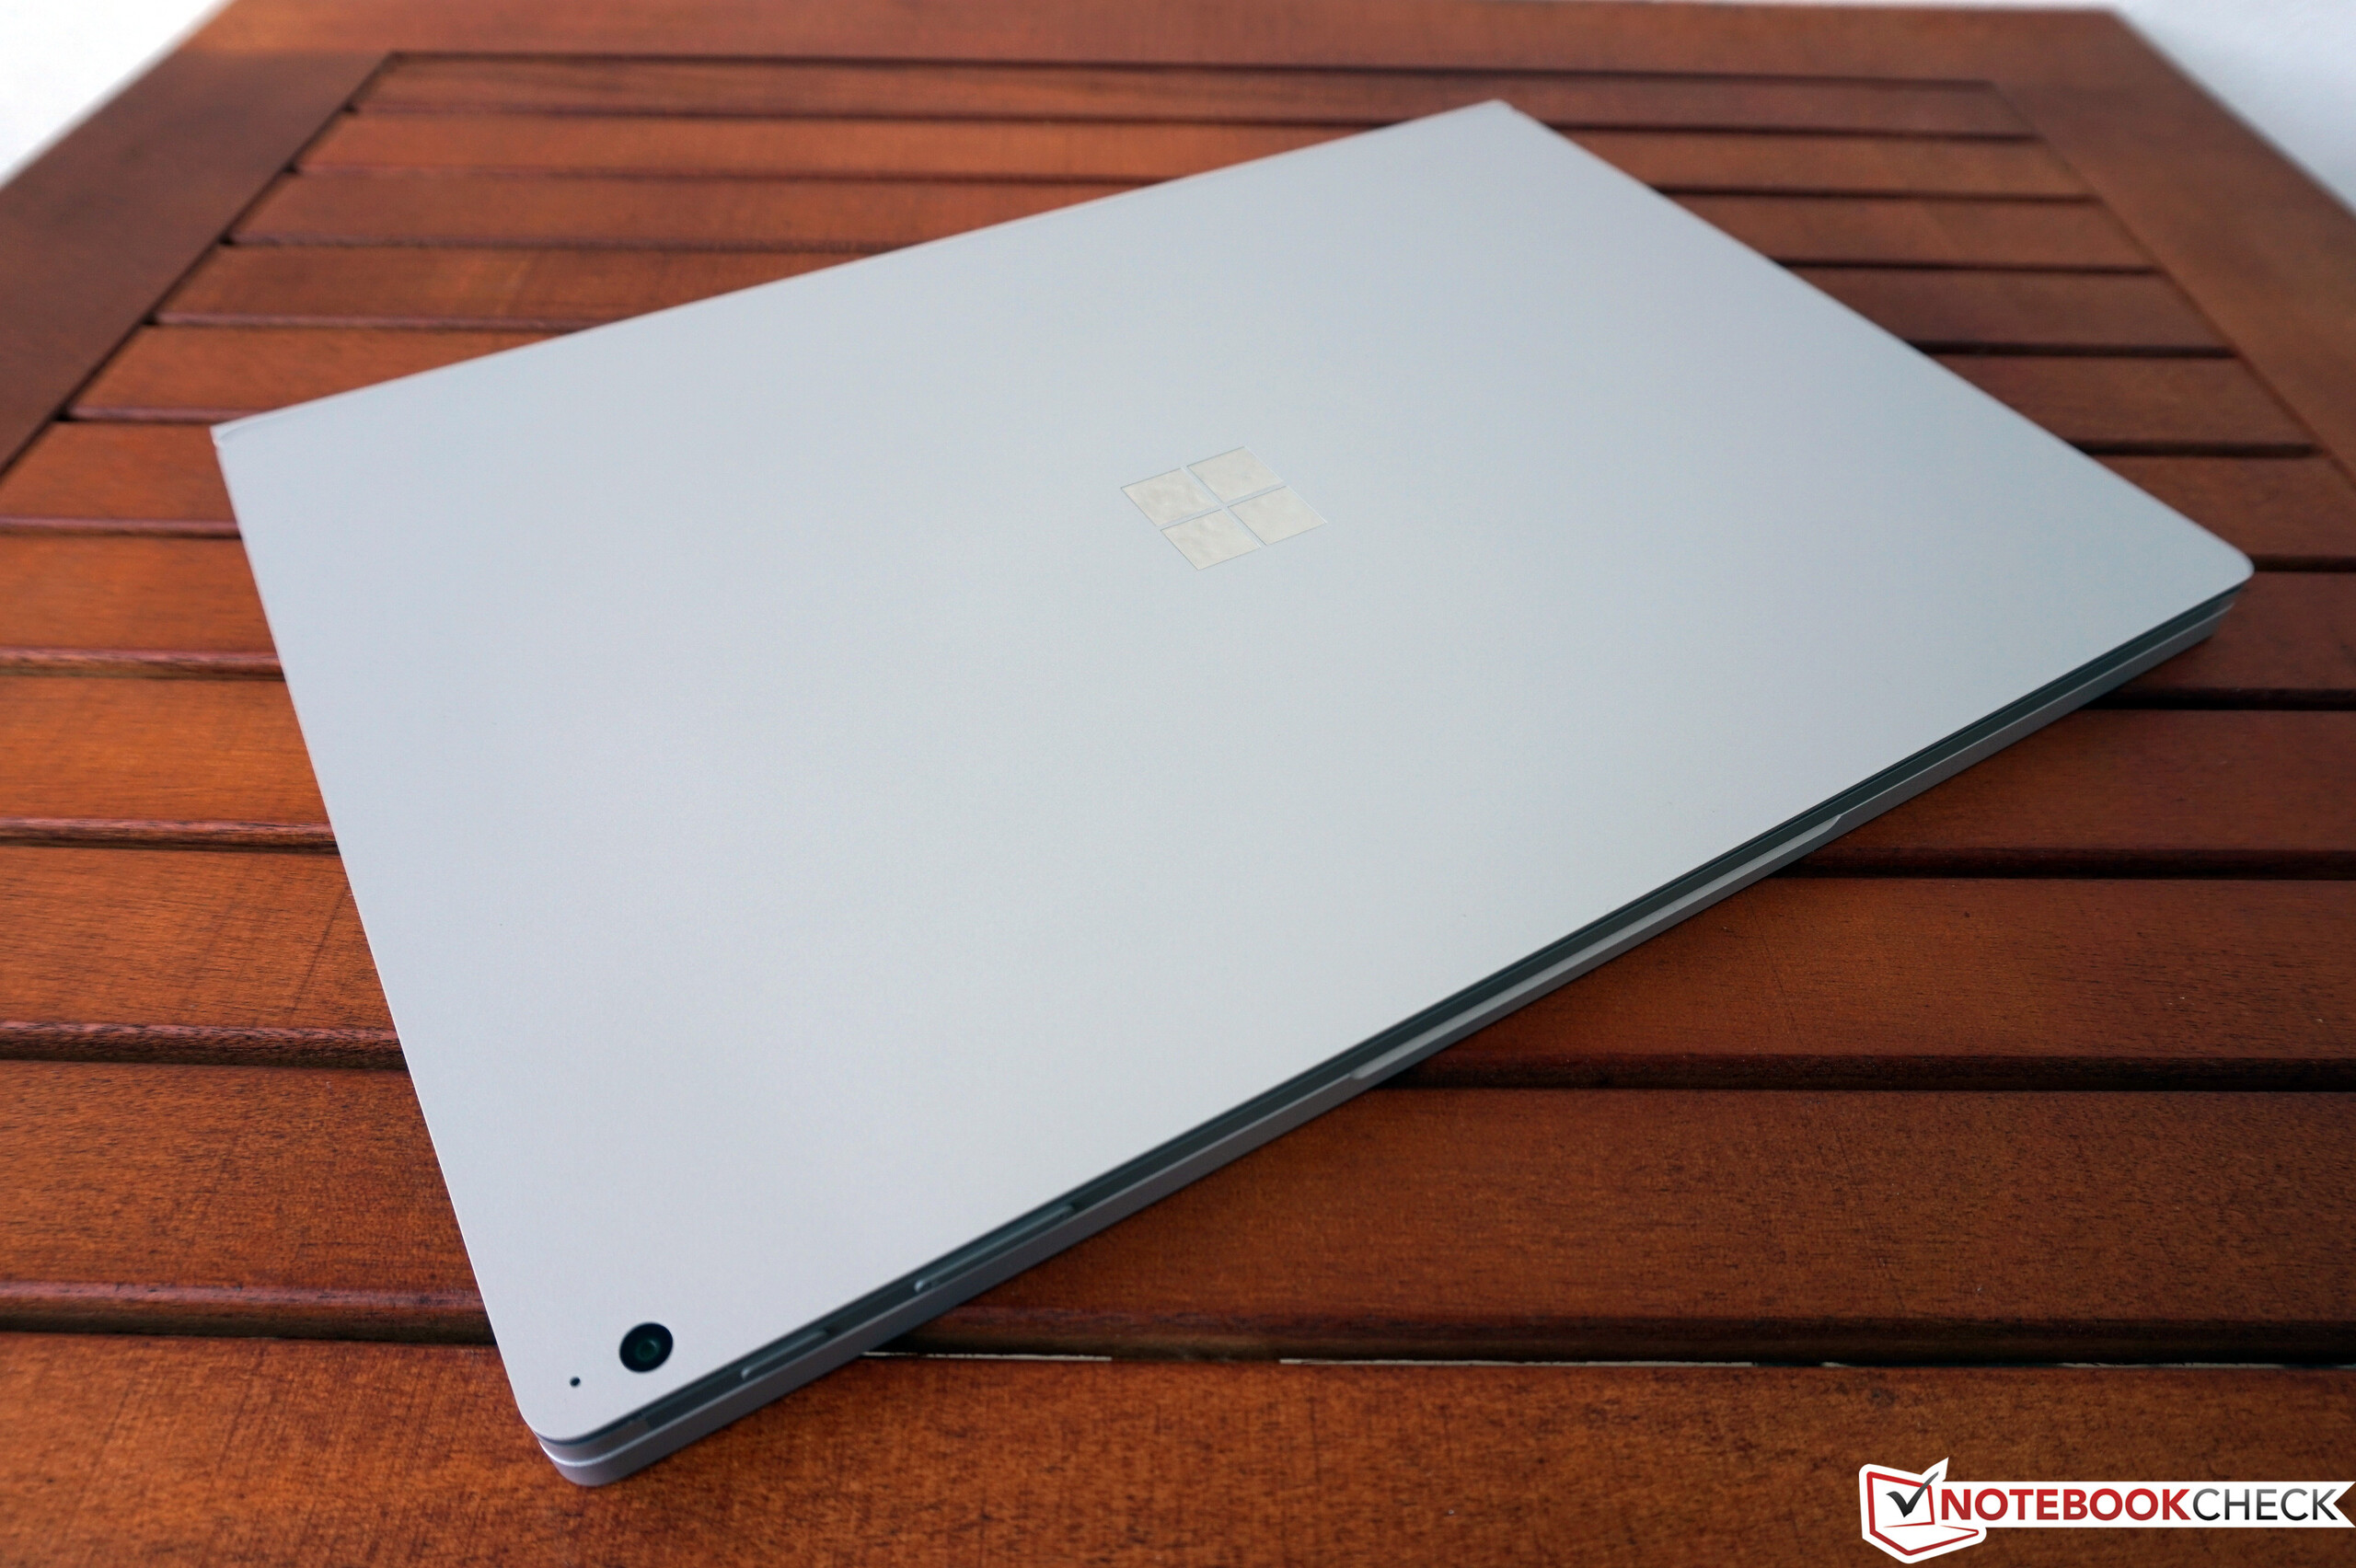
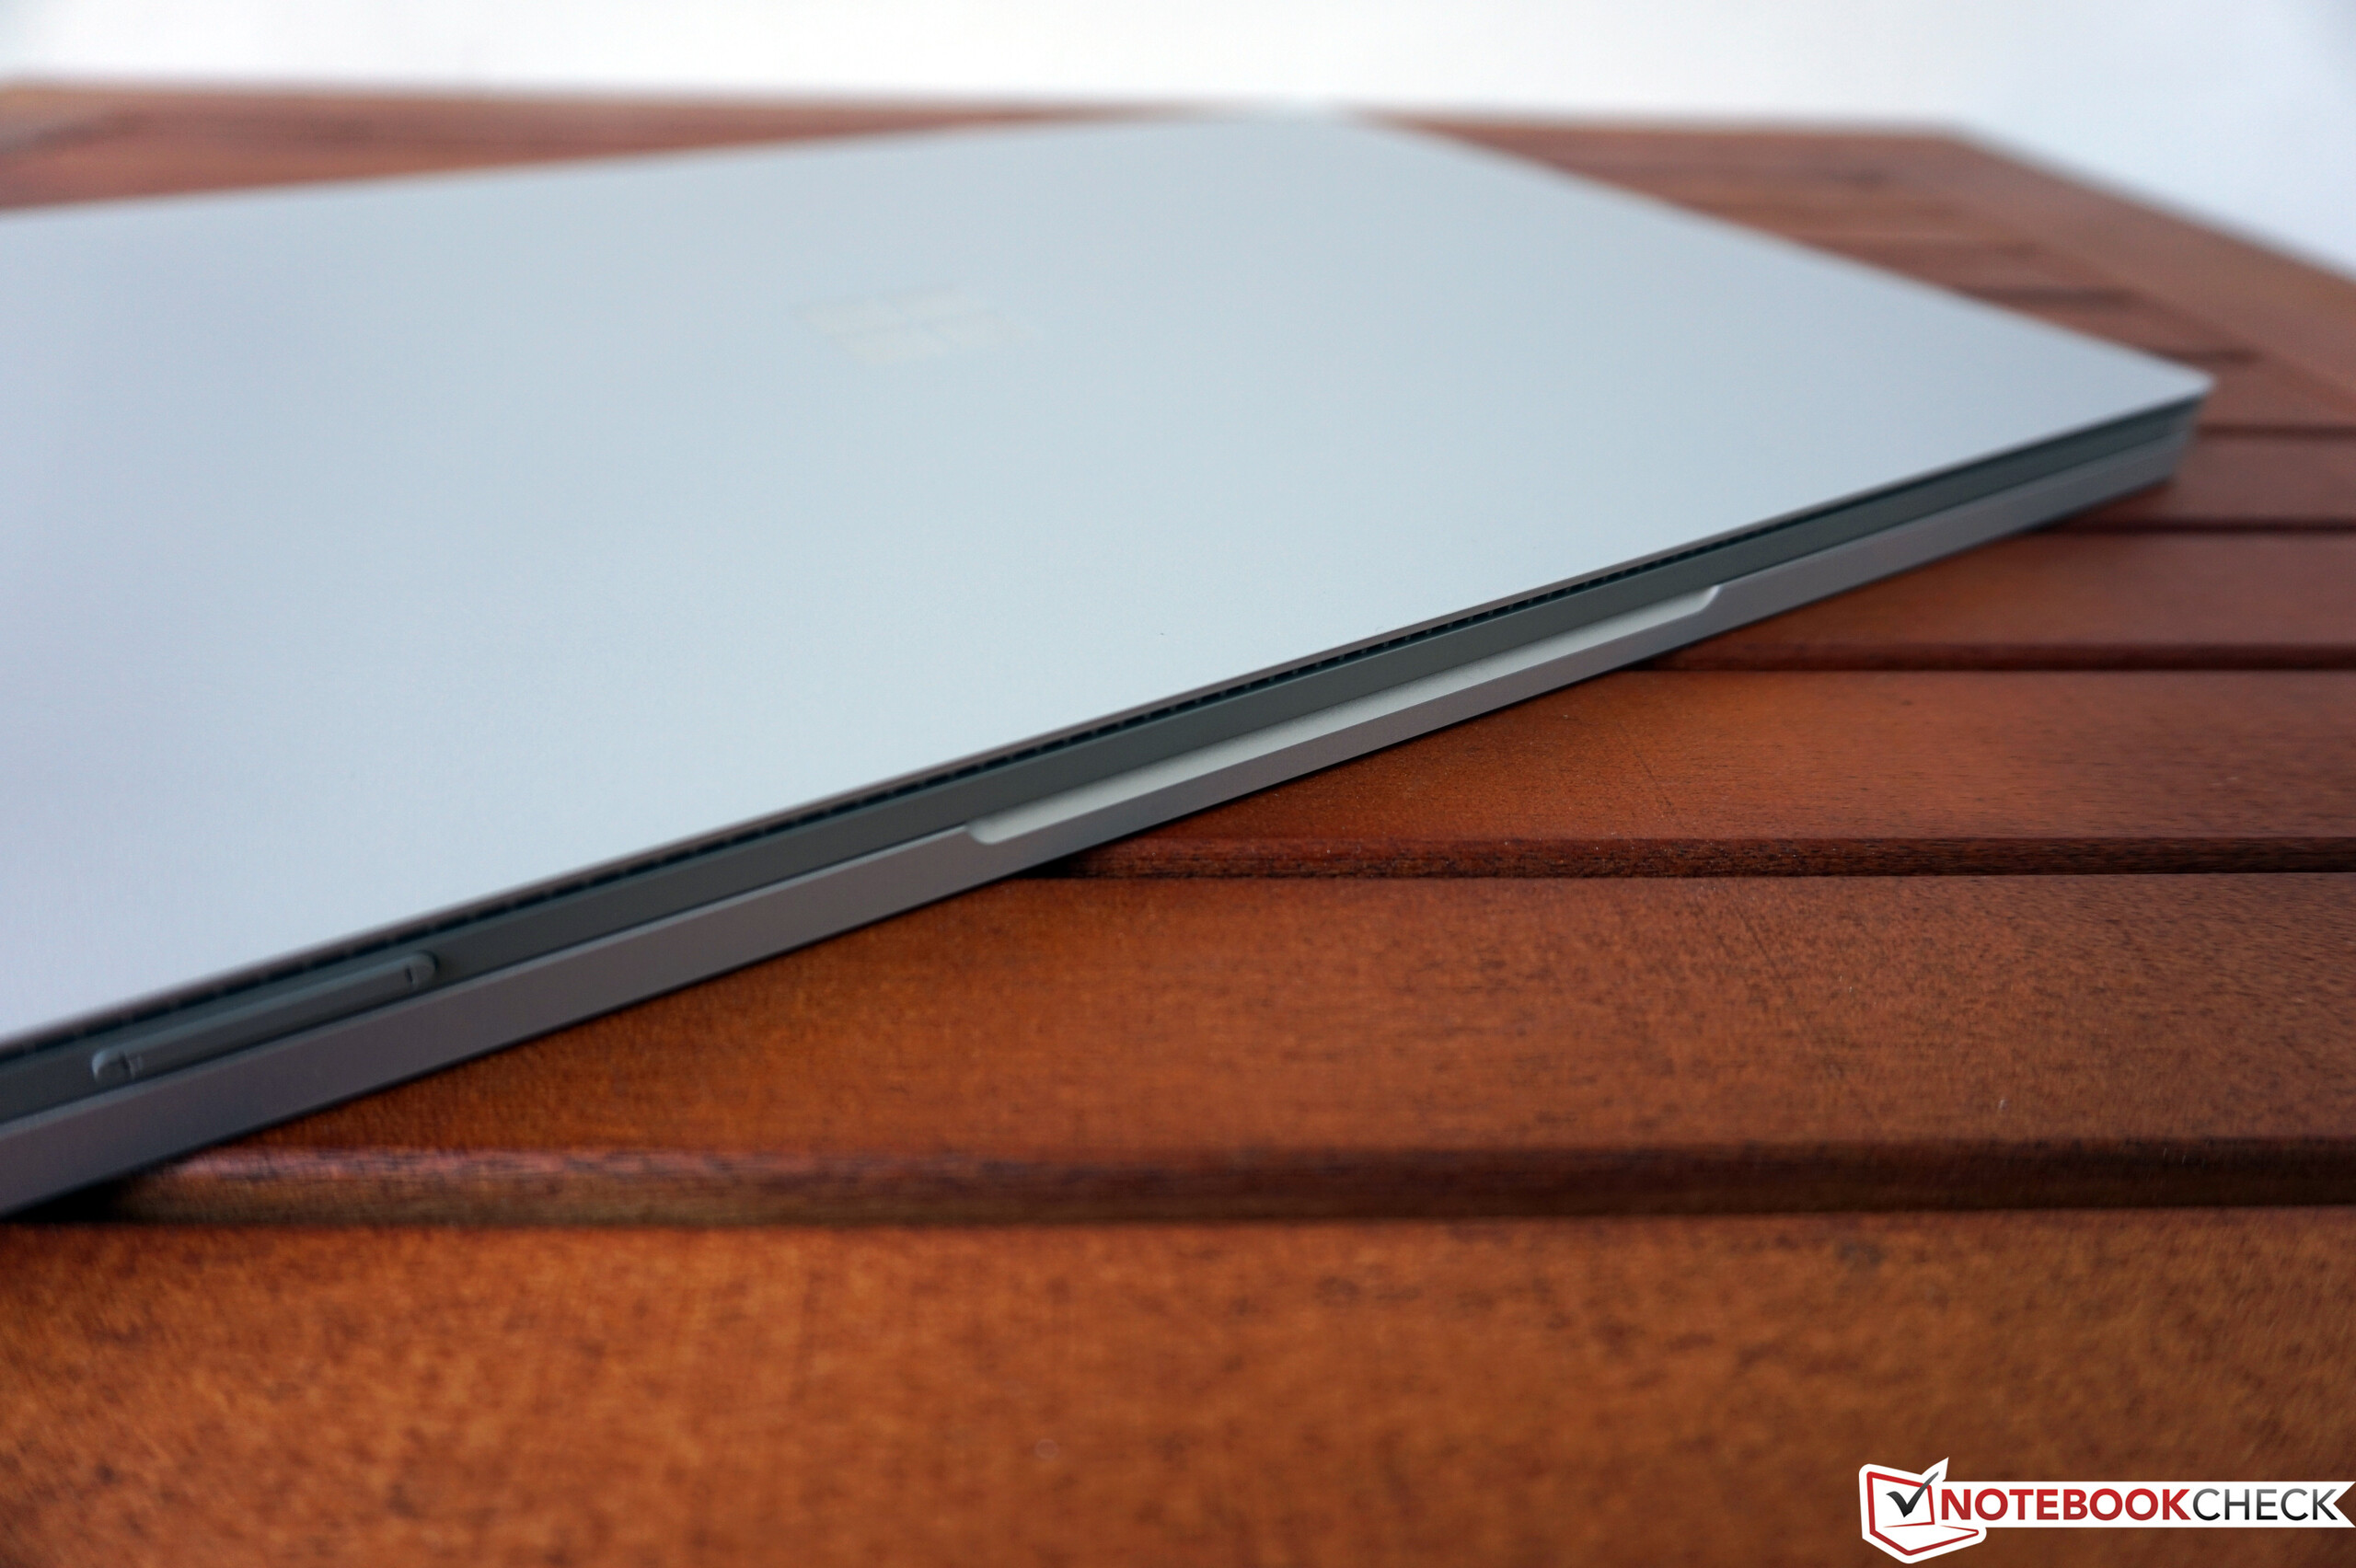
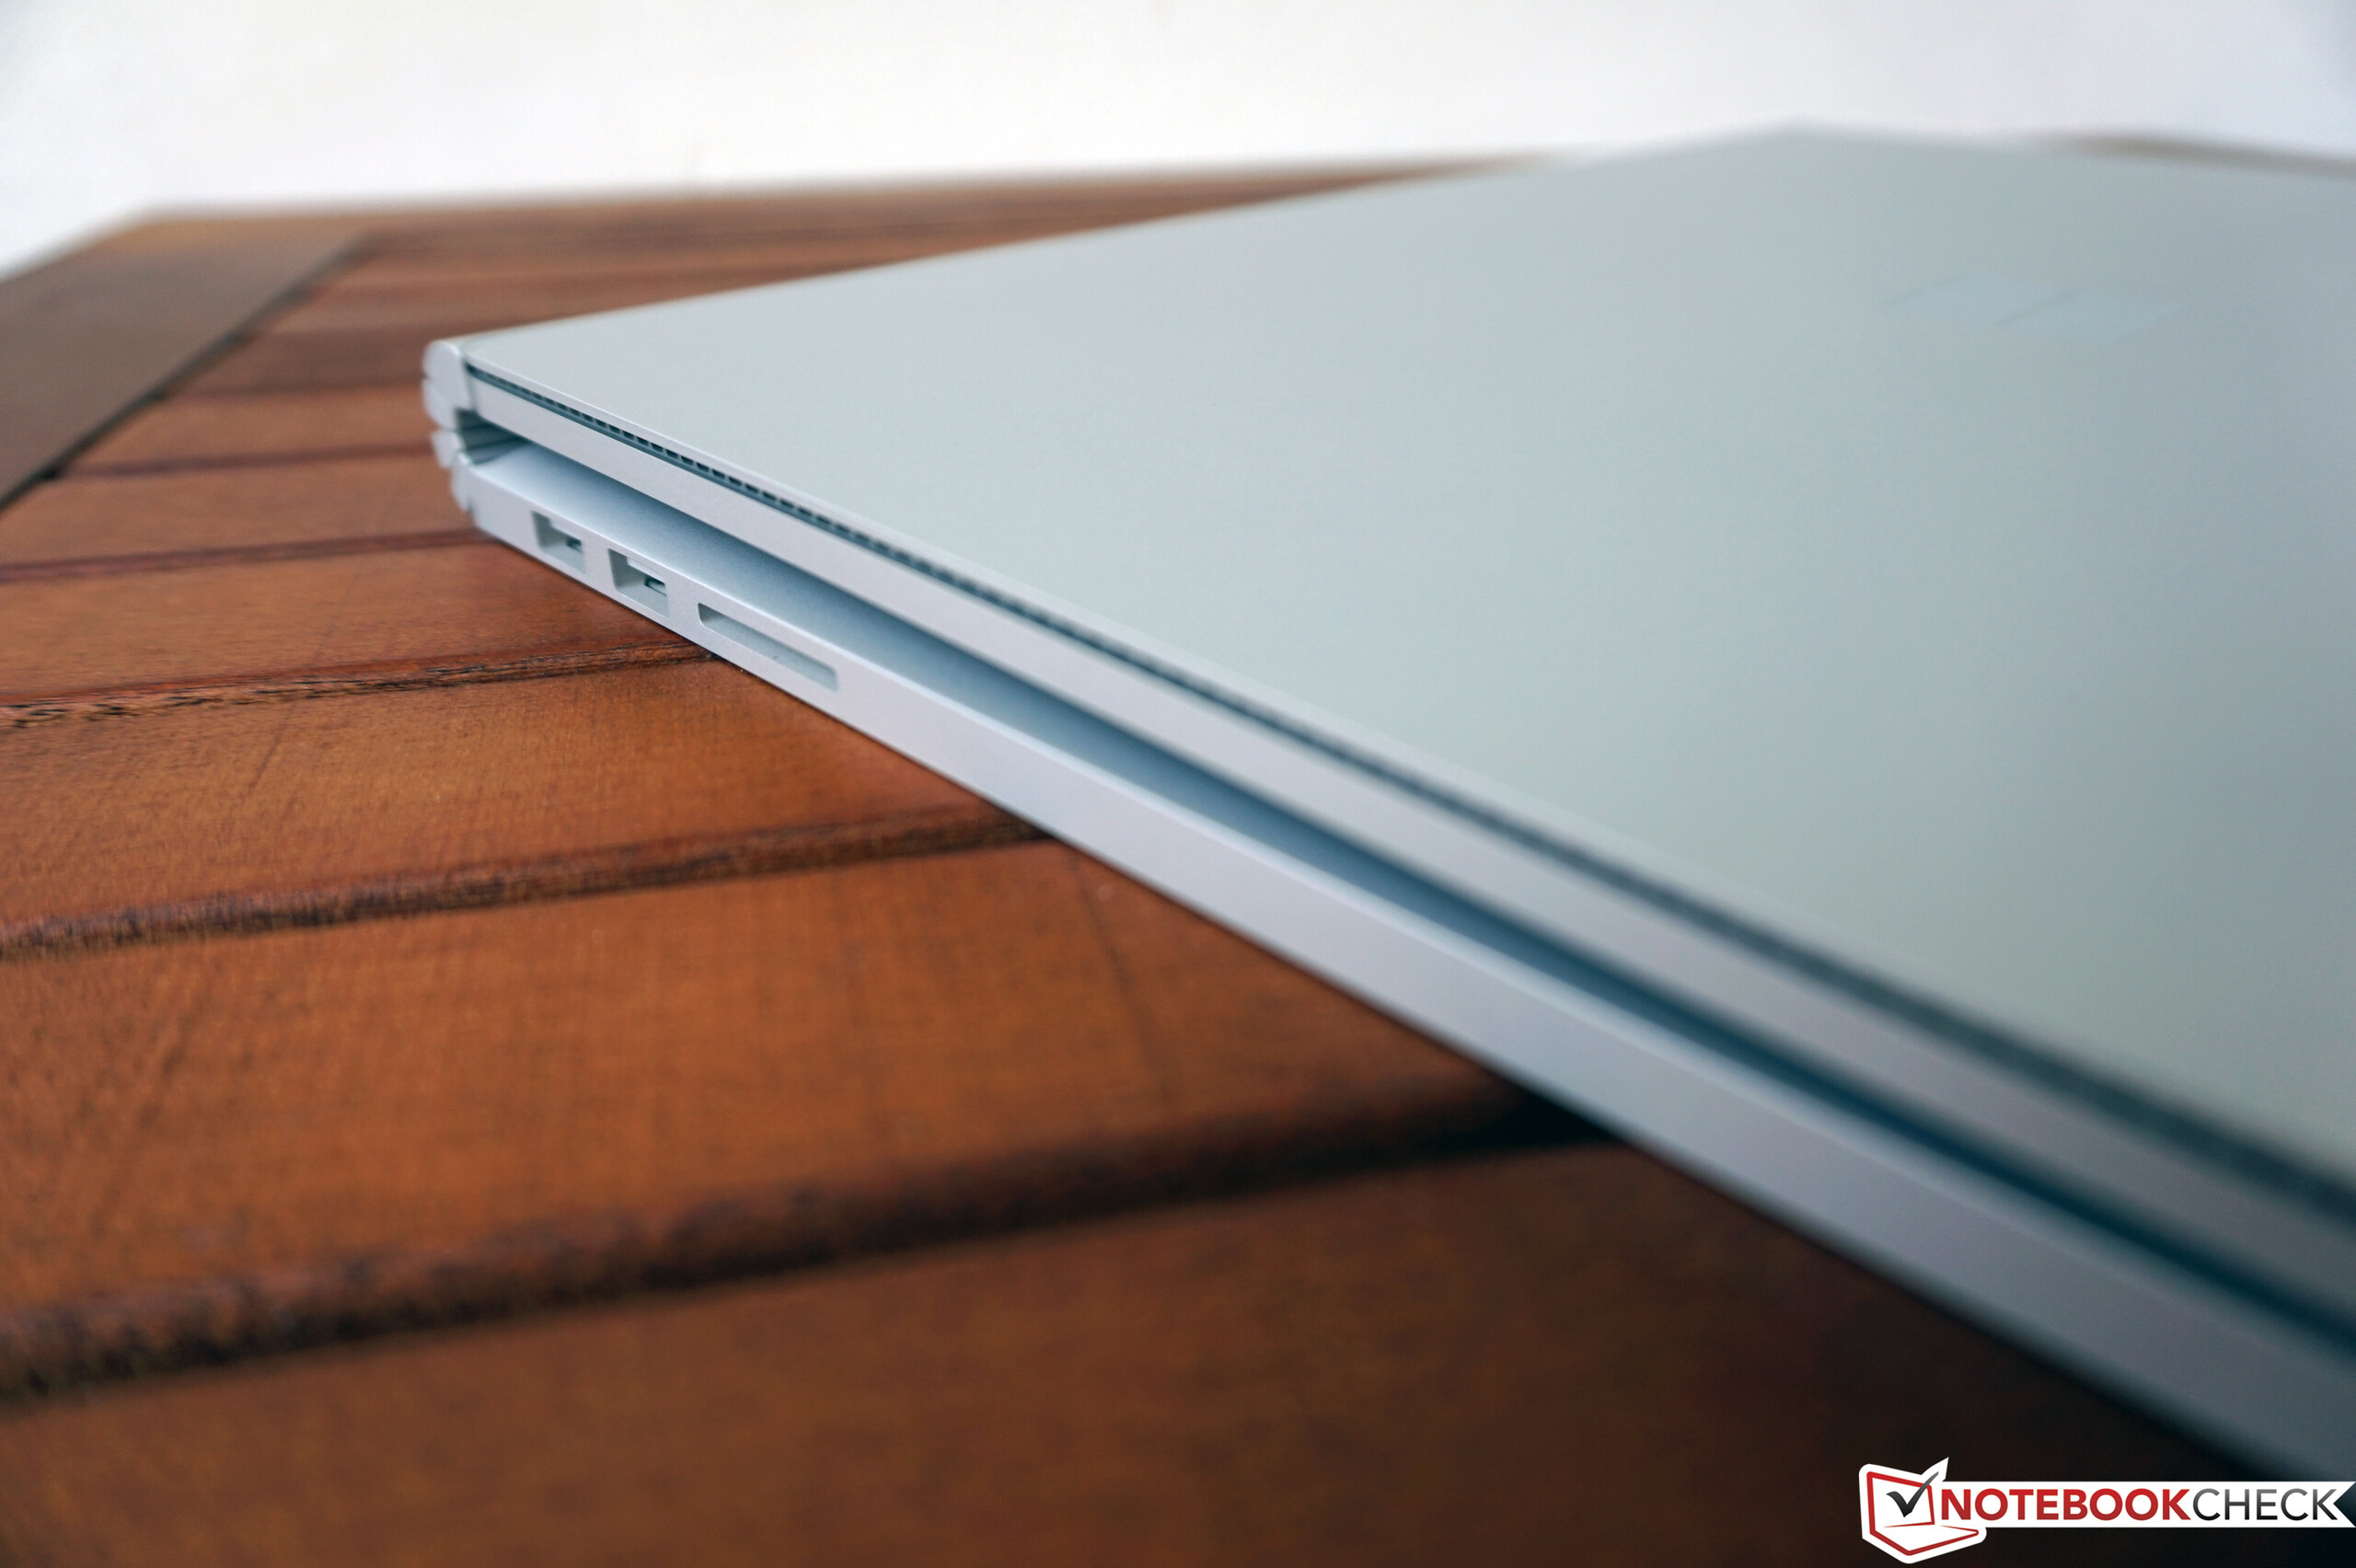
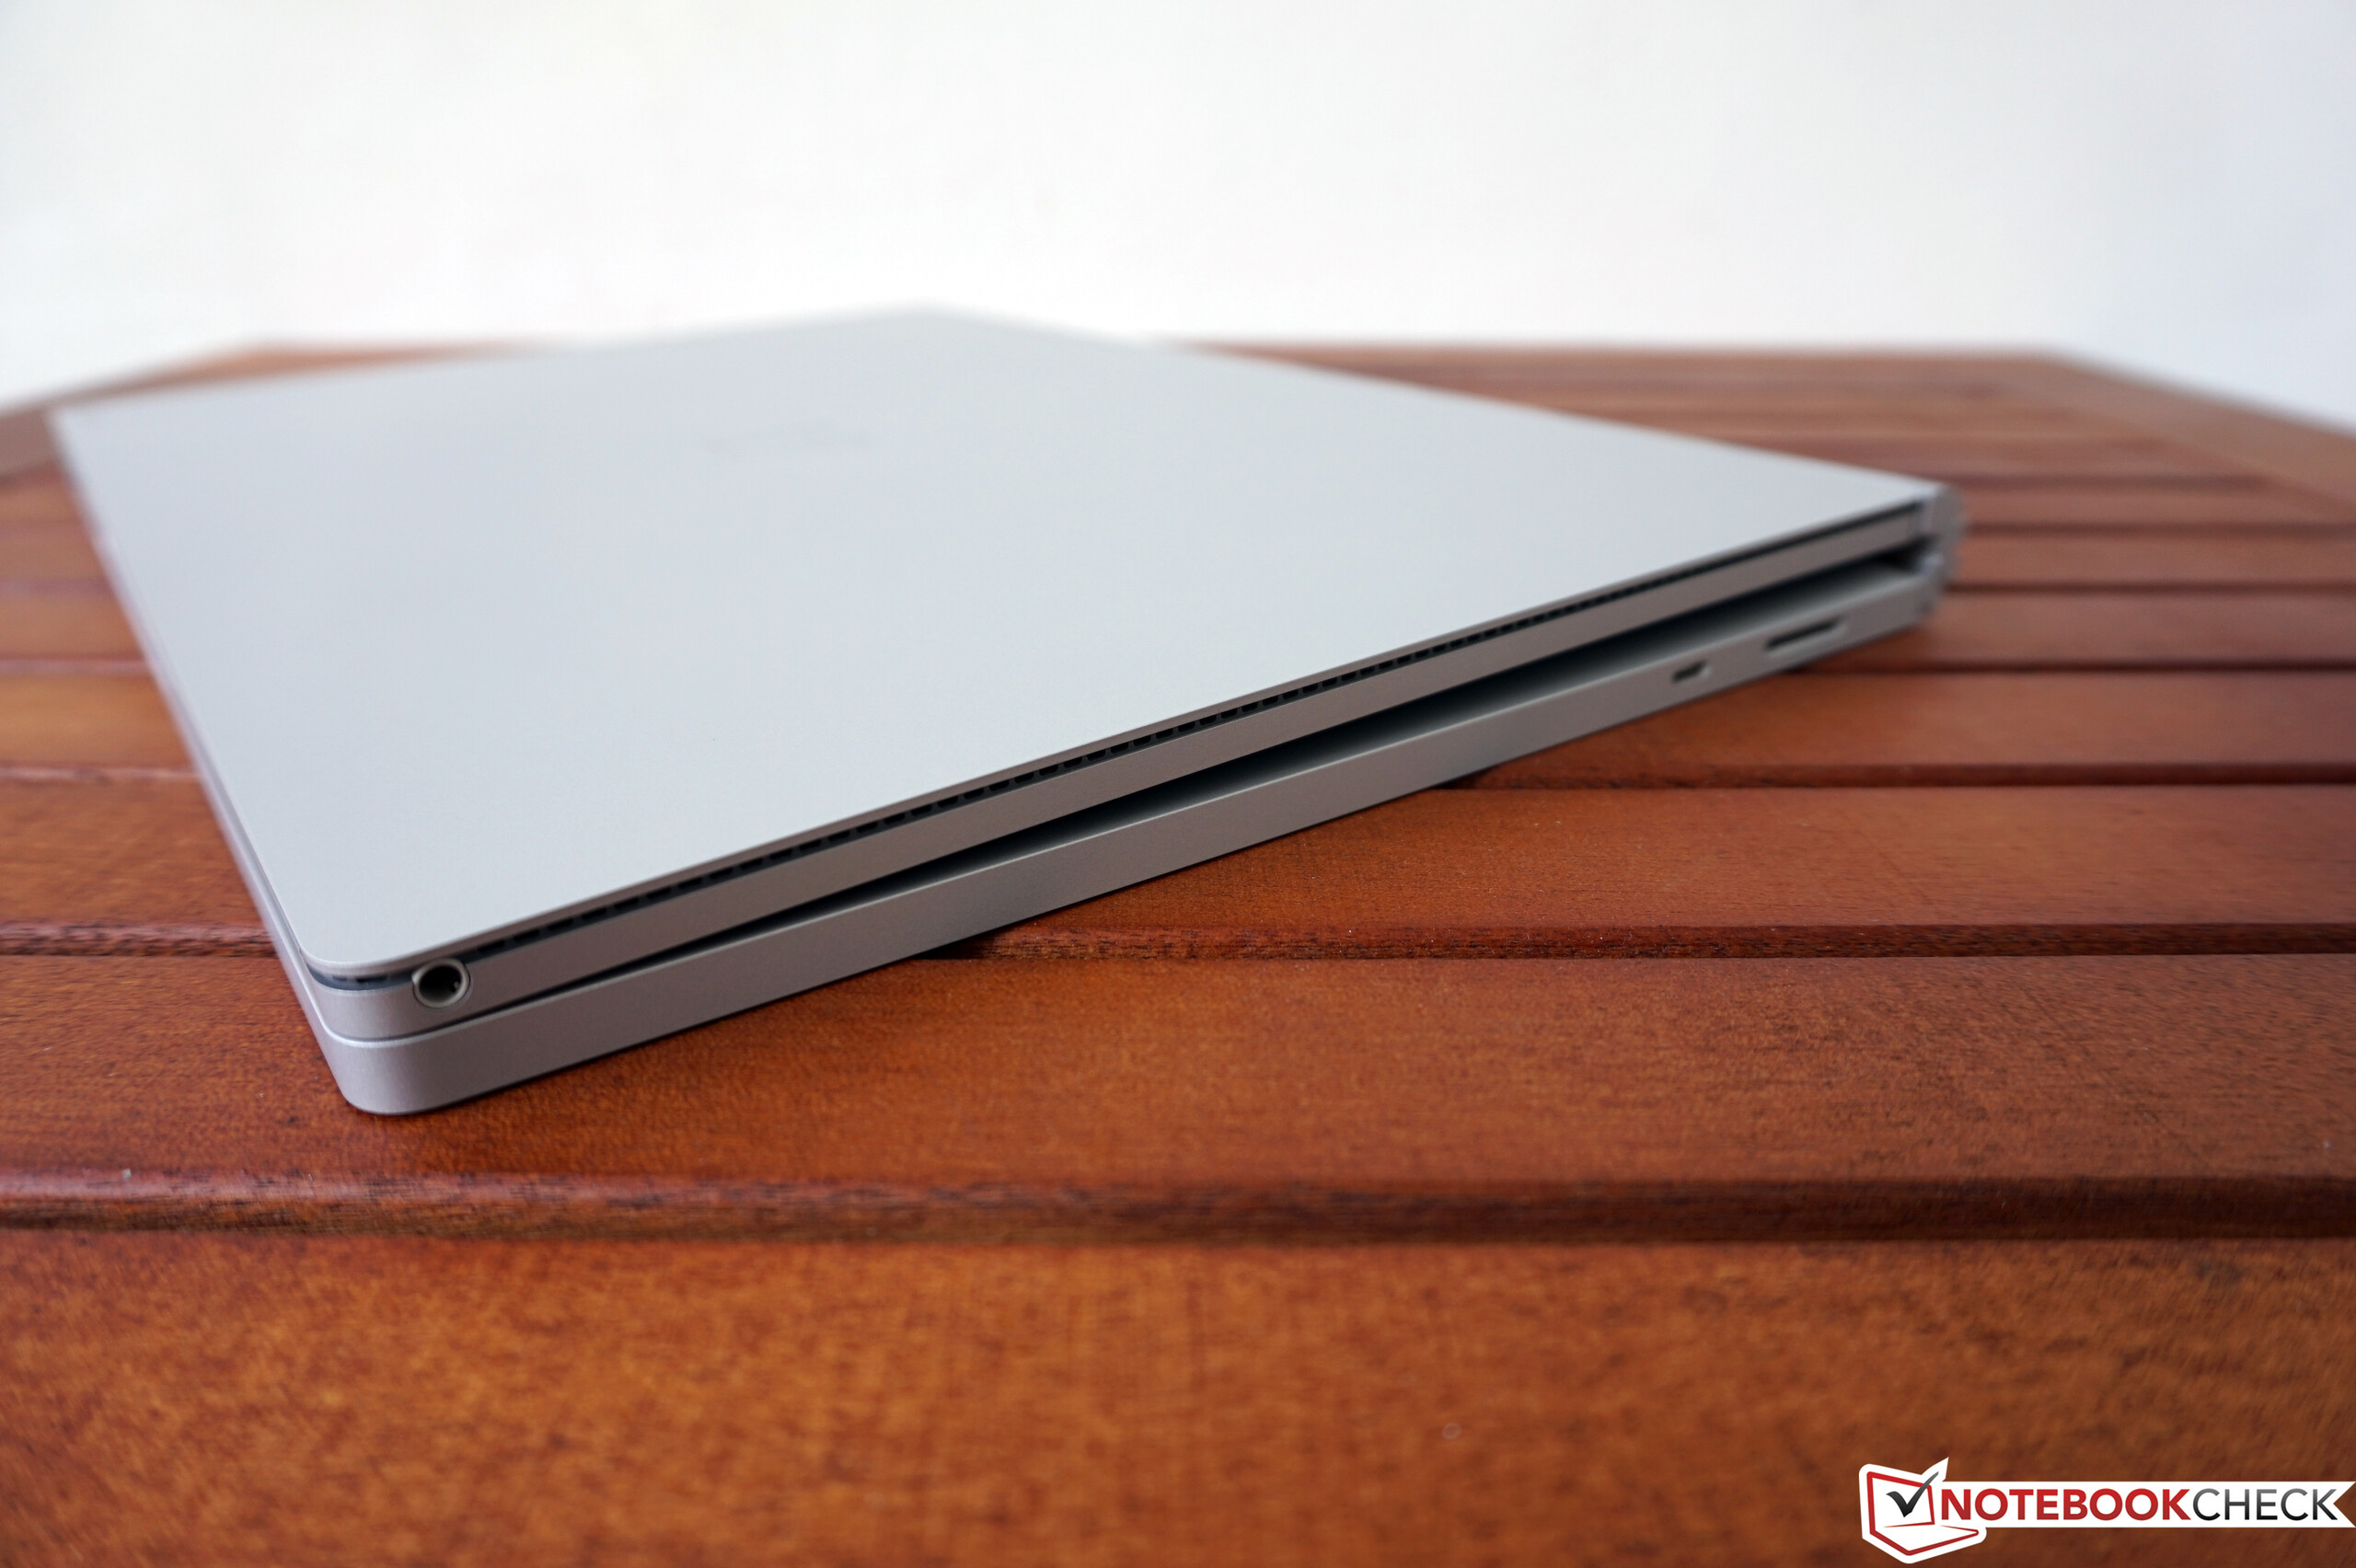
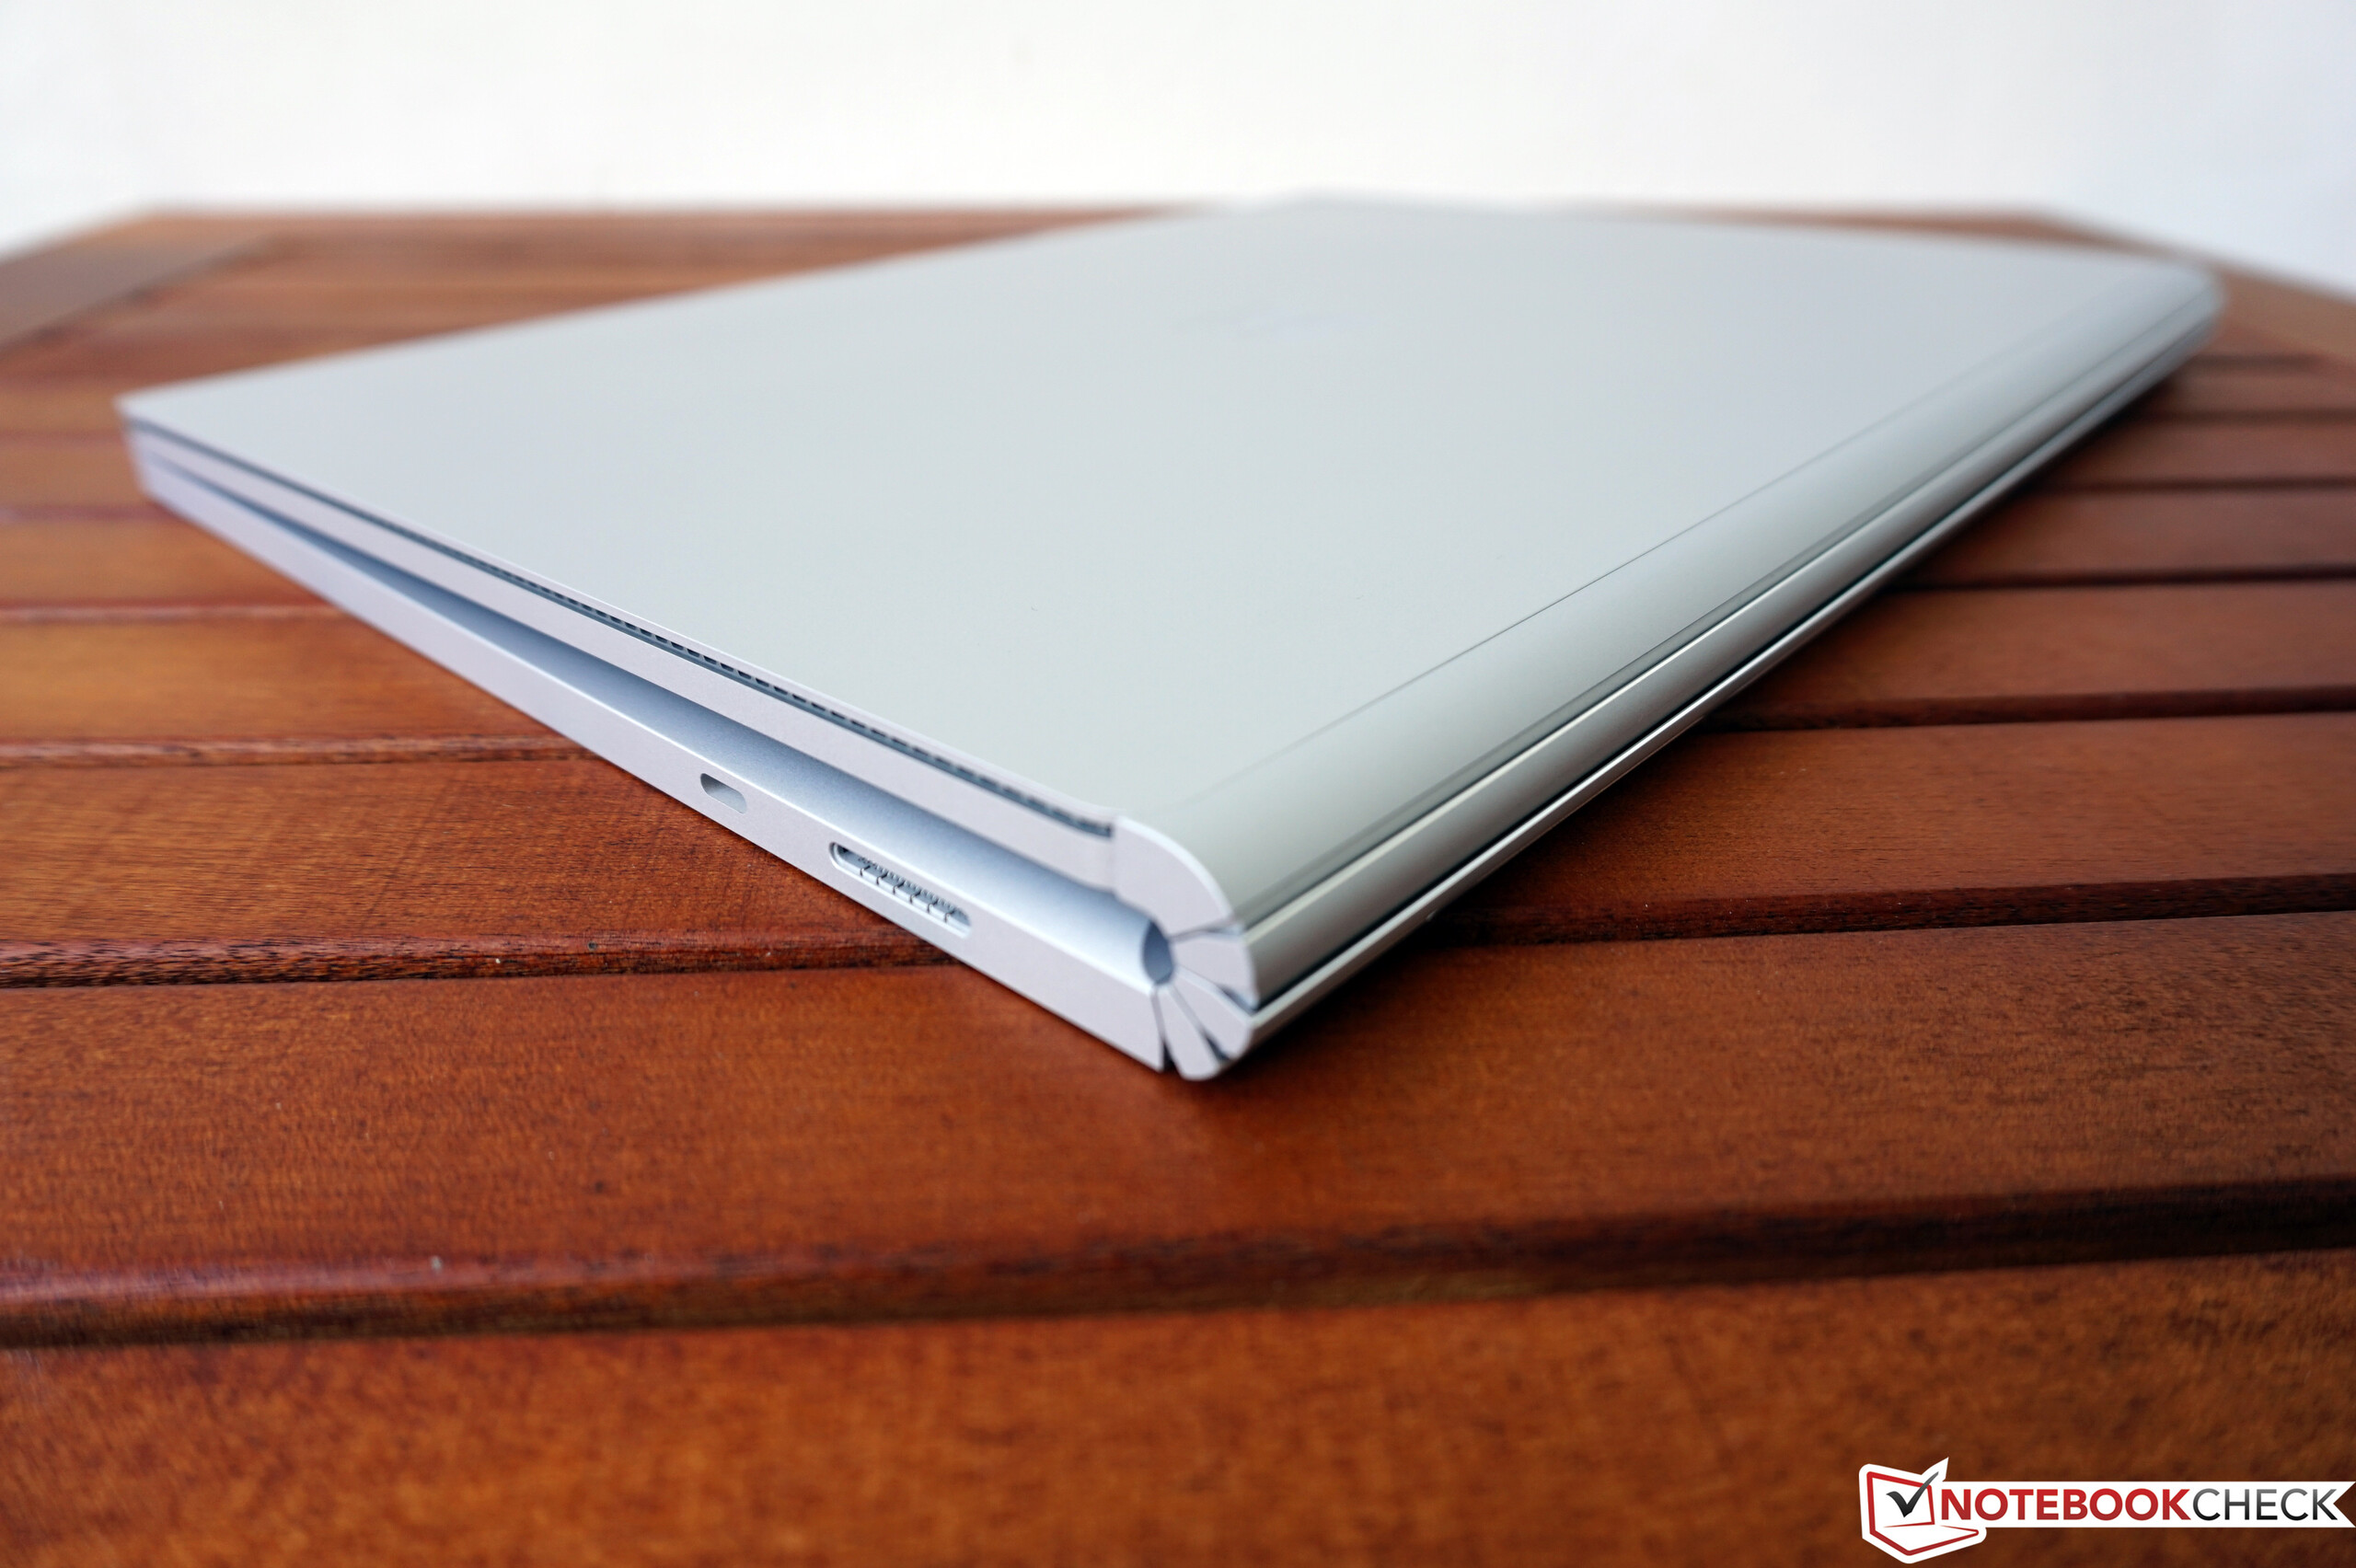
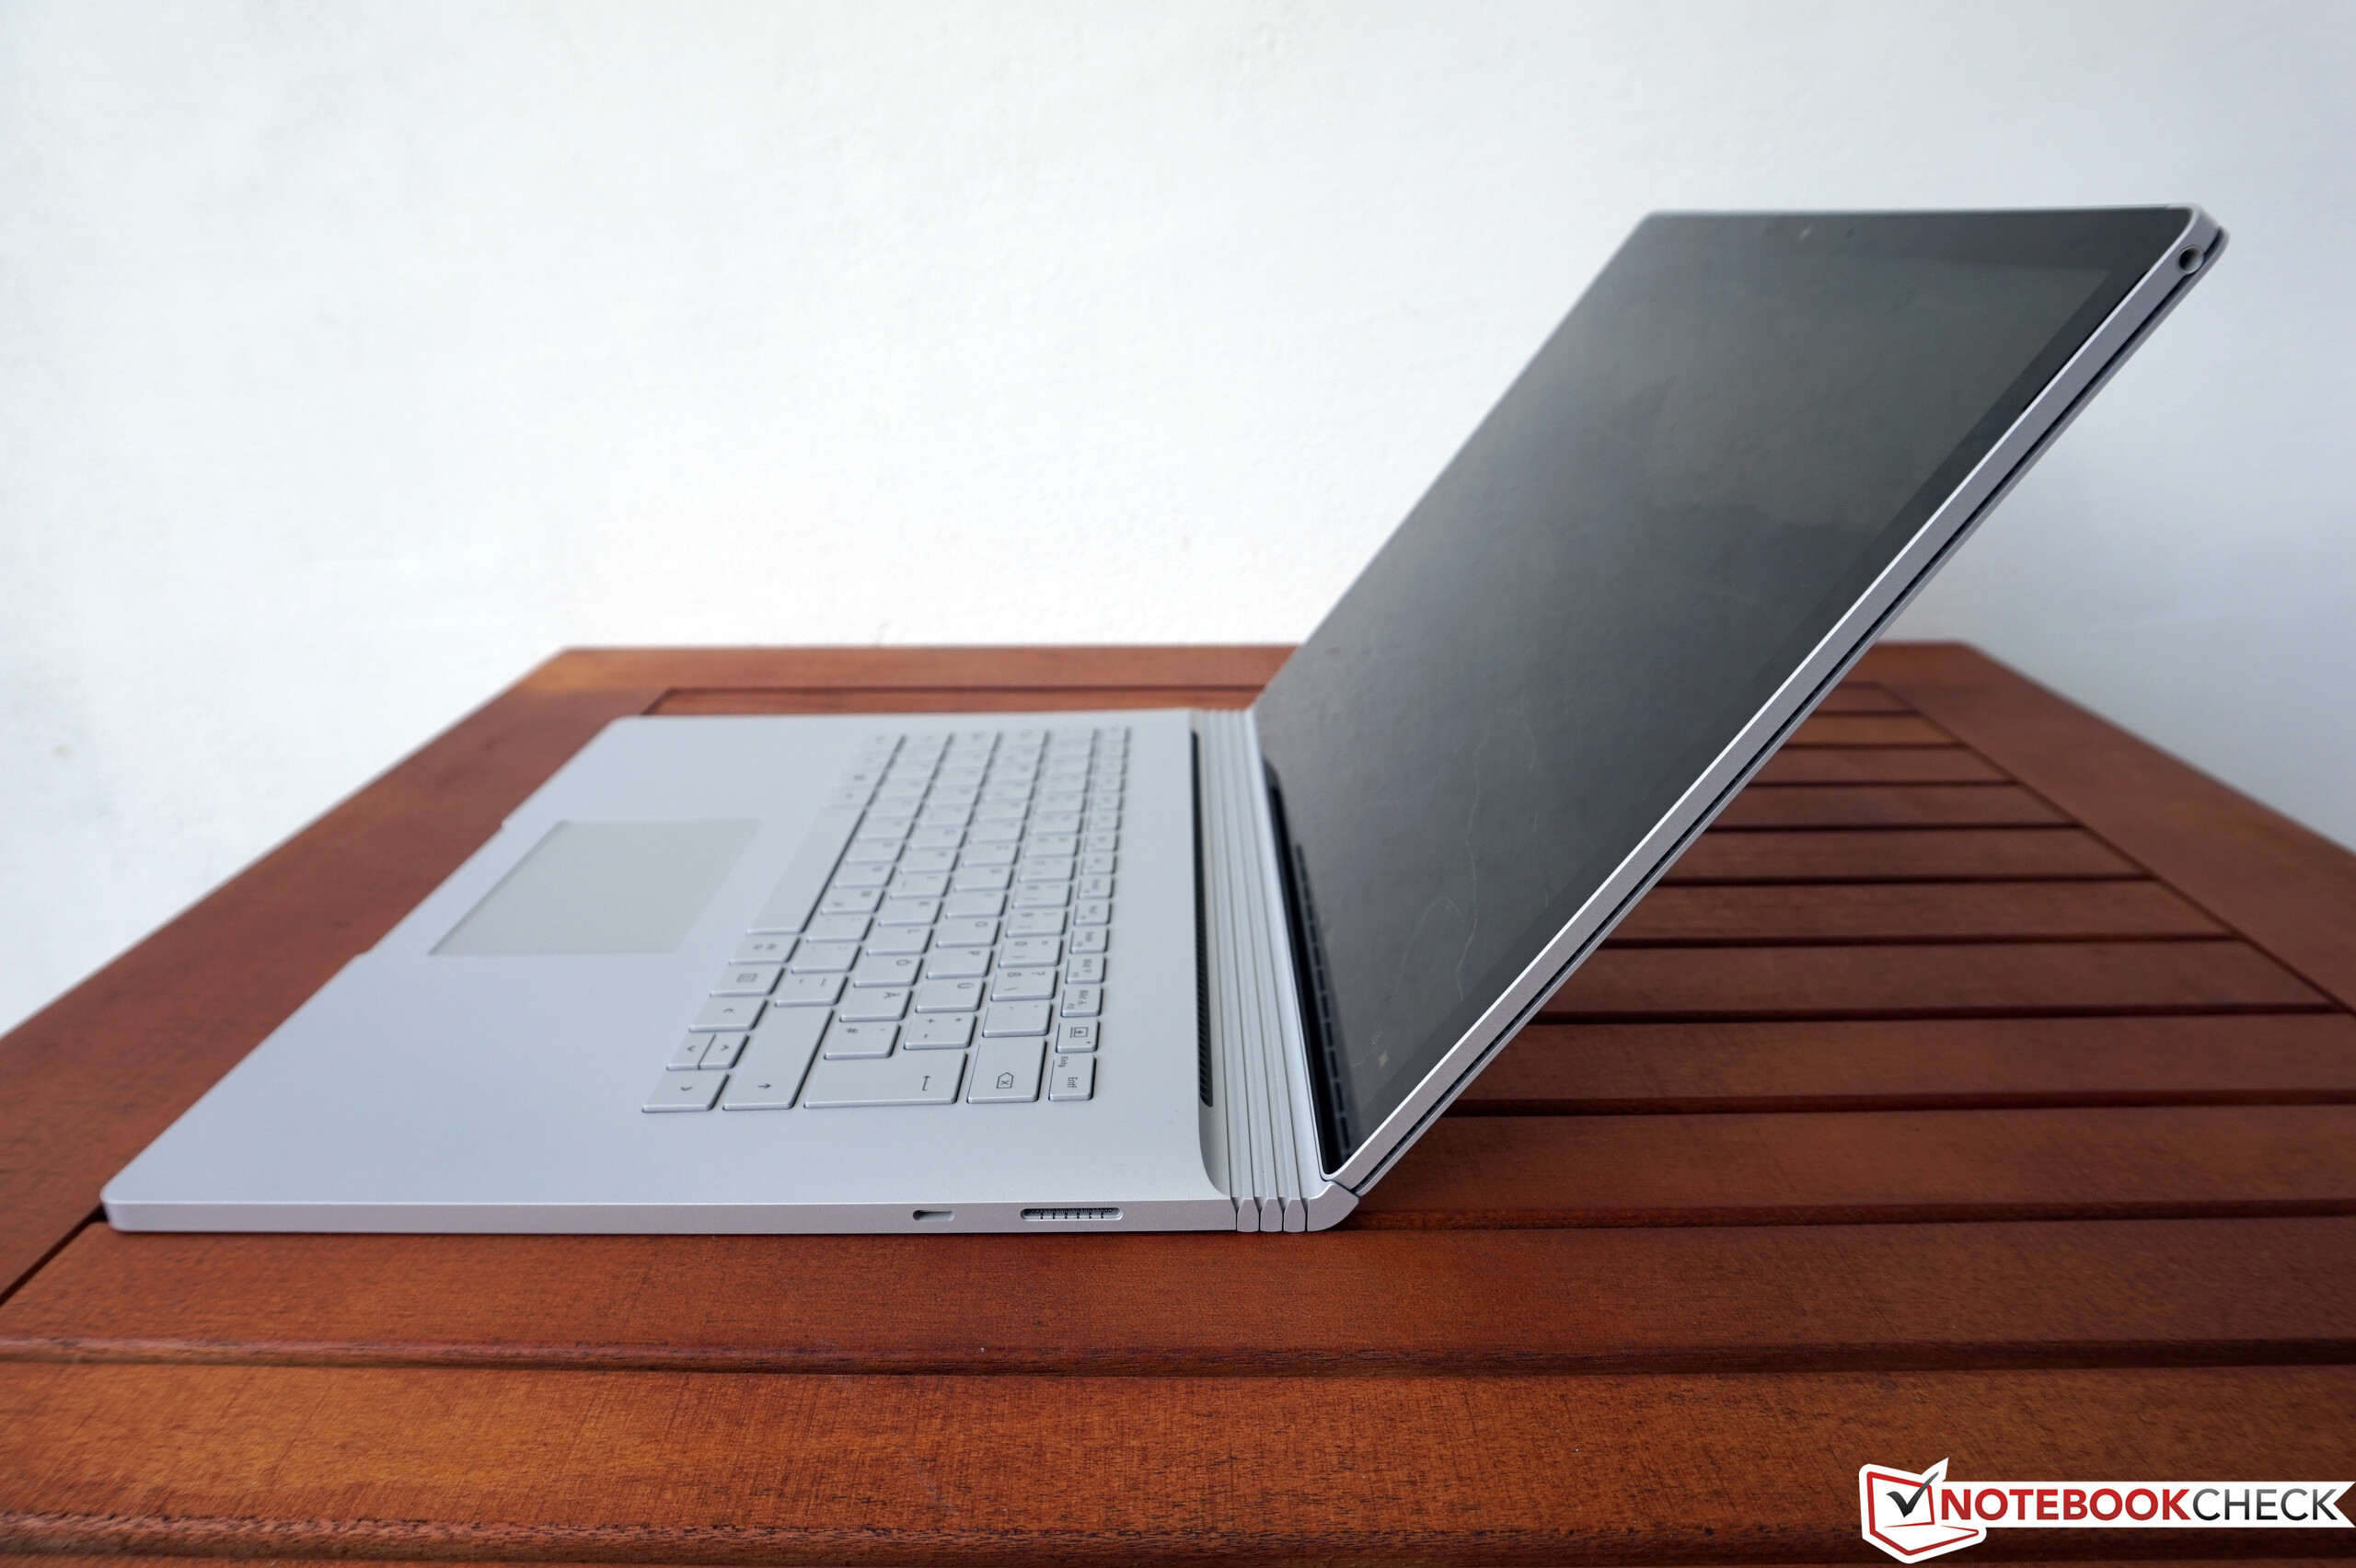
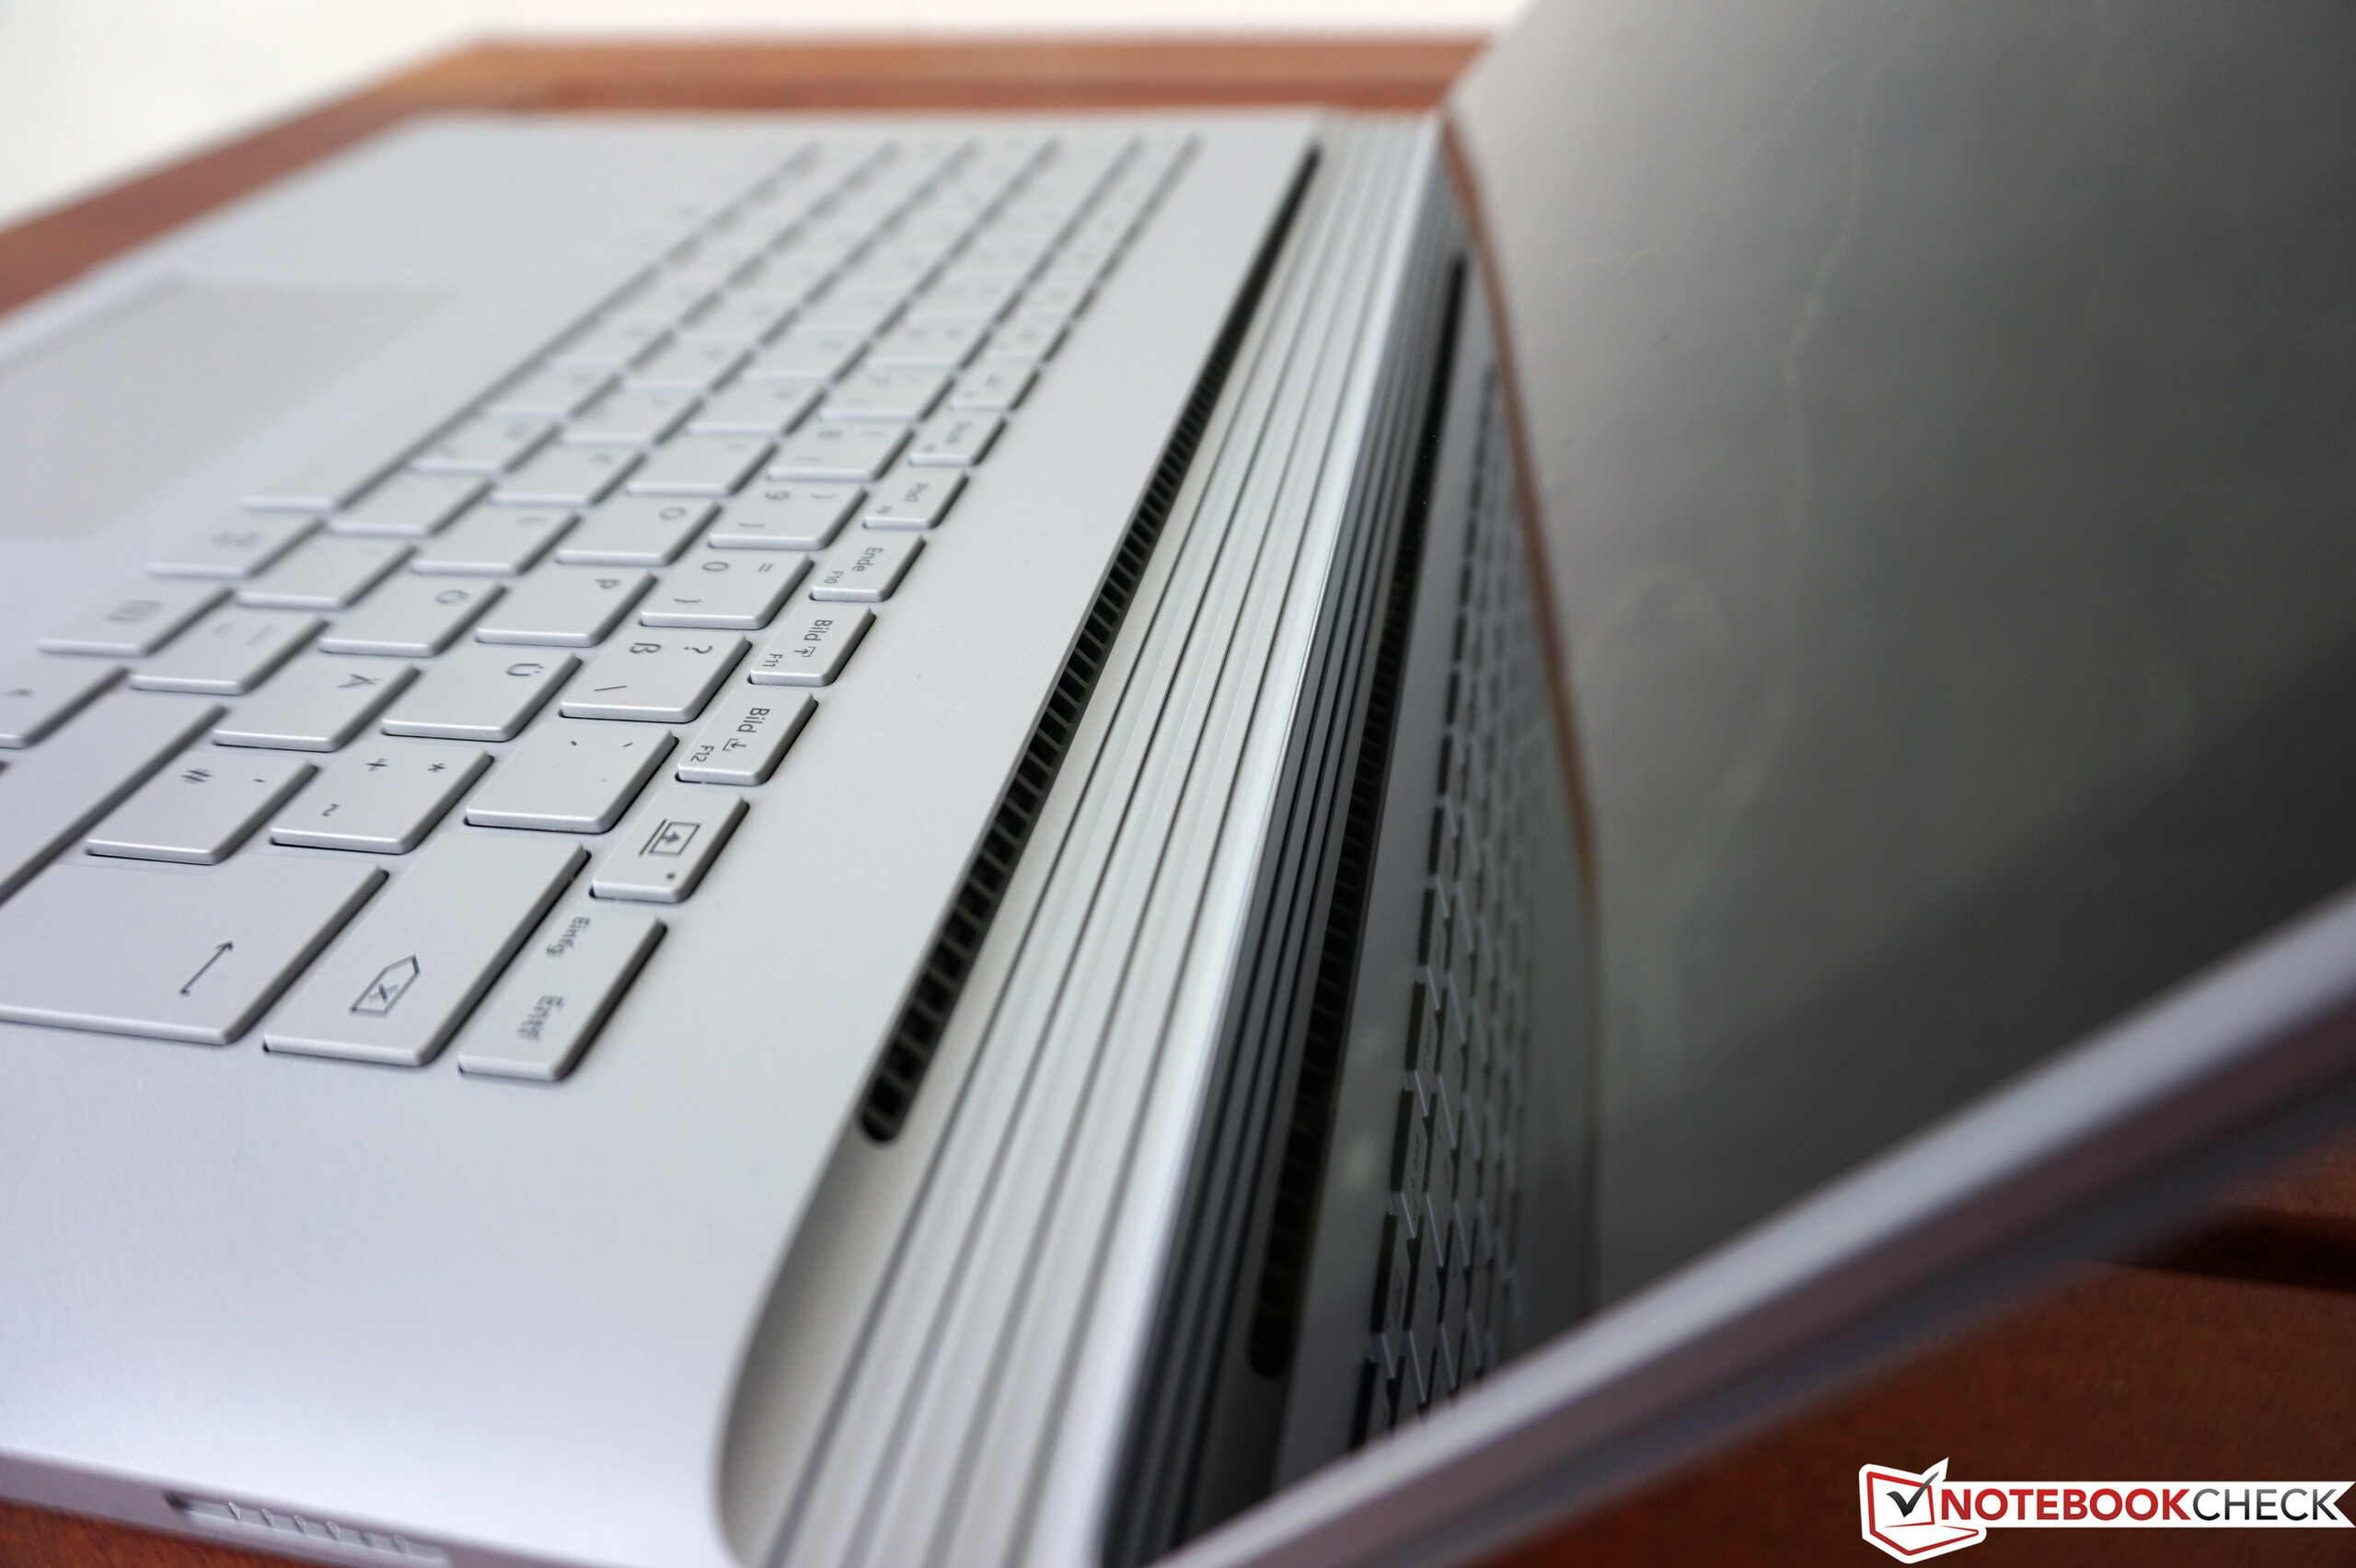
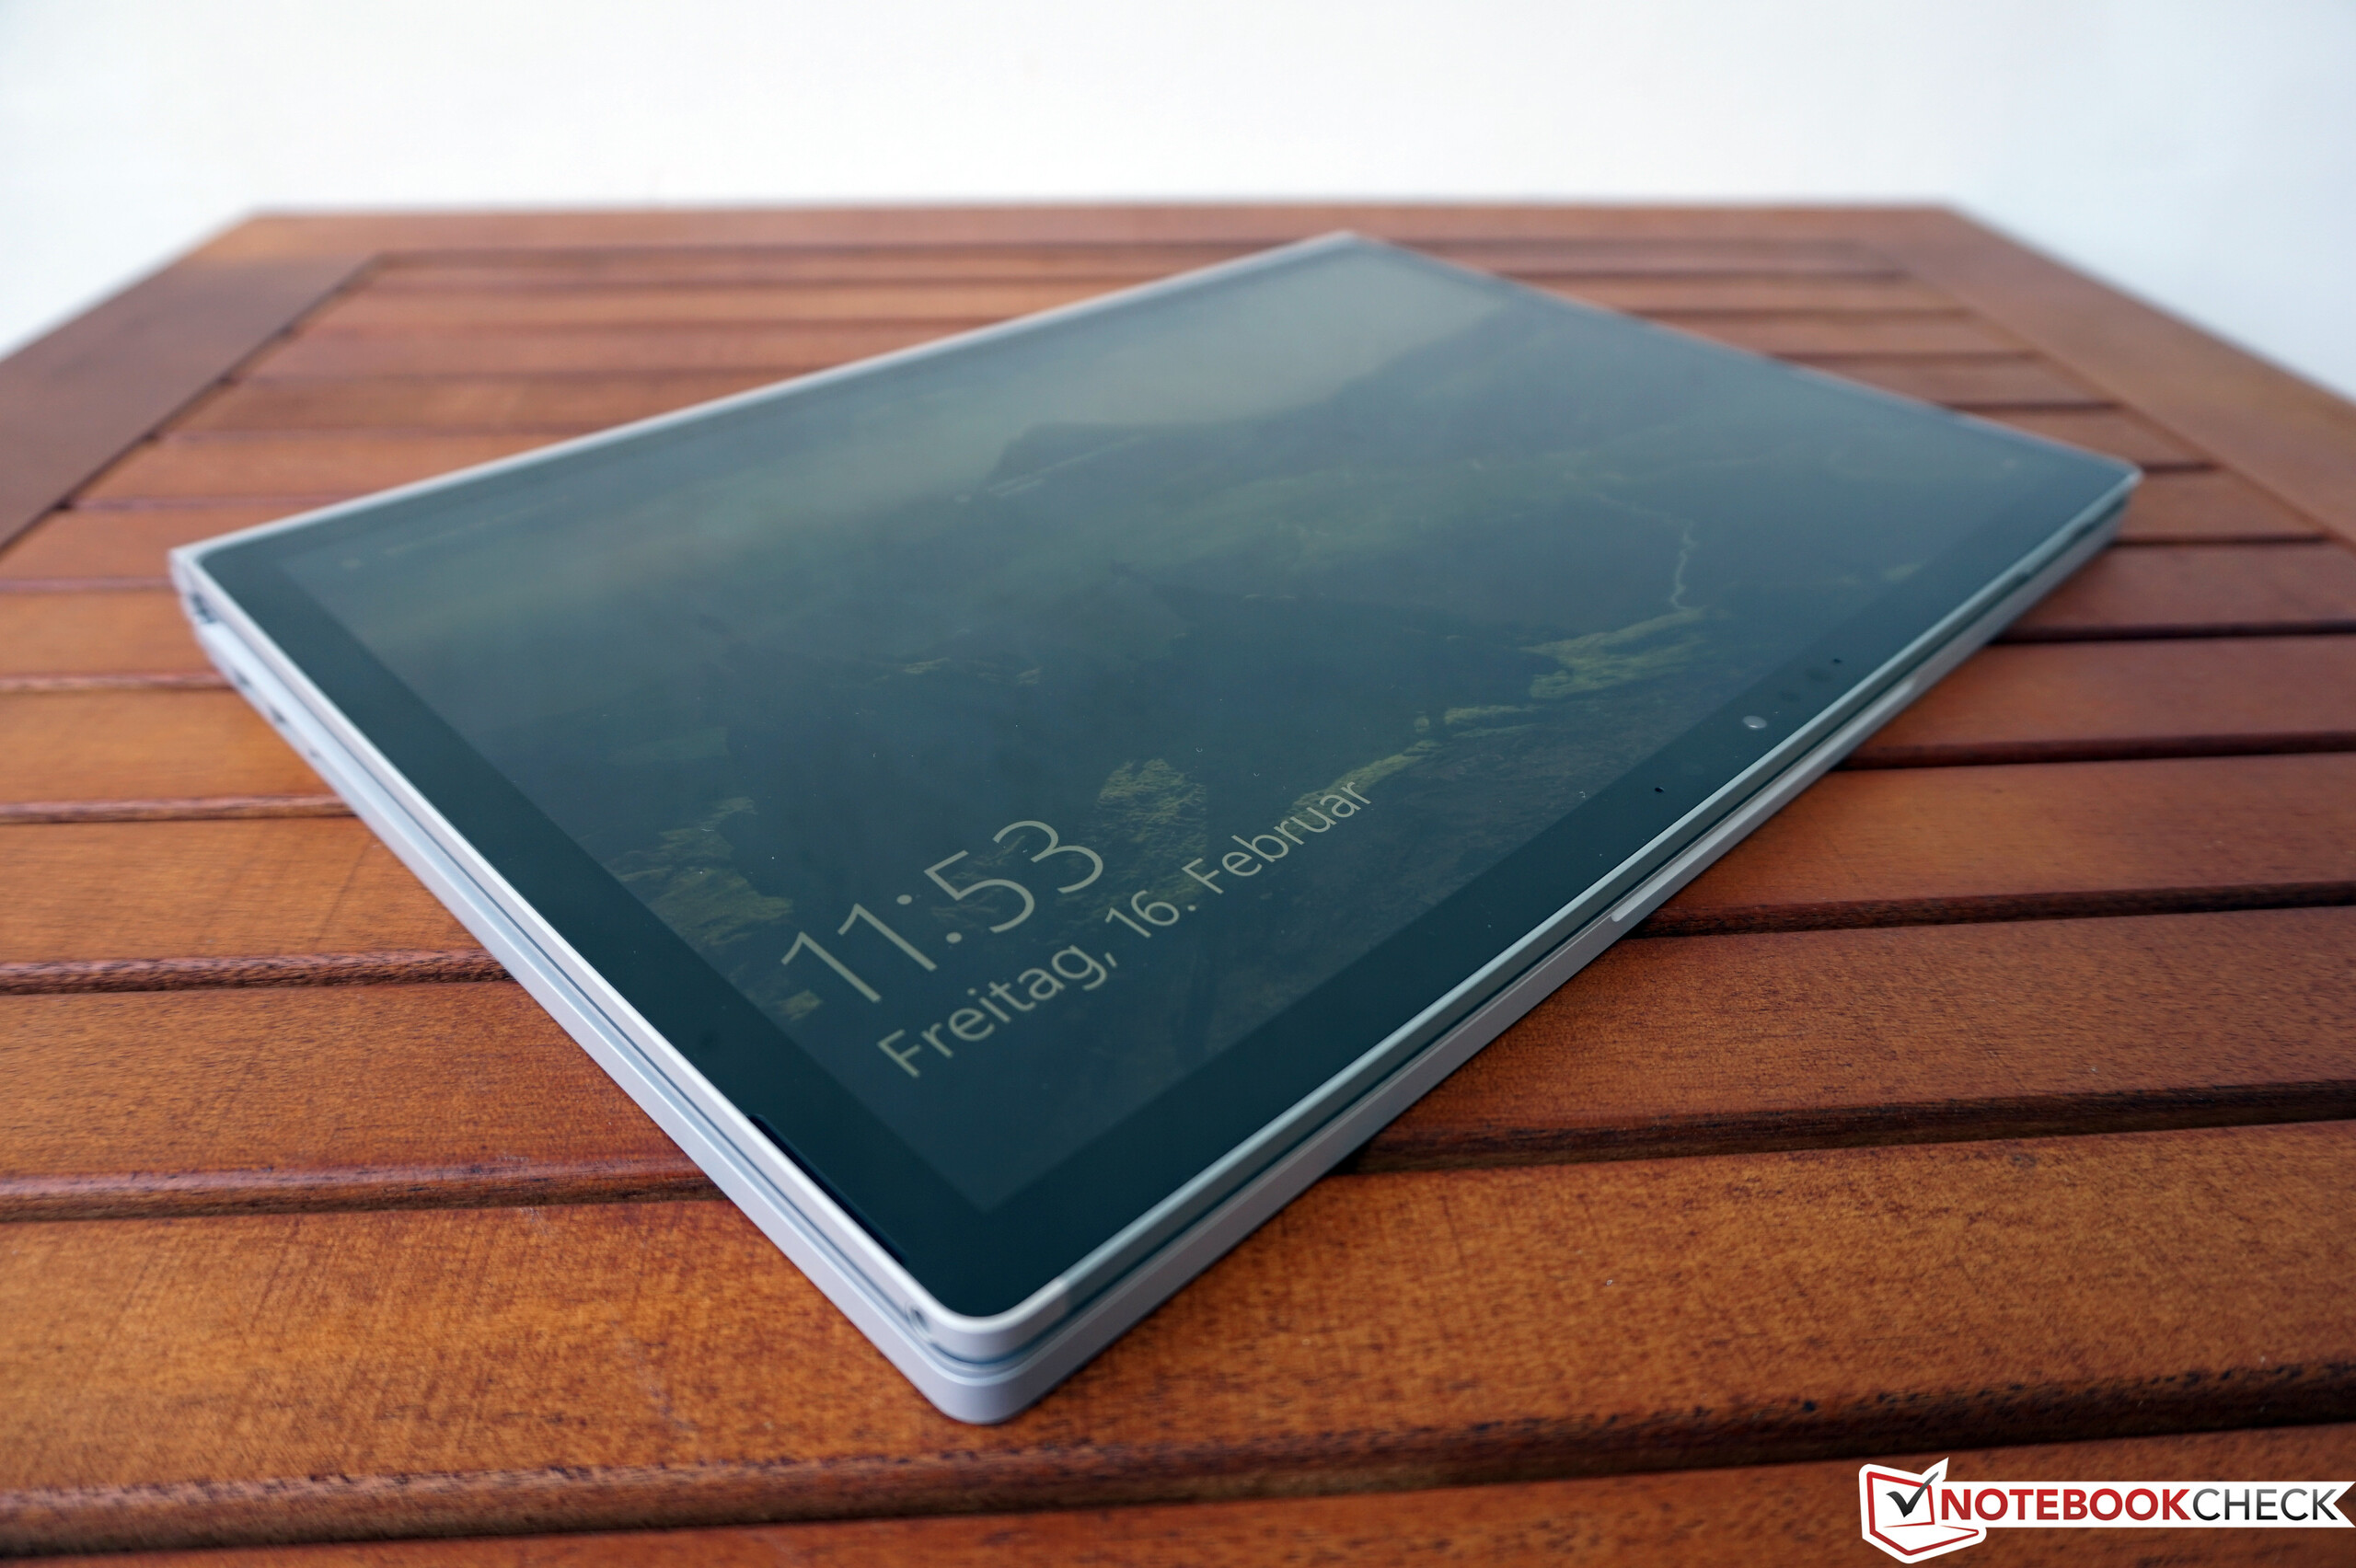
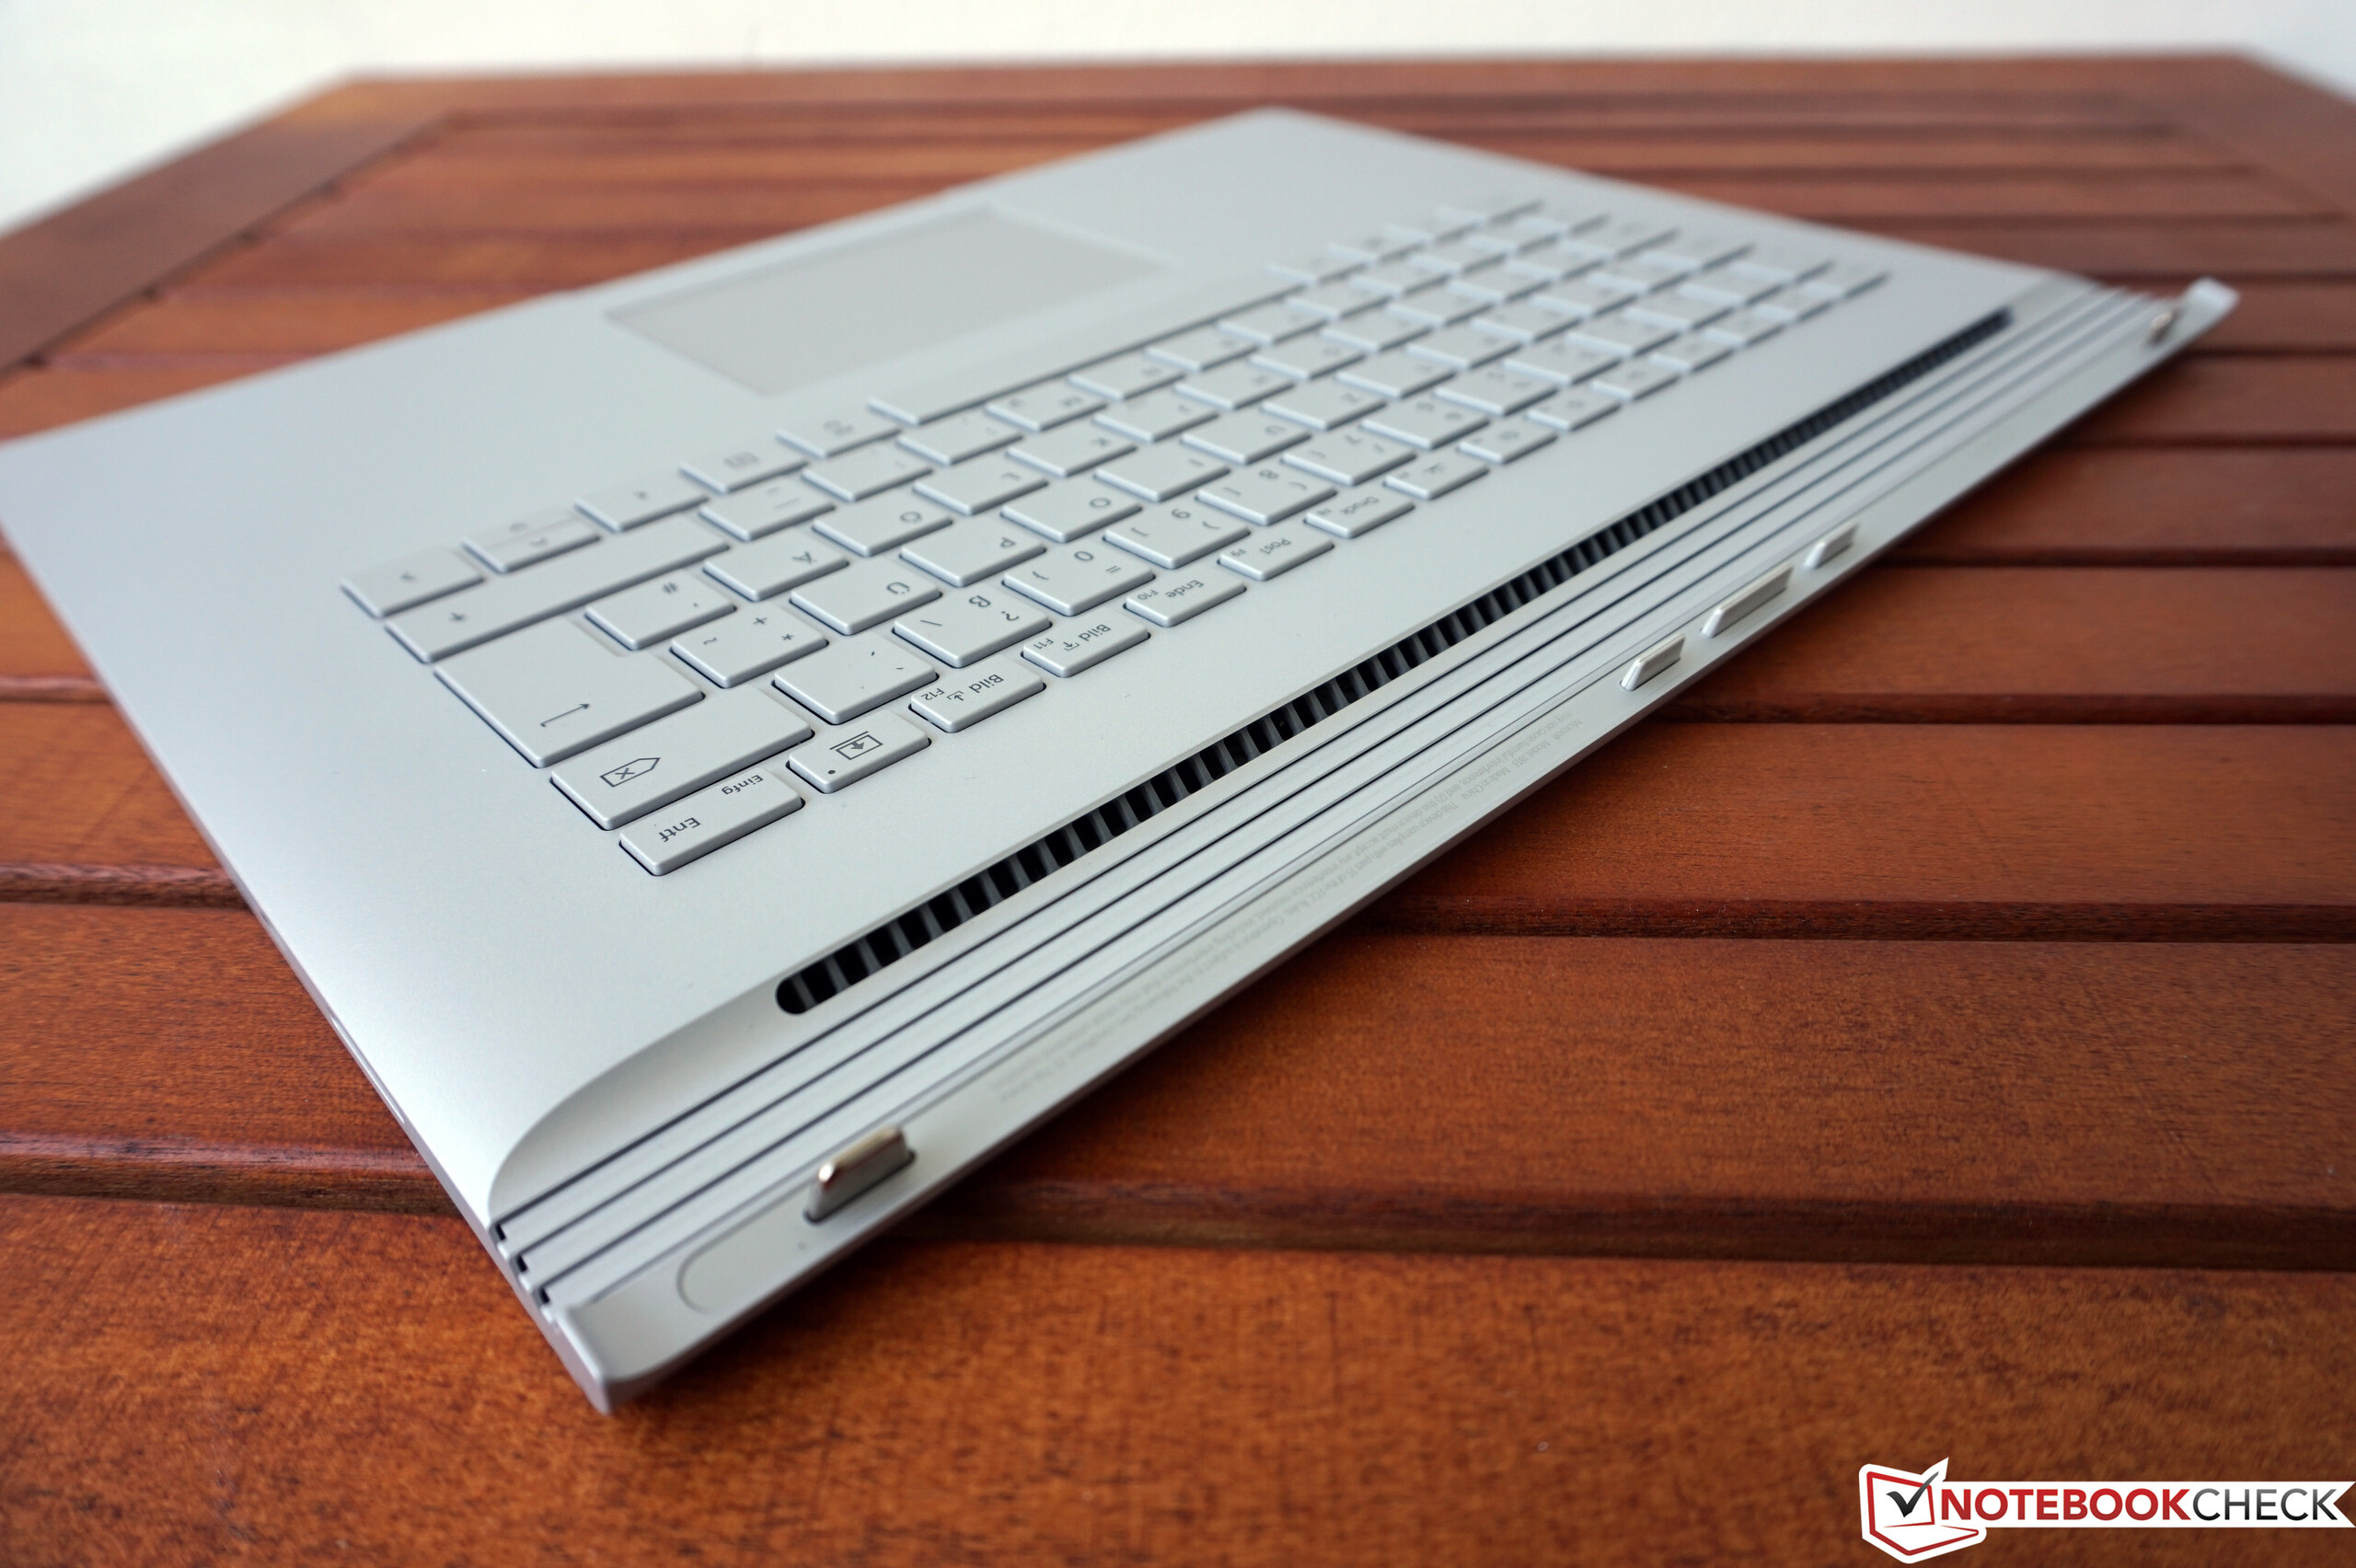
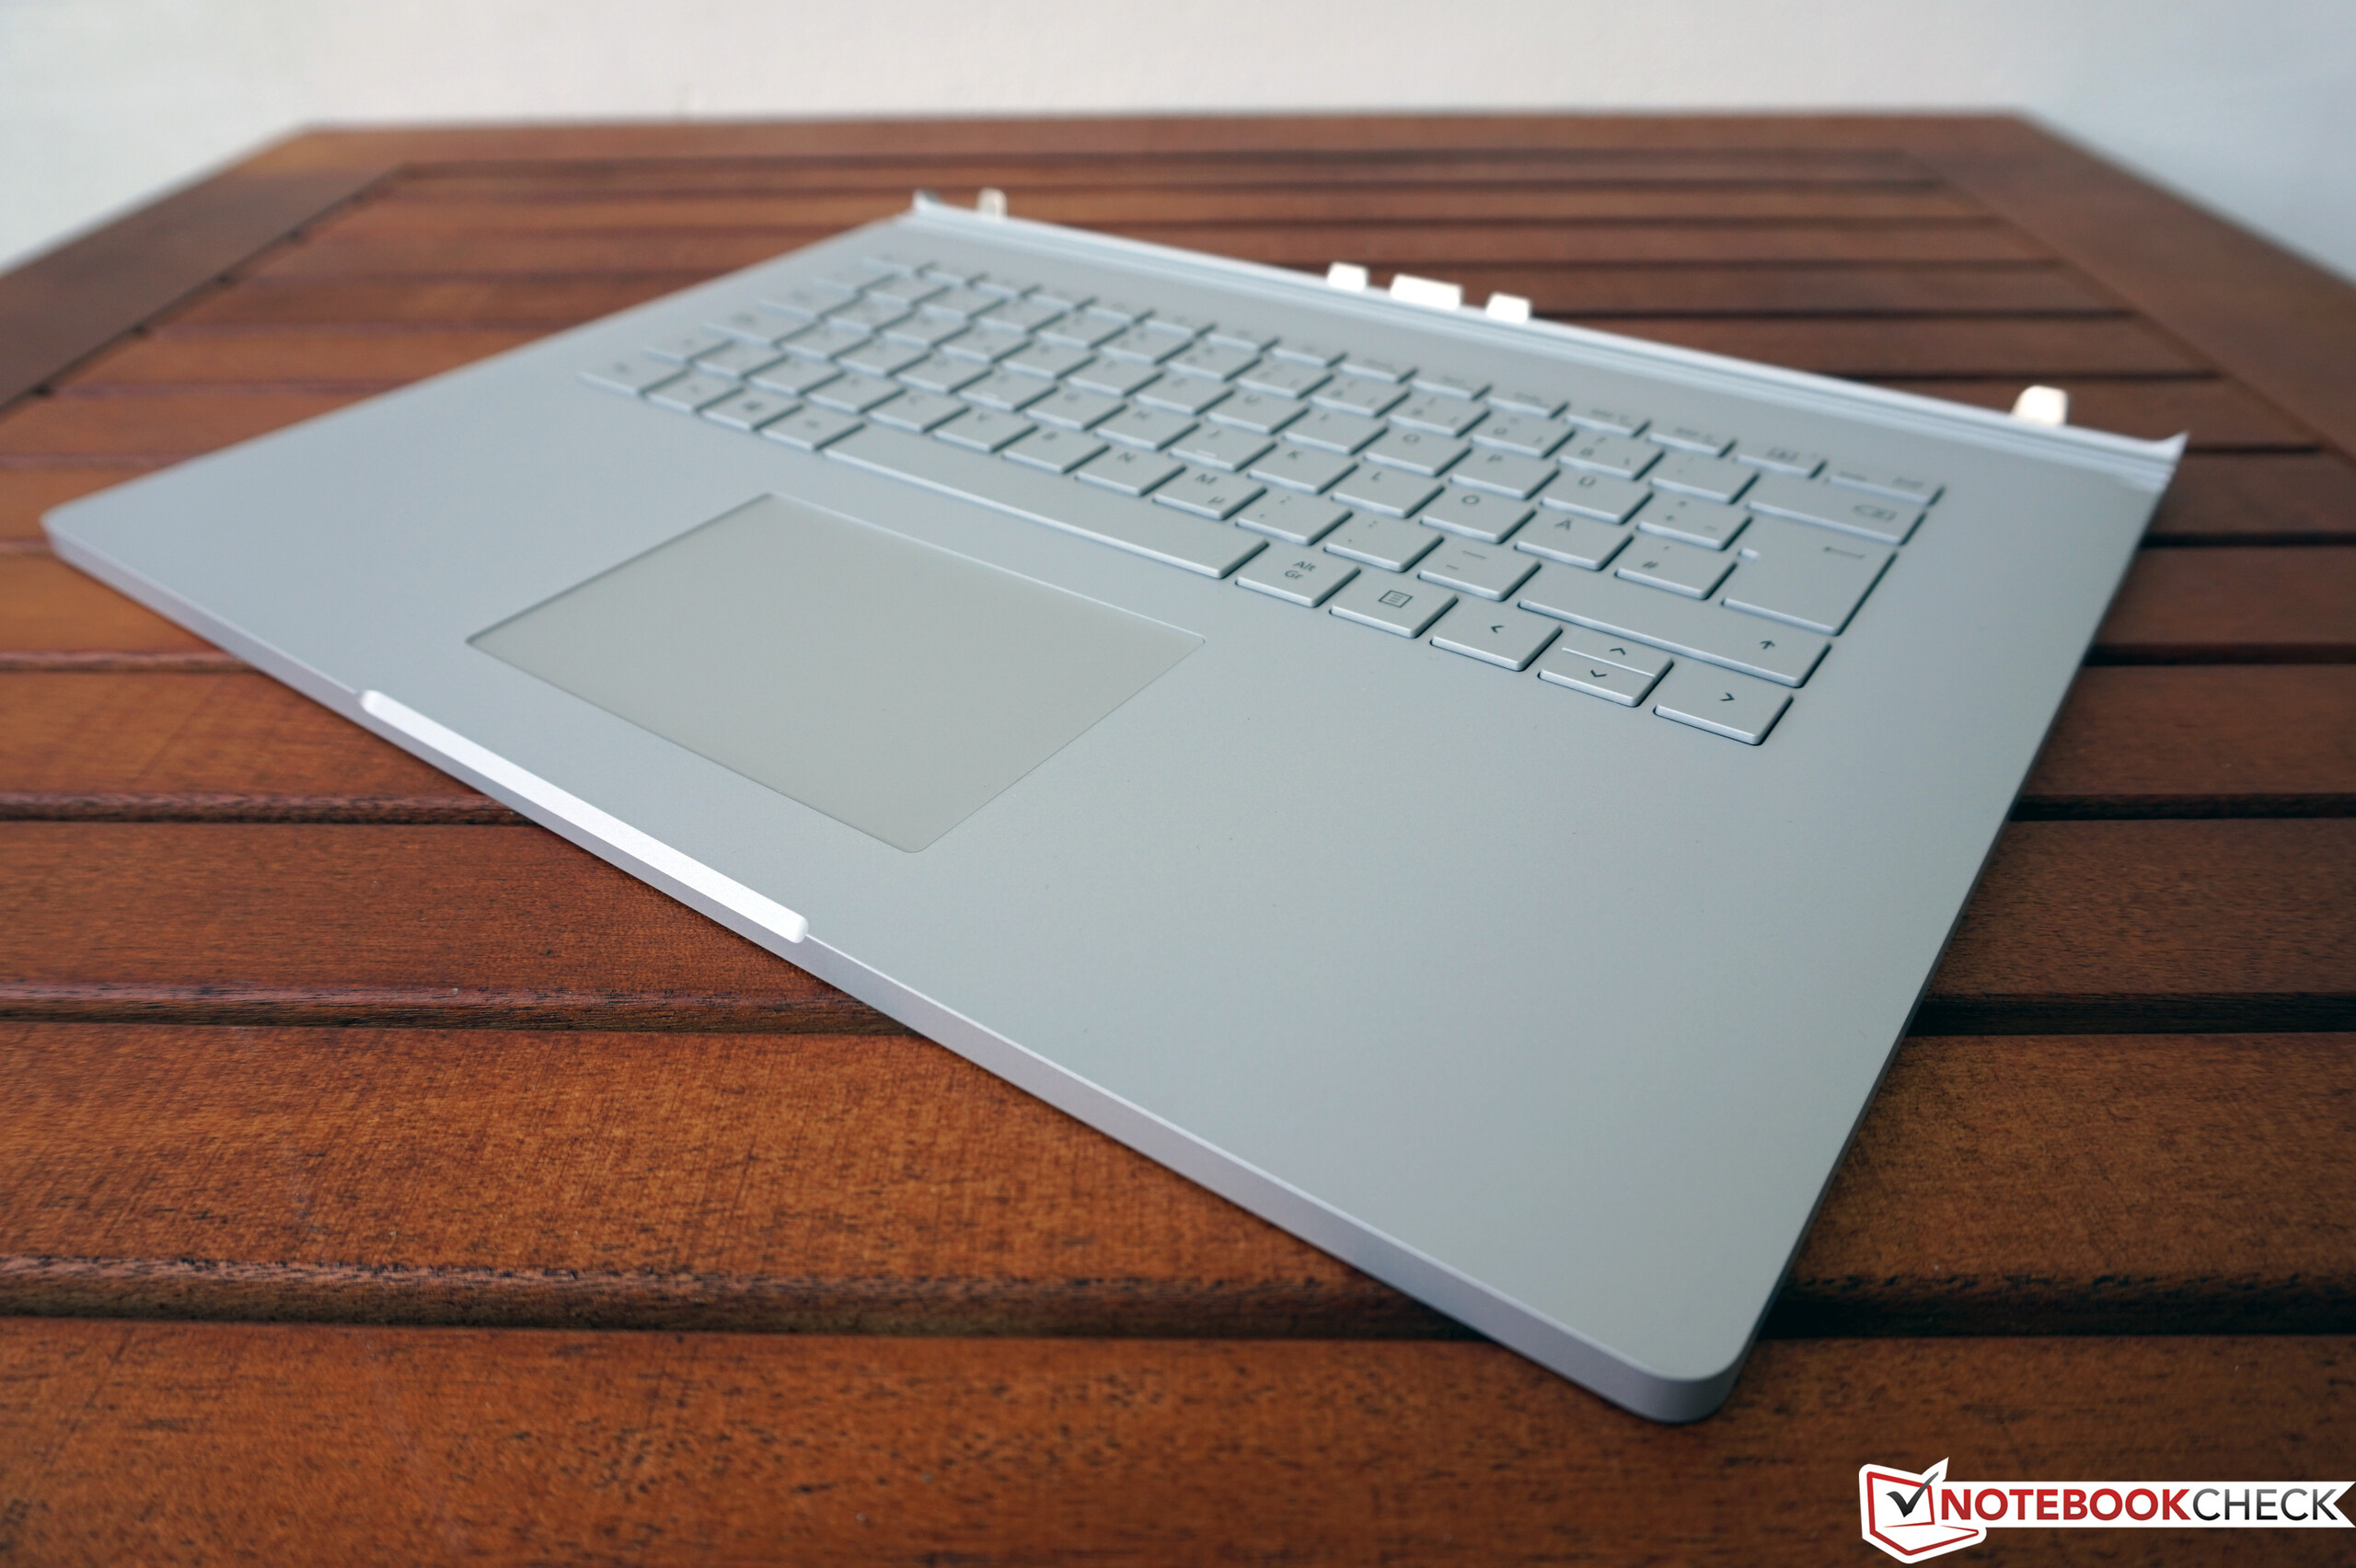
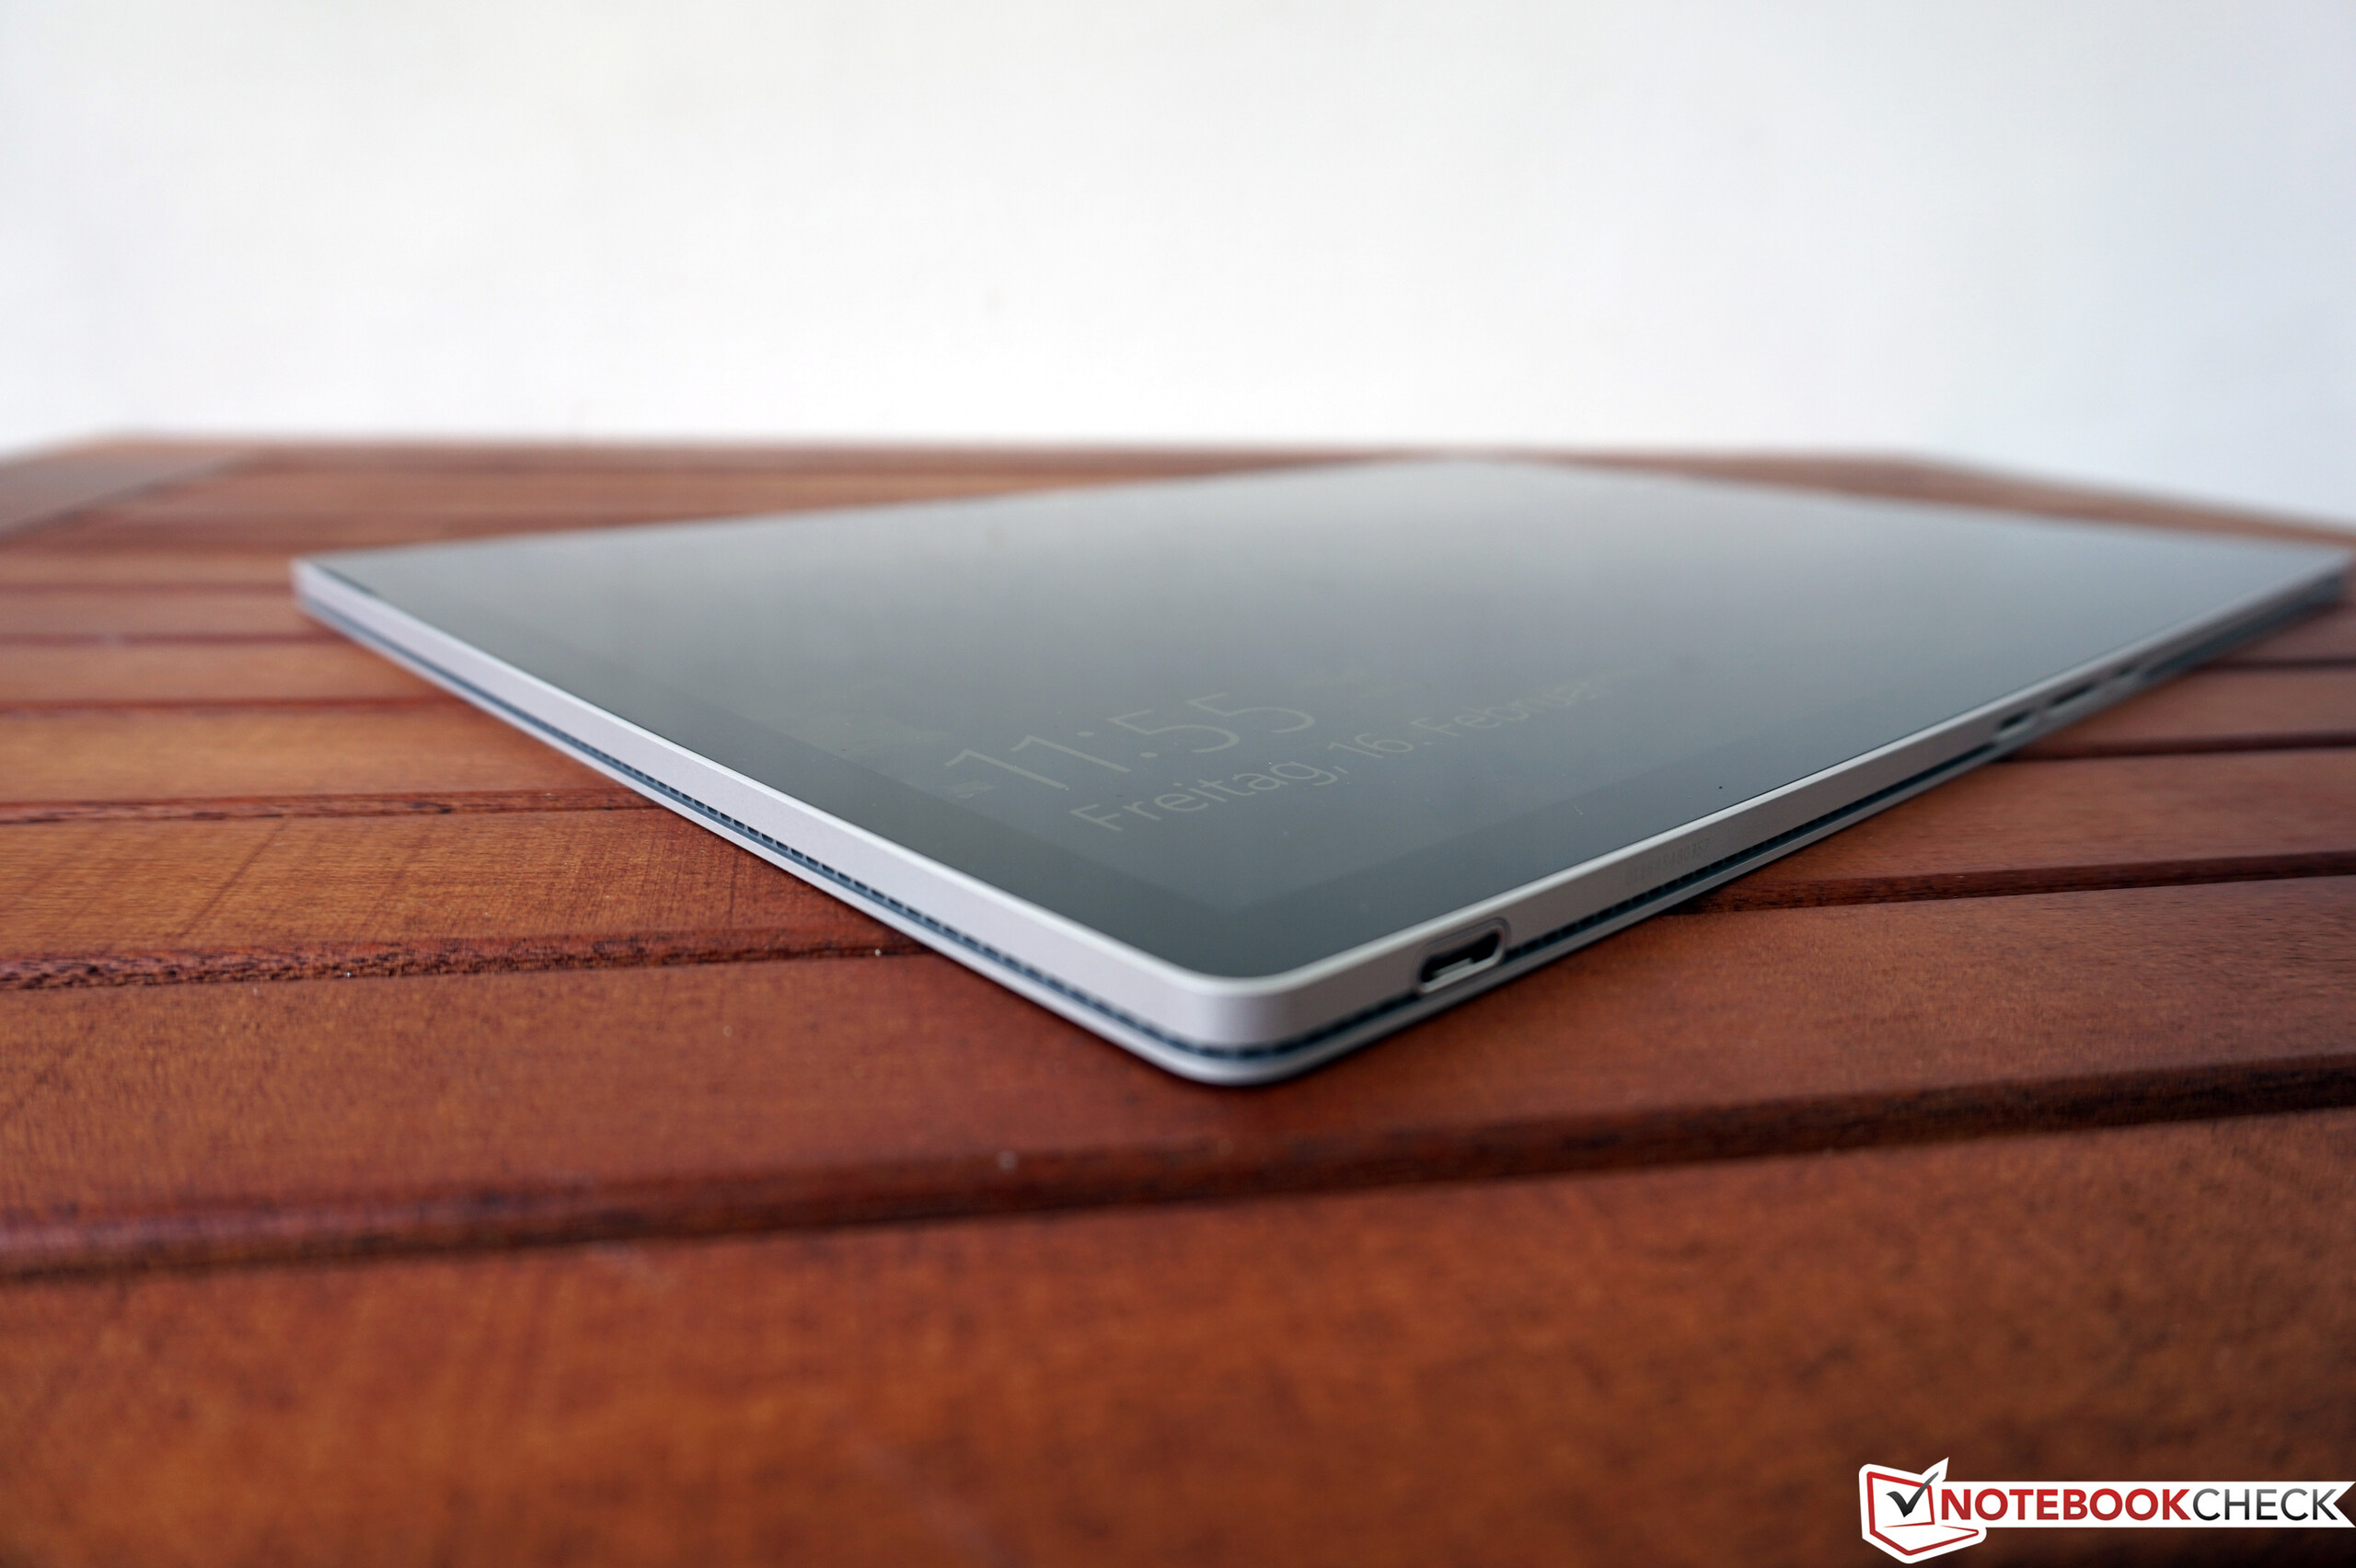
Case
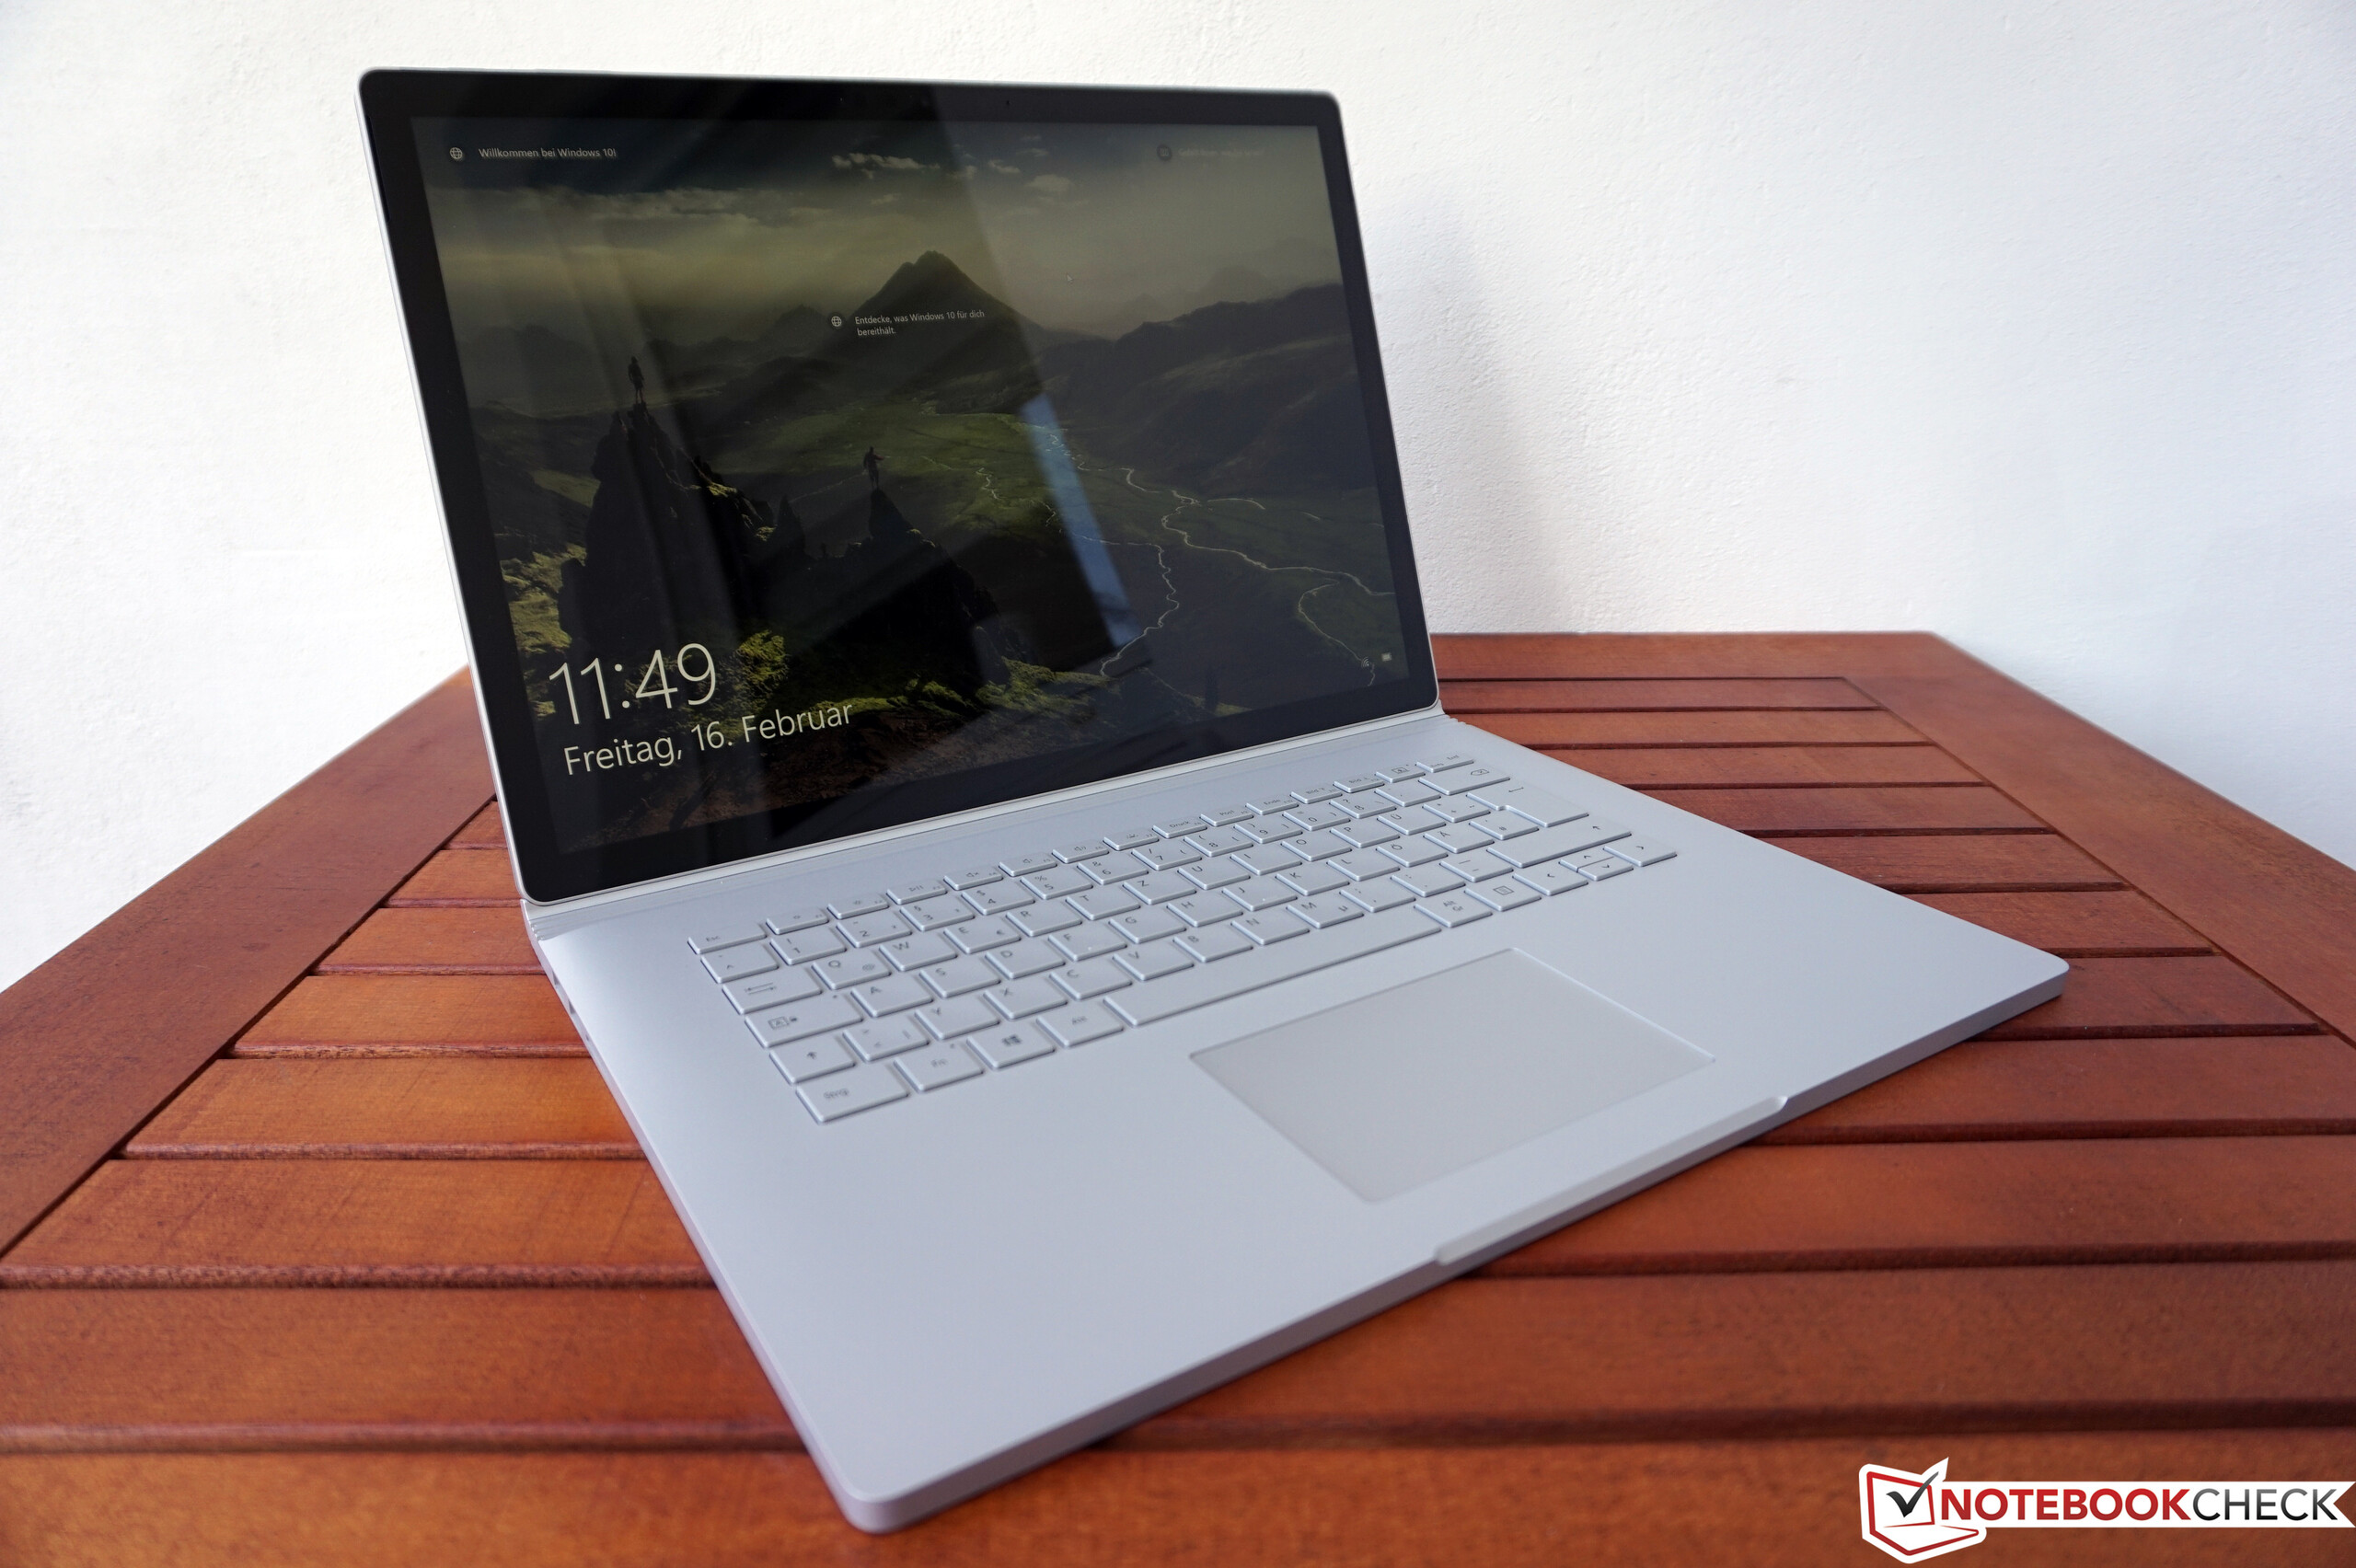
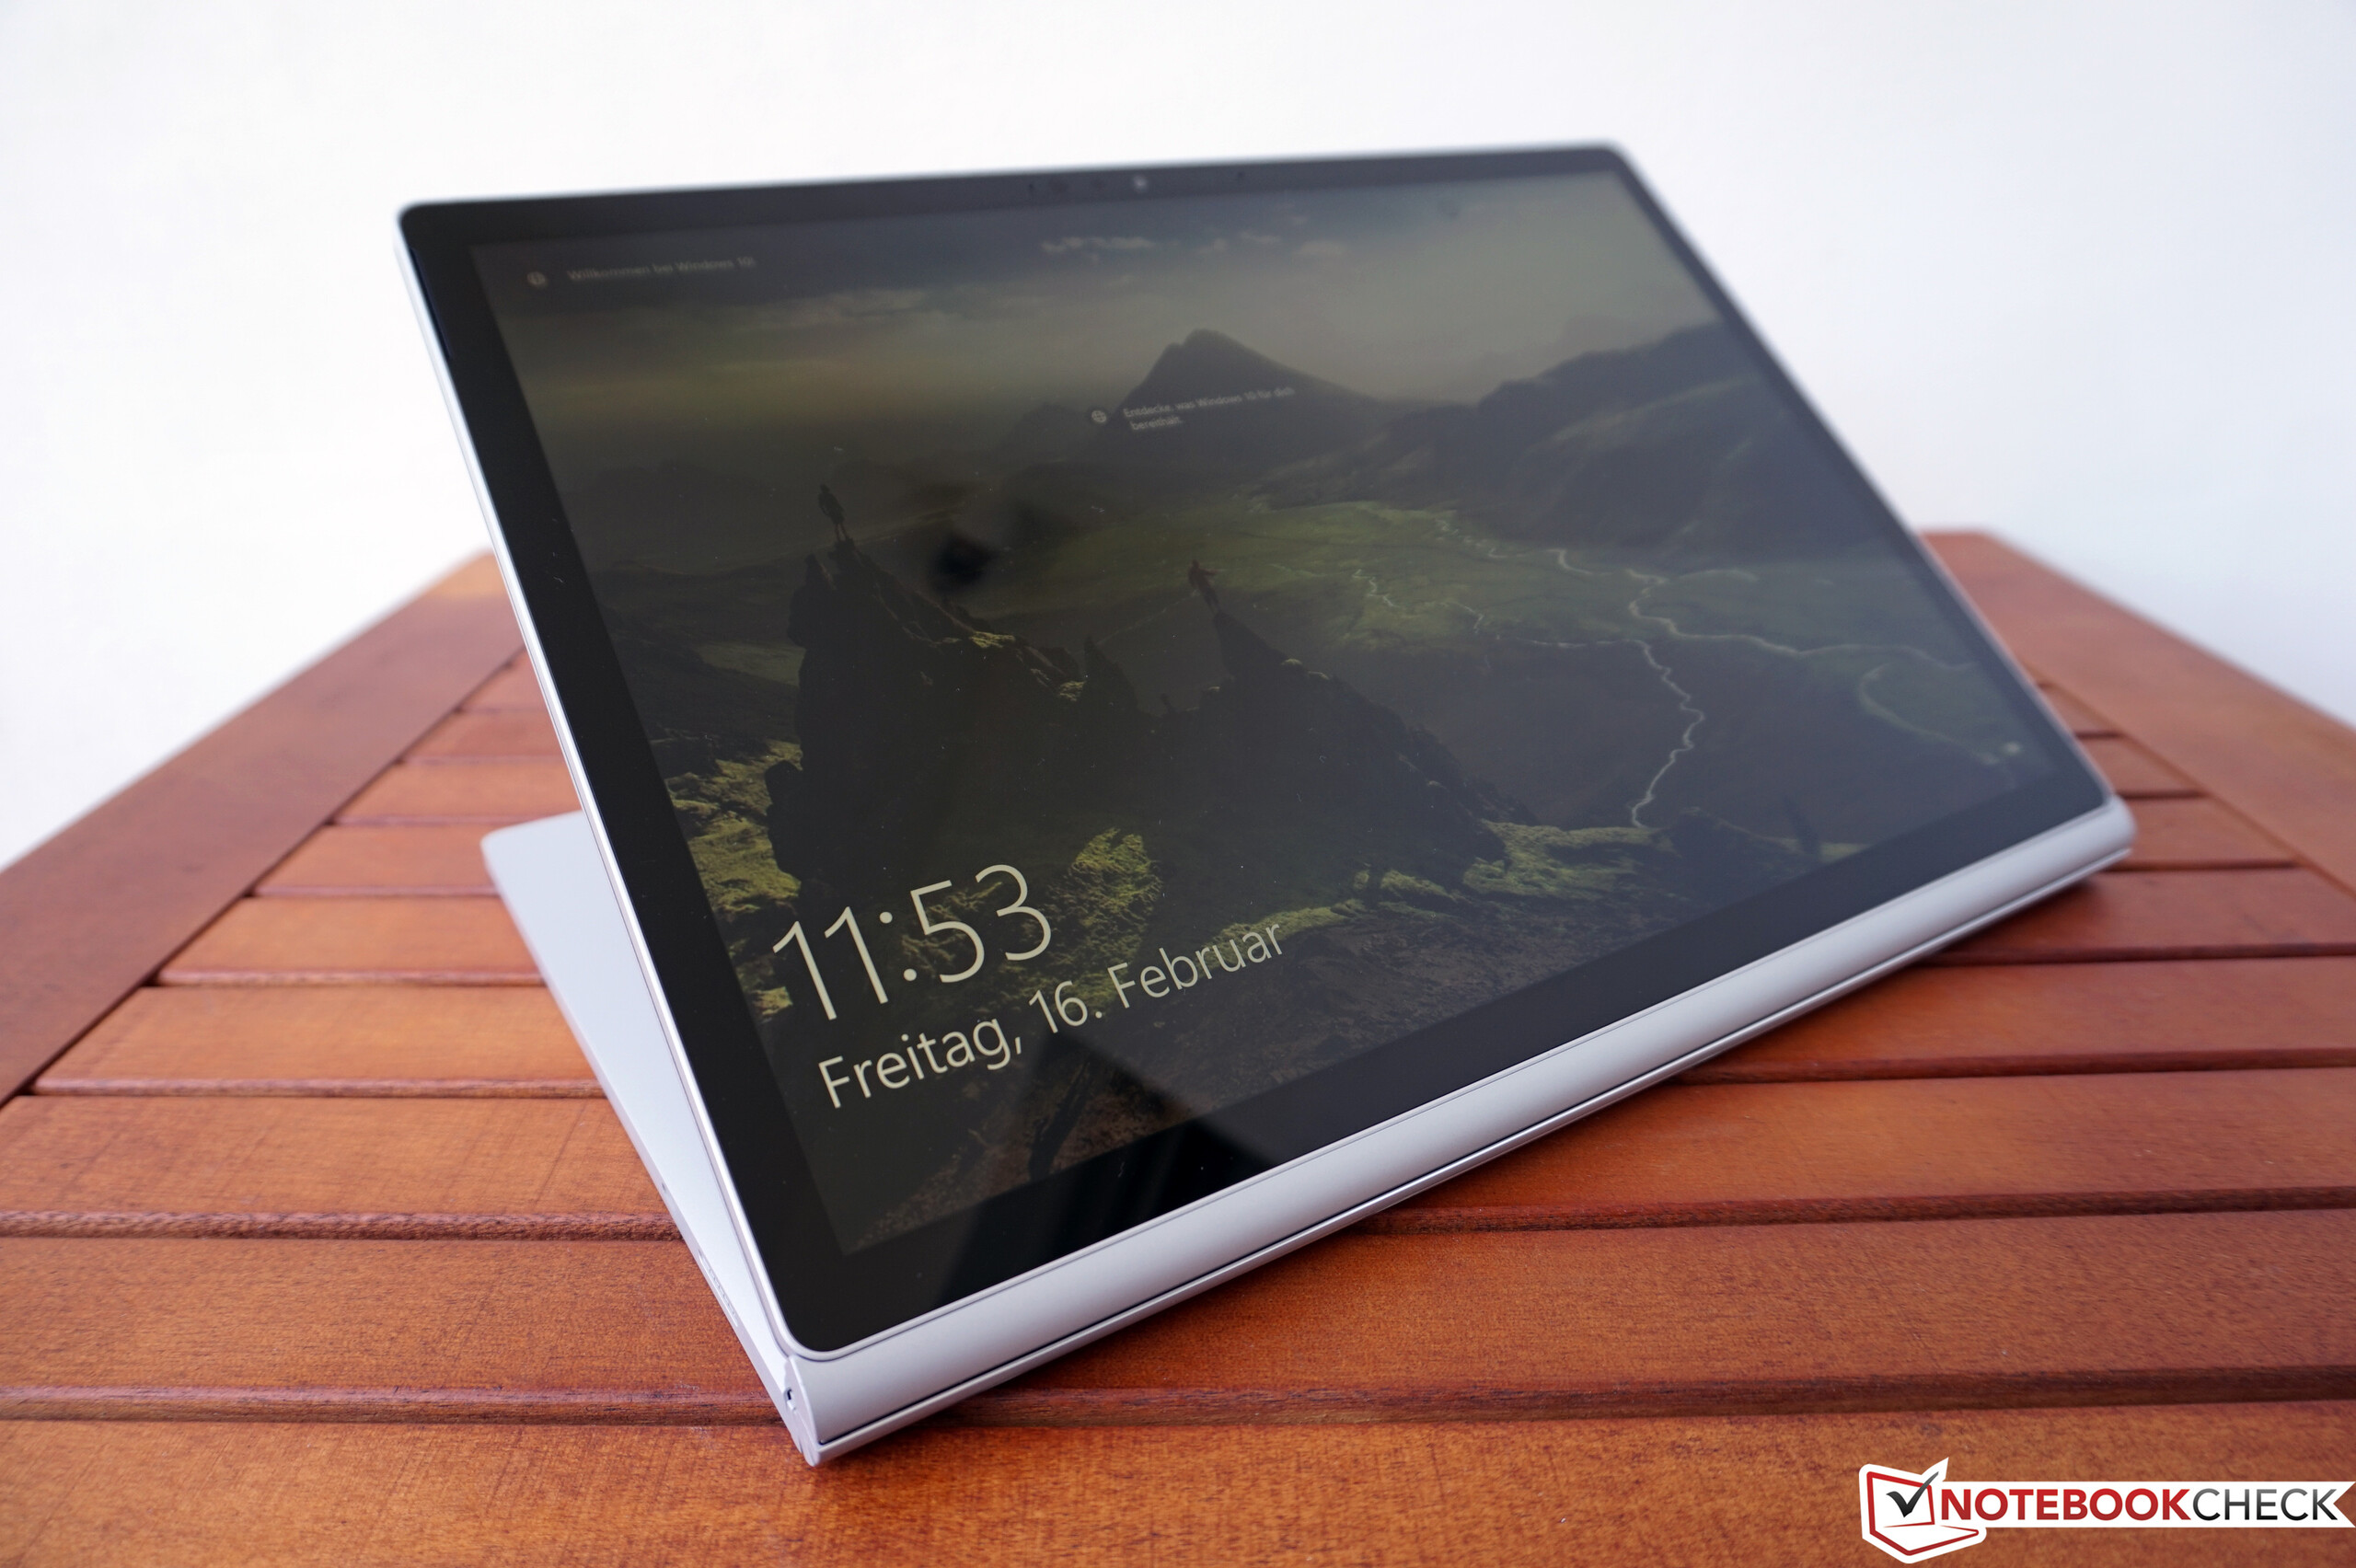
Display – 15-inch PixelSense
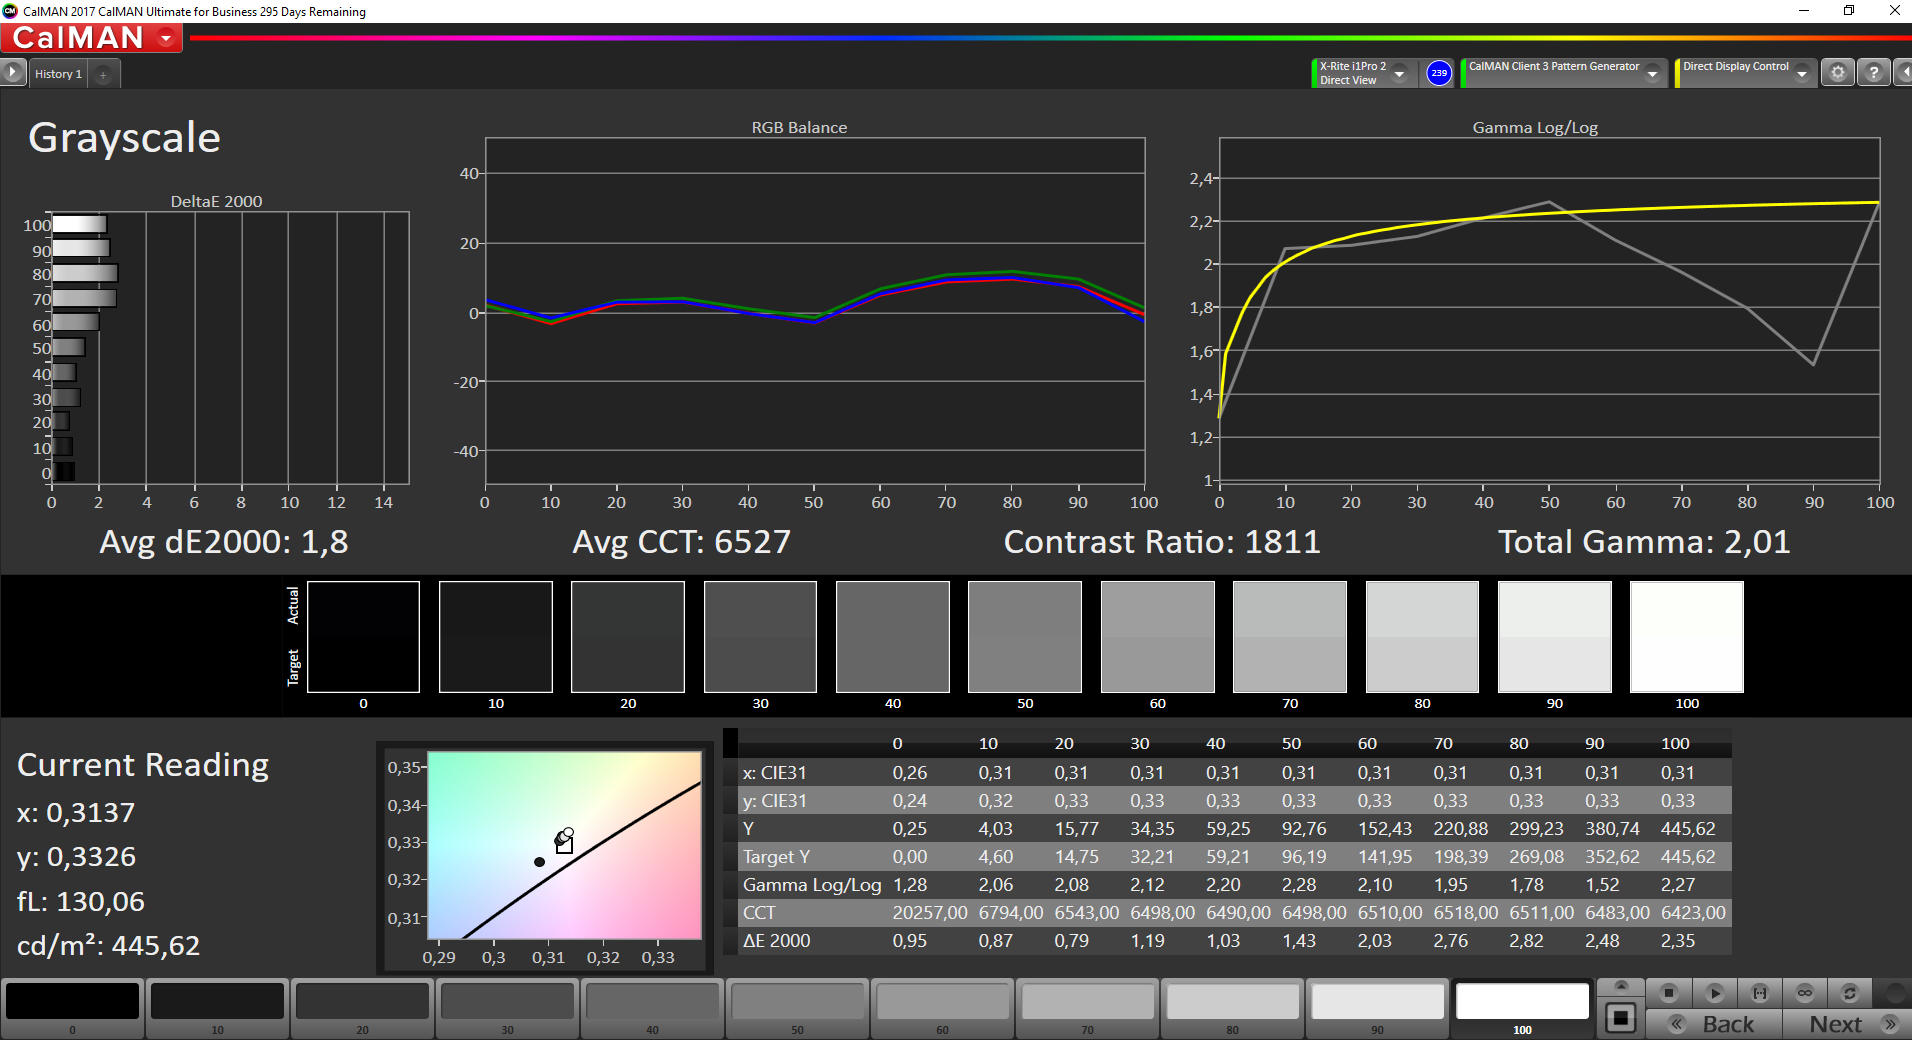
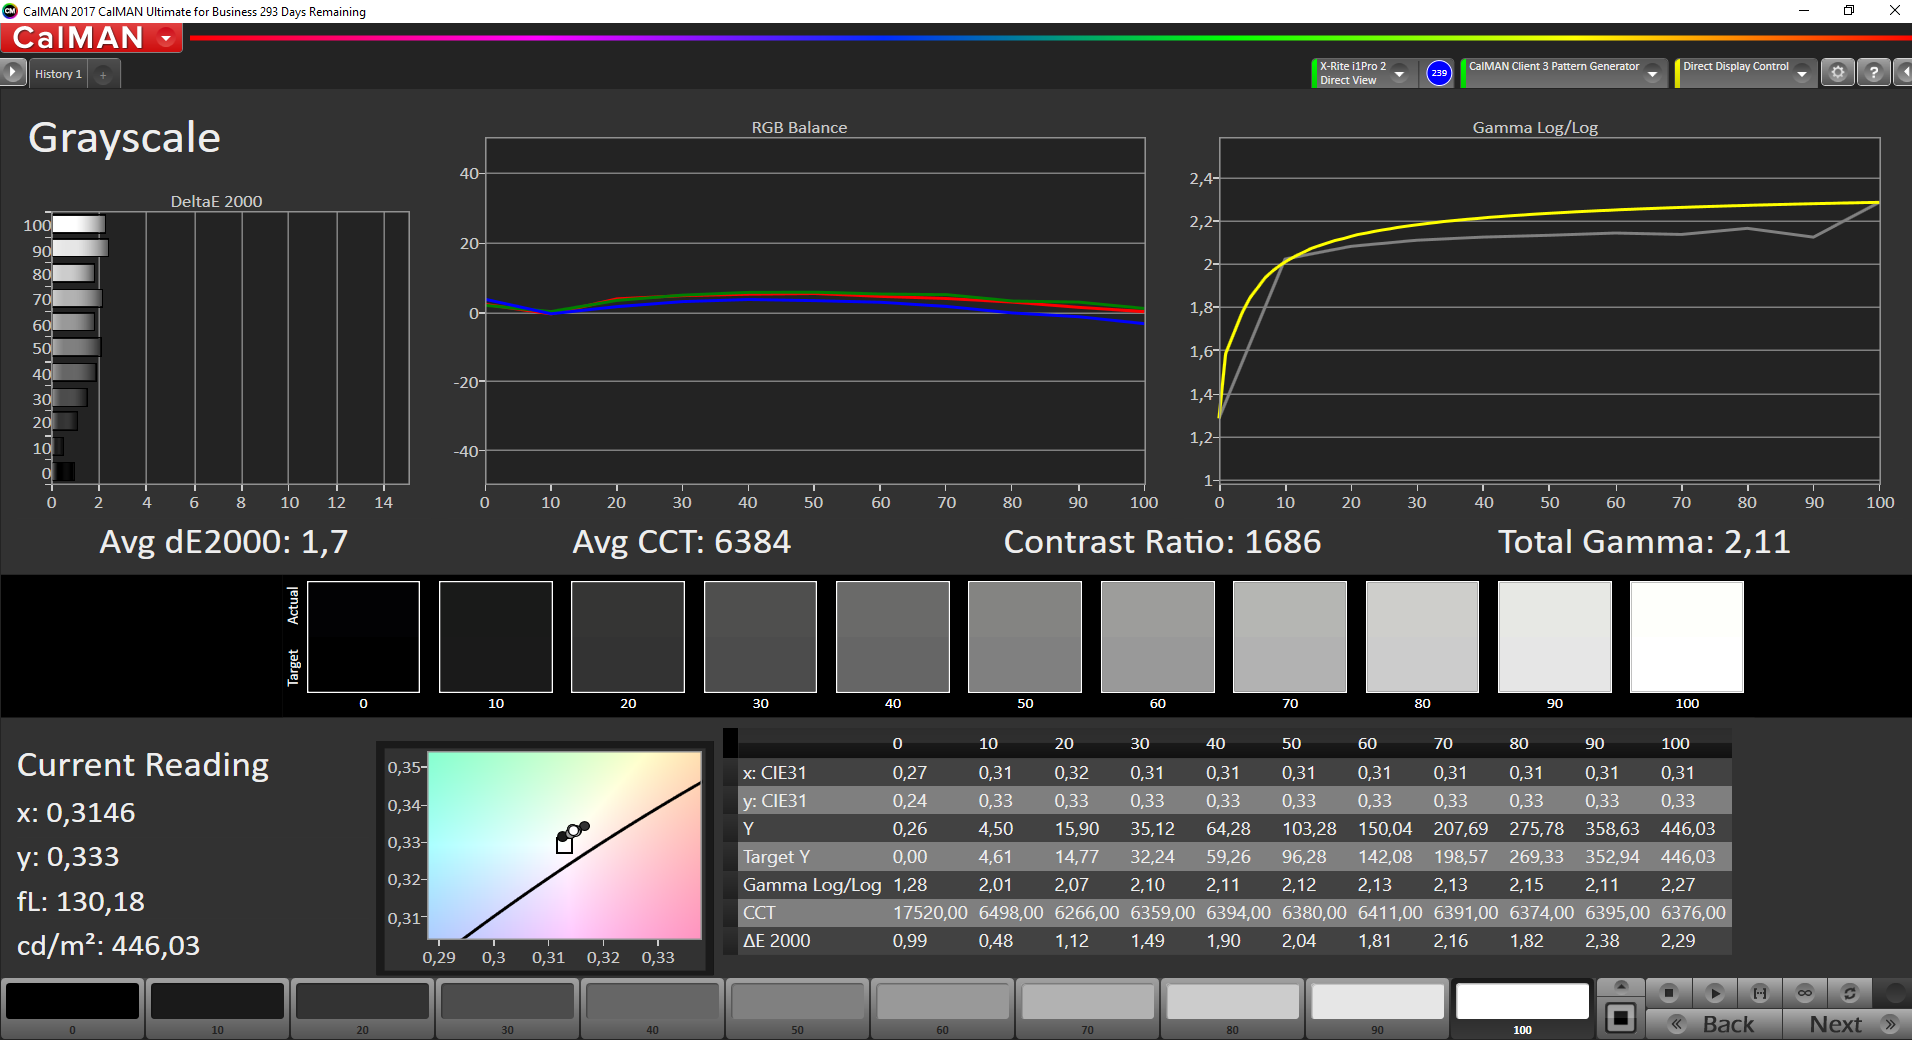
The Microsoft Surface Book 2 15 is only available with a 15-inch PixelSense display. Just like with the smaller brother, what we have here is a capacitive touchscreen with a 3:2 aspect ratio. In order to keep the pixel density at approximately the same level (260 vs. 267 DPI in the 13-inch SB2), the resolution was increased to 3240x2160. Whereas the 13-inch model relied on a panel from Panasonic, here we see a screen from LG (LGD0554). There is an improvement in terms of brightness, which was increased to an average of 444 cd/m² . Despite the high brightness, the brightness distribution is quite uniform; however you can still see the screen bleeding around the edges when the screen is displaying pure black. This was better in the smaller model.

The rest of our display measurements are also quite good. Above all, the high contrast ratio leads to very vivid colors and, subjectively, the screen leaves no room for complaint. However, our measuring device did pick up PWM, at 50 % brightness and below. Nevertheless, the frequency of over 21 kHz is extremely high, which is why, this should not cause any trouble for susceptible individuals.
Screen Flickering / PWM (Pulse-Width Modulation)
| Screen flickering / PWM detected | 21930 Hz | ≤ 50 % brightness setting | 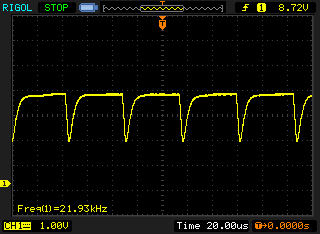 |
The display backlight flickers at 21930 Hz (worst case, e.g., utilizing PWM) Flickering detected at a brightness setting of 50 % and below. There should be no flickering or PWM above this brightness setting. The frequency of 21930 Hz is quite high, so most users sensitive to PWM should not notice any flickering. In comparison: 52 % of all tested devices do not use PWM to dim the display. If PWM was detected, an average of 7741 (minimum: 5 - maximum: 343500) Hz was measured. | |||
| |||||||||||||||||||||||||
Brightness Distribution: 89 %
Center on Battery: 446 cd/m²
Contrast: 1784:1 (Black: 0.25 cd/m²)
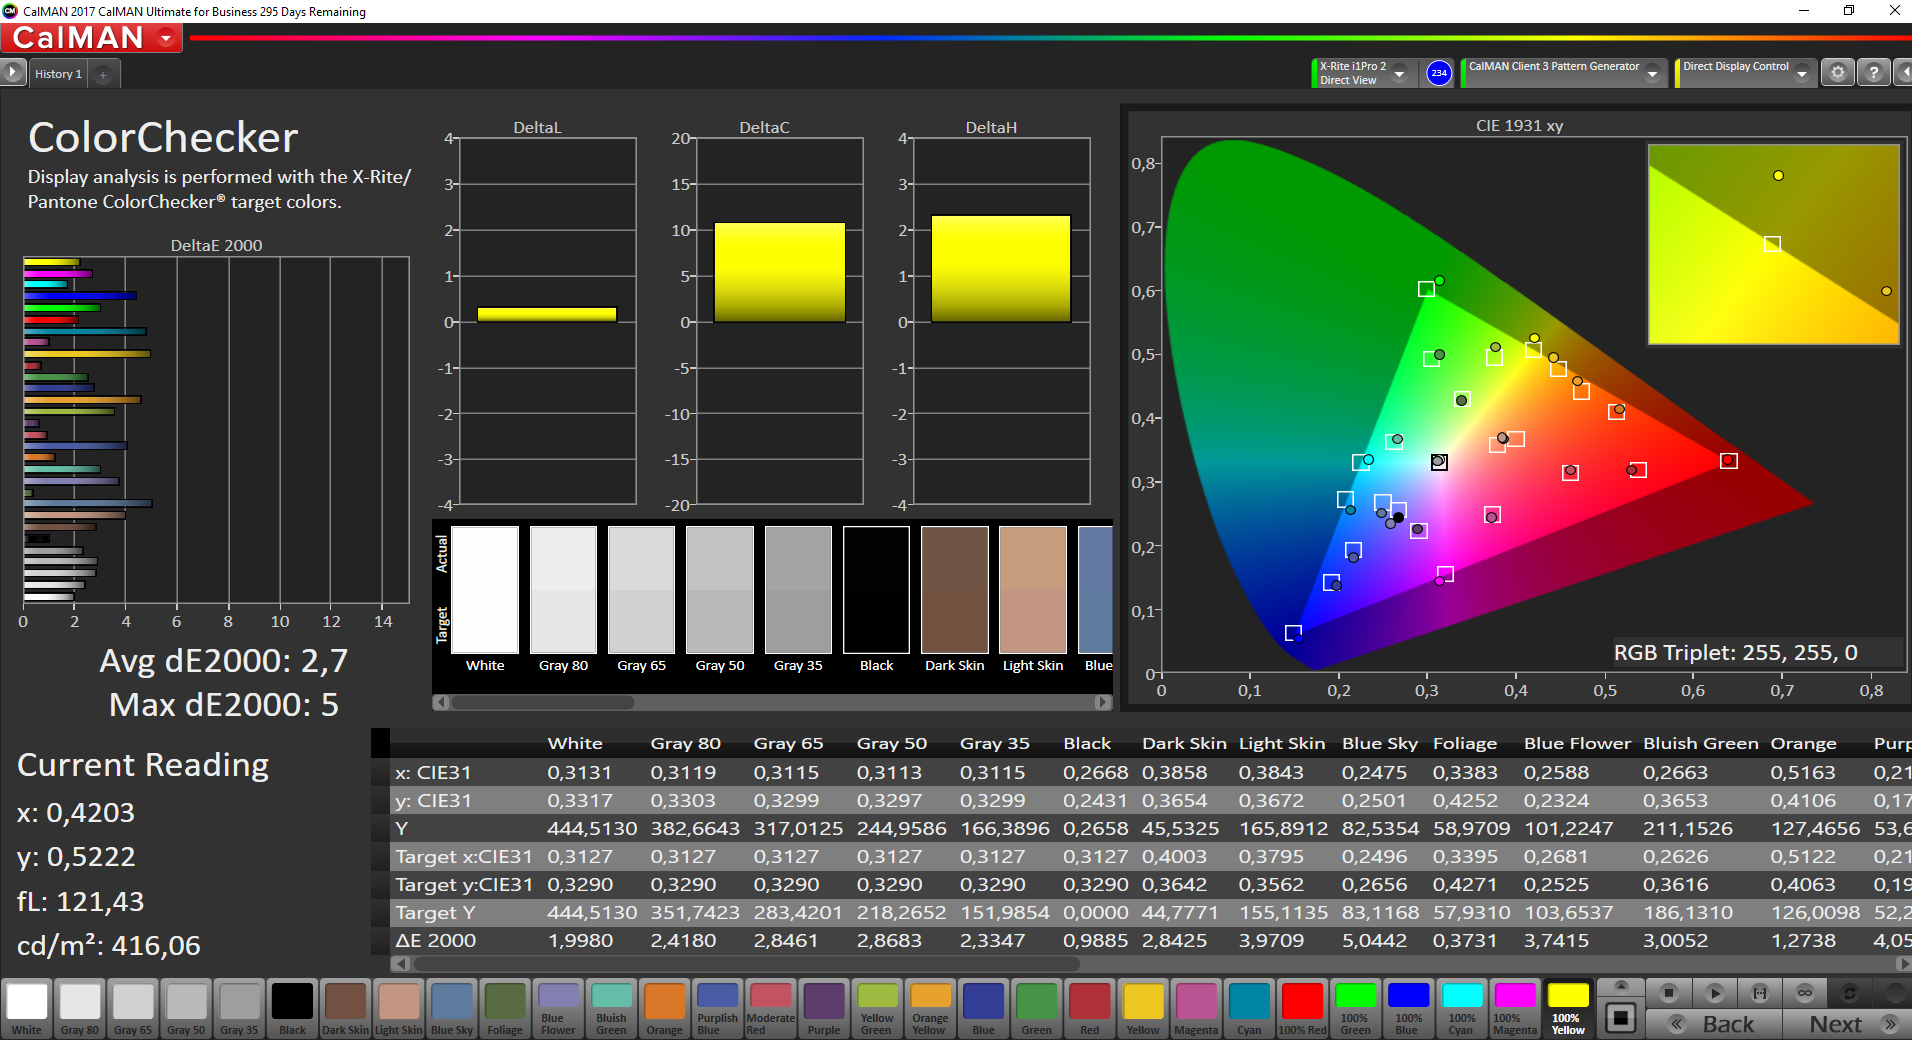
ΔE ColorChecker Calman: 1.7 | ∀{0.5-29.43 Ø4.71}
ΔE Greyscale Calman: 1.7 | ∀{0.09-98 Ø4.96}
92.9% sRGB (Argyll 1.6.3 3D)
58.6% AdobeRGB 1998 (Argyll 1.6.3 3D)
Gamma: 2.11
CCT: 6384 K
| Microsoft Surface Book 2 15 LG Philips LGD0554, , 3240x2160, 15" | Razer Blade (2017) UHD BEO0743, , 3840x2160, 14" | Dell XPS 15 9560 (i7-7700HQ, UHD) 3840x2160, 15.6" | Apple MacBook Pro 15 2017 (2.9 GHz, 560) 2880x1800, 15.4" | Microsoft Surface Book 2 Panasonic MEI96A2 , , 3000x2000, 13.5" | |
|---|---|---|---|---|---|
| Display | |||||
| Display P3 Coverage (%) | 67.8 | 89.7 | 67.9 | ||
| sRGB Coverage (%) | 94.6 | 100 | 95.7 | ||
| AdobeRGB 1998 Coverage (%) | 69 | 100 | 69.4 | ||
| Response Times | -40% | -64% | -19% | -37% | |
| Response Time Grey 50% / Grey 80% * (ms) | 37.6 ? | 51 ? -36% | 57.2 ? -52% | 42.4 ? -13% | 52.8 ? -40% |
| Response Time Black / White * (ms) | 22.4 ? | 32 ? -43% | 39.2 ? -75% | 28 ? -25% | 30 ? -34% |
| PWM Frequency (Hz) | 21930 ? | 200 ? | 962 | ||
| Screen | -36% | -72% | -4% | -5% | |
| Brightness middle (cd/m²) | 446 | 422 -5% | 370.1 -17% | 534 20% | 385 -14% |
| Brightness (cd/m²) | 444 | 402 -9% | 356 -20% | 502 13% | 372 -16% |
| Brightness Distribution (%) | 89 | 91 2% | 87 -2% | 86 -3% | 89 0% |
| Black Level * (cd/m²) | 0.25 | 0.29 -16% | 0.37 -48% | 0.31 -24% | 0.21 16% |
| Contrast (:1) | 1784 | 1455 -18% | 1000 -44% | 1723 -3% | 1833 3% |
| Colorchecker dE 2000 * | 1.7 | 3.06 -80% | 5.3 -212% | 1.8 -6% | 1.6 6% |
| Colorchecker dE 2000 max. * | 2.7 | 5.86 -117% | 9.9 -267% | 3.8 -41% | 4.5 -67% |
| Greyscale dE 2000 * | 1.7 | 3.84 -126% | 4.6 -171% | 2.4 -41% | 1.5 12% |
| Gamma | 2.11 104% | 2.52 87% | 2.31 95% | 2.27 97% | 2.22 99% |
| CCT | 6384 102% | 7100 92% | 6284 103% | 6563 99% | 6502 100% |
| Color Space (Percent of AdobeRGB 1998) (%) | 58.6 | 64 9% | 88.3 51% | 77.92 33% | 64 9% |
| Color Space (Percent of sRGB) (%) | 92.9 | 95 2% | 100 8% | 99.94 8% | 95.9 3% |
| Total Average (Program / Settings) | -38% /
-36% | -68% /
-71% | -12% /
-7% | -21% /
-10% |
* ... smaller is better
Microsoft calibrates each Surface Book 2 individually, and the average DeltaE 2000 deviations against the sRGB color space are in good order, right out of the box. The grayscale reproduction is very good, although there is some room for improvement in terms of the color accuracy. Here, the smaller Surface Book 2 performed better as well.
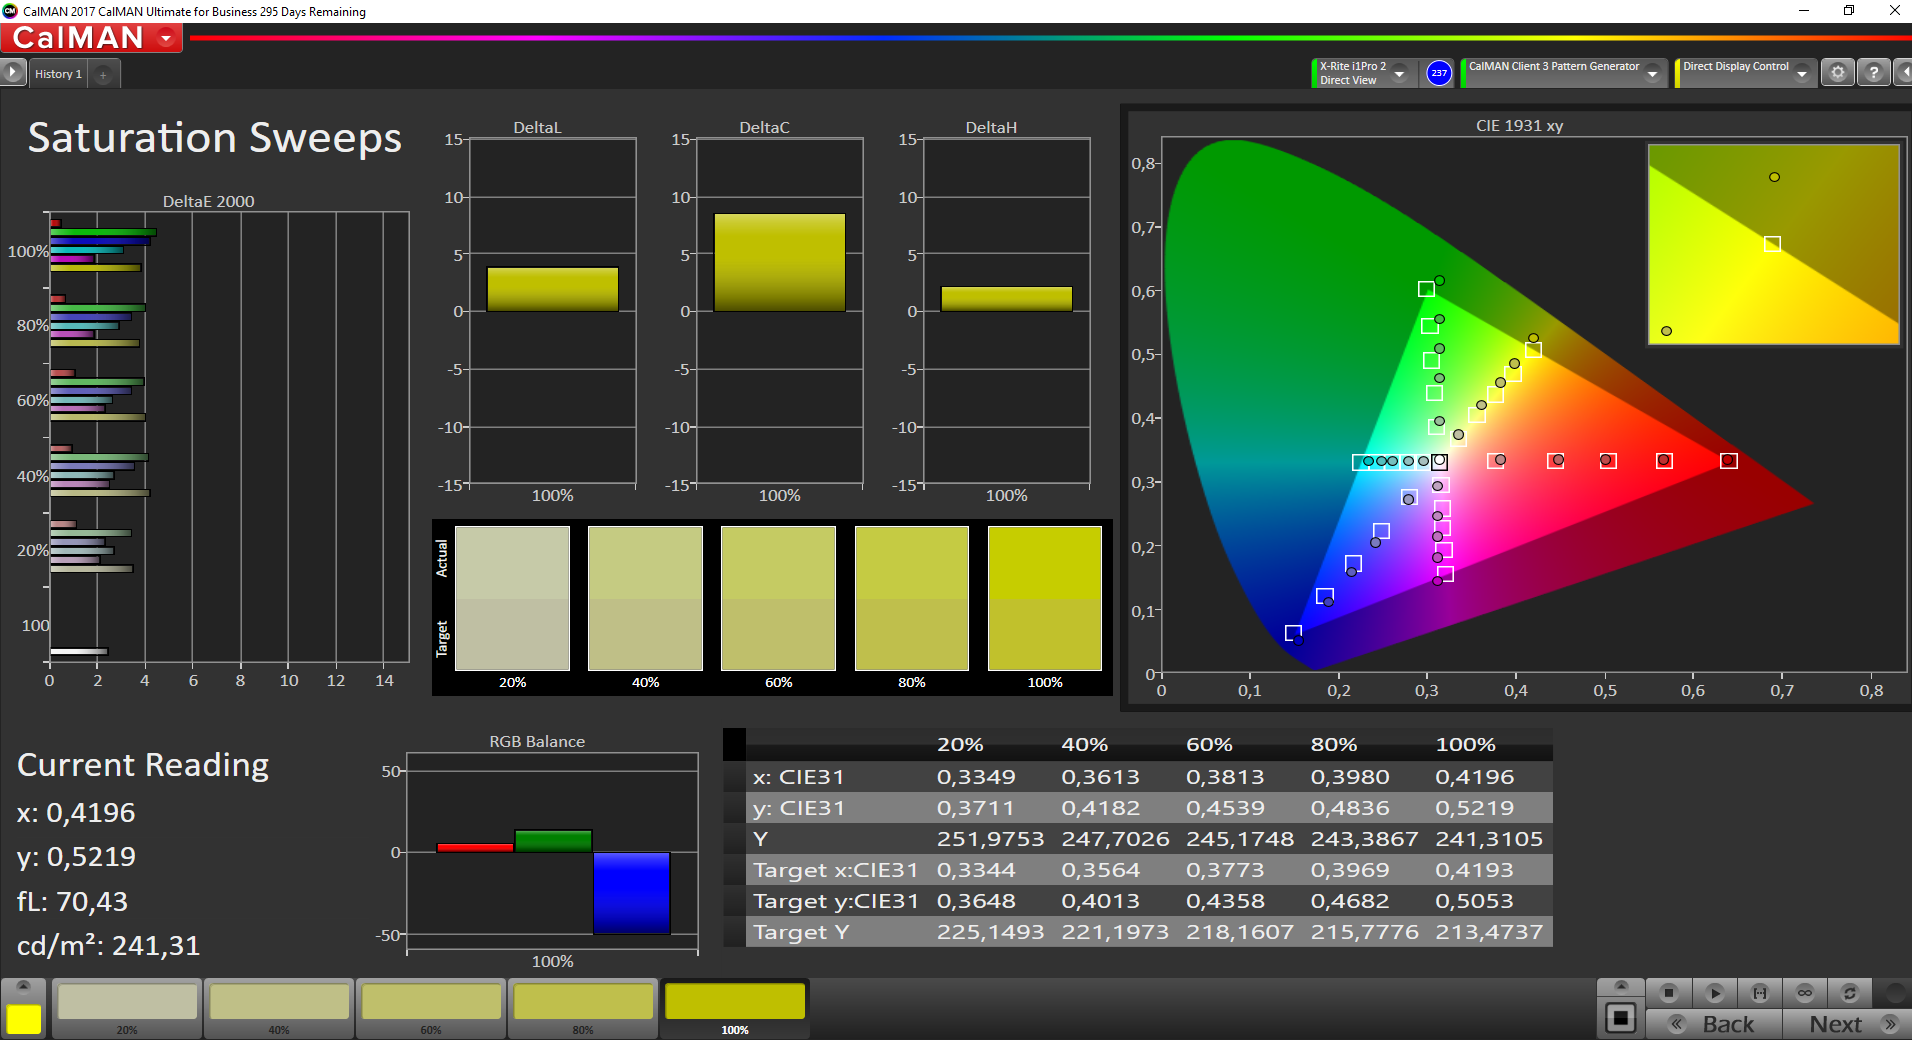
In addition to the preselected profile the Surface Book 2 15 comes with two extra profiles: sRGB and Improved. sRGB turned out to be very accurate in particular, and it practically rendered display calibration moot. Since the profile comes preloaded on every Surface Book 2 device we have adjusted the records in our database accordingly. The “Improved” profile offers more beefy and saturated colors that are less accurate in return.


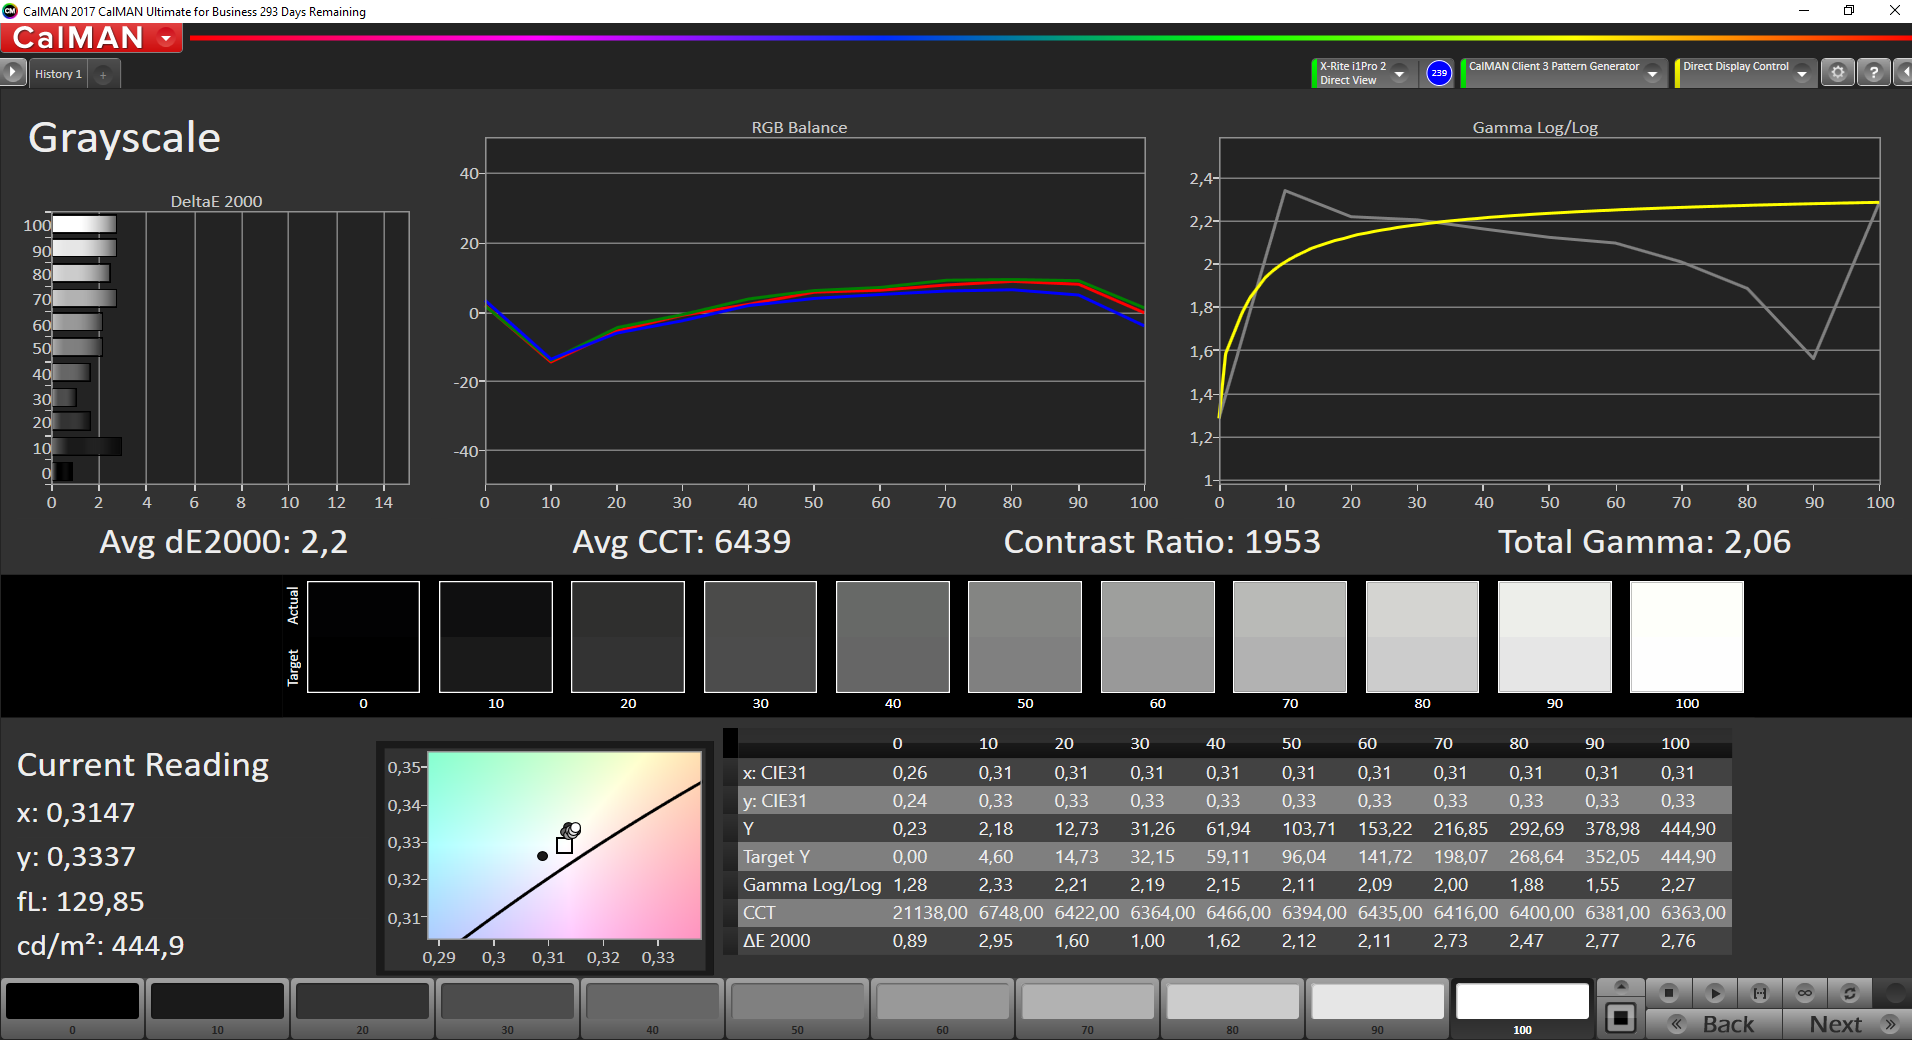
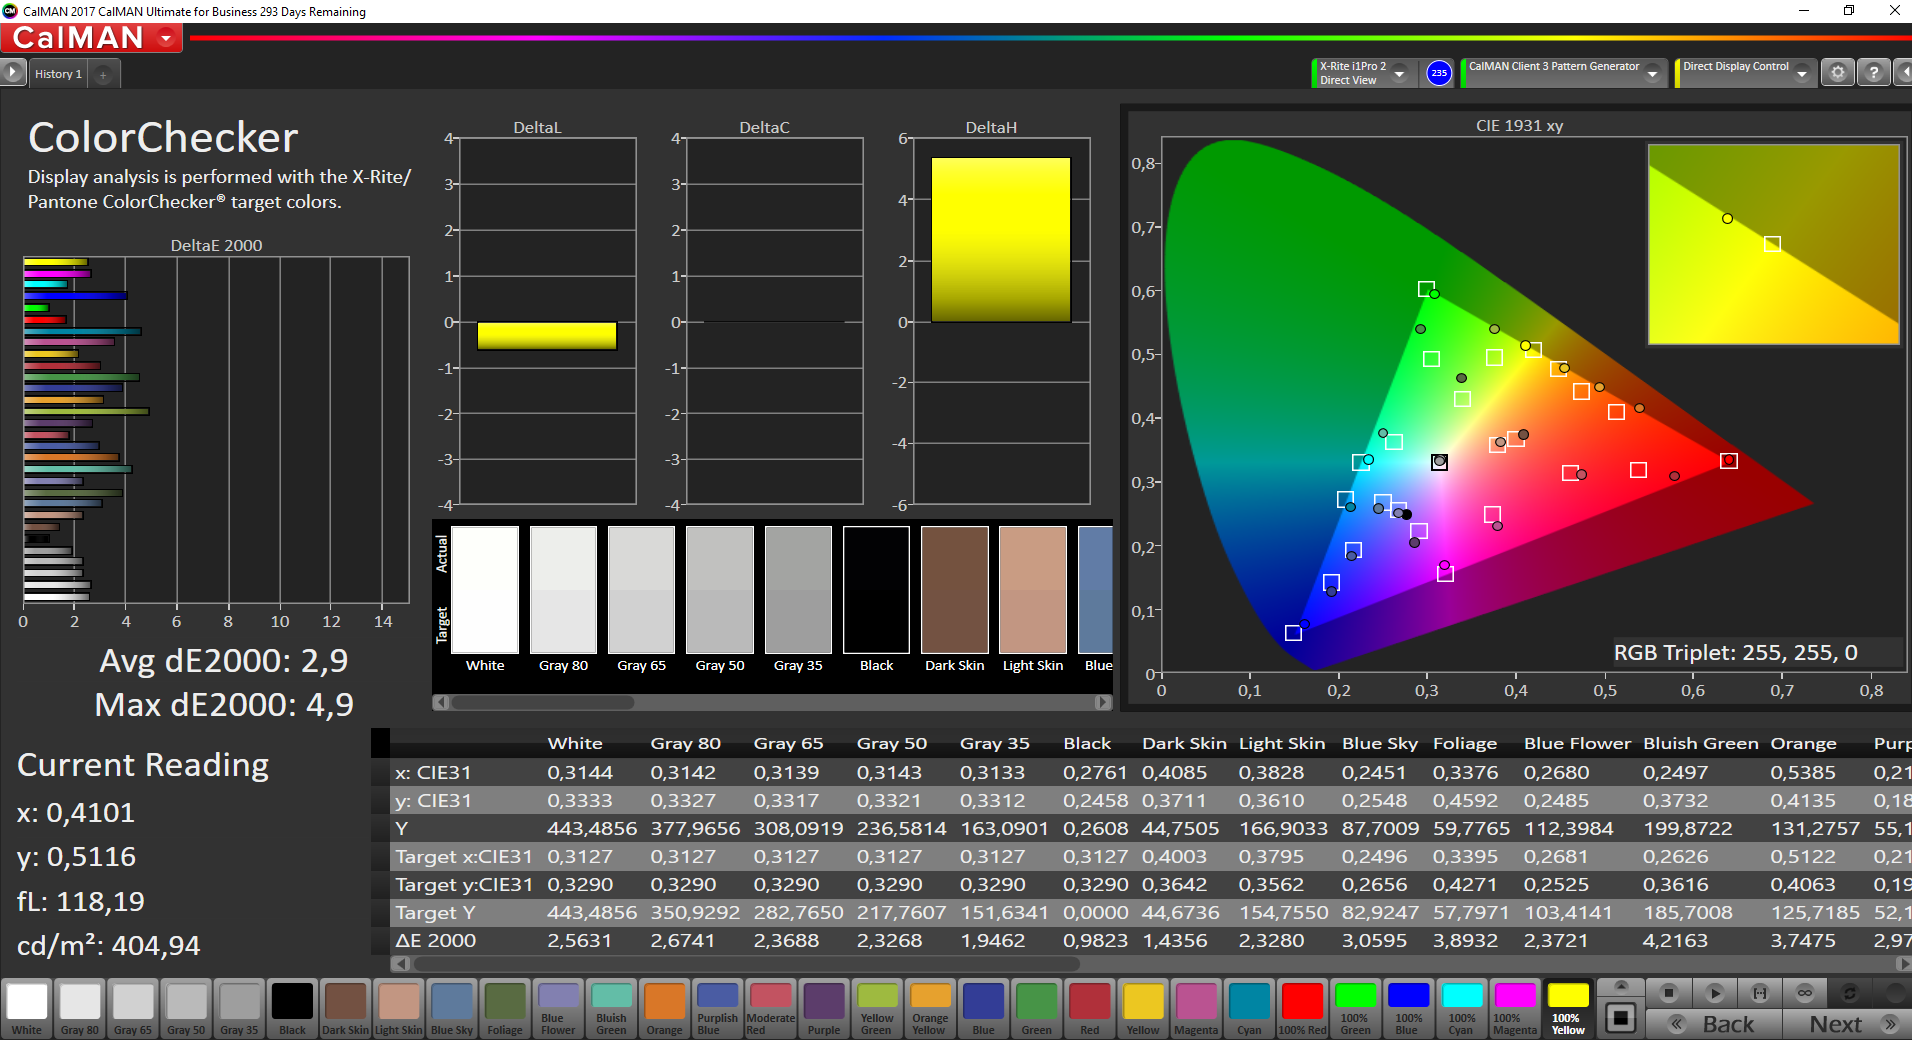
Our calibration attempts failed for some reason, but we are going to repeat them and update this review accordingly. Color space coverage was slightly below the smaller Surface Book 2 13.

Display Response Times
| ↔ Response Time Black to White | ||
|---|---|---|
| 22.4 ms ... rise ↗ and fall ↘ combined | ↗ 11.2 ms rise | 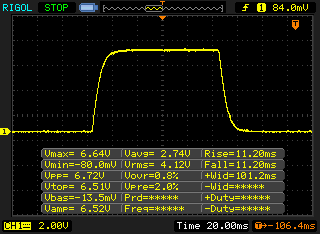 |
| ↘ 11.2 ms fall | ||
| The screen shows good response rates in our tests, but may be too slow for competitive gamers. In comparison, all tested devices range from 0.1 (minimum) to 240 (maximum) ms. » 51 % of all devices are better. This means that the measured response time is worse than the average of all tested devices (19.8 ms). | ||
| ↔ Response Time 50% Grey to 80% Grey | ||
| 37.6 ms ... rise ↗ and fall ↘ combined | ↗ 18 ms rise | 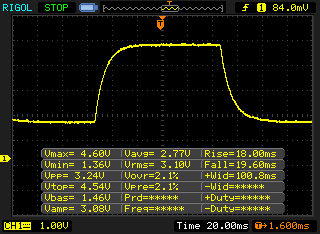 |
| ↘ 19.6 ms fall | ||
| The screen shows slow response rates in our tests and will be unsatisfactory for gamers. In comparison, all tested devices range from 0.165 (minimum) to 636 (maximum) ms. » 55 % of all devices are better. This means that the measured response time is worse than the average of all tested devices (30.9 ms). | ||
Performance
The base hardware configuration of the Surface Book 2 15 is always identical (apart from the SSD capacity). The combination of a modern ULV quad-core CPU, 16 GB of RAM and the powerful GeForce GTX 1060 is suitable for a great many applications, such as: Surfing the web, streaming high quality videos, editing images and videos and playing modern video games.
As we already saw when reviewing the smaller Surface Book 2, the new Windows power management feature (left-click on the battery icon in the taskbar) has quite an impact on the performance and, above all, the fan noise. In the following sections, we will devote some time to accessing the exact effects of using each of these three modes (recommend, better performance & best performance) and we will also provide noise measurements for each mode.
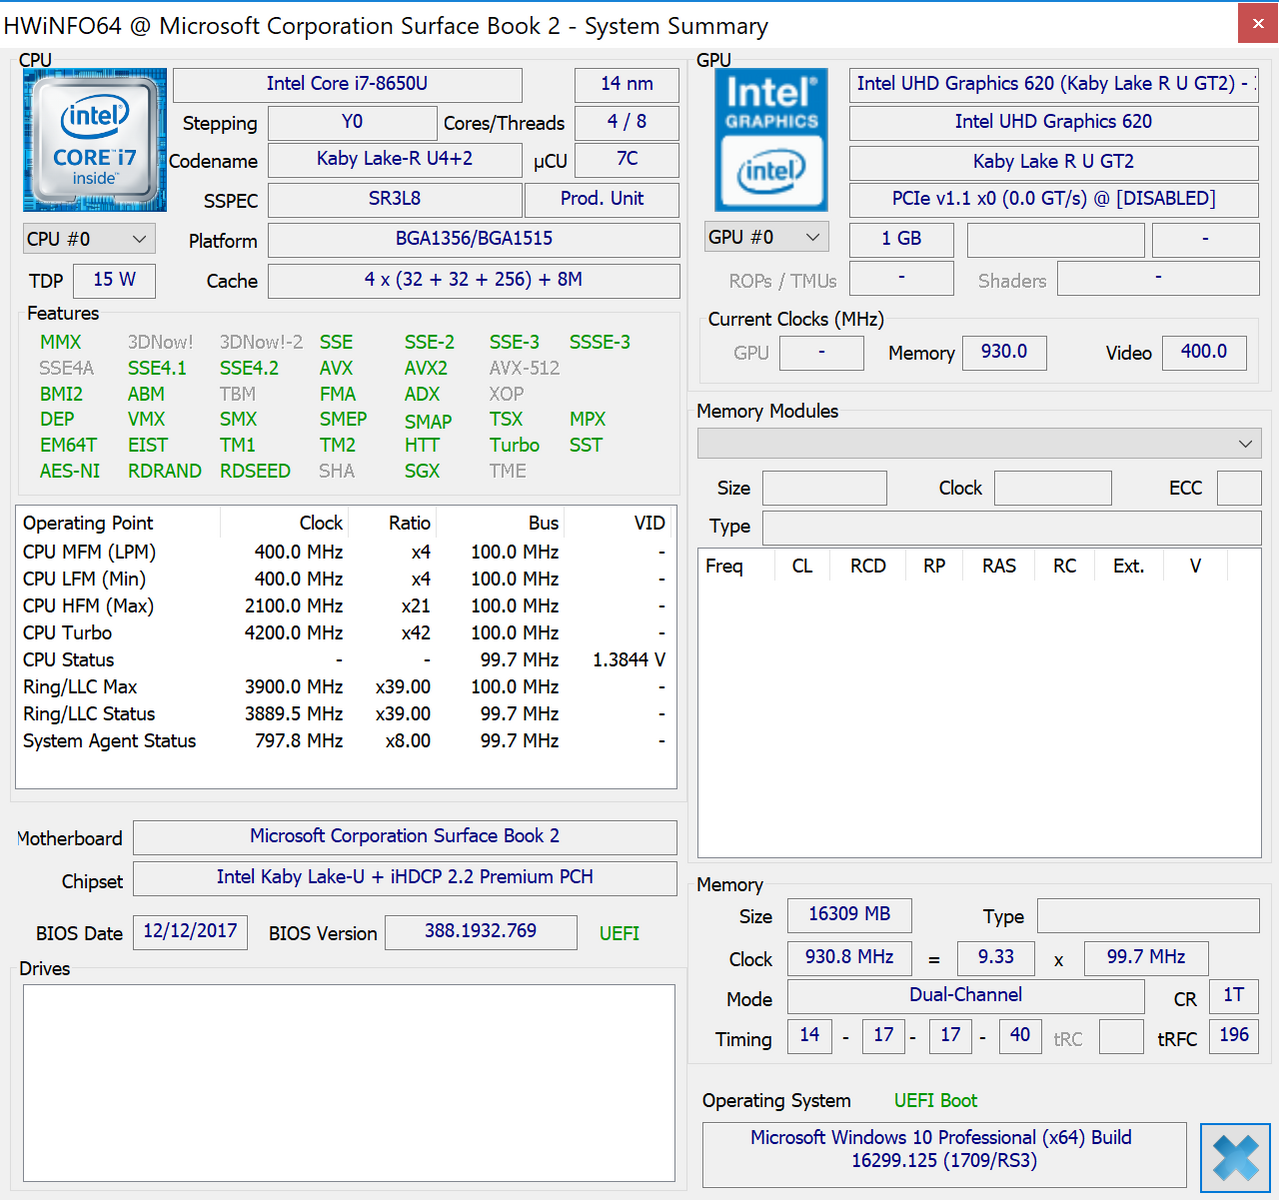
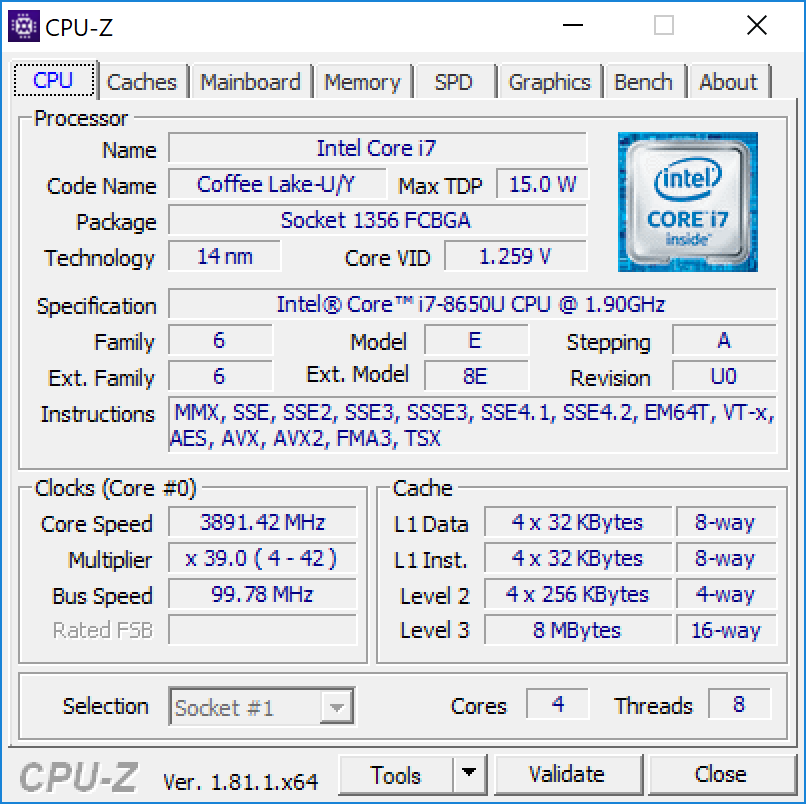
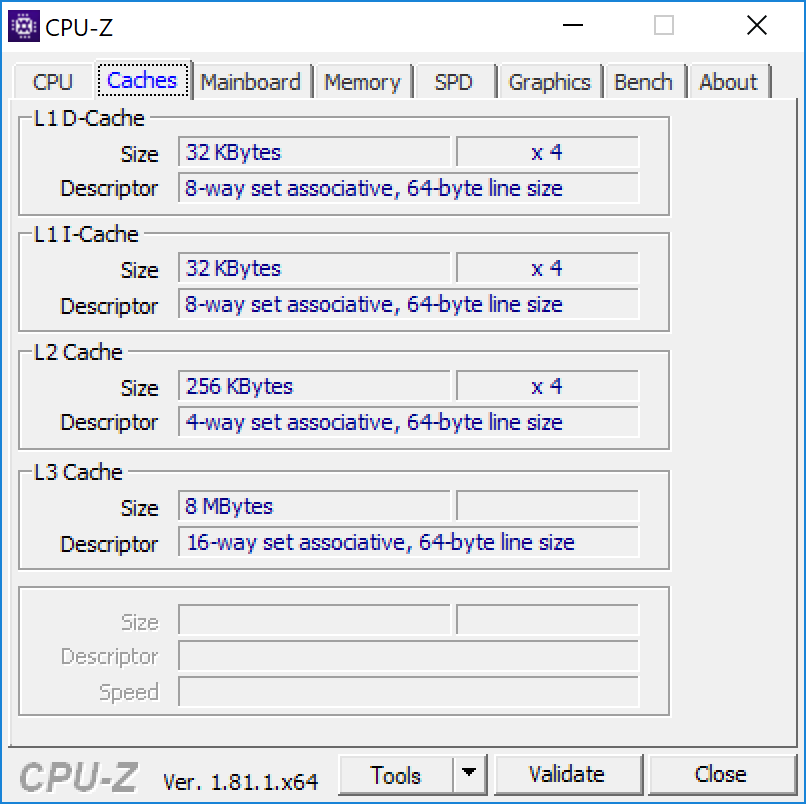
Processor – Core i7-8650U
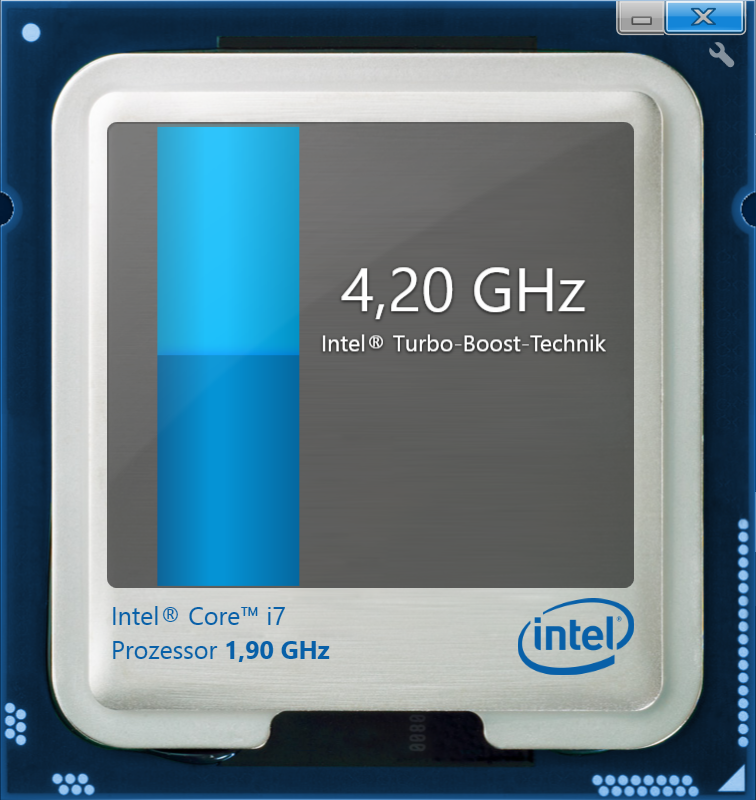
The Microsoft Surface Book 2 15 comes only with the current Kaby Lake R-based Core i7-8650U, which has a maximum clock rate of 4.2 GHz. The four cores support Hyper-threading and can process eight threads at the same time. This is why, the new ULV quad-core CPUs have a significant advantage over the old dual-core processors, such as the i7-7500U, at least, when it comes to the applications which can utilize the additional cores. You can find additional information about the i7-8650U here.
In principle, what we are supposed to have here is a 15-watt part. However, here, the energy consumption averages 25 watts and peaks, temporarily, at 35 watts. So far, our review device performs just like the smaller Surface Book 2 13. However, the CPU in the smaller model was cooled passively, whereas the larger 15-inch model relies on a small fan for cooling.
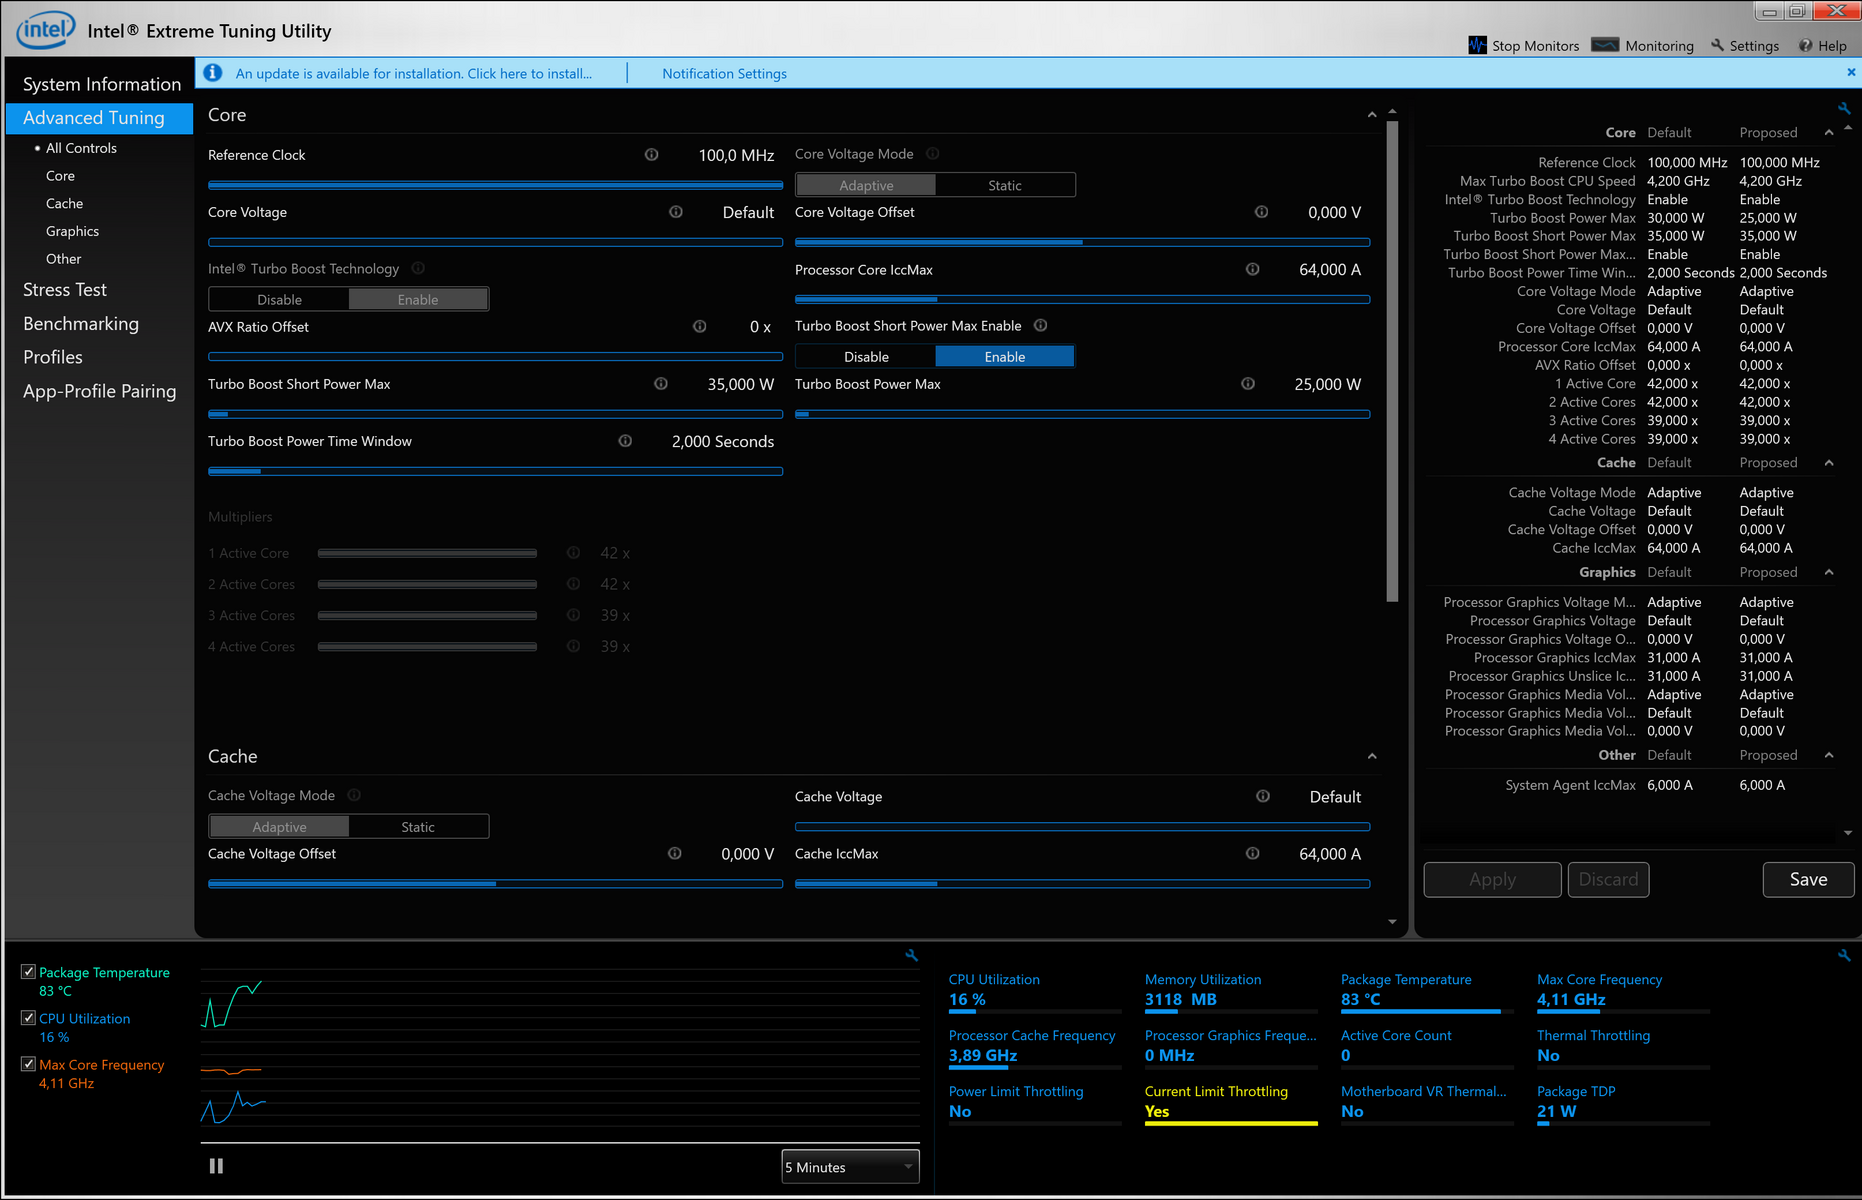
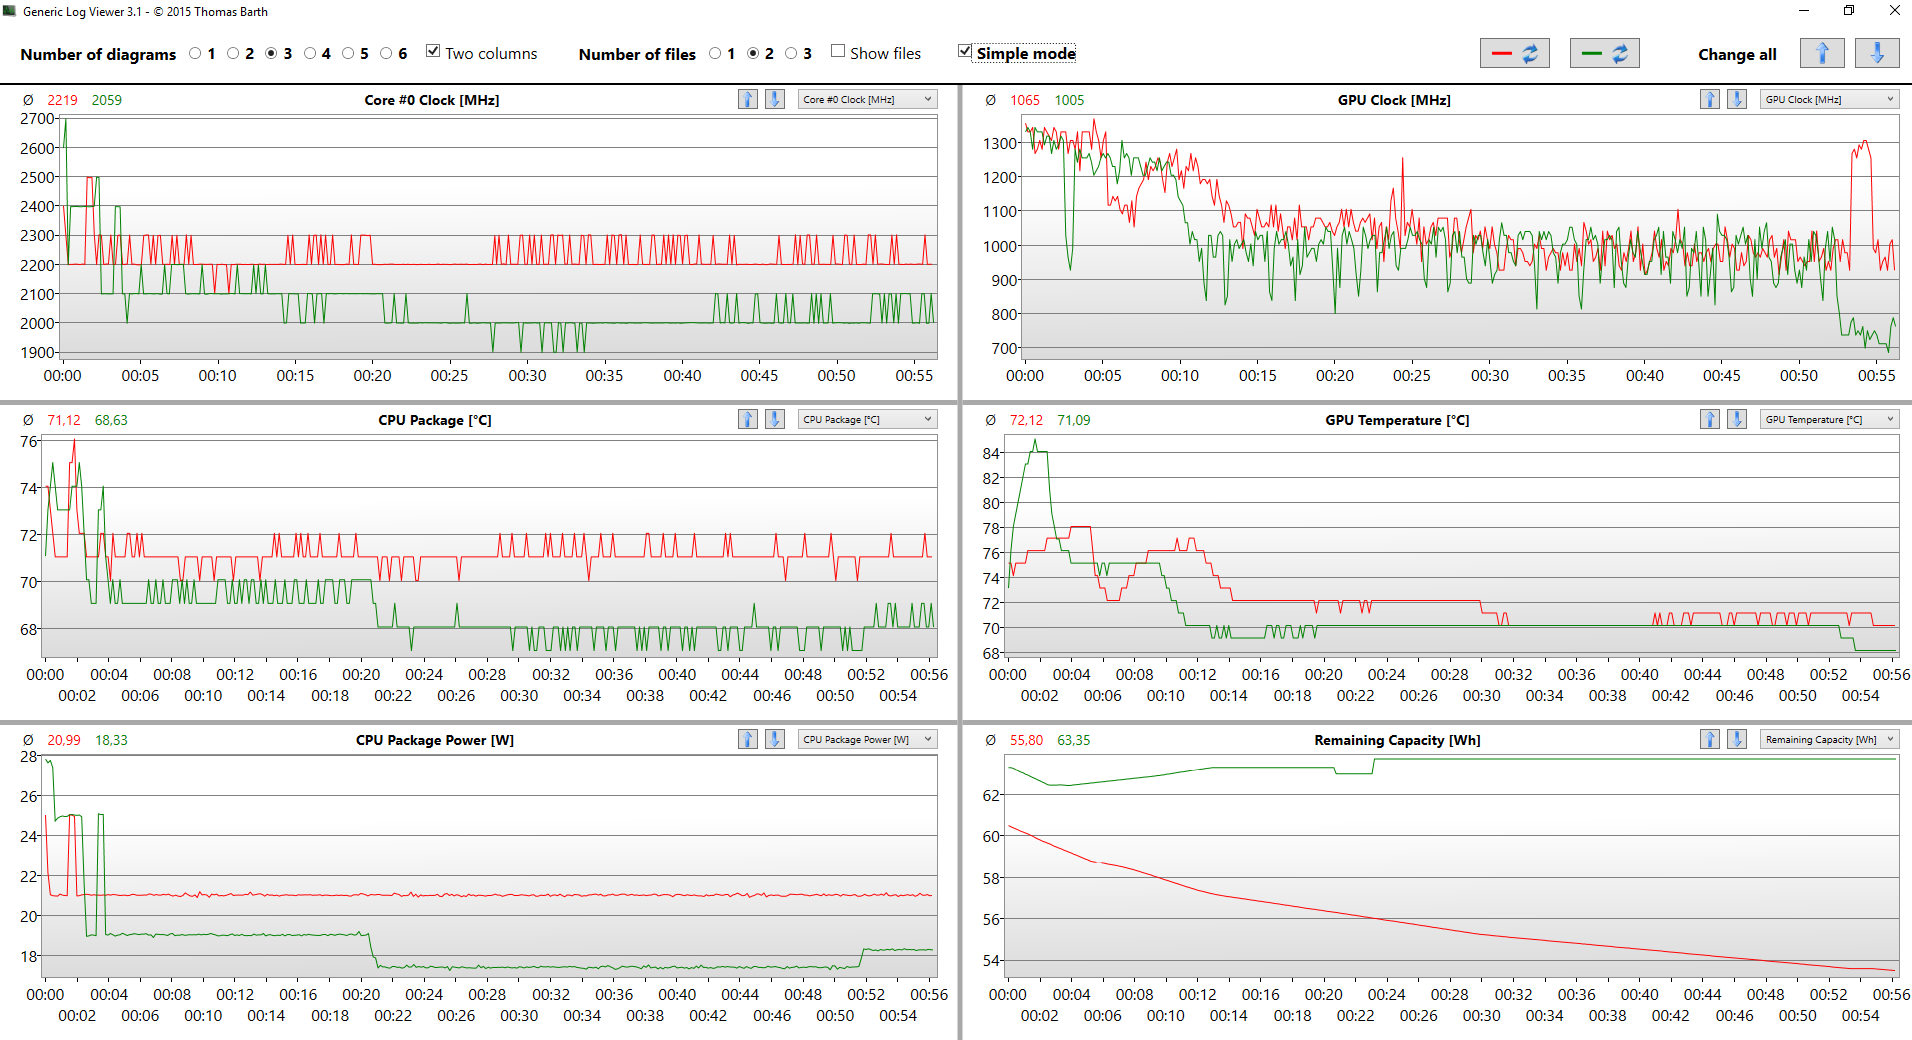
Theoretically, this should mean better performance. We do get the maximum score of 675 points during the first benchmark run. However, after that, the performance drops to the level of the smaller model. The result varies slightly according to the power management setting. However, the noise level is affected by these settings much stronger. When the “Recommended” setting is selected, the fan is nearly inaudible (29.8 dB(A)). However, when two other settings are selected, the fan noise increases considerably (31.4 and 33.2 dB(A), respectively). This might not seem like a big increase, but the small fan does produce a very high-pitched sound, which is, subjectively, more annoying.
Things get interesting during our Cinebench R15 loop (in which the benchmark runs 50 times in a continuous loop). With the “Best Performance” setting selected, the initial result is, actually, the best. However, with this setting, the performance drops faster than with the “Better Performance” setting. After a while, these two settings start handing in similar results, with the “Best Performance” setting delivering, consistently, slightly better results. In “Recommended’ mode, the processor operates more conservatively, albeit more consistently and more quietly.
The active cooling is the reason why the larger Surface Book 2 performs better than its smaller brother, which hit a plateau at 520 points. That said, we expected more from the active cooling solution. The average energy consumption is 5 watts higher, and even the new and extremely thin Dell XPS 13, which comes with a supposedly slower Core i5-8250U, manages to achieve a few more points over the course of 50 benchmark runs.
When the laptop is running on battery power, the CPU performance does not decrease. You can find other benchmark results for the Core i7-8650U on our “CPU benchmarks” page.
The Witcher 3 Performance Analysis
We are obviously going to test the Surface Book 2 15 with various modern games but first let’s take a closer look at the effect the three performance profiles had on frame rates, temperatures, system noise, and power consumption when running The Witcher 3 (Ultra).
While performance differed measurably between the three, the effects were minimal. Comparing the results to the records in our benchmark database we were able to determine that even the Surface Book 2’s best results were at the lower end of the GTX 1060 spectrum. The reason for this is quite possibly the power consumption limitation imposed upon the device.
| Best Performance | Better Performance | Recommended | |
| average FPS after ~1h | 32.8 | 29.9 | 29.2 |
| average system noise in dB(A) | 33.2 | 34.4 | 45.3 |
| total power consumption in watts | 101 | 75 - 80 | 69 - 75 |
The detailed analysis revealed very obvious differences in power consumption between the three profiles. In terms of CPU performance, Best Performance and Better Performance achieved very similar results at average clock speeds of around 3,270 MHz (10 - 11 W). On Recommended, however, we noticed a significant decrease in clock speed (around 2,000 MHz) and power consumption (6.4 W). These results show that The Witcher 3 is limited mostly by the GPU (which is true for most modern games) and not the CPU.
The effect differed somewhat when looking at GPU performance, and the difference between Best and Better Performance was significant. If not for the thermal limit of around 101 W imposed upon the system the difference would have most likely been even more pronounced.
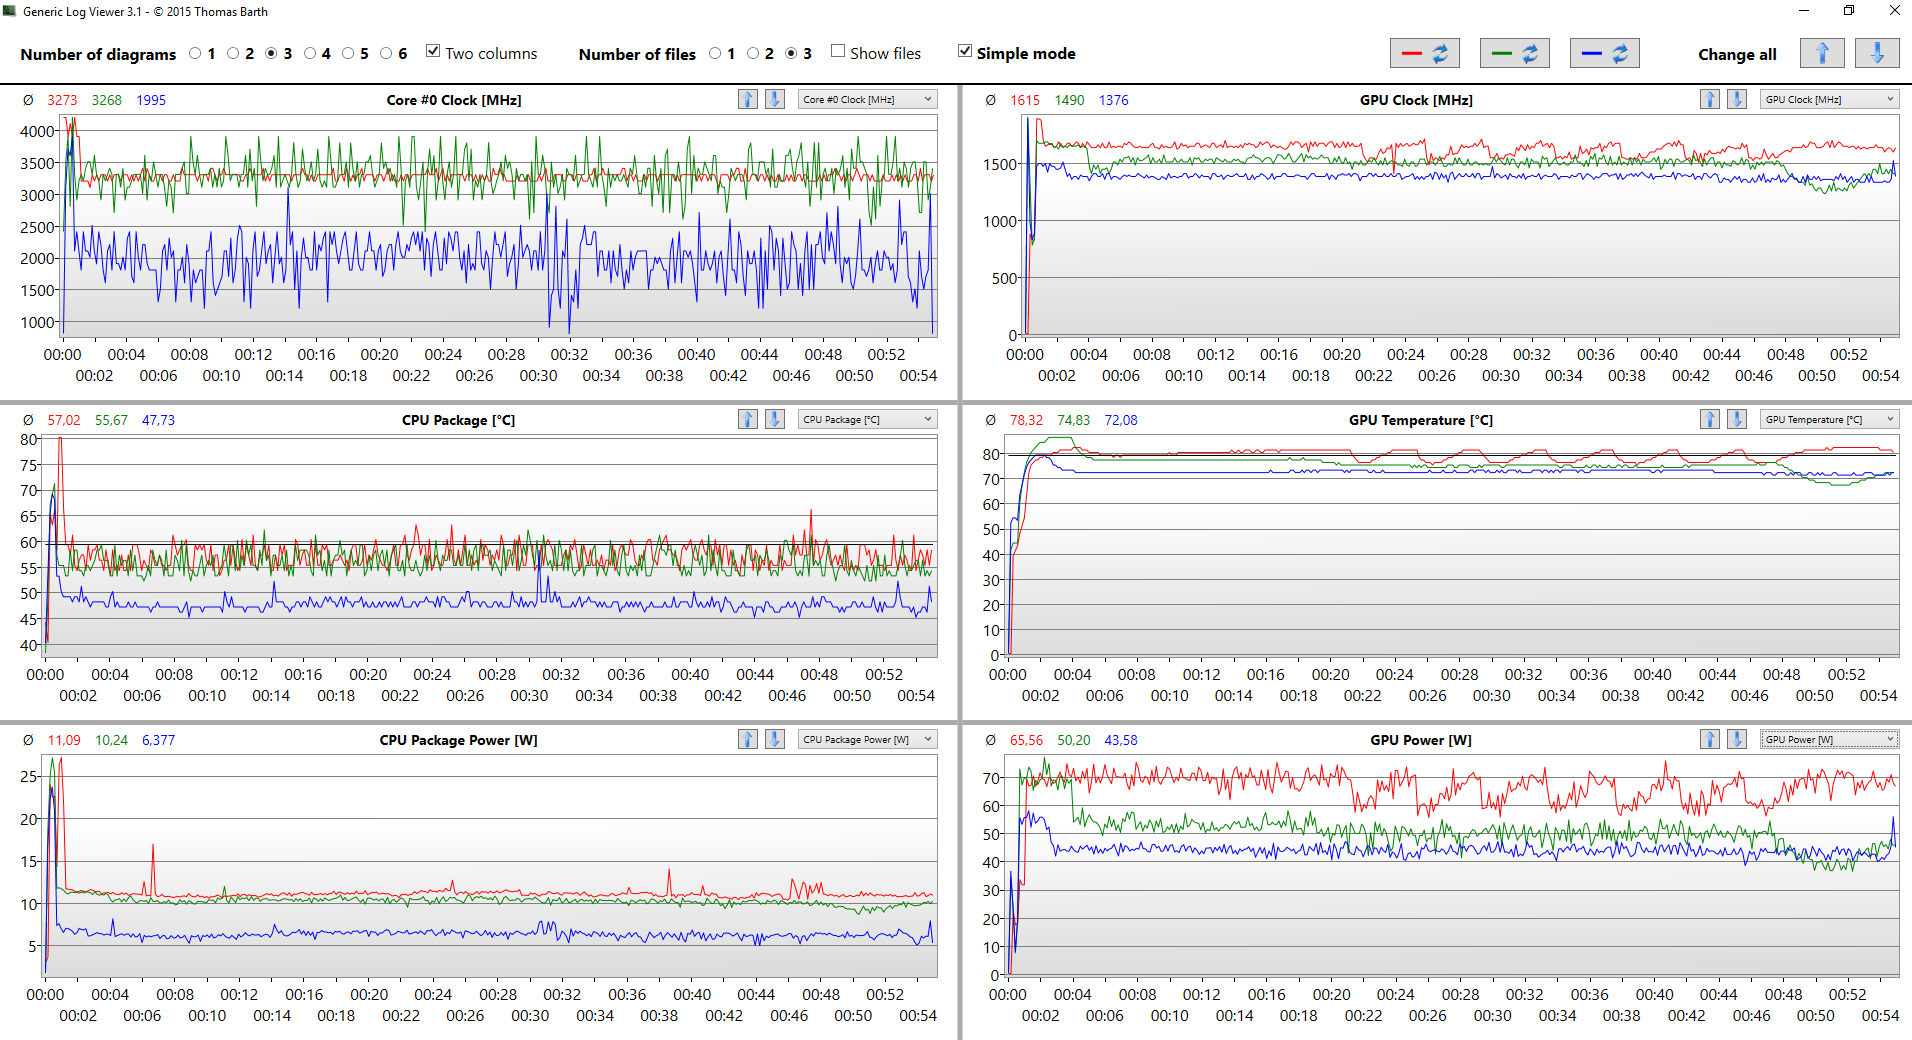
Surface temperatures were pretty similar regardless of profile due to the fact that the fans ran much slower and quieter in the two slower profiles. The keyboard felt warm to the touch when playing games but it was never annoying or even disturbing.
Emissions
System Noise - between load and quiet there is but a click
Both the CPU and the GPU of the Surface Book 2 15 are cooled actively, and the energy management settings affect, above all, the noise level associated with the GPU load. Subsequently, we have taken our first measurements. All in all, the larger Surface Book 2 operates somewhat more quietly than the 13-inch model. Nevertheless, under pure CPU load, the small fan is quite annoying with its high-frequency noise. However, under concurrent CPU and GPU load, the high-pitched fan noise is drowned out.
| Empfohlen | Bessere Leistung | Beste Leistung | |
|---|---|---|---|
| 3DMark 06 | 30,1 dB(A) | 31,4 dB(A) | 35,7 dB(A) |
| Cinebench R15 Multi | 29,8 dB(A) | 31,4 dB(A) | 33,2 dB(A) |
| Witcher 3 ultra | 30,1 dB(A) | 34,4 dB(A) | 45,3 dB(A) |
| Stresstest | 33,2 dB(A) | 35 dB(A) | 45,3 dB(A) |
The biggest differences in terms of fan noise arise while gaming and during our stress test. As per usual, in the following days, we will conduct further tests and benchmarks and we will look at the impacts on performance more closely. An unfortunate occurrence with the Surface Book 2 13 was coil whine, which is also present in the larger model, unfortunately. It varies according to the power setting, and it is most annoying with the “Best Performance” setting.
Noise level
| Idle |
| 29.1 / 29.1 / 29.1 dB(A) |
| Load |
| 35.7 / 45.3 dB(A) |
 | ||
30 dB silent 40 dB(A) audible 50 dB(A) loud |
||
min: | ||
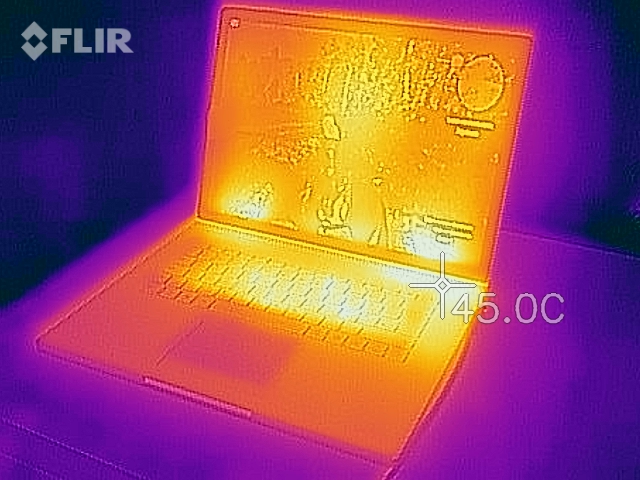
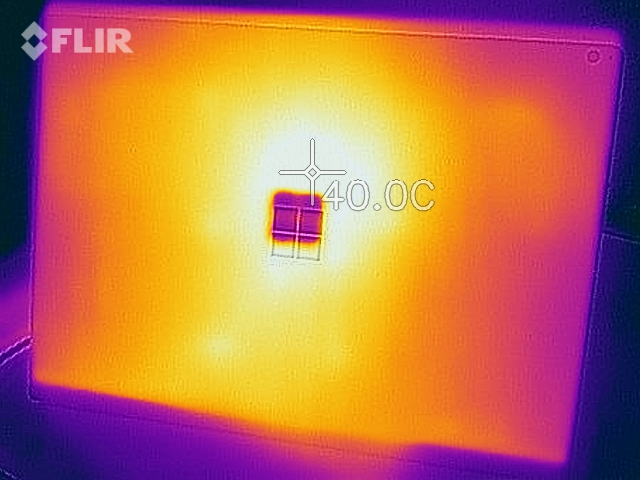
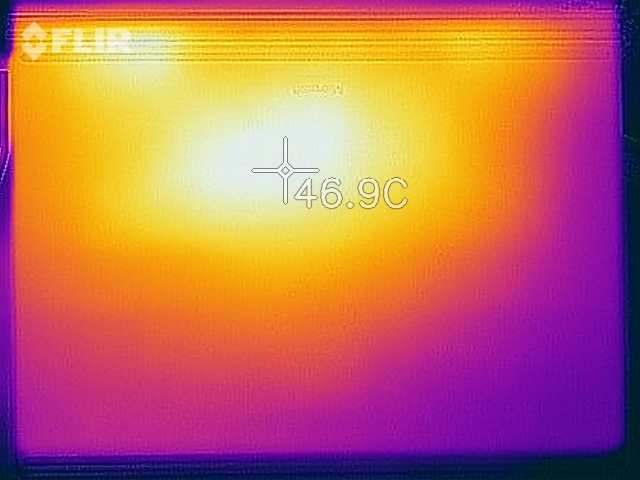
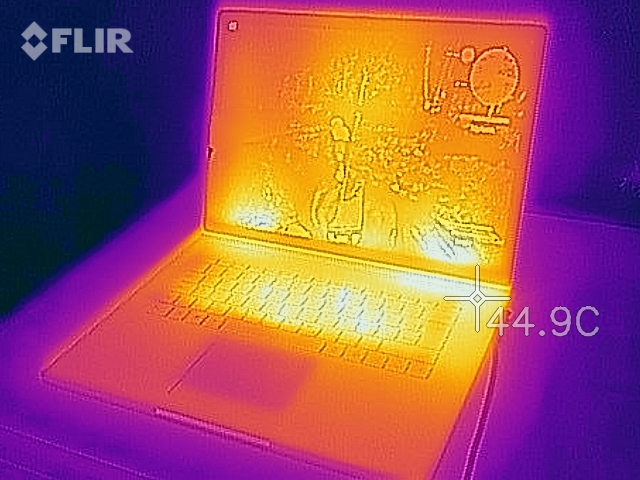
Temperature
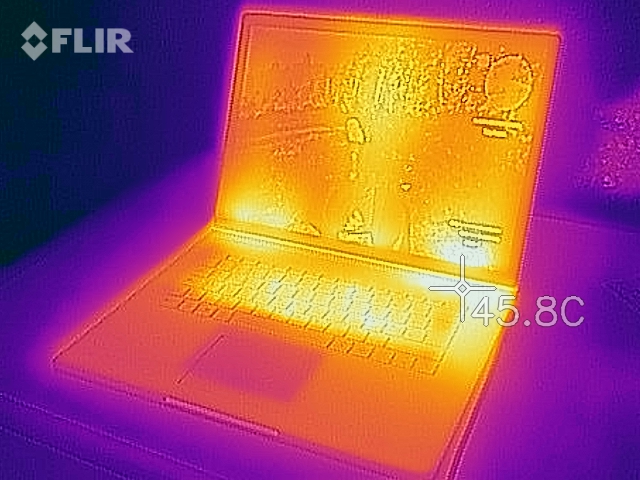
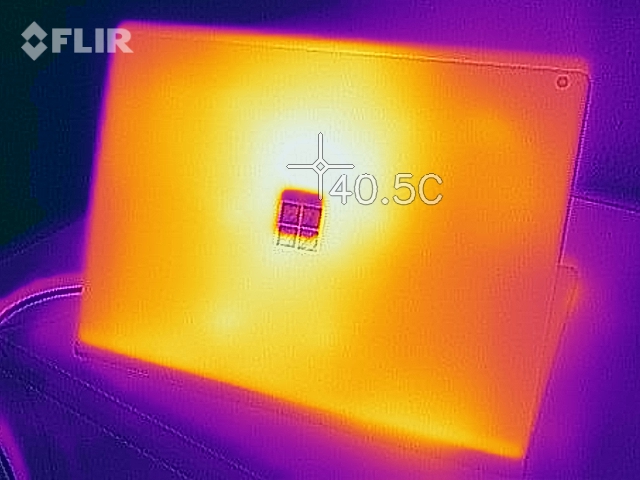
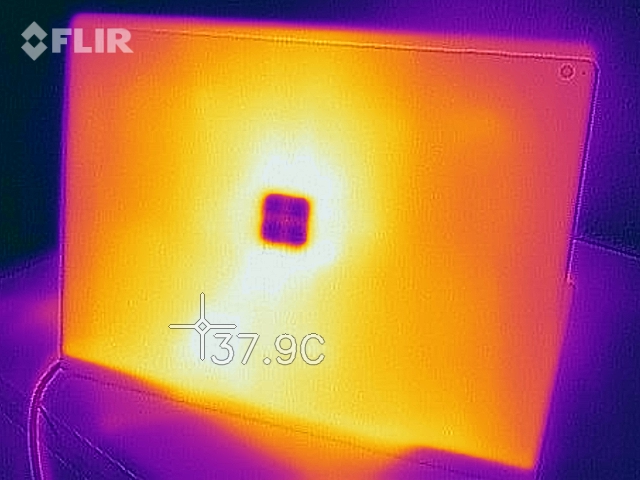
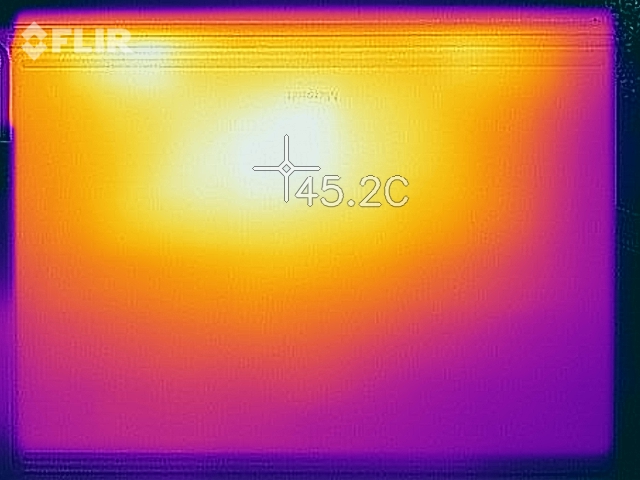
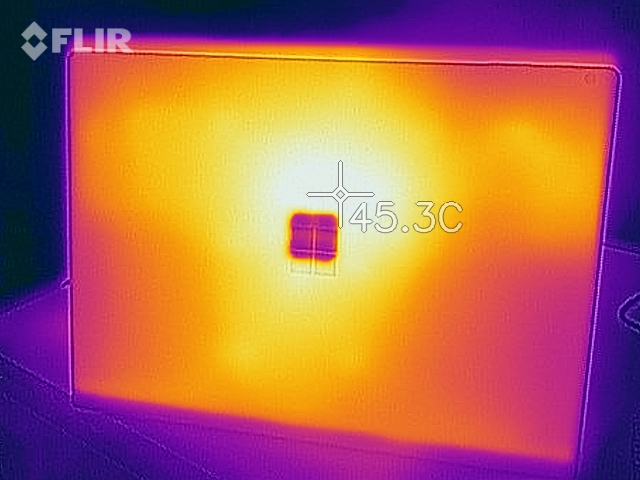
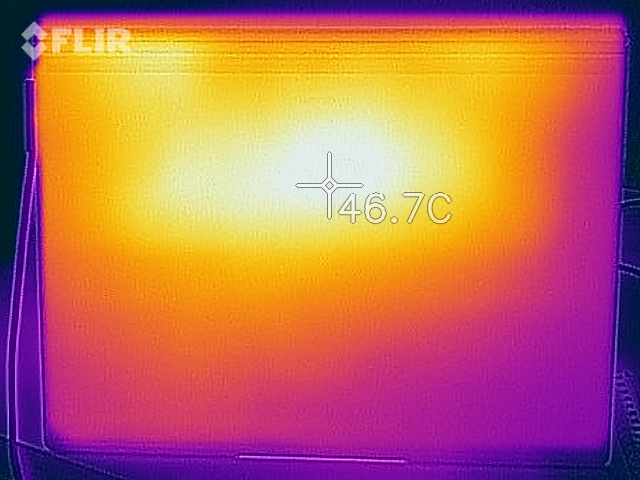
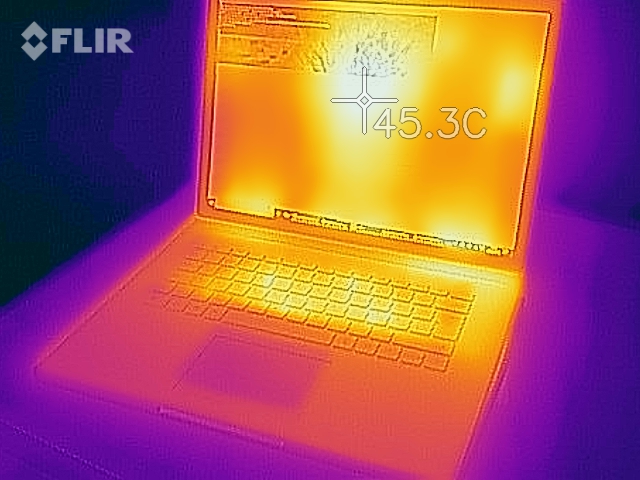
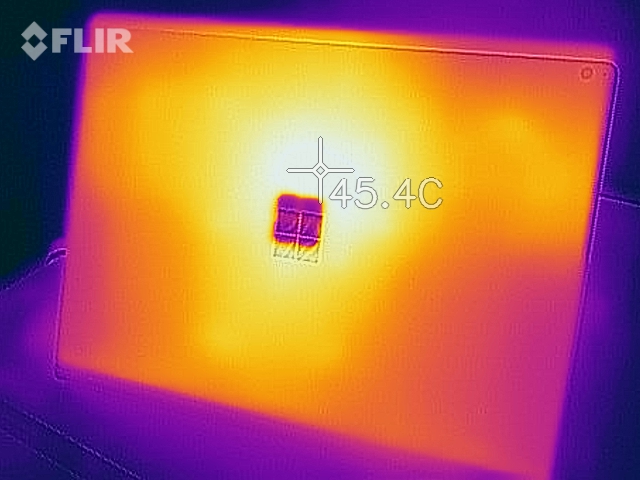
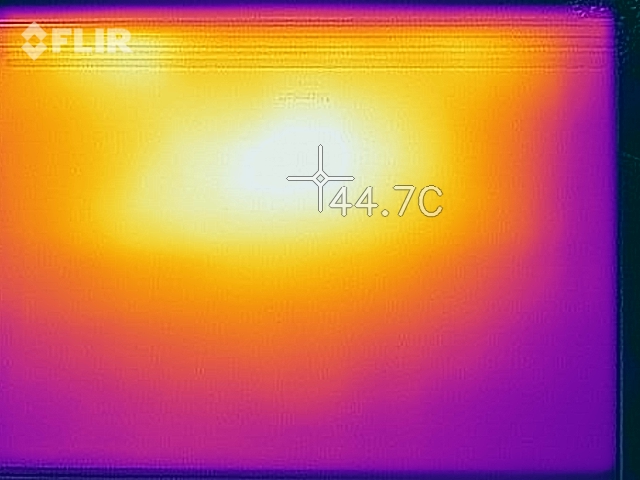
When idle, the Surface Book 2 practically did not warm up at all. The dedicated GPU is disabled in this scenario, and so is the fan in the base unit. Only the bottom edge warmed up ever so slightly, which was likely due to the keyboard backlight.
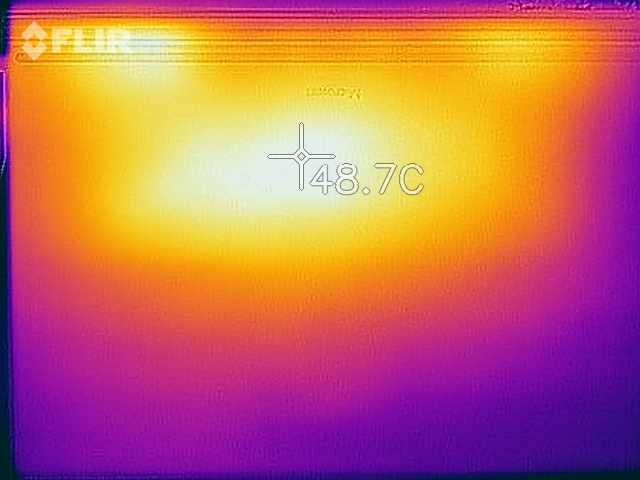
Under load, temperatures exceeded 40 °C almost everywhere on the device. While the temperatures were acceptable overall considering the Surface Book 2’s level of performance we would not recommend using it on your lap under load. The exact hotspot location varied depending on load scenario. The CPU stayed relatively cool in Witcher 3, a game that is heavy on the GPU. Given the limited combined power consumption of 101.5 W this left the GPU with some extra headroom. Running FurMark (aka GPU-load only) power consumption once again peaked at 101.5 W at GPU clock speeds of 1,600 MHz. Adding some extra CPU load power consumption remained firm at 101.5 W, but the GPU clocked down to 1,300 MHz. This is also the wall that games such as Witcher 3 run into. In this particular load scenario, the battery discharged at a rate of around 12 % per hour (with the Best Performance profile selected).
(±) The maximum temperature on the upper side is 43.5 °C / 110 F, compared to the average of 36.8 °C / 98 F, ranging from 21 to 71 °C for the class Multimedia.
(±) The bottom heats up to a maximum of 42.7 °C / 109 F, compared to the average of 39.1 °C / 102 F
(+) In idle usage, the average temperature for the upper side is 25.1 °C / 77 F, compared to the device average of 31.3 °C / 88 F.
(±) Playing The Witcher 3, the average temperature for the upper side is 37.4 °C / 99 F, compared to the device average of 31.3 °C / 88 F.
(-) The palmrests and touchpad can get very hot to the touch with a maximum of 41.8 °C / 107.2 F.
(-) The average temperature of the palmrest area of similar devices was 28.7 °C / 83.7 F (-13.1 °C / -23.5 F).
(±) The maximum temperature on the upper side is 41.8 °C / 107 F, compared to the average of 36.8 °C / 98 F, ranging from 21 to 71 °C for the class Multimedia.
(±) The bottom heats up to a maximum of 43.1 °C / 110 F, compared to the average of 39.1 °C / 102 F
(+) In idle usage, the average temperature for the upper side is 22.3 °C / 72 F, compared to the device average of 31.3 °C / 88 F.
(±) Playing The Witcher 3, the average temperature for the upper side is 36.9 °C / 98 F, compared to the device average of 31.3 °C / 88 F.
(+) The palmrests and touchpad are reaching skin temperature as a maximum (32.5 °C / 90.5 F) and are therefore not hot.
(-) The average temperature of the palmrest area of similar devices was 28.7 °C / 83.7 F (-3.8 °C / -6.8 F).
The following diagrams show the performance data while running the stress test on Best Performance and Better Performance. On Better Performance, initial power consumption peaked at 101.5 W and dropped to 85 W after a short while. This is the reason why the battery did not discharge at all. Overall temperatures were comparable despite the somewhat slower performance: the fans were running slower and system noise was reduced significantly to more reasonable and tolerable levels (35 vs. 45.3 dB(A)).
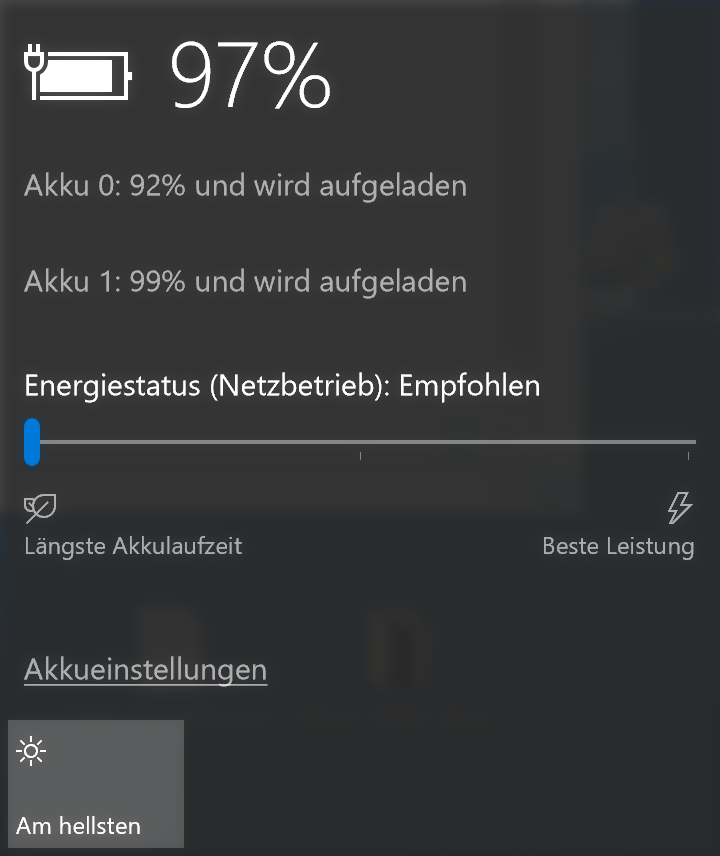
Energy Management
Battery Life
The total battery capacity amounts to 86 Wh (23 Wh for the tablet, 63 Wh for the base) and Microsoft promises, just like with the 13-inch model, a video-playback runtime of up to 17 hours. Naturally, we will put this claim to the test, but first we are going to carry out our practically oriented Wi-Fi test. This test is conducted with the brightness set to 150 cd/m² (59 % brightness in this case) and consists of a mix of websites, which switch automatically every 30 seconds. The Surface Book 2 15 achieves a very good result of ten and a half hours, and, with this result, it falls slightly behind the 13-inch model, which managed to achieve a total runtime of eleven hours. When the keyboard is disconnected, the battery life takes a nosedive. Now it is only three hours and five minutes.
In our video playback battery life test at a normalized brightness of 150 nits (Big Buck Bunny, H.264) the Surface Book 2 barely missed the 17 hour mark advertised by Microsoft. At more than 15 hours the results were still more than impressive, and the smaller 13-inch model was once again only ever so slightly better (+ 18 minutes). Using just the tablet for watching videos playback time was reduced to close to 5 hours (294 minutes).
| Microsoft Surface Book 2 15 i7-8650U, GeForce GTX 1060 Mobile, 86 Wh | Razer Blade (2017) UHD i7-7700HQ, GeForce GTX 1060 Mobile, 70 Wh | Dell XPS 15 9560 (i7-7700HQ, UHD) i7-7700HQ, GeForce GTX 1050 Mobile, 97 Wh | Apple MacBook Pro 15 2017 (2.9 GHz, 560) i7-7820HQ, Radeon Pro 560, Wh | Microsoft Surface Book 2 i7-8650U, GeForce GTX 1050 Mobile, 75 Wh | Average of class Multimedia | |
|---|---|---|---|---|---|---|
| Battery runtime | -46% | -32% | 7% | 5% | 16% | |
| WiFi v1.3 (h) | 10.6 | 5.7 -46% | 7.2 -32% | 11.3 7% | 11.1 5% | 12.3 ? 16% |
| Witcher 3 ultra (h) | 1.3 | 3.8 |
Preliminary Verdict
After the first few hours with the new Surface Book 2 15, we were able to draw a great many parallels between it and its smaller brother. The new performance slider in Windows 10, once again, has quite an impact on the fan noise. The processor in the tablet is actively cooled. However, we were expecting more from the improved cooling solution (as compared to the 13-inch model).
The screen is brighter, but it has more problems with screen bleeding and utilizes PWM for brightness control. Moreover, the factory calibration is not very good. According to our first tests, the larger battery does a good job of offsetting the increased energy consumption of the bigger panel, and, when browsing the web, you can expect more than ten hours of battery life.
We will carry out the remaining tests and benchmarks in the next couple of days. In doing so, we will focus mostly on the impacts on performance and energy consumption of the various power profiles.
Price comparison
