Razer Blade (2017) UHD Laptop Review
For the original German article, see here.
Back in March of 2017, we had the FHD model of the Kaby Lake Razer Blade in review. Now, we have got our hands on the UHD variant of the otherwise completely identical notebook. Accordingly, in this test we are going to focus mainly on the differences between the FHD and the UHD model. Further details regarding connectivity, case, and more can be found in our extensive review of the FHD SKU.
Comparable devices are the Razer Blade 2017 with FHD display, the Skylake-powered UHD SKU of the Razer Blade 2016, and the Gigabyte Aero 14.
Display
The new display is the biggest and most important difference between the two models. As usual, we put the new panel through its paces. According to the HW-Info the manufacturer of the panel with a model number BEO0743, is unknown. The Blade’s FHD panel is made by LG.
| |||||||||||||||||||||||||
Brightness Distribution: 91 %
Center on Battery: 413 cd/m²
Contrast: 1455:1 (Black: 0.29 cd/m²)
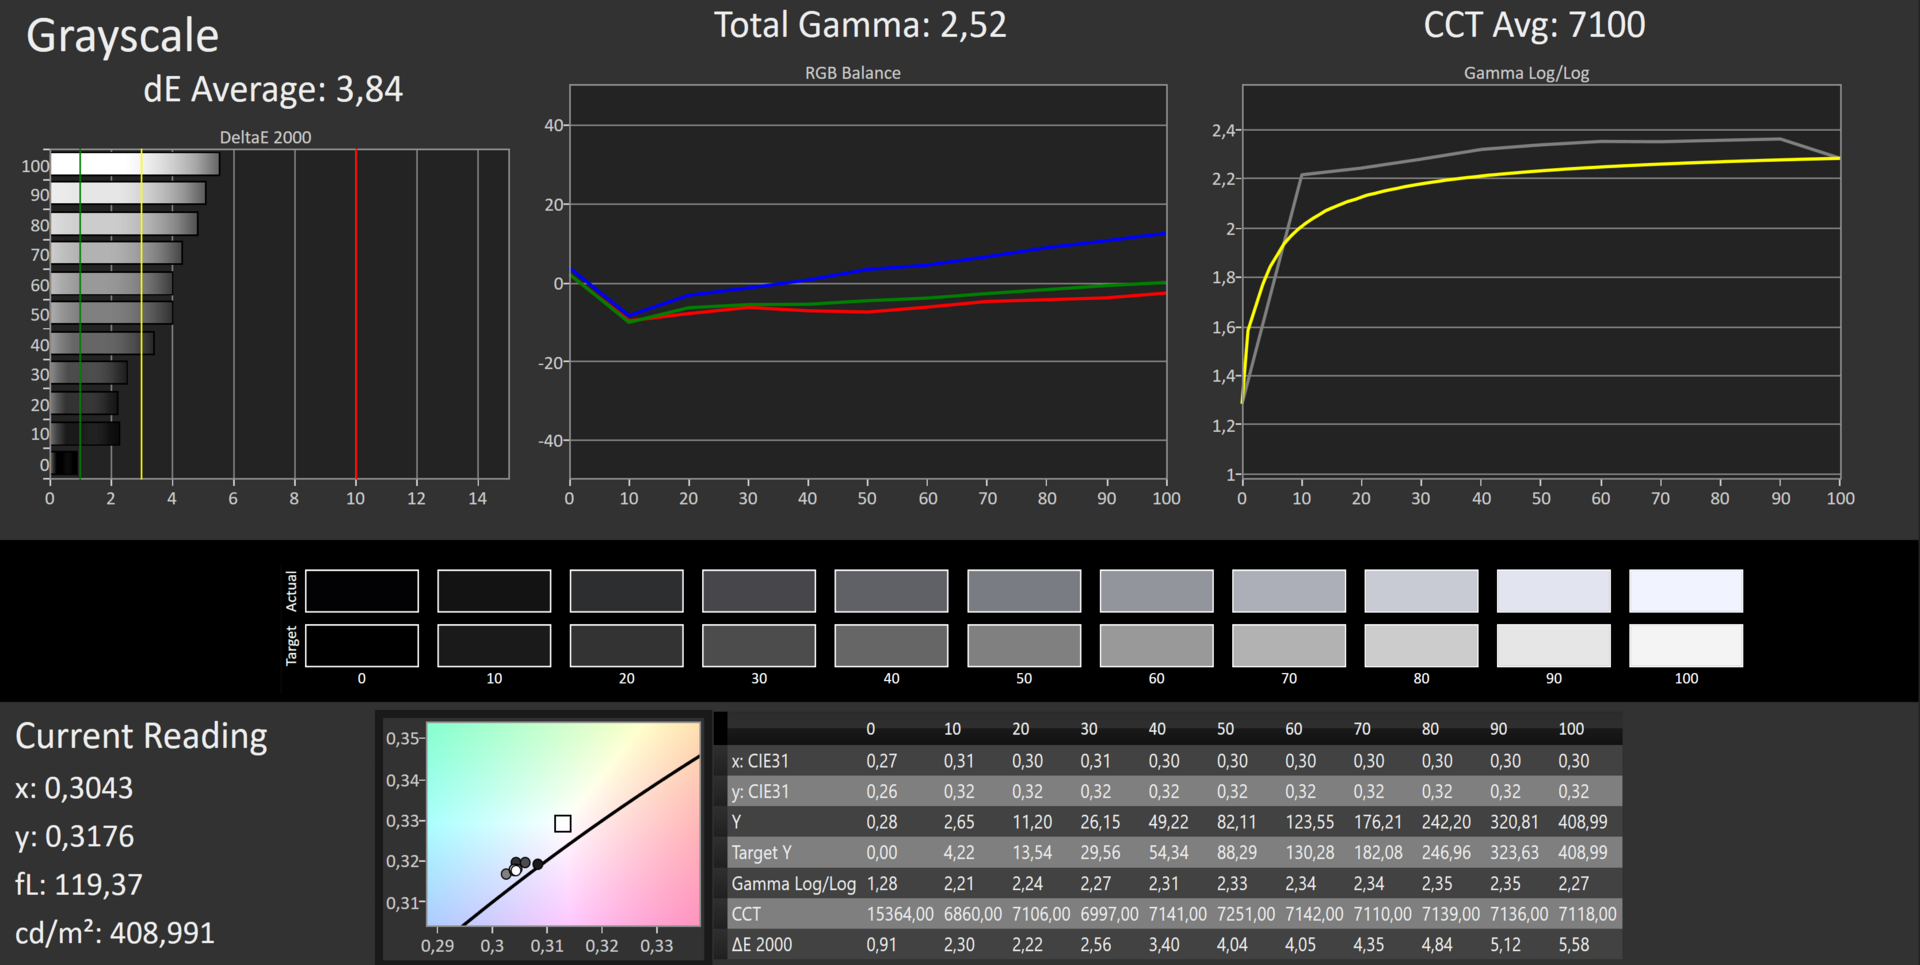
ΔE ColorChecker Calman: 3.06 | ∀{0.5-29.43 Ø4.73}
ΔE Greyscale Calman: 3.84 | ∀{0.09-98 Ø4.97}
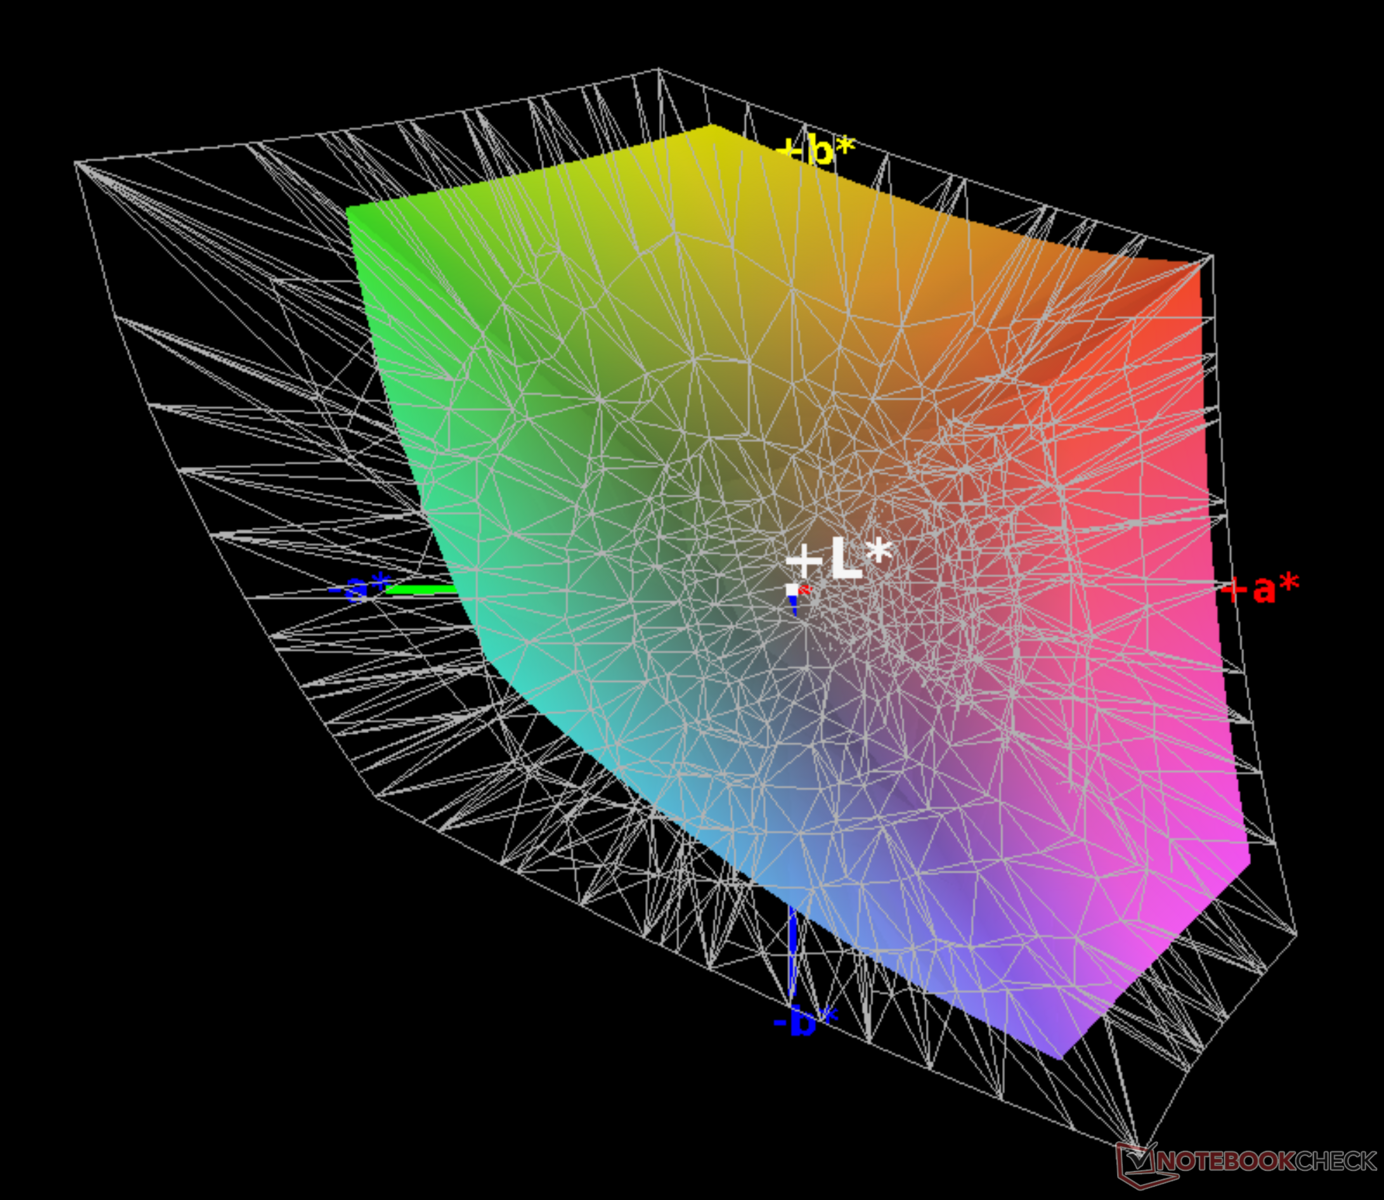
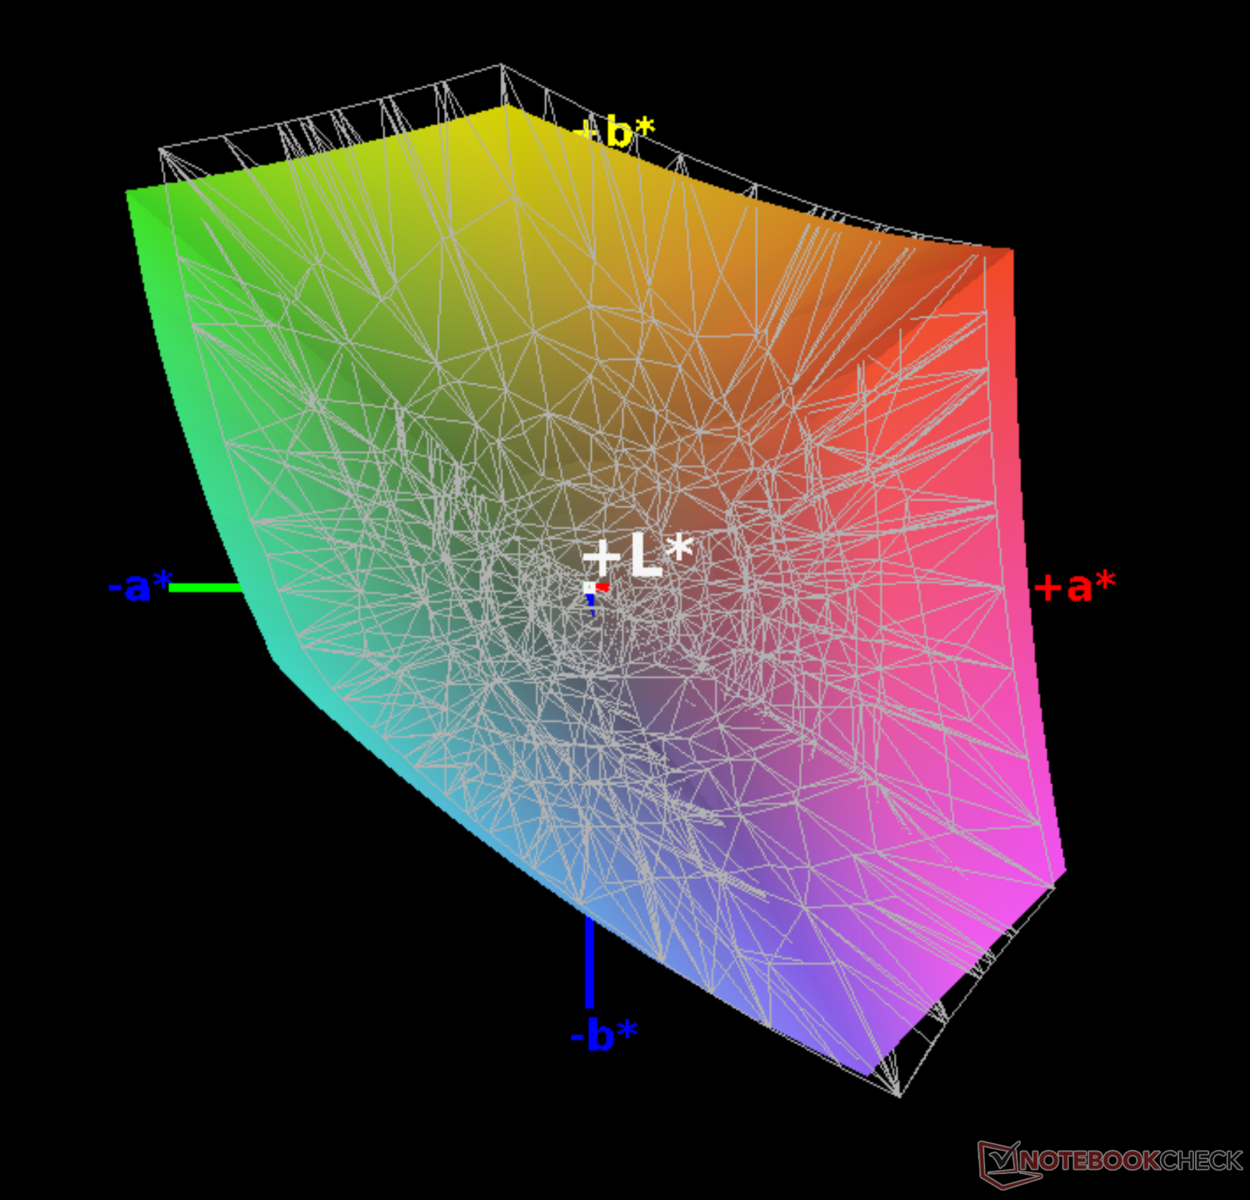
95% sRGB (Argyll 1.6.3 3D)
64% AdobeRGB 1998 (Argyll 1.6.3 3D)
69% AdobeRGB 1998 (Argyll 3D)
94.6% sRGB (Argyll 3D)
67.8% Display P3 (Argyll 3D)
Gamma: 2.52
CCT: 7100 K
| Razer Blade (2017) UHD BEO0743, IPS, 3840x2160, 14" | Razer Blade (2017) LP140WF3-SPD1, IPS, 1920x1080, 14" | Razer Blade (2016) Sharp LQ140Z1JW01 (SHP1401), IGZO, 3200x1800, 14" | Gigabyte Aero 14 LG Philips LP140QH1-SPF1 (LGD049A), IPS, 2560x1440, 14" | Apple MacBook Pro 15 2017 (2.9 GHz, 560) 2880x1800, 15.4" | |
|---|---|---|---|---|---|
| Screen | -23% | 10% | -24% | 20% | |
| Brightness middle (cd/m²) | 422 | 272 -36% | 328 -22% | 290 -31% | 534 27% |
| Brightness (cd/m²) | 402 | 277 -31% | 328 -18% | 257 -36% | 502 25% |
| Brightness Distribution (%) | 91 | 84 -8% | 69 -24% | 79 -13% | 86 -5% |
| Black Level * (cd/m²) | 0.29 | 0.26 10% | 0.22 24% | 0.3 -3% | 0.31 -7% |
| Contrast (:1) | 1455 | 1046 -28% | 1491 2% | 967 -34% | 1723 18% |
| Colorchecker dE 2000 * | 3.06 | 4.59 -50% | 1.91 38% | 4.59 -50% | 1.8 41% |
| Colorchecker dE 2000 max. * | 5.86 | 8.49 -45% | 3.23 45% | 8.68 -48% | 3.8 35% |
| Greyscale dE 2000 * | 3.84 | 4.28 -11% | 1.69 56% | 4.32 -13% | 2.4 37% |
| Gamma | 2.52 87% | 2.23 99% | 2.3 96% | 2.25 98% | 2.27 97% |
| CCT | 7100 92% | 6848 95% | 6418 101% | 7320 89% | 6563 99% |
| Color Space (Percent of AdobeRGB 1998) (%) | 64 | 55 -14% | 63 -2% | 59 -8% | 77.92 22% |
| Color Space (Percent of sRGB) (%) | 95 | 83 -13% | 97 2% | 92 -3% | 99.94 5% |
* ... smaller is better
Response times are somewhat long and not really suitable for fast-paced gaming. In addition, the display utilizes PWM for brightness regulation, which some users will notice as constant flickering at a very low 200 Hz. As such, it is significantly below average.
Display Response Times
| ↔ Response Time Black to White | ||
|---|---|---|
| 32 ms ... rise ↗ and fall ↘ combined | ↗ 19 ms rise | 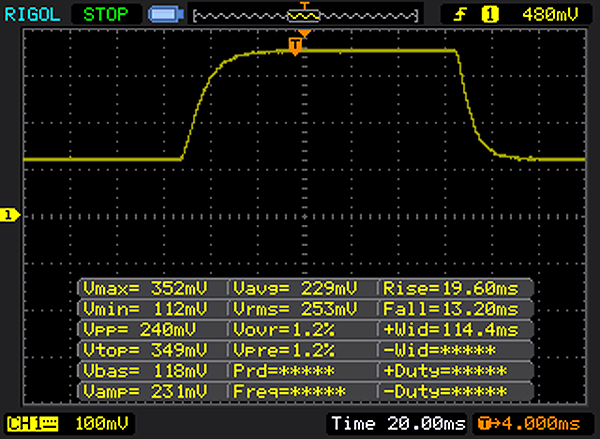 |
| ↘ 13 ms fall | ||
| The screen shows slow response rates in our tests and will be unsatisfactory for gamers. In comparison, all tested devices range from 0.1 (minimum) to 240 (maximum) ms. » 86 % of all devices are better. This means that the measured response time is worse than the average of all tested devices (19.9 ms). | ||
| ↔ Response Time 50% Grey to 80% Grey | ||
| 51 ms ... rise ↗ and fall ↘ combined | ↗ 25 ms rise | 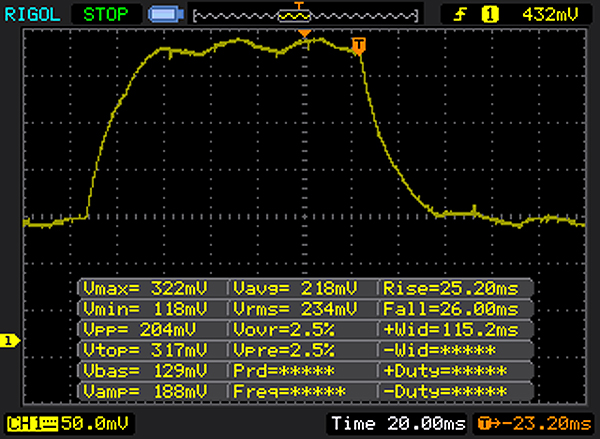 |
| ↘ 26 ms fall | ||
| The screen shows slow response rates in our tests and will be unsatisfactory for gamers. In comparison, all tested devices range from 0.165 (minimum) to 636 (maximum) ms. » 87 % of all devices are better. This means that the measured response time is worse than the average of all tested devices (31.1 ms). | ||
Screen Flickering / PWM (Pulse-Width Modulation)
| Screen flickering / PWM detected | 200 Hz | ≤ 90 % brightness setting | 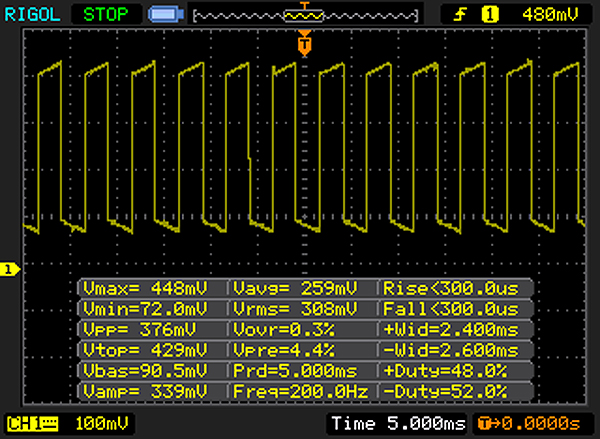 |
The display backlight flickers at 200 Hz (worst case, e.g., utilizing PWM) Flickering detected at a brightness setting of 90 % and below. There should be no flickering or PWM above this brightness setting. The frequency of 200 Hz is relatively low, so sensitive users will likely notice flickering and experience eyestrain at the stated brightness setting and below. In comparison: 52 % of all tested devices do not use PWM to dim the display. If PWM was detected, an average of 7798 (minimum: 5 - maximum: 343500) Hz was measured. | |||
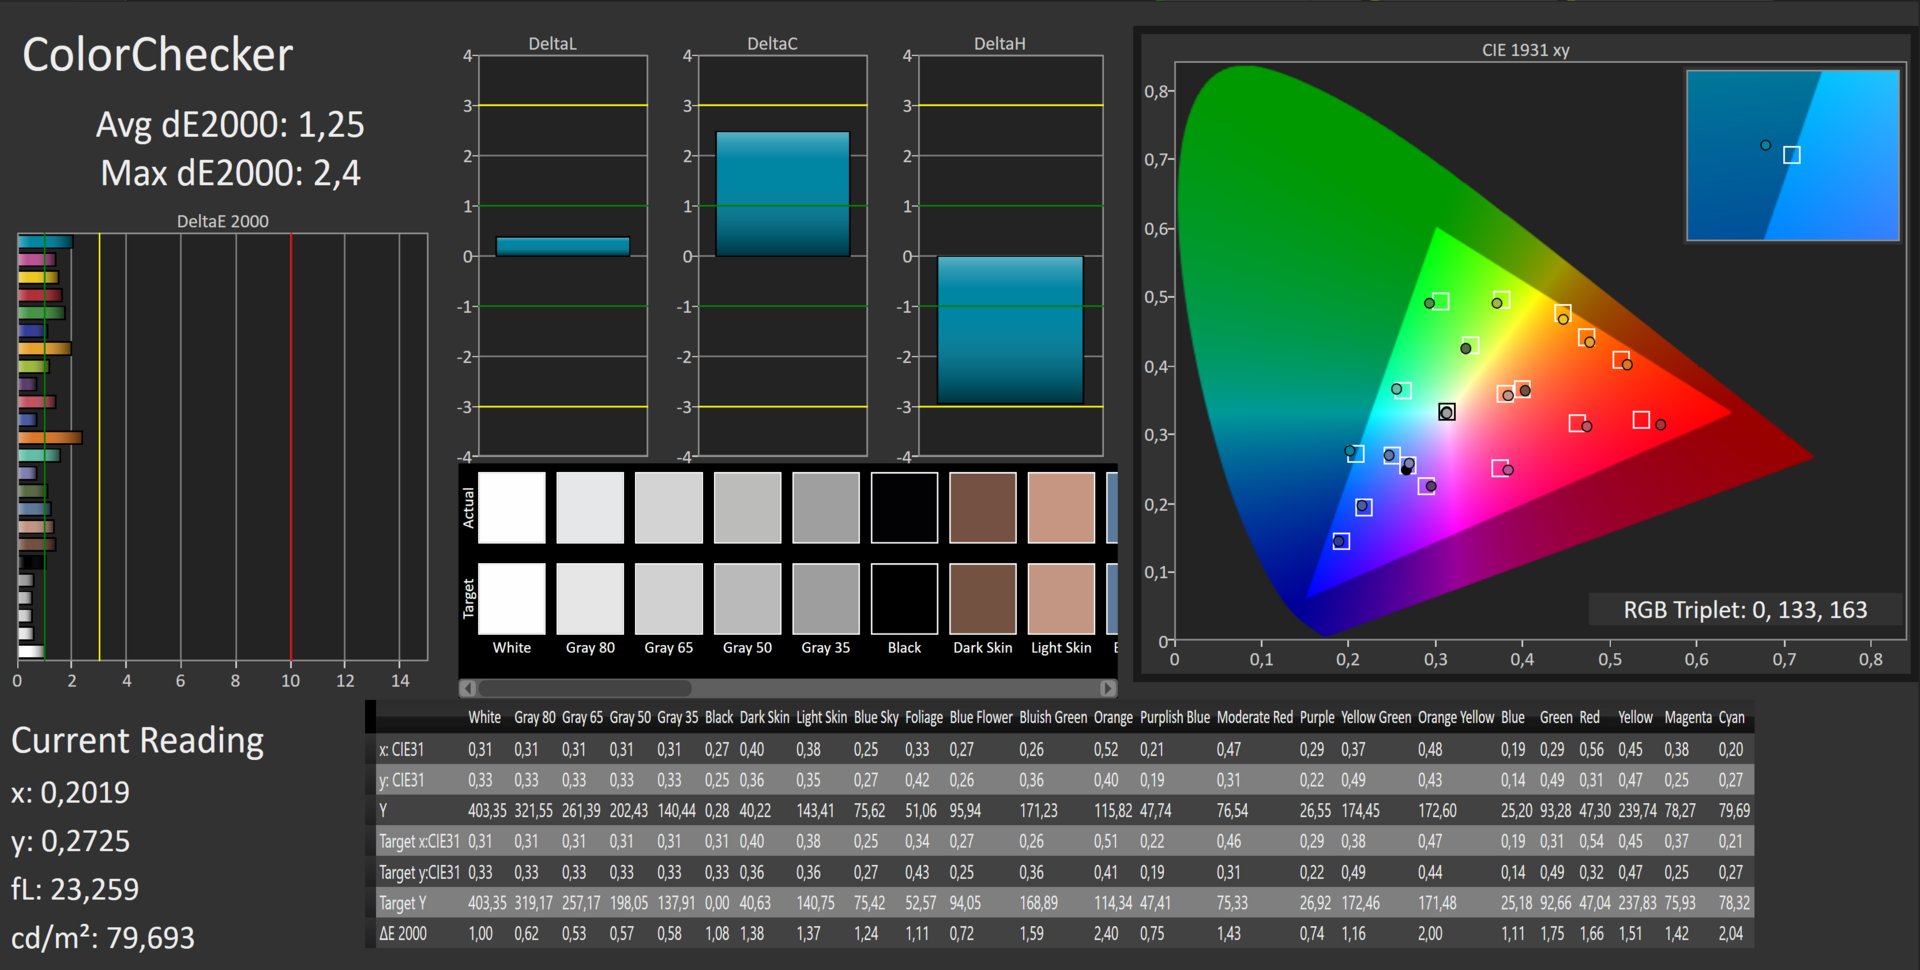
When looking at our CalMAN measurements, the display turned out to be quite decent indeed. DeltaE deviation out of the box was at a very decent 3 and therefore exactly at our threshold that separates a very good from a good display. This was further lowered to 1.25 through calibration, which is on a par with the MacBook Pro. That said, the 2016 UHD SKU was slightly better out of the box. On the other hand, the FHD model was around 20% worse. Thus, if you are planning to purchase a Razer Blade to fulfill all your multimedia needs and requirements, the UHD model would be the better choice over the FHD model. The remaining parameters (black level, contrast ratio, and brightness) were very good as well.
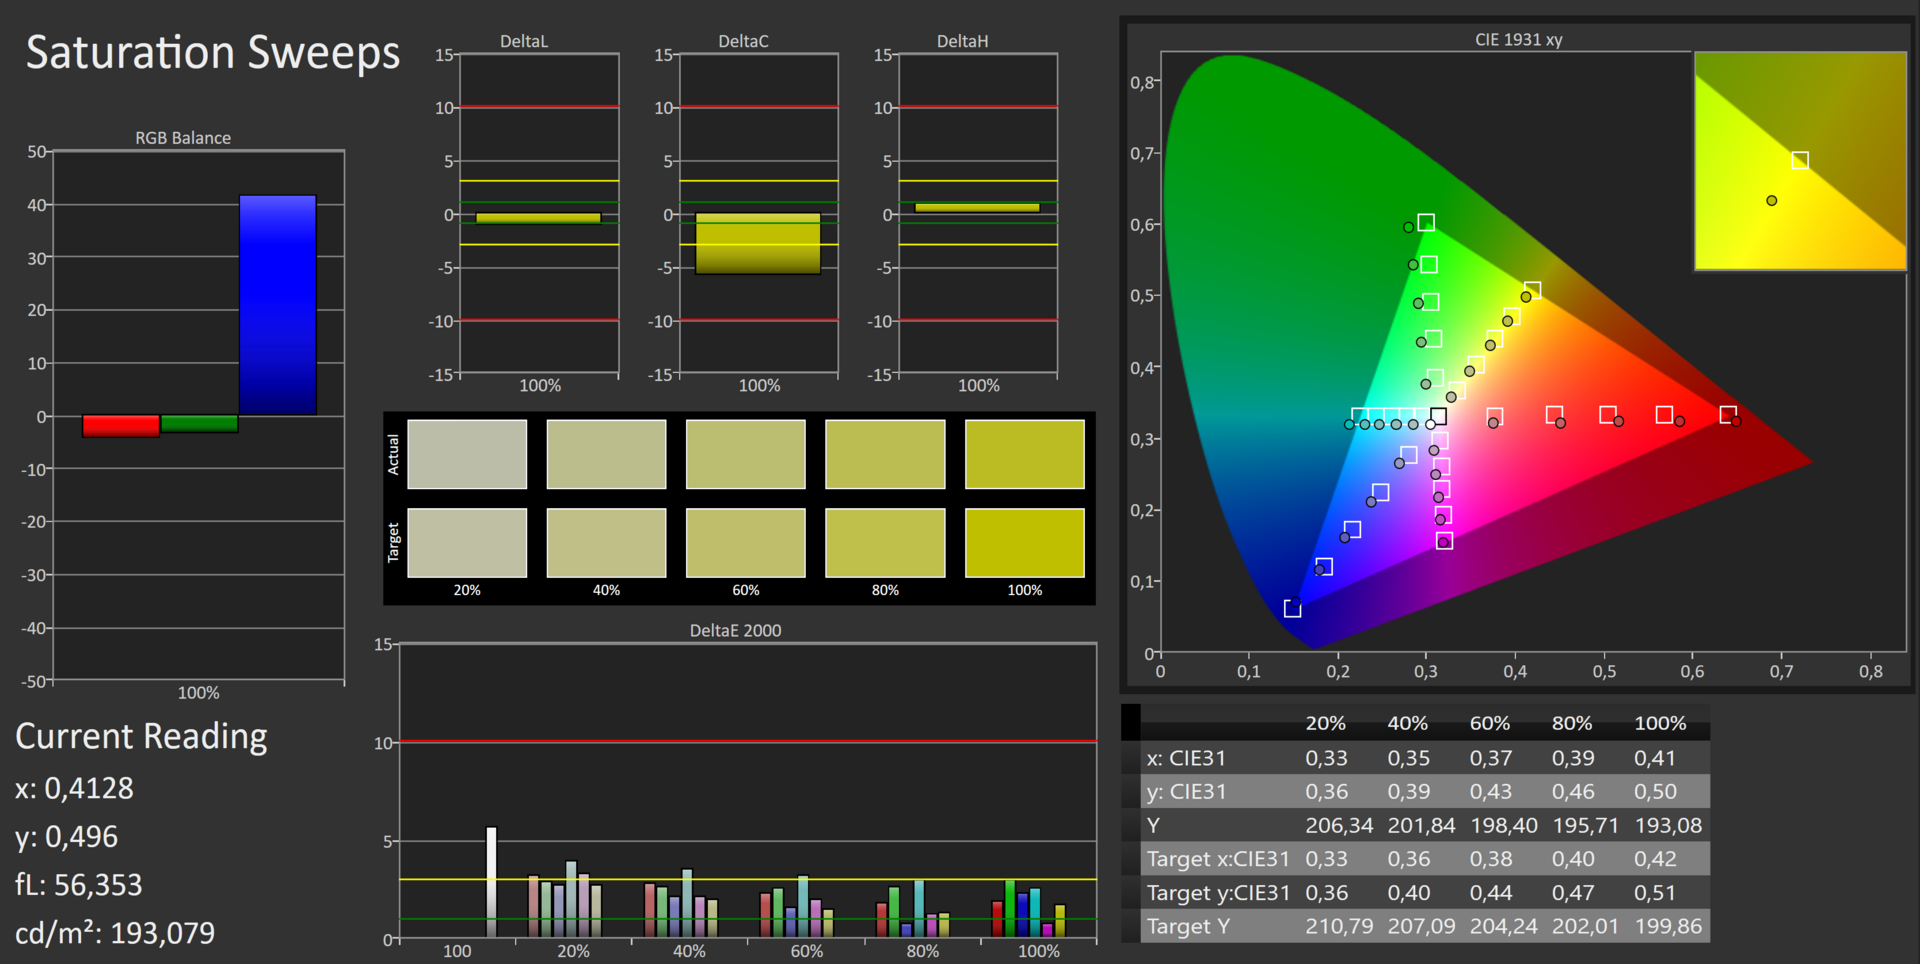
Subjectively speaking, we were unable to determine any shifts in color representation, neither prior to nor after calibration.
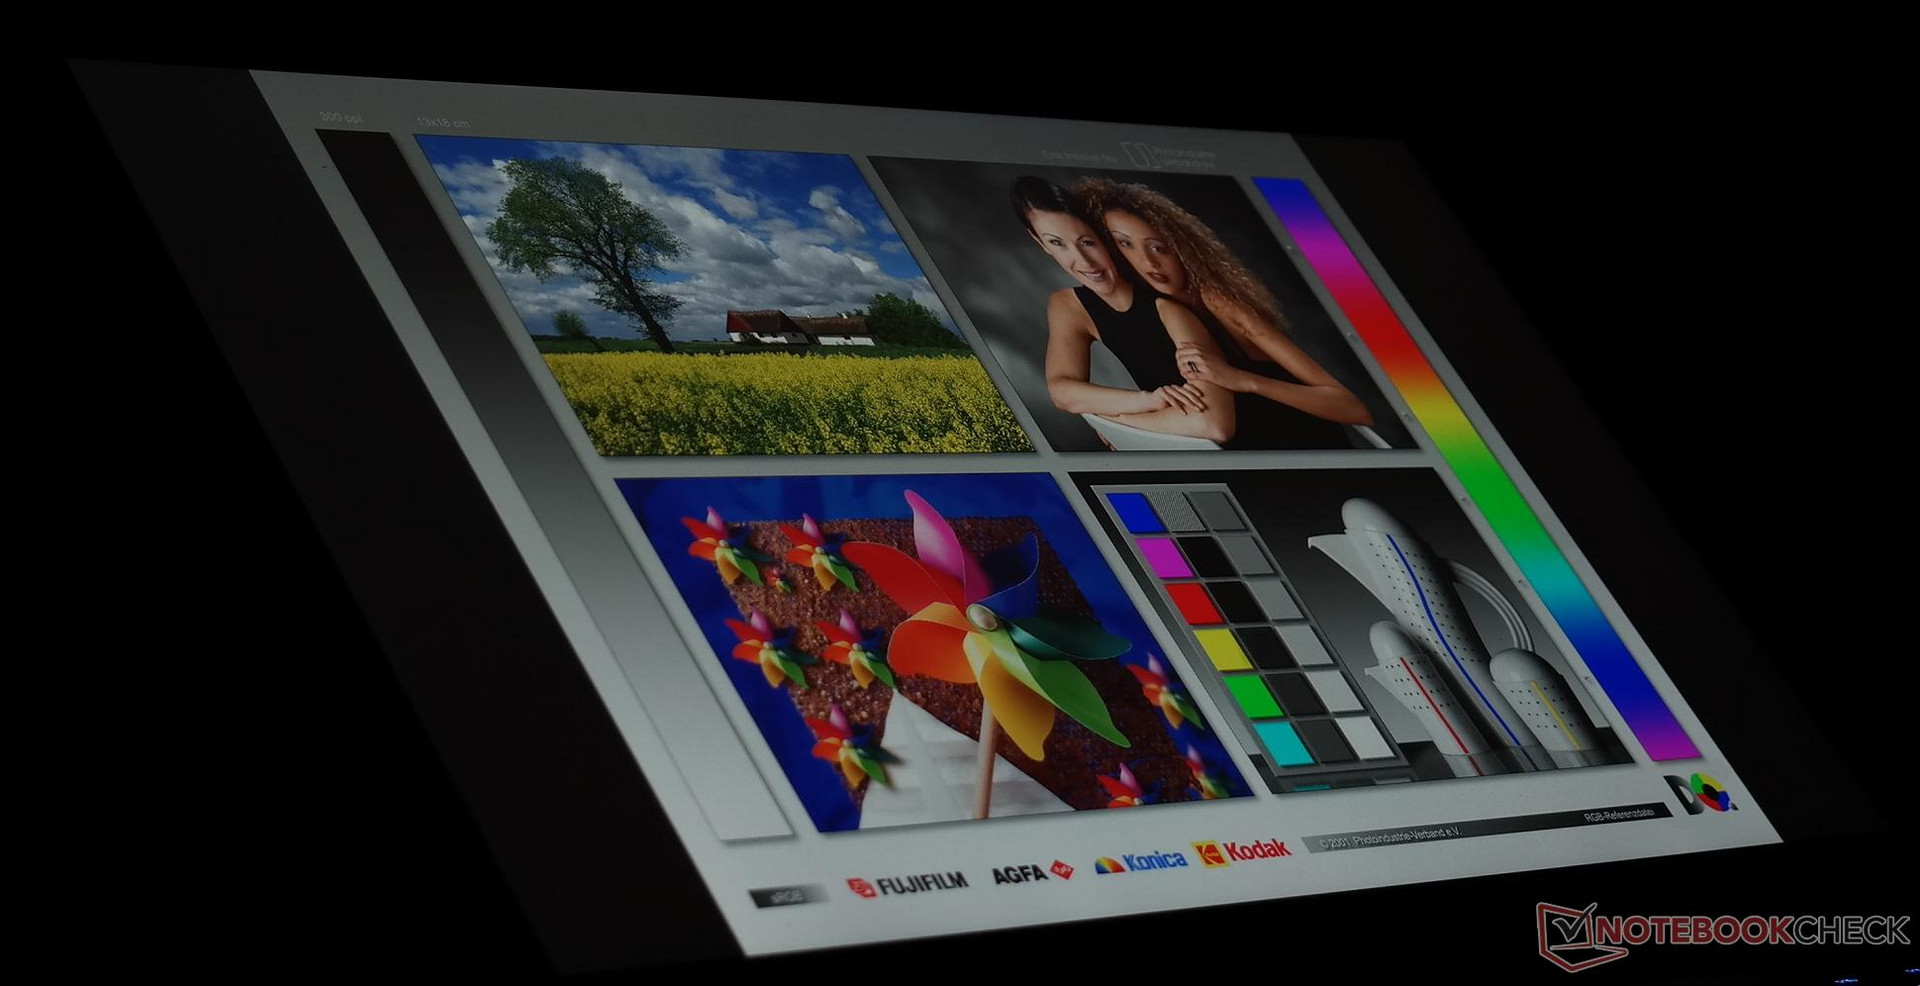
Viewing angles were superb as well. Distorted colors were almost impossible to make out with the naked eye. As can be seen along the edges, blacks tended to shift towards a grayish shade at acute angles.


The remaining parameters (black level, contrast ratio, and brightness) were very good as well. Only AdobeRGB color space coverage was somewhat meager, at no more than 65%. In return, sRGB color space coverage was at a very good 95%.
Performance
We've already hat the Razer Blade equipped with that very same CPU and GPU in review. For a detailed analysis, see this Razer Blade (FHD) review.
Processor
| Cinebench R15 | |
| CPU Single 64Bit | |
| Gigabyte Aero 14 | |
| Razer Blade (2017) | |
| Razer Blade (2016) | |
| Razer Blade (2017) UHD | |
| CPU Multi 64Bit | |
| Razer Blade (2017) UHD | |
| Gigabyte Aero 14 | |
| Razer Blade (2017) | |
| Razer Blade (2016) | |
System Performance
| PCMark 8 | |
| Home Score Accelerated v2 | |
| Razer Blade (2017) | |
| Gigabyte Aero 14 | |
| Razer Blade (2016) | |
| Razer Blade (2017) UHD | |
| Work Score Accelerated v2 | |
| Razer Blade (2017) | |
| Gigabyte Aero 14 | |
| Razer Blade (2016) | |
| Razer Blade (2017) UHD | |
| PCMark 8 Home Score Accelerated v2 | 3415 points | |
| PCMark 8 Creative Score Accelerated v2 | 5073 points | |
| PCMark 8 Work Score Accelerated v2 | 4153 points | |
Help | ||
Storage Devices
| Razer Blade (2017) UHD GeForce GTX 1060 Mobile, i7-7700HQ, Samsung PM961 NVMe MZVLW512HMJP | Razer Blade (2017) GeForce GTX 1060 Mobile, i7-7700HQ, Samsung PM951 NVMe MZVLV256 | Razer Blade (2016) GeForce GTX 1060 Mobile, 6700HQ, Samsung PM951 NVMe MZVLV512 | Gigabyte Aero 14 GeForce GTX 1060 Mobile, i7-7700HQ, LiteOn CX2-8B256 | |
|---|---|---|---|---|
| CrystalDiskMark 5.2 / 6 | ||||
| Write 4K (MB/s) | 151 | |||
| Read 4K (MB/s) | 44 | |||
| Write Seq (MB/s) | 1065 | |||
| Read Seq (MB/s) | 1048 | |||
| Write 4K Q32T1 (MB/s) | 469 | |||
| Read 4K Q32T1 (MB/s) | 556 | |||
| Write Seq Q32T1 (MB/s) | 1593 | |||
| Read Seq Q32T1 (MB/s) | 3242 |

Graphics Card
| 3DMark 11 - 1280x720 Performance GPU | |
| Gigabyte Aero 14 | |
| Razer Blade (2016) | |
| Razer Blade (2017) | |
| 3DMark Ice Storm Standard Score | 35841 points | |
| 3DMark Cloud Gate Standard Score | 21889 points | |
| 3DMark Fire Strike Score | 9247 points | |
| 3DMark Fire Strike Extreme Score | 4937 points | |
| 3DMark Time Spy Score | 3538 points | |
Help | ||
Emissions & Energy
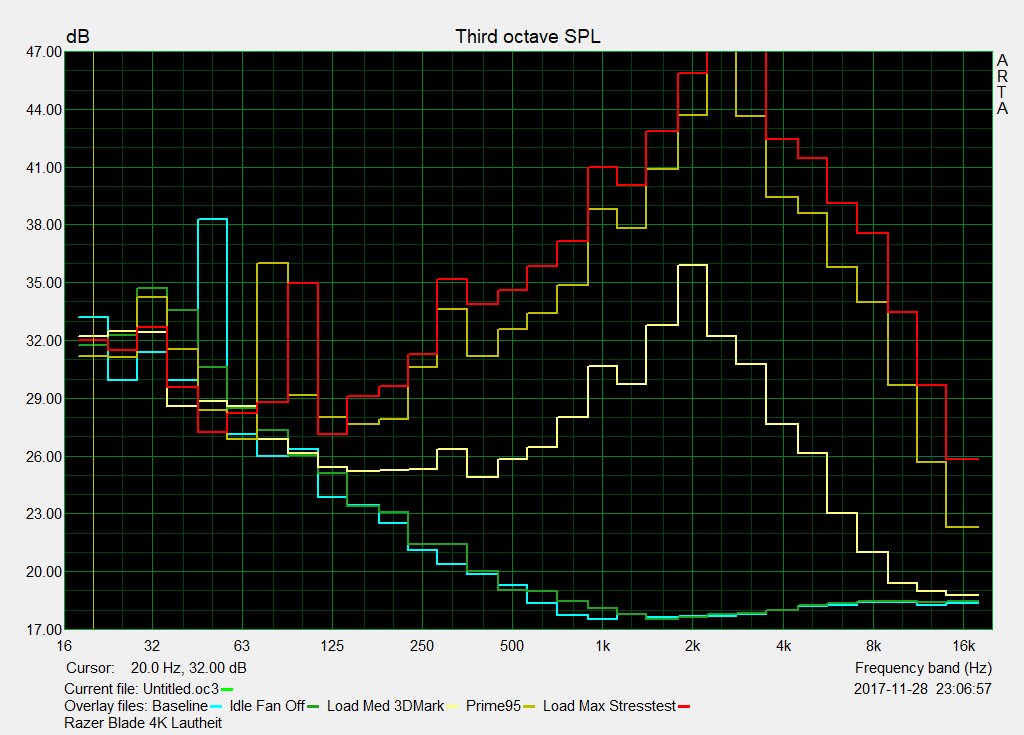
As with the FHD model, noise emissions are a mixed bag with the UHD variant as well. When idle or under low load such as browsing the web or using office productivity suites, the fans are either completely off or barely audible. Under load, however, this changes drastically, and the Razer Blade turns into a 55 dB(A) loud beast. This sound level is very uncomfortable and a massive killjoy in the long run.
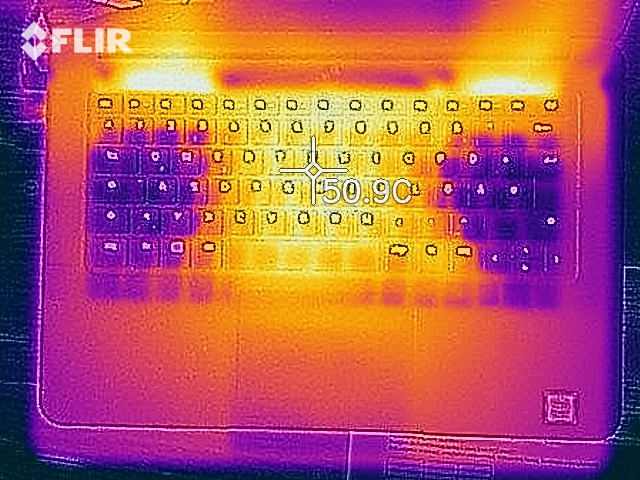
Temperature
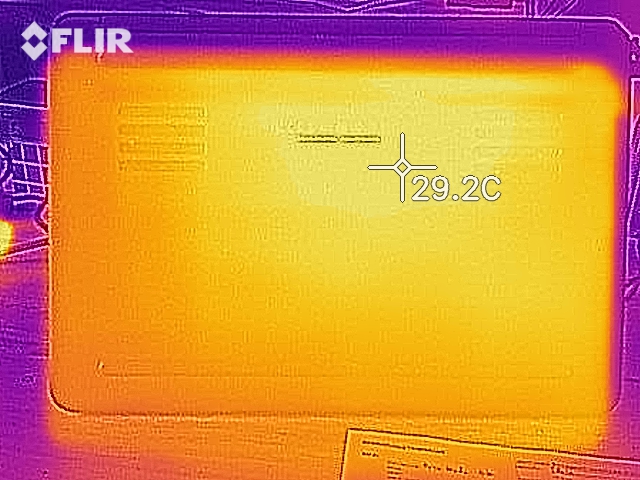
(-) The maximum temperature on the upper side is 50.2 °C / 122 F, compared to the average of 40.4 °C / 105 F, ranging from 21.2 to 68.8 °C for the class Gaming.
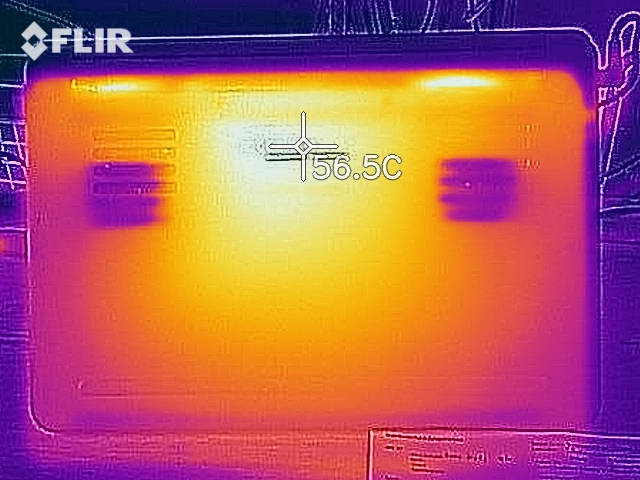
(-) The bottom heats up to a maximum of 51.9 °C / 125 F, compared to the average of 43.2 °C / 110 F
(+) In idle usage, the average temperature for the upper side is 24.4 °C / 76 F, compared to the device average of 33.9 °C / 93 F.
(+) The palmrests and touchpad are reaching skin temperature as a maximum (35 °C / 95 F) and are therefore not hot.
(-) The average temperature of the palmrest area of similar devices was 28.8 °C / 83.8 F (-6.2 °C / -11.2 F).
The same must be said about the temperatures. As long as the load is low enough, the Razer Blade remains cool to the touch. As soon as the device is put under high load, temperatures can rise to 50 °C (~122 °F) and more. The FHD variant remained below the 50 °C (~122 °F) threshold - the high-resolution display takes its toll.
At least the hotspots are located in the center of the unit. The sides (for example around the W-A-S-D block on the keyboard) remain somewhat cooler and max out at around body temperature.

Speakers
Razer Blade (2017) UHD audio analysis
(-) | not very loud speakers (69 dB)
Bass 100 - 315 Hz
(±) | reduced bass - on average 11.6% lower than median
(±) | linearity of bass is average (13.1% delta to prev. frequency)
Mids 400 - 2000 Hz
(+) | balanced mids - only 3.6% away from median
(+) | mids are linear (6.1% delta to prev. frequency)
Highs 2 - 16 kHz
(+) | balanced highs - only 4.7% away from median
(±) | linearity of highs is average (7.4% delta to prev. frequency)
Overall 100 - 16.000 Hz
(±) | linearity of overall sound is average (18.9% difference to median)
Compared to same class
» 63% of all tested devices in this class were better, 8% similar, 29% worse
» The best had a delta of 6%, average was 18%, worst was 132%
Compared to all devices tested
» 44% of all tested devices were better, 8% similar, 48% worse
» The best had a delta of 4%, average was 24%, worst was 134%
Apple MacBook 12 (Early 2016) 1.1 GHz audio analysis
(+) | speakers can play relatively loud (83.6 dB)
Bass 100 - 315 Hz
(±) | reduced bass - on average 11.3% lower than median
(±) | linearity of bass is average (14.2% delta to prev. frequency)
Mids 400 - 2000 Hz
(+) | balanced mids - only 2.4% away from median
(+) | mids are linear (5.5% delta to prev. frequency)
Highs 2 - 16 kHz
(+) | balanced highs - only 2% away from median
(+) | highs are linear (4.5% delta to prev. frequency)
Overall 100 - 16.000 Hz
(+) | overall sound is linear (10.2% difference to median)
Compared to same class
» 7% of all tested devices in this class were better, 2% similar, 91% worse
» The best had a delta of 5%, average was 18%, worst was 53%
Compared to all devices tested
» 5% of all tested devices were better, 1% similar, 94% worse
» The best had a delta of 4%, average was 24%, worst was 134%
Frequency diagram (checkboxes selectable/deselectable!)
Power Consumption
| Off / Standby | |
| Idle | |
| Load |
|
Key:
min: | |
| Razer Blade (2017) UHD i7-7700HQ, GeForce GTX 1060 Mobile, 70 Wh | Razer Blade (2017) i7-7700HQ, GeForce GTX 1060 Mobile, 70 Wh | Razer Blade (2016) 6700HQ, GeForce GTX 1060 Mobile, 70 Wh | Gigabyte Aero 14 i7-7700HQ, GeForce GTX 1060 Mobile, 94 Wh | |
|---|---|---|---|---|
| Battery runtime | ||||
| WiFi v1.3 (h) | 5.7 | 9.1 60% | 4.1 -28% | 8.7 53% |
Pros
Cons
Verdict
In our verdict of the FHD model we have already concluded that the Razer Blade is a premium device. The case is exceptionally well-made, performance was more than decent, and battery life was at an expected level. Surely, this design would find its audience. The keyboard backlight may not be to everybody’s taste; nevertheless it remains impressive from a technical point of view. Suffice it to say that all this is also true for the high-resolution UHD model. At 4K it is well-nigh impossible to make out individual pixels on-screen and overall image and color quality were significantly improved through calibration. Unfortunately, these pros come at a price. Not only literally (the current premium for the UHD panel is $500) but also figuratively: battery life has dropped from around 9 hours to no more than 6 hours.
The Razer Blade would be the perfect Windows MacBook - were it not so loud.
And once again we are faced with the arduous task of classification. For gaming purposes, we highly recommend the FHD SKU - battery life is much better and color accuracy is not as relevant in a gaming notebook. On the other hand, the UHD SKU is much better suited for all multimedia purposes due to its higher color accuracy and representation.
Razer Blade (2017) UHD
- 12/11/2017 v6 (old)
Florian Schaar
Price comparison

