Gigabyte Aero 14K (i7-7700HQ, GTX 1050 Ti, QHD) Laptop Review

For the original German review, click here.
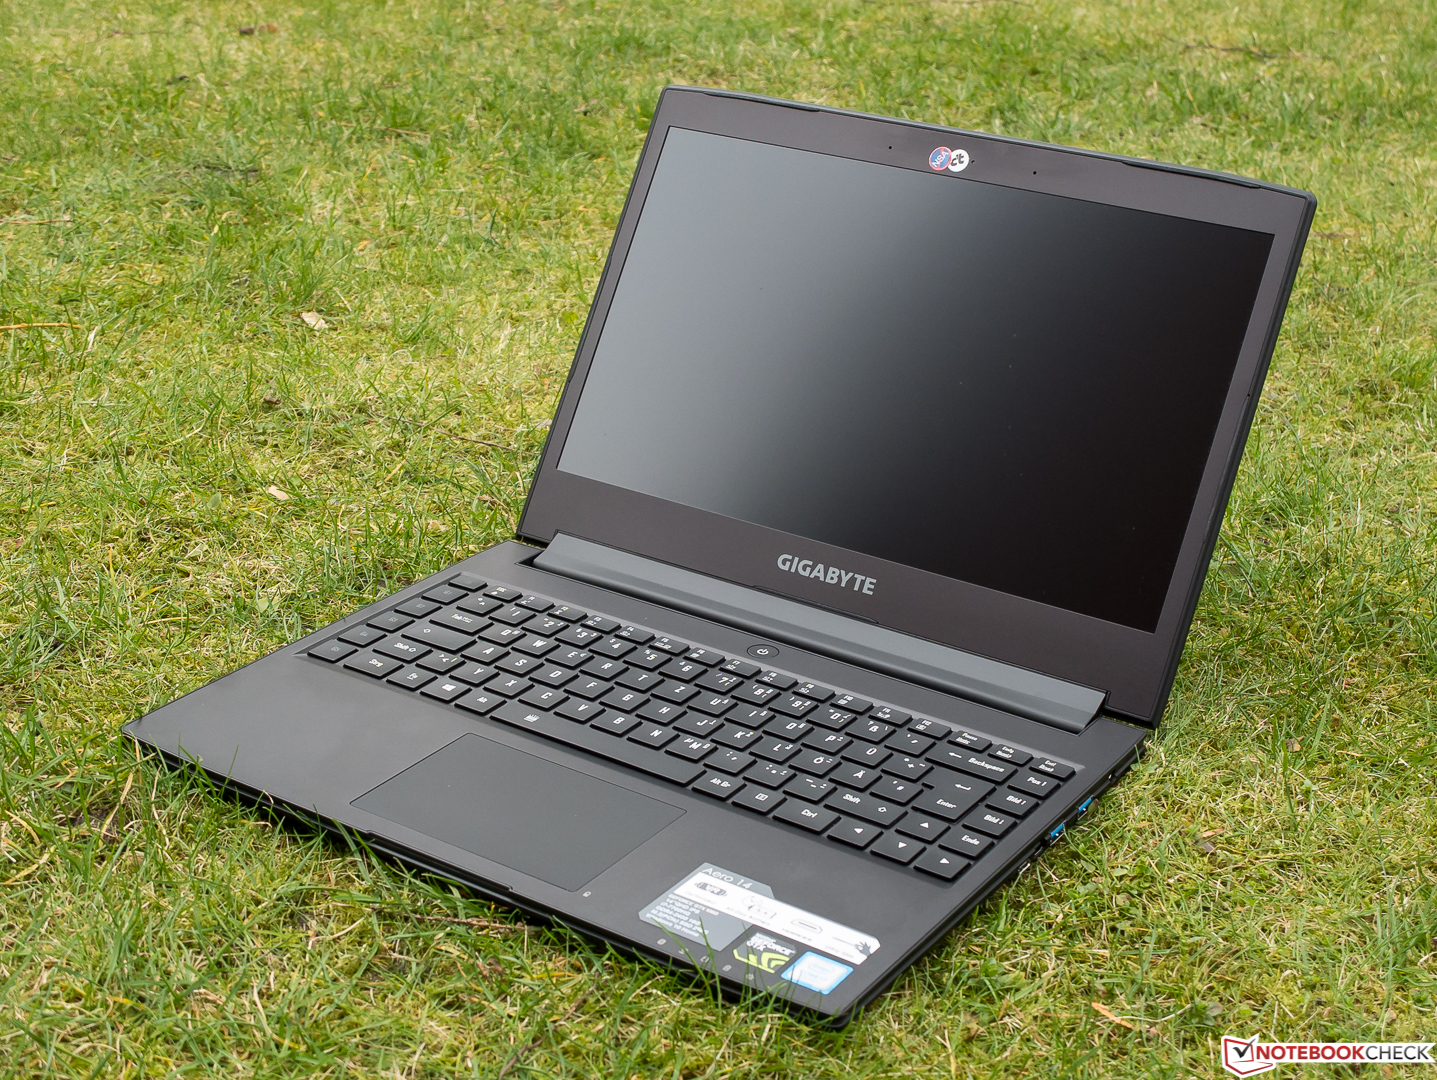
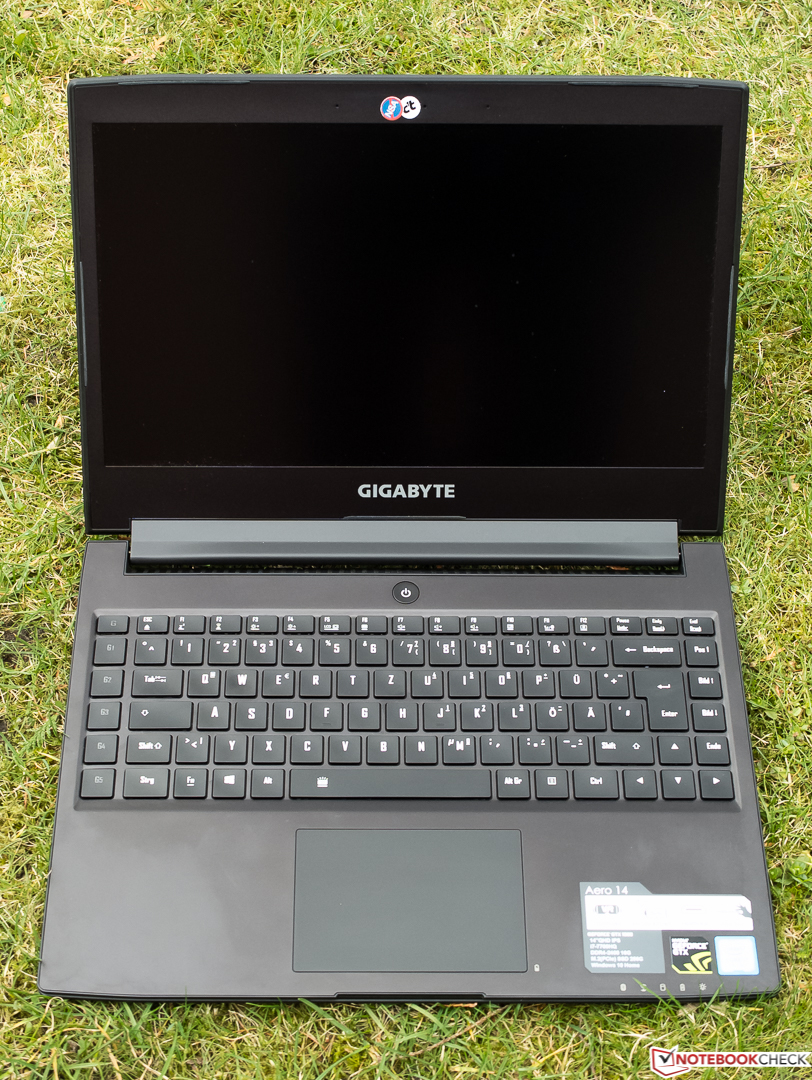
The Gigabyte Aero 14 is not new to us. A few months ago, we tested one of its available models that was equipped with a GeForce GTX 1060 graphics core. Today's test unit has a GeForce GTX 1050 Ti. We will find out what implications this weaker GPU has on the general system performance in our review. Some of the Aero 14's competitors are the Razer Blade, the Schenker XMG P407 and the MSI GS43VR 7RE.
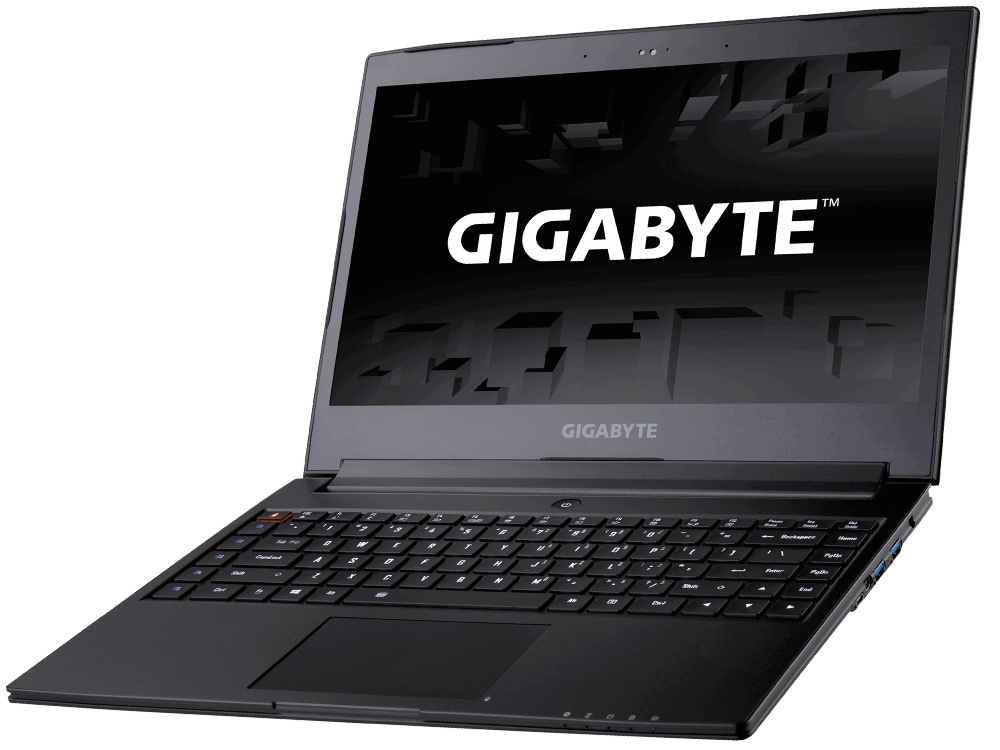
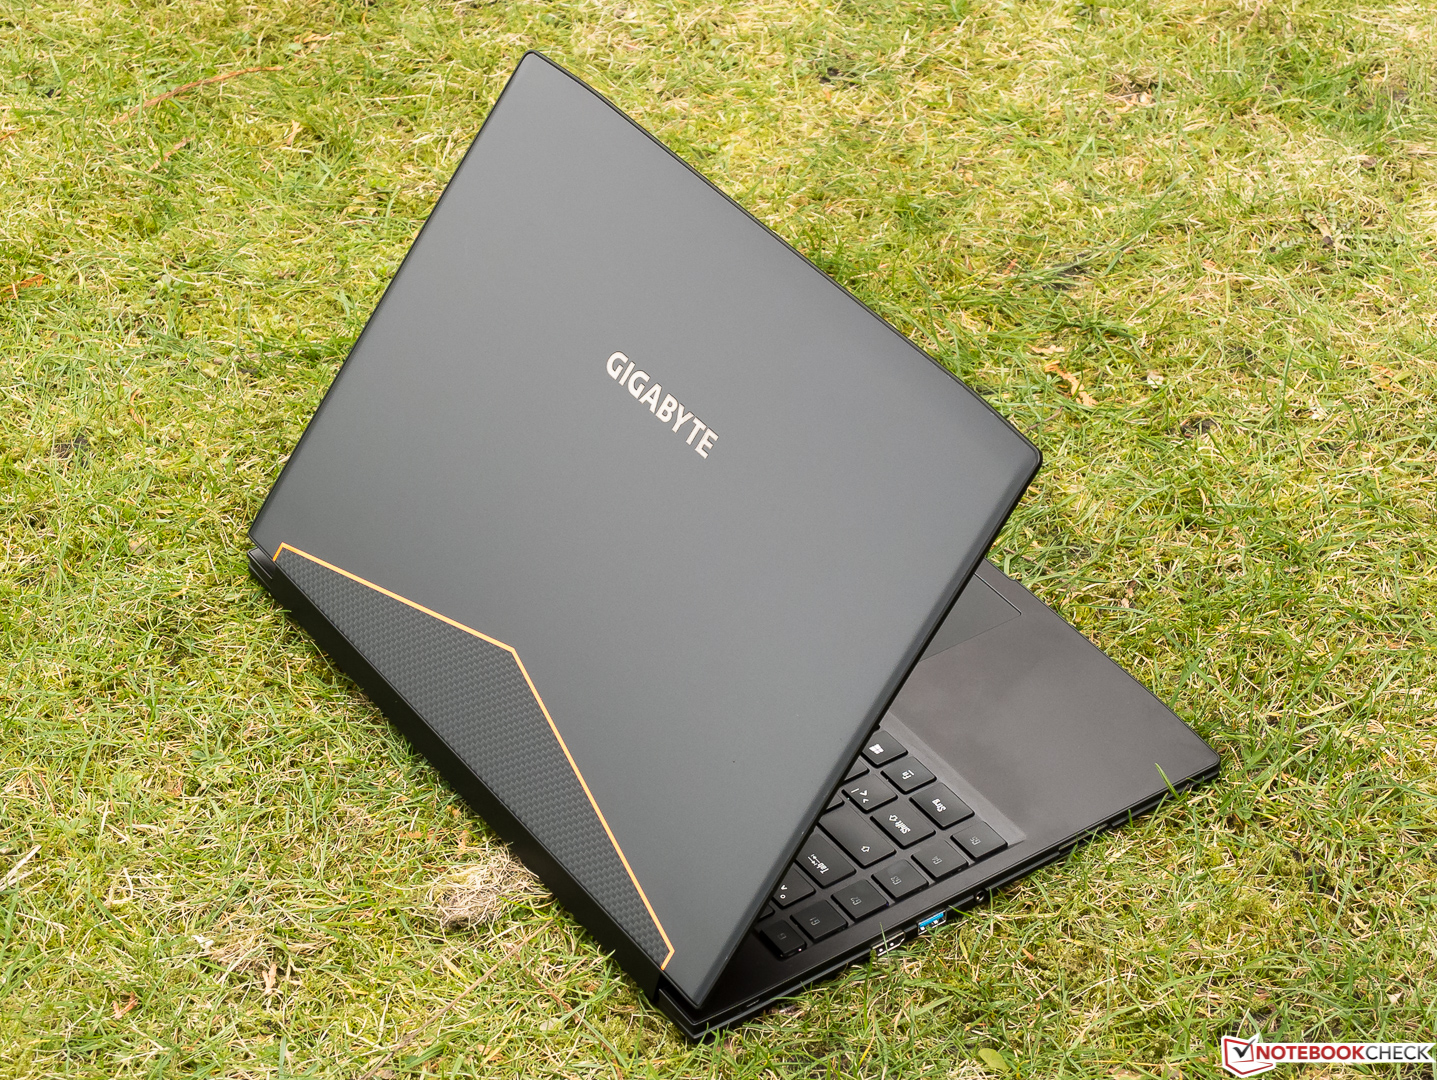
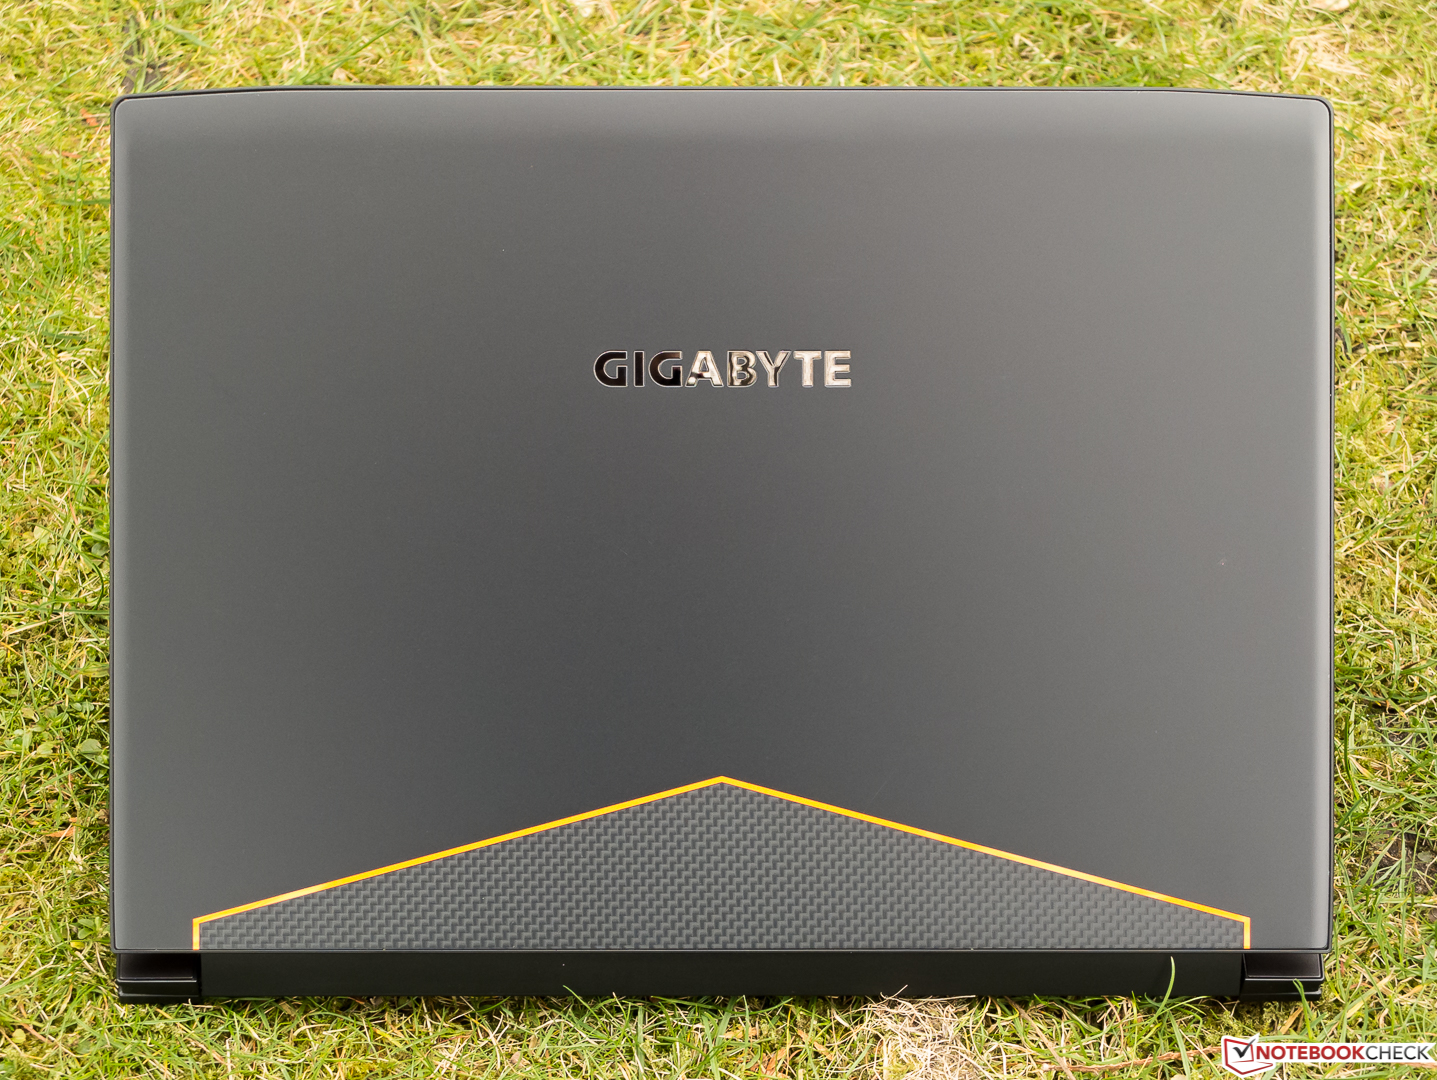
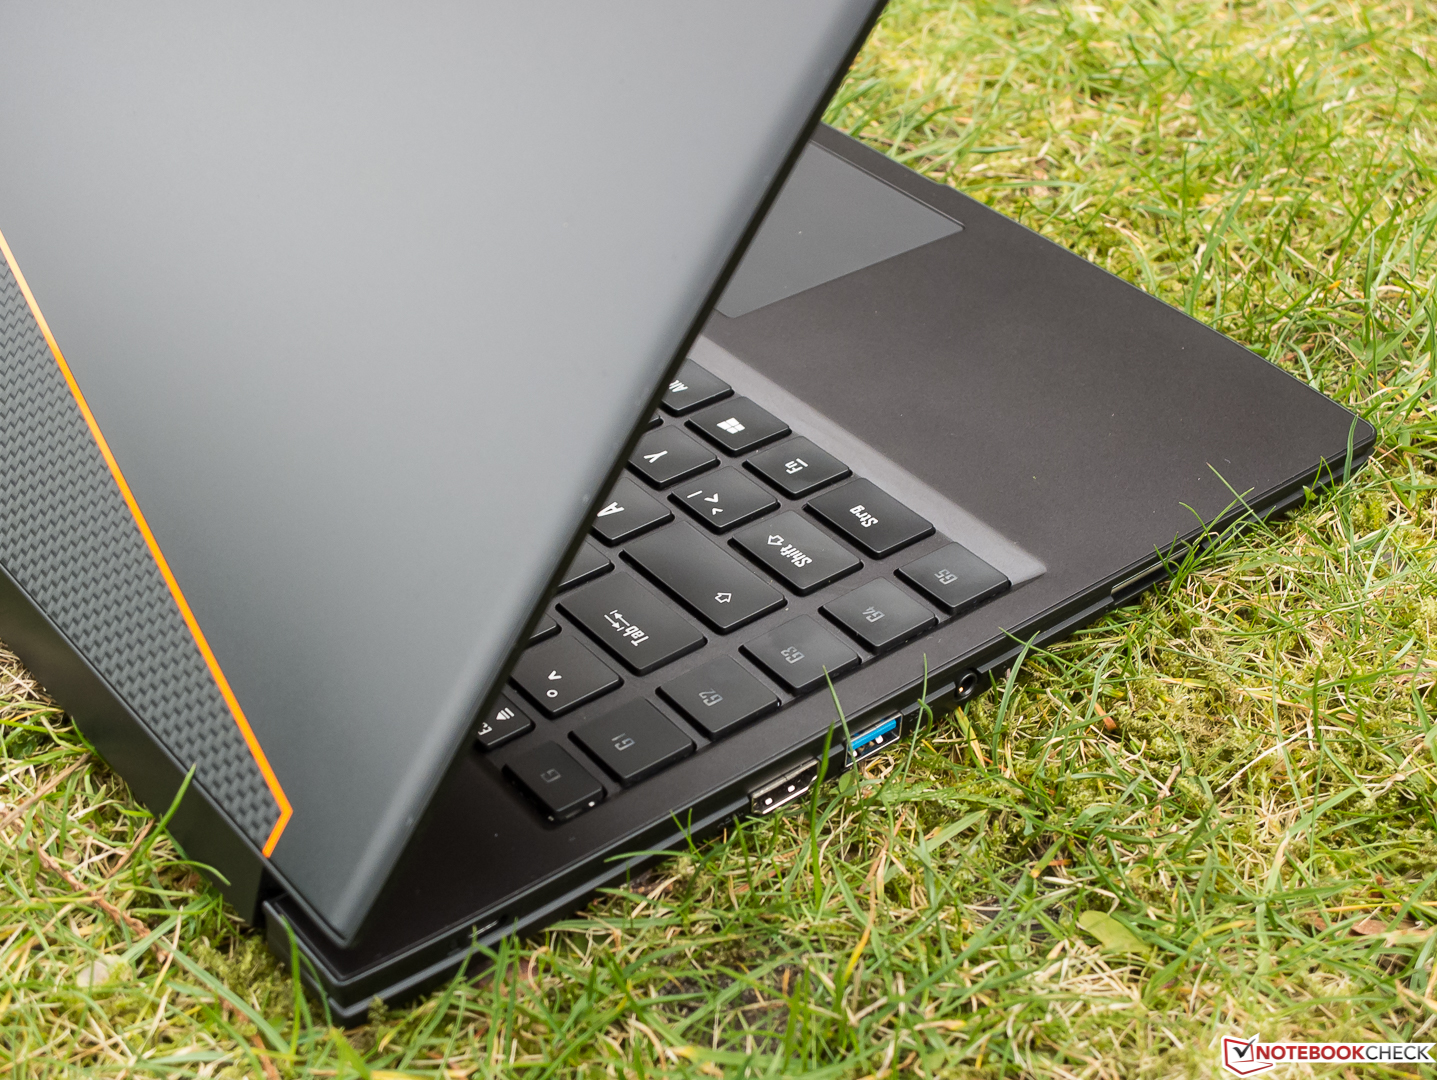
As the two Aero 14 models have the same build, we will not go into further detail about the case, connectivity, input devices, display and speakers. Please take a look at our review of the other Aero 14 model for further information on these areas.
Changes
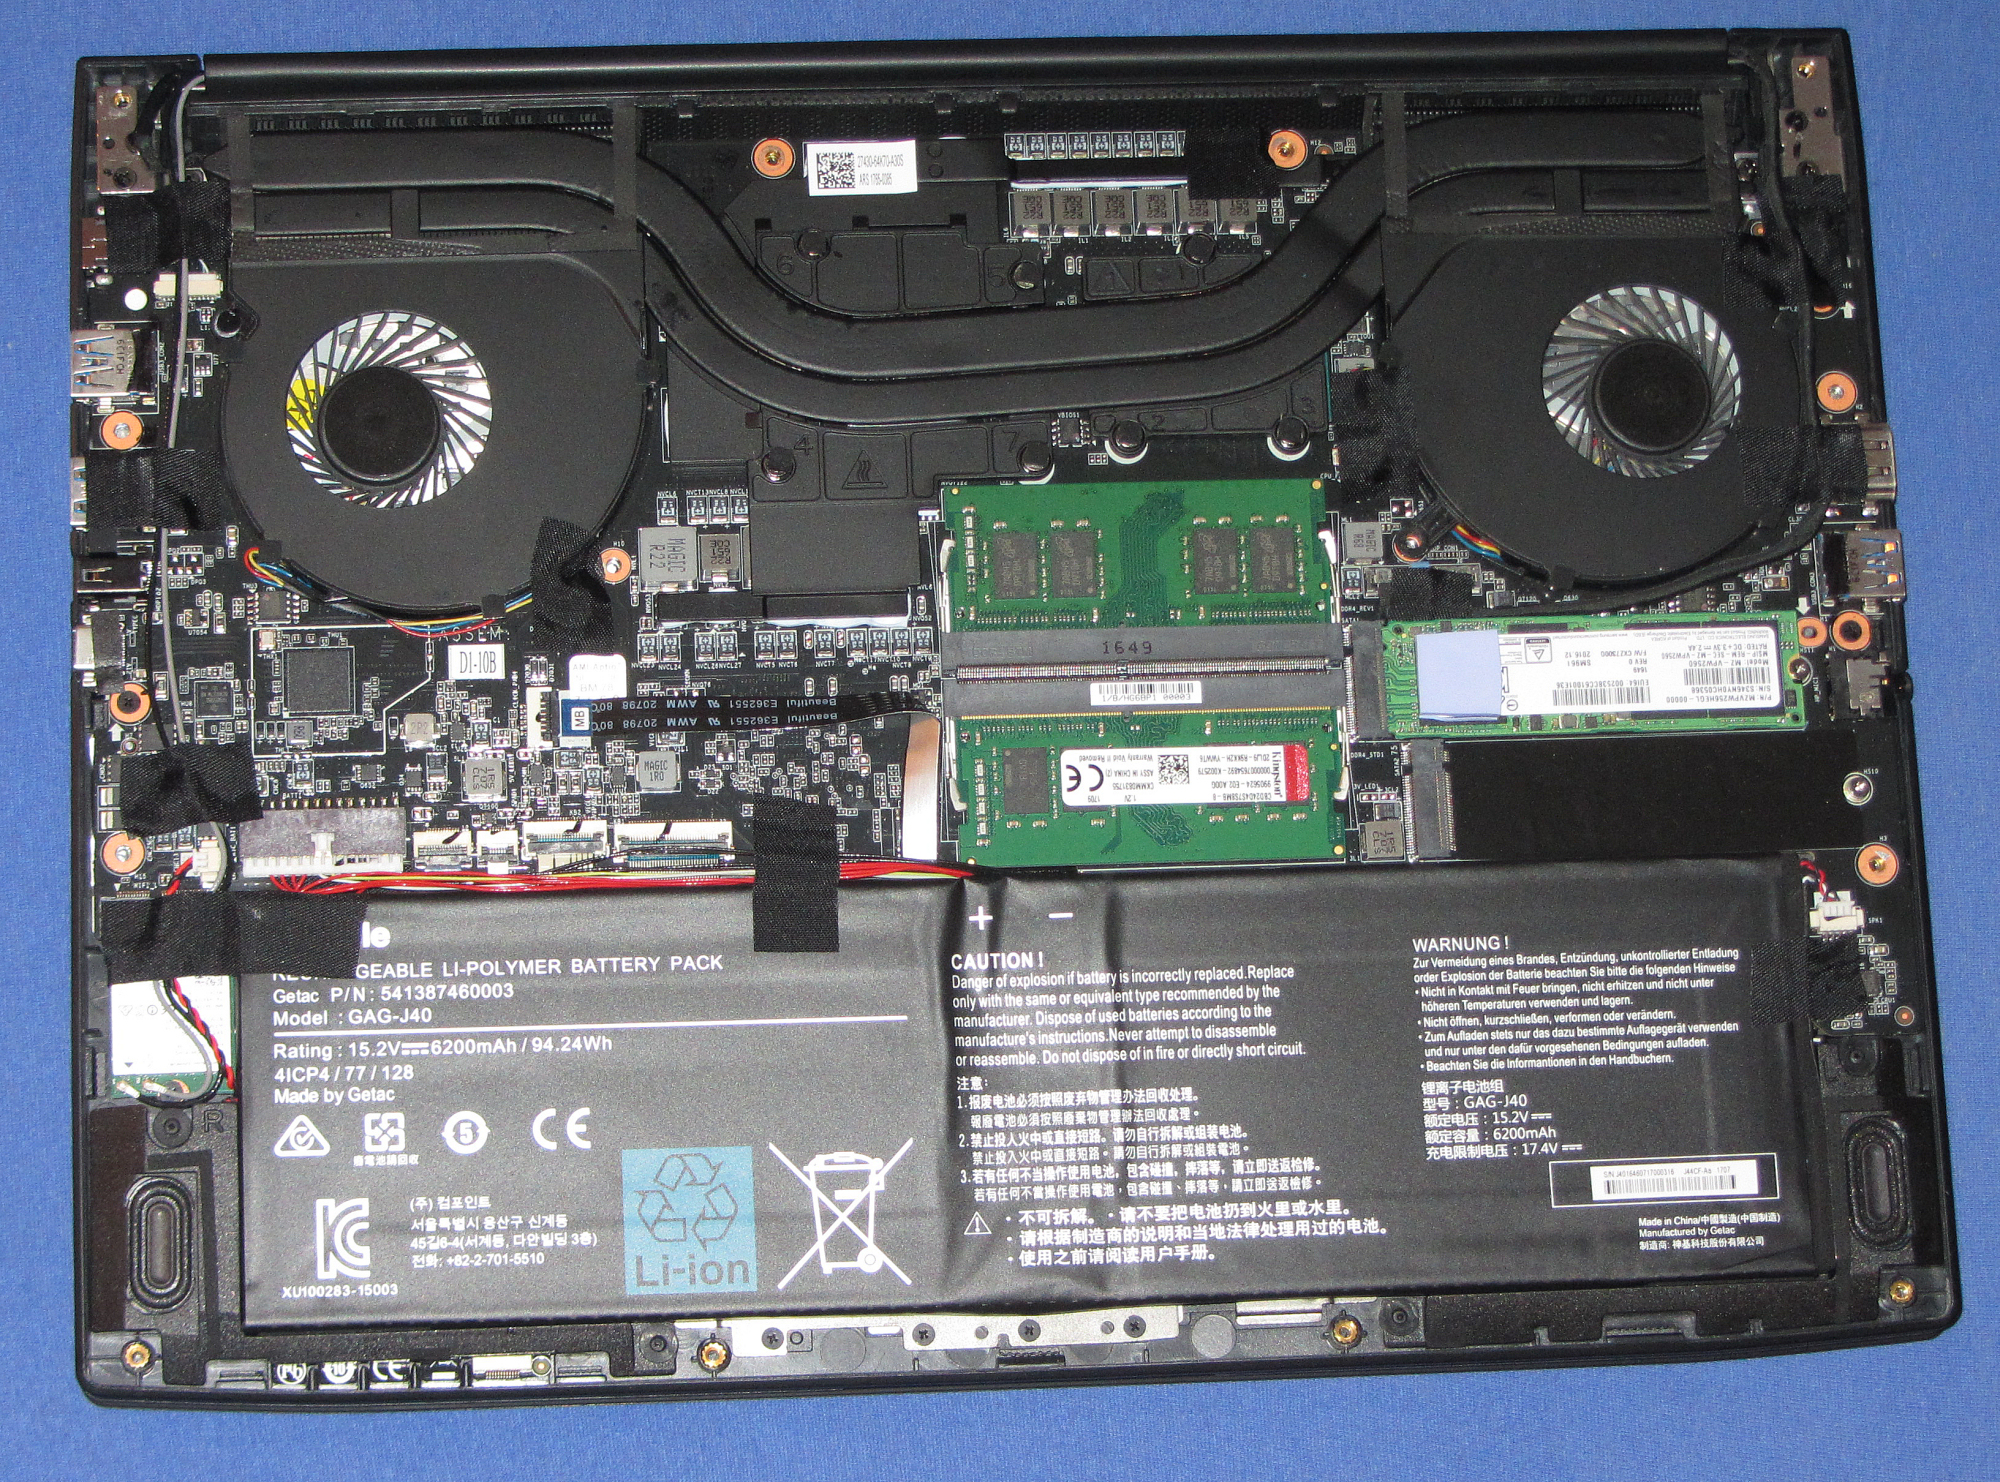
There have been some changes to the insides of the Aero 14 compared to the model that we have already tested. For example, our current test unit also offers a second M.2 drive bay, which also has a PCIe 3.0 x4 interface.
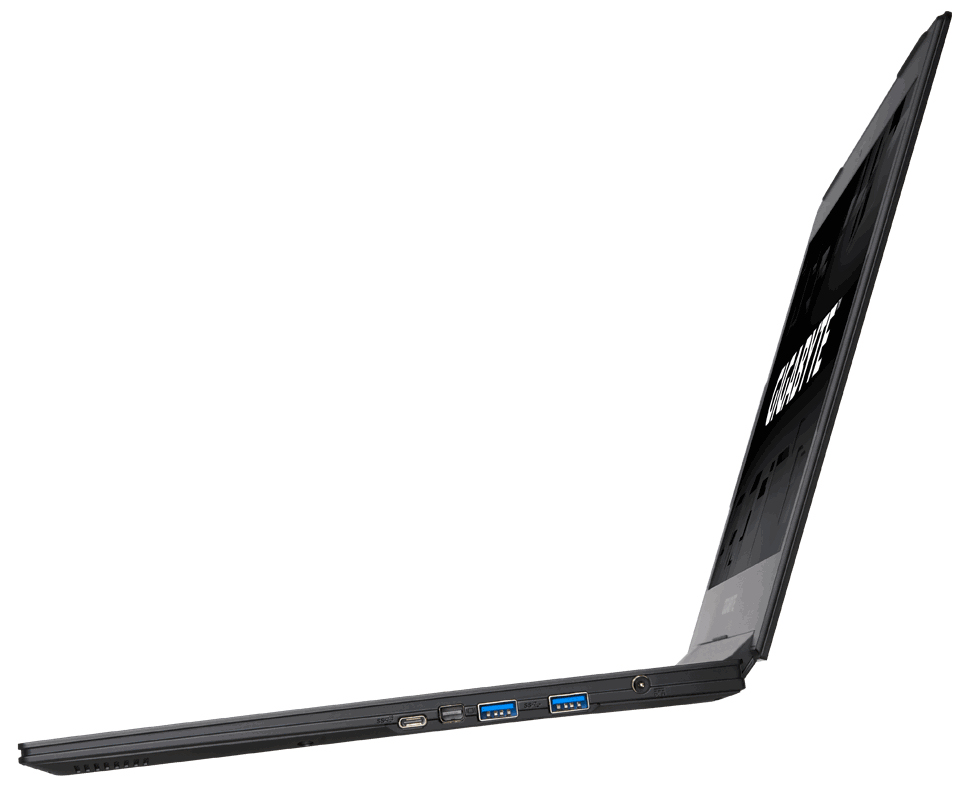
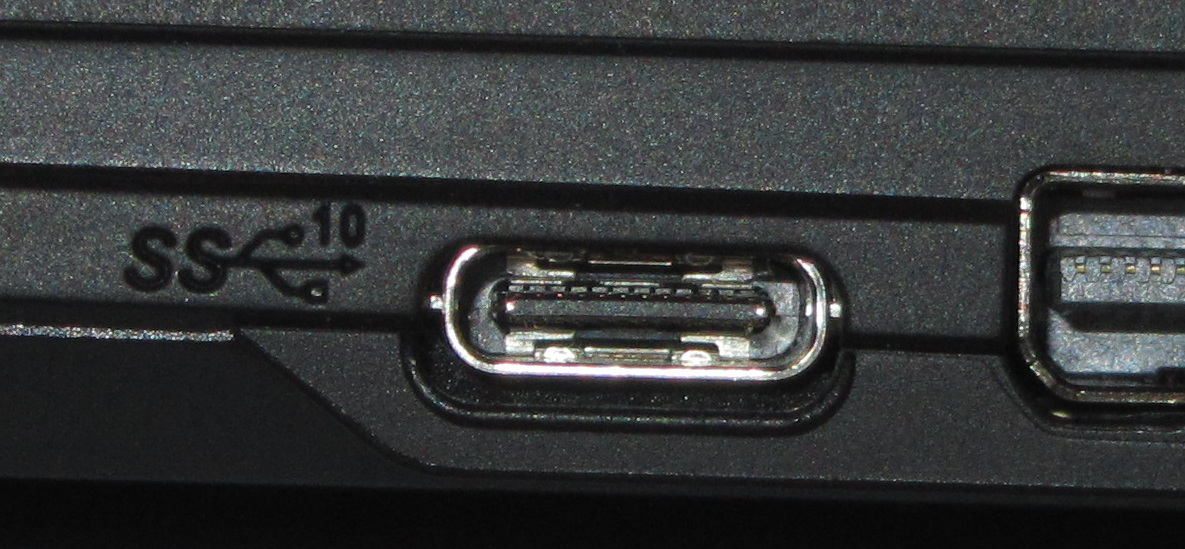
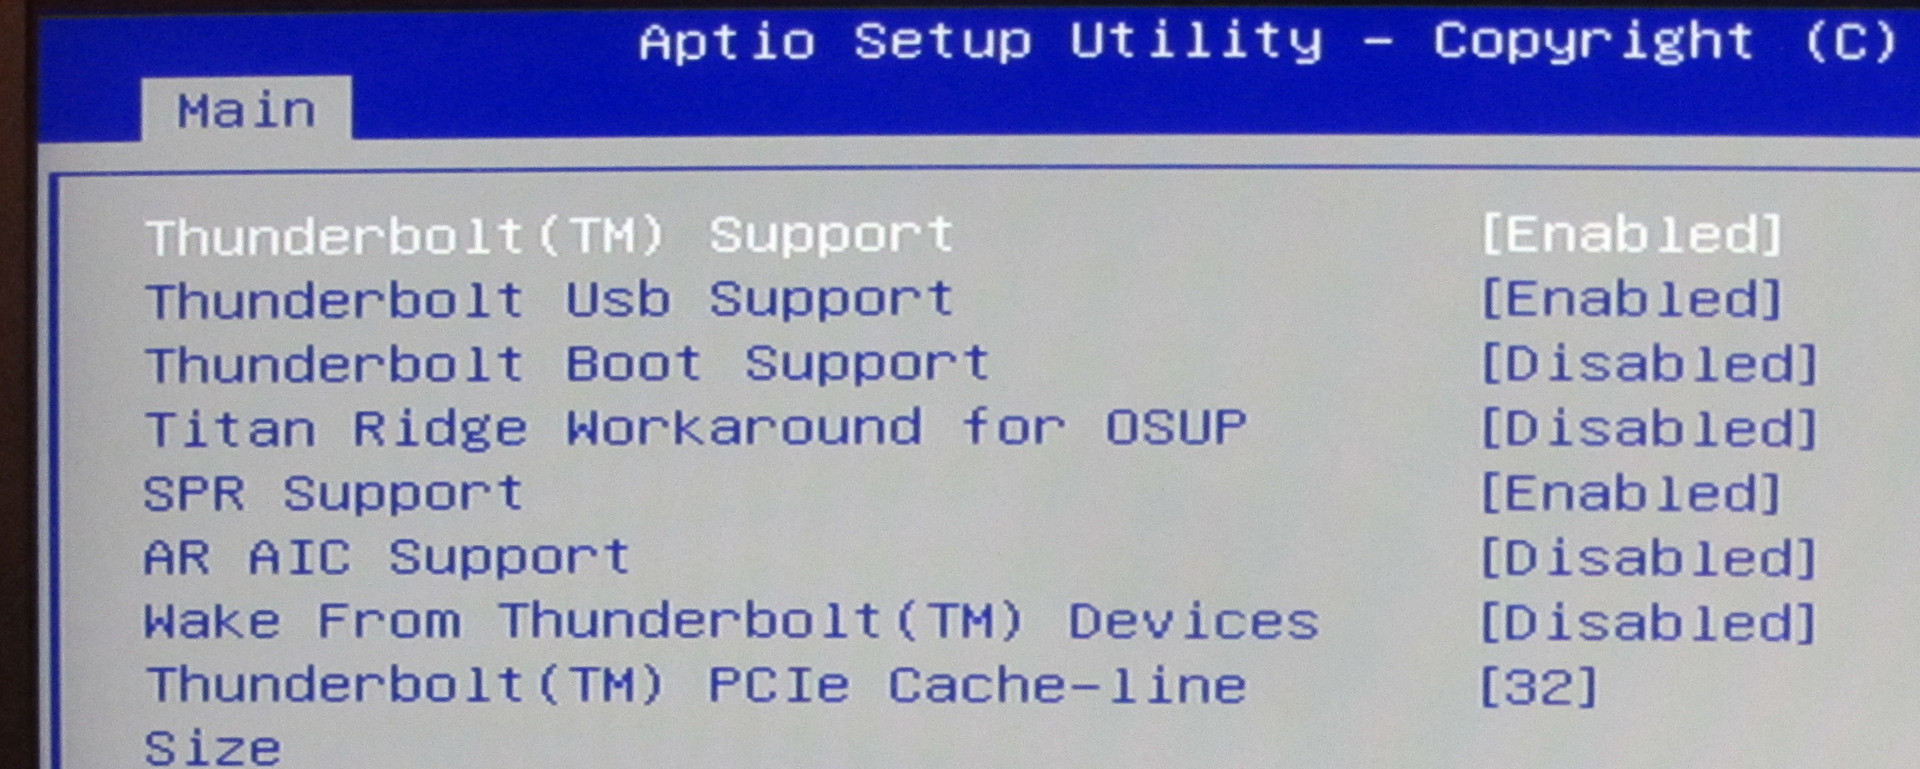
In addition, the notebook offers a Thunderbolt 3 port. The usual Thunderbolt-symbol is not marked next to the Type-C USB port - only the normal USB 3.1 Gen 2 symbol. Gigabyte seems to have left this unchanged from its sister model. A look at the device's BIOS menu confirms that it does support Thunderbolt 3.
Card Reader & Wi-Fi
| SD Card Reader | |
| average JPG Copy Test (av. of 3 runs) | |
| Gigabyte Aero 14-K7 (Toshiba Exceria Pro SDXC 64 GB UHS-II)) | |
| Schenker XMG P407 (Toshiba Exceria Pro SDXC 64 GB UHS-II) | |
| Gigabyte Aero 14 (Toshiba Exceria Pro SDXC 64 GB UHS-II) | |
| MSI GS43VR 7RE-069US (Toshiba Exceria Pro SDXC 64 GB UHS-II) | |
| maximum AS SSD Seq Read Test (1GB) | |
| Gigabyte Aero 14-K7 (Toshiba Exceria Pro SDXC 64 GB UHS-II)) | |
| Schenker XMG P407 (Toshiba Exceria Pro SDXC 64 GB UHS-II) | |
| Gigabyte Aero 14 (Toshiba Exceria Pro SDXC 64 GB UHS-II) | |
| MSI GS43VR 7RE-069US (Toshiba Exceria Pro SDXC 64 GB UHS-II) | |
| Networking | |
| iperf3 transmit AX12 | |
| MSI GS43VR 7RE-069US | |
| Gigabyte Aero 14 | |
| Schenker XMG P407 | |
| Gigabyte Aero 14-K7 | |
| iperf3 receive AX12 | |
| Gigabyte Aero 14 | |
| Gigabyte Aero 14-K7 | |
| MSI GS43VR 7RE-069US | |
| Schenker XMG P407 | |
Display
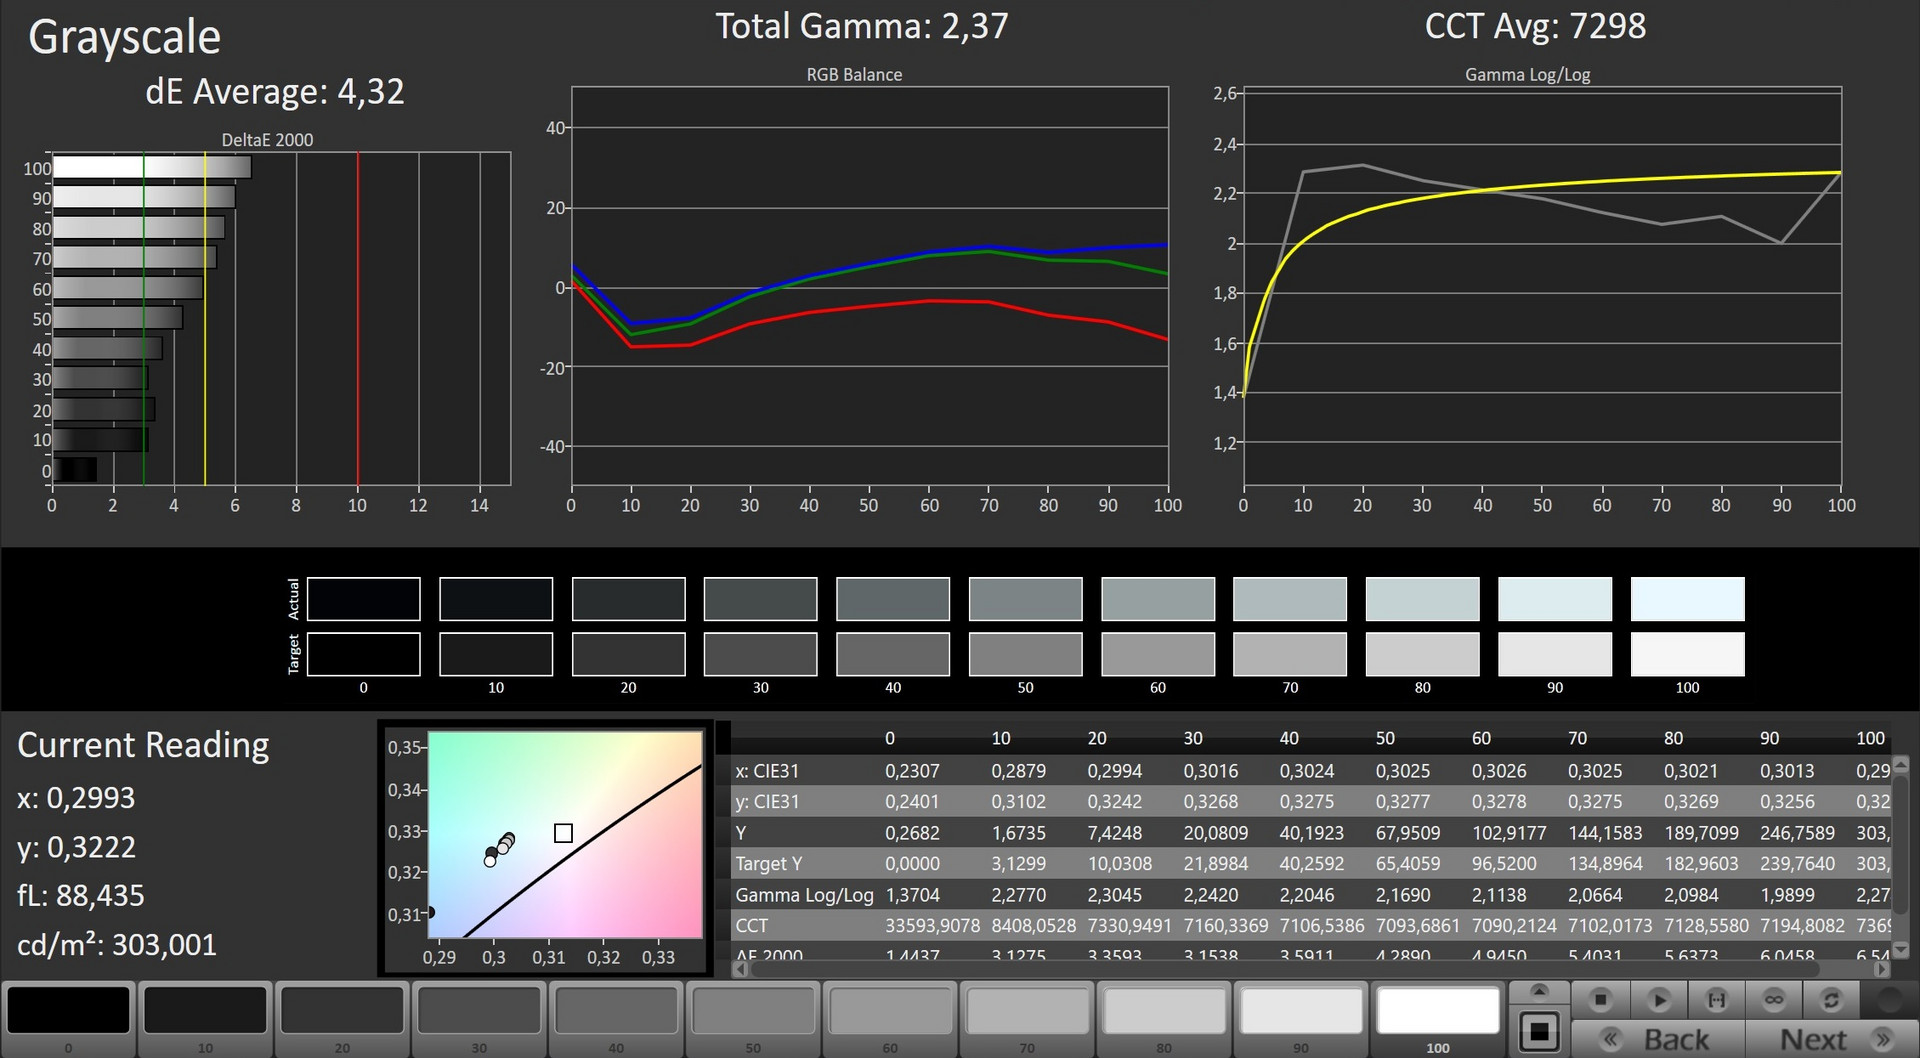
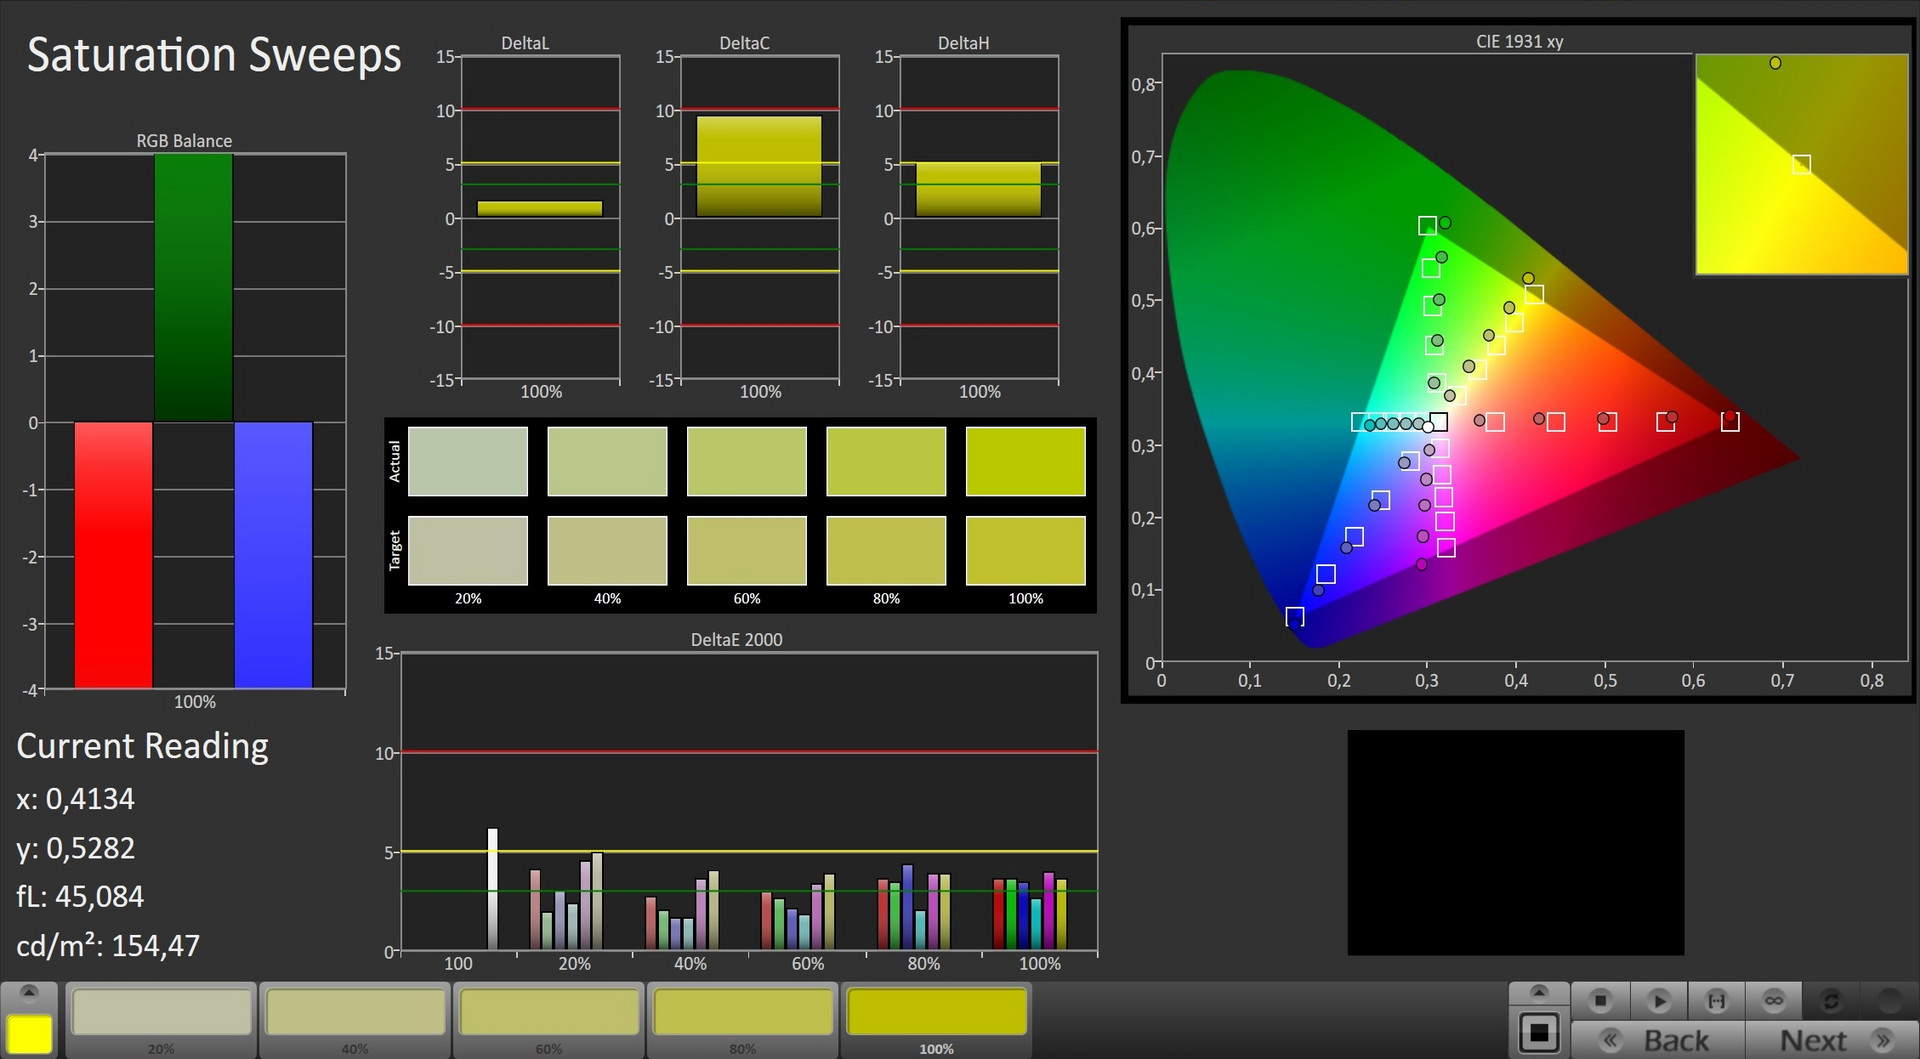
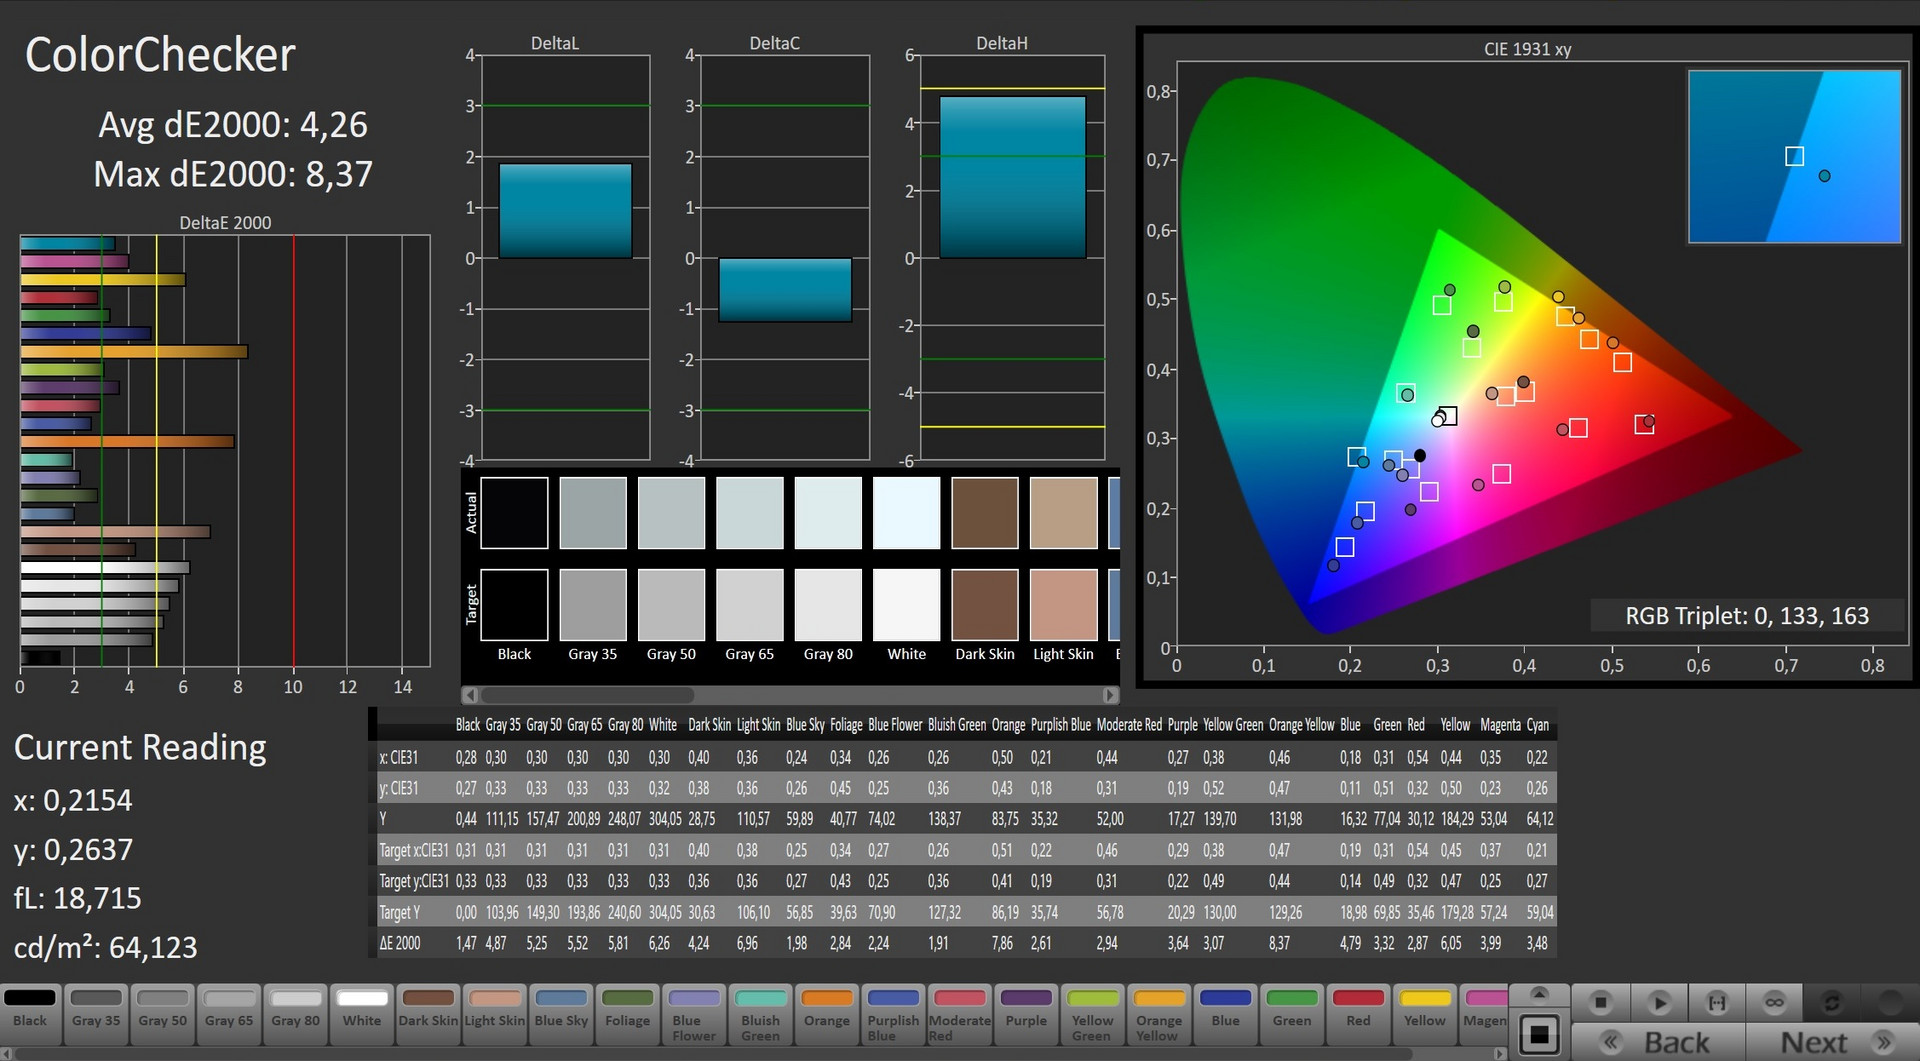
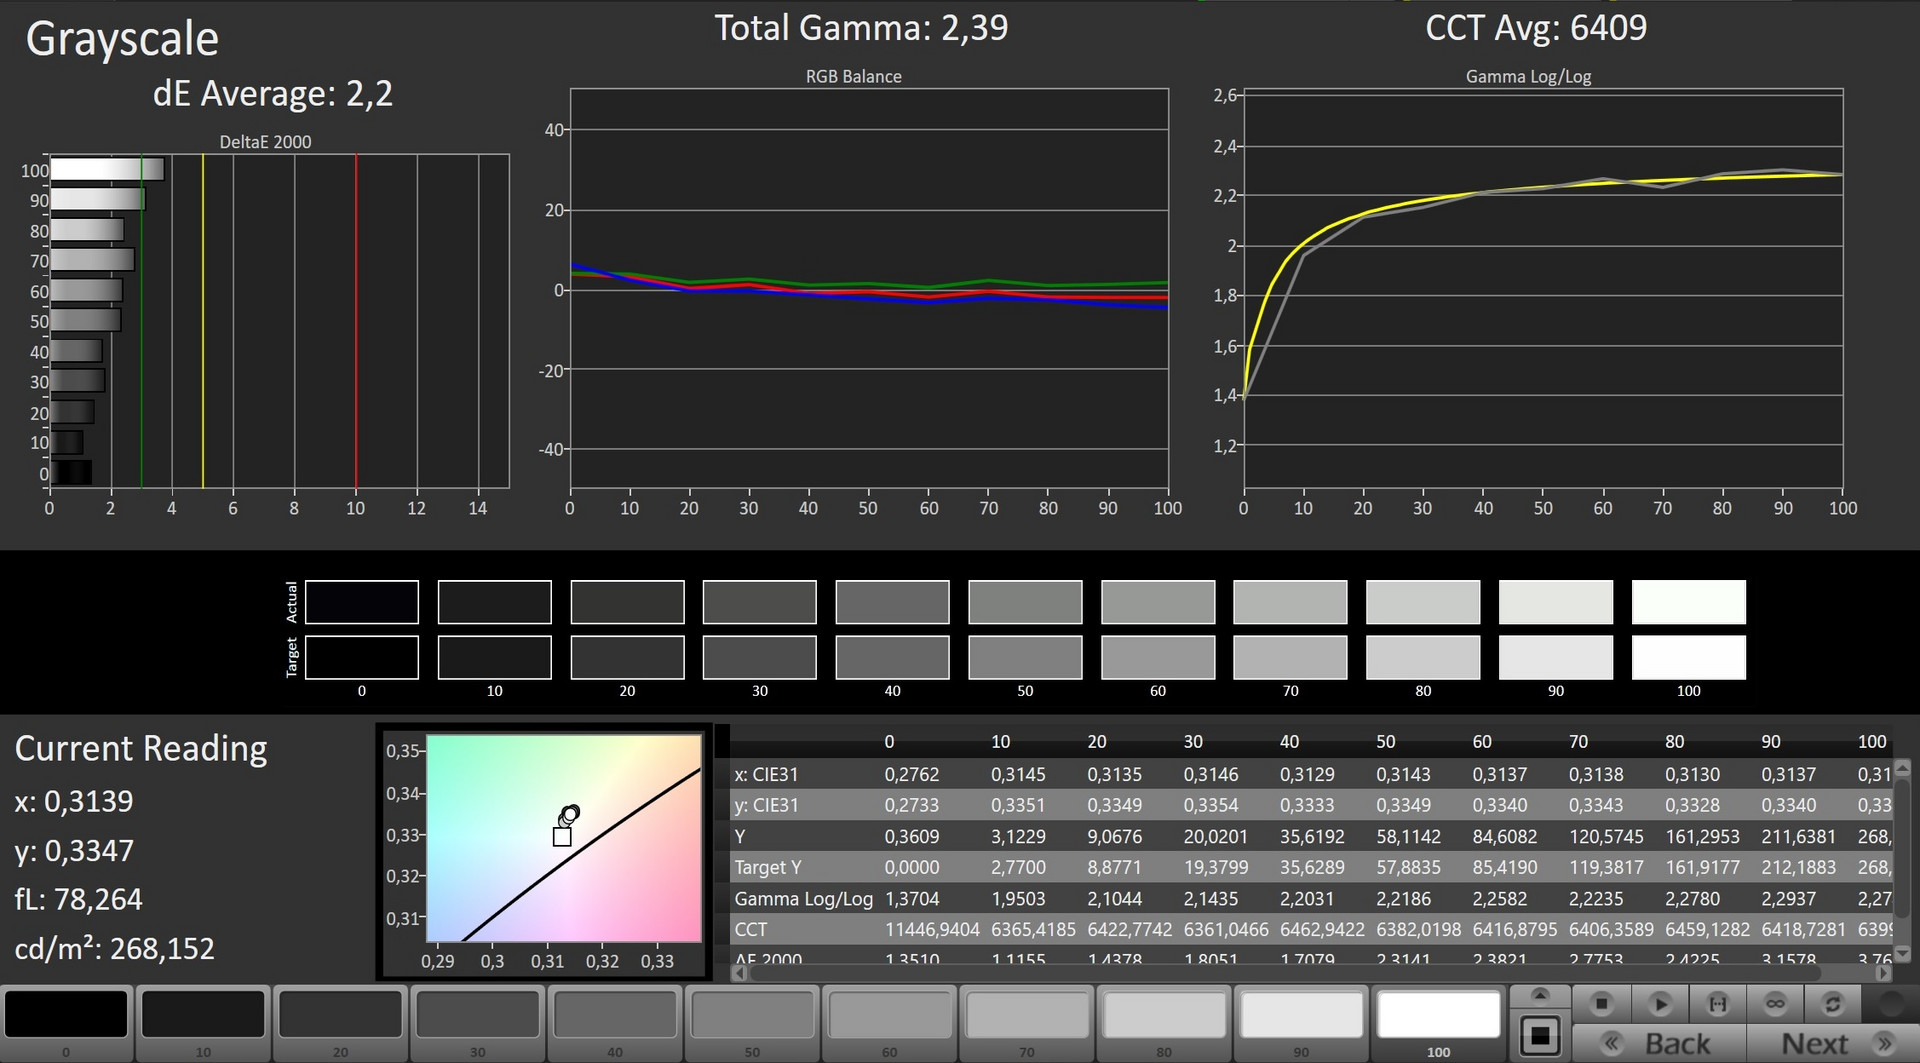
The Aero 14 is equipped with the same IPS QHD screen as its sister model. This is a display with stable viewing angles and good contrast. Brightness, however, could be better. The measured values differ slightly, but this is quite normal as two panels with the same build are never 100% the same.
Due to our recently improved measuring equipment, we can now identify PWM flickering at a brightness level of 95% and below. The frequency of this flickering is so high at 130 000 Hz, that it should not cause headaches or eye problems even for sensitive users.
| |||||||||||||||||||||||||
Brightness Distribution: 84 %
Center on Battery: 277 cd/m²
Contrast: 1026:1 (Black: 0.27 cd/m²)
ΔE ColorChecker Calman: 4.26 | ∀{0.5-29.43 Ø4.73}
ΔE Greyscale Calman: 4.32 | ∀{0.09-98 Ø4.97}
91% sRGB (Argyll 1.6.3 3D)
59% AdobeRGB 1998 (Argyll 1.6.3 3D)
65.9% AdobeRGB 1998 (Argyll 3D)
91.2% sRGB (Argyll 3D)
65.1% Display P3 (Argyll 3D)
Gamma: 2.37
CCT: 7298 K
| Gigabyte Aero 14-K7 IPS, 2560x1440, 14" | Razer Blade (2017) IPS, 1920x1080, 14" | MSI GS43VR 7RE-069US IPS, 1920x1080, 14" | Schenker XMG P407 IPS, 1920x1080, 14" | Gigabyte Aero 14 IPS, 2560x1440, 14" | |
|---|---|---|---|---|---|
| Display | -3% | -7% | -0% | ||
| Display P3 Coverage (%) | 65.1 | 66.3 2% | 64.5 -1% | 64.4 -1% | |
| sRGB Coverage (%) | 91.2 | 85.9 -6% | 82.1 -10% | 91.8 1% | |
| AdobeRGB 1998 Coverage (%) | 65.9 | 62.8 -5% | 60 -9% | 65.5 -1% | |
| Response Times | 20% | 23% | -13% | -1% | |
| Response Time Grey 50% / Grey 80% * (ms) | 40 ? | 25.2 ? 37% | 31.6 ? 21% | 47 ? -18% | 41 ? -2% |
| Response Time Black / White * (ms) | 25.2 ? | 24.8 ? 2% | 19.2 ? 24% | 27 ? -7% | 25 ? 1% |
| PWM Frequency (Hz) | 130 ? | 21370 | 21190 ? | ||
| Screen | -1% | 8% | 0% | -3% | |
| Brightness middle (cd/m²) | 277 | 272 -2% | 306.6 11% | 298 8% | 290 5% |
| Brightness (cd/m²) | 252 | 277 10% | 291 15% | 282 12% | 257 2% |
| Brightness Distribution (%) | 84 | 84 0% | 86 2% | 80 -5% | 79 -6% |
| Black Level * (cd/m²) | 0.27 | 0.26 4% | 0.28 -4% | 0.27 -0% | 0.3 -11% |
| Contrast (:1) | 1026 | 1046 2% | 1095 7% | 1104 8% | 967 -6% |
| Colorchecker dE 2000 * | 4.26 | 4.59 -8% | 3.9 8% | 4.42 -4% | 4.59 -8% |
| Colorchecker dE 2000 max. * | 8.37 | 8.49 -1% | 9 -8% | 8.57 -2% | 8.68 -4% |
| Greyscale dE 2000 * | 4.32 | 4.28 1% | 2 54% | 4.11 5% | 4.32 -0% |
| Gamma | 2.37 93% | 2.23 99% | 2.14 103% | 2.5 88% | 2.25 98% |
| CCT | 7298 89% | 6848 95% | 6626 98% | 6329 103% | 7320 89% |
| Color Space (Percent of AdobeRGB 1998) (%) | 59 | 55 -7% | 56.1 -5% | 54 -8% | 59 0% |
| Color Space (Percent of sRGB) (%) | 91 | 83 -9% | 86.1 -5% | 82 -10% | 92 1% |
| Total Average (Program / Settings) | 10% /
2% | 9% /
7% | -7% /
-3% | -1% /
-2% |
* ... smaller is better
Screen Flickering / PWM (Pulse-Width Modulation)
| Screen flickering / PWM detected | 130 Hz | ≤ 95 % brightness setting | 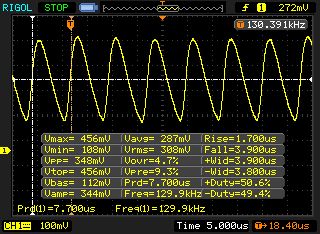 |
The display backlight flickers at 130 Hz (worst case, e.g., utilizing PWM) Flickering detected at a brightness setting of 95 % and below. There should be no flickering or PWM above this brightness setting. The frequency of 130 Hz is very low, so the flickering may cause eyestrain and headaches after extended use. In comparison: 52 % of all tested devices do not use PWM to dim the display. If PWM was detected, an average of 7798 (minimum: 5 - maximum: 343500) Hz was measured. | |||

Display Response Times
| ↔ Response Time Black to White | ||
|---|---|---|
| 25.2 ms ... rise ↗ and fall ↘ combined | ↗ 13.2 ms rise | 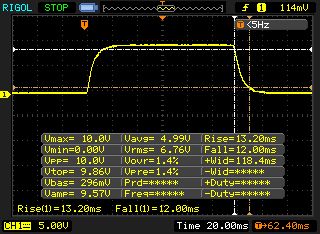 |
| ↘ 12 ms fall | ||
| The screen shows relatively slow response rates in our tests and may be too slow for gamers. In comparison, all tested devices range from 0.1 (minimum) to 240 (maximum) ms. » 60 % of all devices are better. This means that the measured response time is worse than the average of all tested devices (19.9 ms). | ||
| ↔ Response Time 50% Grey to 80% Grey | ||
| 40 ms ... rise ↗ and fall ↘ combined | ↗ 19.6 ms rise | 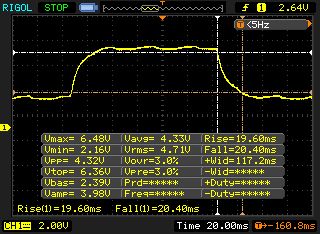 |
| ↘ 20.4 ms fall | ||
| The screen shows slow response rates in our tests and will be unsatisfactory for gamers. In comparison, all tested devices range from 0.165 (minimum) to 636 (maximum) ms. » 61 % of all devices are better. This means that the measured response time is worse than the average of all tested devices (31.1 ms). | ||
Performance
Gigabyte's Aero 14-K7 is a compact mobile gaming notebook in a 14-inch case. It displays all current games smoothly and also does a good job in other areas of use. Our test unit is available for about $1550. Other configurations are available.


Testing Conditions
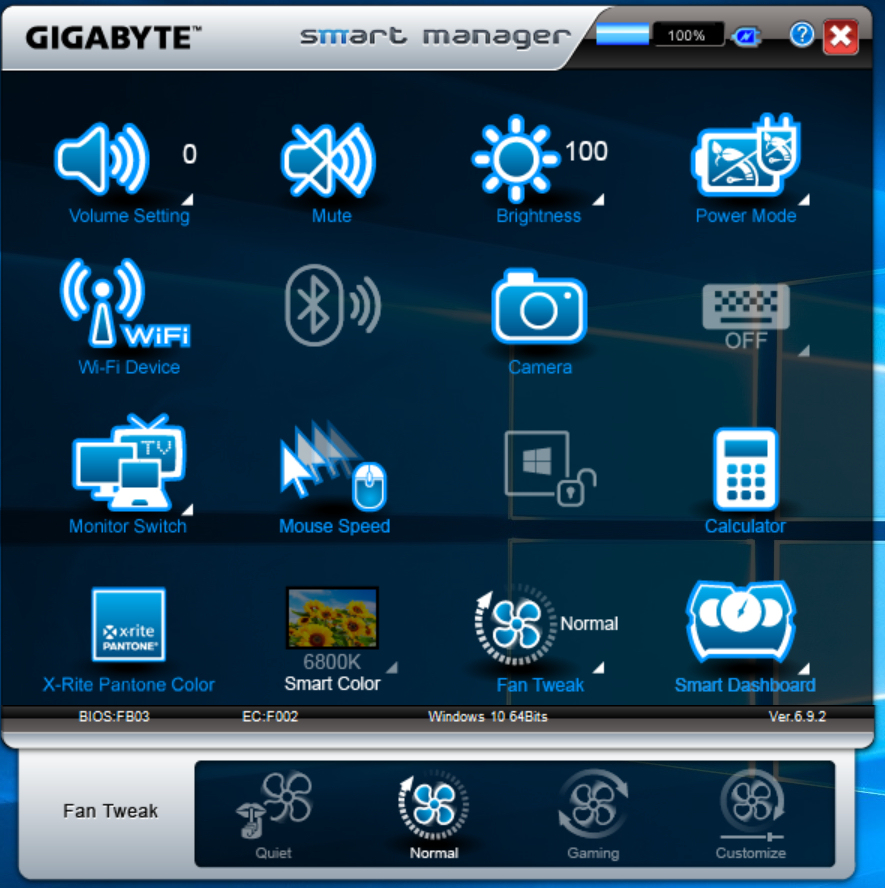
The pre-installed SmartManager tool offers the possibility to switch between various cooling fan profiles. We ran all the benchmarks with the Gaming profile activated. The cooling fans were only set to "normal" during the battery tests.
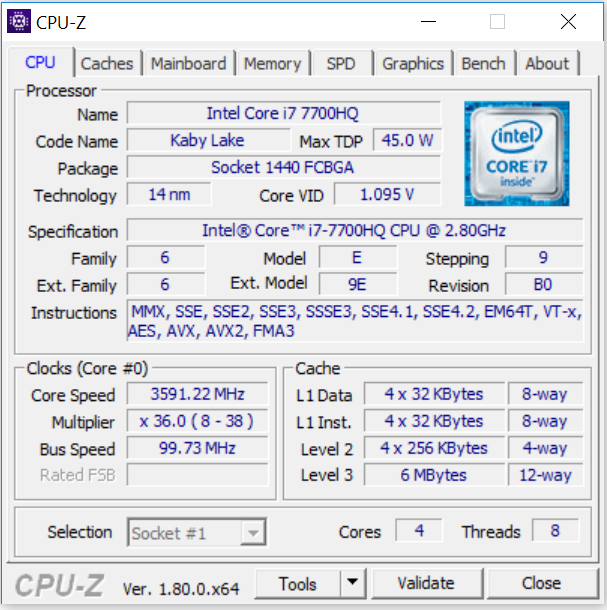
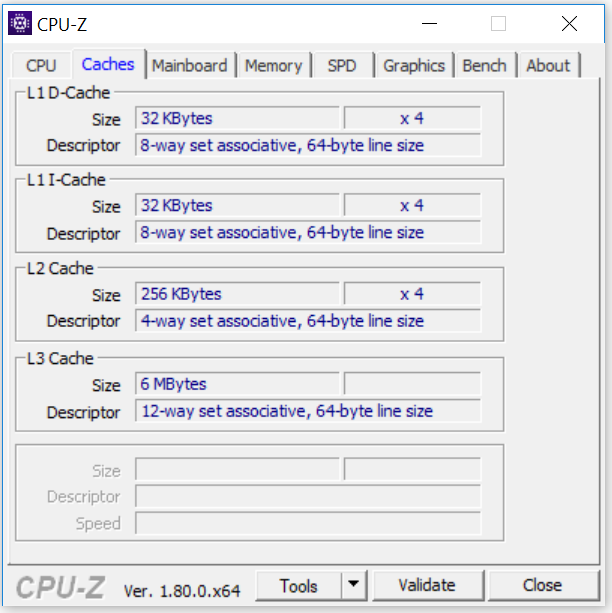
Processor
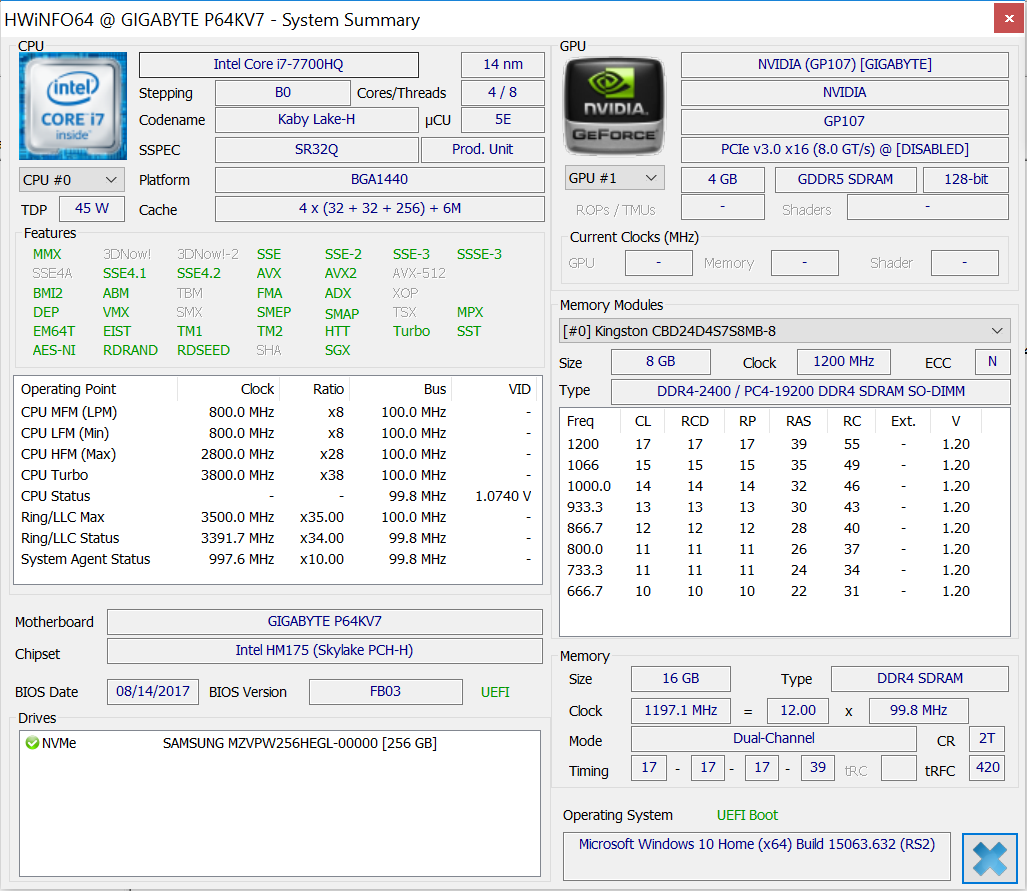
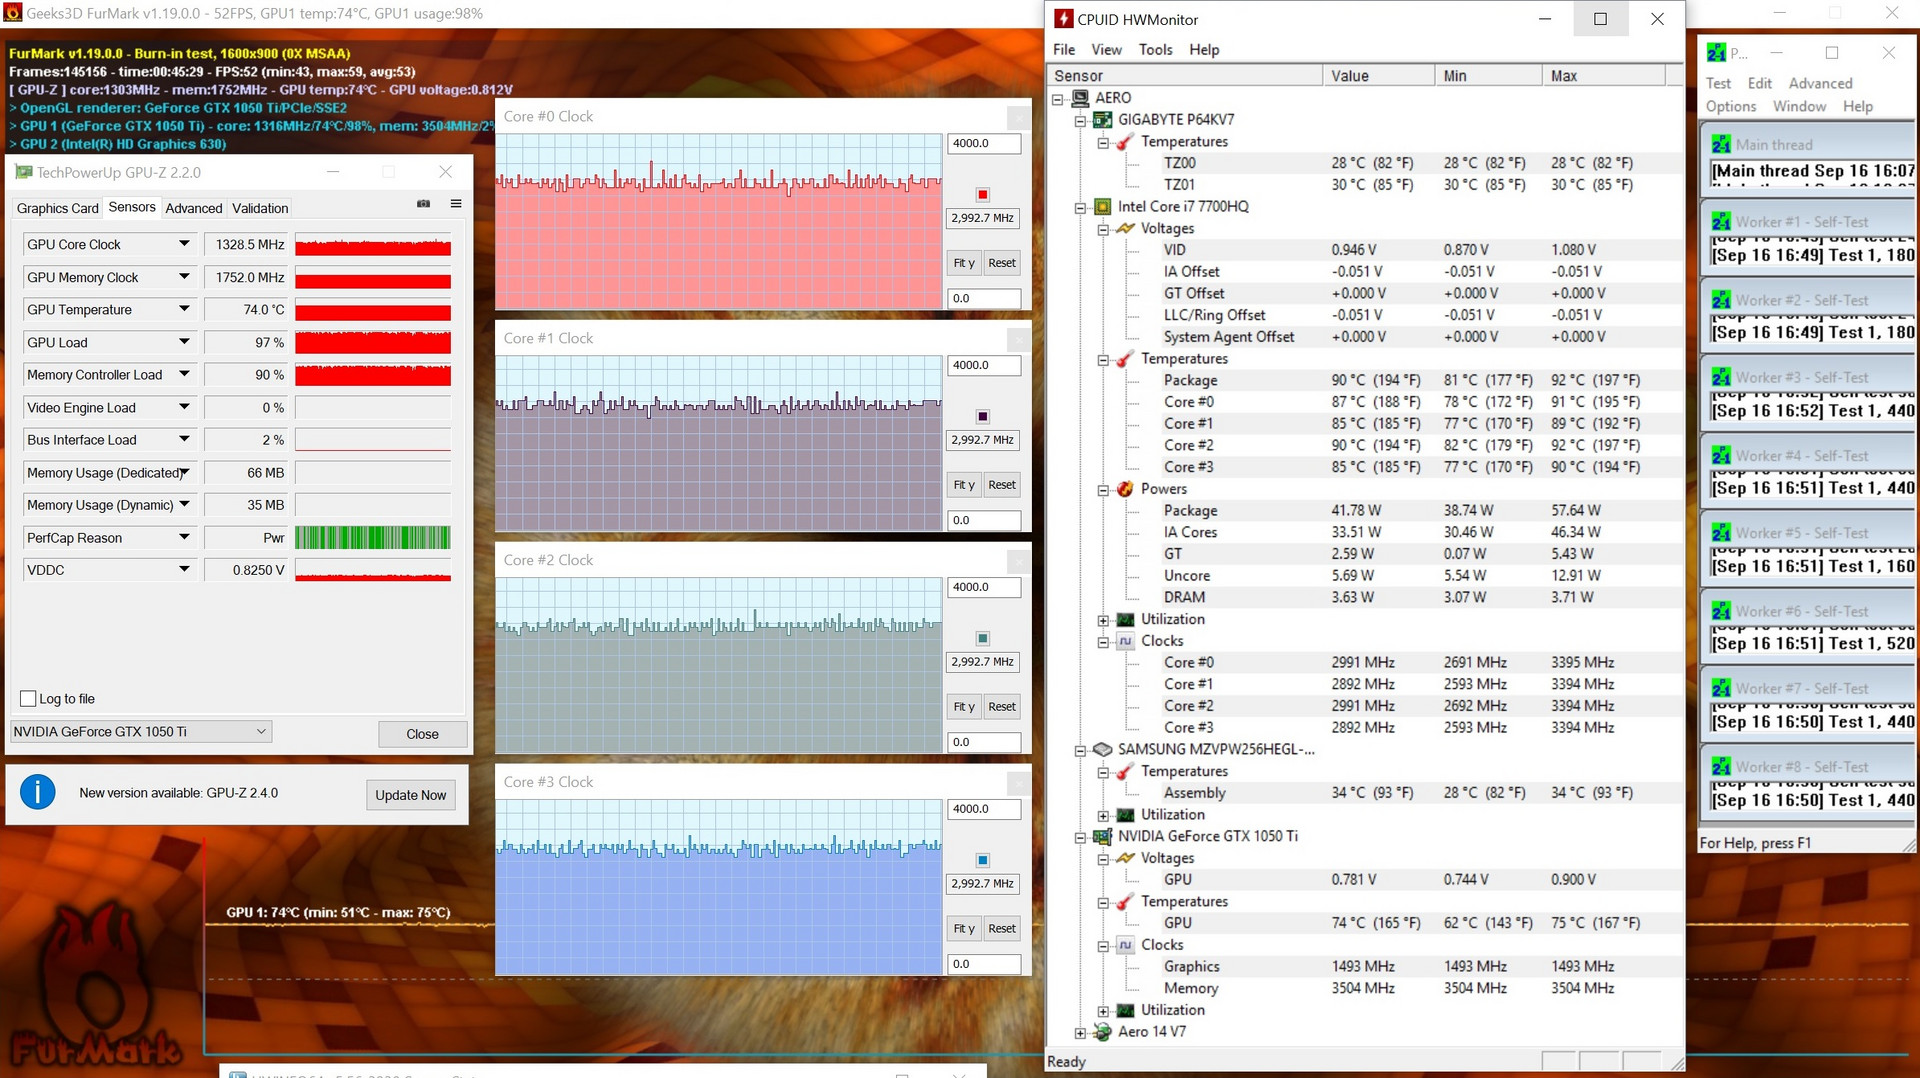
Like the Aero 14 model that we have already tested, the current device is equipped with a Core i7-7700HQ (Kaby Lake) quad-core processor. This model offers a good compromise between processing power and power consumption, which makes it quite suitable for (mobile) gaming notebooks. The CPU works at a base clock rate of 2.8 GHz. This can be increased to 3.4 GHz (four cores), 3.6 GHz (two cores) and 3.8 GHz (one core). The clock rates are 200 to 300 MHz higher than the direct Skylake predecessor Core i7-6700HQ's. The turbo is only used to its full potential on power supply. On battery, the CPU ran our tests between 2.9 and 3.3 GHz (Multithread) and 3.1 to 3.5 GHz (Single thread).
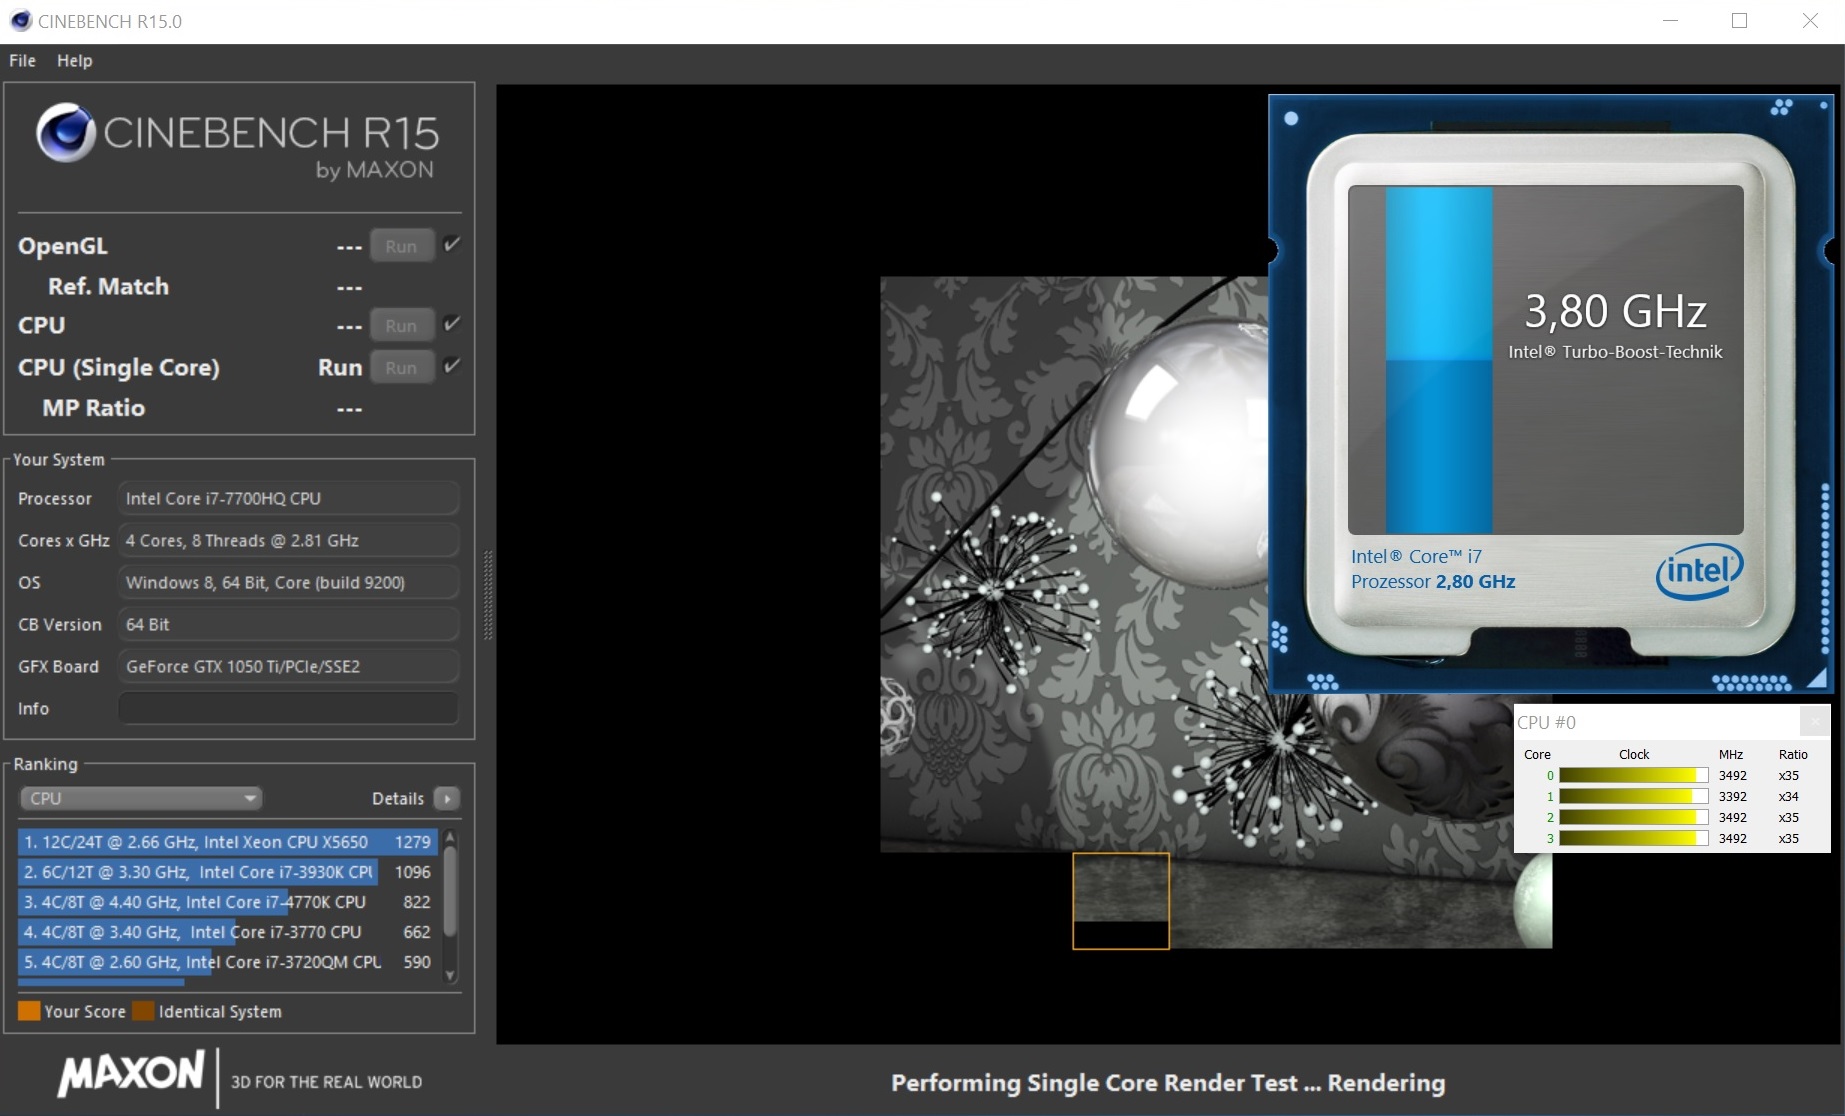
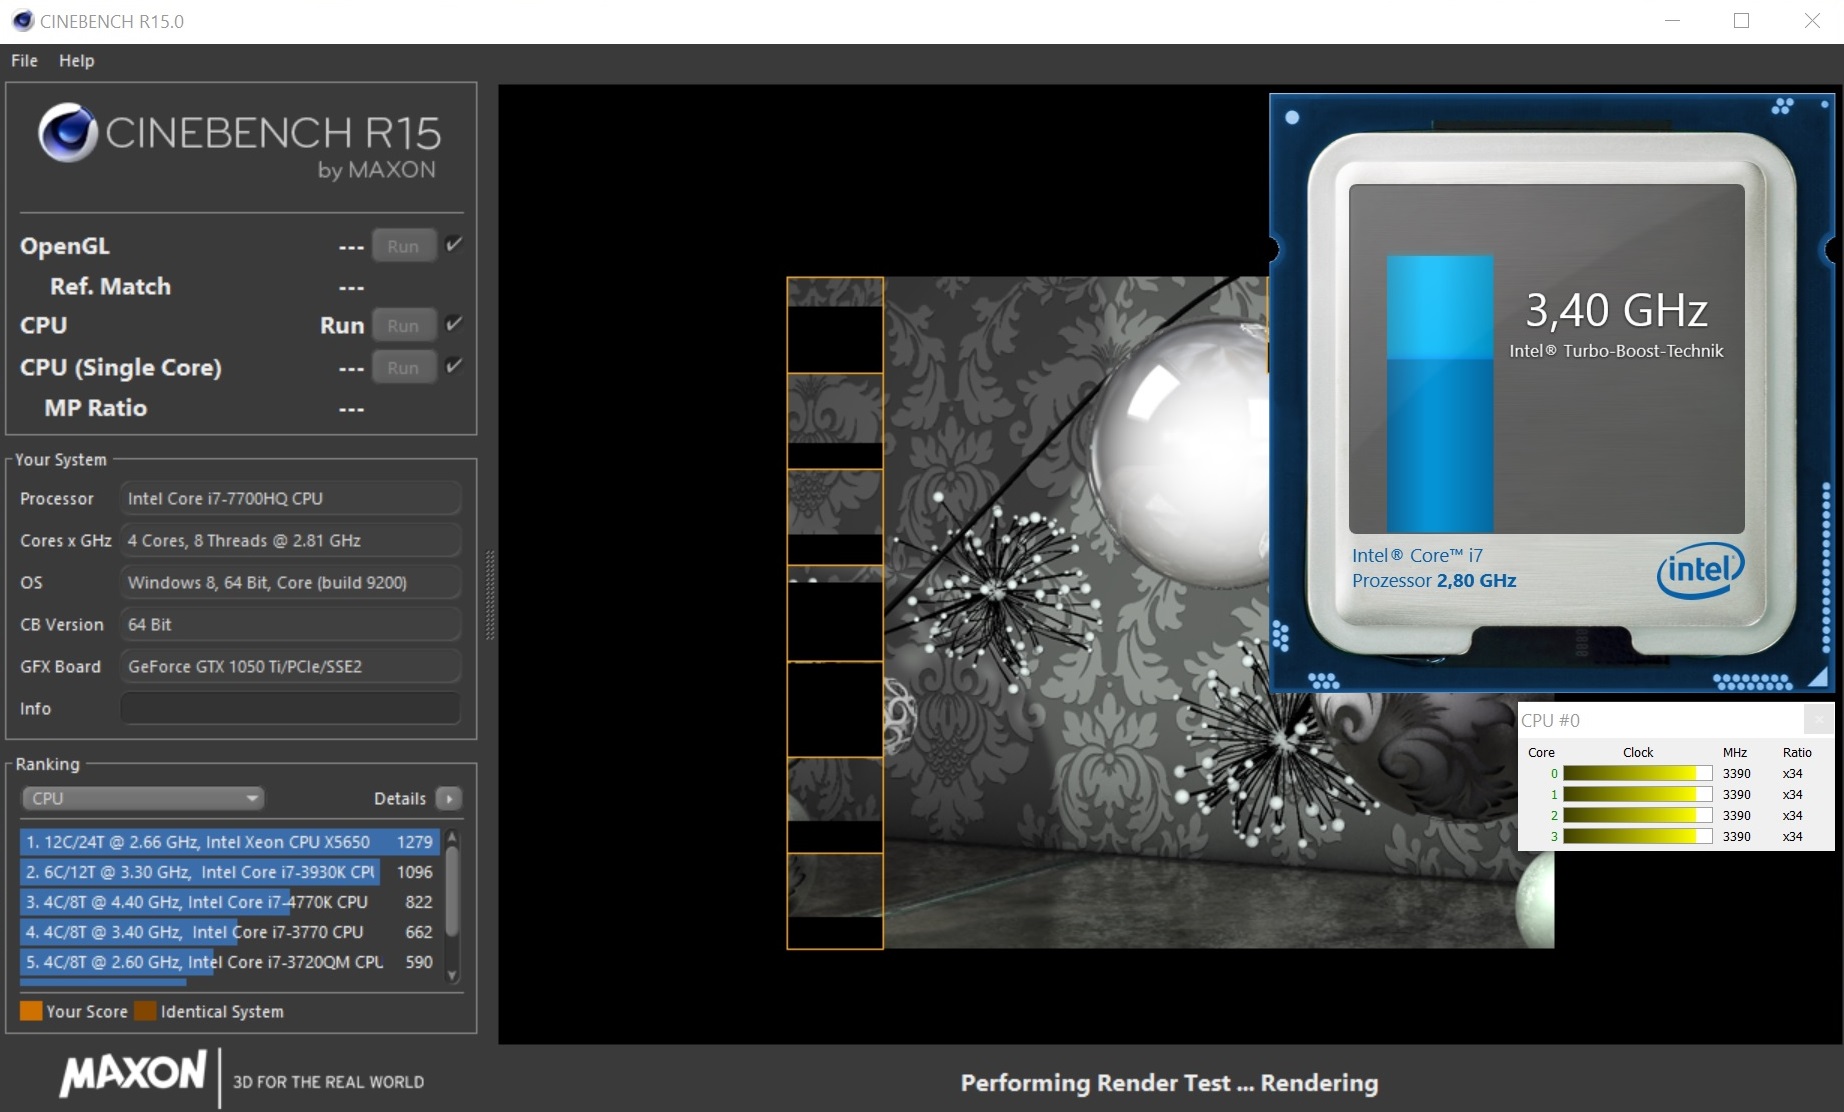
We test whether the turbo can run continuously by running the Multithread Cinebench R15 test in a loop for 30 minutes. The results of the Aero 14 were very consistent and there was no drop in performance.
The results of the CPU tests we did are similar to those of comparable notebooks.
| Cinebench R15 | |
| CPU Single 64Bit | |
| Gigabyte Aero 14-K7 | |
| Gigabyte Aero 14 | |
| Razer Blade (2017) | |
| MSI GS43VR 7RE-069US | |
| Schenker XMG P407 | |
| CPU Multi 64Bit | |
| Gigabyte Aero 14-K7 | |
| Schenker XMG P407 | |
| MSI GS43VR 7RE-069US | |
| Gigabyte Aero 14 | |
| Razer Blade (2017) | |
| Cinebench R11.5 | |
| CPU Multi 64Bit | |
| Gigabyte Aero 14-K7 | |
| MSI GS43VR 7RE-069US | |
| Schenker XMG P407 | |
| CPU Single 64Bit | |
| MSI GS43VR 7RE-069US | |
| Gigabyte Aero 14-K7 | |
| Schenker XMG P407 | |
| Cinebench R10 | |
| Rendering Multiple CPUs 32Bit | |
| Gigabyte Aero 14-K7 | |
| MSI GS43VR 7RE-069US | |
| Schenker XMG P407 | |
| Rendering Single 32Bit | |
| Gigabyte Aero 14-K7 | |
| MSI GS43VR 7RE-069US | |
| Schenker XMG P407 | |
| Geekbench 3 | |
| 32 Bit Multi-Core Score | |
| Gigabyte Aero 14-K7 | |
| Schenker XMG P407 | |
| 32 Bit Single-Core Score | |
| Gigabyte Aero 14-K7 | |
| Schenker XMG P407 | |
| Geekbench 4.0 | |
| 64 Bit Multi-Core Score | |
| Gigabyte Aero 14-K7 | |
| Schenker XMG P407 | |
| 64 Bit Single-Core Score | |
| Gigabyte Aero 14-K7 | |
| Schenker XMG P407 | |
| Geekbench 4.4 | |
| 64 Bit Multi-Core Score | |
| Gigabyte Aero 14-K7 | |
| 64 Bit Single-Core Score | |
| Gigabyte Aero 14-K7 | |
| JetStream 1.1 - 1.1 Total | |
| Gigabyte Aero 14-K7 | |
| Schenker XMG P407 | |
| MSI GS43VR 7RE-069US | |
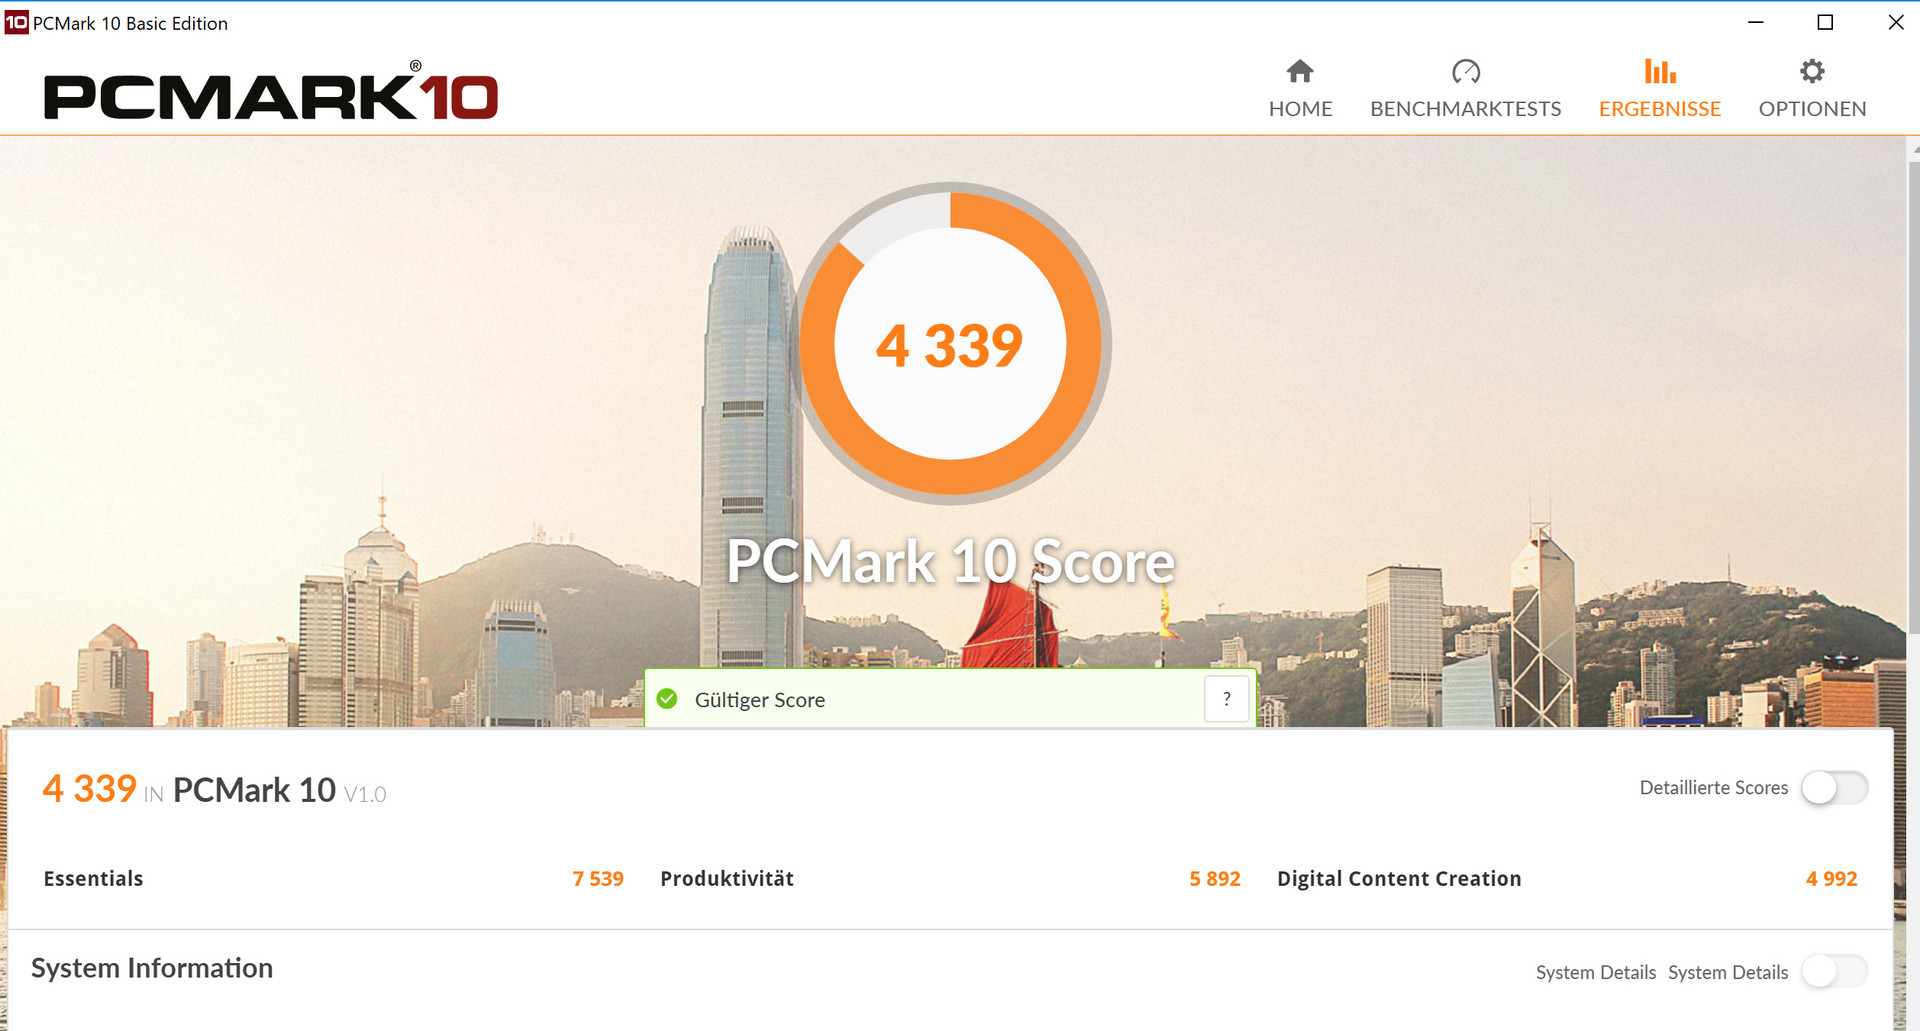
System Performance
A powerful processor and an NVMe SSD as fast as an arrow ensure a fast-running system. We did not encounter any problems. The great results in the various PCMark benchmarks prove that our test unit offers more than enough processing power for gaming, as well as video and image processing. It is not possible to improve the general performance as Gigabyte has already pushed its components to their limits.
| PCMark 7 Score | 6103 points | |
| PCMark 8 Home Score Accelerated v2 | 3962 points | |
| PCMark 8 Creative Score Accelerated v2 | 5282 points | |
| PCMark 8 Work Score Accelerated v2 | 4822 points | |
| PCMark 10 Score | 4339 points | |
Help | ||
| PCMark 8 | |
| Home Score Accelerated v2 | |
| Schenker XMG P407 | |
| Gigabyte Aero 14-K7 | |
| Razer Blade (2017) | |
| MSI GS43VR 7RE-069US | |
| Gigabyte Aero 14 | |
| Work Score Accelerated v2 | |
| Schenker XMG P407 | |
| Razer Blade (2017) | |
| Gigabyte Aero 14-K7 | |
| Gigabyte Aero 14 | |
| MSI GS43VR 7RE-069US | |
Storage Devices
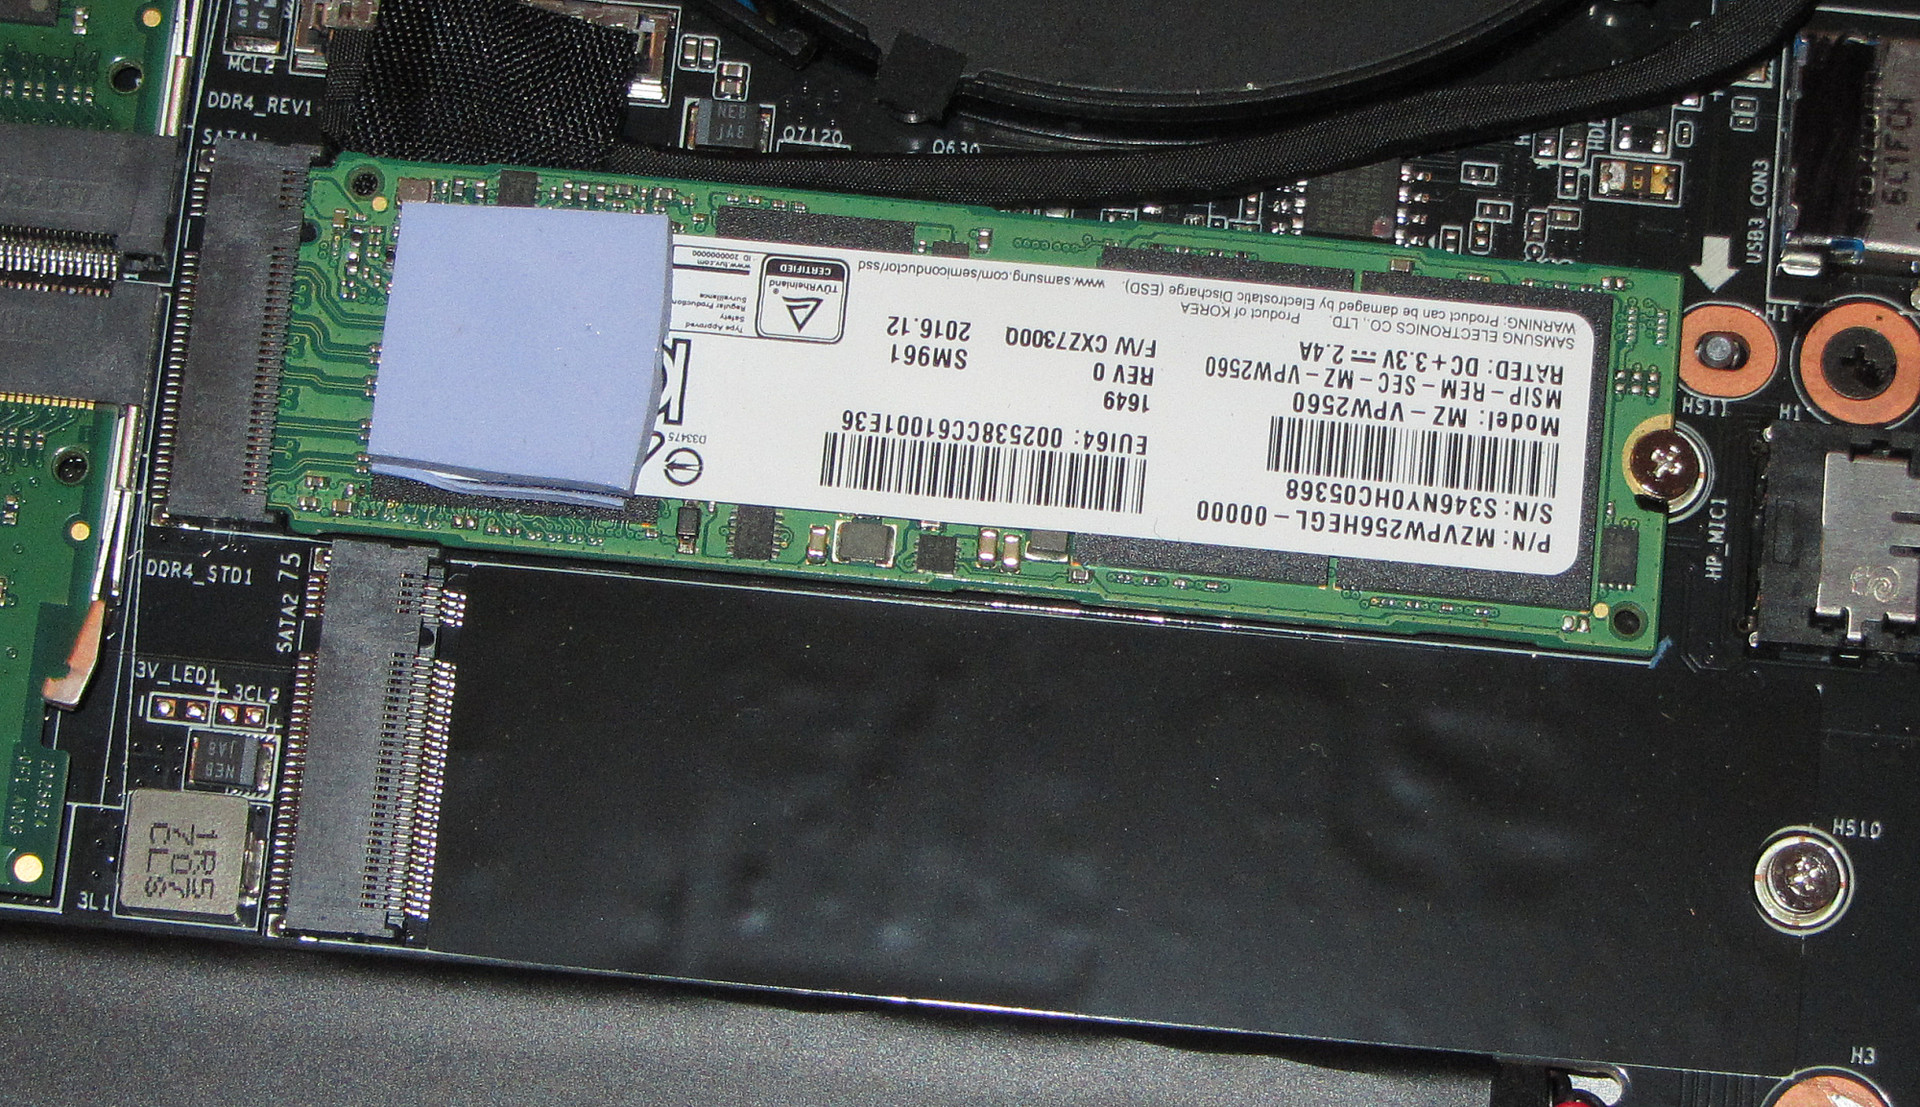
Gigabyte has equipped the Aero 14 with an NVMe SSD from Samsung. These SSDs are connected via PCI Express 3.0 x4 interfaces, which offer significantly higher transfer rates than a SATA III interface. This particular SSD has great transfer rates and installing the Samsung NVMe driver did not further improve those rates.
The SSD offers a total capacity of 256 GB. 180 GB is left available when the device arrives at your door. Should this space not be enough, you can install a second M.2 2280 SSD in the empty drive bay.

| Gigabyte Aero 14-K7 Samsung SM961 MZVPW256HEGL | Razer Blade (2017) Samsung PM951 NVMe MZVLV256 | Schenker XMG P407 Samsung SM961 MZVPW256 m.2 PCI-e | Gigabyte Aero 14 LiteOn CX2-8B256 | |
|---|---|---|---|---|
| CrystalDiskMark 3.0 | -29% | -3% | -2% | |
| Read Seq (MB/s) | 1971 | 1122 -43% | 1345 -32% | 1584 -20% |
| Write Seq (MB/s) | 1541 | 311 -80% | 1502 -3% | 795 -48% |
| Read 512 (MB/s) | 432.6 | 682 58% | 320.3 -26% | 985 128% |
| Write 512 (MB/s) | 1283 | 310 -76% | 1276 -1% | 814 -37% |
| Read 4k (MB/s) | 55.4 | 34.8 -37% | 58.9 6% | 44.93 -19% |
| Write 4k (MB/s) | 141.7 | 134.3 -5% | 171 21% | 131.2 -7% |
| Read 4k QD32 (MB/s) | 603 | 565 -6% | 625 4% | 602 0% |
| Write 4k QD32 (MB/s) | 513 | 308 -40% | 539 5% | 441 -14% |
Graphics
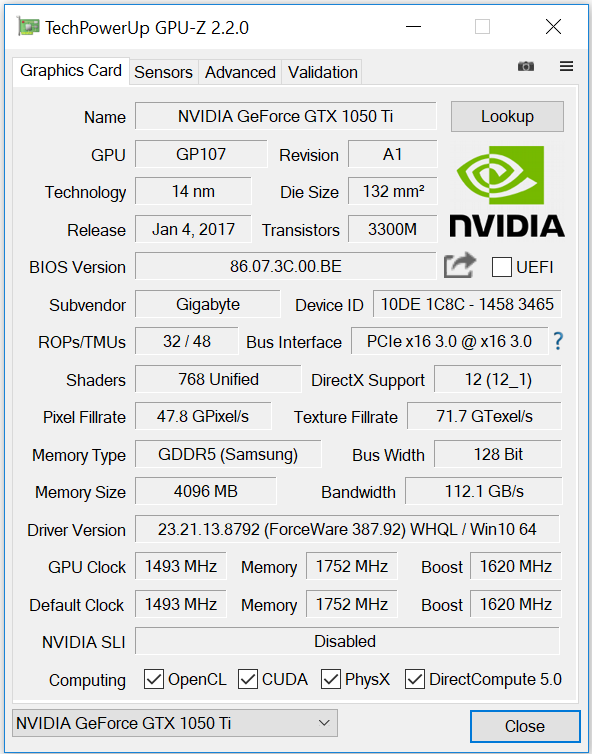
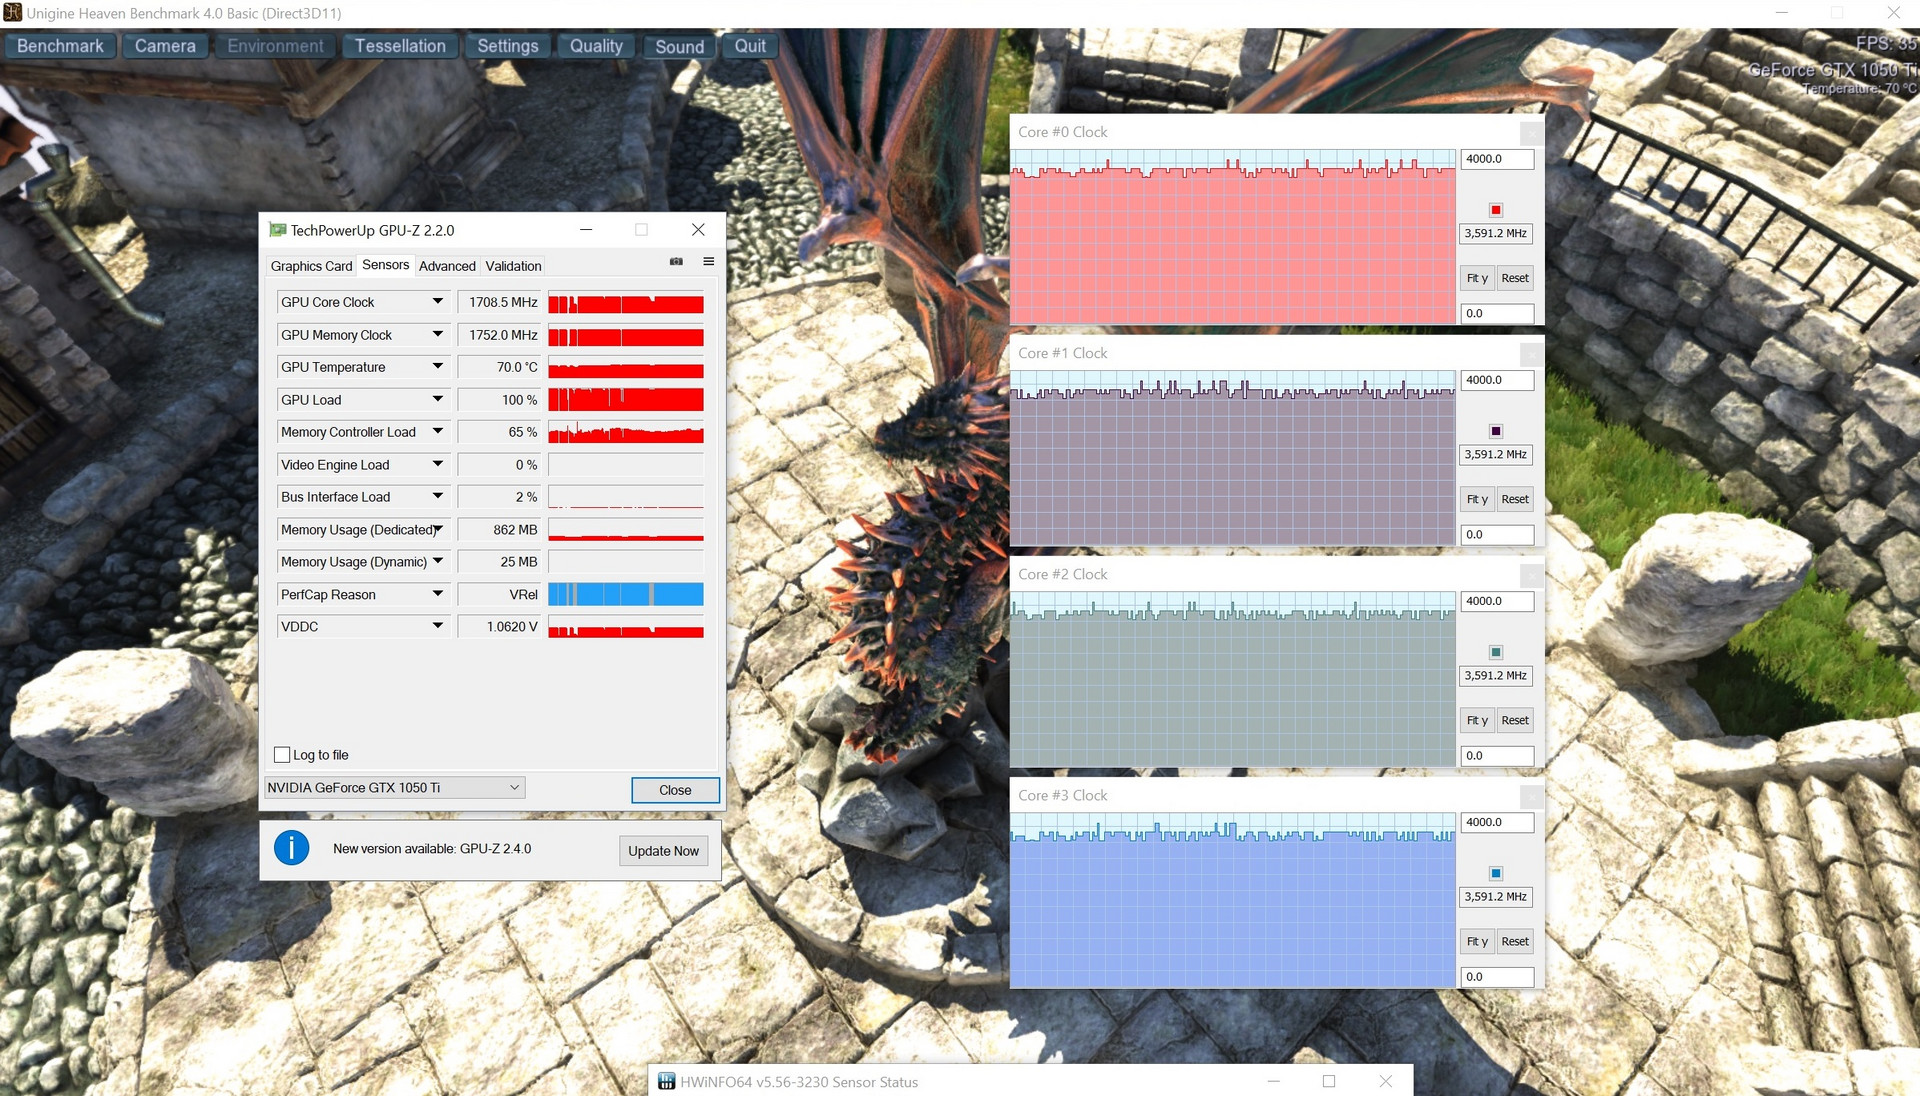
The GeForce GTX 1050 Ti graphics card from Nvidia belongs to the better units of the GPU mid-range. It is based on Pascal architecture, supports DirectX 12 and reaches speeds of up to 1772 MHz. However, the device cannot keep up this speed for very long. We measured an actual working speed of averagely 1710 MHz. The GPU has 4096 MB of GDDR5 graphics memory available.
The results of the 3DMark benchmark are what you would expect from this GPU, although there are some fluctuations. For example, the Aero 14 reached between 9200 and 9600 points in the 3DMark 2011 benchmark. The Schenker XMG P407 is equipped with the same GPU and reaches better results as its GTX 1050 Ti has both higher maximum speeds and a higher average speed than it does in the Aero.
The Aero 14 is supplied with the graphics switching function (Optimus) turned on. In everyday use and on battery, Intel's integrated HD Graphics 630 is in use, while Optimus switches to Nvidia's GPU for more demanding applications such as computer games.
| 3DMark 06 Standard Score | 27789 points | |
| 3DMark 11 Performance | 9524 points | |
| 3DMark Ice Storm Standard Score | 116034 points | |
| 3DMark Cloud Gate Standard Score | 22642 points | |
| 3DMark Fire Strike Score | 6667 points | |
| 3DMark Fire Strike Extreme Score | 3516 points | |
| 3DMark Time Spy Score | 2484 points | |
Help | ||
| 3DMark 11 - 1280x720 Performance GPU | |
| MSI GS43VR 7RE-069US | |
| Gigabyte Aero 14 | |
| Razer Blade (2017) | |
| Schenker XMG P407 | |
| Gigabyte Aero 14-K7 | |
| 3DMark - 1920x1080 Fire Strike Graphics | |
| MSI GS43VR 7RE-069US | |
| Gigabyte Aero 14 | |
| Razer Blade (2017) | |
| Schenker XMG P407 | |
| Gigabyte Aero 14-K7 | |
Gaming Performance
The Aero 14 can display all current games smoothly. Usually, it can manage a resolution of 1920x1080 pixels and middle to high, sometimes maximum quality settings. You will need to reduce resolution and/or quality settings for very demanding games. This, for example, is the case with the game "Mafia 3". Using the full available screen resolution usually requires lowering the quality settings. The device's GPU is not made for resolutions above Full HD.
In order to find out whether the frame rates remain constant over a prolonged period of time, we run the game "The Witcher 3" in Full HD resolution and maximum quality settings for about 60 minutes. We do not move the character in the game during this entire test. We did not register a drop in frame rates.
| BioShock Infinite - 1920x1080 Ultra Preset, DX11 (DDOF) | |
| MSI GS43VR 7RE-069US | |
| Schenker XMG P407 | |
| Gigabyte Aero 14-K7 | |
| Acer Nitro 5 AN515-51-788E | |
| The Witcher 3 - 1920x1080 High Graphics & Postprocessing (Nvidia HairWorks Off) | |
| MSI GS43VR 7RE-069US | |
| Razer Blade (2017) | |
| Acer Nitro 5 AN515-51-788E | |
| Gigabyte Aero 14-K7 | |
| Prey - 1920x1080 Very High Preset AA:2TX SM AF:16x | |
| MSI GS43VR 7RE-069US | |
| Gigabyte Aero 14-K7 | |
| Acer Nitro 5 AN515-51-788E | |
| F1 2017 - 1920x1080 Ultra High Preset AA:T AF:16x | |
| Acer Nitro 5 AN515-51-788E | |
| Gigabyte Aero 14-K7 | |
| low | med. | high | ultra | |
|---|---|---|---|---|
| Tomb Raider (2013) | 439.9 | 304.3 | 202.2 | 90.7 |
| BioShock Infinite (2013) | 267.7 | 207.7 | 188.5 | 74.4 |
| The Witcher 3 (2015) | 141 | 82.8 | 45.7 | 26.1 |
| Prey (2017) | 142.4 | 101.9 | 80.7 | 67.7 |
| F1 2017 (2017) | 184 | 90 | 70 | 44 |
| FIFA 18 (2017) | 293 | 232.4 | 188.6 | 156.8 |
Emissions
System Noise
The fans run at low speed while idling and do not make a lot of noise. The fan did not turn up at all while idling during our test, only while turning the notebook on and off. The Aero 14 can also work silently. For this to happen, you have to set the fan profile to "Quiet" in the Gigabyte SmartManager. The fans do speed up noticeably under load. We measured a noise level of 53 dB(A) during the stress test. The device was not quite as loud during gaming: we measured values between 37 and 49 dB(A) (average: 46 dB(A)).
The cooling fans of the sister model that we have already tested produced an annoying whistling sound in the middle to high RPM range. This is not the case with our current test unit. However, you can hear an occasional coil whine from the insides of our device. But this can only be heard when the fans are standing still.
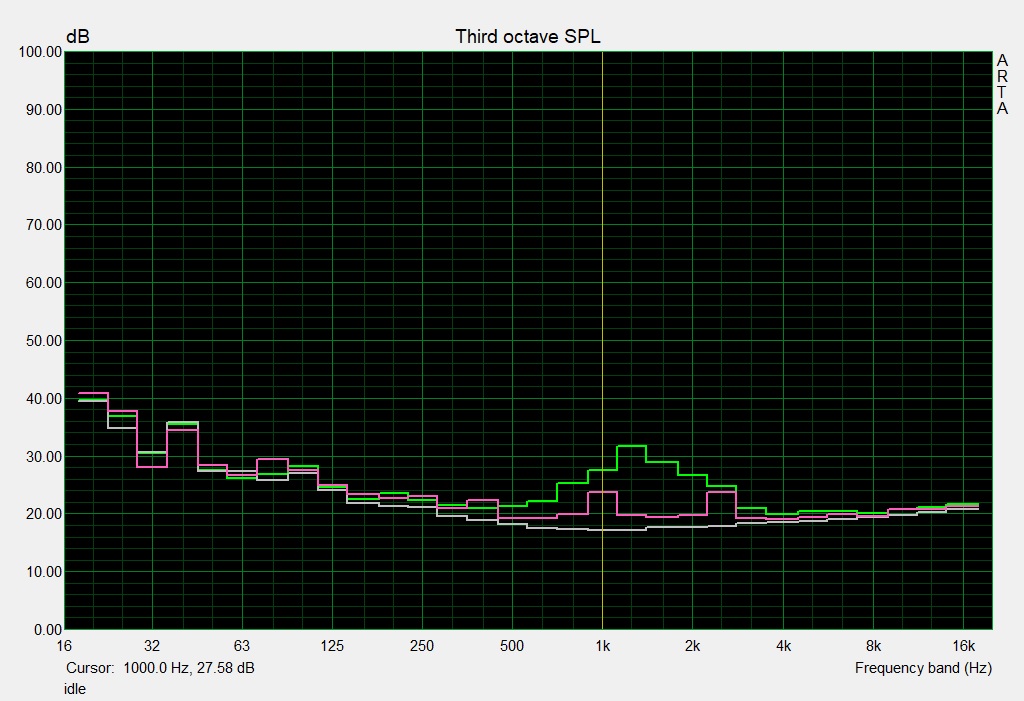
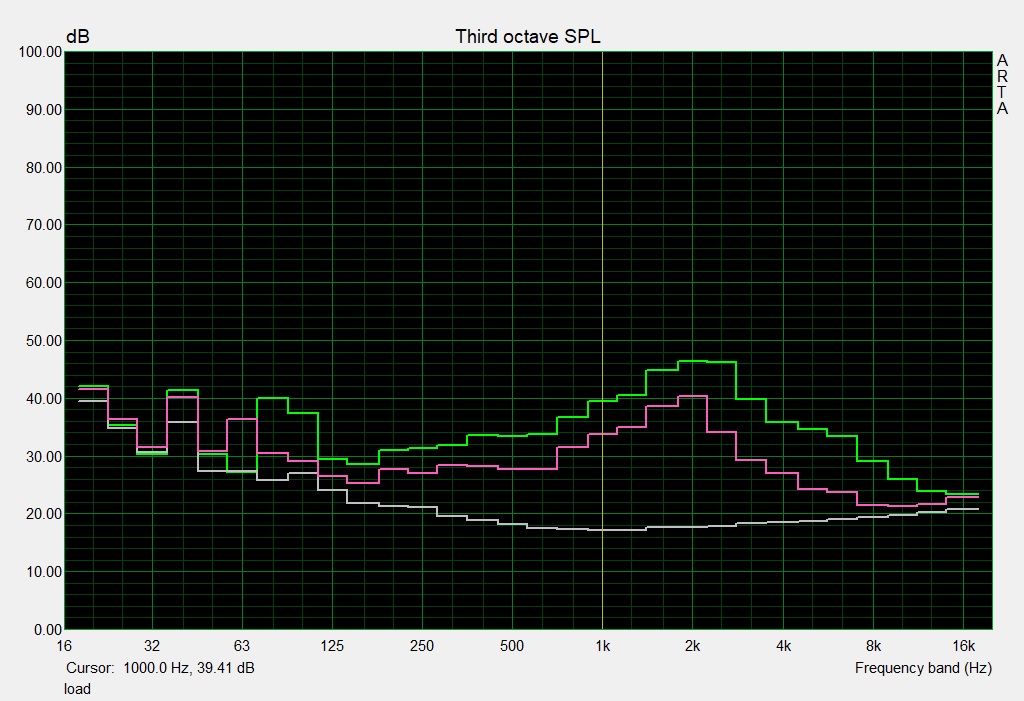
Noise level
| Idle |
| 32 / 33 / 38 dB(A) |
| Load |
| 46 / 53 dB(A) |
 | ||
30 dB silent 40 dB(A) audible 50 dB(A) loud |
||
min: | ||
| Gigabyte Aero 14-K7 i7-7700HQ, GeForce GTX 1050 Ti Mobile | Razer Blade (2017) i7-7700HQ, GeForce GTX 1060 Mobile | MSI GS43VR 7RE-069US i7-7700HQ, GeForce GTX 1060 Mobile | Schenker XMG P407 i7-7700HQ, GeForce GTX 1050 Ti Mobile | Gigabyte Aero 14 i7-7700HQ, GeForce GTX 1060 Mobile | |
|---|---|---|---|---|---|
| Noise | 6% | -5% | 5% | 4% | |
| off / environment * (dB) | 30 | 28 7% | 29 3% | 31 -3% | |
| Idle Minimum * (dB) | 32 | 30 6% | 33 -3% | 31 3% | 31 3% |
| Idle Average * (dB) | 33 | 30 9% | 34.5 -5% | 32 3% | 32 3% |
| Idle Maximum * (dB) | 38 | 30 21% | 35 8% | 36 5% | 33 13% |
| Load Average * (dB) | 46 | 51 -11% | 54.2 -18% | 43 7% | 42 9% |
| Witcher 3 ultra * (dB) | 46 | 56.7 -23% | 45 2% | ||
| Load Maximum * (dB) | 53 | 51 4% | 54.2 -2% | 48 9% | 53 -0% |
* ... smaller is better
Temperature
The Aero 14 completed our stress test (Prime 95 and FurMark running for at least one hour) differently depending on whether it was connected to power or running on battery. On power supply, the processor ran at 3 GHz and the graphics core had a speed of 1350 MHz. On battery, the CPU worked at just 800 MHz, while the GPU clock rate oscillated between 600 and 1600 MHz.
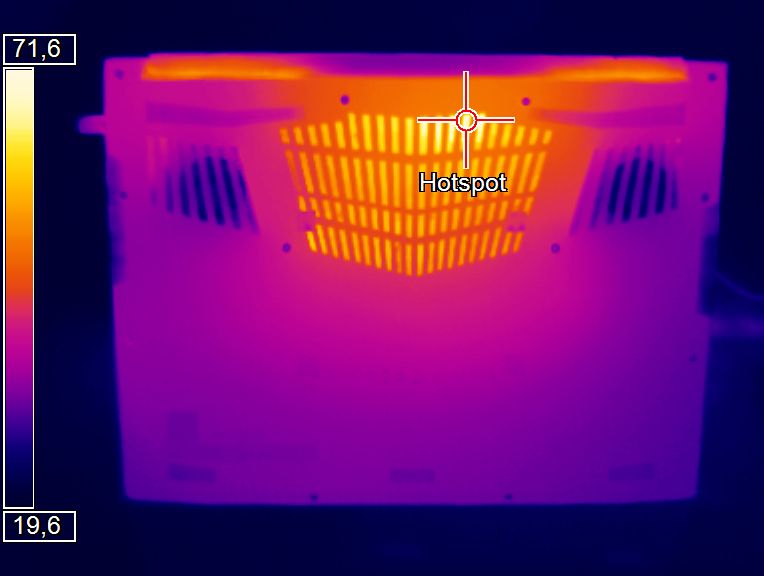
It is not surprising that the notebook heats up a lot under full load. After all, the high-performance hardware is squeezed into a compact case. We measured temperatures over 50 °C (~122 °F) in several areas during our stress test. The heat production was a little lower during our “Witcher 3” test (the game ran for one hour in Full HD resolution and maximum quality settings).
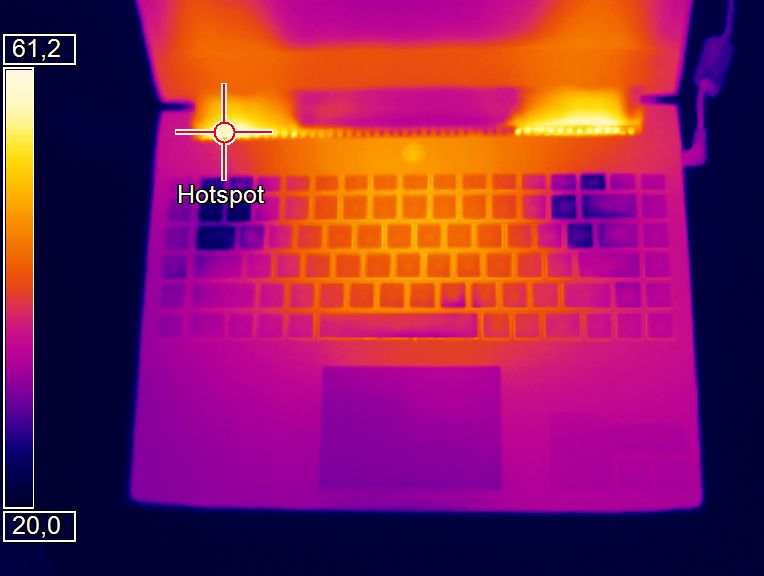
(-) The maximum temperature on the upper side is 51 °C / 124 F, compared to the average of 36.8 °C / 98 F, ranging from 21 to 71 °C for the class Multimedia.
(-) The bottom heats up to a maximum of 58 °C / 136 F, compared to the average of 39.1 °C / 102 F
(+) In idle usage, the average temperature for the upper side is 23.8 °C / 75 F, compared to the device average of 31.3 °C / 88 F.
(-) Playing The Witcher 3, the average temperature for the upper side is 40 °C / 104 F, compared to the device average of 31.3 °C / 88 F.
(+) The palmrests and touchpad are reaching skin temperature as a maximum (35 °C / 95 F) and are therefore not hot.
(-) The average temperature of the palmrest area of similar devices was 28.7 °C / 83.7 F (-6.3 °C / -11.3 F).
| Gigabyte Aero 14-K7 i7-7700HQ, GeForce GTX 1050 Ti Mobile | MSI GS43VR 7RE-069US i7-7700HQ, GeForce GTX 1060 Mobile | Schenker XMG P407 i7-7700HQ, GeForce GTX 1050 Ti Mobile | Gigabyte Aero 14 i7-7700HQ, GeForce GTX 1060 Mobile | |
|---|---|---|---|---|
| Heat | -15% | 3% | -2% | |
| Maximum Upper Side * (°C) | 51 | 47.8 6% | 49 4% | 58.3 -14% |
| Maximum Bottom * (°C) | 58 | 63.2 -9% | 50.8 12% | 59.8 -3% |
| Idle Upper Side * (°C) | 24 | 29.8 -24% | 26.3 -10% | 23.3 3% |
| Idle Bottom * (°C) | 25 | 33.2 -33% | 24.1 4% | 23.8 5% |
* ... smaller is better
Speakers
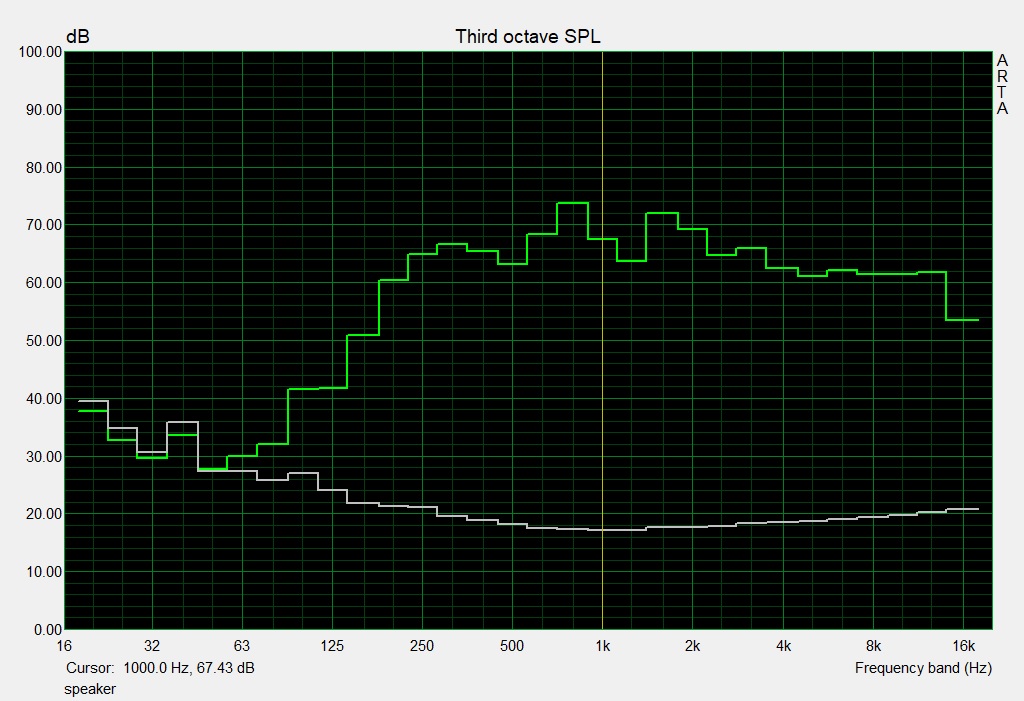
Gigabyte Aero 14-K7 audio analysis
(±) | speaker loudness is average but good (79 dB)
Bass 100 - 315 Hz
(±) | reduced bass - on average 10.5% lower than median
(±) | linearity of bass is average (13% delta to prev. frequency)
Mids 400 - 2000 Hz
(+) | balanced mids - only 4.7% away from median
(±) | linearity of mids is average (9.9% delta to prev. frequency)
Highs 2 - 16 kHz
(+) | balanced highs - only 1.7% away from median
(+) | highs are linear (4.1% delta to prev. frequency)
Overall 100 - 16.000 Hz
(+) | overall sound is linear (14.1% difference to median)
Compared to same class
» 32% of all tested devices in this class were better, 4% similar, 64% worse
» The best had a delta of 5%, average was 17%, worst was 45%
Compared to all devices tested
» 17% of all tested devices were better, 4% similar, 80% worse
» The best had a delta of 4%, average was 24%, worst was 134%
MSI GS43VR 7RE-069US audio analysis
(±) | speaker loudness is average but good (72 dB)
Bass 100 - 315 Hz
(-) | nearly no bass - on average 21.9% lower than median
(±) | linearity of bass is average (7.2% delta to prev. frequency)
Mids 400 - 2000 Hz
(+) | balanced mids - only 3.5% away from median
(±) | linearity of mids is average (7.6% delta to prev. frequency)
Highs 2 - 16 kHz
(±) | higher highs - on average 5.7% higher than median
(±) | linearity of highs is average (11% delta to prev. frequency)
Overall 100 - 16.000 Hz
(±) | linearity of overall sound is average (27.5% difference to median)
Compared to same class
» 93% of all tested devices in this class were better, 1% similar, 5% worse
» The best had a delta of 6%, average was 18%, worst was 132%
Compared to all devices tested
» 84% of all tested devices were better, 3% similar, 13% worse
» The best had a delta of 4%, average was 24%, worst was 134%
Frequency diagram in comparison (checkboxes can be turned on/off!)
Energy Management
Power Consumption
The power consumption goes up to 19 watts while idling. Here, the Aero 14 consumes a little more power than some of its competitors, which is due to the QHD display. During our stress test, the value rose to 149 watts and almost reached the power supply's limit (150 watts). Power consumption is lower while gaming and our notebook consumed about 95 watts during our “Witcher 3” test.
| Off / Standby | |
| Idle | |
| Load |
|
Key:
min: | |
| Gigabyte Aero 14-K7 i7-7700HQ, GeForce GTX 1050 Ti Mobile | Razer Blade (2017) i7-7700HQ, GeForce GTX 1060 Mobile | MSI GS43VR 7RE-069US i7-7700HQ, GeForce GTX 1060 Mobile | Schenker XMG P407 i7-7700HQ, GeForce GTX 1050 Ti Mobile | Gigabyte Aero 14 i7-7700HQ, GeForce GTX 1060 Mobile | |
|---|---|---|---|---|---|
| Power Consumption | 13% | 4% | -5% | 1% | |
| Idle Minimum * (Watt) | 9 | 7.5 17% | 9.1 -1% | 10 -11% | 8 11% |
| Idle Average * (Watt) | 14 | 12.1 14% | 11.9 15% | 15 -7% | 13 7% |
| Idle Maximum * (Watt) | 19 | 14.3 25% | 12.2 36% | 24 -26% | 20 -5% |
| Load Average * (Watt) | 84 | 73.5 12% | 77 8% | 82 2% | 78 7% |
| Witcher 3 ultra * (Watt) | 95 | 108 -14% | 126.4 -33% | 110 -16% | |
| Load Maximum * (Watt) | 149 | 110.2 26% | 153 -3% | 124 17% | 146 2% |
* ... smaller is better
Battery Runtime
Our practical Wi-Fi test lasted 8:56 hours with the Aero 14. For this, we simulate the load of accessing websites with the help of a script. We set the power profile to "balanced" and turn off power-saving functions. Display brightness is set to about 150 cd/m². During our video test, our Gigabyte device ran for 7:50h on battery. Here, we run the short film "Big Buck Bunny" (H.264-coded, 1920x1080p) in a loop. The communication modules and power-saving functions are turned off and brightness set to 150 cd/m².
The device's BIOS offers the option of turning off the dedicated graphics unit. But this function did not improve the battery runtime in our Wi-Fi test.
| Gigabyte Aero 14-K7 i7-7700HQ, GeForce GTX 1050 Ti Mobile, 94.24 Wh | Razer Blade (2017) i7-7700HQ, GeForce GTX 1060 Mobile, 70 Wh | MSI GS43VR 7RE-069US i7-7700HQ, GeForce GTX 1060 Mobile, 61 Wh | Schenker XMG P407 i7-7700HQ, GeForce GTX 1050 Ti Mobile, 45 Wh | Gigabyte Aero 14 i7-7700HQ, GeForce GTX 1060 Mobile, 94 Wh | |
|---|---|---|---|---|---|
| Battery runtime | 2% | -52% | -50% | -5% | |
| Reader / Idle (h) | 15.9 | 9 -43% | 7.4 -53% | 15.2 -4% | |
| H.264 (h) | 7.8 | 3.6 -54% | |||
| WiFi v1.3 (h) | 8.9 | 9.1 2% | 2.9 -67% | 4 -55% | 8.7 -2% |
| Load (h) | 2.4 | 1.3 -46% | 1.5 -37% | 2.2 -8% |
Verdict
Pros
Cons
Gigabyte's compact gamer can display all current computer games on its matte QHD screen, but buyers will have to forego the highest quality settings. The GeForce GTX 1050 Ti graphics core offers too little performance for this.
Gigabyte's 14-inch device combines high processing power with long battery runtimes.
The Aero also did a good job as an office device: The device has a very good keyboard and runs quietly to silently. And it also offers mobile use: Thanks to the well-dimensioned battery, the device has great battery runtimes, which puts some office notebooks to shame.
The fast NVMe SSD ensures a fast-running system. It would be possible to exchange the SSD, and this one does not offer a lot of space for a gamer with its capacity of 256 GB. There is also the possibility of installing a second M.2 SSD. The matte QHD screen is satisfying with stable viewing angles and a good contrast. Unfortunately, display brightness is rather low for a notebook of this price range.
Gigabyte Aero 14-K7
- 10/12/2017 v6 (old)
Sascha Mölck
Price comparison
