Gigabyte Aero 14 v8 (i7-8750H, GTX 1050 Ti, QHD) Laptop Review

We have the Gigabyte Aero 14 in for review following our recent look at the latest Aero 15X. Just like the latter device, Gigabyte has updated the Aero 14 from a quad-core Kaby Lake Core i7-7700HQ to Intel’s new Coffee Lake architecture, namely the hexa-core Core i7-8750H.
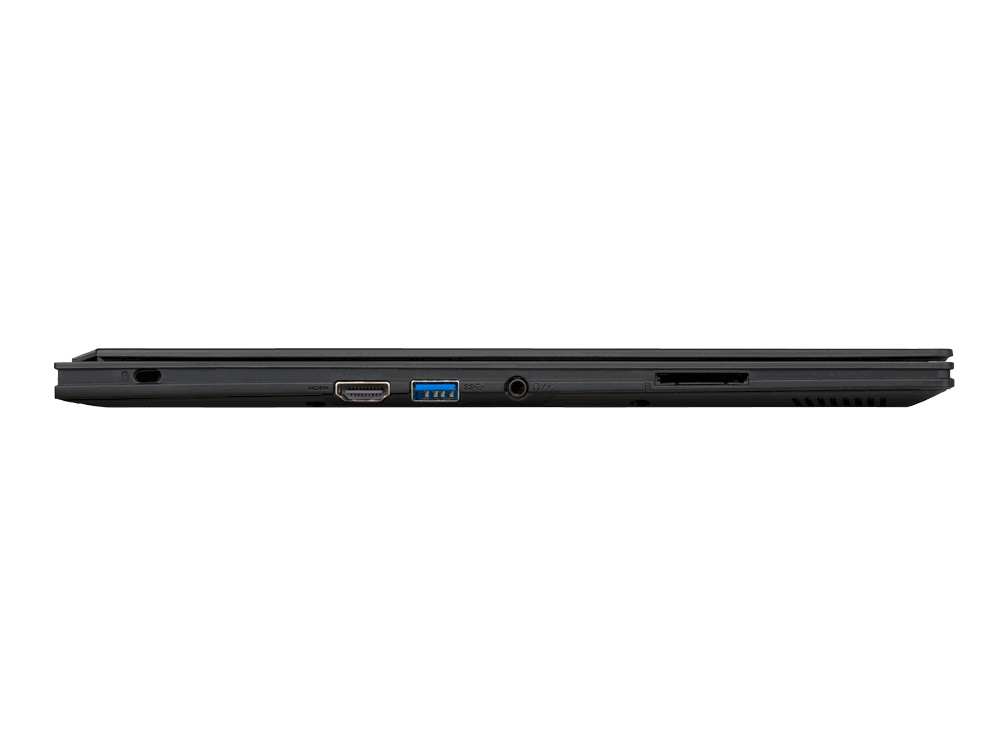
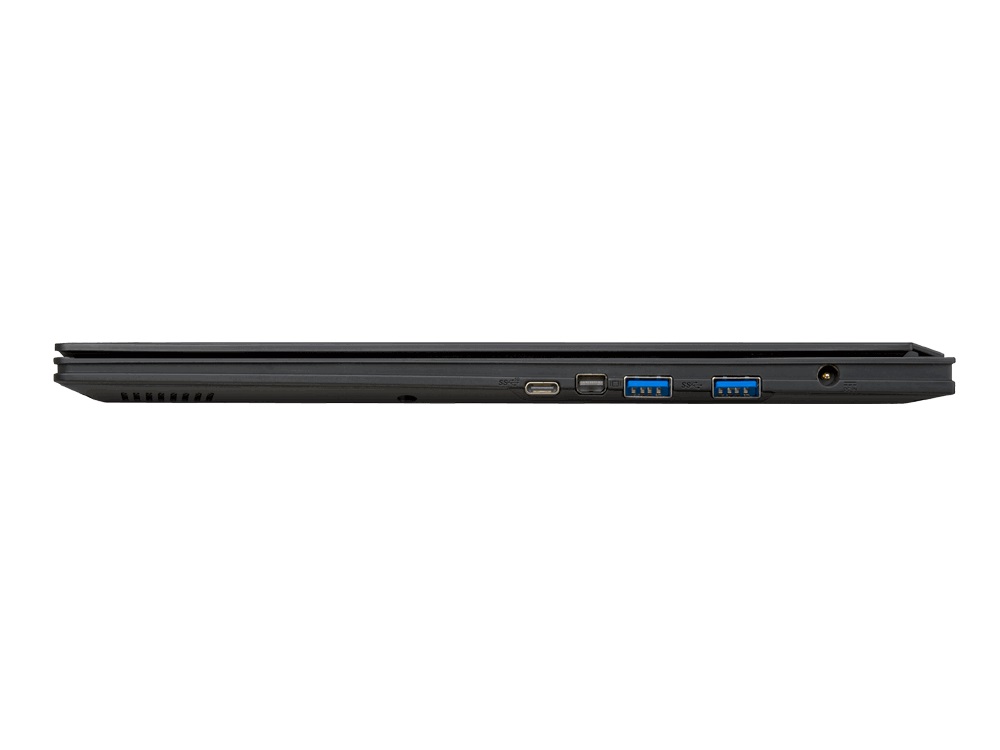
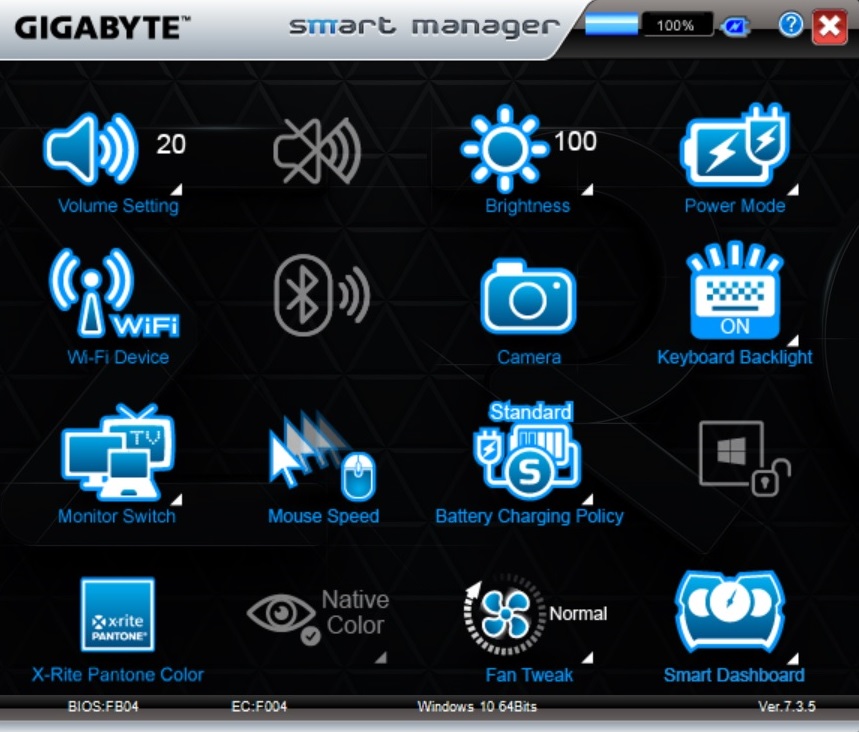
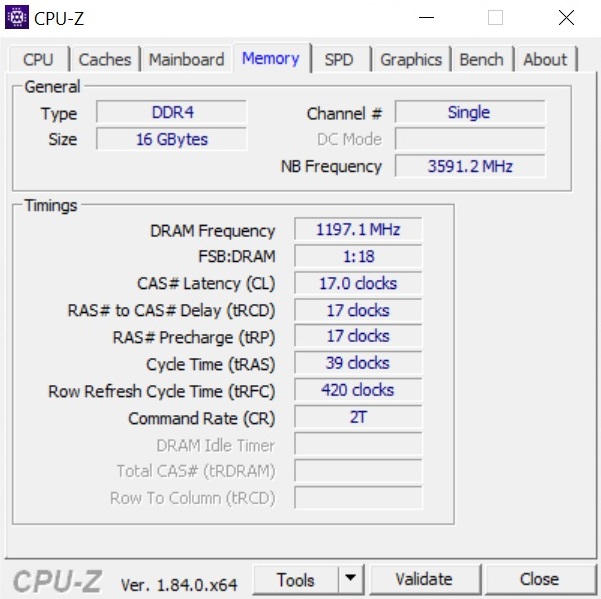
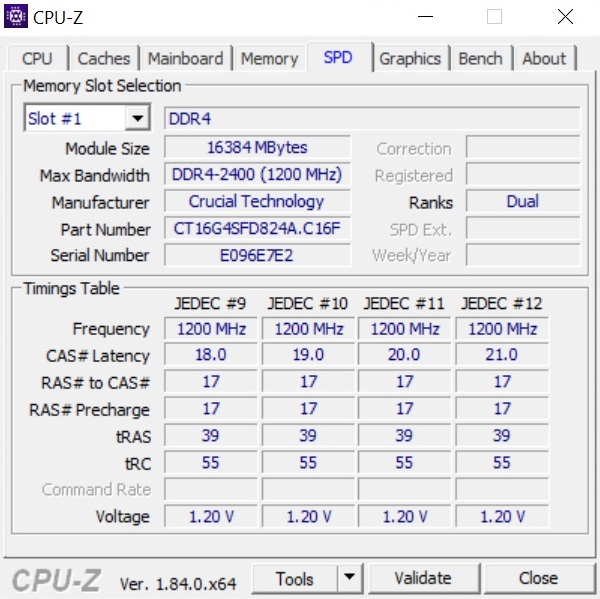
Besides the CPU upgrade, the Aero 14 mainly benefits from cosmetic upgrades. For example, more of the USB ports now support the current Gen 2 USB 3.1 standard, while Gigabyte has upgraded its Smart Manager program. Gigabyte has stuck with using DDR4 2400 RAM. By contrast, the Aero 15X is equipped with faster DDR4 2666 RAM.
At a first glance, the new Aero 14 has the same display and graphics card as its predecessor. The choice of an Nvidia GeForce GTX 1050 Ti and a 60 Hz 2560x1440 IPS display should position the Aero 14 as an all-around device and so as not to overwhelm its cooling system.
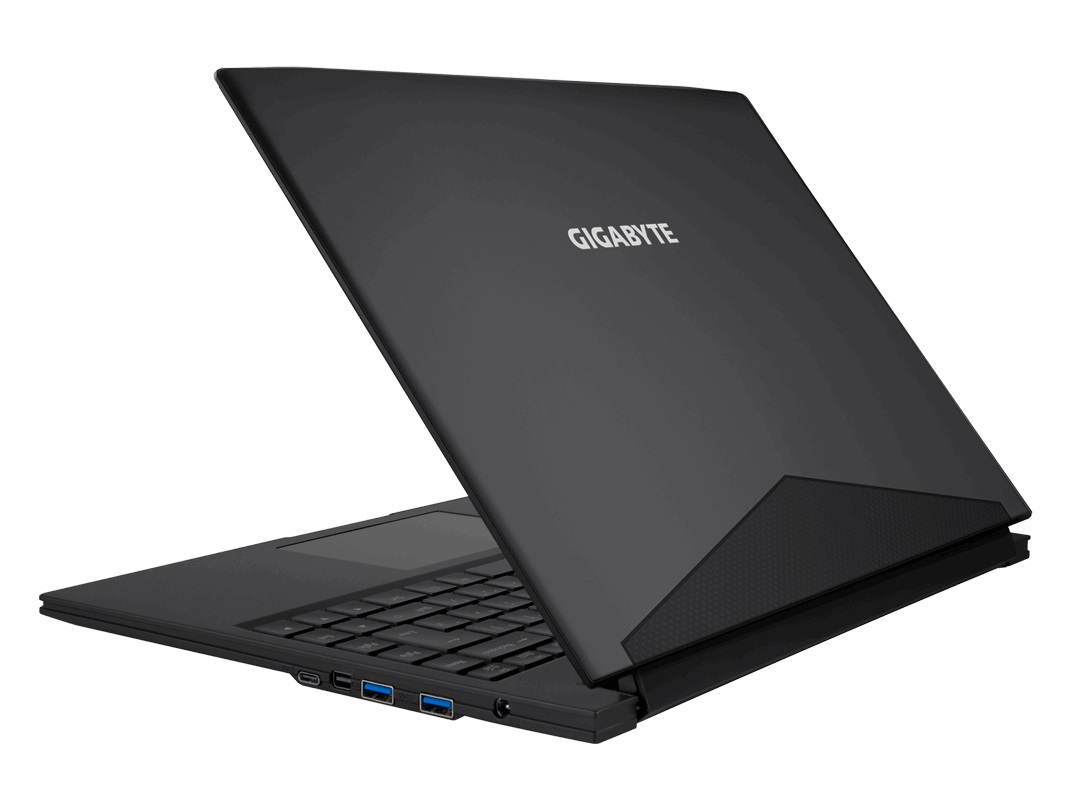
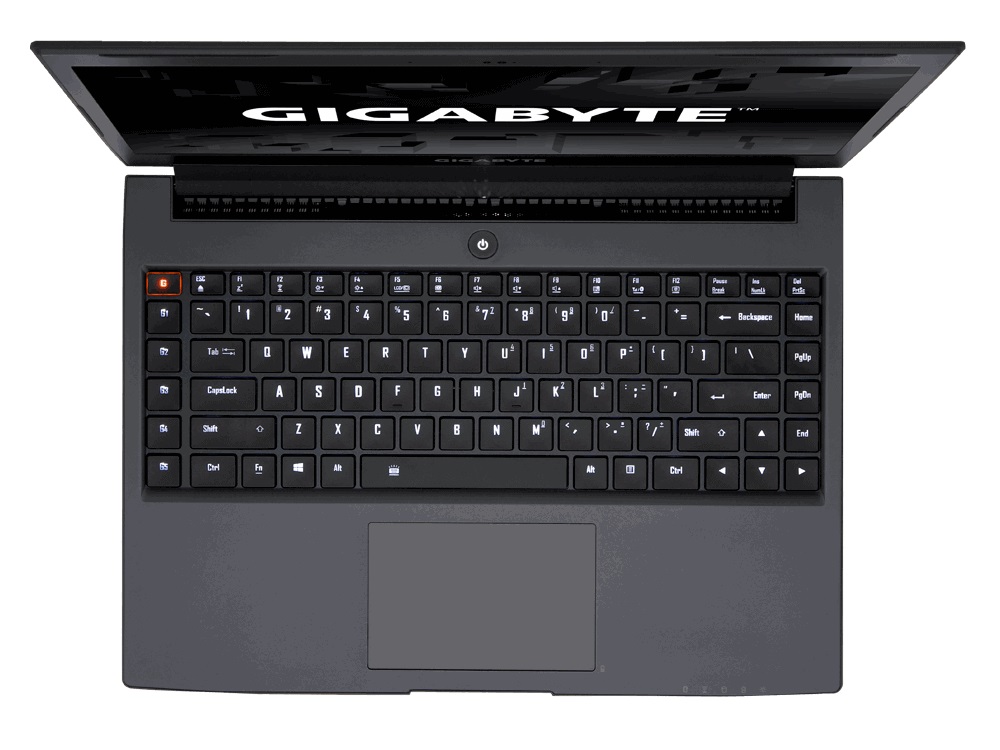
The Aero 14 competes among other 14-inch gaming notebooks like the Razer Blade, the MSI GS43VR and the Schenker XMG P407, against which we will be comparing the new Gigabyte laptop. When looking at comparative performance, bear in mind that all our comparison devices are powered by Kaby Lake processors, so they lack the power of Intel’s Coffee Lake architecture. Since this new Aero 14 shares so much with its 2017 predecessor, we will not examine the case, the connectivity or the input devices. Information on these areas can be found here.
| SD Card Reader | |
| average JPG Copy Test (av. of 3 runs) | |
| Average of class Multimedia (23 - 531, n=36, last 2 years) | |
| Gigabyte Aero 14-K8 (Toshiba Exceria Pro SDXC 64 GB UHS-II) | |
| Gigabyte Aero 14-K7 (Toshiba Exceria Pro SDXC 64 GB UHS-II)) | |
| Schenker XMG P407 (Toshiba Exceria Pro SDXC 64 GB UHS-II) | |
| MSI GS43VR 7RE-069US (Toshiba Exceria Pro SDXC 64 GB UHS-II) | |
| maximum AS SSD Seq Read Test (1GB) | |
| Average of class Multimedia (37.3 - 1455, n=35, last 2 years) | |
| Gigabyte Aero 14-K7 (Toshiba Exceria Pro SDXC 64 GB UHS-II)) | |
| Schenker XMG P407 (Toshiba Exceria Pro SDXC 64 GB UHS-II) | |
| Gigabyte Aero 14-K8 (Toshiba Exceria Pro SDXC 64 GB UHS-II) | |
| MSI GS43VR 7RE-069US (Toshiba Exceria Pro SDXC 64 GB UHS-II) | |
| Networking | |
| iperf3 transmit AX12 | |
| MSI GS43VR 7RE-069US | |
| Schenker XMG P407 | |
| Gigabyte Aero 14-K8 | |
| Gigabyte Aero 14-K7 | |
| iperf3 receive AX12 | |
| Gigabyte Aero 14-K8 | |
| Gigabyte Aero 14-K7 | |
| MSI GS43VR 7RE-069US | |
| Schenker XMG P407 | |
Display
While the new Aero 14 appears to share the same 14-inch 2560x1440 display as its predecessor, there are some significant differences. Gigabyte has gone with an AU Optronics display instead of the LG Philips display found in last year’s model. Additionally, there is no G-Sync this time around, possibly to improve battery life. Please see the table below for a more detailed comparison between the two displays.
| |||||||||||||||||||||||||
Brightness Distribution: 90 %
Center on Battery: 256 cd/m²
Contrast: 914:1 (Black: 0.28 cd/m²)
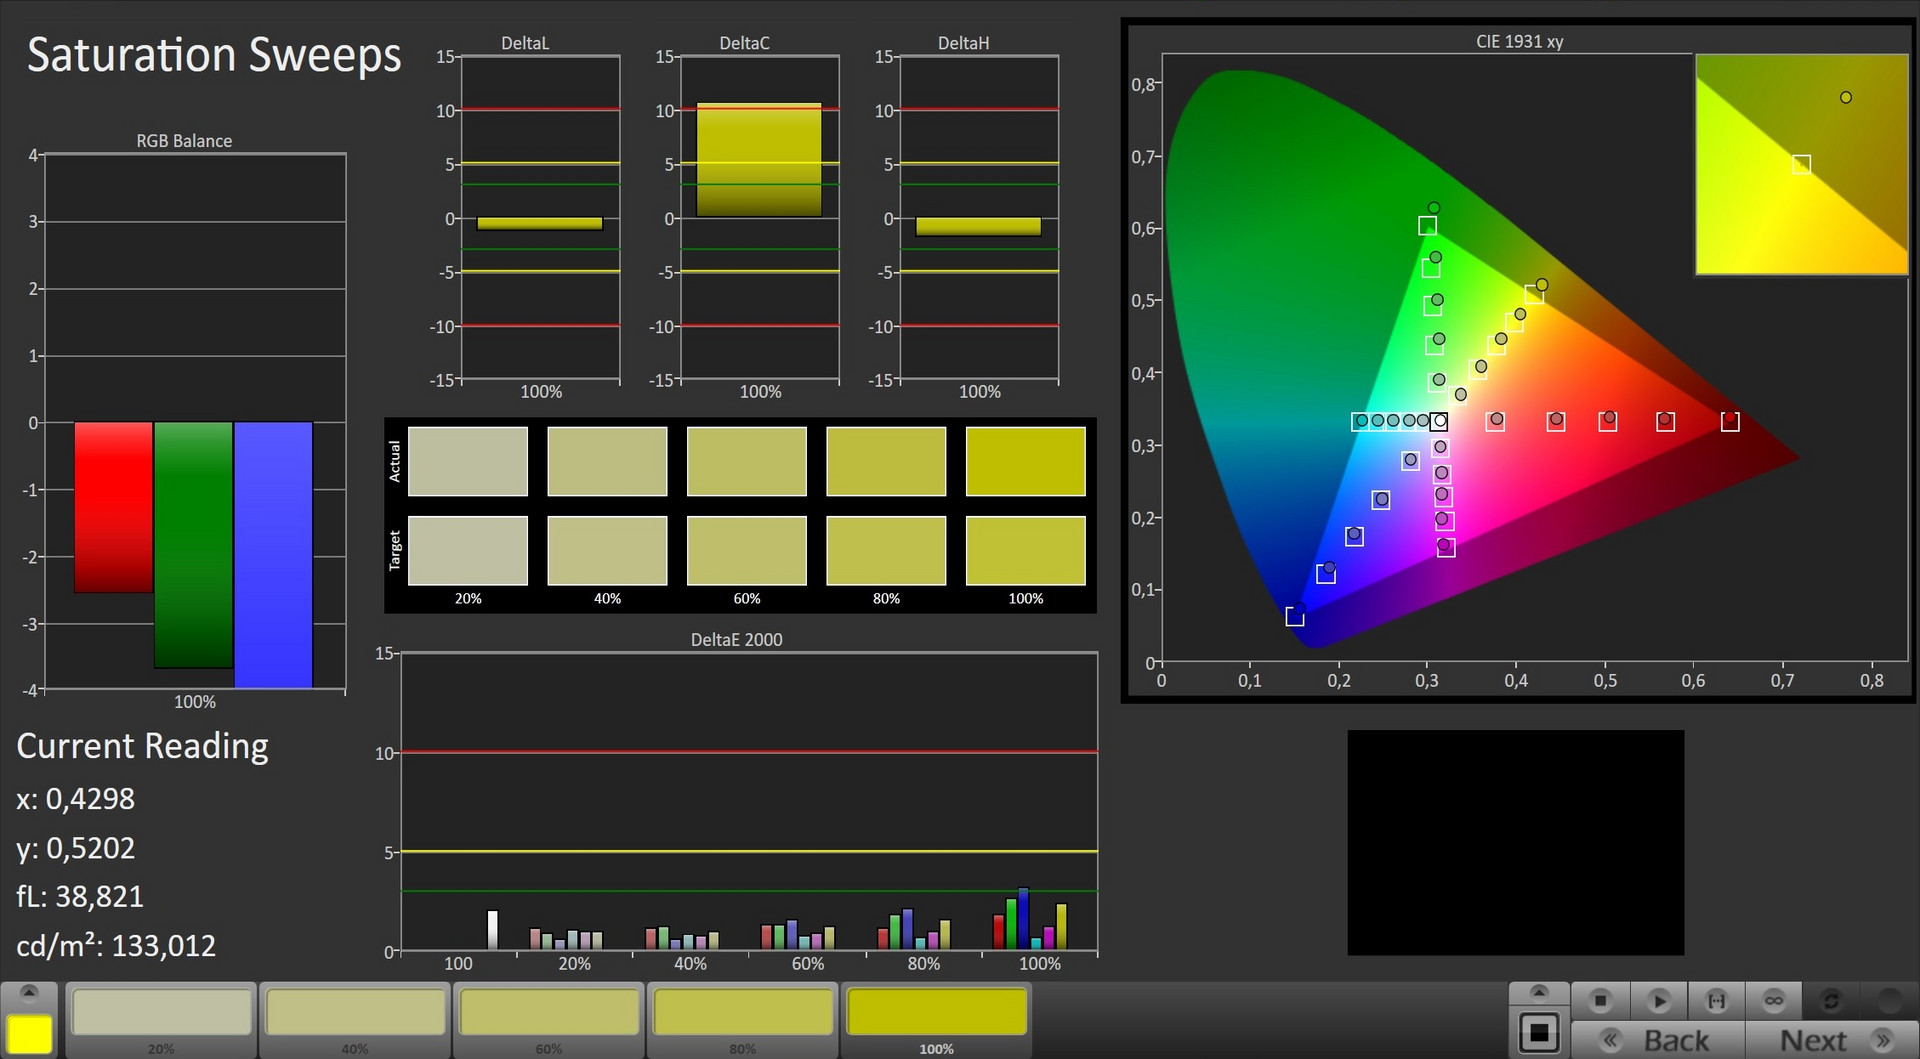
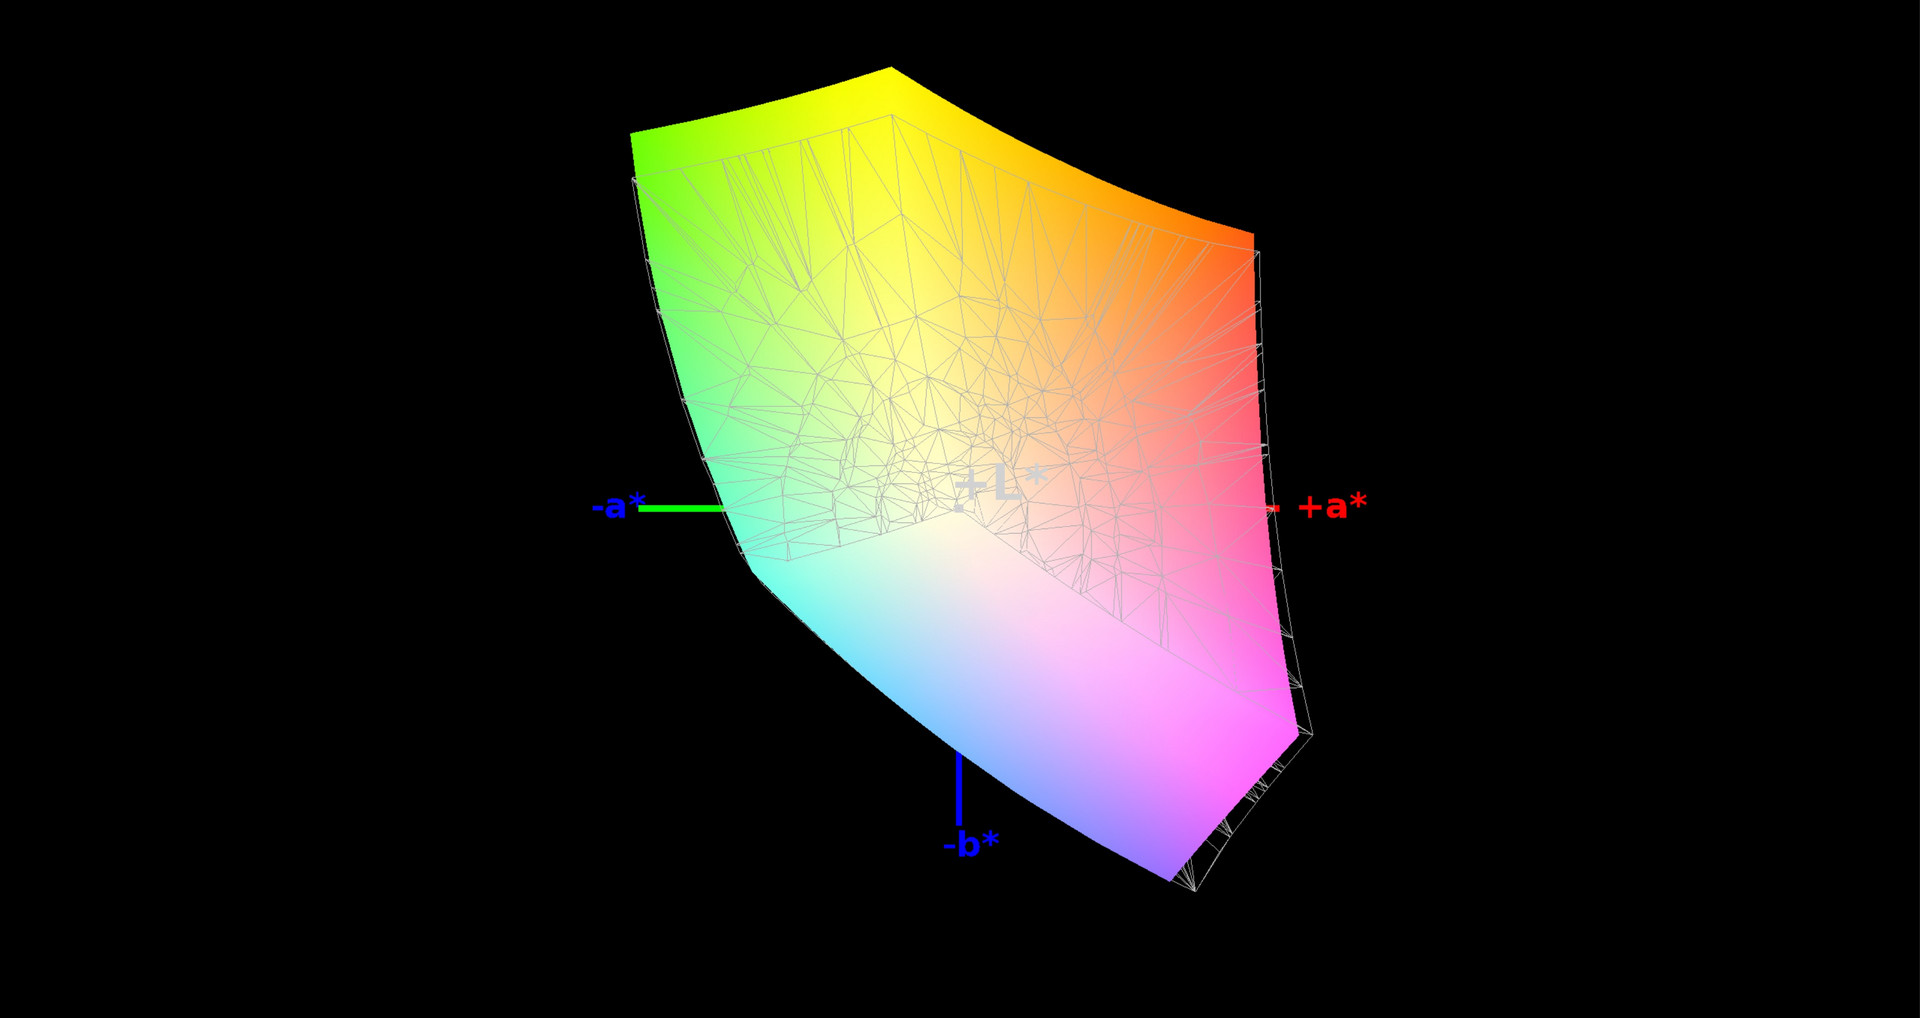
ΔE ColorChecker Calman: 1.21 | ∀{0.5-29.43 Ø4.71}
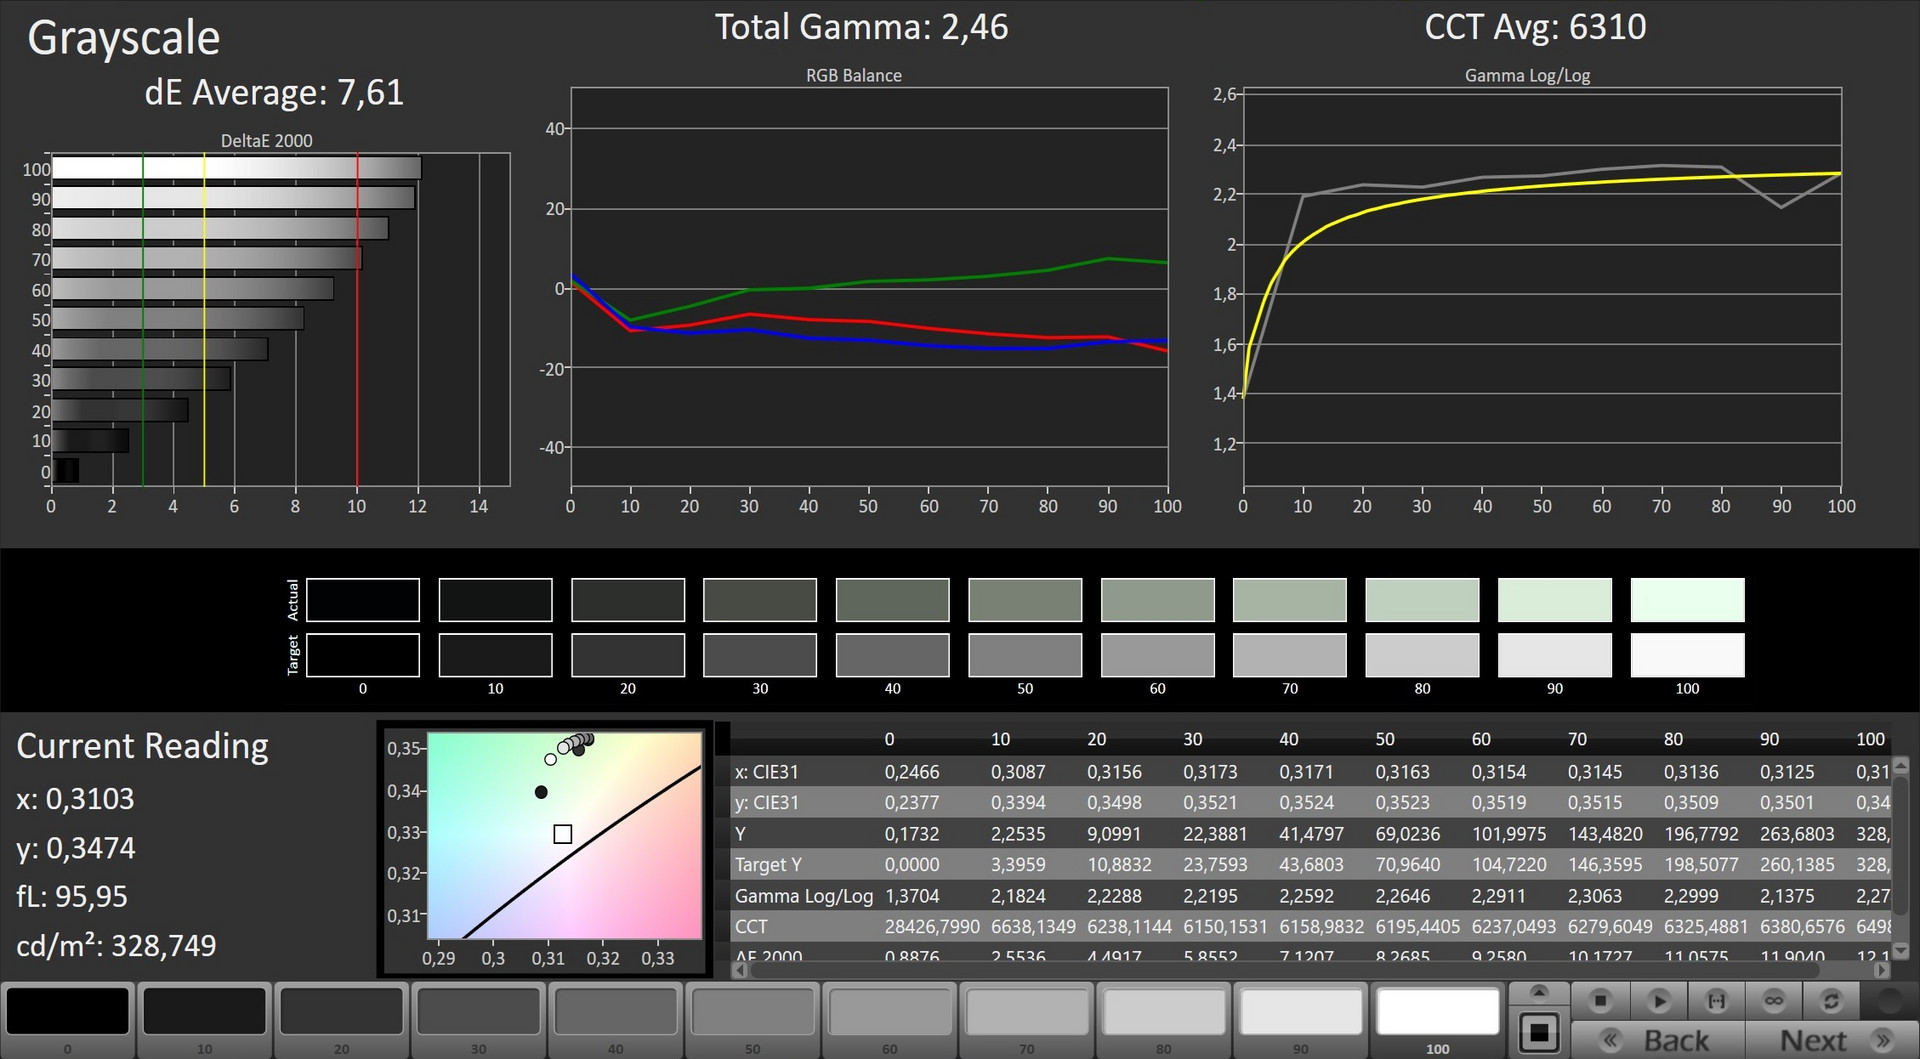
ΔE Greyscale Calman: 1.13 | ∀{0.09-98 Ø4.96}
96% sRGB (Argyll 1.6.3 3D)
62% AdobeRGB 1998 (Argyll 1.6.3 3D)
70.3% AdobeRGB 1998 (Argyll 3D)
96% sRGB (Argyll 3D)
69.1% Display P3 (Argyll 3D)
Gamma: 2.42
CCT: 6422 K
| Gigabyte Aero 14-K8 AU Optronics B140QAN01.5 (AUO1536), IPS, 2560x1440 | Gigabyte Aero 14-K7 LG Philips LP140QH1-SPF1 (LGD049A), IPS, 2560x1440 | Schenker XMG P407 LG Philips LP140WF3-SPD1 (LGD046D), IPS, 1920x1080 | MSI GS43VR 7RE-069US ID: LGD046D, Name: LG Philips LP140WF3-SPD1, IPS, 1920x1080 | Razer Blade (2017) LP140WF3-SPD1, IPS, 1920x1080 | |
|---|---|---|---|---|---|
| Display | -6% | -12% | -9% | ||
| Display P3 Coverage (%) | 69.1 | 65.1 -6% | 64.5 -7% | 66.3 -4% | |
| sRGB Coverage (%) | 96 | 91.2 -5% | 82.1 -14% | 85.9 -11% | |
| AdobeRGB 1998 Coverage (%) | 70.3 | 65.9 -6% | 60 -15% | 62.8 -11% | |
| Response Times | 21% | 11% | 39% | 37% | |
| Response Time Grey 50% / Grey 80% * (ms) | 47.2 ? | 40 ? 15% | 47 ? -0% | 31.6 ? 33% | 25.2 ? 47% |
| Response Time Black / White * (ms) | 34 ? | 25.2 ? 26% | 27 ? 21% | 19.2 ? 44% | 24.8 ? 27% |
| PWM Frequency (Hz) | 130 ? | 21190 ? | 21370 | ||
| Screen | -82% | -82% | -59% | -85% | |
| Brightness middle (cd/m²) | 256 | 277 8% | 298 16% | 306.6 20% | 272 6% |
| Brightness (cd/m²) | 250 | 252 1% | 282 13% | 291 16% | 277 11% |
| Brightness Distribution (%) | 90 | 84 -7% | 80 -11% | 86 -4% | 84 -7% |
| Black Level * (cd/m²) | 0.28 | 0.27 4% | 0.27 4% | 0.28 -0% | 0.26 7% |
| Contrast (:1) | 914 | 1026 12% | 1104 21% | 1095 20% | 1046 14% |
| Colorchecker dE 2000 * | 1.21 | 4.26 -252% | 4.42 -265% | 3.9 -222% | 4.59 -279% |
| Colorchecker dE 2000 max. * | 2.11 | 8.37 -297% | 8.57 -306% | 9 -327% | 8.49 -302% |
| Greyscale dE 2000 * | 1.13 | 4.32 -282% | 4.11 -264% | 2 -77% | 4.28 -279% |
| Gamma | 2.42 91% | 2.37 93% | 2.5 88% | 2.14 103% | 2.23 99% |
| CCT | 6422 101% | 7298 89% | 6329 103% | 6626 98% | 6848 95% |
| Color Space (Percent of AdobeRGB 1998) (%) | 62 | 59 -5% | 54 -13% | 56.1 -10% | 55 -11% |
| Color Space (Percent of sRGB) (%) | 96 | 91 -5% | 82 -15% | 86.1 -10% | 83 -14% |
| Total Average (Program / Settings) | -22% /
-53% | -28% /
-56% | -10% /
-36% | -24% /
-65% |
* ... smaller is better
While the contrast of this year’s display is slightly lower than that of last year’s Aero 14, the new Aero 14 has better brightness uniformity and color-space accuracy than last year’s model.
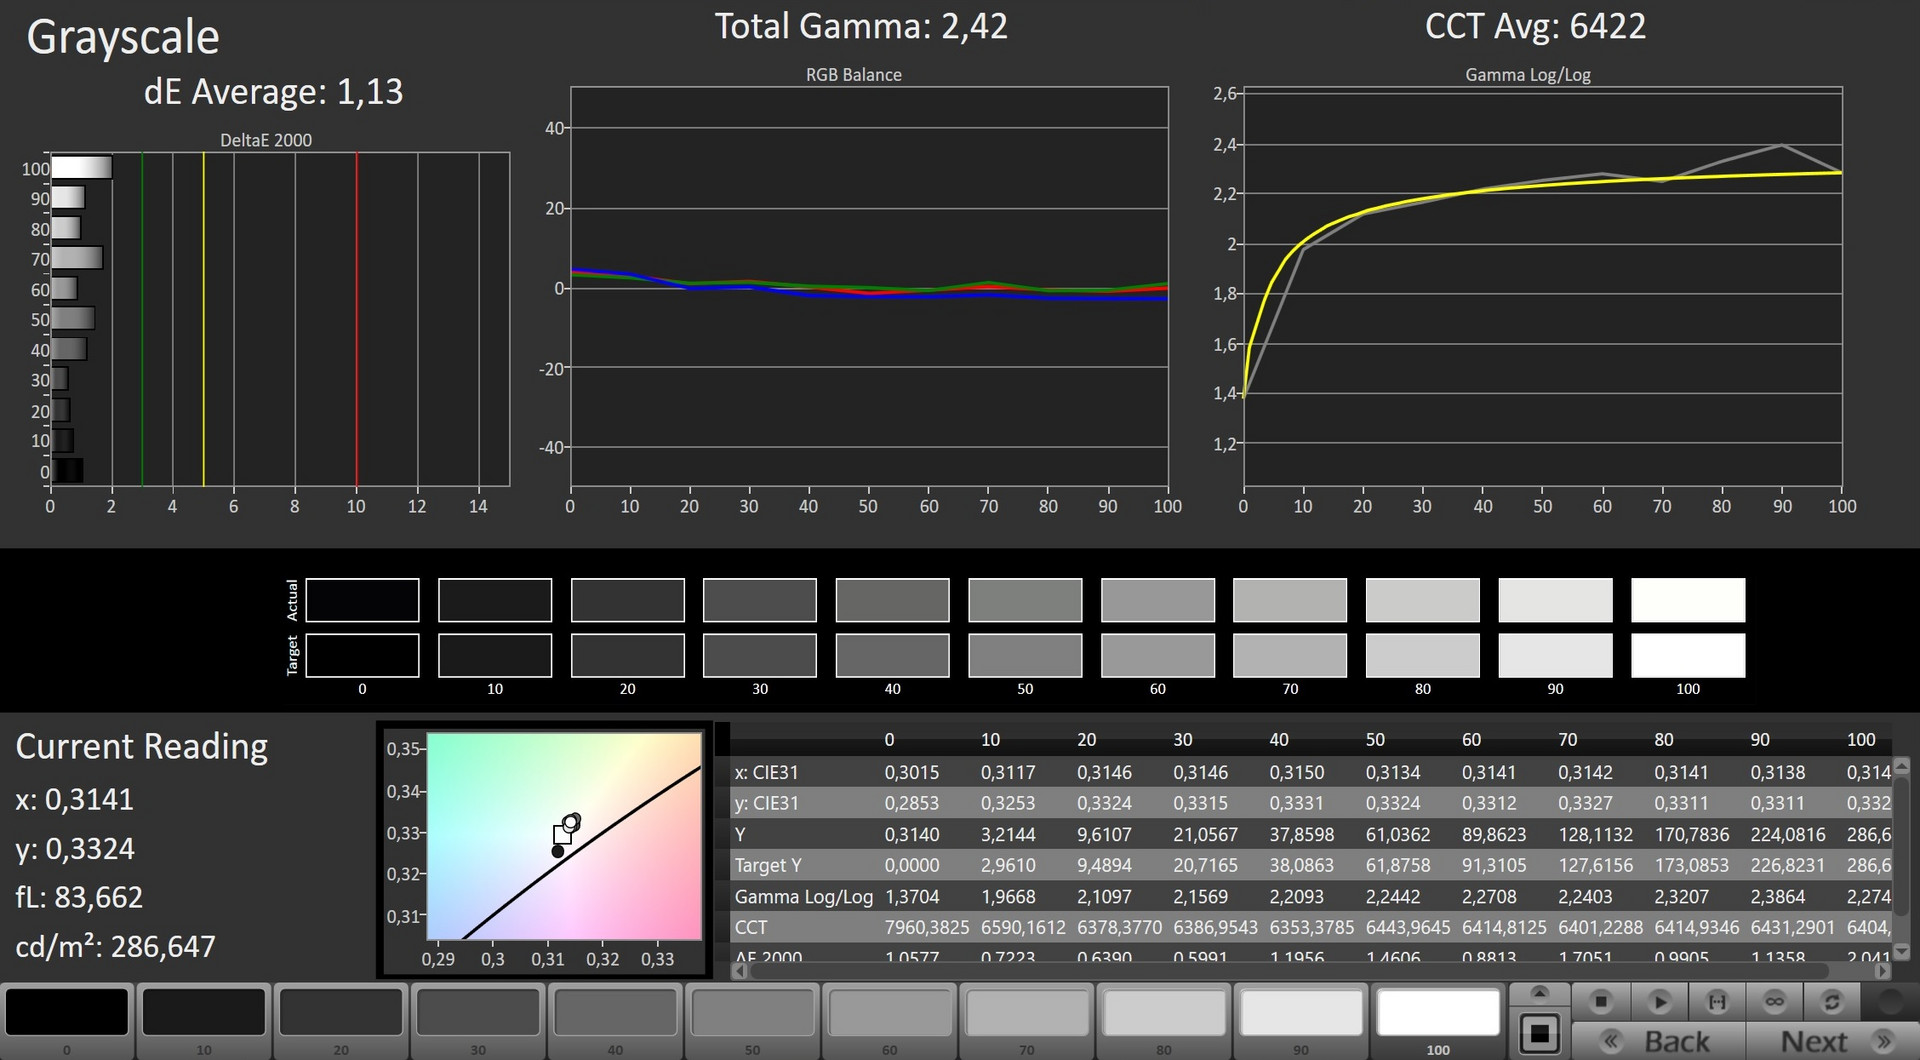
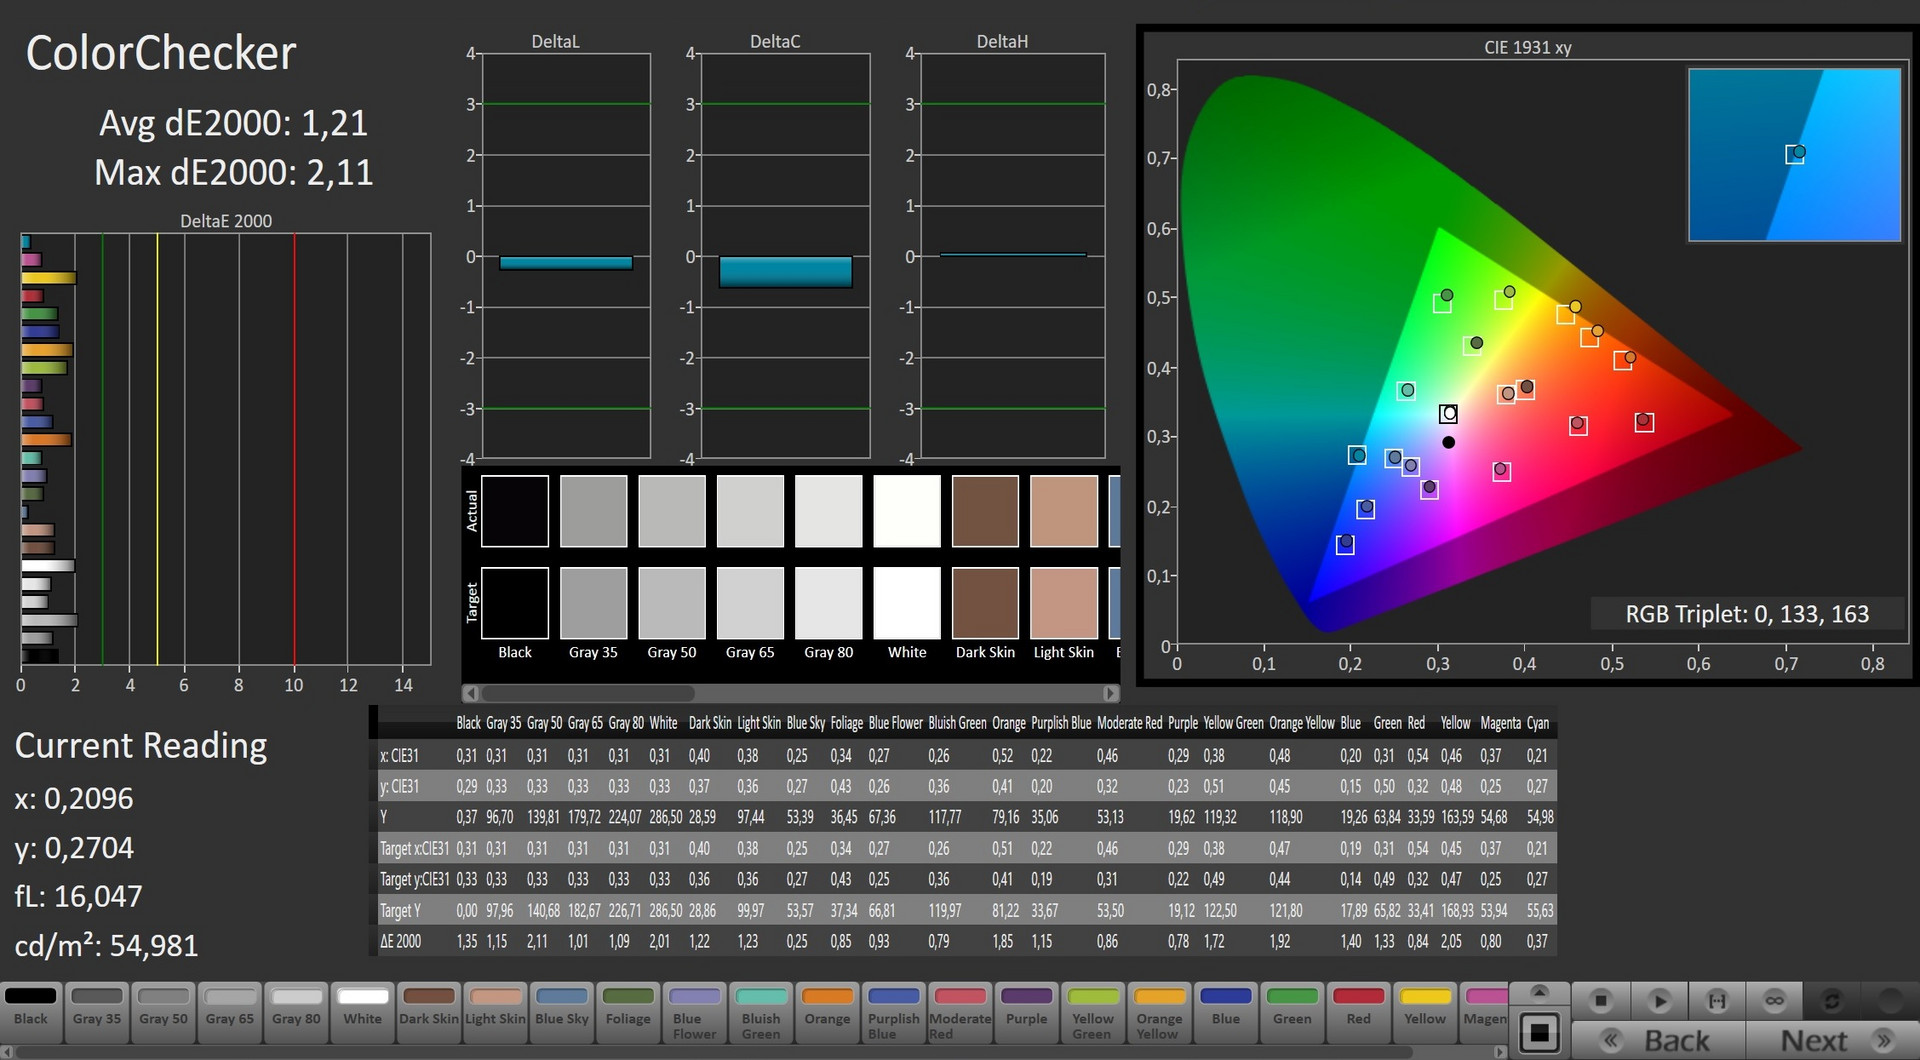
The Aero 14 has the X-Rite Pantone certification to thank for its high display color accuracy. Testing last year’s model in Native Color model with the X-Rite profile measurements from this year’s model resulted in significantly better results and higher scores for last year’s Aero 14.

Unfortunately, the QHD display has comparatively poor response times. Some gamers may be put off by 34 ms black-to-white and 47 ms gray-to-gray reaction times. By contrast, last year’s LG panel responded in 25 and 40 ms, respectively.
Display Response Times
| ↔ Response Time Black to White | ||
|---|---|---|
| 34 ms ... rise ↗ and fall ↘ combined | ↗ 19.6 ms rise | 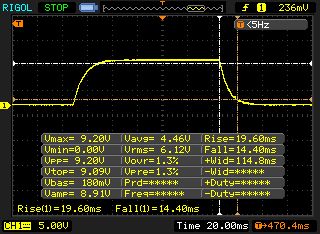 |
| ↘ 14.4 ms fall | ||
| The screen shows slow response rates in our tests and will be unsatisfactory for gamers. In comparison, all tested devices range from 0.1 (minimum) to 240 (maximum) ms. » 91 % of all devices are better. This means that the measured response time is worse than the average of all tested devices (19.8 ms). | ||
| ↔ Response Time 50% Grey to 80% Grey | ||
| 47.2 ms ... rise ↗ and fall ↘ combined | ↗ 24 ms rise | 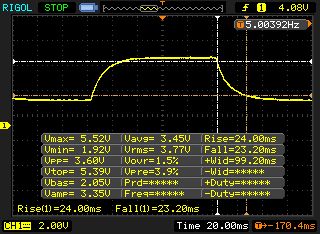 |
| ↘ 23.2 ms fall | ||
| The screen shows slow response rates in our tests and will be unsatisfactory for gamers. In comparison, all tested devices range from 0.165 (minimum) to 636 (maximum) ms. » 82 % of all devices are better. This means that the measured response time is worse than the average of all tested devices (30.9 ms). | ||
Screen Flickering / PWM (Pulse-Width Modulation)
| Screen flickering / PWM not detected | 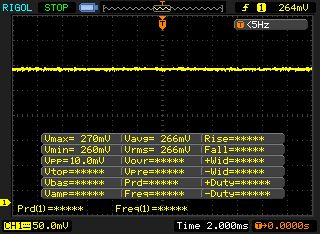 | ||
In comparison: 52 % of all tested devices do not use PWM to dim the display. If PWM was detected, an average of 7748 (minimum: 5 - maximum: 343500) Hz was measured. | |||
Performance
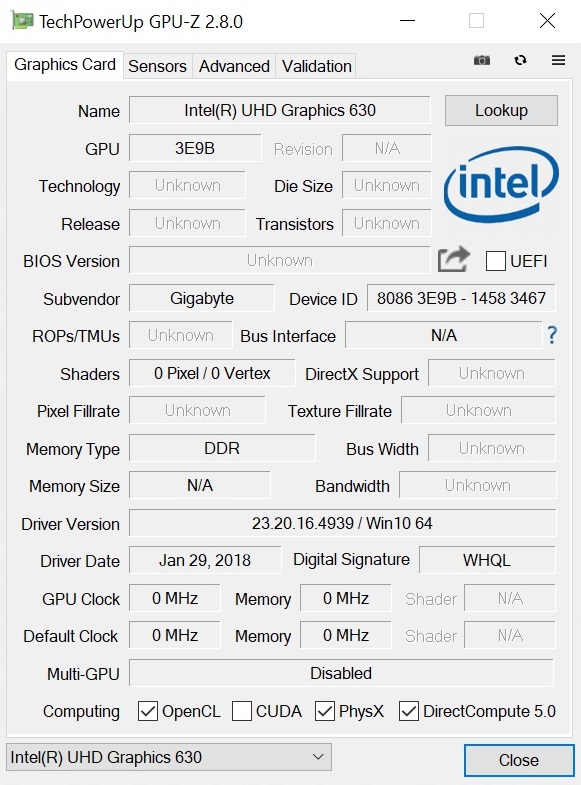
The Aero 14 is primarily a multimedia notebook that, thanks to modern technology, is also suitable for occasional gamers. For example, Nvidia Optimus technology reduces power consumption by only turning on the dedicated GPU when needed. This means that the integrated Intel UHD Graphics 630 chip handles graphics when the Aero 14 is idling or running graphically undemanding tasks like office programs, watching videos or browsing the web.
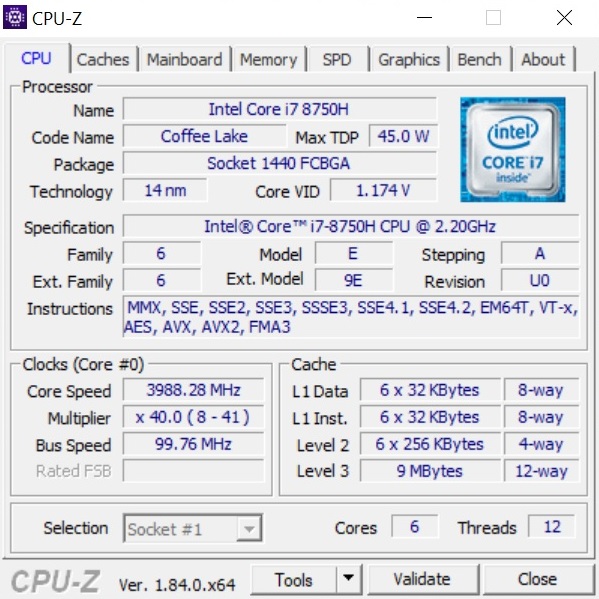
Processor
Intel has released the Coffee Lake series in response to AMD’s Ryzen processors. Coffee Lake CPUs not only have ample clock speeds, but they also have many cores.
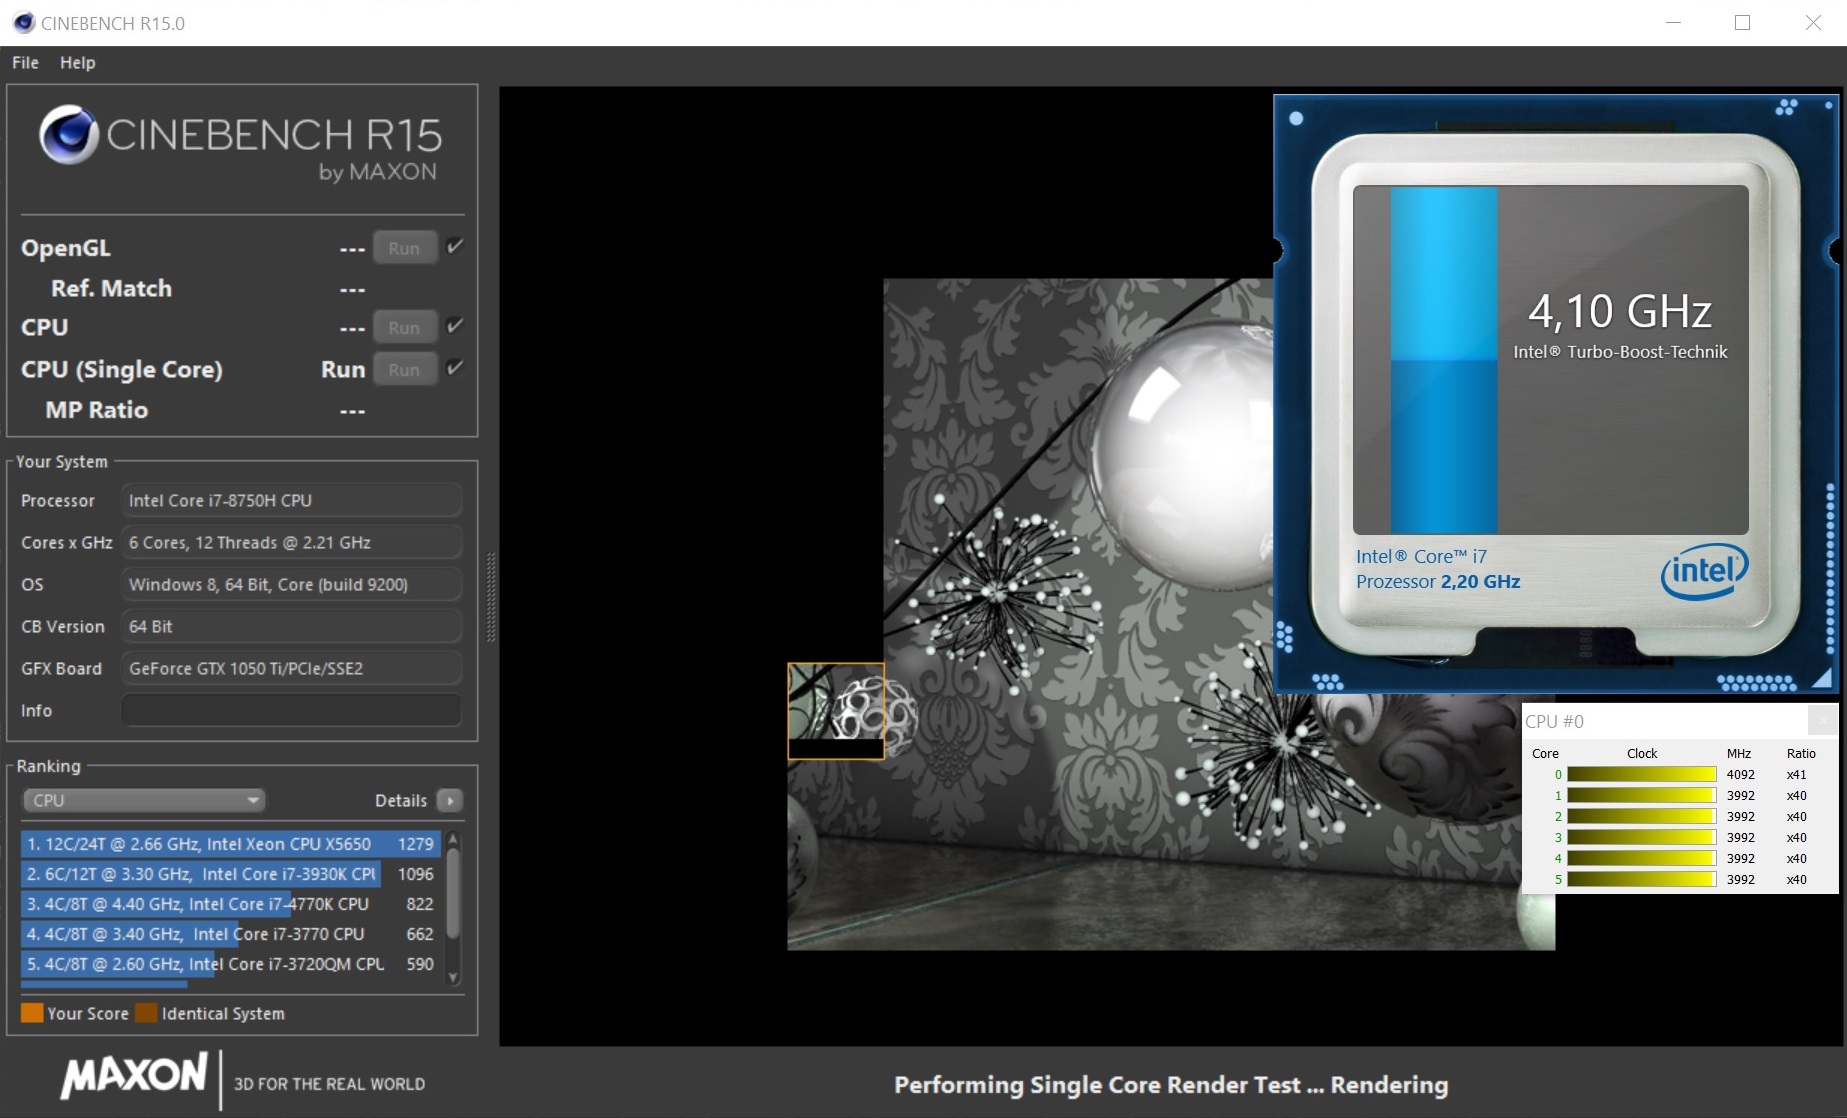
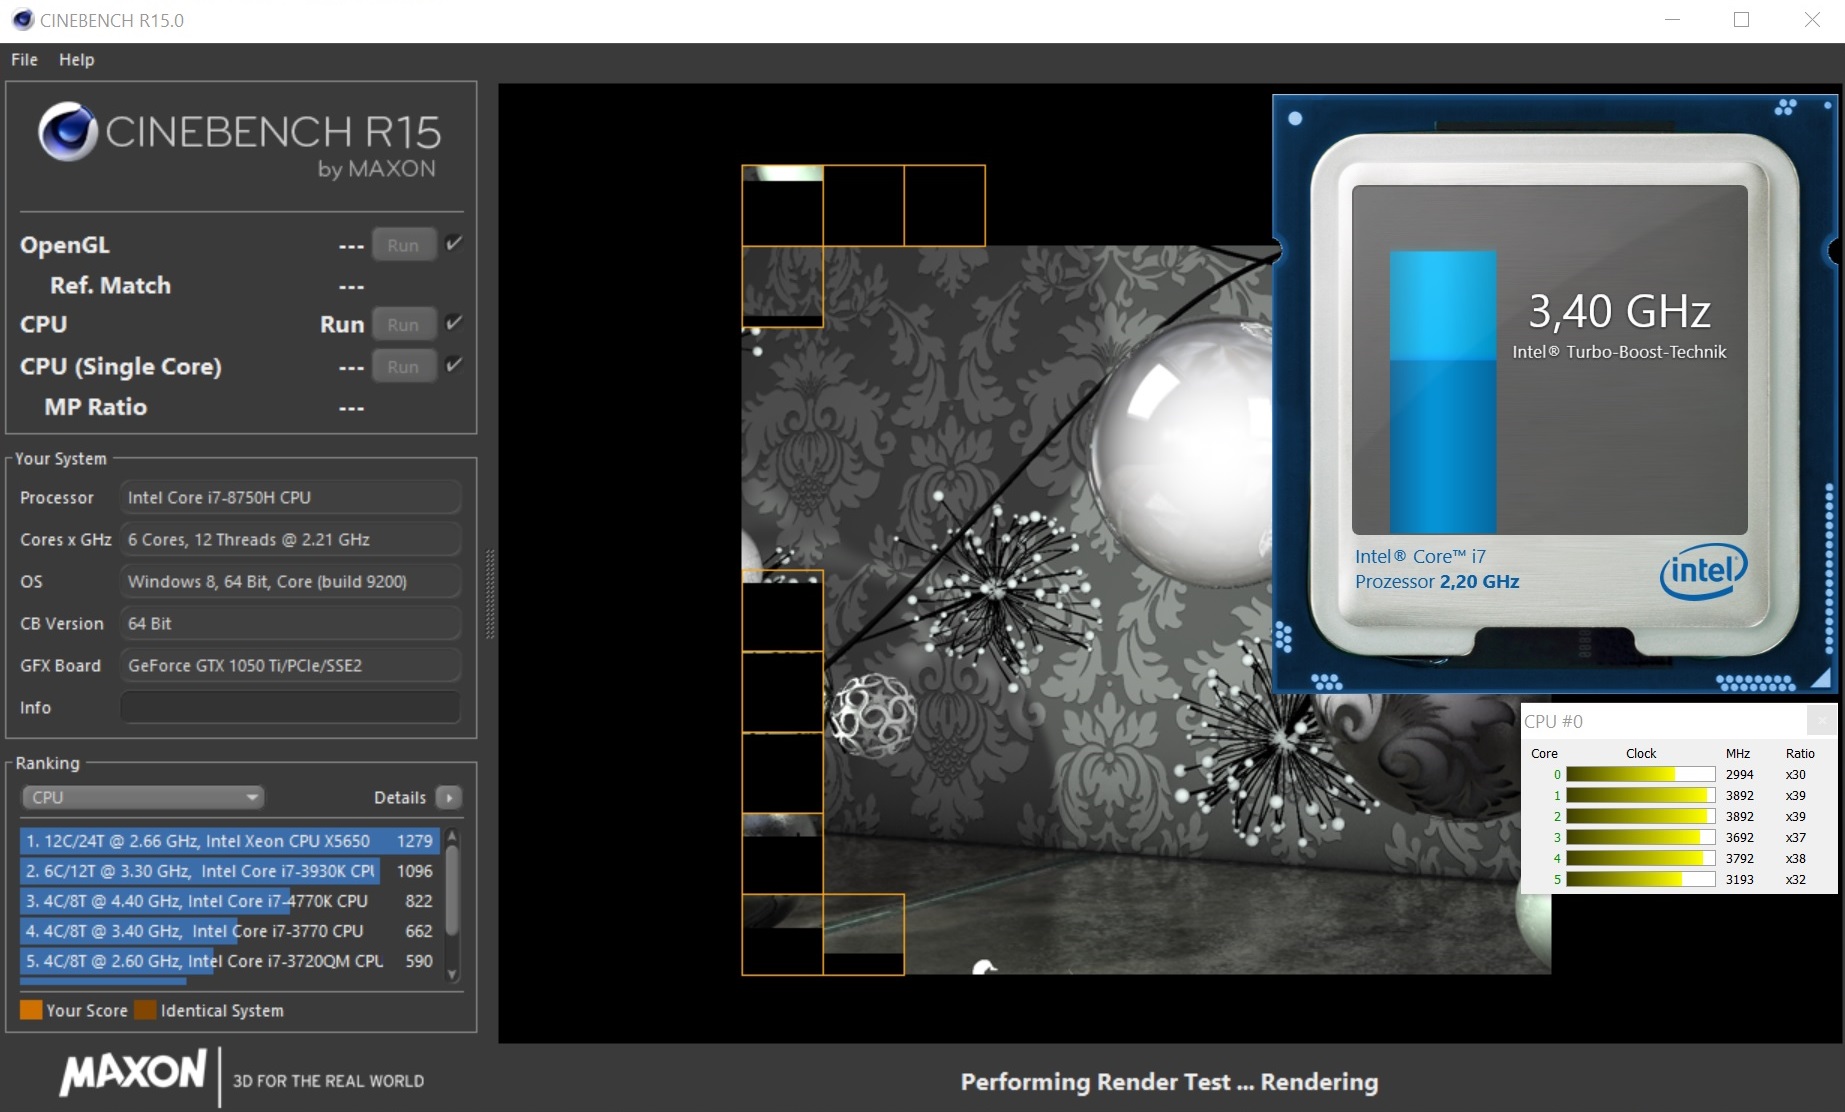
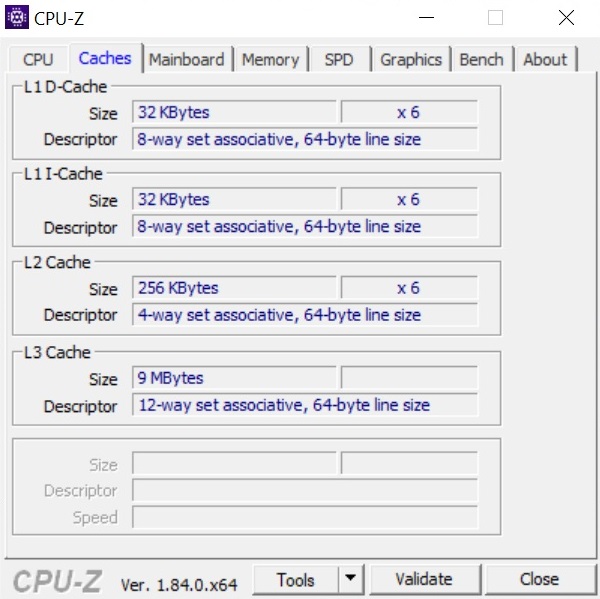
While the Kaby Lake generation brought quad-core CPUs to notebooks en masse, Coffee Lake introduces six-core processors with 12 threads in parallel thanks to Hyper-Threading. The Aero 14 is powered by an Intel Core i7-8750H that has 9 MB L3 cache and a clock speed up to 4.1 GHz.
The Core i7-8750H leaves the older Core i7-7700HQ far behind in benchmarks despite not always working at its maximum potential Turbo Boost speed of 3.9 GHz. In multi-core tests, the Core i7-8750H fluctuates between 2.2 and 3.9 GHz. In Cinebench R15 and Cinebench R11.5, the Aero 14 performs up to 43 and 48% faster than its predecessor.
System Performance
The Aero 14 performs well but potentially not as good as it could. While the Aero 14 outperformed its predecessor by 9% in PCMark 10, the 2018 model has a significantly slower SSD than its predecessor. In daily use though, the Aero 14 boots quickly and is as snappy as we have come to expect from a modern notebook.
We must also praise the Aero 14 for its consistency when running on either battery or on mains power. The Witcher 3 ran just 10% slower on battery than it did on mains power. Typically, 3D performance is far worse on battery than on mains power for other notebooks.
| PCMark 10 - Score | |
| Average of class Multimedia (4325 - 10386, n=51, last 2 years) | |
| MSI GS43VR 7RE-069US | |
| Gigabyte Aero 14-K8 | |
| Gigabyte Aero 14-K7 | |
| PCMark 8 | |
| Home Score Accelerated v2 | |
| Average of class Multimedia (n=1last 2 years) | |
| Schenker XMG P407 | |
| Gigabyte Aero 14-K7 | |
| Razer Blade (2017) | |
| MSI GS43VR 7RE-069US | |
| Gigabyte Aero 14-K8 | |
| Work Score Accelerated v2 | |
| Schenker XMG P407 | |
| Razer Blade (2017) | |
| Gigabyte Aero 14-K8 | |
| Gigabyte Aero 14-K7 | |
| MSI GS43VR 7RE-069US | |
| PCMark 8 Home Score Accelerated v2 | 3894 points | |
| PCMark 8 Work Score Accelerated v2 | 4973 points | |
| PCMark 10 Score | 4750 points | |
Help | ||
Storage Devices
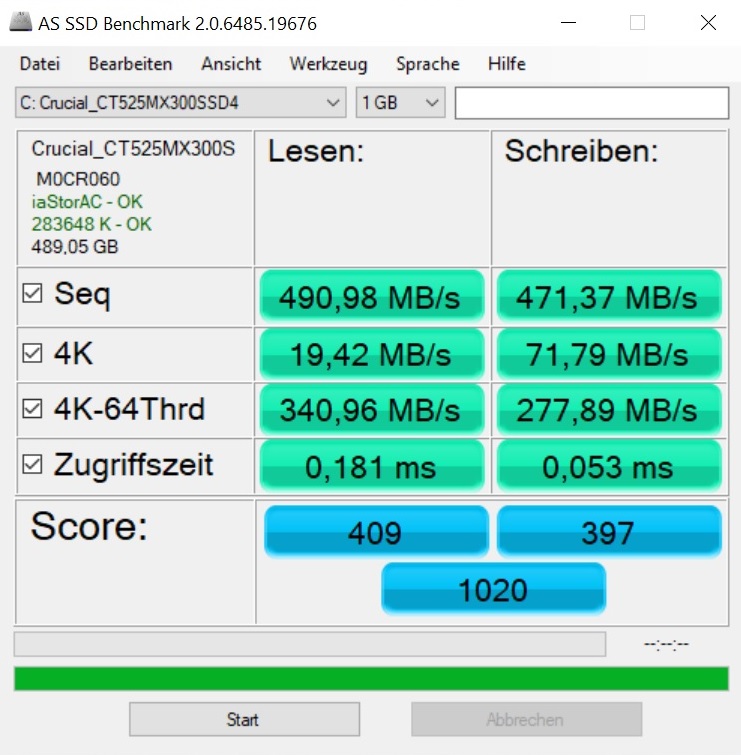
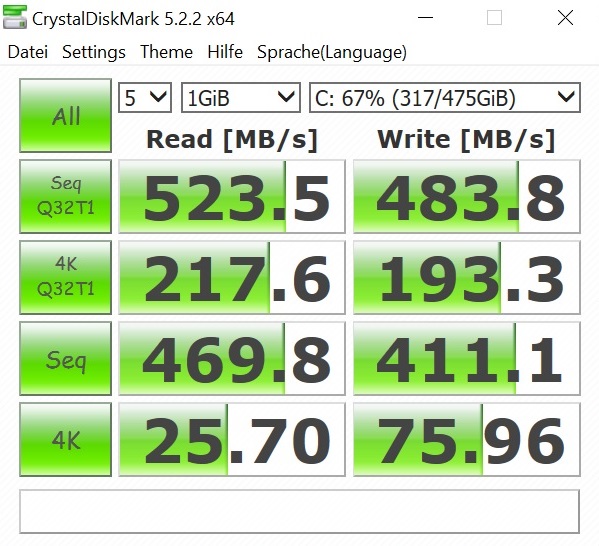
The Aero 14 has taken a step backwards compared with its predecessor in terms of SSD performance. The Samsung SM961 PCIe drive inside last year’s Aero 14 is significantly faster than this year’s Crucial MX300 SATA III SSD. The Crucial SSD is limited to 500 MB/s for technical reasons.
Benchmark scores highlight the stark difference in performance between the two drives. AS SSD benchmark results show that the Samsung SM961 has 394% faster sequential read speeds and 183% faster sequential write speeds. However, the speed at which Windows operates relies largely on how quickly the system can process small files. As such, there is no big disadvantage between a SATA III drive over PCIe in daily use. Gigabyte’s choice of SATA III over PCIe could be cooling related as PCIe drives traditionally get quite hot. Potentially, Gigabyte compromised on a SATA III drive to compensate against a more powerful and quite possibly warmer CPU.
The Aero 14 has two M.2 drive bays and one of them is occupied by the Crucial MX300 SSD. Incidentally, there is no 2.5-inch drive bay. This omission does allow for a relatively large battery though.
| Gigabyte Aero 14-K8 Crucial MX300 CT525MX300SSD1 | Gigabyte Aero 14-K7 Samsung SM961 MZVPW256HEGL | Schenker XMG P407 Samsung SM961 MZVPW256 m.2 PCI-e | MSI GS43VR 7RE-069US SK Hynix HFS128G39MNC-3510A | Razer Blade (2017) Samsung PM951 NVMe MZVLV256 | |
|---|---|---|---|---|---|
| AS SSD | 232% | 243% | 13% | ||
| Seq Read (MB/s) | 491 | 2425 394% | 2607 431% | 509 4% | |
| Seq Write (MB/s) | 471.4 | 1335 183% | 1313 179% | 366.6 -22% | |
| 4K Read (MB/s) | 19.42 | 48.6 150% | 53 173% | 30.35 56% | |
| 4K Write (MB/s) | 71.8 | 121.4 69% | 140.9 96% | 86.2 20% | |
| Score Read (Points) | 409 | 1829 347% | 1840 350% | 455 11% | |
| Score Write (Points) | 397 | 1181 197% | 1158 192% | 435 10% | |
| Score Total (Points) | 1020 | 3894 282% | 3879 280% | 1126 10% |

Graphics Card
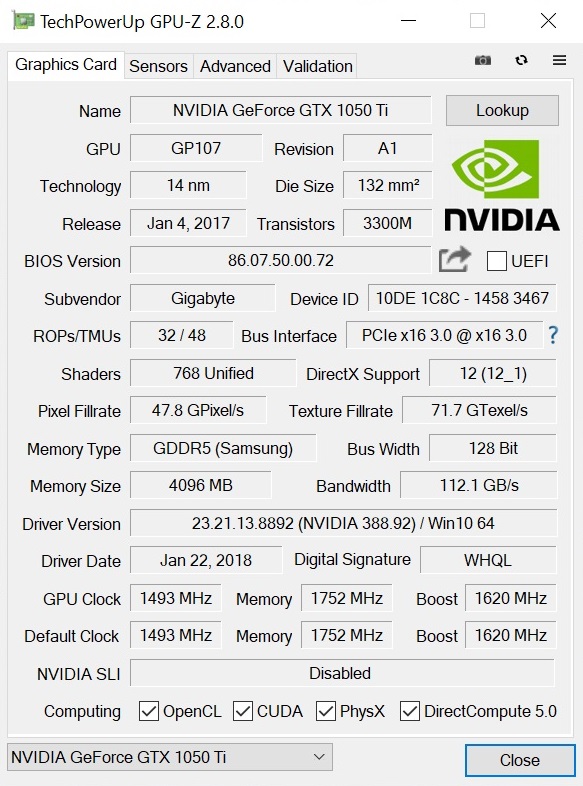
The Aero 14 is equipped with an Nvidia GeForce GTX 1050 Ti. This GPU has 4 GB GDDR5 VRAM, support for DirectX 12, and it sits between Nvidia’s mid-range and high-end Pascal GPUs.
| 3DMark 11 Performance | 9109 points | |
| 3DMark Cloud Gate Standard Score | 26663 points | |
| 3DMark Fire Strike Score | 6856 points | |
| 3DMark Time Spy Score | 2512 points | |
Help | ||
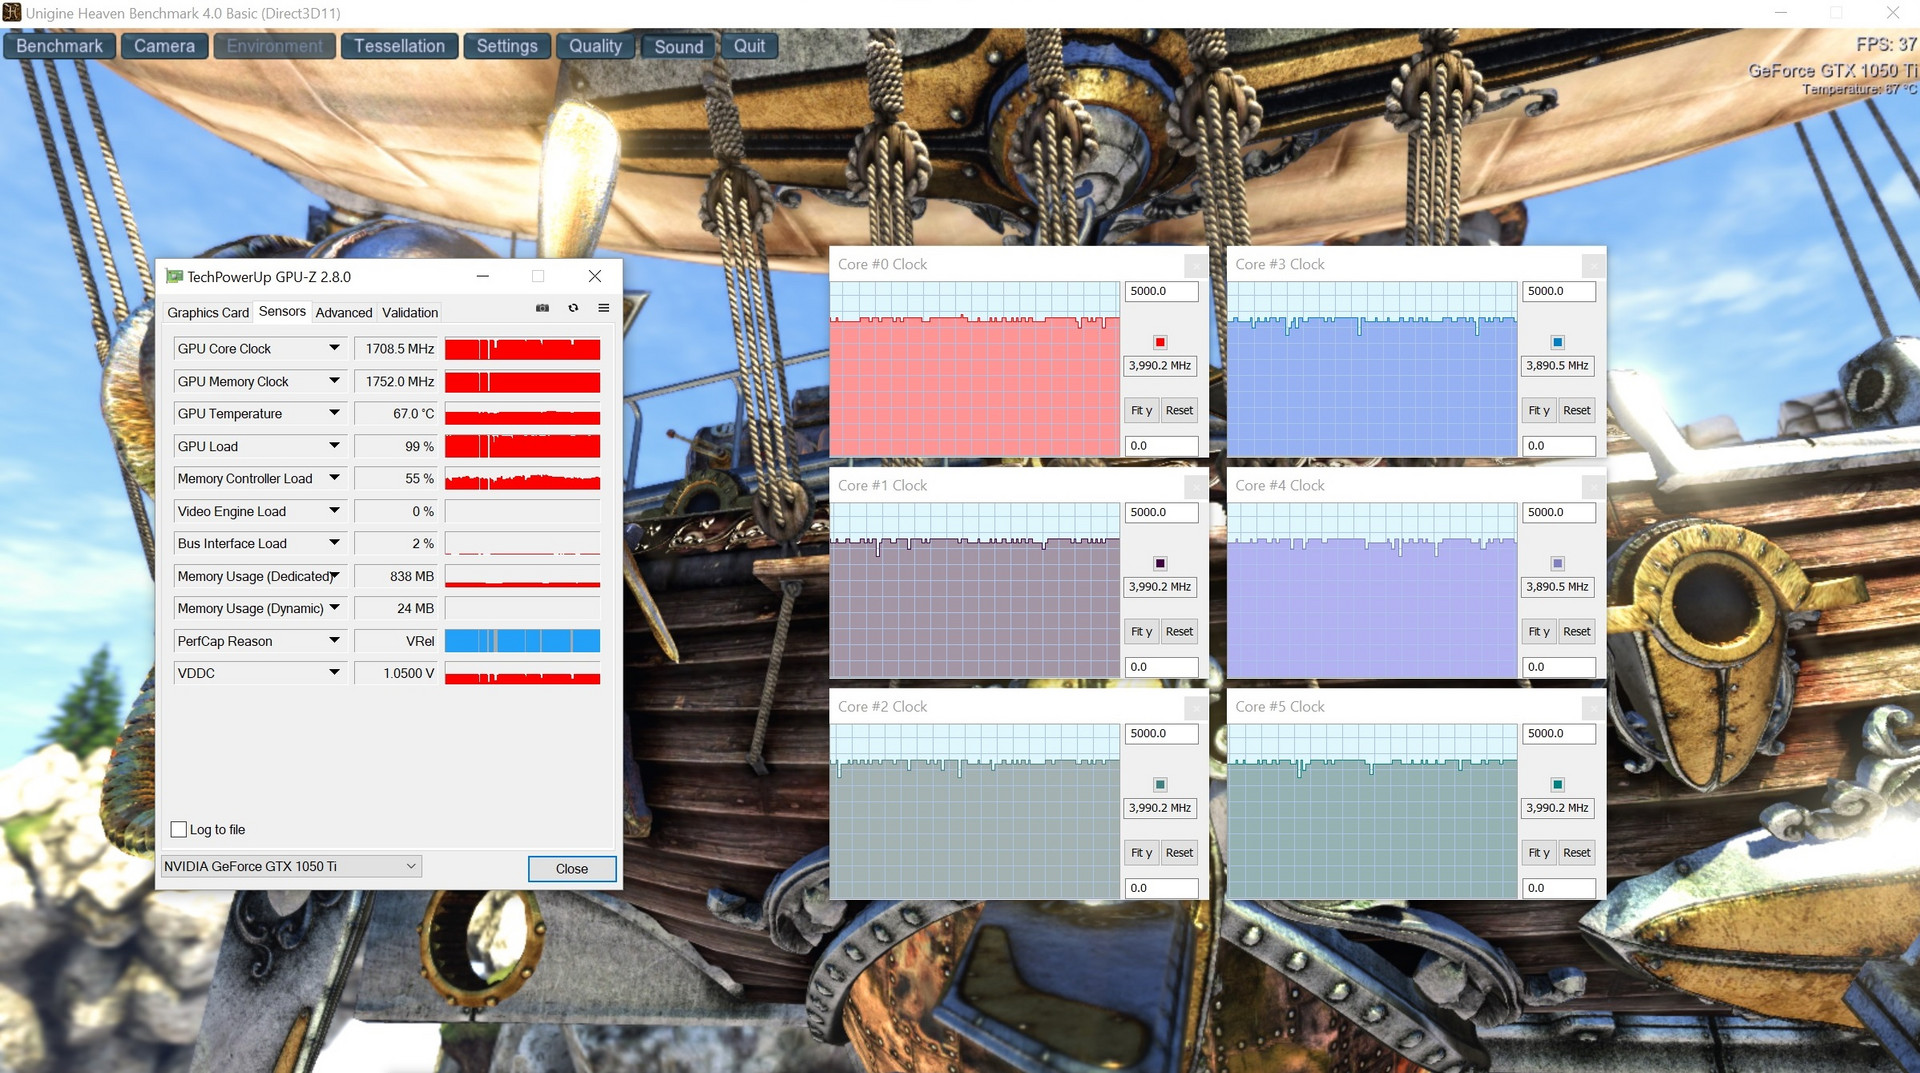
GeForce GPUs can automatically increase their clock speed if there is sufficient cooling, just like Core iX processors. The GTX 1050 Ti can boost up 1,759 MHz under load. Clock speeds leveled off at around 1,700 MHz in Unigine Heaven 4.0 benchmarks. The GTX 1050 Ti performed equally well during our 60-minute play of The Witcher 3 set to full details at Full HD. Generally, The Witcher 3 played at a constant frame rate.
The GTX 1050 Ti performed well in synthetic benchmarks, too. Looking at just GPU scores, the Aero 14 is comparable to other GTX 1050 Ti devices. Meanwhile, GTX 1060-equipped devices like the Razer Blade and the MSI GS43VR performed about 40% better than the Aero 14.
| 3DMark - 1920x1080 Fire Strike Graphics | |
| Average of class Multimedia (2328 - 48907, n=57, last 2 years) | |
| MSI GS43VR 7RE-069US | |
| Razer Blade (2017) | |
| Schenker XMG P407 | |
| Gigabyte Aero 14-K8 | |
| Gigabyte Aero 14-K7 | |
| 3DMark 11 - 1280x720 Performance GPU | |
| Average of class Multimedia (3749 - 60002, n=54, last 2 years) | |
| MSI GS43VR 7RE-069US | |
| Razer Blade (2017) | |
| Schenker XMG P407 | |
| Gigabyte Aero 14-K7 | |
| Gigabyte Aero 14-K8 | |
Gaming Performance
As the graph below demonstrates, the GTX 1050 Ti struggles to play games at the Aero 14’s QHD native resolution. Practically all games were noticeably jerky at Ultra, while the Aero 14 often struggled even at medium to high details. Hence, we would recommend playing games at Full HD (1920x1080).
| Far Cry 5 - 2560x1440 Ultra Preset AA:T | |
| Gigabyte Aero 14-K8 | |
| Average NVIDIA GeForce GTX 1050 Ti Mobile (25 - 27, n=2) | |
| Kingdom Come: Deliverance - 2560x1440 Ultra High Preset | |
| Gigabyte Aero 14-K8 | |
| Average NVIDIA GeForce GTX 1050 Ti Mobile (16.9 - 17.9, n=2) | |
| Fortnite - 2560x1440 Epic Preset | |
| Gigabyte Aero 14-K8 | |
| Average NVIDIA GeForce GTX 1050 Ti Mobile (28.8 - 34.8, n=2) | |
| Star Wars Battlefront 2 - 2560x1440 Ultra Preset | |
| Gigabyte Aero 14-K8 | |
| Average NVIDIA GeForce GTX 1050 Ti Mobile (19.5 - 26, n=2) | |
| Need for Speed Payback - 2560x1440 Ultra Preset | |
| Gigabyte Aero 14-K8 | |
| Average NVIDIA GeForce GTX 1050 Ti Mobile (30.3 - 34, n=2) | |
| Call of Duty WWII - 2560x1440 Extra / On AA:Filmic T2X SM | |
| Gigabyte Aero 14-K8 | |
| Average NVIDIA GeForce GTX 1050 Ti Mobile (30.8 - 39.9, n=2) | |
| Assassin´s Creed Origins - 2560x1440 Ultra High Preset | |
| Gigabyte Aero 14-K8 | |
| Average NVIDIA GeForce GTX 1050 Ti Mobile (20 - 26, n=2) | |
| ELEX - 2560x1440 Ultra / On AA:SM AF:16x | |
| Gigabyte Aero 14-K8 | |
| Average NVIDIA GeForce GTX 1050 Ti Mobile (19.6 - 21.8, n=2) | |
| The Evil Within 2 - 2560x1440 Ultra Preset AA:FXAA + T | |
| Gigabyte Aero 14-K8 | |
| Average NVIDIA GeForce GTX 1050 Ti Mobile (n=1) | |
| Middle-earth: Shadow of War - 2560x1440 Ultra Preset AA:T | |
| Gigabyte Aero 14-K8 | |
| Average NVIDIA GeForce GTX 1050 Ti Mobile (20 - 22, n=2) | |
| Wolfenstein II: The New Colossus - 2560x1440 Extreme Preset AA:SM AF:16x | |
| Gigabyte Aero 14-K8 | |
| Average NVIDIA GeForce GTX 1050 Ti Mobile (n=1) | |
The GTX 1050 Ti performs much better with games set to Full HD. We found that all but the most CPU-intensive games played well at this resolution. We had to drop image quality a further step down to play games like The Evil Within 2 and Final Fantasy XV. In other words, the GTX 1050 Ti is fine for casual gamers. Avid gamers would probably only be happy with at least a GeForce GTX 1060.
| low | med. | high | ultra | QHD | |
|---|---|---|---|---|---|
| The Witcher 3 (2015) | 47.1 | 26 | |||
| Middle-earth: Shadow of War (2017) | 44 | 33 | |||
| The Evil Within 2 (2017) | 32.8 | 30.7 | |||
| ELEX (2017) | 44.9 | 34.3 | 21.8 | ||
| Wolfenstein II: The New Colossus (2017) | 49.3 | 44.3 | 23.2 | ||
| Assassin´s Creed Origins (2017) | 43 | 36 | 26 | ||
| Call of Duty WWII (2017) | 69 | 53.8 | 39.9 | ||
| Need for Speed Payback (2017) | 56.3 | 52.4 | 34 | ||
| Star Wars Battlefront 2 (2017) | 58.3 | 41.4 | 26 | ||
| Fortnite (2018) | 79.2 | 58 | 34.8 | ||
| Final Fantasy XV Benchmark (2018) | 37.4 | 24.6 | |||
| Kingdom Come: Deliverance (2018) | 37.5 | 27.7 | 17.9 | ||
| Far Cry 5 (2018) | 44 | 40 | 27 |
Emissions
Fan Noise
The Aero 14 is not directly comparable to its predecessor in terms of emissions. After the poor experiences we had with setting the fan profiles of both the Aorus X9 and the Aero 15X to ‘Gaming’, we used the ‘Normal’ fan mode instead. This resulted in the fans remaining pleasantly quiet at around 31/32 dB with the Aero 14 at idle. The fans tended to become audible as the Aero 14 booted or during program installations and Windows updates.
The Aero 14 gets loud only under load, during which the fans sit between 46 and 53 dB. This is loud for a GTX 1050 Ti notebook, the main culprit being the hexa-core CPU. A quad-core CPU like the Core i5-8400H or the Core i5-8300H would have been a better choice for the overall concept of the Aero 14 in our opinion given its graphics performance.
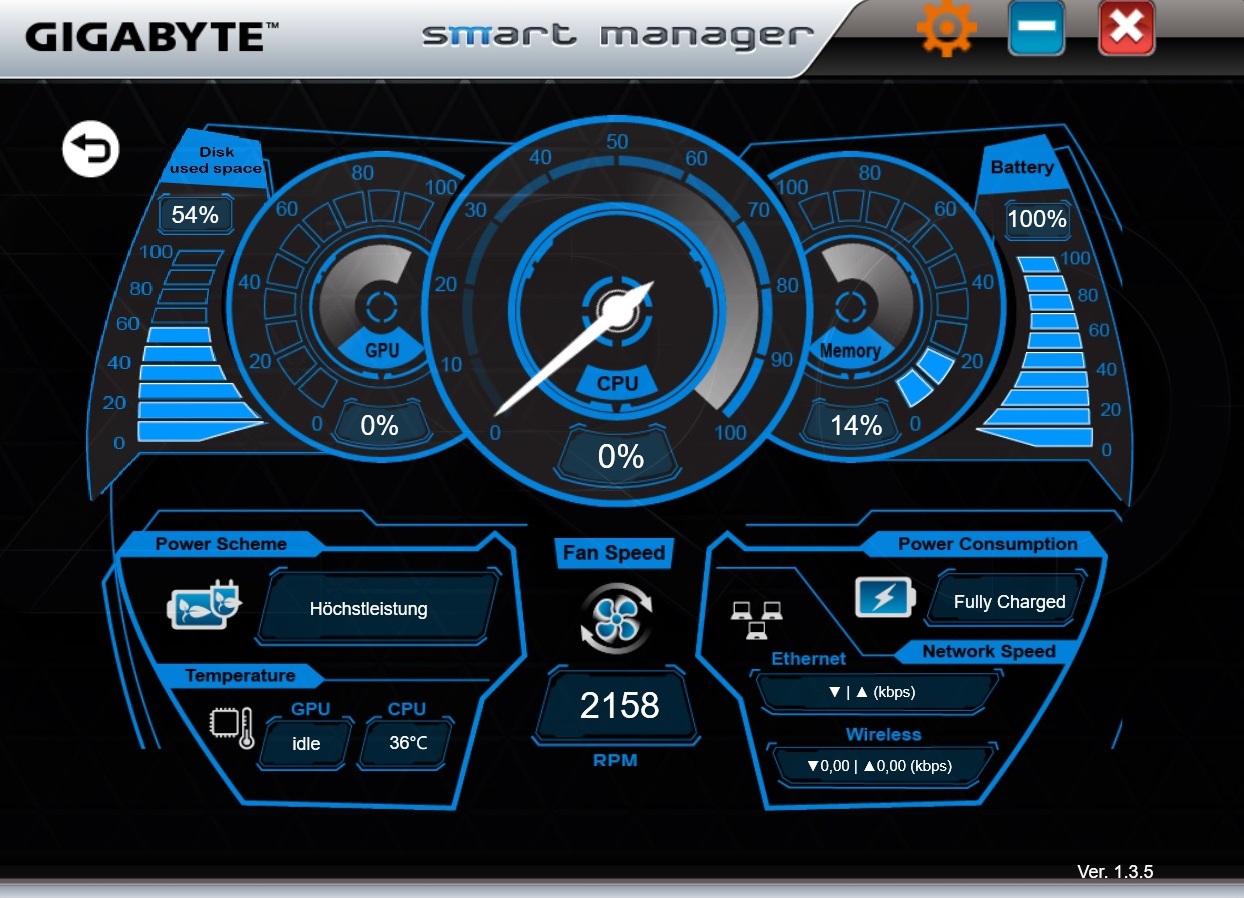
Fortunately, the Smart Manager tool allows for manual fan control to keep those fans in check. There is also a ‘Quiet’ fan mode that keeps the fans completely quiet, ideal when working in quiet environments and for noise-sensitive users.
Noise level
| Idle |
| 31 / 32 / 37 dB(A) |
| Load |
| 50 / 53 dB(A) |
 | ||
30 dB silent 40 dB(A) audible 50 dB(A) loud |
||
min: | ||
| Gigabyte Aero 14-K8 GeForce GTX 1050 Ti Mobile, i7-8750H | Gigabyte Aero 14-K7 GeForce GTX 1050 Ti Mobile, i7-7700HQ | Schenker XMG P407 GeForce GTX 1050 Ti Mobile, i7-7700HQ | MSI GS43VR 7RE-069US GeForce GTX 1060 Mobile, i7-7700HQ | Razer Blade (2017) GeForce GTX 1060 Mobile, i7-7700HQ | Average of class Multimedia | |
|---|---|---|---|---|---|---|
| Noise | -0% | 5% | -5% | 6% | 22% | |
| off / environment * (dB) | 30 | 30 -0% | 29 3% | 28 7% | 24.1 ? 20% | |
| Idle Minimum * (dB) | 31 | 32 -3% | 31 -0% | 33 -6% | 30 3% | 24.3 ? 22% |
| Idle Average * (dB) | 32 | 33 -3% | 32 -0% | 34.5 -8% | 30 6% | 24.6 ? 23% |
| Idle Maximum * (dB) | 37 | 38 -3% | 36 3% | 35 5% | 30 19% | 26.2 ? 29% |
| Load Average * (dB) | 50 | 46 8% | 43 14% | 54.2 -8% | 51 -2% | 37.3 ? 25% |
| Witcher 3 ultra * (dB) | 46 | 46 -0% | 56.7 -23% | |||
| Load Maximum * (dB) | 53 | 53 -0% | 48 9% | 54.2 -2% | 51 4% | 46 ? 13% |
* ... smaller is better
Temperature
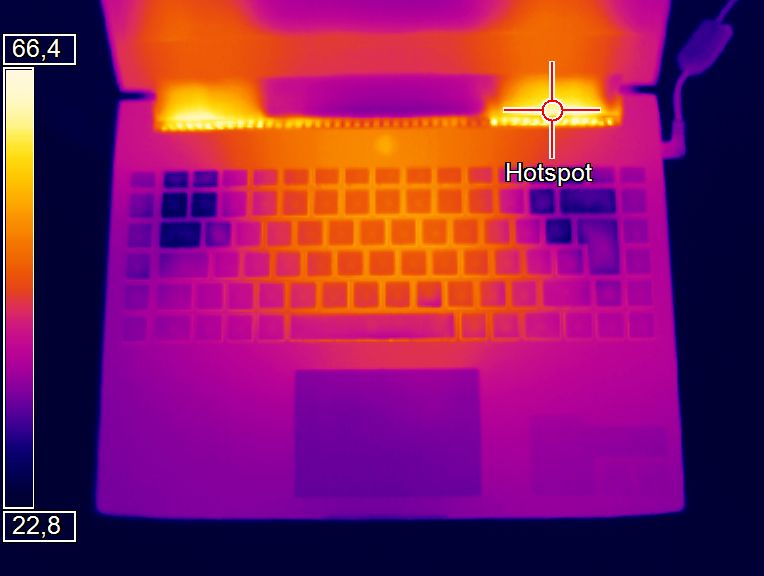
The way in which the Aero 14 manages its surface temperatures at idle does not reflect how it performs under load. The case stays impressively cool at idle or when running simple tasks, with surface temperatures remaining below 30 °C. By contrast, the Aero 14 heats up considerably under load. After an hour of stress tests, the rear third of the case heats up to 53 °C on the top and 59 °C on the bottom. Our test device stayed cooler when playing games like The Witcher 3, with the same areas reaching 48 °C and 50 °C, respectively. Even so, we would recommend putting the Aero 14 on a table when gaming rather than on your lap.
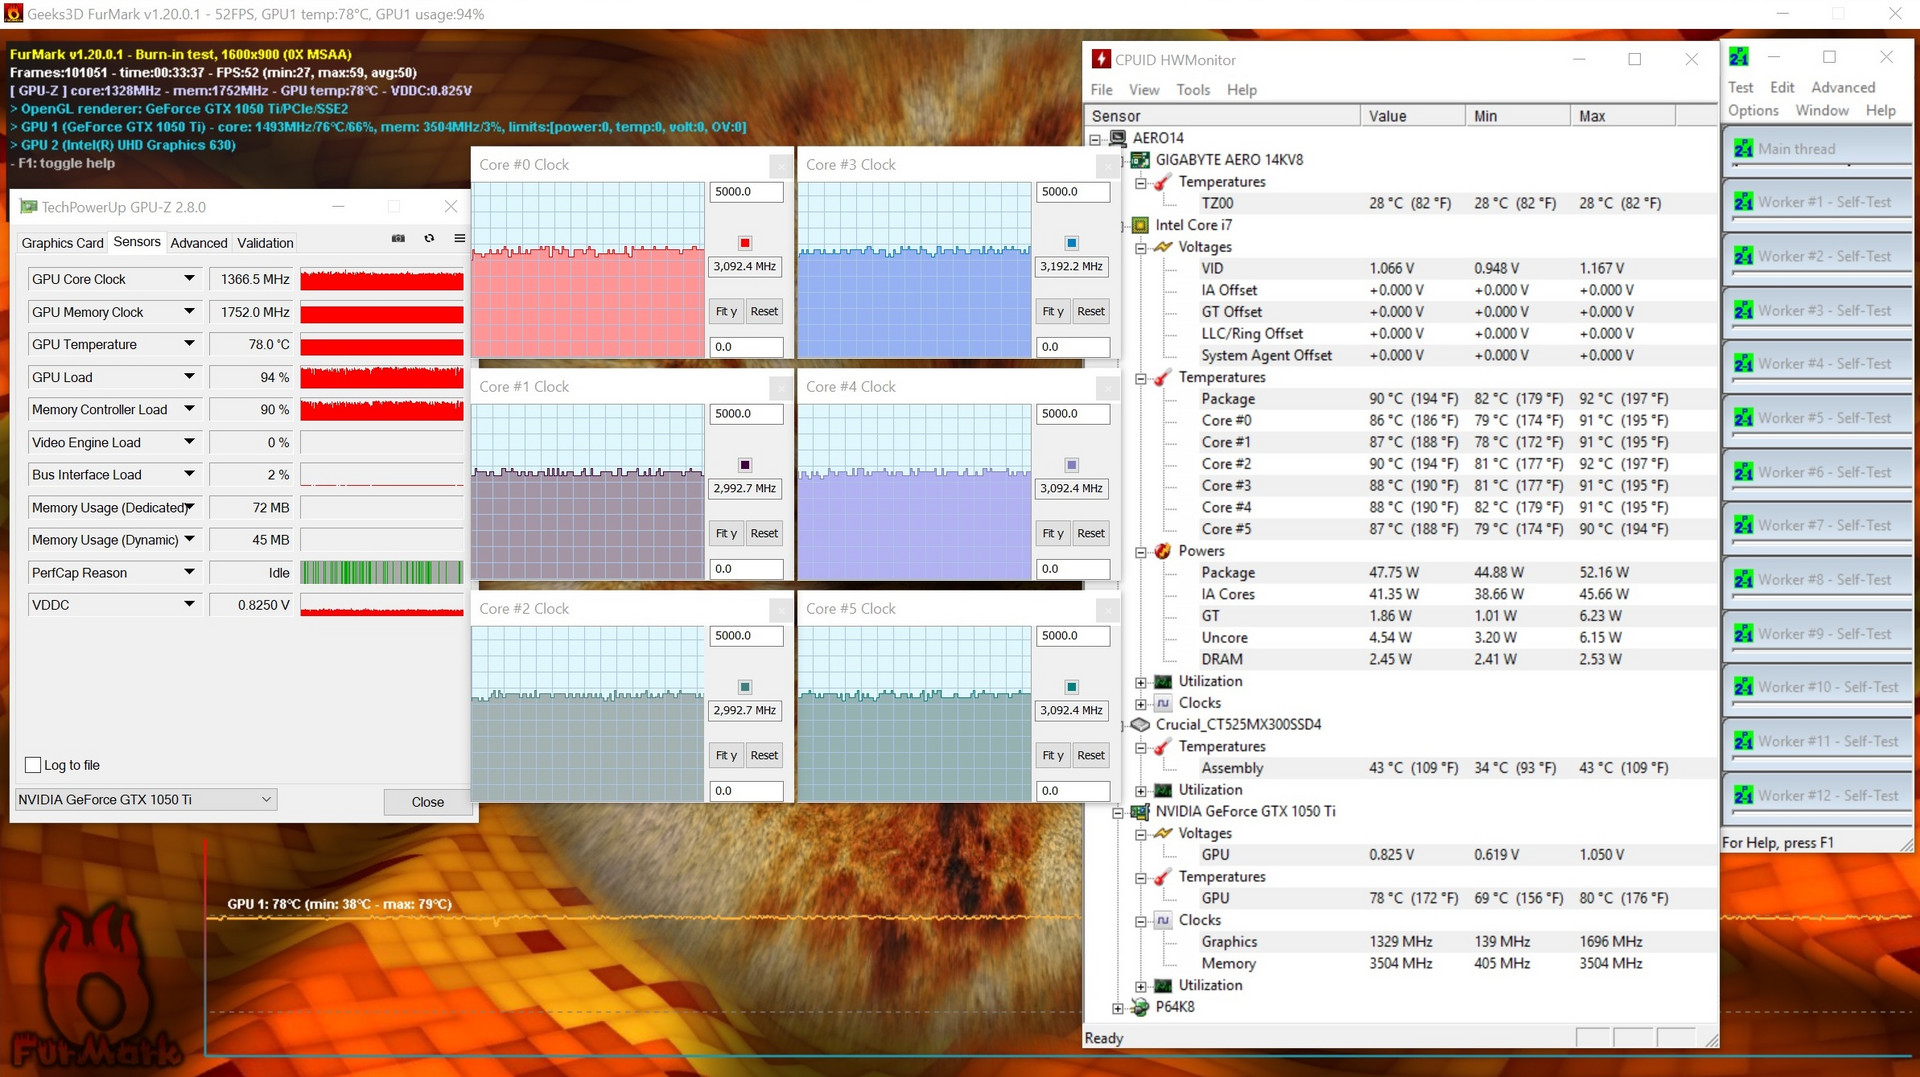
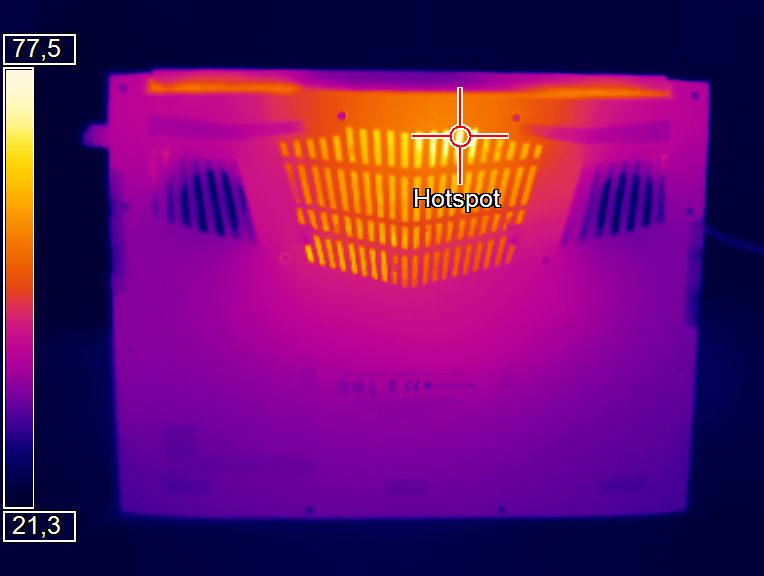
It is the usual picture under the hood. While the GTX 1050 Ti reaches a moderate 78 °C during Furmark and Prime 95 stress tests, the Core i7-8750H reaches 90 °C. This is relatively high, but not critically so. The GPU throttles only under extreme conditions, while the CPU remains at 3.0 GHz even at full load.
(-) The maximum temperature on the upper side is 53 °C / 127 F, compared to the average of 36.8 °C / 98 F, ranging from 21 to 71 °C for the class Multimedia.
(-) The bottom heats up to a maximum of 59 °C / 138 F, compared to the average of 39.1 °C / 102 F
(+) In idle usage, the average temperature for the upper side is 23.3 °C / 74 F, compared to the device average of 31.3 °C / 88 F.
(-) Playing The Witcher 3, the average temperature for the upper side is 39.9 °C / 104 F, compared to the device average of 31.3 °C / 88 F.
(±) The palmrests and touchpad can get very hot to the touch with a maximum of 36 °C / 96.8 F.
(-) The average temperature of the palmrest area of similar devices was 28.7 °C / 83.7 F (-7.3 °C / -13.1 F).
| Gigabyte Aero 14-K8 GeForce GTX 1050 Ti Mobile, i7-8750H | Gigabyte Aero 14-K7 GeForce GTX 1050 Ti Mobile, i7-7700HQ | Schenker XMG P407 GeForce GTX 1050 Ti Mobile, i7-7700HQ | MSI GS43VR 7RE-069US GeForce GTX 1060 Mobile, i7-7700HQ | Razer Blade (2017) GeForce GTX 1060 Mobile, i7-7700HQ | Average of class Multimedia | |
|---|---|---|---|---|---|---|
| Heat | 1% | 3% | -15% | 5% | ||
| Maximum Upper Side * (°C) | 53 | 51 4% | 49 8% | 47.8 10% | 41 ? 23% | |
| Maximum Bottom * (°C) | 59 | 58 2% | 50.8 14% | 63.2 -7% | 43.4 ? 26% | |
| Idle Upper Side * (°C) | 24 | 24 -0% | 26.3 -10% | 29.8 -24% | 26.9 ? -12% | |
| Idle Bottom * (°C) | 24 | 25 -4% | 24.1 -0% | 33.2 -38% | 27.8 ? -16% |
* ... smaller is better
Speakers
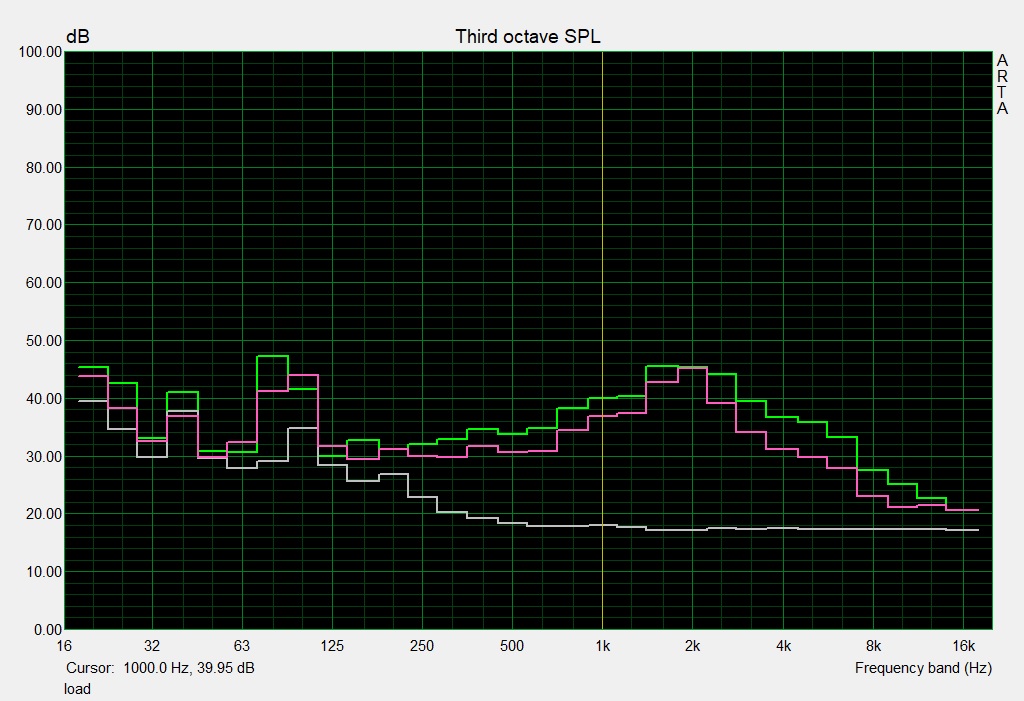
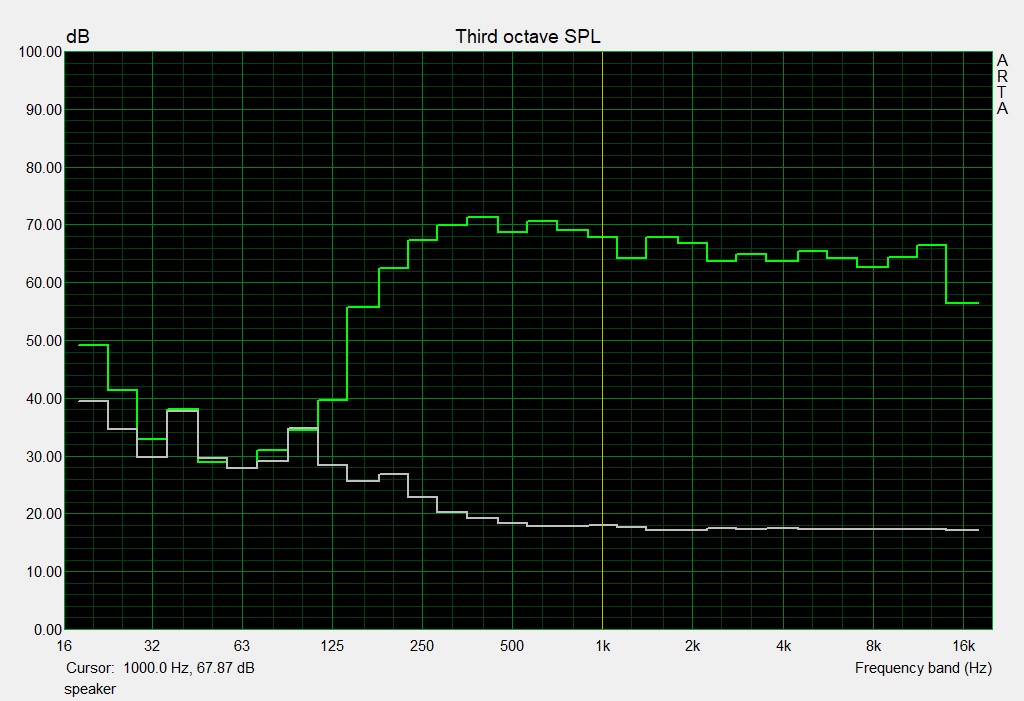
The Aero 14 has 2.0 speakers that are supported with Dolby Atmos software. The sound is surprisingly good for a compact notebook, although it is never going to be as good as what a headset or external speakers can achieve. Notwithstanding, the Aero 14 outperforms the Razer Blade as demonstrated by our audio analysis.
Gigabyte Aero 14-K8 audio analysis
(±) | speaker loudness is average but good (79 dB)
Bass 100 - 315 Hz
(±) | reduced bass - on average 12.4% lower than median
(±) | linearity of bass is average (13.7% delta to prev. frequency)
Mids 400 - 2000 Hz
(+) | balanced mids - only 3.6% away from median
(+) | mids are linear (4.5% delta to prev. frequency)
Highs 2 - 16 kHz
(+) | balanced highs - only 0.9% away from median
(+) | highs are linear (3.6% delta to prev. frequency)
Overall 100 - 16.000 Hz
(+) | overall sound is linear (12.7% difference to median)
Compared to same class
» 24% of all tested devices in this class were better, 5% similar, 71% worse
» The best had a delta of 5%, average was 17%, worst was 45%
Compared to all devices tested
» 12% of all tested devices were better, 3% similar, 86% worse
» The best had a delta of 4%, average was 23%, worst was 134%
Razer Blade (2017) UHD audio analysis
(-) | not very loud speakers (69 dB)
Bass 100 - 315 Hz
(±) | reduced bass - on average 11.6% lower than median
(±) | linearity of bass is average (13.1% delta to prev. frequency)
Mids 400 - 2000 Hz
(+) | balanced mids - only 3.6% away from median
(+) | mids are linear (6.1% delta to prev. frequency)
Highs 2 - 16 kHz
(+) | balanced highs - only 4.7% away from median
(±) | linearity of highs is average (7.4% delta to prev. frequency)
Overall 100 - 16.000 Hz
(±) | linearity of overall sound is average (18.9% difference to median)
Compared to same class
» 63% of all tested devices in this class were better, 8% similar, 29% worse
» The best had a delta of 6%, average was 18%, worst was 132%
Compared to all devices tested
» 44% of all tested devices were better, 8% similar, 48% worse
» The best had a delta of 4%, average was 23%, worst was 134%
Power Management
Power Consumption
The Aero 14 consumes less power than its predecessor despite the higher core count. We measured the Aero 14 consuming between 7 and 13 W at idle. Contrast this with the Schenker XMG P407, which consumes between 10 to 24 W when idling. Our test device consumes between 73 to 143 W under load, demonstrating that the Aero 14 has good energy-saving mechanisms and efficient components.
| Off / Standby | |
| Idle | |
| Load |
|
Key:
min: | |
| Gigabyte Aero 14-K8 GeForce GTX 1050 Ti Mobile, i7-8750H | Gigabyte Aero 14-K7 GeForce GTX 1050 Ti Mobile, i7-7700HQ | Schenker XMG P407 GeForce GTX 1050 Ti Mobile, i7-7700HQ | MSI GS43VR 7RE-069US GeForce GTX 1060 Mobile, i7-7700HQ | Razer Blade (2017) GeForce GTX 1060 Mobile, i7-7700HQ | Average of class Multimedia | |
|---|---|---|---|---|---|---|
| Power Consumption | -22% | -35% | -15% | -5% | 11% | |
| Idle Minimum * (Watt) | 7 | 9 -29% | 10 -43% | 9.1 -30% | 7.5 -7% | 5.62 ? 20% |
| Idle Average * (Watt) | 10 | 14 -40% | 15 -50% | 11.9 -19% | 12.1 -21% | 10.2 ? -2% |
| Idle Maximum * (Watt) | 13 | 19 -46% | 24 -85% | 12.2 6% | 14.3 -10% | 12.5 ? 4% |
| Load Average * (Watt) | 73 | 84 -15% | 82 -12% | 77 -5% | 73.5 -1% | 65 ? 11% |
| Witcher 3 ultra * (Watt) | 96 | 95 1% | 126.4 -32% | 108 -13% | ||
| Load Maximum * (Watt) | 143 | 149 -4% | 124 13% | 153 -7% | 110.2 23% | 111.9 ? 22% |
* ... smaller is better
Battery Life
The relatively low power consumption and high capacity 94 Wh battery ensure that the Aero 14 has above average battery life. Our test device lasts just under three hours when running 3D tasks at full brightness and manages 19 hours when idling at low brightness. By comparison, the Schenker XMG P407 lasted just over seven hours at idle with its 45 Wh battery. In our Wi-Fi test, the Aero 14 lasted 11 hours at medium brightness. In daily use, such as browsing the web and playing videos, you can expect the Aero 14 to last a long time.
| Gigabyte Aero 14-K8 GeForce GTX 1050 Ti Mobile, i7-8750H, 94.24 Wh | Gigabyte Aero 14-K7 GeForce GTX 1050 Ti Mobile, i7-7700HQ, 94.24 Wh | Schenker XMG P407 GeForce GTX 1050 Ti Mobile, i7-7700HQ, 45 Wh | MSI GS43VR 7RE-069US GeForce GTX 1060 Mobile, i7-7700HQ, 61 Wh | Razer Blade (2017) GeForce GTX 1060 Mobile, i7-7700HQ, 70 Wh | Average of class Multimedia | |
|---|---|---|---|---|---|---|
| Battery runtime | -18% | -58% | -61% | -17% | 1% | |
| Reader / Idle (h) | 17.6 | 15.9 -10% | 7.4 -58% | 9 -49% | 24.9 ? 41% | |
| WiFi v1.3 (h) | 11 | 8.9 -19% | 4 -64% | 2.9 -74% | 9.1 -17% | 12.3 ? 12% |
| Load (h) | 3.2 | 2.4 -25% | 1.5 -53% | 1.3 -59% | 1.645 ? -49% | |
| H.264 (h) | 7.8 | 3.6 | 16.8 ? |
Verdict
Pros
Cons
The 2018 Gigabyte Aero 14 is an impressive all-in-one device. The Aero 14 has a sturdy, stylish and slim case while being powerful enough for professional or private use.
The Aero 14 handles this balancing act better than almost any other laptop. The combination of a Core i7-8750H and a GeForce GTX 1050 Ti means that the Aero 14 can get loud when running 3D applications. Fortunately, Gigabyte provides fan modes that can keep the Aero 14 silent at idle and when completing simple tasks.
There are no major drawbacks either. While the display response time could be better, the Aero 14 is designed with more than just gaming in mind. The high resolution and X-Rite Pantone color accuracy show that Gigabyte is aiming the Aero 14 at the professional sector too. There is even Thunderbolt 3, while most buyers will be satisfied with the speakers.
The biggest highlight is its battery life, which makes the Gigabyte Aero a great all-rounder.
Gigabyte Aero 14-K8
- 05/14/2020 v7 (old)
Florian Glaser
Price comparison

