Aorus X9 DT (i9-8950HK, GTX 1080, FHD) Laptop Review

While the recently reviewed Aero 15X is aimed primarily at gamers who are frequently out and about, the much bigger and heavier Aorus X9 is definitely a stationary desktop-replacement. The GeForce GTX 1070 Max-Q has been replaced with Nvidia’s fastest Pascal GPU: a GeForce GTX 1080 with 8 GB of GDDR5X VRAM.
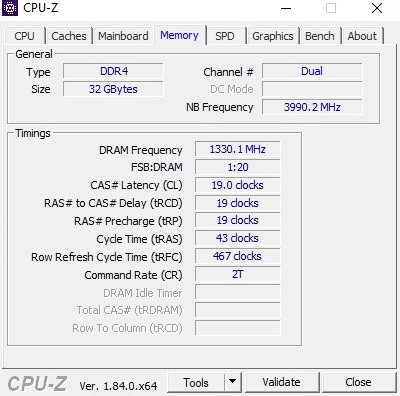
The CPU also differs from the Aero 15X. Intel’s Core i9-8950HK is currently the fastest available mobile CPU and much faster in some respects than the Core i7-8750H. Our review unit was also equipped with 32 GB of DDR4 RAM (2x 16 GB), two storage devices (1 TB SSD and a 1 TB HDD), and an FHD IPS display. In this particular configuration, this notebook currently sells for slightly below $4,000 plus tax in the United States.
Updates
Although the case seems identical, the notebook differs significantly from its lookalike predecessor. Previously equipped with a quad-core CPU the 2018 model now features a six-core processor for additional multi-thread performance. On the other hand, 3D performance has decreased on average as Gigabyte bid farewell to the SLI setup due to its various downsides such as enormous power consumption, micro-stuttering, dependence on driver support, etc. Instead, the X9 features a single GPU, which truth be told we are not particularly saddened by.
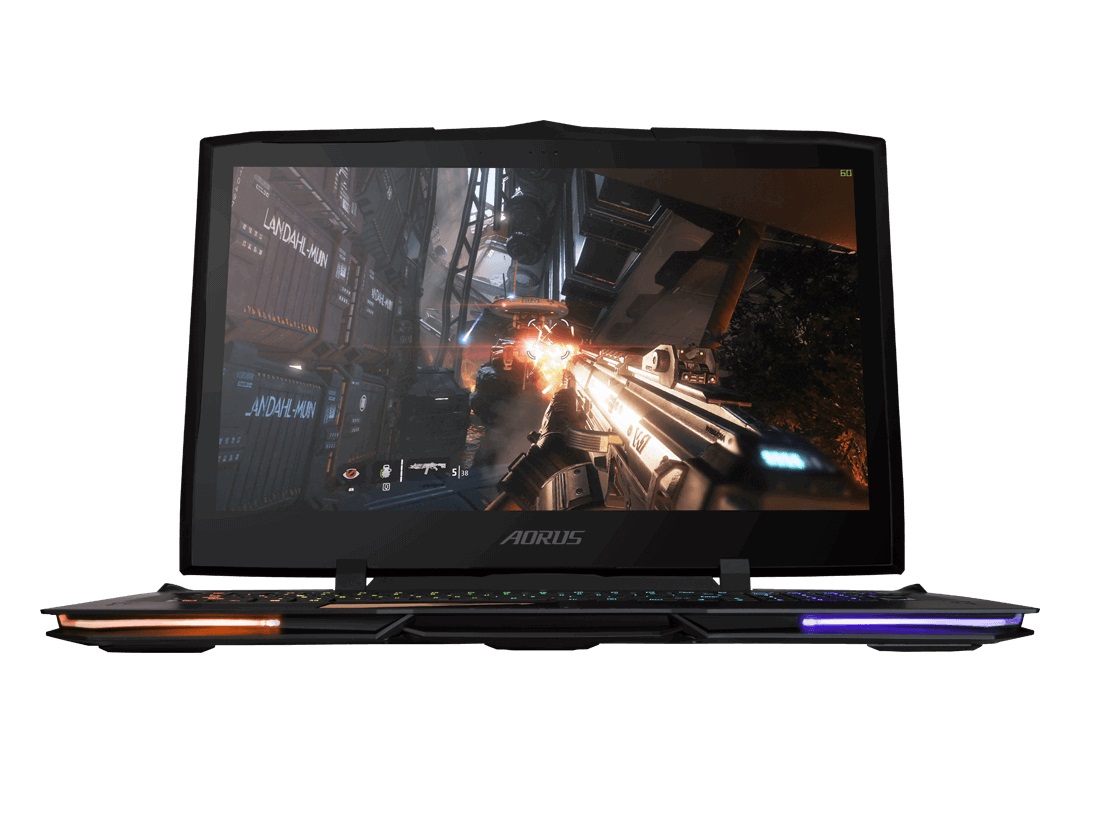
Lower resolution (FHD instead of QHD) aside, the display has been improved significantly. Instead of a 120 Hz TN panel with poor viewing angles this year’s model features a 144 Hz IPS panel with G-Sync support.
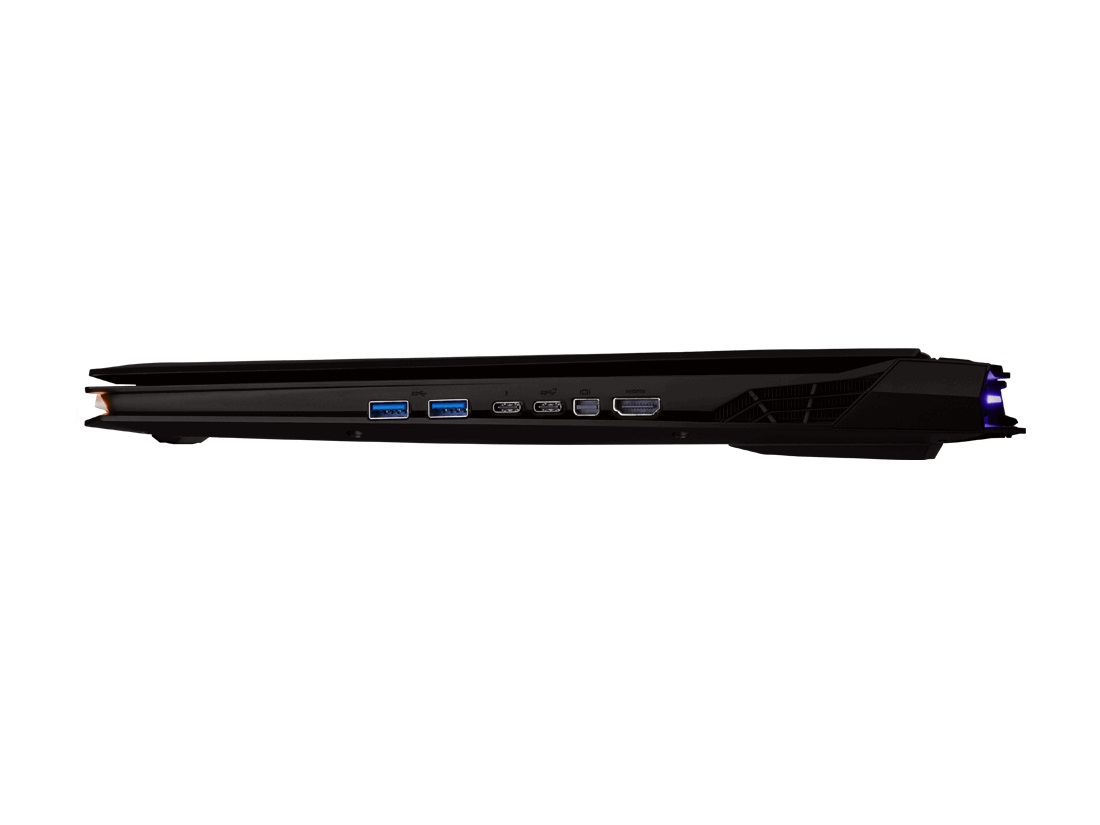
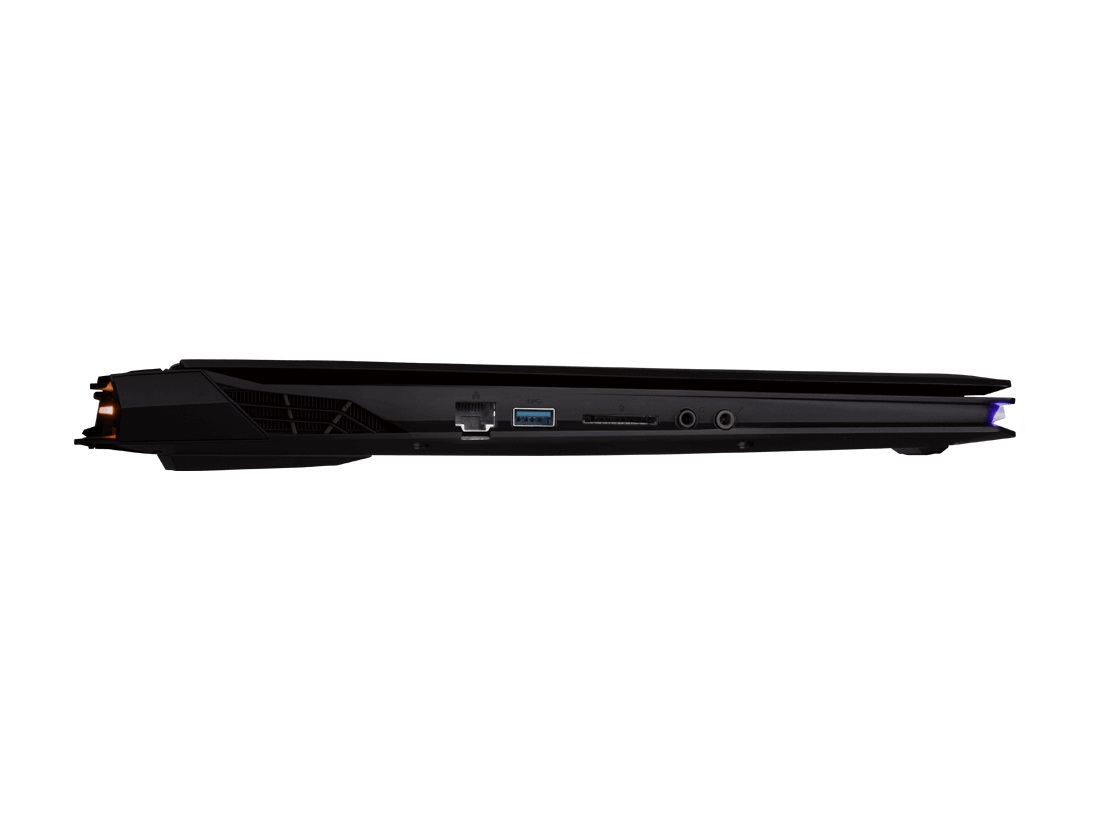
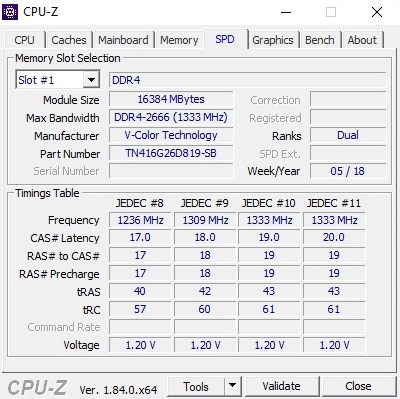
The other updates are rather discreet. For example, Gigabyte claims to have updated the keyboard. Other upgrades include faster RAM (2,666 vs. 2,400 MHz) and support for Dolby Atmos. And last but not least, connectivity has been slightly upgraded with more ports supporting the faster USB 3.1 Gen 2 standard now.
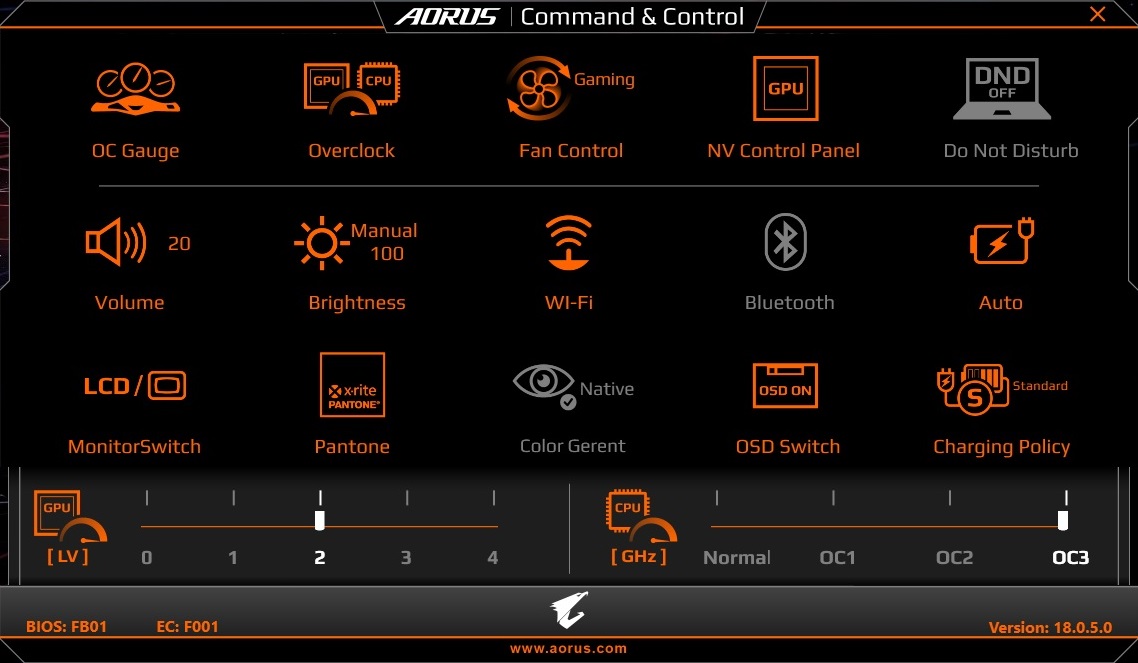
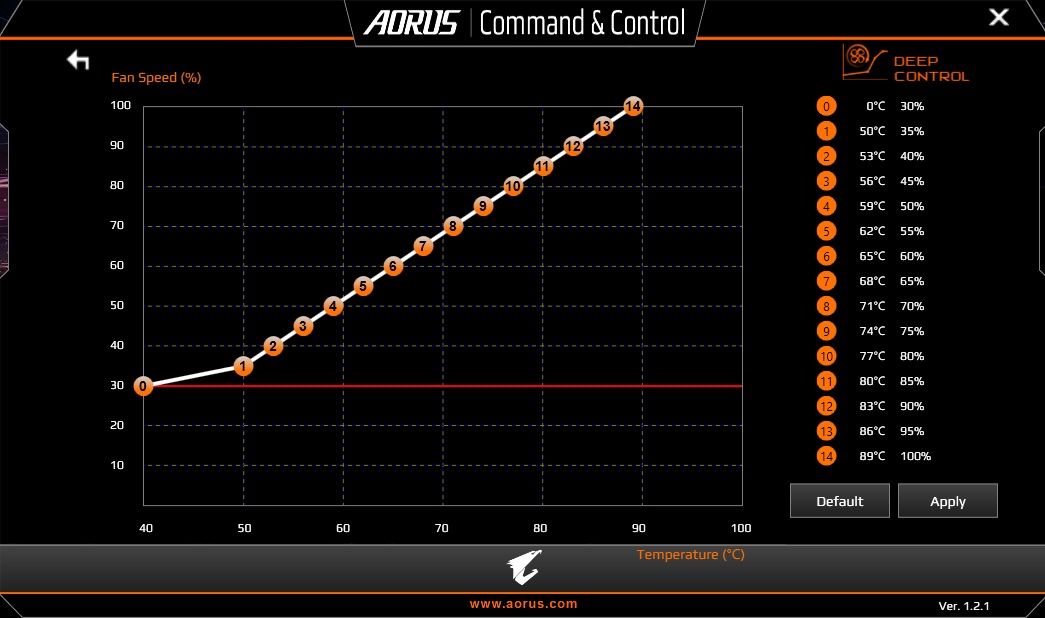
Tuning enthusiasts will be delighted to hear that the Command & Control tool is still present and once again offers various monitoring possibilities as well as access to low-level system settings. Most importantly, these are fan control and overclocking features. At the request of Gigabyte, we ran our benchmarks and tests with fan control set to “Gaming” and the OC level set to 2 and 3 for GPU and CPU, respectively.
| SD Card Reader | |
| average JPG Copy Test (av. of 3 runs) | |
| Aorus X9 DT (Toshiba Exceria Pro SDXC 64 GB UHS-II) | |
| Aorus X9 (Toshiba Exceria Pro SDXC 64 GB UHS-II) | |
| Asus G703 (Toshiba Exceria Pro SDXC 64 GB UHS-II) | |
| Average of class Gaming (20.9 - 210, n=54, last 2 years) | |
| MSI GT75VR 7RF-012 Titan Pro (Toshiba Exceria Pro SDXC 64 GB UHS-II) | |
| Acer Predator 17 X GX-792-76DL (Toshiba Exceria Pro SDXC 64 GB UHS-II) | |
| HP Omen X 17-ap0xx (Toshiba Exceria Pro SDXC 64 GB UHS-II) | |
| maximum AS SSD Seq Read Test (1GB) | |
| Aorus X9 DT (Toshiba Exceria Pro SDXC 64 GB UHS-II) | |
| Aorus X9 (Toshiba Exceria Pro SDXC 64 GB UHS-II) | |
| Asus G703 (Toshiba Exceria Pro SDXC 64 GB UHS-II) | |
| Average of class Gaming (25.5 - 261, n=51, last 2 years) | |
| Acer Predator 17 X GX-792-76DL (Toshiba Exceria Pro SDXC 64 GB UHS-II) | |
| MSI GT75VR 7RF-012 Titan Pro (Toshiba Exceria Pro SDXC 64 GB UHS-II) | |
| HP Omen X 17-ap0xx (Toshiba Exceria Pro SDXC 64 GB UHS-II) | |
Display
One of the X9 DT’s highlights is certainly its brand-new 144 Hz display with support for G-Sync. Its smoothness has the potential to render gamers speechless. Unfortunately, we cannot attest to Gigabyte’s 7 ms response time claims. That said, the screen still managed a respectable 12 ms for black to white and 18 ms for gray to gray.
| |||||||||||||||||||||||||
Brightness Distribution: 86 %
Center on Battery: 280 cd/m²
Contrast: 1273:1 (Black: 0.22 cd/m²)
ΔE ColorChecker Calman: 1.78 | ∀{0.5-29.43 Ø4.73}
ΔE Greyscale Calman: 0.74 | ∀{0.09-98 Ø4.97}
92% sRGB (Argyll 1.6.3 3D)
60% AdobeRGB 1998 (Argyll 1.6.3 3D)
67.3% AdobeRGB 1998 (Argyll 3D)
92.1% sRGB (Argyll 3D)
66.8% Display P3 (Argyll 3D)
Gamma: 2.43
CCT: 6494 K
| Aorus X9 DT AUO B173HAN03.0 (AUO309D), IPS, 1920x1080 | Aorus X9 AUO B173QTN01.3 (AUO1396), TN, 2560x1440 | HP Omen X 17-ap0xx AU Optronics B173HW01, IPS, 1920x1080 | Acer Predator 17 X GX-792-76DL LP173WF4-SPF5 (LGD056D), IPS, 1920x1080 | MSI GT75VR 7RF-012 Titan Pro CMN N173HHE-G32 (CMN1747), TN LED, 1920x1080 | Asus G703 AUO B173HAN03.0 (AUO309D), IPS, 1920x1080 | |
|---|---|---|---|---|---|---|
| Display | -9% | -5% | -6% | 24% | -1% | |
| Display P3 Coverage (%) | 66.8 | 60.6 -9% | 63.7 -5% | 66 -1% | 90.3 35% | 65.5 -2% |
| sRGB Coverage (%) | 92.1 | 84 -9% | 88.2 -4% | 83.7 -9% | 99.6 8% | 92.4 0% |
| AdobeRGB 1998 Coverage (%) | 67.3 | 61.1 -9% | 64.2 -5% | 61.2 -9% | 86.8 29% | 66.6 -1% |
| Response Times | 14% | -151% | -139% | 40% | 6% | |
| Response Time Grey 50% / Grey 80% * (ms) | 18.4 ? | 21.6 ? -17% | 44 ? -139% | 45 ? -145% | 11.6 ? 37% | 17.6 ? 4% |
| Response Time Black / White * (ms) | 12 ? | 6.6 ? 45% | 31.6 ? -163% | 28 ? -133% | 6.8 ? 43% | 11.2 ? 7% |
| PWM Frequency (Hz) | 25000 ? | |||||
| Screen | -119% | -40% | -70% | 3% | -74% | |
| Brightness middle (cd/m²) | 280 | 346 24% | 343 23% | 380 36% | 274 -2% | 274 -2% |
| Brightness (cd/m²) | 262 | 326 24% | 332 27% | 362 38% | 262 0% | 268 2% |
| Brightness Distribution (%) | 86 | 88 2% | 83 -3% | 91 6% | 87 1% | 80 -7% |
| Black Level * (cd/m²) | 0.22 | 0.54 -145% | 0.35 -59% | 0.37 -68% | 0.26 -18% | 0.29 -32% |
| Contrast (:1) | 1273 | 641 -50% | 980 -23% | 1027 -19% | 1054 -17% | 945 -26% |
| Colorchecker dE 2000 * | 1.78 | 5.98 -236% | 3.35 -88% | 4.12 -131% | 1.36 24% | 3.99 -124% |
| Colorchecker dE 2000 max. * | 3.91 | 9.77 -150% | 5.62 -44% | 8.19 -109% | 4.1 -5% | 7.33 -87% |
| Greyscale dE 2000 * | 0.74 | 5.47 -639% | 2.4 -224% | 3.95 -434% | 0.64 14% | 4.14 -459% |
| Gamma | 2.43 91% | 2.21 100% | 2.35 94% | 2.47 89% | 2.19 100% | 2.58 85% |
| CCT | 6494 100% | 7721 84% | 6495 100% | 6539 99% | 6551 99% | 7352 88% |
| Color Space (Percent of AdobeRGB 1998) (%) | 60 | 55 -8% | 57 -5% | 55 -8% | 77 28% | 60 0% |
| Color Space (Percent of sRGB) (%) | 92 | 84 -9% | 88 -4% | 84 -9% | 100 9% | 92 0% |
| Colorchecker dE 2000 calibrated * | 2.5 | 1.79 | ||||
| Total Average (Program / Settings) | -38% /
-79% | -65% /
-48% | -72% /
-66% | 22% /
12% | -23% /
-48% |
* ... smaller is better
The X-Rite Pantone certification is also worth mentioning. Color deviations are minor in the “Native Color” mode already and the X-Rite certification is going to play an important role for users with serious photo and video editing ambitions.
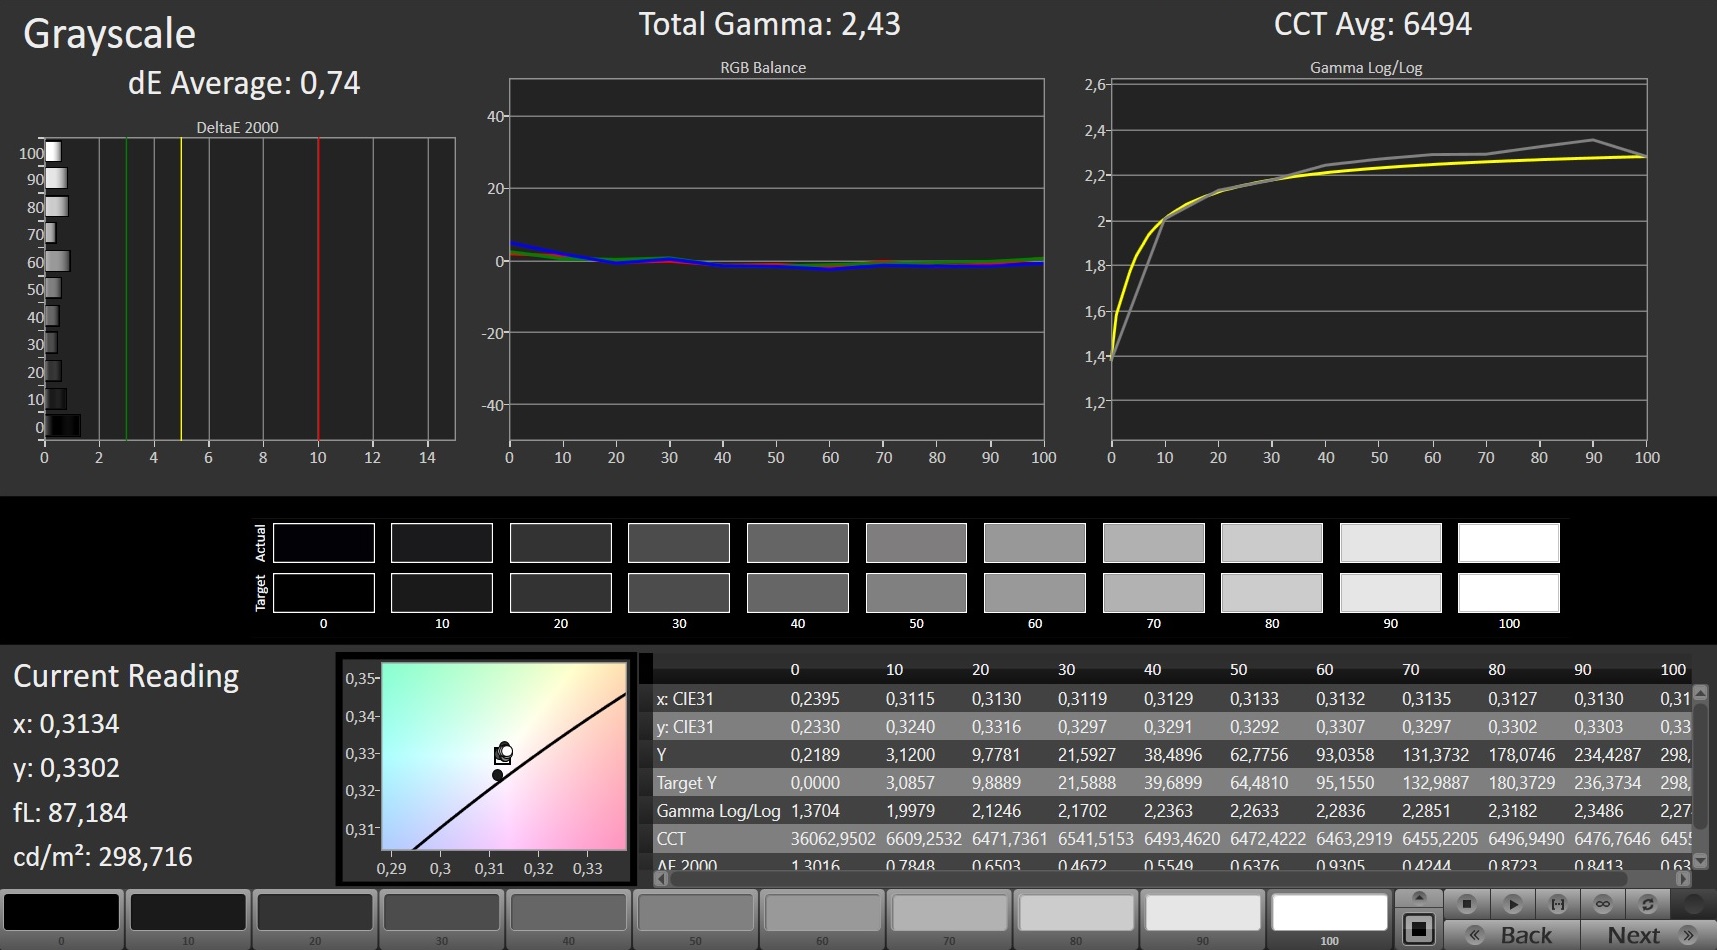
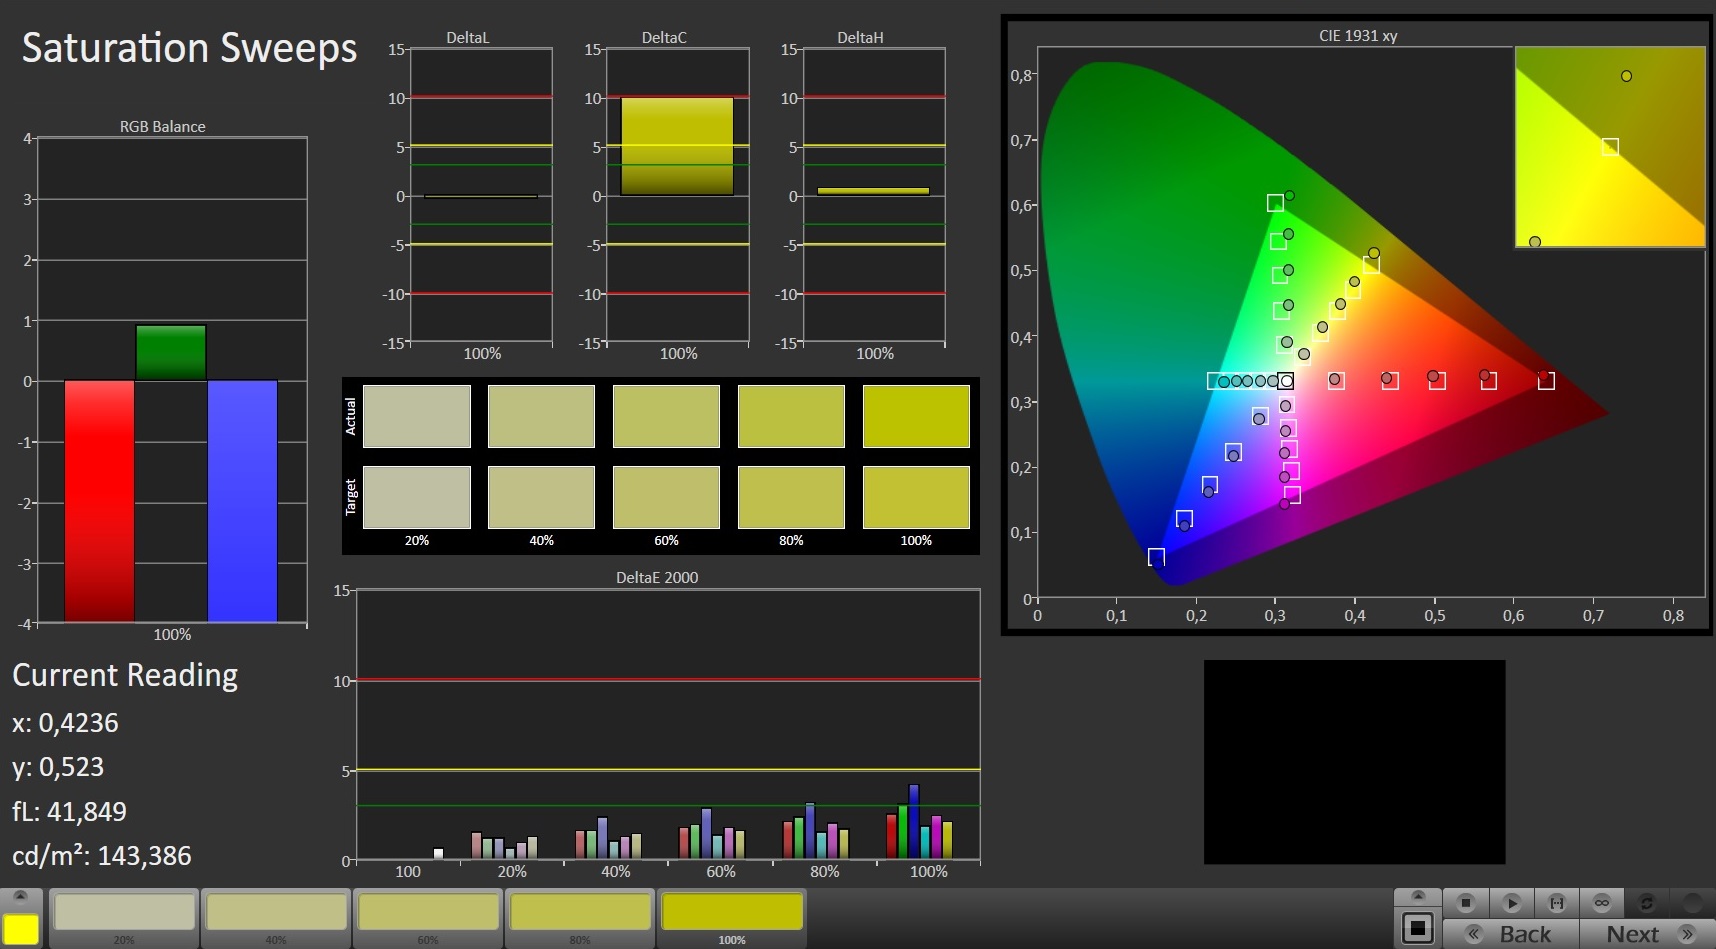
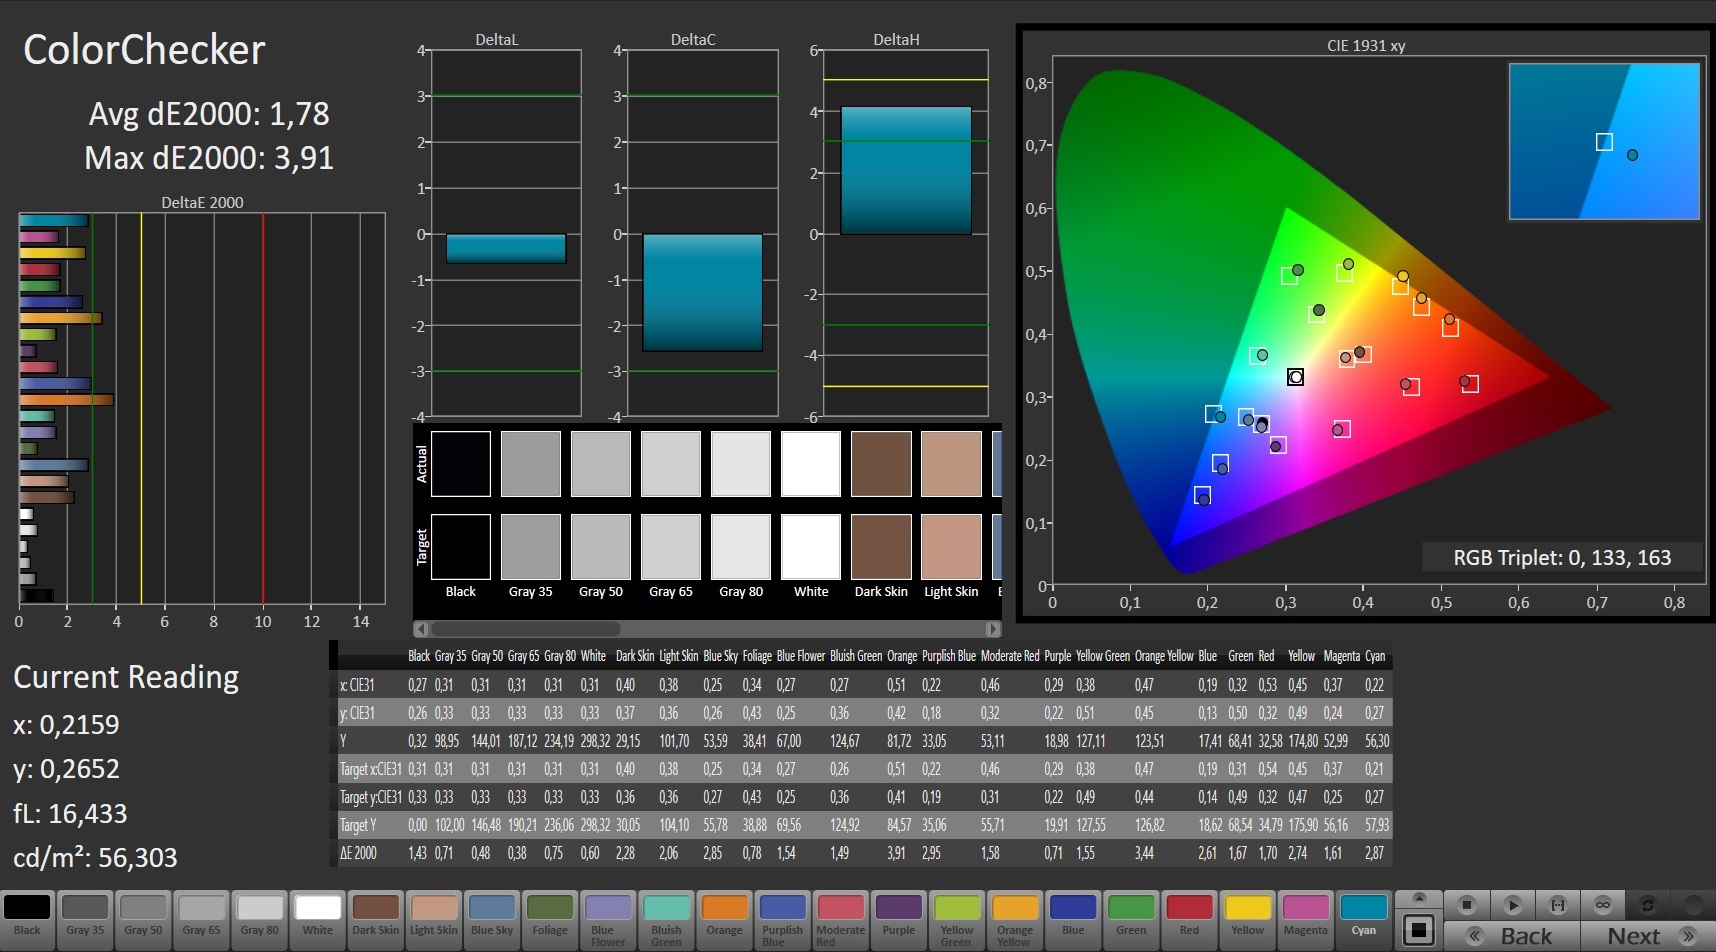
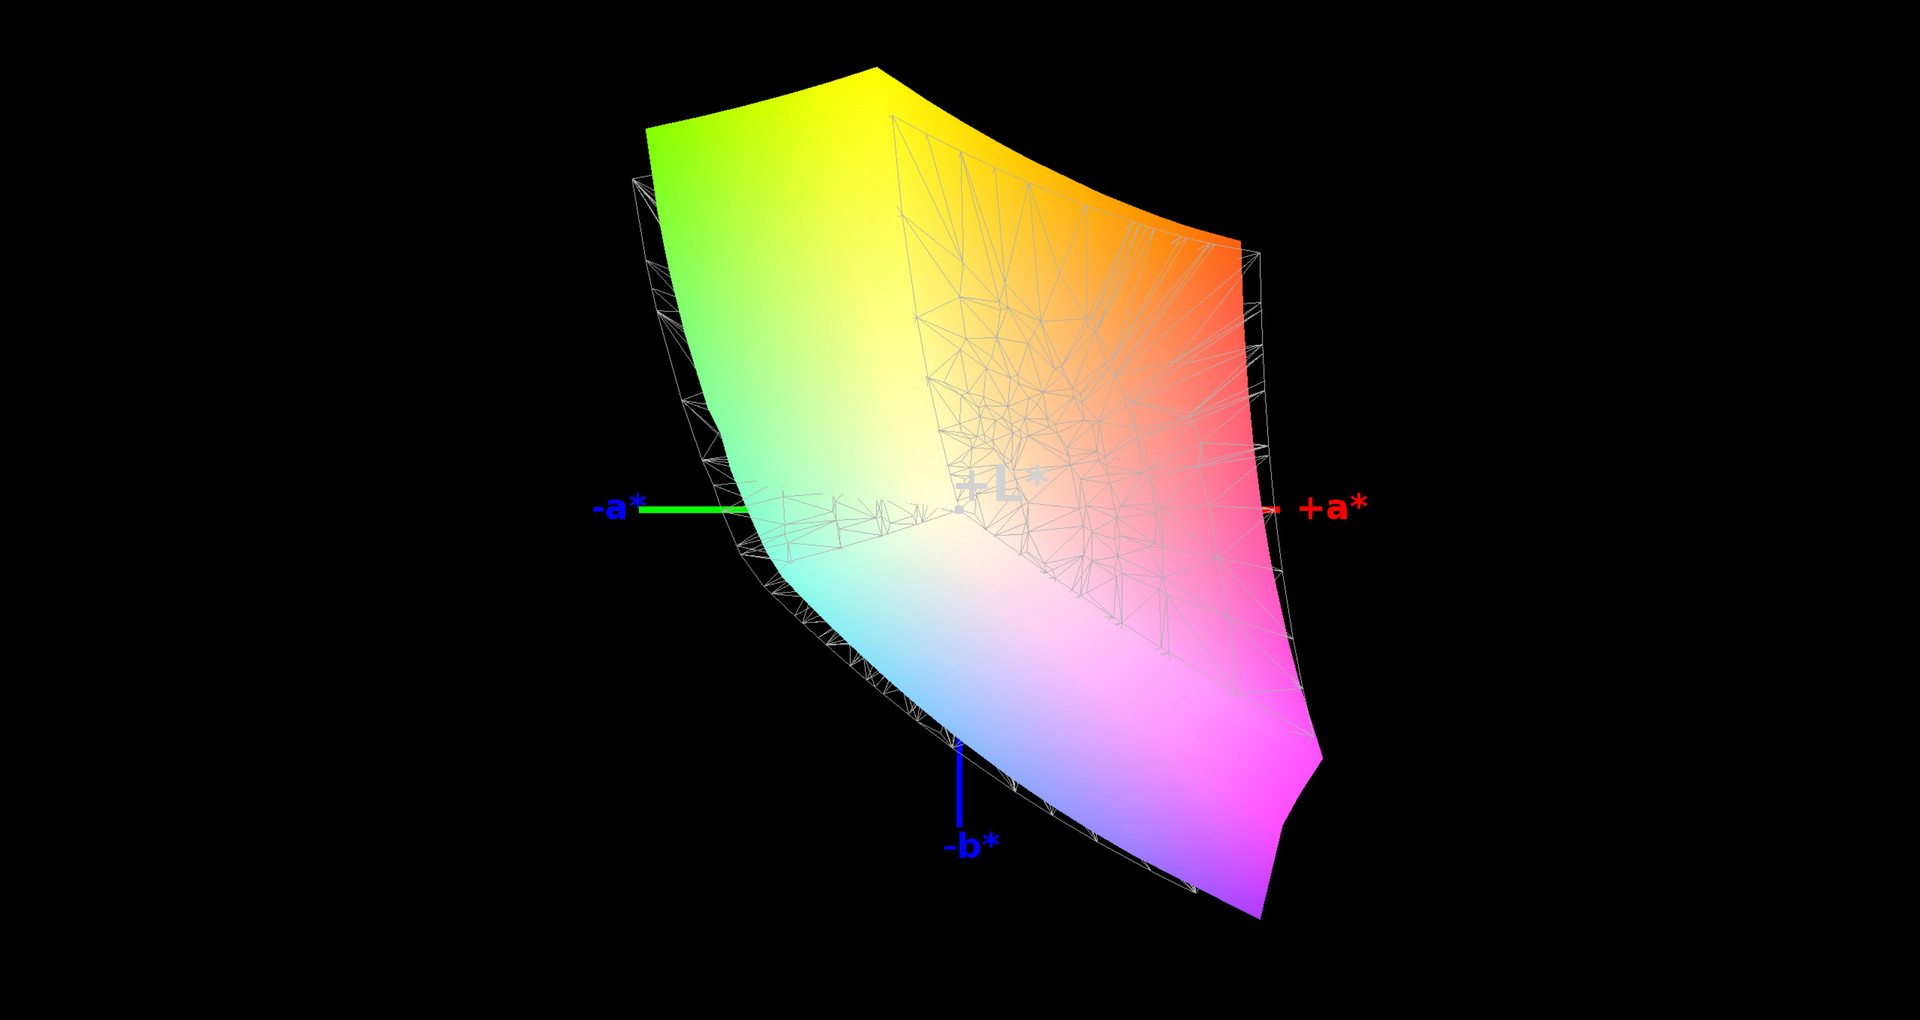
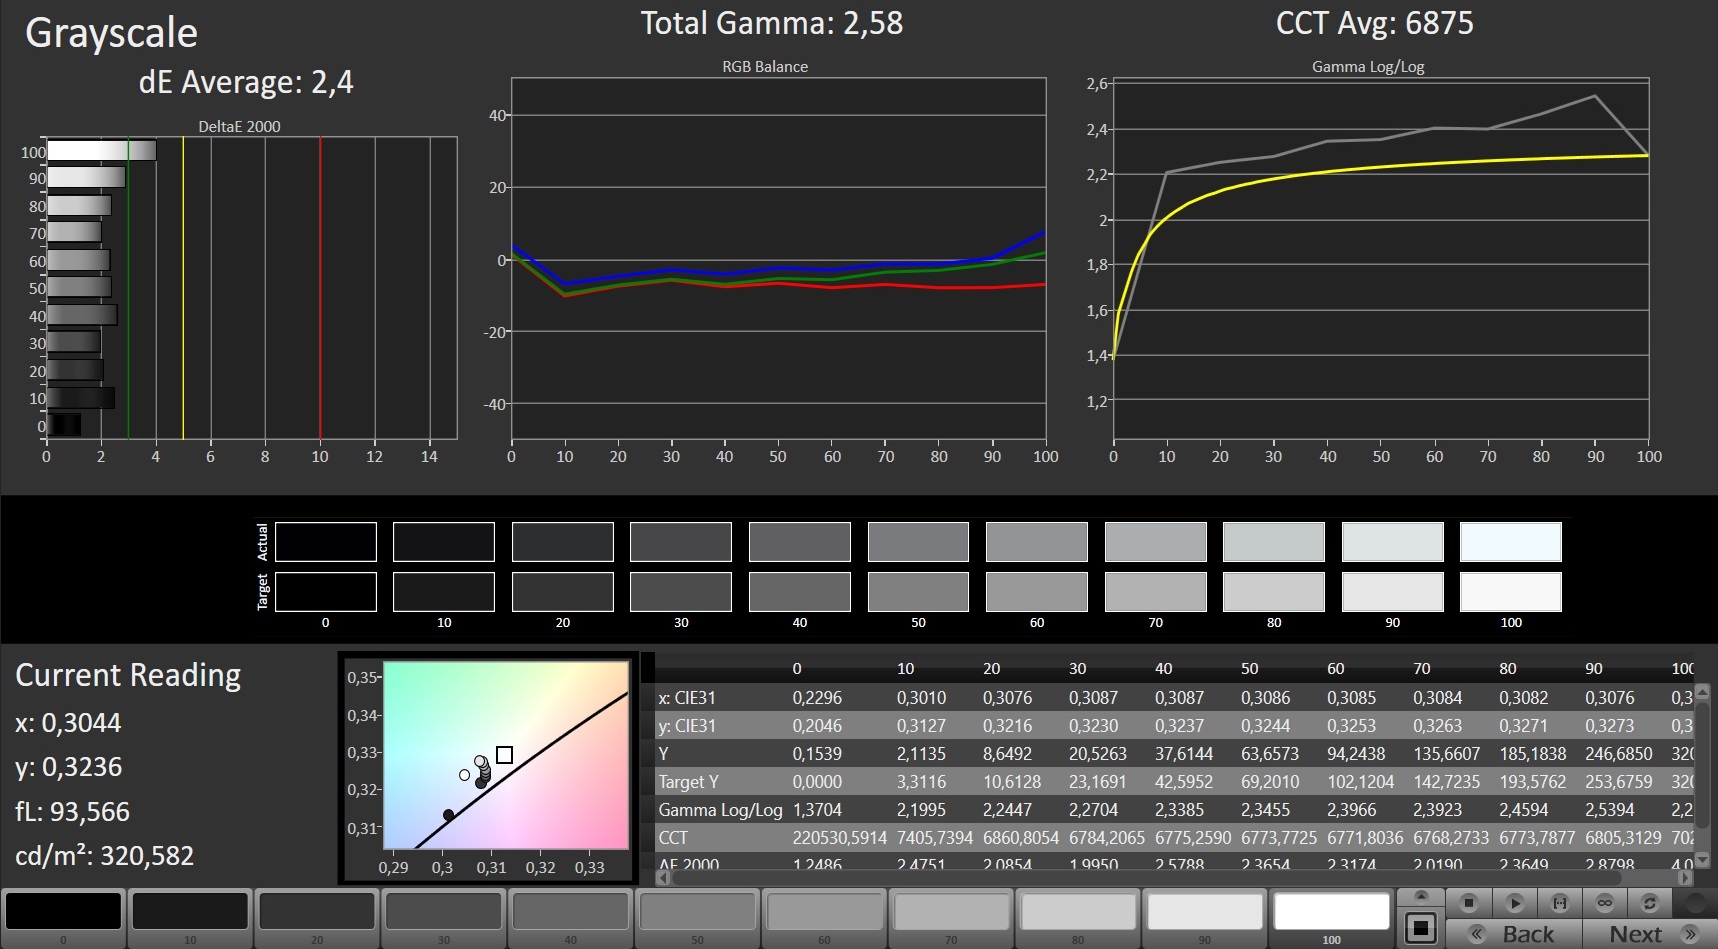
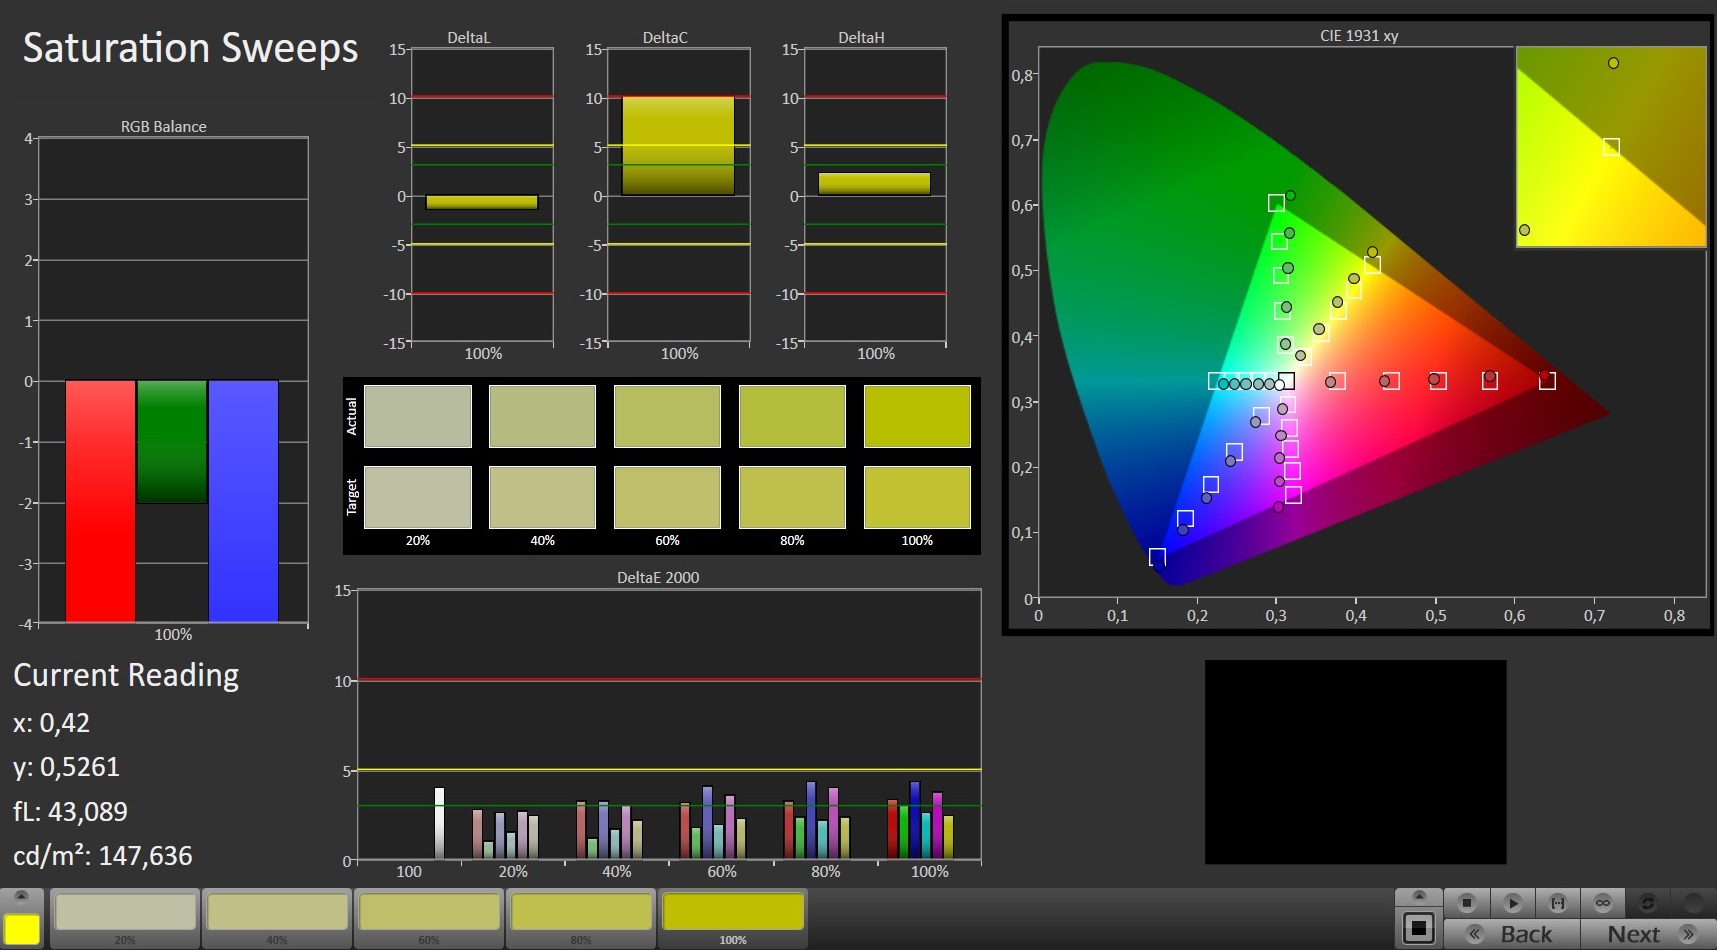
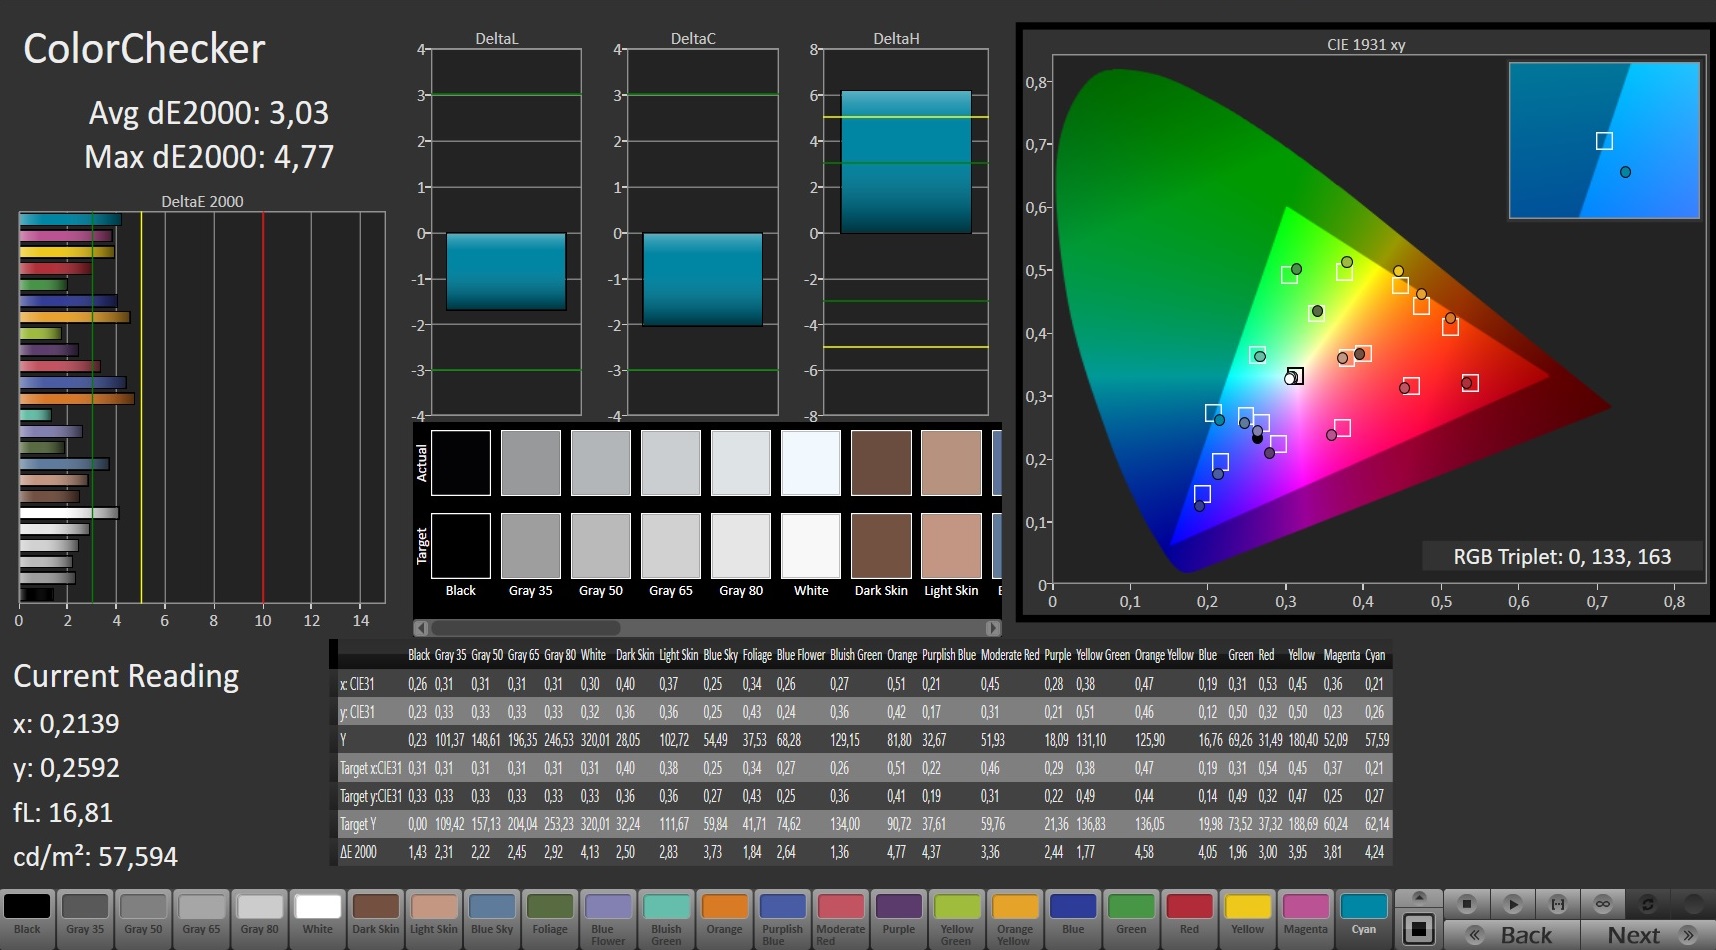

Its rather poor maximum brightness (262 nits) aside, the IPS display did pretty well by and large, with its black level of 0.22 nits, a contrast ratio of 1,200:1, and wide viewing angles. We found color space coverage to be at 92% sRGB and 60% AdobeRGB, which is acceptable for a gaming notebook.
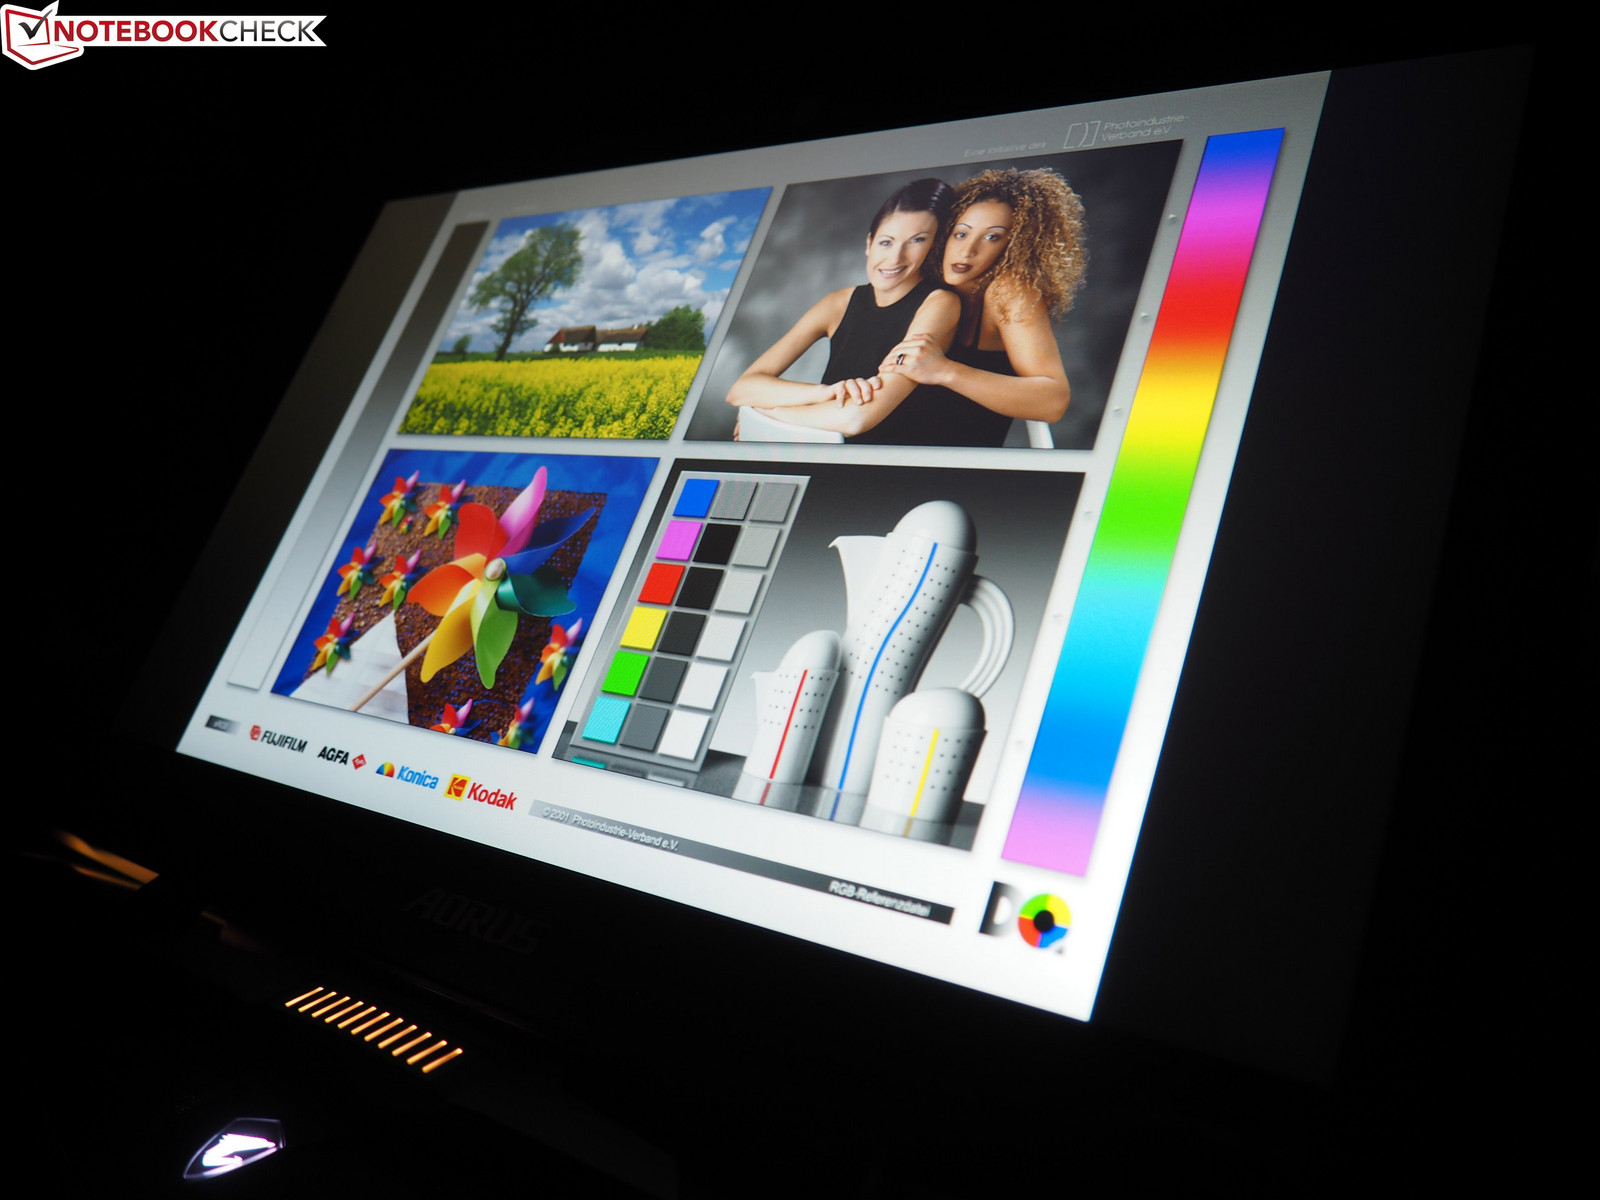
Overall brightness distribution was decent, and we did not notice any pronounced clouding. All things considered, the only display on a par with the Aorus X9 DT was the MSI GT75VR’s. The predecessor’s panel was significantly worse, save for its higher maximum brightness.
Display Response Times
| ↔ Response Time Black to White | ||
|---|---|---|
| 12 ms ... rise ↗ and fall ↘ combined | ↗ 6.8 ms rise | 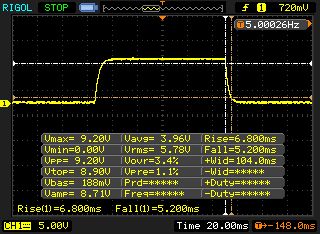 |
| ↘ 5.2 ms fall | ||
| The screen shows good response rates in our tests, but may be too slow for competitive gamers. In comparison, all tested devices range from 0.1 (minimum) to 240 (maximum) ms. » 31 % of all devices are better. This means that the measured response time is better than the average of all tested devices (19.9 ms). | ||
| ↔ Response Time 50% Grey to 80% Grey | ||
| 18.4 ms ... rise ↗ and fall ↘ combined | ↗ 9.2 ms rise | 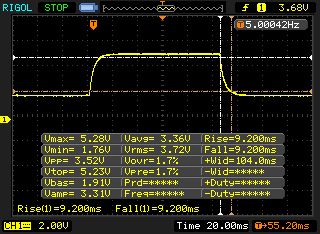 |
| ↘ 9.2 ms fall | ||
| The screen shows good response rates in our tests, but may be too slow for competitive gamers. In comparison, all tested devices range from 0.165 (minimum) to 636 (maximum) ms. » 32 % of all devices are better. This means that the measured response time is better than the average of all tested devices (31.1 ms). | ||
Screen Flickering / PWM (Pulse-Width Modulation)
| Screen flickering / PWM not detected | 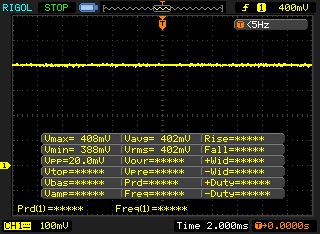 | ||
In comparison: 52 % of all tested devices do not use PWM to dim the display. If PWM was detected, an average of 7798 (minimum: 5 - maximum: 343500) Hz was measured. | |||
Performance
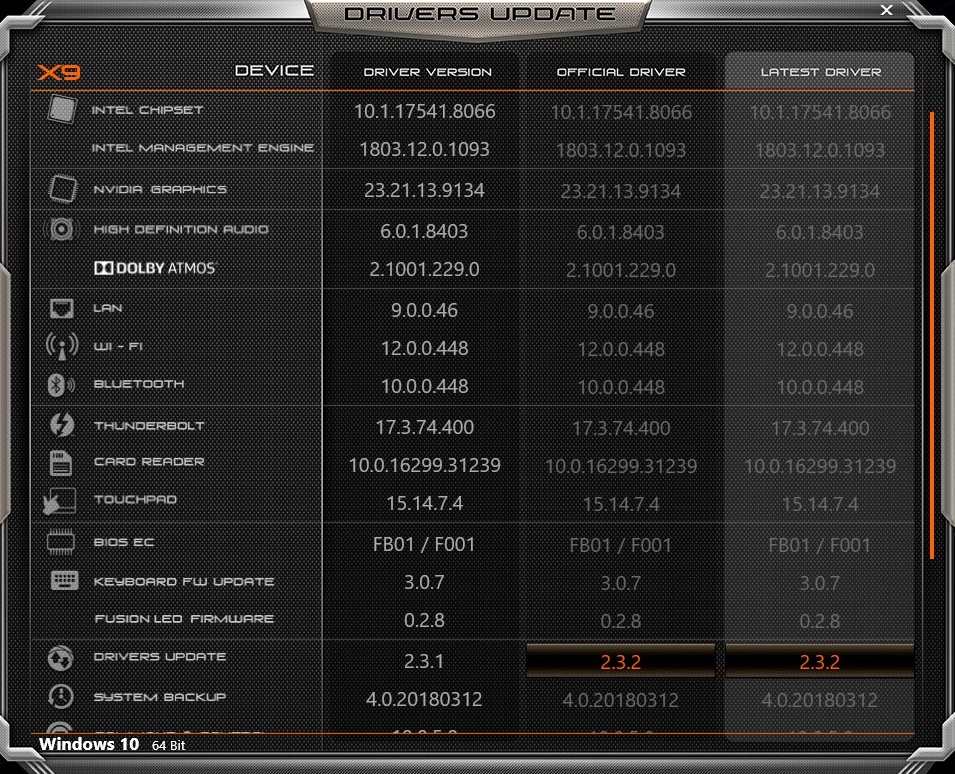
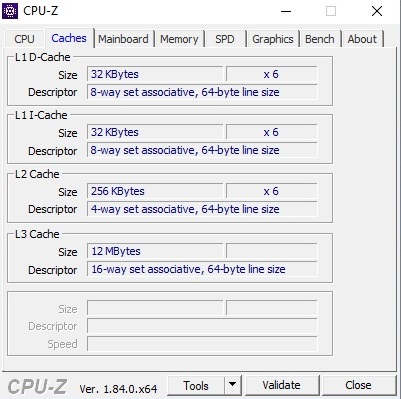
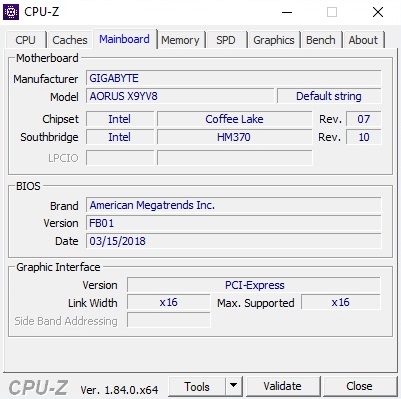
Let's start with some screenshots.
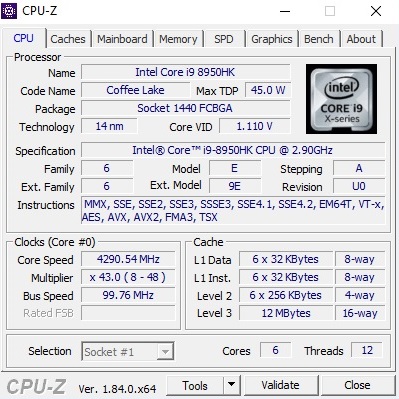
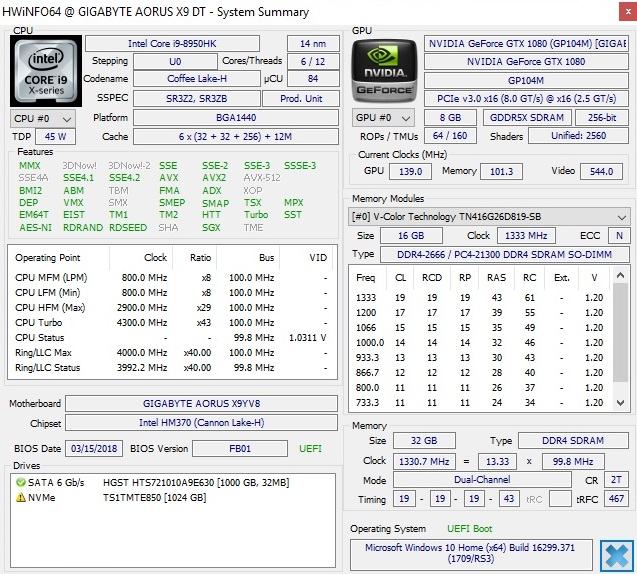
Processor
As already mentioned the CPU can be overclocked with the included Command & Control application. However, we suggest you take these claims with a grain of salt. The only difference between normal operation and OC level 3 was the Core i9-8950HK's consistent maximum turbo speed of 4.3 GHz (4.0 GHz on normal, 4.1 GHz on OC level 1, 4.2 GHz on OC level 2).
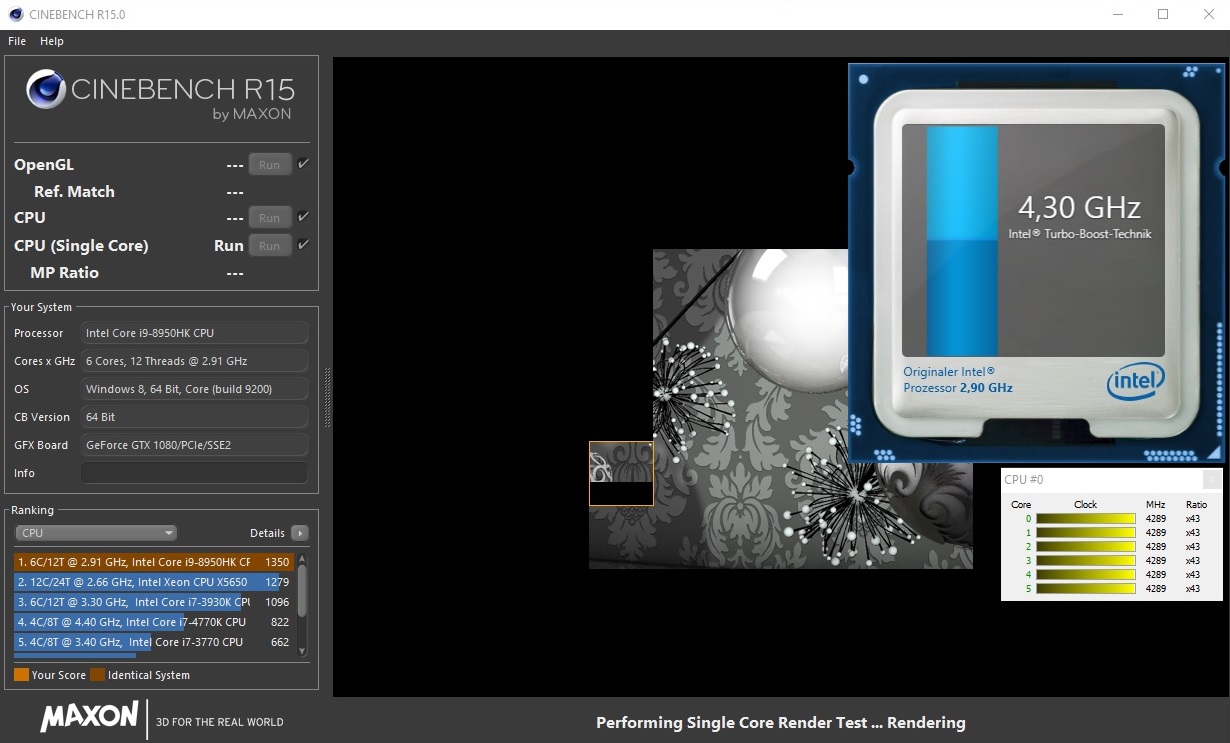
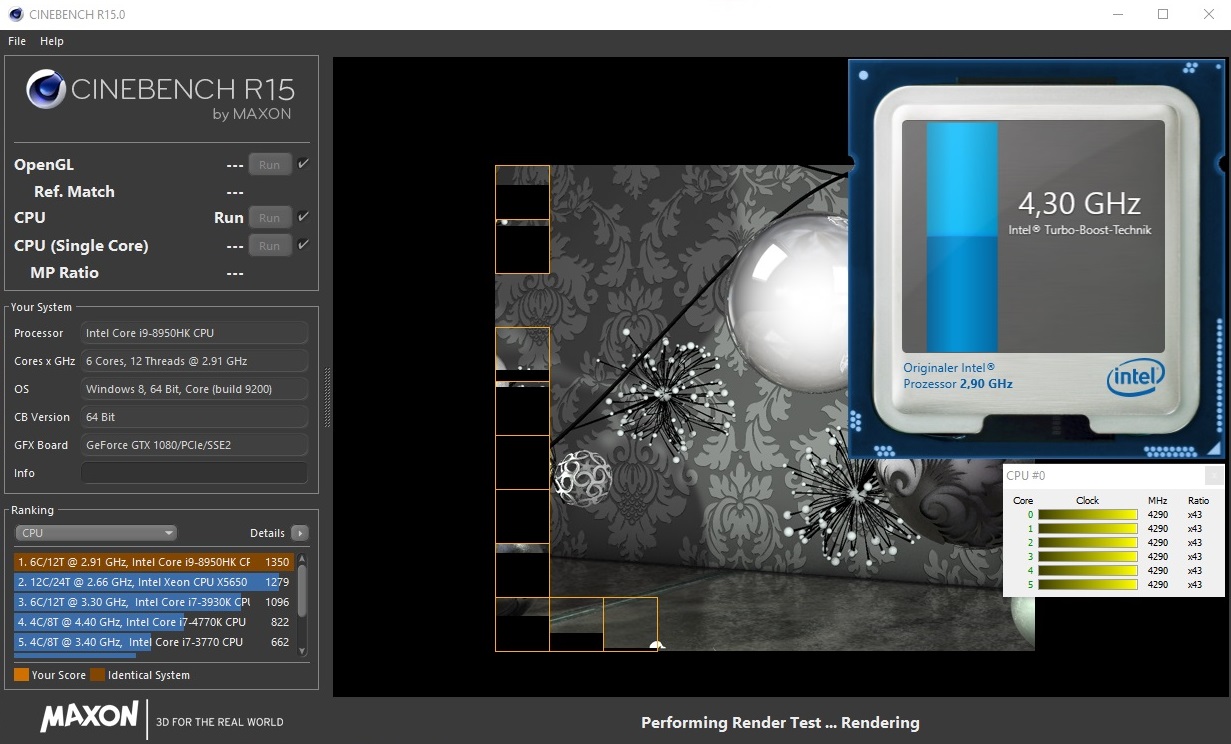
All previously reviewed Coffee Lake systems suffered from a massive drop in maximum turbo boost after a few seconds of sustained load. Even the Core i7-8750H’s clock frequency dropped by several hundred MHz (see for example the Aero 15X or the Asus ROG Zephyrus M GM501). This means that maximum performance was lower than it could have been in theory. On the contrary, the Aorus X9 DT was the first hexa-core CPU that did not show this behavior and thus was capable of fully utilizing its turbo-boost potential.
Accordingly, our review unit practically wiped the floor with its Kaby Lake based quad-core competitors. Even the i7-7820HK-equipped overclocked to 4.3 GHz laptops Asus ROG Chimera G703 and Acer Predator 17 X did not stand a chance against the X9 DT and were between 50 and 60% slower in Cinebench R15’s multi-thread benchmark.
System Performance
General system performance was top notch as well: 6,387 points in PC Mark 10 is impressive and deserving of first place among our test group. The fastest competitor was 14% slower (X9 2017), the slowest a whopping 27% (Asus G703). Thanks to the fast SSD, Windows 10 felt snappy with incredibly fast boot times and short application launch times.
| PCMark 10 - Score | |
| Average of class Gaming (5828 - 11574, n=95, last 2 years) | |
| Aorus X9 DT | |
| Aorus X9 | |
| HP Omen X 17-ap0xx | |
| MSI GT75VR 7RF-012 Titan Pro | |
| Asus G703 | |
| PCMark 8 Home Score Accelerated v2 | 5859 points | |
| PCMark 8 Work Score Accelerated v2 | 6055 points | |
| PCMark 10 Score | 6387 points | |
Help | ||
Storage Devices
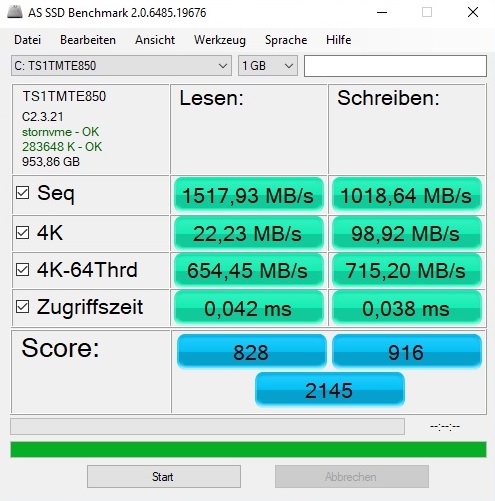
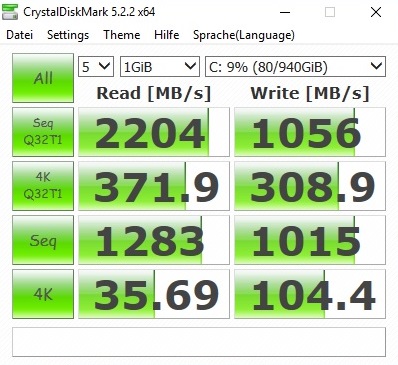
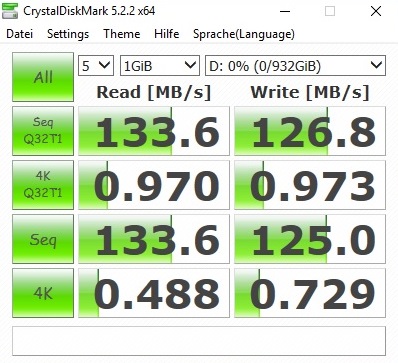
Speaking of which: Gigabyte has opted for a 1 TB large NVMe M.2 SSD made by Transcend (TS1TMTE850). Its AS SSD read and writes speeds of 1,517 and 1,018 MB/s, respectively, were much faster than any SATA-III drive will ever be able to achieve due to its inherent 500 MB/s bus limitation.
While the Transcend SSD was incapable of keeping up with even faster NVMe SSDs such as Samsung’s SM961 or PM961, this should not be noticeable for 95% of all users. Subjectively, these drives feel identical in everyday use.
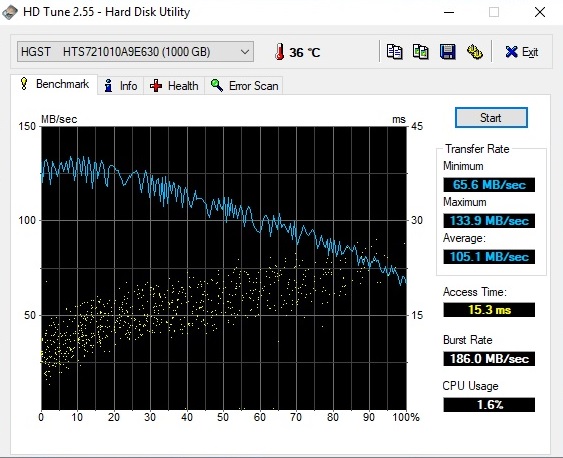
Our review unit was equipped with a secondary conventional 7.200 RPM hard disk drive that offered another 1 TB of storage space. For this drive, Gigabyte has opted for the very popular HGST Travelstar 7K1000.
| Aorus X9 DT Transcend TS1TMTE850 | Aorus X9 Samsung SM961 MZVKW512HMJP m.2 PCI-e | HP Omen X 17-ap0xx Samsung PM961 MZVLW256HEHP | Acer Predator 17 X GX-792-76DL Toshiba NVMe THNSN5512GPU7 | MSI GT75VR 7RF-012 Titan Pro 2x Samsung SM961 MZVPW256HEGL NVMe (RAID 0) | Asus G703 2x Samsung SM961 MZVKW512HMJP NVMe (RAID 0) | |
|---|---|---|---|---|---|---|
| AS SSD | 75% | 40% | 36% | 80% | 96% | |
| Seq Read (MB/s) | 1518 | 2695 78% | 2352 55% | 2261 49% | 3137 107% | 3177 109% |
| Seq Write (MB/s) | 1019 | 1678 65% | 1145 12% | 1338 31% | 2352 131% | 2556 151% |
| 4K Read (MB/s) | 22.23 | 50.6 128% | 44.81 102% | 39.52 78% | 50.1 125% | 47.61 114% |
| 4K Write (MB/s) | 98.9 | 134.3 36% | 116.2 17% | 133.8 35% | 128.8 30% | 148.4 50% |
| Score Read (Points) | 828 | 1534 85% | 1248 51% | 1118 35% | 1412 71% | 1633 97% |
| Score Write (Points) | 916 | 1478 61% | 1029 12% | 930 2% | 1289 41% | 1519 66% |
| Score Total (Points) | 2145 | 3753 75% | 2862 33% | 2581 20% | 3392 58% | 3962 85% |

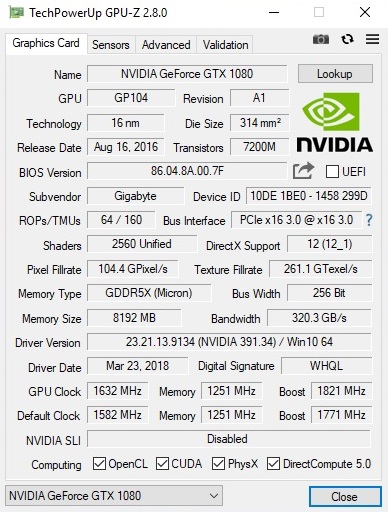
GPU Performance
Despite the fact that some users will certainly bemoan the loss of the X9’s SLI setup, we personally consider the single GPU setup a distinct advantage due to the aforementioned restrictions and limitations of dual GPU setups. Instead of the predecessor’s two GTX 1070 chips Gigabyte has now chosen a single GTX 1080 running at 1,582 MHz.
| 3DMark - 1920x1080 Fire Strike Graphics | |
| Average of class Gaming (12242 - 62849, n=120, last 2 years) | |
| Aorus X9 | |
| Acer Predator 17 X GX-792-76DL | |
| Aorus X9 DT | |
| Asus G703 | |
| MSI GT75VR 7RF-012 Titan Pro | |
| HP Omen X 17-ap0xx | |
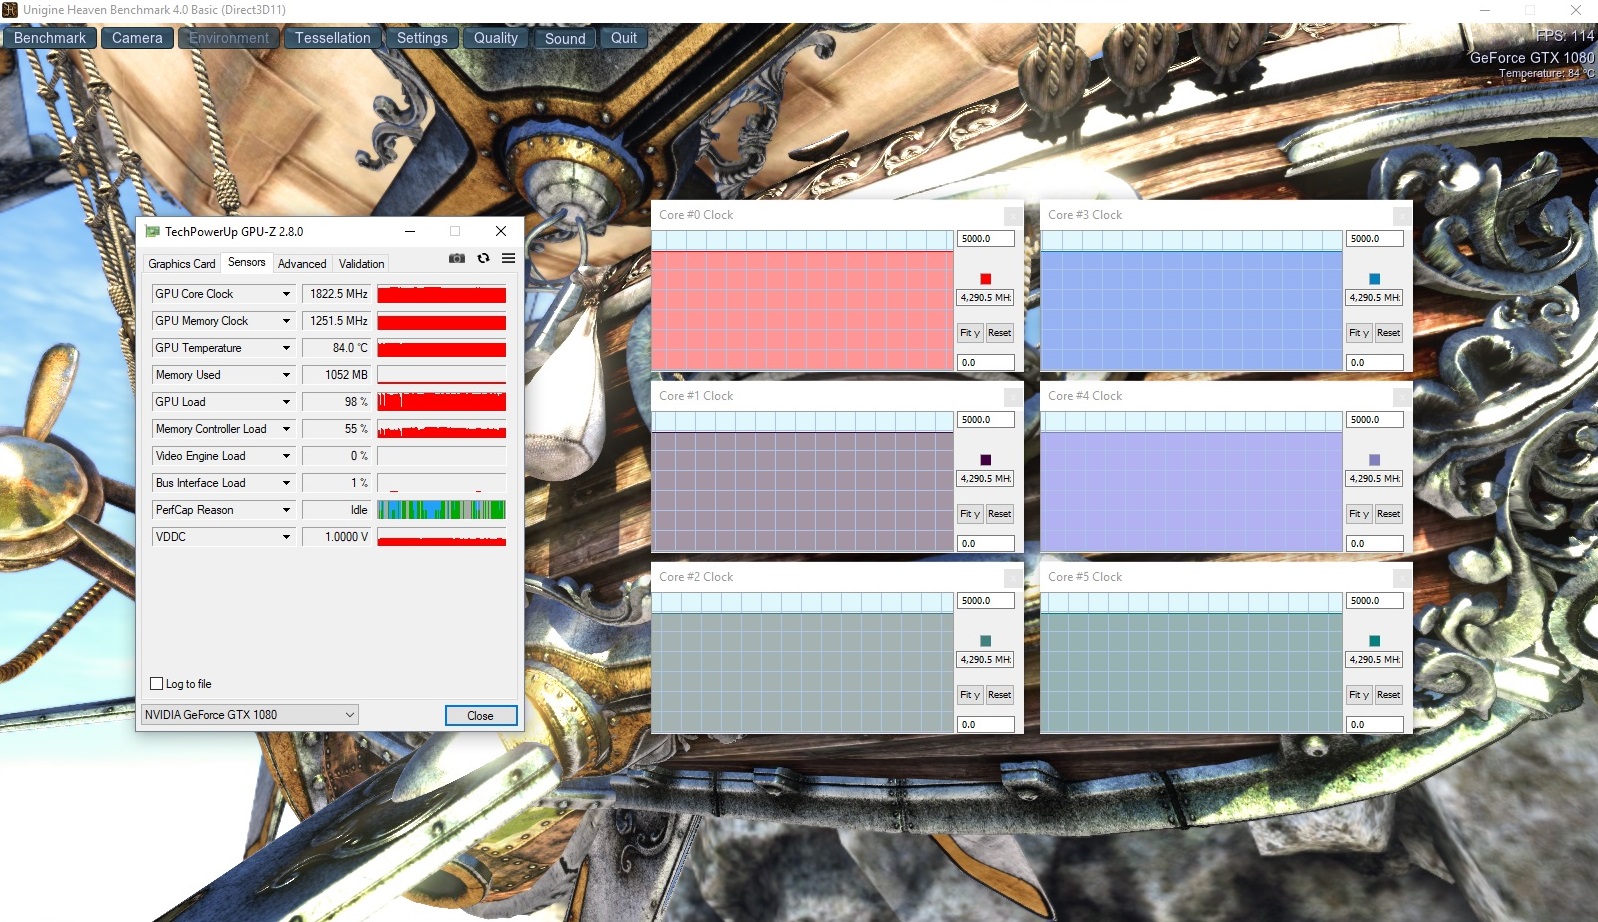
Like the CPU, the GPU can also be overclocked in 25 MHz steps. Out of the box, our review unit was set to level 2 and thus running at 1,632 MHz. Just like Intel’s Core CPUs, Nvidia’s Pascal GPUs are capable of dynamic overclocking based on ambient factors and independent of additional overclocking by the manufacturer.
Consequently, our review unit’s GeForce GTX 1080 ran with a very respectable average GPU boost frequency of 1,823 MHz (determined by running the Unigine Heaven 4.0 Benchmark as well as “The Witcher 3”). It was thus on a par with the likes of Acer (Predator 17X) and Asus (ROG Chimera G703).
| 3DMark 06 Standard Score | 40395 points | |
| 3DMark 11 Performance | 22703 points | |
| 3DMark Ice Storm Standard Score | 194505 points | |
| 3DMark Cloud Gate Standard Score | 42659 points | |
| 3DMark Fire Strike Score | 19250 points | |
Help | ||
Our review unit held its own during our sustained load tests as well, and frequencies remained fairly consistent in both our CineBench R15 loop (30 minutes multi-thread) and our “Witcher 3” load test (60 minutes at FHD/Ultra).
Gaming Performance
Due to the display’s resolution if just 1,920x1,080, it is virtually impossible to bring the GeForce GTX 1080 to its knees. All tested games ran smoothly at their respective maximum settings. Many games even managed more than 60 FPS rendering the 144 Hz panel a useful investment. Playing games on an external WQHD display (2,560x1,440) was also a very smooth experience with the Aorus X9 DT. UHD displays (3,840x2,160) can be too much, though.
| The Witcher 3 - 1920x1080 Ultra Graphics & Postprocessing (HBAO+) | |
| Average of class Gaming (95 - 240, n=8, last 2 years) | |
| Aorus X9 | |
| Asus G703 | |
| Aorus X9 DT | |
| MSI GT75VR 7RF-012 Titan Pro | |
| Acer Predator 17 X GX-792-76DL | |
| HP Omen X 17-ap0xx | |
Despite the fact that hexa-core CPUs do not tend to have a measurable influence on gaming performance, the X9 DT’s frame rates were significantly higher than on other GTX 1080 laptops. The most likely cause is the Core i9-8950HK’s high clock speeds with performance levels akin to desktop CPUs. Games that are not too limited by the GPU reach their respective CPU limit later and manage to squeeze out some extra FPS along the way. Overclocking the GPU obviously also helps.
| low | med. | high | ultra | |
|---|---|---|---|---|
| The Witcher 3 (2015) | 146 | 77.4 | ||
| Dirt 4 (2017) | 157 | 105 | ||
| F1 2017 (2017) | 167 | 115 | ||
| Middle-earth: Shadow of War (2017) | 126 | 99 | ||
| The Evil Within 2 (2017) | 77.7 | 75.3 | ||
| ELEX (2017) | 121 | 99.2 | ||
| Wolfenstein II: The New Colossus (2017) | 139 | 123 | ||
| Assassin´s Creed Origins (2017) | 107 | 86 | ||
| Call of Duty WWII (2017) | 175 | 149 | ||
| Fortnite (2018) | 207 | 160 | ||
| Final Fantasy XV Benchmark (2018) | 77.6 | |||
| Kingdom Come: Deliverance (2018) | 104 | 77.5 | ||
| Far Cry 5 (2018) | 120 | 113 |
Emissions
System Noise
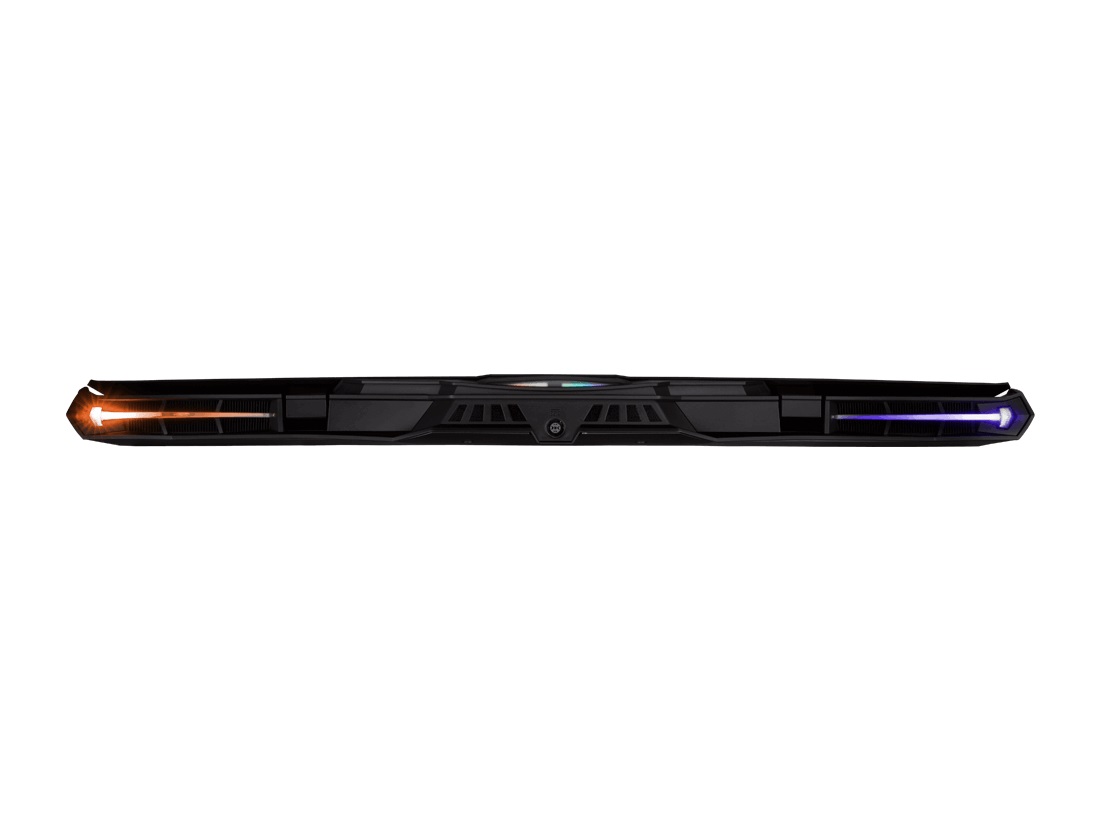
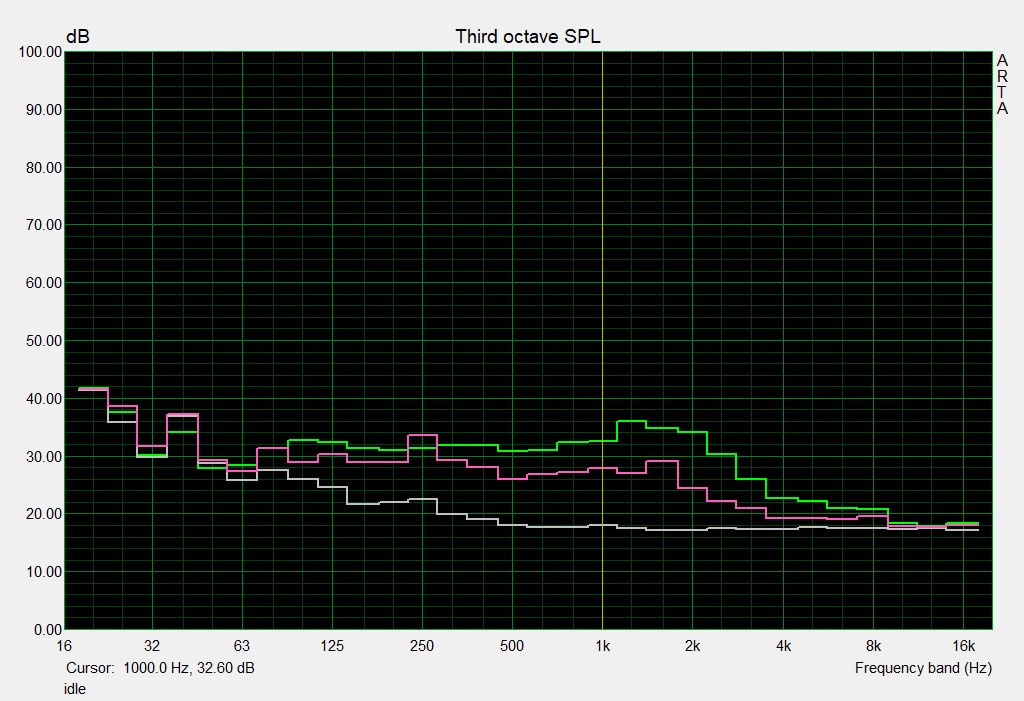
By and large, the X9 DT was a very loud notebook. With the fans set to “Gaming”, the four fans were noticeable even when the device was completely idle (36-37 dB(A)) and got even louder with up to 40 dB(A) in low-load usage scenarios such as installing software, Windows updates, or watching videos. The same happened during the boot process.
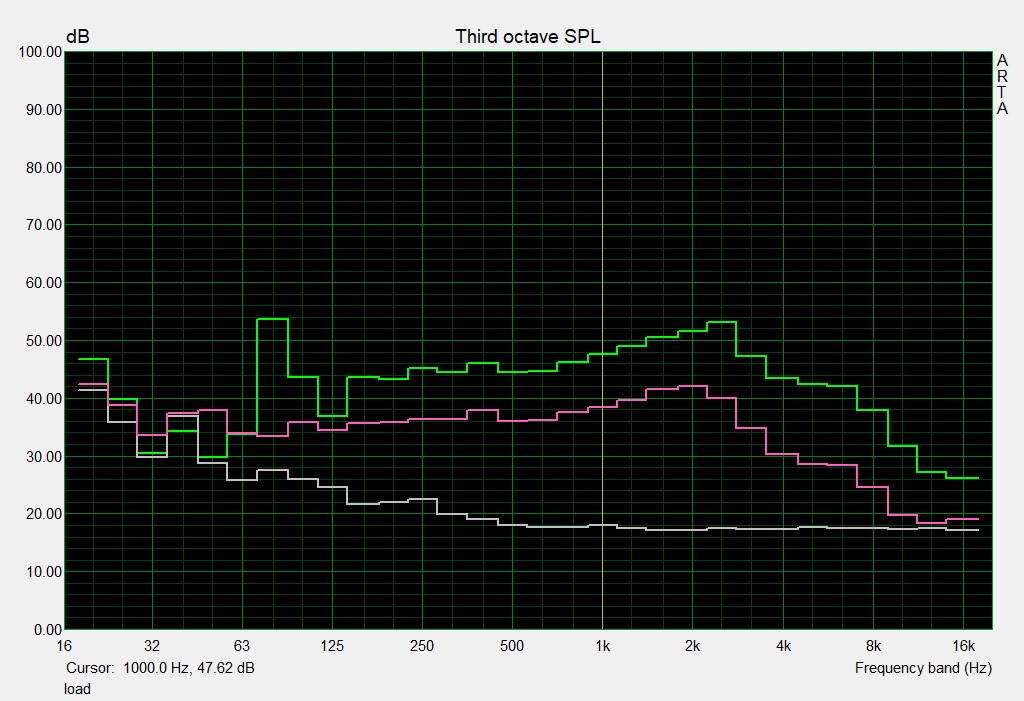
However, it was when playing games that all hell broke loose. A sound pressure level of between 50 and 61 dB(A) depending on application (for example: 57 dB(A) when running “The Witcher 3”) means that the 17-inch Aorus X9 DT was one of the noisiest notebooks ever reviewed by us. The overall gaming experience is severely limited without headphones and even with them the system noise remained obtrusive and annoying.
As a consequence of these findings, we will refrain from listening to manufacturer’s requests regarding fan or overclocking presets that are clearly optimized for high benchmark at the expense of tolerable levels of noise. We suggest to steer clear not just of higher OC levels, but also the “Gaming” fan mode completely. The 17-inch notebook was surprisingly quiet with the fans set to “Quiet”, which we suggest selecting for office workloads and other low-load usage scenarios such as browsing the web.
Noise level
| Idle |
| 36 / 37 / 43 dB(A) |
| HDD |
| 33 dB(A) |
| Load |
| 50 / 61 dB(A) |
 | ||
30 dB silent 40 dB(A) audible 50 dB(A) loud |
||
min: | ||
| Aorus X9 DT GeForce GTX 1080 Mobile, i9-8950HK | Aorus X9 GeForce GTX 1070 SLI (Laptop), i7-7820HK | HP Omen X 17-ap0xx GeForce GTX 1080 Mobile, i7-7820HK | Acer Predator 17 X GX-792-76DL GeForce GTX 1080 Mobile, i7-7820HK | MSI GT75VR 7RF-012 Titan Pro GeForce GTX 1080 Mobile, i7-7820HK | Asus G703 GeForce GTX 1080 Mobile, i7-7820HK | Average of class Gaming | |
|---|---|---|---|---|---|---|---|
| Noise | 1% | 17% | 11% | 6% | 8% | 22% | |
| off / environment * (dB) | 30 | 30 -0% | 28.3 6% | 30 -0% | 30 -0% | 30 -0% | 24.1 ? 20% |
| Idle Minimum * (dB) | 36 | 35 3% | 31.5 12% | 33 8% | 33 8% | 35 3% | 25.8 ? 28% |
| Idle Average * (dB) | 37 | 37 -0% | 31.6 15% | 35 5% | 34 8% | 36 3% | 27.4 ? 26% |
| Idle Maximum * (dB) | 43 | 43 -0% | 31.6 27% | 37 14% | 38 12% | 38 12% | 30 ? 30% |
| Load Average * (dB) | 50 | 49 2% | 36.8 26% | 40 20% | 44 12% | 46 8% | 43 ? 14% |
| Witcher 3 ultra * (dB) | 57 | 56 2% | 48.2 15% | 56 2% | 48 16% | ||
| Load Maximum * (dB) | 61 | 60 2% | 52.1 15% | 50 18% | 62 -2% | 54 11% | 54 ? 11% |
* ... smaller is better
Temperature
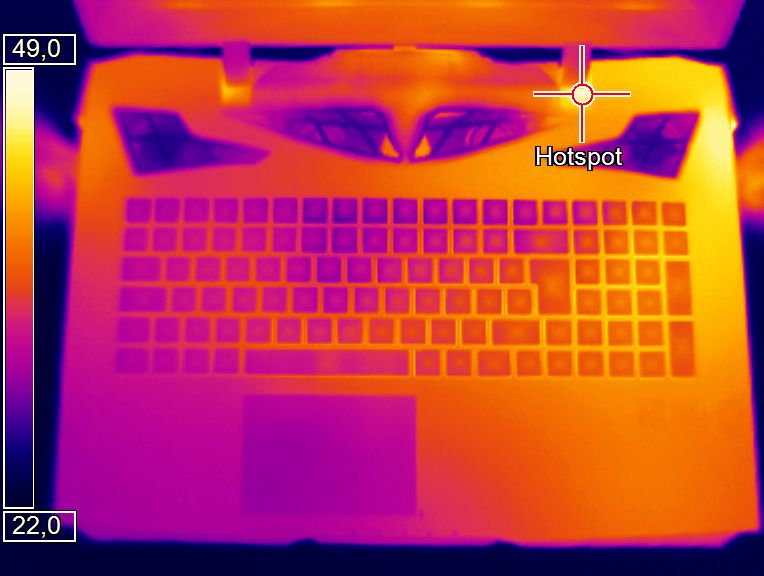
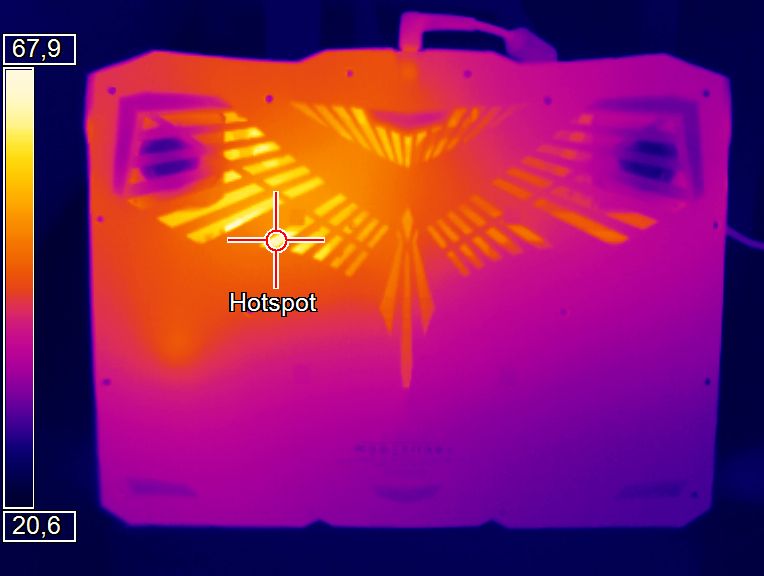
While the system got louder compared to its predecessor, surface temperatures were slightly lower in return. The X9 2017 reached a maximum surface temperature of 62 °C (~144 °F) when running FurMark and Prime95 simultaneously; the new model tops out at “just” 55 °C (~131 °F) at the bottom. The top stayed 4 °C (~7 °F) cooler than before - 43 °C (~109 °F) instead of 47 °C (~117 °F) - and when idle, the entire chassis remained below 30 °C (~86 °F).
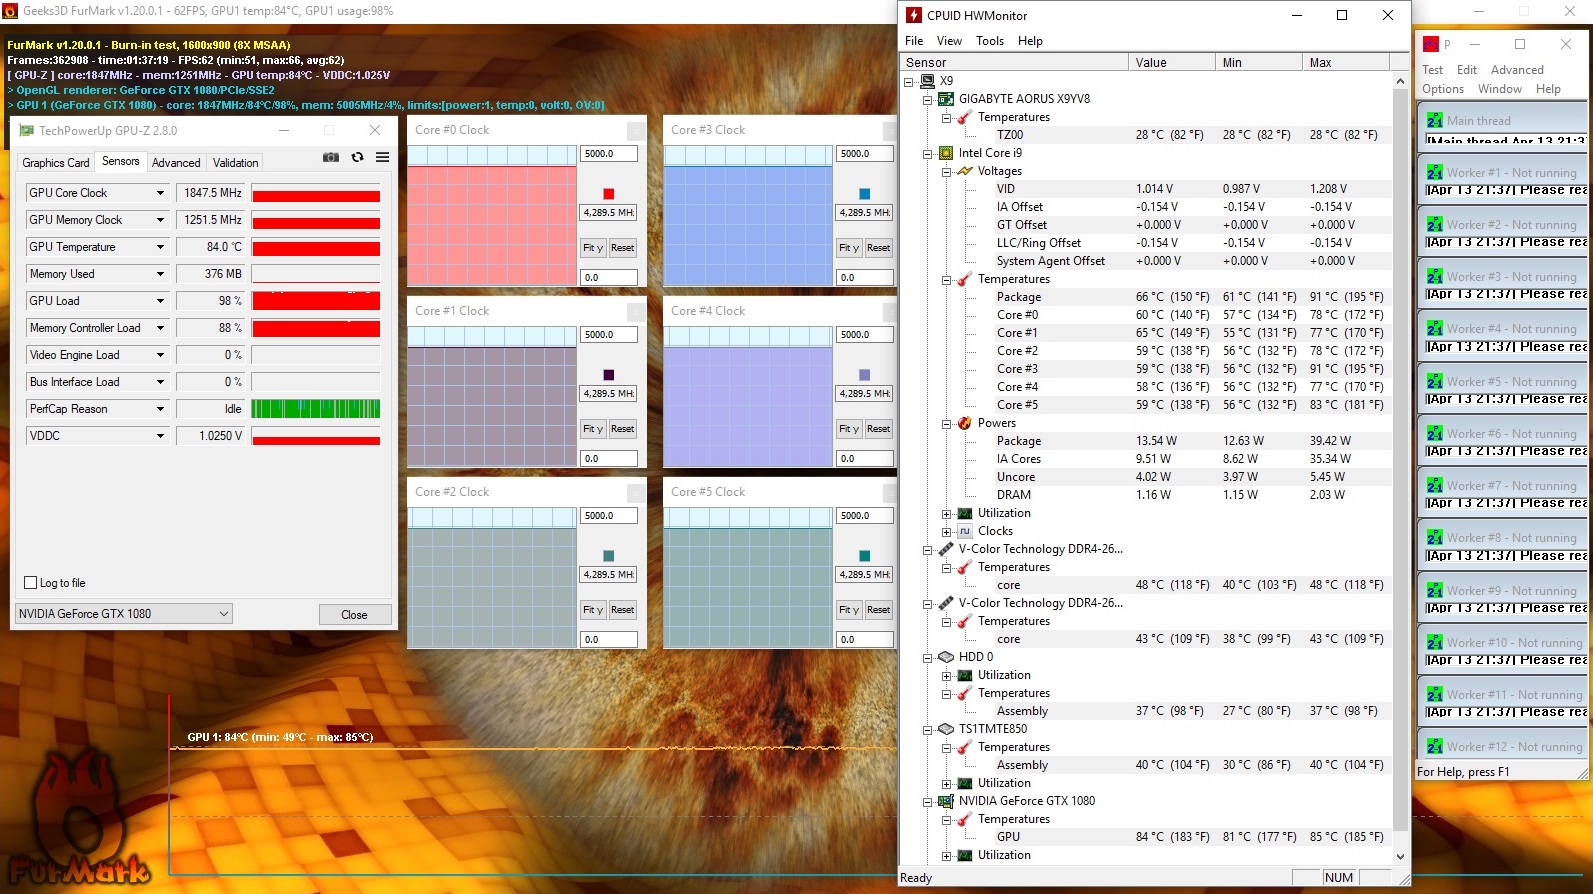
Due to a lack of throttling both chips got very hot under maximum load with up to 91 °C (~196 °F) and 85 °C (~185 °F) for CPU and GPU, respectively.
(±) The maximum temperature on the upper side is 43 °C / 109 F, compared to the average of 40.4 °C / 105 F, ranging from 21.2 to 68.8 °C for the class Gaming.
(-) The bottom heats up to a maximum of 55 °C / 131 F, compared to the average of 43.2 °C / 110 F
(+) In idle usage, the average temperature for the upper side is 25.2 °C / 77 F, compared to the device average of 33.9 °C / 93 F.
(±) Playing The Witcher 3, the average temperature for the upper side is 37.8 °C / 100 F, compared to the device average of 33.9 °C / 93 F.
(±) The palmrests and touchpad can get very hot to the touch with a maximum of 38 °C / 100.4 F.
(-) The average temperature of the palmrest area of similar devices was 28.8 °C / 83.8 F (-9.2 °C / -16.6 F).
| Aorus X9 DT GeForce GTX 1080 Mobile, i9-8950HK | Aorus X9 GeForce GTX 1070 SLI (Laptop), i7-7820HK | HP Omen X 17-ap0xx GeForce GTX 1080 Mobile, i7-7820HK | Acer Predator 17 X GX-792-76DL GeForce GTX 1080 Mobile, i7-7820HK | MSI GT75VR 7RF-012 Titan Pro GeForce GTX 1080 Mobile, i7-7820HK | Asus G703 GeForce GTX 1080 Mobile, i7-7820HK | Average of class Gaming | |
|---|---|---|---|---|---|---|---|
| Heat | -9% | 16% | -4% | -15% | -11% | -6% | |
| Maximum Upper Side * (°C) | 43 | 47 -9% | 35.6 17% | 44.2 -3% | 46 -7% | 55 -28% | 45.2 ? -5% |
| Maximum Bottom * (°C) | 55 | 62 -13% | 39 29% | 43 22% | 57 -4% | 54 2% | 48 ? 13% |
| Idle Upper Side * (°C) | 27 | 30 -11% | 24.2 10% | 32.4 -20% | 34 -26% | 29 -7% | 31.1 ? -15% |
| Idle Bottom * (°C) | 29 | 30 -3% | 27.4 6% | 32.8 -13% | 35 -21% | 32 -10% | 34.2 ? -18% |
* ... smaller is better
Speakers
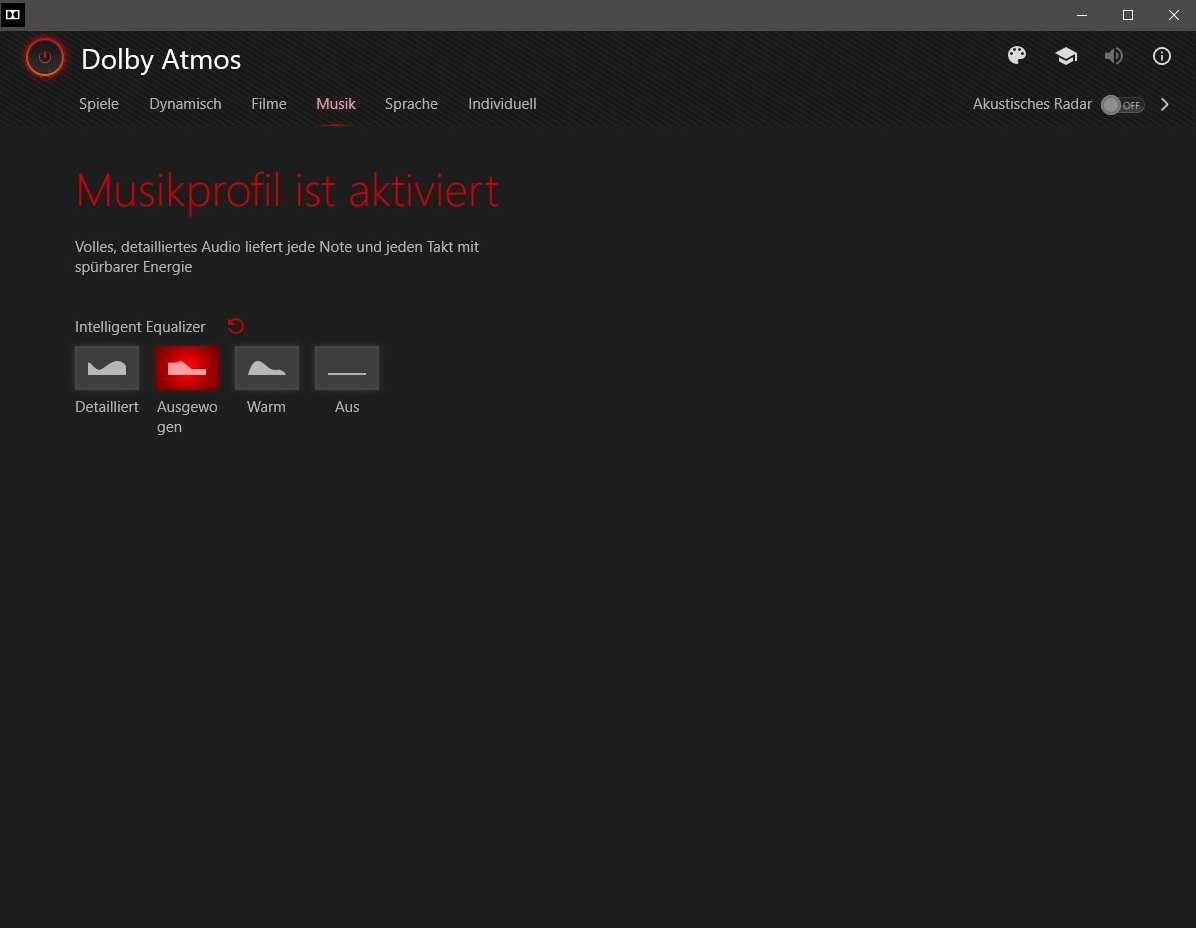
The sound system has been slightly updated. More specifically, although the speakers are still the same, the software has been replaced: instead of Gigabyte’s Tools Audio Equalizer the system now supports Dolby Atmos.
Subjectively speaking the latter makes for a different soundscape; objectively, our audio analysis returned almost identical results to last year’s model with slightly better highs on the latter.
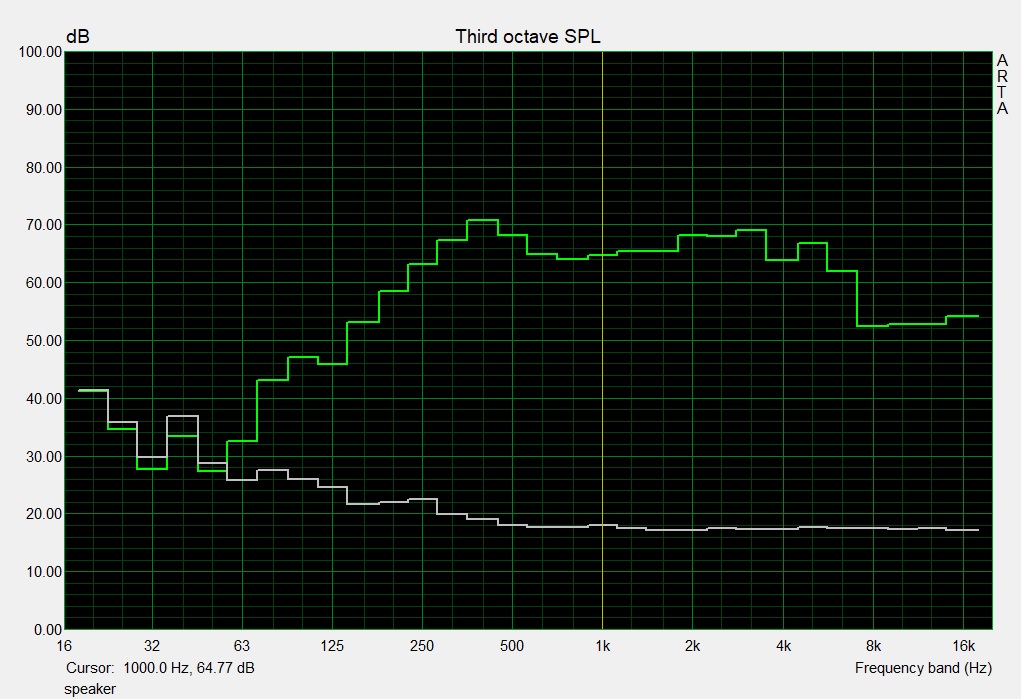
Aorus X9 DT audio analysis
(±) | speaker loudness is average but good (78 dB)
Bass 100 - 315 Hz
(±) | reduced bass - on average 9.3% lower than median
(±) | linearity of bass is average (9.6% delta to prev. frequency)
Mids 400 - 2000 Hz
(+) | balanced mids - only 2.5% away from median
(+) | mids are linear (3.9% delta to prev. frequency)
Highs 2 - 16 kHz
(±) | reduced highs - on average 5.2% lower than median
(±) | linearity of highs is average (7.4% delta to prev. frequency)
Overall 100 - 16.000 Hz
(+) | overall sound is linear (14.4% difference to median)
Compared to same class
» 27% of all tested devices in this class were better, 7% similar, 66% worse
» The best had a delta of 6%, average was 18%, worst was 132%
Compared to all devices tested
» 18% of all tested devices were better, 4% similar, 78% worse
» The best had a delta of 4%, average was 24%, worst was 134%
HP Omen X 17-ap0xx audio analysis
(-) | not very loud speakers (65.7 dB)
Bass 100 - 315 Hz
(-) | nearly no bass - on average 18.1% lower than median
(±) | linearity of bass is average (9.9% delta to prev. frequency)
Mids 400 - 2000 Hz
(+) | balanced mids - only 3.4% away from median
(+) | mids are linear (6.3% delta to prev. frequency)
Highs 2 - 16 kHz
(+) | balanced highs - only 2.3% away from median
(±) | linearity of highs is average (9.8% delta to prev. frequency)
Overall 100 - 16.000 Hz
(±) | linearity of overall sound is average (22.3% difference to median)
Compared to same class
» 80% of all tested devices in this class were better, 6% similar, 14% worse
» The best had a delta of 6%, average was 18%, worst was 132%
Compared to all devices tested
» 65% of all tested devices were better, 6% similar, 29% worse
» The best had a delta of 4%, average was 24%, worst was 134%
Energy Management
Power Consumption
Given that the Aorus X9 DT does not support Optimus GPU switching, overall power consumption was pretty high: between 28 and 40 W when idle were anything but impressive. Under load, the 17-inch notebook consumed between 109 and 353 W, and was thus above average in this category. At least in part the factory OC settings are to blame for the high power consumption.
| Off / Standby | |
| Idle | |
| Load |
|
Key:
min: | |
| Aorus X9 DT GeForce GTX 1080 Mobile, i9-8950HK | Aorus X9 GeForce GTX 1070 SLI (Laptop), i7-7820HK | HP Omen X 17-ap0xx GeForce GTX 1080 Mobile, i7-7820HK | Acer Predator 17 X GX-792-76DL GeForce GTX 1080 Mobile, i7-7820HK | MSI GT75VR 7RF-012 Titan Pro GeForce GTX 1080 Mobile, i7-7820HK | Asus G703 GeForce GTX 1080 Mobile, i7-7820HK | Average of class Gaming | |
|---|---|---|---|---|---|---|---|
| Power Consumption | -7% | 26% | 10% | -8% | 4% | 34% | |
| Idle Minimum * (Watt) | 28 | 29 -4% | 21.6 23% | 27 4% | 34 -21% | 26 7% | 13.2 ? 53% |
| Idle Average * (Watt) | 37 | 35 5% | 26.4 29% | 32 14% | 41 -11% | 30 19% | 18.9 ? 49% |
| Idle Maximum * (Watt) | 40 | 42 -5% | 26.6 33% | 41 -2% | 50 -25% | 37 7% | 24.3 ? 39% |
| Load Average * (Watt) | 109 | 140 -28% | 95.6 12% | 102 6% | 106 3% | 123 -13% | 108 ? 1% |
| Witcher 3 ultra * (Watt) | 256 | 295 -15% | 221.7 13% | 257 -0% | 257 -0% | ||
| Load Maximum * (Watt) | 353 | 334 5% | 199.6 43% | 248 30% | 320 9% | 341 3% | 254 ? 28% |
* ... smaller is better
Battery Life
Despite its massive 94 Wh battery, the X9 DT’s battery life was fairly short. Maximum display brightness and high load drained the battery within one hour, minimum display brightness and medium to low load achieved the same in around four hours. In our Wi-Fi test with medium brightness, the device lasted a paltry three hours.
| Aorus X9 DT GeForce GTX 1080 Mobile, i9-8950HK, 94.24 Wh | Aorus X9 GeForce GTX 1070 SLI (Laptop), i7-7820HK, 94.24 Wh | HP Omen X 17-ap0xx GeForce GTX 1080 Mobile, i7-7820HK, 99 Wh | Acer Predator 17 X GX-792-76DL GeForce GTX 1080 Mobile, i7-7820HK, 88.8 Wh | MSI GT75VR 7RF-012 Titan Pro GeForce GTX 1080 Mobile, i7-7820HK, 75 Wh | Asus G703 GeForce GTX 1080 Mobile, i7-7820HK, 71 Wh | Average of class Gaming | |
|---|---|---|---|---|---|---|---|
| Battery runtime | -23% | 56% | 23% | -23% | -25% | 80% | |
| Reader / Idle (h) | 4.2 | 2.9 -31% | 5.8 38% | 5.2 24% | 3 -29% | 3.3 -21% | 8.71 ? 107% |
| WiFi v1.3 (h) | 3.2 | 2.2 -31% | 5.6 75% | 4.2 31% | 2.4 -25% | 2.5 -22% | 7.02 ? 119% |
| Load (h) | 1.3 | 1.2 -8% | 2 54% | 1.5 15% | 1.1 -15% | 0.9 -31% | 1.47 ? 13% |
| H.264 (h) | 2.3 | 3.4 | 2.5 | 2.4 | 8.26 ? |
Verdict
Pros
Cons
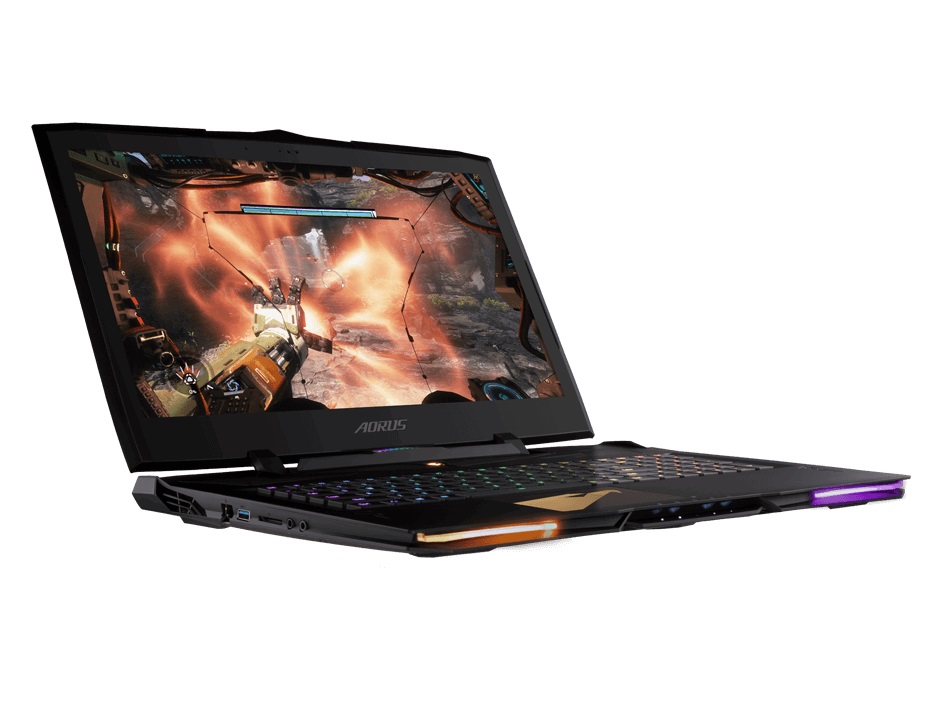
The 2018 edition of Gigabyte’s Aorus X9 DT is a mixed bag. Yes, compared to other high-end gaming notebooks the case is pleasingly slim (3 cm/~1/2 in) and yes, at no more than 3.7 kg (~8.1 lb) it is also comparatively light. However, the space savings came at the expense of cooling performance.
With the “Gaming” mode activated and with slight overclocking settings applied, the 17-inch notebook got so stupendously loud that it spoiled the party for good. With these settings, the Aorus X9 DT has set a new record and lowered the bar significantly. Fortunately, the “Normal” and “Quiet” modes were much better.
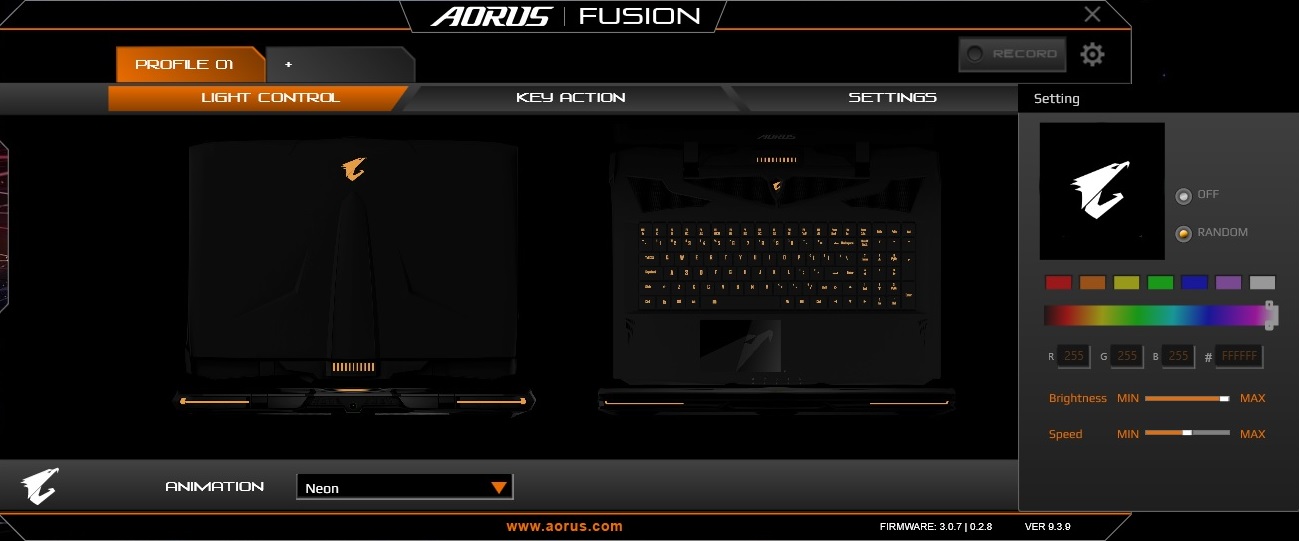
Those extremely high noise levels aside, Gigabyte has done a pretty good job. The mechanical keyboard with firm feedback and its bright RGB backlight was a pleasure to use. Connectivity was decent and includes Thunderbolt 3. And the 144 Hz display in combination with the Core i9-8950HK, the GeForce GTX 1080, and Nvidia’s G-Sync technology was certainly a highlight.
Aorus X9 DT
- 04/16/2018 v6 (old)
Florian Glaser
Price comparison

