Aorus 15 (i7-8750H, RTX 2070) Laptop Review
The 15.6-inch Aorus X5 launched in 2015 as Gigabyte's premier ultra-thin gaming laptop for enthusiasts. Its chassis, while super-sleek at the time, had remained essentially the same for years. Competing gaming laptops had evolved in the meantime to be even thinner and smaller than the best that Aorus had to offer. The X5 lineup was in dire need of an overhaul to better challenge the competition.
Aorus delivered in CES 2019 where the OEM proudly showed off its Aorus 15 to supplant the aging Aorus X5. The brand new chassis carries some of the bells and whistles we've come to expect from a mid-range to enthusiast gaming laptop including narrow bezels and a 144 Hz display with fast response times. It competes directly with the growing number of ultra-thin 15.6-inch gaming laptops like the MSI GS65, Asus ROG GL504, Razer Blade 15, Alienware m15, and the Acer Predator Triton 500 just to name a few.
Two initial SKUs are available: the Aorus 15-W9 and the Aorus 15-X9. Both options carry the exact same CPU (Core i7-8750H) and display (matte 1080p144) and they are only separated by the GPU (full-power RTX 2060 or RTX 2070). Be prepared to pay $1700 to $2000 depending on the GPU, storage drives, and RAM. For this review, we'll be comparing the Aorus 15-X9 to all the aforementioned alternatives as well as the older Aorus X5 that it replaces.
More Gigabyte and Aorus reviews:
Case
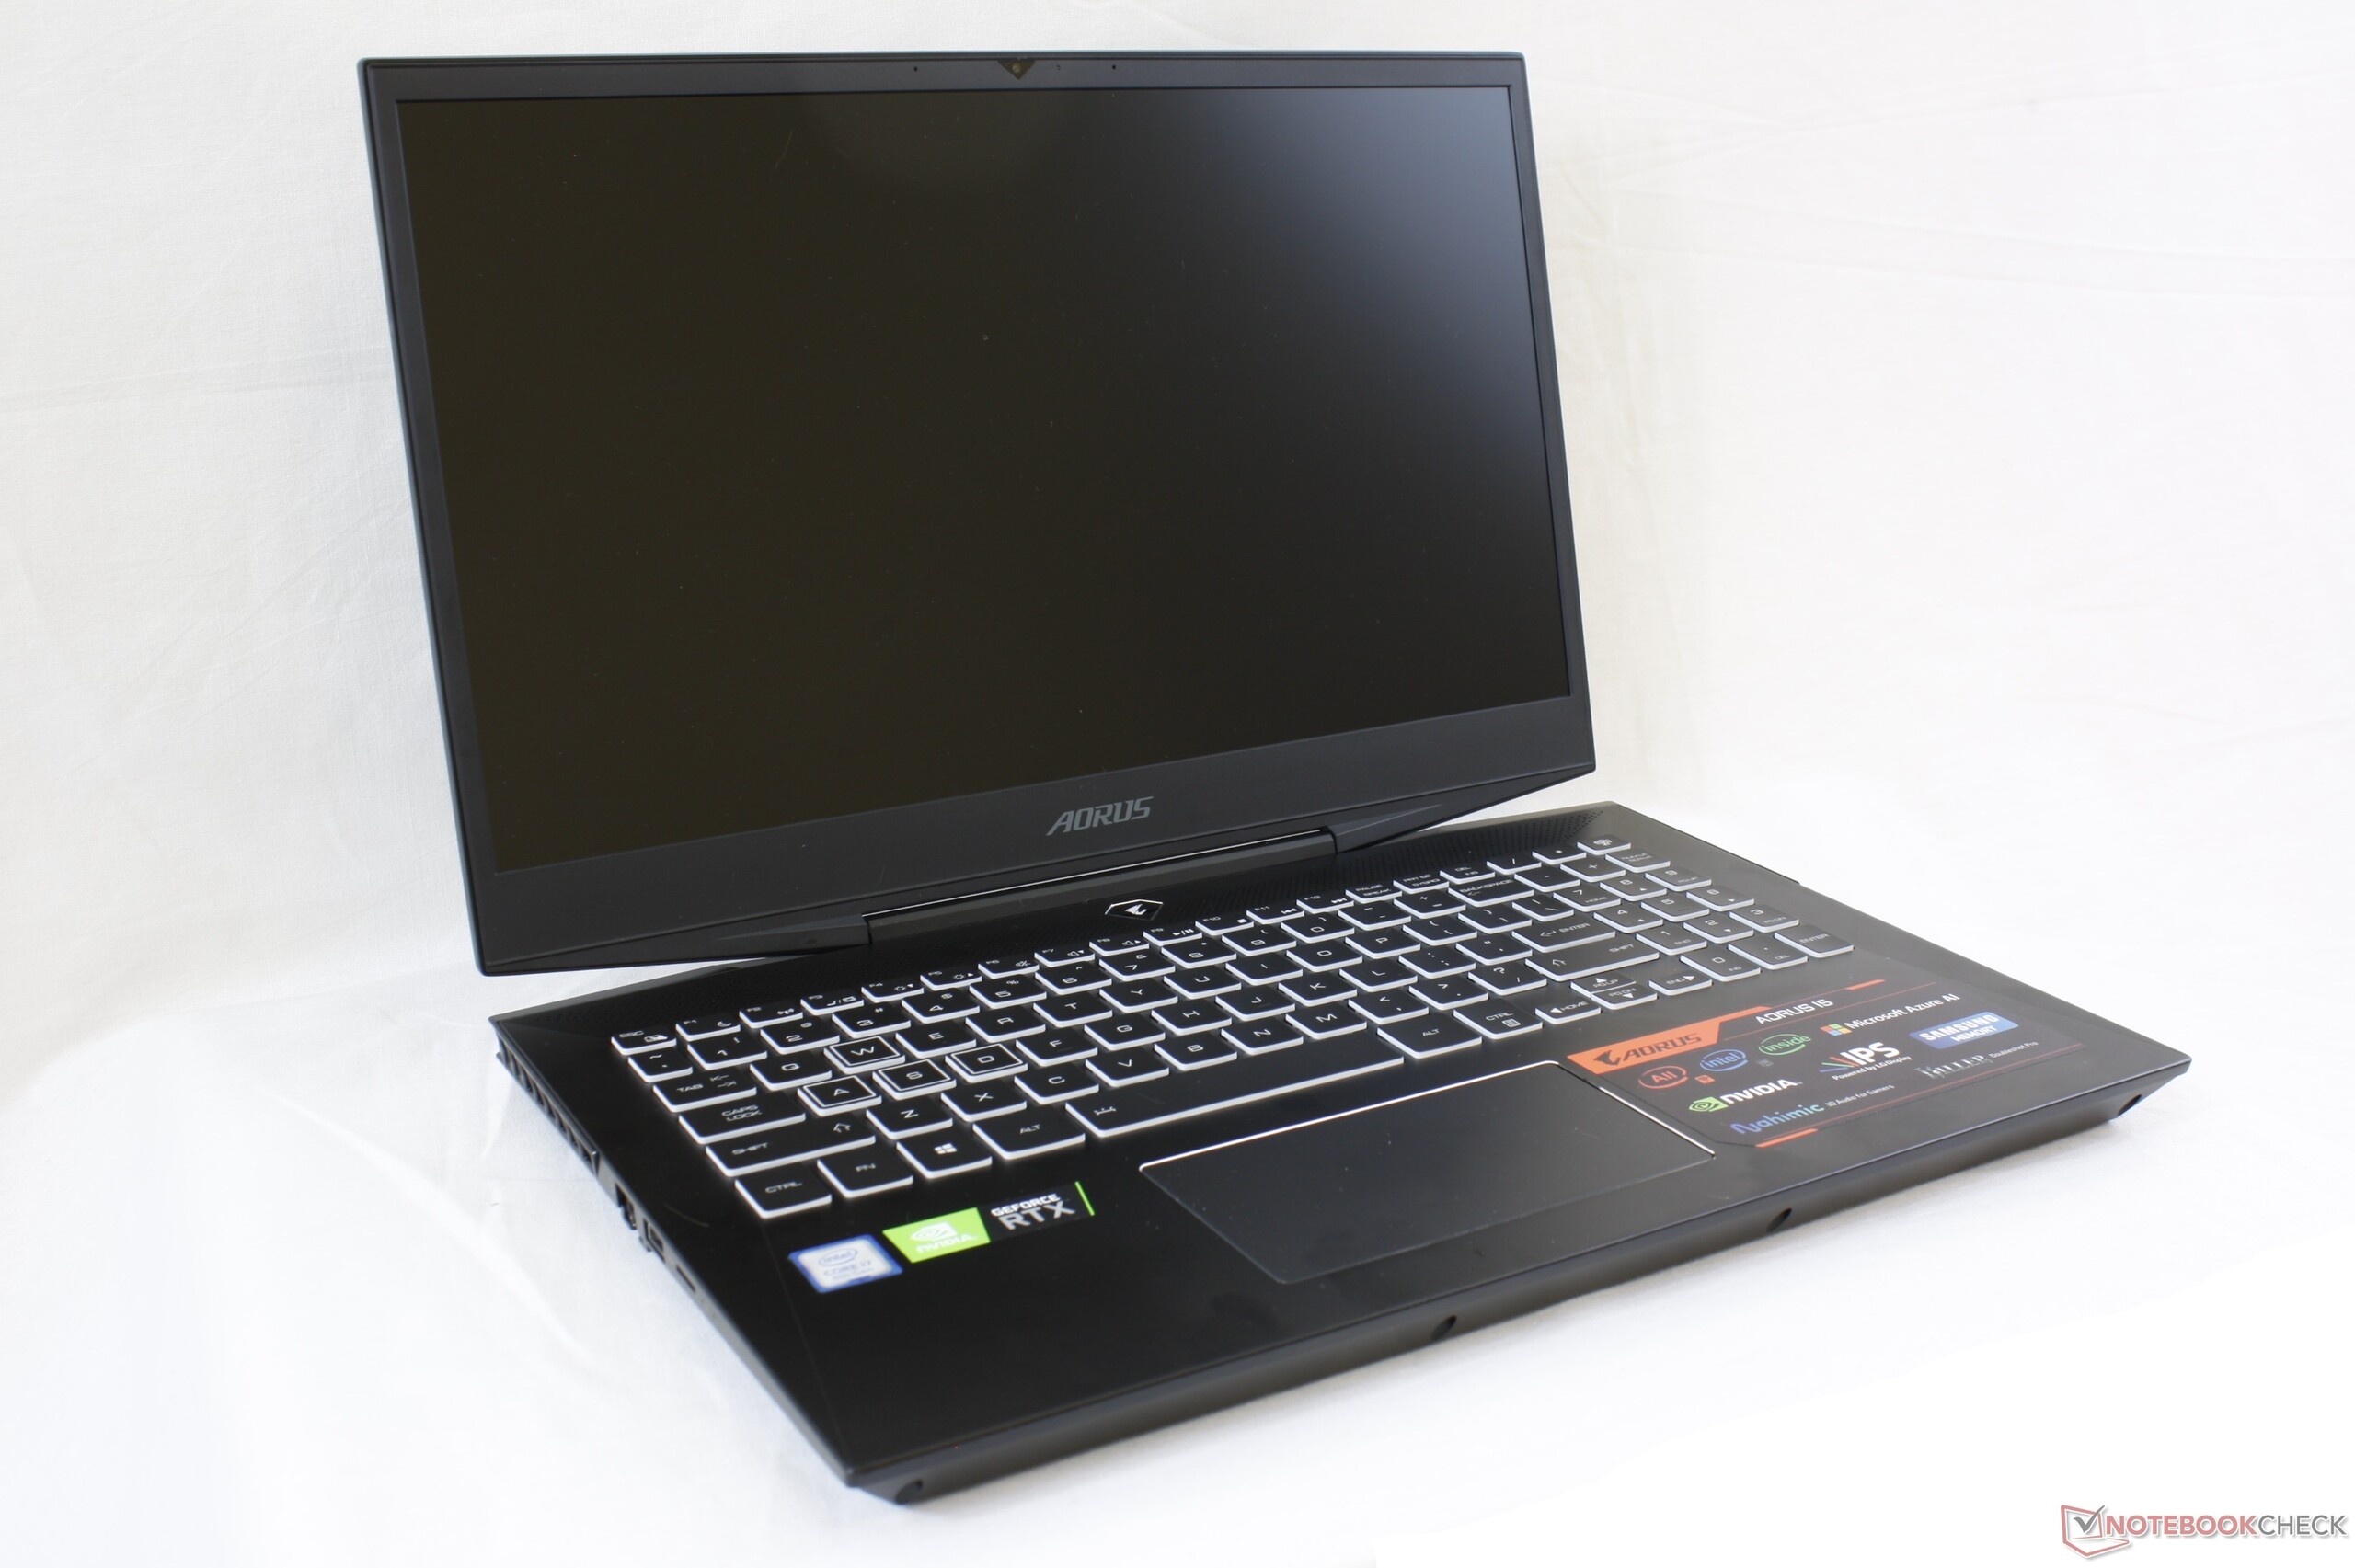
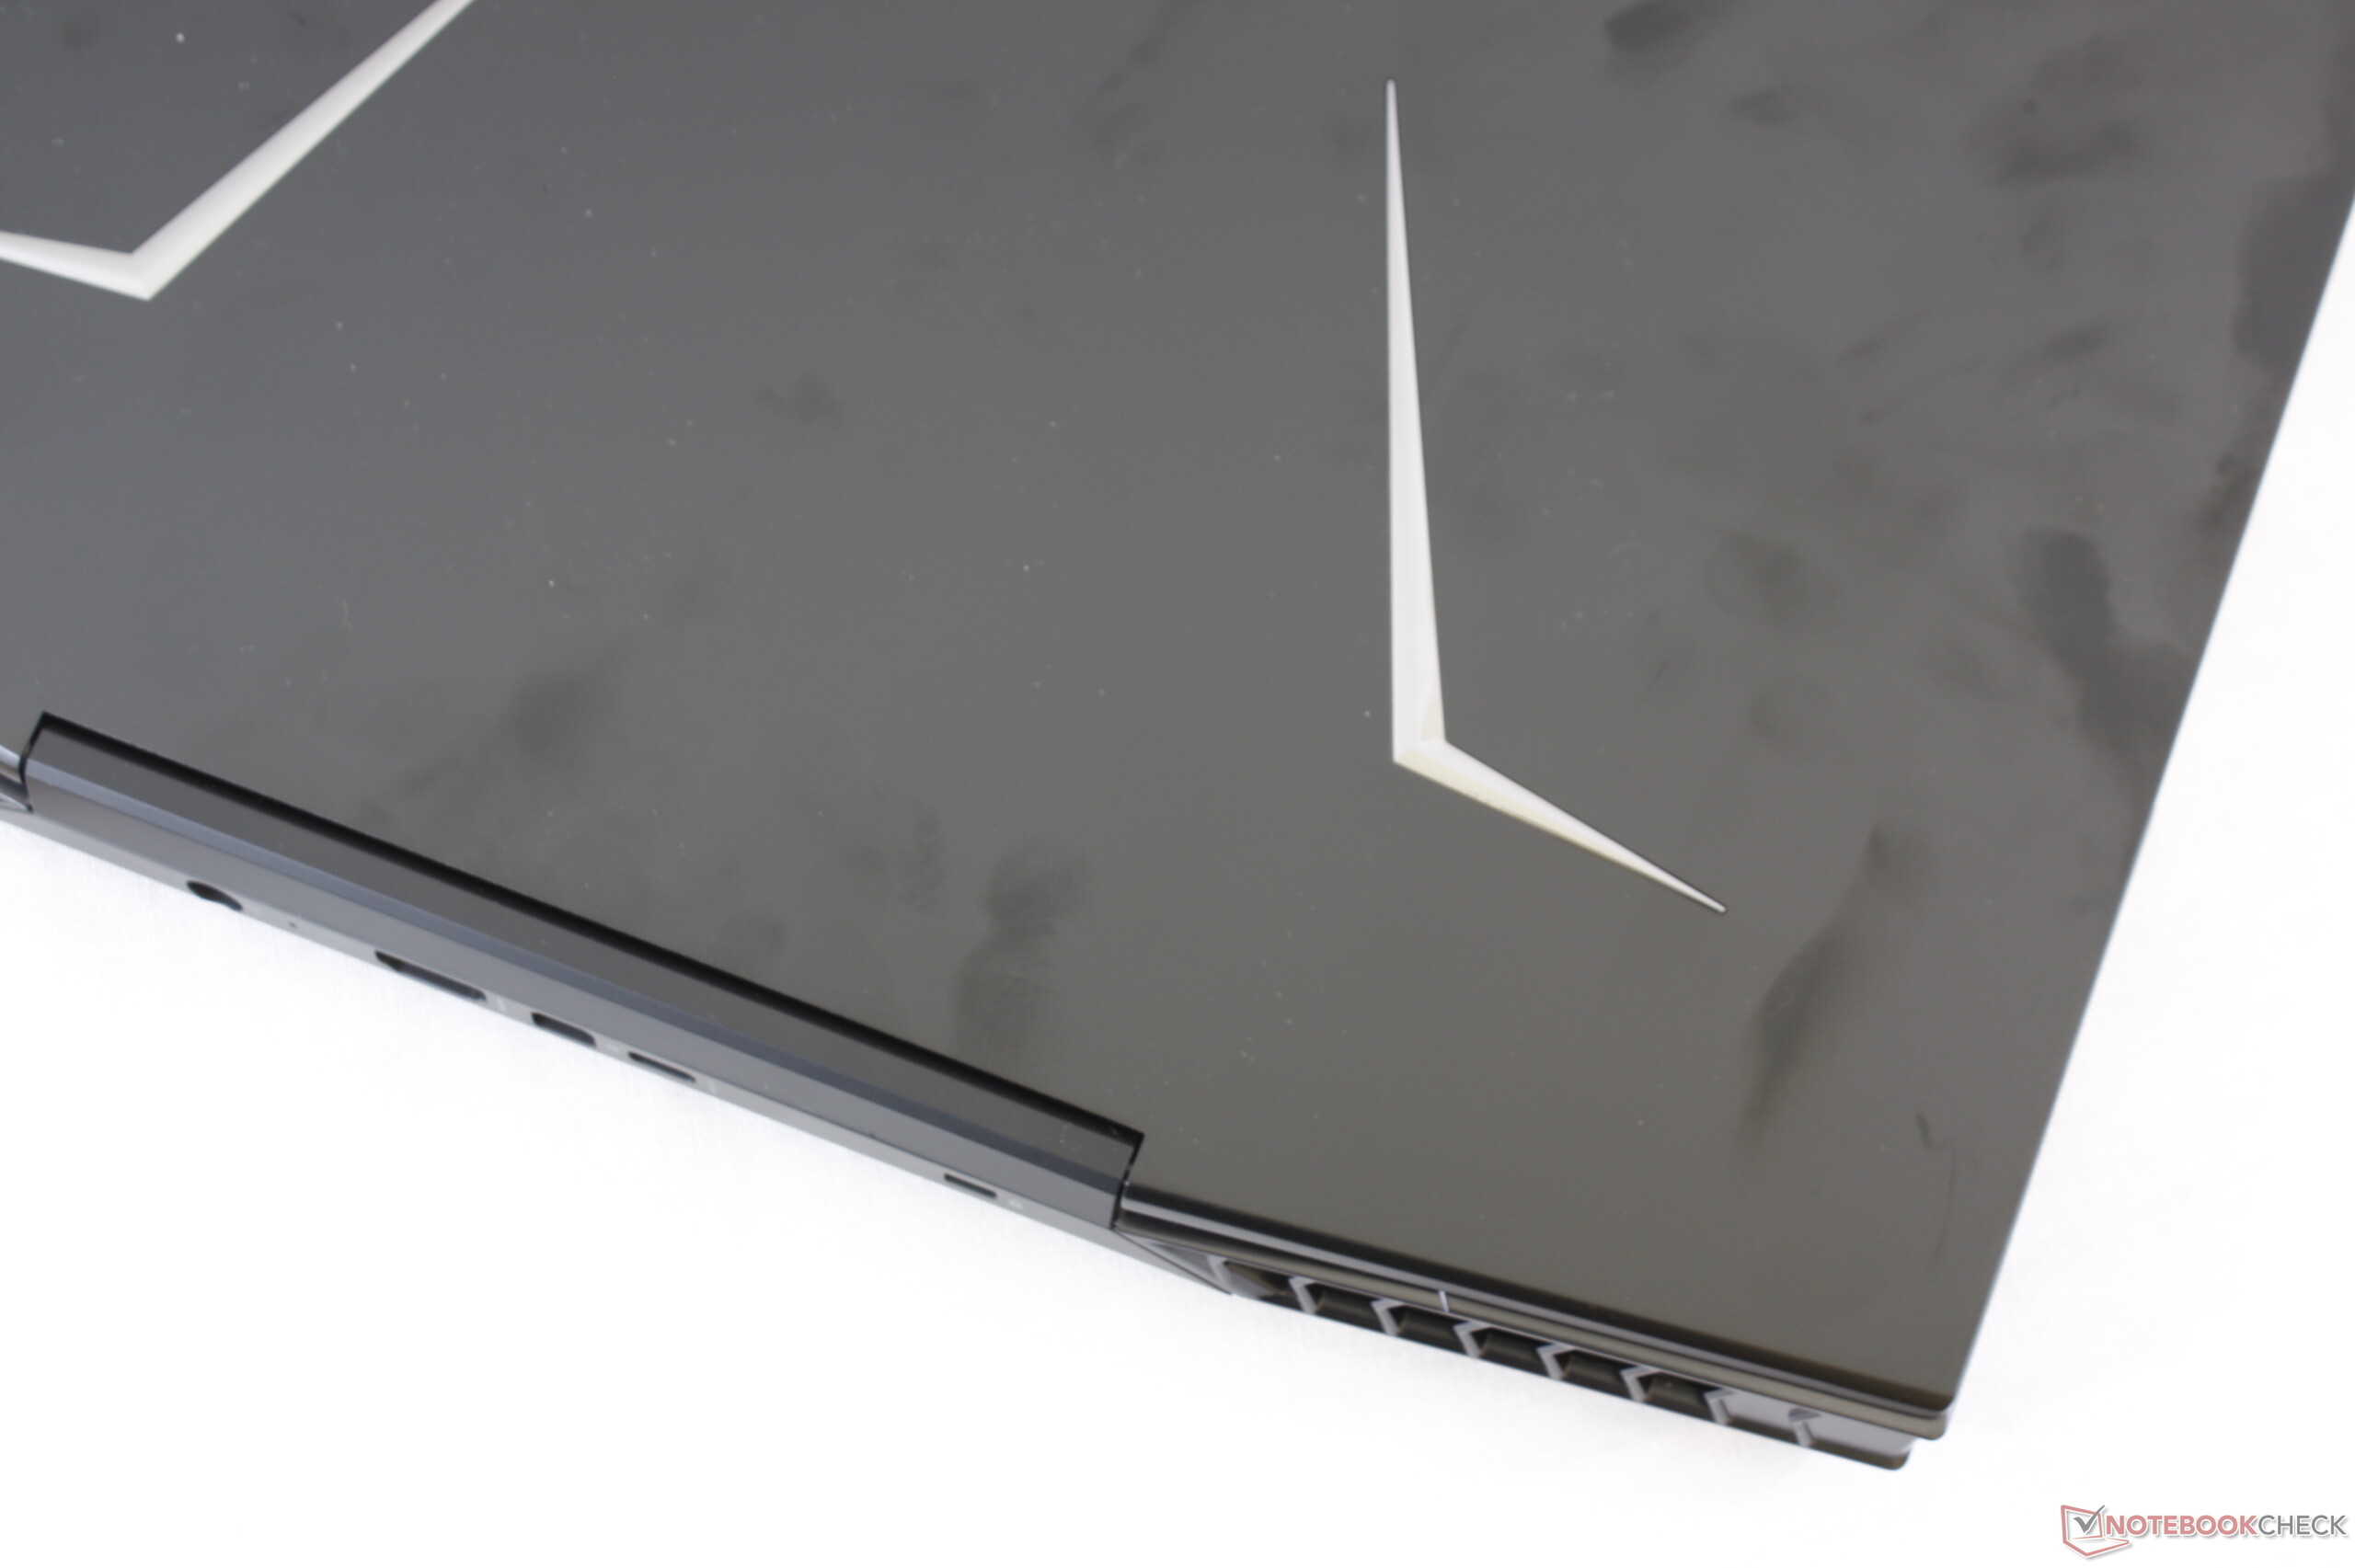
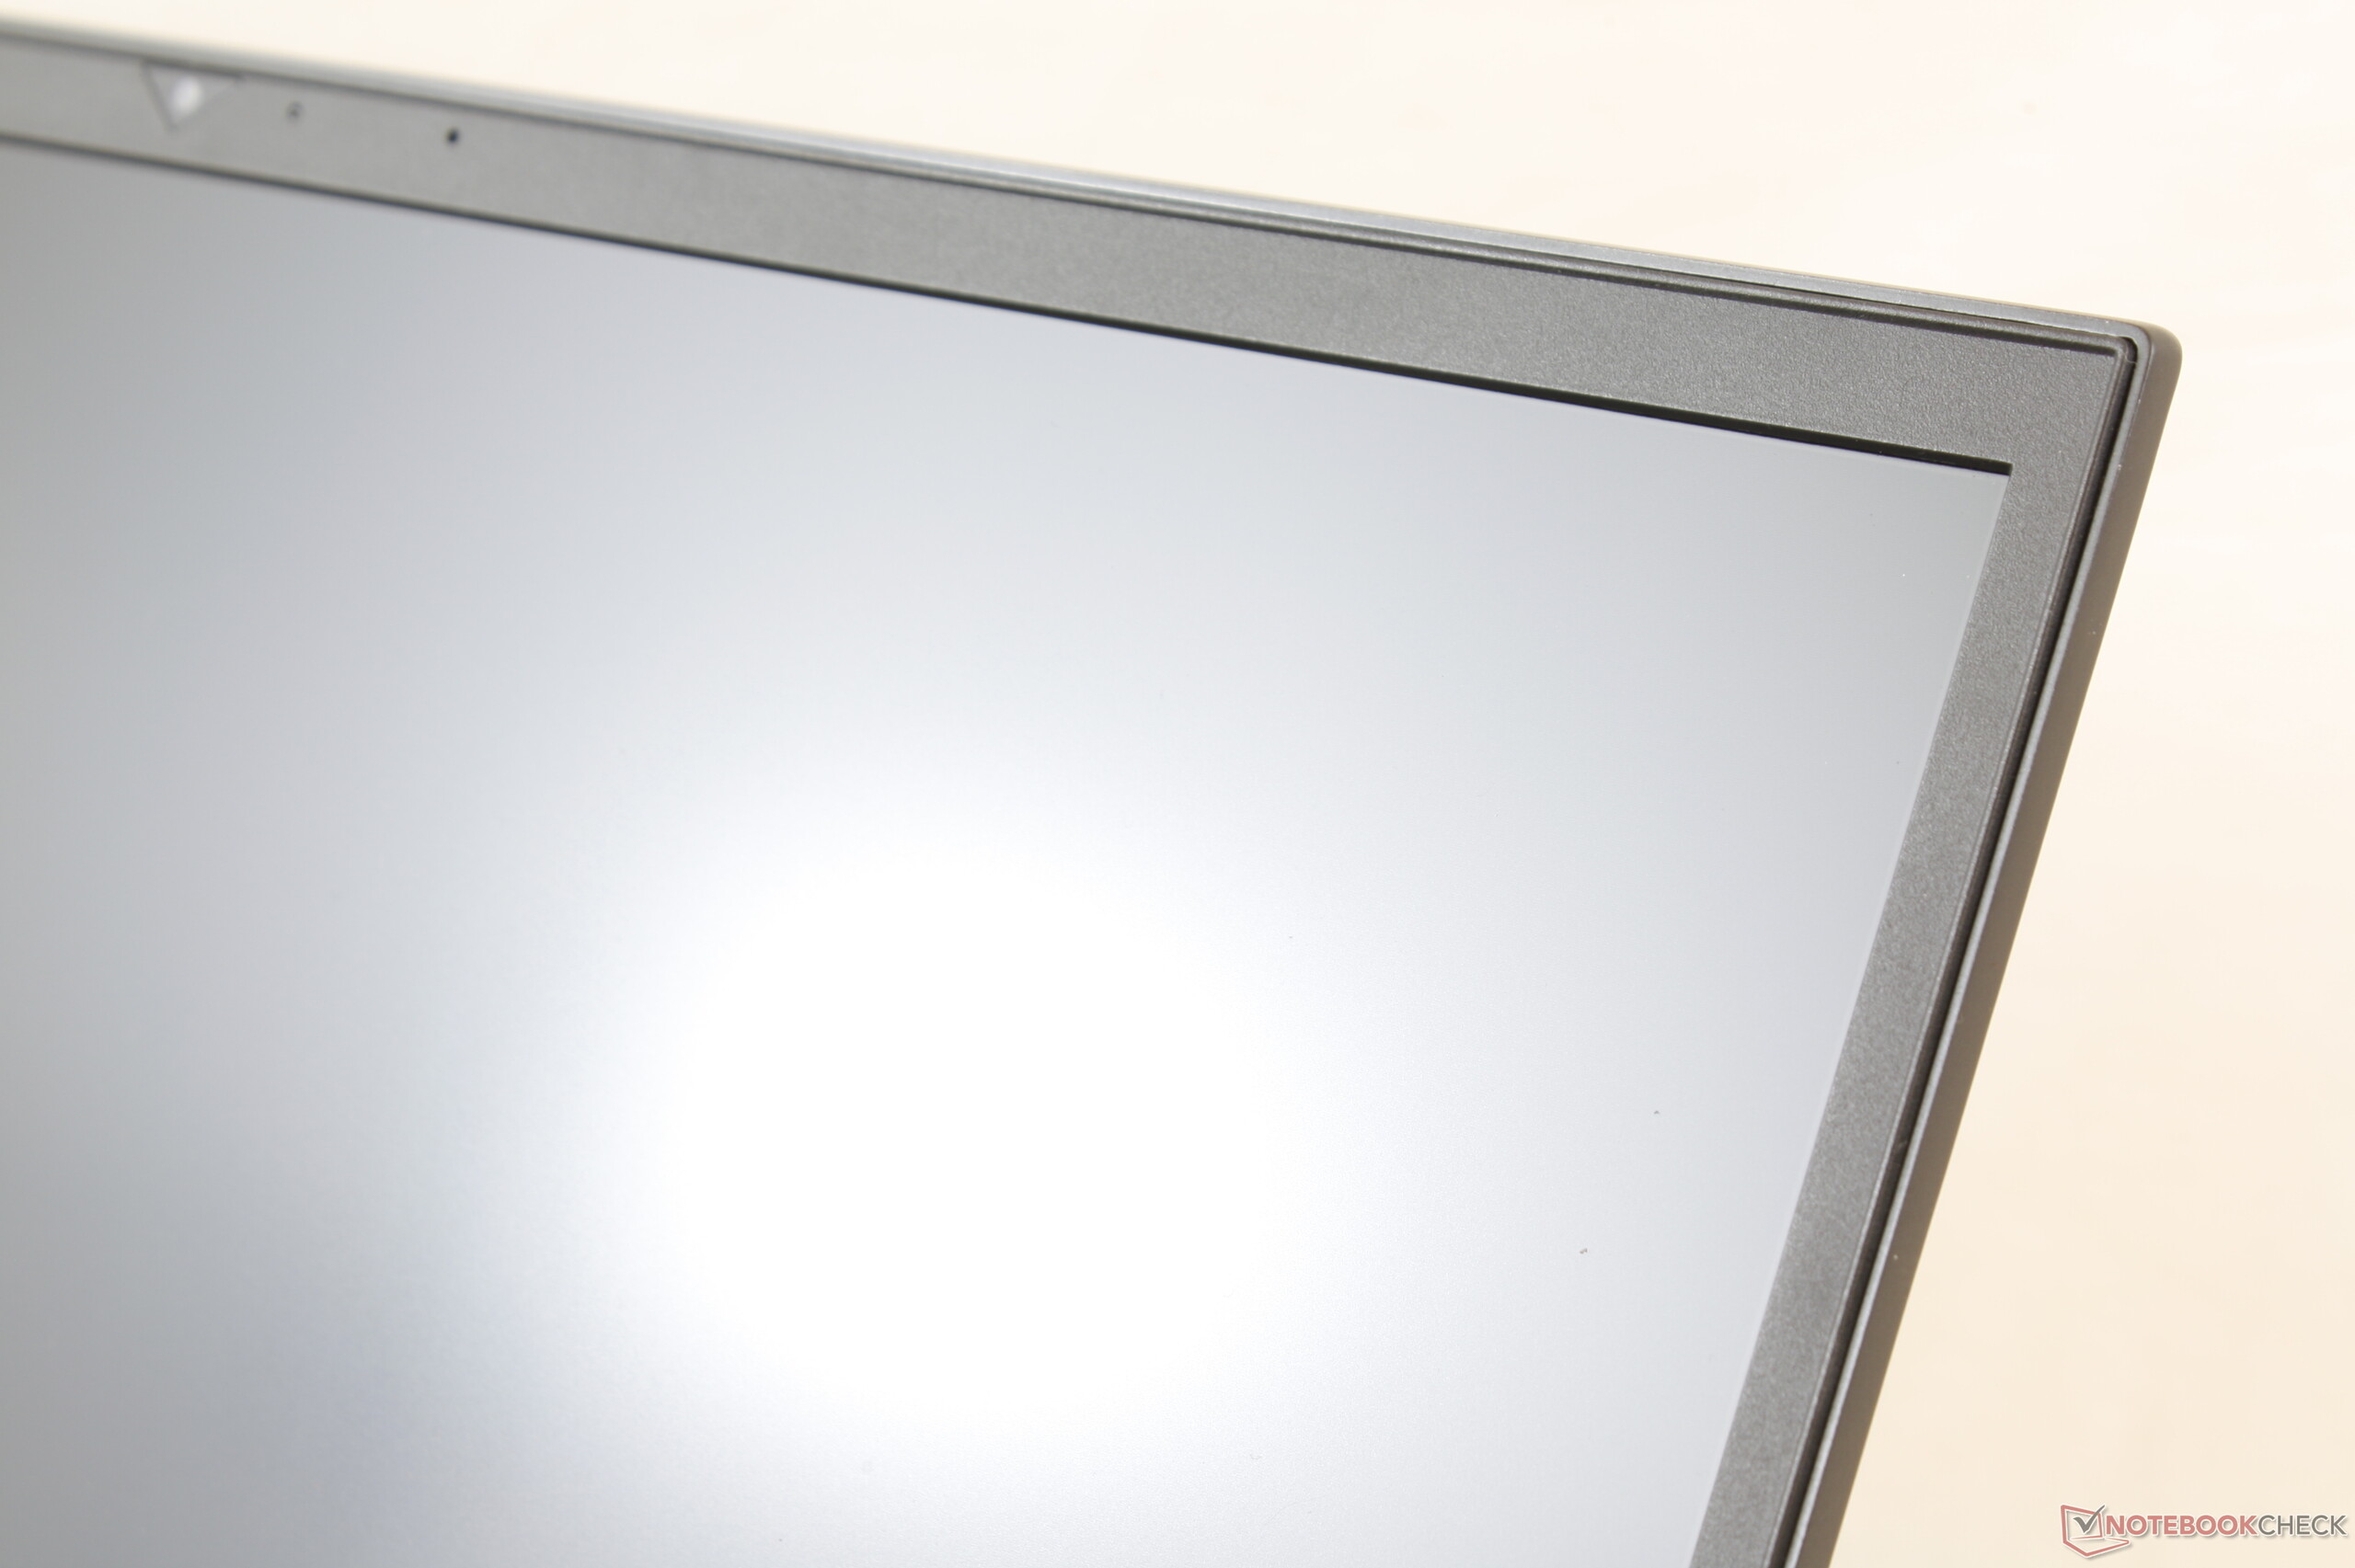
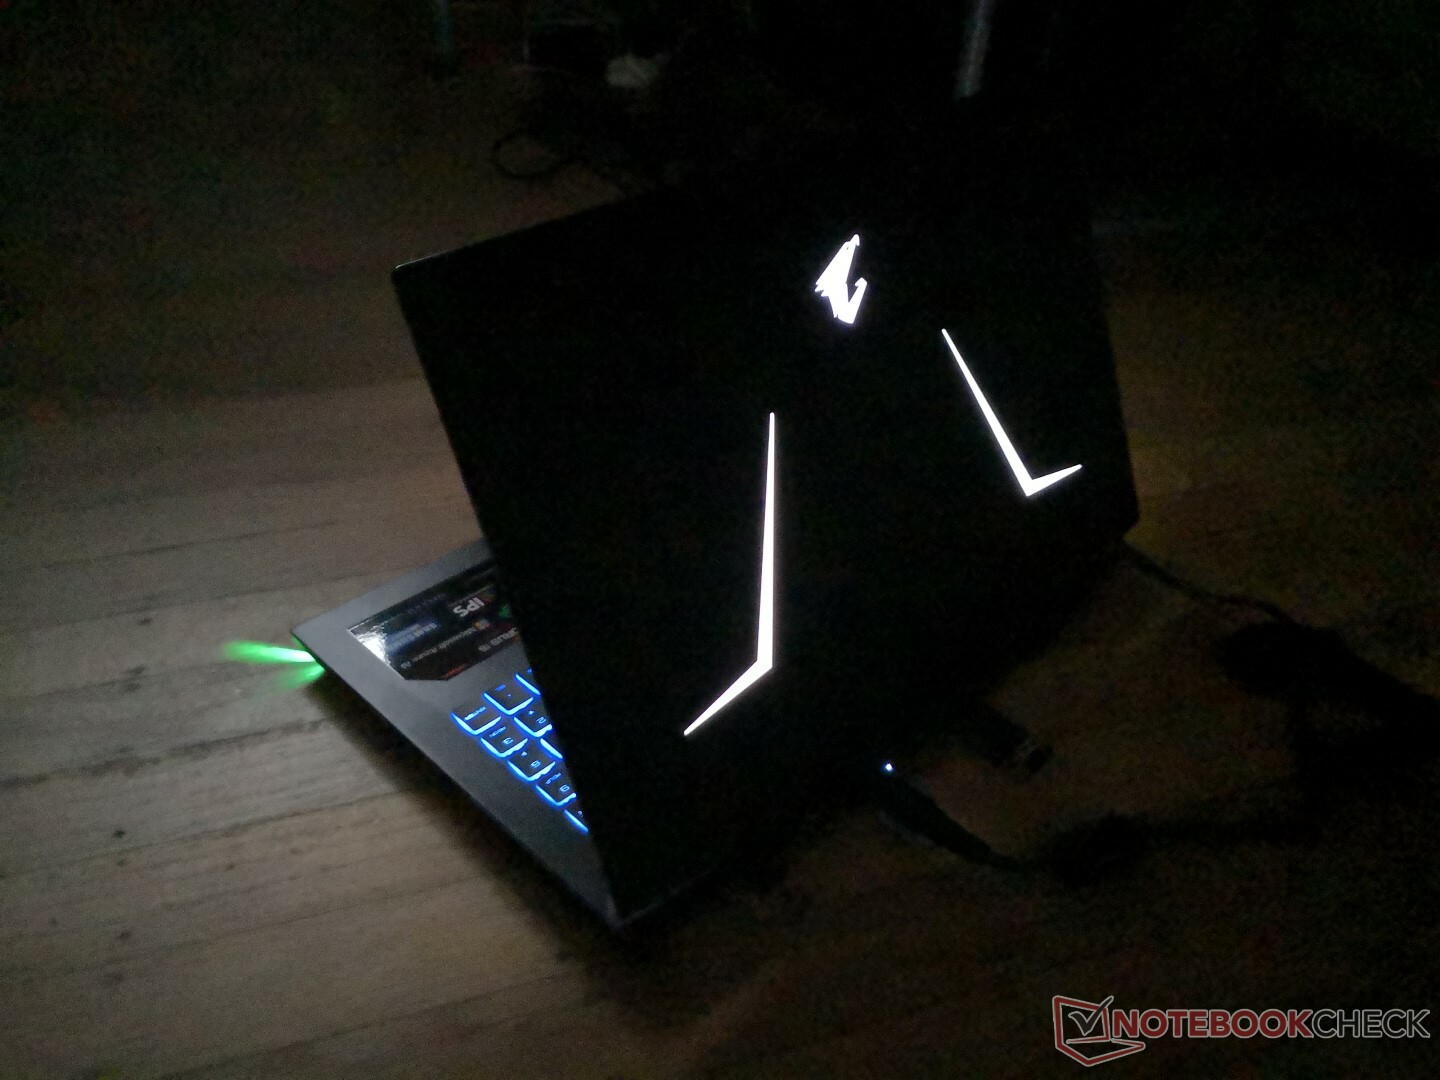
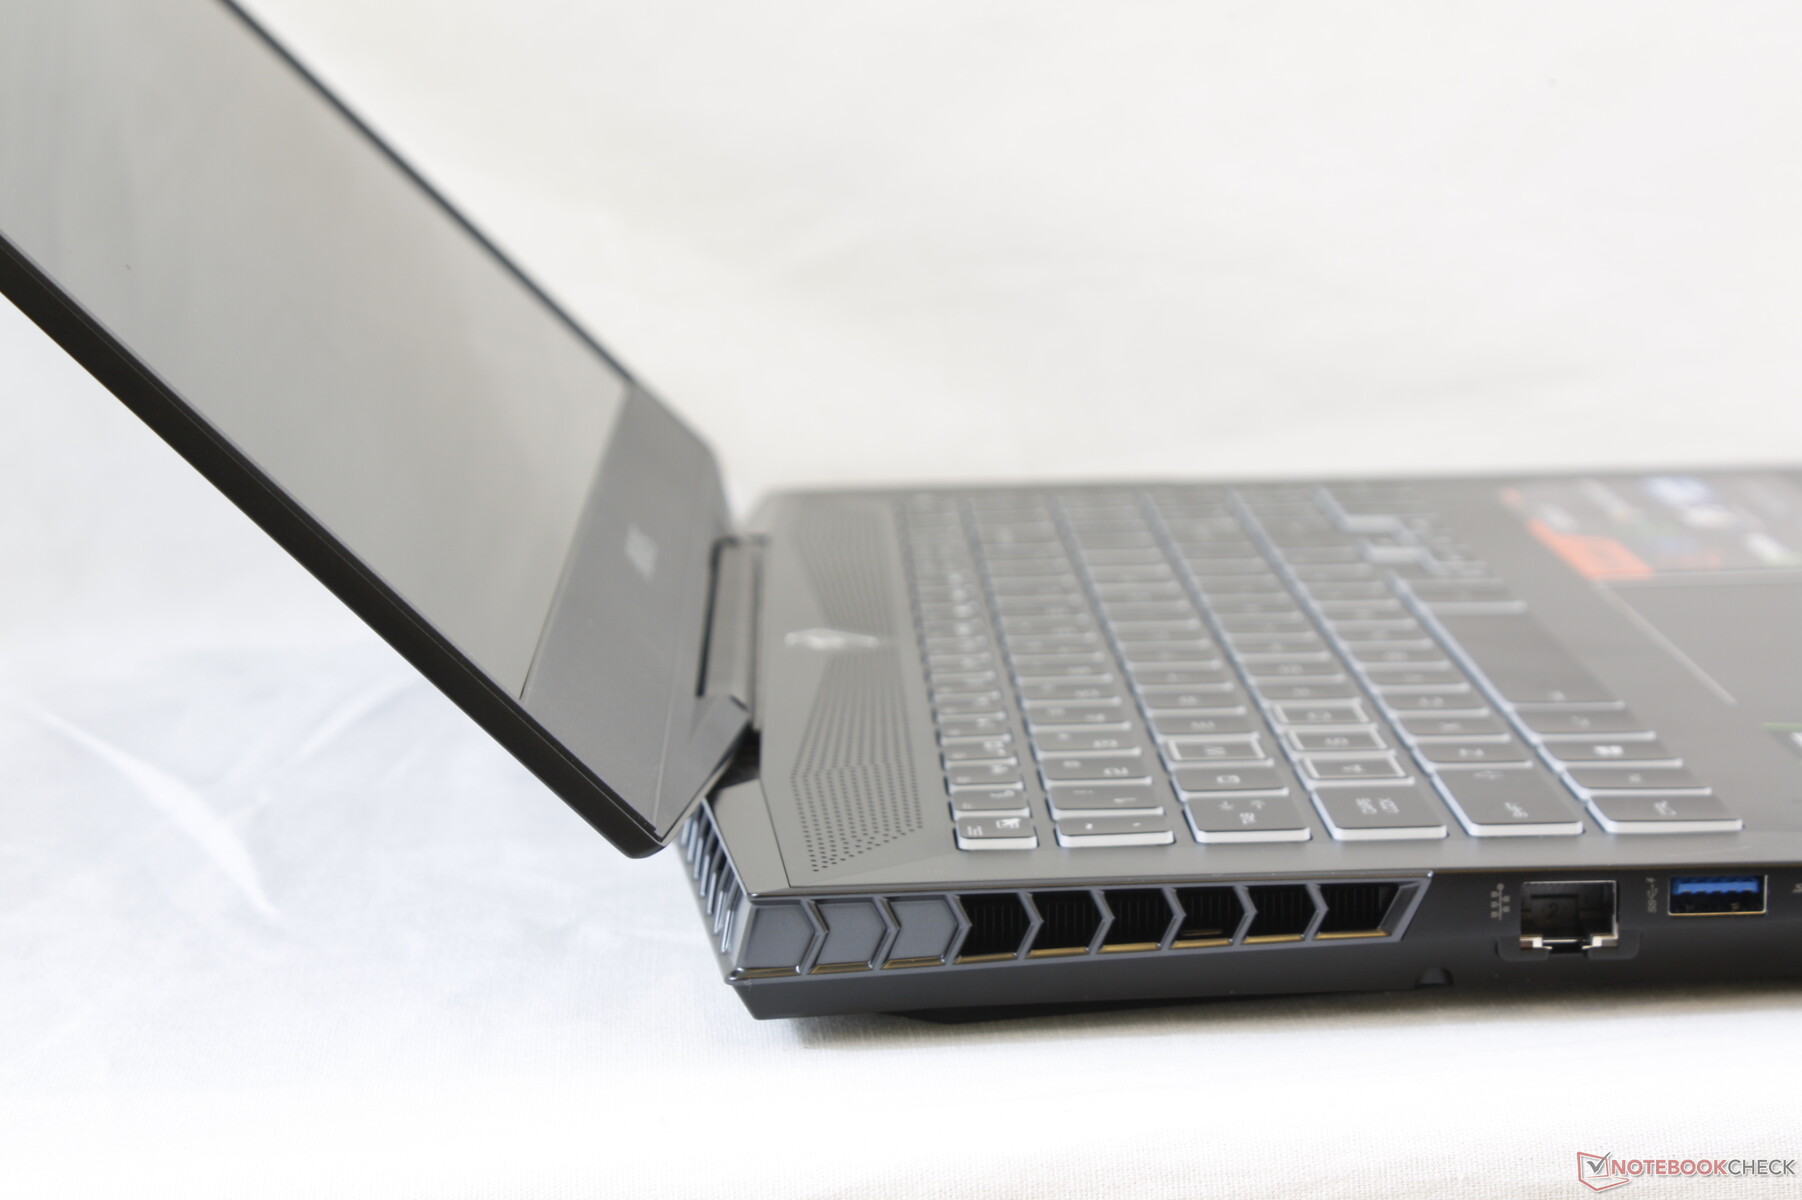
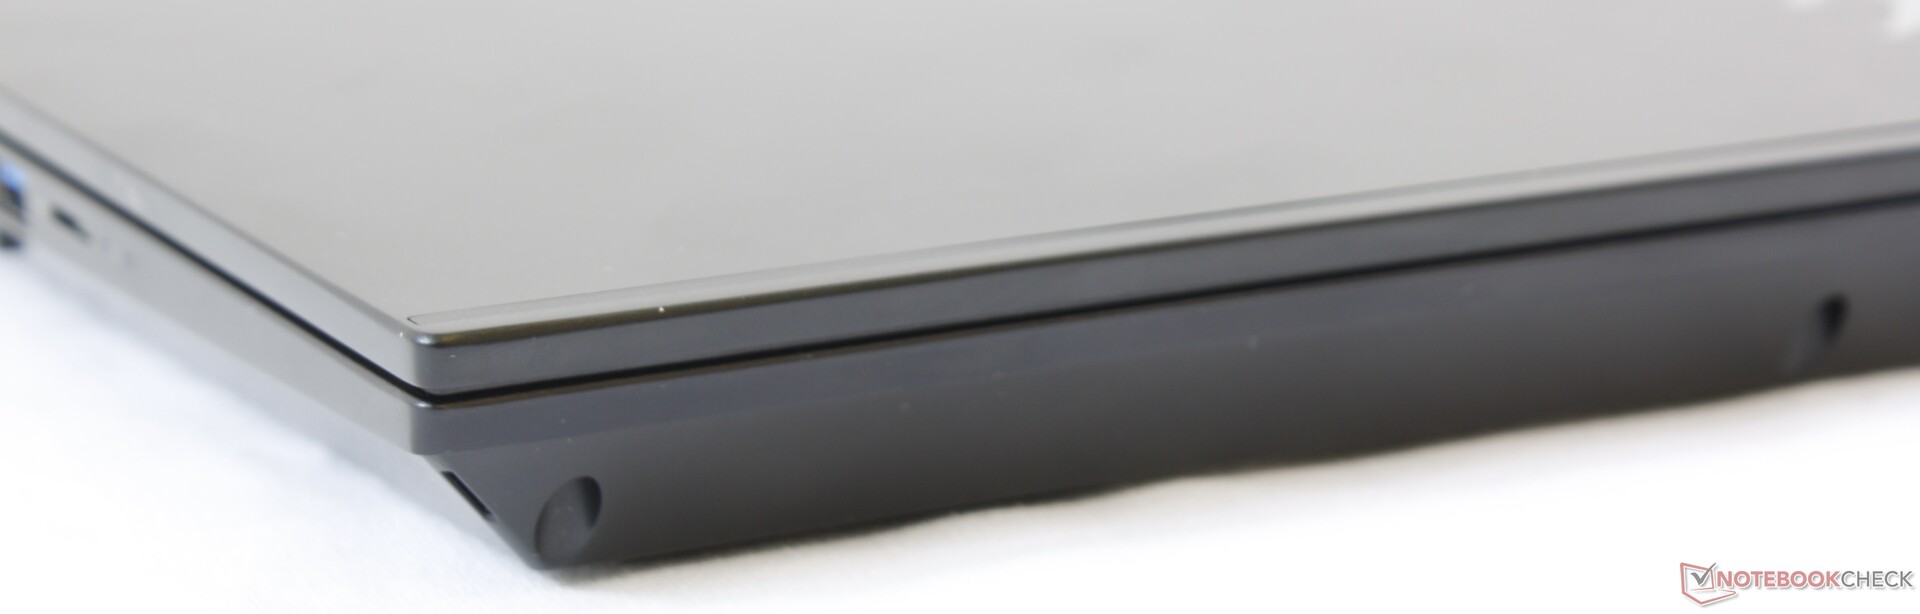
Aorus laptops revel in sleek and distinctive gamer designs in contrast to the subtler look of Gigabyte systems. The Aorus 15 retains the gamer aesthetic while addressing the two biggest drawbacks of the Aorus X5 chassis: the thick bezels and flimsy lid. The bezels are now significantly thinner without needing to re-position the webcam and lid rigidity is thankfully not adversely affected. It's still more flexible than the lids of the Razer Blade 15, Asus ROG GL504, and Alienware m15, but it is at least an improvement over the outgoing generation. Hinge rigidity is also satisfactory with minimal teetering when adjusting the angle up to 140 degrees.
Construction quality and base rigidity are excellent with no creaking or warping when attempting to twist it. Applying moderate pressure on the palm rests or keyboard center will slightly depress the surface and so it isn't perfect. It still feels stronger than the MSI GS65 and comparable to the Alienware m15 albeit in a thicker and heavier package than both.
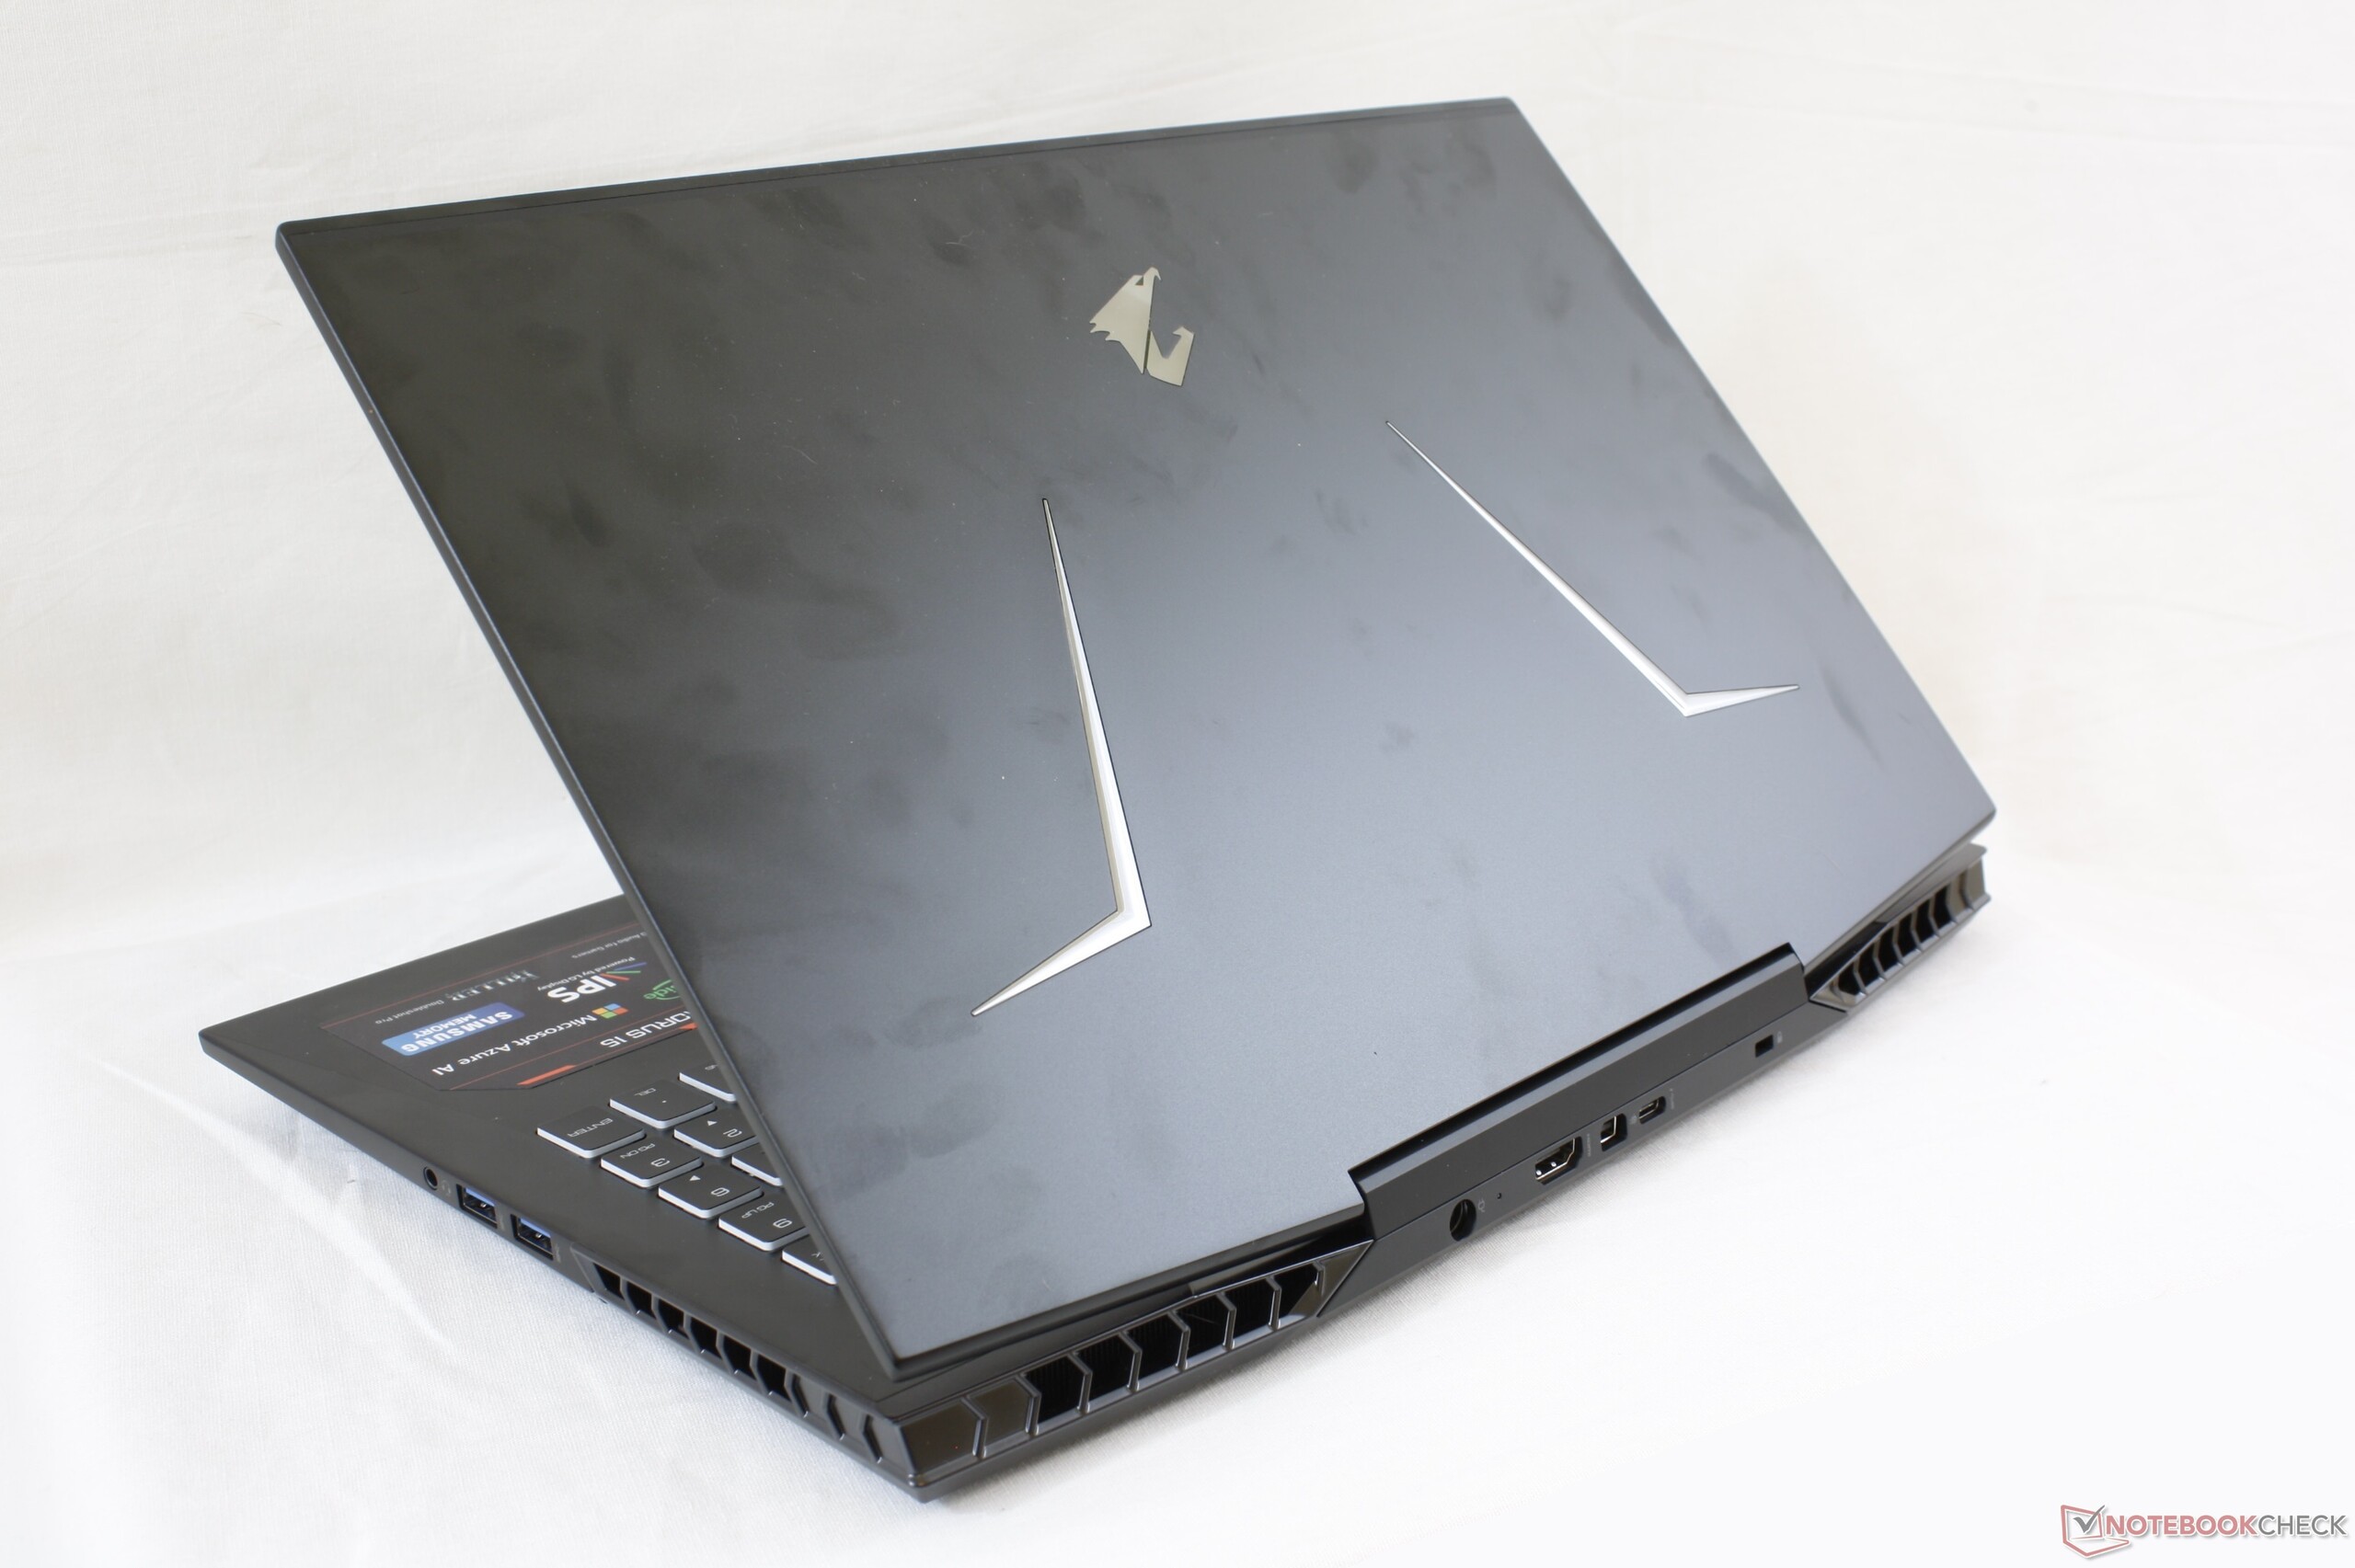
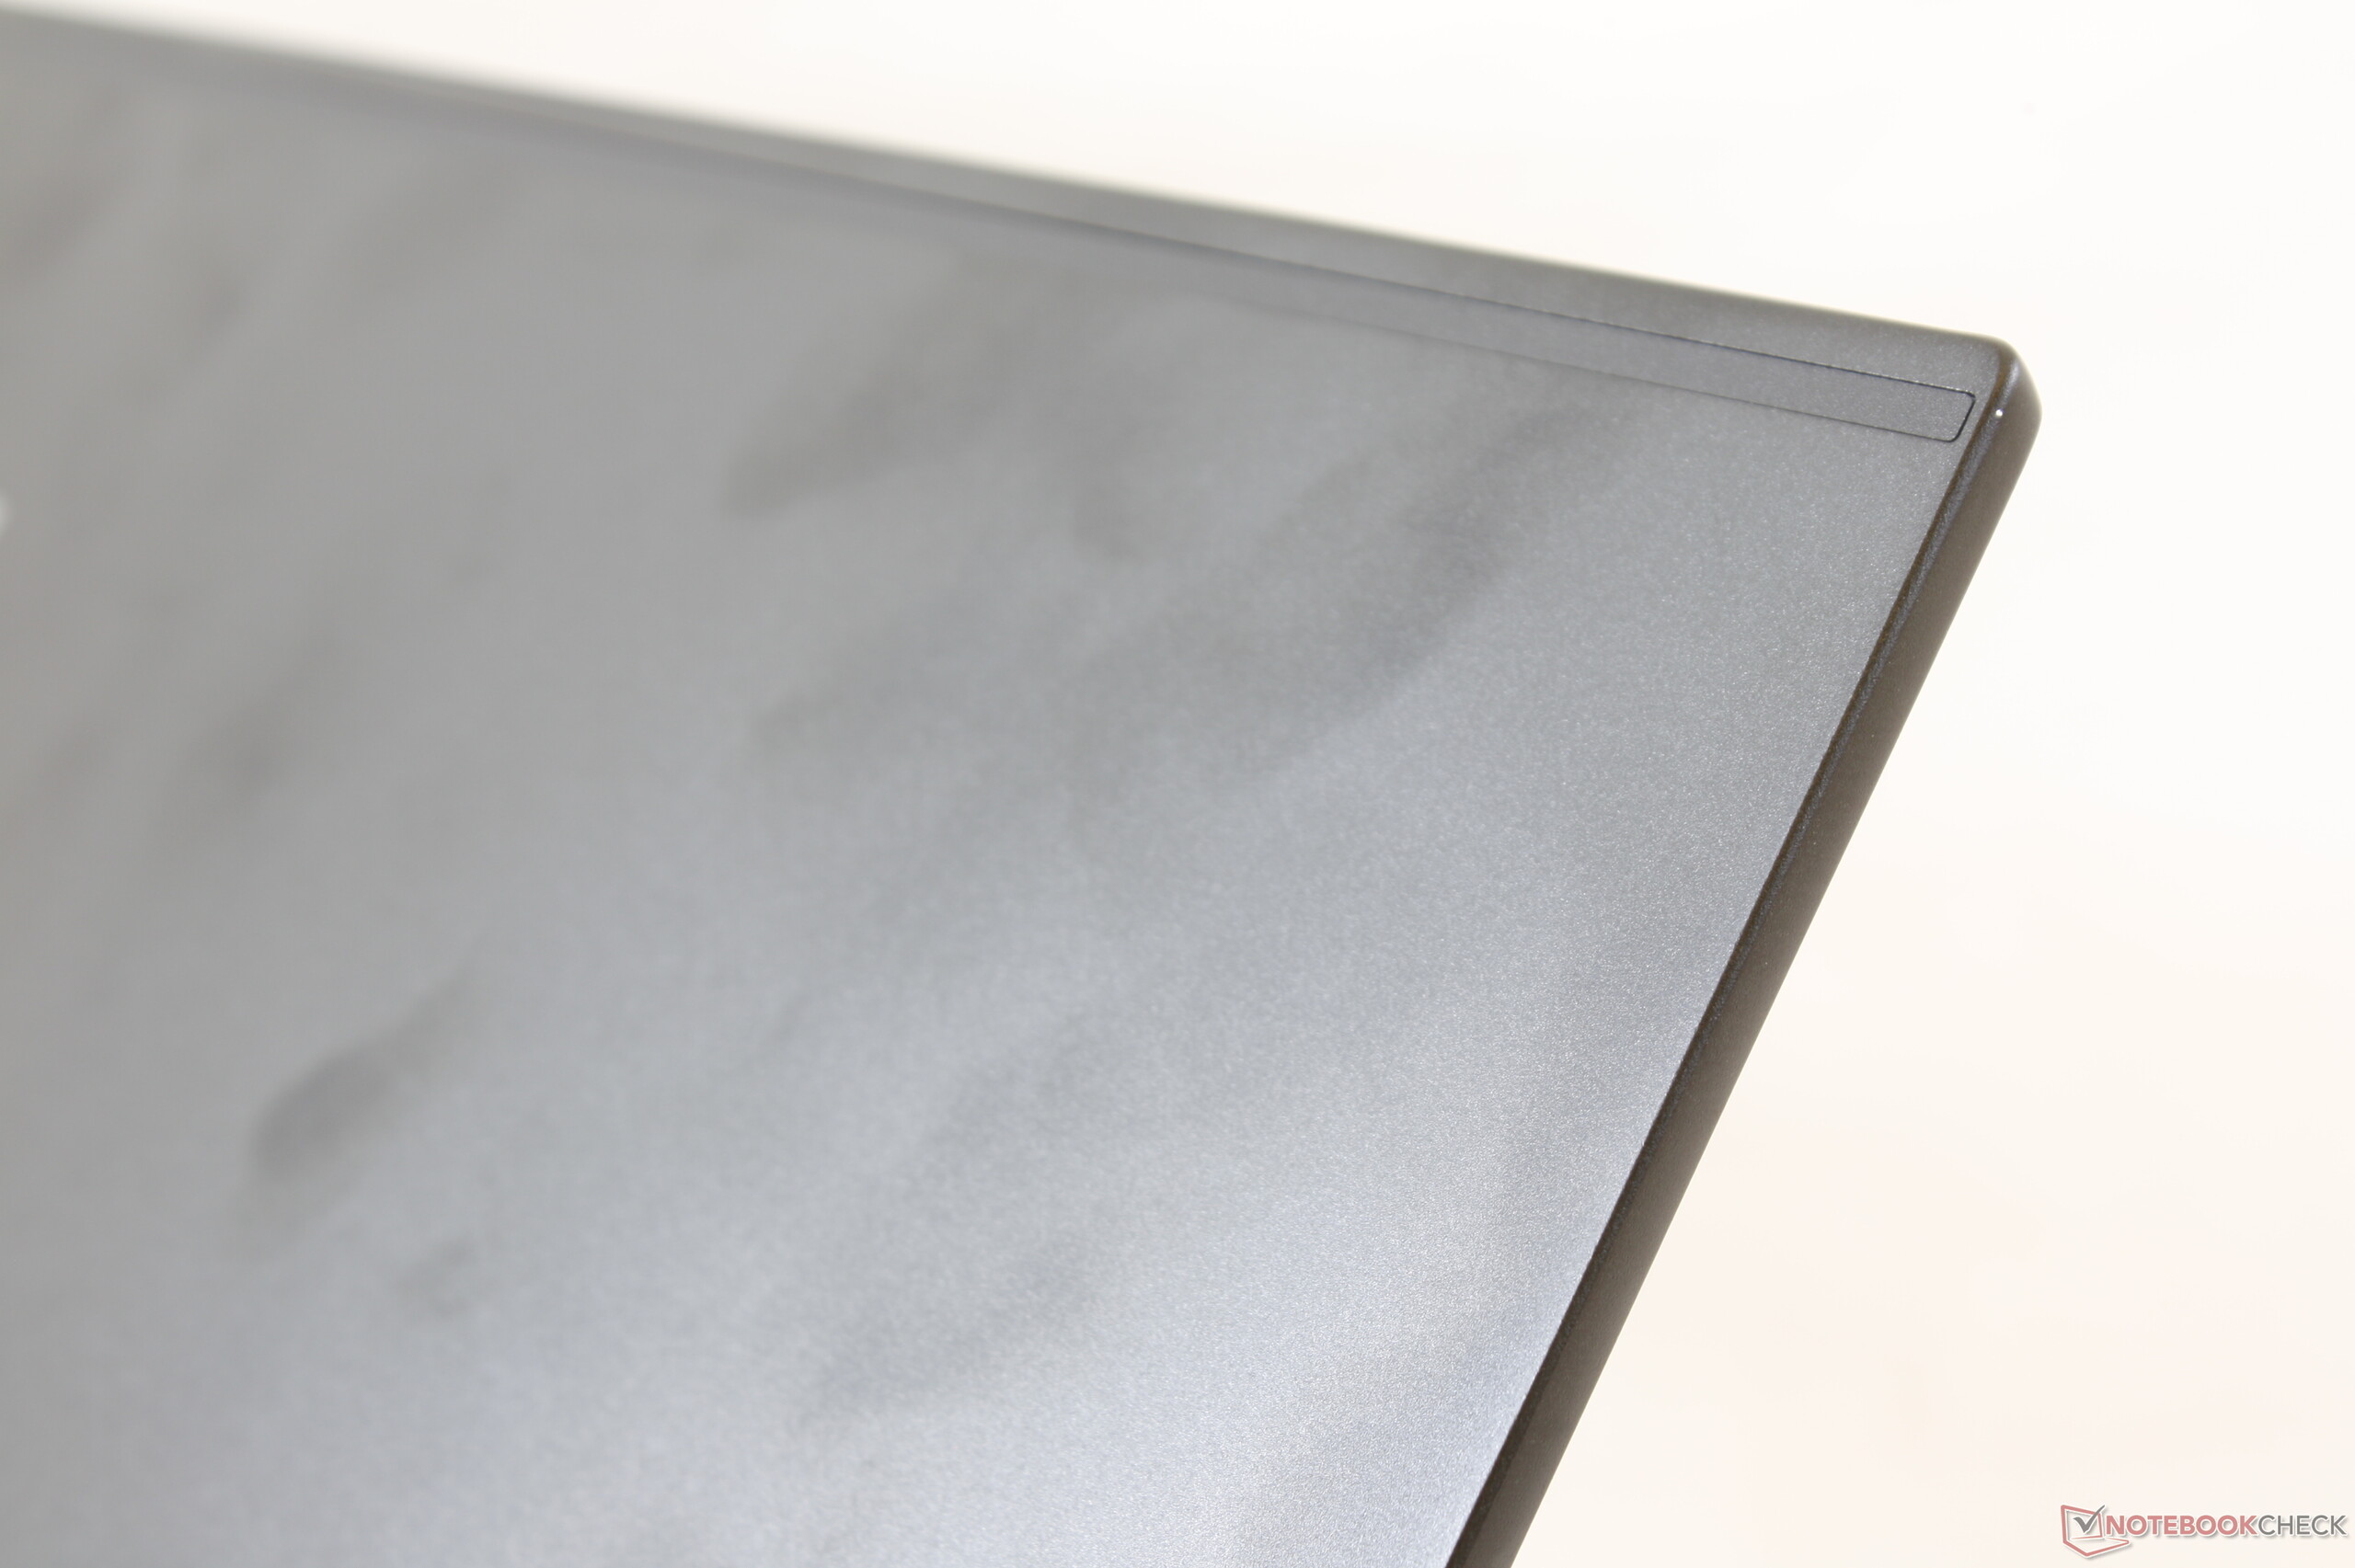
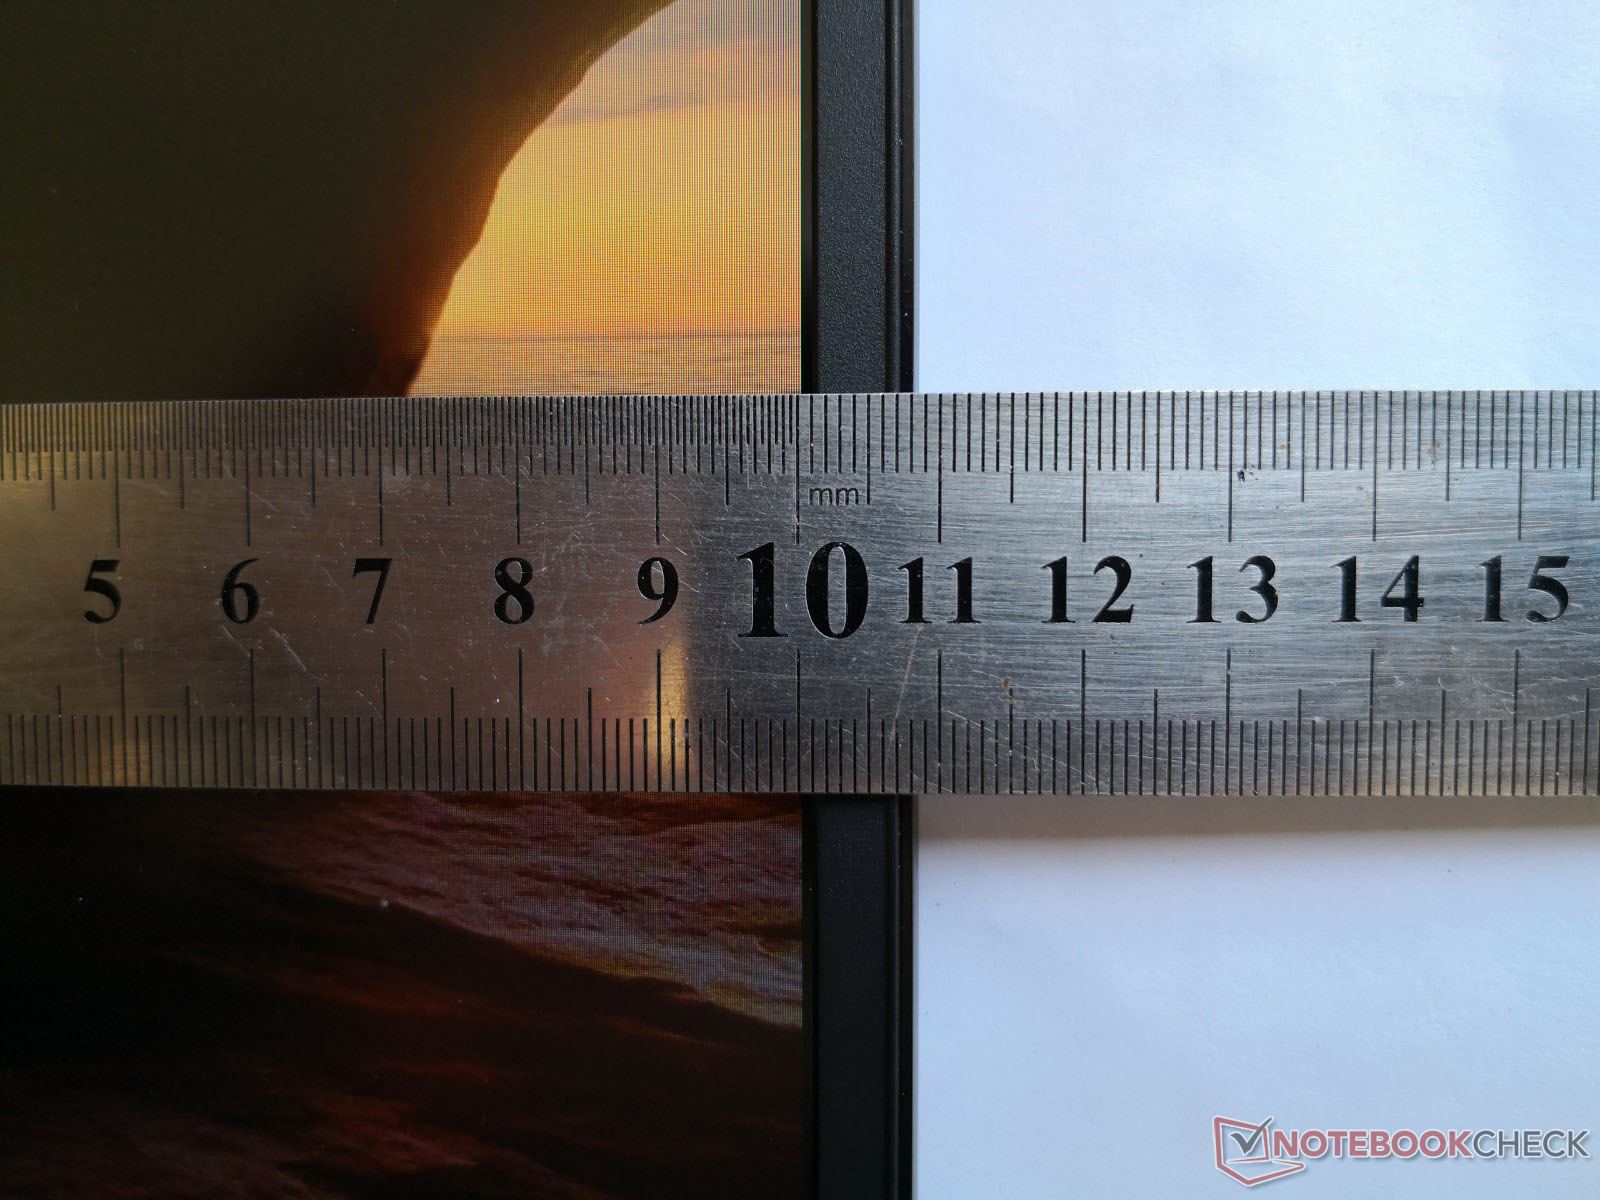
The chassis is thicker than the last generation Aorus X5 by almost 1.5 mm, but it makes up for this by being lighter (2.4 kg vs. 2.7 kg) and with a significantly smaller footprint. The massive bezels of the X5 have been trimmed to be more in line with the latest designs from MSI, Alienware, and Razer.
As far as ultra-thin gaming laptops go, the Aorus 15 is thicker than the GS65, Blade 15, Alienware m15, and even Gigabyte's own Aero 15 by several millimeters. It's a laptop that straddles the line for what we consider to be "ultra-thin". Gigabyte says this was necessary in order to offer uncompromised performance from a standard non-Max-Q RTX 2070 GPU.
Connectivity
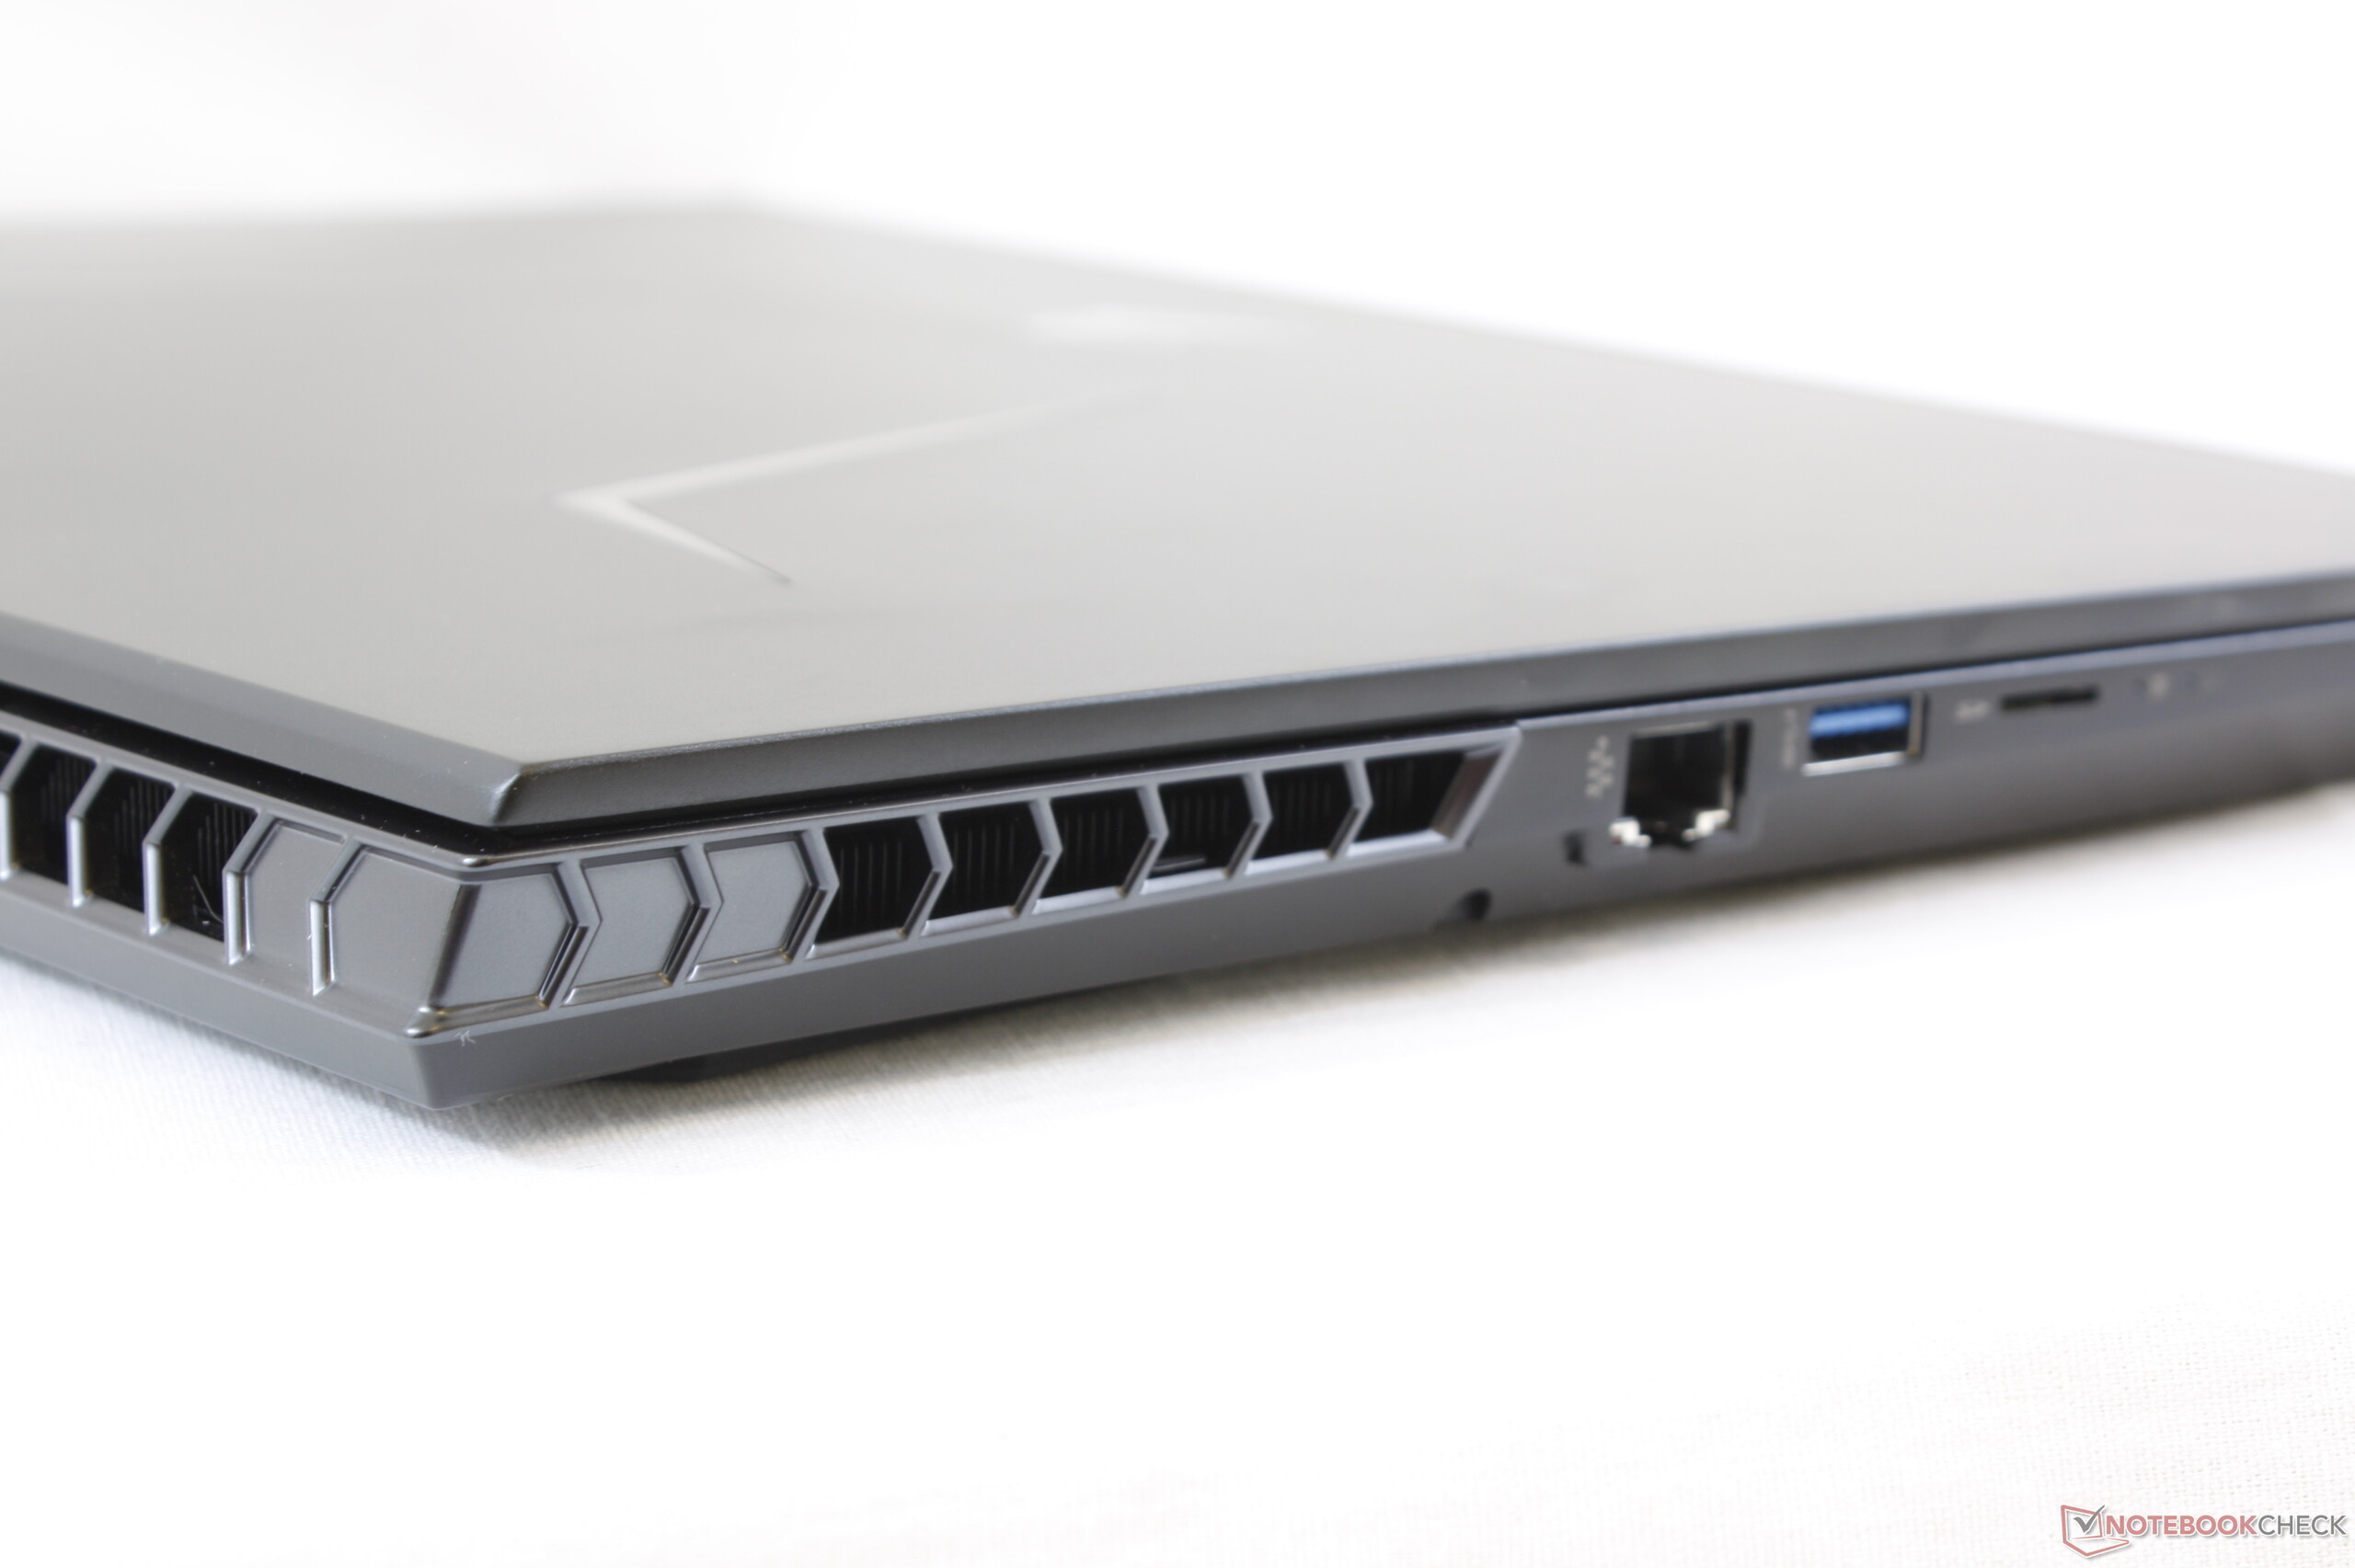
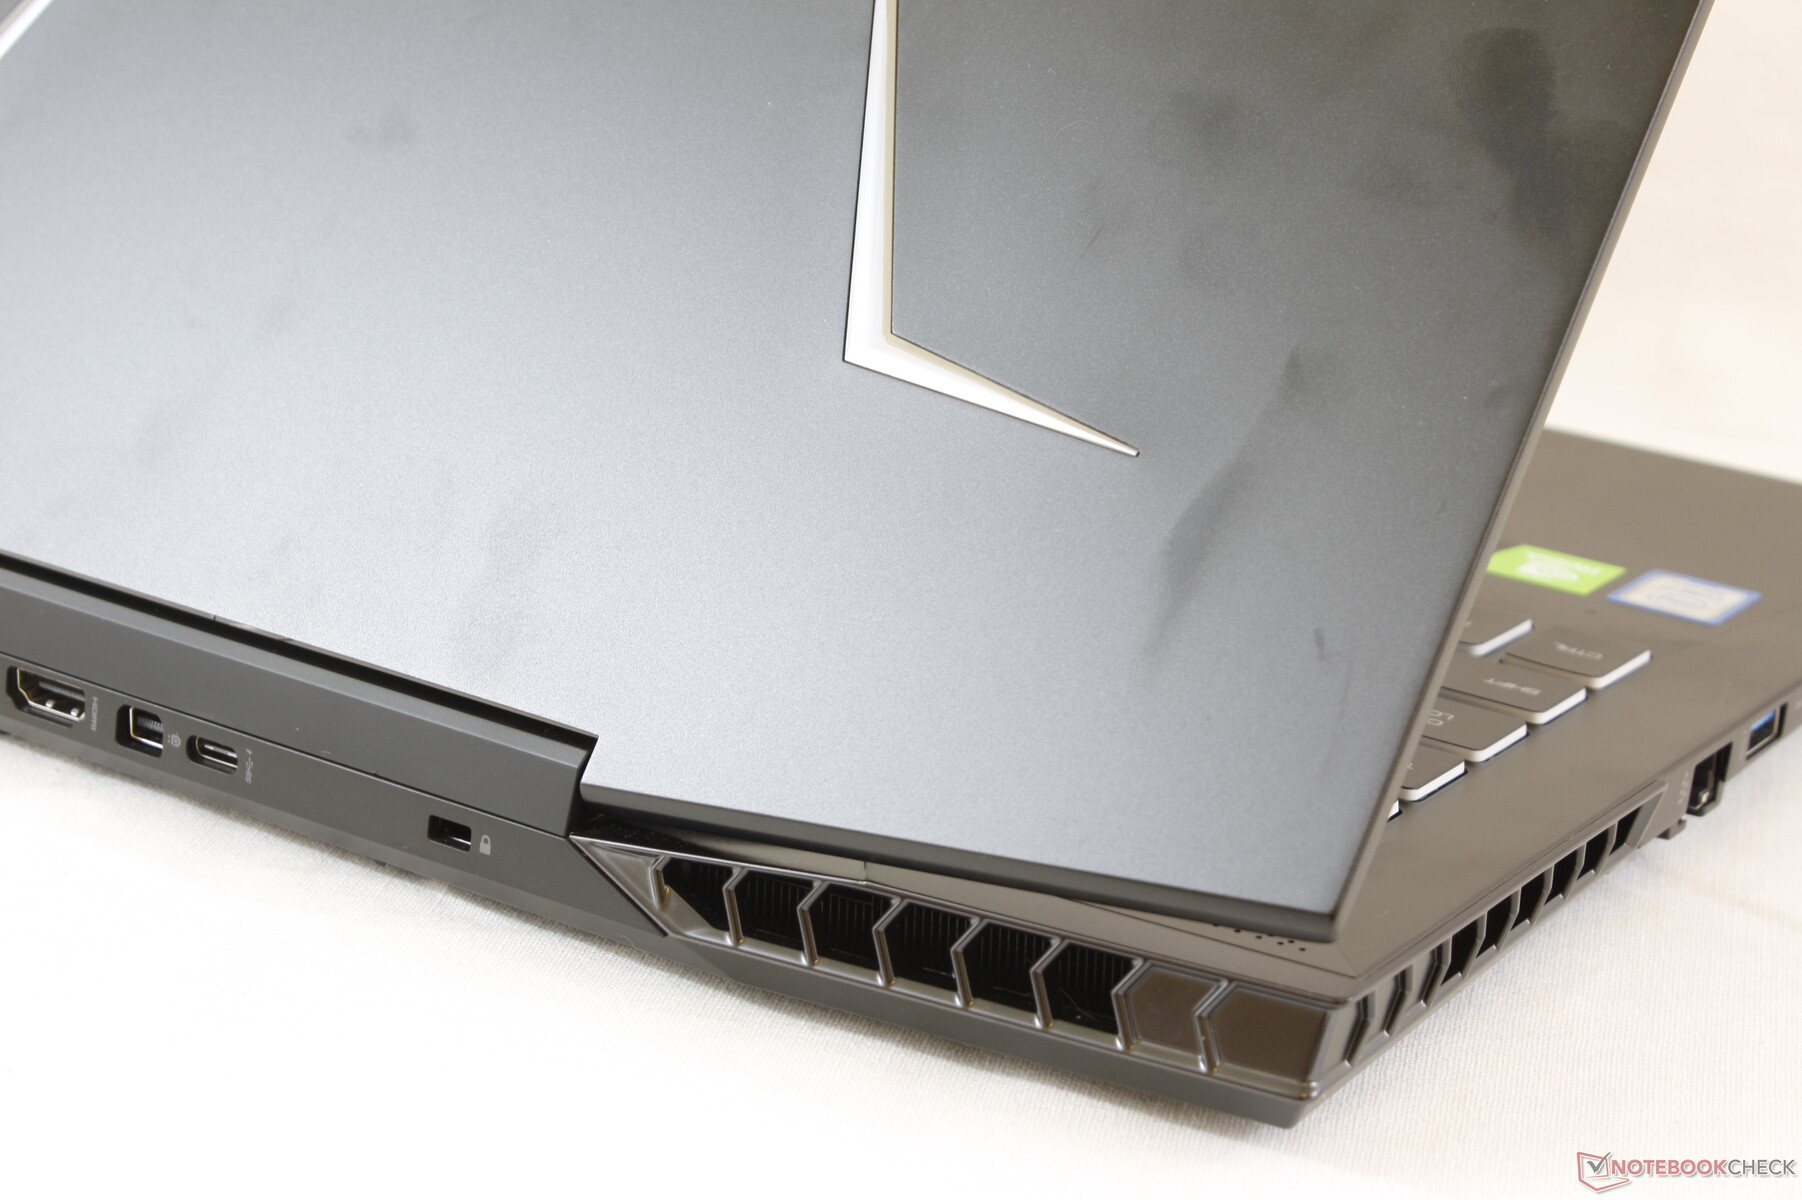
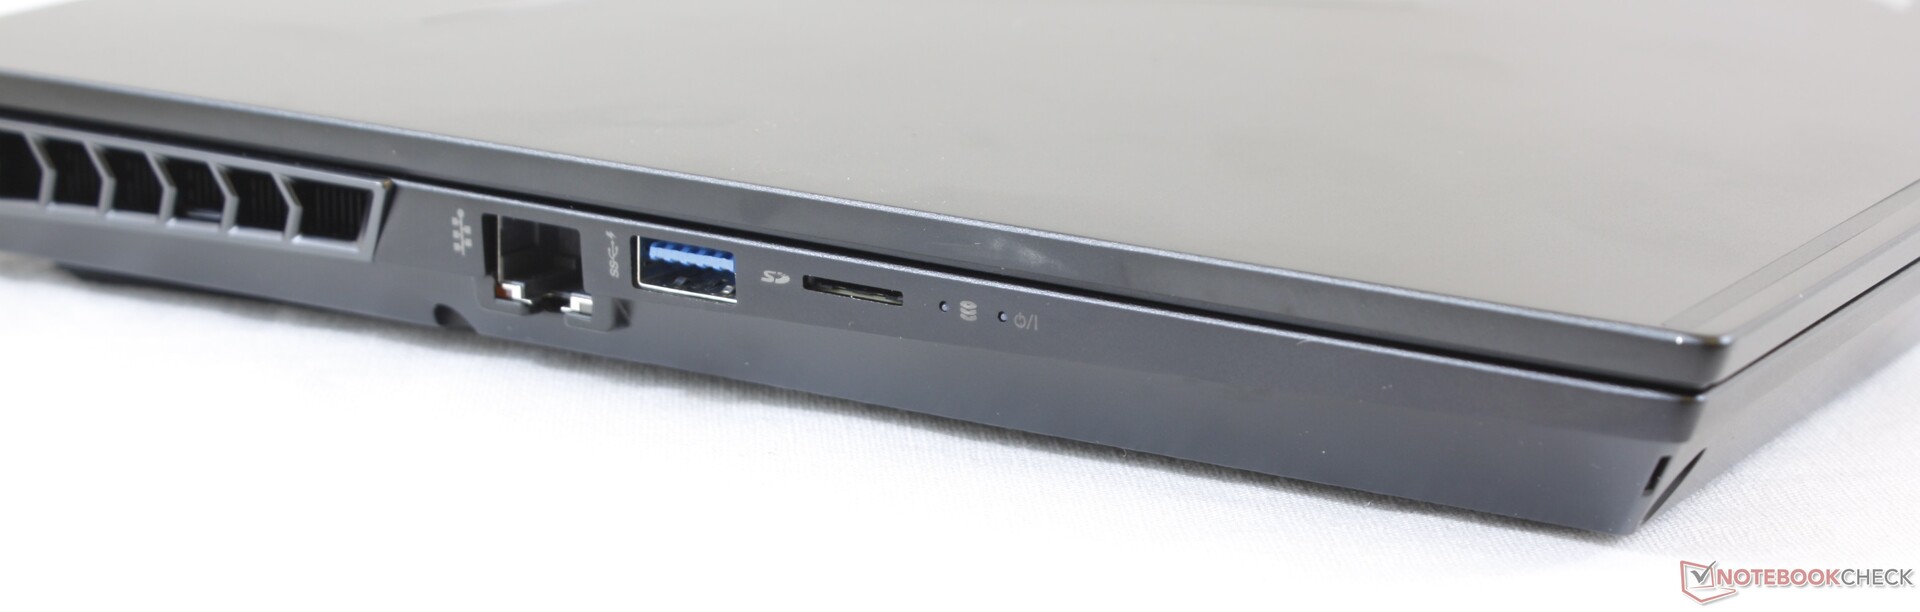
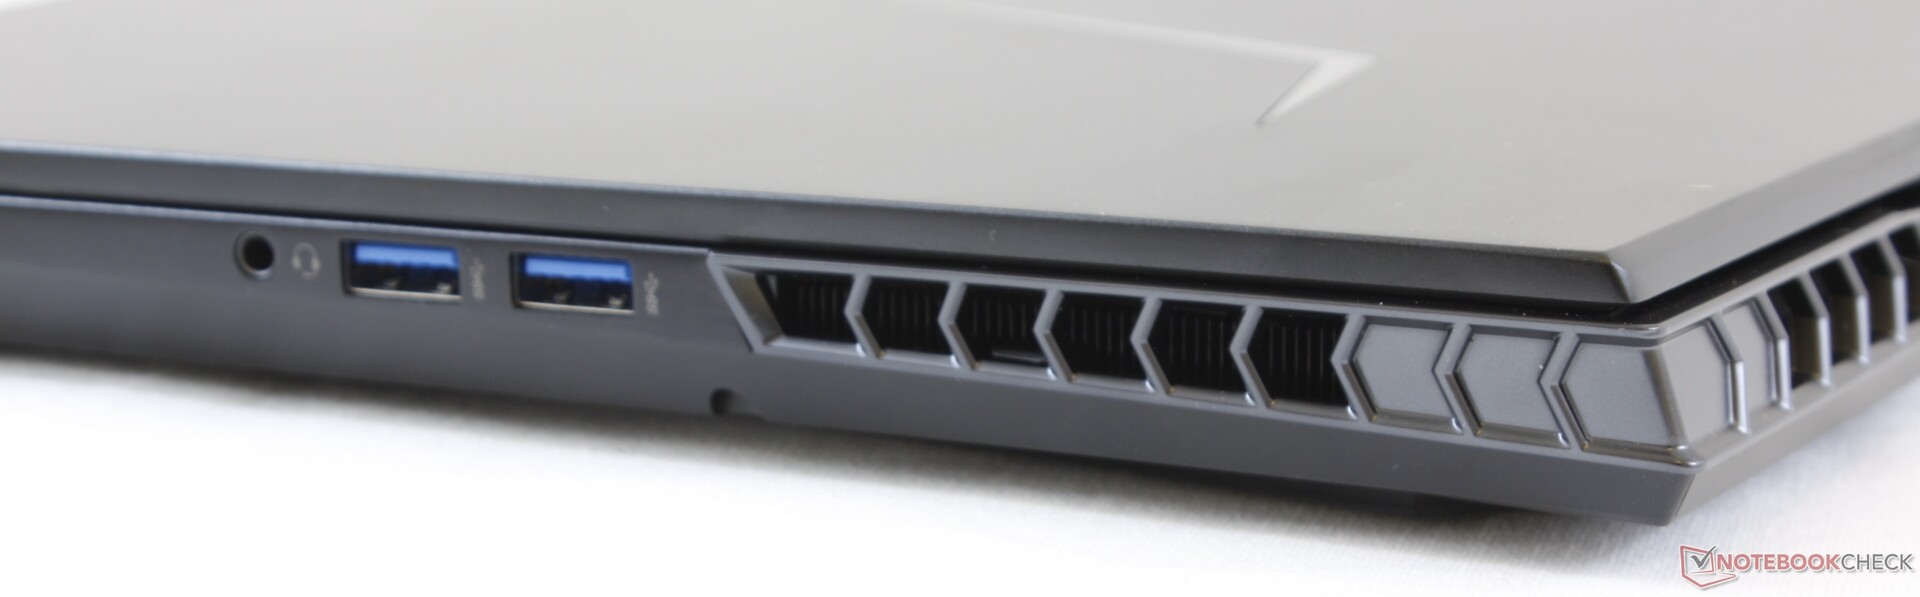
Port selection has changed slightly from the last generation model. Whereas the Aorus X5 integrates a full-size SD reader with two audio jacks, the Aorus 15 integrates a MicroSD reader with a single audio jack. Everything else remains identical including the lack of Thunderbolt 3. The Aorus brand is supposed to be Gigabyte's premier gaming series and so we're a little baffled to see Thunderbolt support missing here.
Ports are evenly distributed along the rear and sides with the rear ports being more difficult to access. Lenovo has seemingly solved this issue on the competing Legion Y740 series by having LED symbol indicators along the back.

SD Card Reader
Not only has Gigabyte downgraded the card reader to MicroSD, but transfer rates are much slower as well. Transferring 1 GB worth of photos from our UHS-II test card takes about 13 seconds compared to less than half that on the older Aorus X5. Still, this is better than the Blade 15 which has no card reader at all.
A fully inserted MicroSD card protrudes by about 1 mm for easy ejecting.
| SD Card Reader | |
| average JPG Copy Test (av. of 3 runs) | |
| Gigabyte Aero 15-X9 (Toshiba Exceria Pro SDXC 64 GB UHS-II) | |
| Aorus X5 v8 (Toshiba Exceria Pro SDXC 64 GB UHS-II) | |
| Dell XPS 13 9380 2019 (Toshiba Exceria Pro SDXC 64 GB UHS-II) | |
| Aorus 15 X9 (Toshiba Exceria Pro M501 64 GB UHS-II) | |
| maximum AS SSD Seq Read Test (1GB) | |
| Gigabyte Aero 15-X9 (Toshiba Exceria Pro SDXC 64 GB UHS-II) | |
| Aorus X5 v8 (Toshiba Exceria Pro SDXC 64 GB UHS-II) | |
| Dell XPS 13 9380 2019 (Toshiba Exceria Pro SDXC 64 GB UHS-II) | |
| Aorus 15 X9 (Toshiba Exceria Pro M501 64 GB UHS-II) | |
Communication
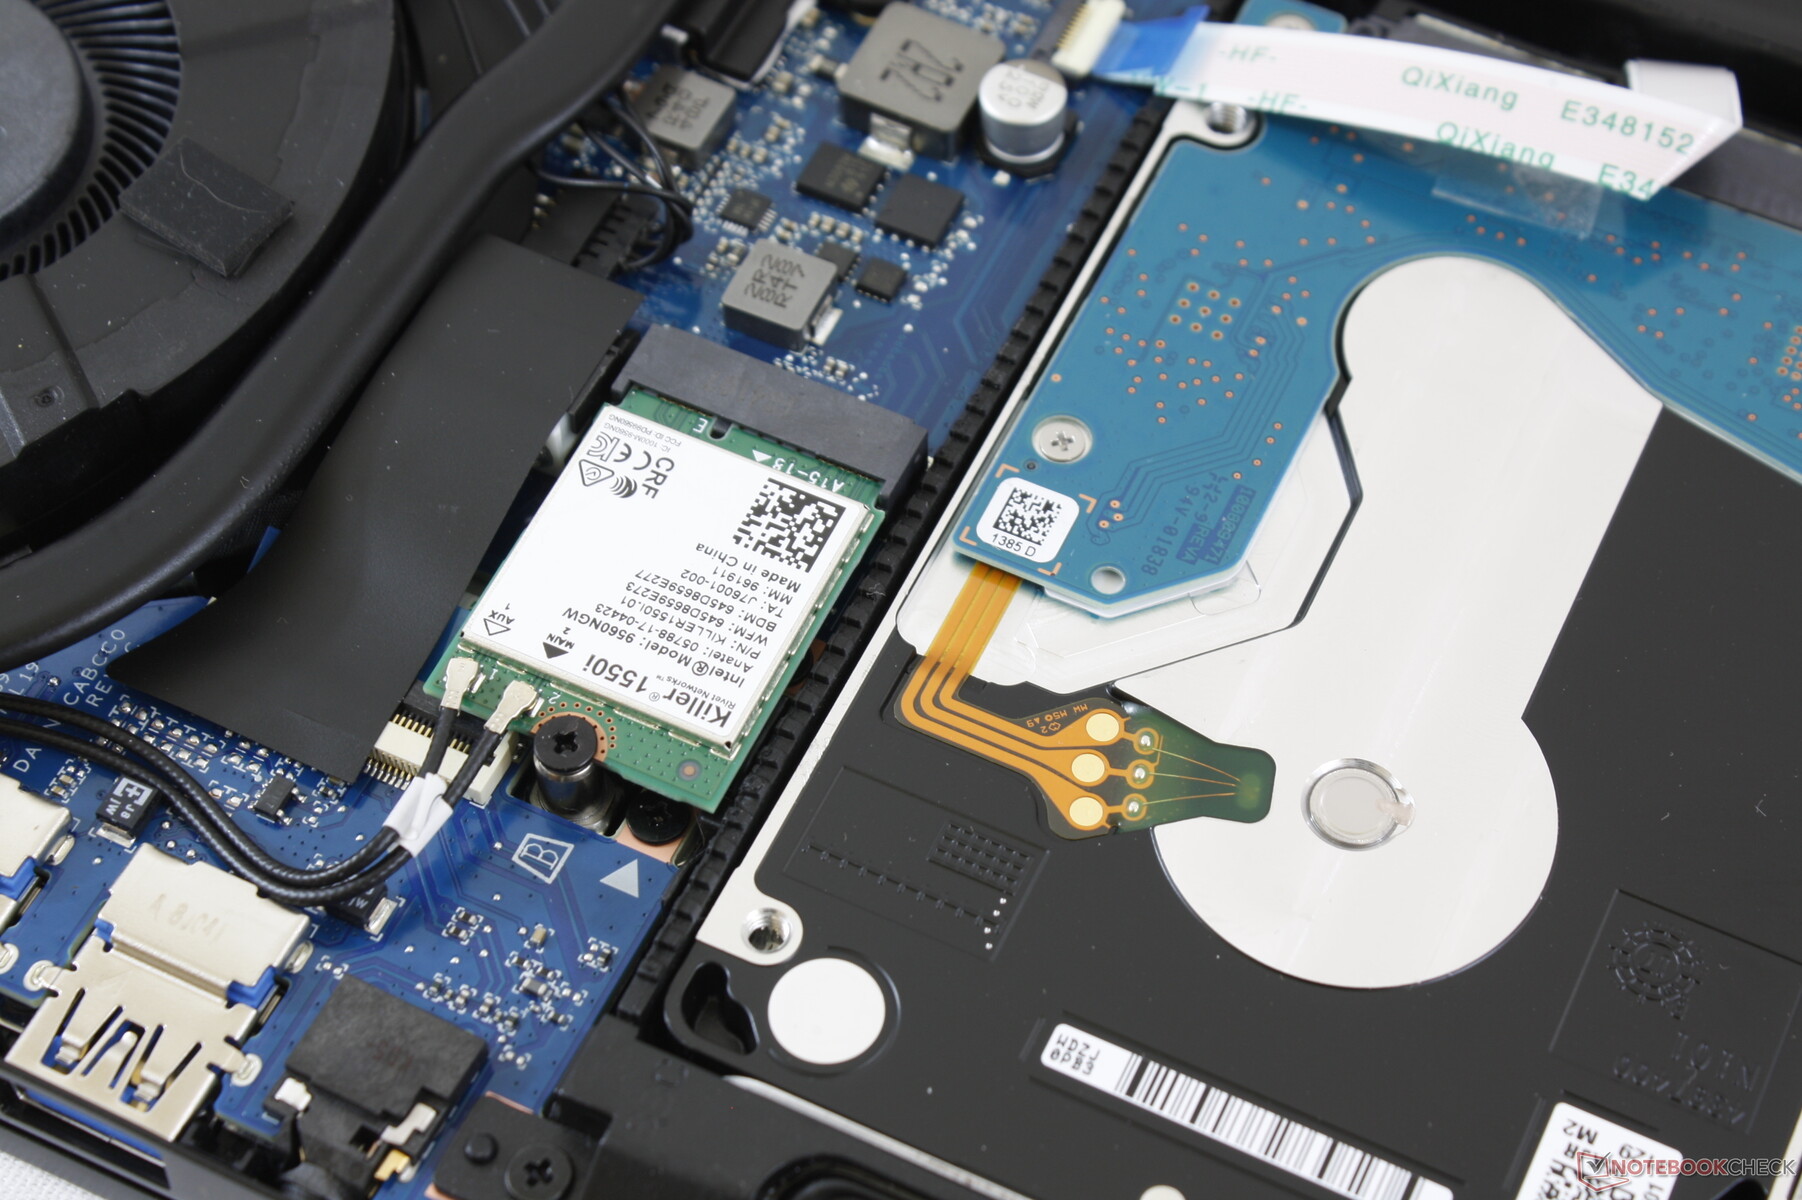
The Killer 1550i is capable of theoretical transfer rates of up to 1.73 Gbps and it includes all the auxiliary features as found on the Killer 1535. Gigabyte equips its Aero 15 series with the exact same Killer option. We didn't experience any connectivity issues during our time with the unit. Performance can be faster than what we've recorded below since our server setup is limited by a 1 Gbps line.
| Networking | |
| iperf3 transmit AX12 | |
| Gigabyte Aero 15-X9 | |
| Razer Blade 15 RTX 2070 Max-Q | |
| Aorus 15 X9 | |
| Aorus X5 v8 | |
| iperf3 receive AX12 | |
| Razer Blade 15 RTX 2070 Max-Q | |
| Gigabyte Aero 15-X9 | |
| Aorus X5 v8 | |
| Aorus 15 X9 | |
Maintenance
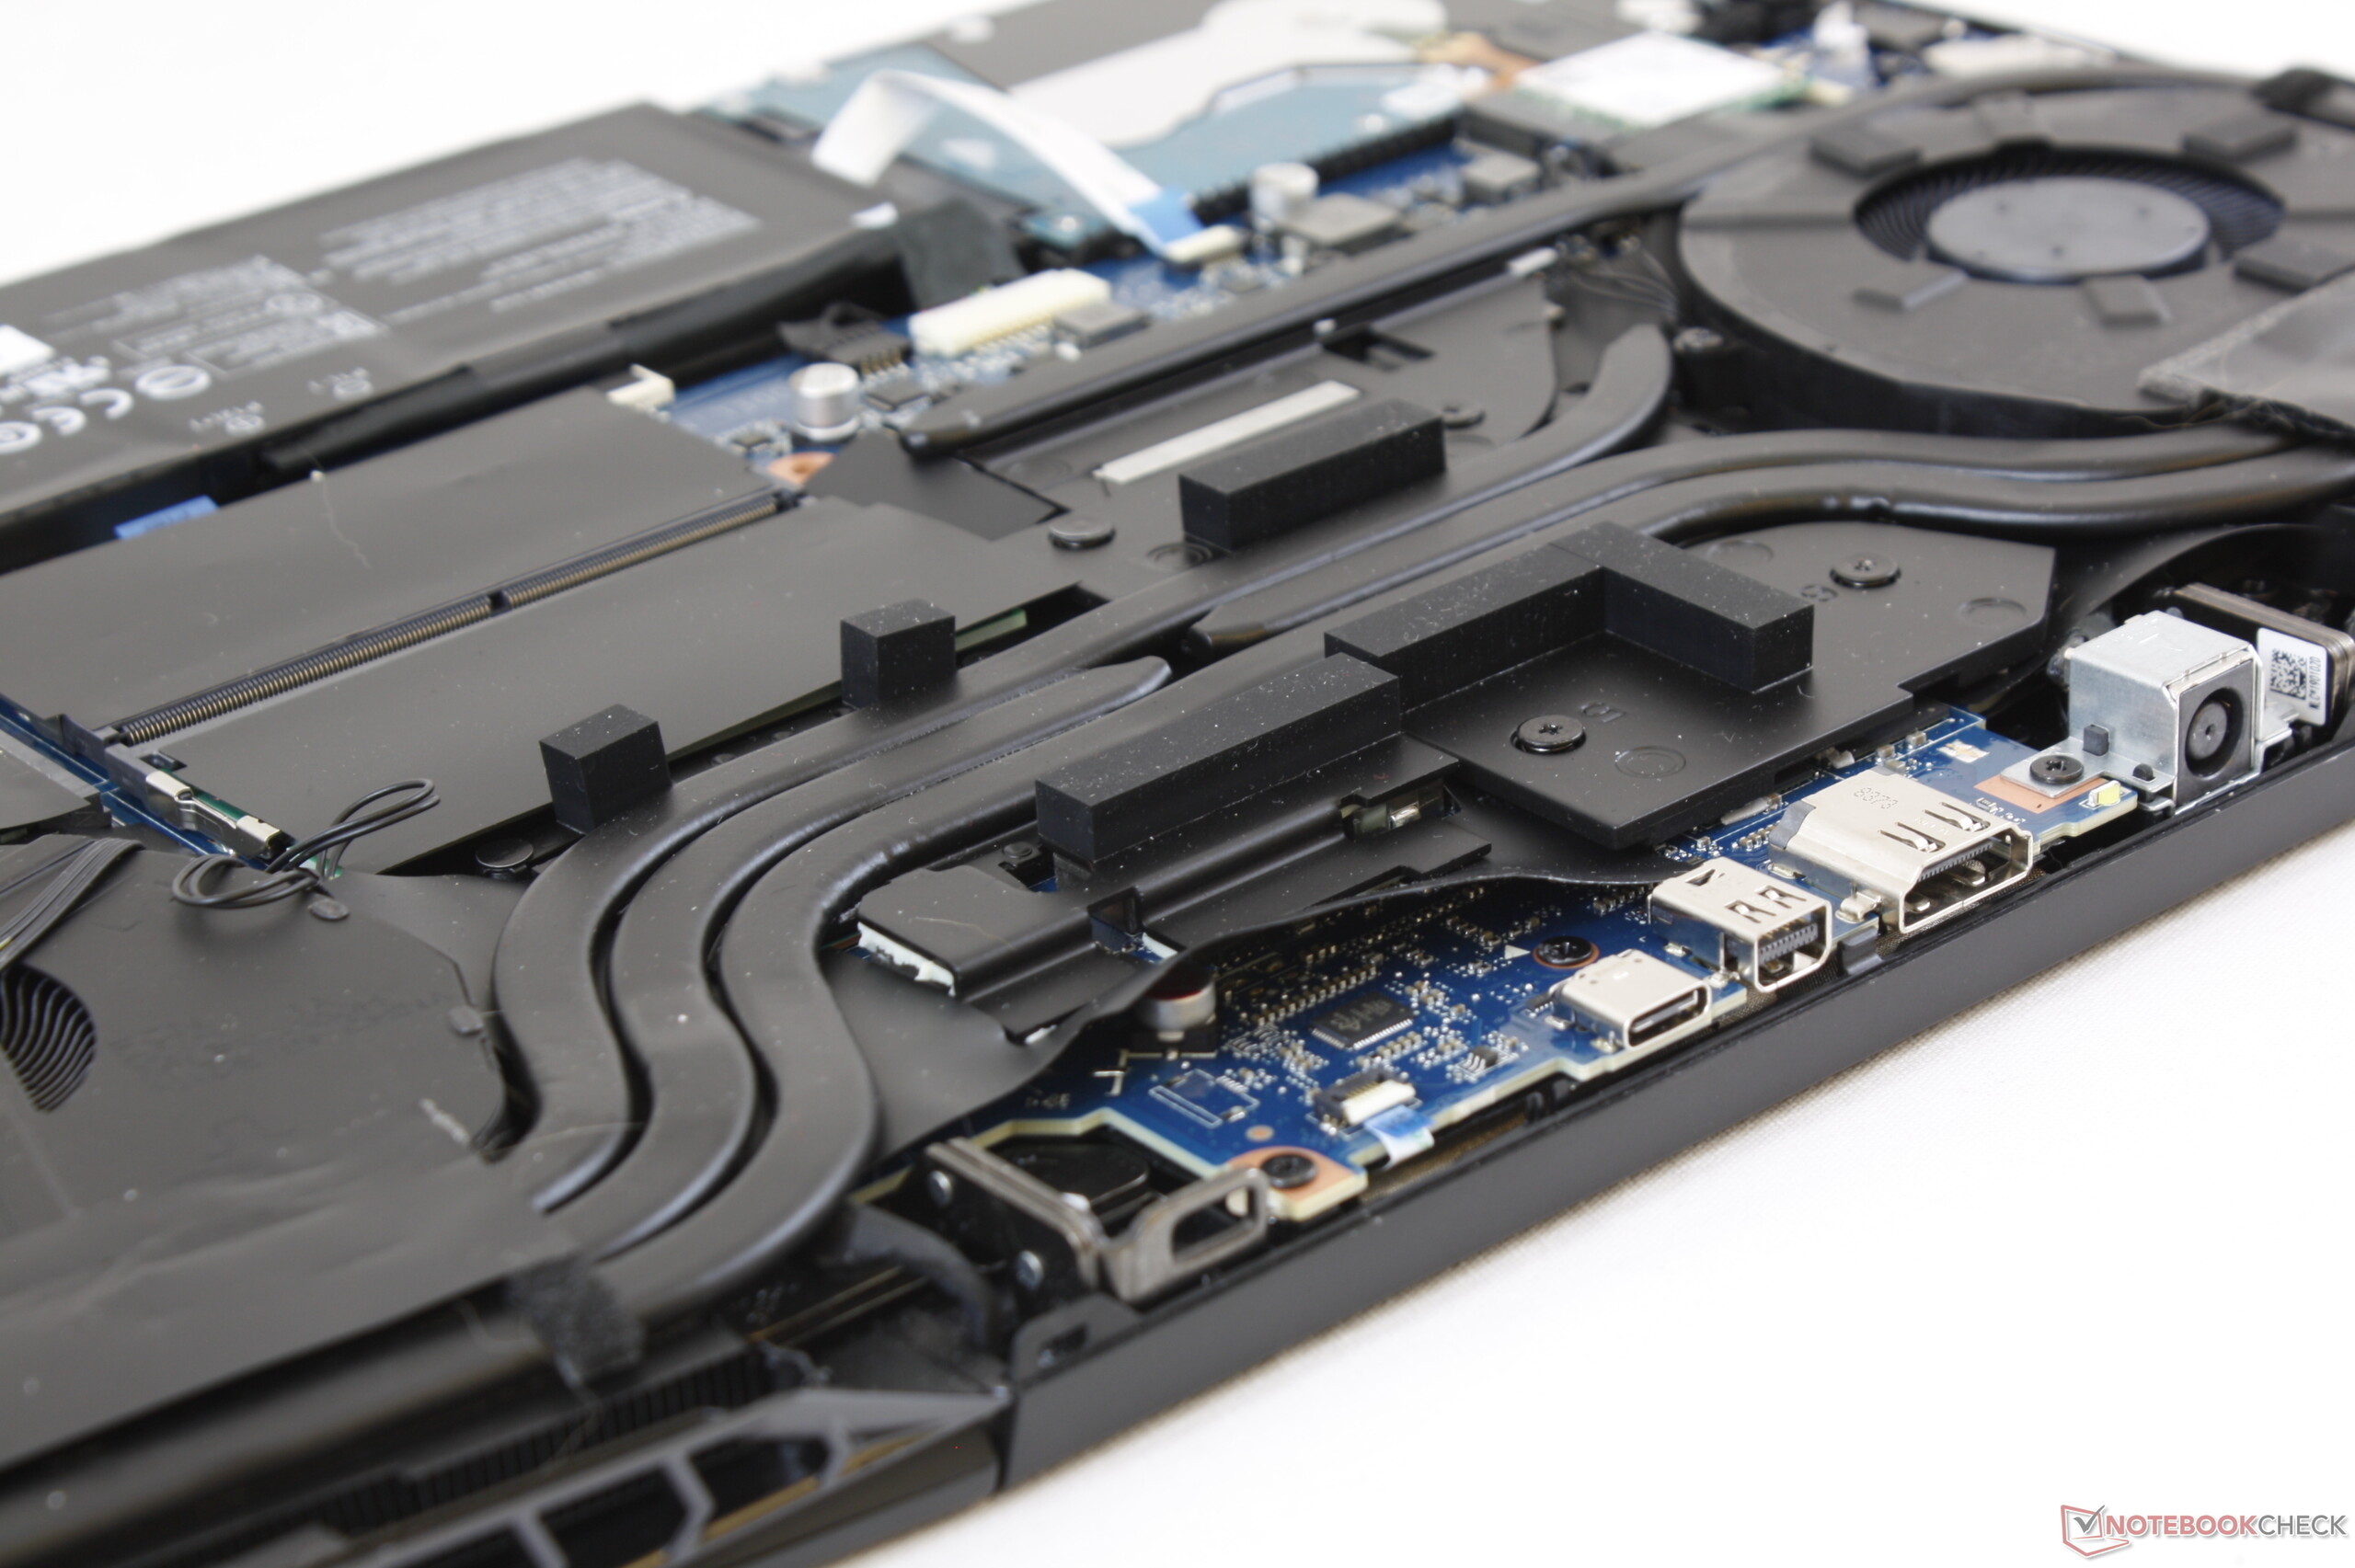
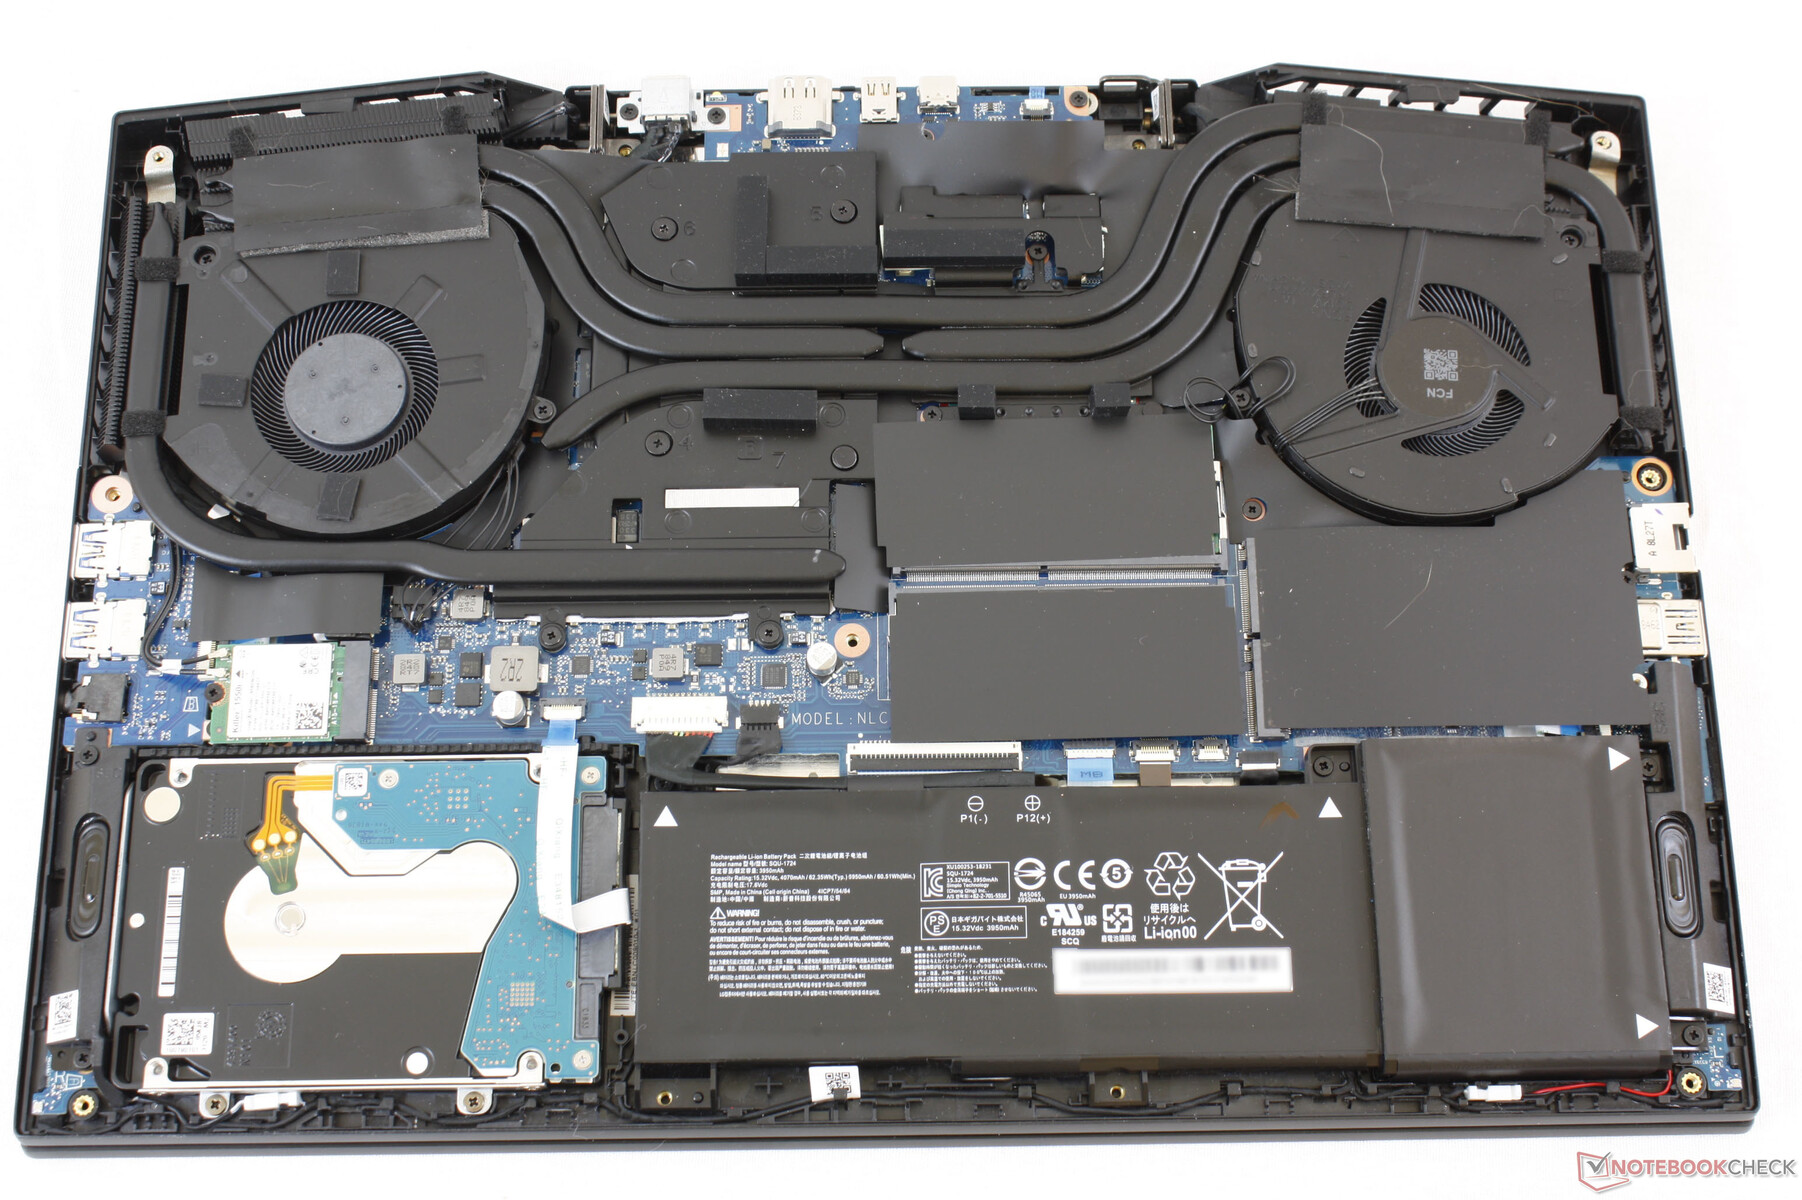
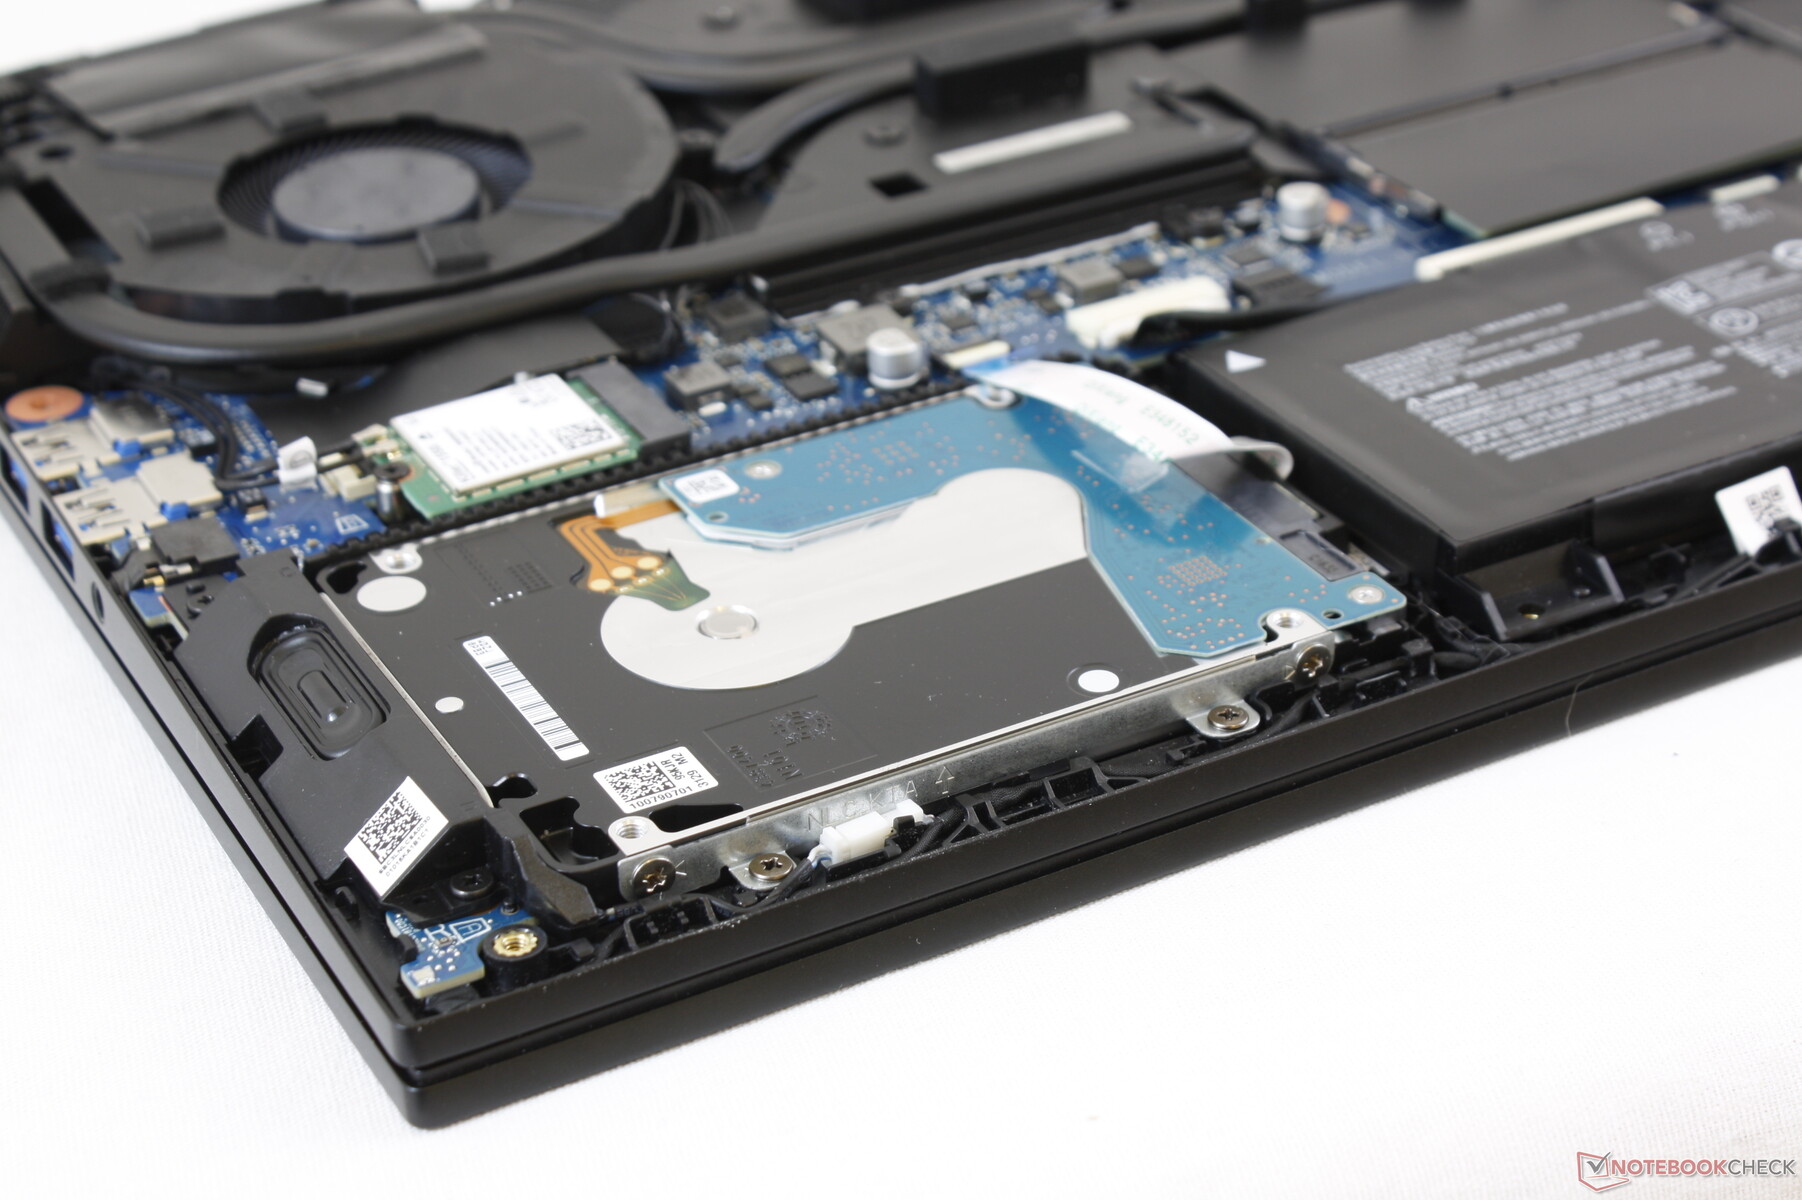
The bottom panel can be removed with a standard Philips screwdriver and a sharp edge in contrast to the Torx screws on the Aorus X5. The latches around the Aorus 15 are quite tight, however, so it may take some practice to safely remove the bottom plate.
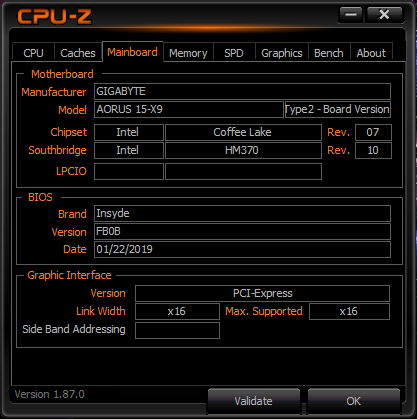
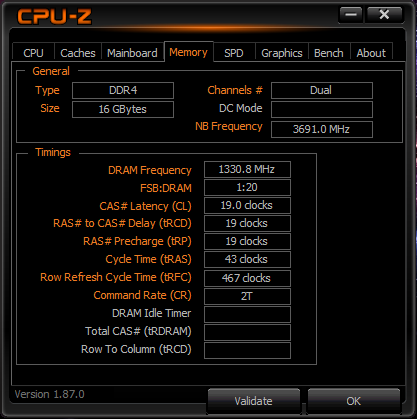
Once inside, users have direct access to all three storage bays, both DDR4 SODIMM slots (up to 32 GB), battery, and WLAN module.
Keep in mind that a sticker must first be broken to remove the bottom panel which could impact the limited warranty.
Accessories and Warranty
(May 3, 2019 update: We originally reported a two-year standard warranty for U.S. customers. We've now corrected this to say one-year instead.)
There are no extras in the box other than the Quick Start guide and warranty card. It's quite the barebones unboxing experience.
Gigabyte offers the standard one-year limited warranty in the United States.
Input Devices
Keyboard
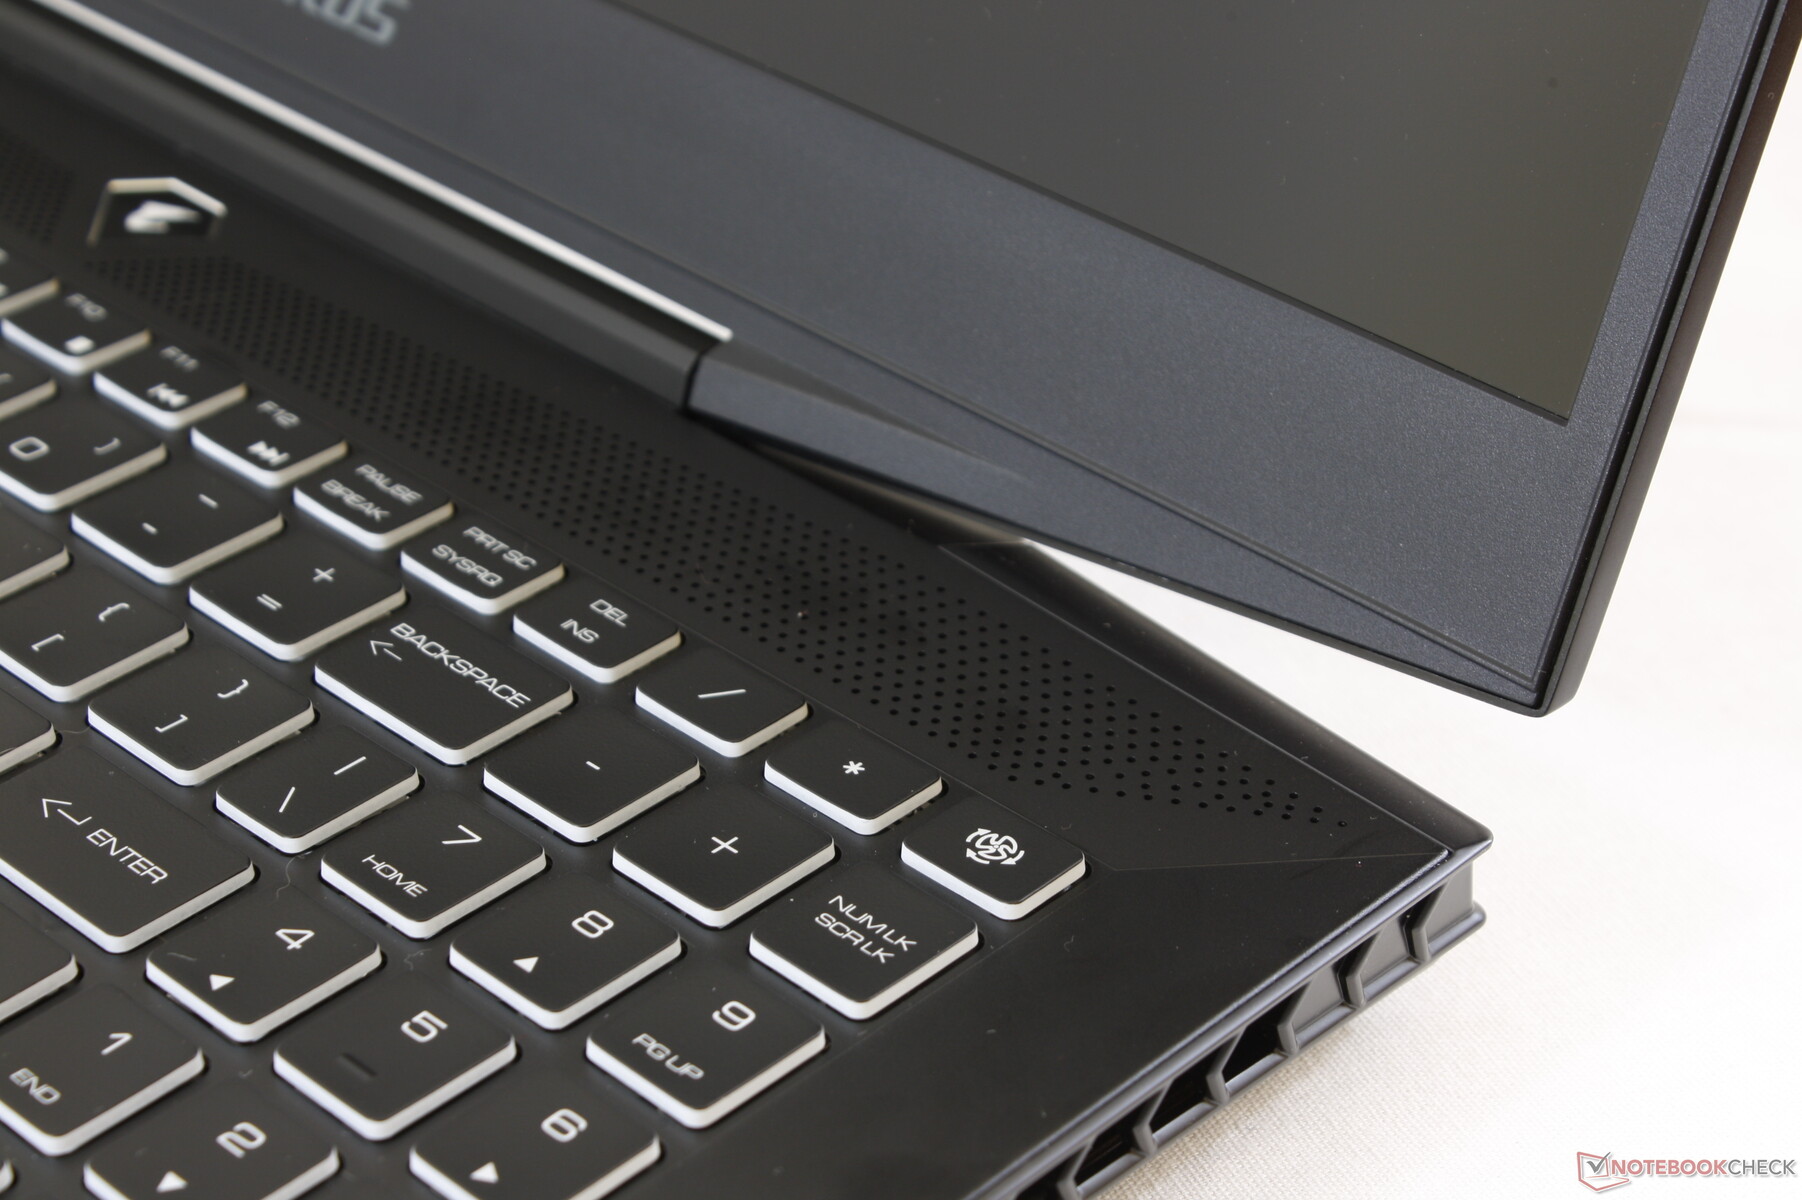
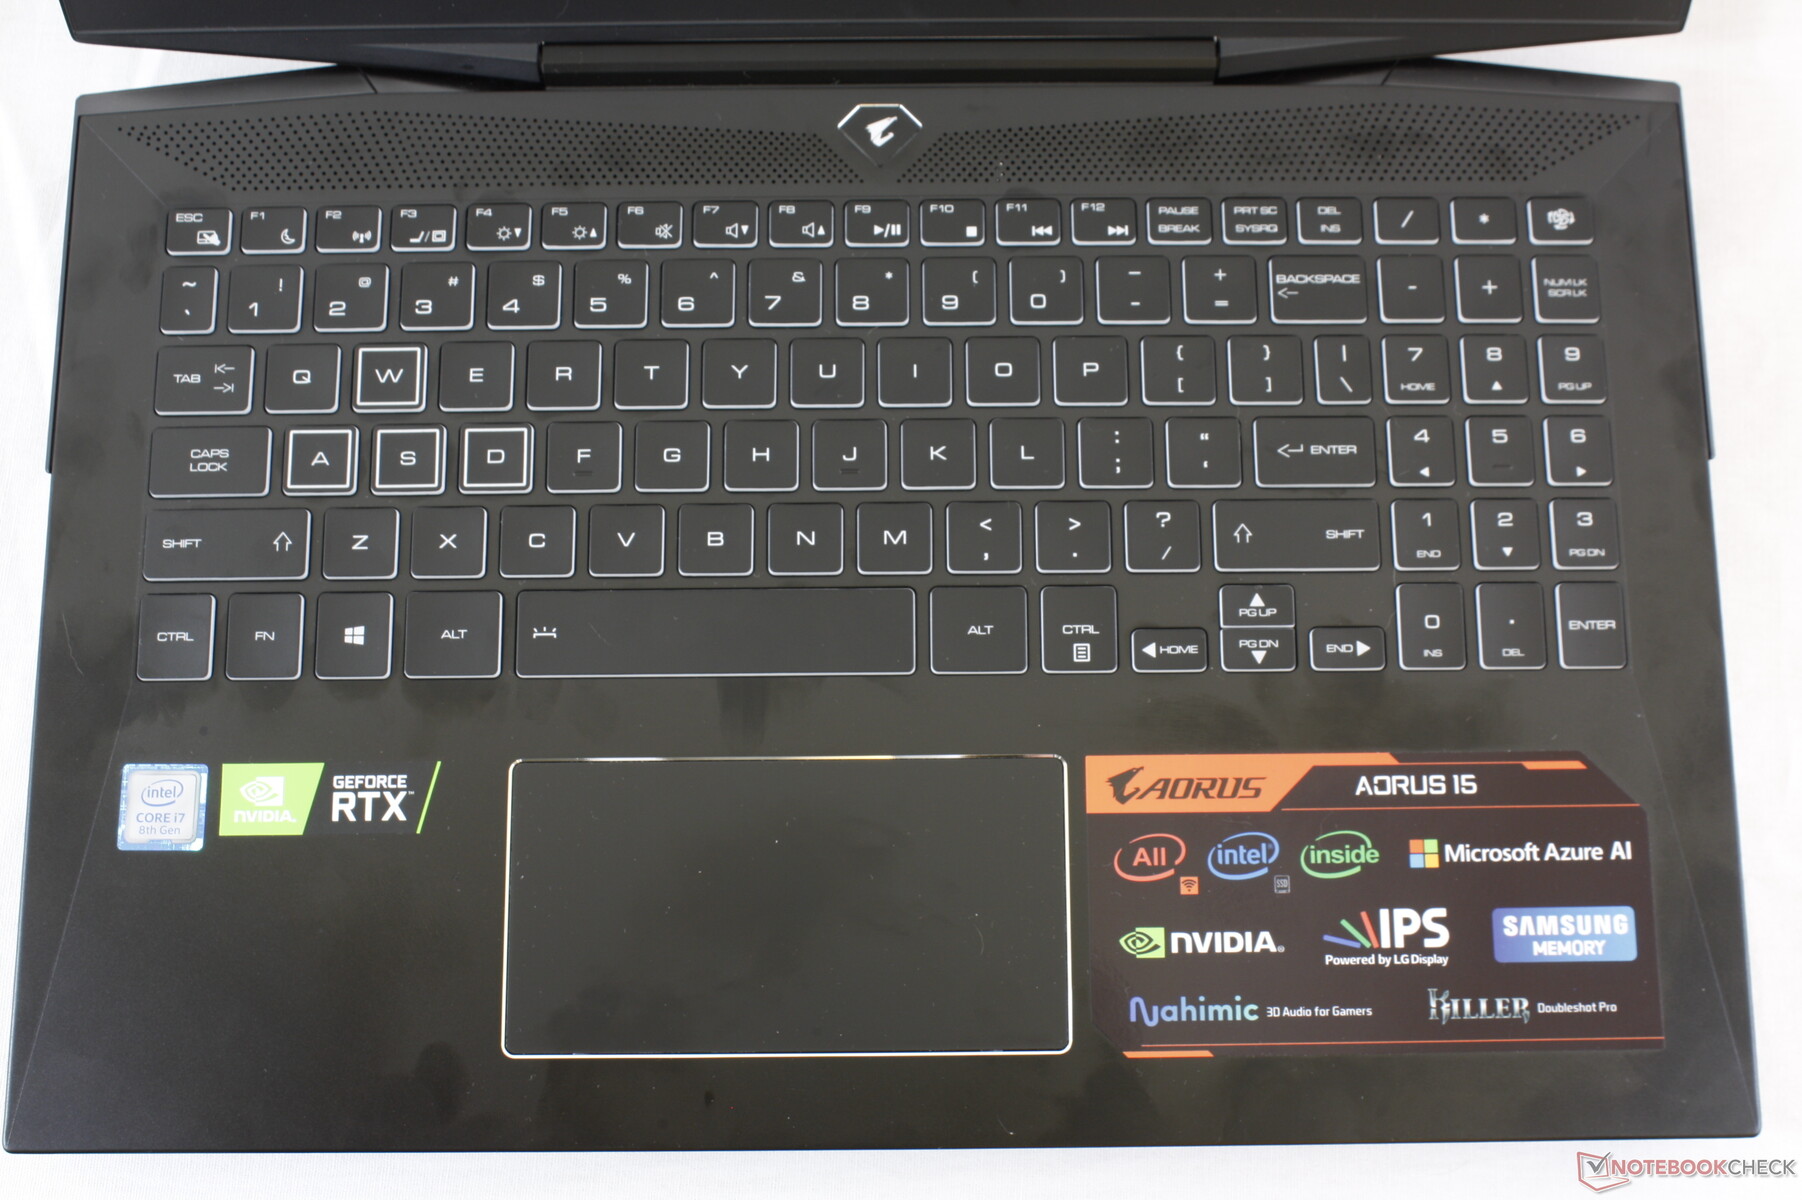
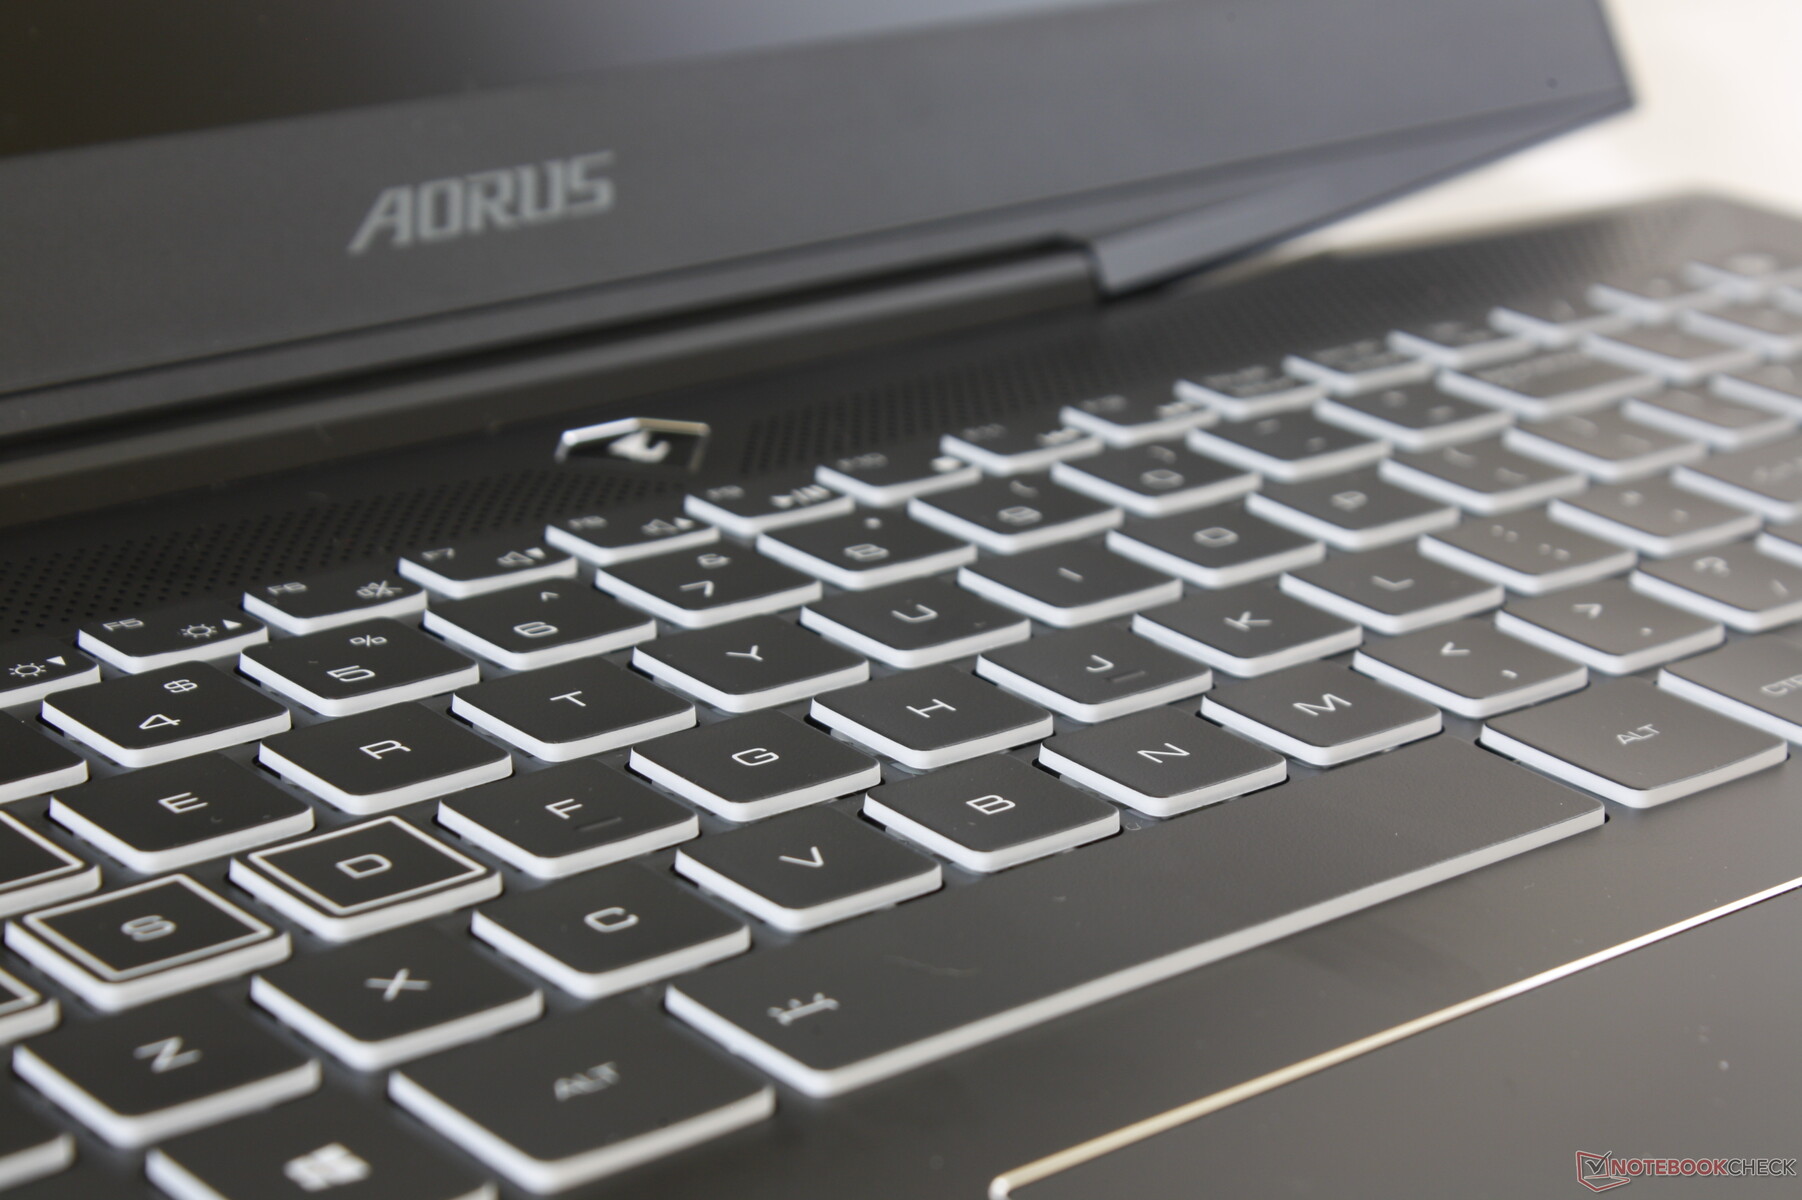
Keyboard feedback is better than on the Razer Blade 15 with slightly louder clatter than on the MSI GS65. The actuation point doesn't feel as crisp as on an HP Spectre x360 15, but we find the typing experience to be satisfactory nonetheless. A minor annoyance is the extra-small Arrow keys, Backspace key, and Vertical Bar "|" key. All of these keys were much larger on the last generation Aorus X5.
An integrated NumPad is present unlike on most other 15-inch gaming laptops. On the Aorus 15, however, the number keys are narrower and thus more cramped. It's too bad that the laptop does not utilize the empty space along the sides of the keyboard to fit larger NumPad keys.
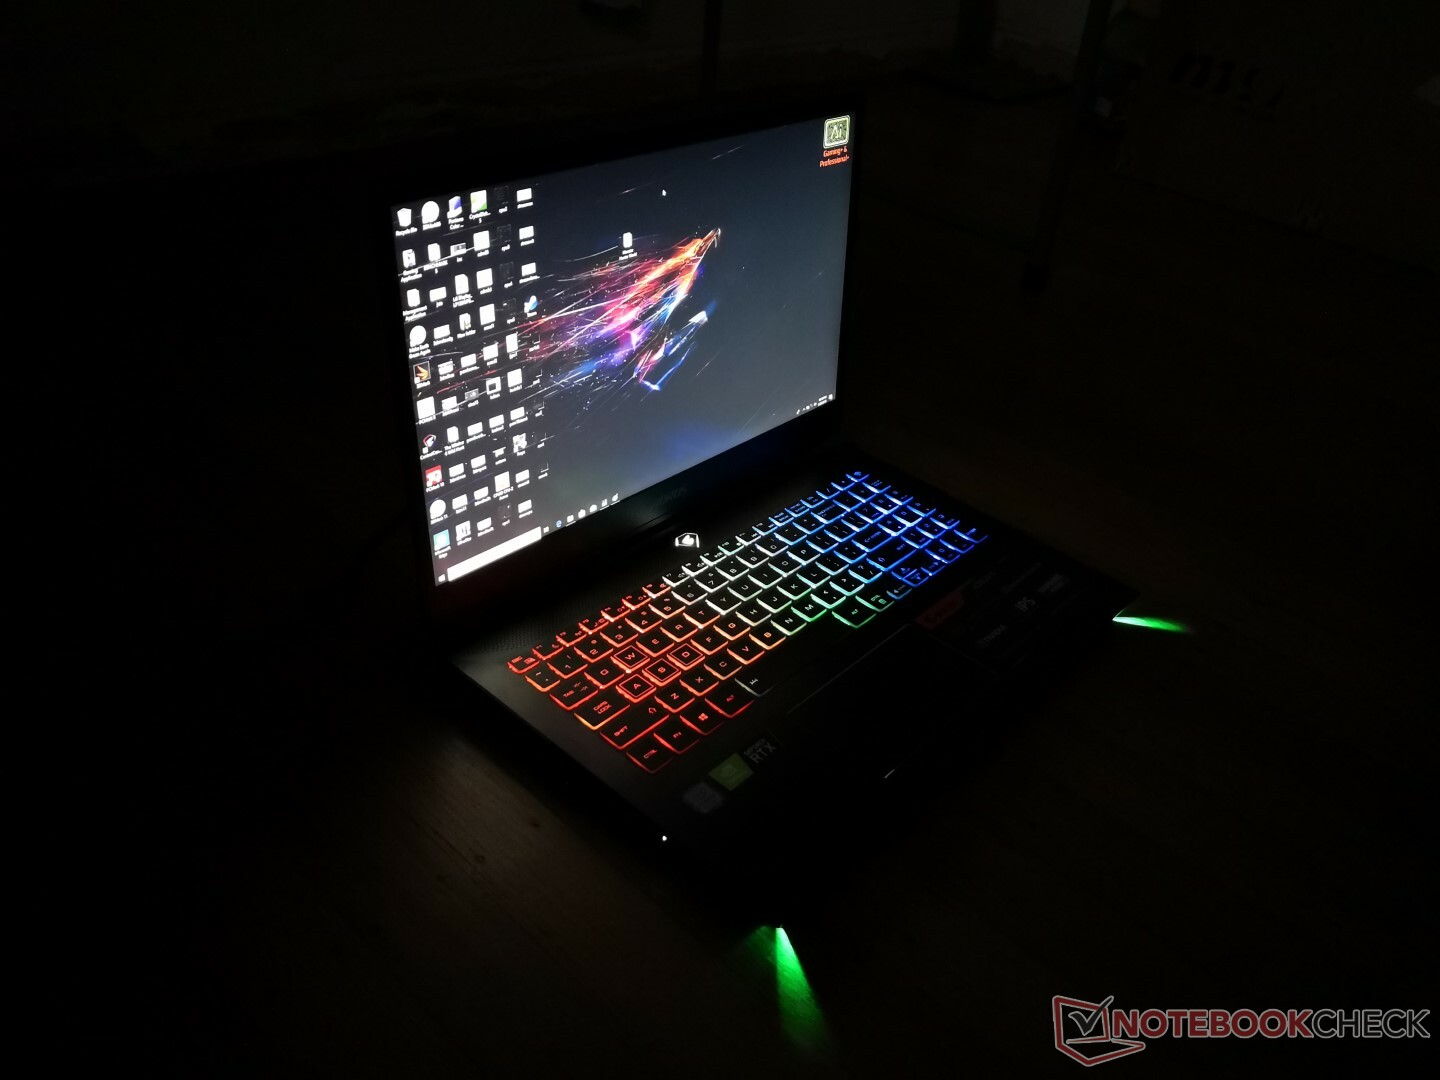
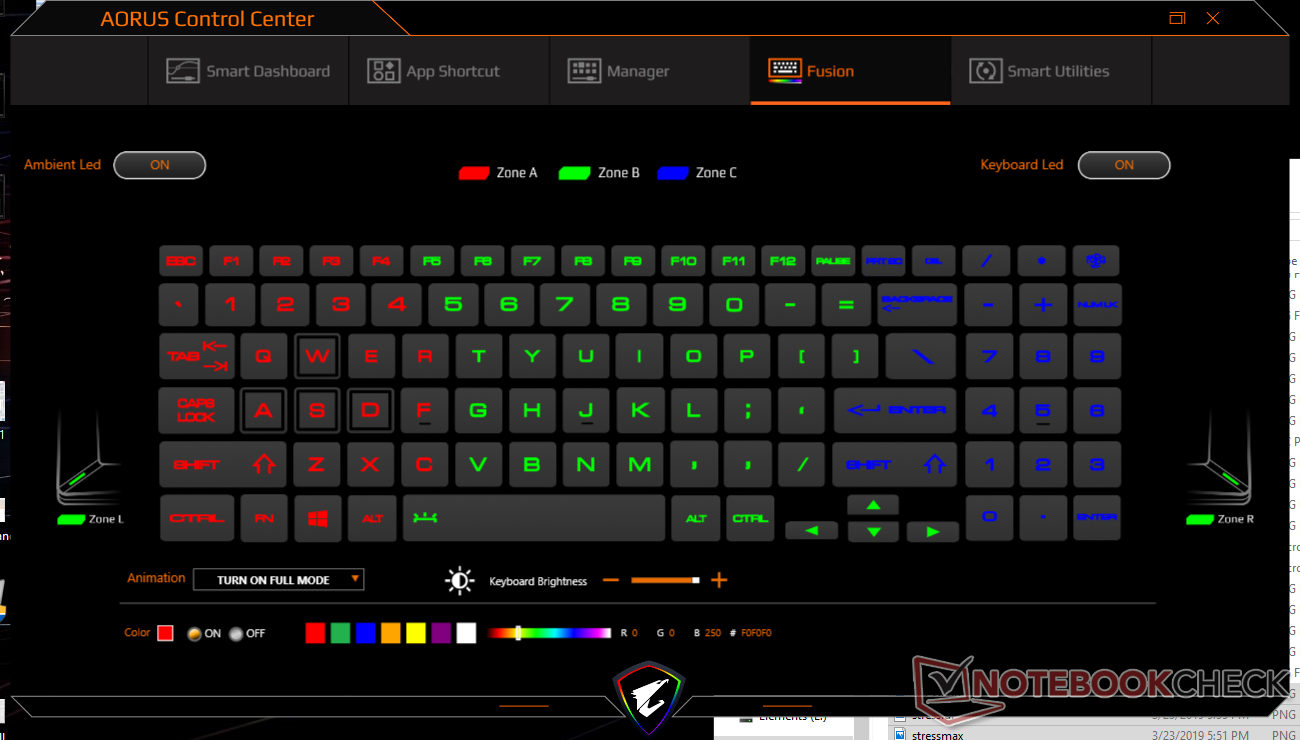
Aorus has dropped the column of Macro keys as well as the per-key RGB lighting of the Aorus X5 for a more standard three-zone RGB lighting.
Touchpad
We're happy to see that the glossy and sticky touchpad of the last generation Aorus X5 and X7 series is now gone for a more traditional look and feel. Glide is smooth and responsive no matter the cursor speed with just minimal sticking when moving very slowly. Unfortunately, the matte plastic surface will accumulate grease very quickly for an unsightly look after just a few days of use.
Trackpad size (11.5 x 6 cm) is smaller than on both the XPS 15 (10.5 x 8.5 cm) and last generation Aorus X5 (10.6 x 7.8 cm). There is ample space both above and below the trackpad that appears under-utilized.
The integrated mouse keys are a huge improvement over the previous generation. Feedback is much firmer for a satisfying click without being very loud.
Display
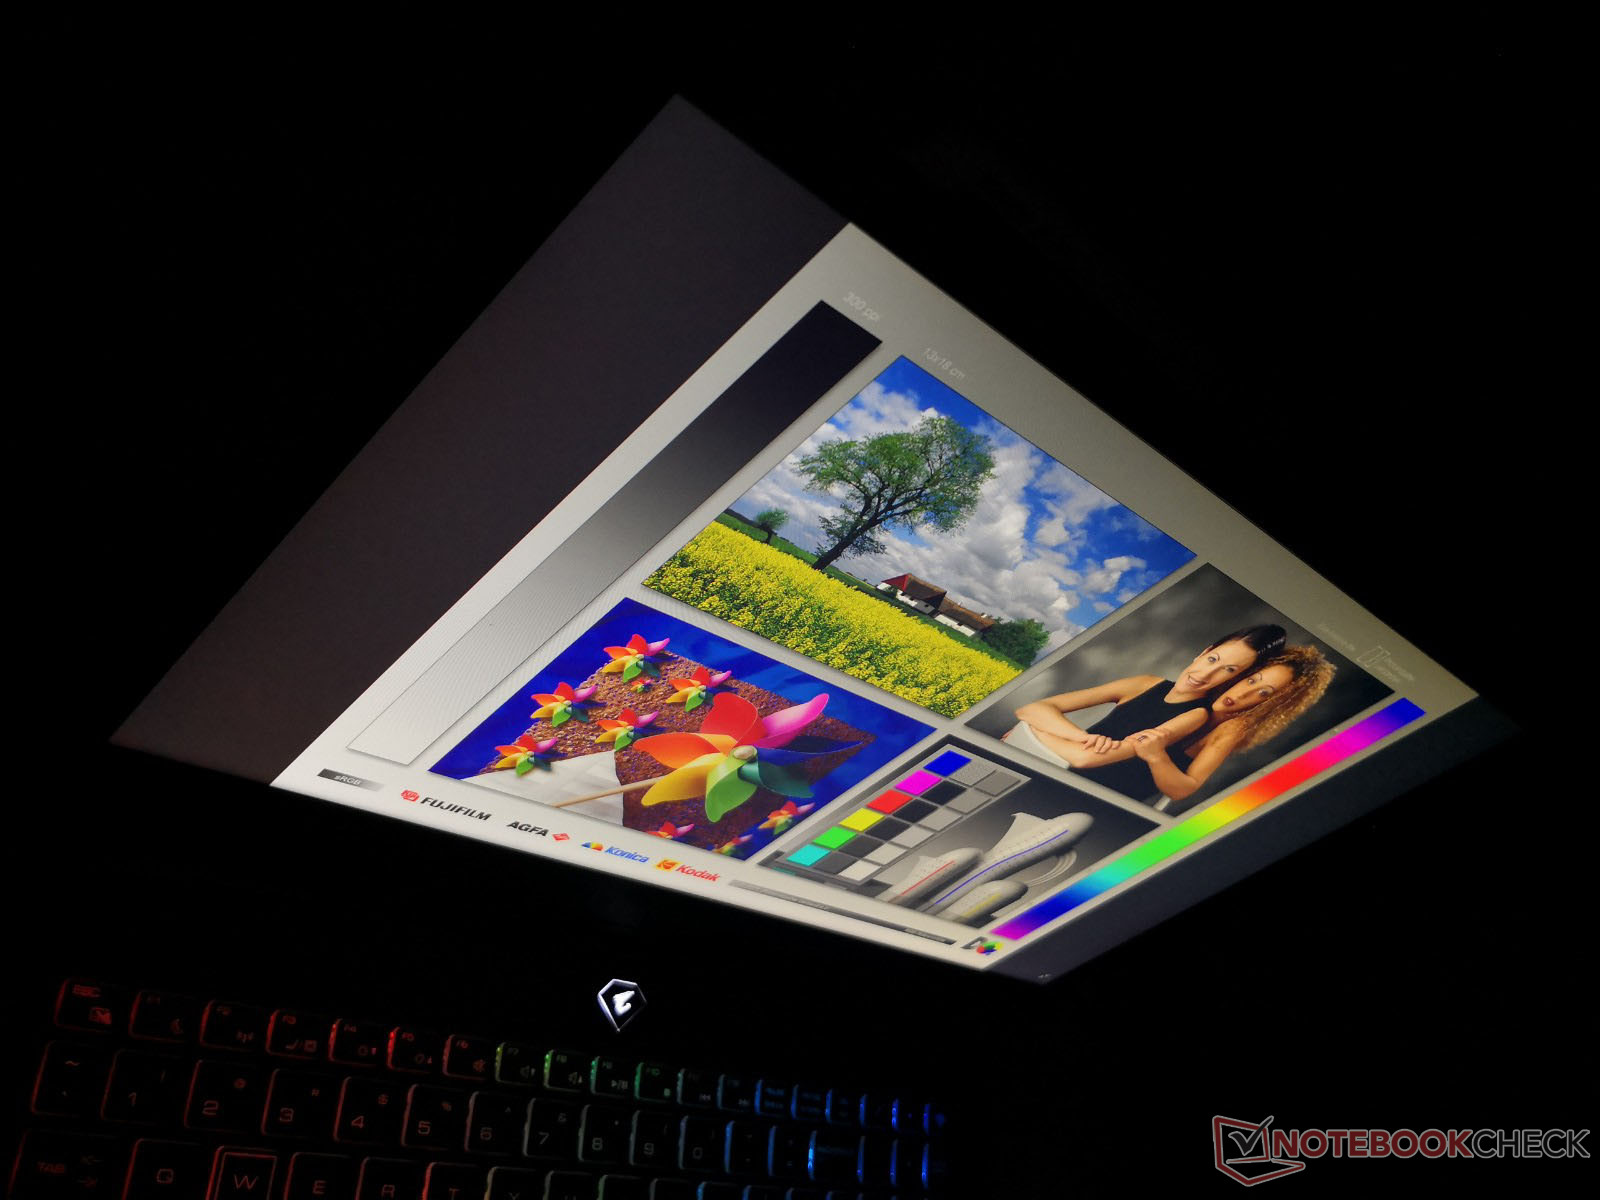
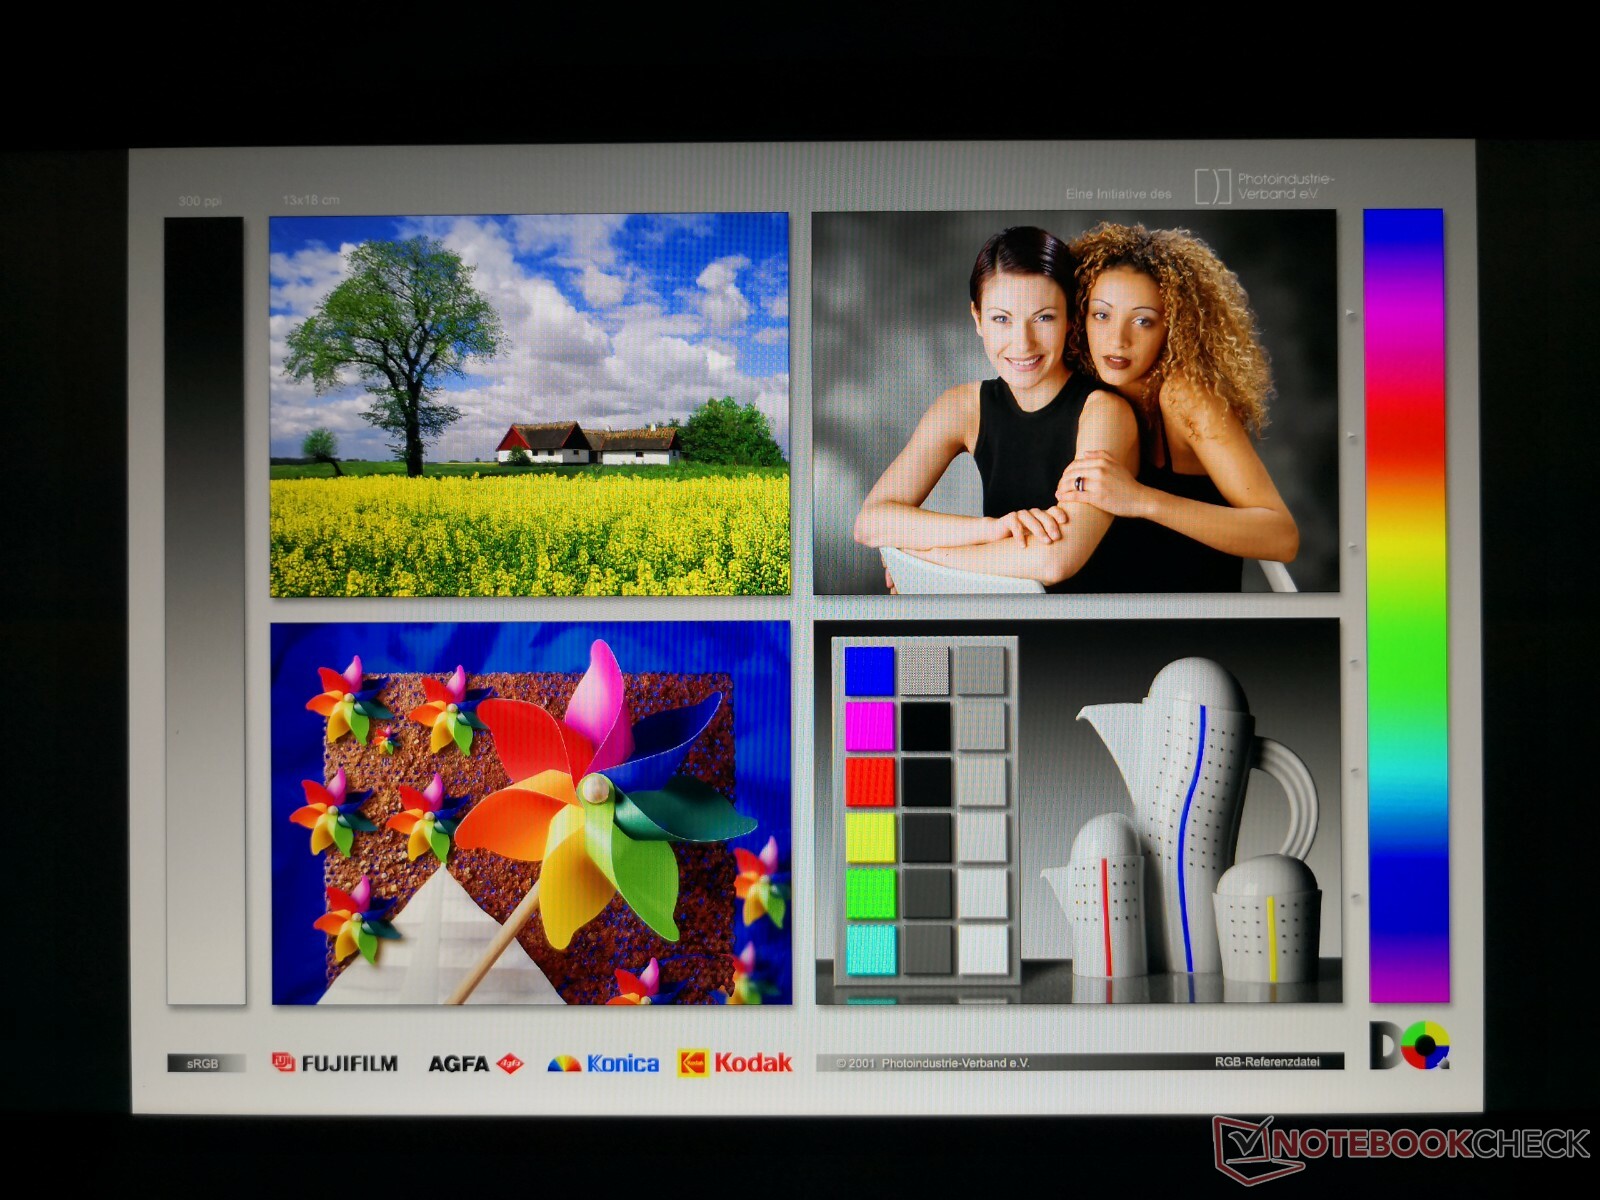
Gigabyte has switched panel manufacturers from AU Optronics to LG Philips for the Aorus 15. The high quality LP156WFG-SPB2 IPS panel found here was also used on last year's Lenovo Legion Y530. Both systems subsequently share similar characteristics including the fast black-white response times for reduced ghosting, native 144 Hz refresh rate for smoother gameplay, and almost identical color spaces. Contrast ratio, oddly enough, is notably higher on the Aorus. Display brightness is typical of gaming laptops at about 300 nits.
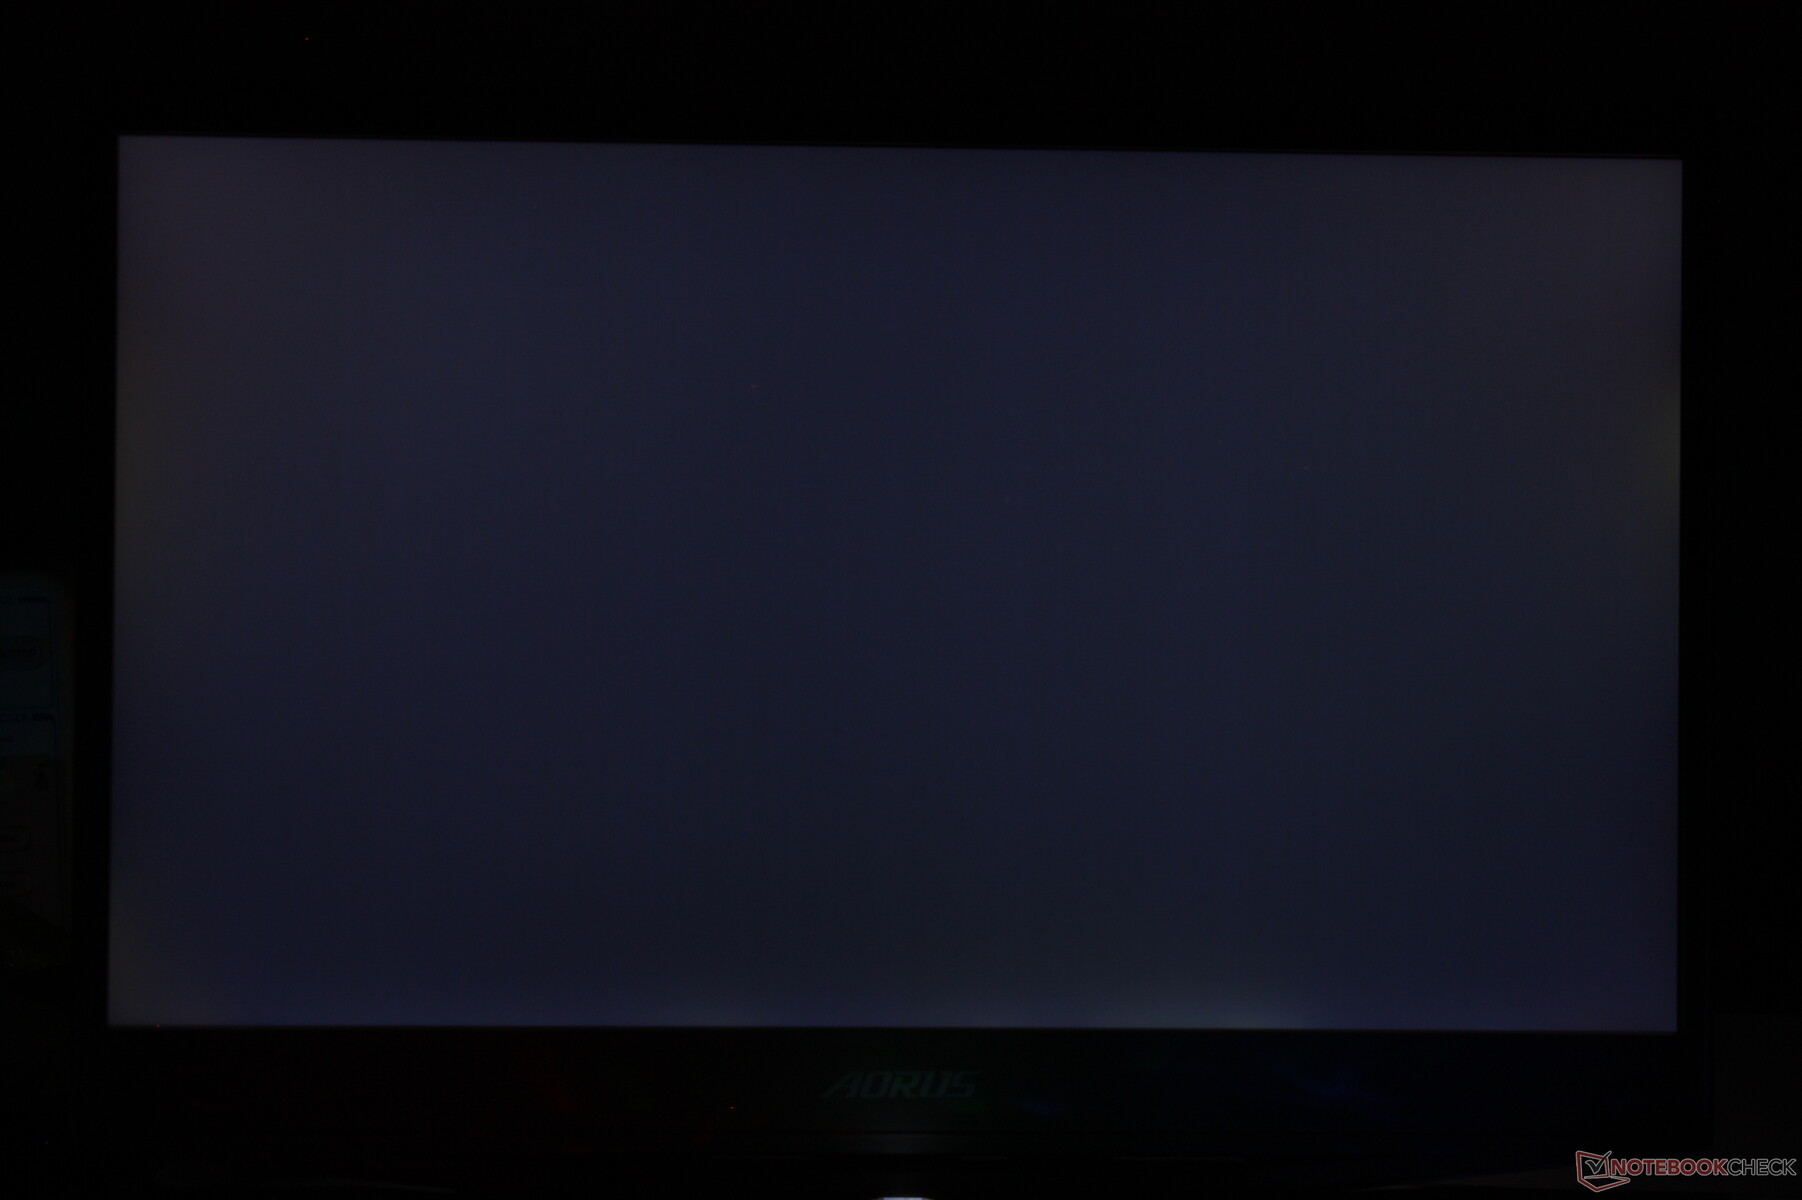
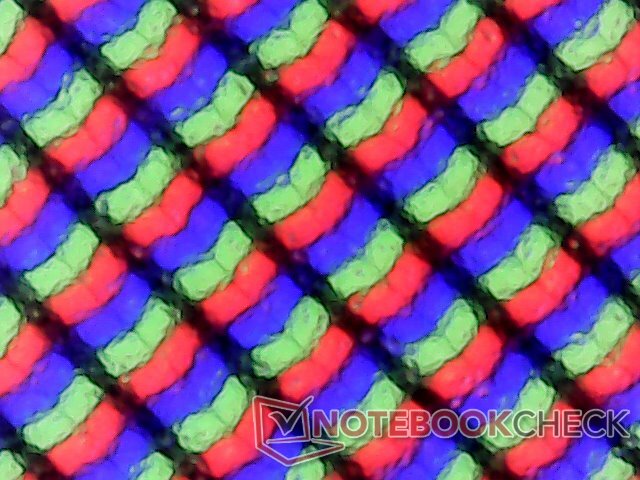
The matte panel is crisp and almost grain-free. Backlight bleeding is also kept to a minimum as it's largely unnoticeable as shown by our picture below.
There are no other display options available at the moment meaning no 4K UHD or touchscreen features. We personally prefer 1080p144 for gaming purposes at this screen size anyway. The system can still output to a 4K UHD monitor at 60 Hz via mini DisplayPort or HDMI 2.0.
There are no G-Sync options available at the time of writing.
| |||||||||||||||||||||||||
Brightness Distribution: 78 %
Center on Battery: 305.1 cd/m²
Contrast: 925:1 (Black: 0.33 cd/m²)
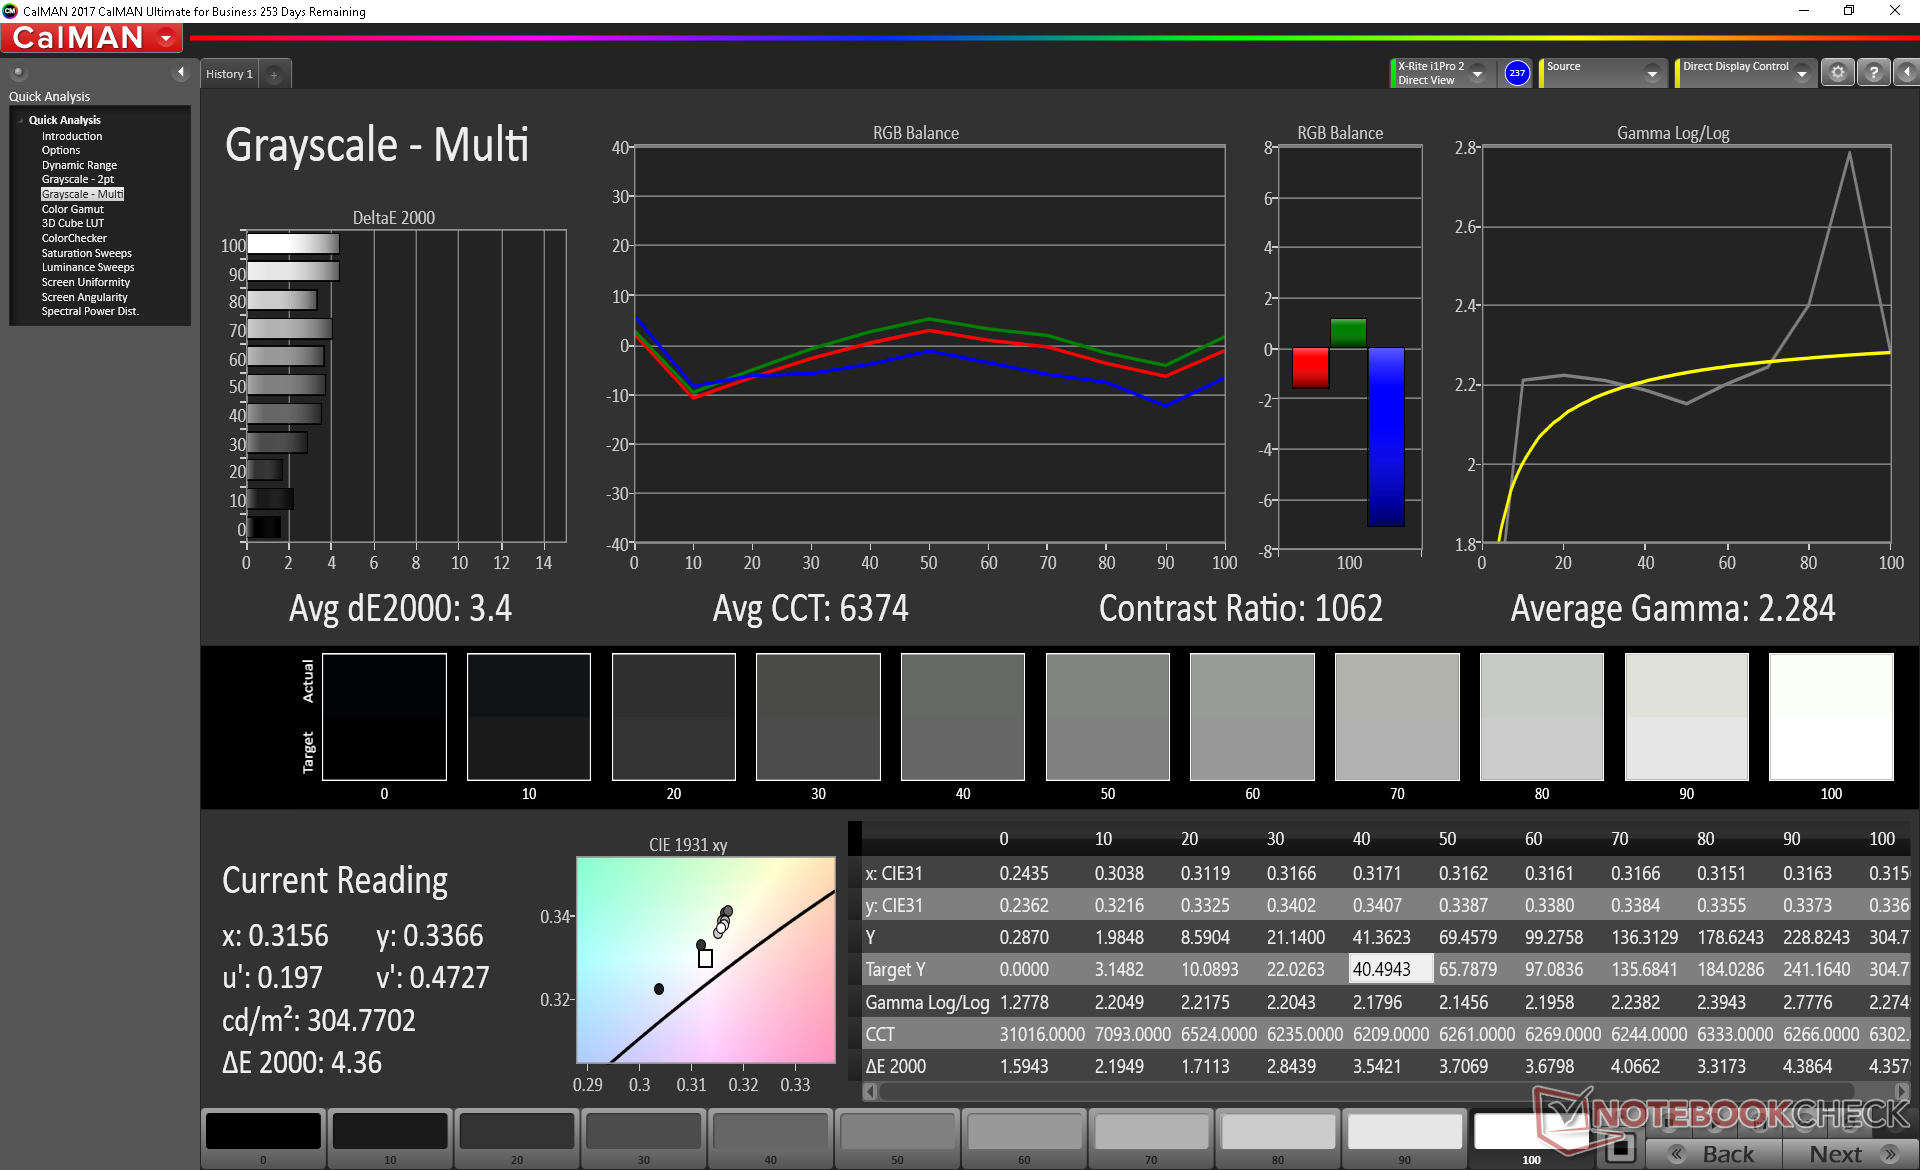
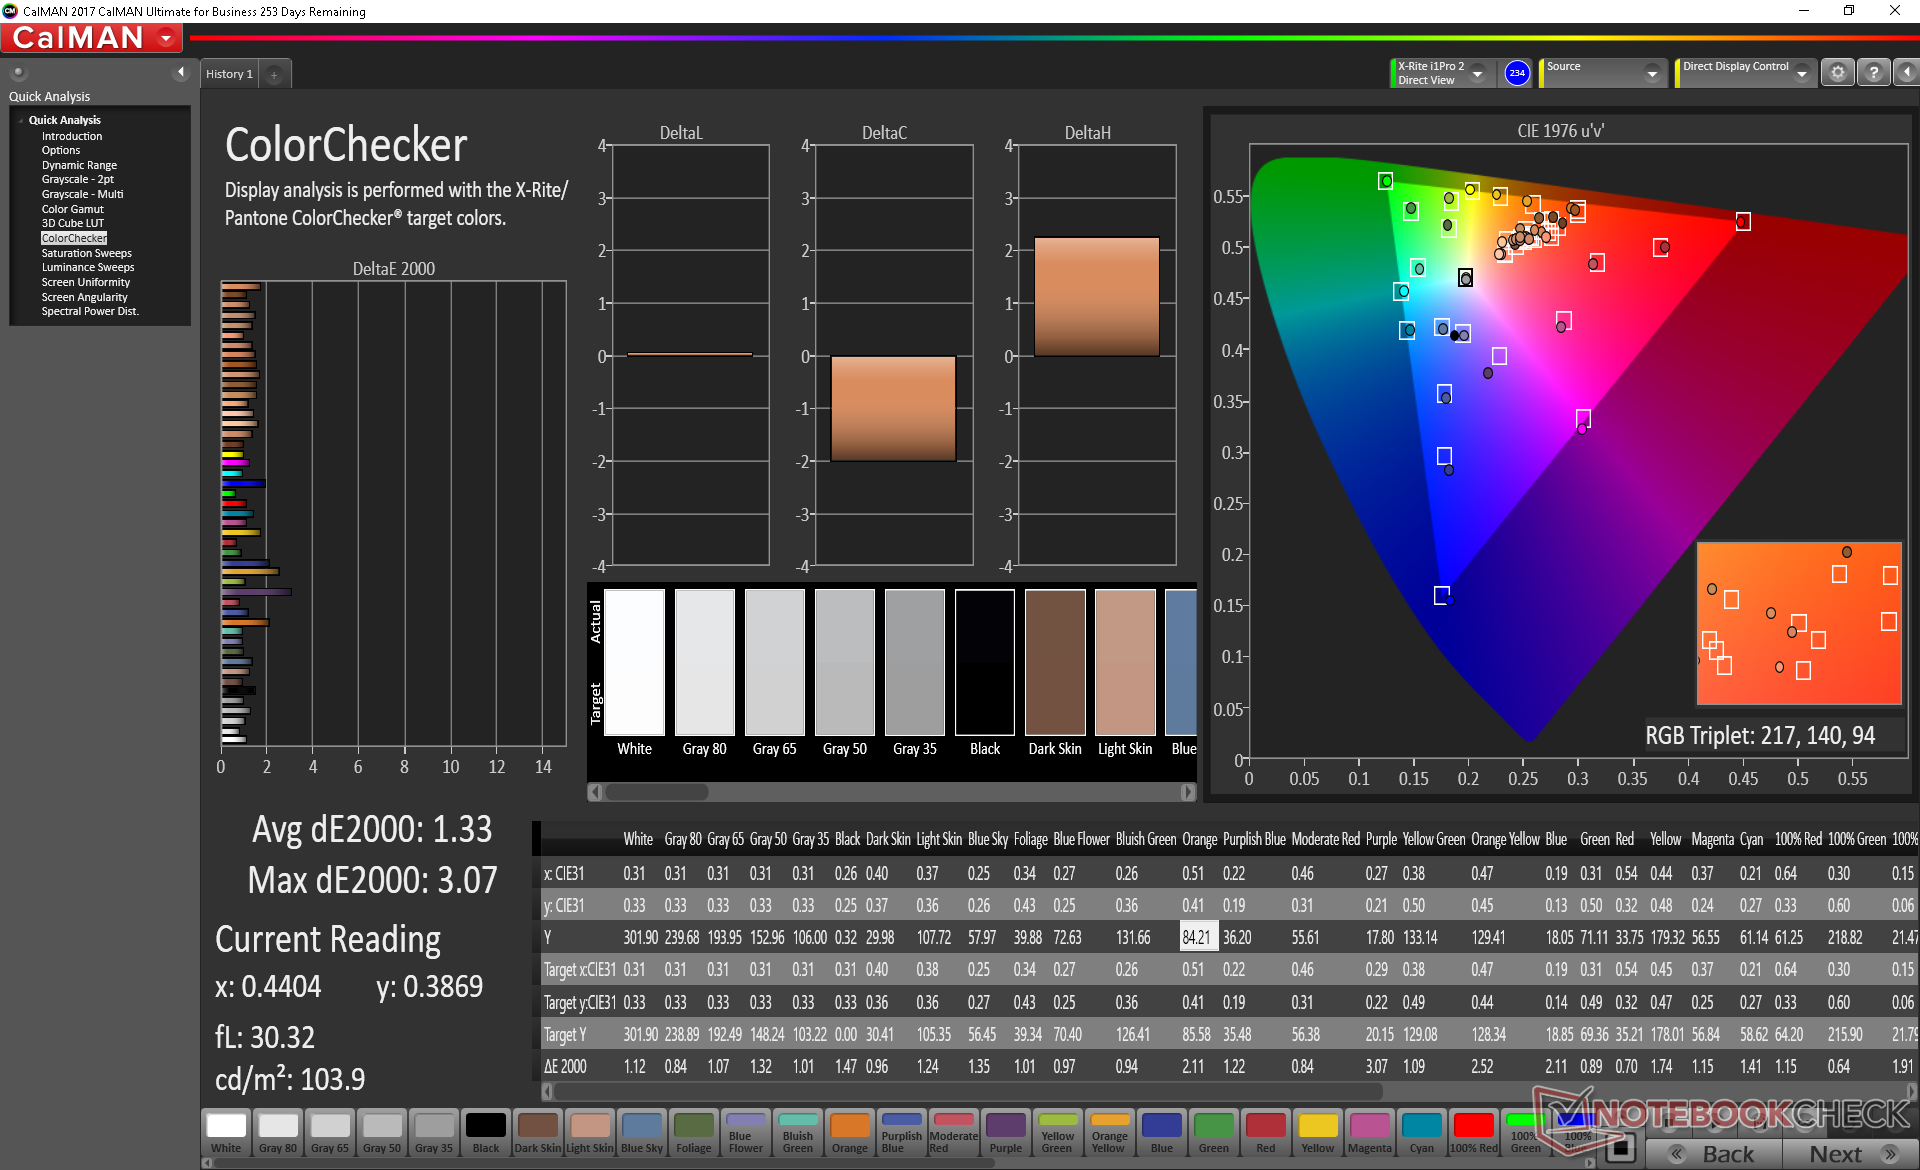
ΔE ColorChecker Calman: 2.58 | ∀{0.5-29.43 Ø4.73}
calibrated: 1.33
ΔE Greyscale Calman: 3.4 | ∀{0.09-98 Ø4.97}
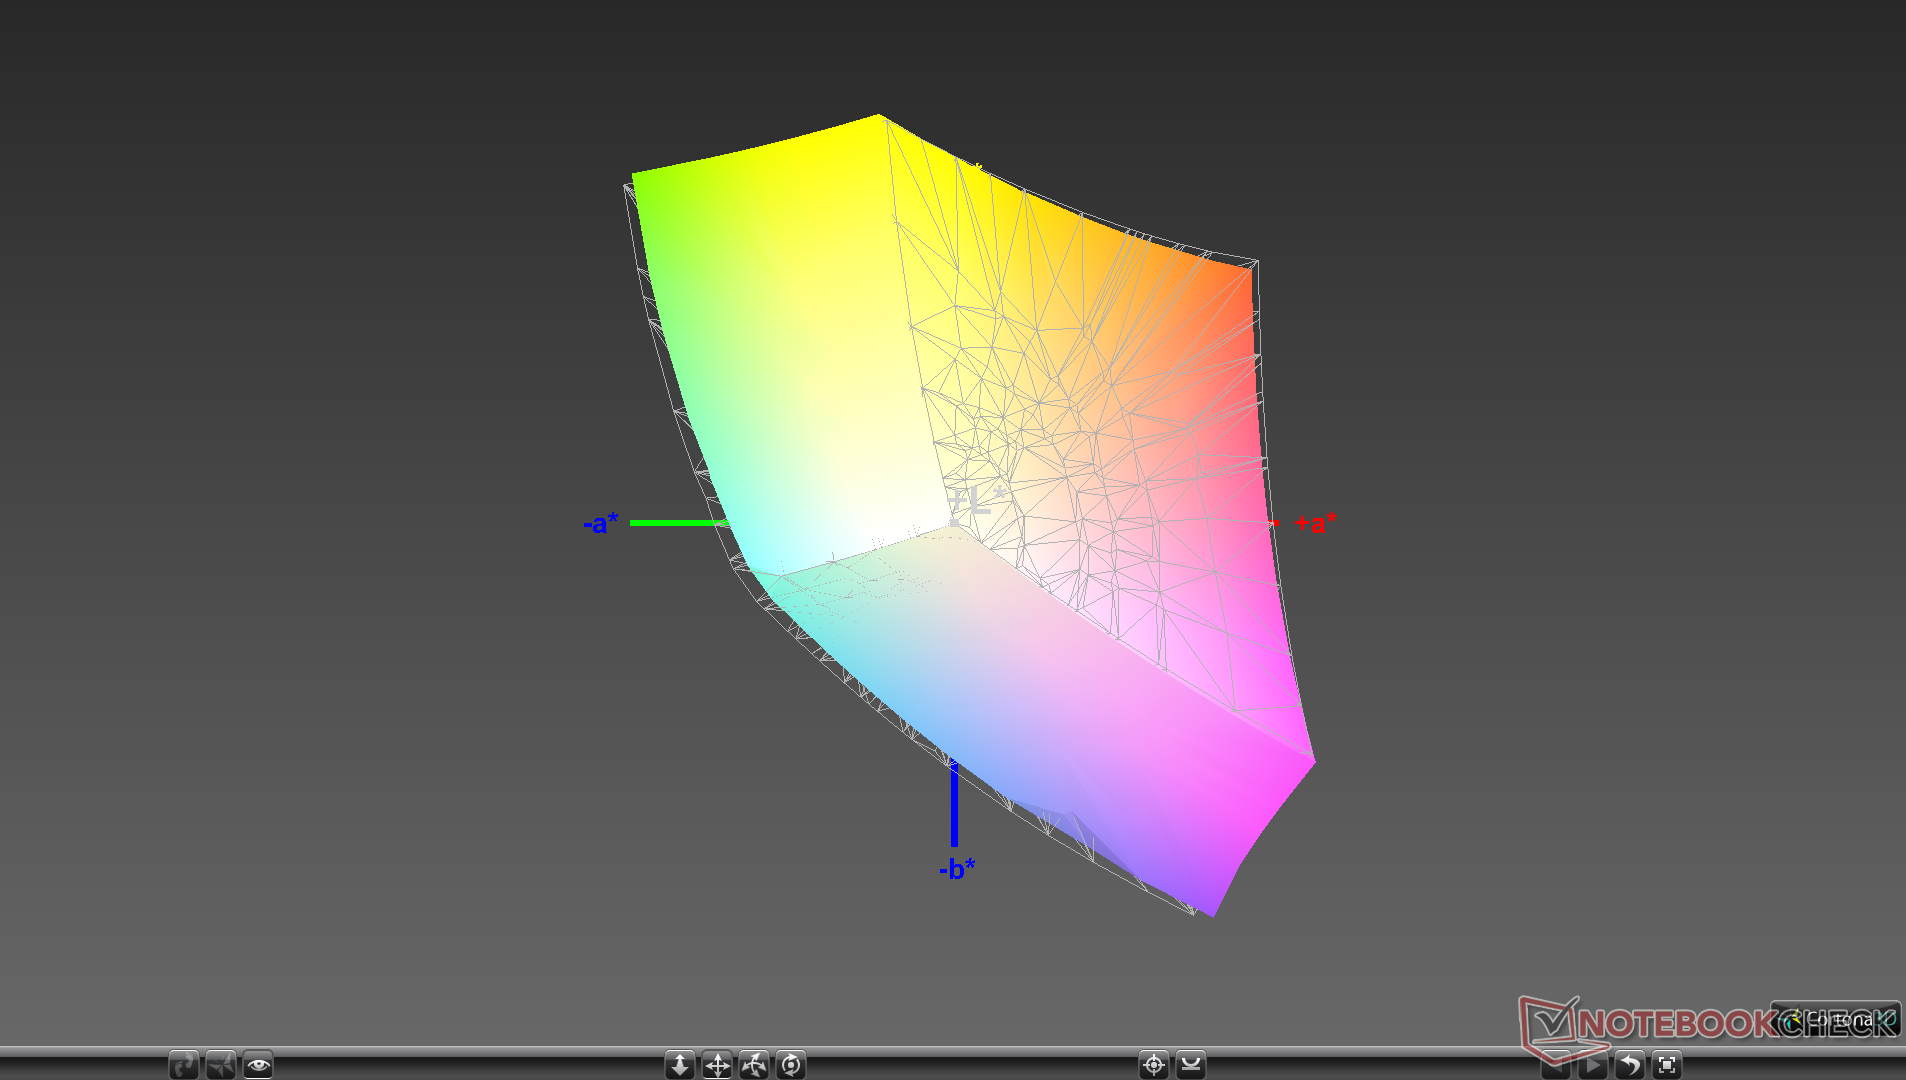
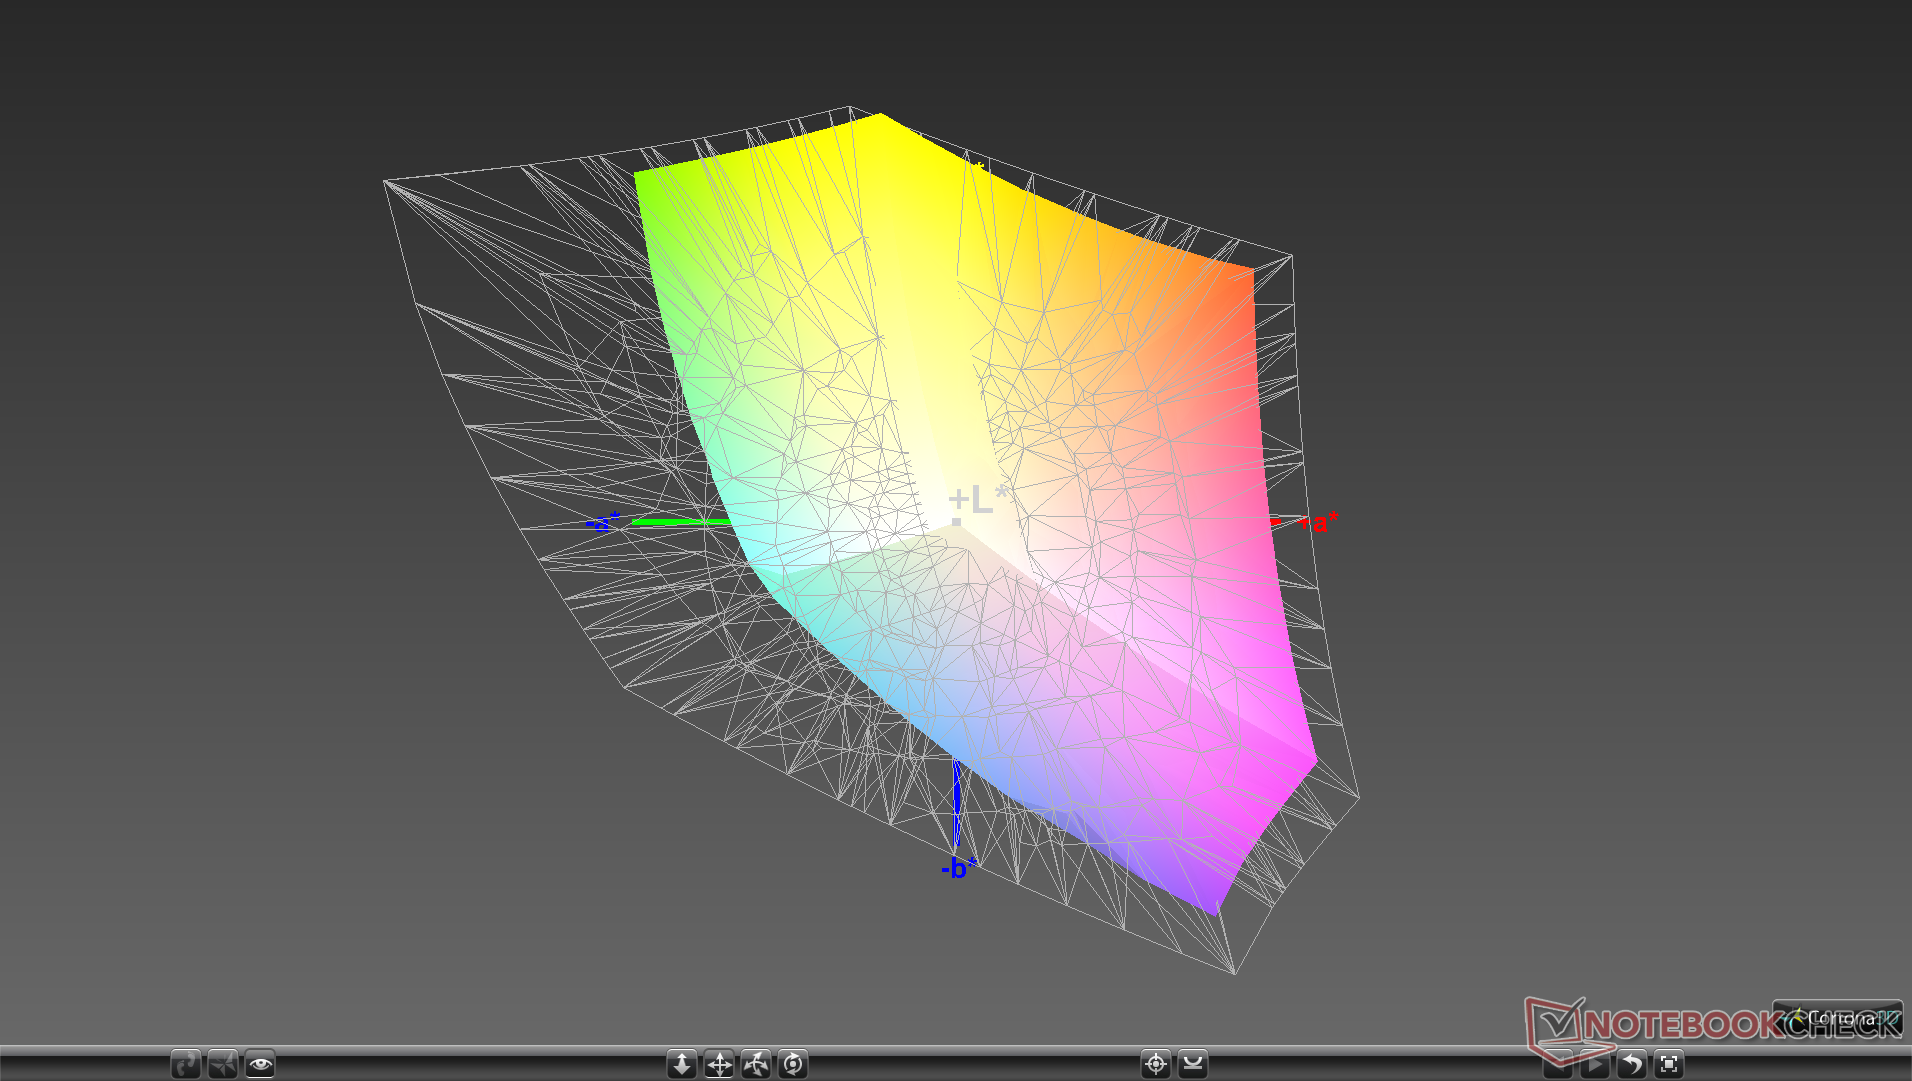
95.2% sRGB (Argyll 1.6.3 3D)
60.7% AdobeRGB 1998 (Argyll 1.6.3 3D)
66.3% AdobeRGB 1998 (Argyll 3D)
95.6% sRGB (Argyll 3D)
64.9% Display P3 (Argyll 3D)
Gamma: 2.28
CCT: 6374 K
| Aorus 15 X9 LG Philips LP156WFG-SPB2, IPS, 15.6", 1920x1080 | Razer Blade 15 RTX 2070 Max-Q LG Philips LGD05C0, IPS, 15.6", 1920x1080 | Aorus X5 v8 AU Optronics B156HAN07.0 (AUO70ED), IPS, 15.6", 1920x1080 | Gigabyte Aero 15-X9 LGD05C0, IPS, 15.6", 1920x1080 | MSI GS65 Stealth Thin 8RE-051US AUO80ED, IPS, 15.6", 1920x1080 | Alienware m15 GTX 1070 Max-Q AU Optronics B156HAN, IPS, 15.6", 1920x1080 | |
|---|---|---|---|---|---|---|
| Display | 0% | 1% | -3% | -1% | -4% | |
| Display P3 Coverage (%) | 64.9 | 65.3 1% | 67.1 3% | 63.5 -2% | 65.8 1% | 63.5 -2% |
| sRGB Coverage (%) | 95.6 | 94.9 -1% | 93.4 -2% | 93.1 -3% | 92.1 -4% | 89.4 -6% |
| AdobeRGB 1998 Coverage (%) | 66.3 | 66.3 0% | 68.1 3% | 64.5 -3% | 67 1% | 64.5 -3% |
| Response Times | -3% | -11% | -9% | -15% | -8% | |
| Response Time Grey 50% / Grey 80% * (ms) | 15.2 ? | 16.8 ? -11% | 18.8 ? -24% | 16.4 ? -8% | 20 ? -32% | 18 ? -18% |
| Response Time Black / White * (ms) | 12.4 ? | 11.6 ? 6% | 12 ? 3% | 13.6 ? -10% | 12 ? 3% | 12 ? 3% |
| PWM Frequency (Hz) | ||||||
| Screen | -4% | 14% | 12% | -17% | -24% | |
| Brightness middle (cd/m²) | 305.1 | 314.7 3% | 271 -11% | 250 -18% | 250.9 -18% | 353.6 16% |
| Brightness (cd/m²) | 295 | 312 6% | 259 -12% | 235 -20% | 257 -13% | 346 17% |
| Brightness Distribution (%) | 78 | 90 15% | 87 12% | 85 9% | 83 6% | 86 10% |
| Black Level * (cd/m²) | 0.33 | 0.38 -15% | 0.27 18% | 0.29 12% | 0.32 3% | 0.3 9% |
| Contrast (:1) | 925 | 828 -10% | 1004 9% | 862 -7% | 784 -15% | 1179 27% |
| Colorchecker dE 2000 * | 2.58 | 2.56 1% | 1.81 30% | 1.46 43% | 2.77 -7% | 4.55 -76% |
| Colorchecker dE 2000 max. * | 4.32 | 4.89 -13% | 3.33 23% | 2.47 43% | 5.89 -36% | 7.91 -83% |
| Colorchecker dE 2000 calibrated * | 1.33 | 1.71 -29% | 2.5 -88% | 3.37 -153% | ||
| Greyscale dE 2000 * | 3.4 | 3.4 -0% | 1.09 68% | 1.27 63% | 4 -18% | 4.1 -21% |
| Gamma | 2.28 96% | 2.3 96% | 2.45 90% | 2.4 92% | 2.27 97% | 2.27 97% |
| CCT | 6374 102% | 6435 101% | 6435 101% | 6749 96% | 6901 94% | 7434 87% |
| Color Space (Percent of AdobeRGB 1998) (%) | 60.7 | 60.7 0% | 61 0% | 60 -1% | 60 -1% | 57.9 -5% |
| Color Space (Percent of sRGB) (%) | 95.2 | 94.6 -1% | 93 -2% | 93 -2% | 92 -3% | 88.9 -7% |
| Total Average (Program / Settings) | -2% /
-3% | 1% /
8% | 0% /
6% | -11% /
-14% | -12% /
-18% |
* ... smaller is better
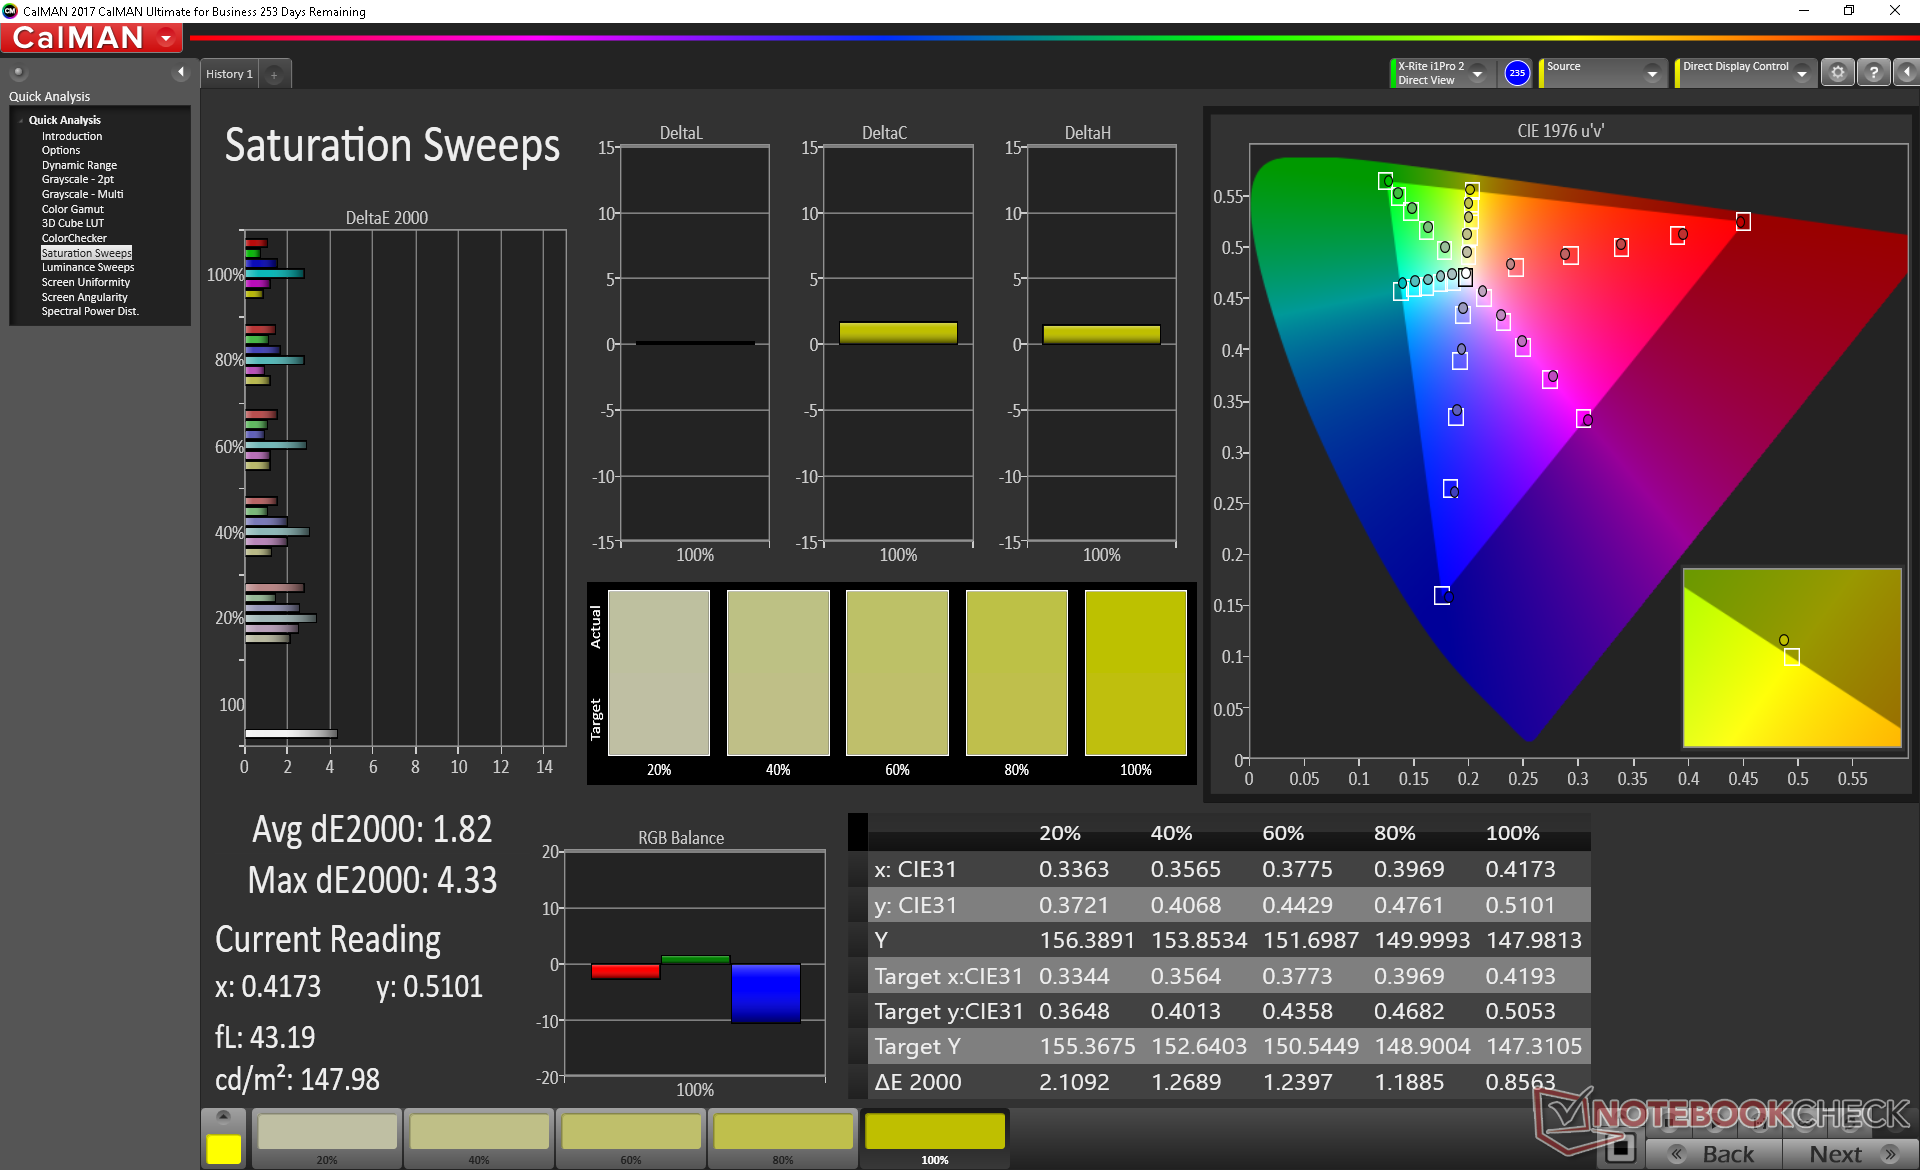
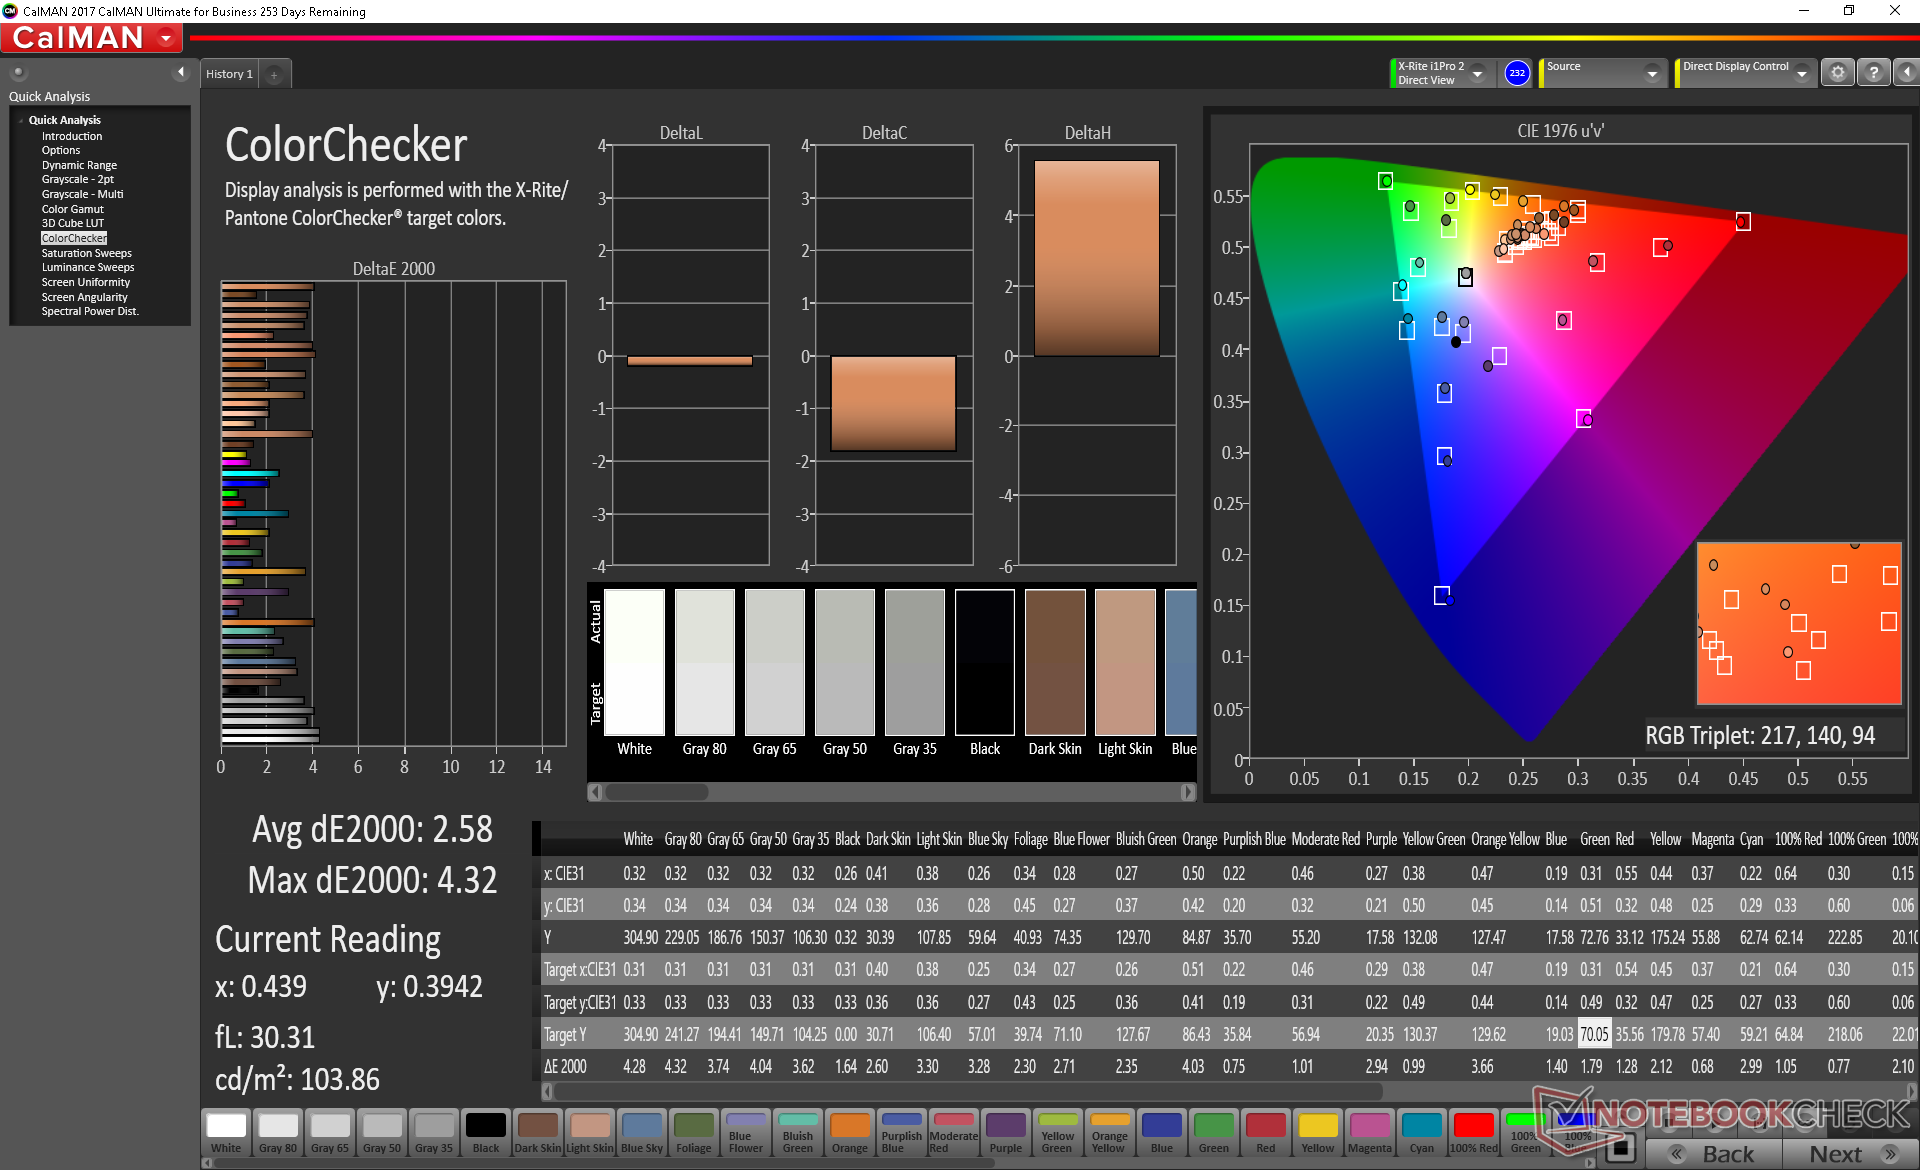
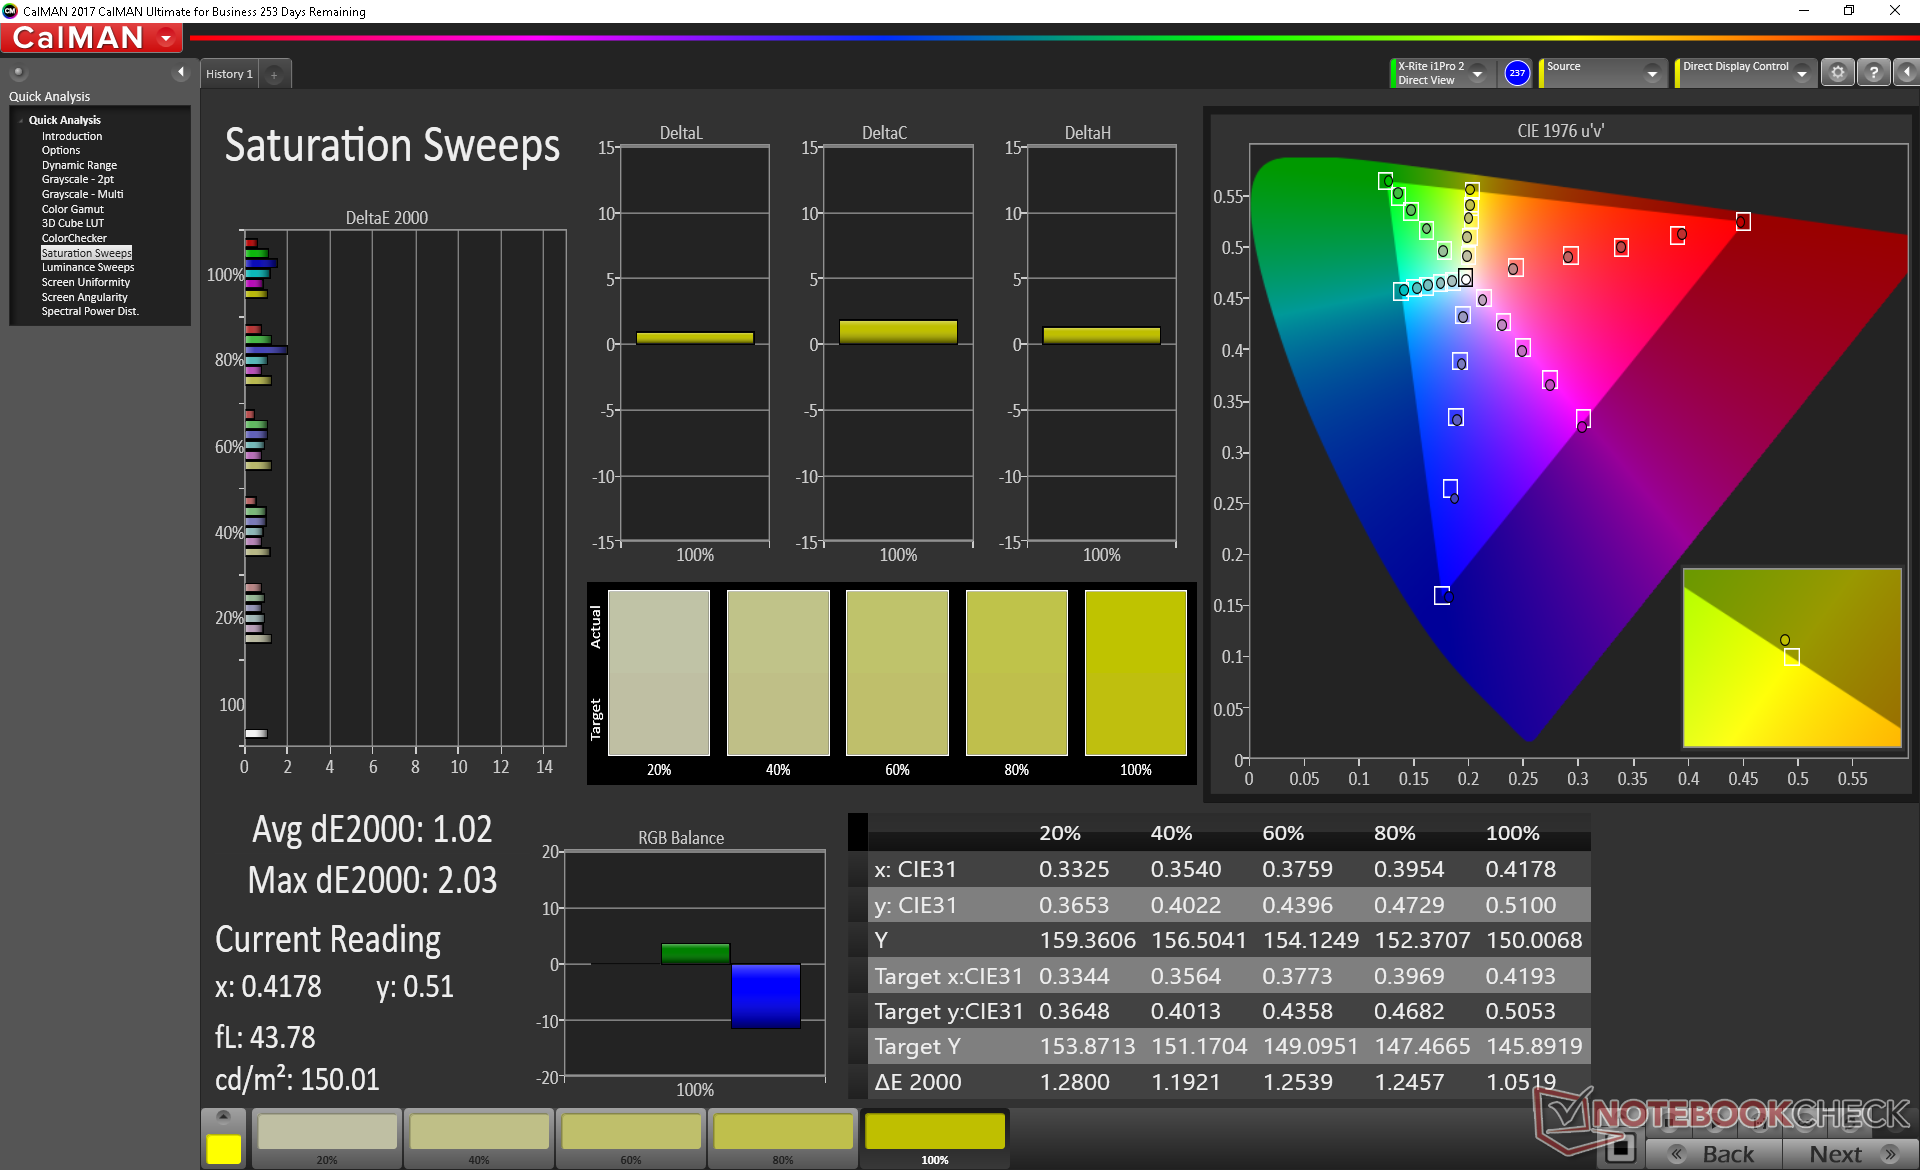
Color space is approximately 60 percent and 95 percent of the AdobeRGB and sRGB standards, respectively, to be nearly identical to the FHD Aero 15 and many other gaming laptops with fast 144 Hz IPS panels. High refresh rate panels with wider gamuts are still not widely available for this particular screen size.
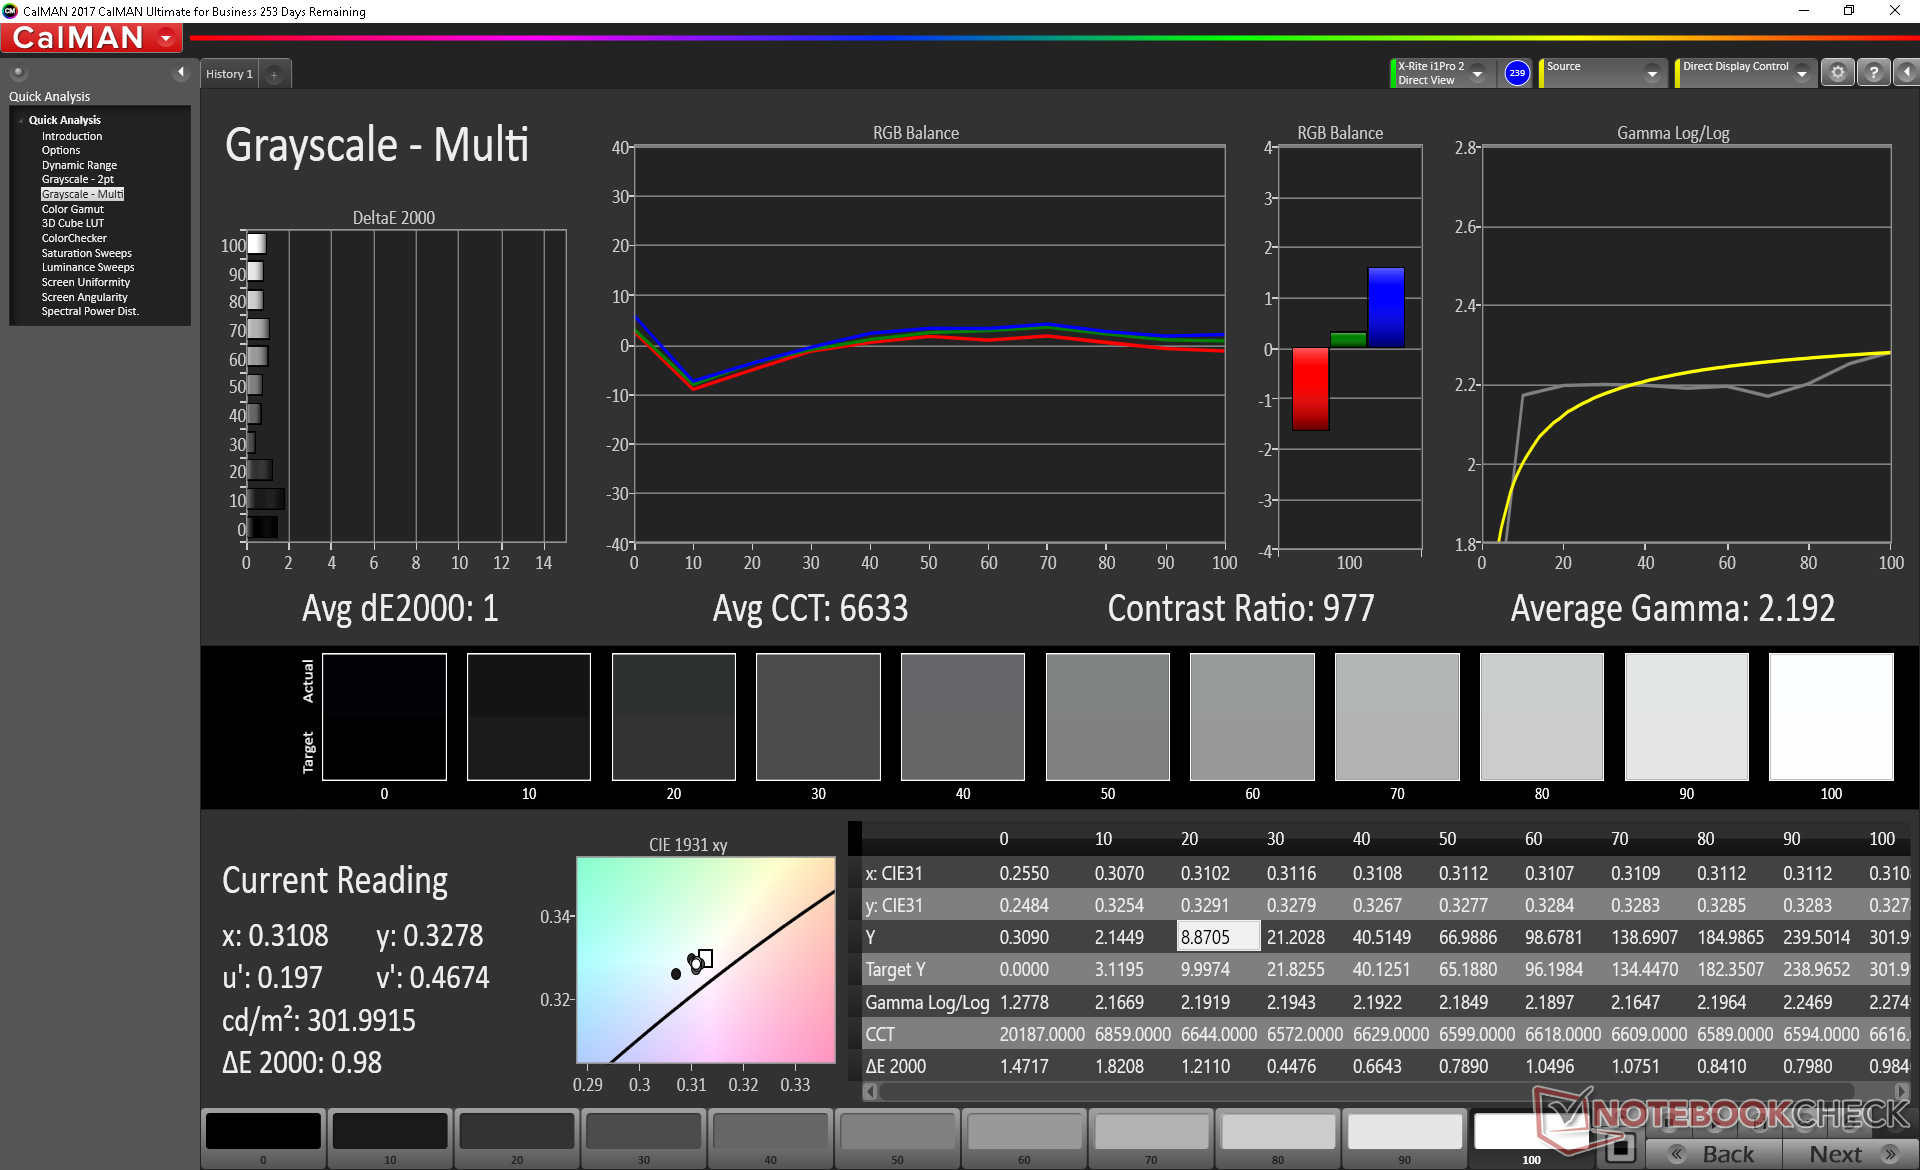
Measurements with an X-Rite colorimeter show a color accurate display out of the box. Nonetheless, we're able to marginally improve the display even further through our own calibration. Our final results bring down the average grayscale and color dE values from 3.4 and 2.58 to 1.0 and 1.33, respectively.
Display Response Times
| ↔ Response Time Black to White | ||
|---|---|---|
| 12.4 ms ... rise ↗ and fall ↘ combined | ↗ 7.6 ms rise | 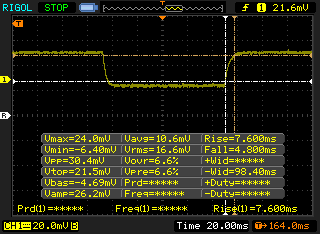 |
| ↘ 4.8 ms fall | ||
| The screen shows good response rates in our tests, but may be too slow for competitive gamers. In comparison, all tested devices range from 0.1 (minimum) to 240 (maximum) ms. » 33 % of all devices are better. This means that the measured response time is better than the average of all tested devices (19.9 ms). | ||
| ↔ Response Time 50% Grey to 80% Grey | ||
| 15.2 ms ... rise ↗ and fall ↘ combined | ↗ 8.4 ms rise | 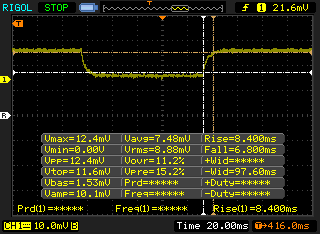 |
| ↘ 6.8 ms fall | ||
| The screen shows good response rates in our tests, but may be too slow for competitive gamers. In comparison, all tested devices range from 0.165 (minimum) to 636 (maximum) ms. » 29 % of all devices are better. This means that the measured response time is better than the average of all tested devices (31.1 ms). | ||
Screen Flickering / PWM (Pulse-Width Modulation)
| Screen flickering / PWM not detected | 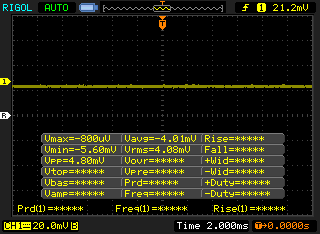 | ||
In comparison: 52 % of all tested devices do not use PWM to dim the display. If PWM was detected, an average of 7784 (minimum: 5 - maximum: 343500) Hz was measured. | |||
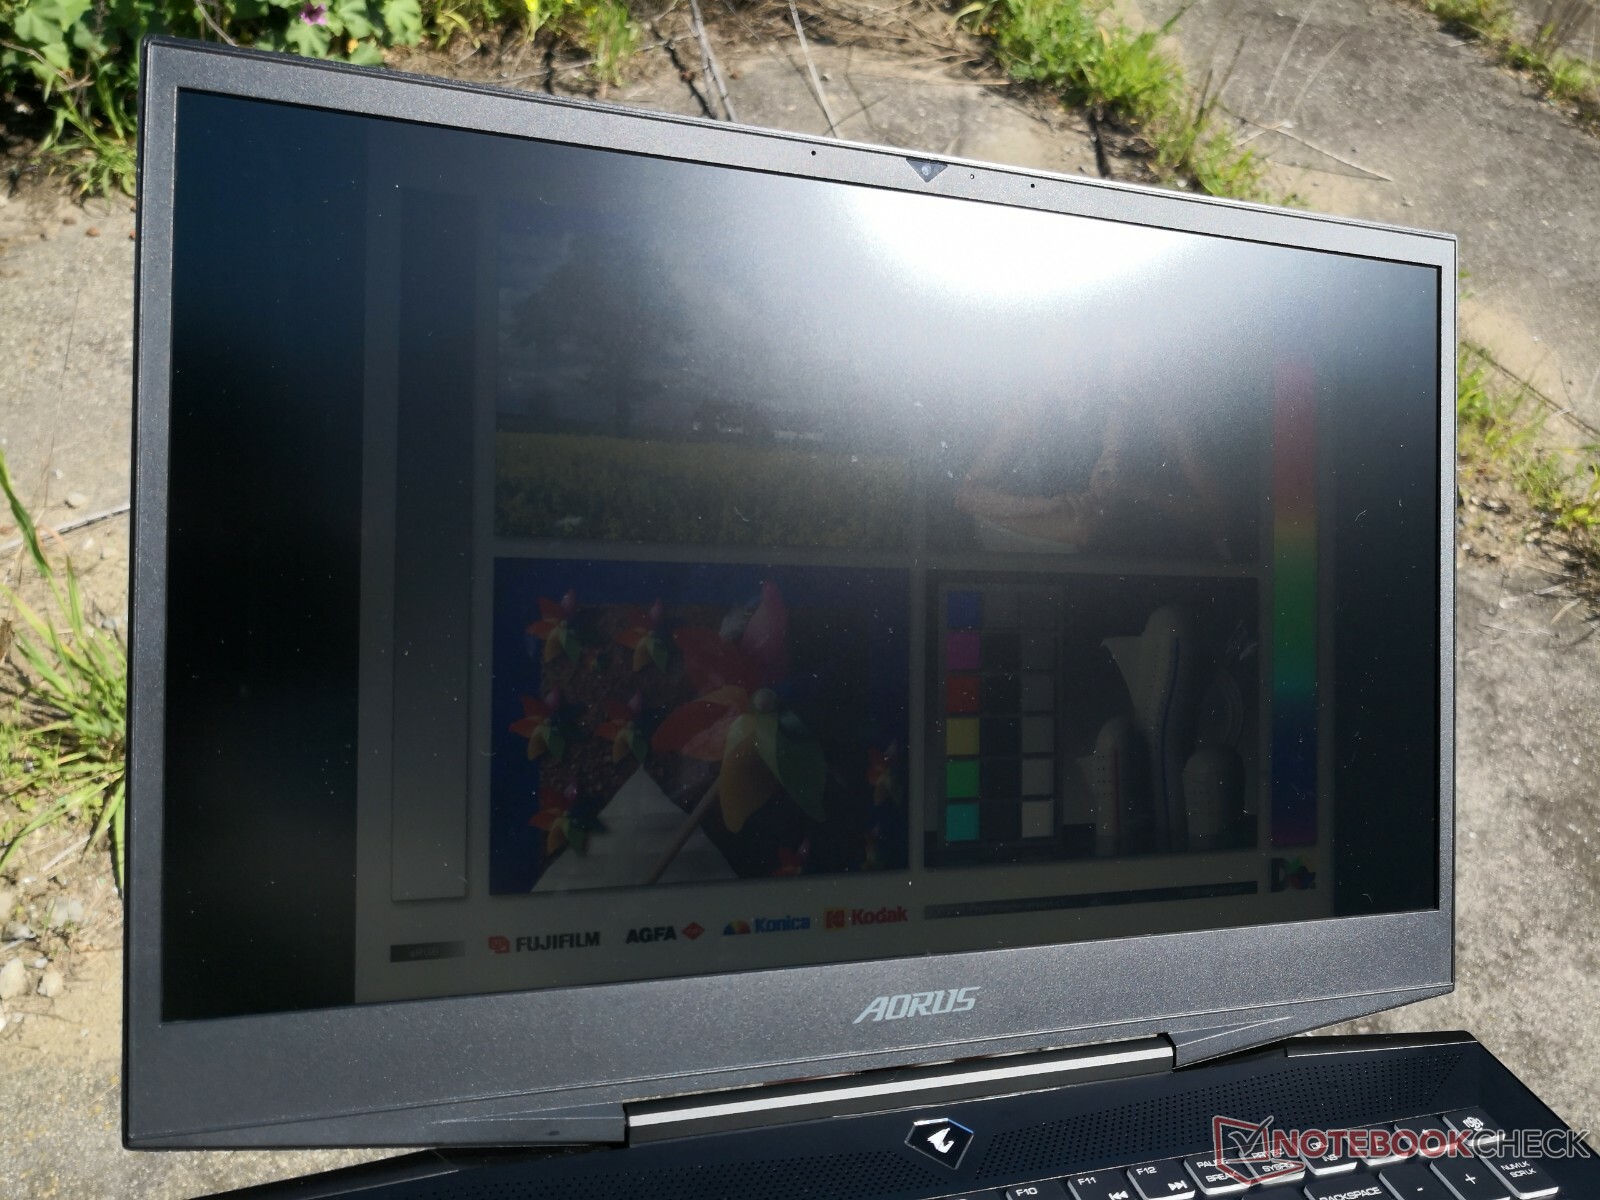
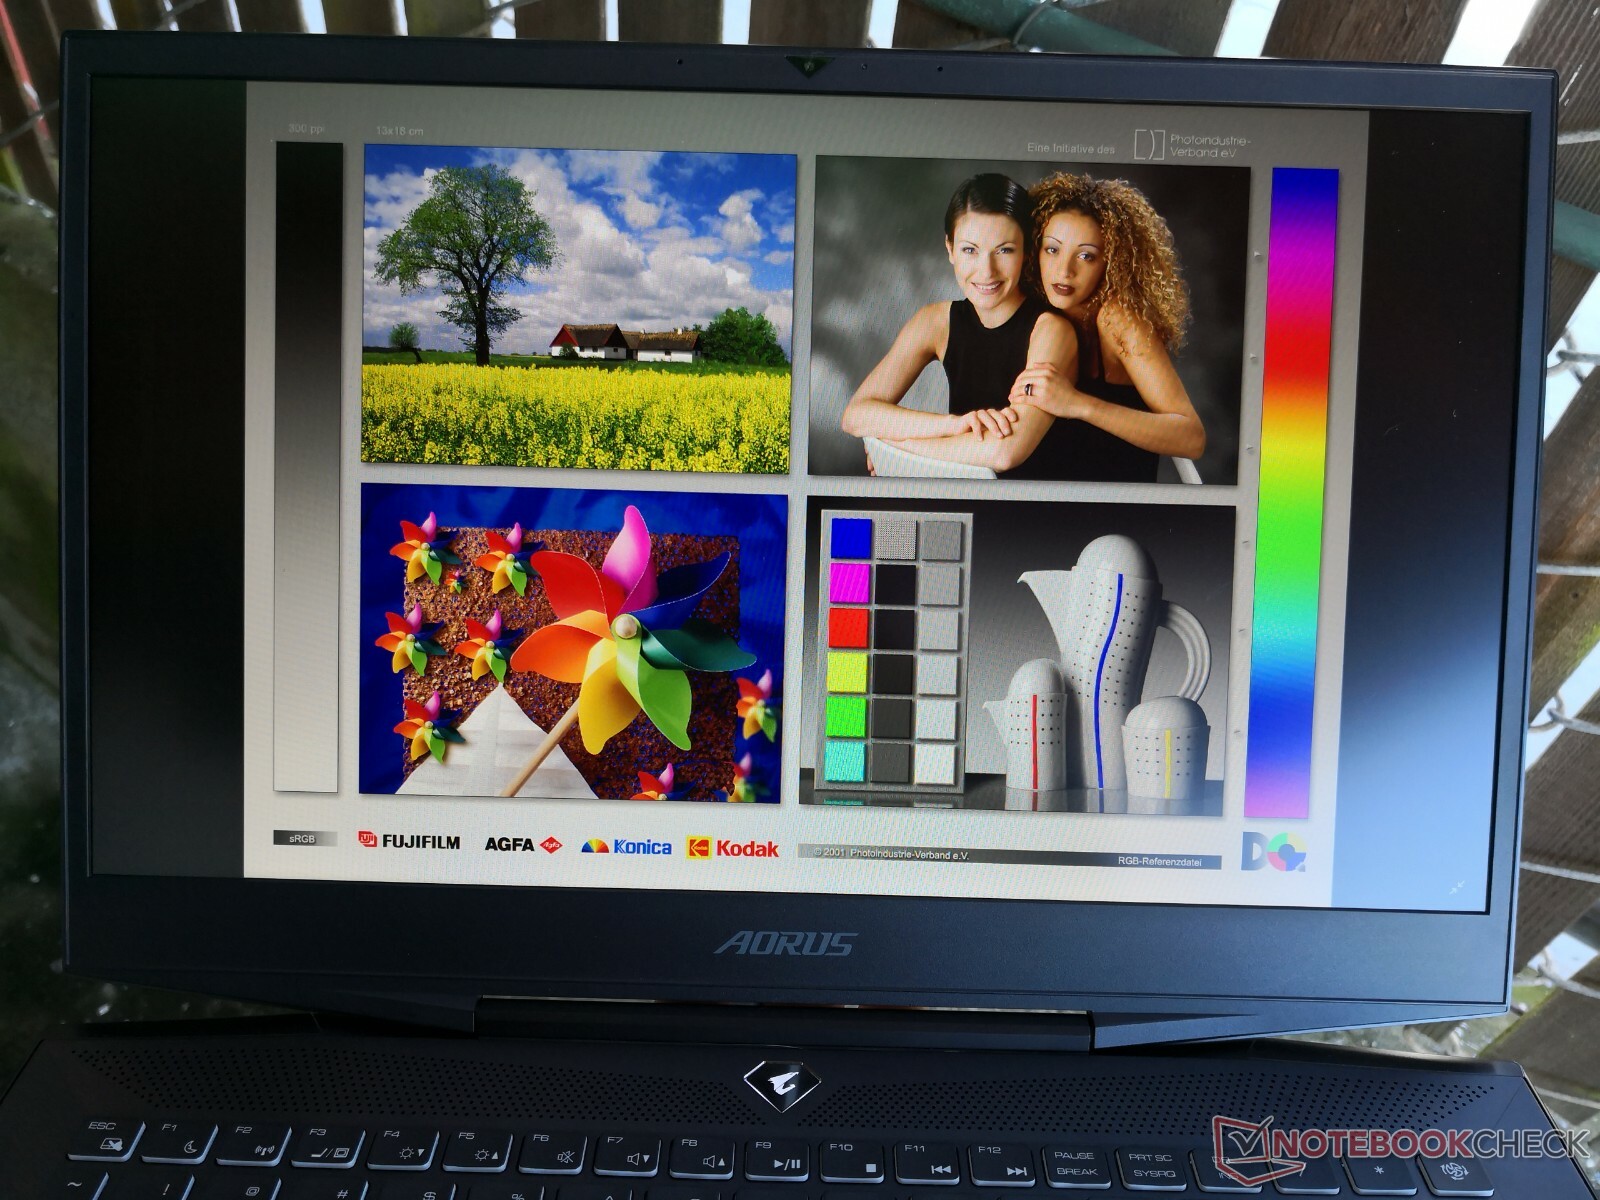
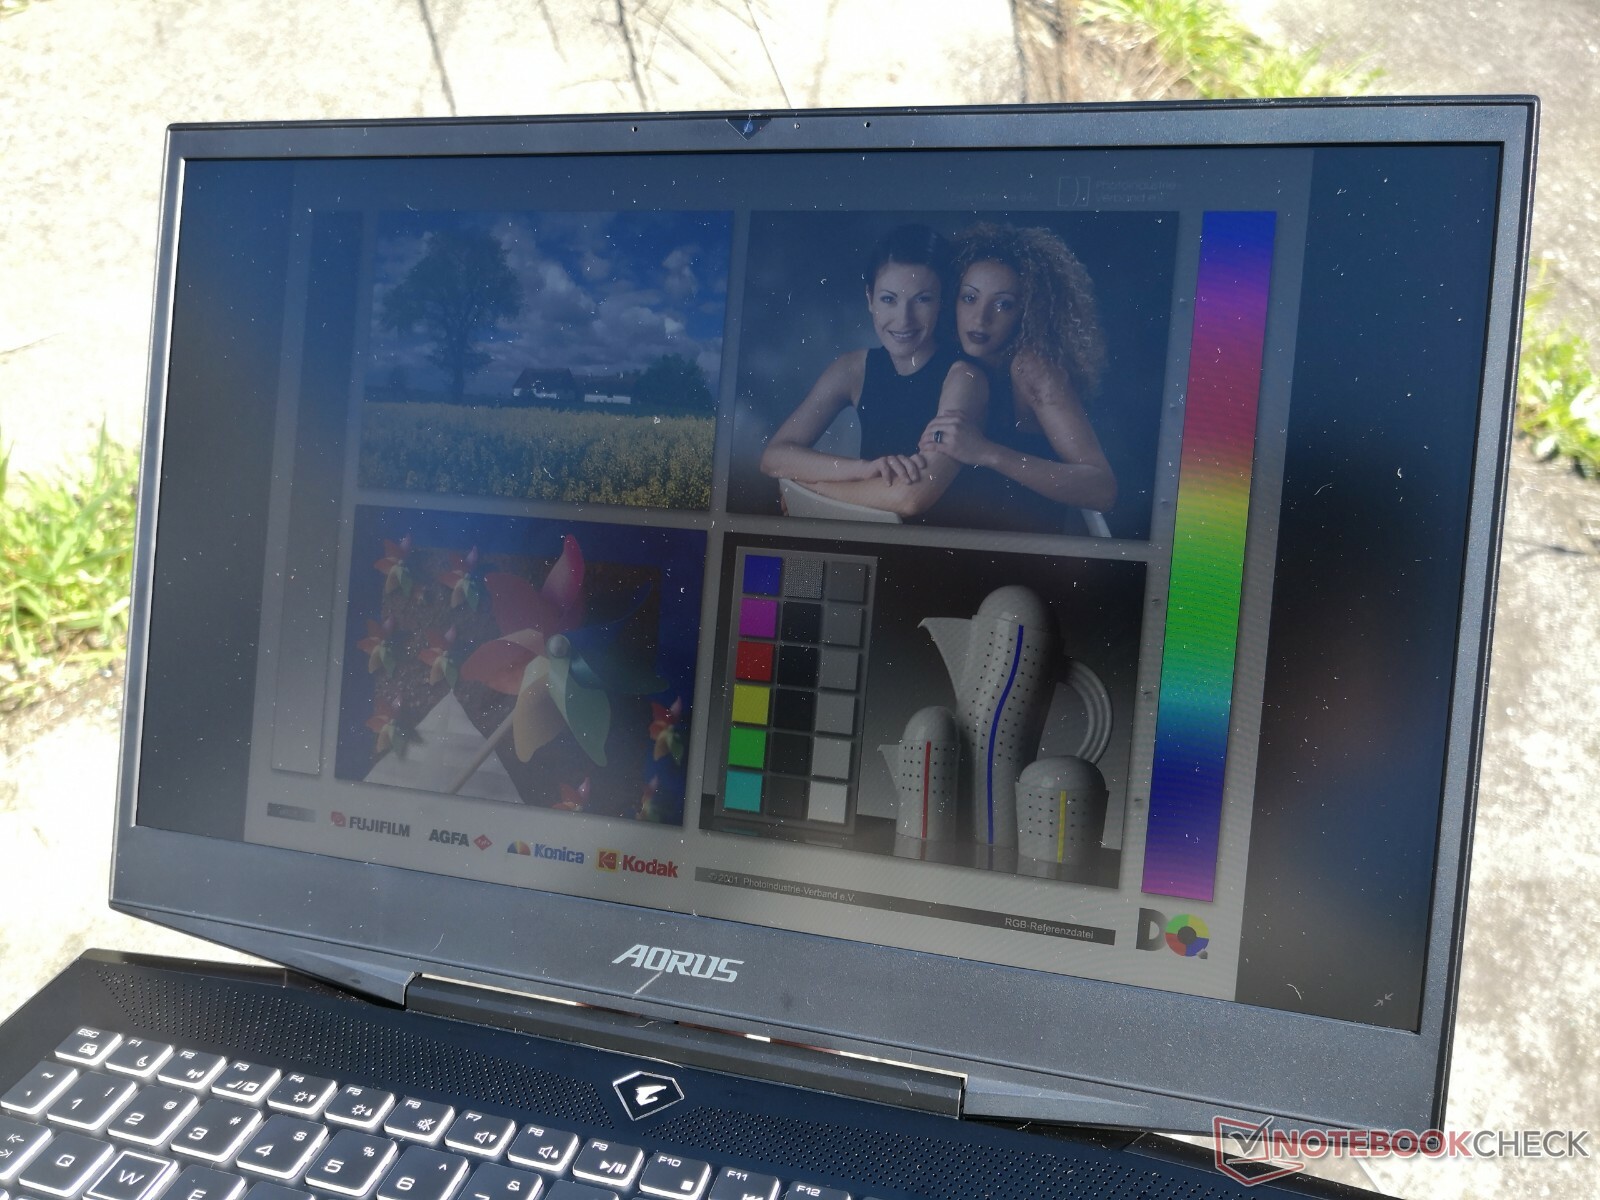
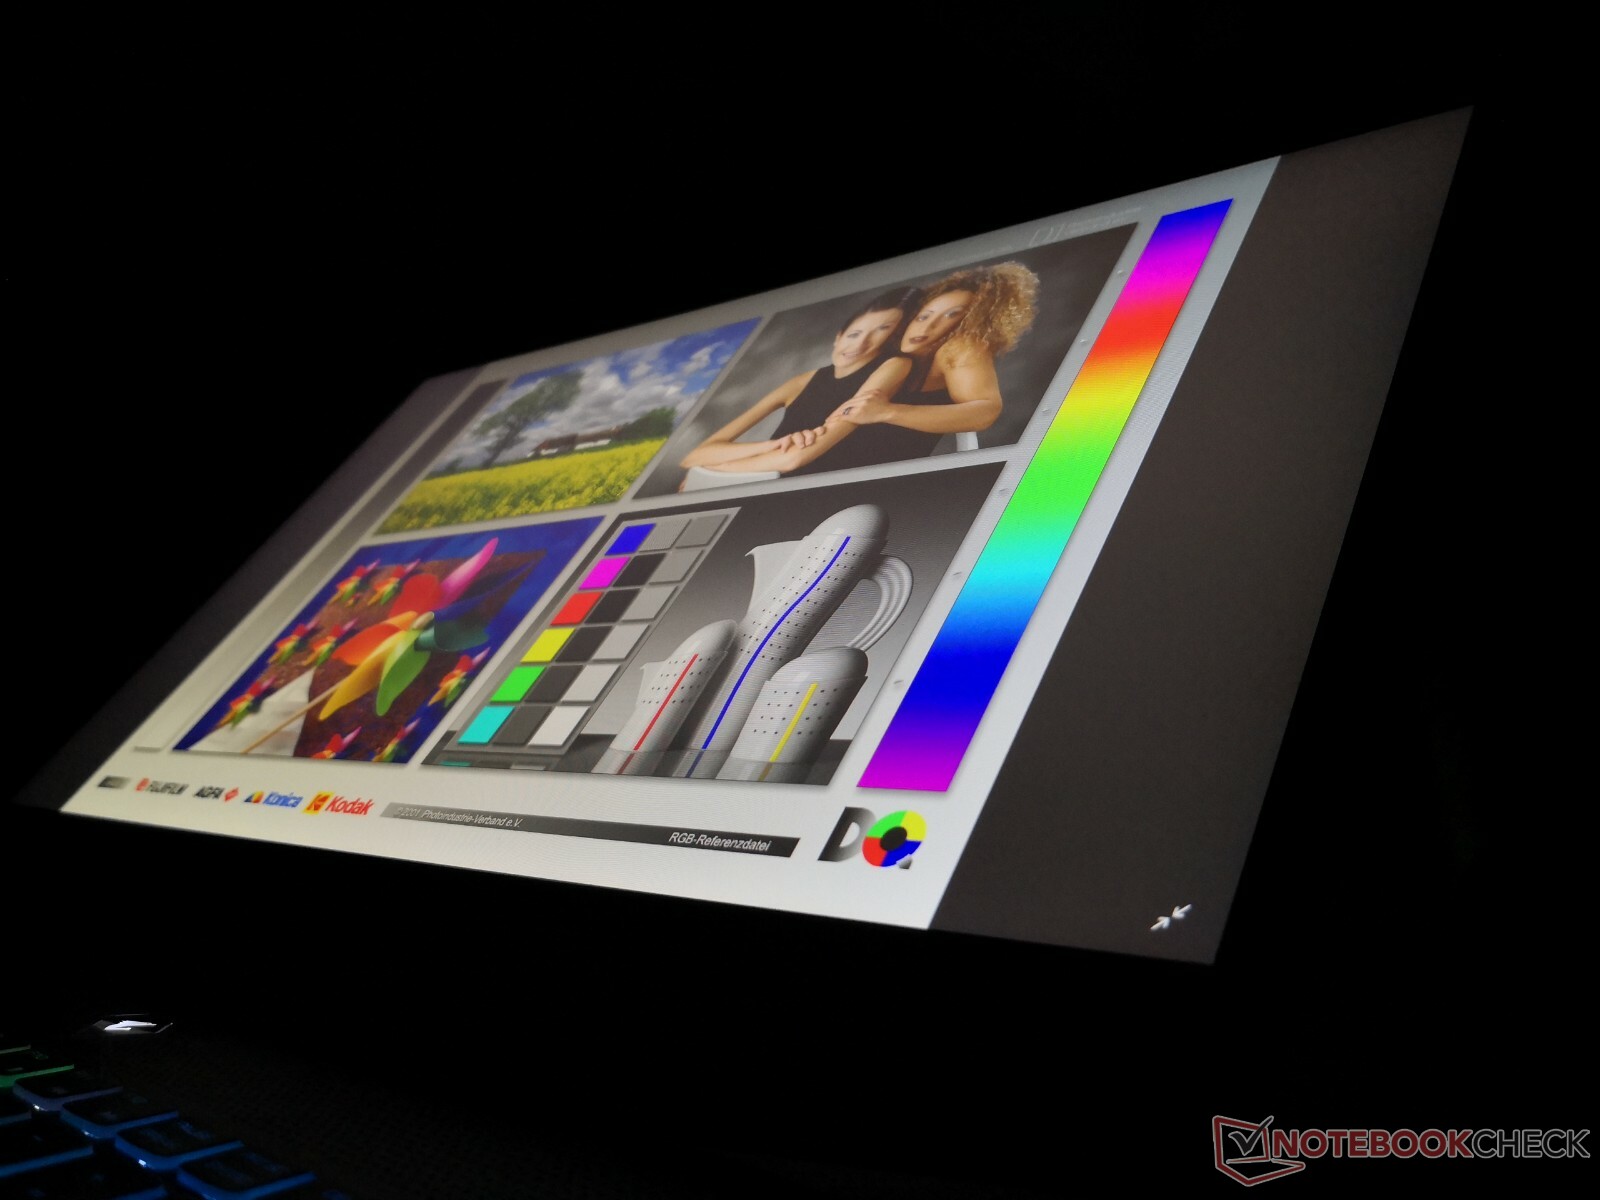
Outdoor visibility is not all that different from the Aorus X5. The display is a little brighter this time but it's not enough to make a real difference when under sunlight. Both the matte panel and wide viewing angles help to reduce glare.
Performance
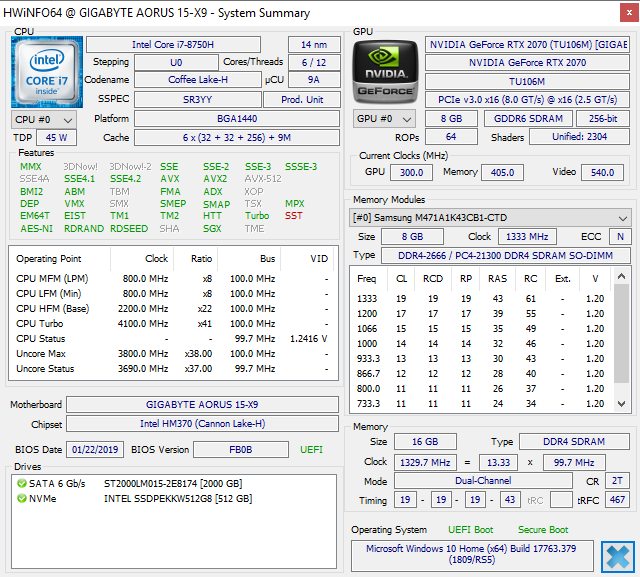
Unlike the Aorus X5 v8 and Gigabyte Aero 15 with the Core i7-8850H and Core i9-8950HK, respectively, all current SKUs of the Aorus 15 ship with the Core i7-8750H only. This particular Coffee Lake-H CPU is very common amongst mainstream to high-end gaming laptops. There are no Max-Q or RTX 2080 or even Optimus options for now.
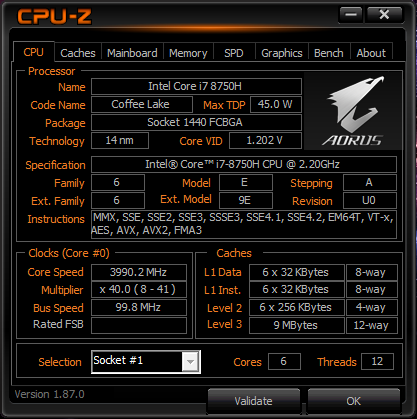
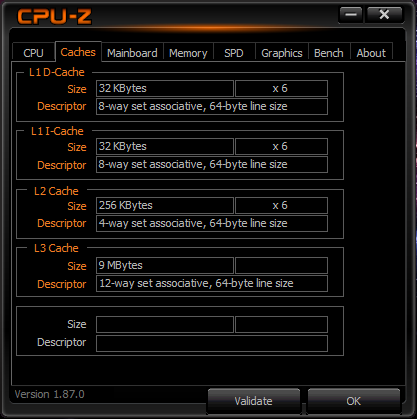
Processor
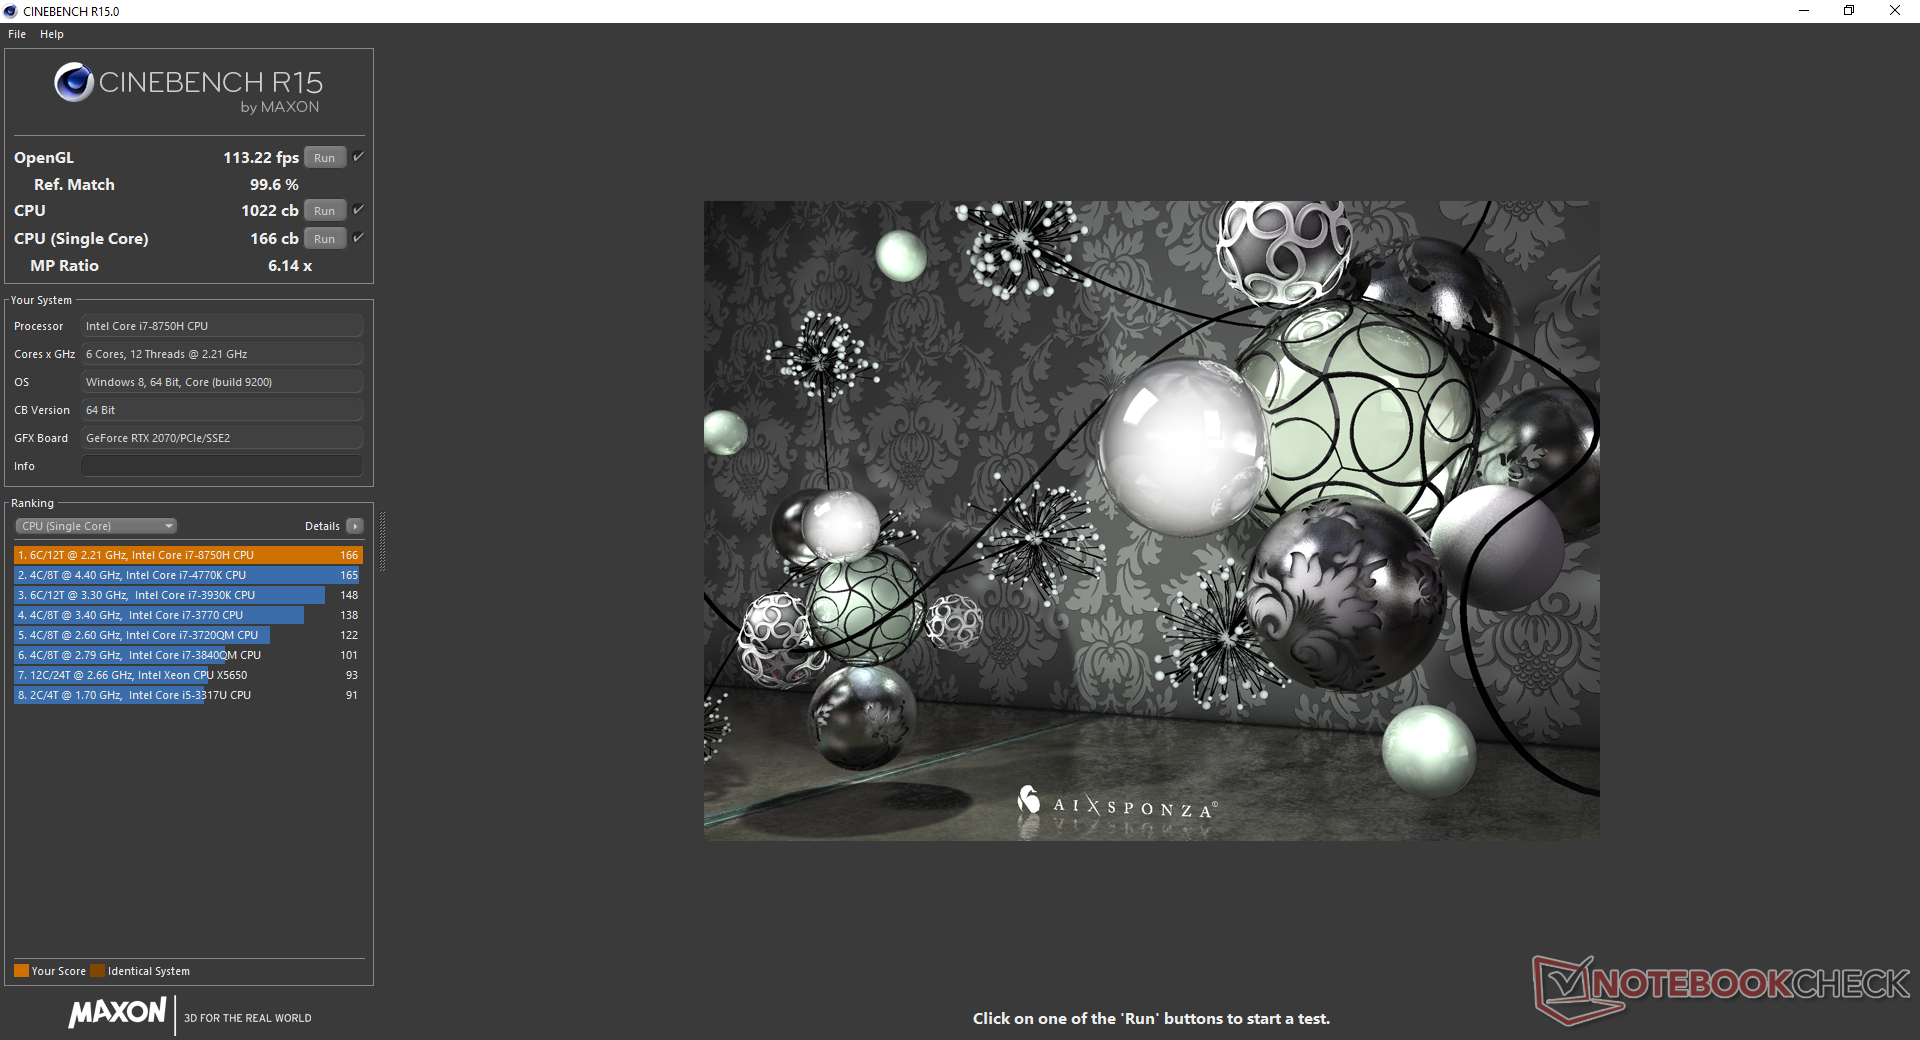
Multi-thread performance is about 8 percent slower than the average i7-8750H in our database taken from 75 other laptops. This is due to the more limited Turbo Boost potential of the chassis and so the Aorus will generally run at slightly slower clock rates than expected. When running CineBench R15 Multi-Thread in a loop, the initial high score of 1022 points drops to 959 points by the second loop and it never recovers from there. Both the MSI GS65 and Aero 15-X9 are able to run the same processor at slightly faster clock rates for longer periods.
Raw multi-thread performance is still significantly faster than the Core i5-8300H and last generation Core i7-7700HQ by about 30 percent and 45 percent, respectively. Users aiming for stable 144 FPS, however, will want every ounce of CPU power they can get from the i7-8750H.
See our dedicated page on the Core i7-8750H for more technical information and benchmark comparisons.
| Cinebench R10 | |
| Rendering Multiple CPUs 32Bit | |
| Schenker XMG Ultra 15 Turing | |
| Gigabyte Aero 15-Y9 | |
| Aorus X5 v8 | |
| Average Intel Core i7-8750H (29664 - 35307, n=25) | |
| MSI GV62 8RE-016US | |
| Asus Strix GL703VM-DB74 | |
| Rendering Single 32Bit | |
| Schenker XMG Ultra 15 Turing | |
| Gigabyte Aero 15-Y9 | |
| Aorus X5 v8 | |
| Average Intel Core i7-8750H (6236 - 6645, n=25) | |
| MSI GV62 8RE-016US | |
| Asus Strix GL703VM-DB74 | |
| wPrime 2.10 - 1024m | |
| Asus Strix GL703VM-DB74 | |
| MSI GV62 8RE-016US | |
| Average Intel Core i7-8750H (125.5 - 180.5, n=6) | |
* ... smaller is better
System Performance
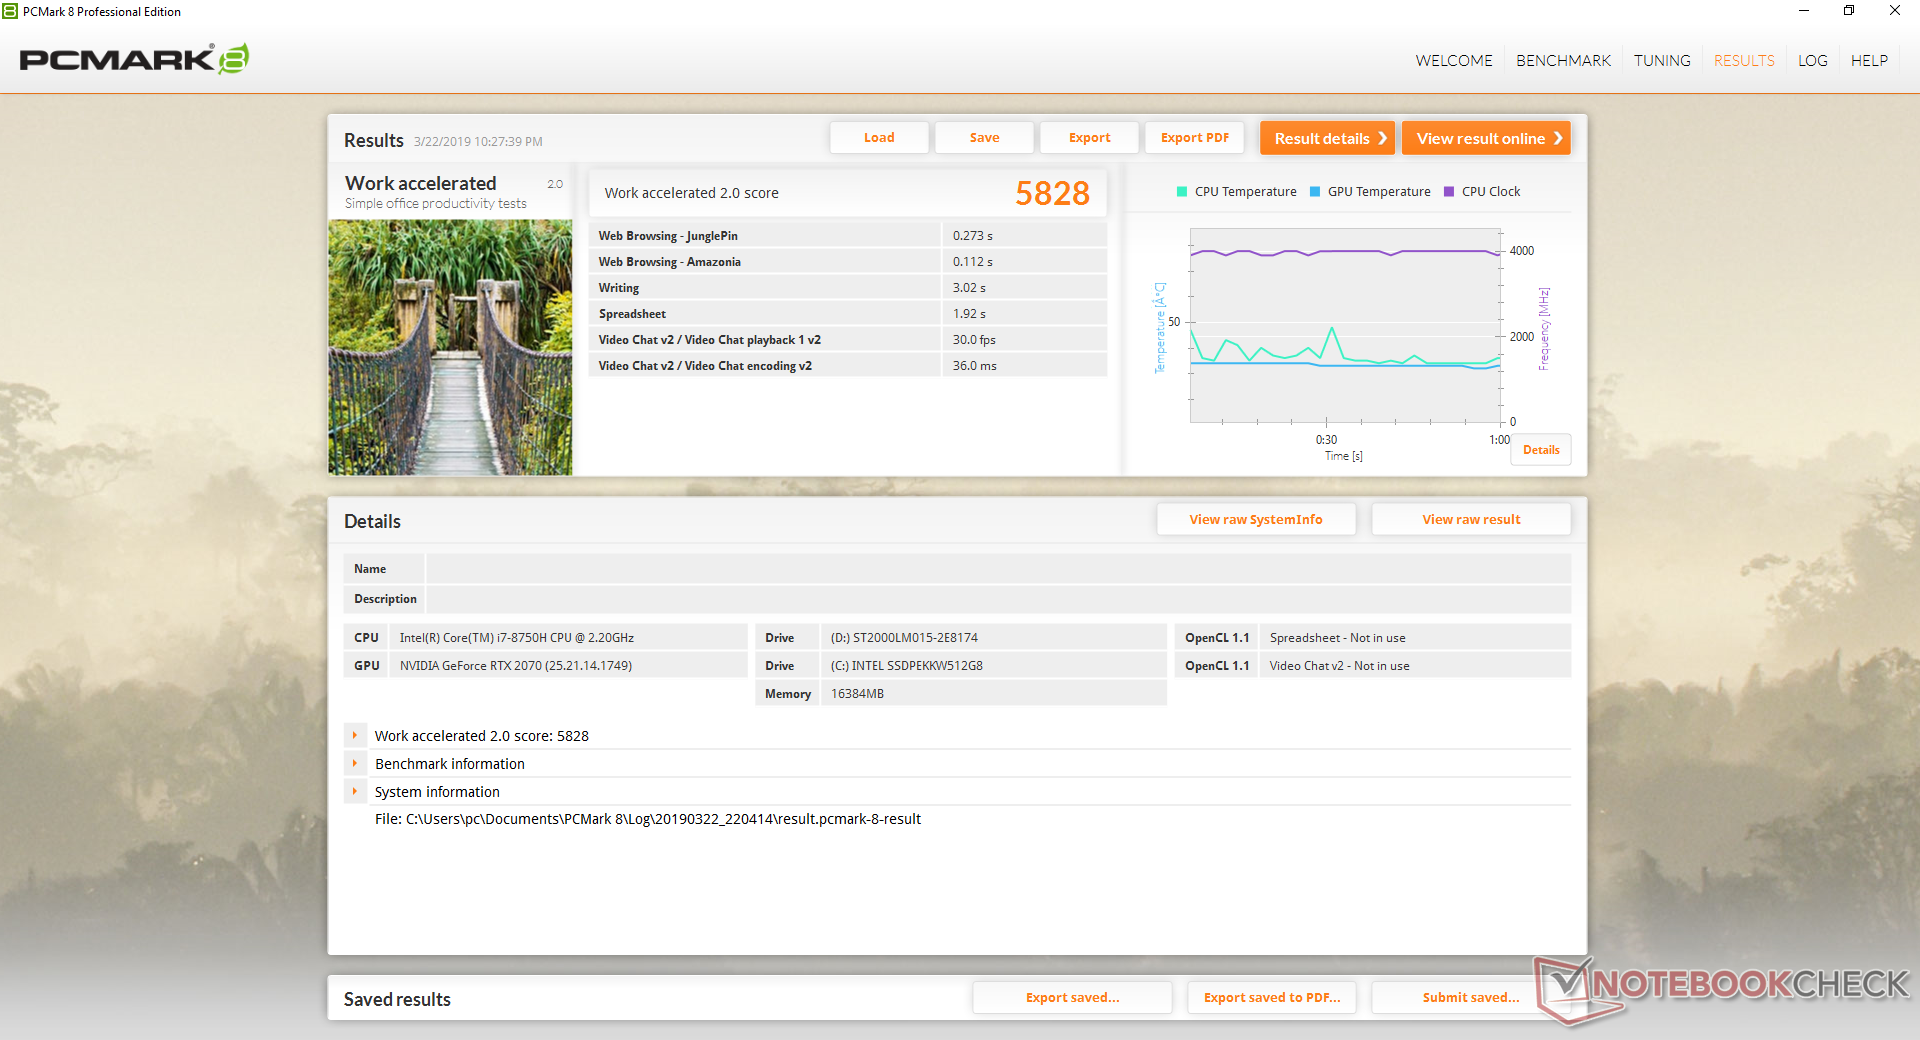
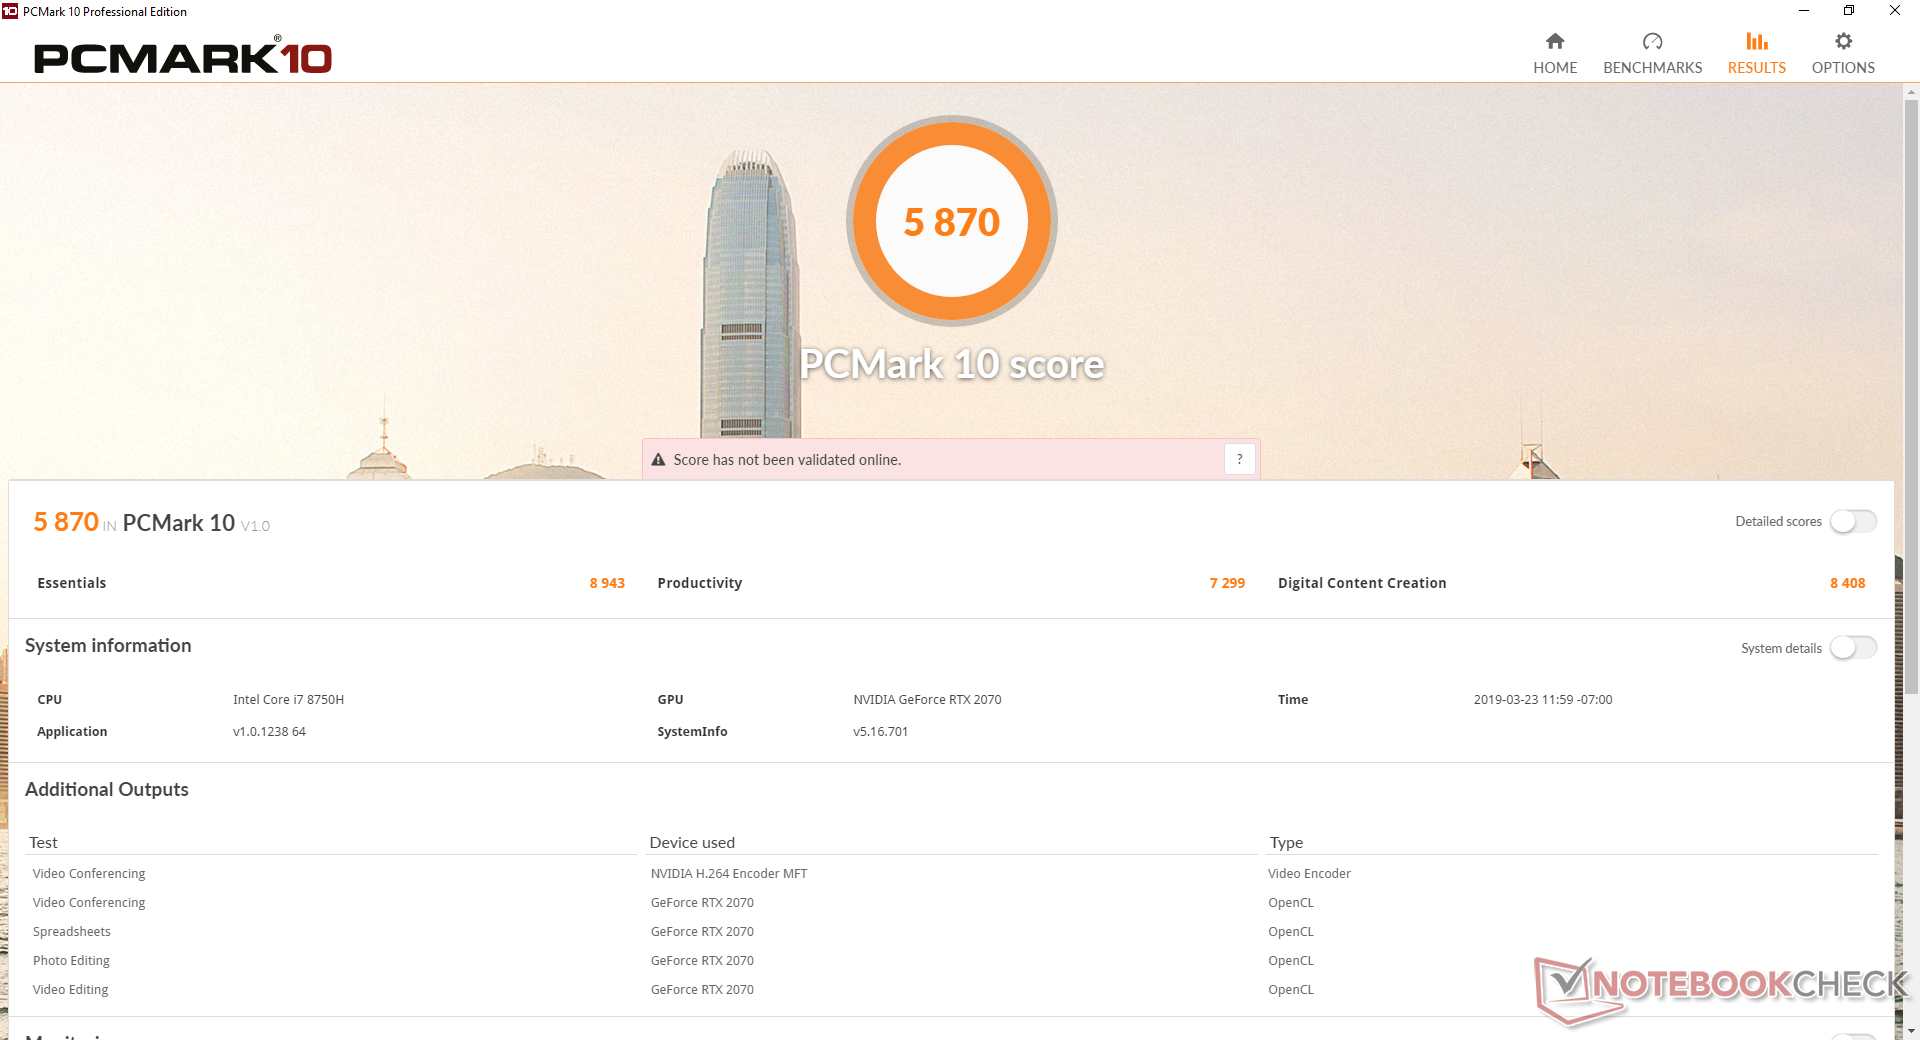
PCMark results are about where we expect them to be considering the CPU and GPU. The exception is its Digital Content Creation score which is particularly high at 16 percent over the similarly equipped Asus ROG GL704.
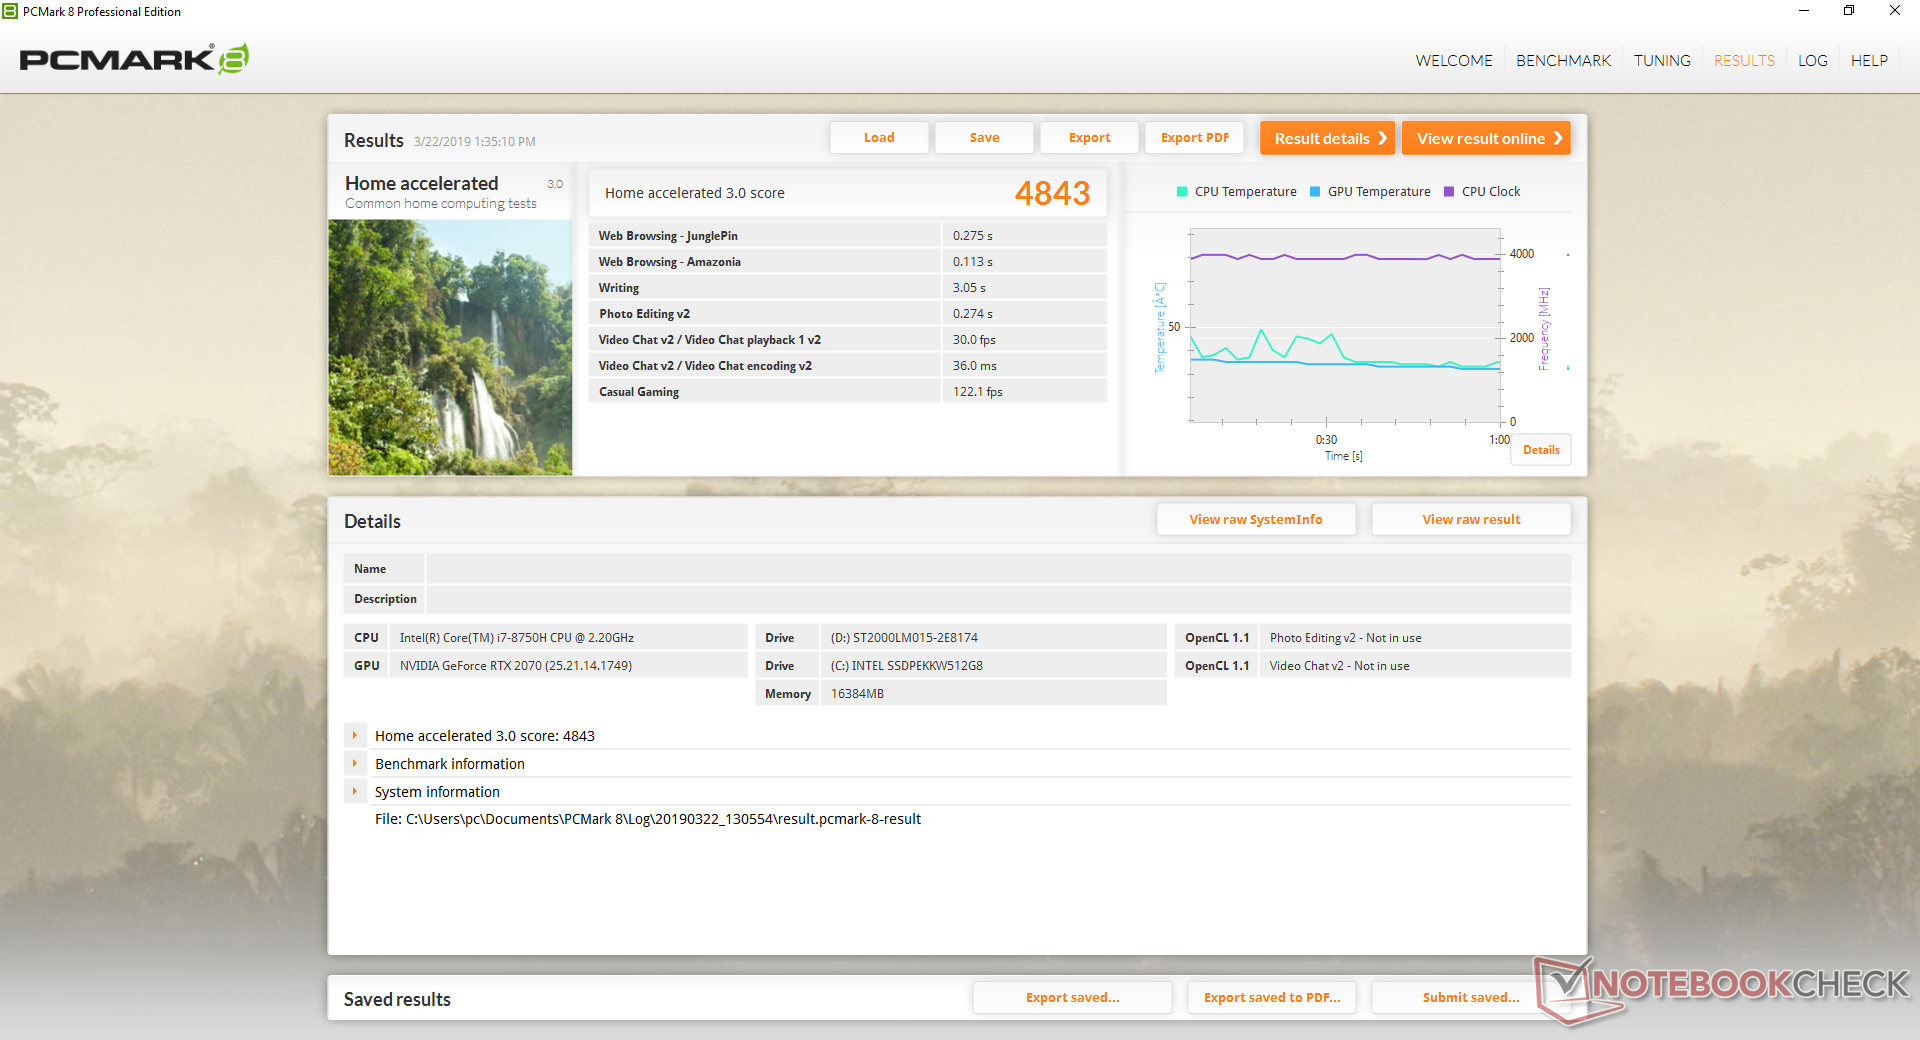
| PCMark 8 Home Score Accelerated v2 | 4843 points | |
| PCMark 8 Work Score Accelerated v2 | 5828 points | |
| PCMark 10 Score | 5870 points | |
Help | ||
Storage Devices
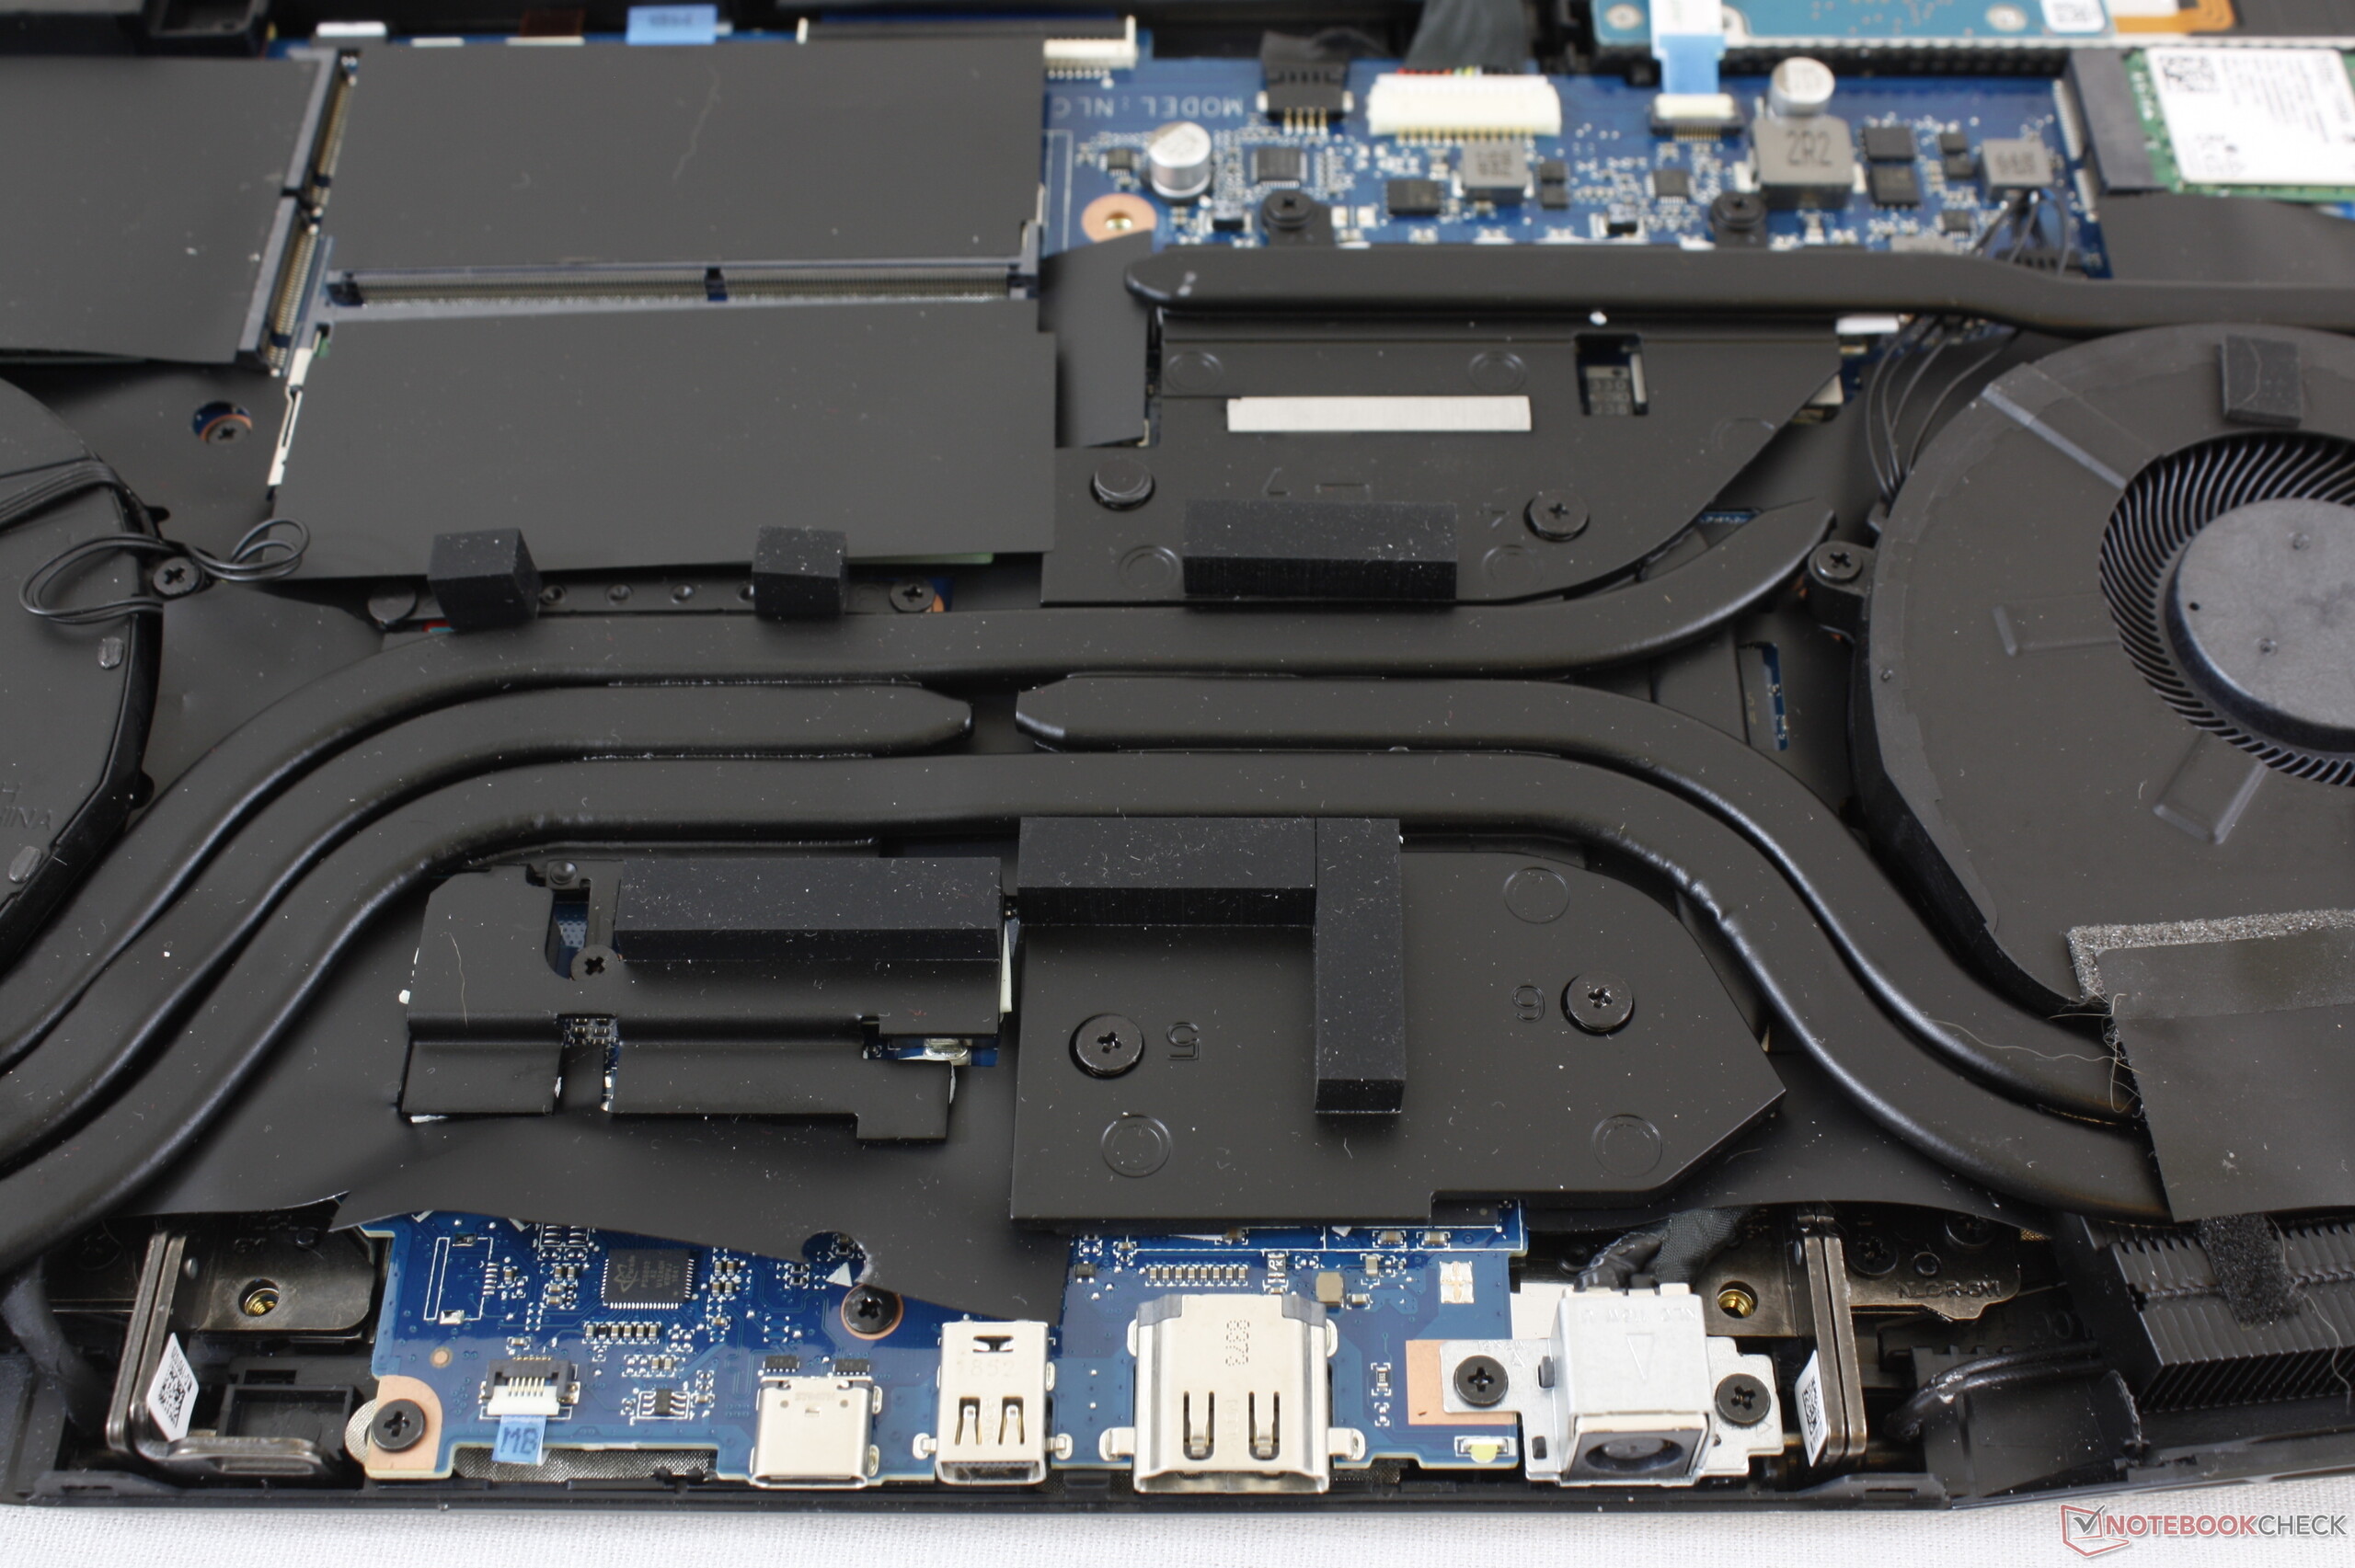
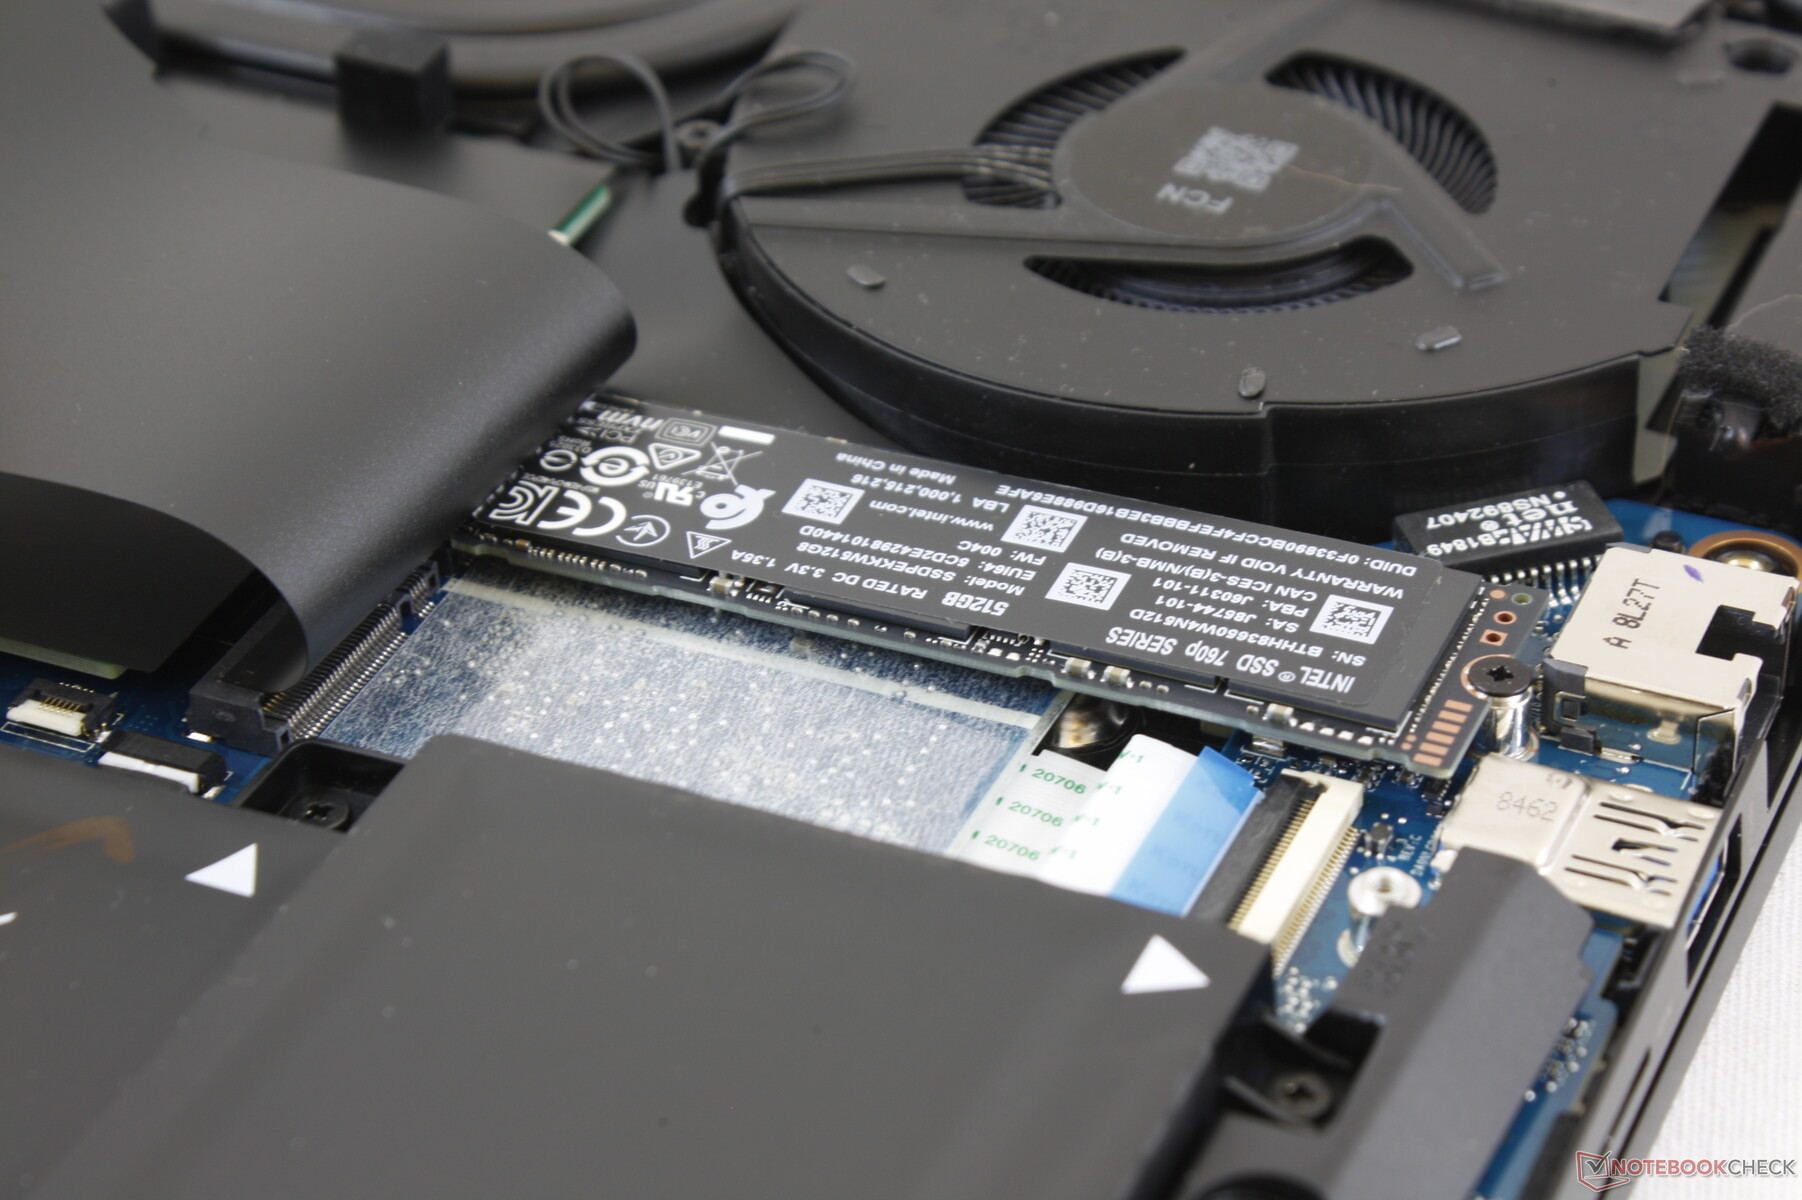
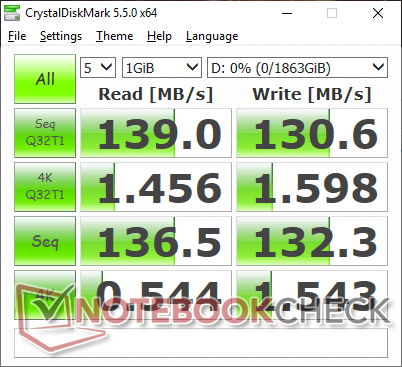
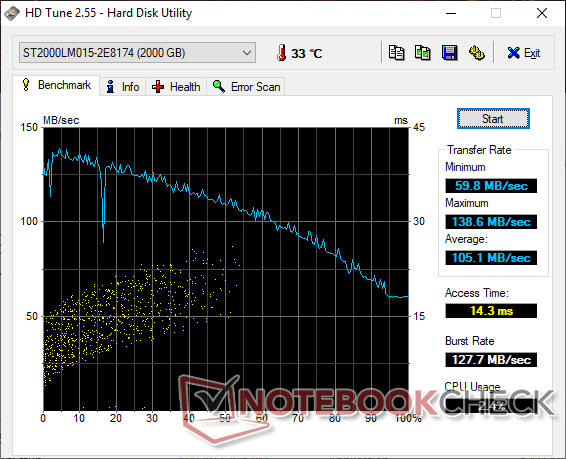
There are three internal storage bays (2x RAID-compatible M.2 2280 PCIe x4 slots + 1x 2.5-inch SATA III) compared to four on the Aorus X5 (3x M.2 2280 + 1x 2.5-inch SATA III). While Xotic PC offers a bevy of capacities and combinations, it's simple enough to access the drives and upgrade on your own if desired.
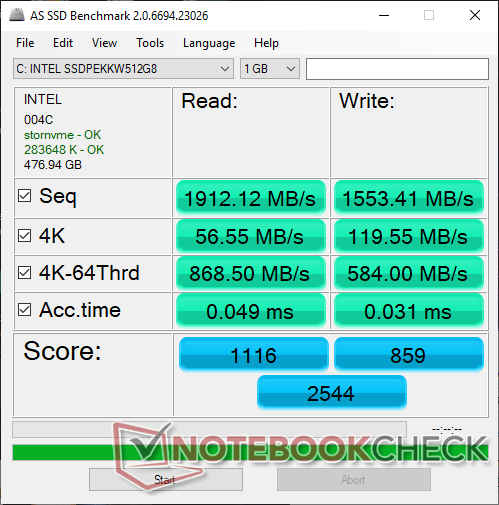
The 512 GB NVMe Intel drive on our test unit is a notable improvement over the NVMe Toshiba drive on the Alienware m15 and our last Aorus X5 v8. In particular, sequential write rates are now much faster and closer to a Samsung PM981. Note that Gigabyte utilizes a similar Intel SSD for its Aero 15 series as well.
Optane does not appear to be an option.
See our table of HDDs and SSDs for more benchmark comparisons.
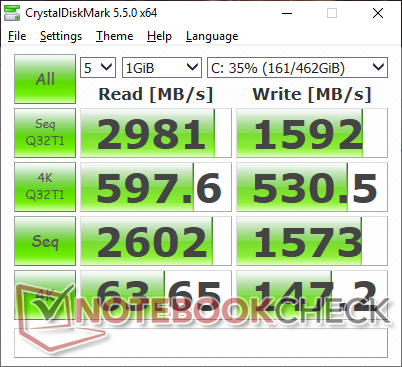
| Aorus 15 X9 Intel SSD 760p SSDPEKKW512G8 | Razer Blade 15 RTX 2070 Max-Q Samsung SSD PM981 MZVLB512HAJQ | Aorus X5 v8 Toshiba NVMe THNSN5512GPU7 | Gigabyte Aero 15-X9 Intel SSD 760p SSDPEKKW010T8 | MSI GS65 Stealth Thin 8RE-051US Samsung SSD PM981 MZVLB256HAHQ | Alienware m15 GTX 1070 Max-Q Toshiba XG5 KXG50ZNV512G | |
|---|---|---|---|---|---|---|
| AS SSD | 38% | -34% | -6% | -23% | -27% | |
| Seq Read (MB/s) | 1912 | 1840 -4% | 1813 -5% | 2113 11% | 1612 -16% | 1967 3% |
| Seq Write (MB/s) | 1553 | 1822 17% | 966 -38% | 1471 -5% | 1475 -5% | 1135 -27% |
| 4K Read (MB/s) | 56.5 | 52.3 -7% | 23.21 -59% | 55 -3% | 43.09 -24% | 29.17 -48% |
| 4K Write (MB/s) | 119.6 | 110.7 -7% | 84.5 -29% | 107.1 -10% | 83.8 -30% | 93.4 -22% |
| 4K-64 Read (MB/s) | 869 | 1126 30% | 856 -1% | 914 5% | 611 -30% | 995 14% |
| 4K-64 Write (MB/s) | 584 | 1717 194% | 773 32% | 703 20% | 570 -2% | 656 12% |
| Access Time Read * (ms) | 0.049 | 0.047 4% | 0.166 -239% | 0.114 -133% | 0.071 -45% | 0.116 -137% |
| Access Time Write * (ms) | 0.031 | 0.033 -6% | 0.044 -42% | 0.034 -10% | 0.045 -45% | 0.063 -103% |
| Score Read (Points) | 1116 | 1362 22% | 1061 -5% | 1180 6% | 815 -27% | 1221 9% |
| Score Write (Points) | 859 | 2010 134% | 954 11% | 957 11% | 802 -7% | 862 0% |
| Score Total (Points) | 2544 | 4079 60% | 2515 -1% | 2722 7% | 2039 -20% | 2667 5% |
| Copy ISO MB/s (MB/s) | 1329 | 1975 49% | 1864 40% | 642 -52% | ||
| Copy Program MB/s (MB/s) | 404.3 | 526 30% | 362.6 -10% | 431.5 7% | ||
| Copy Game MB/s (MB/s) | 1071 | 1200 12% | 936 -13% | 706 -34% |
* ... smaller is better

GPU Performance
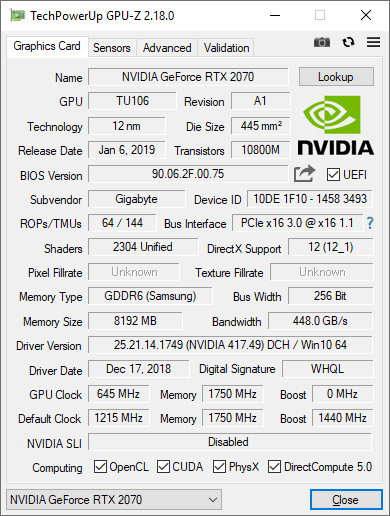
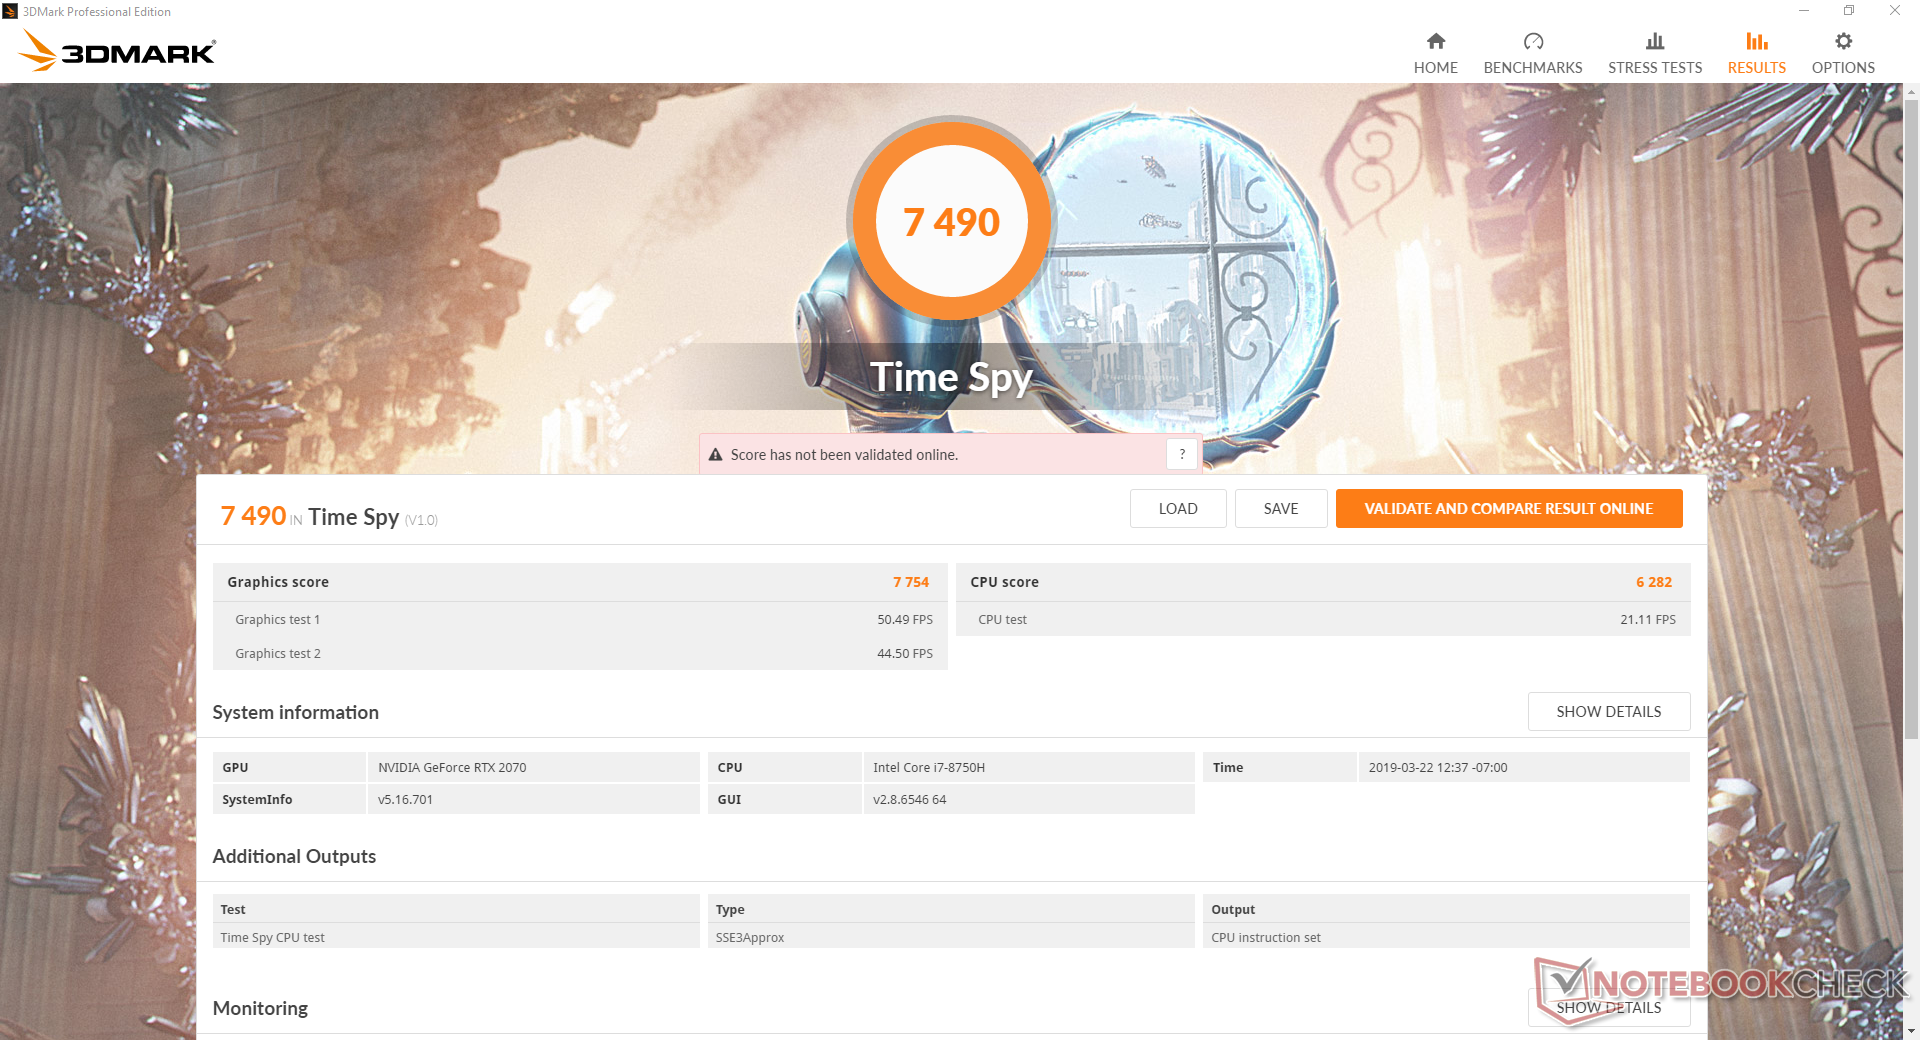
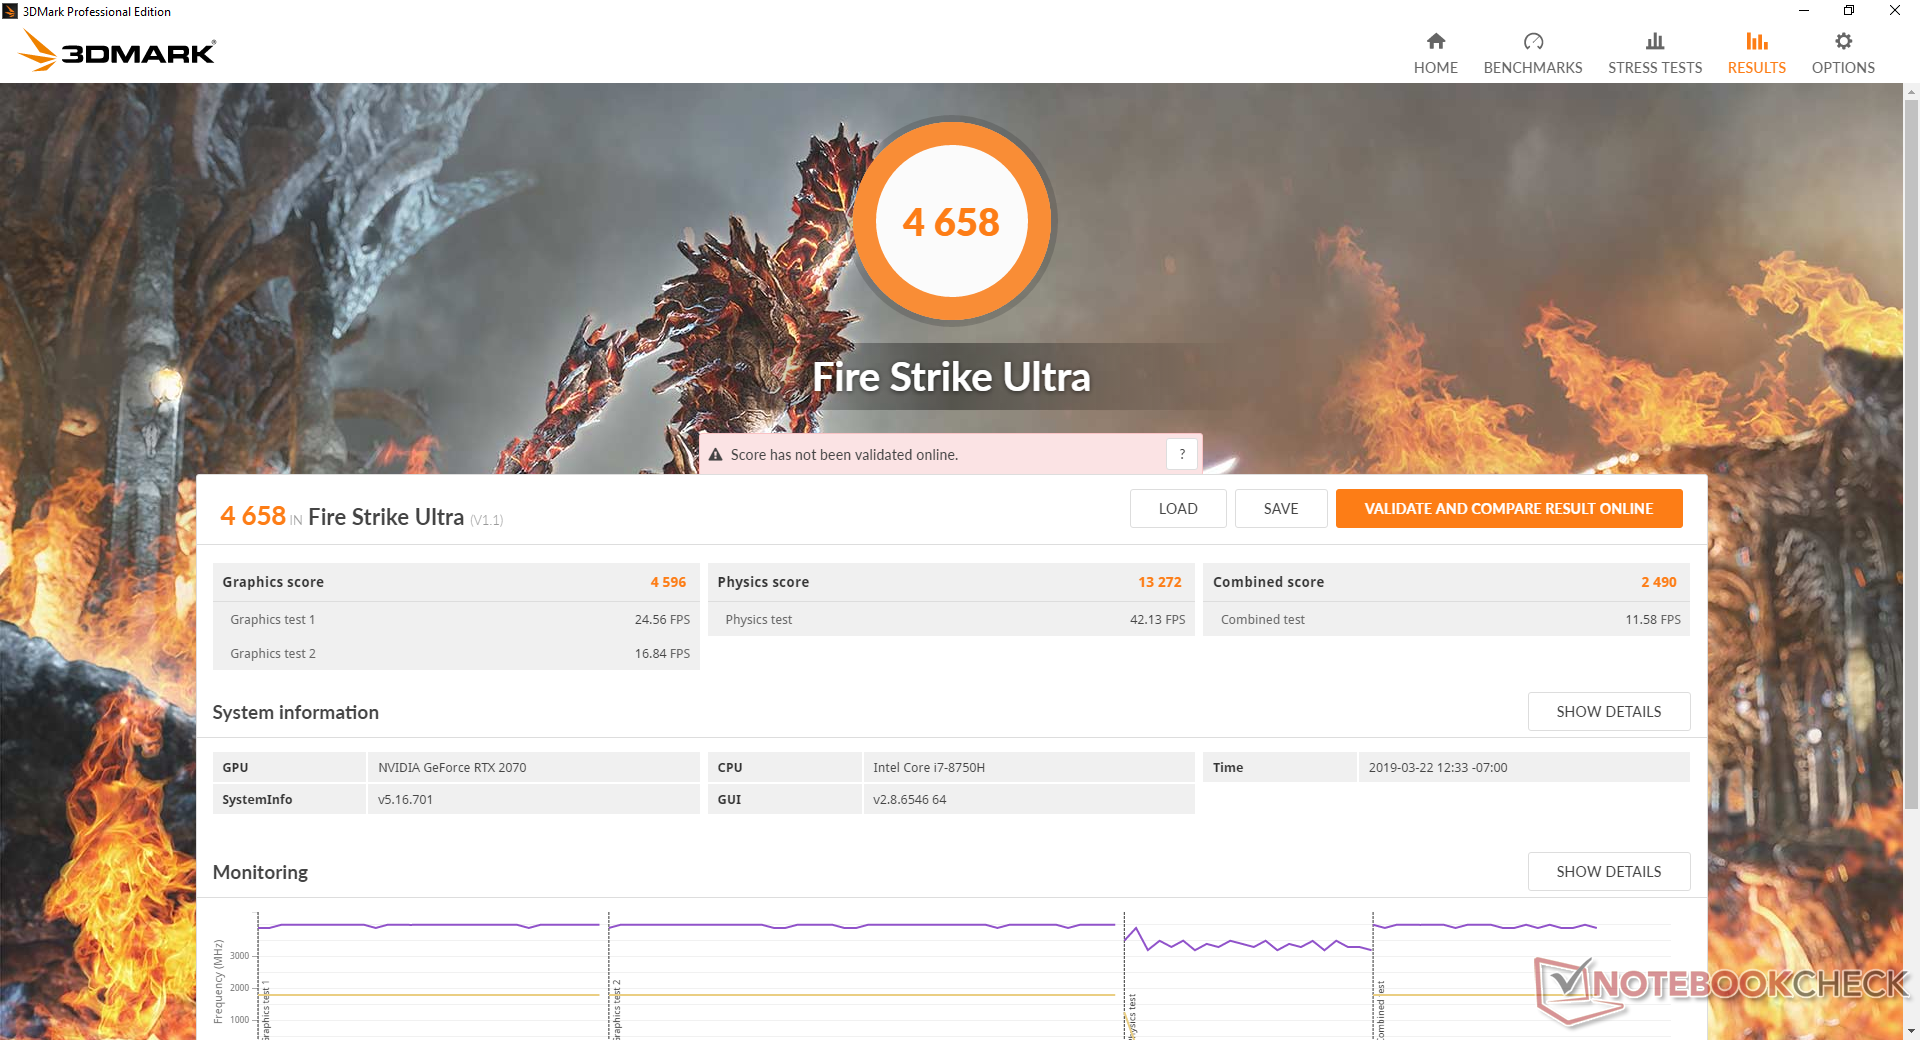
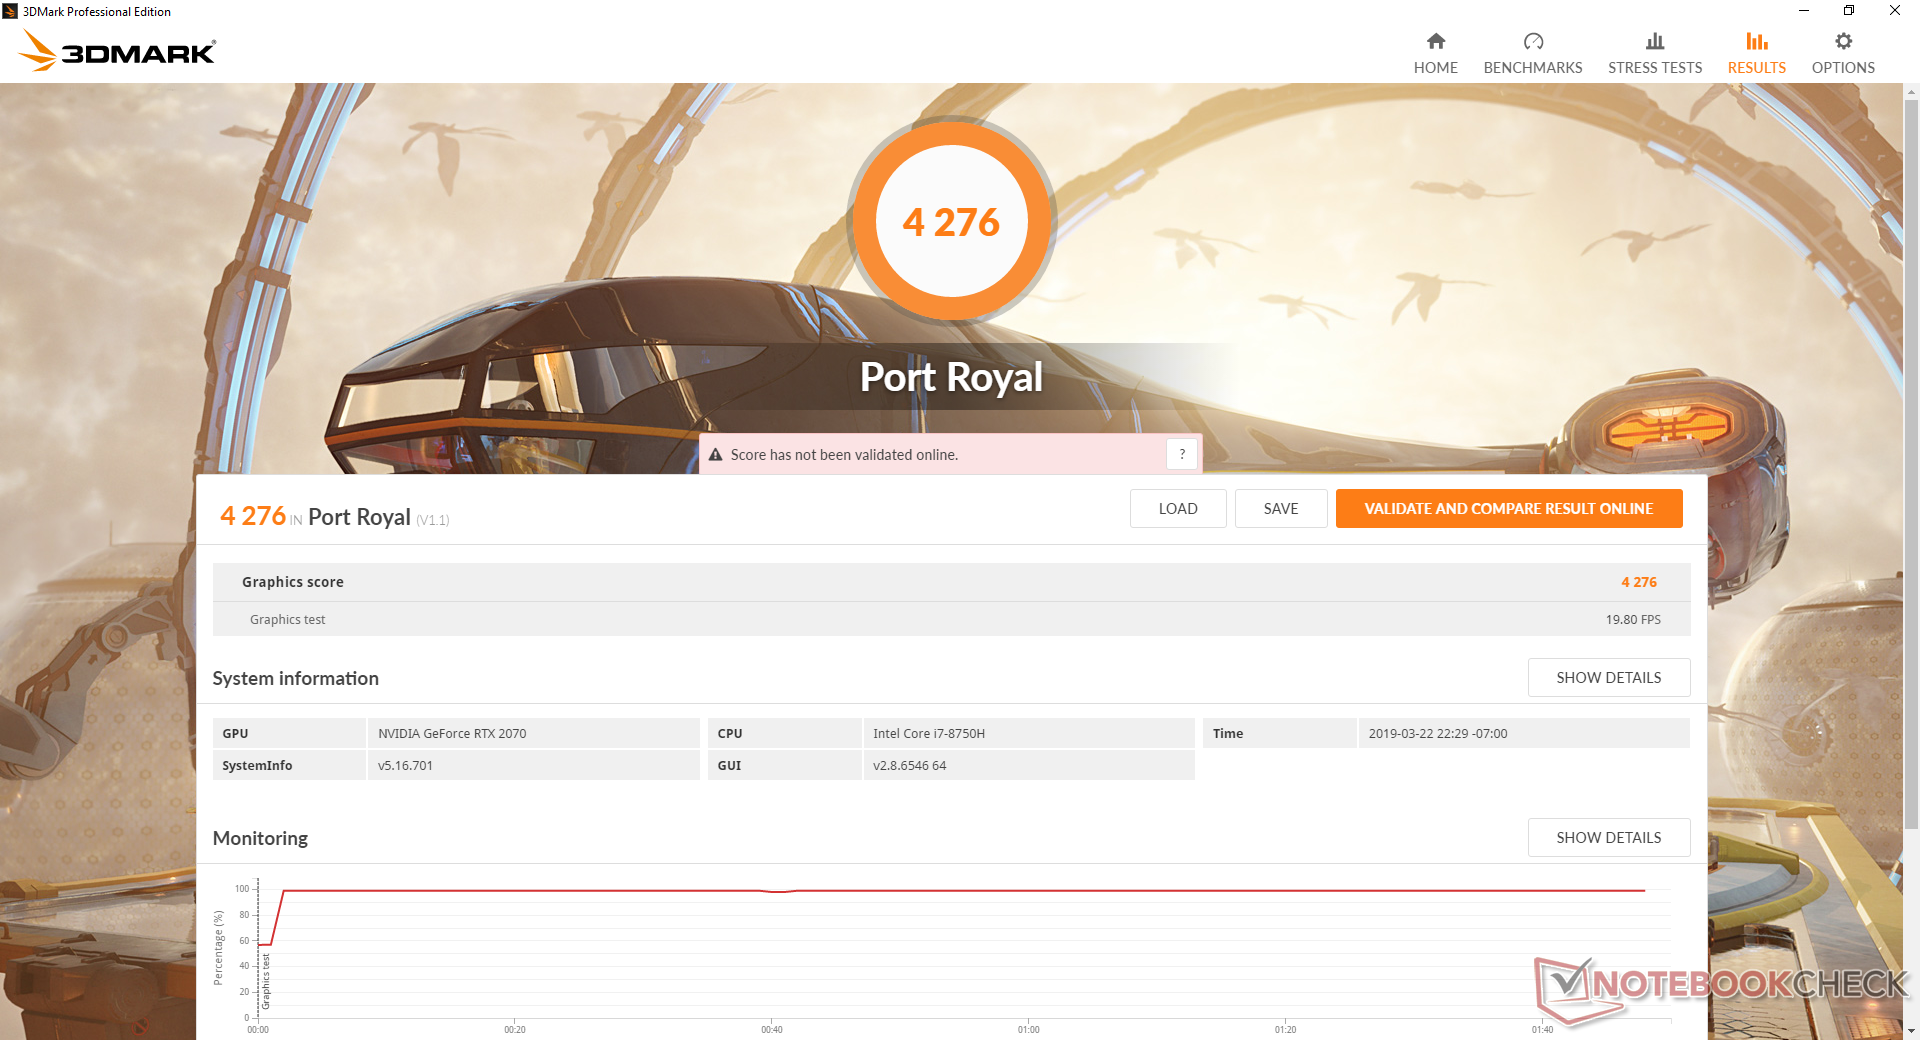
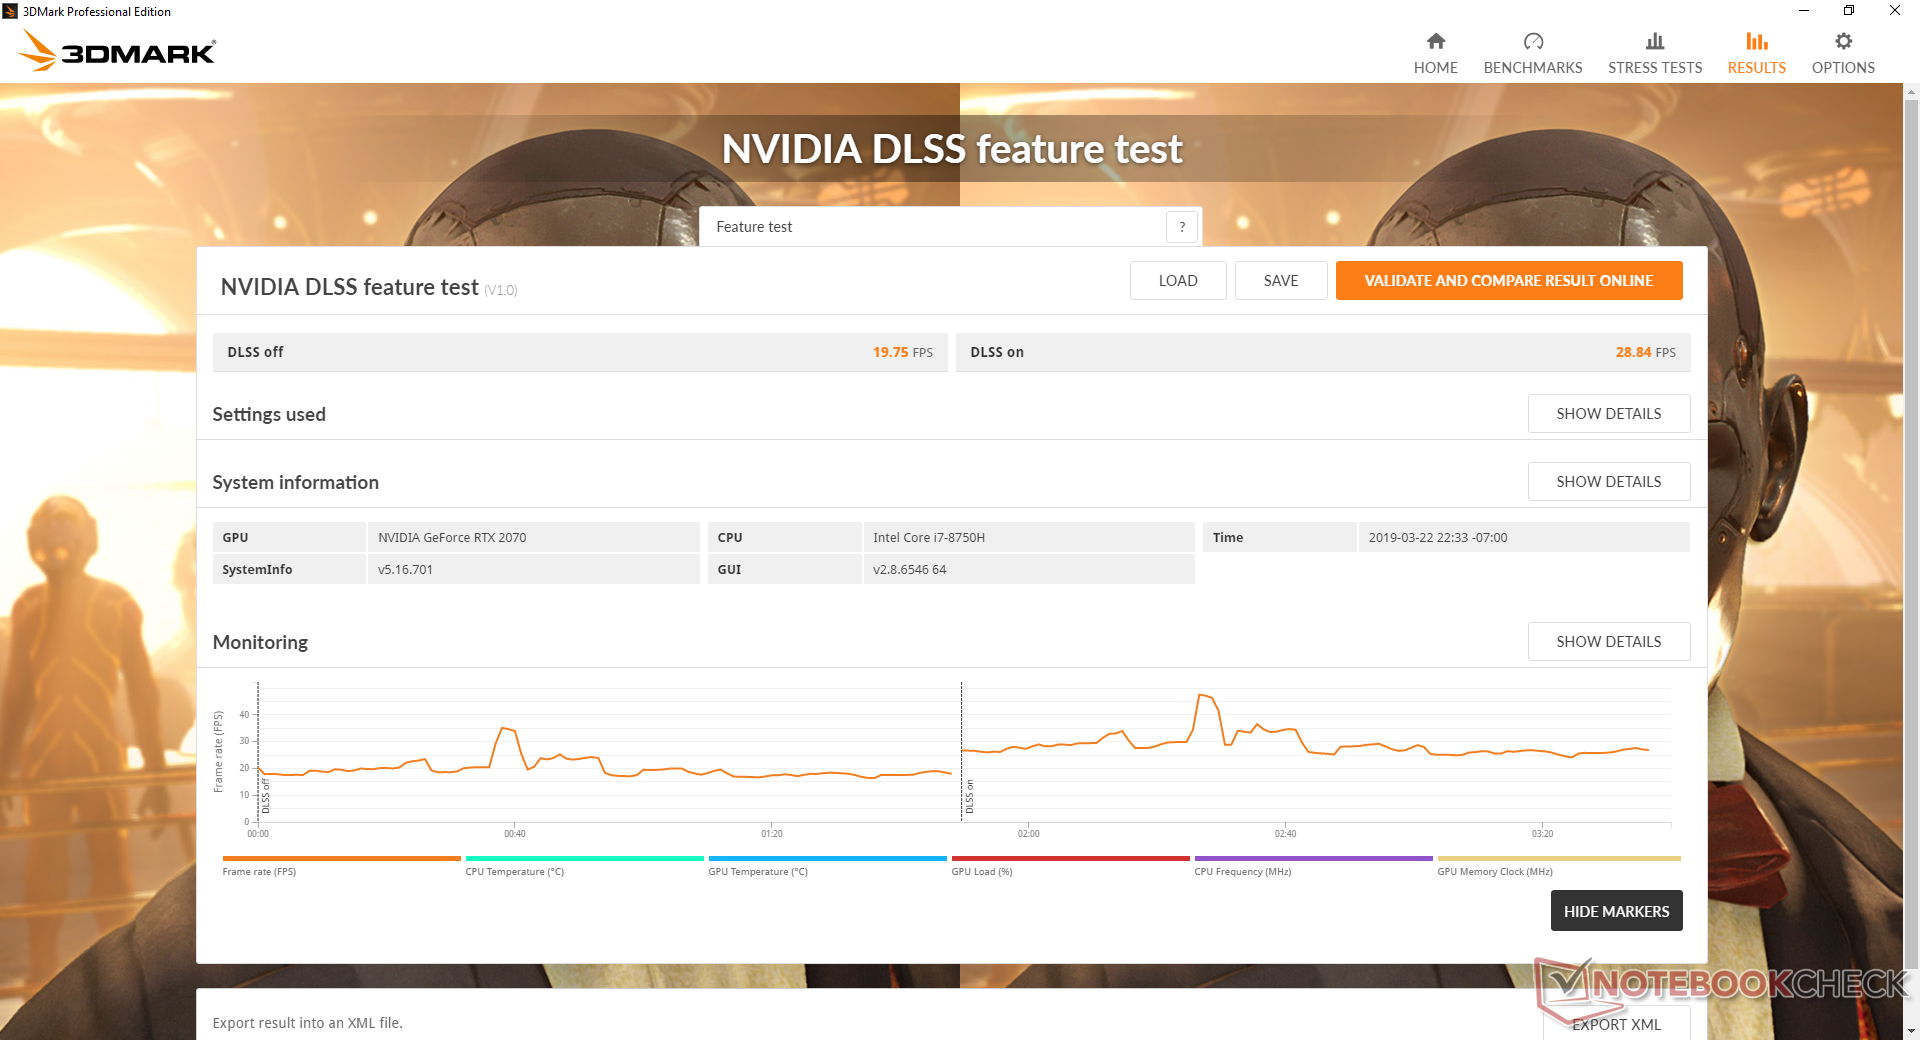
This is our fifth laptop equipped with RTX 2070 graphics and 3DMark benchmarks show it to be within just 1 to 2 percentage points of our average. In other words, Gigabyte has not artificially throttled or reduced the performance of the GPU in any way. Owners can expect 6 to 10 percent slower performance than the RTX 2080 Max-Q and a 30 to 35 percent boost over the standard laptop RTX 2060. Anyone upgrading from the older GTX 1060 will see a massive gain of about 65 percent.
When compared to our RTX 2070 desktop reference, however, the RTX 2070 in our Aorus is about 10 to 15 percent slower.
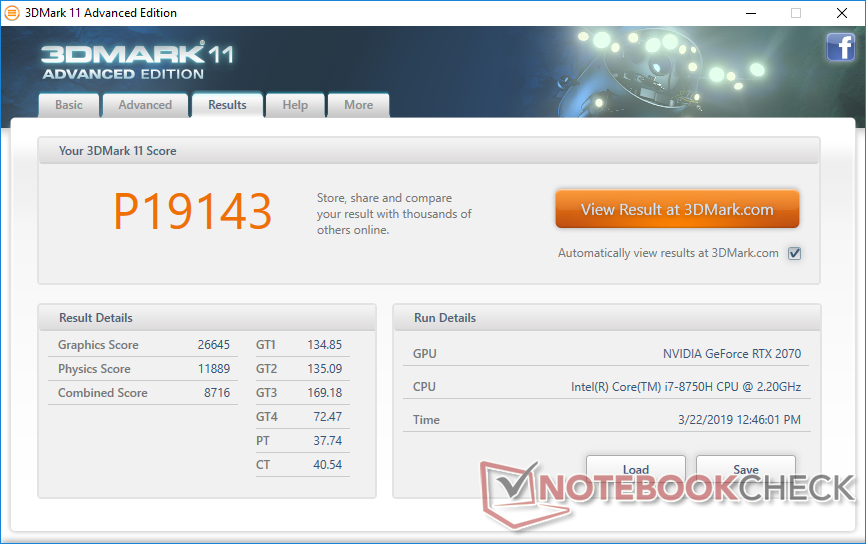
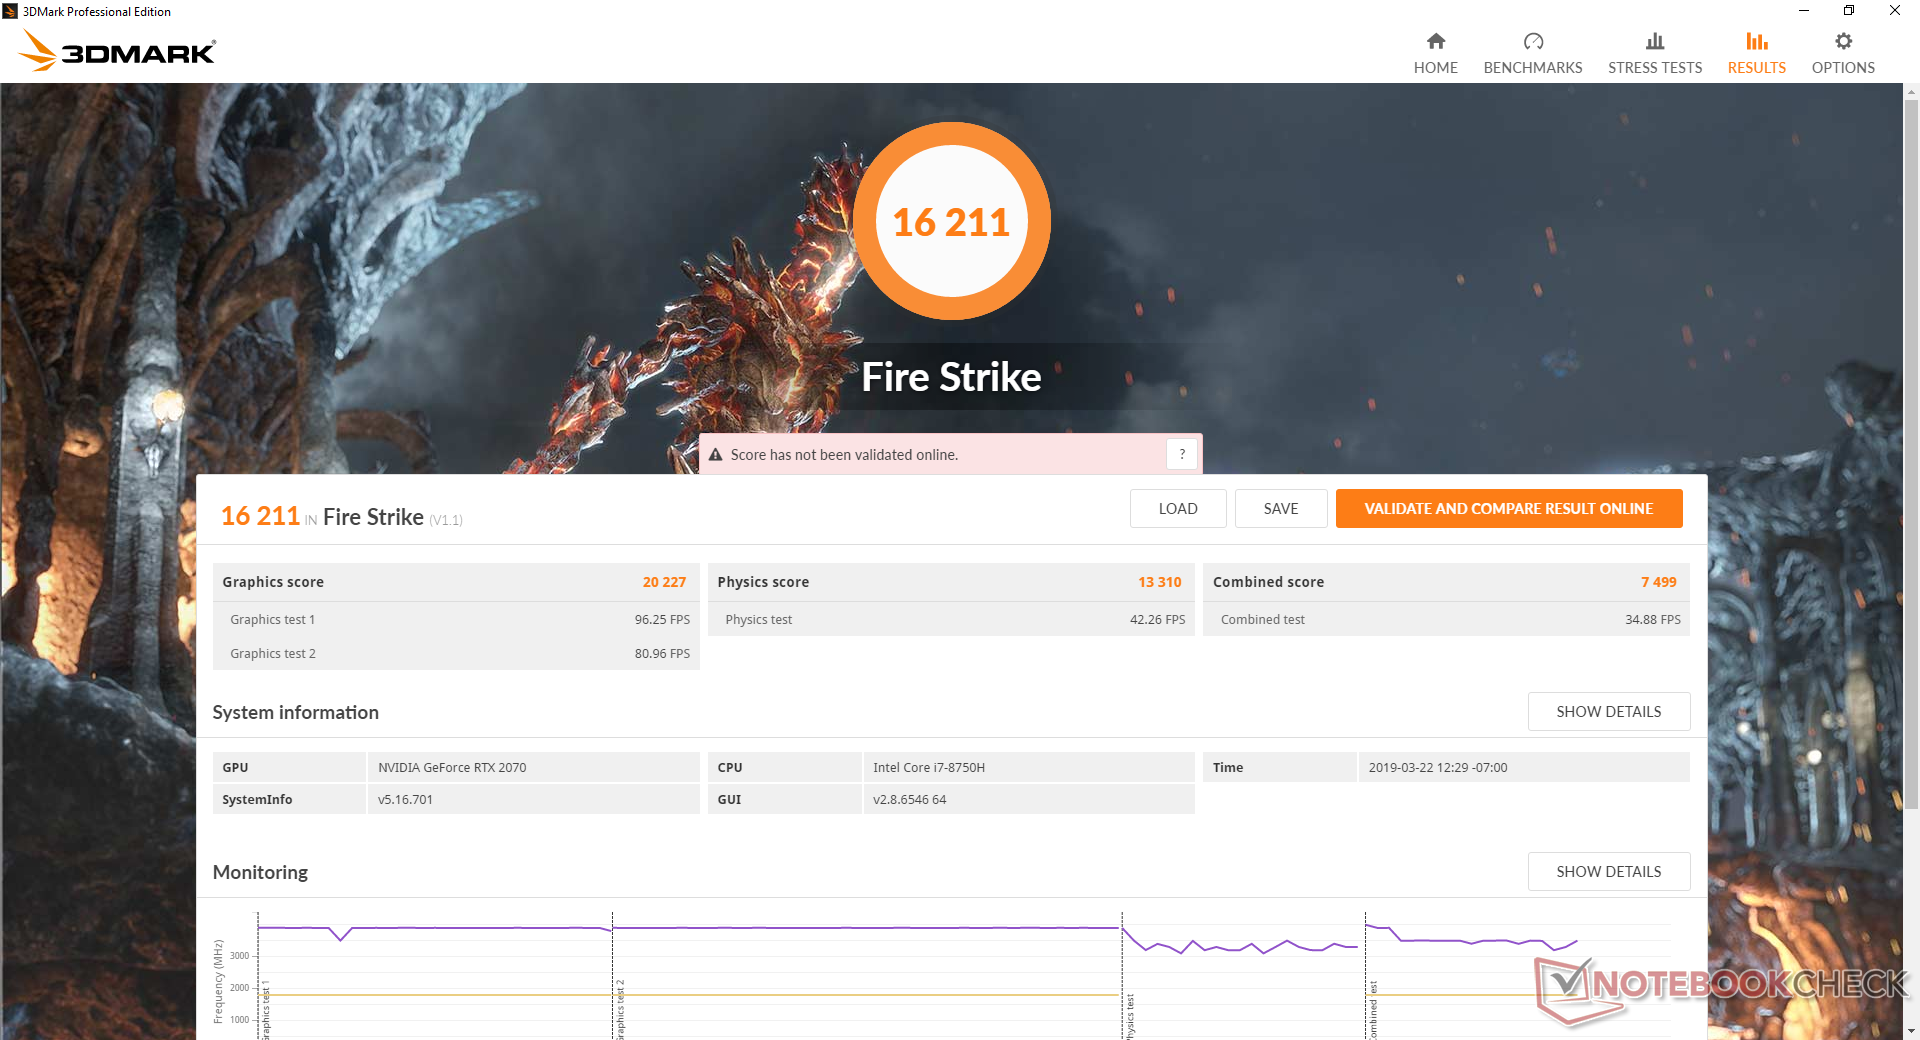
| 3DMark 11 Performance | 19143 points | |
| 3DMark Cloud Gate Standard Score | 31987 points | |
| 3DMark Fire Strike Score | 16211 points | |
| 3DMark Time Spy Score | 7490 points | |
Help | ||
Gaming Performance
Performance in Witcher 3 is where we expect it to be in relation to other RTX 2070 laptops we've tested. It is unfortunately closer to an RTX 2070 Max-Q than it is to a proper desktop RTX 2070. The RTX 2080 Max-Q can be up to 14 percent faster depending on the laptop in question.
Idling on Witcher 3 shows no recurring dips in frame rates to suggest no interrupting background activity when gaming.
See our full review on the RTX Turing series for more technical information and our dedicated page on the GeForce RTX 2070 for more benchmark comparisons.
| The Witcher 3 - 1920x1080 Ultra Graphics & Postprocessing (HBAO+) | |
| Alienware Area-51m i9-9900K RTX 2080 | |
| Asus ROG Strix RTX 2070 OC | |
| Asus Zephyrus S GX701GX | |
| Average NVIDIA GeForce RTX 2070 Mobile (64 - 82.1, n=21) | |
| Aorus 15 X9 | |
| Razer Blade 15 RTX 2070 Max-Q | |
| Gigabyte Aero 15-Y9 | |
| MSI GL73 8SE-010US | |
| MSI GS65 Stealth Thin 8RE-051US | |
| Huawei MateBook 13 i7 | |
| low | med. | high | ultra | |
|---|---|---|---|---|
| BioShock Infinite (2013) | 304.5 | 249.3 | 229.8 | 154.3 |
| The Witcher 3 (2015) | 236.1 | 197 | 131.3 | 71.8 |
| Rise of the Tomb Raider (2016) | 211.8 | 145.3 | 132.8 | 115.2 |
Emissions
System Noise
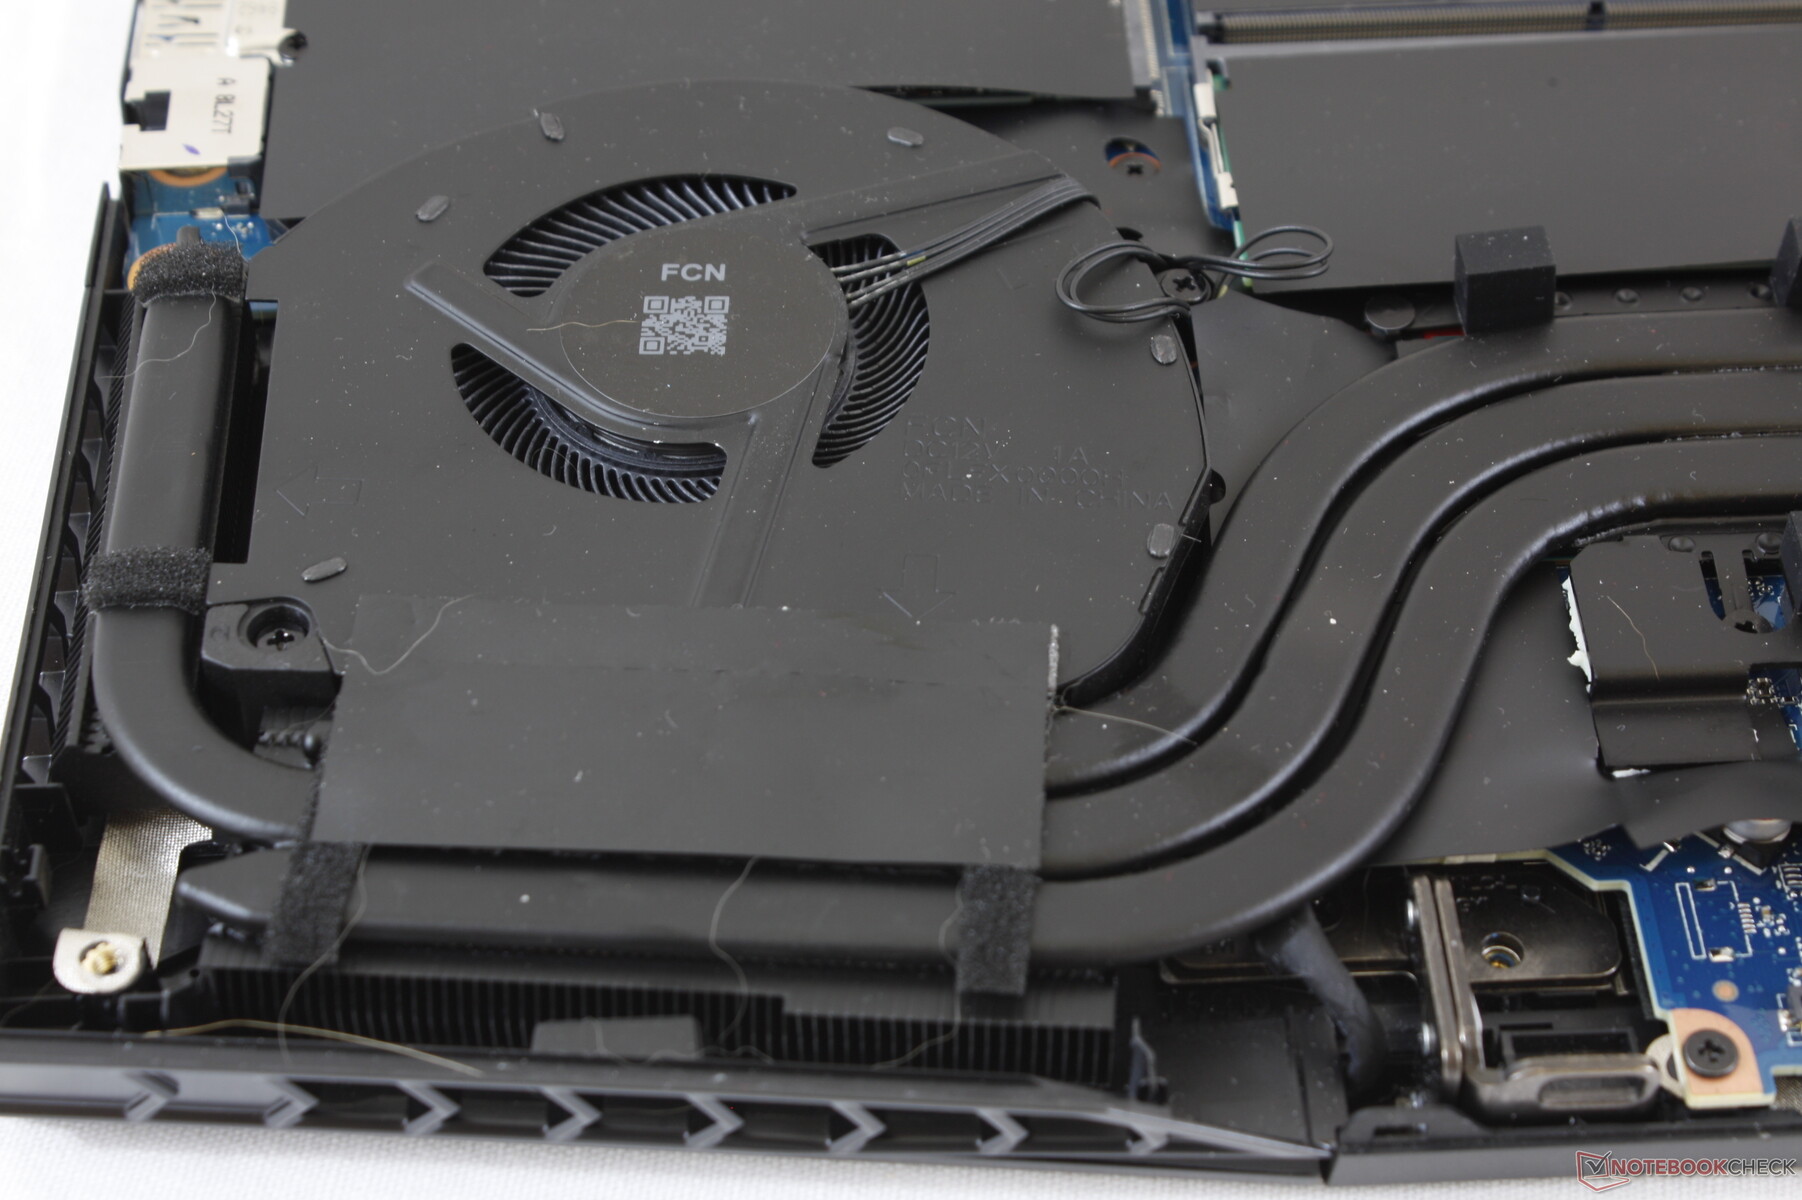
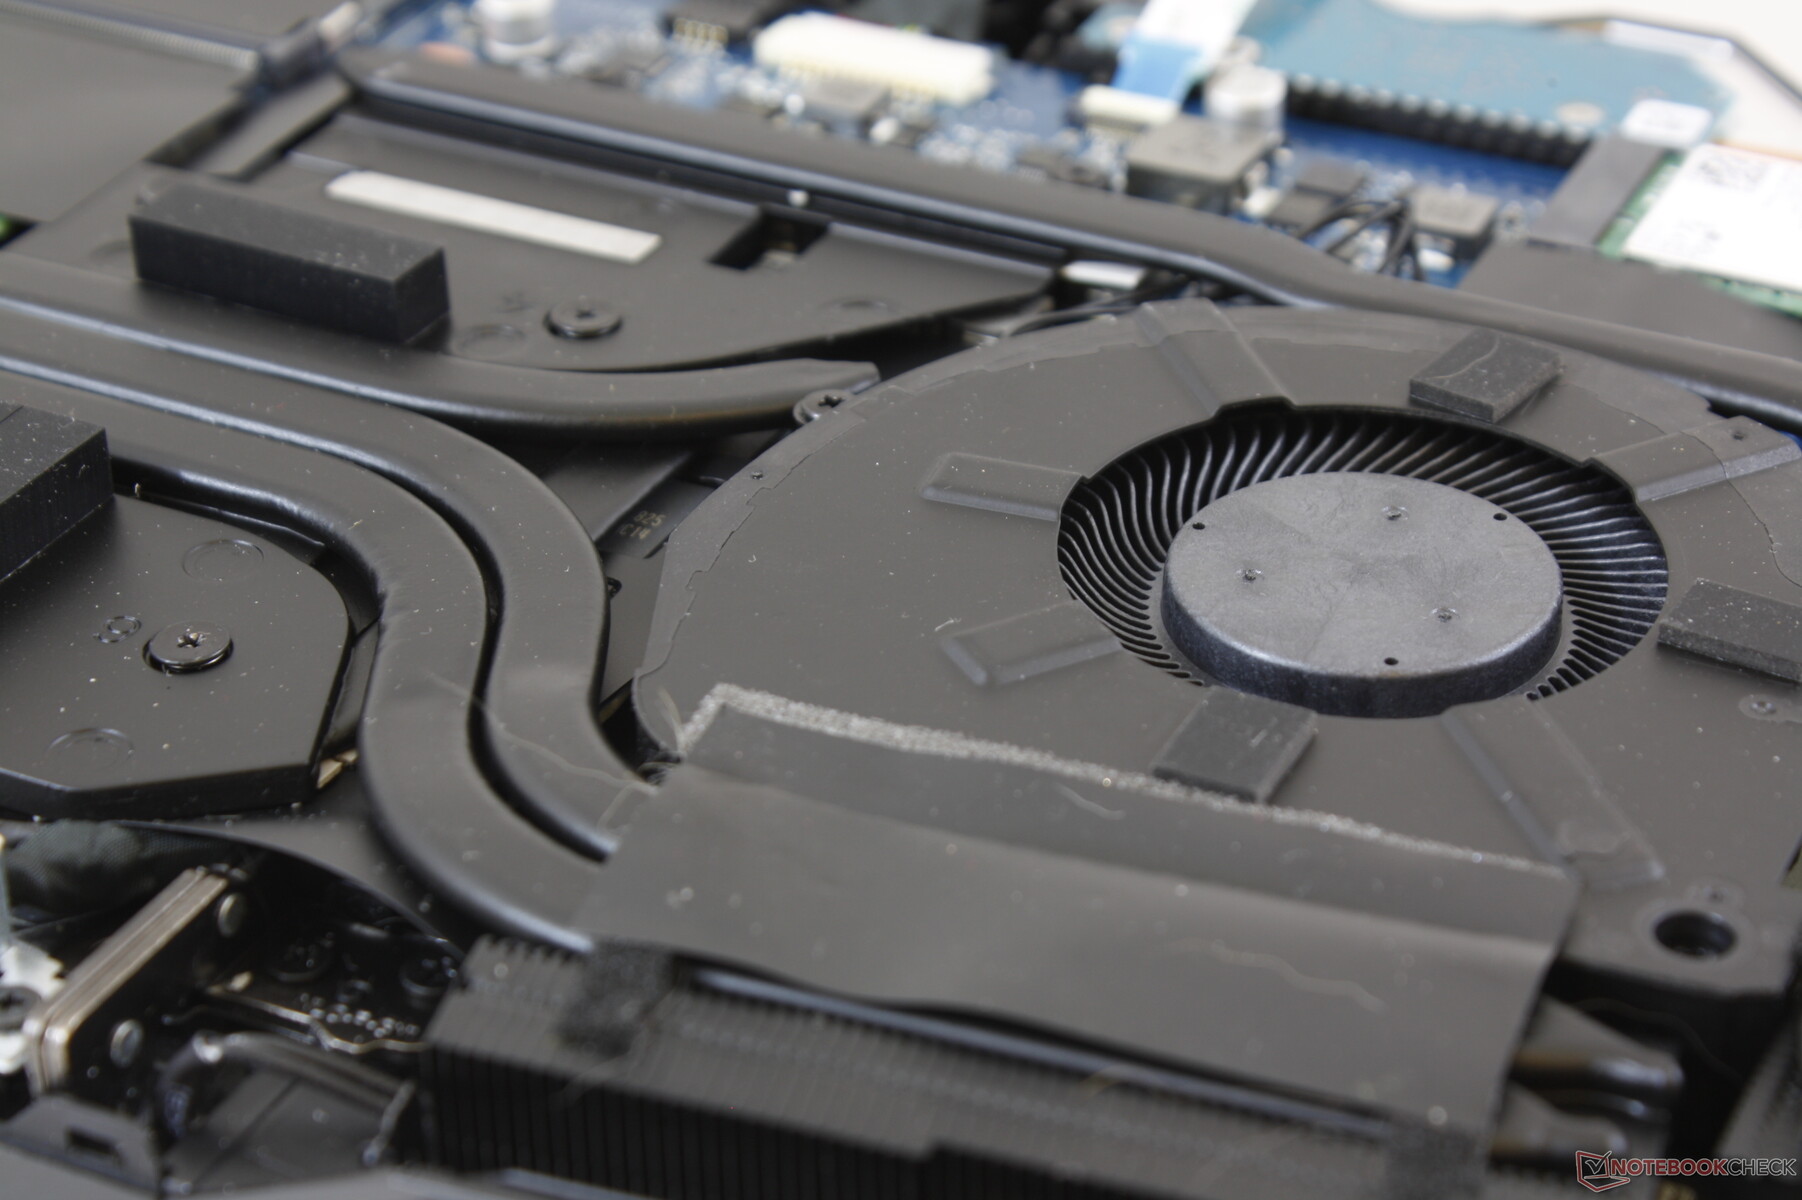
The cooling system consists of twin ~50 mm fans with six heat pipes between them. Both fans are always active no matter the setting or load. Competing machines like the Alienware m15 and MSI GS65 are still quieter and can run completely silent for at least a period of time during low processing loads.
Fan noise becomes unstable when running higher loads. No matter what setting we use, the laptop would sometimes automatically set itself to "Max Fan" mode for absolutely no reason at all. For example, simply launching 3DMark 11 would automatically cause the fans to spin at a blisteringly loud 64 dB(A) even when Windows is on the Power Saver profile. This thankfully does not occur when browsing or streaming video, but the fact that this can happen at all by default is unacceptable. Avoid High Performance mode if the extra horsepower is not needed to reduce the occurrence of pulsing fans.
"Max Fan" mode is fortunately not needed when gaming. Nonetheless, the Aorus 15 is still louder than many competing gaming laptops. We're able to record a fan noise of 51.8 dB(A) when playing Witcher 3 compared to about 45 dB(A) on the Aero 15. The 50 dB(A) range is where we recommend headphones if possible especially when playing sound-sensitive titles like Metal Gear Solid V or Metro Exodus.
We can notice no coil whine on our test unit.
| Aorus 15 X9 GeForce RTX 2070 Mobile, i7-8750H, Intel SSD 760p SSDPEKKW512G8 | Razer Blade 15 RTX 2070 Max-Q GeForce RTX 2070 Max-Q, i7-8750H, Samsung SSD PM981 MZVLB512HAJQ | Aorus X5 v8 GeForce GTX 1070 Mobile, i7-8850H, Toshiba NVMe THNSN5512GPU7 | Gigabyte Aero 15-X9 GeForce RTX 2070 Max-Q, i7-8750H, Intel SSD 760p SSDPEKKW010T8 | MSI GS65 Stealth Thin 8RE-051US GeForce GTX 1060 Mobile, i7-8750H, Samsung SSD PM981 MZVLB256HAHQ | Alienware m15 GTX 1070 Max-Q GeForce GTX 1070 Max-Q, i7-8750H, Toshiba XG5 KXG50ZNV512G | |
|---|---|---|---|---|---|---|
| Noise | 13% | -5% | 2% | 9% | 8% | |
| off / environment * (dB) | 28.2 | 28.8 -2% | 30 -6% | 30 -6% | 28.4 -1% | 28.6 -1% |
| Idle Minimum * (dB) | 32.6 | 28.8 12% | 33 -1% | 32 2% | 28.4 13% | 28.6 12% |
| Idle Average * (dB) | 32.7 | 28.8 12% | 35 -7% | 34 -4% | 28.4 13% | 28.6 13% |
| Idle Maximum * (dB) | 32.7 | 29.4 10% | 40 -22% | 36 -10% | 29.6 9% | 28.6 13% |
| Load Average * (dB) | 38.9 | 35.7 8% | 45 -16% | 42 -8% | 43.5 -12% | 40.8 -5% |
| Witcher 3 ultra * (dB) | 51.8 | 42.5 18% | 50 3% | 44 15% | 45.7 12% | 49.6 4% |
| Load Maximum * (dB) | 64.1 | 45 30% | 55 14% | 48 25% | 45.7 29% | 49.6 23% |
* ... smaller is better
Noise level
| Idle |
| 32.6 / 32.7 / 32.7 dB(A) |
| Load |
| 38.9 / 64.1 dB(A) |
 | ||
30 dB silent 40 dB(A) audible 50 dB(A) loud |
||
min: | ||
Temperature
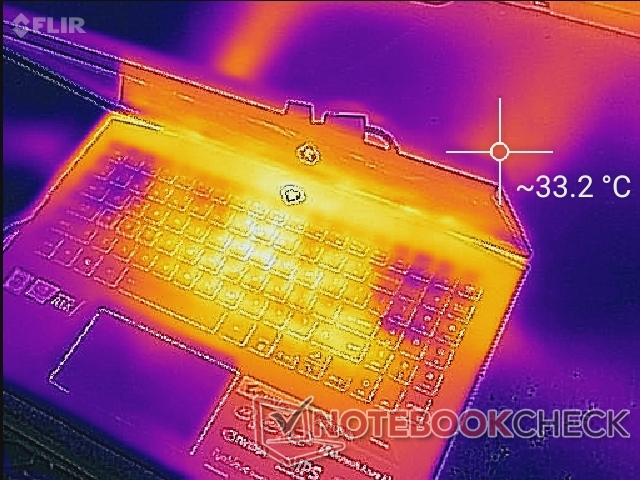
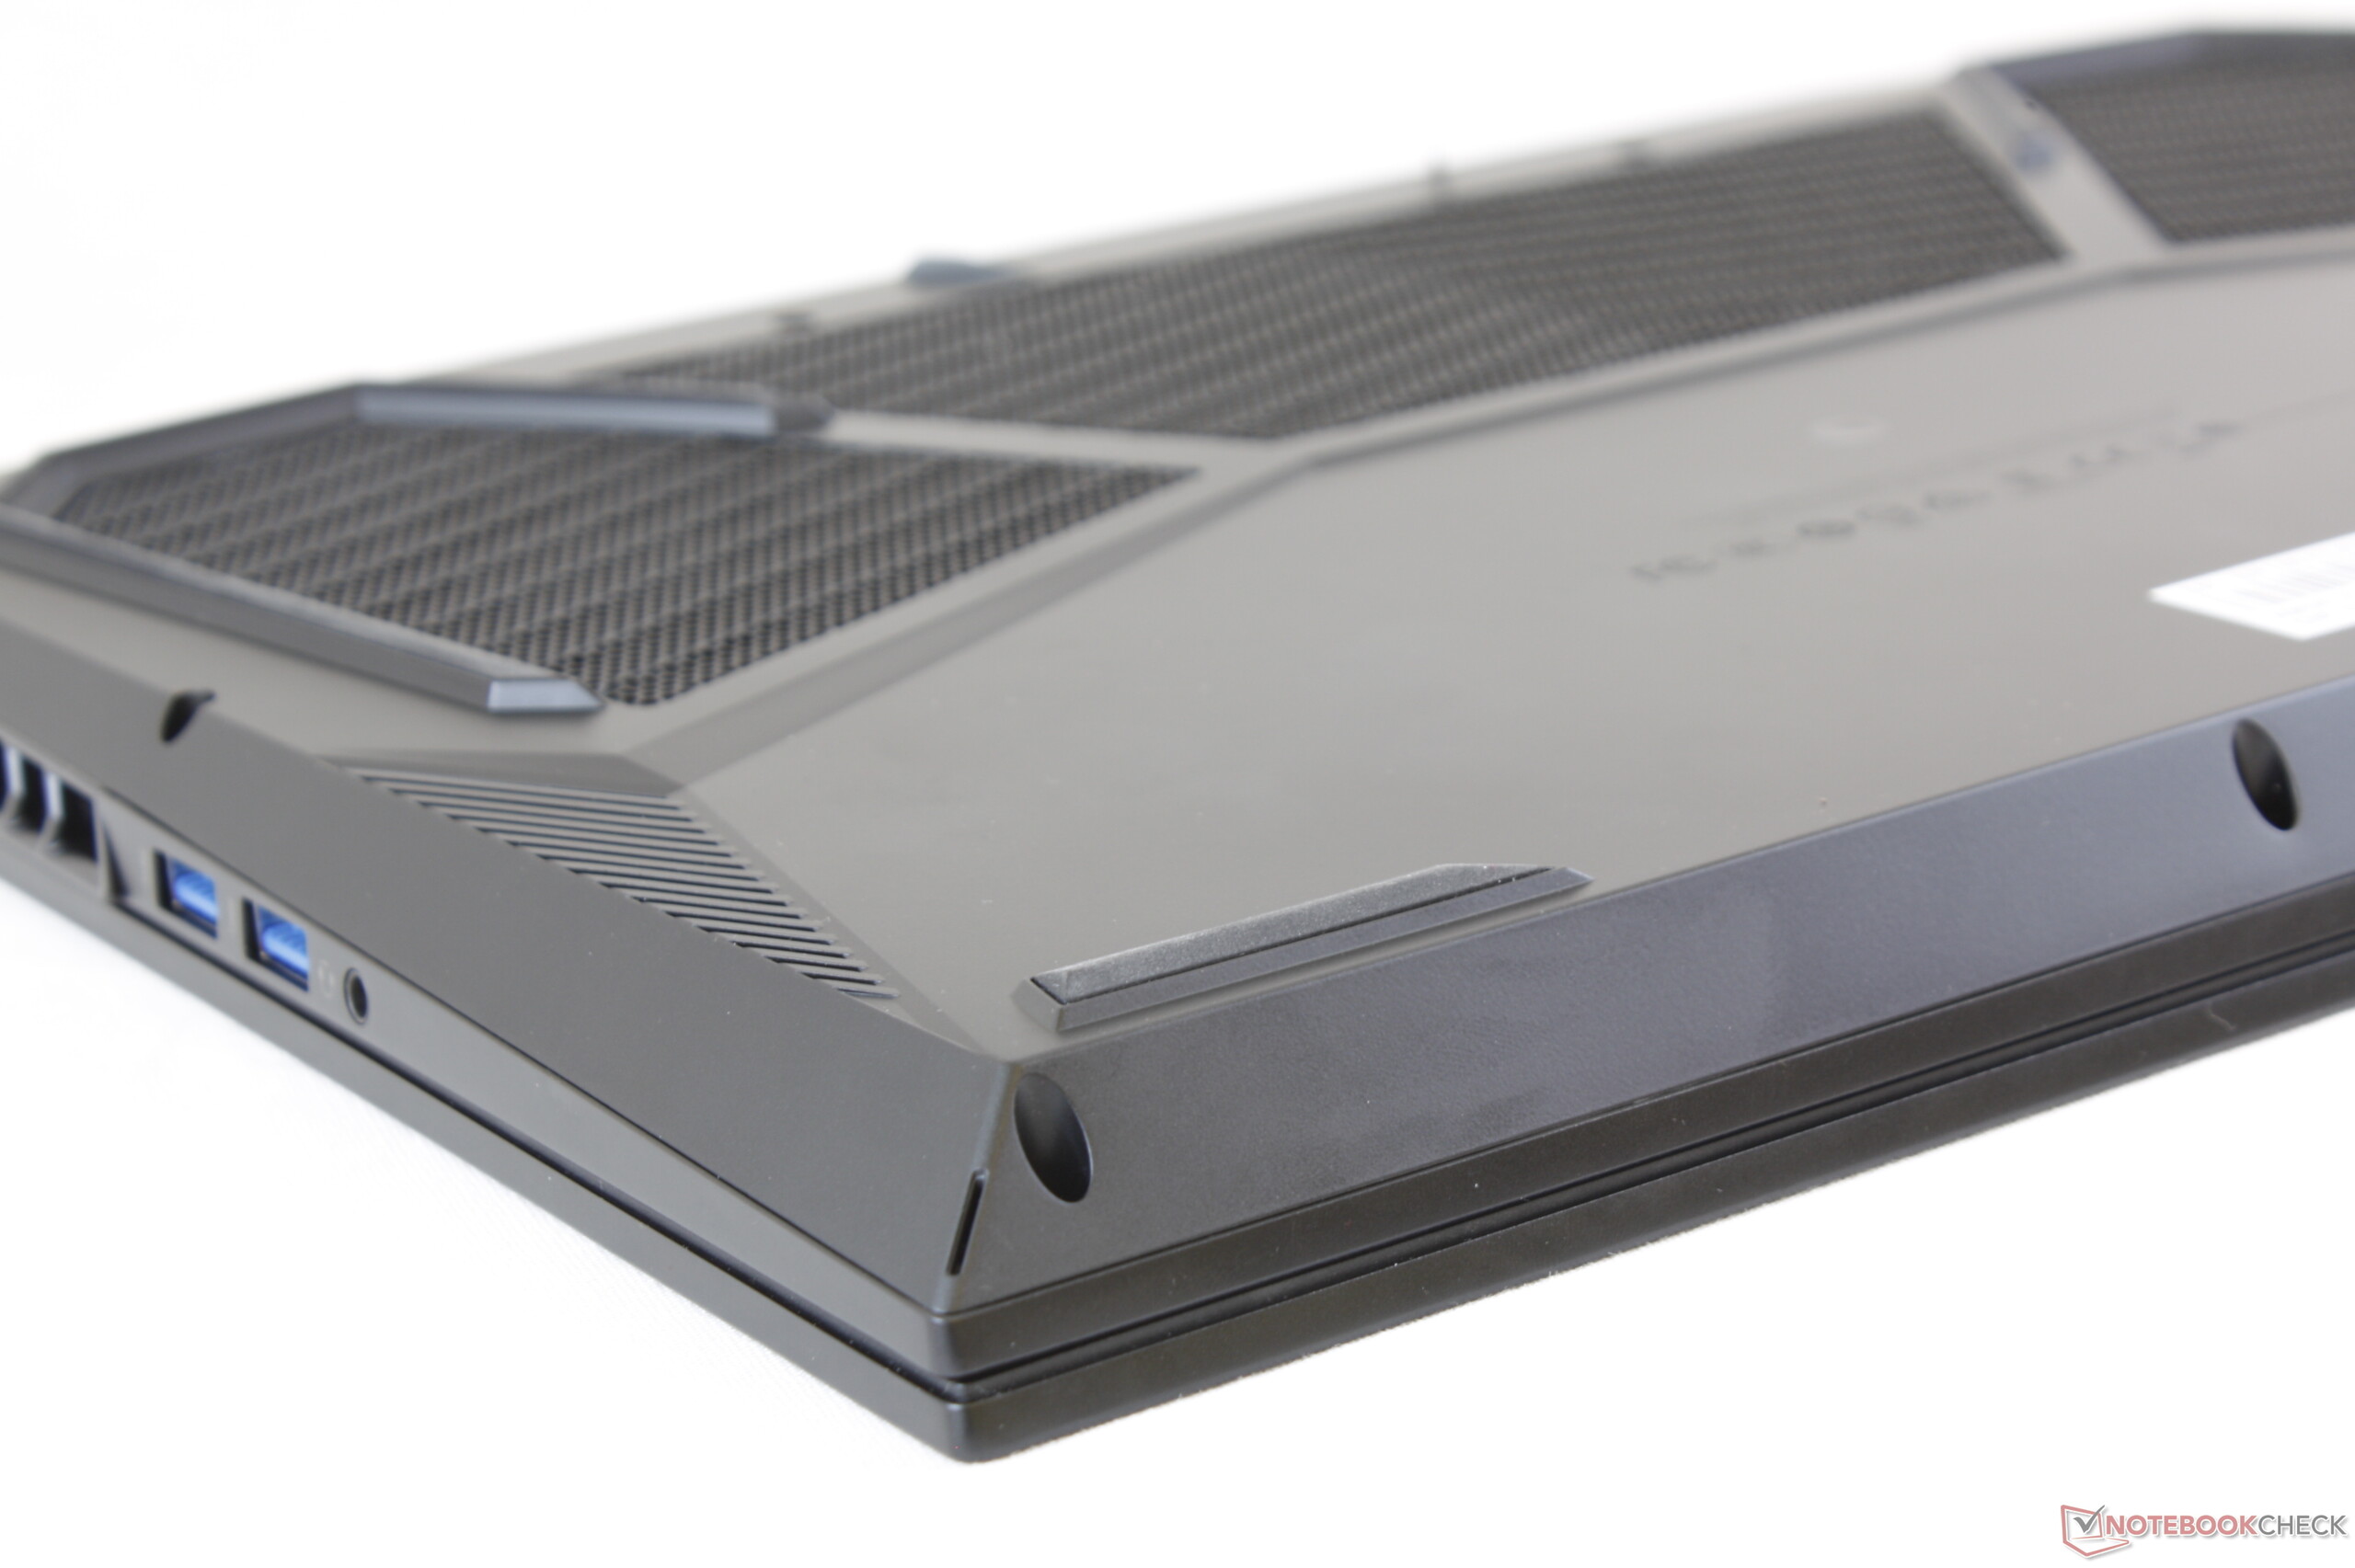
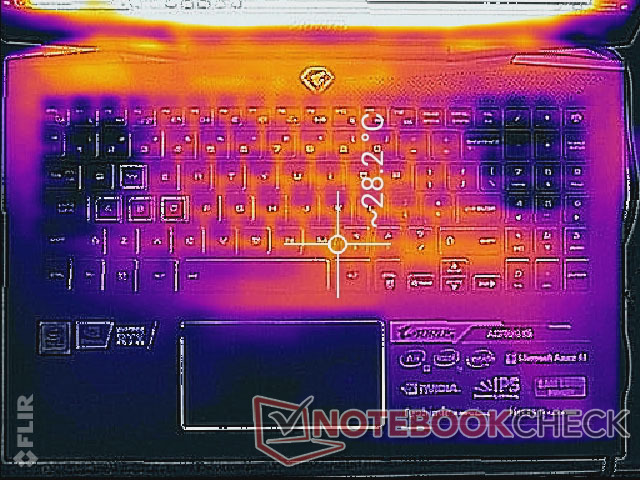
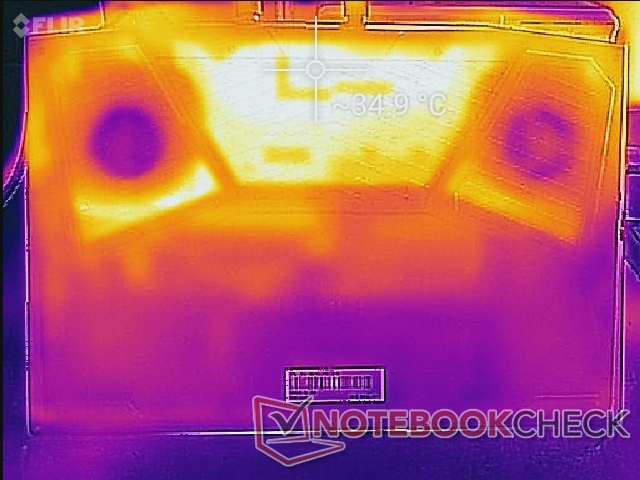
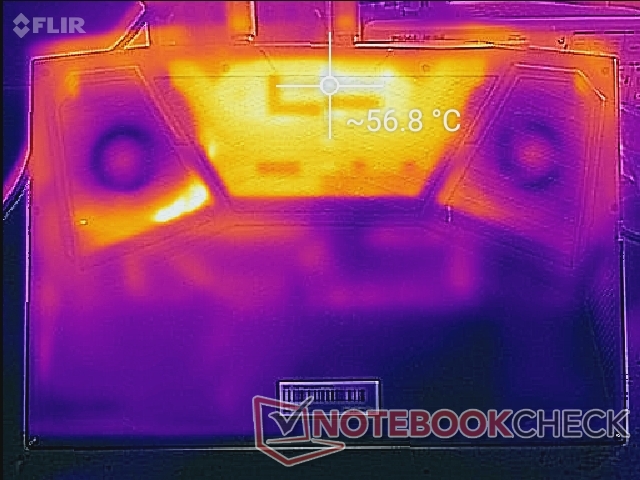
Surface temperatures when idling are flat at a maximum of only 28 C towards the center of the keyboard. Since the fans are always running and drawing air from the top corners of the keyboard, these specific areas will always be cooler as shown by our temperature maps below.
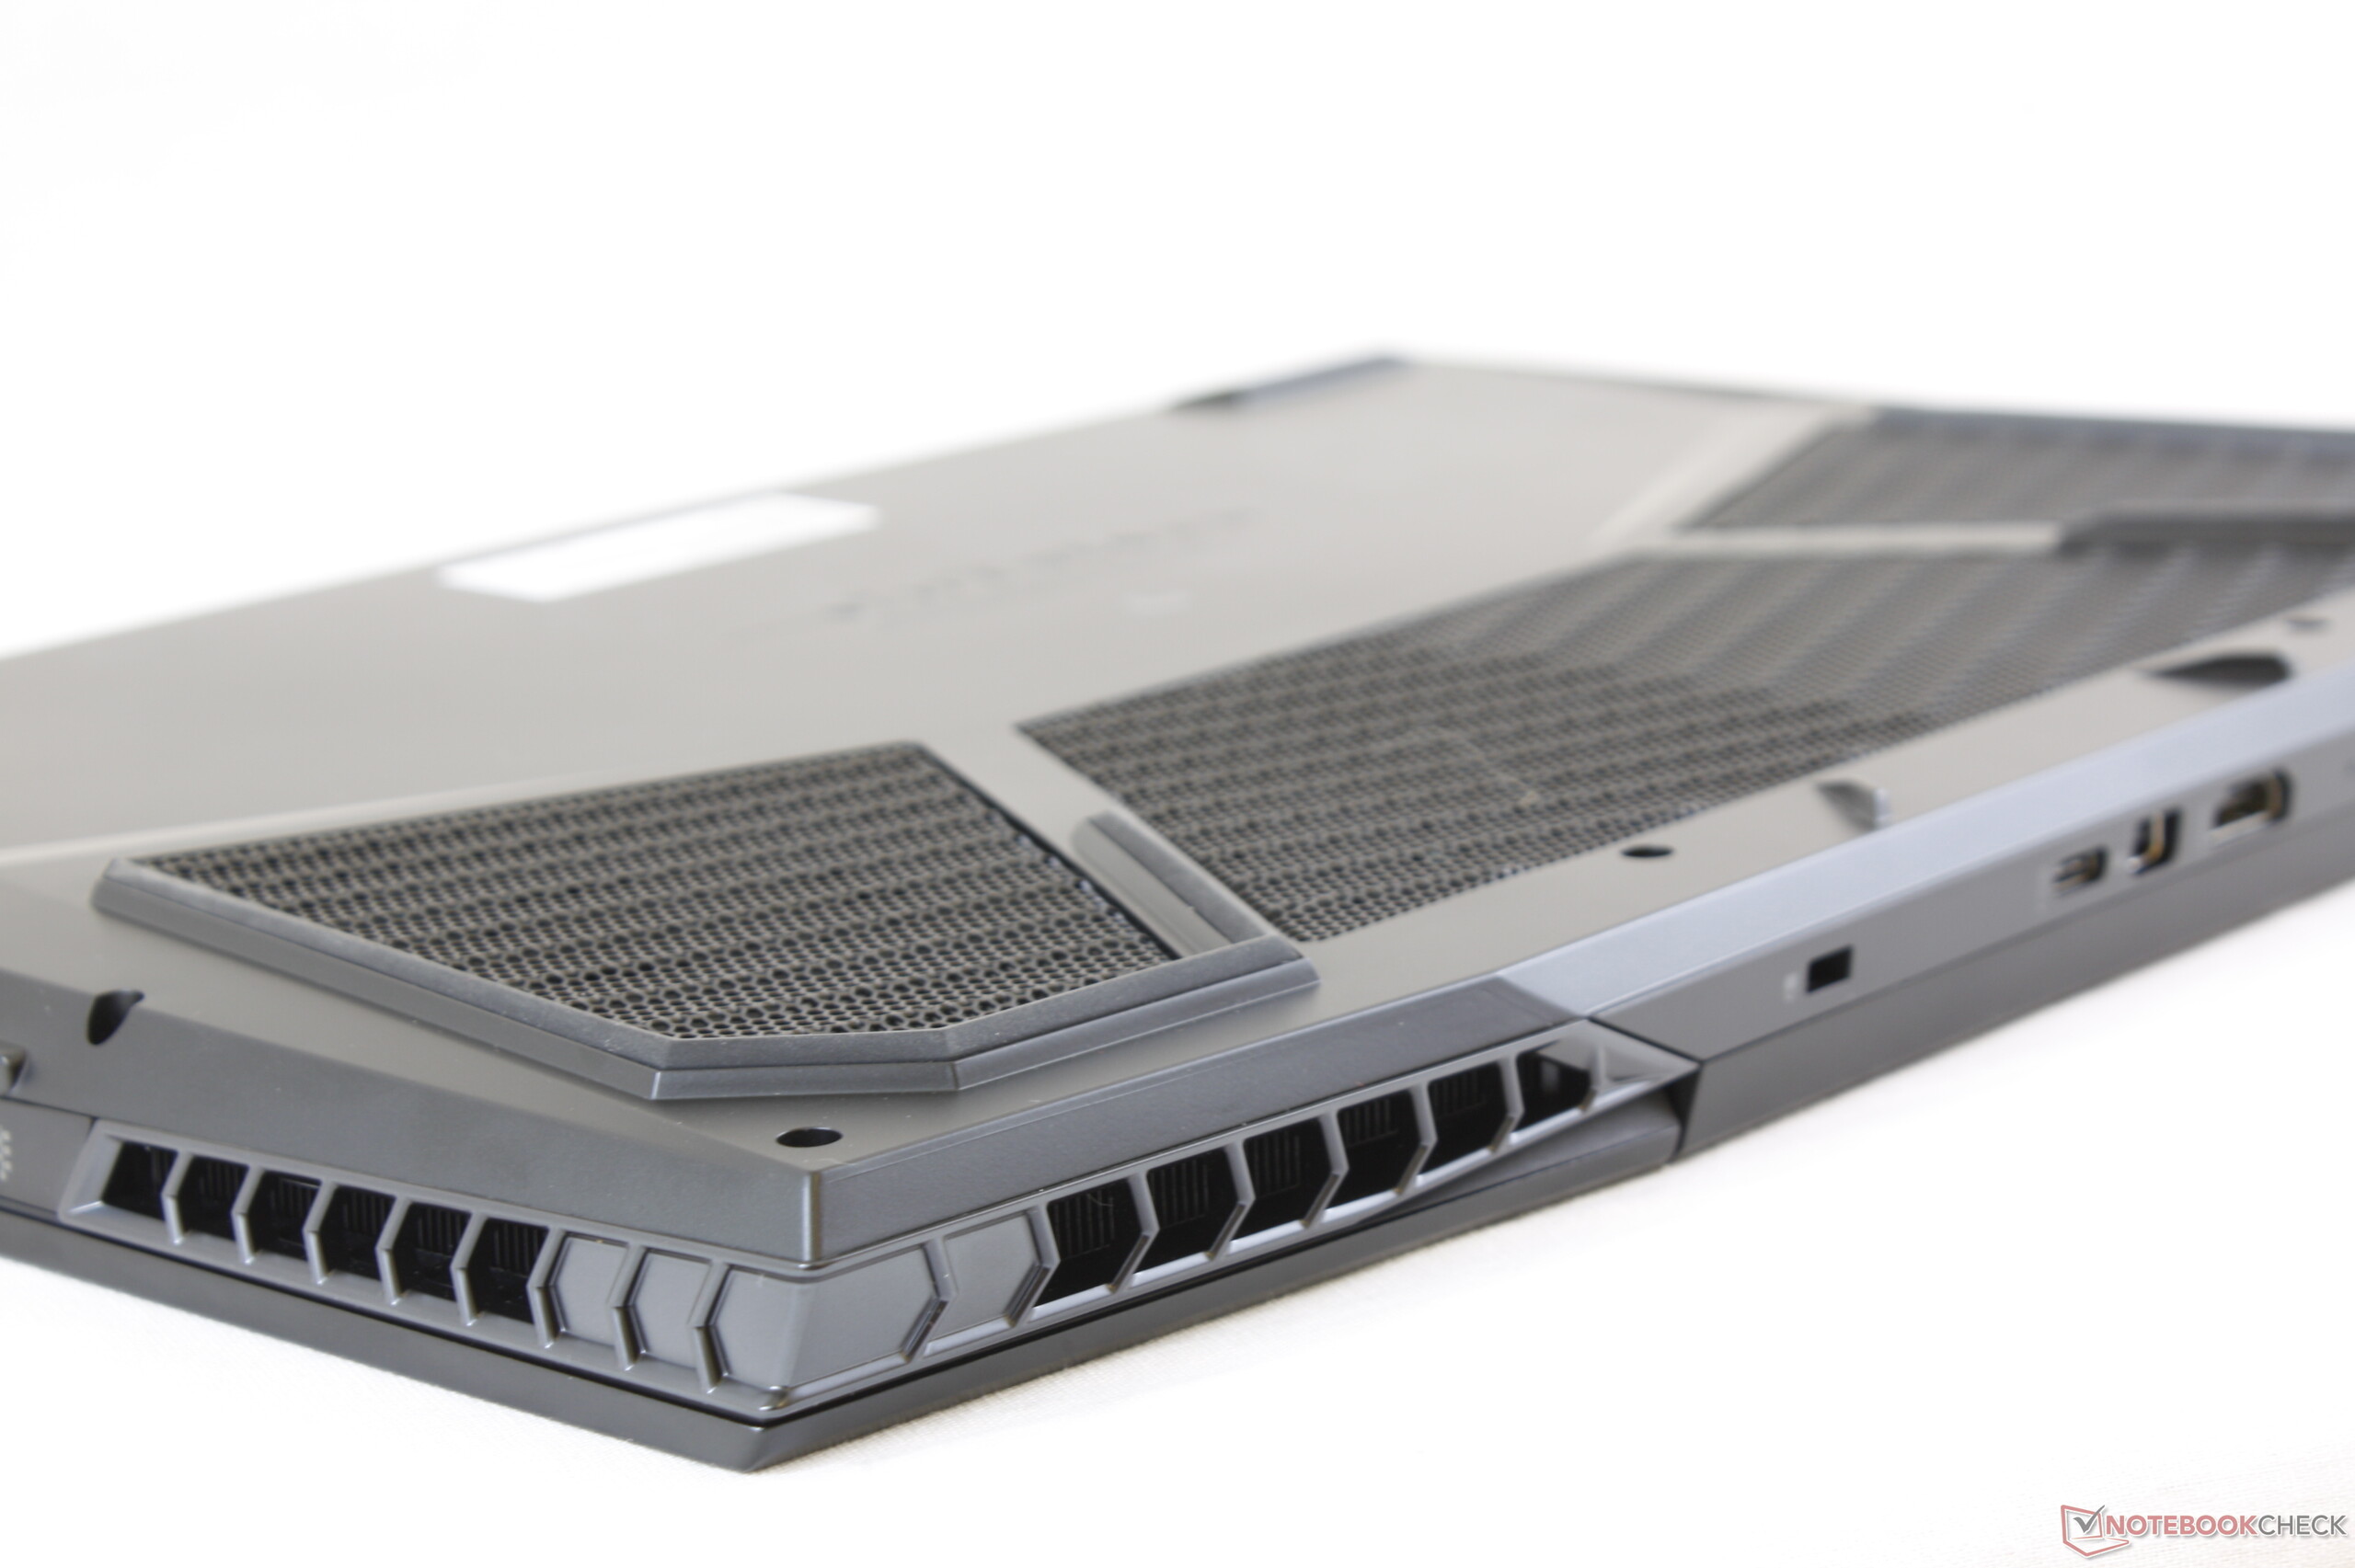
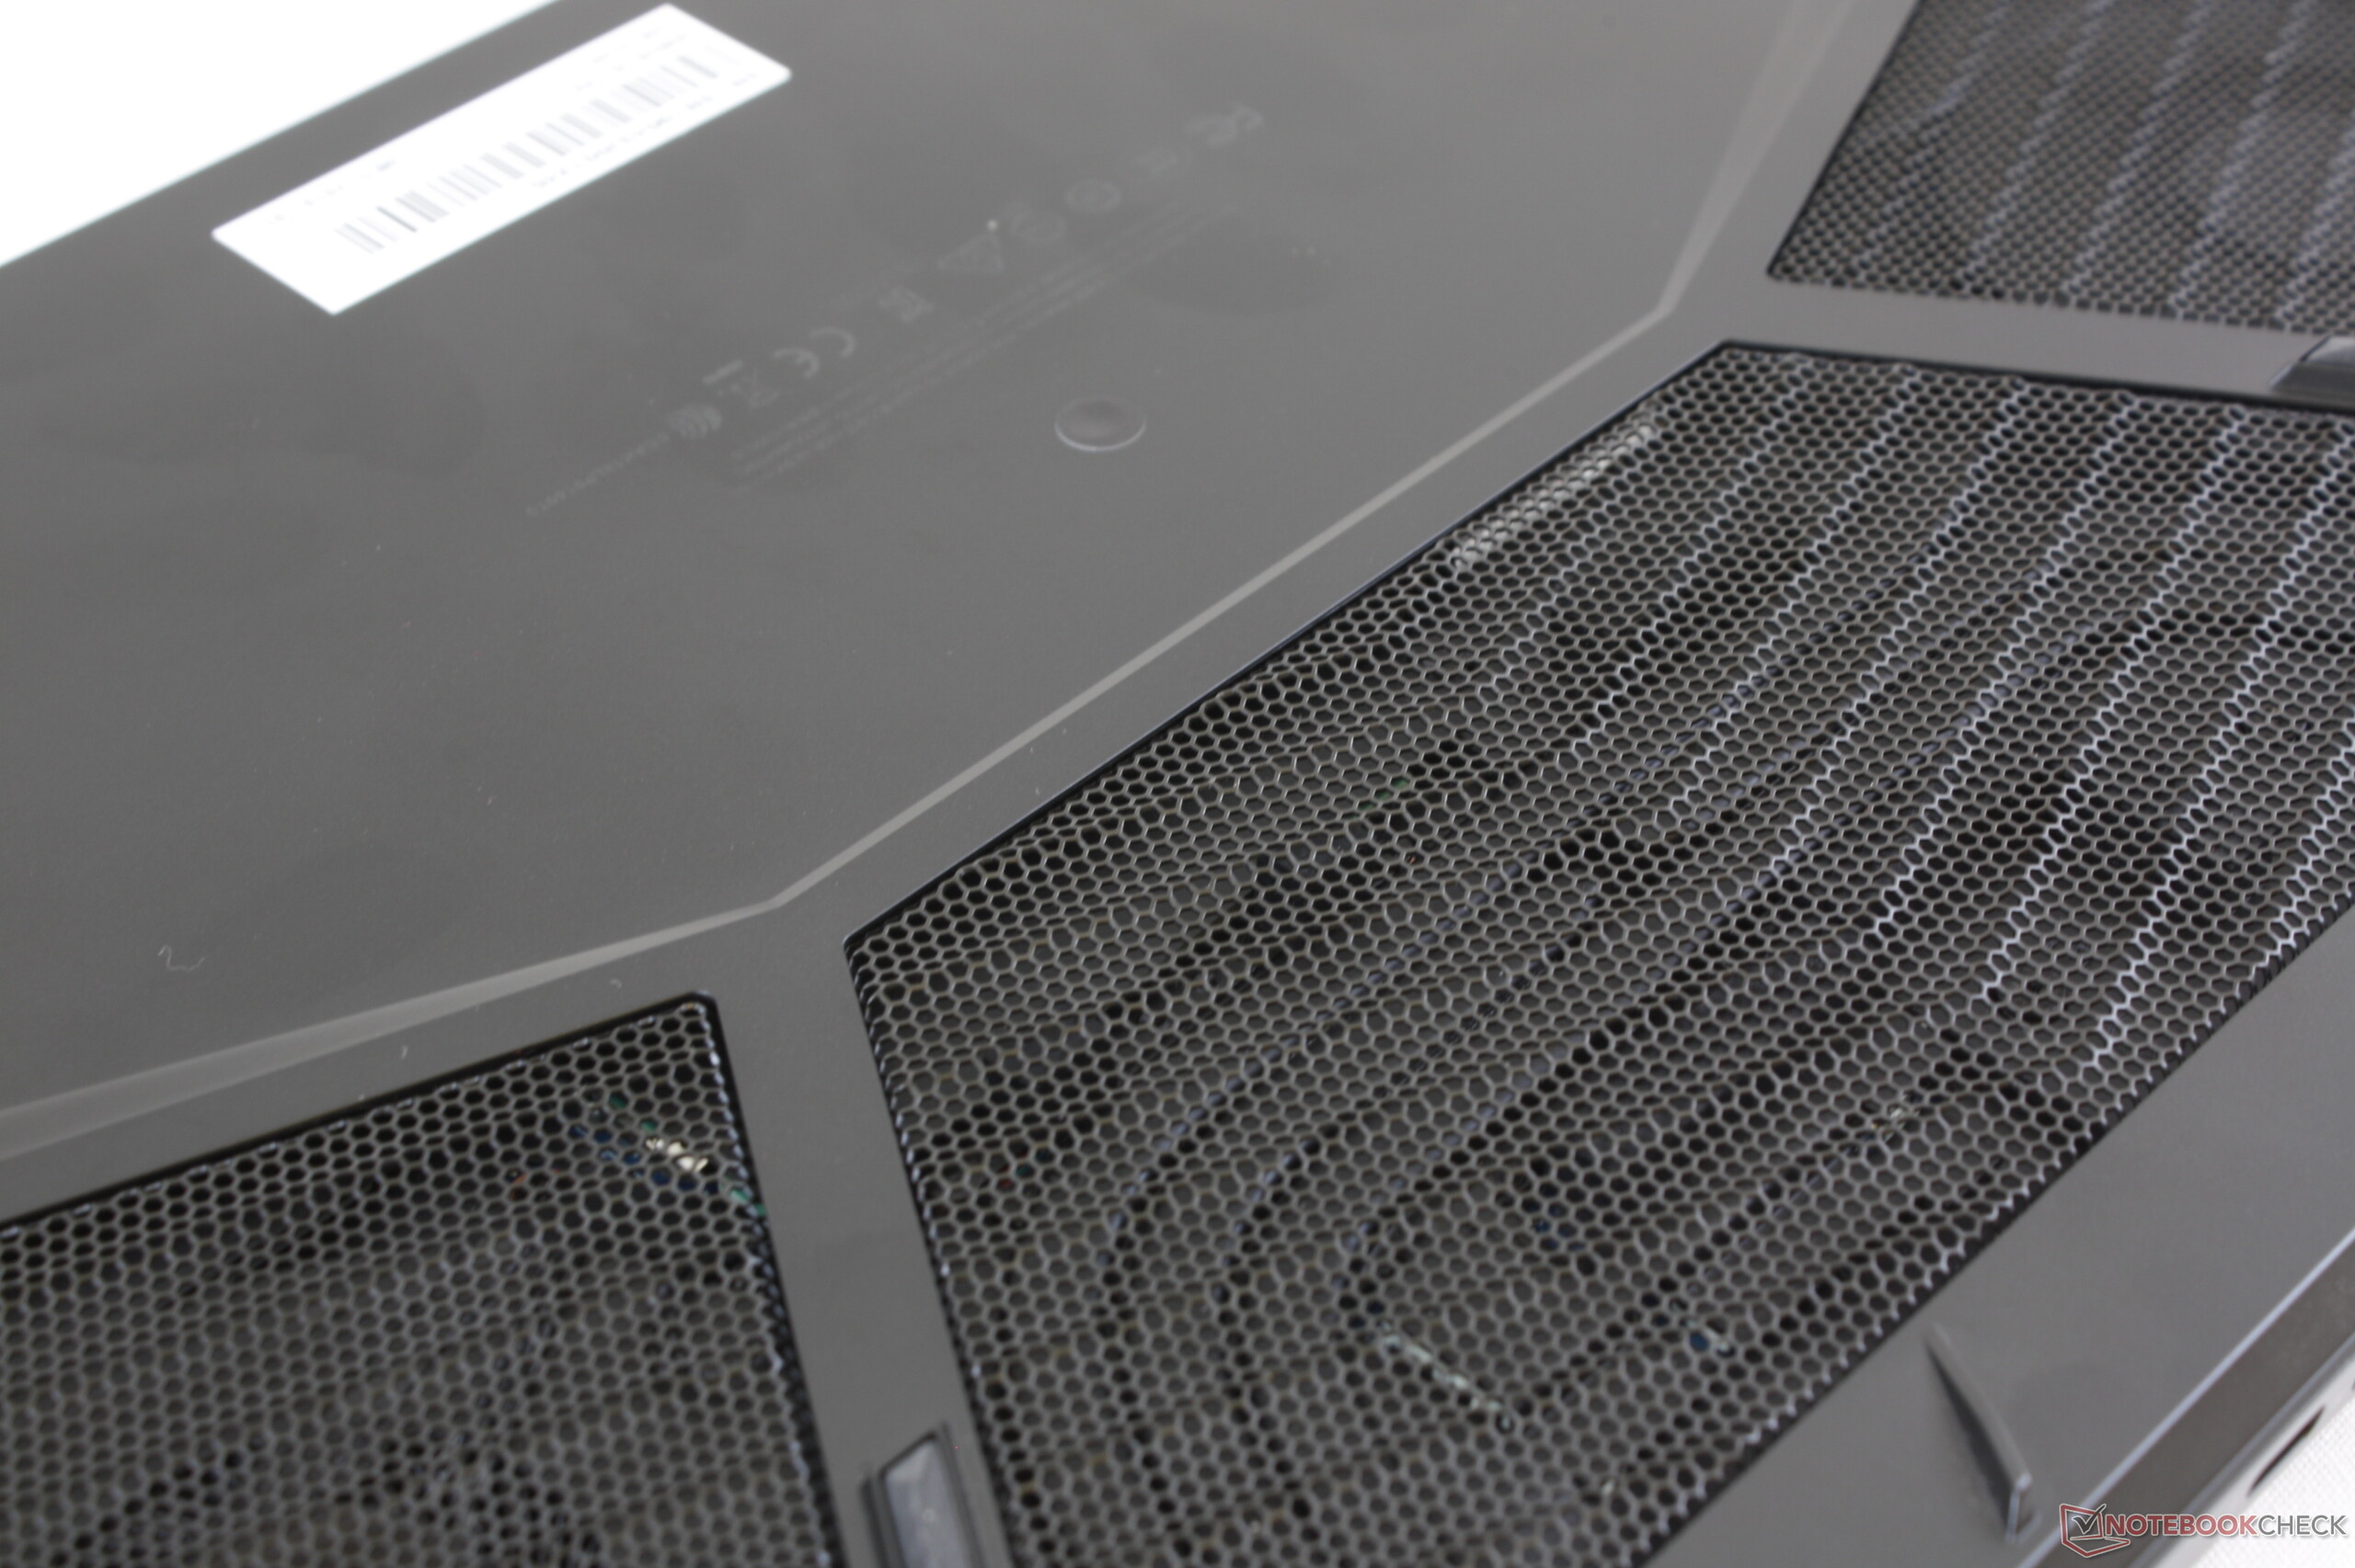
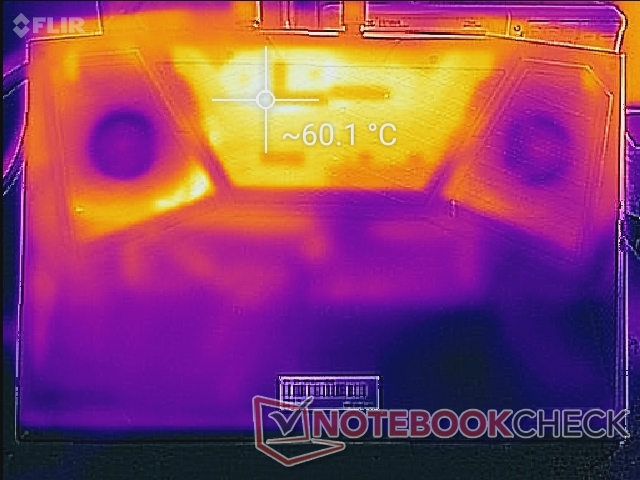
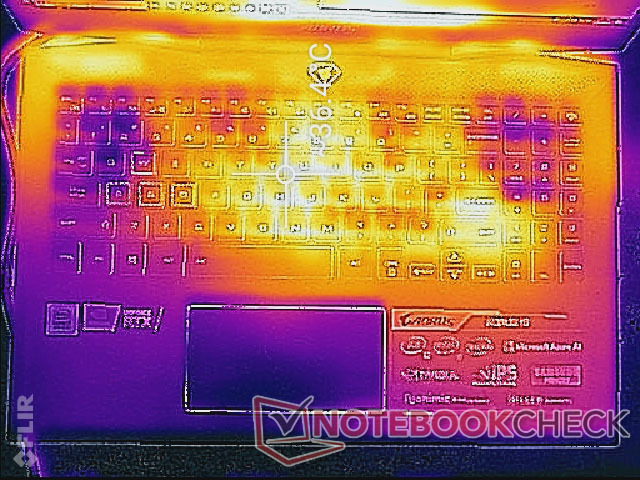
When running Witcher 3, the keyboard center and bottom surface can become as warm as 40 C and 60 C, respectively. The bottom of the Aorus 15 has a large mesh that exposes the entire cooling solution for more ventilation when compared to the older Aorus X5. As a result, it's thankfully only the heat pipe that is 60 C and not the mesh itself. Be sure to not block or impede airflow through any of the many ventilation grilles.
The hot spots are never on the palm rests, WASD keys, or NumPad keys for comfortable gaming no matter the load. This is an improvement over the older Aorus X5 where the palm rests and WASD keys can be 40 C or warmer.

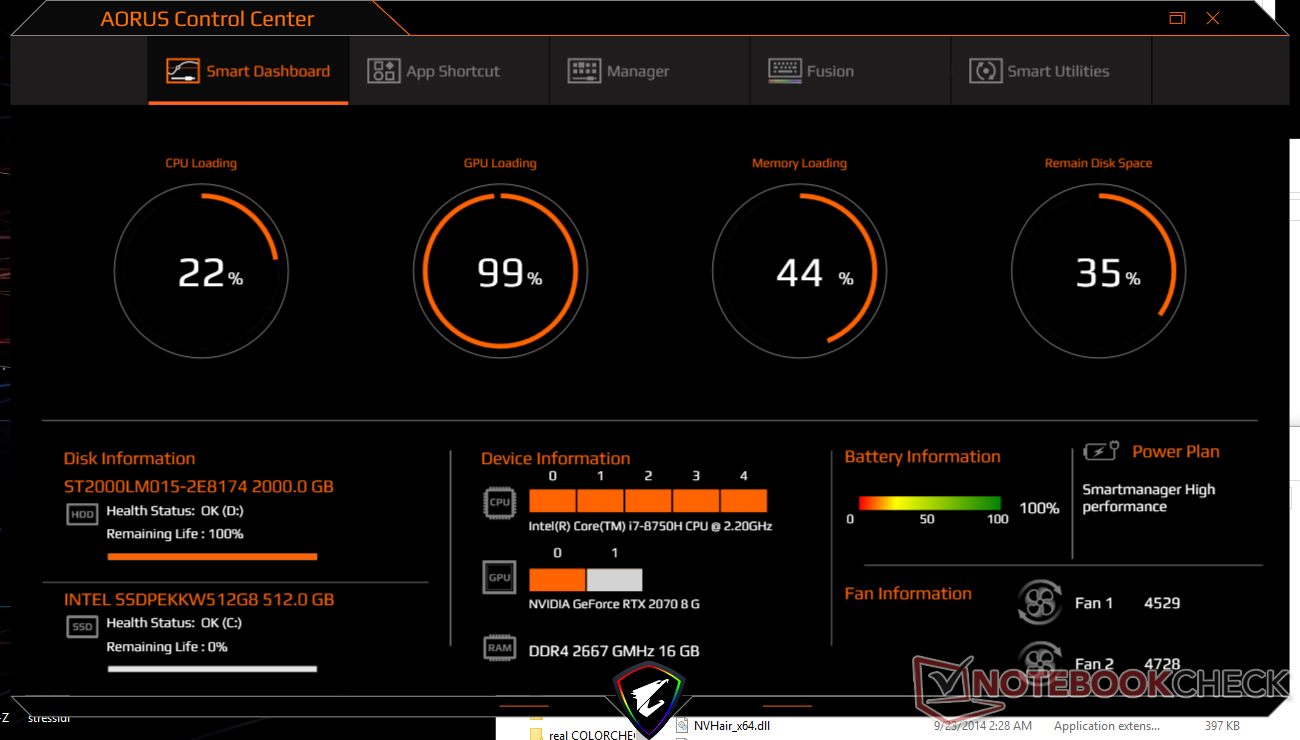
Stress Test
We subject the laptop to extreme loads in order to identify for any potential throttling or stability issues. When subjected to Prime95 load, the CPU can be observed running at up to 3.6 GHz for the first few seconds before hitting 80 C. Thereafter, clock rates drop to the 2.9 GHz to 3.0 GHz range for a cooler core temperature of 76 C. Although this is above the base clock rate of 2.2 GHz, it's still nowhere near the 3.9 GHz maximum Turbo Boost that the CPU is capable of. The behavior lines up with what we recorded during our CineBench loop test above where the CPU was fastest only during the initial loop.
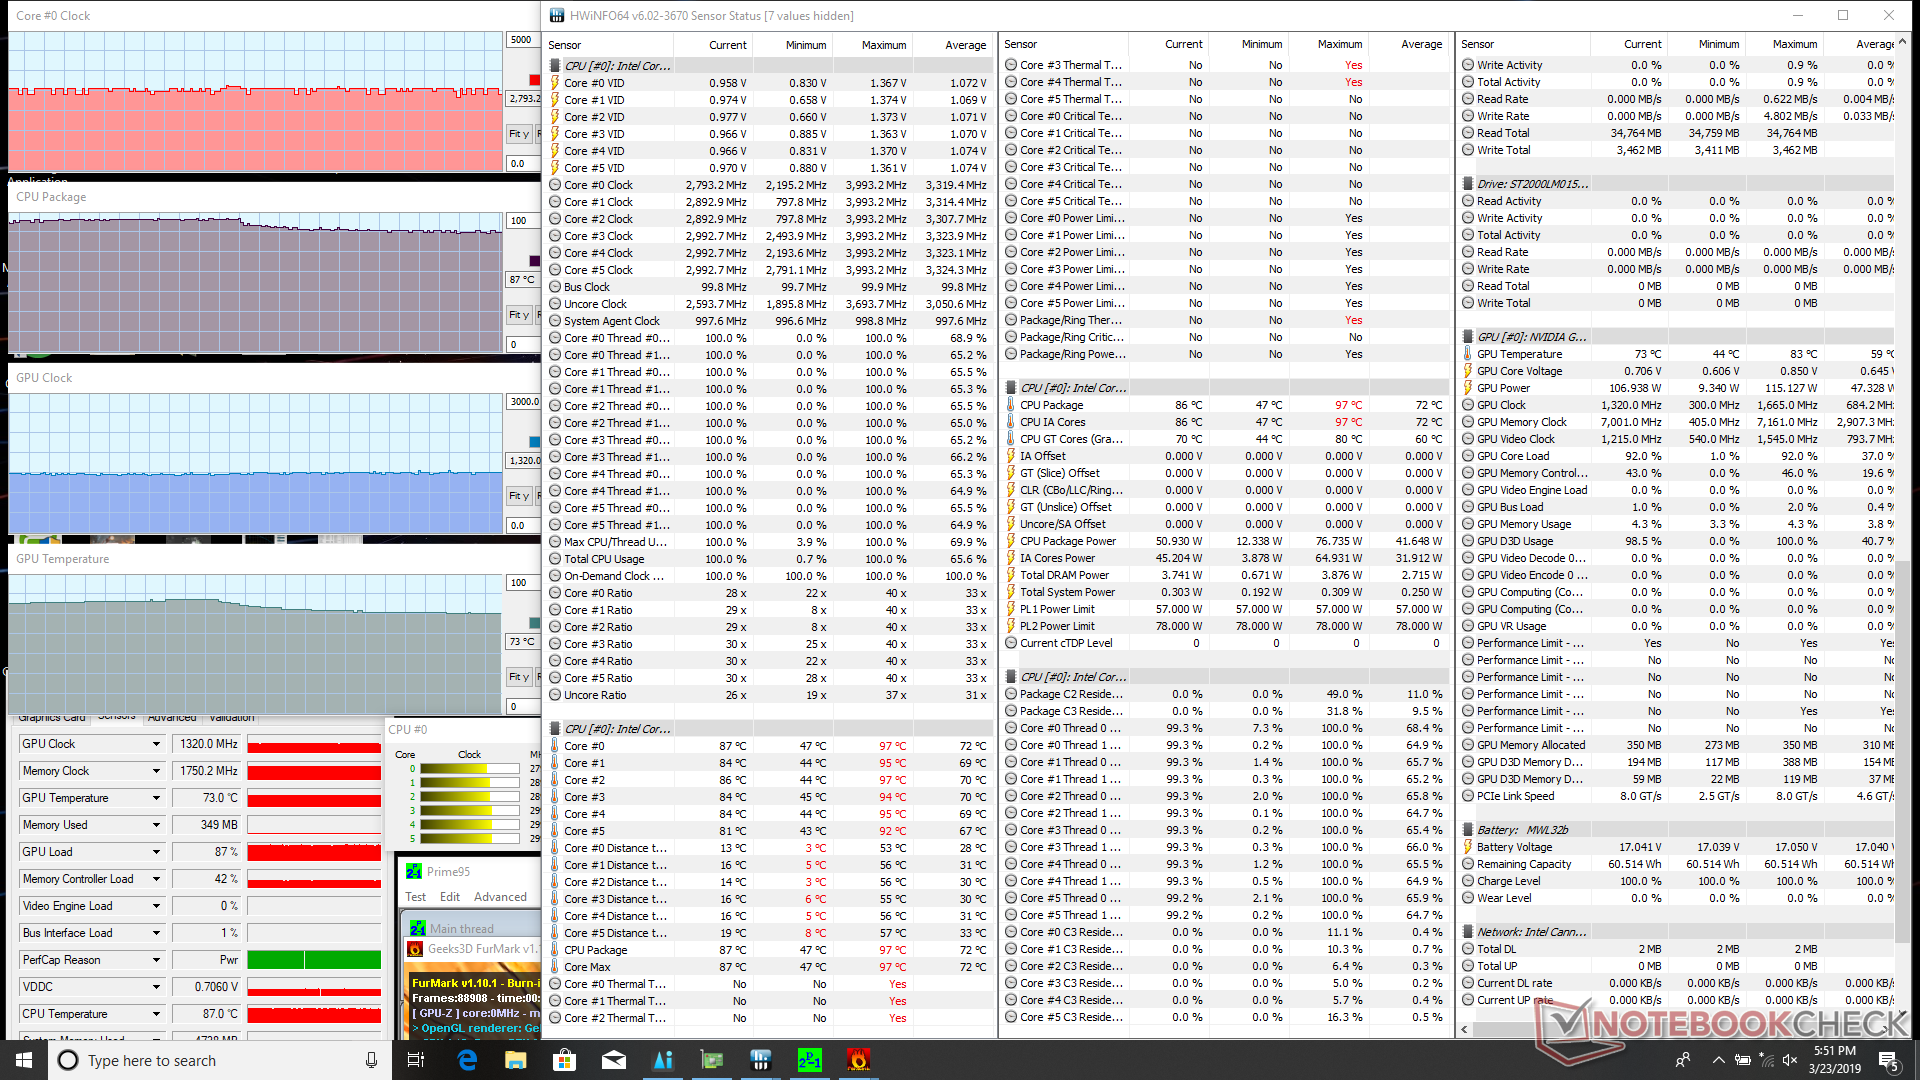
When running both Prime95 and FurMark simultaneously, CPU and GPU temperatures stabilize at up to 95 C and 83 C, respectively. If Max Fan mode is enabled, then temperatures drop to 87 C and 73 C, respectively.
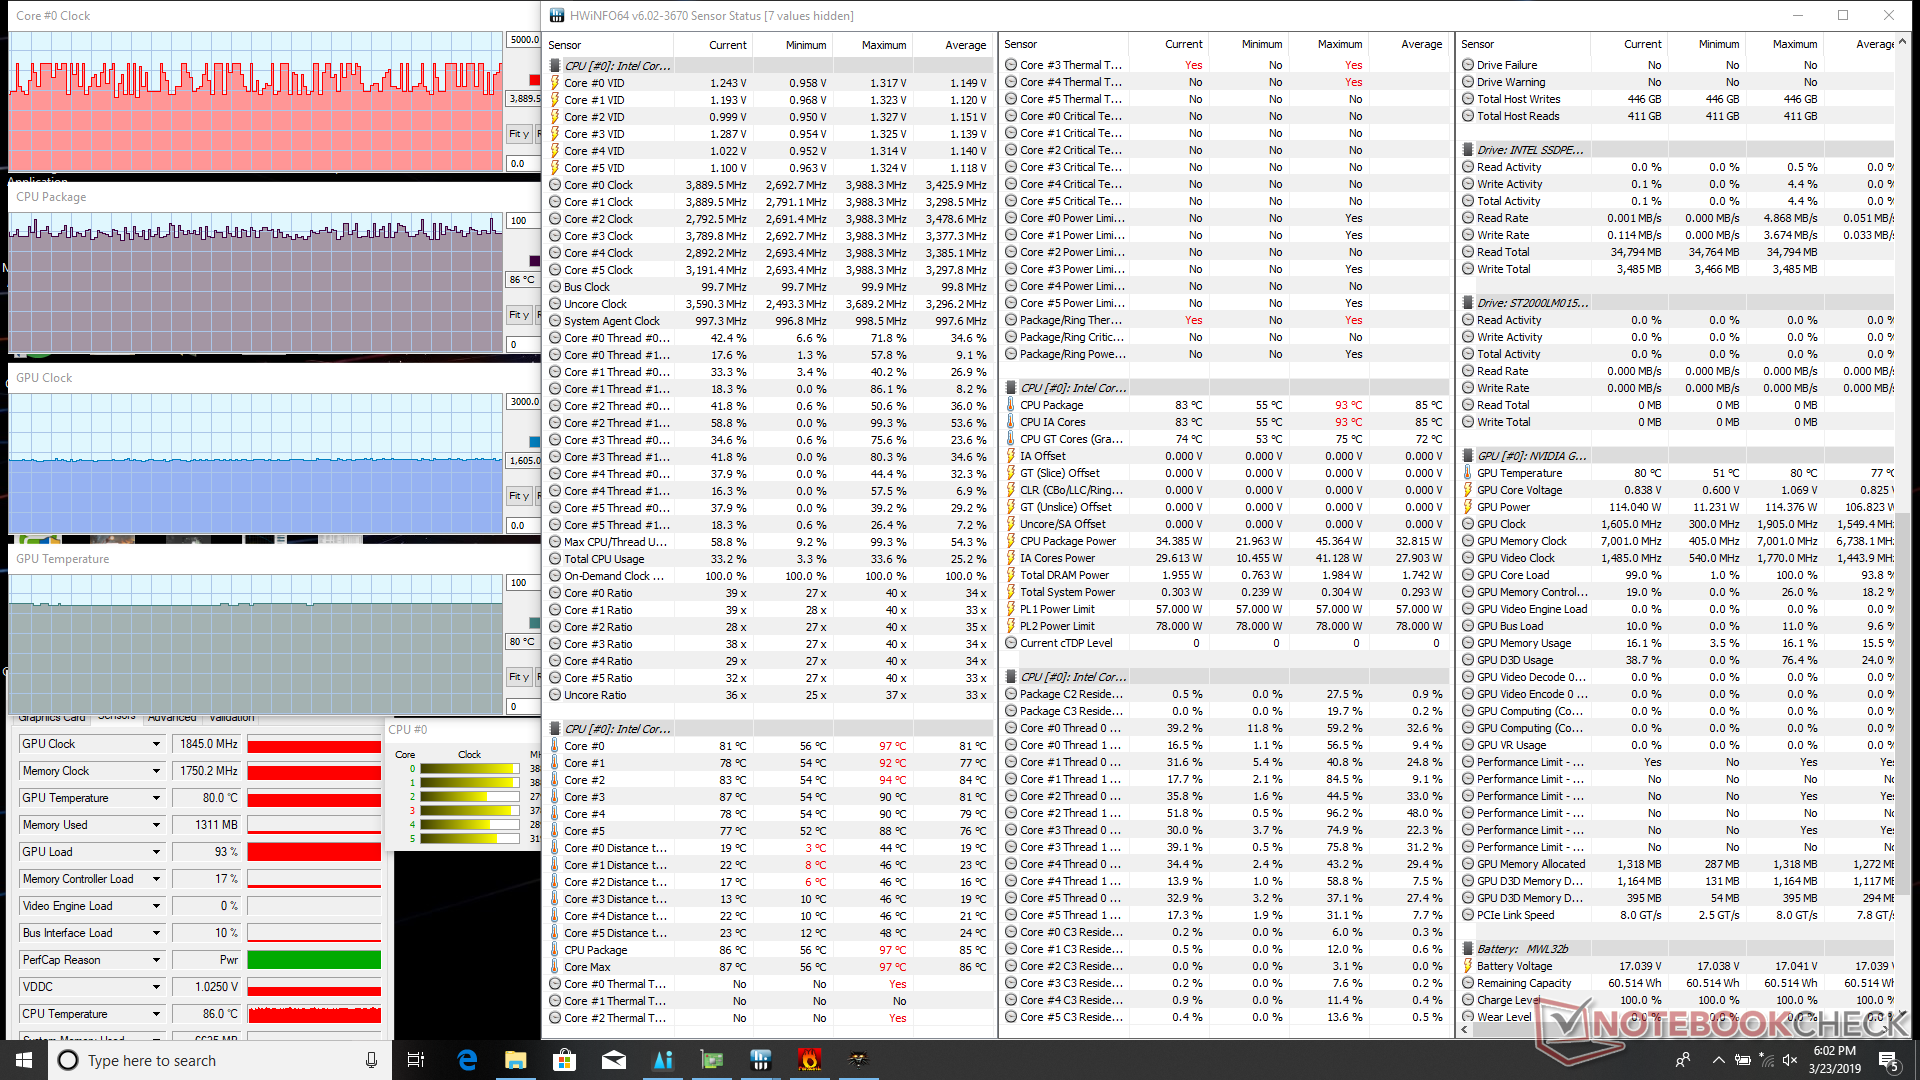
Witcher 3 is a more real-world representation of general gaming load. When running the game, the CPU and GPU stabilize at 86 C and 80 C, respectively, which are comparable numbers to the Asus ROG Strix GL504. Much larger systems like the 17.3-inch MSI GE75 can run the game at cooler core temperatures of about 70 C. The processors run warmer than we would like on the Aorus, but it's a fair trade-off for the small form factor and full-power RTX 2070 GPU.
Activating Max Fan mode when running Witcher 3 will cause CPU and GPU temperatures to drop to 77 C and 67 C, respectively, without tangibly increasing performance. The bump in fan noise, however, is substantial and so we don't find Max Fan mode to be necessary for most conditions.
Running on battery power will limit CPU and GPU performance. A 3DMark Fire Strike run on batteries returns Physics and Graphics scores of 7294 and 5292 points, respectively, compared to 13310 and 20227 points when on mains.
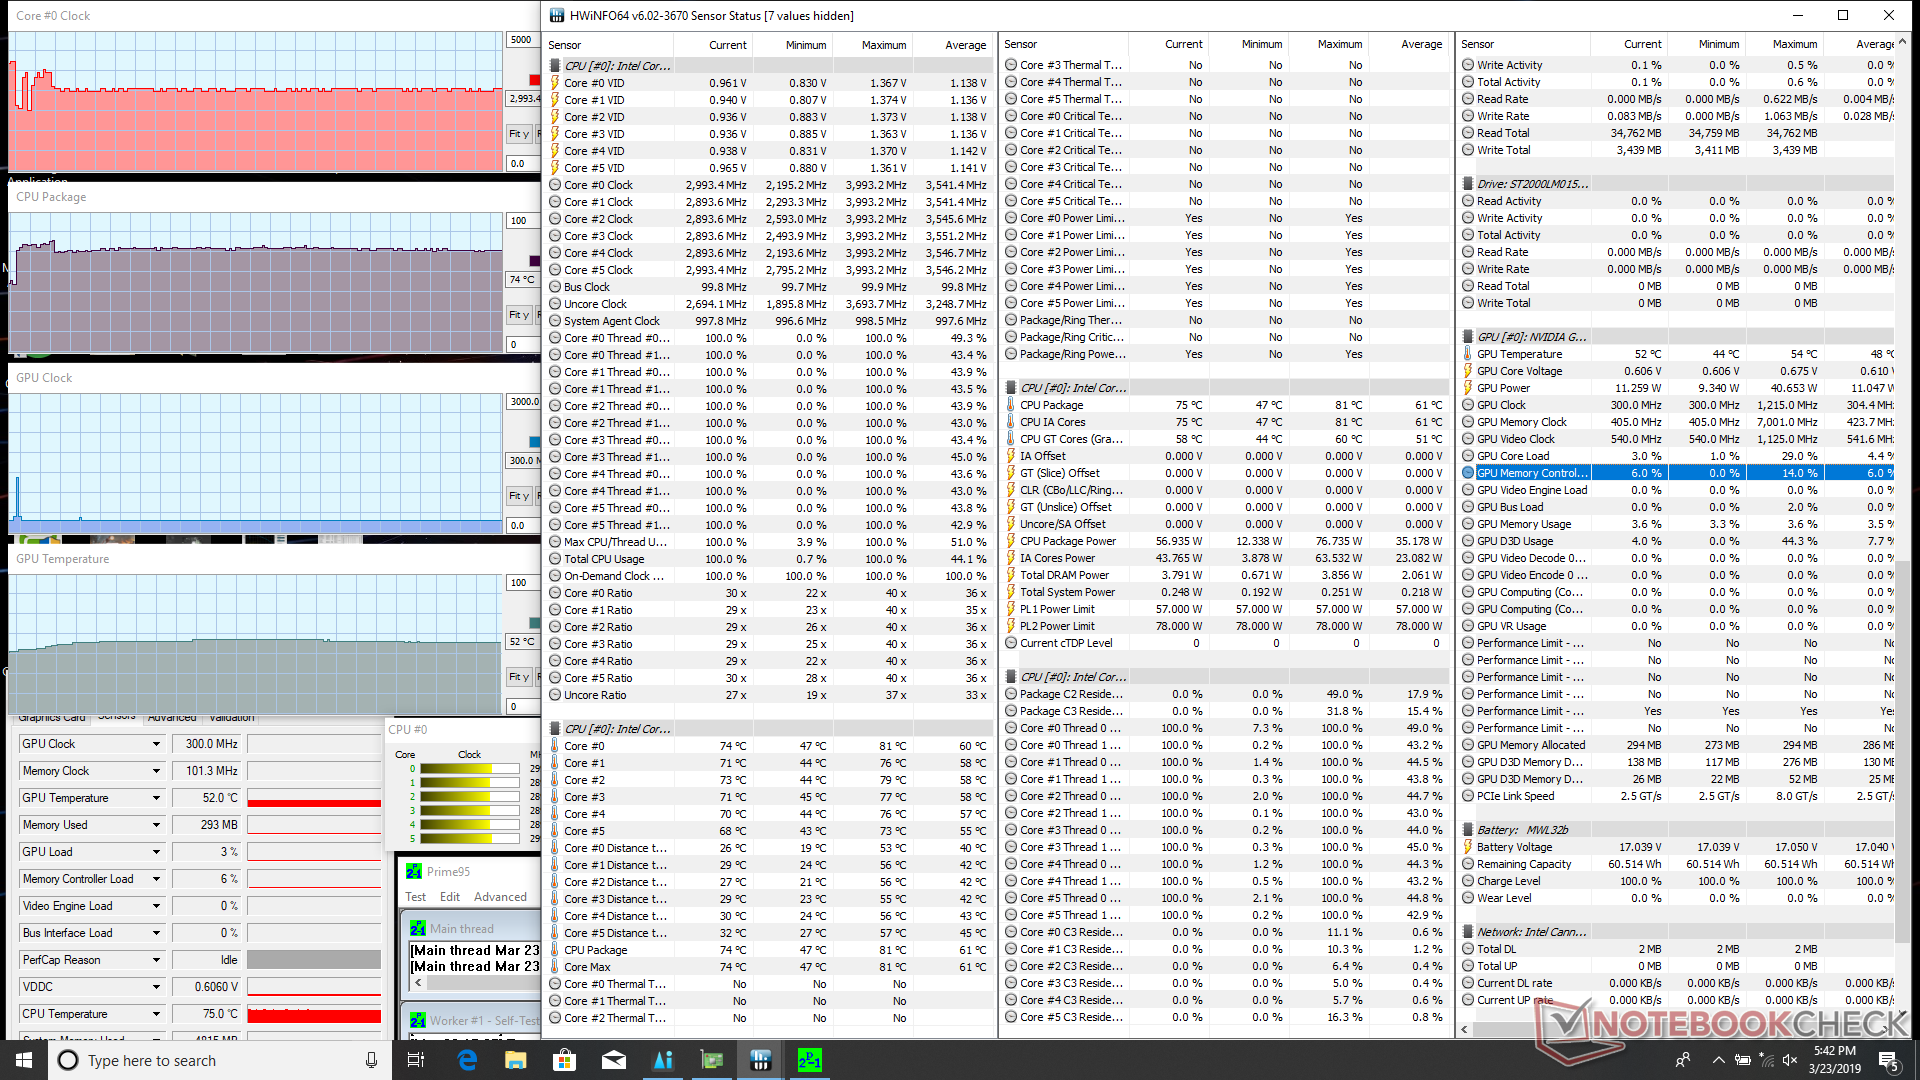
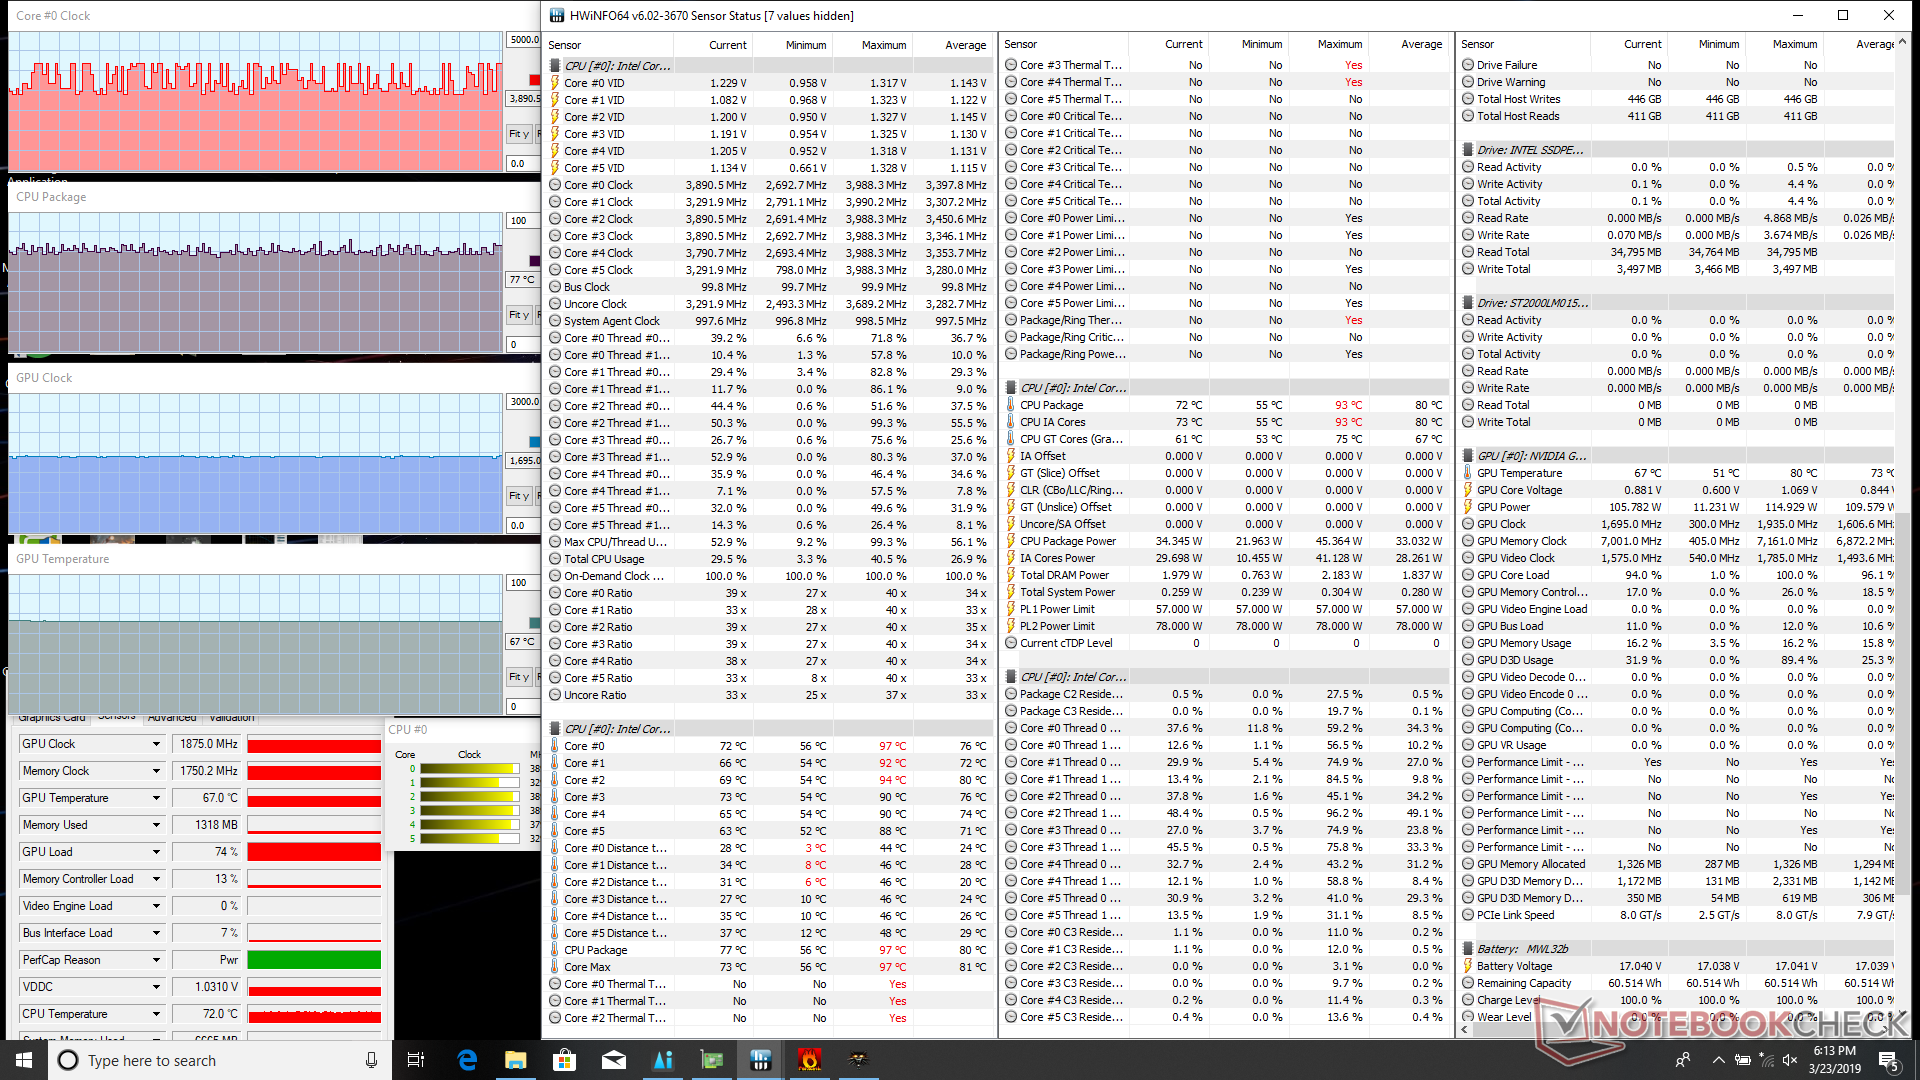
| CPU Clock (GHz) | GPU Clock (MHz) | Average CPU Temperature (°C) | Average GPU Temperature (°C) | |
| System Idle | -- | -- | 49 | 45 |
| Prime95 Stress | 2.9 - 3.0 | -- | 74 | -- |
| Prime95 + FurMark Stress | 2.8 - 2.9 | 1320 | 87 | 73 |
| Witcher 3 Stress | ~3.9 | 1845 | 86 | 80 |
| Witcher 3 Stress (Max Fan on) | ~3.9 | 1875 | 77 | 67 |
(+) The maximum temperature on the upper side is 36.6 °C / 98 F, compared to the average of 40.4 °C / 105 F, ranging from 21.2 to 68.8 °C for the class Gaming.
(-) The bottom heats up to a maximum of 56.8 °C / 134 F, compared to the average of 43.2 °C / 110 F
(+) In idle usage, the average temperature for the upper side is 26.6 °C / 80 F, compared to the device average of 33.9 °C / 93 F.
(±) Playing The Witcher 3, the average temperature for the upper side is 32.5 °C / 91 F, compared to the device average of 33.9 °C / 93 F.
(+) The palmrests and touchpad are cooler than skin temperature with a maximum of 29.4 °C / 84.9 F and are therefore cool to the touch.
(±) The average temperature of the palmrest area of similar devices was 28.8 °C / 83.8 F (-0.6 °C / -1.1 F).
Speakers
There is nothing special about the stereo 2 W speakers. Maximum volume is enough to fill a small room (and essentially necessary if on Max Fan mode) with roll-off at 250 Hz as we've come to expect from most laptops without dedicated subwoofers. High volume introduces no static or chassis vibrations.


Aorus 15 X9 audio analysis
(-) | not very loud speakers (69.3 dB)
Bass 100 - 315 Hz
(-) | nearly no bass - on average 19% lower than median
(-) | bass is not linear (15.9% delta to prev. frequency)
Mids 400 - 2000 Hz
(+) | balanced mids - only 2.4% away from median
(+) | mids are linear (6.6% delta to prev. frequency)
Highs 2 - 16 kHz
(+) | balanced highs - only 3.3% away from median
(±) | linearity of highs is average (8.7% delta to prev. frequency)
Overall 100 - 16.000 Hz
(±) | linearity of overall sound is average (22.6% difference to median)
Compared to same class
» 81% of all tested devices in this class were better, 5% similar, 14% worse
» The best had a delta of 6%, average was 18%, worst was 132%
Compared to all devices tested
» 67% of all tested devices were better, 6% similar, 28% worse
» The best had a delta of 4%, average was 24%, worst was 134%
Apple MacBook 12 (Early 2016) 1.1 GHz audio analysis
(+) | speakers can play relatively loud (83.6 dB)
Bass 100 - 315 Hz
(±) | reduced bass - on average 11.3% lower than median
(±) | linearity of bass is average (14.2% delta to prev. frequency)
Mids 400 - 2000 Hz
(+) | balanced mids - only 2.4% away from median
(+) | mids are linear (5.5% delta to prev. frequency)
Highs 2 - 16 kHz
(+) | balanced highs - only 2% away from median
(+) | highs are linear (4.5% delta to prev. frequency)
Overall 100 - 16.000 Hz
(+) | overall sound is linear (10.2% difference to median)
Compared to same class
» 7% of all tested devices in this class were better, 2% similar, 91% worse
» The best had a delta of 5%, average was 18%, worst was 53%
Compared to all devices tested
» 5% of all tested devices were better, 1% similar, 94% worse
» The best had a delta of 4%, average was 24%, worst was 134%
Energy Management
Power Consumption
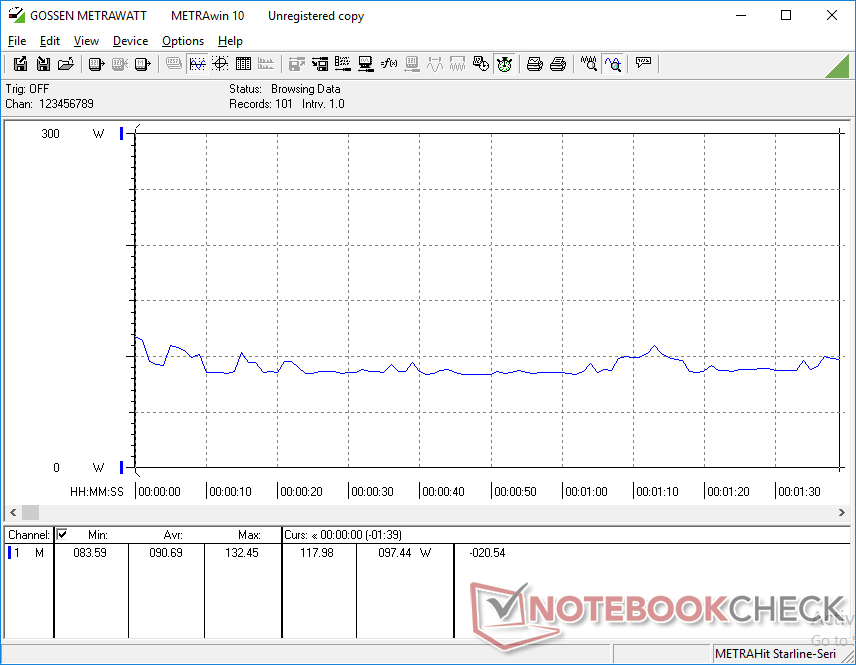
Power consumption when idling is nearly identical to the last generation Aorus X5. Unfortunately, this is hardly a compliment as the Aorus system draws much more power than competing 15.6-inch gaming notebooks during low loads as shown by our table below. Expect an average consumption of almost 35 W simply by idling on desktop compared to less than half that on the MSI GS65 or Alienware m15.
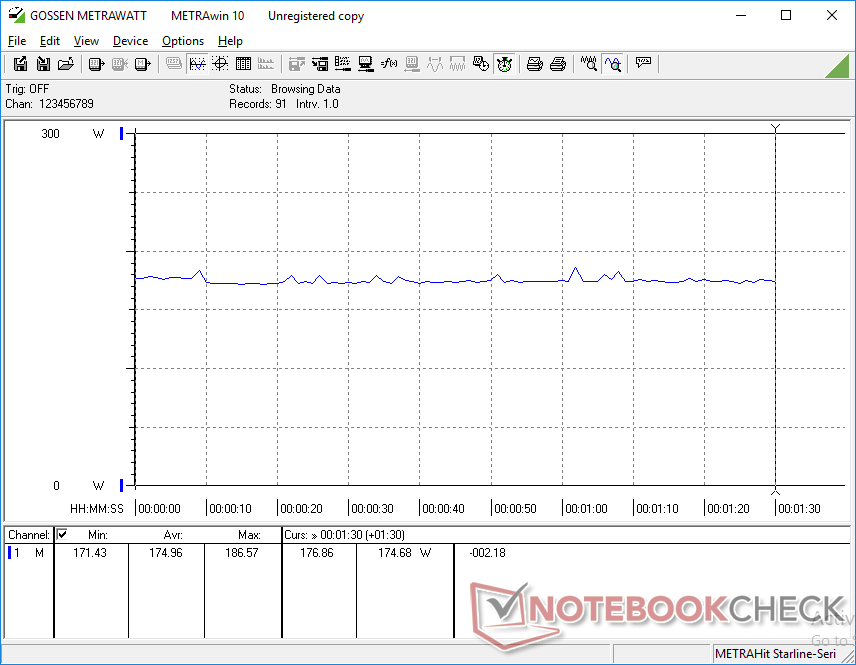
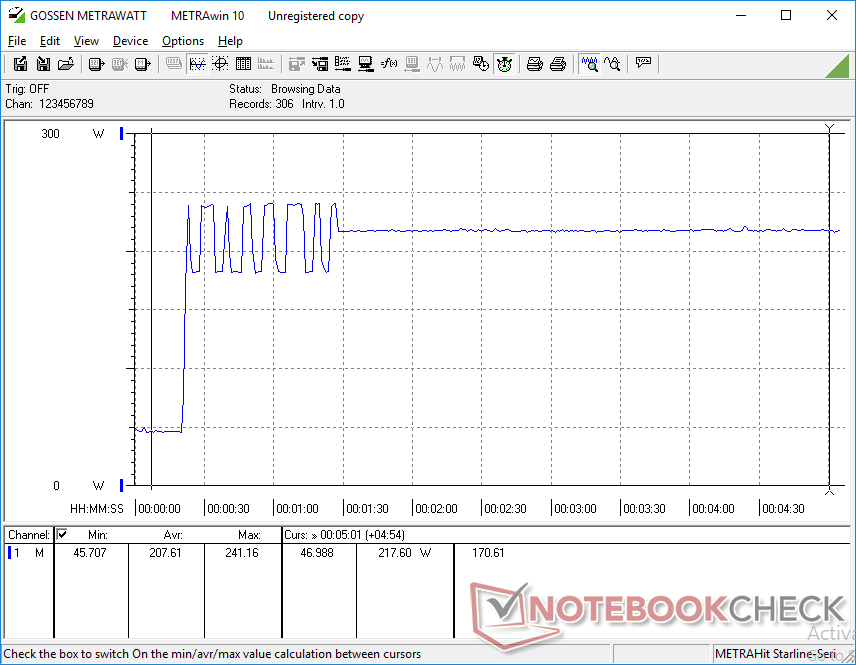
Consumption becomes more normal during higher loads like gaming. When running Witcher 3, we're able to record a constant draw of 175 W compared to 155 W on the Razer Blade 15 with the RTX 2070 Max-Q graphics. It's a 13 percent increase in consumption for an 11 to 16 percent boost in graphics performance over the Aorus rival.
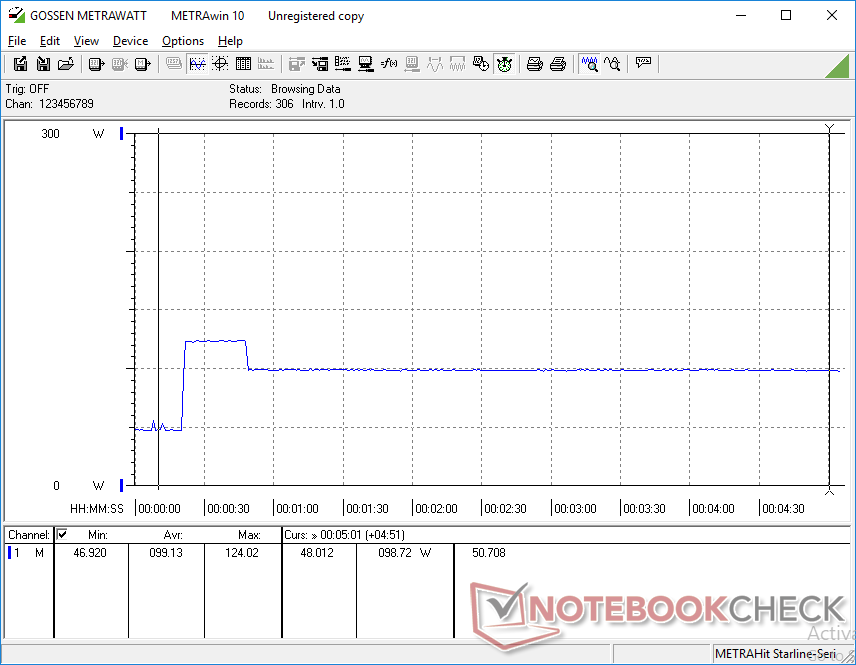
Running both Prime95 and FurMark simultaneously will draw up to 241 W from the medium-sized (~15.5 x 7.5 x 3 cm) 230 W AC adapter. This is unsustainable, however, and power draw eventually settles at 217 W as shown by our graph below.
Older Aorus laptops had AC adapters with USB ports whereas this newer adapter does not. The Aorus 15-Y9 with RTX 2060 graphics ships with a lighter 180 W AC adapter instead.
| Off / Standby | |
| Idle | |
| Load |
|
Key:
min: | |
| Aorus 15 X9 i7-8750H, GeForce RTX 2070 Mobile, Intel SSD 760p SSDPEKKW512G8, IPS, 1920x1080, 15.6" | Razer Blade 15 RTX 2070 Max-Q i7-8750H, GeForce RTX 2070 Max-Q, Samsung SSD PM981 MZVLB512HAJQ, IPS, 1920x1080, 15.6" | Aorus X5 v8 i7-8850H, GeForce GTX 1070 Mobile, Toshiba NVMe THNSN5512GPU7, IPS, 1920x1080, 15.6" | Gigabyte Aero 15-X9 i7-8750H, GeForce RTX 2070 Max-Q, Intel SSD 760p SSDPEKKW010T8, IPS, 1920x1080, 15.6" | MSI GS65 Stealth Thin 8RE-051US i7-8750H, GeForce GTX 1060 Mobile, Samsung SSD PM981 MZVLB256HAHQ, IPS, 1920x1080, 15.6" | Alienware m15 GTX 1070 Max-Q i7-8750H, GeForce GTX 1070 Max-Q, Toshiba XG5 KXG50ZNV512G, IPS, 1920x1080, 15.6" | |
|---|---|---|---|---|---|---|
| Power Consumption | 34% | -2% | 30% | 38% | 37% | |
| Idle Minimum * (Watt) | 26 | 10.4 60% | 25 4% | 16 38% | 8.7 67% | 7.6 71% |
| Idle Average * (Watt) | 30.8 | 14.6 53% | 31 -1% | 18 42% | 13 58% | 13.8 55% |
| Idle Maximum * (Watt) | 34.9 | 16.3 53% | 33 5% | 23 34% | 14.3 59% | 14.6 58% |
| Load Average * (Watt) | 90.7 | 88.5 2% | 102 -12% | 88 3% | 107.4 -18% | 97.6 -8% |
| Witcher 3 ultra * (Watt) | 175 | 155.4 11% | 194 -11% | 120 31% | 129 26% | 145.8 17% |
| Load Maximum * (Watt) | 241.2 | 182.4 24% | 239 1% | 167 31% | 151.5 37% | 172.5 28% |
* ... smaller is better
Battery Life
Runtimes have always been quite poor on Aorus laptops and now it's even worse on the Aorus 15. Battery capacity has been reduced significantly from the last generation Aorus X5 (90 Wh vs. 62 Wh) and when coupled with the lack of Optimus graphics switching, we're only able to record a WLAN runtime of just 1.5 hours. Even idling on desktop at the lowest settings possible (minimum brightness, Power Saver, WLAN off) results in a runtime of just 105 minutes. Results are below average for the category.
Charging from empty to full capacity takes about 1.5 hours.
| Aorus 15 X9 i7-8750H, GeForce RTX 2070 Mobile, 62 Wh | Aorus X5 v7 i7-7820HK, GeForce GTX 1070 Mobile, 94 Wh | Razer Blade 15 RTX 2070 Max-Q i7-8750H, GeForce RTX 2070 Max-Q, 80 Wh | Gigabyte Aero 15-X9 i7-8750H, GeForce RTX 2070 Max-Q, 94.24 Wh | MSI GS65 Stealth Thin 8RE-051US i7-8750H, GeForce GTX 1060 Mobile, 82 Wh | Alienware m15 GTX 1070 Max-Q i7-8750H, GeForce GTX 1070 Max-Q, 90 Wh | |
|---|---|---|---|---|---|---|
| Battery runtime | 63% | 296% | 300% | 154% | 311% | |
| Reader / Idle (h) | 1.8 | 3.5 94% | 11.4 533% | 9.2 411% | 10.5 483% | |
| WiFi v1.3 (h) | 1.6 | 2.5 56% | 6.5 306% | 6.4 300% | 6.2 288% | 7.7 381% |
| Load (h) | 1 | 1.4 40% | 1.5 50% | 2.9 190% | 1.2 20% | 1.7 70% |
Pros
Cons
Verdict

The Aorus 15 takes several steps forward and a few steps back when compared to the older Aorus X5. It's smaller, lighter, more powerful, and runs cooler than the last generation model with a stronger chassis to top it all off. The trackpad and lid in particular have been improved to be easier to use and more rigid, respectively, and ventilation is stronger.
However, there are a handful of disadvantages. Last year's Aorus X5 integrates a full-size SD reader, more storage bays, per-key RGB lighting, G-Sync, a larger battery, a larger trackpad, and dedicated Macro keys. To see all these features missing on the newer Aorus 15 is a bit disappointing because we're used to Aorus products being enthusiast offerings with all the bells and whistles often associated with high-end gaming laptops. The Aorus 15 sits somewhere between mid-range and high-end in this regard.
Other aspects of the Aorus X5 weren't improved at all on the Aorus 15. Fan noise, battery life, and the lack of Thunderbolt 3 are still absent or even worse on this latest iteration. Raw graphics performance over the GTX 1070 and RTX 2070 Max-Q is about 15 to 25 percent each depending on the title and resolution.
A big advantage of the Aorus 15 is its price. Our RTX 2070 SKU in particular is $2000 on Xotic PC compared to $2100 for the MSI GS65 or $2400 for the Razer Blade 15 with slower RTX 2060 or RTX 2070 Max-Q graphics. The Asus ROG Scar GL504GW is even cheaper than the Aorus 15 at $1900 with the same CPU and GPU to make it a very compelling alternative.
It's the most balanced Aorus laptop to date both inside and out. There is a list of missing features we'd love to see on future iterations like per-key RGB lighting, G-Sync, and Thunderbolt 3 to make the Aorus 15 more worthwhile in the enthusiast gaming space.
Aorus 15 X9
- 03/26/2019 v6 (old)
Allen Ngo
Price comparison
