Asus ROG Strix GL504GM Hero II (i7-8750H, GTX 1060, FHD) Laptop Review
Do you find the Asus ROG G700 series too big and the ROG Zephyrus GX series too small? Luckily for you, Asus has a middle-ground solution that also happens to retail for hundreds of dollars less. Called the ROG GL504 series, the new models directly succeed the last generation GL503 series by incorporating a brand new narrow-bezel chassis design inspired by the pricier Zephyrus series.
The GL504 is currently available in two major SKUs: the GL504GM Hero II with the GTX 1060 and the GL504GS Scar II with the GTX 1070. Both configurations otherwise share the same chassis design with very similar internals. We recommend checking out our existing review on the GL504GS for more details on case quality, connectivity features, keyboard, and more. Our review on the GL504GM will instead focus on performance and how much it differs from the more powerful GL504GS.
As a mid-range 15-inch gaming laptop, competition is fierce with many available examples including the Lenovo Legion Y530, HP Omen 15, MSI GL series, Gigabyte Aero 15x, Acer Aspire V15, and the Dell Gaming G7 series.
Case
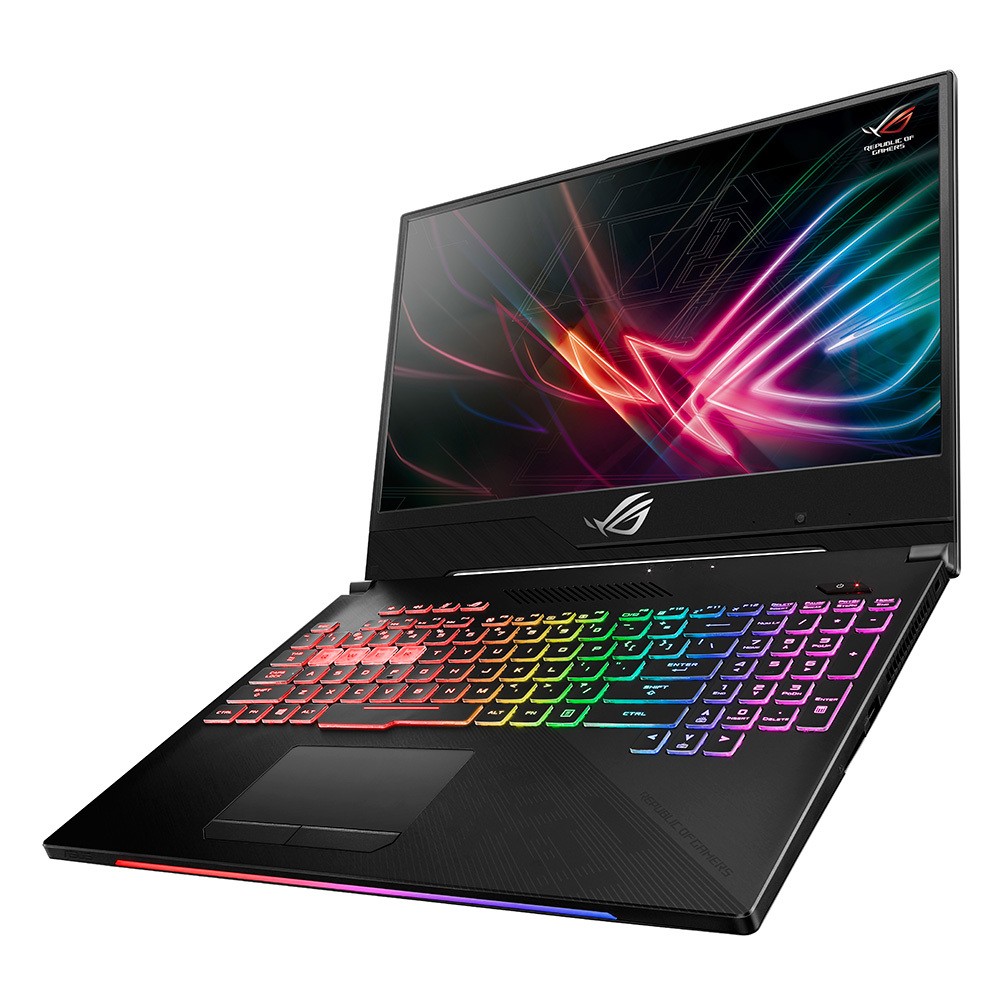
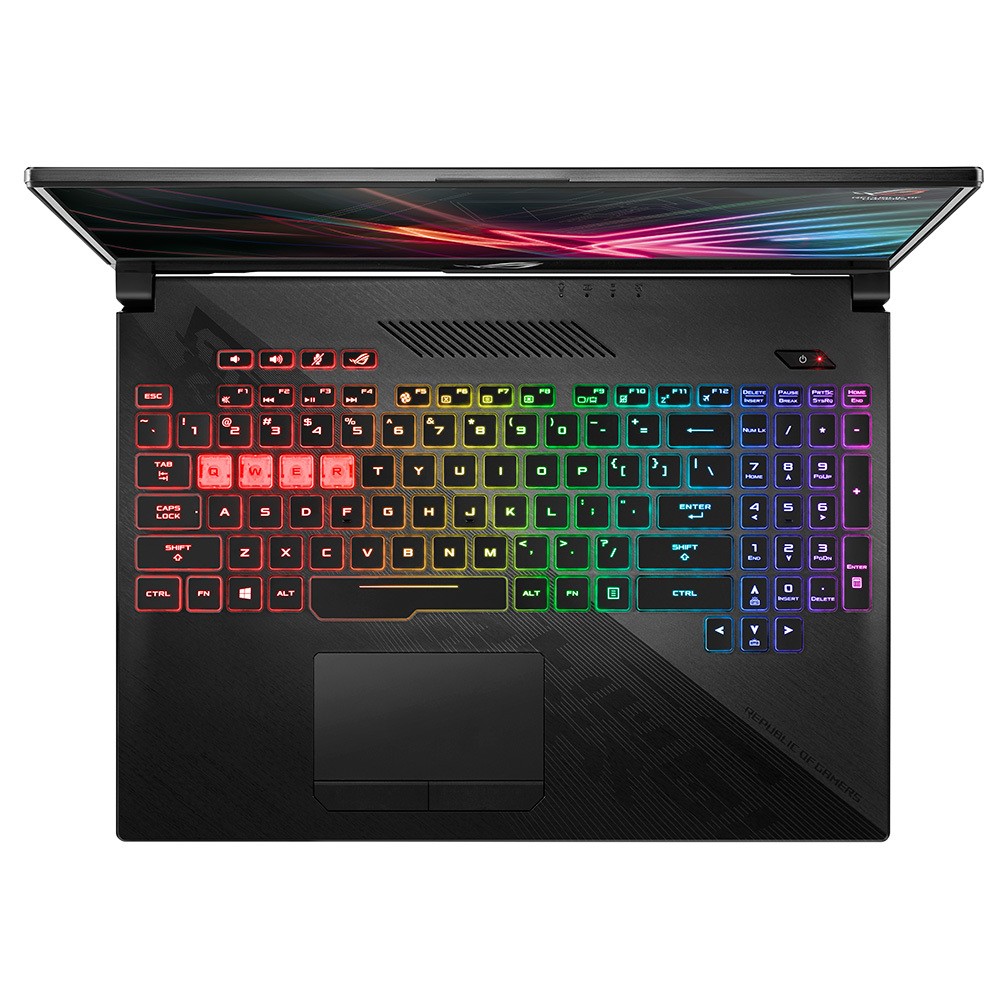
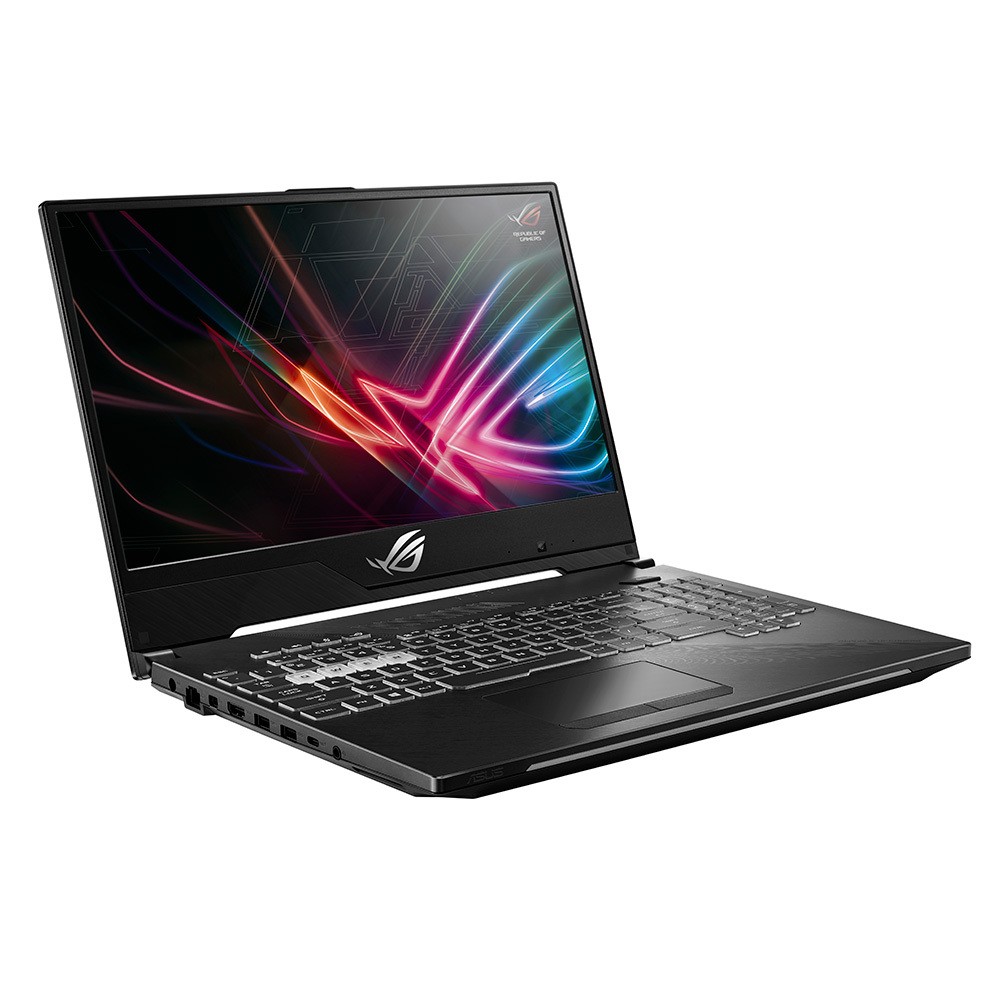
An easy way to tell the GL504GM apart from the GL504GS is its translucent QWER keys whereas the latter has translucent WASD keys. The GL504GM is geared towards MOBA players where the QWER keys are often used for abilities and so they are highlighted on the design. In contrast, the more powerful GL504GS caters to FPS players where the WASD keys are traditionally used for movement. Both SKUs share the same chassis aside from this visual distinction.

| SD Card Reader | |
| average JPG Copy Test (av. of 3 runs) | |
| Eurocom Sky X4C (Toshiba Exceria Pro SDXC 64 GB UHS-II) | |
| Gigabyte Aero 15X v8 (Toshiba Exceria Pro SDXC 64 GB UHS-II) | |
| Asus Strix GL504GM (Toshiba Exceria Pro SDXC 64 GB UHS-II) | |
| Asus Strix GL502VM-FY039T (Toshiba Exceria Pro SDXC 64 GB UHS-II) | |
| maximum AS SSD Seq Read Test (1GB) | |
| Gigabyte Aero 15X v8 (Toshiba Exceria Pro SDXC 64 GB UHS-II) | |
| Eurocom Sky X4C (Toshiba Exceria Pro SDXC 64 GB UHS-II) | |
| Asus Strix GL502VM-FY039T (Toshiba Exceria Pro SDXC 64 GB UHS-II) | |
| Asus Strix GL504GM (Toshiba Exceria Pro SDXC 64 GB UHS-II) | |
| Networking | |
| iperf3 transmit AX12 | |
| Asus Strix GL504GM | |
| Razer Blade 15 GTX 1060 | |
| Asus Zephyrus M GM501 | |
| Asus Strix GL502VM-FY039T | |
| iperf3 receive AX12 | |
| Asus Zephyrus M GM501 | |
| Razer Blade 15 GTX 1060 | |
| Asus Strix GL502VM-FY039T | |
| Asus Strix GL504GM | |
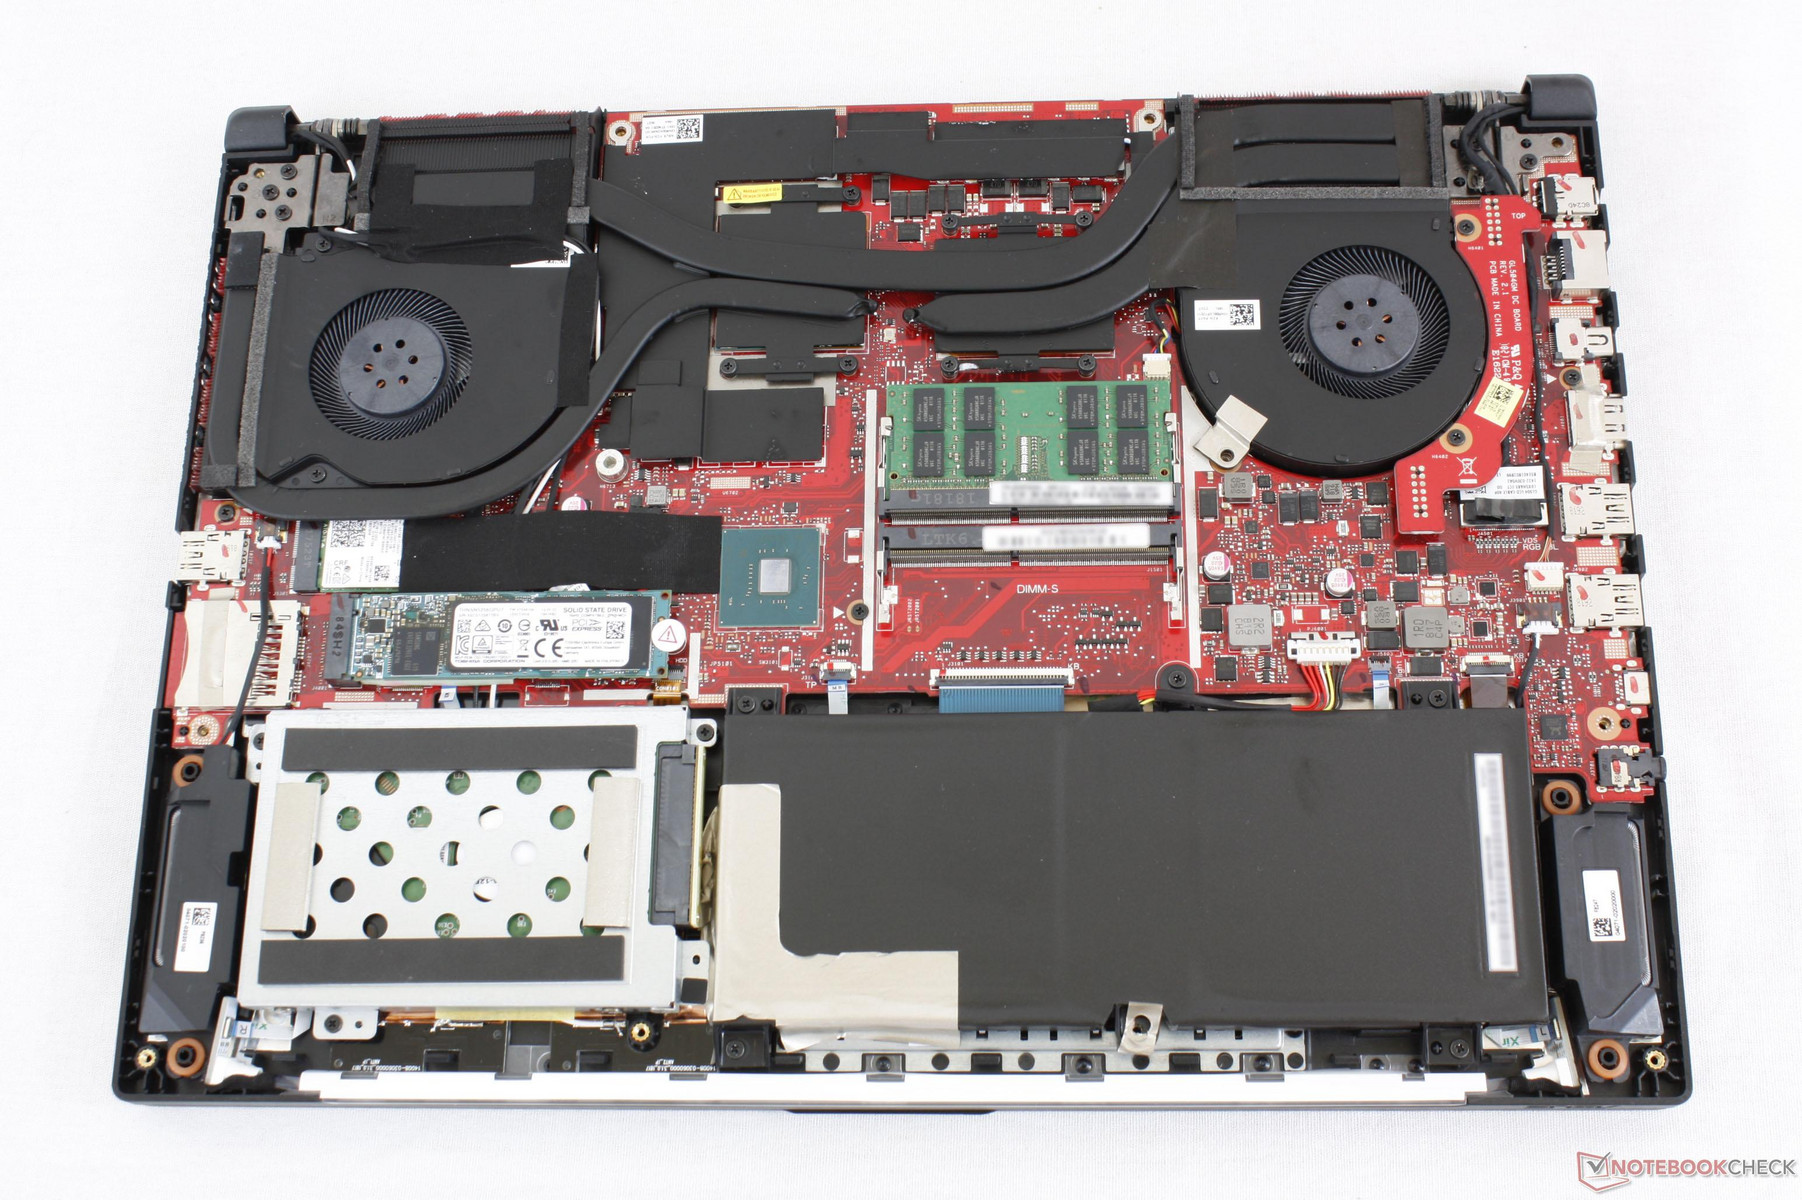
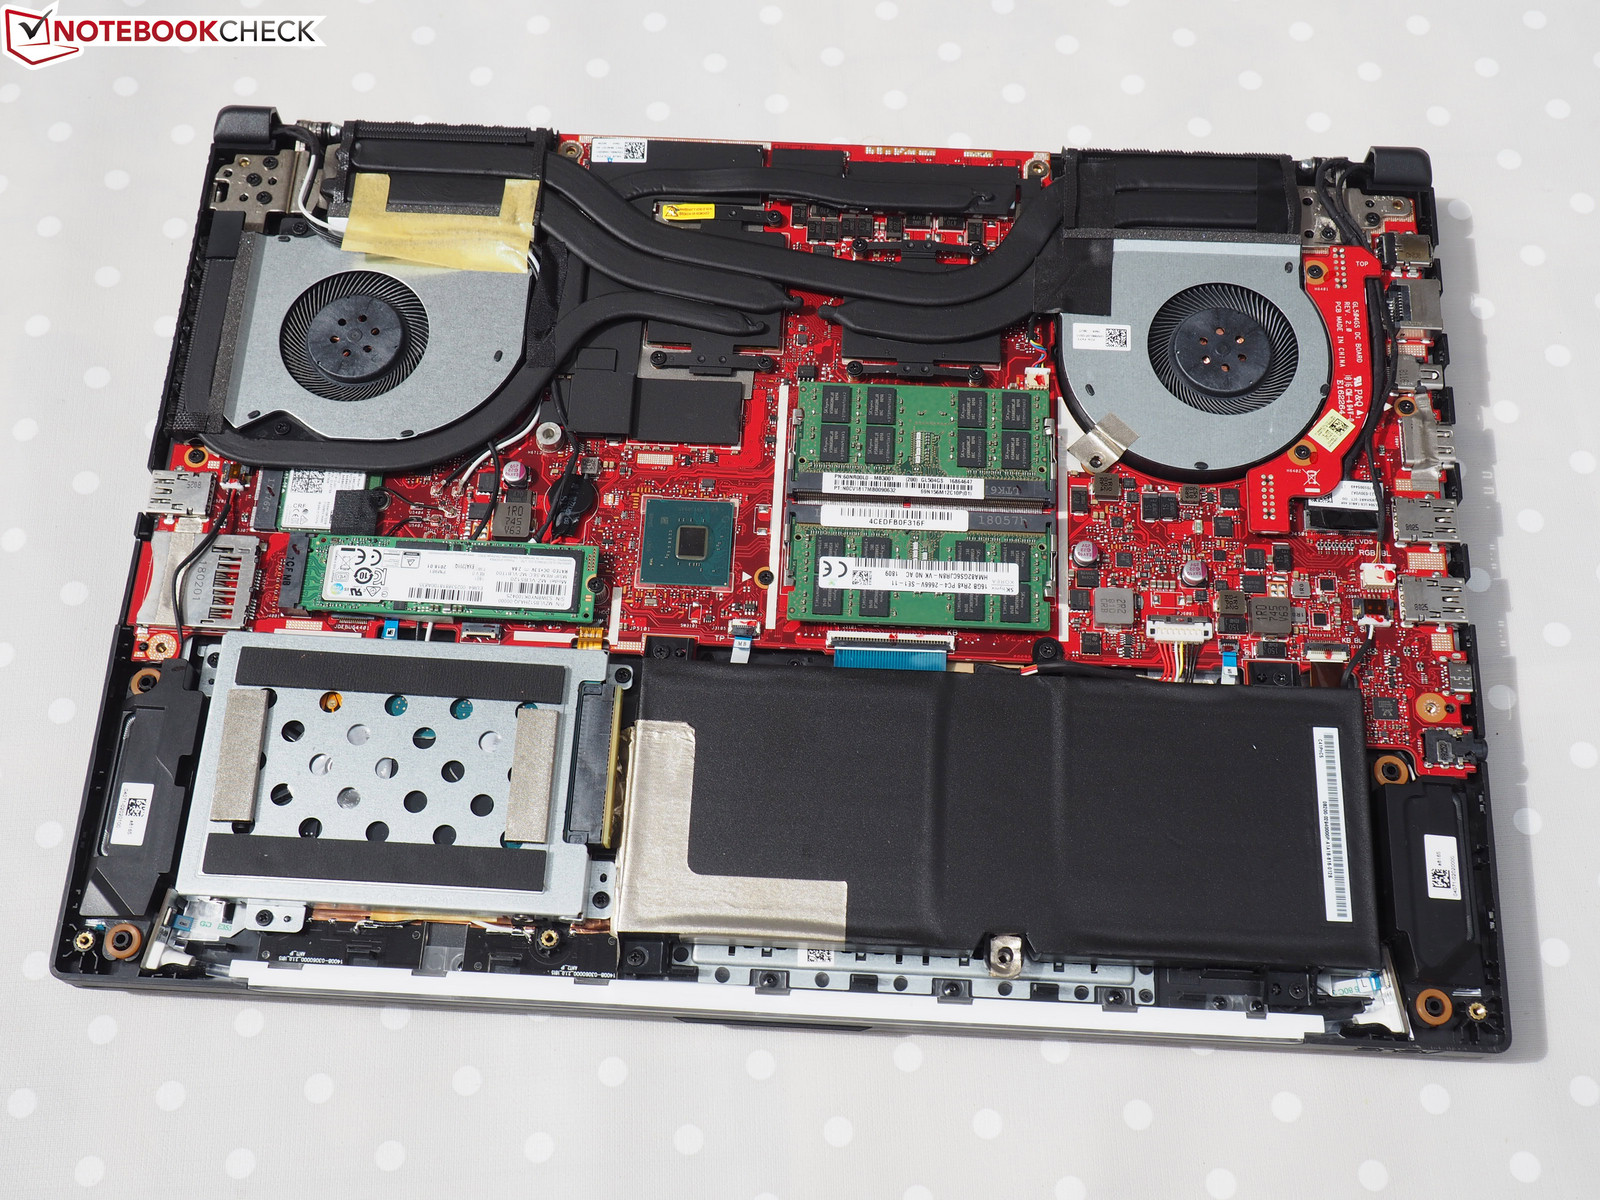
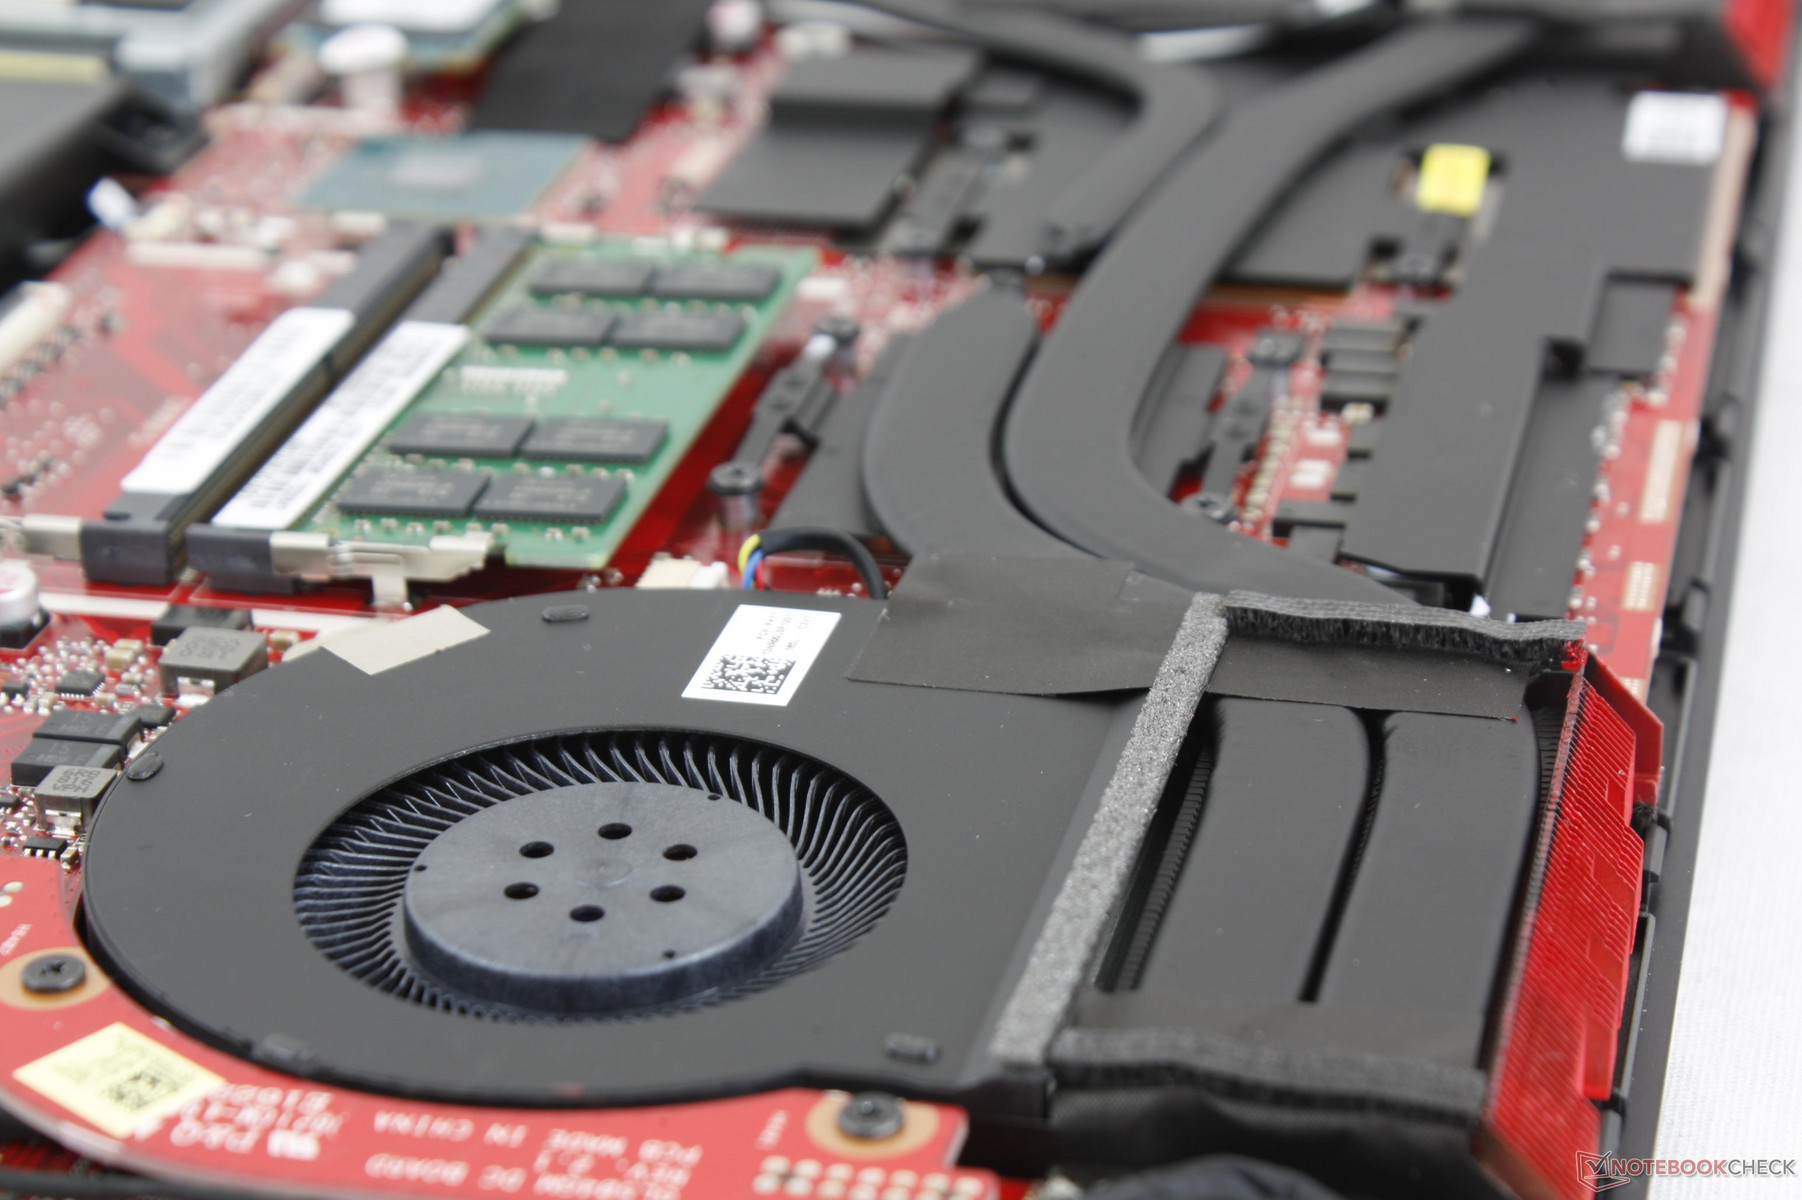
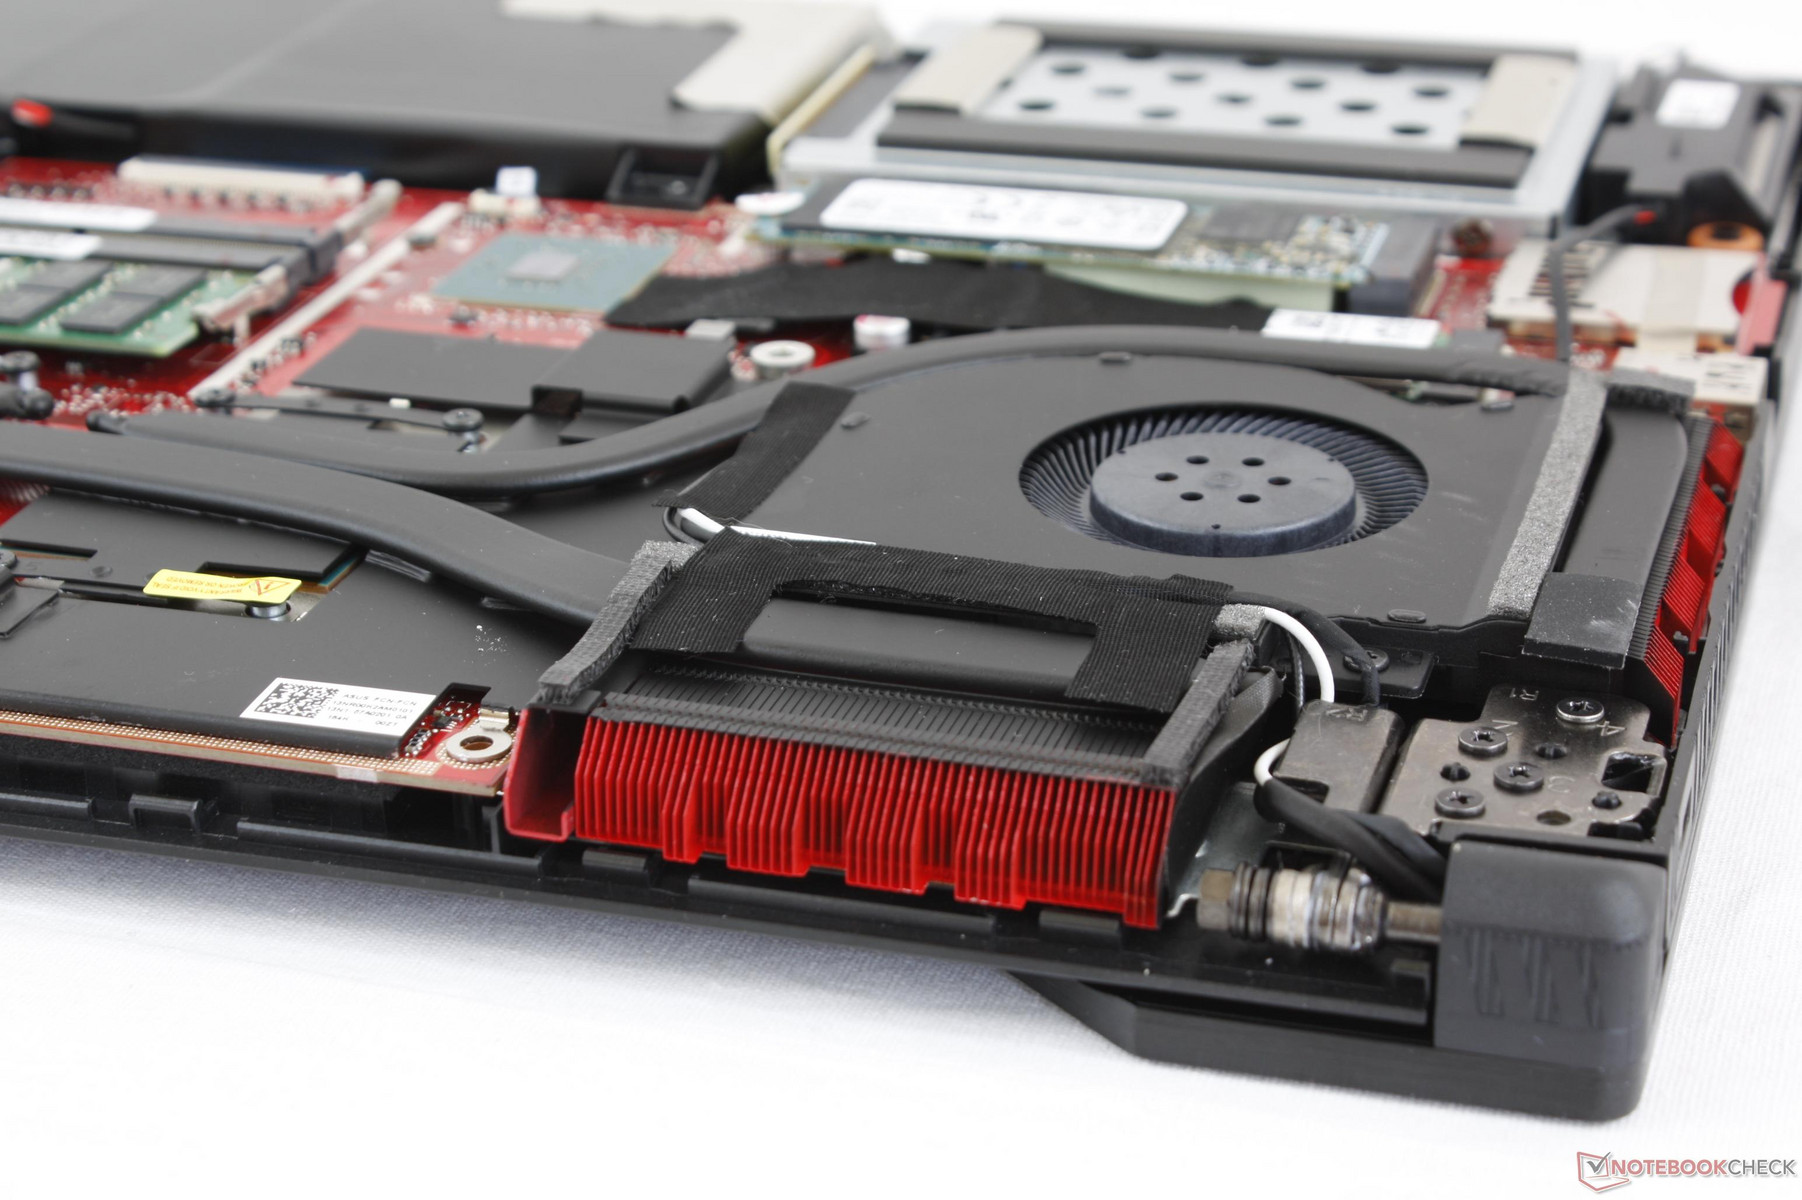
Maintenance
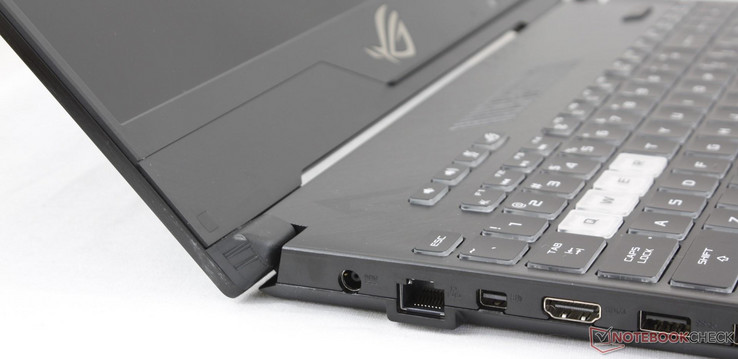
Serviceability is easy if not a bit cumbersome as the bottom panel is help in place by a dozen Philips screws. Internals are otherwise similar to the GL504GS albeit with one less heat pipe. This means that the same hardware is used to cool the processors even though there is a wide TDP gap between the GTX 1060 and GTX 1070. The effects of this can be seen in our Stress Test section below.
Display
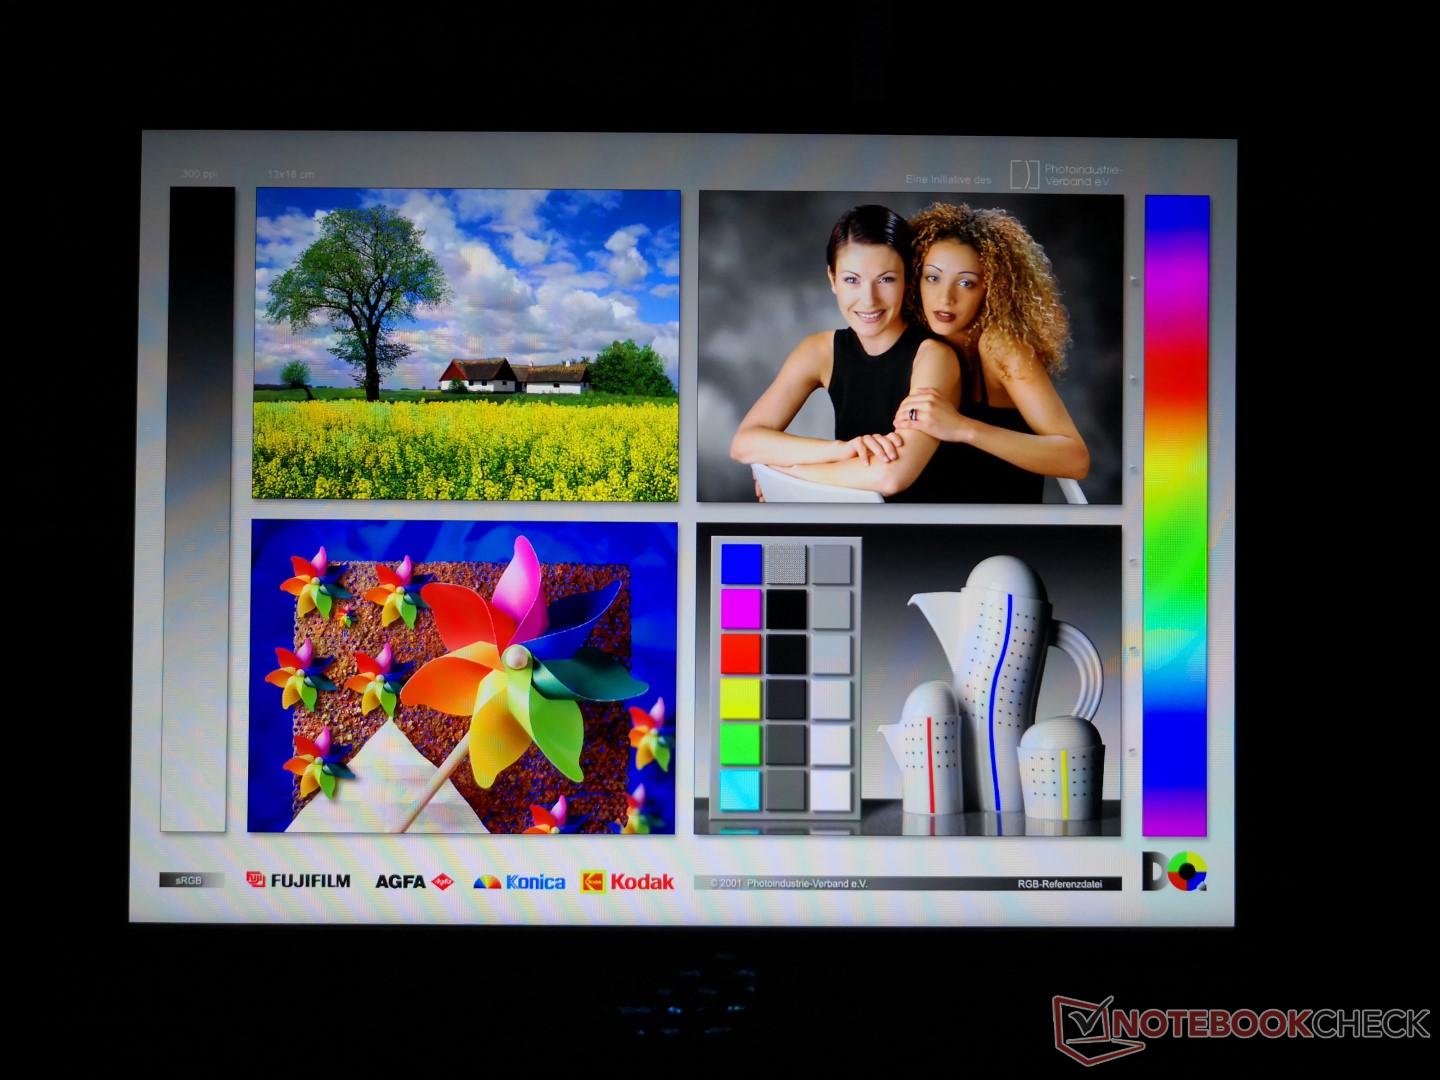
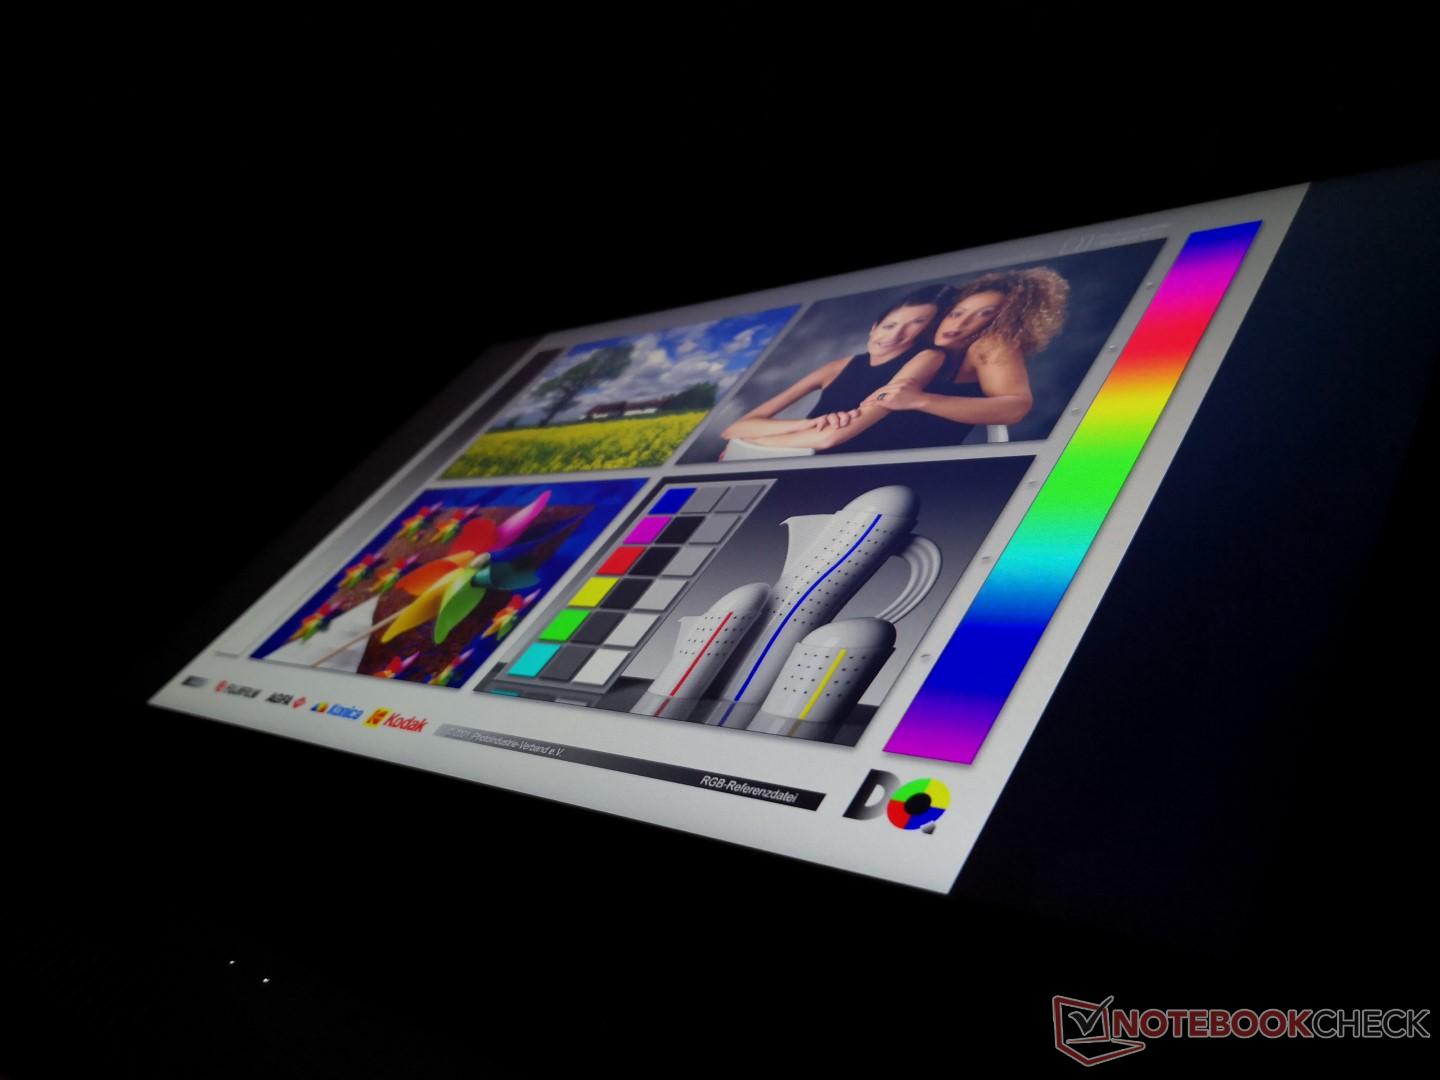
Unsurprisingly, the GL504GM utilizes the same AU Optronics B156HAN08.2 IPS panel as on the GL504GS while the competing MSI GS65 utilizes a variant from the same provider. The displays on both GL504 configurations share similar characteristics as a result including the very fast response times, relatively wide gamut, and respectable contrast ratio. The difference in display quality is night and day when compared to the LG Philips panel on last year's GL503 series as the newer AUO panel offers a faster native 144 Hz refresh rate with significantly less ghosting.
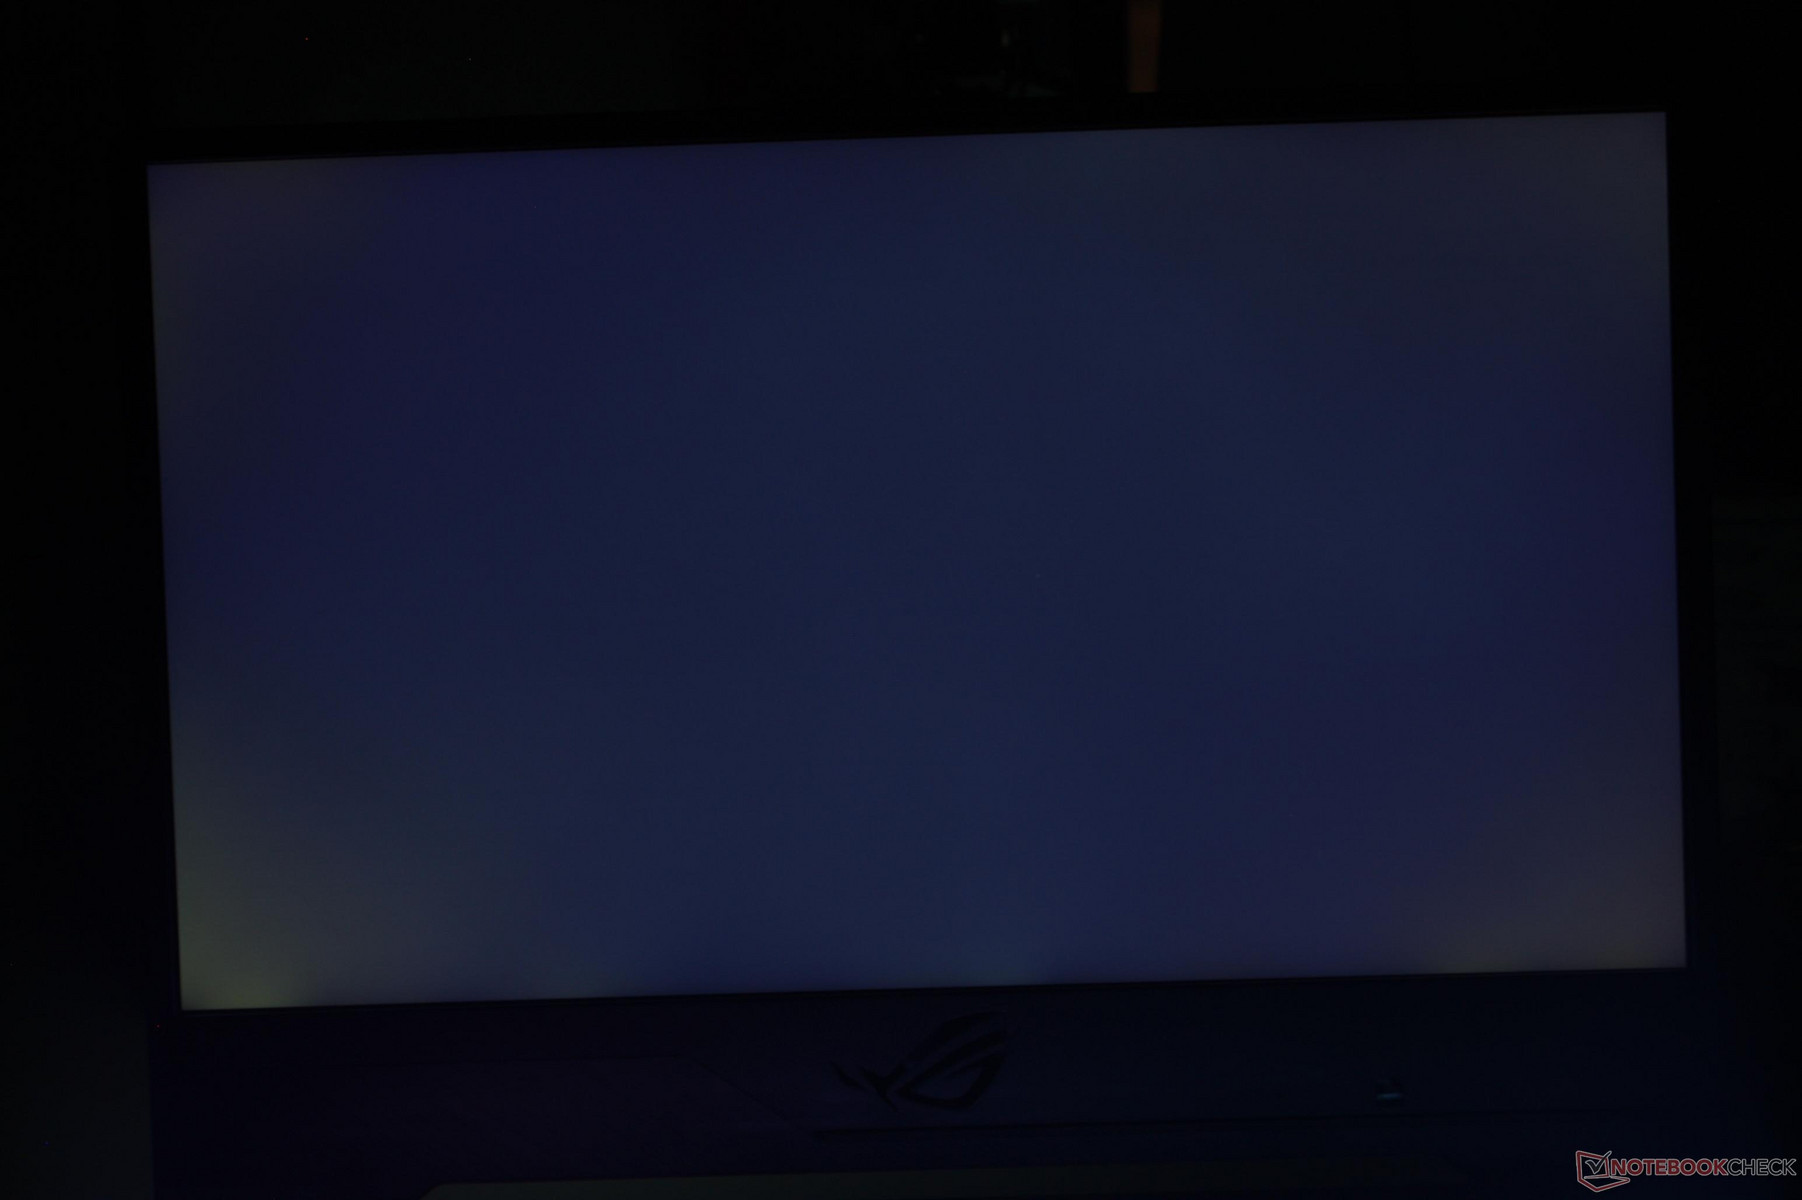
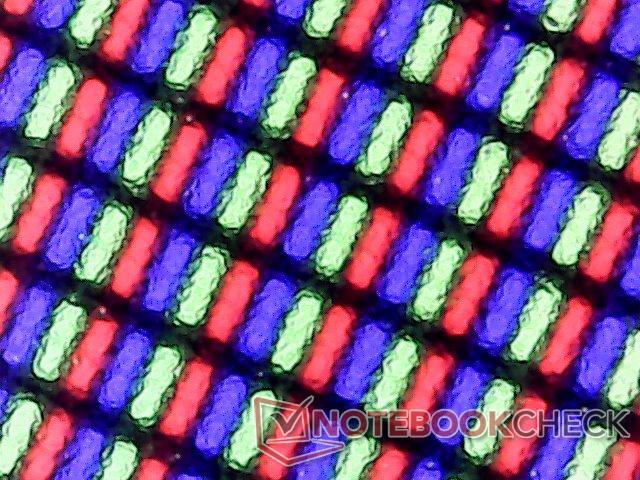
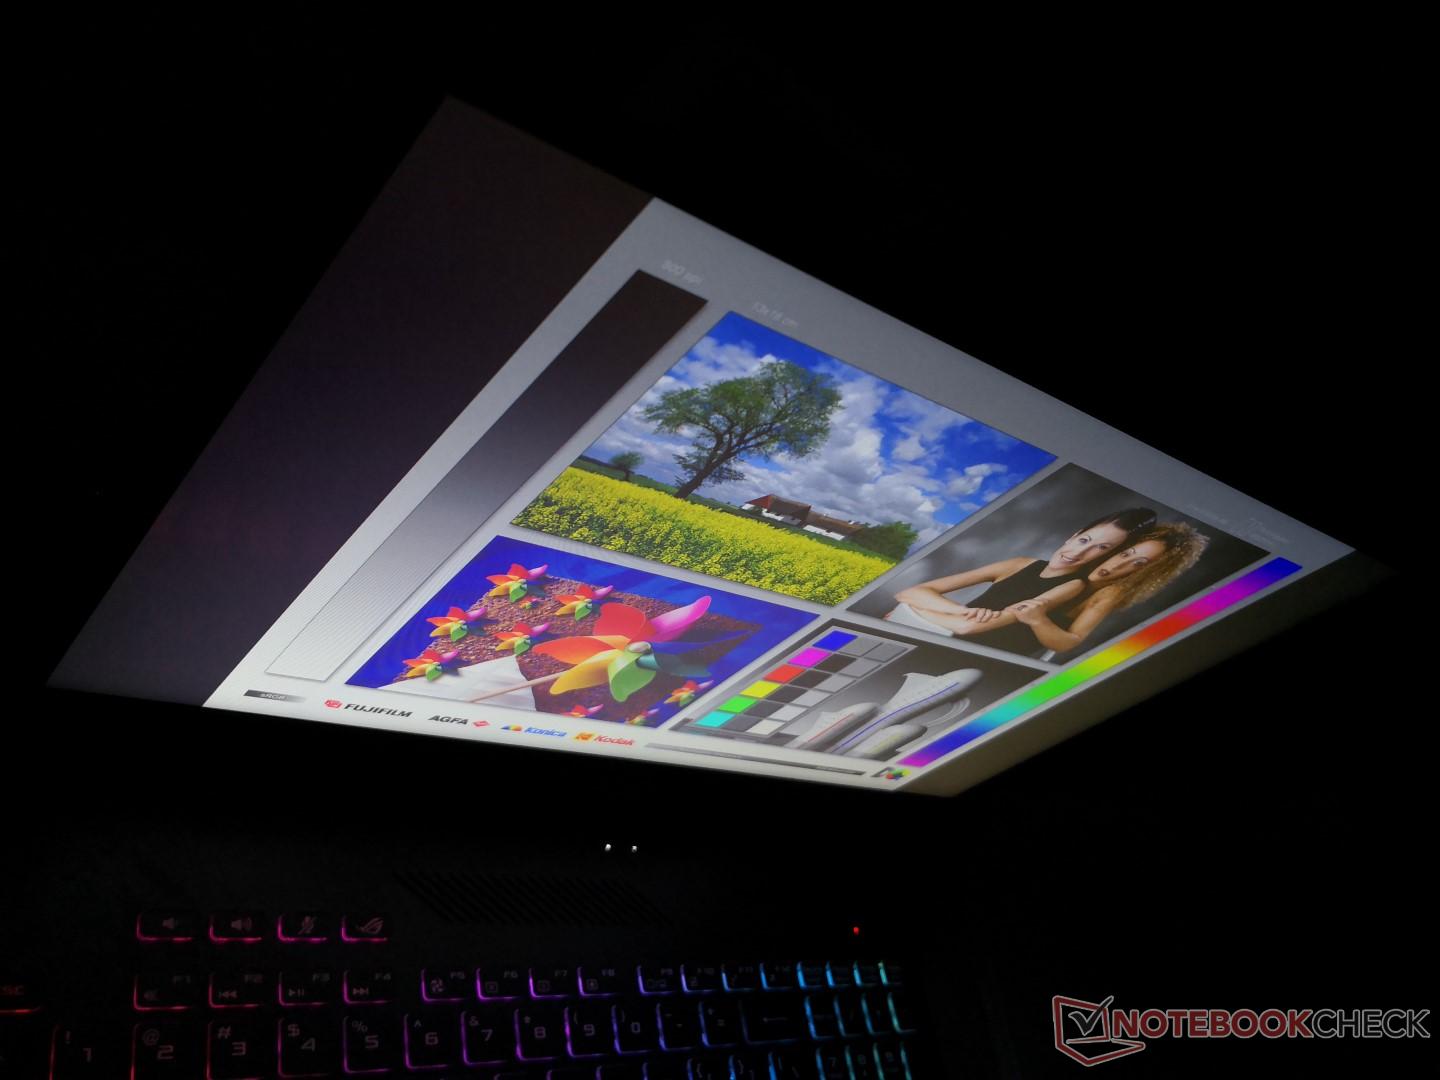
Graininess is minimal and the lack of any major reflections from the matte panel is a boon for videos and gaming. Minor backlight bleeding is present but largely unnoticeable and pulse-width modulation is now completely absent on all brightness levels.
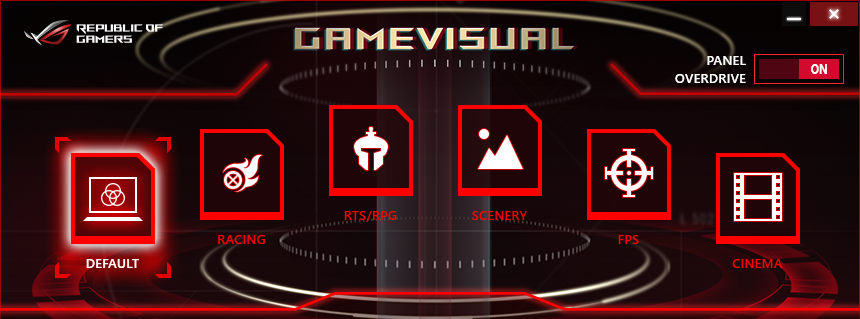
Interestingly, our GL504GM has a brighter backlight than our GL504GS unit. We're unsure if this was intentional on Asus' part or if the pre-installed GameVisual color profile software is responsible for the differences. Either way, the screen is sufficiently bright for indoor environments.
| |||||||||||||||||||||||||
Brightness Distribution: 90 %
Center on Battery: 350 cd/m²
Contrast: 1061:1 (Black: 0.33 cd/m²)
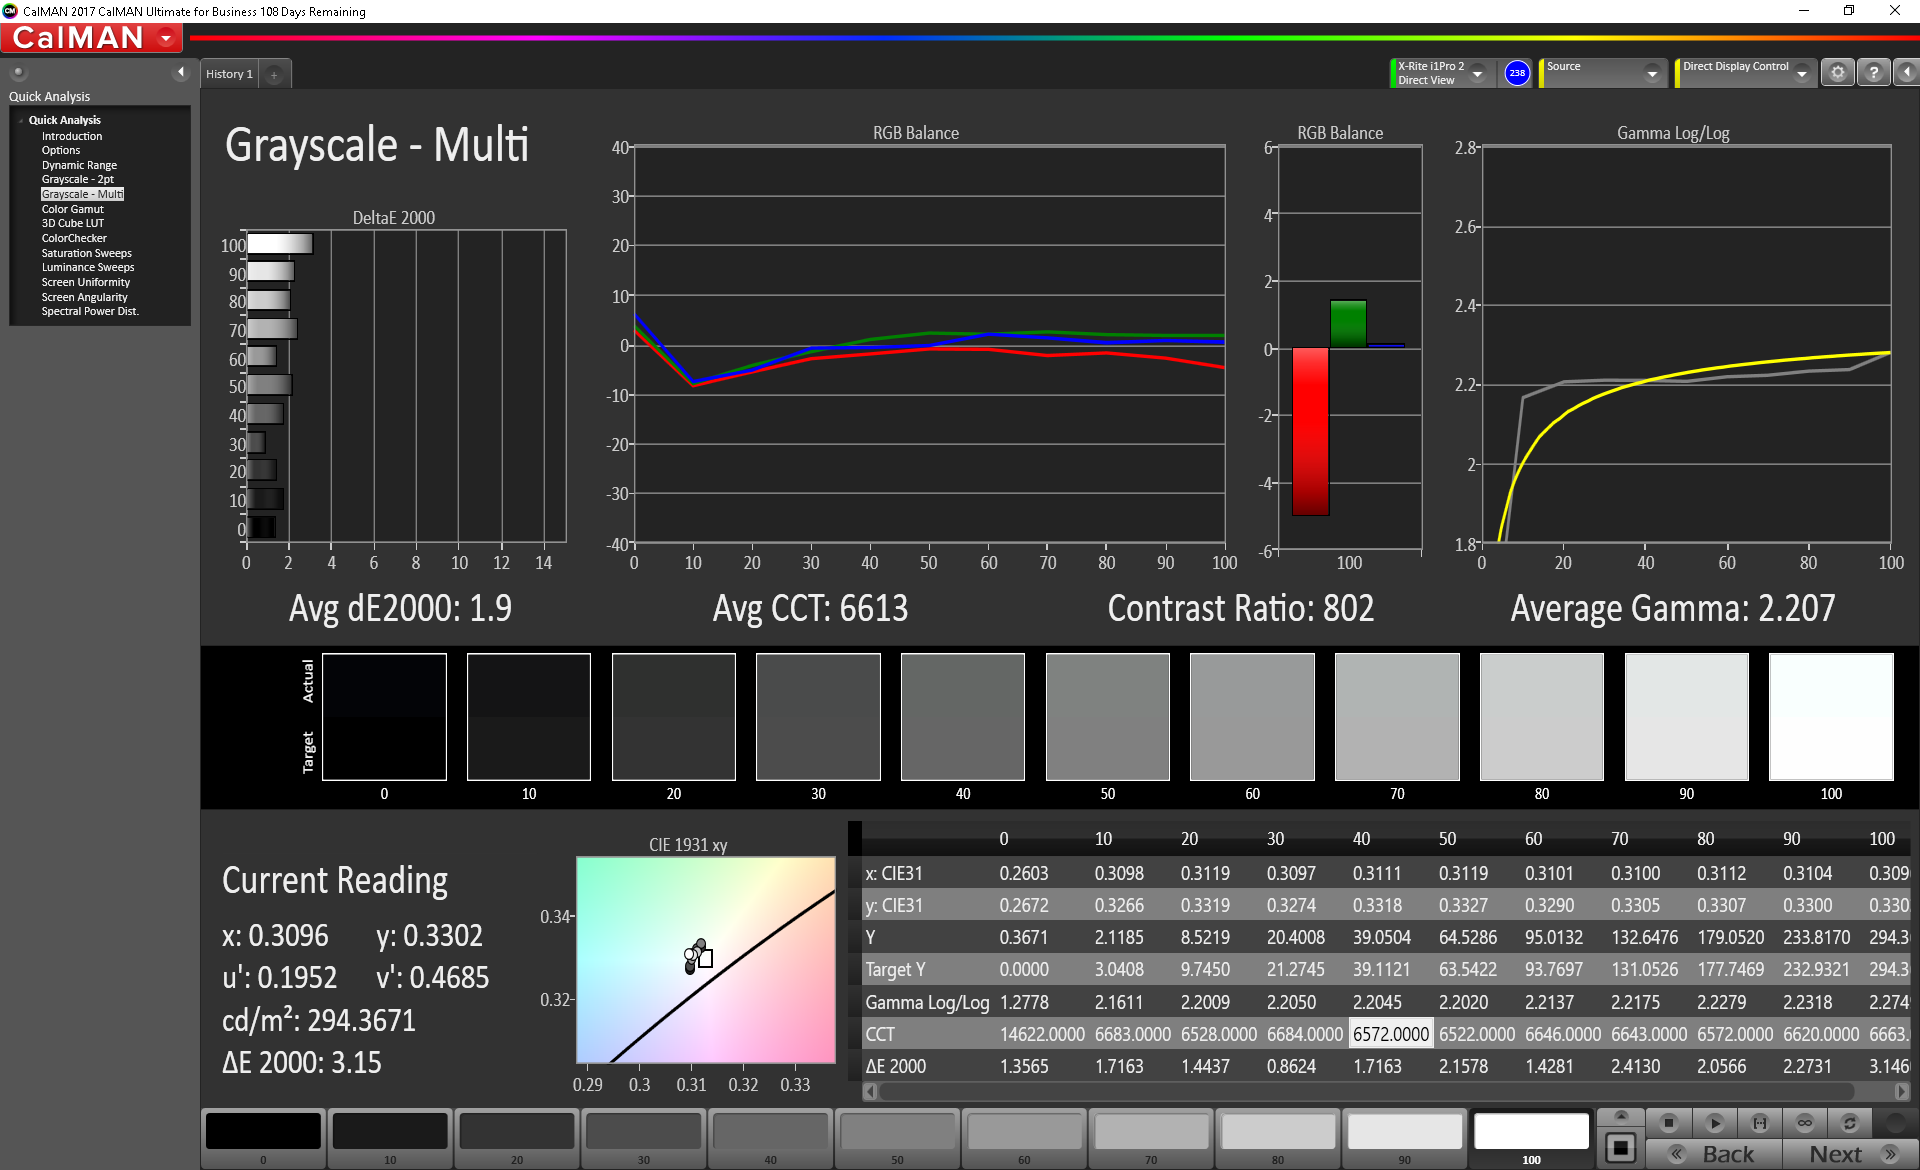
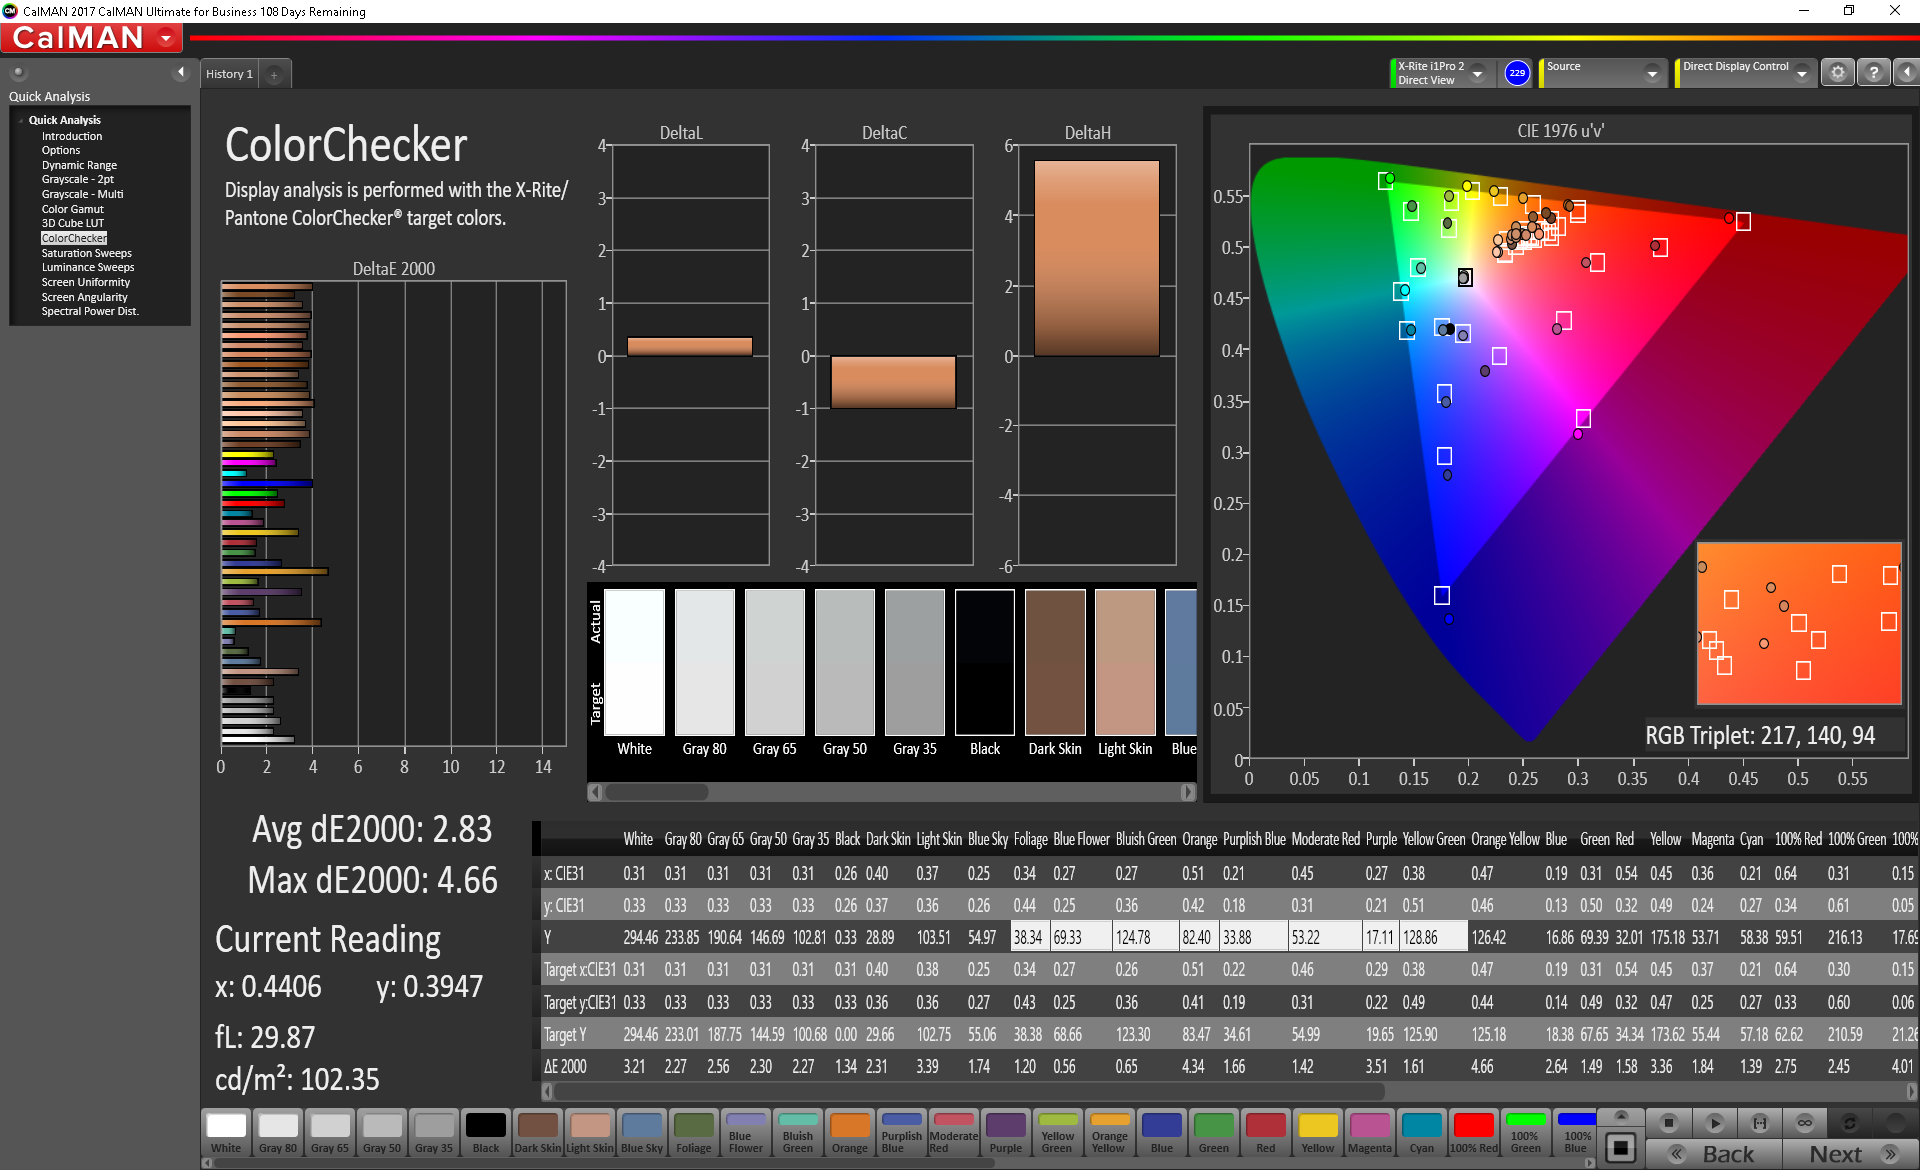
ΔE ColorChecker Calman: 4.3 | ∀{0.5-29.43 Ø4.73}
calibrated: 2.83
ΔE Greyscale Calman: 4.4 | ∀{0.09-98 Ø4.97}
92.5% sRGB (Argyll 1.6.3 3D)
60% AdobeRGB 1998 (Argyll 1.6.3 3D)
66.7% AdobeRGB 1998 (Argyll 3D)
92.8% sRGB (Argyll 3D)
65.3% Display P3 (Argyll 3D)
Gamma: 2.26
CCT: 7517 K
| Asus Strix GL504GM AU Optronics B156HAN08.2 (AUO82ED), IPS, 15.6", 1920x1080 | Asus GL504GS AU Optronics B156HAN08.2 (AUO82ED), IPS, 15.6", 1920x1080 | MSI GS65 8RF-019DE Stealth Thin AU Optronics B156HAN08.0 (AUO80ED), IPS, 15.6", 1920x1080 | Razer Blade 15 GTX 1060 LGD05C0, IPS, 15.6", 1920x1080 | Asus Zephyrus M GM501 AUO B156HAN07.1 (AUO71ED), IPS, 15.6", 1920x1080 | Asus GL503VD-DB74 LG Philips LP156WF6, IPS, 15.6", 1920x1080 | |
|---|---|---|---|---|---|---|
| Display | -1% | 0% | -1% | 1% | -6% | |
| Display P3 Coverage (%) | 65.3 | 66.4 2% | 66.2 1% | 64.4 -1% | 66.1 1% | 64.3 -2% |
| sRGB Coverage (%) | 92.8 | 90.2 -3% | 92.1 -1% | 93.4 1% | 92.7 0% | 84.4 -9% |
| AdobeRGB 1998 Coverage (%) | 66.7 | 66 -1% | 67.2 1% | 65.5 -2% | 67.2 1% | 61.7 -7% |
| Response Times | 12% | -75% | -45% | 8% | -260% | |
| Response Time Grey 50% / Grey 80% * (ms) | 7.8 ? | 7.2 ? 8% | 17.6 ? -126% | 13.6 ? -74% | 6.6 ? 15% | 36.4 ? -367% |
| Response Time Black / White * (ms) | 10.4 ? | 8.8 ? 15% | 12.8 ? -23% | 12 ? -15% | 10.4 ? -0% | 26.2 ? -152% |
| PWM Frequency (Hz) | 21010 ? | |||||
| Screen | 7% | 16% | 11% | -7% | -10% | |
| Brightness middle (cd/m²) | 350 | 271 -23% | 254 -27% | 304.3 -13% | 307 -12% | 315.9 -10% |
| Brightness (cd/m²) | 338 | 261 -23% | 262 -22% | 293 -13% | 296 -12% | 304 -10% |
| Brightness Distribution (%) | 90 | 86 -4% | 89 -1% | 80 -11% | 89 -1% | 88 -2% |
| Black Level * (cd/m²) | 0.33 | 0.32 3% | 0.22 33% | 0.38 -15% | 0.25 24% | 0.37 -12% |
| Contrast (:1) | 1061 | 847 -20% | 1155 9% | 801 -25% | 1228 16% | 854 -20% |
| Colorchecker dE 2000 * | 4.3 | 2.61 39% | 2.37 45% | 1.79 58% | 5.74 -33% | 4.9 -14% |
| Colorchecker dE 2000 max. * | 7.78 | 4.93 37% | 4.71 39% | 3.69 53% | 11.32 -46% | 9.7 -25% |
| Colorchecker dE 2000 calibrated * | 2.83 | 2.33 18% | 1.84 35% | 1.94 31% | ||
| Greyscale dE 2000 * | 4.4 | 1.97 55% | 1.58 64% | 1.1 75% | 6.44 -46% | 3.8 14% |
| Gamma | 2.26 97% | 2.4 92% | 2.48 89% | 2.27 97% | 2.48 89% | 2.24 98% |
| CCT | 7517 86% | 6398 102% | 6785 96% | 6665 98% | 8395 77% | 6847 95% |
| Color Space (Percent of AdobeRGB 1998) (%) | 60 | 59 -2% | 60 0% | 59.8 0% | 60 0% | 55 -8% |
| Color Space (Percent of sRGB) (%) | 92.5 | 90 -3% | 92 -1% | 92.8 0% | 93 1% | 84 -9% |
| Total Average (Program / Settings) | 6% /
6% | -20% /
2% | -12% /
1% | 1% /
-4% | -92% /
-42% |
* ... smaller is better
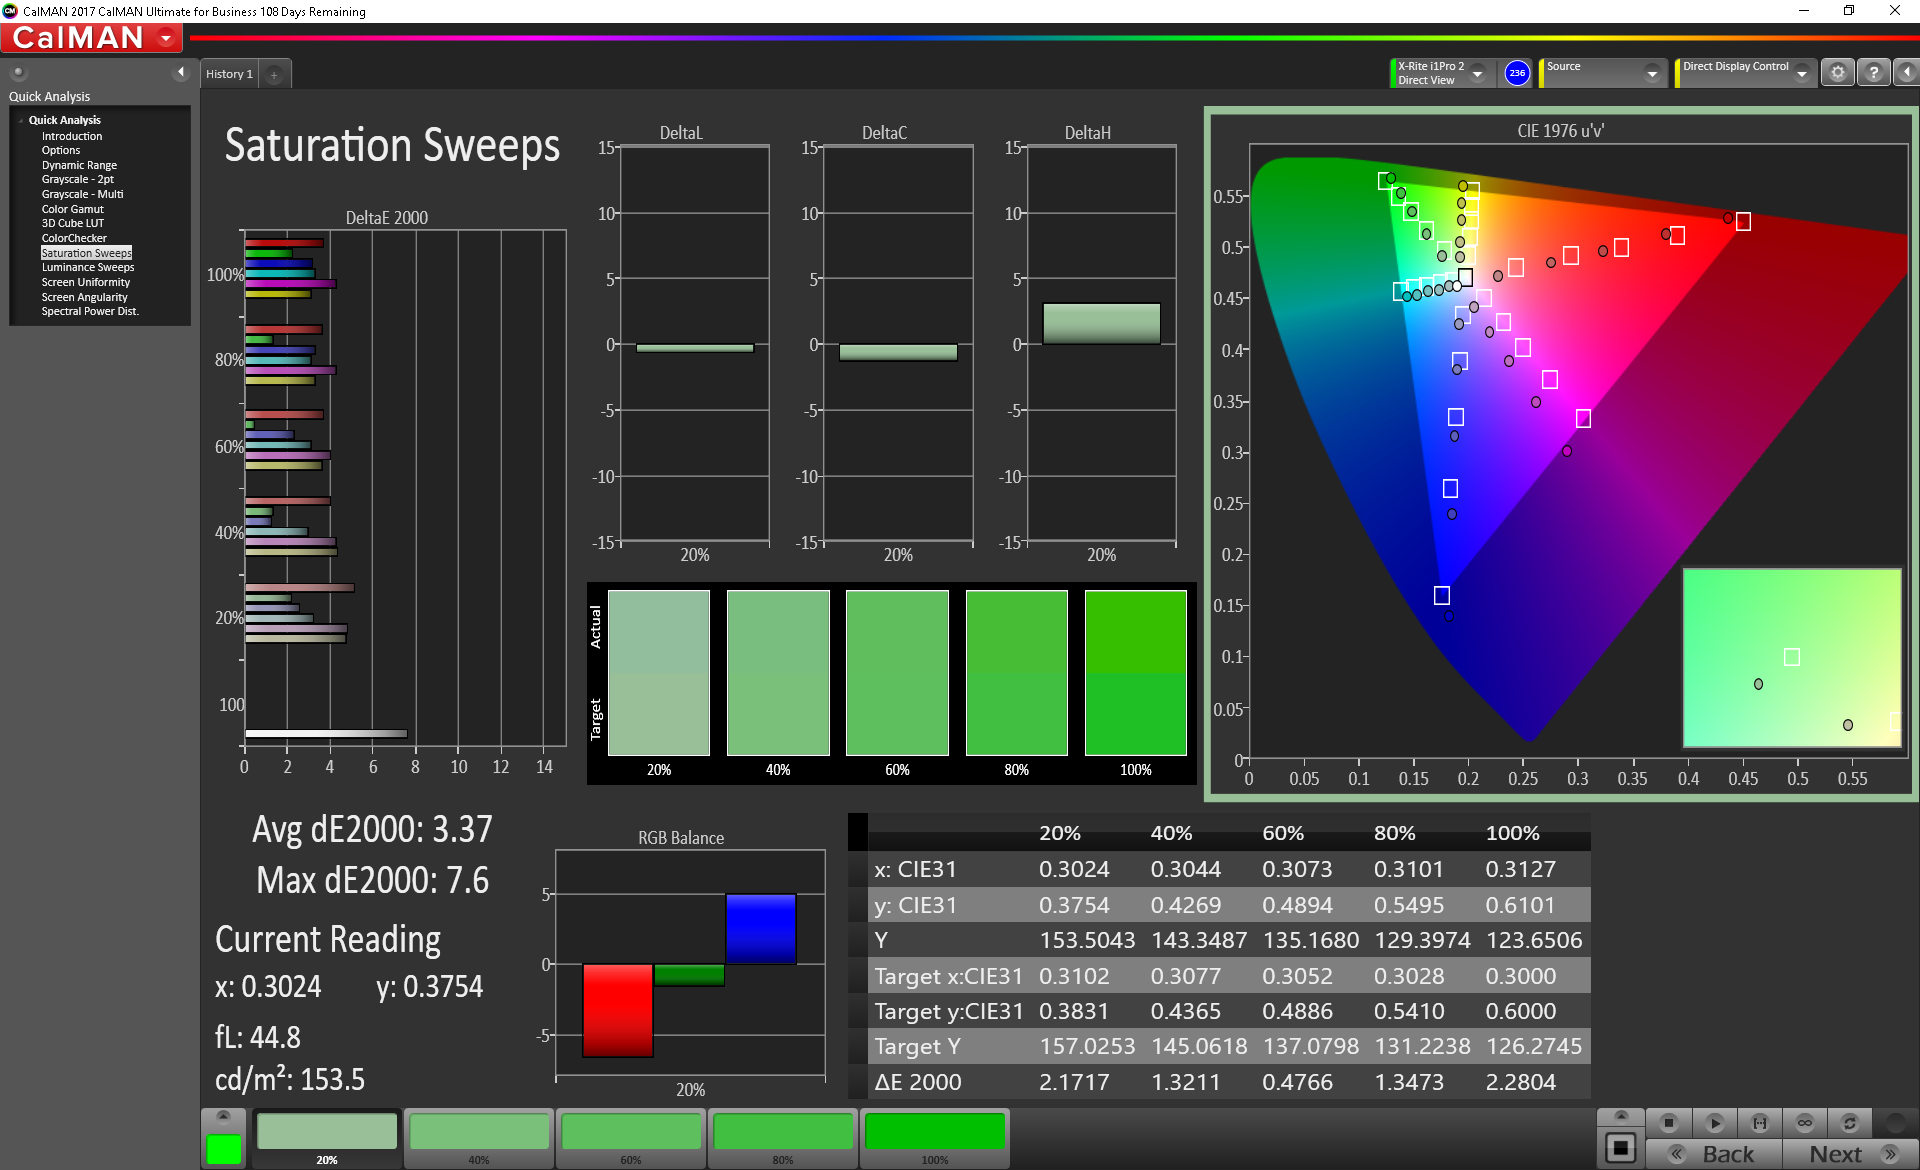
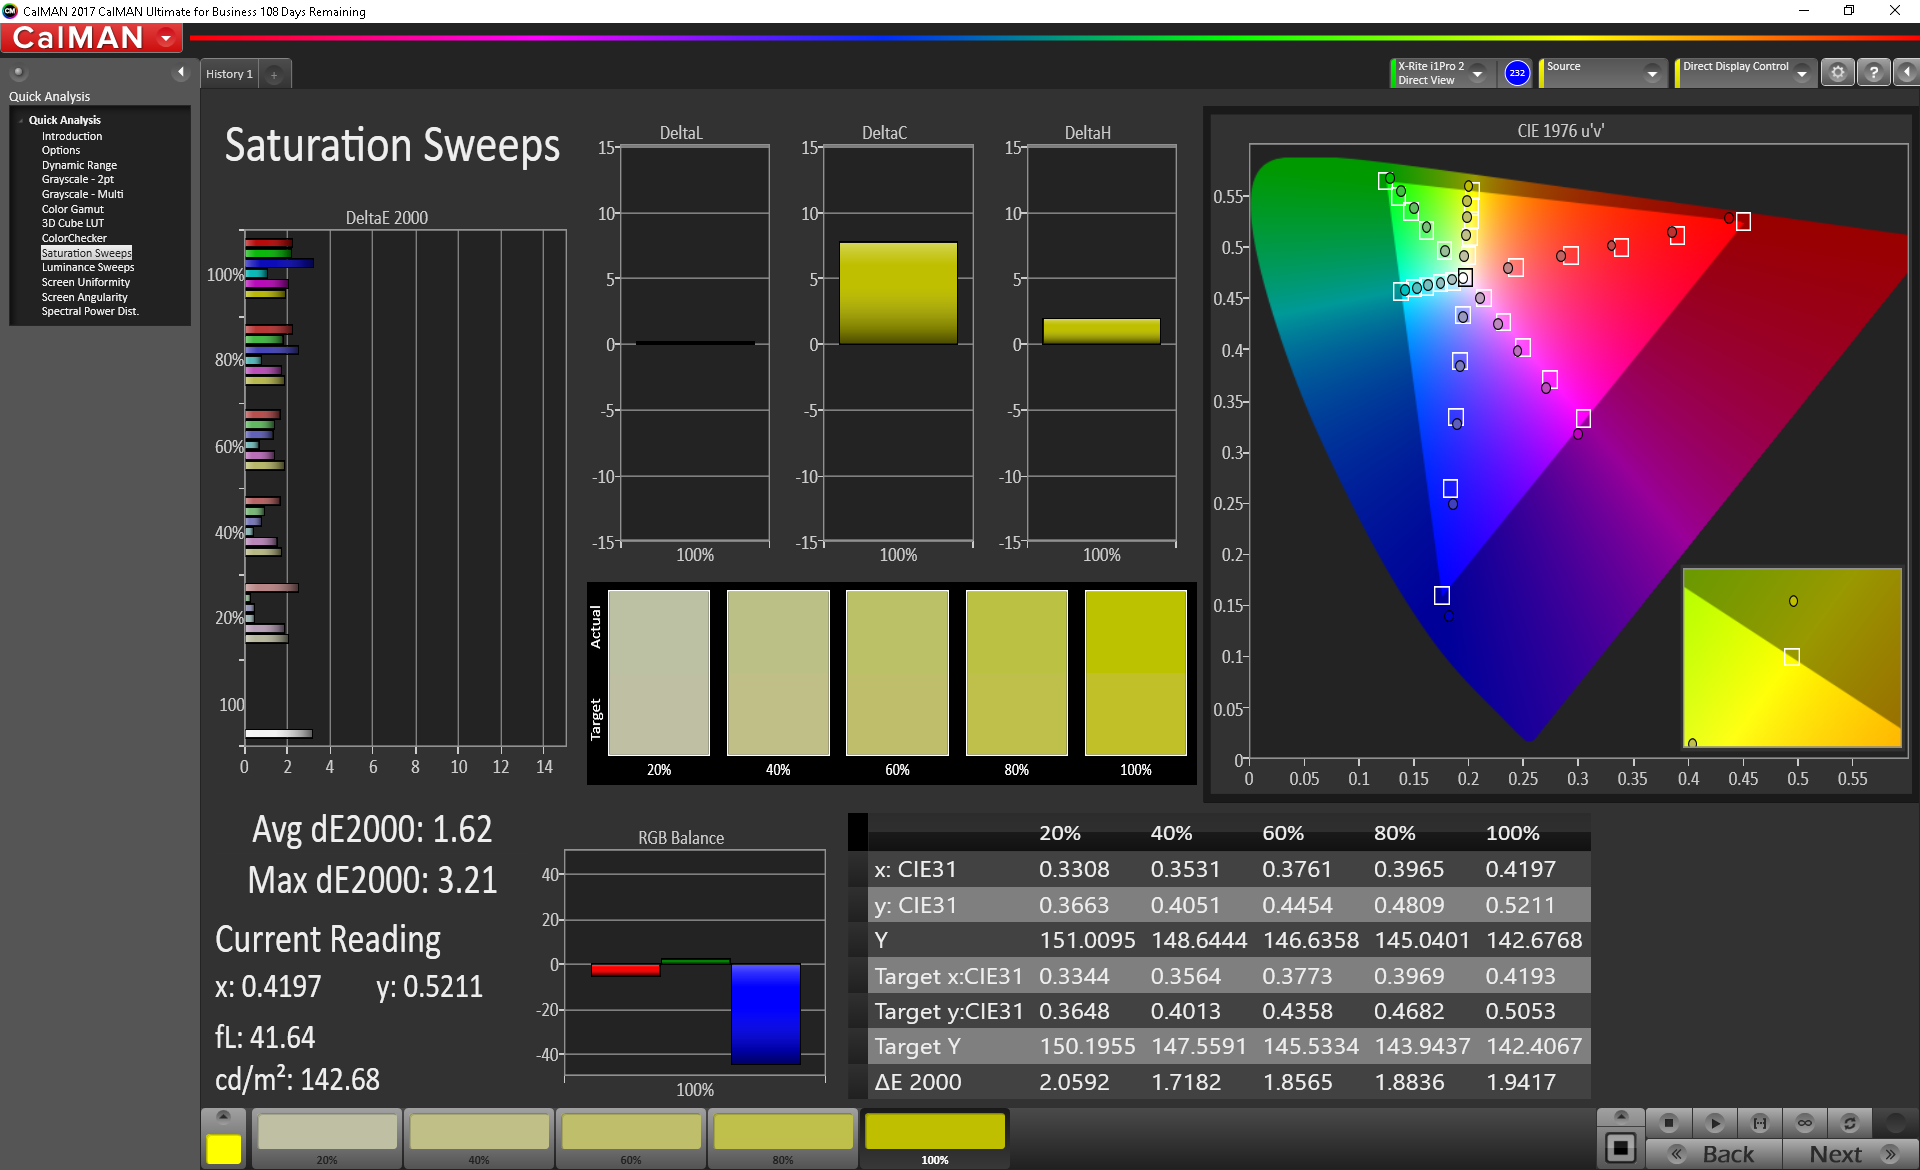
Color space is approximately 93 percent and 60 percent of the sRGB and AdobeRGB standards, respectively. Competing gaming notebooks like the Razer Blade 15 and MSI GS65 offer very similar color spaces to the GL504 series. Gamut is more than sufficient for gaming purposes as larger color spaces typically lead to slower response times for IPS panels.
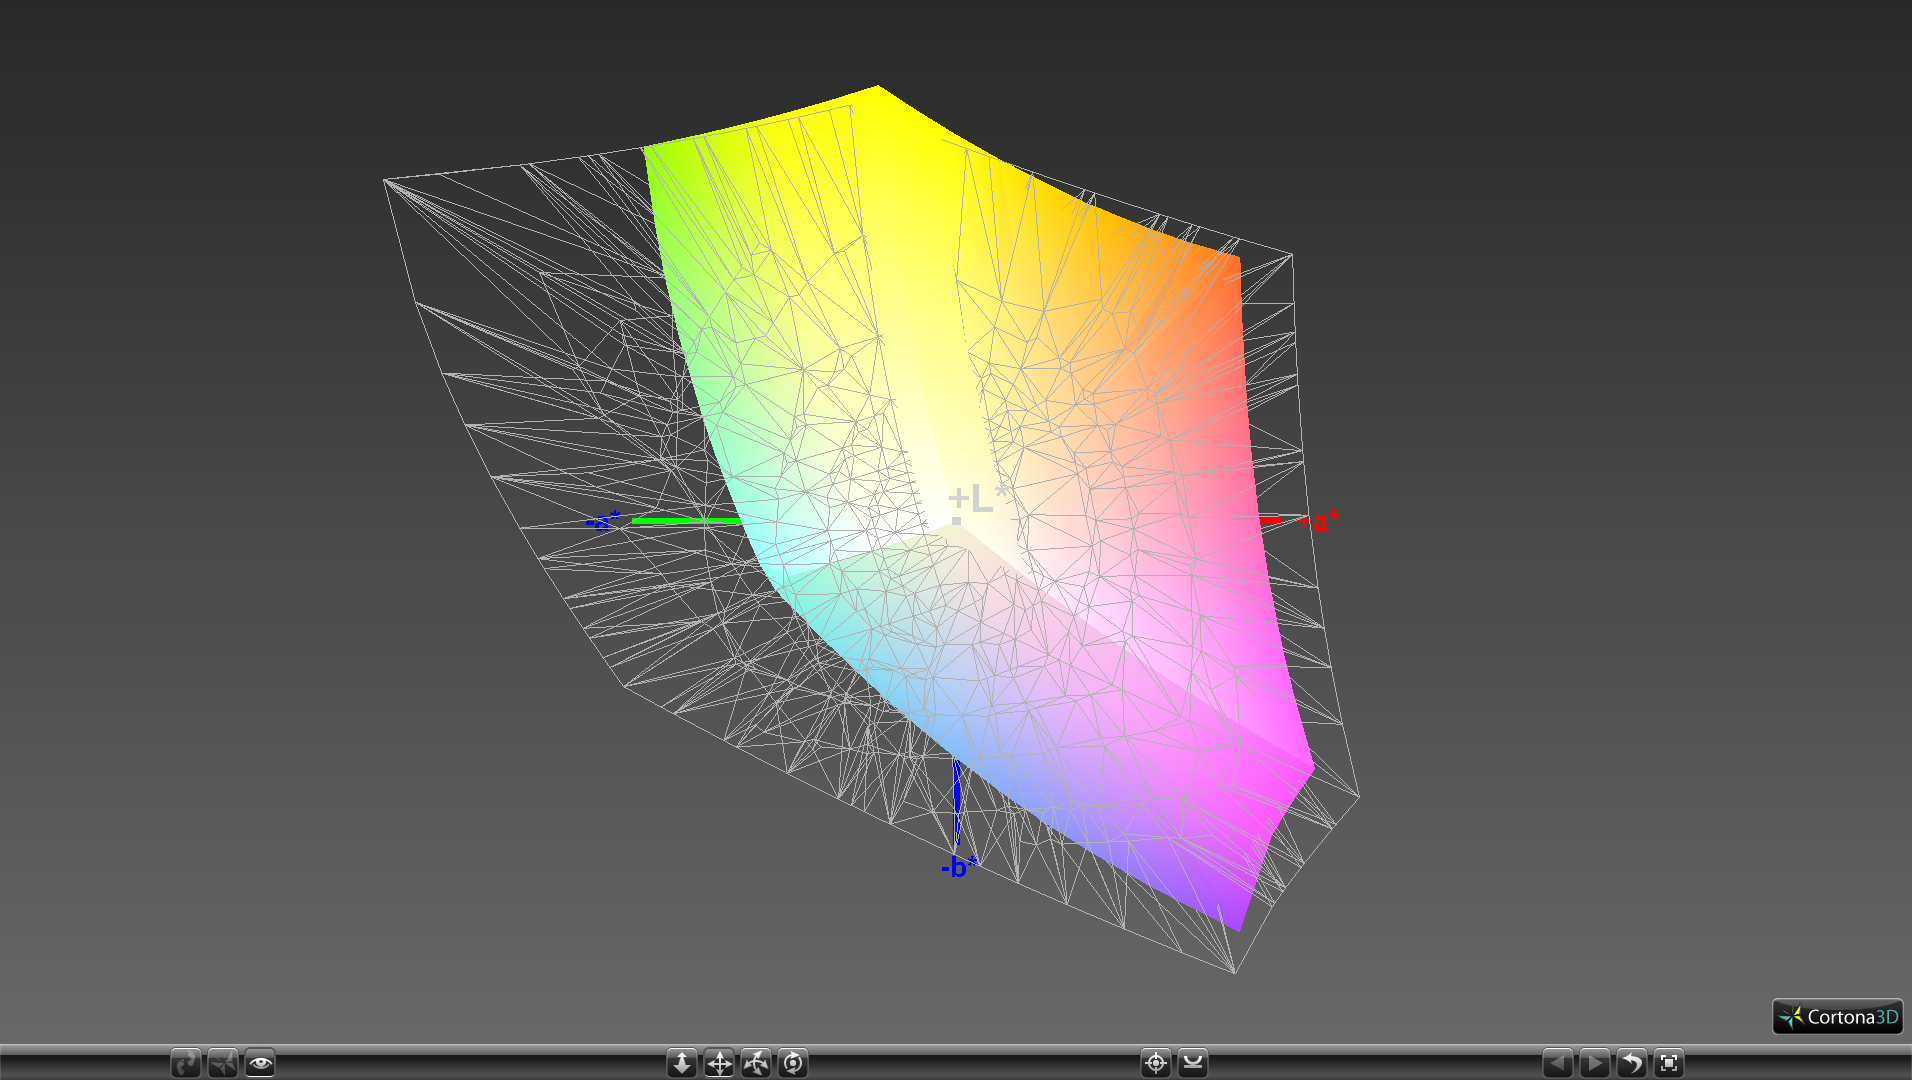
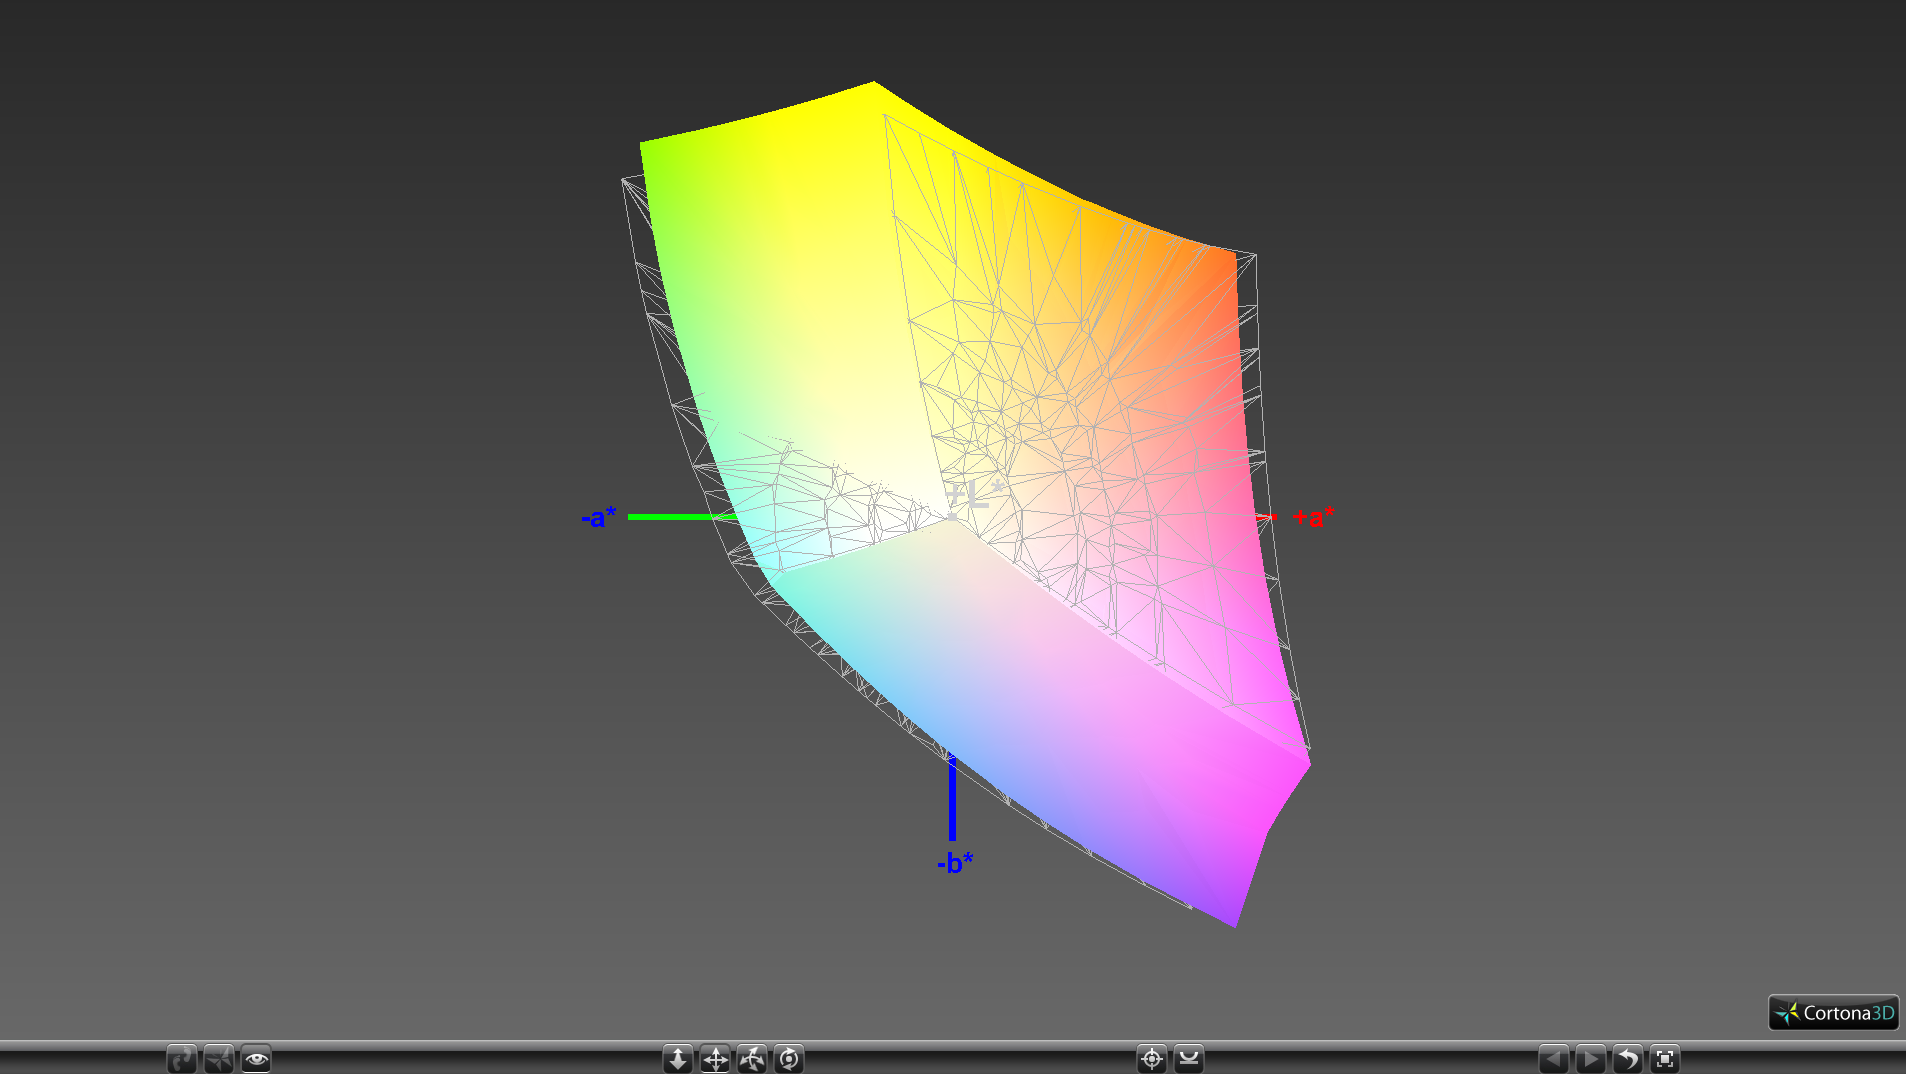
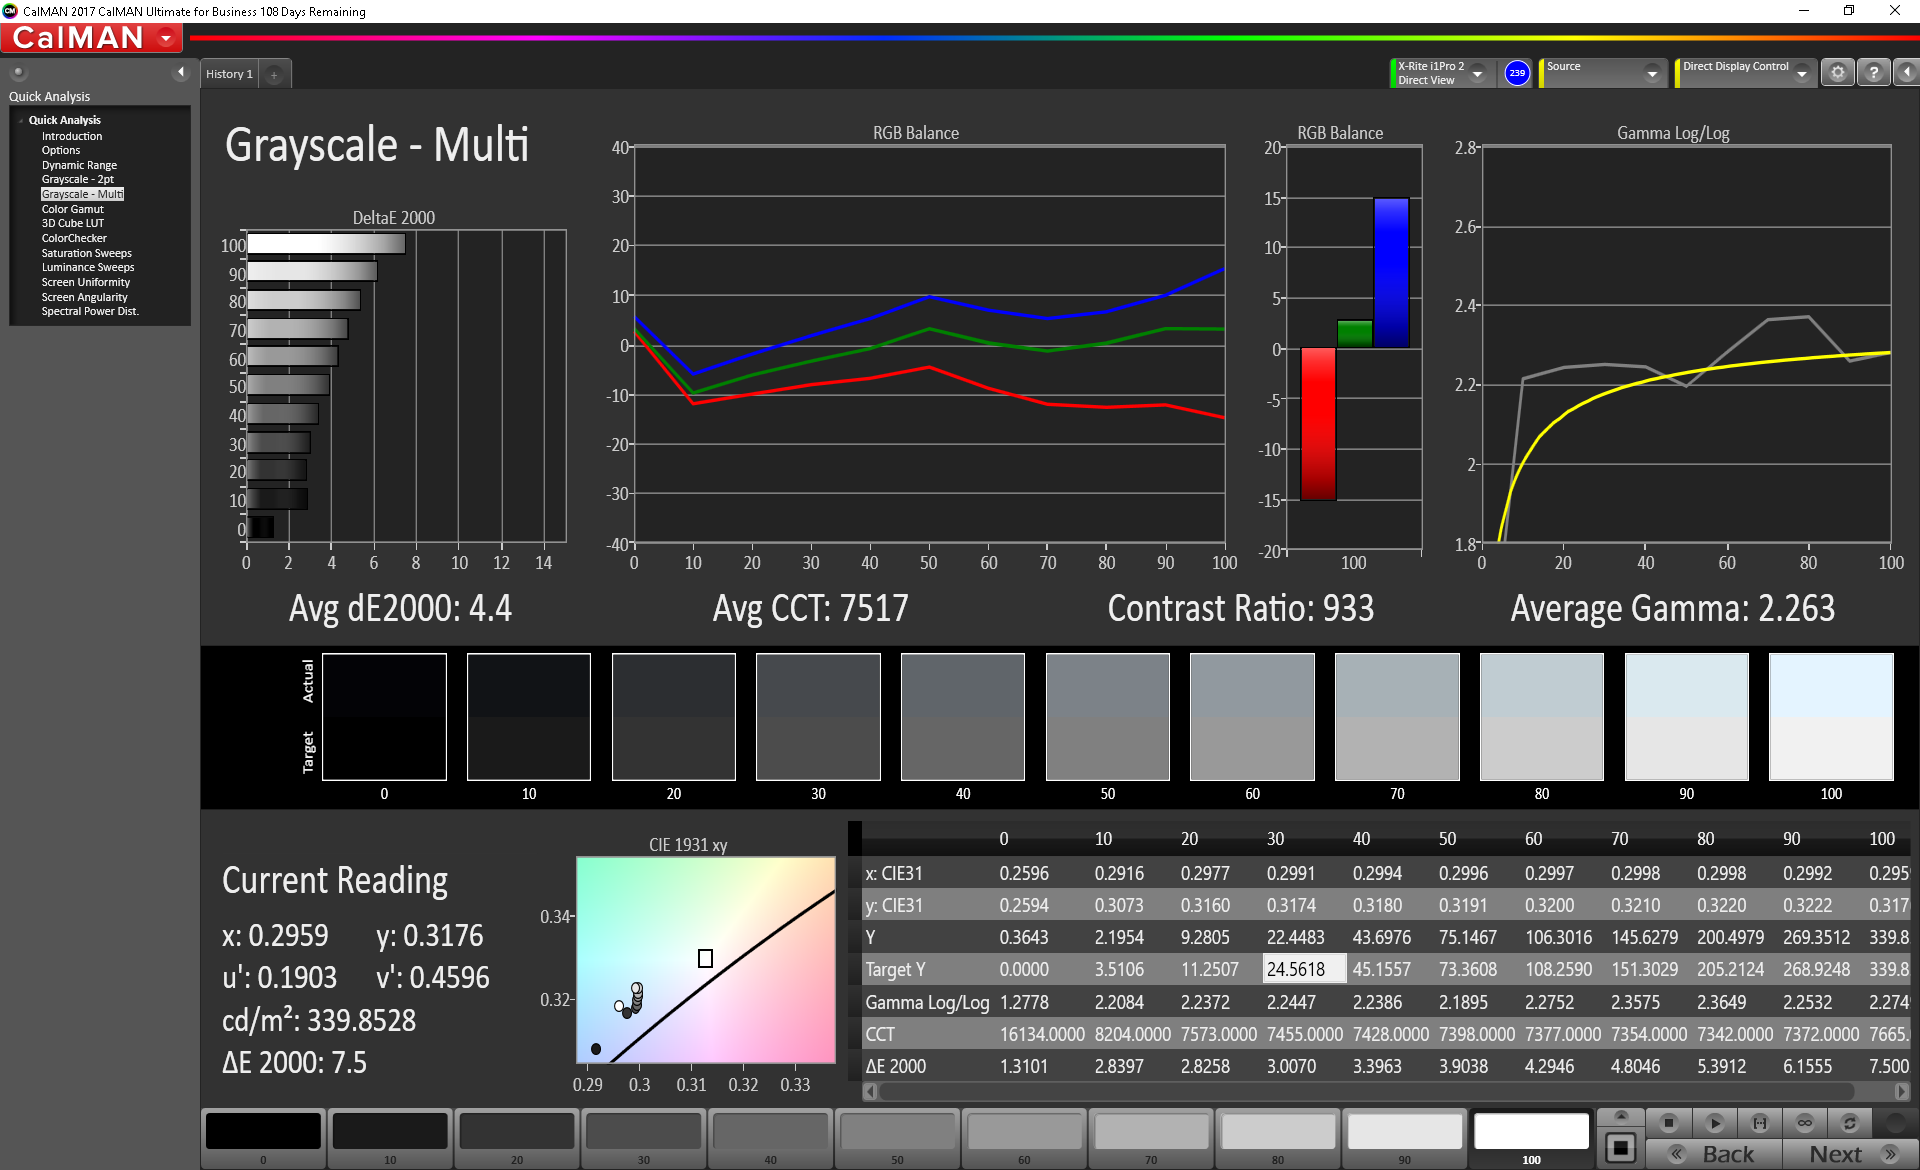
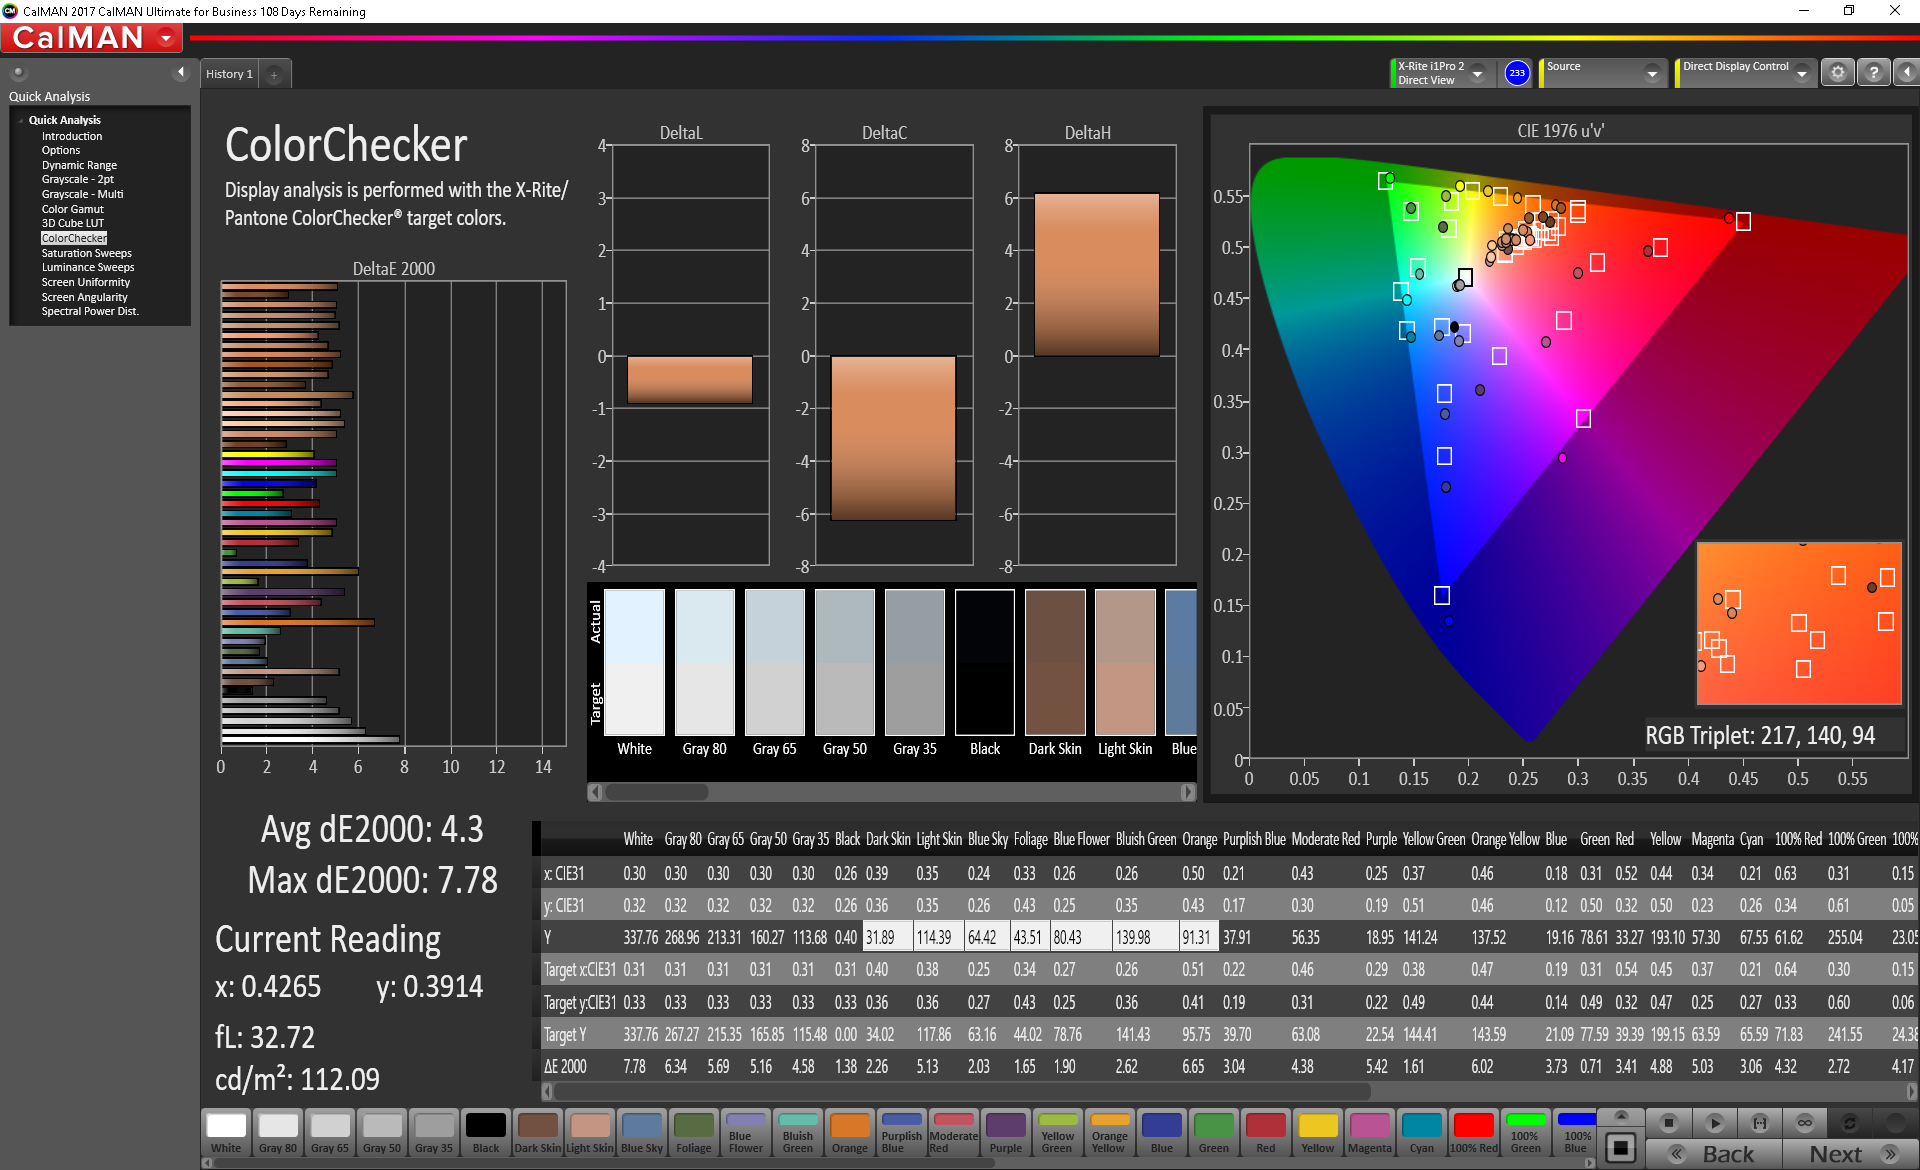
Further measurements with a X-Rite spectrophotometer reveal average grayscale and a slightly cool color temperature. Our calibration efforts improve both grayscale and RGB balance and so we recommend an end-user calibration to get the most out of the display.
Display Response Times
| ↔ Response Time Black to White | ||
|---|---|---|
| 10.4 ms ... rise ↗ and fall ↘ combined | ↗ 5.2 ms rise | 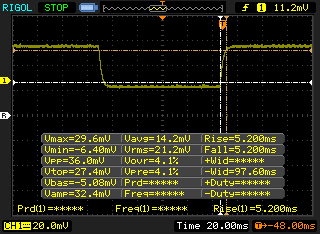 |
| ↘ 5.2 ms fall | ||
| The screen shows good response rates in our tests, but may be too slow for competitive gamers. In comparison, all tested devices range from 0.1 (minimum) to 240 (maximum) ms. » 28 % of all devices are better. This means that the measured response time is better than the average of all tested devices (19.9 ms). | ||
| ↔ Response Time 50% Grey to 80% Grey | ||
| 7.8 ms ... rise ↗ and fall ↘ combined | ↗ 4.4 ms rise | 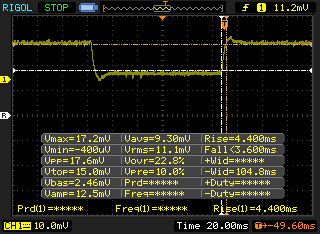 |
| ↘ 3.4 ms fall | ||
| The screen shows very fast response rates in our tests and should be very well suited for fast-paced gaming. In comparison, all tested devices range from 0.165 (minimum) to 636 (maximum) ms. » 20 % of all devices are better. This means that the measured response time is better than the average of all tested devices (31.1 ms). | ||
Screen Flickering / PWM (Pulse-Width Modulation)
| Screen flickering / PWM not detected | 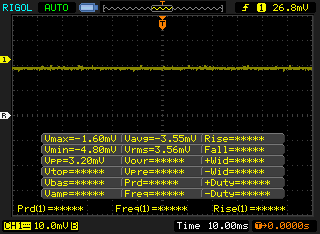 | ||
In comparison: 52 % of all tested devices do not use PWM to dim the display. If PWM was detected, an average of 7798 (minimum: 5 - maximum: 343500) Hz was measured. | |||
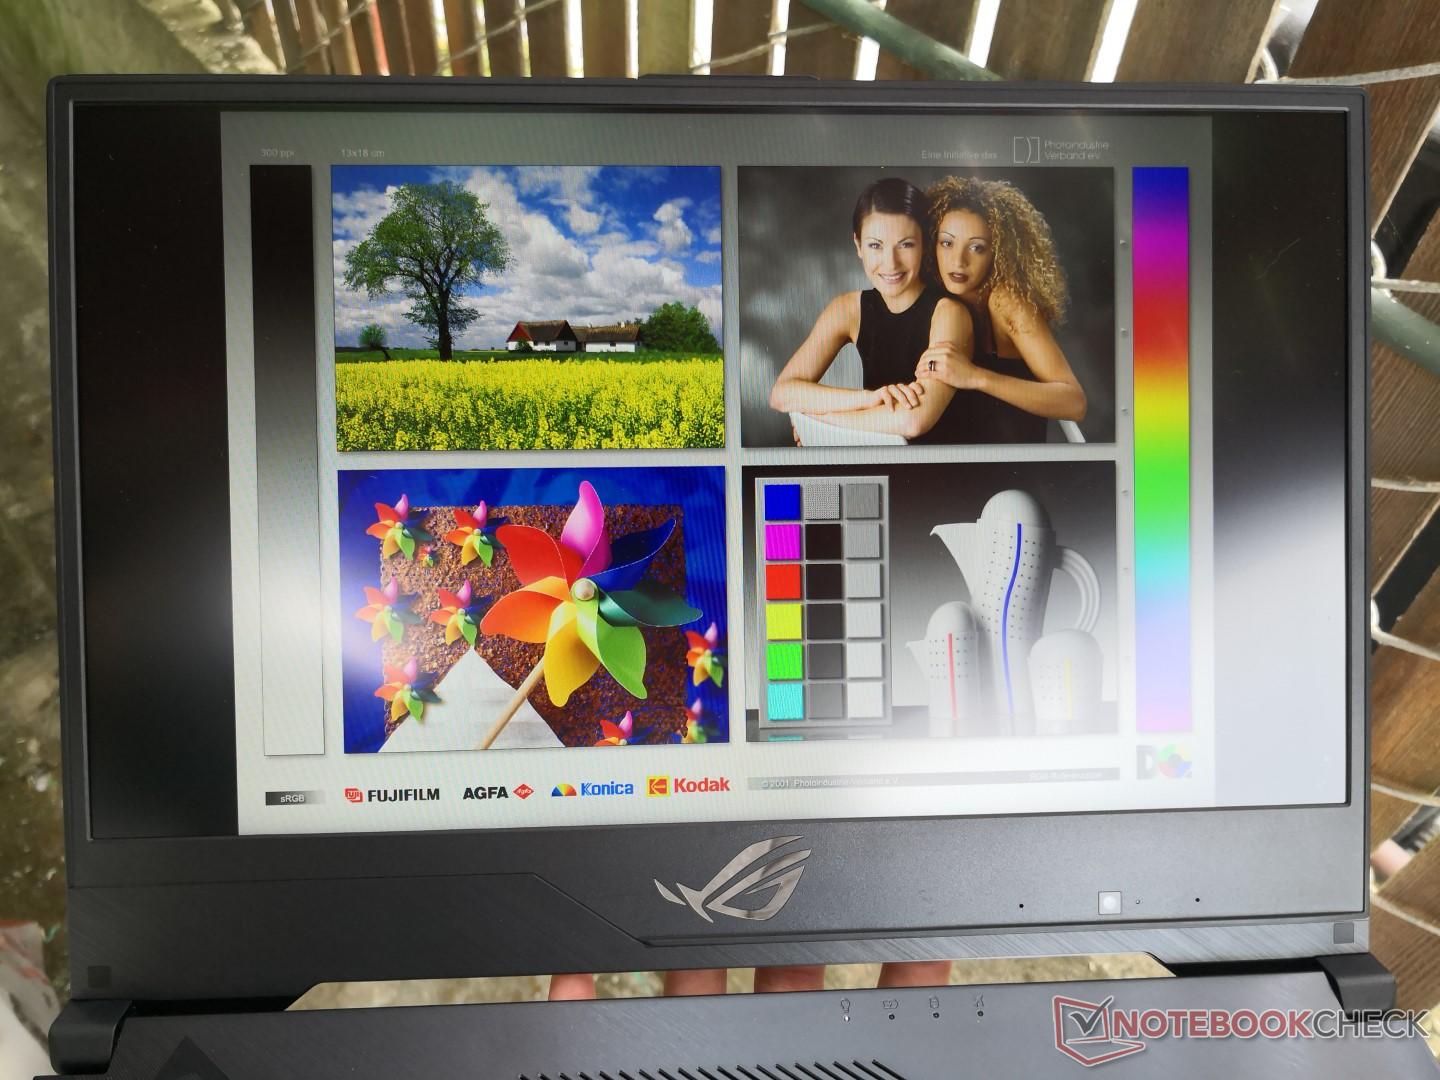
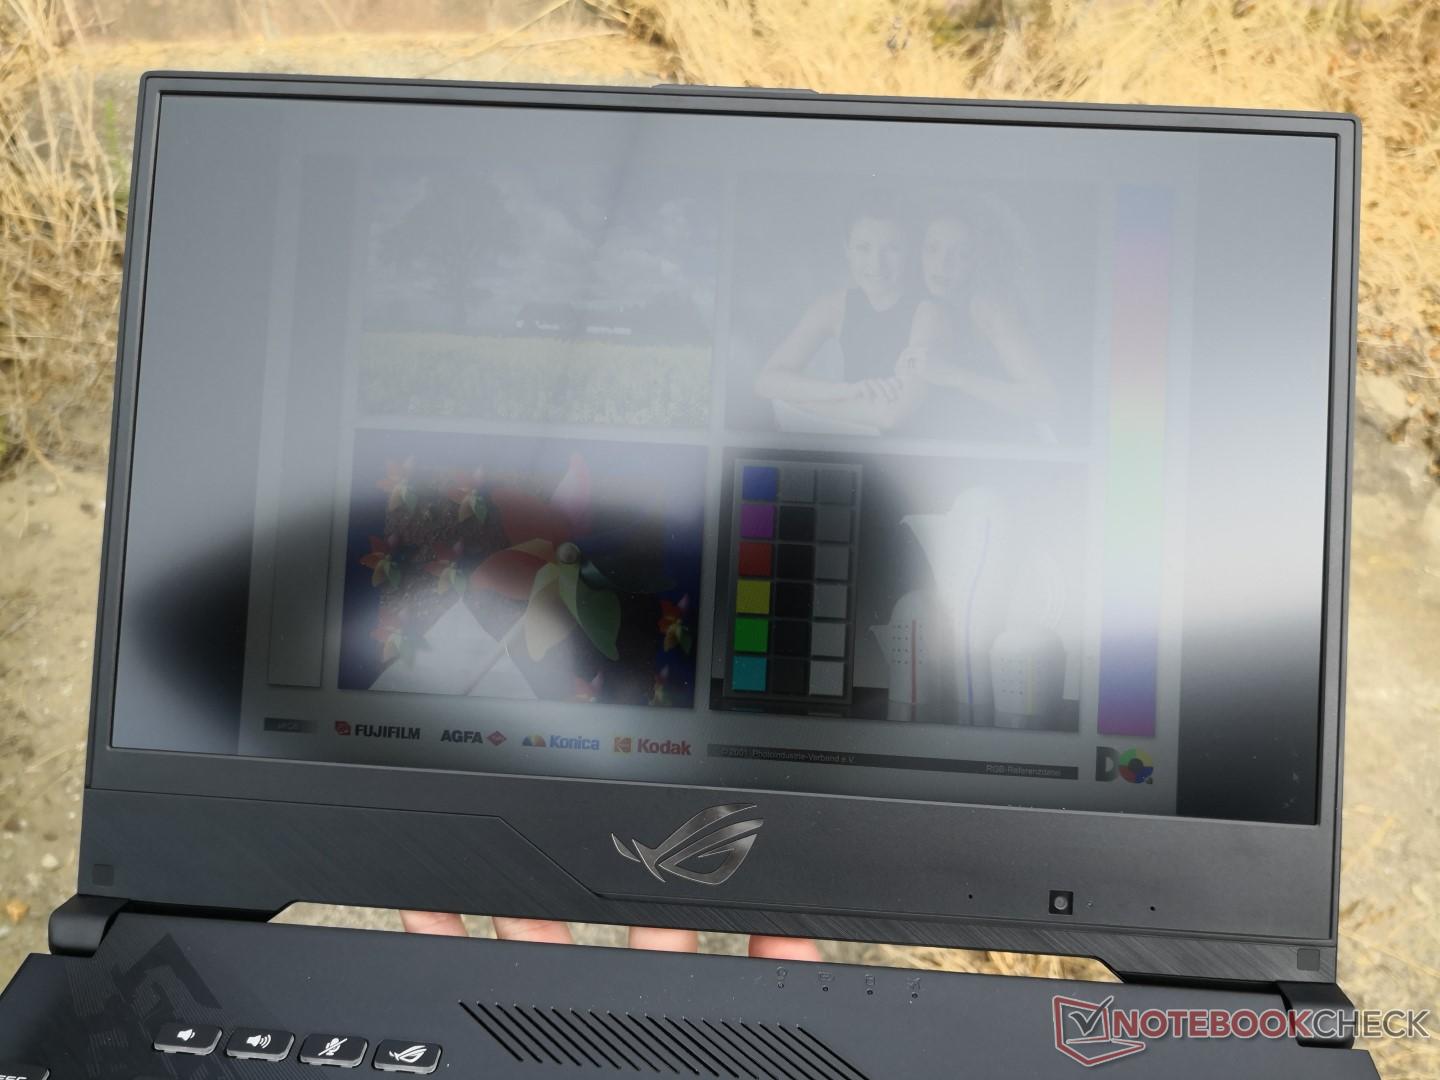
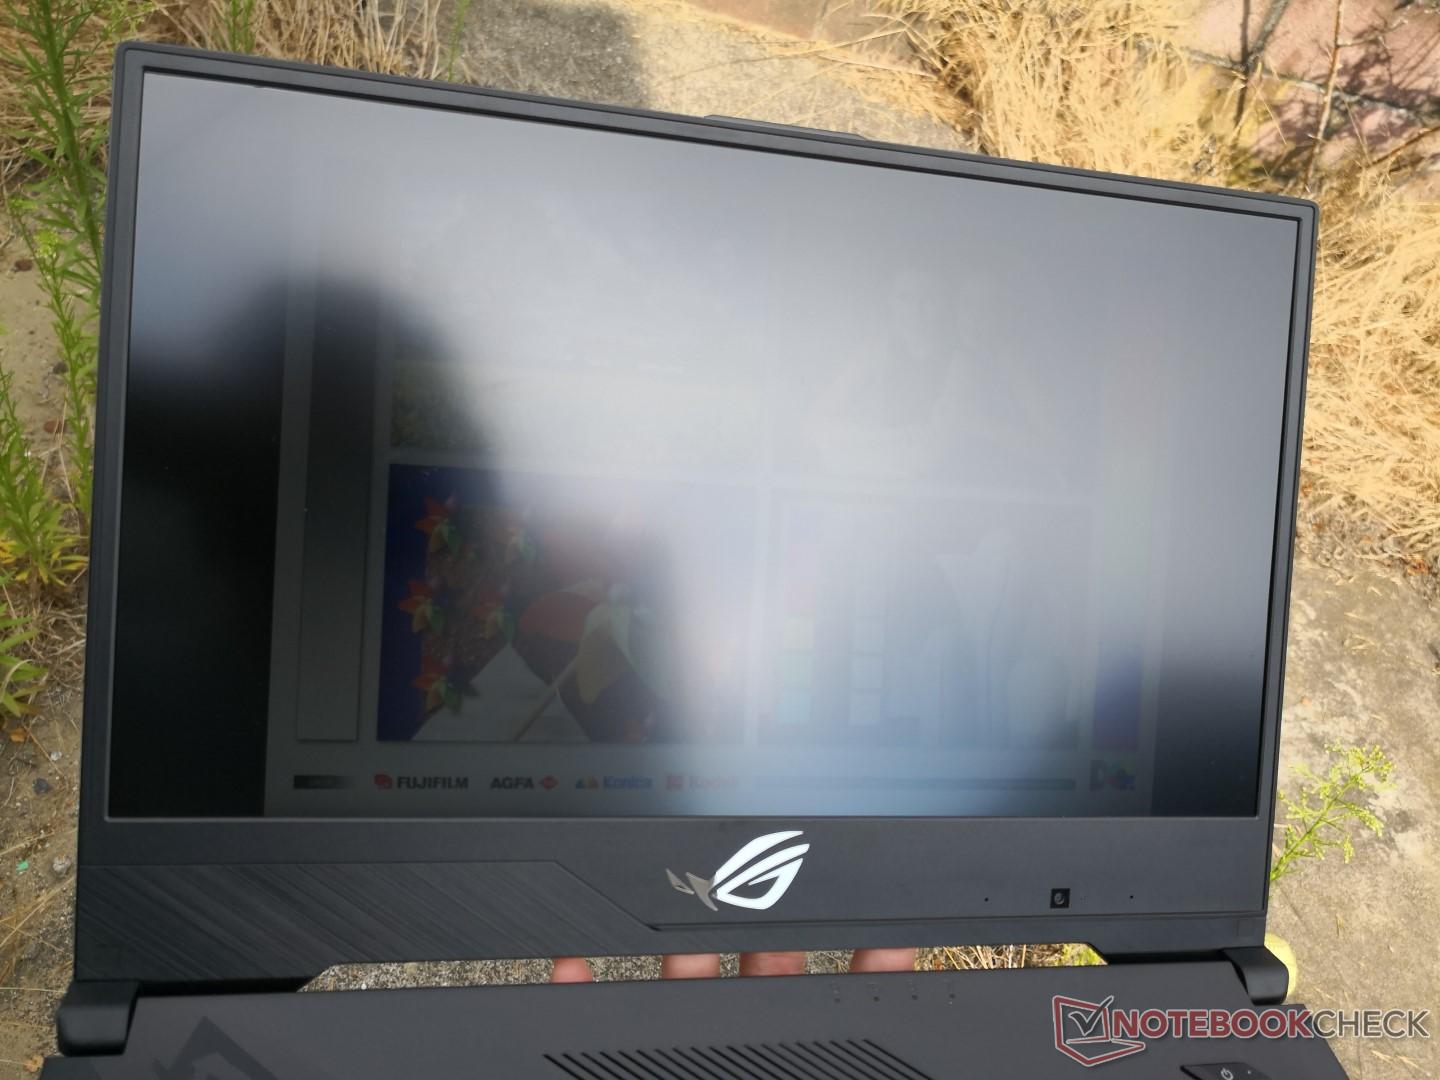
Outdoor visibility is average under shade and too dim when standing in sunlight. Though the bezels are thin, the GL504 was definitely not designed for extended use outdoors.
Performance
The GL504 series can be configured with the Core i5-8300H, Core i7-8750H, GTX 1060, or GTX 1070 at the time of writing. A standard 60 Hz panel is also an option for the GL504GM. Asus is clearly aiming for the mid-to-high gaming audience based on these specifications and the kind of gaming performance we can expect. Users who want even more power should consider the enthusiast Zephyrus GX series or 17.3-inch G7xx series where unlocked HK-class CPUs and the GTX 1080 are common options.
Processor
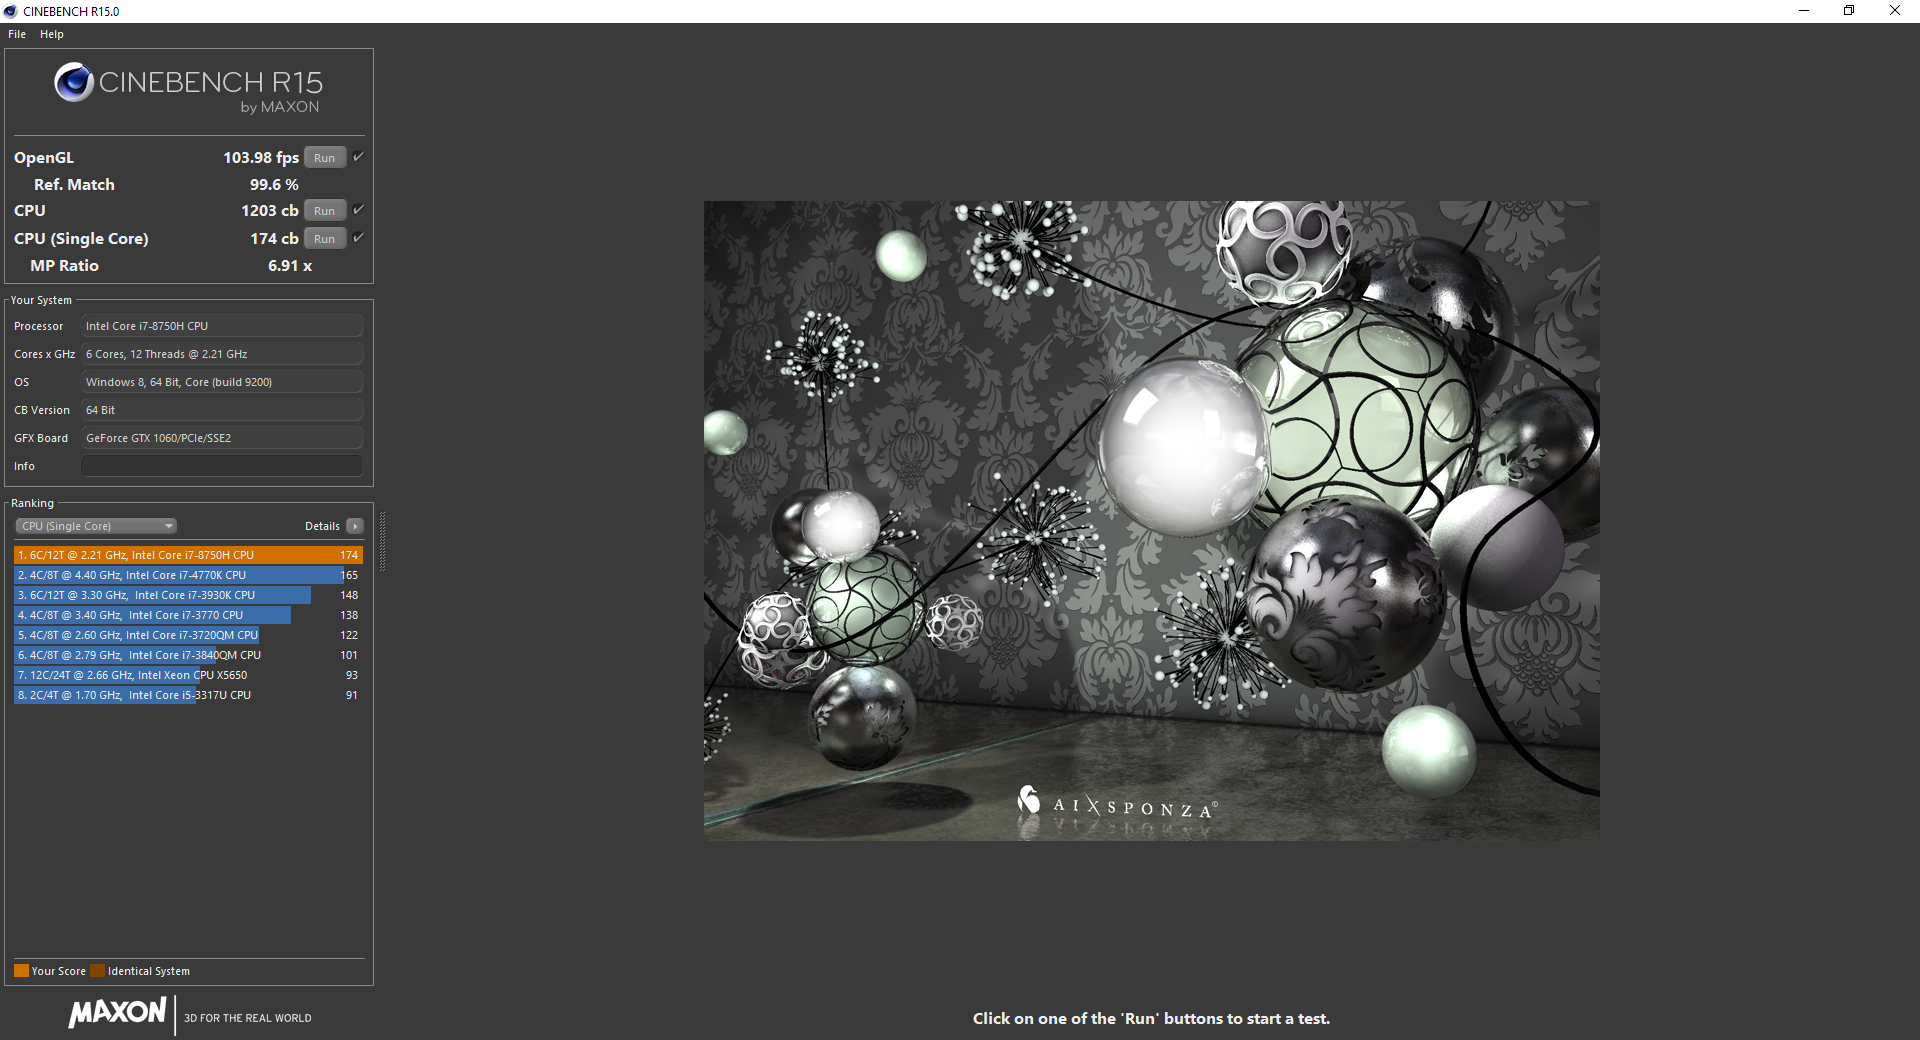
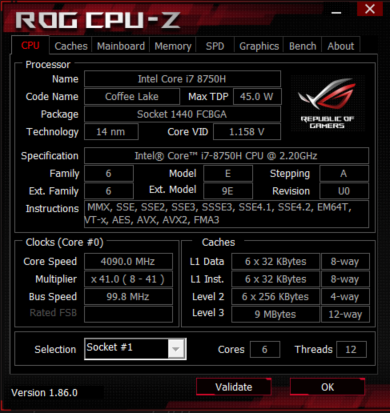
CPU performance is where we expect it to be with no surprises. The Core i7-8750H in our Asus is roughly 70 percent faster in multi-threaded workloads than the Core i7-7700HQ as found on the last generation Asus GL703VM and nearly 100 percent faster than the i5-8300H in the less expensive Asus FX504GD. More impressively, however, the GL504GM is able to maintain a high level of CPU performance even when subjected to extreme CPU stress for extended periods. By running CineBench R15 Multi-Thread in a loop, we are able to record a performance dip of just 9 percent over time. Results are actually slightly better than the same CPU in the GL504GS.
The Core i7-8750H should be more than enough for the target mainstream gaming audience. See our dedicated page on the i7-8750H for more technical information and benchmark comparisons.
| Cinebench R10 | |
| Rendering Multiple CPUs 32Bit | |
| Eurocom Sky X4C | |
| Average Intel Core i7-8750H (29664 - 35307, n=25) | |
| Asus GL702ZC-GC104T | |
| Asus Strix GL502VM-FY039T | |
| Asus FX504GD | |
| Asus Strix GL703VM-DB74 | |
| Rendering Single 32Bit | |
| Eurocom Sky X4C | |
| Asus FX504GD | |
| Average Intel Core i7-8750H (6236 - 6645, n=25) | |
| Asus Strix GL502VM-FY039T | |
| Asus Strix GL703VM-DB74 | |
| Asus GL702ZC-GC104T | |
| wPrime 2.10 - 1024m | |
| Asus FX504GD | |
| Asus Strix GL703VM-DB74 | |
| Average Intel Core i7-8750H (125.5 - 180.5, n=6) | |
| Eurocom Sky X4C | |
* ... smaller is better
System Performance
PCMark scores are not unlike on the GL504GS with some benchmarks even returning slightly higher scores. Regardless, the results are about where we expect them to be considering the hardware.
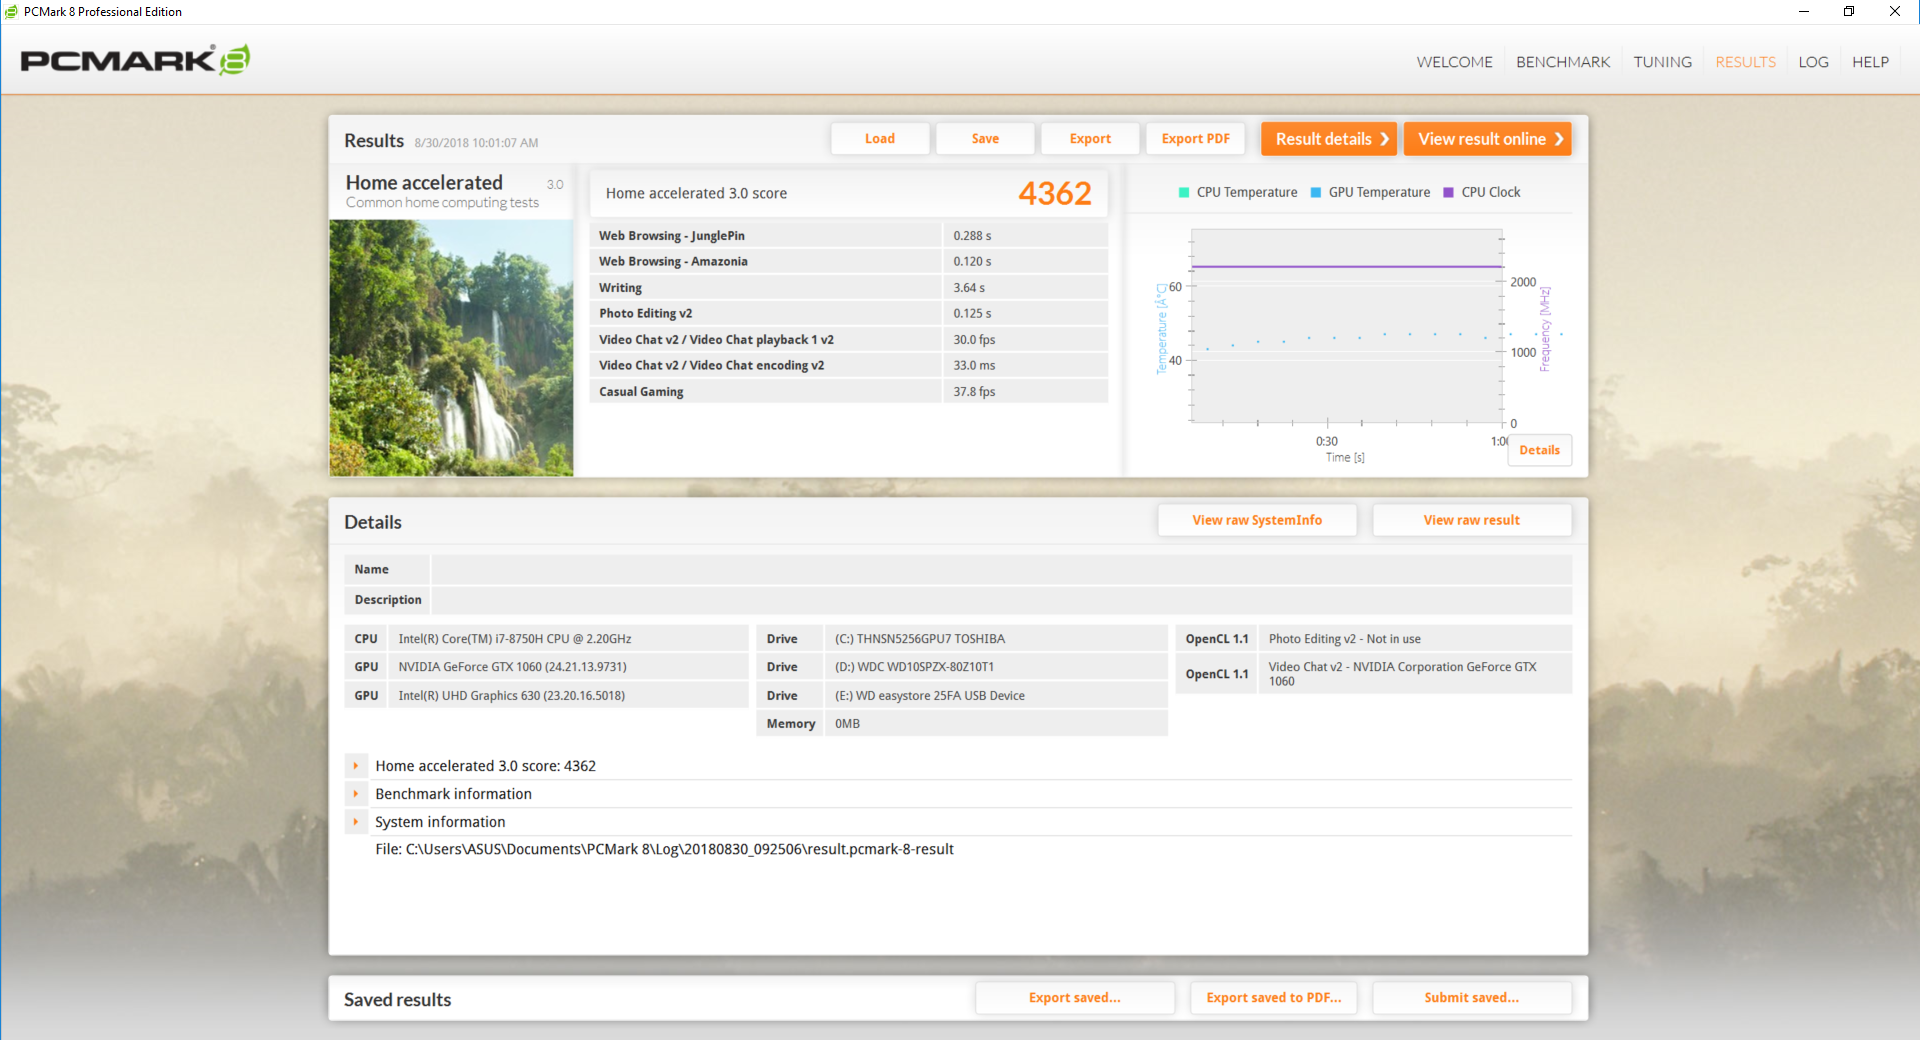
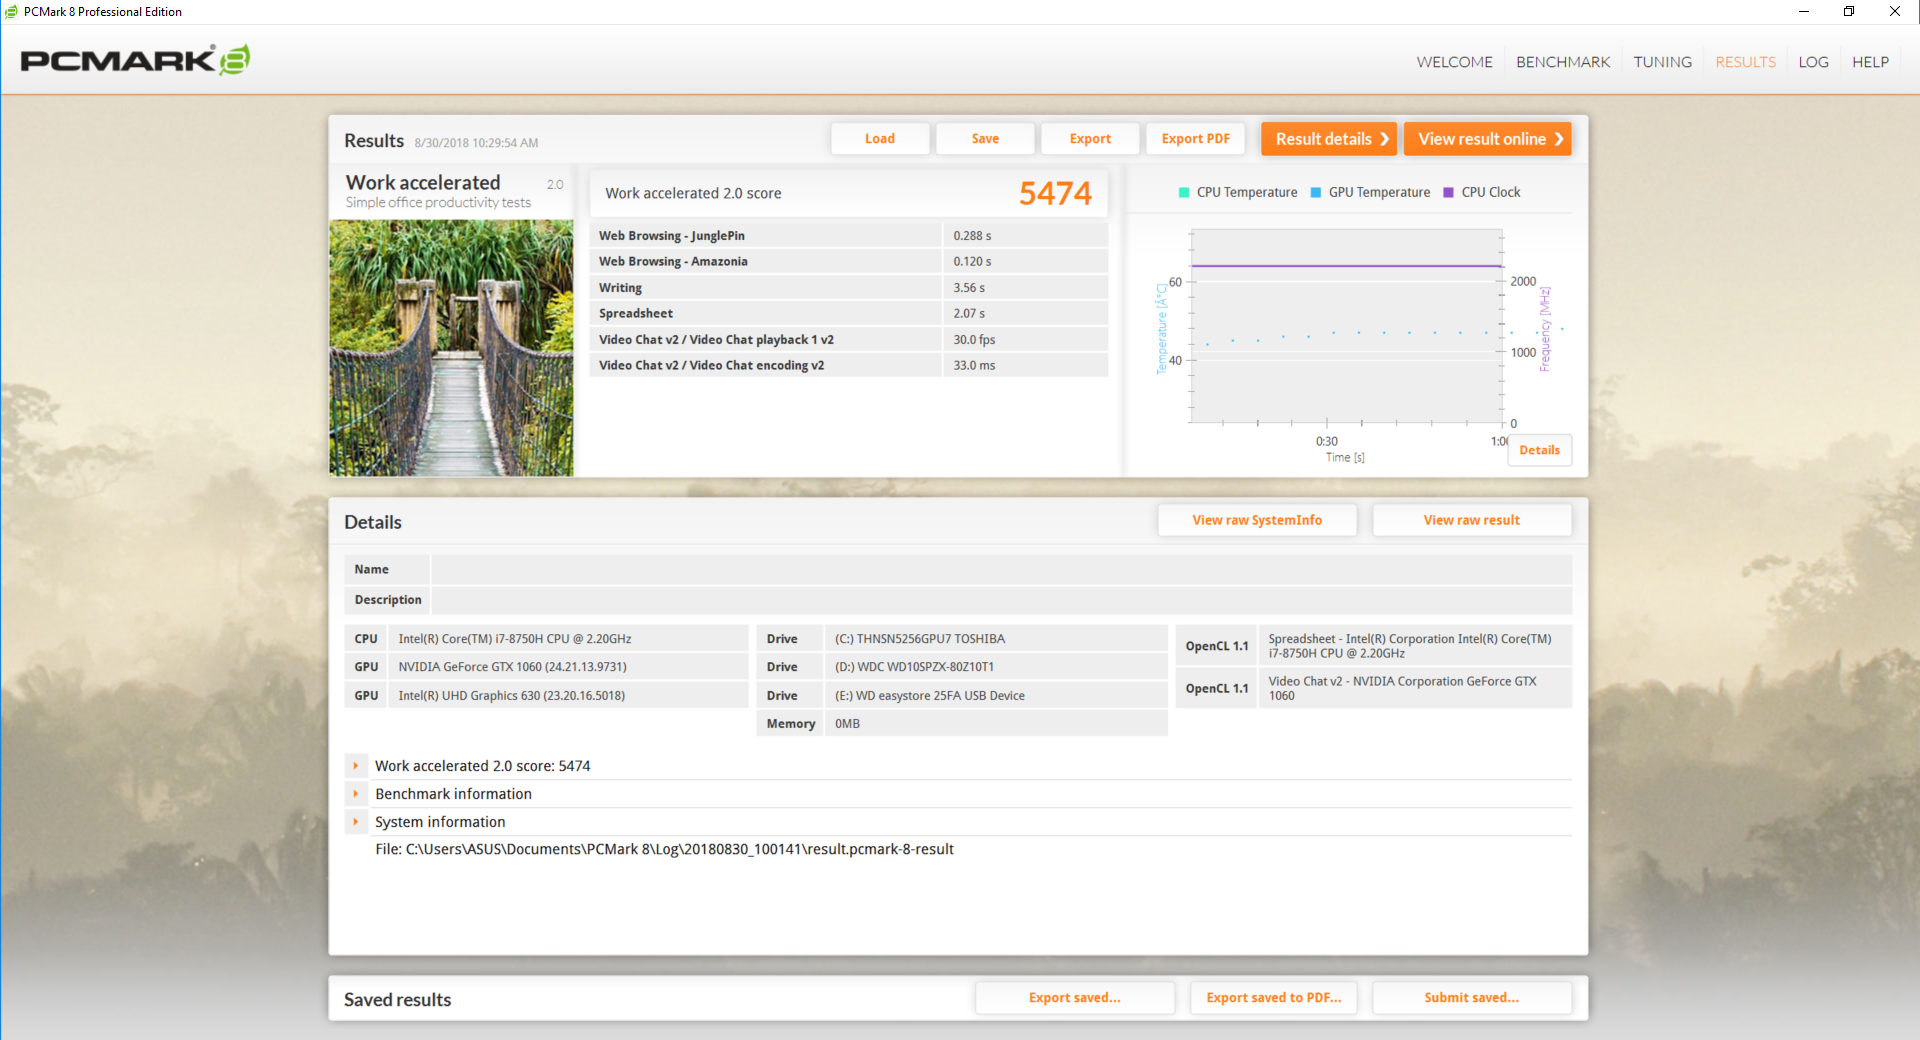
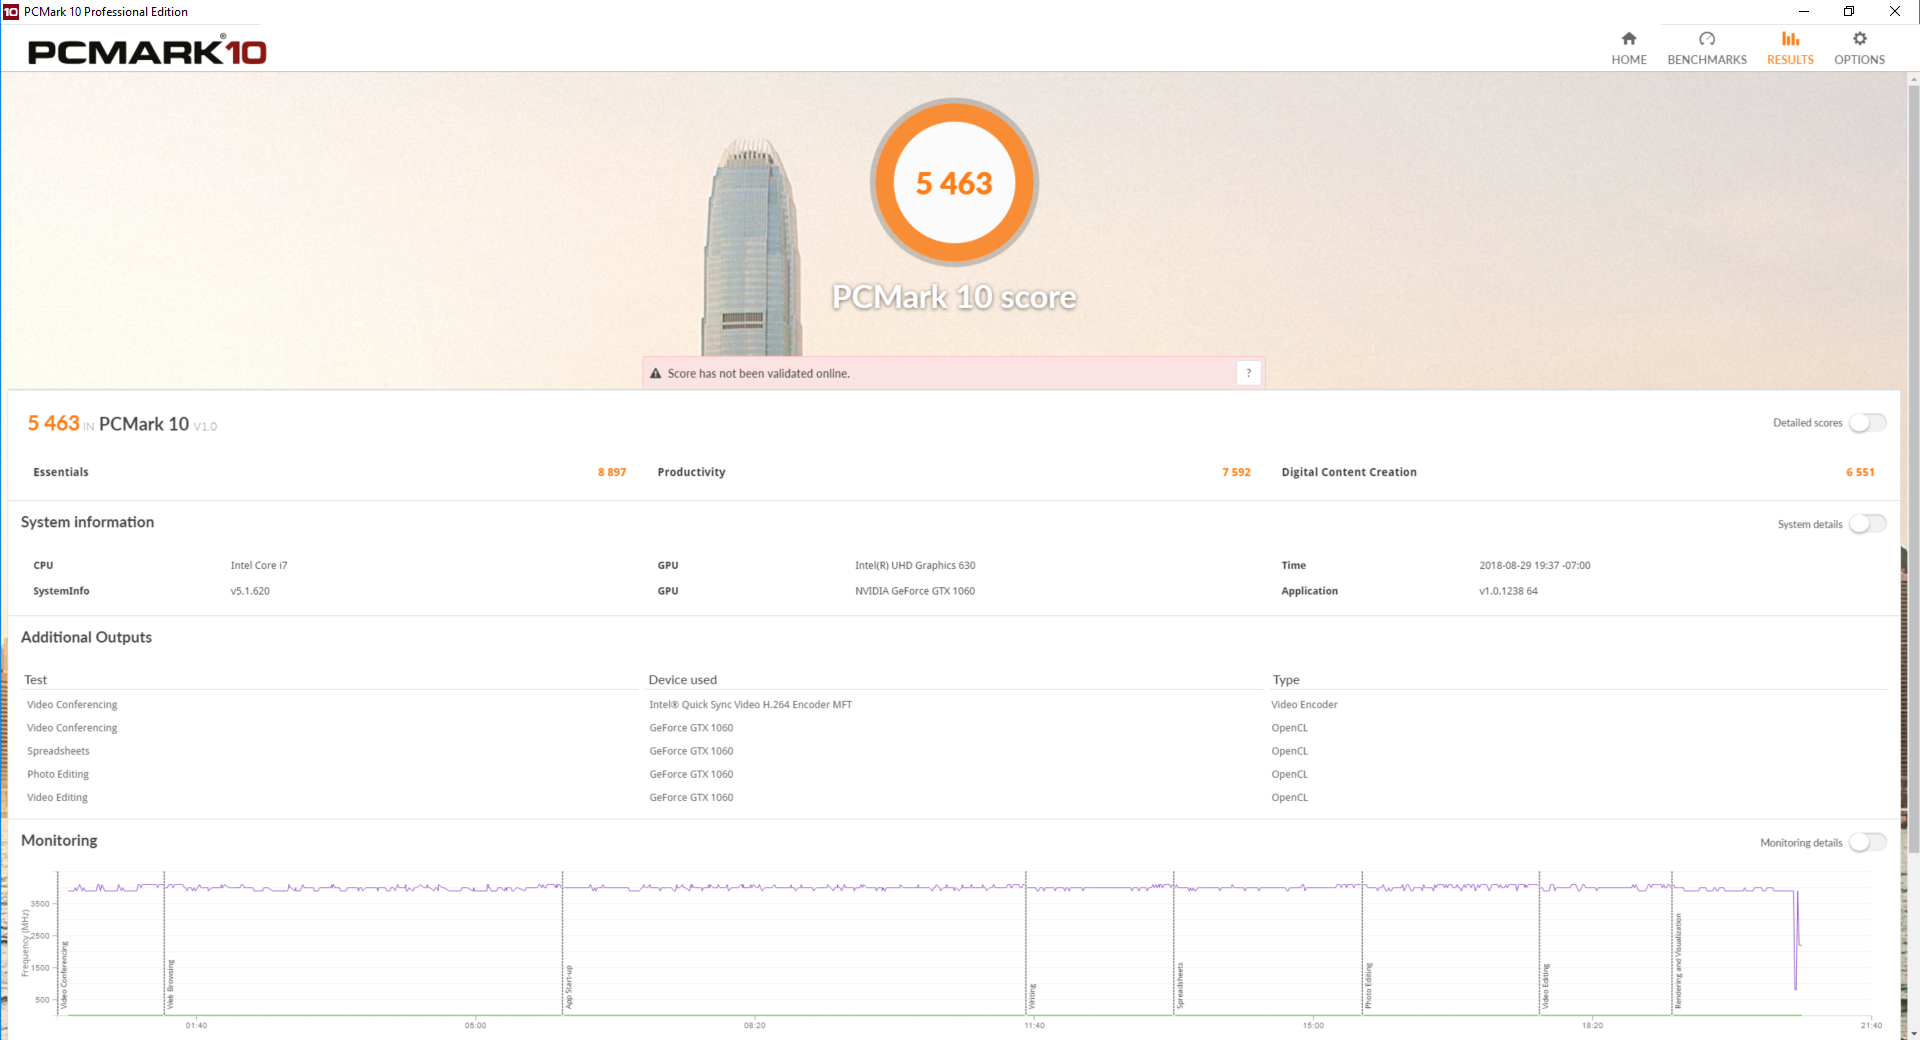
| PCMark 8 Home Score Accelerated v2 | 4362 points | |
| PCMark 8 Work Score Accelerated v2 | 5474 points | |
| PCMark 10 Score | 5463 points | |
Help | ||
Storage Devices
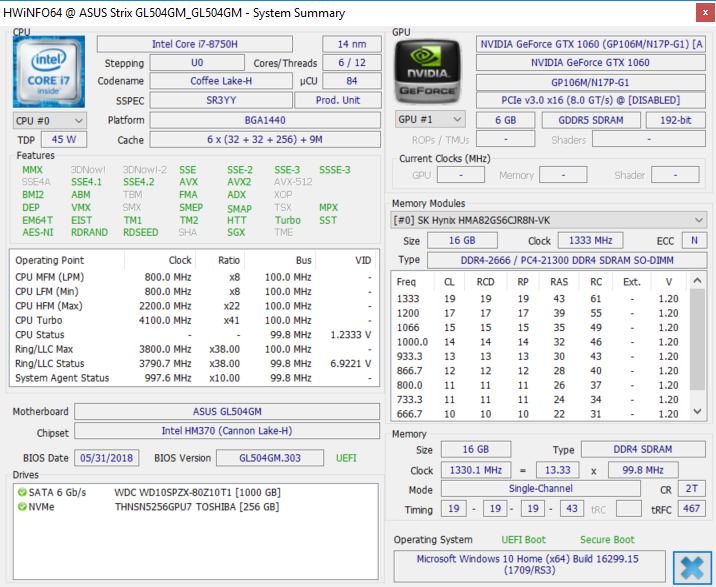
Internal drive options include M.2 2280 NVMe and a standard 2.5-inch SATA III bay. Our specific test unit is equipped with a 256 GB Toshiba THNSN5256GPU7 NVMe SSD and a secondary 1 TB WD Blue WD10SPZX HDD, but resellers like CUKUSA may offer different SSD options. We recommend using a primary SSD and sticking to 7 mm HDDs if more capacity is required.
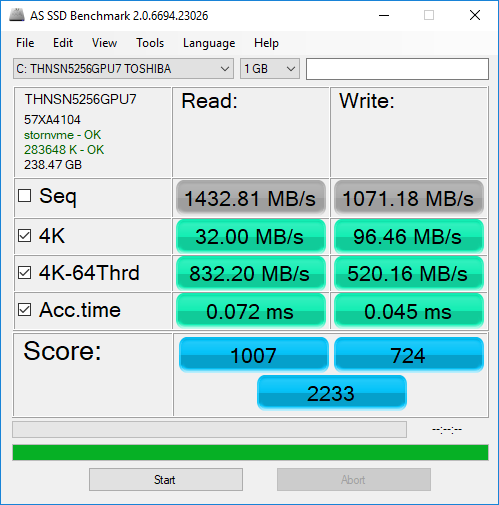
The Toshiba SSD in our GL504GM is fast but merely average for a NVMe drive. Samsung SSDs continue to offer faster transfer rates across the board.
See our table of HDDs and SSDs for more benchmark comparisons.
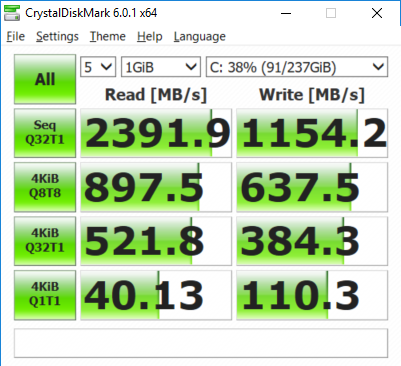
| Asus Strix GL504GM Toshiba NVMe THNSN5256GPU7 | Asus GL504GS Samsung SSD PM981 MZVLB512HAJQ | MSI GS65 8RF-019DE Stealth Thin Samsung SSD PM981 MZVLB512HAJQ | Razer Blade 15 GTX 1060 Samsung SSD PM981 MZVLB512HAJQ | Asus Zephyrus M GM501 Samsung SM961 MZVKW512HMJP m.2 PCI-e | |
|---|---|---|---|---|---|
| AS SSD | 75% | 66% | 53% | 50% | |
| Copy Game MB/s (MB/s) | 1088 | 882 -19% | |||
| Copy Program MB/s (MB/s) | 752 | 370.7 -51% | |||
| Copy ISO MB/s (MB/s) | 1006 | 1452 44% | |||
| Score Total (Points) | 2233 | 4318 93% | 4122 85% | 4095 83% | 3649 63% |
| Score Write (Points) | 724 | 1983 174% | 2051 183% | 1955 170% | 1446 100% |
| Score Read (Points) | 1007 | 1542 53% | 1346 34% | 1407 40% | 1471 46% |
| Access Time Write * (ms) | 0.045 | 0.035 22% | 0.035 22% | 0.037 18% | 0.041 9% |
| Access Time Read * (ms) | 0.072 | 0.049 32% | 0.073 -1% | 0.05 31% | 0.046 36% |
| 4K-64 Write (MB/s) | 520 | 1704 228% | 1760 238% | 1664 220% | 1198 130% |
| 4K-64 Read (MB/s) | 832 | 1305 57% | 1170 41% | 1177 41% | 1218 46% |
| 4K Write (MB/s) | 96.5 | 105.7 10% | 107.2 11% | 99.2 3% | 90.2 -7% |
| 4K Read (MB/s) | 32 | 53.3 67% | 48.94 53% | 48.56 52% | 43.42 36% |
| Seq Write (MB/s) | 1071 | 1730 62% | 1834 71% | 1917 79% | 1580 48% |
| Seq Read (MB/s) | 1433 | 1837 28% | 1266 -12% | 1820 27% | 2091 46% |
* ... smaller is better

GPU Performance
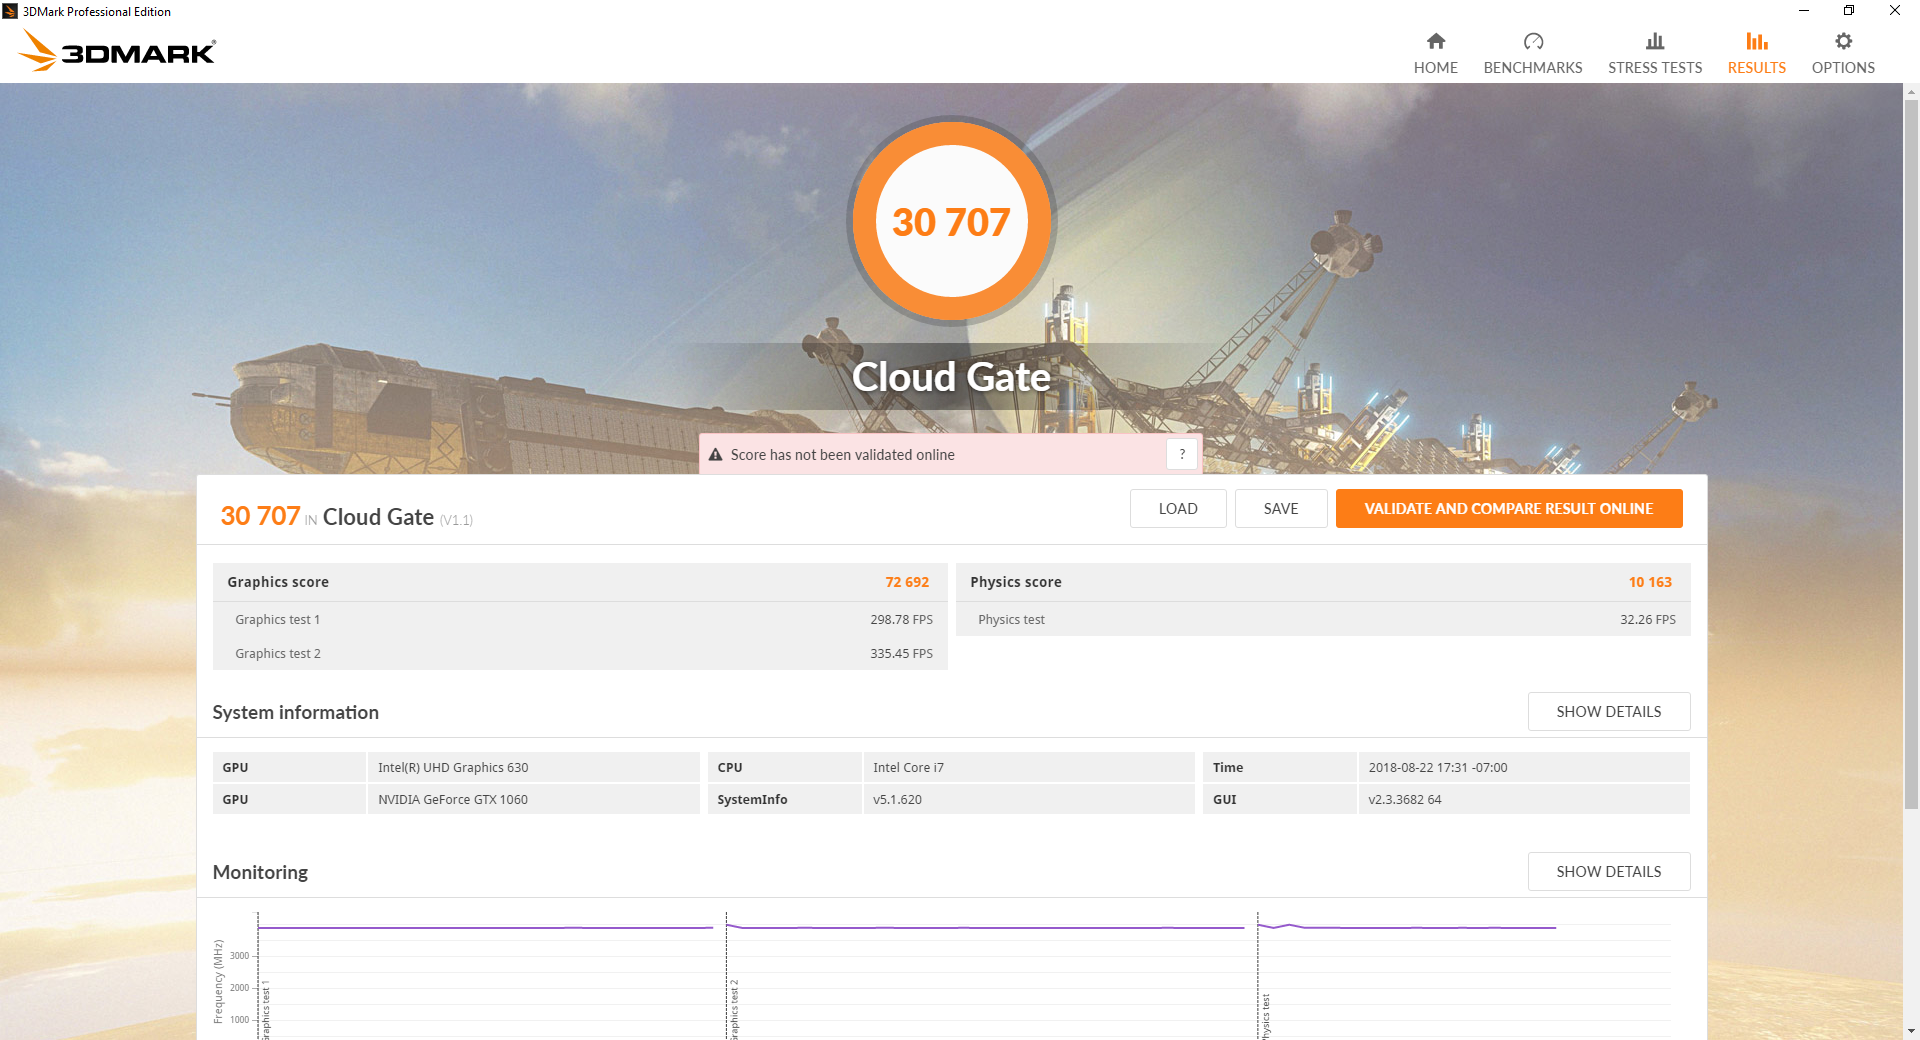
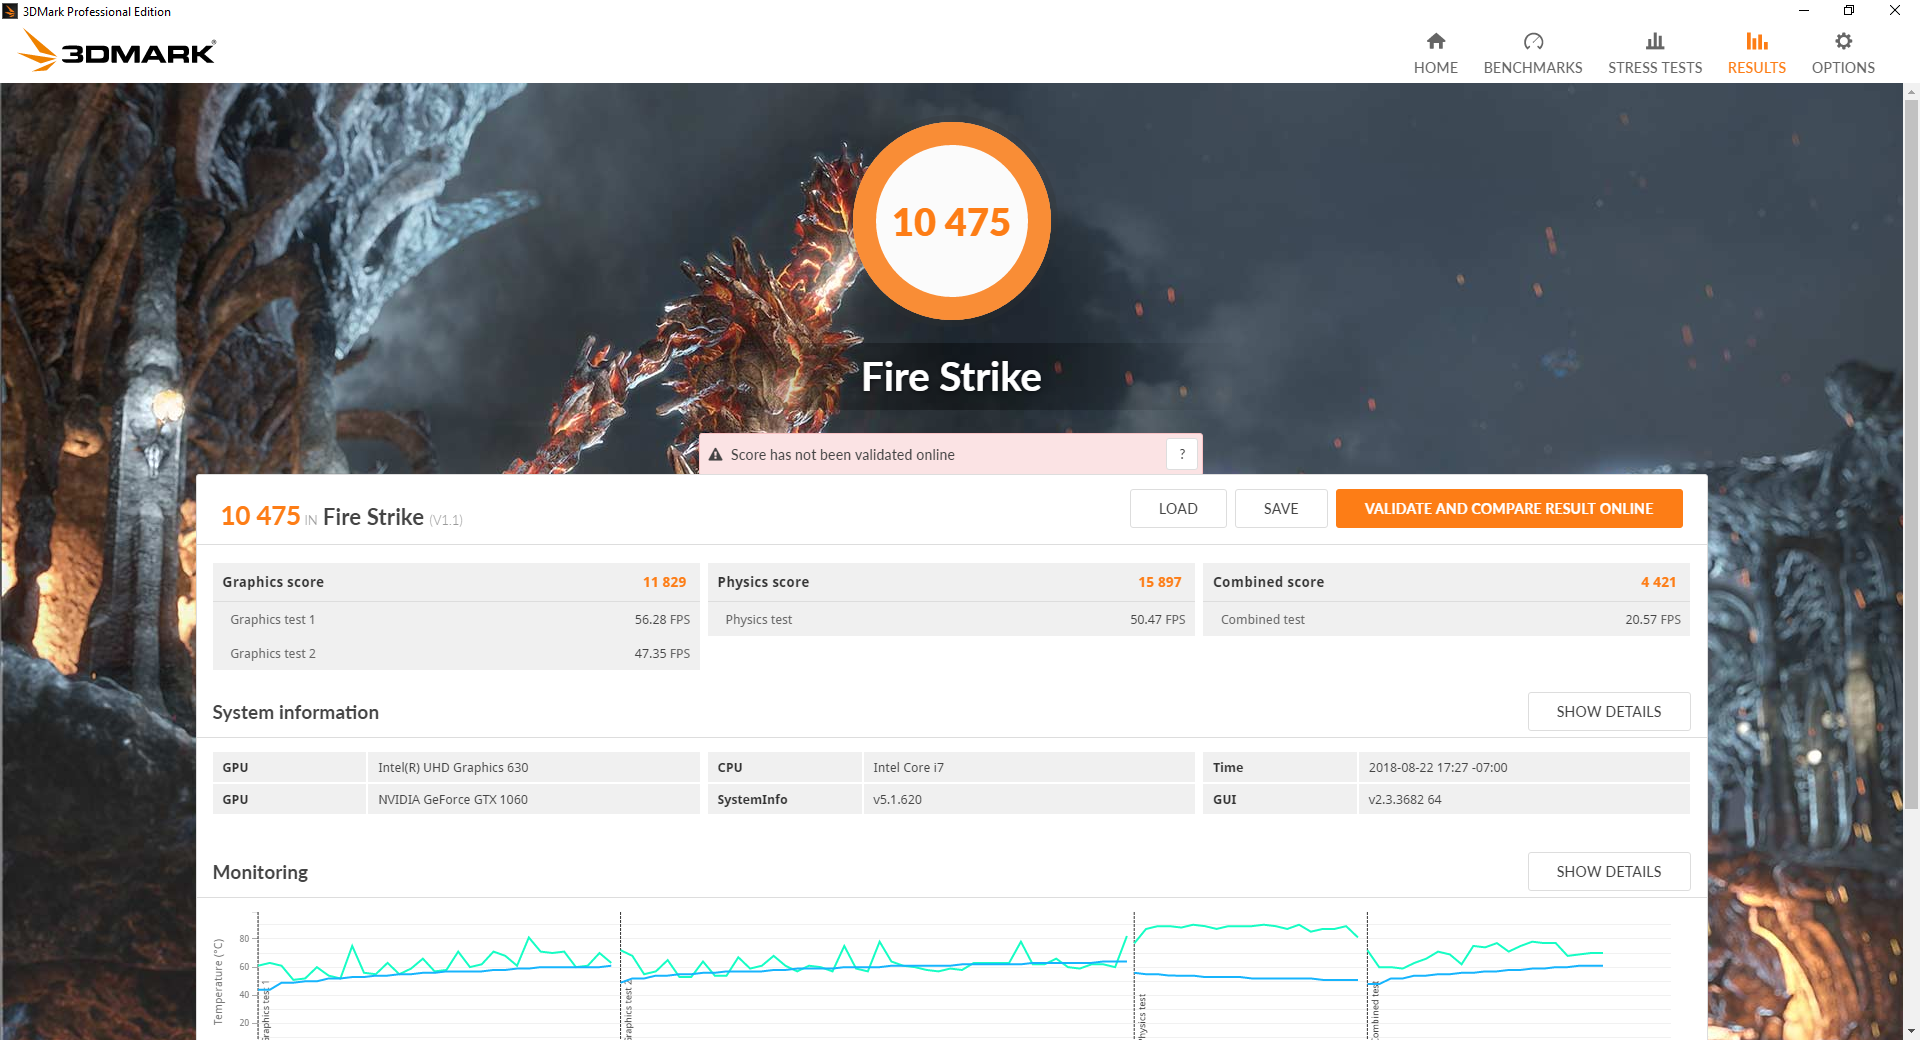
The GTX 1060 in the GL504GM is within 2 to 3 percentage points of the average GTX 1060 in our database taken from a sample of 62 other GTX 1060 laptops. In other words, Asus hasn't throttled or overclocked the GPU in any way for this particular configuration. The desktop GTX 1060 and the GTX 1070 in the GL504GS are about 10 percent and 40 percent faster, respectively, than the GL504GM.
The gaming prowess of the GTX 1060 has been well documented. Expect to be able to play the latest titles on maximum settings at native 1080p. In order to make the most of the 144 Hz display, however, most settings will have to be tuned down significantly to boost frame rates and this is where the GL504GS can flex its bigger muscles. It's unfortunate that G-Sync is not an option as such a feature would have paired very well with the GTX 1060.
See our dedicated page on the GeForce GTX 1060 for more technical information and benchmark comparisons.
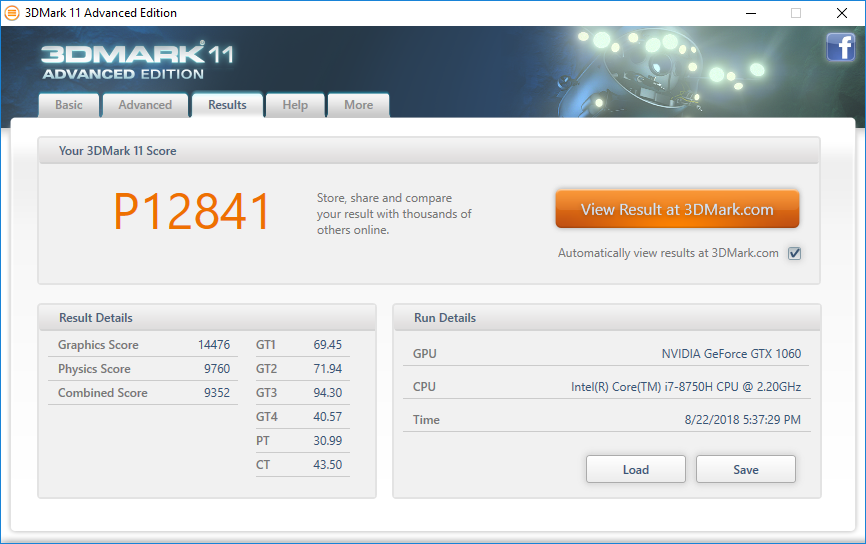
| 3DMark 11 Performance | 12841 points | |
| 3DMark Cloud Gate Standard Score | 30707 points | |
| 3DMark Fire Strike Score | 10475 points | |
Help | ||
| low | med. | high | ultra | |
|---|---|---|---|---|
| BioShock Infinite (2013) | 242.2 | 211 | 198 | 104.7 |
| The Witcher 3 (2015) | 192 | 133.4 | 80.6 | 37.5 |
| Rise of the Tomb Raider (2016) | 145.9 | 121.6 | 82 | 66.9 |
Stress Test
We stress the notebook with synthetic loads to identify for any potential throttling or stability issues. When running Prime95, the system can be observed holding a steady clock rate of 3.9 GHz which is the maximum rated multi-core Turbo Boost for the i7-8750H. The results match our CineBench loop test above where CPU performance is shown to be very consistent even after half an hour of constant stress. Core temperature remains steady at a respectable 77 C. If running both Prime95 and FurMark simultaneously, core temperature rises slightly to 81 C.
Running Witcher 3 is more representative of real-world load. When under such conditions, the CPU and GPU in the GL504GM will run at relatively cool temperatures of 65 C and 68 C, respectively. In comparison, the CPU and GPU in the more powerful GL504GS will be around 80 C and 85 C, respectively, when subjected to the same Witcher 3 load. It's clear that the less demanding GTX 1060 in the GL504GM has a noticeable effect on operating temperatures relative to the GTX 1070-equipped GL504GS.
Running on batteries will limit both CPU and GPU performance even when on the High Performance profile. A 3DMark 11 run on batteries returns Physics and Graphics scores of 7408 and 7267 points, respectively, compared to 9760 and 14476 points when on mains.
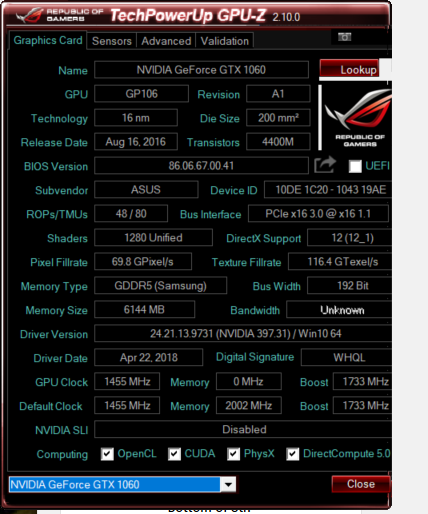
Note that the GPU-Z window in the screenshots below are showing data on the integrated HD Graphics 630 and not the GTX 1060 GPU.
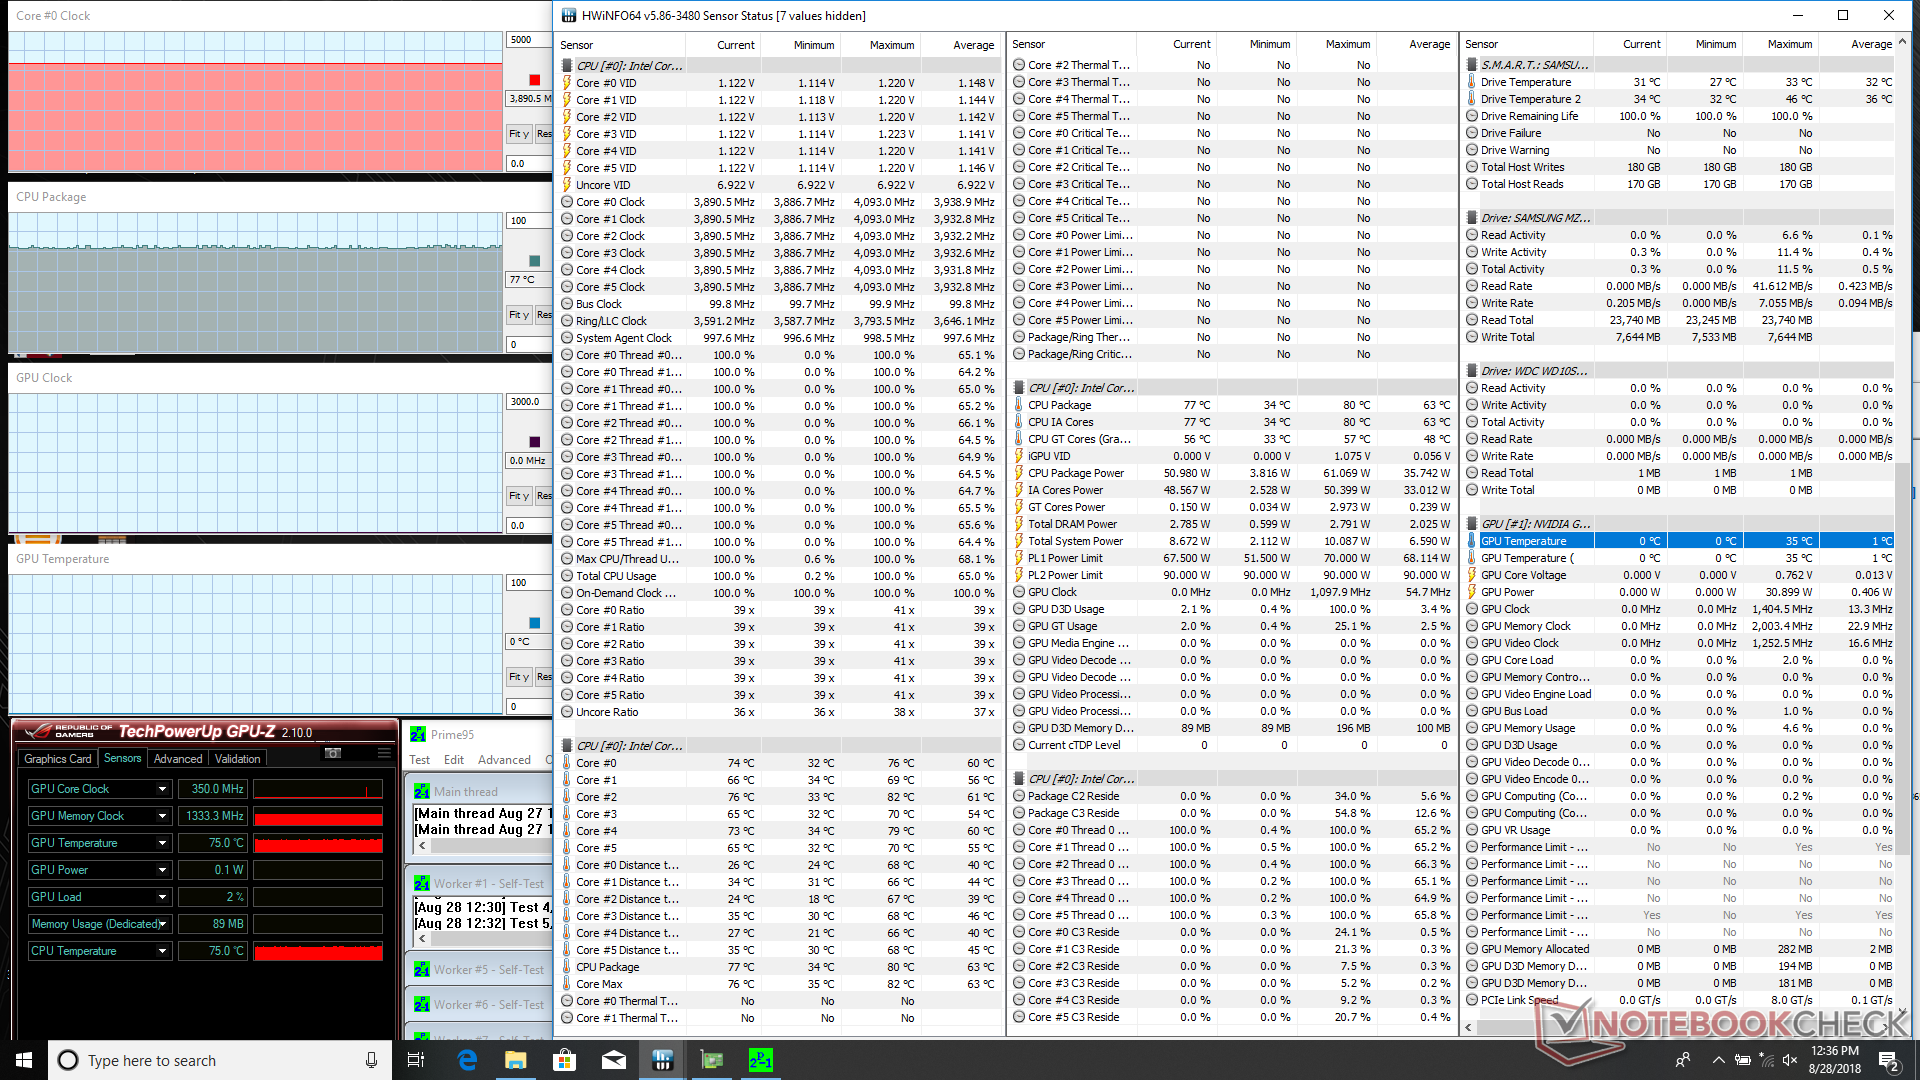
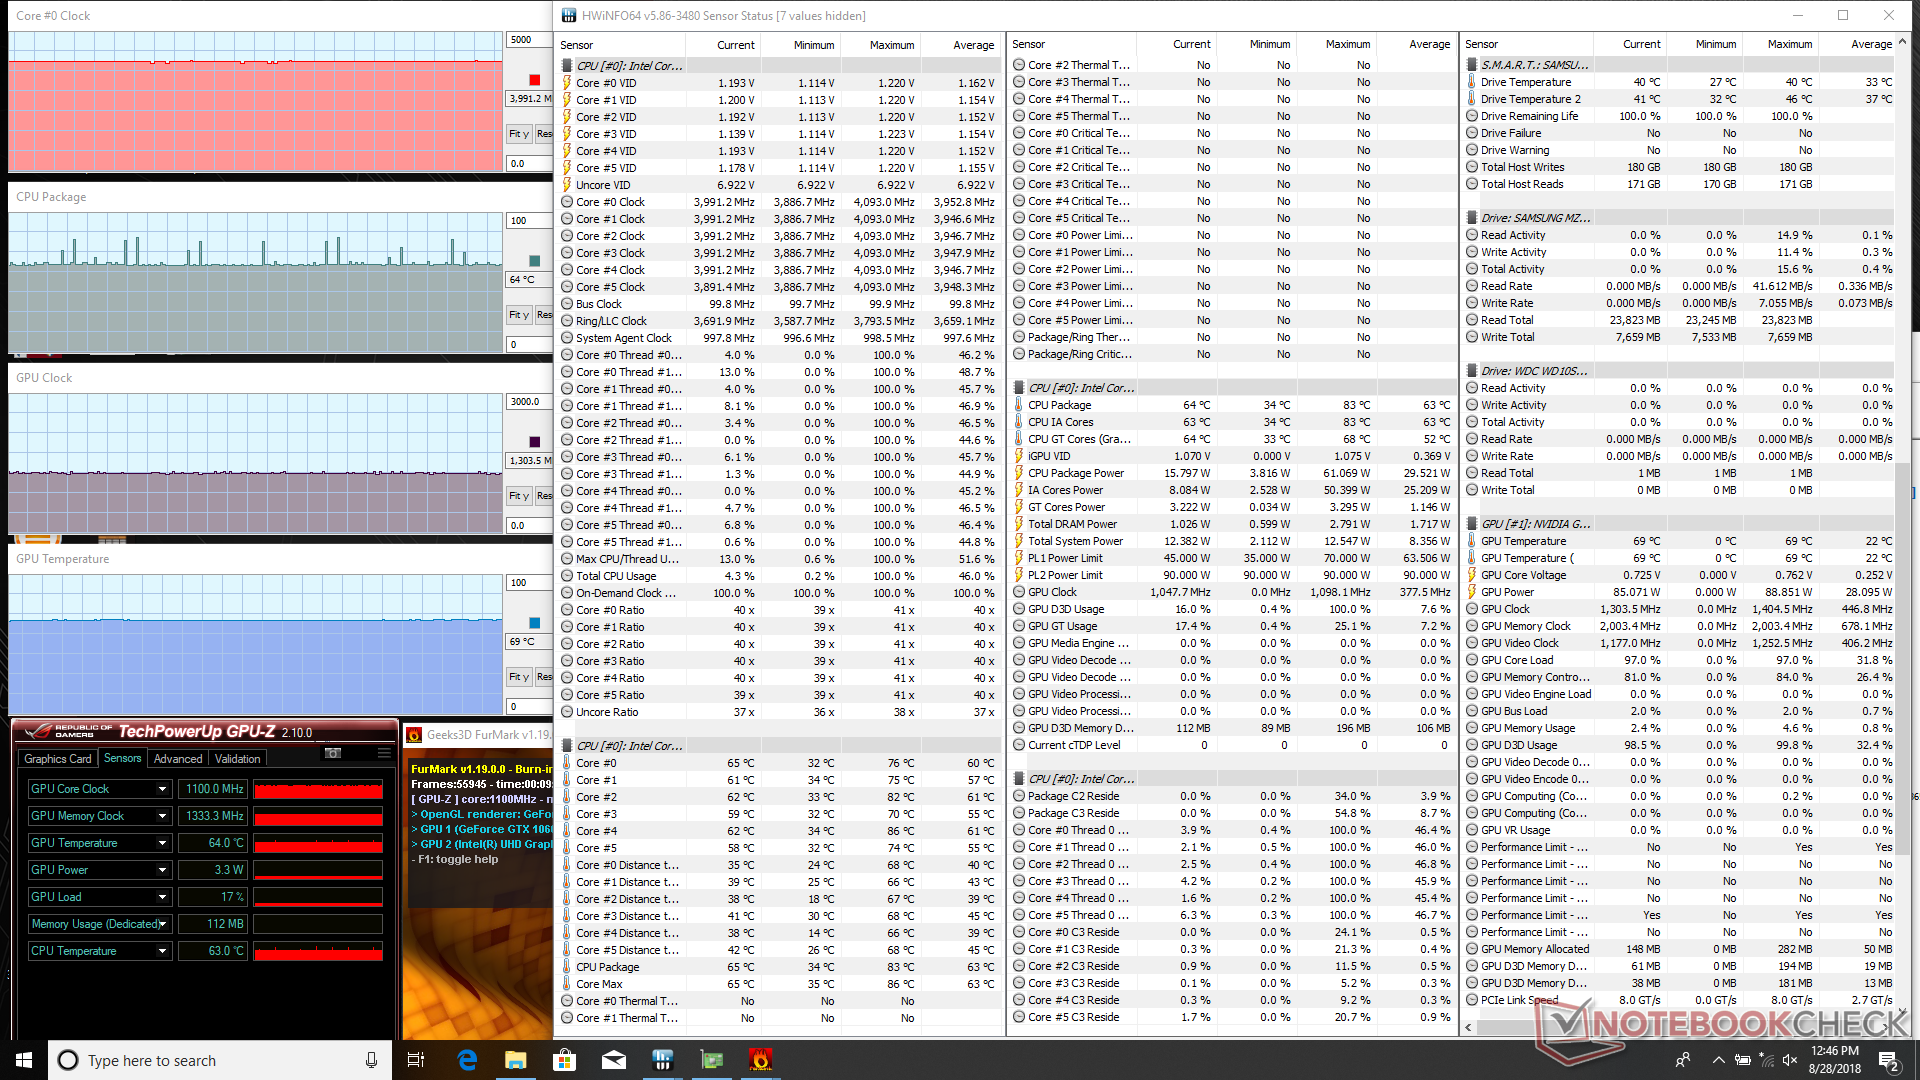
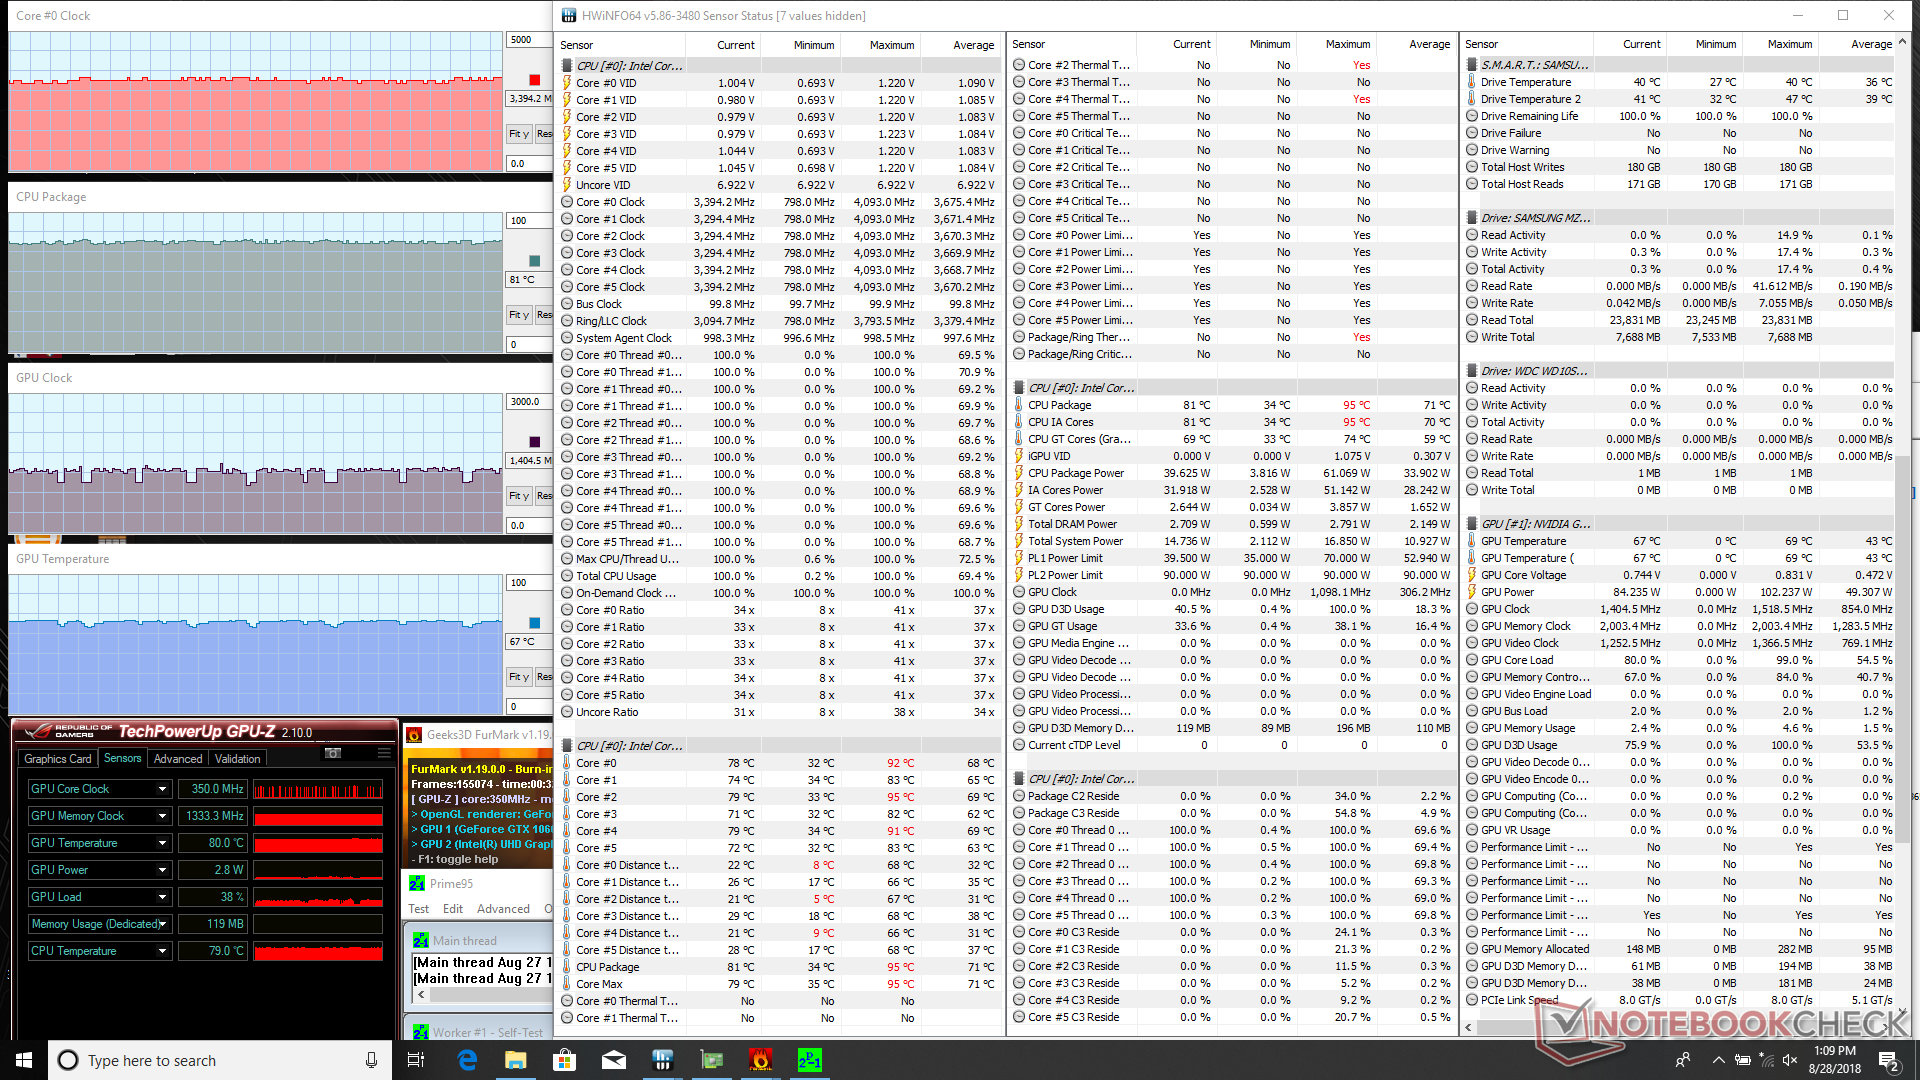
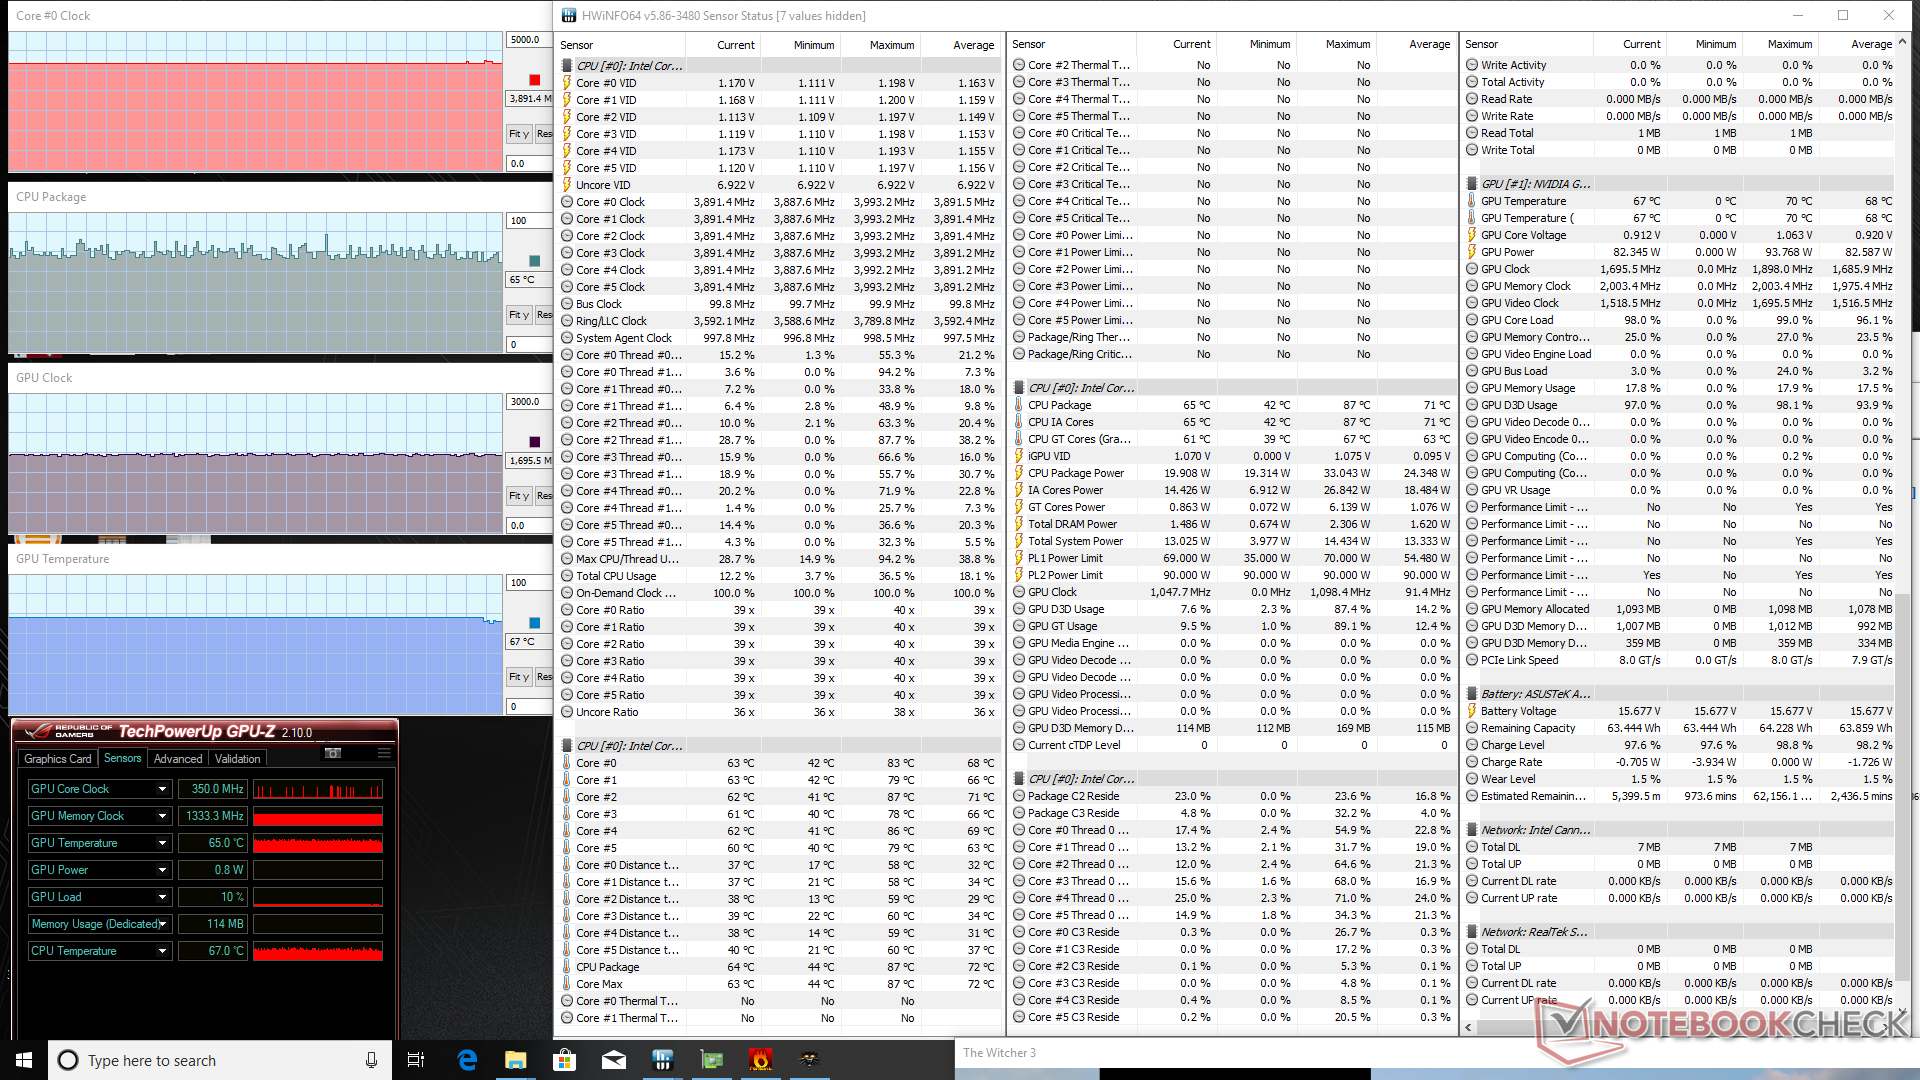
| CPU Clock (GHz) | GPU Clock (MHz) | Average CPU Temperature (°C) | Average GPU Temperature (°C) | |
| Prime95 Stress | 3.9 | -- | 77 | -- |
| FurMark Stress | - | 1304 | -- | 69 |
| Prime95 + FurMark Stress | 3.4 | 1113 - 1392 | 81 | ~66 |
| Witcher 3 Stress | 3.9 | 1696 | 66 | 68 |
Emissions
System Noise
As we suspected, the GL504GM runs much quieter than the GL504GS. Its fans are less likely to pulsate during low loads and it is noticeably quieter when running Witcher 3 as well. The system is still loud when gaming even when compared to other thin laptops like the Blade 15, but at least it is more bearable than on the GL504GS.
Our unit exhibited slight electronic noise or high-pitch humming when idling on desktop. It's essentially unnoticeable during regular use, though we suggest users check for it regardless.
Noise level
| Idle |
| 30 / 30 / 30 dB(A) |
| Load |
| 41.8 / 50 dB(A) |
 | ||
30 dB silent 40 dB(A) audible 50 dB(A) loud |
||
min: | ||
| Asus Strix GL504GM GeForce GTX 1060 Mobile, i7-8750H, Toshiba NVMe THNSN5256GPU7 | Asus GL504GS GeForce GTX 1070 Mobile, i7-8750H, Samsung SSD PM981 MZVLB512HAJQ | MSI GS65 8RF-019DE Stealth Thin GeForce GTX 1070 Max-Q, i7-8750H, Samsung SSD PM981 MZVLB512HAJQ | Razer Blade 15 GTX 1060 GeForce GTX 1060 Max-Q, i7-8750H, Samsung SSD PM981 MZVLB512HAJQ | Asus Zephyrus M GM501 GeForce GTX 1070 Mobile, i7-8750H, Samsung SM961 MZVKW512HMJP m.2 PCI-e | Aorus X5 v8 GeForce GTX 1070 Mobile, i7-8850H, Toshiba NVMe THNSN5512GPU7 | |
|---|---|---|---|---|---|---|
| Noise | -12% | 0% | -0% | -6% | -13% | |
| off / environment * (dB) | 28.5 | 29 -2% | 30 -5% | 28.1 1% | 29 -2% | 30 -5% |
| Idle Minimum * (dB) | 30 | 32 -7% | 30 -0% | 28.1 6% | 30 -0% | 33 -10% |
| Idle Average * (dB) | 30 | 33 -10% | 31 -3% | 33 -10% | 31 -3% | 35 -17% |
| Idle Maximum * (dB) | 30 | 40 -33% | 34 -13% | 33.5 -12% | 33 -10% | 40 -33% |
| Load Average * (dB) | 41.8 | 49 -17% | 43 -3% | 42.2 -1% | 49 -17% | 45 -8% |
| Witcher 3 ultra * (dB) | 47.6 | 51 -7% | 42 12% | 45.3 5% | 50 -5% | 50 -5% |
| Load Maximum * (dB) | 50 | 53 -6% | 44 12% | 45.7 9% | 52 -4% | 55 -10% |
* ... smaller is better
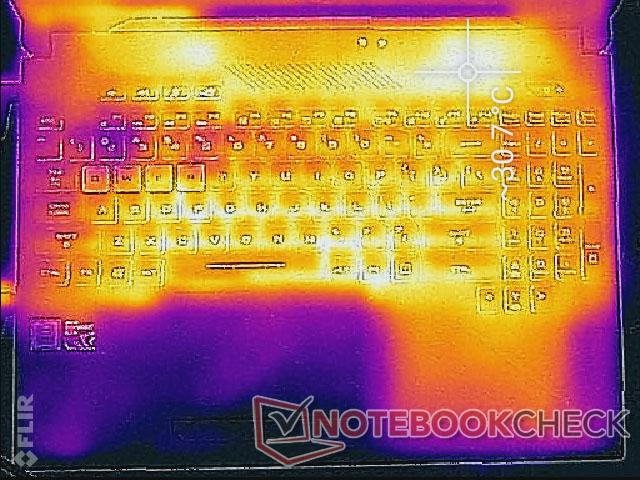
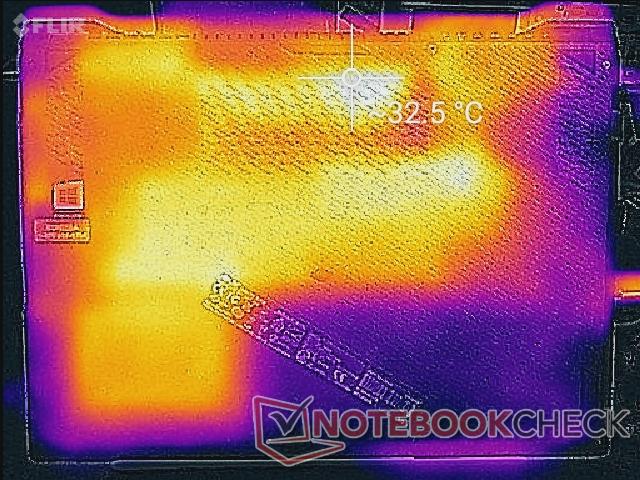
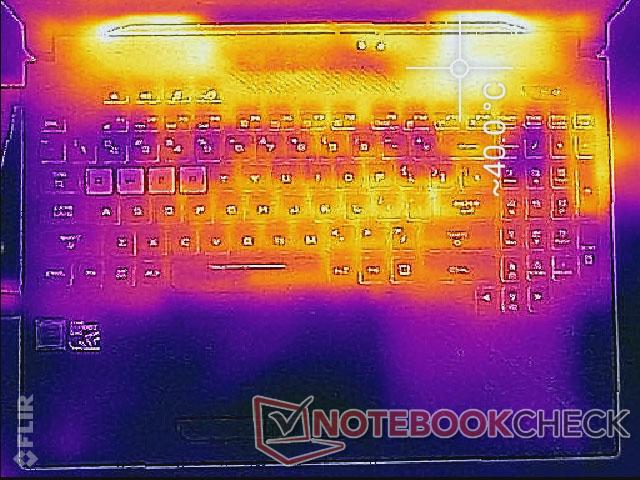
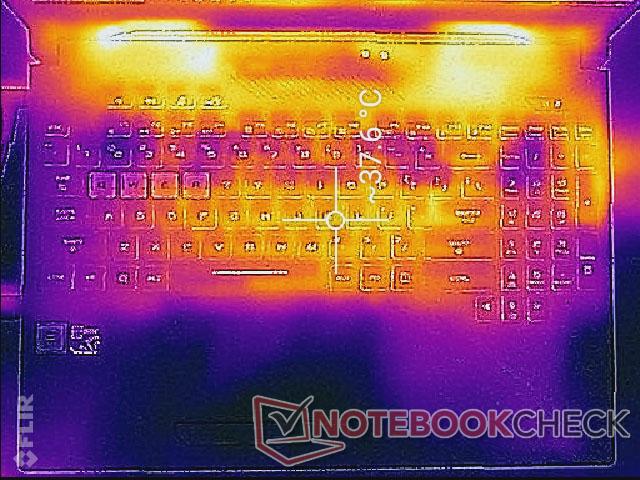
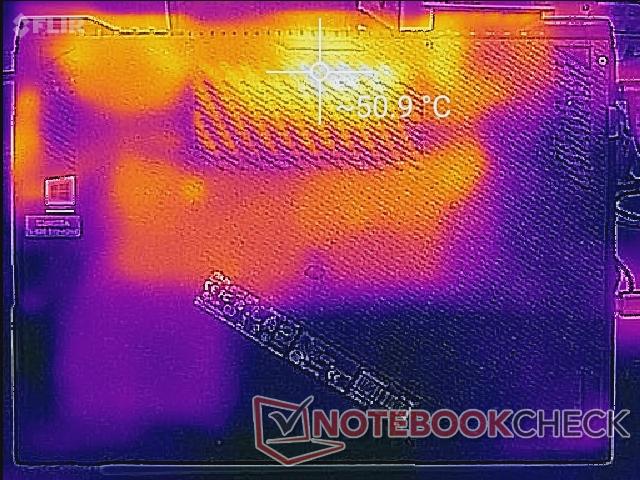
Temperature
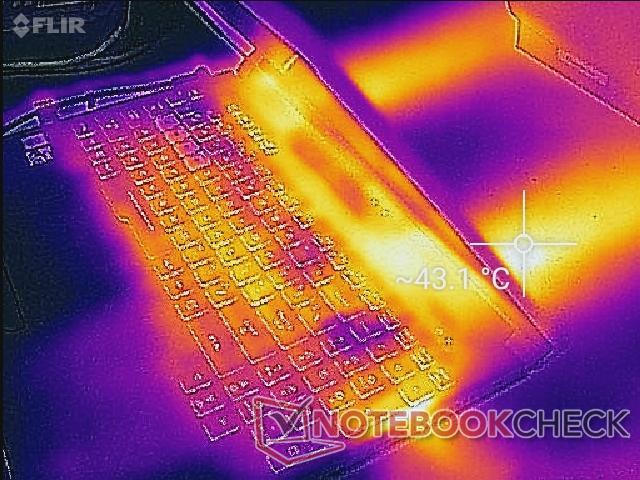
Surface temperatures are much cooler than what we recorded on the more powerful GL504GS. While the hot spot when running demanding loads is still in the low 50 C range, the hot spot itself is much smaller as shown by the temperature maps below. This means that more of the notebook surface is cooler for a more comfortable typing or gaming experience. For example, the WASD keys on the GL504GM are only about 32 C when gaming compared to over 40 C on the GL504GS. The warmest areas are thankfully above the first row of keys away from users' hands.
When idling, surface temperatures are flat on both sides of the notebook as one would expect. Note that the right palm rest will always be a few degrees warmer than the left if a 2.5-inch SSD or HDD is installed.
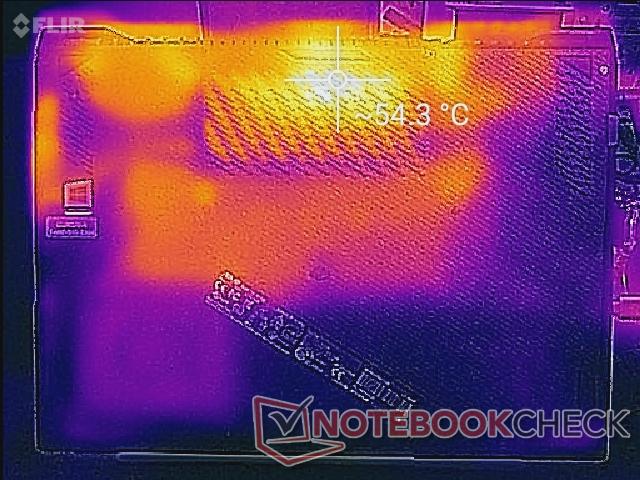
(±) The maximum temperature on the upper side is 41.4 °C / 107 F, compared to the average of 40.4 °C / 105 F, ranging from 21.2 to 68.8 °C for the class Gaming.
(-) The bottom heats up to a maximum of 51.2 °C / 124 F, compared to the average of 43.2 °C / 110 F
(+) In idle usage, the average temperature for the upper side is 29 °C / 84 F, compared to the device average of 33.9 °C / 93 F.
(+) Playing The Witcher 3, the average temperature for the upper side is 31.1 °C / 88 F, compared to the device average of 33.9 °C / 93 F.
(+) The palmrests and touchpad are cooler than skin temperature with a maximum of 29.2 °C / 84.6 F and are therefore cool to the touch.
(±) The average temperature of the palmrest area of similar devices was 28.8 °C / 83.8 F (-0.4 °C / -0.8 F).
Speakers
Sound quality is great for the size with better-than-expected bass. The chassis will reverberate from the bass rather noticeably, however, even when set to just 50 percent volume. Luckily, there is no audible rattling.


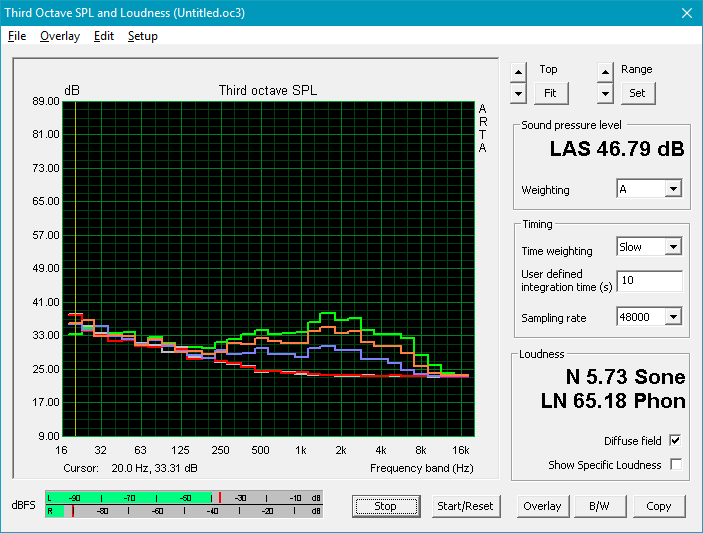
Asus Strix GL504GM audio analysis
(-) | not very loud speakers (65.4 dB)
Bass 100 - 315 Hz
(+) | good bass - only 4.3% away from median
(±) | linearity of bass is average (8.9% delta to prev. frequency)
Mids 400 - 2000 Hz
(+) | balanced mids - only 2.6% away from median
(+) | mids are linear (5.1% delta to prev. frequency)
Highs 2 - 16 kHz
(±) | reduced highs - on average 5.5% lower than median
(+) | highs are linear (5.1% delta to prev. frequency)
Overall 100 - 16.000 Hz
(±) | linearity of overall sound is average (17.5% difference to median)
Compared to same class
» 49% of all tested devices in this class were better, 12% similar, 40% worse
» The best had a delta of 6%, average was 18%, worst was 132%
Compared to all devices tested
» 34% of all tested devices were better, 8% similar, 58% worse
» The best had a delta of 4%, average was 24%, worst was 134%
Apple MacBook 12 (Early 2016) 1.1 GHz audio analysis
(+) | speakers can play relatively loud (83.6 dB)
Bass 100 - 315 Hz
(±) | reduced bass - on average 11.3% lower than median
(±) | linearity of bass is average (14.2% delta to prev. frequency)
Mids 400 - 2000 Hz
(+) | balanced mids - only 2.4% away from median
(+) | mids are linear (5.5% delta to prev. frequency)
Highs 2 - 16 kHz
(+) | balanced highs - only 2% away from median
(+) | highs are linear (4.5% delta to prev. frequency)
Overall 100 - 16.000 Hz
(+) | overall sound is linear (10.2% difference to median)
Compared to same class
» 7% of all tested devices in this class were better, 2% similar, 91% worse
» The best had a delta of 5%, average was 18%, worst was 53%
Compared to all devices tested
» 5% of all tested devices were better, 1% similar, 94% worse
» The best had a delta of 4%, average was 24%, worst was 134%
Energy Management
Power Consumption
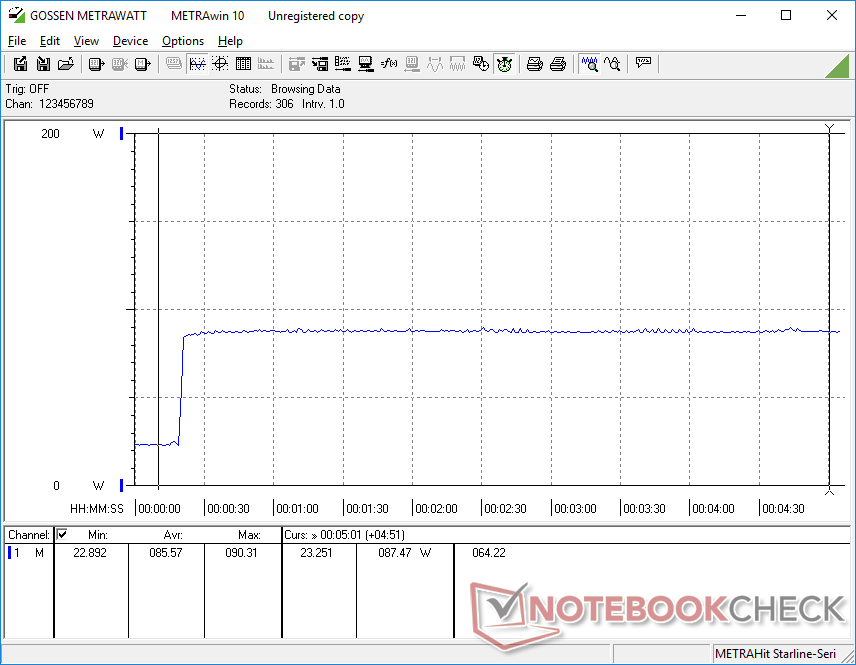
Power consumption when idling is significantly less than on the GL504GS SKU possibly due to Optimus being exclusive to the GL504GM. Medium load (as represented by 3DMark 06) is otherwise very similar to other gaming laptops with GTX 1060 or GTX 1070 graphics at around 112 W.
The power gap between the GL504GM and GL504GS widens further when running higher loads like gaming. Witcher 3, for example, draws 136 W compared to 170 W on the GL504GS. Maximum load draws an average of 157 W over a 90 second period from a medium-sized (~16 x 7.5 x 2.6 cm) 180 W AC adapter. The GL504GS carries a more capable 230 W AC adapter in order to accommodate its more demanding GPU. Overall consumption is very similar to the 15-inch Asus GU501GM since the system carries the same i7-8750H CPU and GTX 1060 GPU.
| Off / Standby | |
| Idle | |
| Load |
|
Key:
min: | |
| Asus Strix GL504GM i7-8750H, GeForce GTX 1060 Mobile, Toshiba NVMe THNSN5256GPU7, IPS, 1920x1080, 15.6" | Asus GL504GS i7-8750H, GeForce GTX 1070 Mobile, Samsung SSD PM981 MZVLB512HAJQ, IPS, 1920x1080, 15.6" | MSI GS65 8RF-019DE Stealth Thin i7-8750H, GeForce GTX 1070 Max-Q, Samsung SSD PM981 MZVLB512HAJQ, IPS, 1920x1080, 15.6" | Razer Blade 15 GTX 1060 i7-8750H, GeForce GTX 1060 Max-Q, Samsung SSD PM981 MZVLB512HAJQ, IPS, 1920x1080, 15.6" | Asus Zephyrus M GM501 i7-8750H, GeForce GTX 1070 Mobile, Samsung SM961 MZVKW512HMJP m.2 PCI-e, IPS, 1920x1080, 15.6" | Asus ROG GU501GM-BI7N8 i7-8750H, GeForce GTX 1060 Mobile, Kingston RBUSNS8154P3128GJ, IPS, 1920x1080, 15.6" | |
|---|---|---|---|---|---|---|
| Power Consumption | -69% | 12% | -2% | -25% | -6% | |
| Idle Minimum * (Watt) | 10 | 29 -190% | 7 30% | 14.9 -49% | 16 -60% | 12.35 -23% |
| Idle Average * (Watt) | 16.9 | 32 -89% | 11 35% | 17.5 -4% | 19 -12% | 19.98 -18% |
| Idle Maximum * (Watt) | 21.1 | 38 -80% | 20 5% | 19.2 9% | 26 -23% | 25.44 -21% |
| Load Average * (Watt) | 112.4 | 100 11% | 98 13% | 103.2 8% | 103 8% | 94.28 16% |
| Witcher 3 ultra * (Watt) | 135.5 | 170 -25% | 132 3% | 123.1 9% | 164 -21% | 132.9 2% |
| Load Maximum * (Watt) | 157.3 | 217 -38% | 182 -16% | 132.7 16% | 223 -42% | 140.63 11% |
* ... smaller is better
Battery Life
We were expecting battery life on the GL504GM to be longer than on the GL504GS since the latter includes no Optimus, but we weren't expecting this huge of a lead. The lesser-equipped GL504GM can run for over twice as long as its more powerful sibling when both are subjected to similar WLAN loads. Users can expect almost 6 hours of real-world browsing whereas the GL504GS can barely make it past 2.5 hours.
Charging from near empty to full capacity takes about 2 hours.
| Asus Strix GL504GM i7-8750H, GeForce GTX 1060 Mobile, 66 Wh | Asus GL504GS i7-8750H, GeForce GTX 1070 Mobile, 66 Wh | MSI GS65 8RF-019DE Stealth Thin i7-8750H, GeForce GTX 1070 Max-Q, 82 Wh | Razer Blade 15 GTX 1060 i7-8750H, GeForce GTX 1060 Max-Q, 80 Wh | Asus Zephyrus M GM501 i7-8750H, GeForce GTX 1070 Mobile, 55 Wh | Aorus X5 v8 i7-8850H, GeForce GTX 1070 Mobile, 92.24 Wh | |
|---|---|---|---|---|---|---|
| Battery runtime | -59% | 2% | 14% | -54% | ||
| WiFi v1.3 (h) | 5.9 | 2.4 -59% | 6 2% | 6.7 14% | 2.7 -54% | |
| Reader / Idle (h) | 2.9 | 8.5 | 4 | 4.9 | ||
| Load (h) | 1.2 | 1.4 | 1.2 | 1.5 |
Pros
Cons
Verdict

Similar to how the Razer Blade 15 GTX 1060 runs cooler, longer, and quieter than the Blade 15 GTX 1070, the GL504GM also runs cooler, longer, and quieter than the GL504GS. There are thus several reasons why would one would prefer the less expensive GL504GM over the GL504GS other than cost as the GL504GS could have benefited from a stronger cooling solution. After all, there is a reason why other 15-inch laptops with the same GTX 1070 GPU option, such as the MSI GT63, can have twice as many heat pipes.
The best part of the GL504 series is still the 144 Hz matte screen. The narrower bezels and vastly improved display refresh rate and response times make the last generation GL503 models look very dated in comparison. To make the most of the high refresh rate, however, the GL504GS is still the best option as the GTX 1070 is needed for pushing those extra frames on most titles. It's an upgrade worth considering based on the display and design alone especially for those still gaming on Maxwell GPUs.
The lack of G-Sync is a bummer, but the GL504GM makes up for it with Optimus for longer battery life and quieter fans than on the GL504GS. It's one of the stronger narrow-bezel 15-inch chassis designs currently available and certainly more rigid than what the MSI GS65 has to offer.
Asus Strix GL504GM
- 08/31/2018 v6 (old)
Allen Ngo
Price comparison
