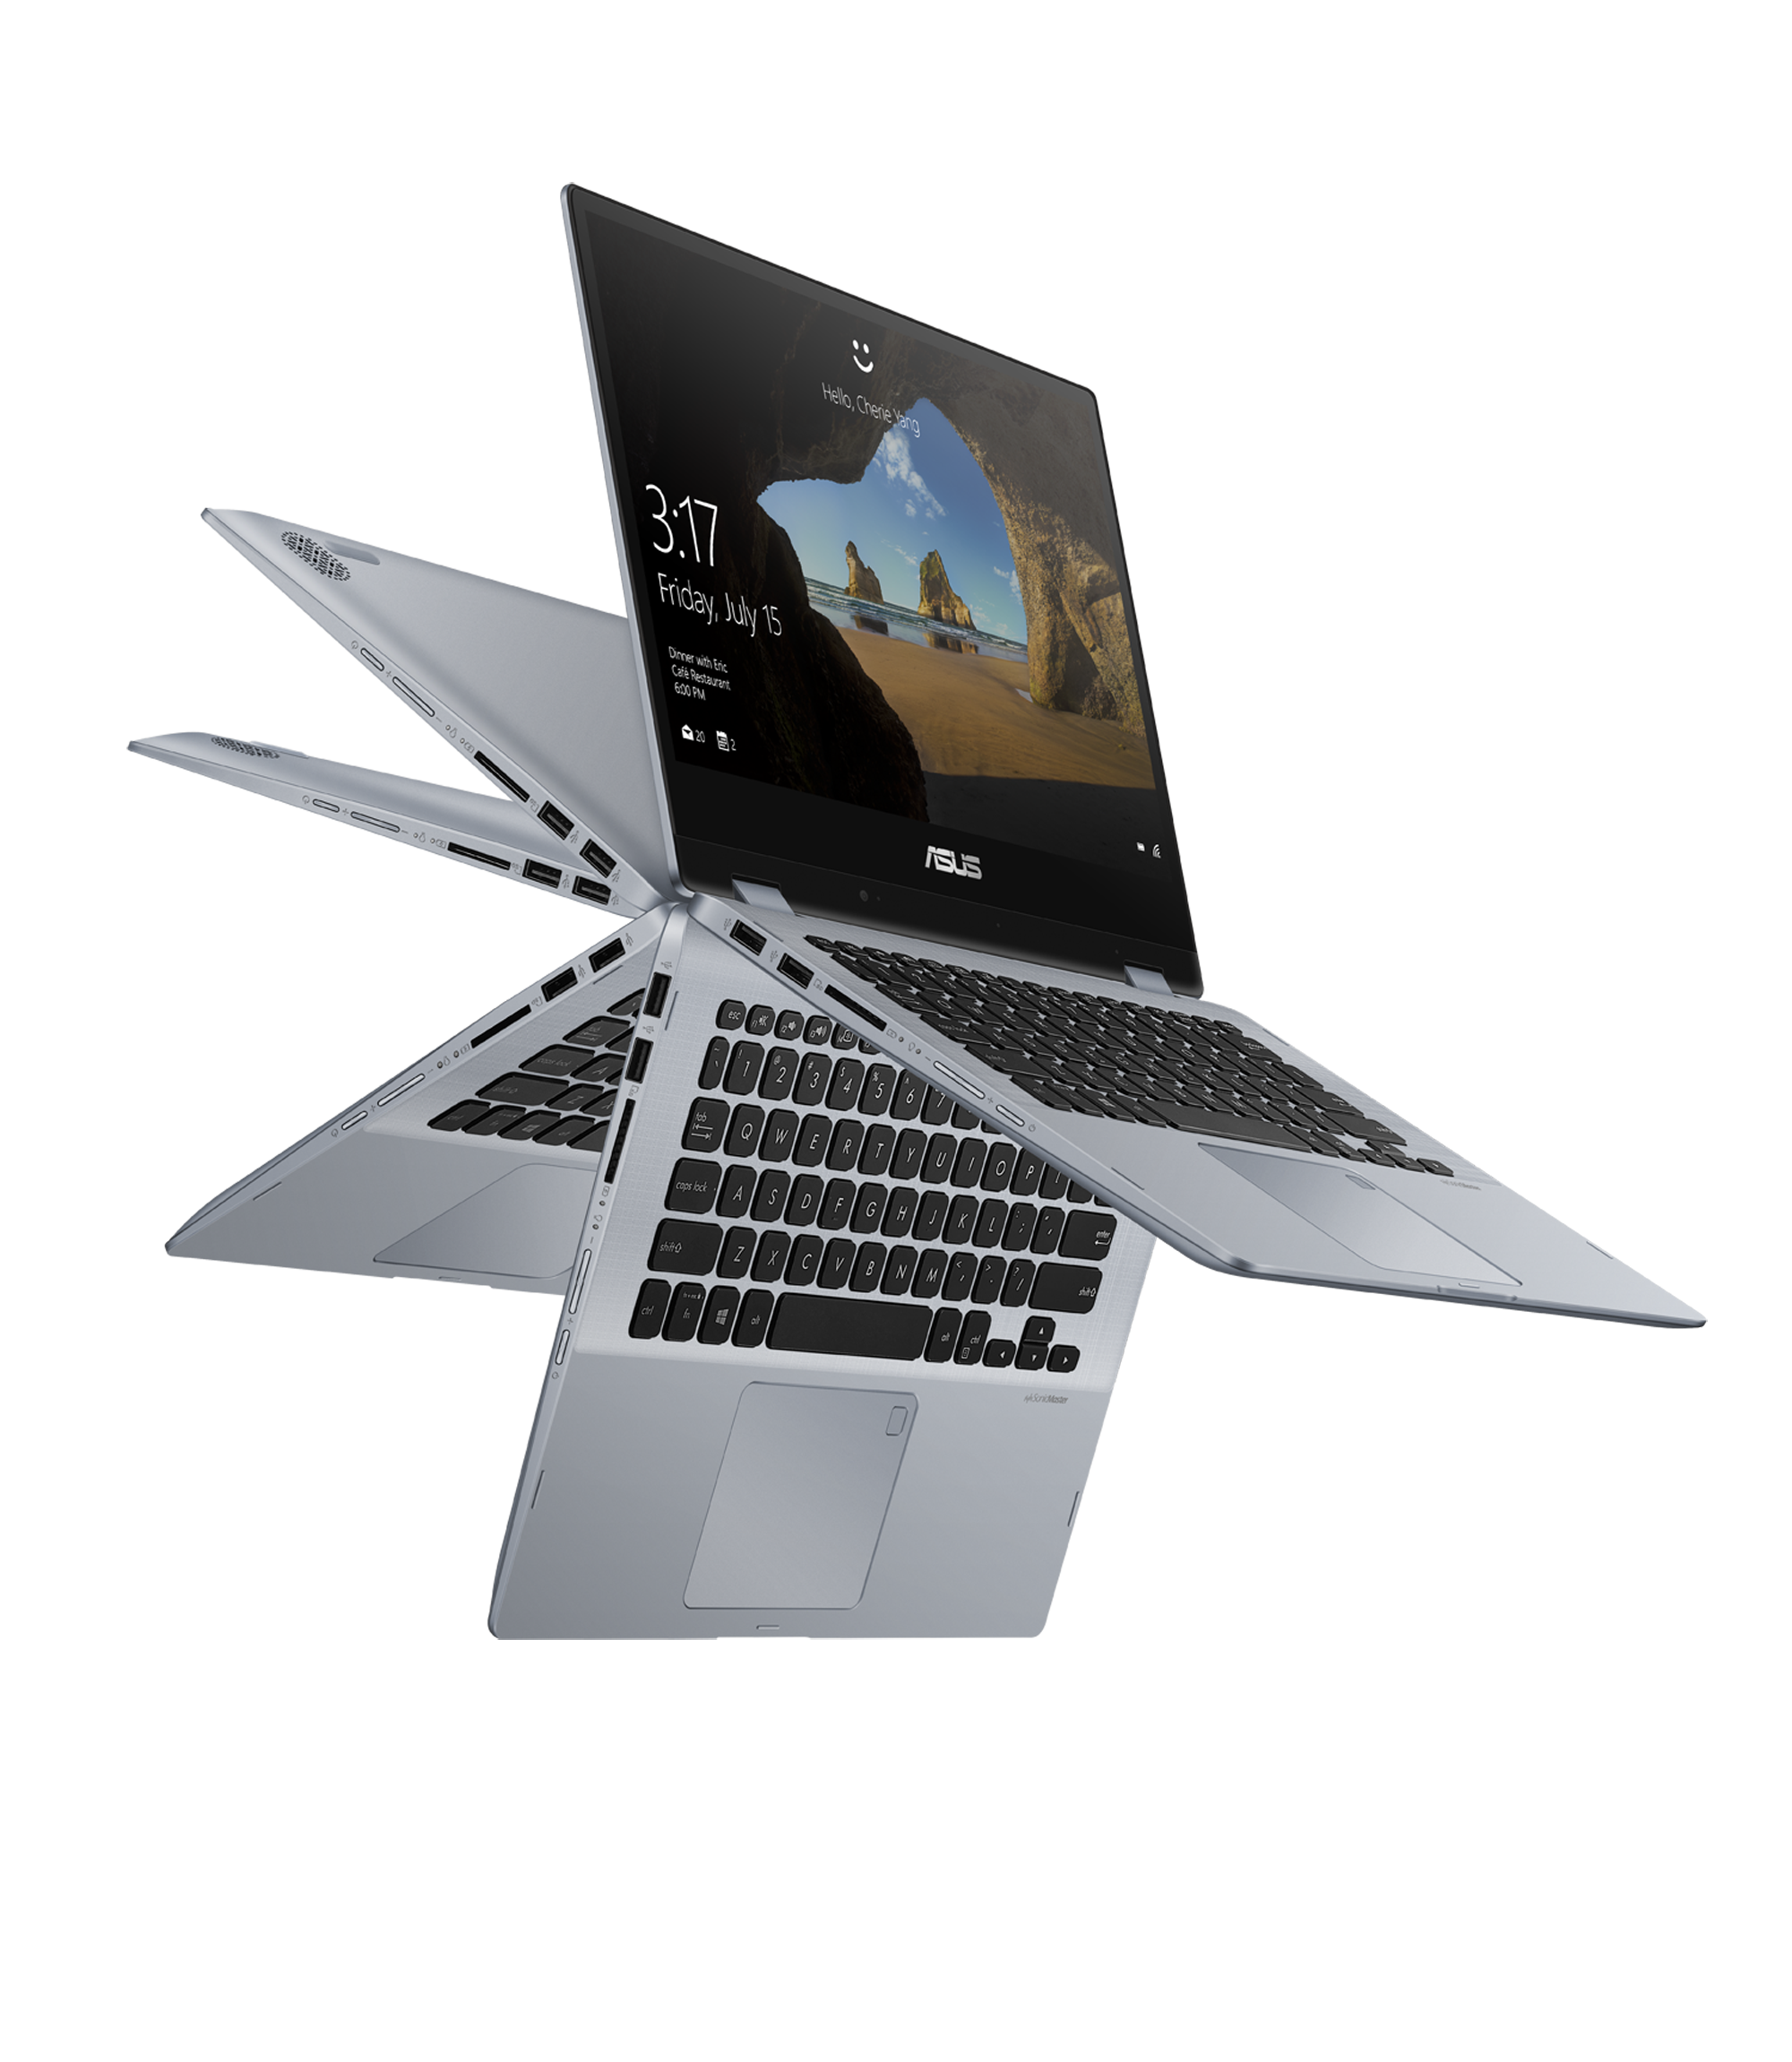
Asus VivoBook Flip 14 TP412UA (i5-8250U) Convertible Review
The Asus VivoBook Flip 14 TP412 directly succeeds last year's VivoBook Flip 14 TP410 with a fair number of changes in tow. Announced in June, the convertible only began shipping earlier this month for a starting price of under $700 USD for the base Core i3 configuration.
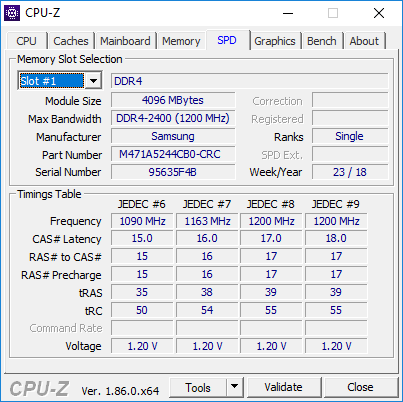
Our test unit today is the mid-range Core i5 SKU with 8 GB of RAM and 256 GB of storage for $750 USD. The highest-end option includes a Core i7-8550U with double the RAM and up to 1 TB of storage. The 1080p touchscreen and integrated graphics are otherwise identical across the entire lineup.
The mainstream VivoBook series sits just below the flagship ZenBook series to appeal to users on a tight budget. Thus, it directly competes with other sub 15-inch mainstream convertibles like the Lenovo Yoga 530, Acer Spin 3 SP314, Samsung Notebook 7 Spin, Dell XPS 13 9365, or Dell Inspiron 13 5000 2-in-1. Pricier flagship convertibles are also available in this size category such as the ZenBook Flip 14, Lenovo Yoga 920, and HP Spectre x360 13.
We recommend checking out our review on the last generation VivoBook Flip 14 TP410 as it still shares many similarities with this latest iteration.
Case
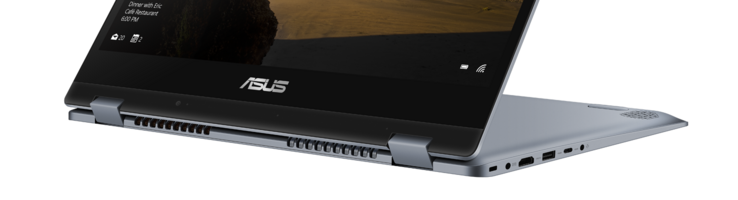
Asus has managed to cut the thickness down from 19 mm on last year's TP410 model to 17.6 mm on this year's TP412 model. The newer design is just a hair lighter and smaller as a result without sacrificing any of the connectivity features of the previous model.
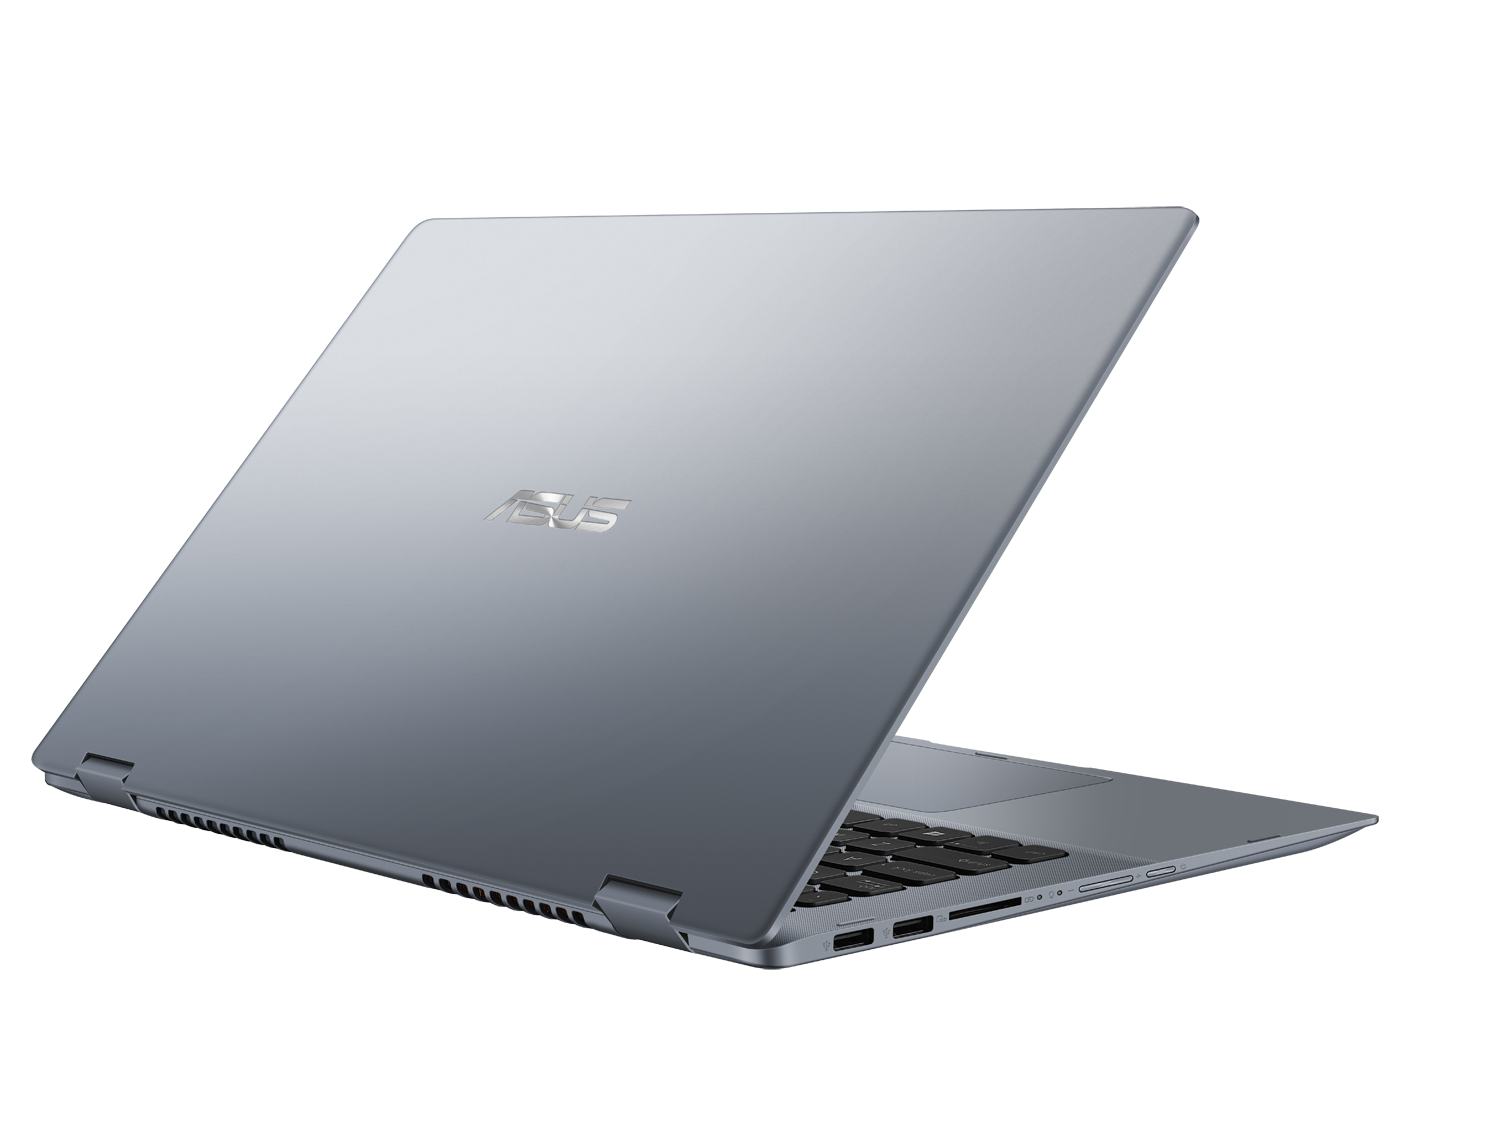
The matte chassis leaves a good first impression with no unintended gaps or uneven crevices. The aluminum outer lid is smooth and more rigid than even the lid of the Yoga 920. Meanwhile, the plastic base is slightly textured with a comparatively cheaper feel. Slight but visible flexing is possible when attempting to twist the front edges or warp the center of the keyboard deck. The flexing is not enough to be a concern during regular use, but it cements the TP412 as a mainstream offering instead of a flagship Zenbook.
The hinges are the weakest aspect of the chassis as they could have been more taut to reduce teetering of the lid. Overall, system rigidity is a step below the Spectre x360 13.

Connectivity
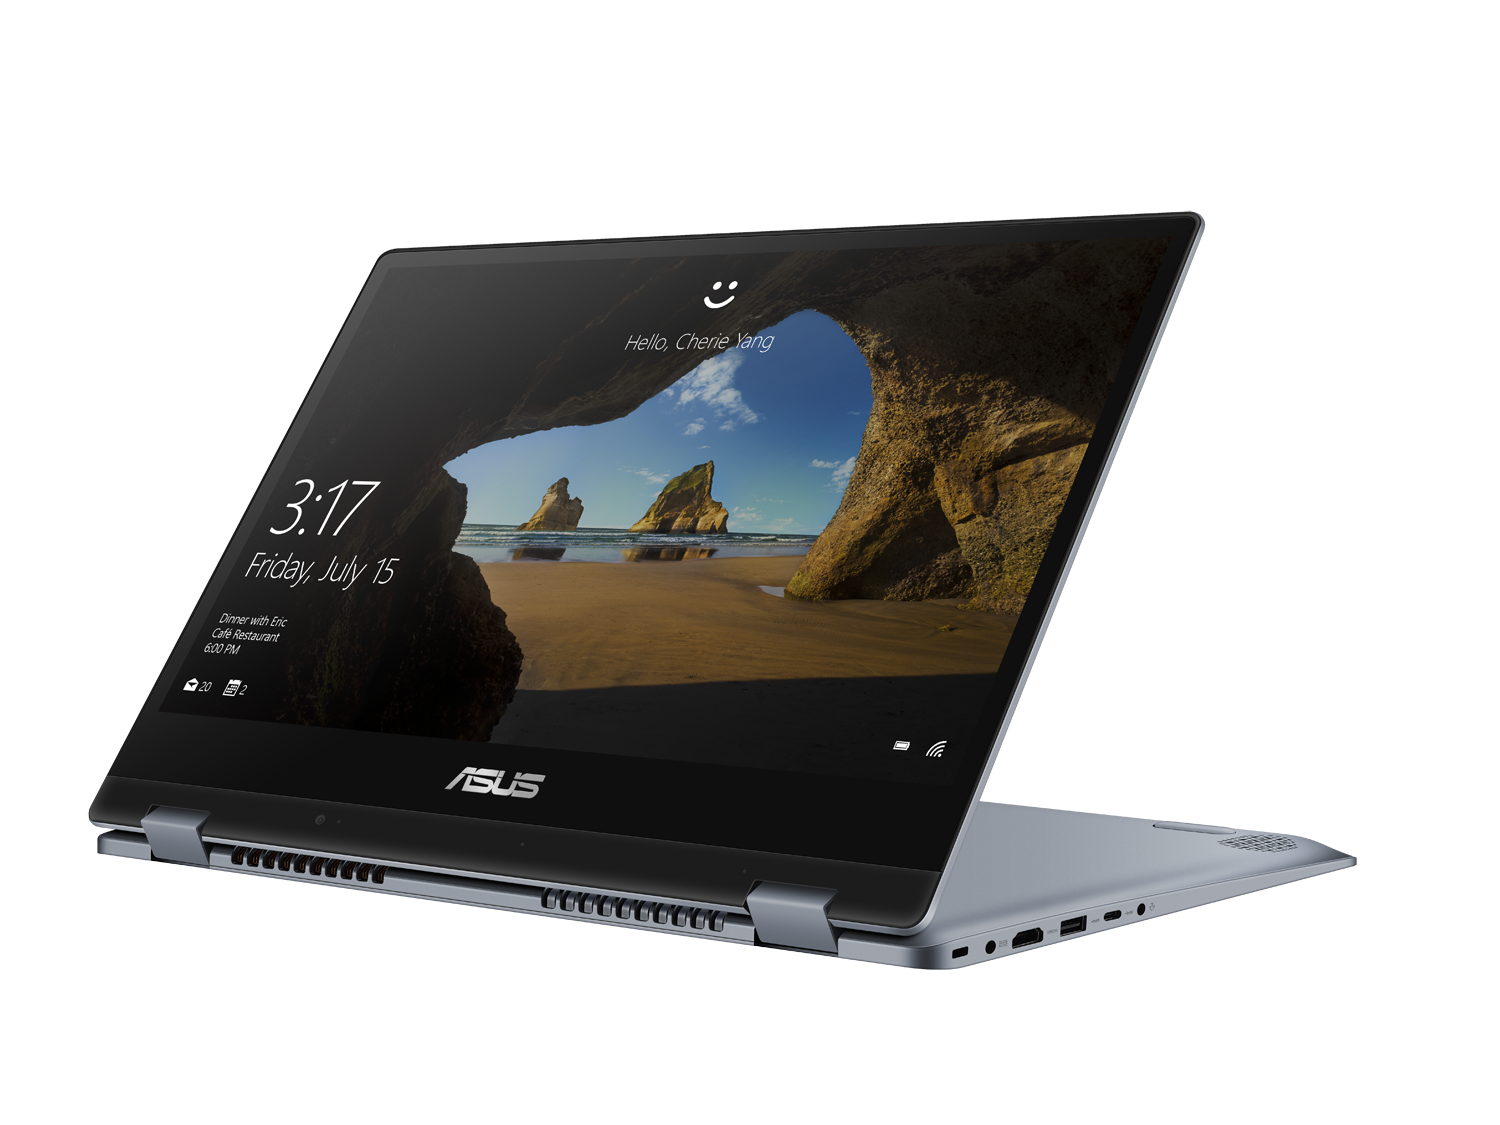
The ports are essentially identical to last year's TP410. The Kensington Lock has been moved from the left edge to the right edge, but nothing else has changed. We're hoping that Asus will drop the proprietary AC adapter port altogether for USB Type-C charging similar to the ZenBook 3 UX390.
SD Card Reader
The integrated SD card reader is slow with a transfer rate of only 28 MB/s with our UHS-II test card. Moving 1 GB worth of images from our card to desktop takes over 40 seconds compared to 6 or 7 seconds on the Spectre x360 15.
A fully inserted SD card still protrudes by over half its length. Be sure to remove the card first for safer transporting.
| SD Card Reader | |
| average JPG Copy Test (av. of 3 runs) | |
| HP Spectre x360 15-ch000 (Toshiba Exceria Pro SDXC 64 GB UHS-II) | |
| Dell XPS 15 9570 i7 UHD (Toshiba Exceria Pro SDXC 64 GB UHS-II) | |
| Asus VivoBook Flip 14 TP412UA-DB51T (Toshiba Exceria Pro SDXC 64 GB UHS-II) | |
| Asus VivoBook Flip 14 TP410UA-EC242T (Toshiba Exceria Pro SDXC 64 GB UHS-II) | |
| maximum AS SSD Seq Read Test (1GB) | |
| HP Spectre x360 15-ch000 (Toshiba Exceria Pro SDXC 64 GB UHS-II) | |
| Dell XPS 15 9570 i7 UHD (Toshiba Exceria Pro SDXC 64 GB UHS-II) | |
| Asus VivoBook Flip 14 TP412UA-DB51T (Toshiba Exceria Pro SDXC 64 GB UHS-II) | |
| Asus VivoBook Flip 14 TP410UA-EC242T (Toshiba Exceria Pro SDXC 64 GB UHS-II) | |
Communication
The Intel 8265 module has not changed for theoretical transfer rates of up to 867 Mbps. While we experienced no issues when browsing the net, we noticed that connectivity was not always steady. An iPerf test revealed that transfer rates would sometimes fluctuate to under 100 Mbps once or twice every minute. We're unsure if this is widespread or something specific to our test unit.
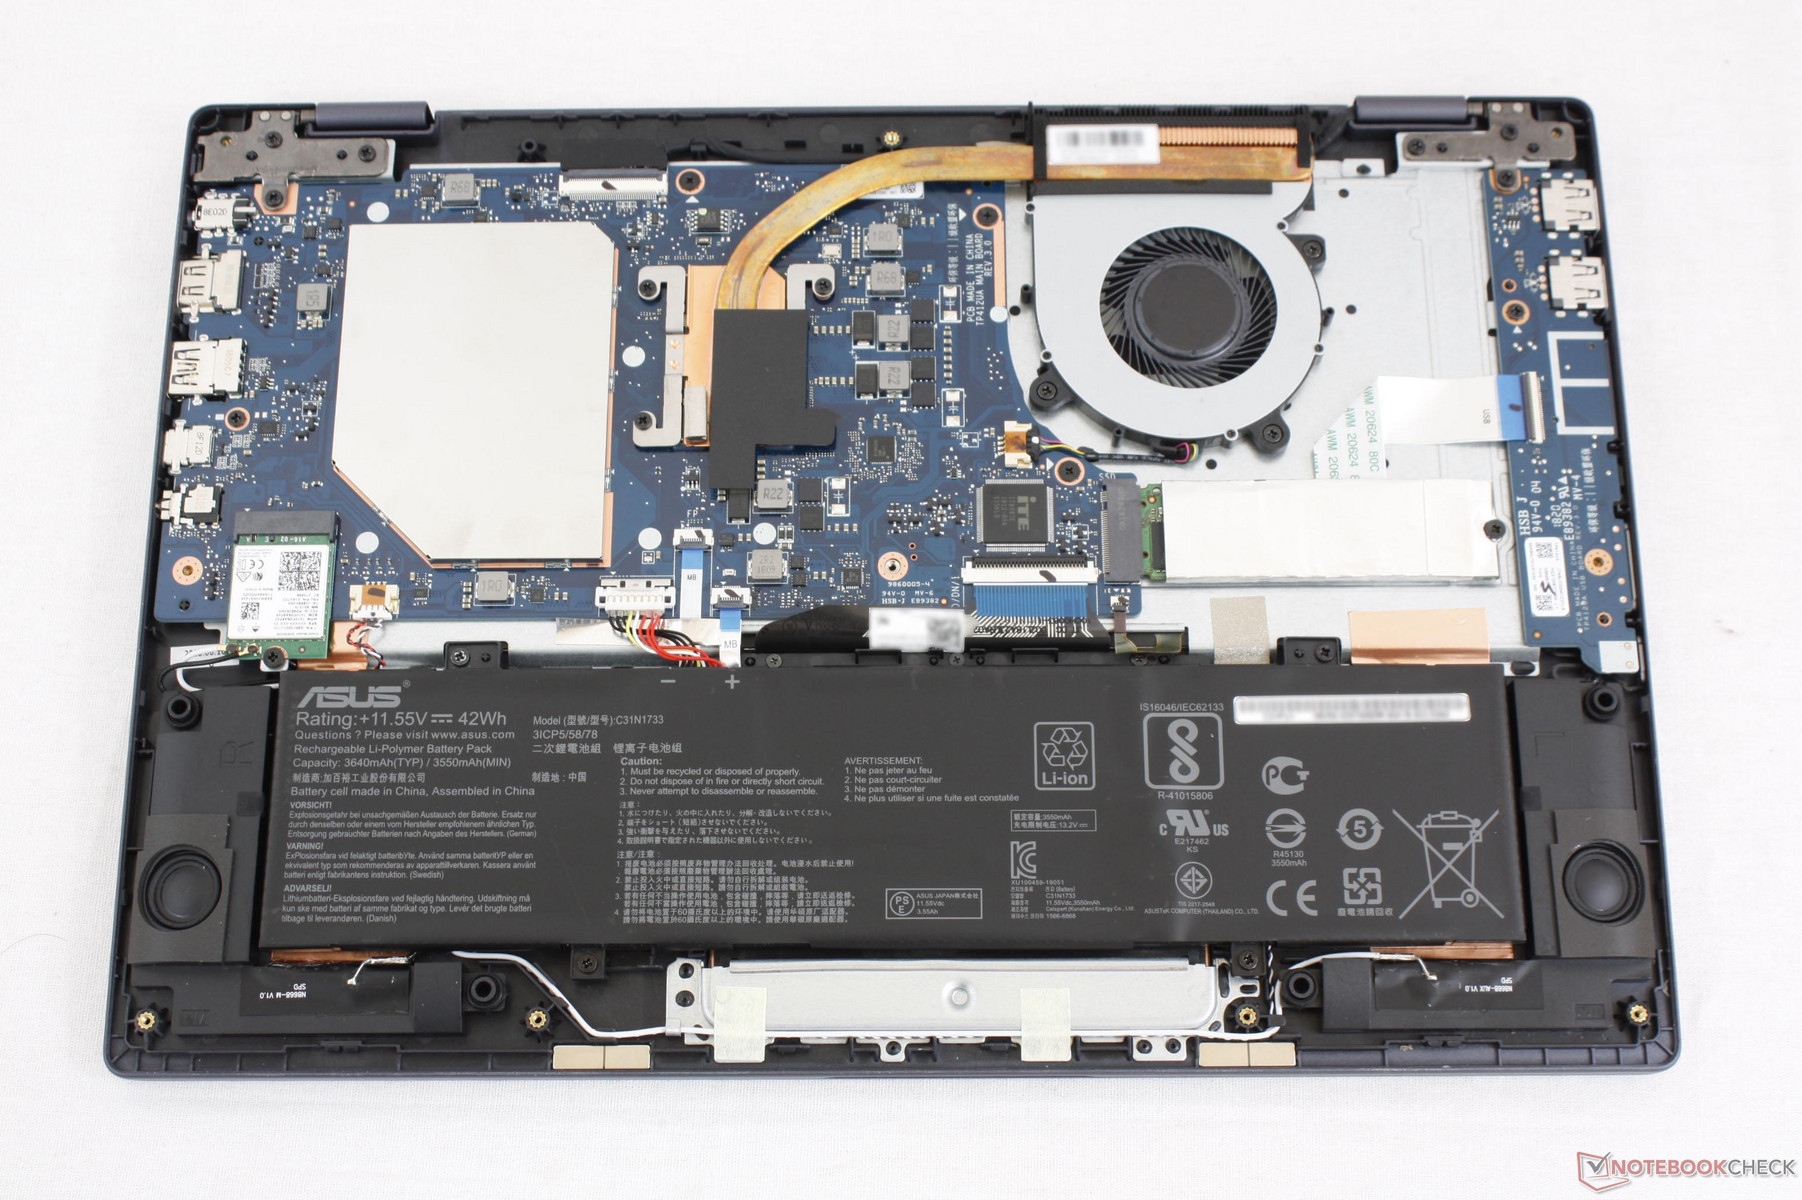
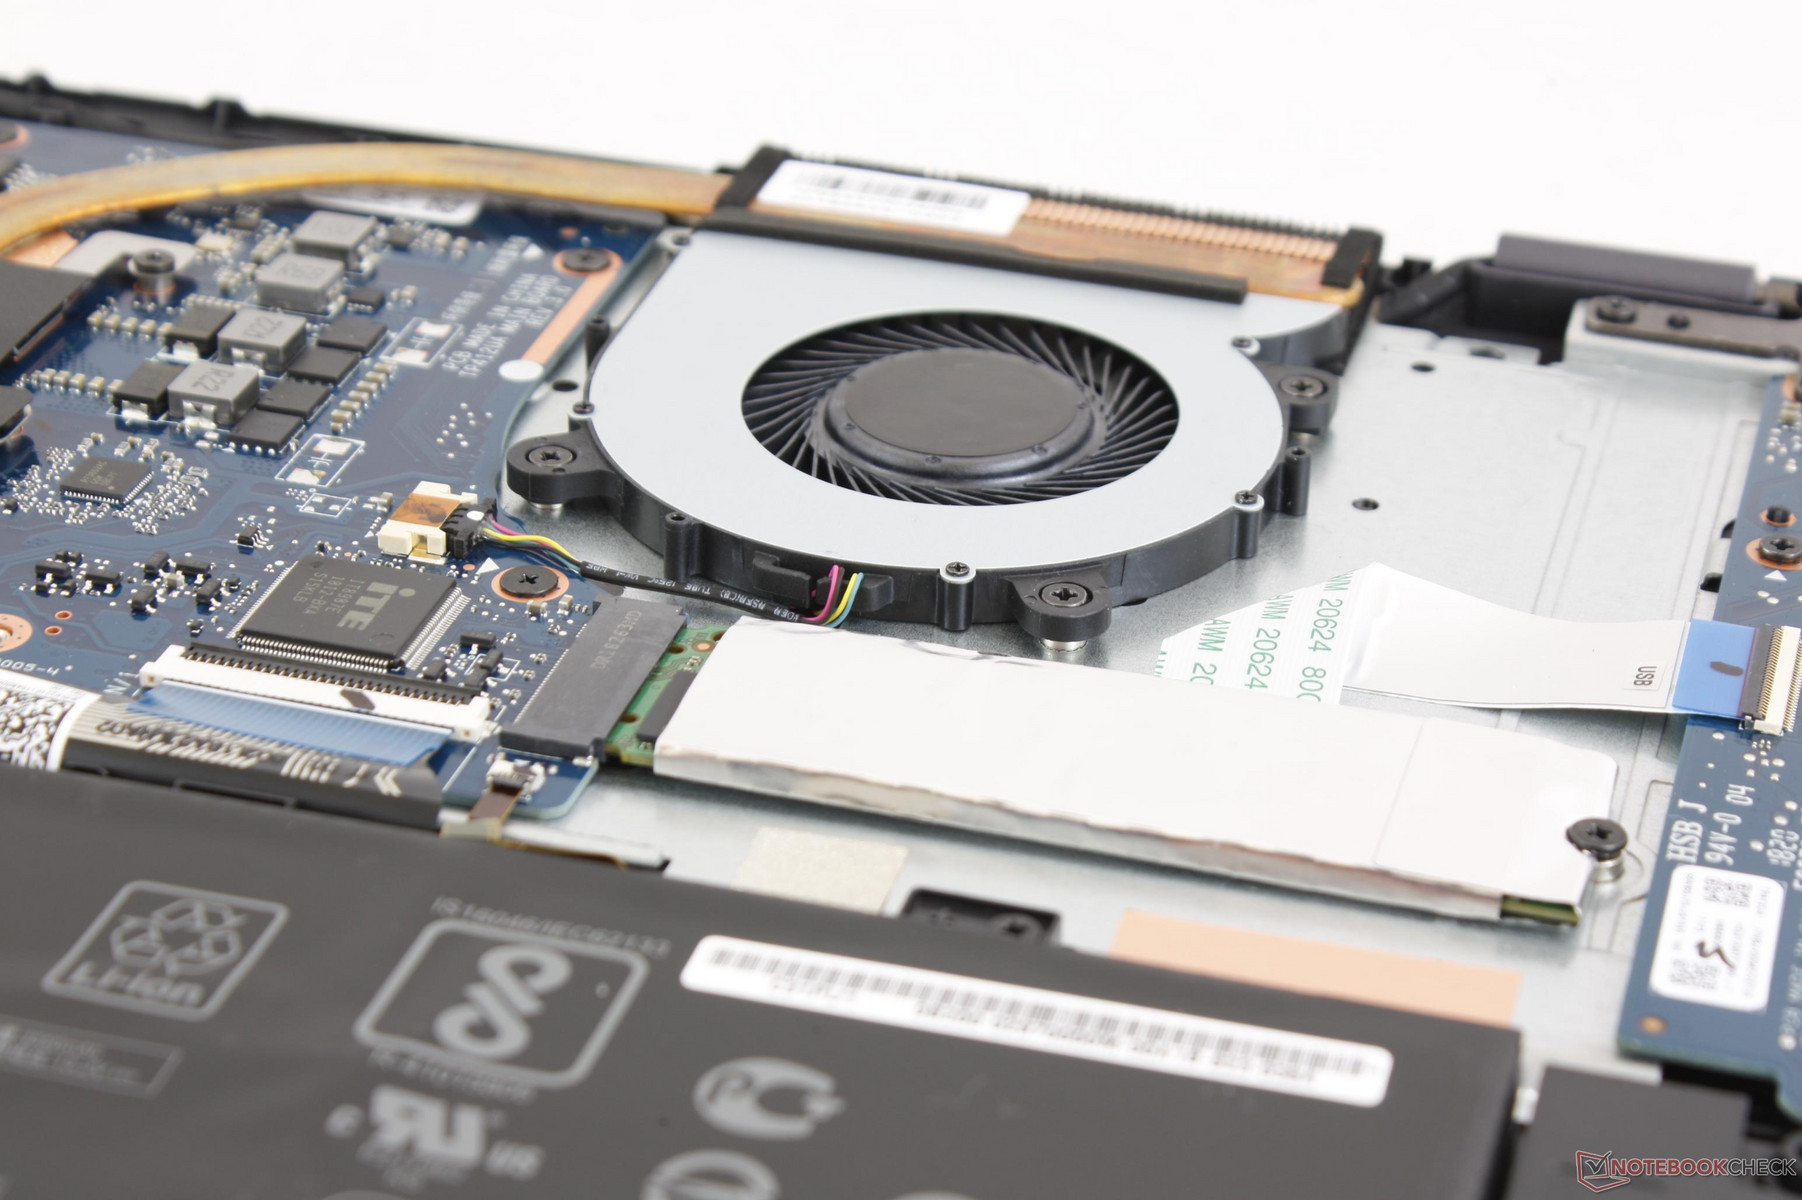
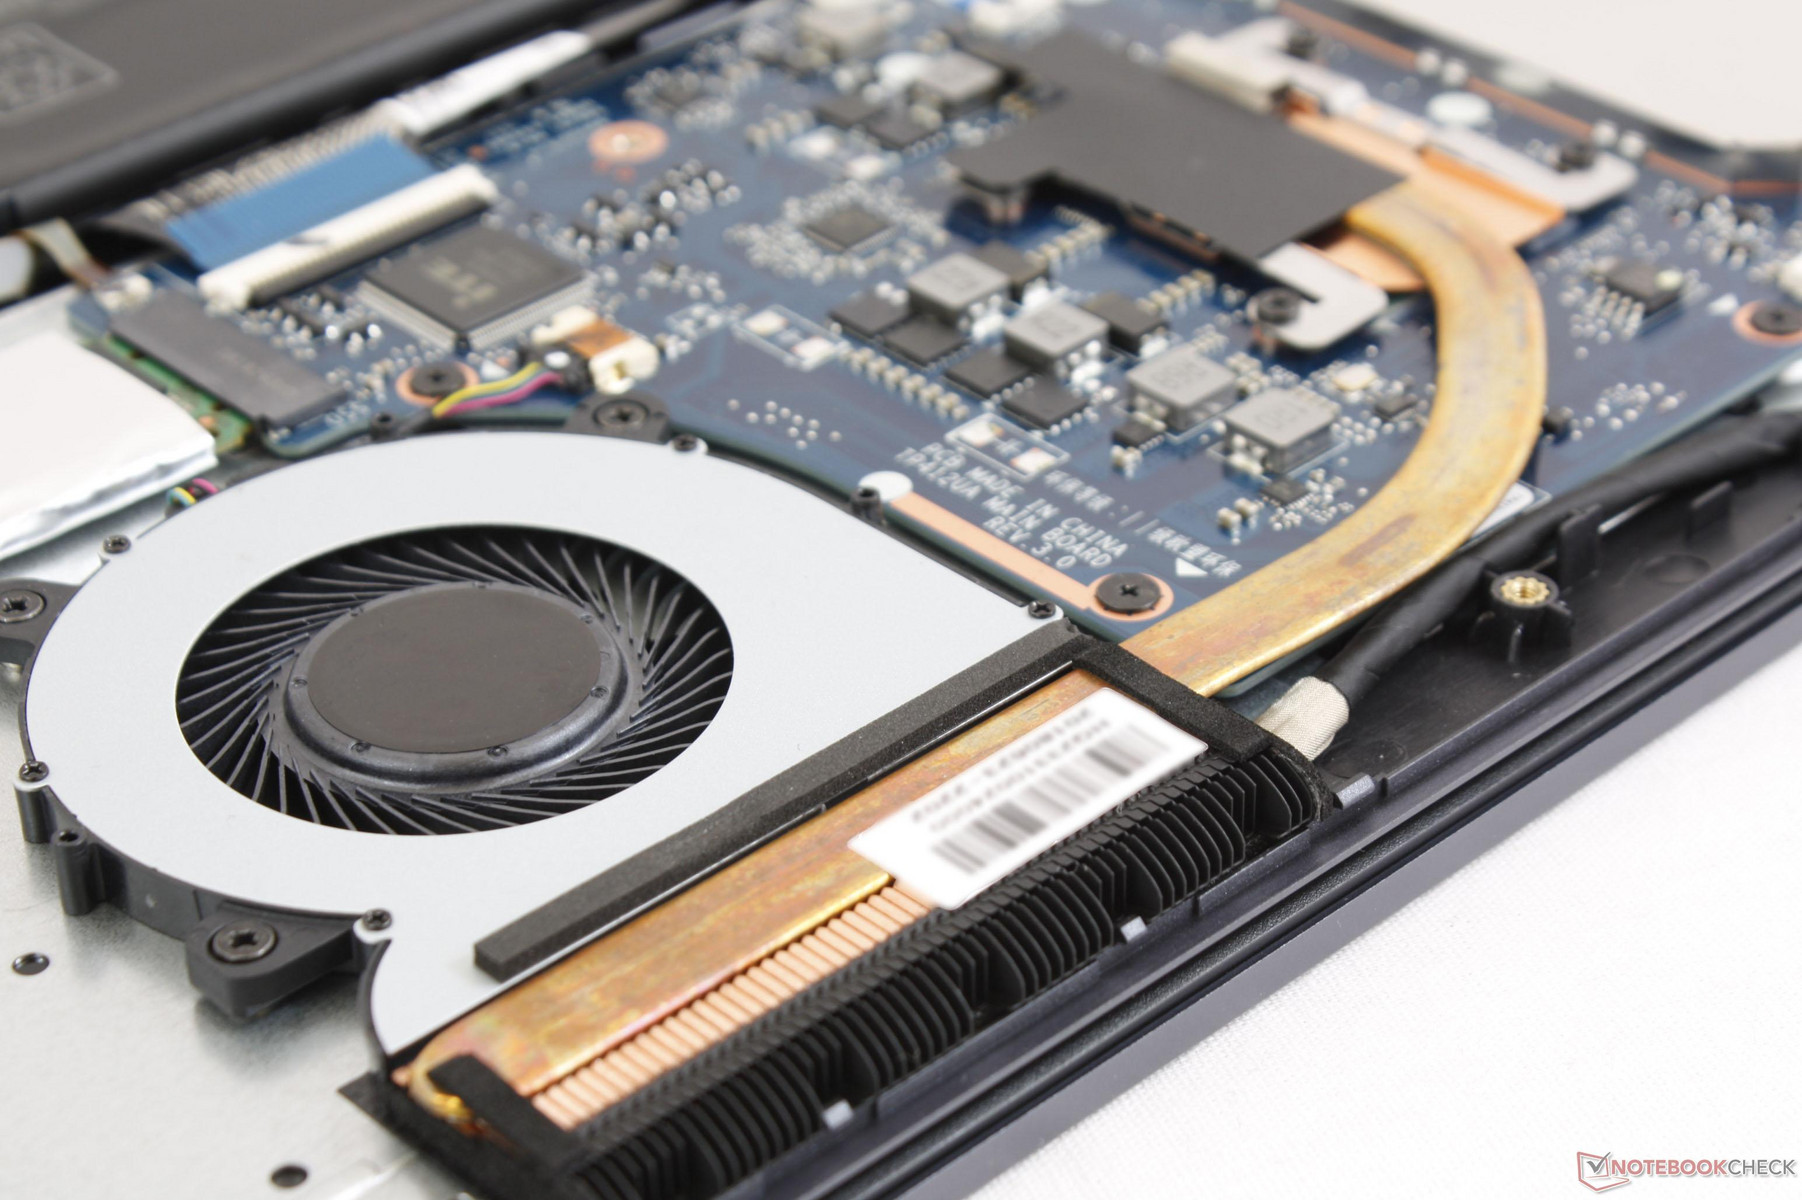
Maintenance
Serviceability has improved significantly over last year's model. The bottom panel is relatively easy to remove with just a Philips screwdriver and sharp edge. The RAM slot is covered by an aluminum cage and the secondary 2.5-inch SATA bay has been removed.
Accessories and Warranty
The box includes no extras other than the AC adapter, Quick Start guide, and warranty card. The standard one-year limited manufacturer warranty applies. Please see our Guarantees, Return policies and Warranties FAQ for country-specific information.
Input Devices
Keyboard
The keyboard keys (~27.0 x 10.5 cm) are adequate if not slightly on the spongy side. The Backspace, Enter, and Arrow keys in particular are softer than we are used to. Clatter is moderate and close to the keys of the XPS 13.
The three-level white backlight returns. Unlike on the TP410, however, Asus has flipped the F function keys with their secondary multimedia functions. Thus, the fn key is no longer required to adjust volume, brightness, or keyboard lighting.
Touchpad
The Precision clickpad surface (~10.6 x 7.5 cm) is responsive with smooth gliding properties. If moving very slowly, however, the finger tends to stick and skip. Its integrated mouse clicks are also shallow in travel and could have benefited from stronger feedback.
Display
Asus has unfortunately downgraded the display for the TP412. Whereas last year's TP410 utilized an IPS panel from Chi Mei, the new TP410 uses an IPS panel from AU Optronics with inferior gamut and contrast and a dimmer backlight as shown by our table below. It could have been a cost-saving measure, but it's a very disappointing find nonetheless.
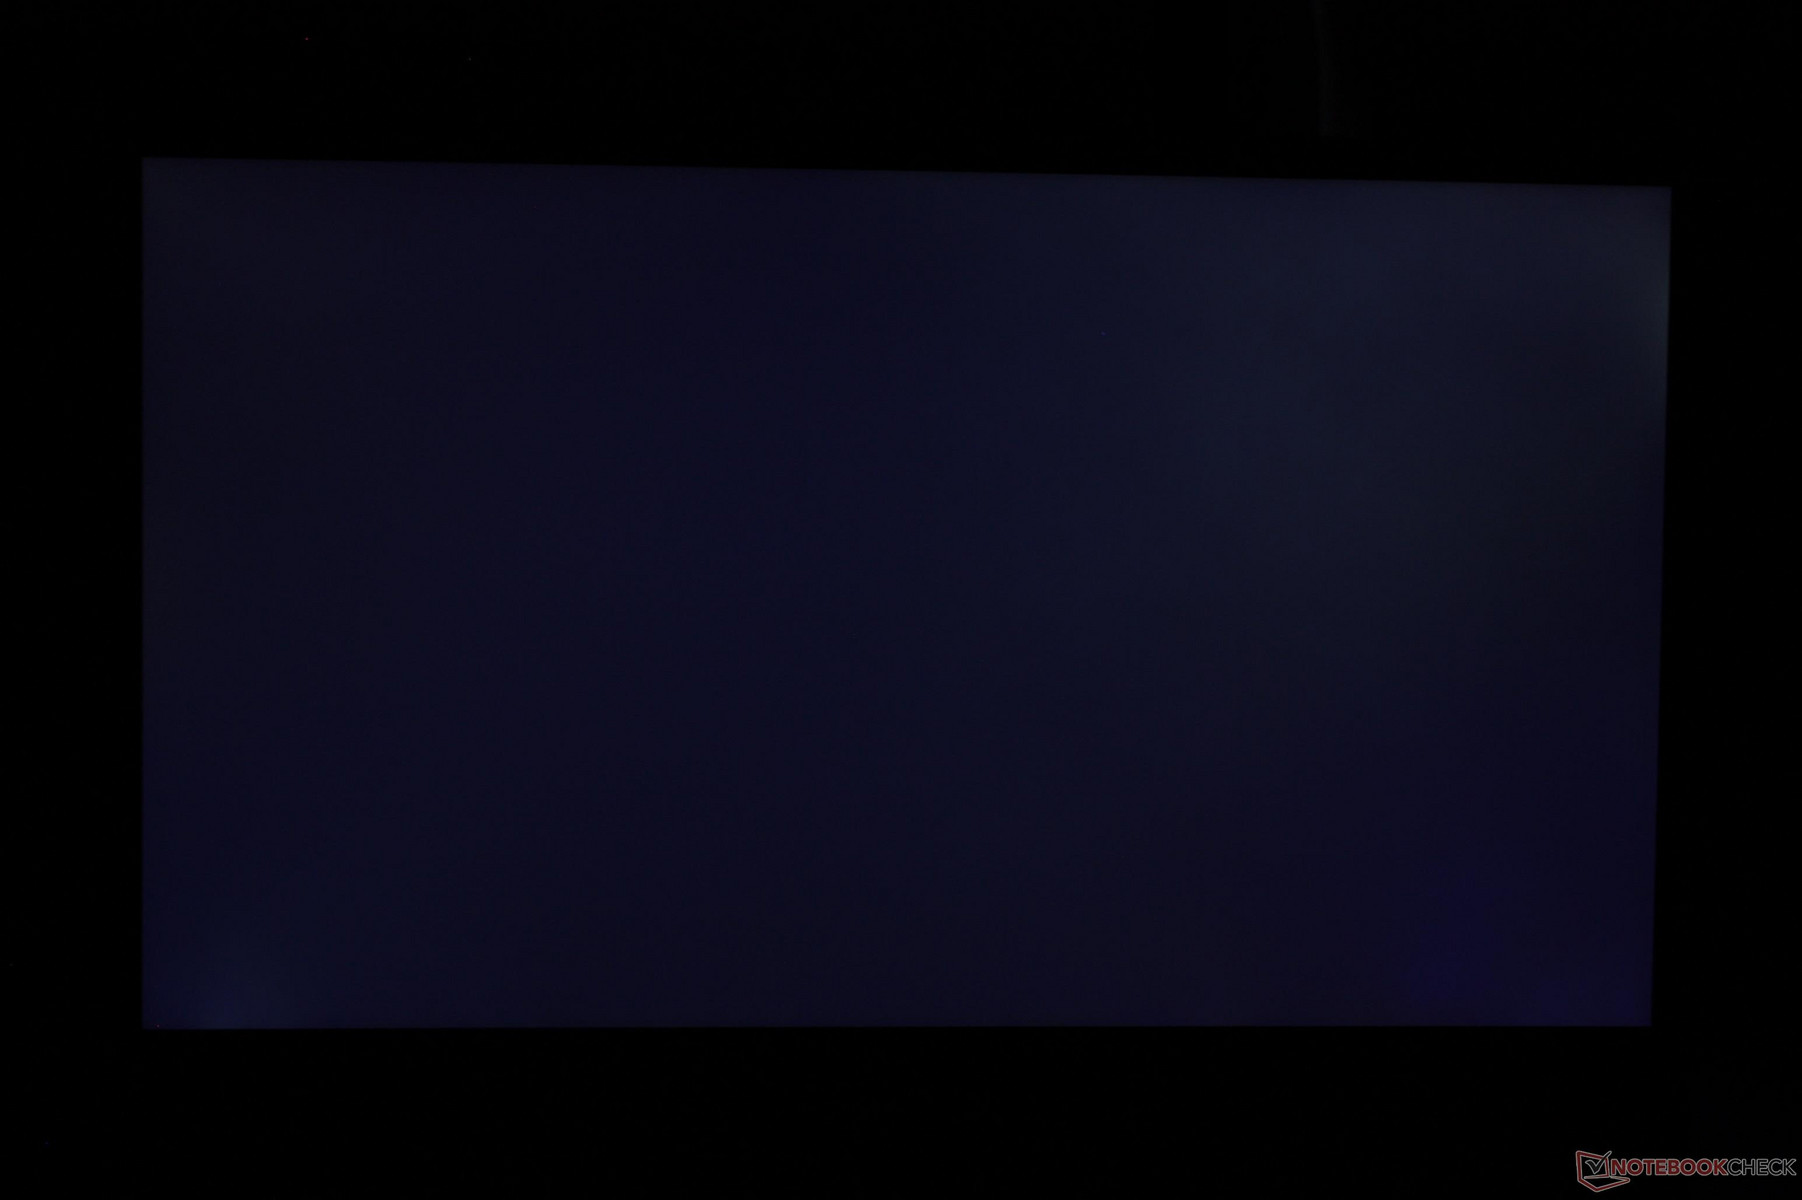
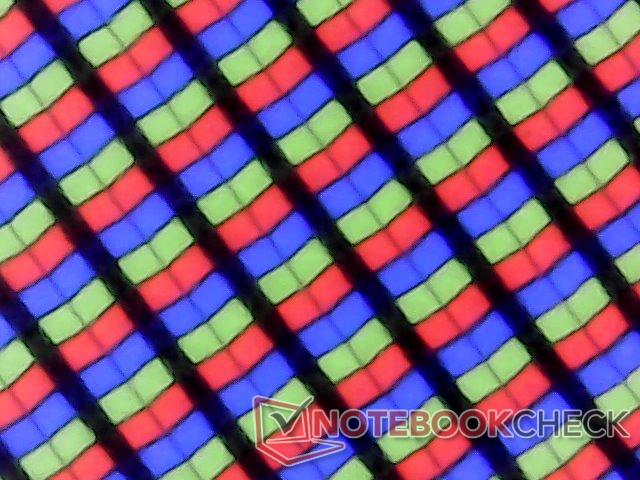
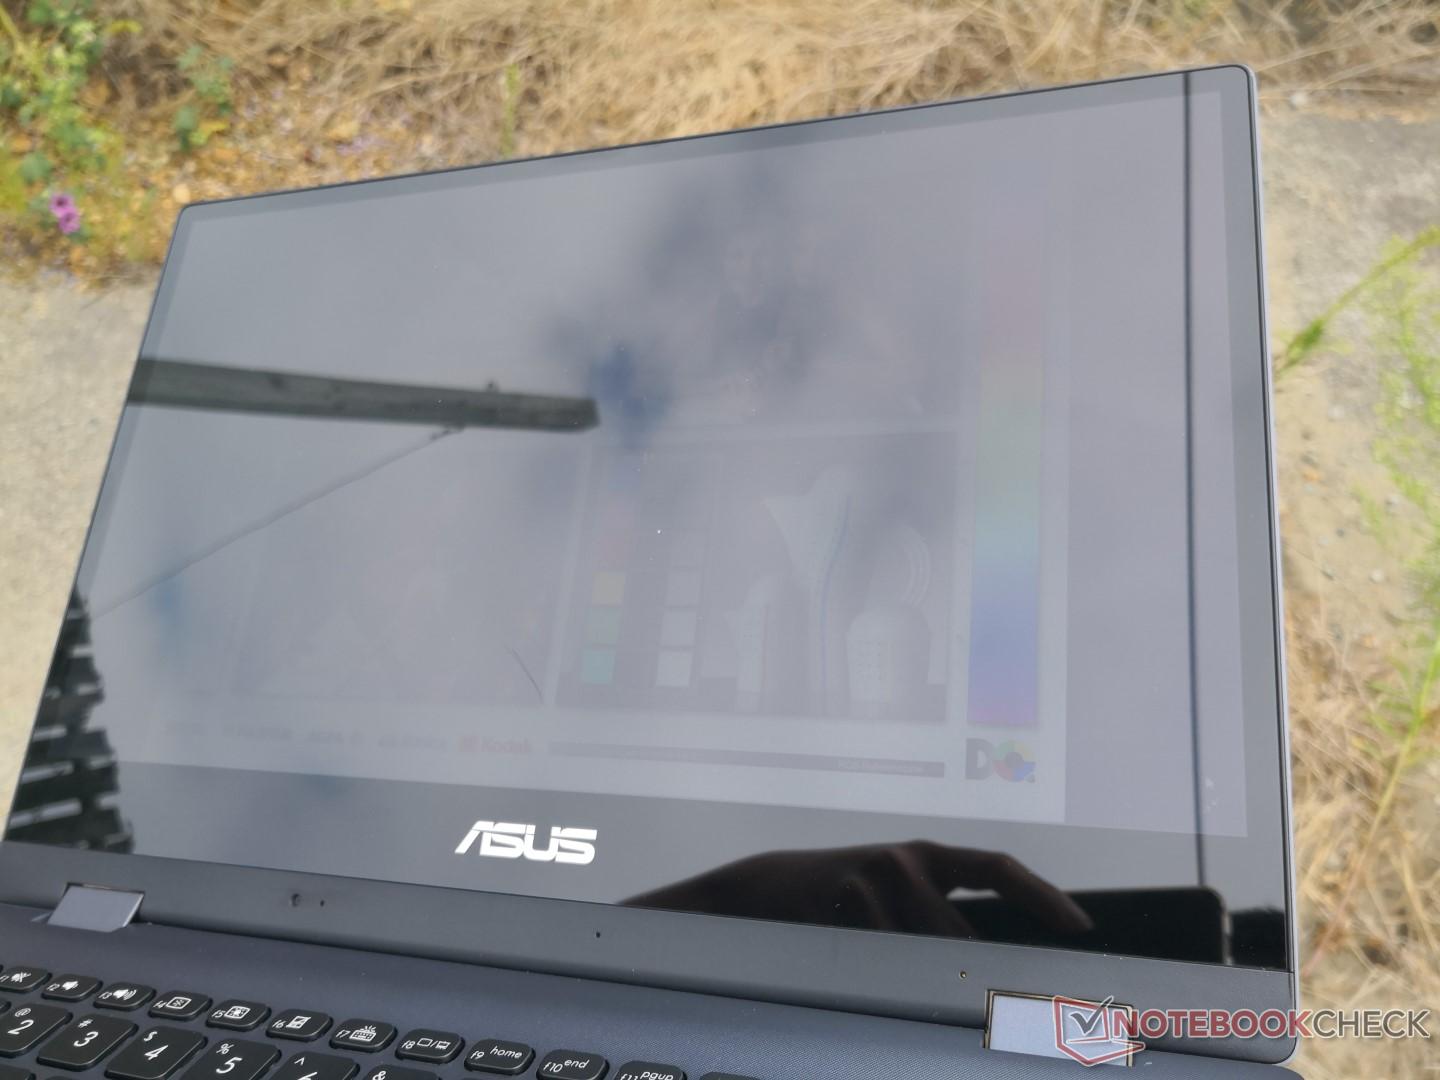
Luckily, the glossy touchscreen is still crisp and free of grains. We can detect no pulse-width modulation and backlight bleeding is minimal around the corners of our unit.
| |||||||||||||||||||||||||
Brightness Distribution: 87 %
Center on Battery: 252.5 cd/m²
Contrast: 881:1 (Black: 0.29 cd/m²)
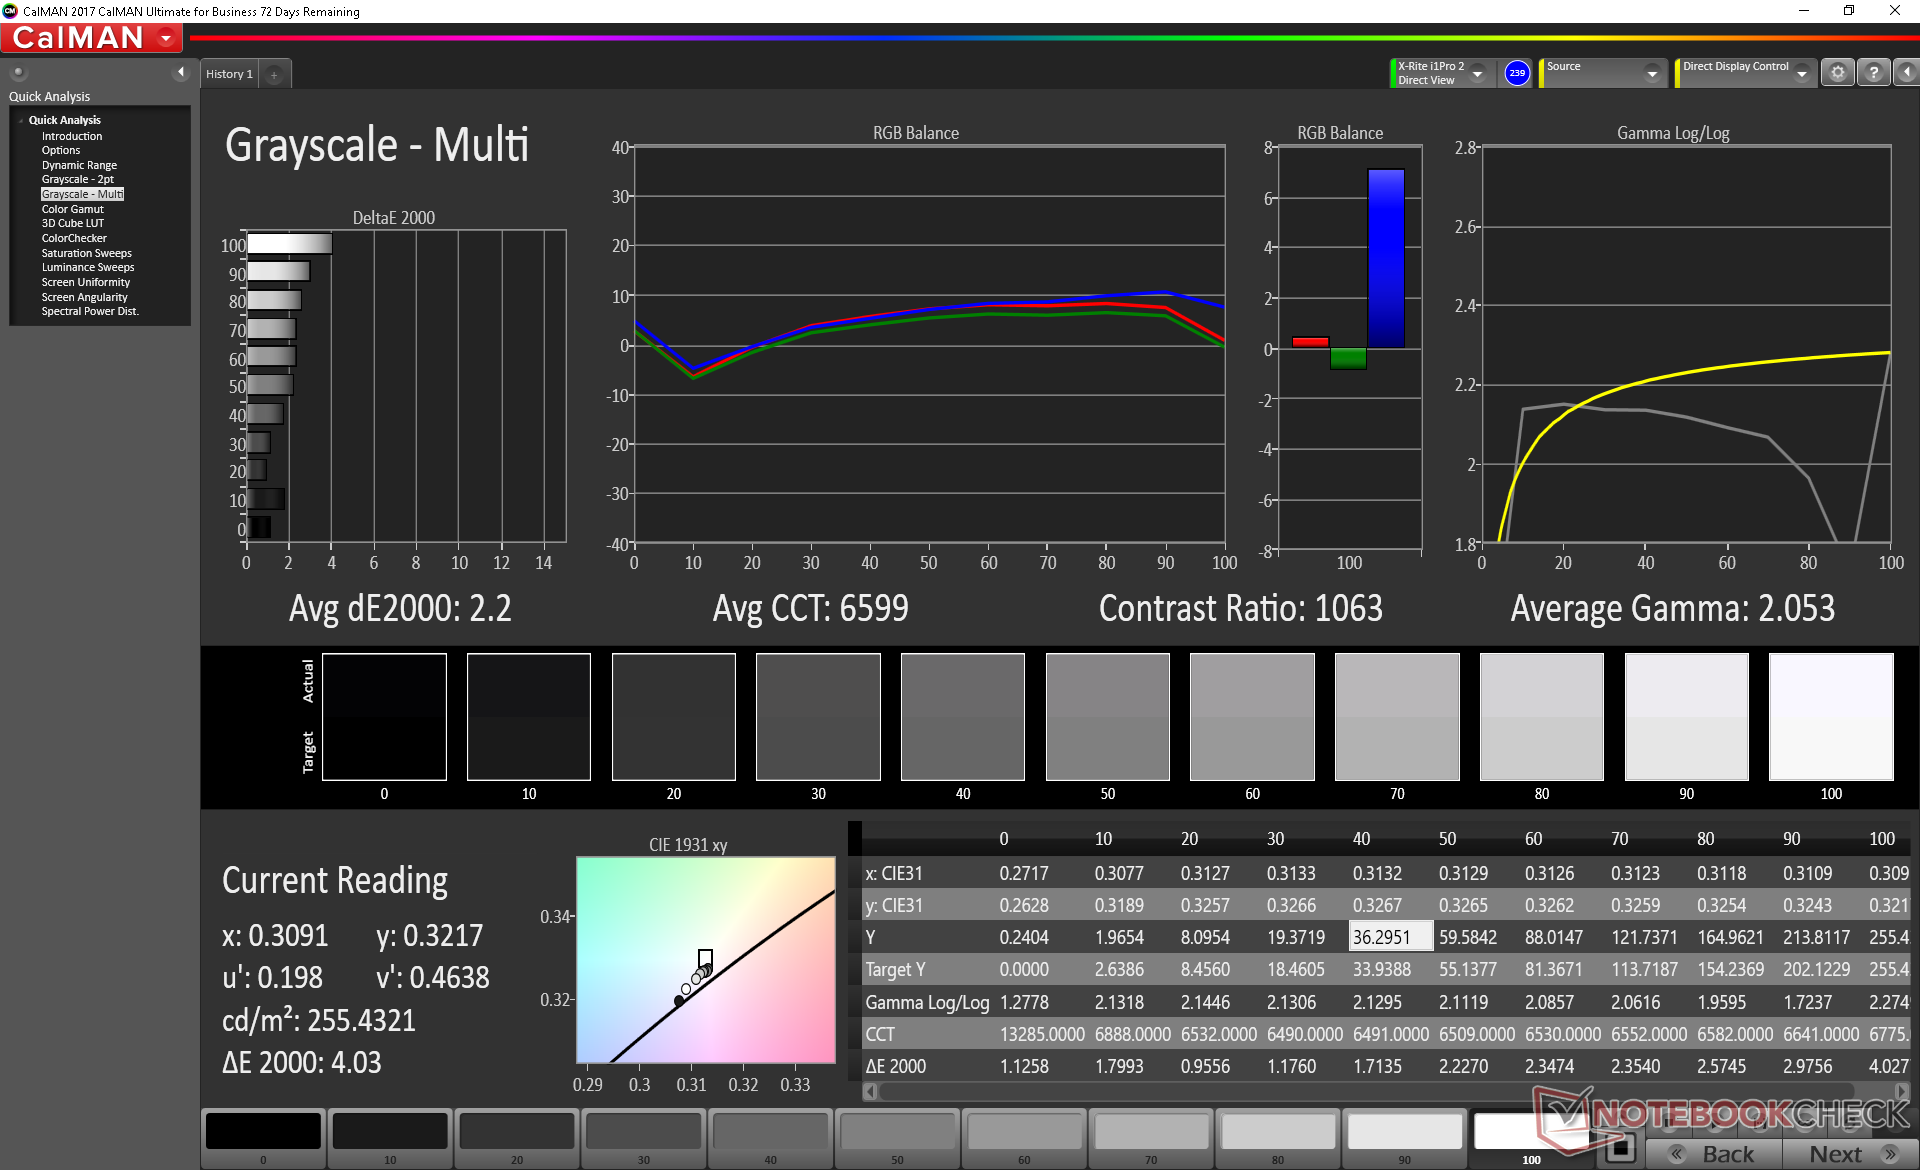
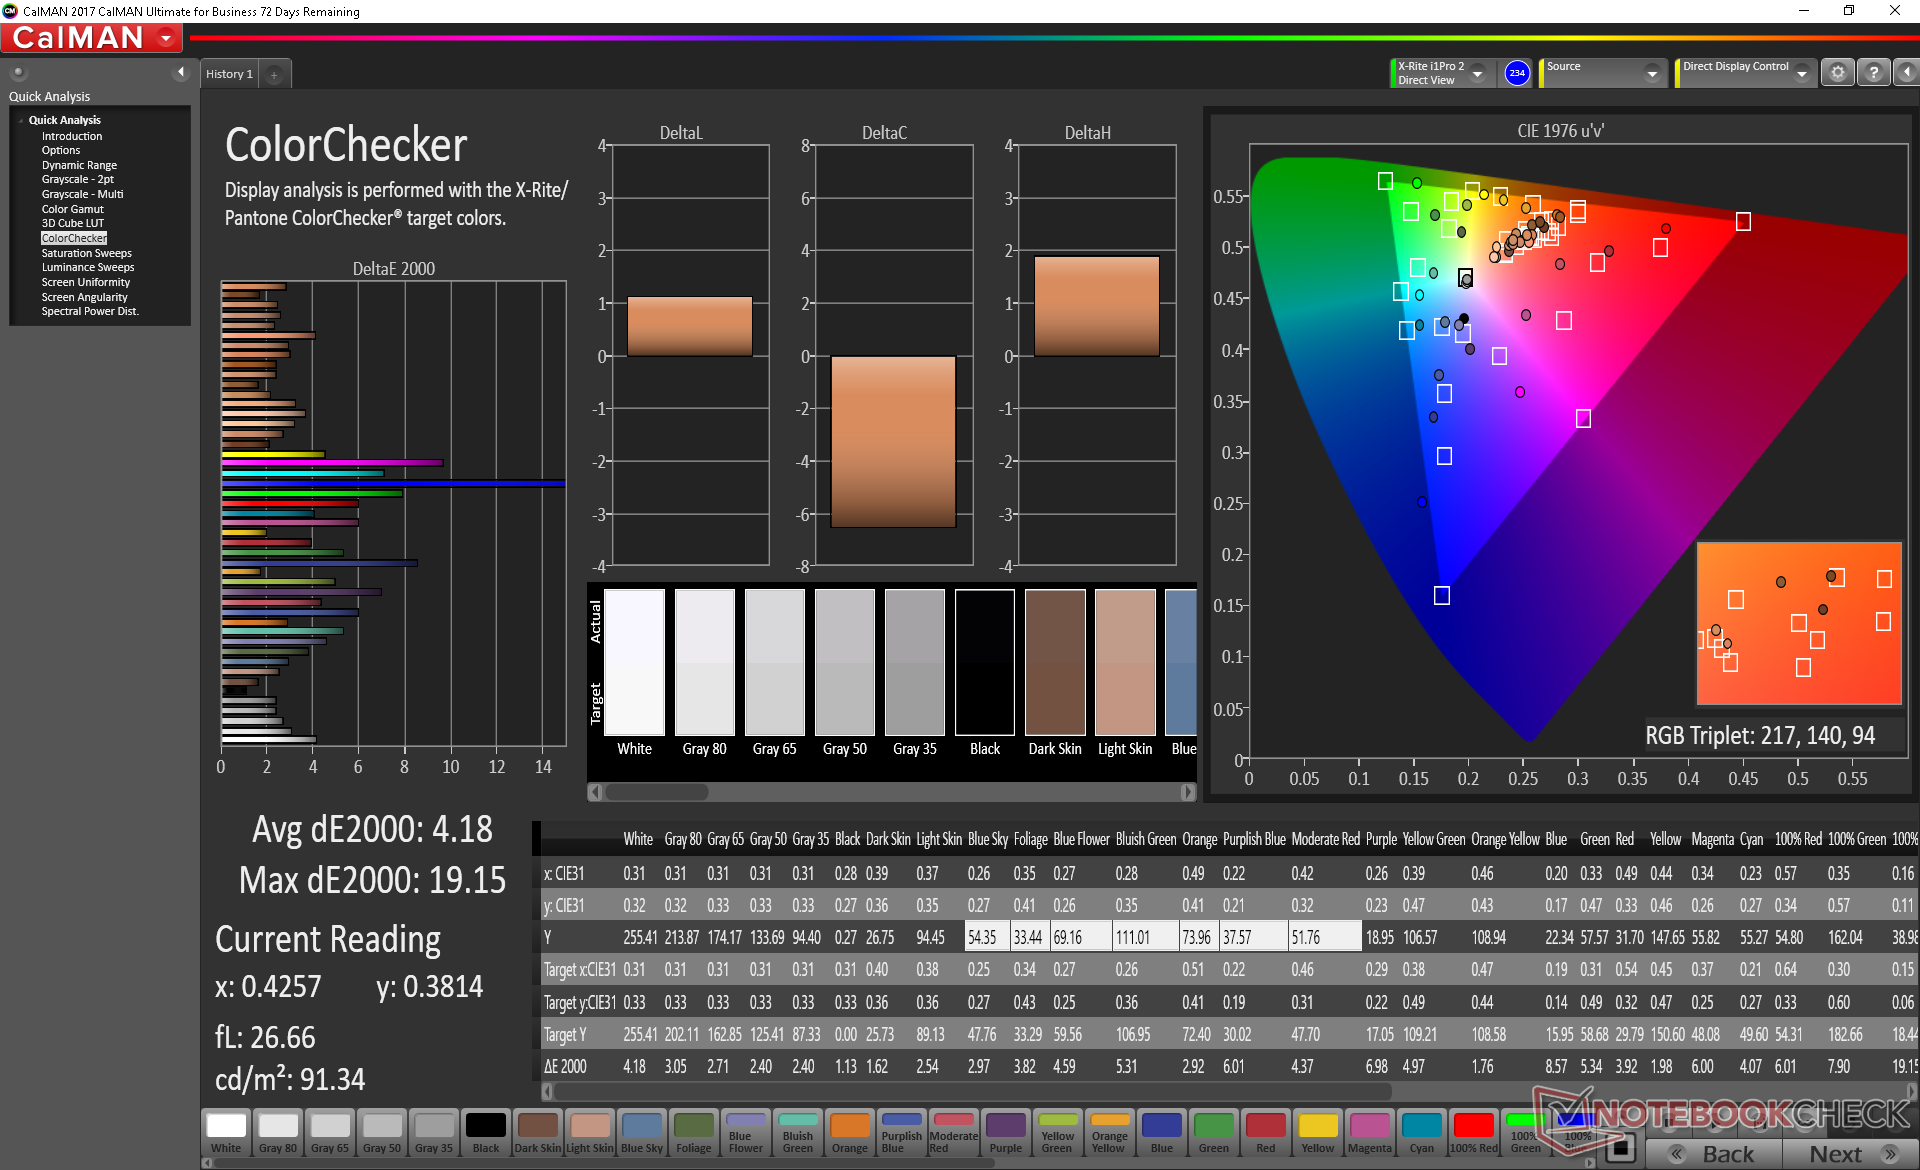
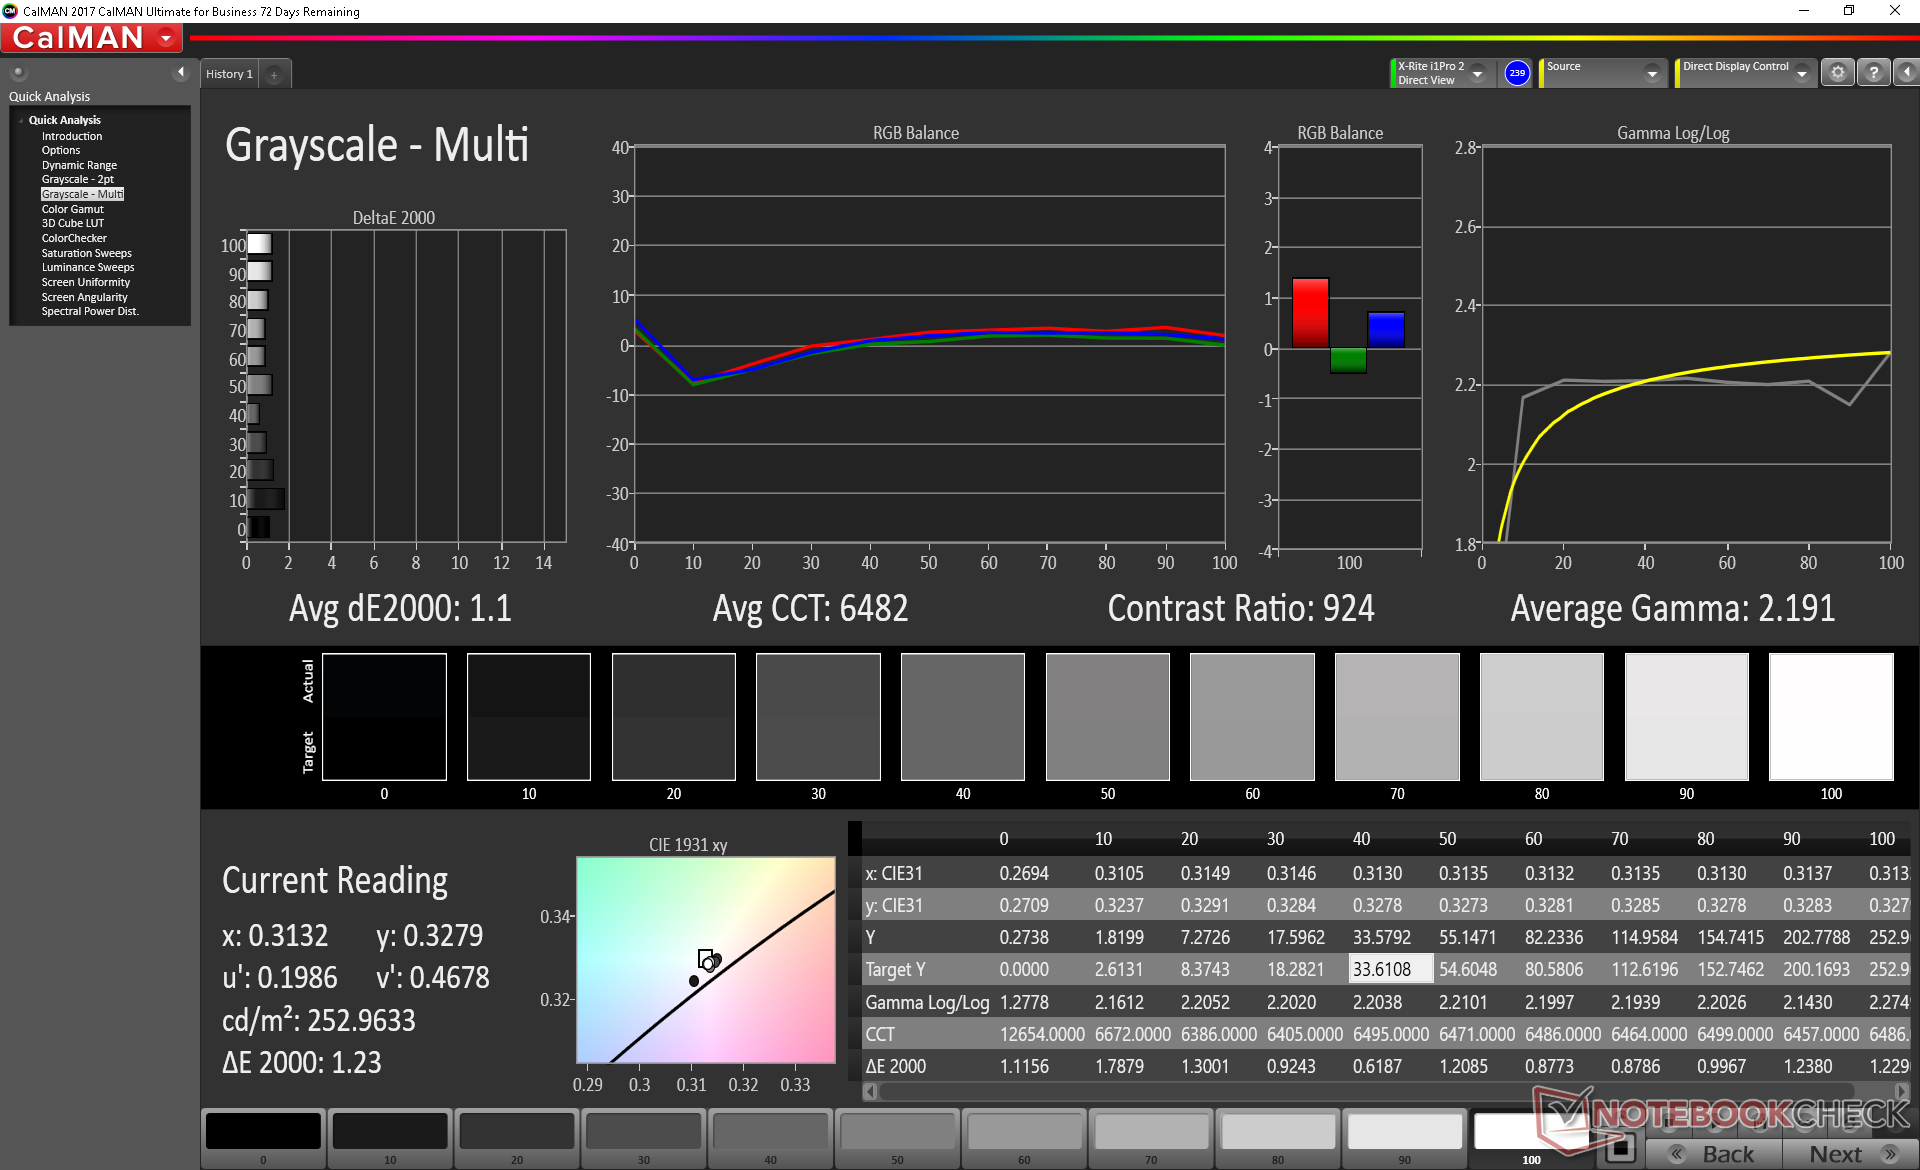
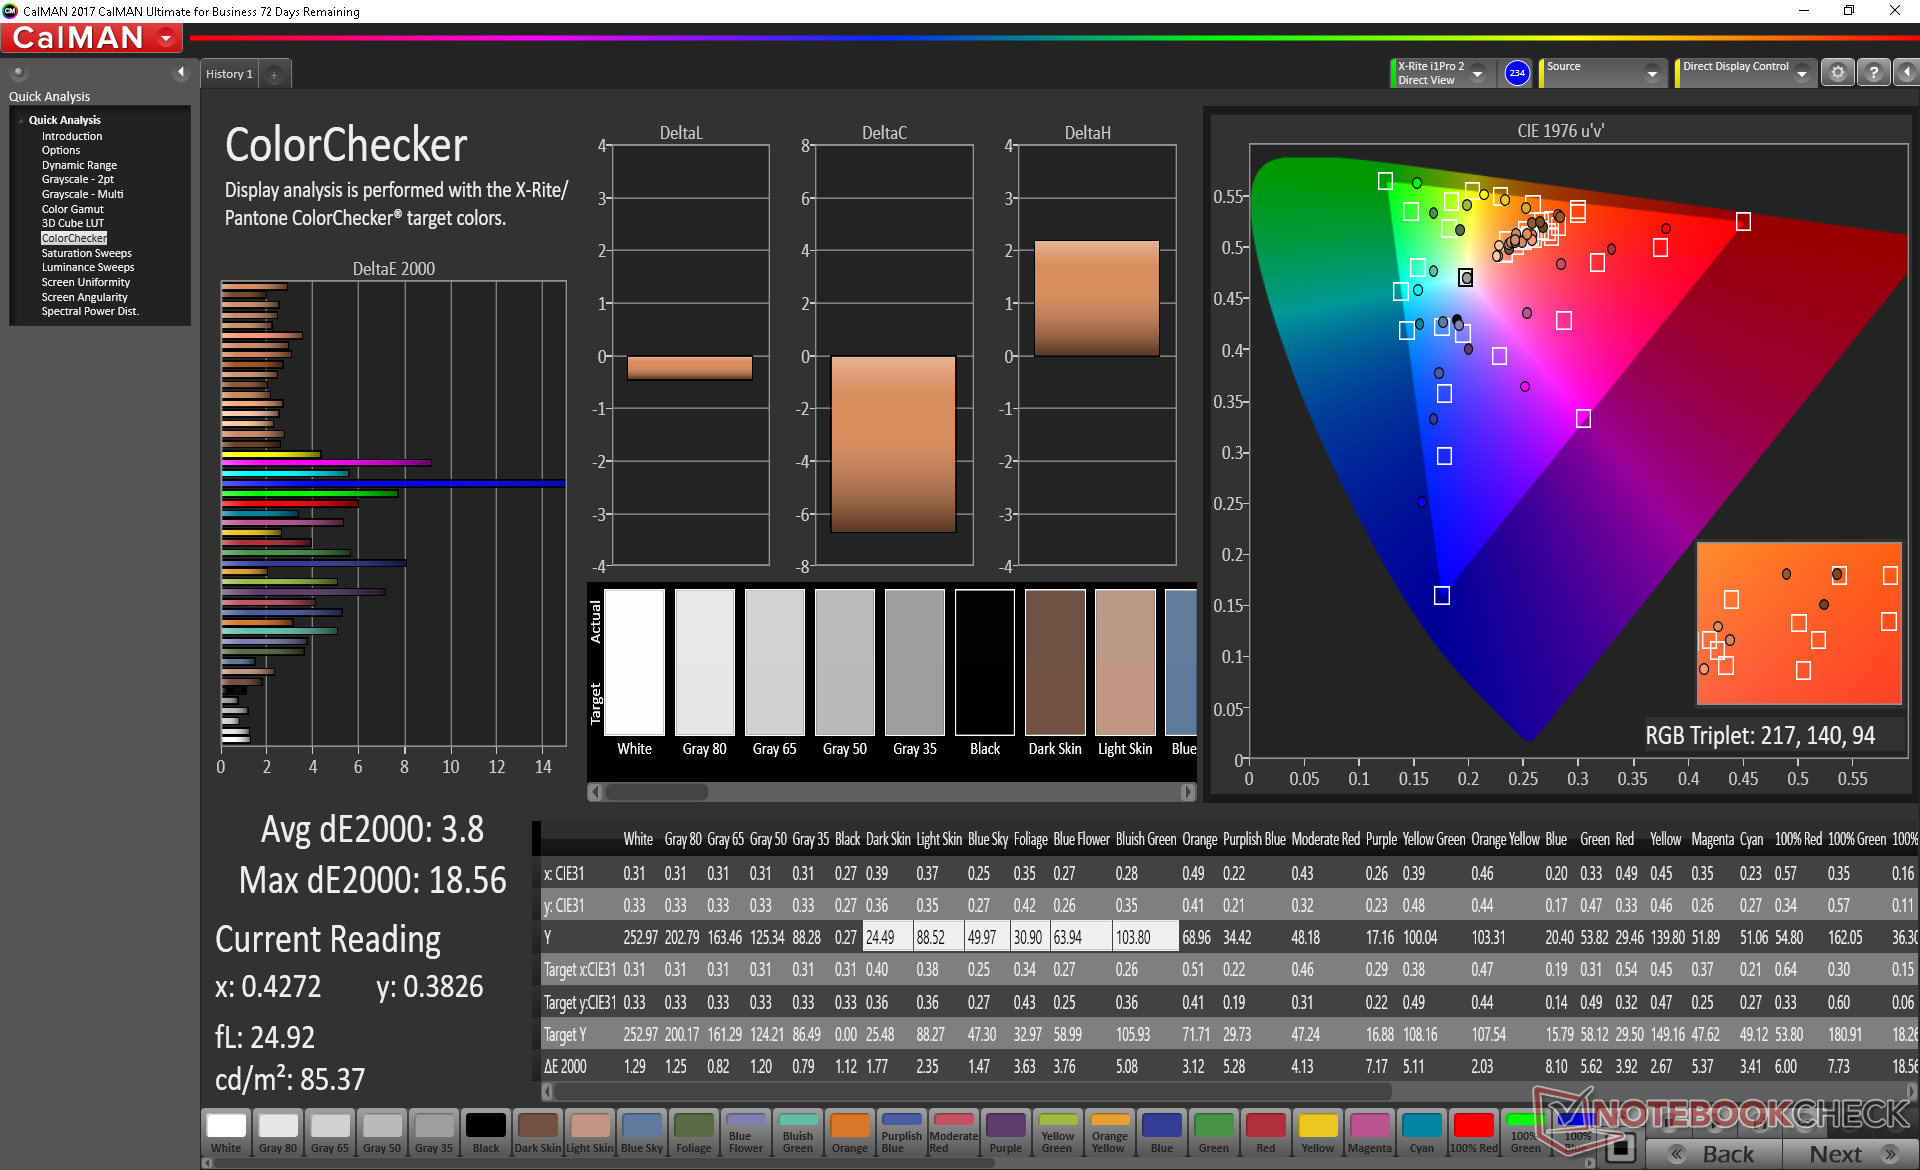
ΔE ColorChecker Calman: 4.18 | ∀{0.5-29.43 Ø4.72}
calibrated: 3.8
ΔE Greyscale Calman: 2.2 | ∀{0.09-98 Ø4.97}
59.1% sRGB (Argyll 1.6.3 3D)
37.5% AdobeRGB 1998 (Argyll 1.6.3 3D)
40.73% AdobeRGB 1998 (Argyll 3D)
59.2% sRGB (Argyll 3D)
39.42% Display P3 (Argyll 3D)
Gamma: 2.05
CCT: 6599 K
| Asus VivoBook Flip 14 TP412UA-DB51T AUO B140HAN04.0, IPS, 14", 1920x1080 | Lenovo Yoga 920-13IKB-80Y7 AU Optronics B139HAN03.0, IPS, 13.9", 1920x1080 | Asus VivoBook Flip 14 TP410UA-EC242T Chi Mei N140HCE-EN1, IPS, 14", 1920x1080 | Lenovo Yoga 530-14IKB-81EK00CWGE InfoVision M140NWF5 R2, IPS, 14", 1920x1080 | Dell XPS 15 9570 i7 UHD LQ156D1, IPS, 15.6", 3840x2160 | HP Spectre x360 15-ch000 BOE0730, IPS, 15.6", 3840x2160 | |
|---|---|---|---|---|---|---|
| Display | 57% | 67% | 5% | 87% | 58% | |
| Display P3 Coverage (%) | 39.42 | 62.5 59% | 66.7 69% | 41.52 5% | 79.1 101% | 66.7 69% |
| sRGB Coverage (%) | 59.2 | 91.7 55% | 96.6 63% | 62.1 5% | 98.8 67% | 87.4 48% |
| AdobeRGB 1998 Coverage (%) | 40.73 | 64.1 57% | 68.9 69% | 42.92 5% | 79.2 94% | 63.8 57% |
| Response Times | -12% | 9% | -8% | -13% | 14% | |
| Response Time Grey 50% / Grey 80% * (ms) | 38 ? | 46 ? -21% | 34 ? 11% | 45 ? -18% | 46.4 ? -22% | 36 ? 5% |
| Response Time Black / White * (ms) | 30.8 ? | 31.6 ? -3% | 29 ? 6% | 30 ? 3% | 32 ? -4% | 23.6 ? 23% |
| PWM Frequency (Hz) | 24750 ? | 520 ? | 980 ? | 943 ? | ||
| Screen | -11% | 29% | 18% | 35% | 15% | |
| Brightness middle (cd/m²) | 255.5 | 297.9 17% | 327 28% | 240 -6% | 494 93% | 349.5 37% |
| Brightness (cd/m²) | 242 | 278 15% | 308 27% | 234 -3% | 457 89% | 330 36% |
| Brightness Distribution (%) | 87 | 81 -7% | 90 3% | 93 7% | 88 1% | 90 3% |
| Black Level * (cd/m²) | 0.29 | 0.44 -52% | 0.23 21% | 0.11 62% | 0.34 -17% | 0.29 -0% |
| Contrast (:1) | 881 | 677 -23% | 1422 61% | 2182 148% | 1453 65% | 1205 37% |
| Colorchecker dE 2000 * | 4.18 | 5.1 -22% | 2.63 37% | 4.98 -19% | 5.2 -24% | 4.06 3% |
| Colorchecker dE 2000 max. * | 19.15 | 11 43% | 6.58 66% | 10.75 44% | 17.5 9% | 7.68 60% |
| Colorchecker dE 2000 calibrated * | 3.8 | 3.33 12% | 4.22 -11% | |||
| Greyscale dE 2000 * | 2.2 | 6.7 -205% | 4.11 -87% | 3.51 -60% | 2.7 -23% | 4.4 -100% |
| Gamma | 2.05 107% | 2.9 76% | 2.45 90% | 2.2 100% | 2.1 105% | 2.11 104% |
| CCT | 6599 98% | 6839 95% | 7352 88% | 6606 98% | 7038 92% | 7422 88% |
| Color Space (Percent of AdobeRGB 1998) (%) | 37.5 | 64.1 71% | 63 68% | 40 7% | 71.2 90% | 56.5 51% |
| Color Space (Percent of sRGB) (%) | 59.1 | 91.7 55% | 97 64% | 62 5% | 98.8 67% | 86.9 47% |
| Total Average (Program / Settings) | 11% /
3% | 35% /
34% | 5% /
12% | 36% /
39% | 29% /
23% |
* ... smaller is better
Color space covers only 59 percent and 38 percent of the sRGB and AdobeRGB standards, respectively, to indicate a budget panel. Costlier Ultrabooks like the Zenbook or Lenovo Yoga often cover sRGB almost fully for deeper and more accurate colors.
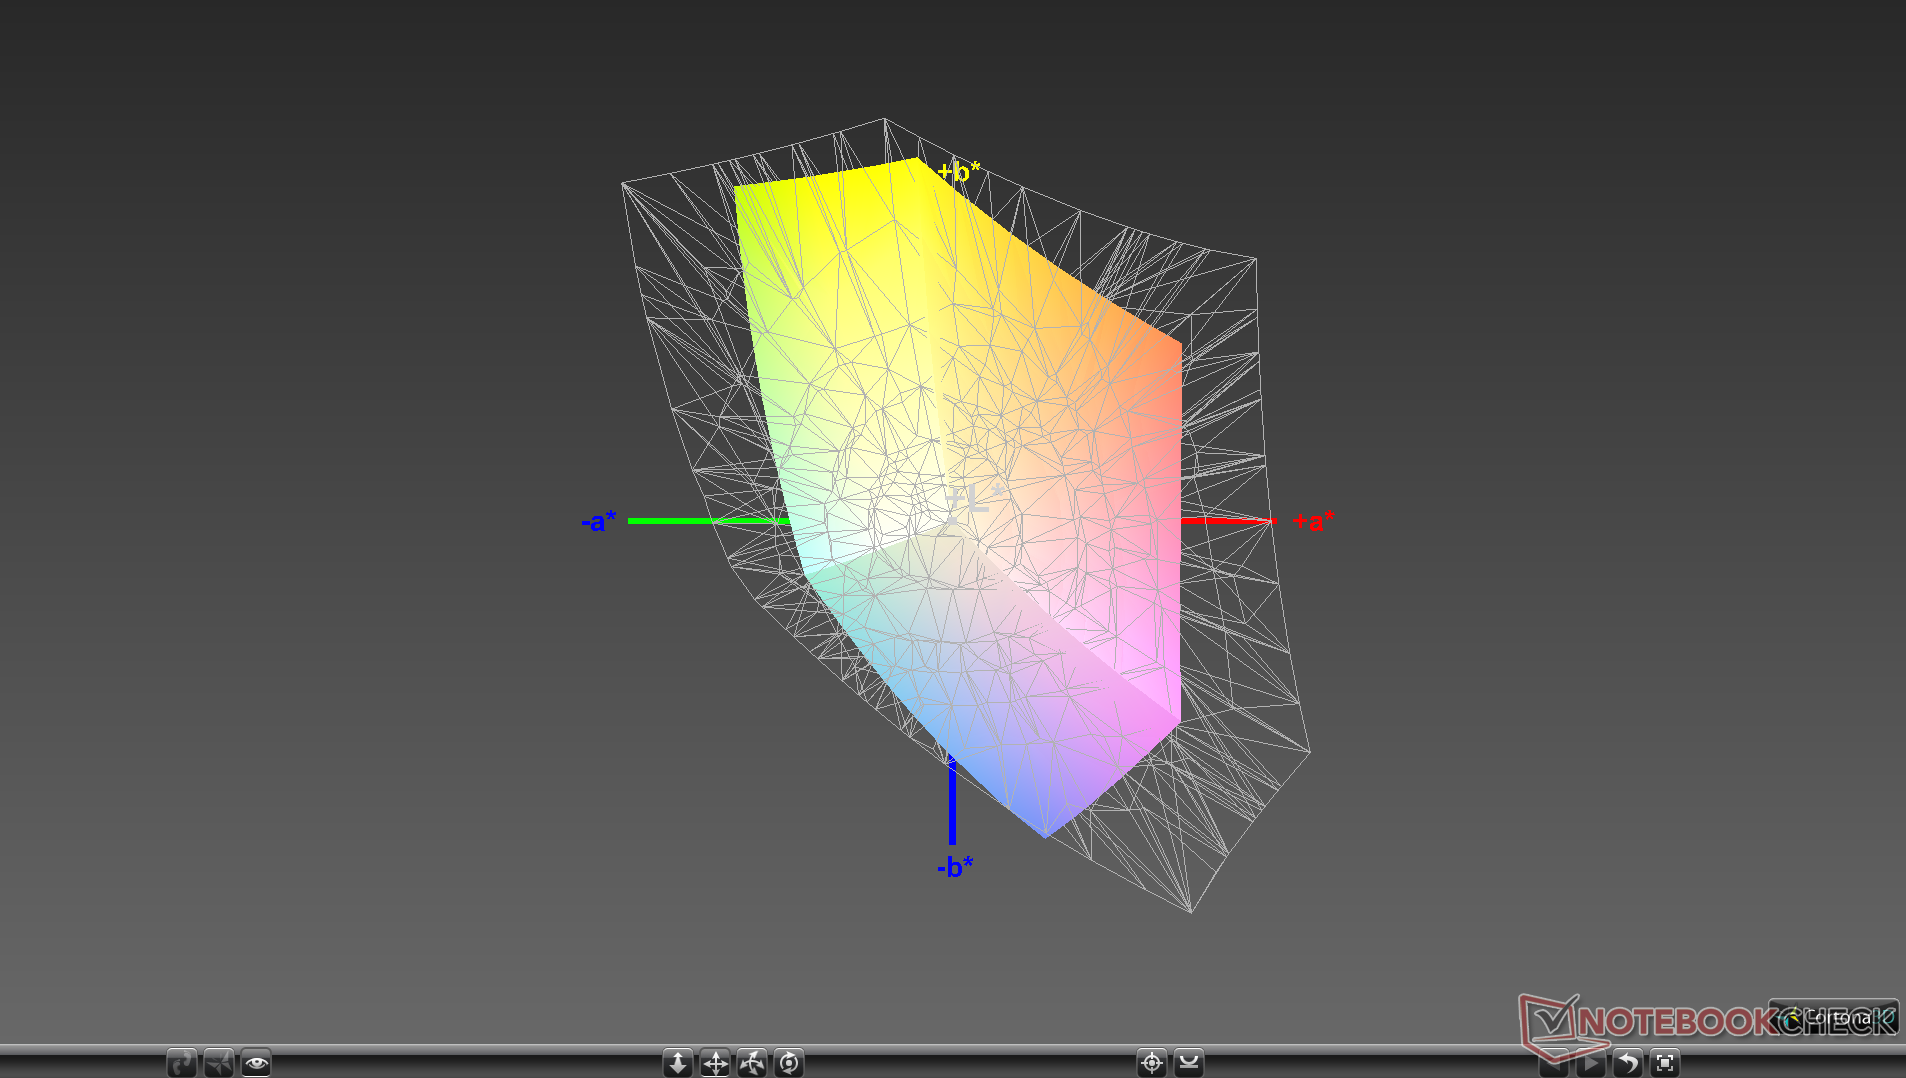
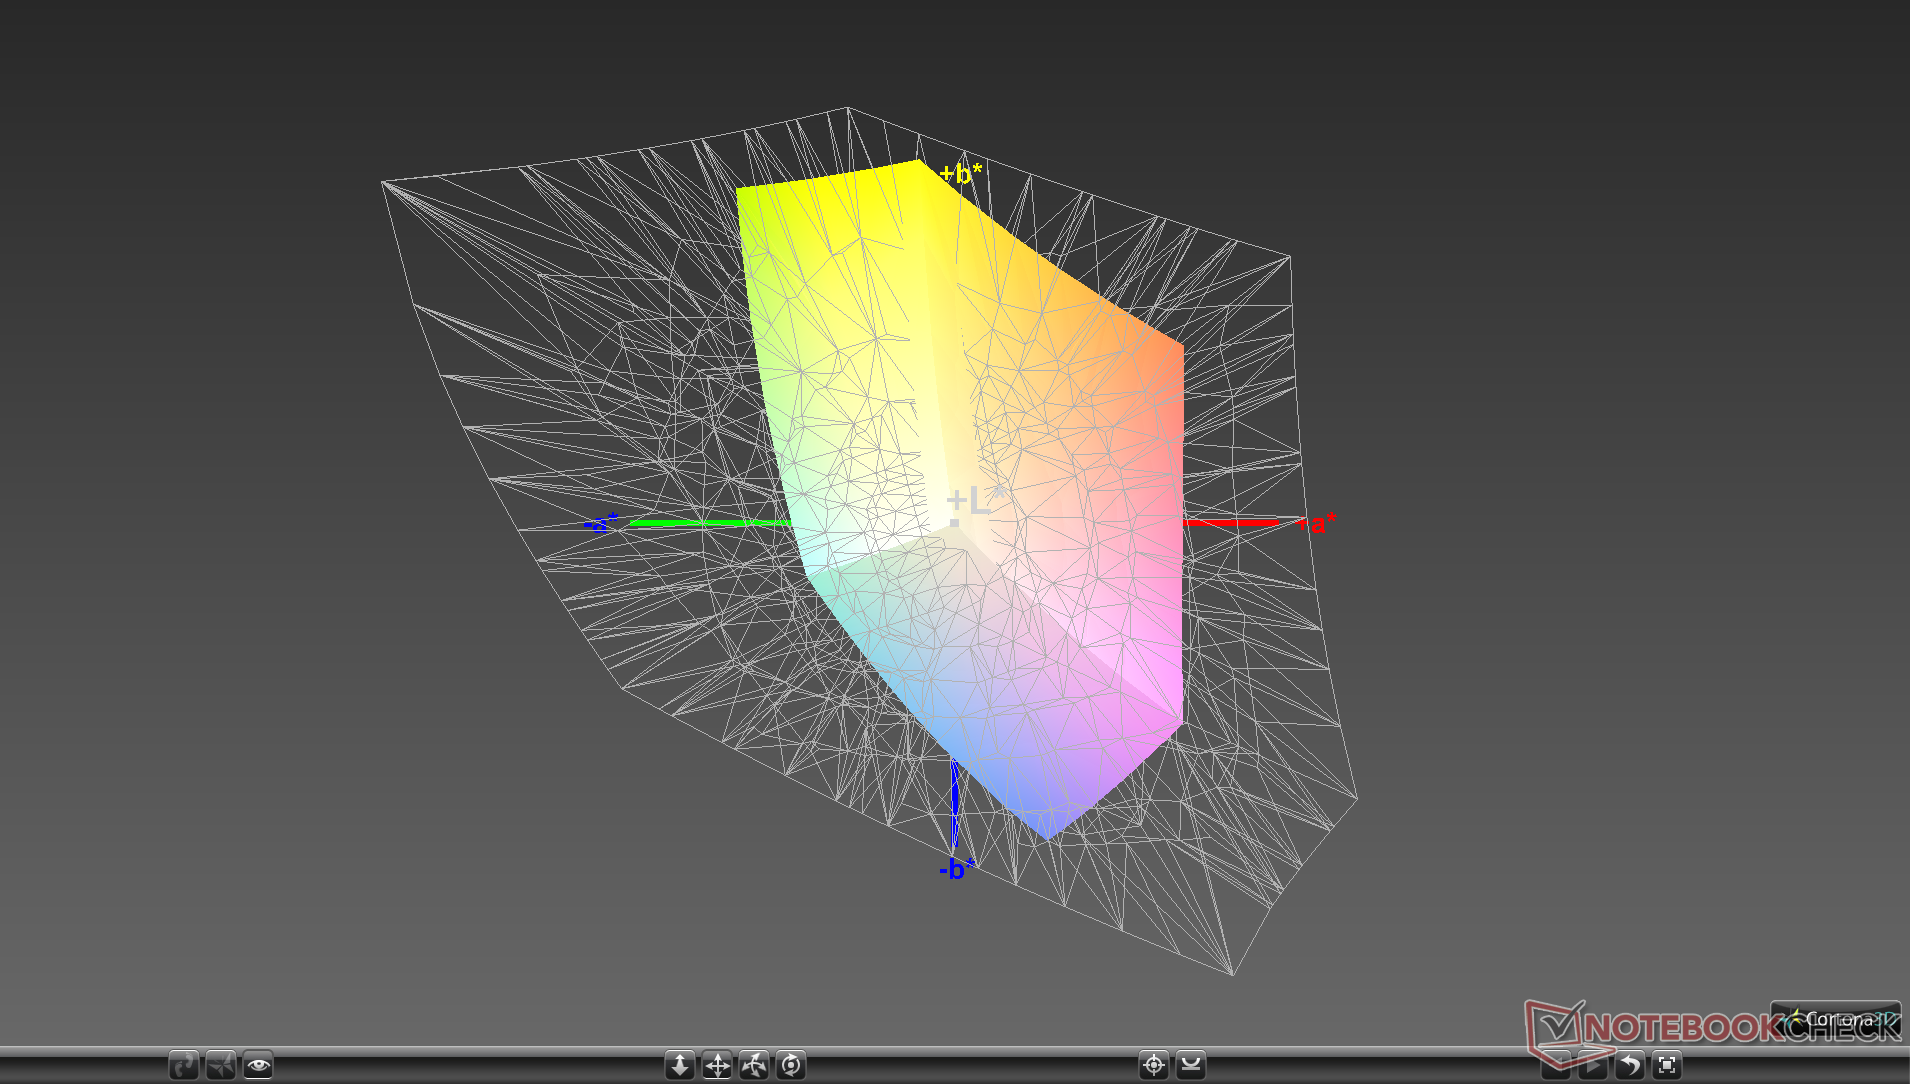
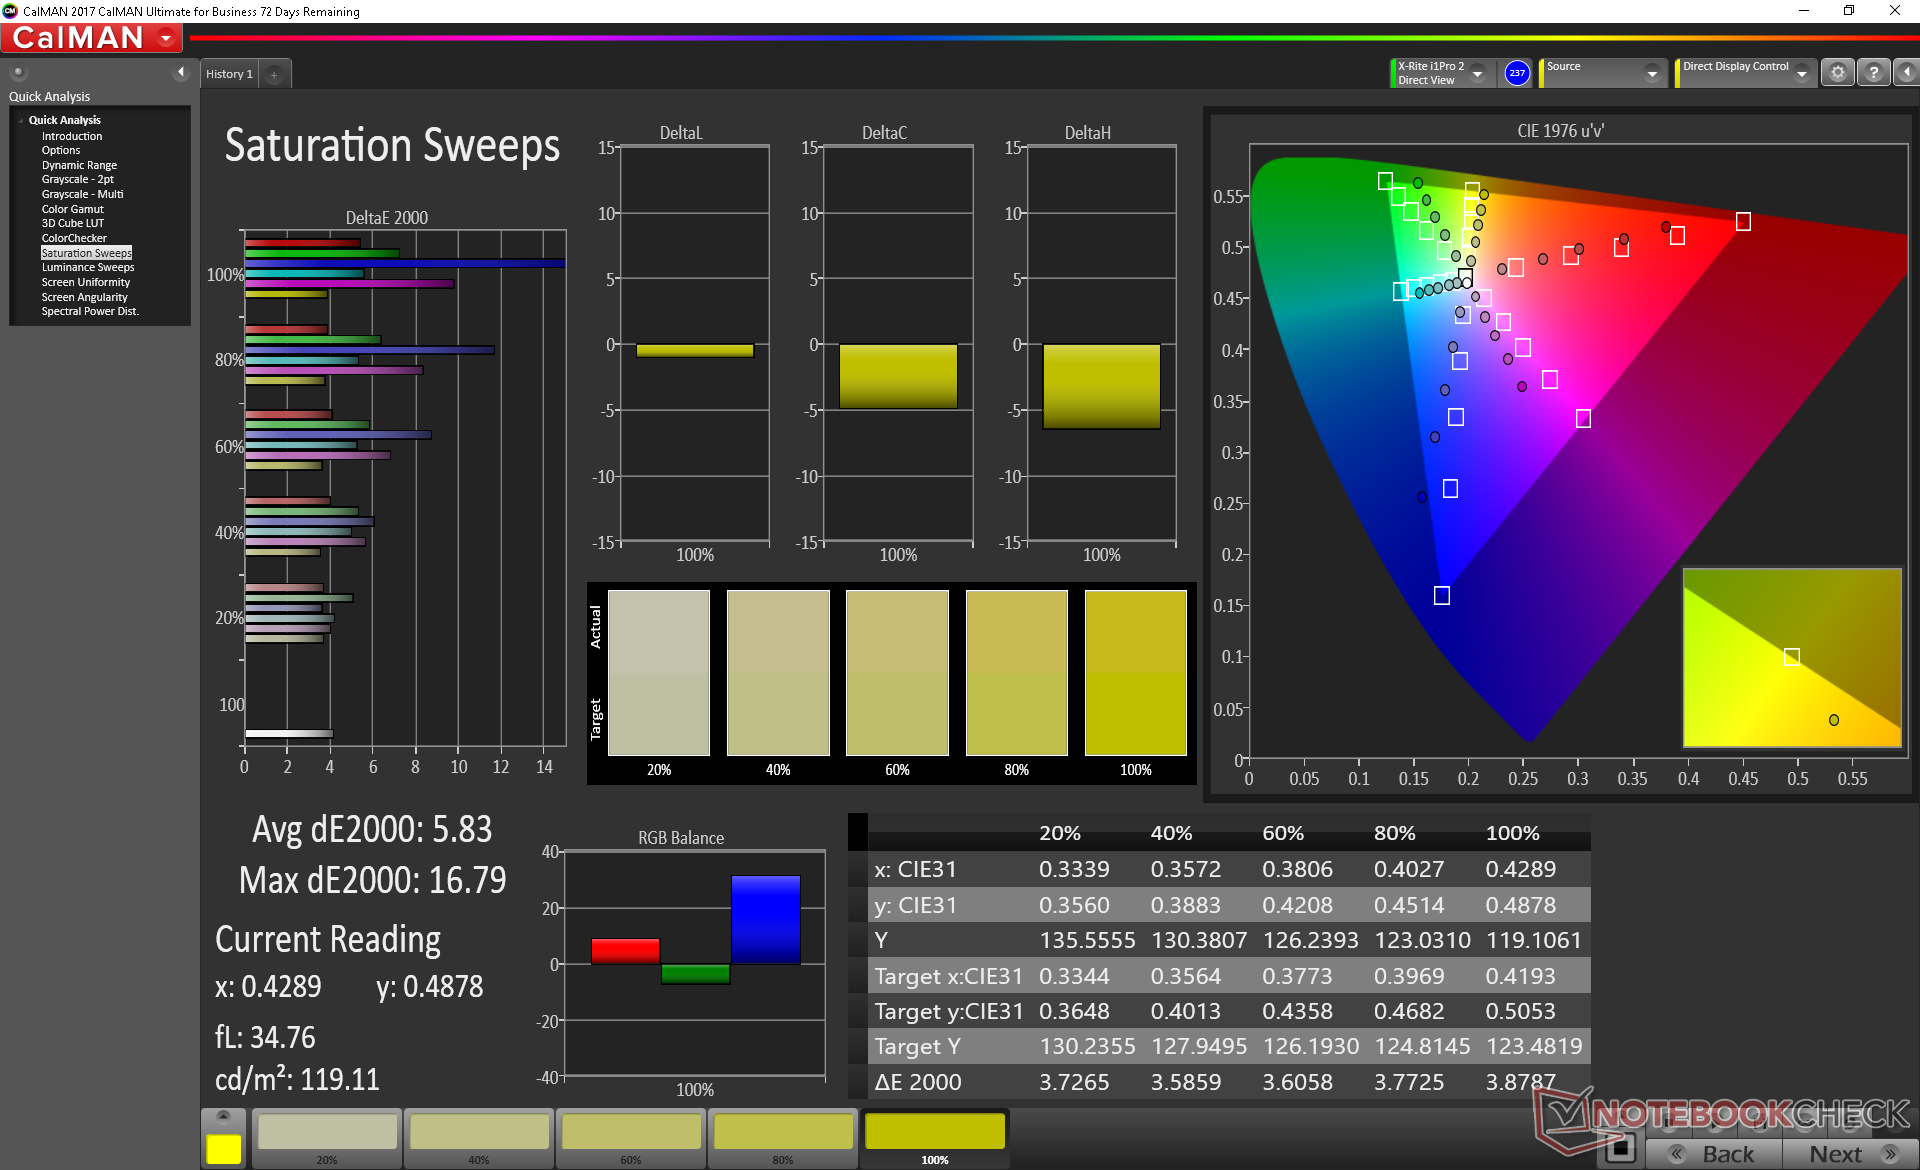
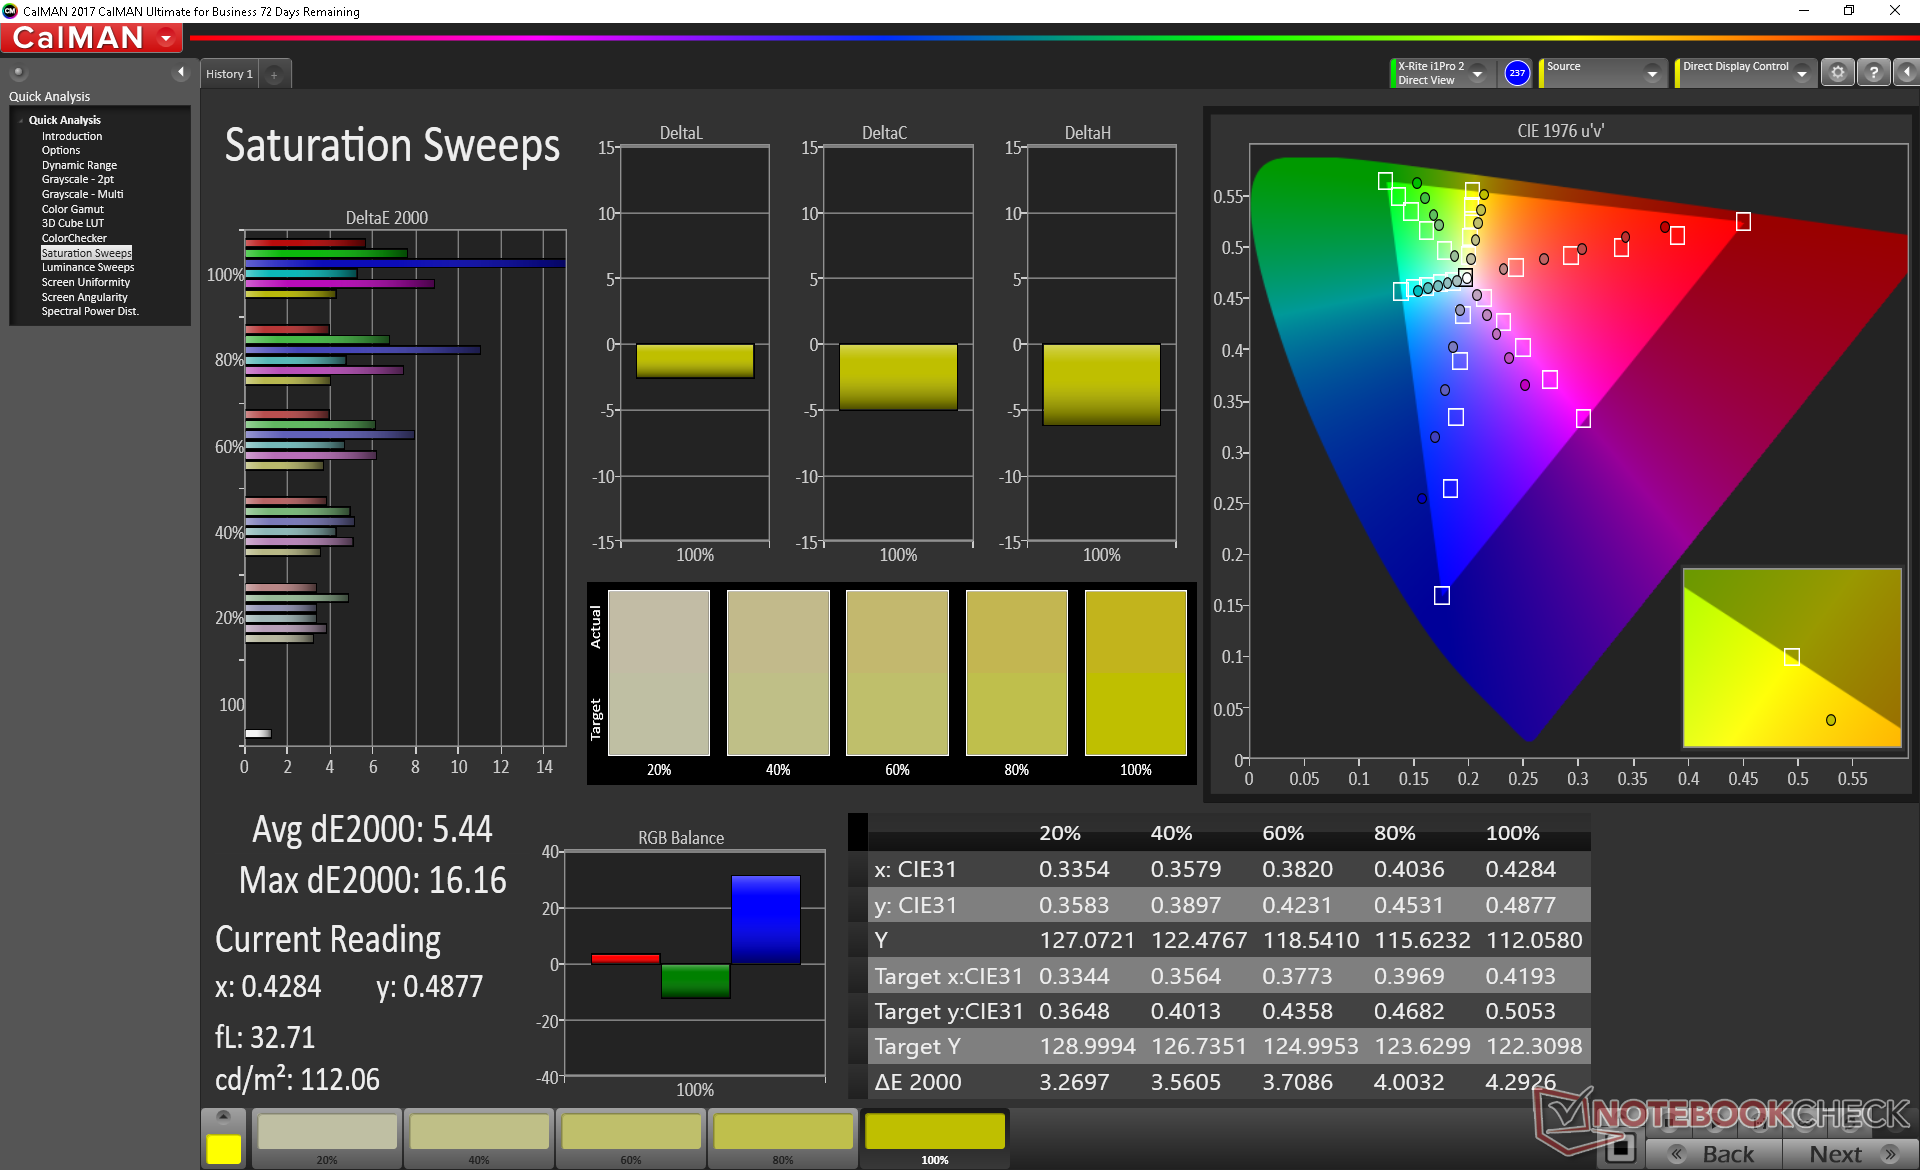
Further display measurements reveal accurate grayscale and colors which we were not expecting from a budget-mainstream system. Our calibration attempts improve the display only marginally. Colors still become increasingly more inaccurate at higher saturation levels due to imperfect sRGB coverage.
Display Response Times
| ↔ Response Time Black to White | ||
|---|---|---|
| 30.8 ms ... rise ↗ and fall ↘ combined | ↗ 17.2 ms rise | 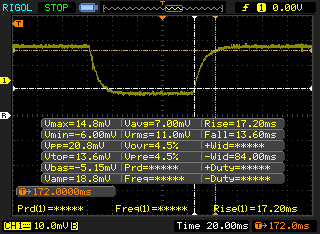 |
| ↘ 13.6 ms fall | ||
| The screen shows slow response rates in our tests and will be unsatisfactory for gamers. In comparison, all tested devices range from 0.1 (minimum) to 240 (maximum) ms. » 83 % of all devices are better. This means that the measured response time is worse than the average of all tested devices (19.8 ms). | ||
| ↔ Response Time 50% Grey to 80% Grey | ||
| 38 ms ... rise ↗ and fall ↘ combined | ↗ 19.6 ms rise | 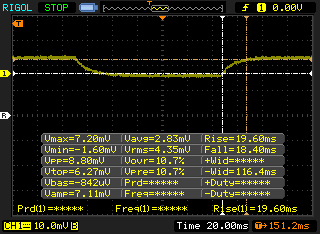 |
| ↘ 18.4 ms fall | ||
| The screen shows slow response rates in our tests and will be unsatisfactory for gamers. In comparison, all tested devices range from 0.165 (minimum) to 636 (maximum) ms. » 55 % of all devices are better. This means that the measured response time is worse than the average of all tested devices (31 ms). | ||
Screen Flickering / PWM (Pulse-Width Modulation)
| Screen flickering / PWM not detected | 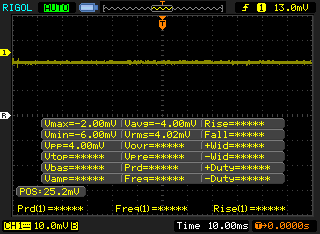 | ||
In comparison: 52 % of all tested devices do not use PWM to dim the display. If PWM was detected, an average of 7753 (minimum: 5 - maximum: 343500) Hz was measured. | |||
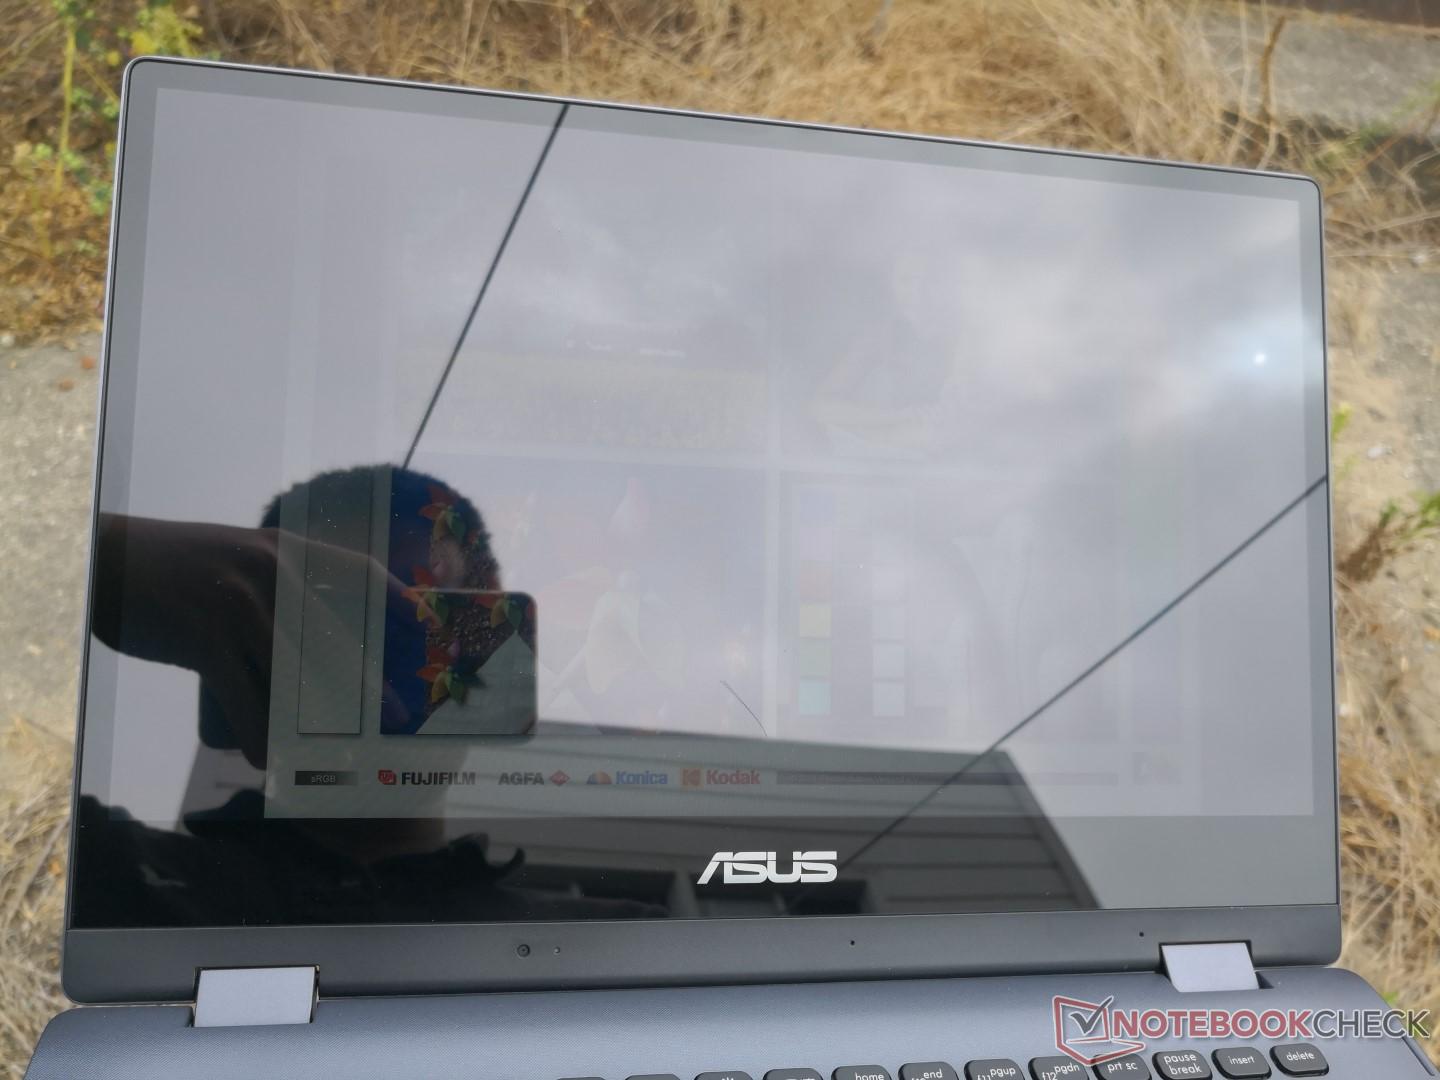
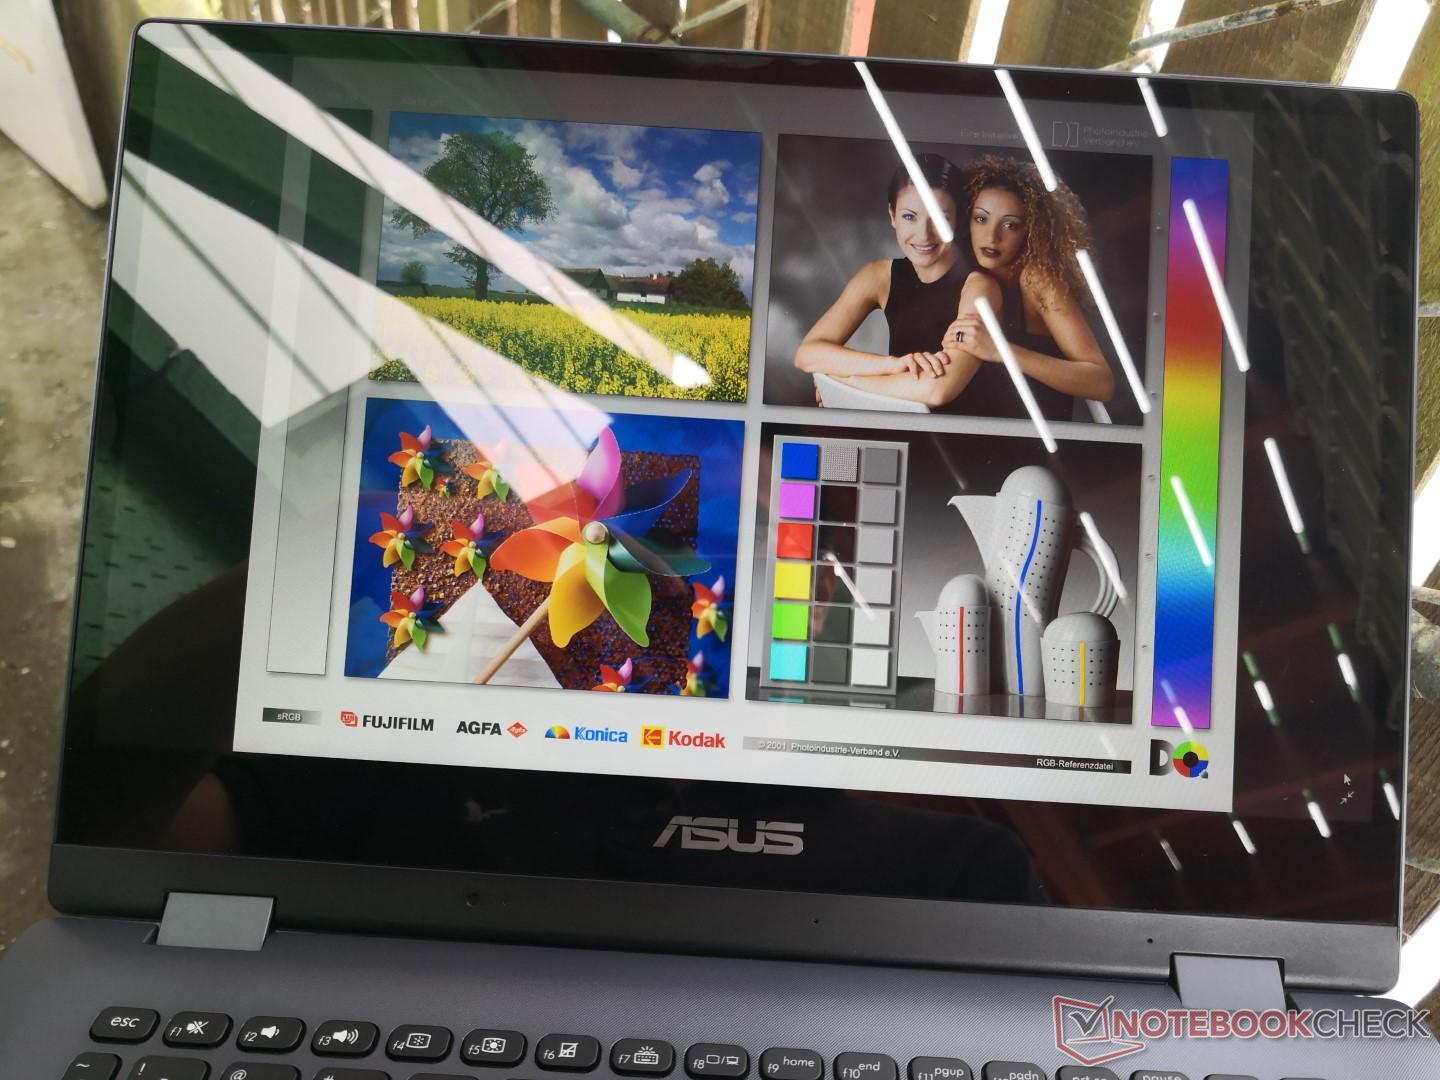
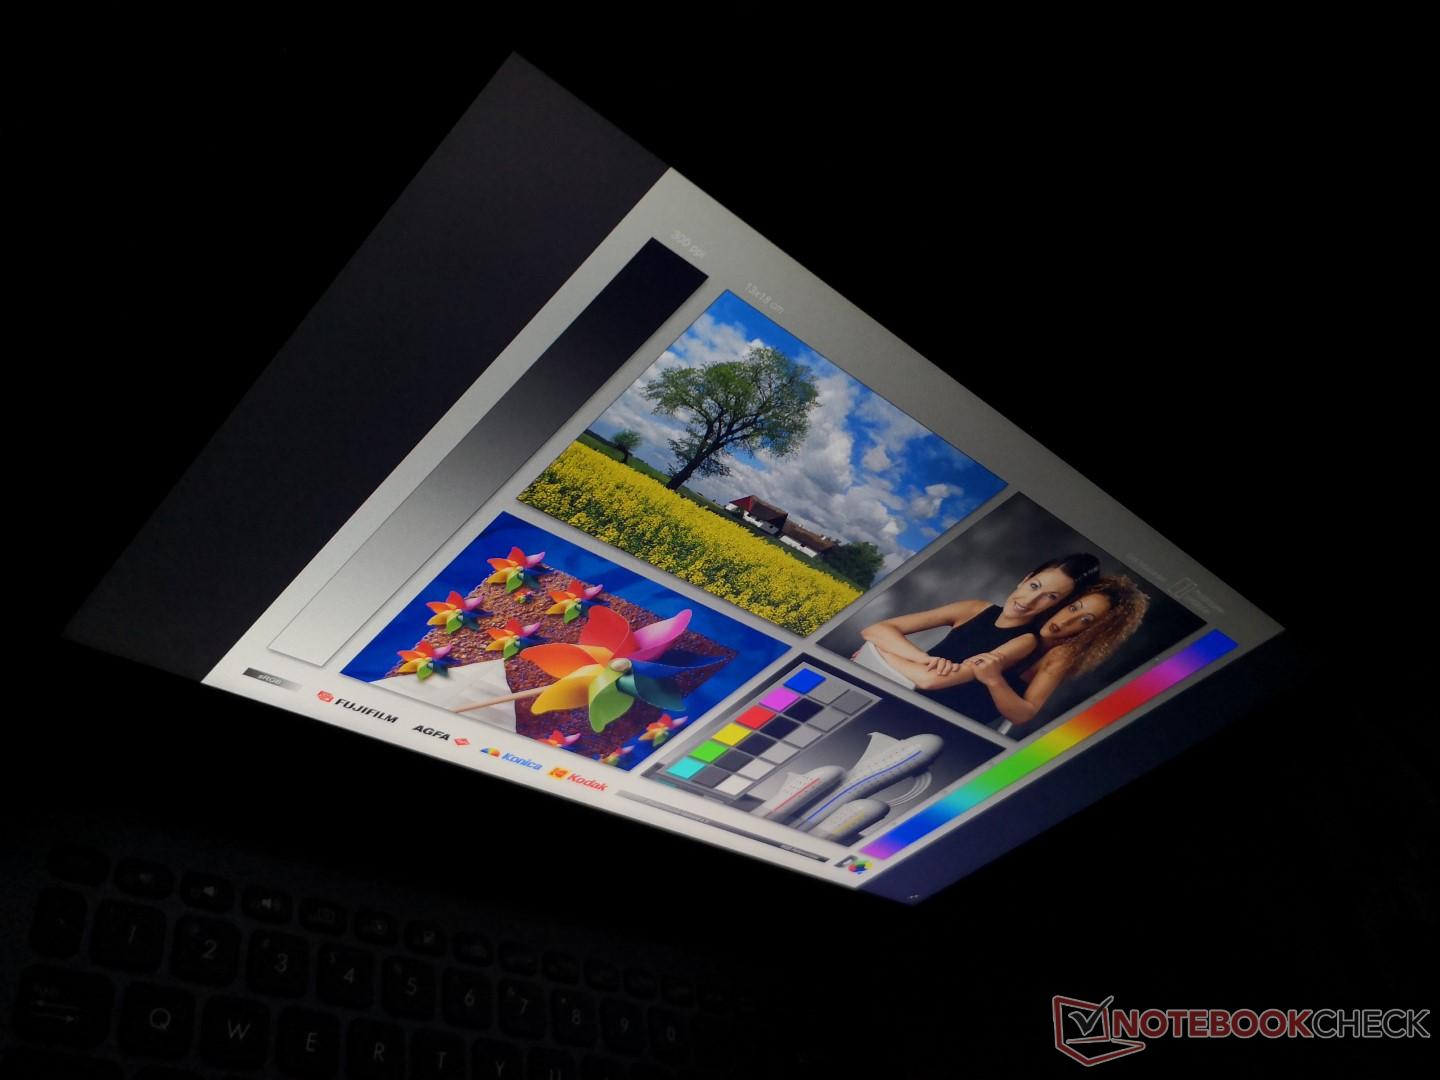
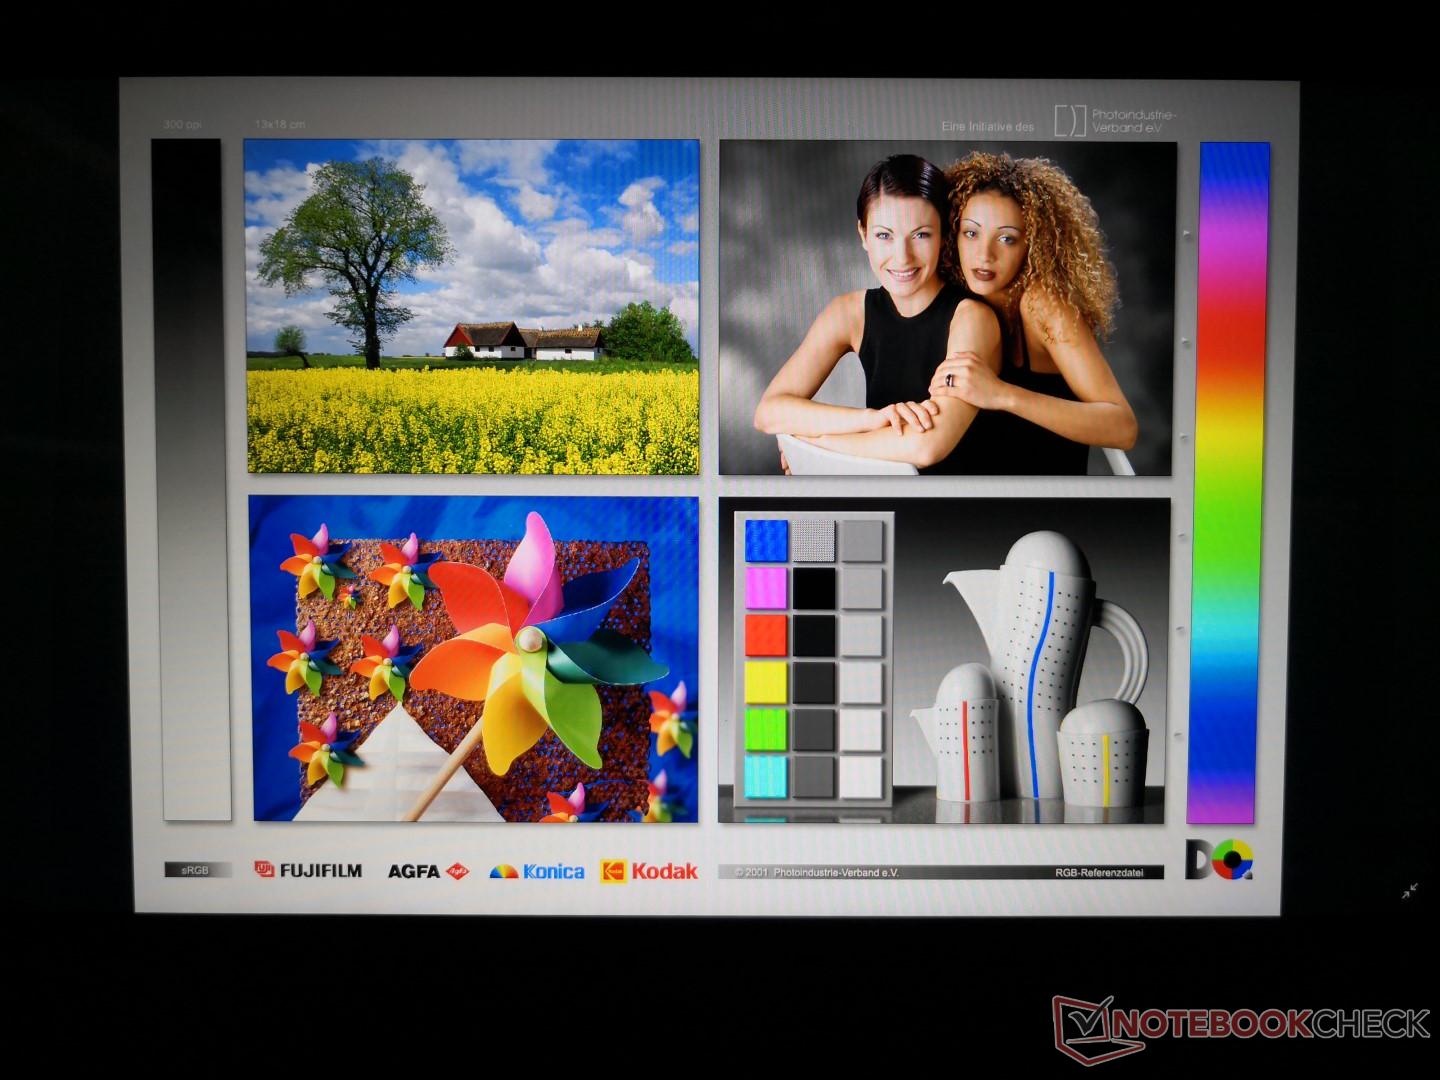
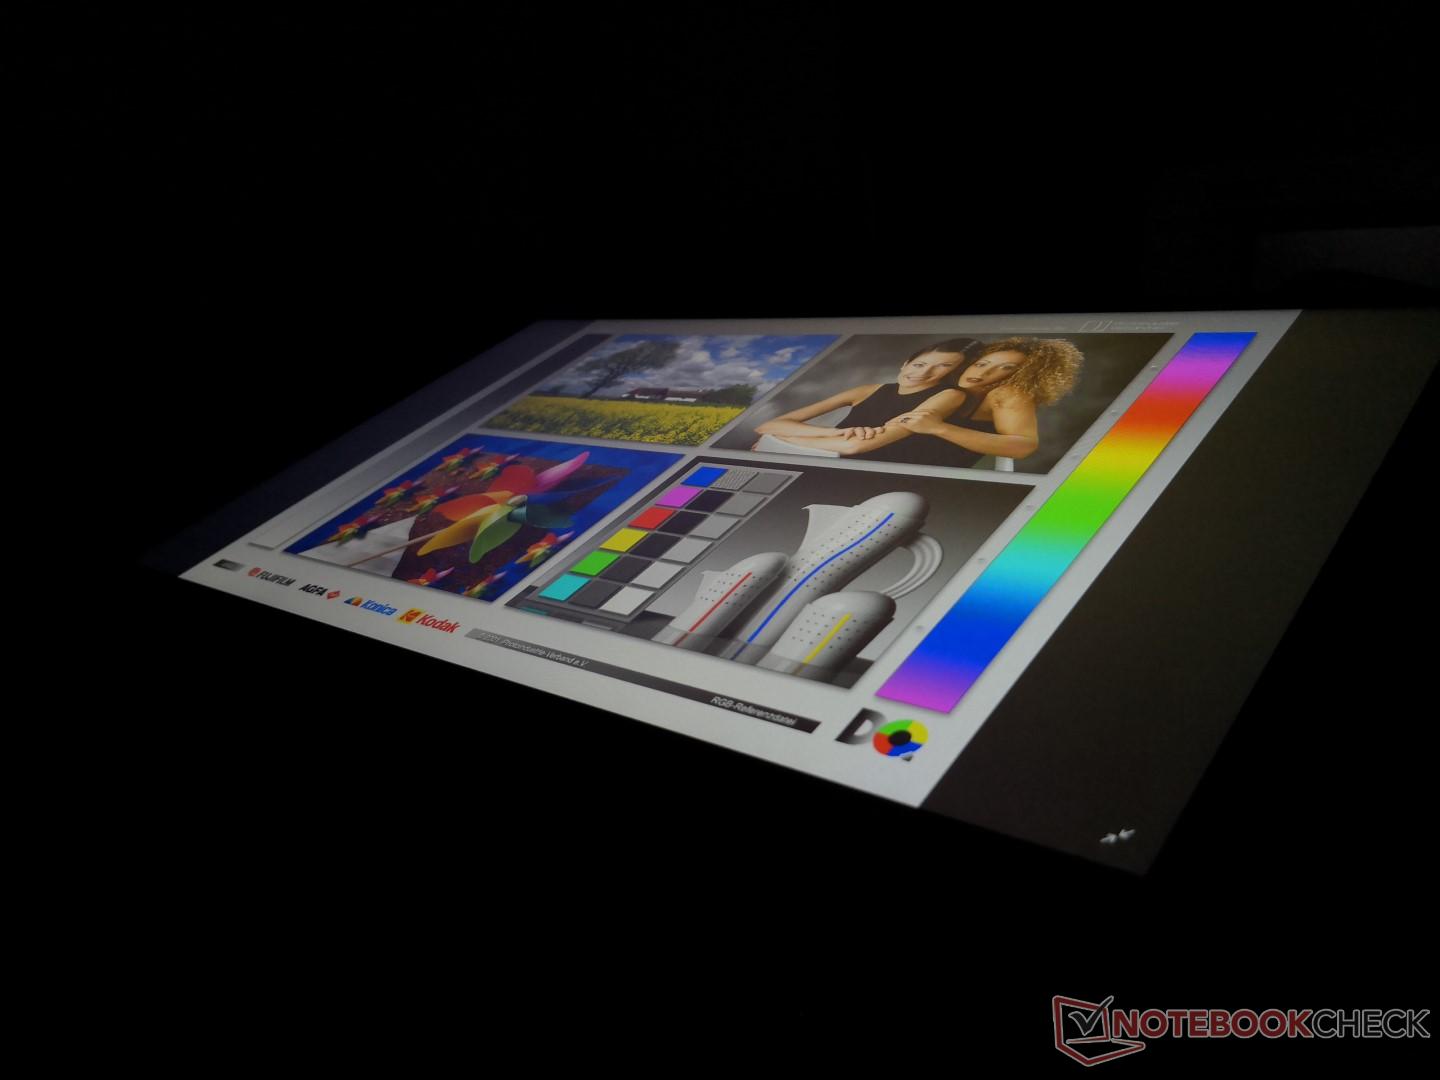
Outdoor visibility is poor despite the flexible 2-in-1 design. The dim display and glossy backlight only accentuate glare. Viewing angles are otherwise very wide with no major color shifting as one would expect from an IPS panel.
Performance
Current SKUs can be configured with a Core i3-8130U, i5-8250U, or i7-8550U while the integrated Intel GPU remains fixed. These ULV CPUs cater to light office or home users where word processing, browsing, streaming, and multi-tasking take priority. Performance users or video editors may want to consider laptops with more powerful Intel Core H-class CPUs such as the Zenbook Pro 15 series.
Processor
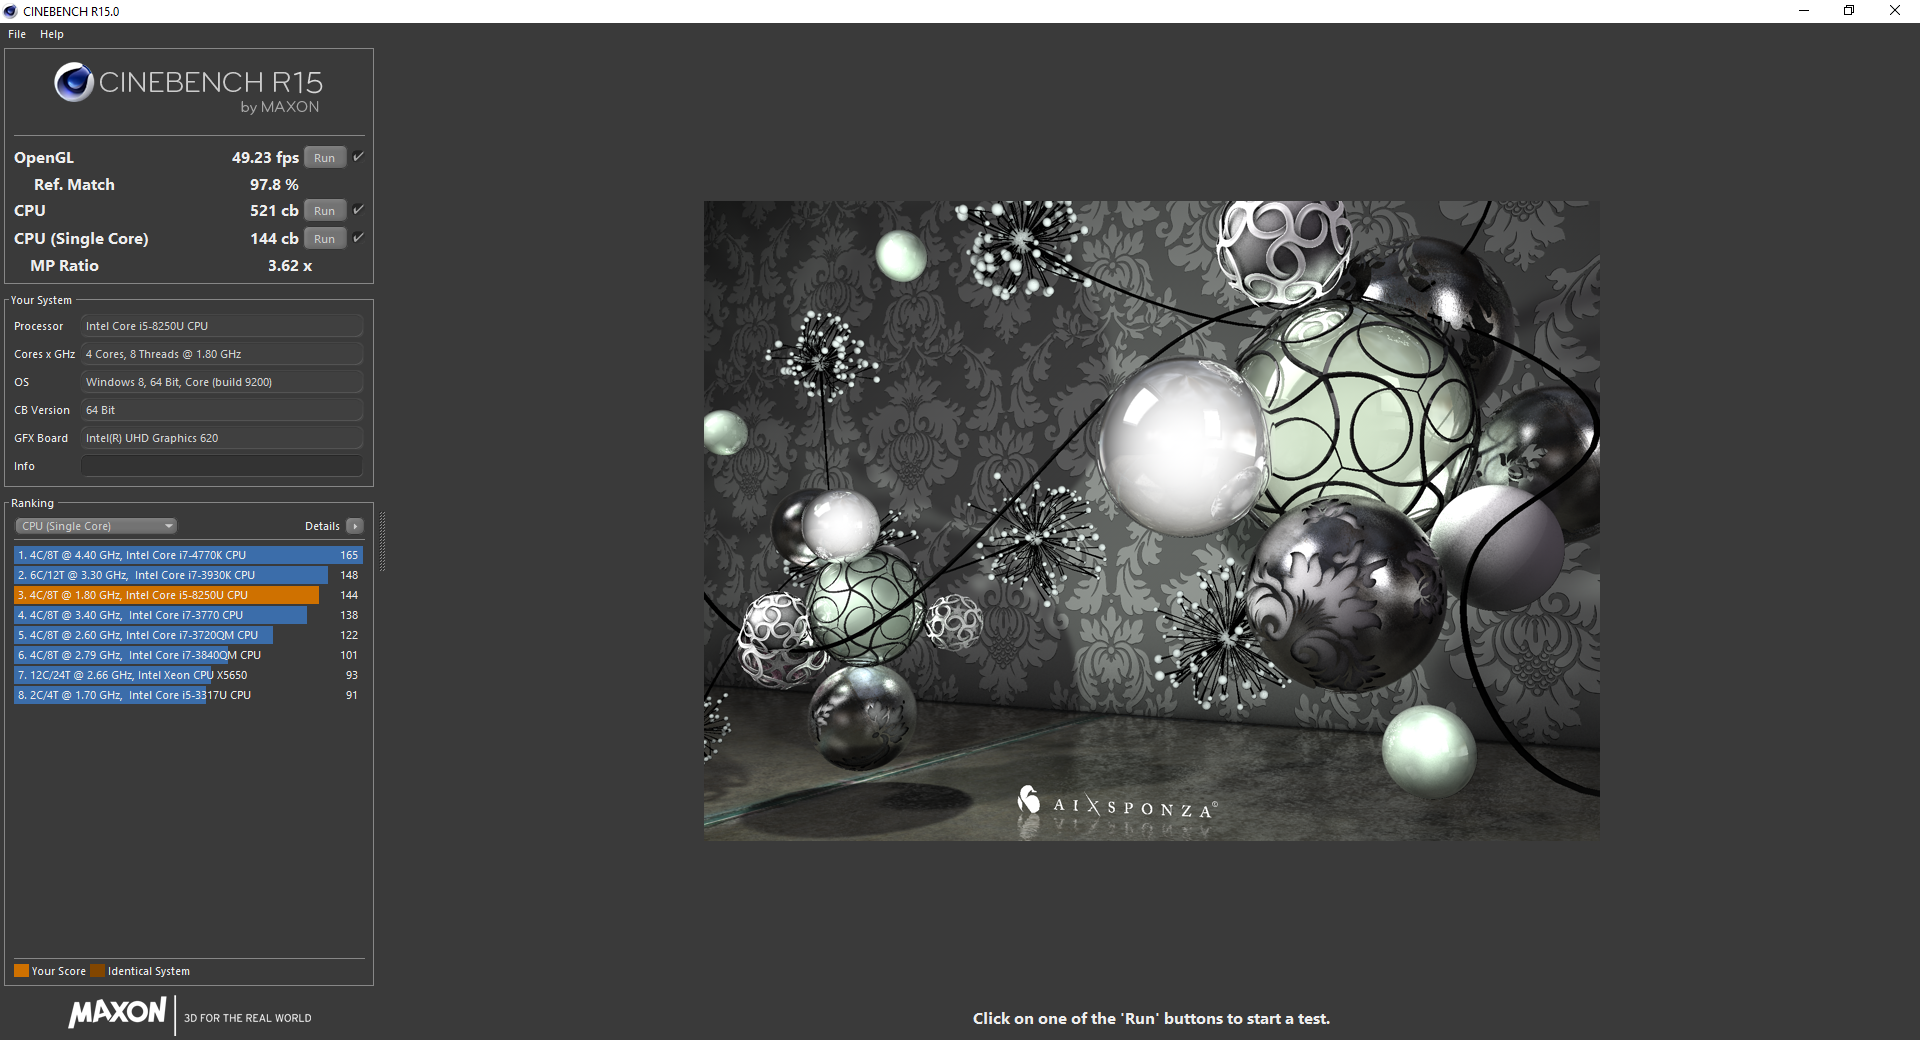
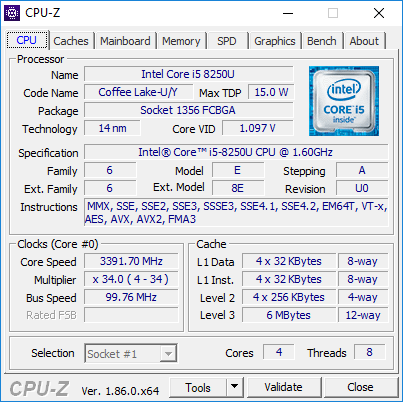
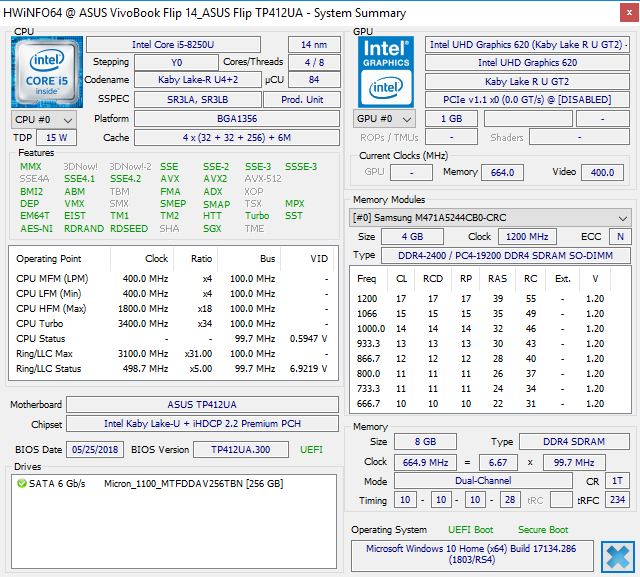
CPU performance is where we expect it to be for a Core i5-8250U. The Kaby Lake-R processor is roughly 60 percent faster than the Kaby Lake Core i5-7200U in last year's TP410 for a performance level very similar to the Core i5-7300HQ. Users upgrading from the Core i3-8130U option should see a notable performance boost of about 54 percent.
Running CineBench R15 Multi-Thread in a loop reveals a performance drop of only 7 percent over time. This suggests that the system is unable to maintain maximum Turbo Boost clock rates indefinitely when under very high stress. Such a behavior is not unexpected from super-thin laptops.
See our dedicated page on the Core i5-8250U for more technical information and benchmark comparisons.
System Performance
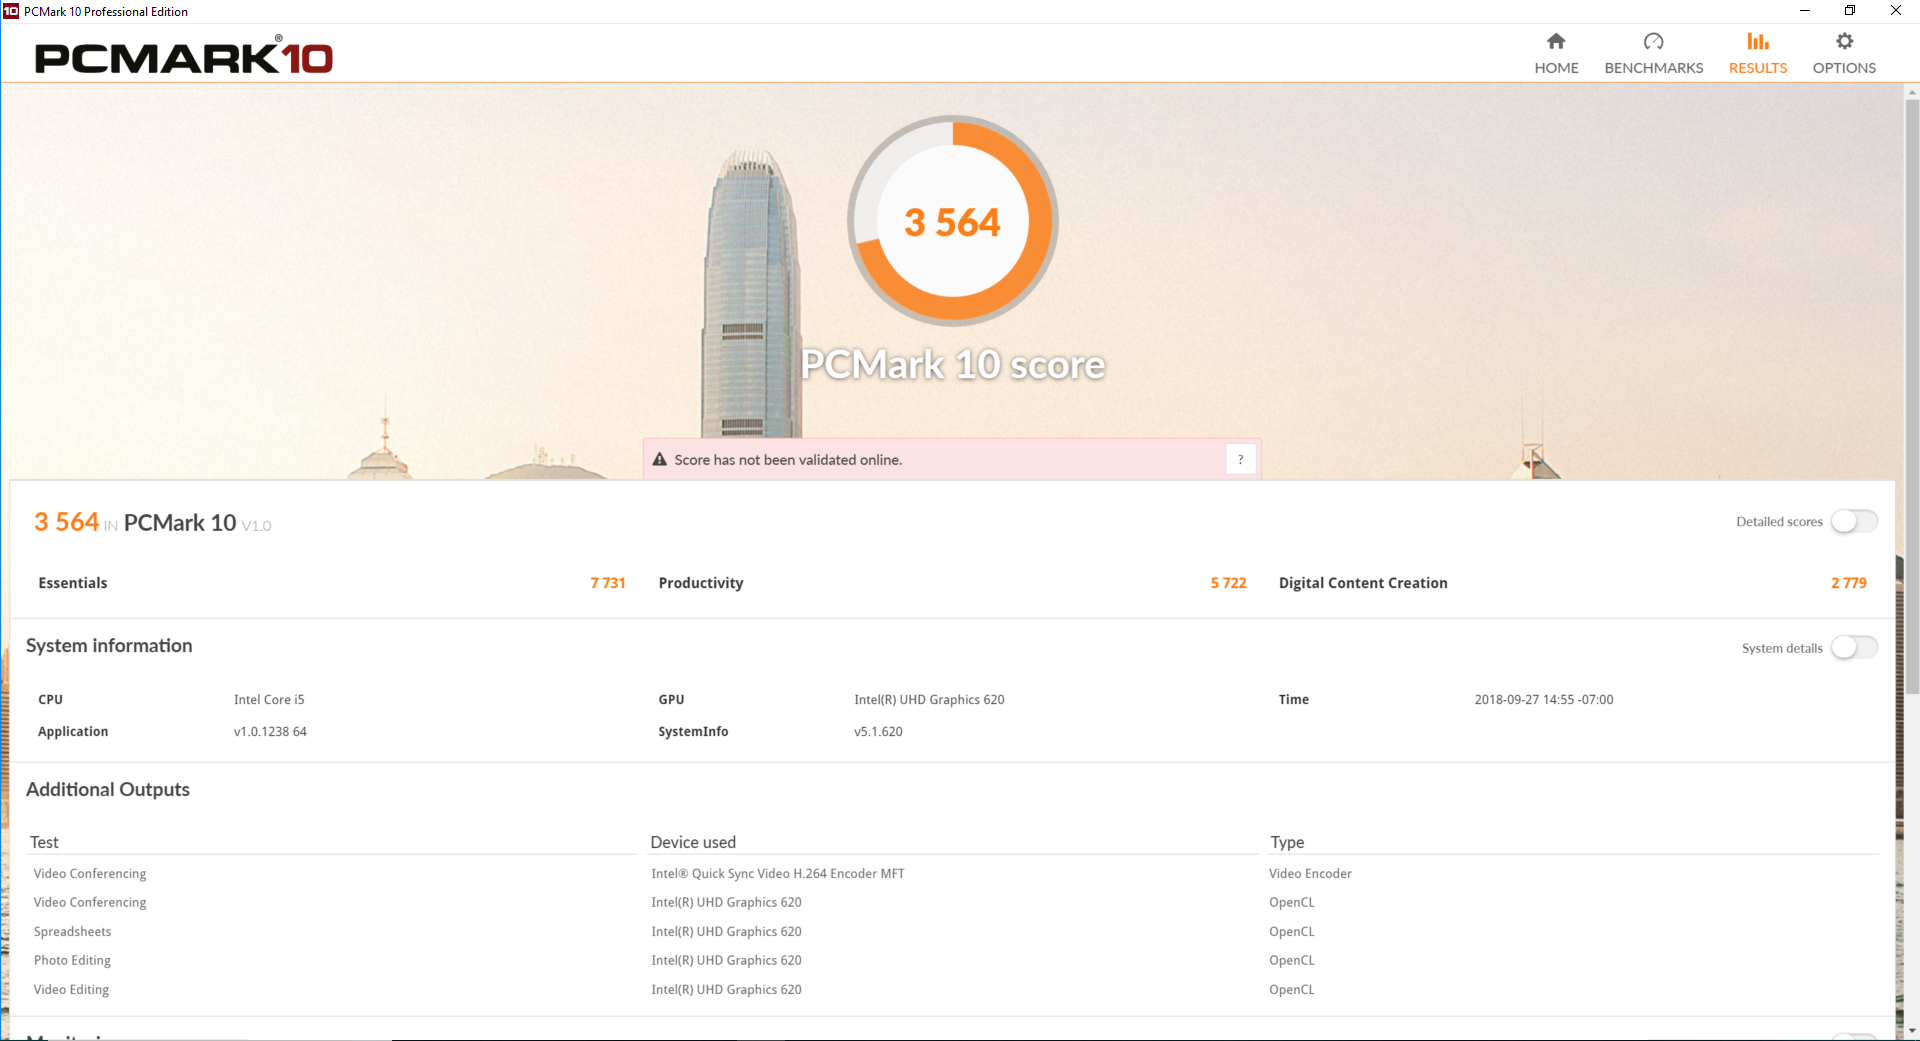
Our PCMark 10 score is 16 percent higher than the last generation TP410 to indicate a small year-over-year performance boost. Pricier and more powerful convertibles, such as the Yoga 920, will still outperform the TP412.
Our test unit suffers from sleep and wake issues. When setting the system to sleep, it would always reboot instead of waking up properly. There appears to be no update to address the issue at the time of writing.
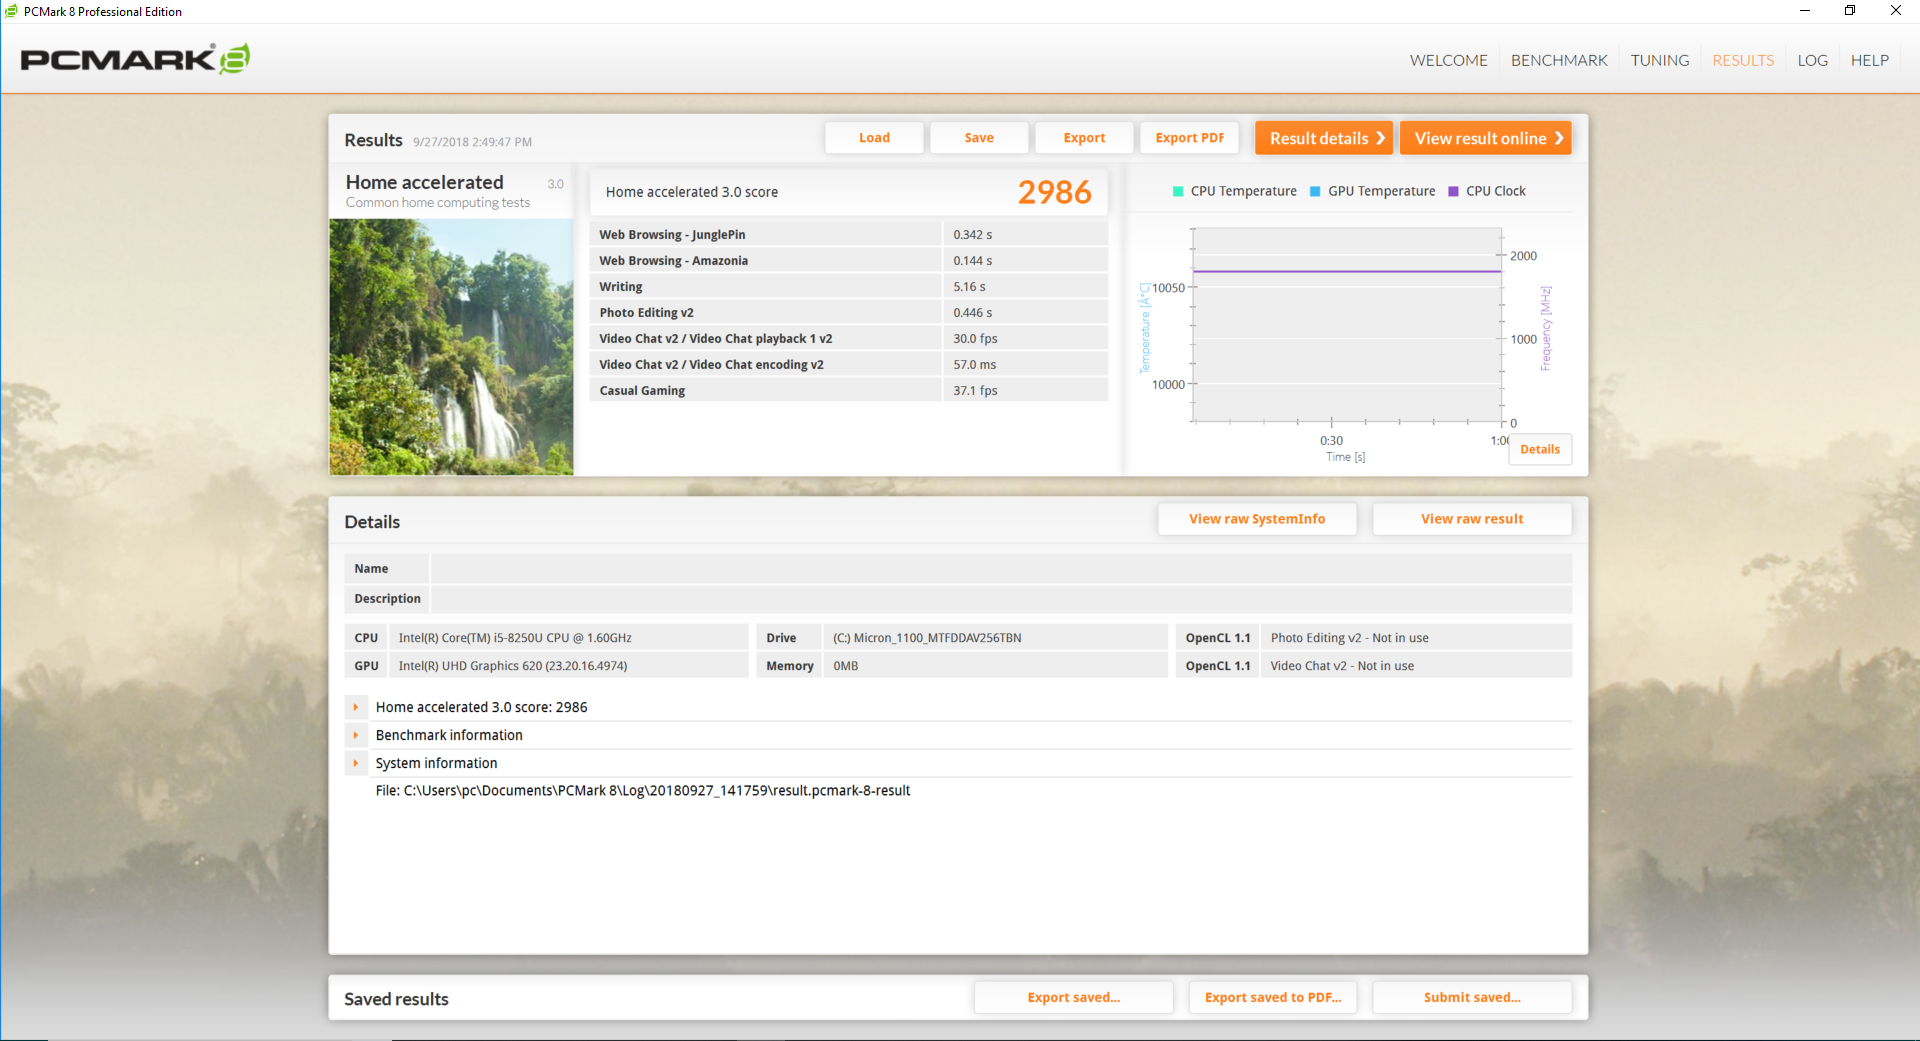
| PCMark 8 Home Score Accelerated v2 | 2986 points | |
| PCMark 10 Score | 3564 points | |
Help | ||
Storage Devices
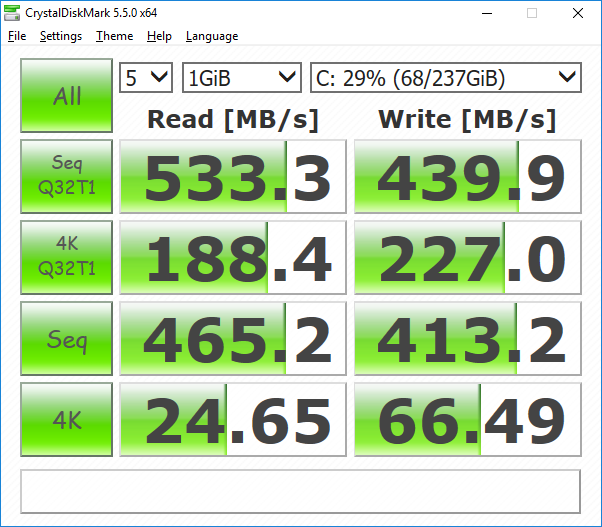
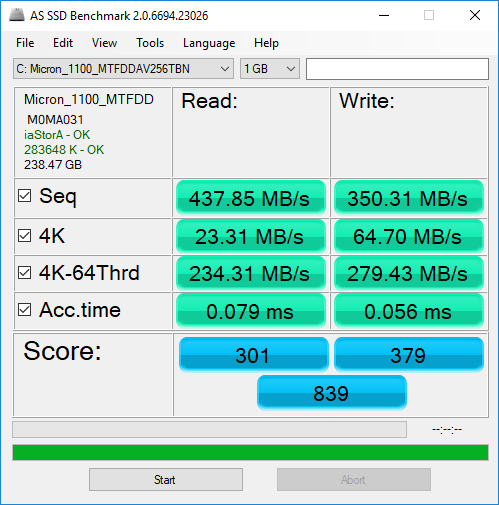
Whereas the TP410 had two internal drive options (M.2 + 2.5-inch SATA III), the TP412 has only a single M.2 drive. The 256 GB Micron 1100 MTFDDAV256TBN drive in our test system is average for a SATA III SSD if not slightly slower in sequential read and write rates.
See our table of HDDs and SSDs for more benchmark comparisons.
| Asus VivoBook Flip 14 TP412UA-DB51T Micron 1100 MTFDDAV256TBN | Lenovo Yoga 920-13IKB-80Y7 Samsung PM961 MZVLW256HEHP | Asus VivoBook Flip 14 TP410UA-EC242T SK Hynix HFS256G39TND-N210A | HP Spectre x360 15-ch000 Toshiba XG5-P KXG50PNV2T04 | Lenovo Yoga 520-14IKB 80X80097GE Intel SSD 600p SSDPEKKW256G7 | |
|---|---|---|---|---|---|
| AS SSD | 150% | -29% | 162% | 51% | |
| Copy Game MB/s (MB/s) | 354 | 319.2 -10% | 183.5 -48% | 698 97% | 425.7 20% |
| Copy Program MB/s (MB/s) | 364.3 | 463.3 27% | 120.9 -67% | 463.7 27% | 227.4 -38% |
| Copy ISO MB/s (MB/s) | 414.4 | 1341 224% | 241.6 -42% | 1674 304% | 579 40% |
| Score Total (Points) | 839 | 2536 202% | 1005 20% | 2720 224% | 1312 56% |
| Score Write (Points) | 379 | 608 60% | 323 -15% | 1145 202% | 662 75% |
| Score Read (Points) | 301 | 1316 337% | 453 50% | 1087 261% | 449 49% |
| Access Time Write * (ms) | 0.056 | 0.028 50% | 0.226 -304% | 0.065 -16% | 0.033 41% |
| Access Time Read * (ms) | 0.079 | 0.044 44% | 0.118 -49% | 0.047 41% | 0.092 -16% |
| 4K-64 Write (MB/s) | 279.4 | 391.3 40% | 230.2 -18% | 950 240% | 495.4 77% |
| 4K-64 Read (MB/s) | 234.3 | 1039 343% | 375.3 60% | 840 259% | 279.3 19% |
| 4K Write (MB/s) | 64.7 | 128.1 98% | 68.3 6% | 96.9 50% | 110.2 70% |
| 4K Read (MB/s) | 23.31 | 48.46 108% | 28.07 20% | 20.21 -13% | 33.13 42% |
| Seq Write (MB/s) | 350.3 | 885 153% | 248.8 -29% | 980 180% | 561 60% |
| Seq Read (MB/s) | 437.9 | 2282 421% | 499.7 14% | 2269 418% | 1367 212% |
* ... smaller is better

GPU Performance
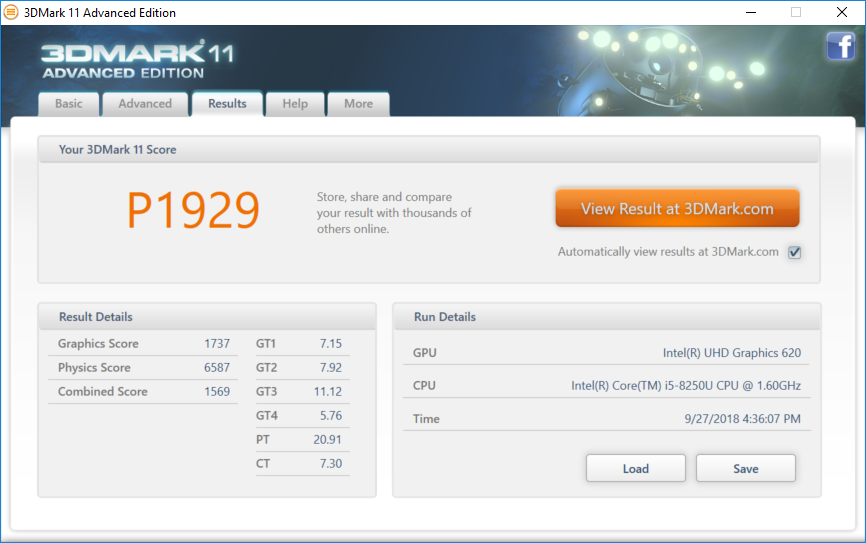
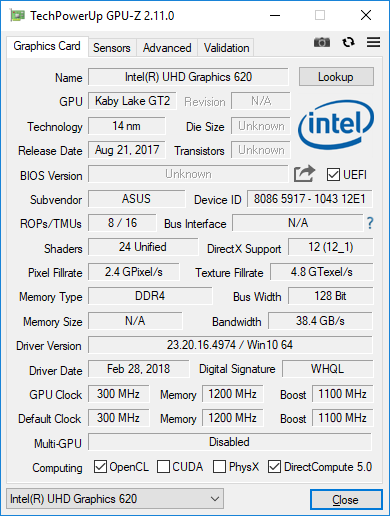
The integrated UHD Graphics 620 holds no surprises as it very common amongst laptops less than two years old. Raw GPU power is about 22 percent higher than the HD Graphics 620 in last year's TP410 and almost 35 percent slower than the old GeForce 940MX. In practical terms, GPU performance is still lackluster for anything more demanding than streaming or light gaming.
See our dedicated page on the UHD Graphics 620 for more technical information and benchmark comparisons.
| 3DMark 11 Performance | 1929 points | |
Help | ||
| low | med. | high | ultra | |
|---|---|---|---|---|
| BioShock Infinite (2013) | 63.8 | 34.3 | 29.1 | 9.7 |
Stress Test
We stress the notebook with synthetic loads to identify for any potential throttling or stability issues. When running Prime95, the CPU can be observed operating at 3.2 GHz for the first few seconds until reaching a core temperature of 95 C. Thereafter, clock rates quickly drop to a stable 2.3 GHz in order to maintain a cooler core temperature of 73 C as shown by our screenshots below. When considering that the base clock rate of the Core i5-8250U is 1.6 GHz, the system's ability to maintain a +700 MHz Turbo Boost is admirable. Running both Prime95 and FurMark simultaneously will throttle performance even further.
Running on battery power will not impact CPU or GPU performance. A 3DMark 11 run on batteries returns Physics and Graphics scores that are within just 1 percent of the scores when running on mains.
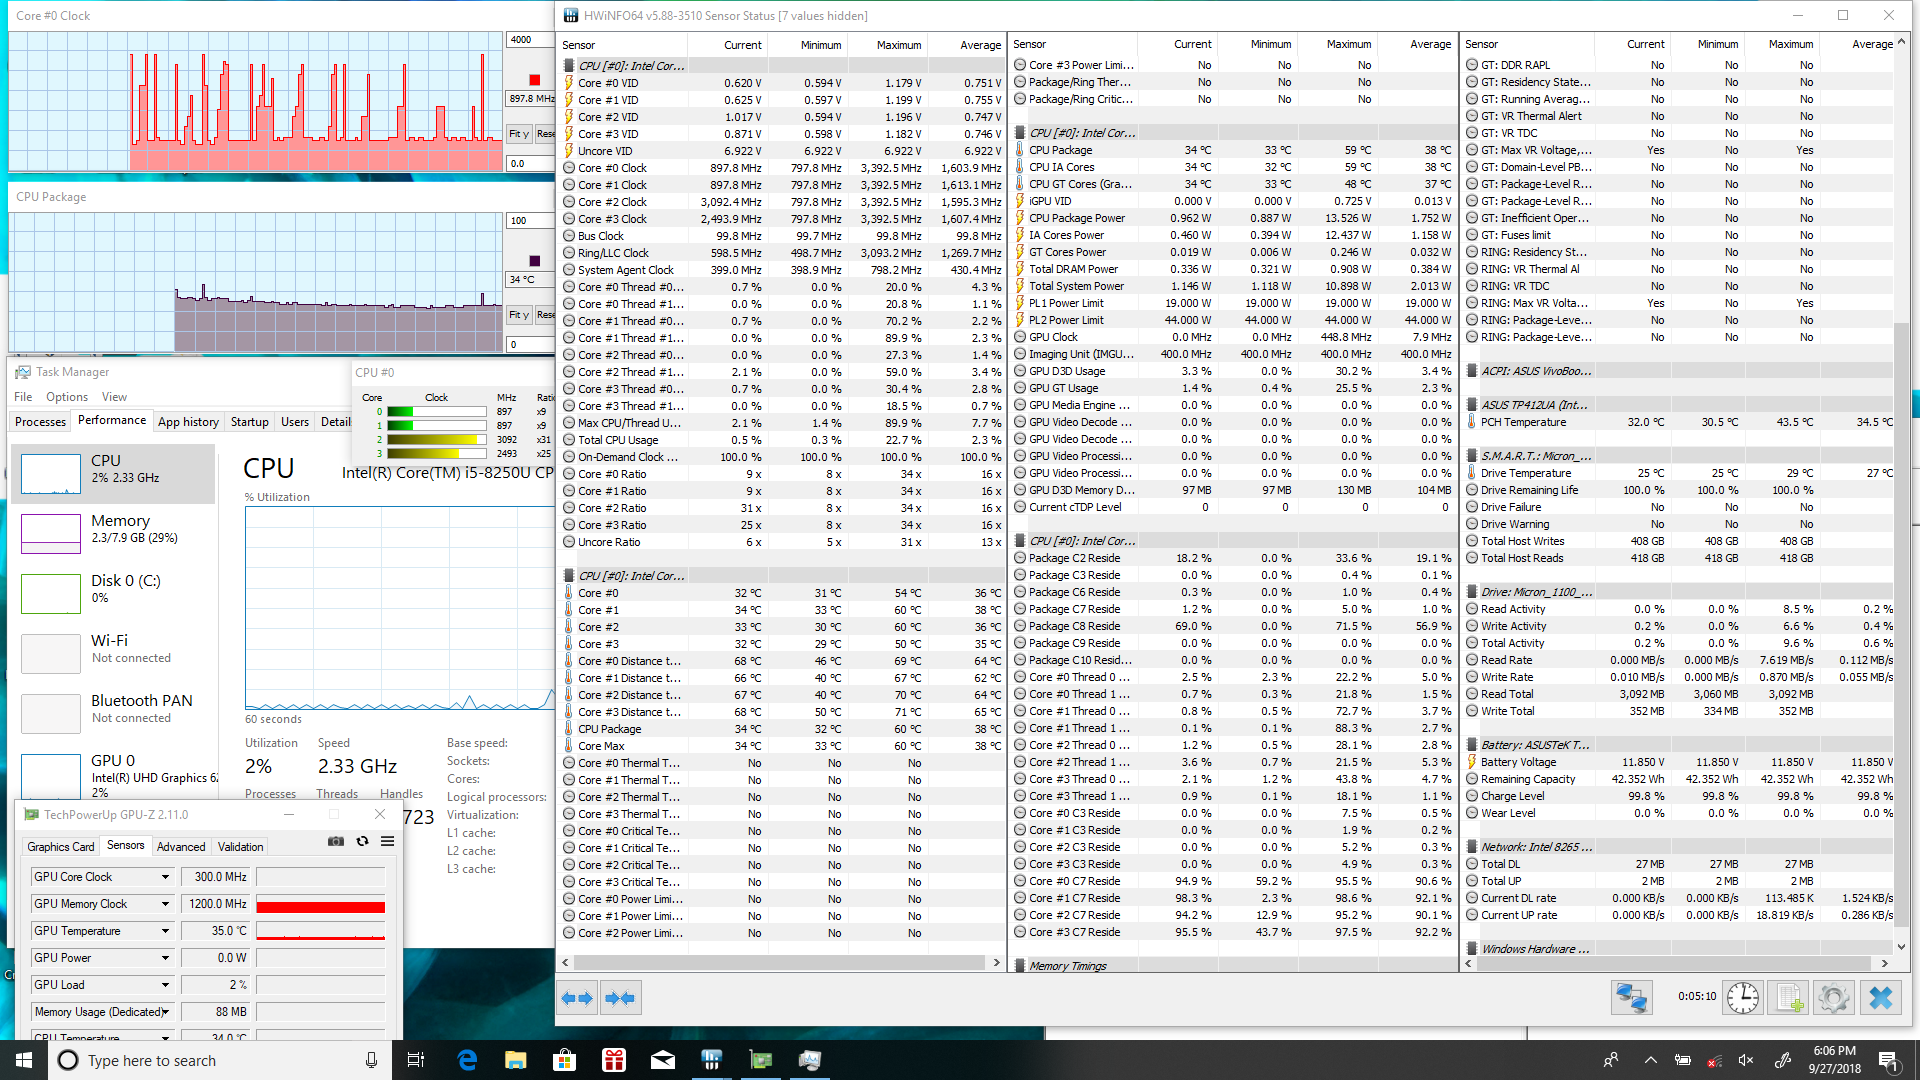
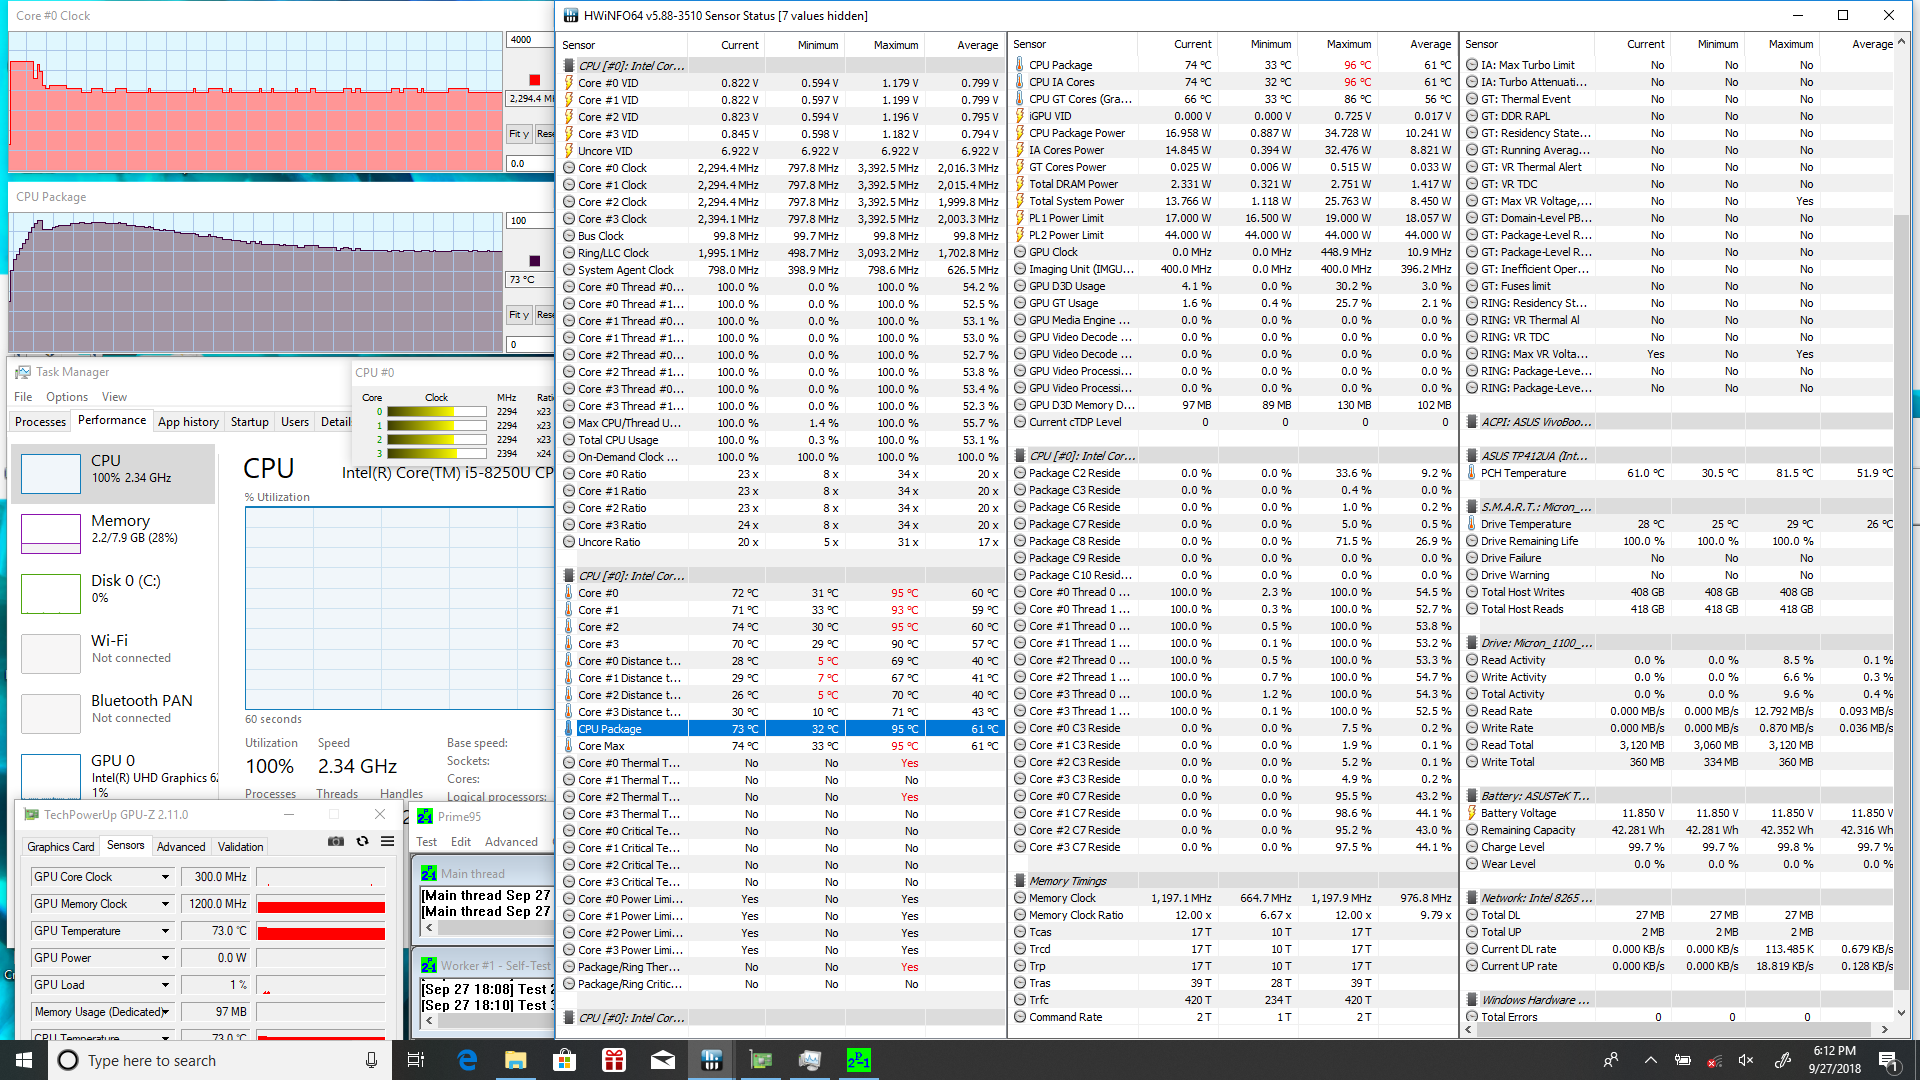
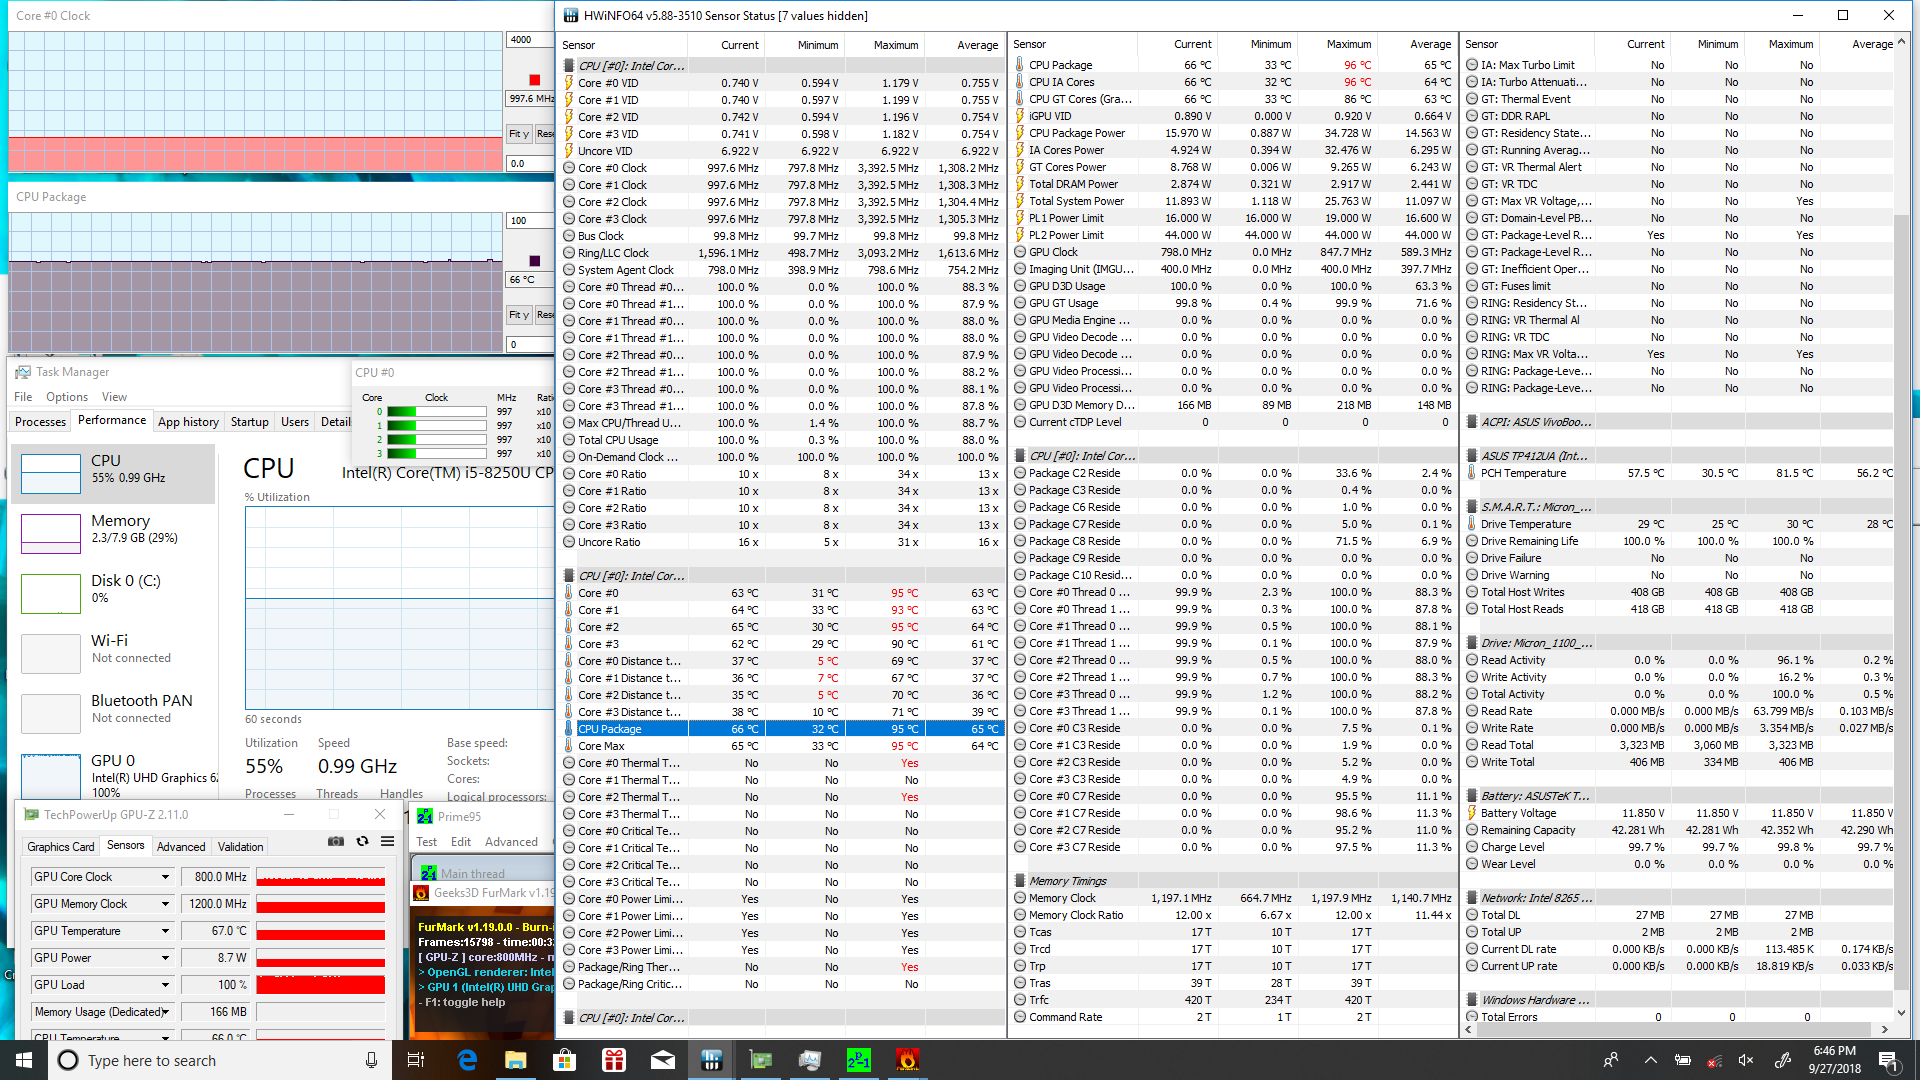
| CPU Clock (GHz) | GPU Clock (MHz) | Average CPU Temperature (°C) | |
| System Idle | -- | -- | 34 |
| Prime95 Stress | 2.3 | -- | 73 |
| Prime95 + FurMark Stress | 1.0 | 800 | 66 |
Emissions
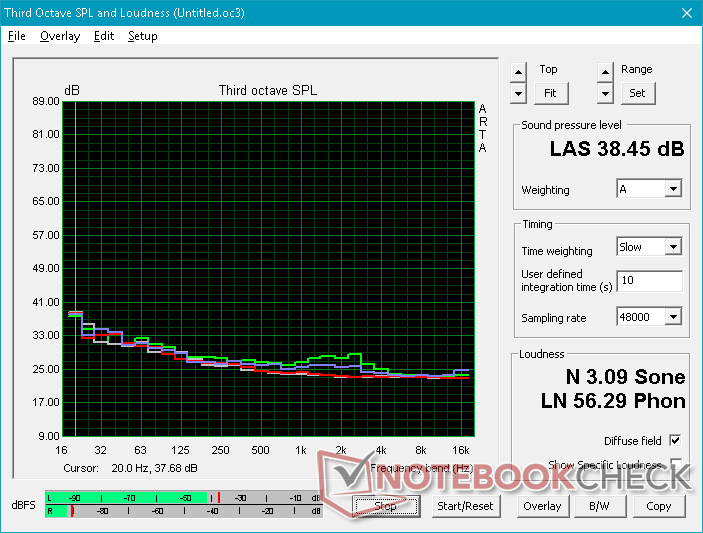
System Noise
The system fan is always active no matter the onscreen load. When idling on desktop, however, fan noise is so low that our microphone cannot detect it 15 cm away; you'd have to place an ear on the keyboard to hear the slight whir. The system is essentially silent when word processing or streaming.
Higher loads like gaming may induce a fan noise of 35 dB(A) to 39 dB(A) not unlike on the TP410.
Noise level
| Idle |
| 28.4 / 28.4 / 28.4 dB(A) |
| Load |
| 35.7 / 39 dB(A) |
 | ||
30 dB silent 40 dB(A) audible 50 dB(A) loud |
||
min: | ||
| Asus VivoBook Flip 14 TP412UA-DB51T UHD Graphics 620, i5-8250U, Micron 1100 MTFDDAV256TBN | Lenovo Yoga 920-13IKB-80Y7 UHD Graphics 620, i5-8550U, Samsung PM961 MZVLW256HEHP | Dell XPS 15 9570 i7 UHD GeForce GTX 1050 Ti Max-Q, i7-8750H, Toshiba XG5 KXG50ZNV512G | Asus VivoBook Flip 14 TP410UA-EC242T HD Graphics 620, i5-7200U, SK Hynix HFS256G39TND-N210A | HP Spectre x360 15-ch000 Vega M GL / 870, i7-8705G, Toshiba XG5-P KXG50PNV2T04 | Lenovo Yoga 530-14IKB-81EK00CWGE UHD Graphics 620, i5-8250U, SK hynix PC401 HFS256GD9TNG | |
|---|---|---|---|---|---|---|
| Noise | 2% | -5% | -6% | -5% | -3% | |
| off / environment * (dB) | 28.4 | 28 1% | 29.9 -5% | 30.3 -7% | 28.1 1% | 30.3 -7% |
| Idle Minimum * (dB) | 28.4 | 28 1% | 29.9 -5% | 31.2 -10% | 30.8 -8% | 30.3 -7% |
| Idle Average * (dB) | 28.4 | 28.8 -1% | 29.9 -5% | 31.2 -10% | 30.9 -9% | 30.3 -7% |
| Idle Maximum * (dB) | 28.4 | 30.3 -7% | 30.3 -7% | 31.2 -10% | 30.9 -9% | 30.3 -7% |
| Load Average * (dB) | 35.7 | 34.5 3% | 36.5 -2% | 36.2 -1% | 31.8 11% | 36.1 -1% |
| Load Maximum * (dB) | 39 | 34.3 12% | 40.4 -4% | 38.3 2% | 44.2 -13% | 33.9 13% |
| Witcher 3 ultra * (dB) | 40.4 | 48.1 |
* ... smaller is better
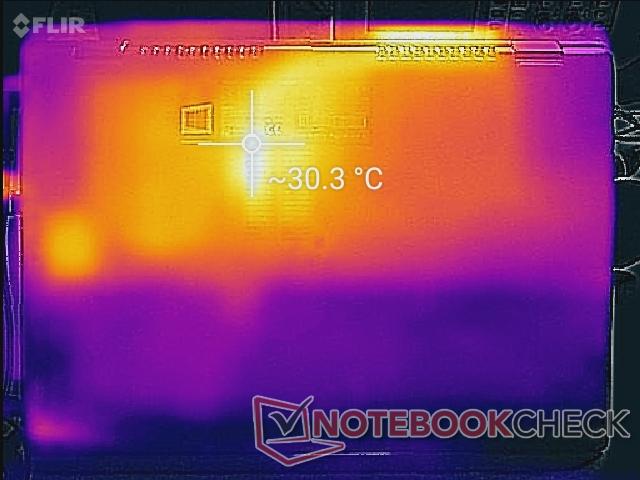
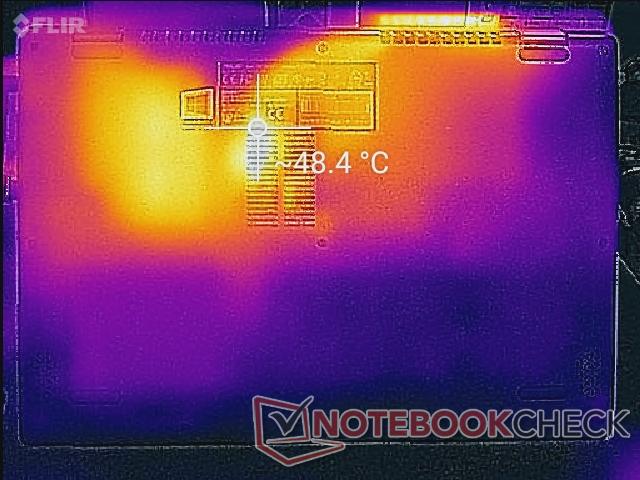
Temperature
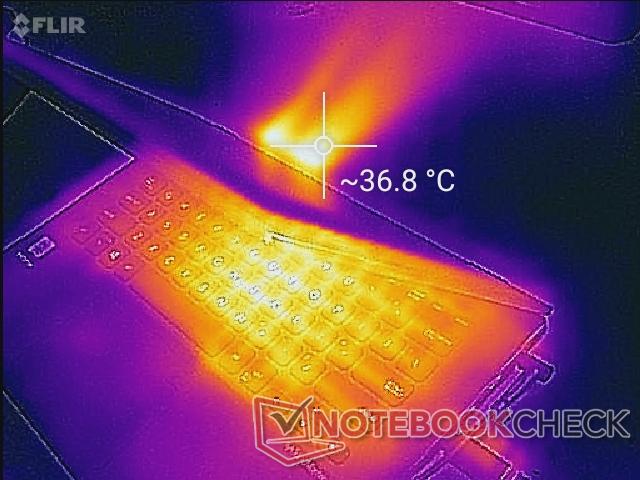
Surface temperatures are warmest near the center of the notebook due to the positioning of the processor and heat sink underneath. When under very high loads, the top and bottom hot spots can become as warm as 37 C and 48 C, respectively. The system never becomes uncomfortably warm when streaming or word processing, but take care to not cover the small ventilation grilles along the bottom.
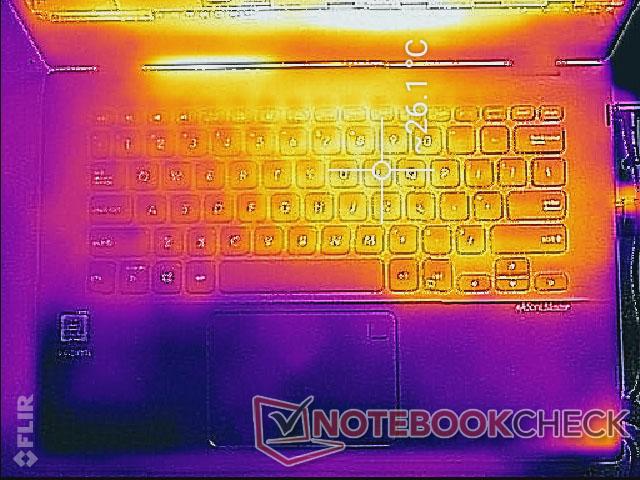
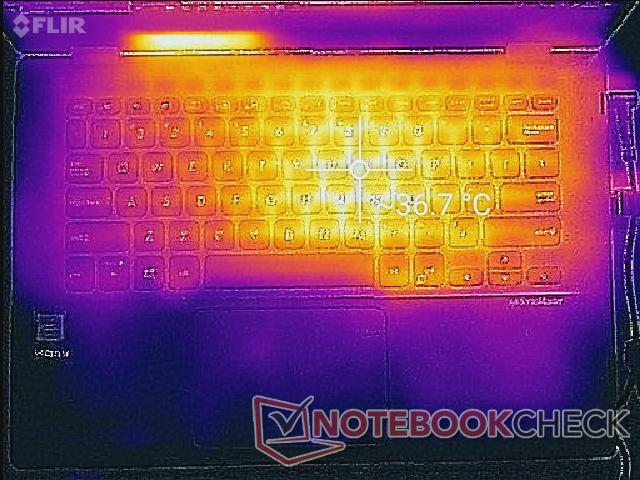
(+) The maximum temperature on the upper side is 36.6 °C / 98 F, compared to the average of 35.4 °C / 96 F, ranging from 19.6 to 60 °C for the class Convertible.
(-) The bottom heats up to a maximum of 49.4 °C / 121 F, compared to the average of 36.9 °C / 98 F
(+) In idle usage, the average temperature for the upper side is 24 °C / 75 F, compared to the device average of 30.3 °C / 87 F.
(+) The palmrests and touchpad are cooler than skin temperature with a maximum of 22.2 °C / 72 F and are therefore cool to the touch.
(+) The average temperature of the palmrest area of similar devices was 28 °C / 82.4 F (+5.8 °C / 10.4 F).
Speakers
The stereo speakers are surprisingly loud for the size with no static and minimal chassis reverberation. Bass is weak and earphones are recommended for video or music playback.


Asus VivoBook Flip 14 TP412UA-DB51T audio analysis
(±) | speaker loudness is average but good (77 dB)
Bass 100 - 315 Hz
(-) | nearly no bass - on average 18.2% lower than median
(±) | linearity of bass is average (12.3% delta to prev. frequency)
Mids 400 - 2000 Hz
(+) | balanced mids - only 3.2% away from median
(+) | mids are linear (6.4% delta to prev. frequency)
Highs 2 - 16 kHz
(+) | balanced highs - only 4.6% away from median
(+) | highs are linear (5.6% delta to prev. frequency)
Overall 100 - 16.000 Hz
(±) | linearity of overall sound is average (18.4% difference to median)
Compared to same class
» 41% of all tested devices in this class were better, 7% similar, 52% worse
» The best had a delta of 6%, average was 20%, worst was 57%
Compared to all devices tested
» 41% of all tested devices were better, 8% similar, 51% worse
» The best had a delta of 4%, average was 23%, worst was 134%
Apple MacBook 12 (Early 2016) 1.1 GHz audio analysis
(+) | speakers can play relatively loud (83.6 dB)
Bass 100 - 315 Hz
(±) | reduced bass - on average 11.3% lower than median
(±) | linearity of bass is average (14.2% delta to prev. frequency)
Mids 400 - 2000 Hz
(+) | balanced mids - only 2.4% away from median
(+) | mids are linear (5.5% delta to prev. frequency)
Highs 2 - 16 kHz
(+) | balanced highs - only 2% away from median
(+) | highs are linear (4.5% delta to prev. frequency)
Overall 100 - 16.000 Hz
(+) | overall sound is linear (10.2% difference to median)
Compared to same class
» 7% of all tested devices in this class were better, 2% similar, 91% worse
» The best had a delta of 5%, average was 18%, worst was 53%
Compared to all devices tested
» 5% of all tested devices were better, 1% similar, 94% worse
» The best had a delta of 4%, average was 23%, worst was 134%
Energy Management
Power Consumption
When idling, the TP412 is more efficient than the TP410 which could explain its longer battery life in the next section. Otherwise, consumption is similar to other Ultrabooks with the same Core i5-8250U or i7-8550U CPU.
The very small (~5.2 x 5.2 x 2.8 cm) 45 W AC adapter is sufficient for the power profile of the system.
| Off / Standby | |
| Idle | |
| Load |
|
Key:
min: | |
| Asus VivoBook Flip 14 TP412UA-DB51T i5-8250U, UHD Graphics 620, Micron 1100 MTFDDAV256TBN, IPS, 1920x1080, 14" | Lenovo Yoga 920-13IKB-80Y7 i5-8550U, UHD Graphics 620, Samsung PM961 MZVLW256HEHP, IPS, 1920x1080, 13.9" | Dell XPS 15 9570 i7 UHD i7-8750H, GeForce GTX 1050 Ti Max-Q, Toshiba XG5 KXG50ZNV512G, IPS, 3840x2160, 15.6" | Asus VivoBook Flip 14 TP410UA-EC242T i5-7200U, HD Graphics 620, SK Hynix HFS256G39TND-N210A, IPS, 1920x1080, 14" | HP Spectre x360 15-ch000 i7-8705G, Vega M GL / 870, Toshiba XG5-P KXG50PNV2T04, IPS, 3840x2160, 15.6" | Lenovo Yoga 530-14IKB-81EK00CWGE i5-8250U, UHD Graphics 620, SK hynix PC401 HFS256GD9TNG, IPS, 1920x1080, 14" | |
|---|---|---|---|---|---|---|
| Power Consumption | -10% | -211% | -24% | -207% | -6% | |
| Idle Minimum * (Watt) | 3.3 | 3.1 6% | 9.48 -187% | 3.9 -18% | 11.7 -255% | 3.3 -0% |
| Idle Average * (Watt) | 5.2 | 6.6 -27% | 16.1 -210% | 7 -35% | 16.8 -223% | 5.8 -12% |
| Idle Maximum * (Watt) | 5.6 | 7 -25% | 16.9 -202% | 9.3 -66% | 18.9 -238% | 8 -43% |
| Load Average * (Watt) | 32.9 | 35.2 -7% | 90.8 -176% | 35 -6% | 82.3 -150% | 29.2 11% |
| Load Maximum * (Watt) | 35.2 | 34.6 2% | 134.4 -282% | 33 6% | 94.9 -170% | 31.1 12% |
| Witcher 3 ultra * (Watt) | 87.2 |
* ... smaller is better
Battery Life
Battery capacity has not increased from last year's TP410. Despite this, runtimes are now much longer by over two hours when subjected to the same WLAN loads. A reduction in background activity could be a likely culprit.
Charging from near empty to full capacity takes a little over two hours.
| Asus VivoBook Flip 14 TP412UA-DB51T i5-8250U, UHD Graphics 620, 42 Wh | Lenovo Yoga 920-13IKB-80Y7 i5-8550U, UHD Graphics 620, 70 Wh | Dell XPS 15 9570 i7 UHD i7-8750H, GeForce GTX 1050 Ti Max-Q, 97 Wh | Asus VivoBook Flip 14 TP410UA-EC242T i5-7200U, HD Graphics 620, 42 Wh | HP Spectre x360 15-ch000 i7-8705G, Vega M GL / 870, 84 Wh | Lenovo Yoga 530-14IKB-81EK00CWGE i5-8250U, UHD Graphics 620, 45 Wh | |
|---|---|---|---|---|---|---|
| Battery runtime | 19% | 0% | -29% | -41% | -27% | |
| WiFi v1.3 (h) | 9.6 | 11.4 19% | 9.6 0% | 6.8 -29% | 5.7 -41% | 7 -27% |
| Reader / Idle (h) | 27.6 | 9 | 15.3 | |||
| Load (h) | 2.3 | 1.3 | 1.1 | 1.8 | ||
| Witcher 3 ultra (h) | 1 |
Pros
Cons
Verdict
The 2018 VivoBook Flip TP412 is both a few steps forward and a few steps back compared to its immediate predecessor. Its Kaby Lake-R update is indubitably faster while being thinner, lighter, and longer-lasting for a more attractive package overall. Unfortunately, its display is dimmer, its gamut is narrower, and it's missing the secondary 2.5-inch SATA bay that was present on the TP410.
For a retail price of $700 to $800, the TP412 is a compelling 14-inch convertible without any of the fancy features of pricier models. Its versatility makes it good for indoor and classroom use while its dim display makes it poorer for outdoor conditions.
Fair for the price. The VivoBook Flip TP412 doesn't offer anything above its price range to make it a must buy for mainstream users. Hopefully, future iterations will brighten up the glossy display to improve outdoor visibility.
Asus VivoBook Flip 14 TP412UA-DB51T
- 09/29/2018 v6 (old)
Allen Ngo
Price comparison
