Lenovo IdeaPad 330-15IGM (Celeron N4100) Laptop Review
The Ideapad series is home to Lenovo's budget laptops for users who may not need all the fancy features or sleek designs of flagship Ultrabooks. The Ideapad 330 in particular is the manufacturer's least expensive 15-inch offering costing less than one-third the retail price of a flagship Yoga 920 convertible.
We've already checked out the Ideapad 330 with the Ryzen 3 2200U and Ryzen 7 2700U SoCs. Since this is our third Ideapad 330 with the same chassis design, we recommend checking out our original reviews for more information on the case, keyboard, connectivity features, and more. For this review, we will instead focus on how the new Celeron N4100 performs and other minute differences between this Intel configuration compared to the aforementioned AMD options.
Case
Connectivity
Port selection and positioning are identical to the Ideapad 330 Ryzen SKUs save for a couple of changes. Firstly, the AC adapter is different and incompatible between the configurations. Secondly, this particular SKU omits USB Type-C entirely in what is likely a cost-saving measure.
SD Card Reader
The integrated SD reader is slow at only about 26 MB/s with our UHS-II test card. A fully inserted card still protrudes by over half its length. A spring-loaded reader would have been preferable for safer transporting.
| SD Card Reader | |
| average JPG Copy Test (av. of 3 runs) | |
| HP Pavilion 15-cs0053cl (Toshiba Exceria Pro SDXC 64 GB UHS-II) | |
| Asus VivoBook 15 F510UF-ES71 (Toshiba Exceria Pro SDXC 64 GB UHS-II) | |
| Lenovo IdeaPad 330-15IGM (Toshiba Exceria Pro SDXC 64 GB UHS-II) | |
| Acer Extensa 2519-P35U (Toshiba Exceria Pro SDXC 64 GB UHS-II) | |
| maximum AS SSD Seq Read Test (1GB) | |
| HP Pavilion 15-cs0053cl (Toshiba Exceria Pro SDXC 64 GB UHS-II) | |
| Asus VivoBook 15 F510UF-ES71 (Toshiba Exceria Pro SDXC 64 GB UHS-II) | |
| Acer Extensa 2519-P35U (Toshiba Exceria Pro SDXC 64 GB UHS-II) | |
| Lenovo IdeaPad 330-15IGM (Toshiba Exceria Pro SDXC 64 GB UHS-II) | |
Communication
The Intel 3165 wireless is capable of theoretical transfer rates of up to 433 Mbps whereas pricier laptops may be equipped with the Intel 8260 for double the maximum speed. We experienced no connectivity issues during our time with the test unit.
| Networking | |
| iperf3 transmit AX12 | |
| Asus VivoBook 15 F510UF-ES71 | |
| Lenovo IdeaPad 330-15IGM | |
| HP Pavilion 15-cs0053cl | |
| Acer Extensa 2519-P35U | |
| iperf3 receive AX12 | |
| Asus VivoBook 15 F510UF-ES71 | |
| Lenovo IdeaPad 330-15IGM | |
| HP Pavilion 15-cs0053cl | |
| Acer Extensa 2519-P35U | |
Accessories
There are no included extras in the box outside of the AC adapter, warranty information, and Quick Start guide.
Maintenance
The bottom panel can be removed with a Philips screwdriver and sharp edge. RAM, storage, battery, and WLAN can all be serviced with ease if needed. Note that the fan has been omitted on this particular SKU when compared to the more powerful Ryzen SKUs since the N4100 SoC can be passively cooled.
Warranty
The standard one-year limited manufacturer warranty applies. Like Dell, Lenovo has extensive optional warranty benefits. Please see our Guarantees, Return policies and Warranties FAQ for country-specific information.
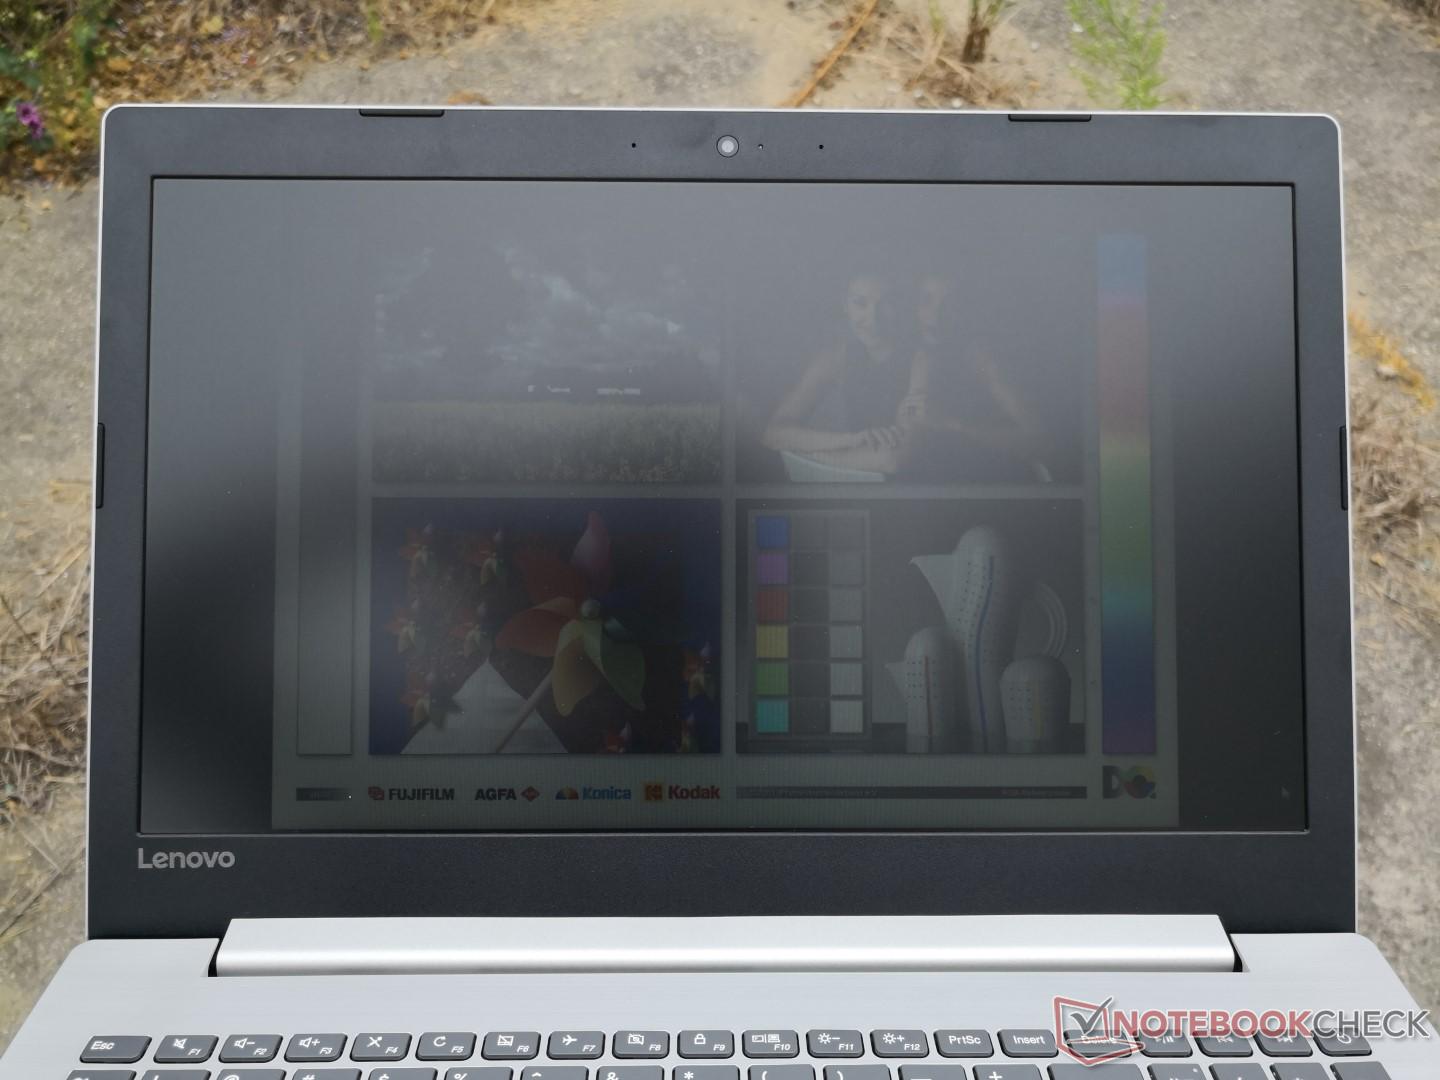
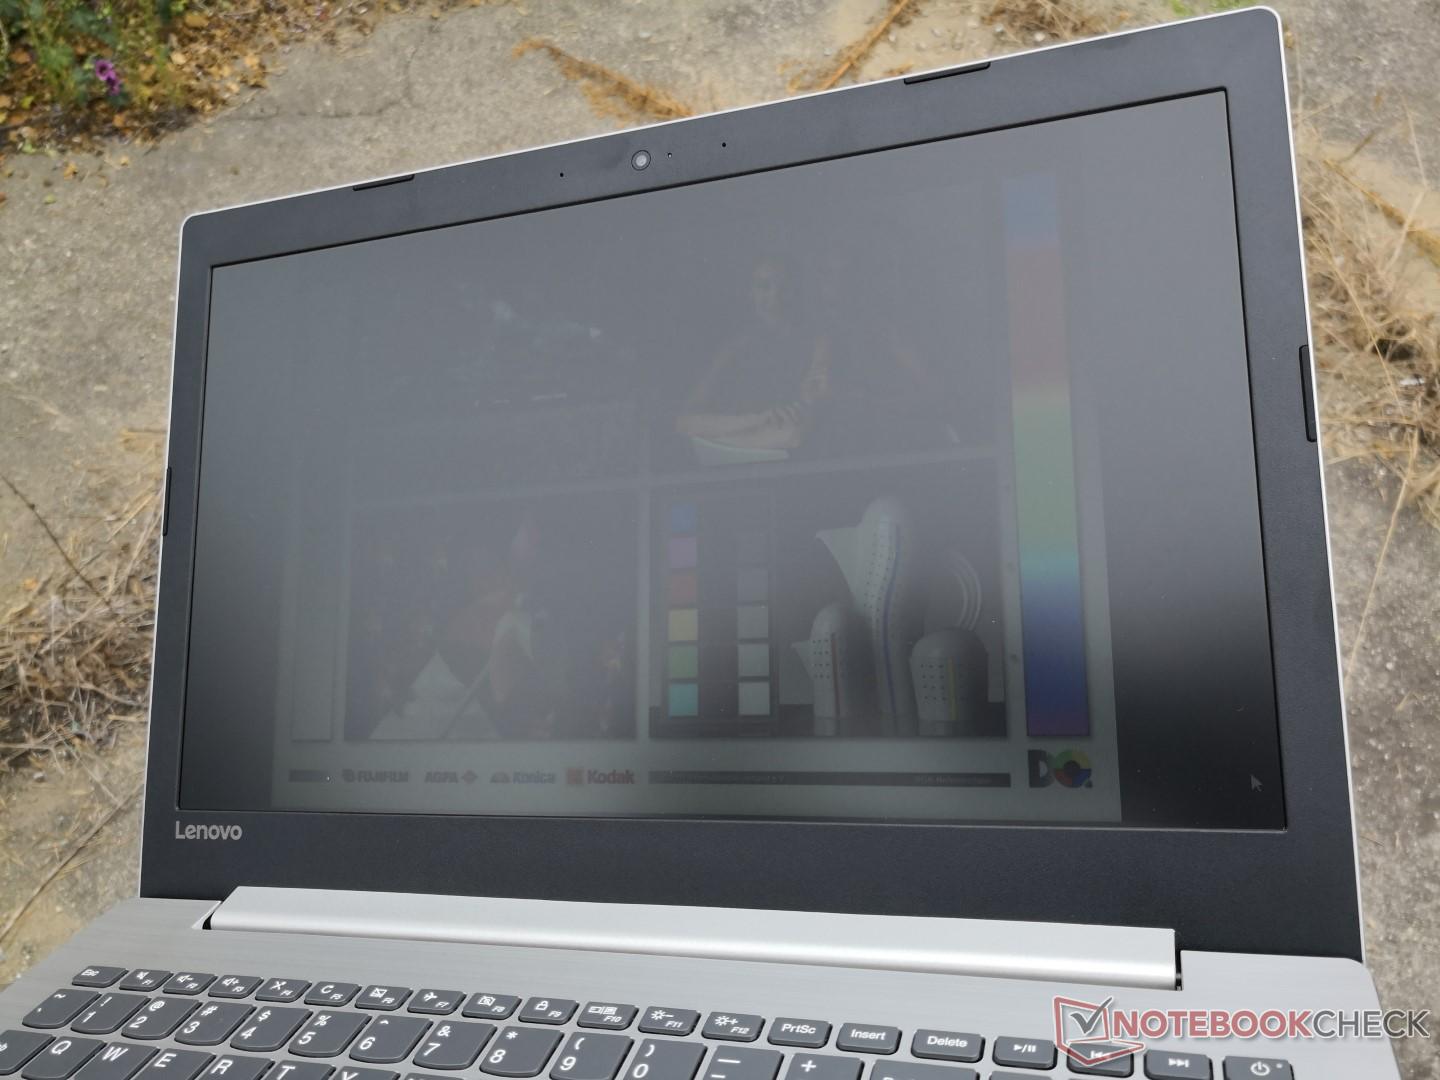
Display

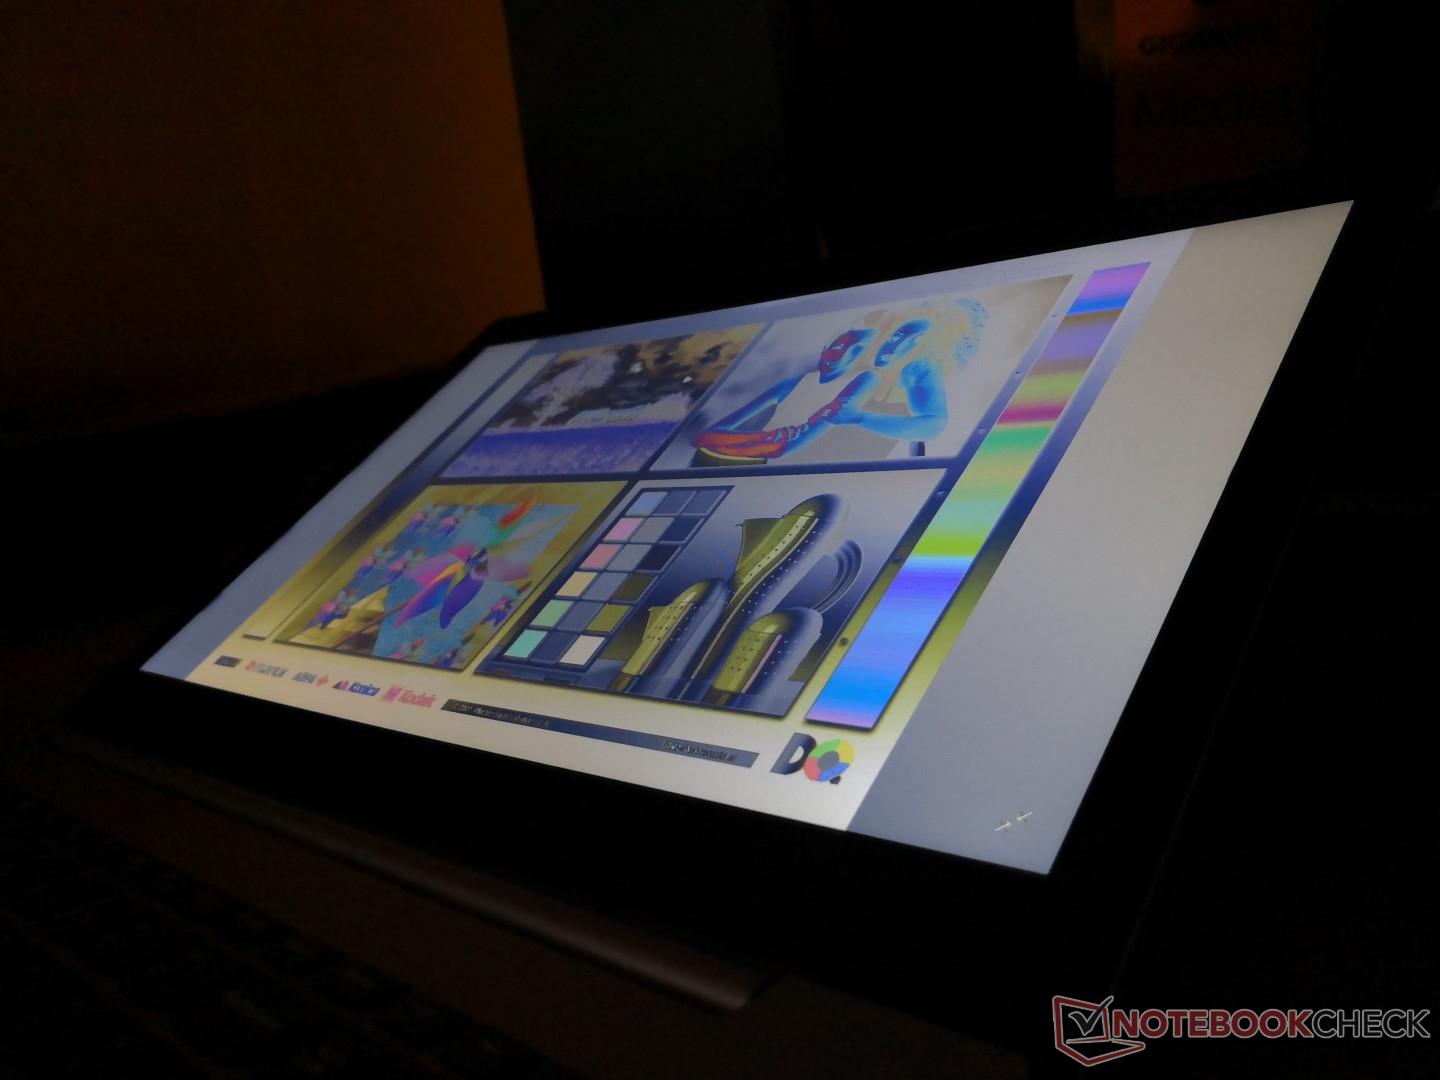
Whereas our previous Ideapad 330 test units were equipped with 1080p displays, this particular SKU is limited to a native resolution of just 768p. Contrast and colors are about as poor as our 1080p counterparts albeit with two additional drawbacks: the backlight is now dimmer and pulse-width modulation is present. Note that this same BOE NT156WHM-N42 TN panel is also utilized on other budget 15.6-inch laptops like the Asus ASUSPRO P541 and Lenovo ThinkPad E570.
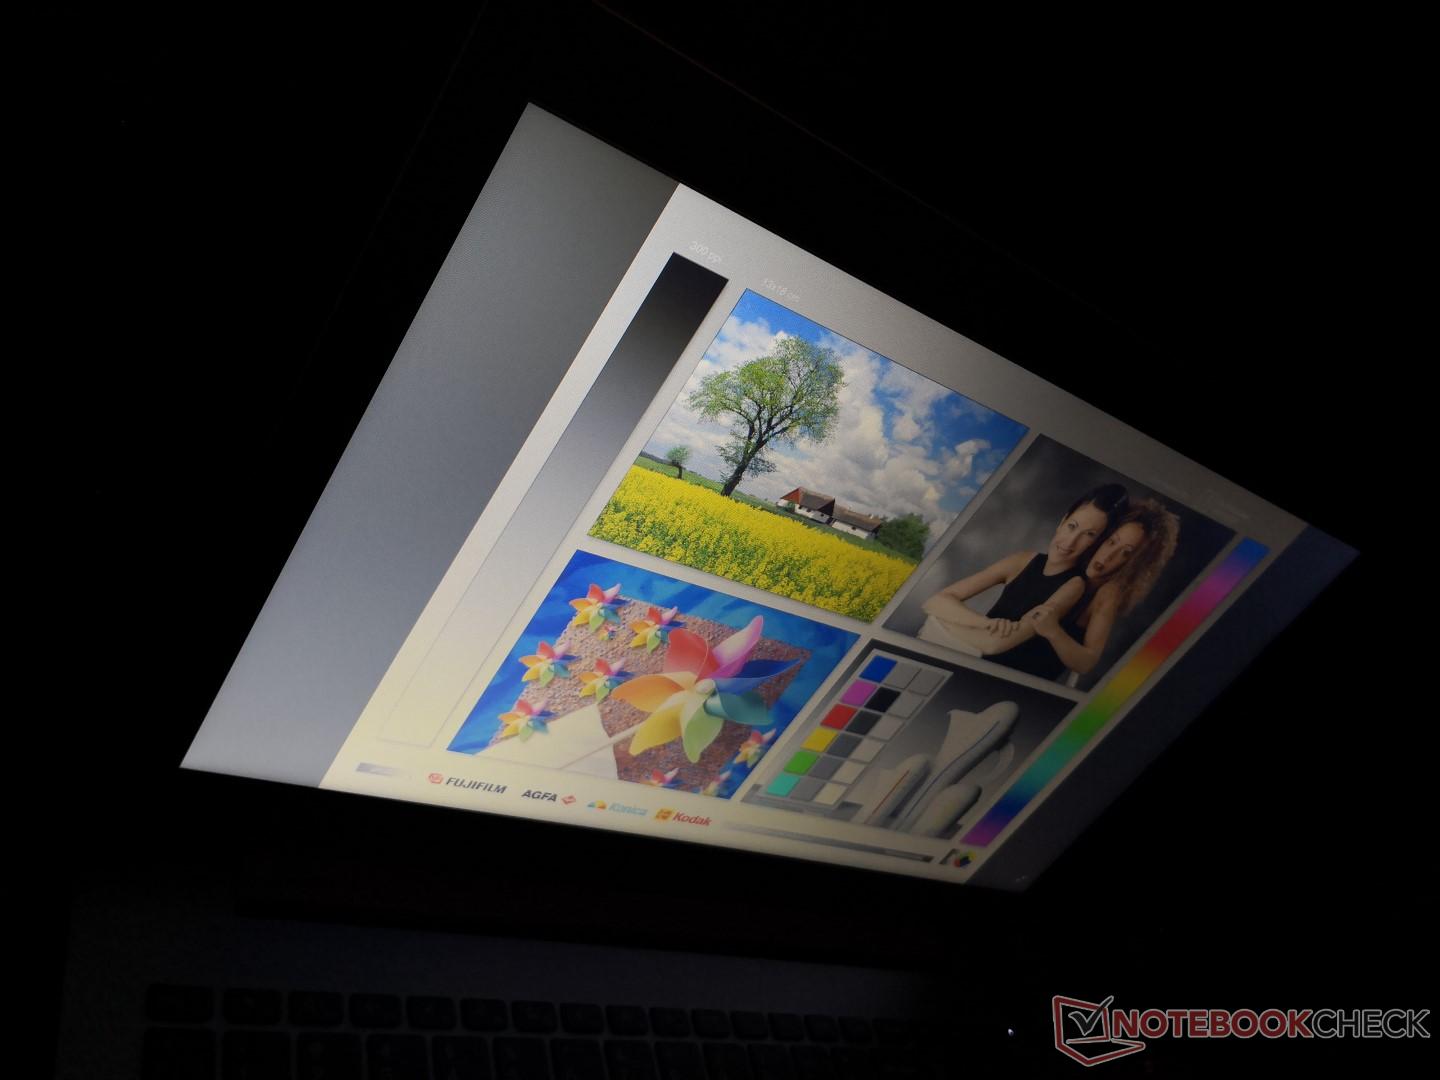
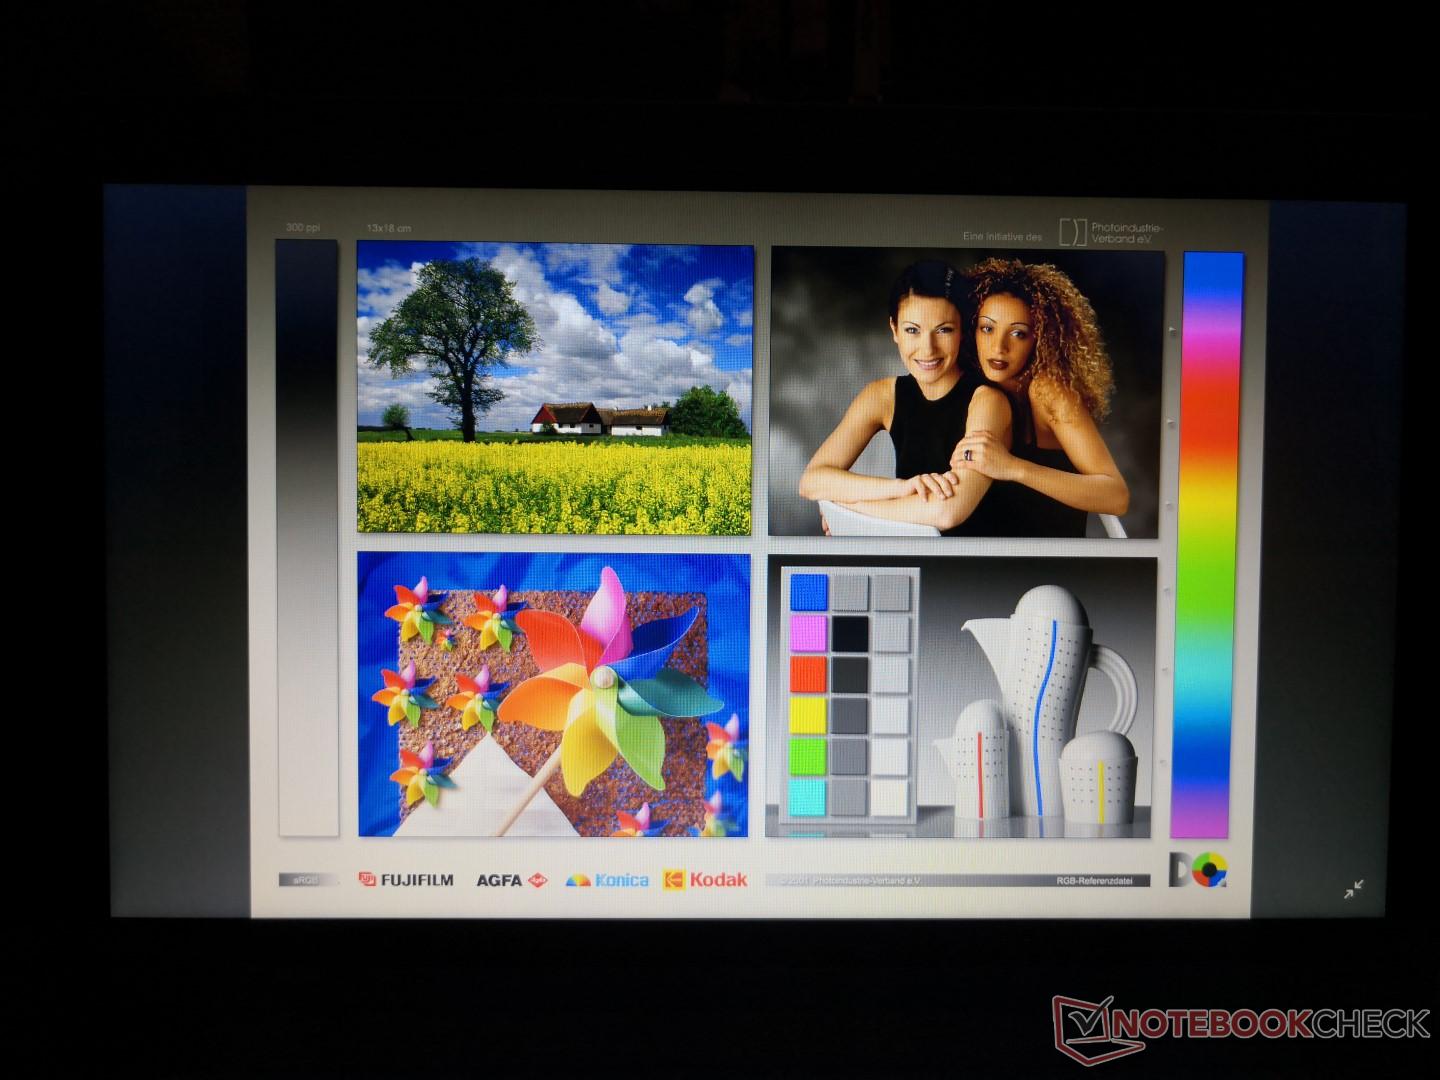
Content appears grainier than we would like due to the low PPI and matte overlay. Subpixels are not very sharp as shown by our microscope snapshot when compared to a glossy panel.
| |||||||||||||||||||||||||
Brightness Distribution: 82 %
Center on Battery: 212.7 cd/m²
Contrast: 409:1 (Black: 0.52 cd/m²)
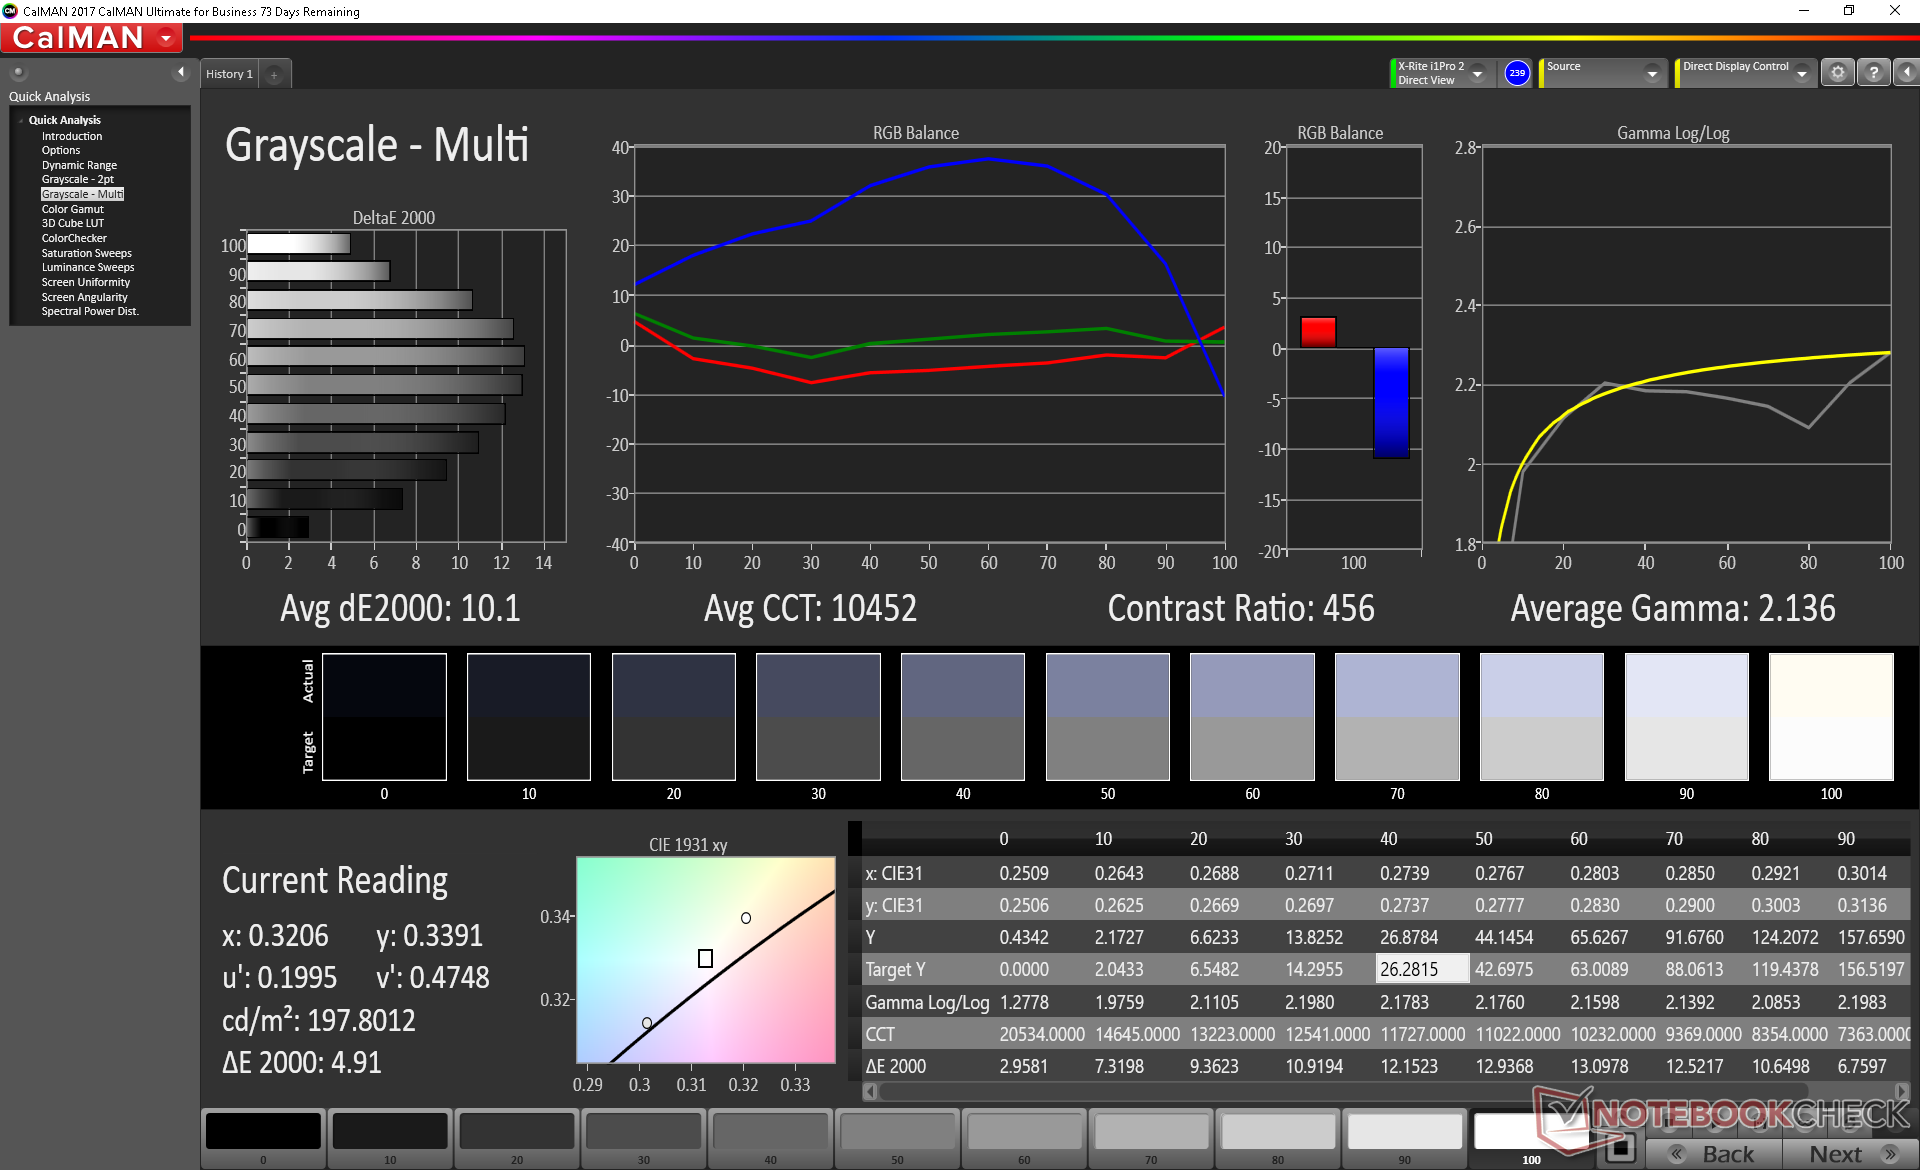
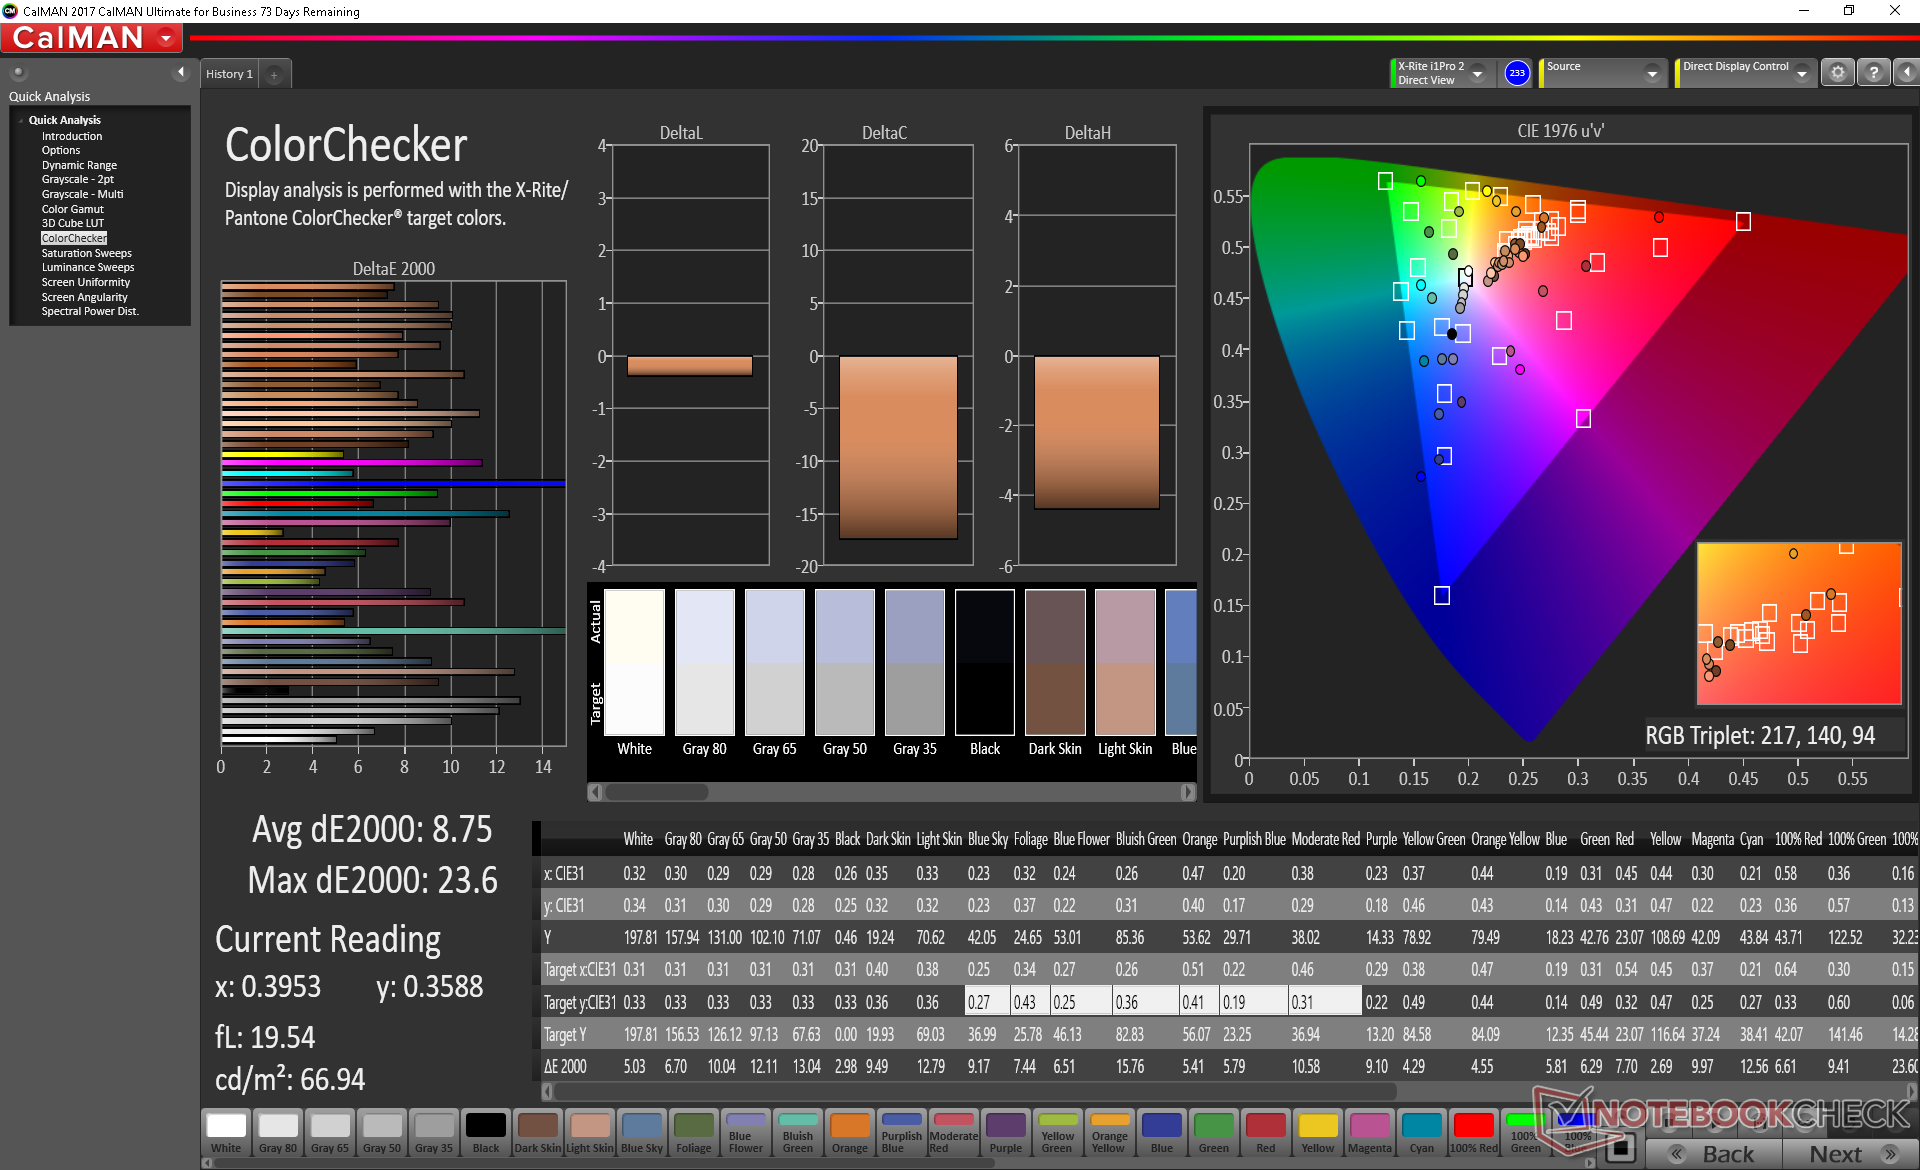
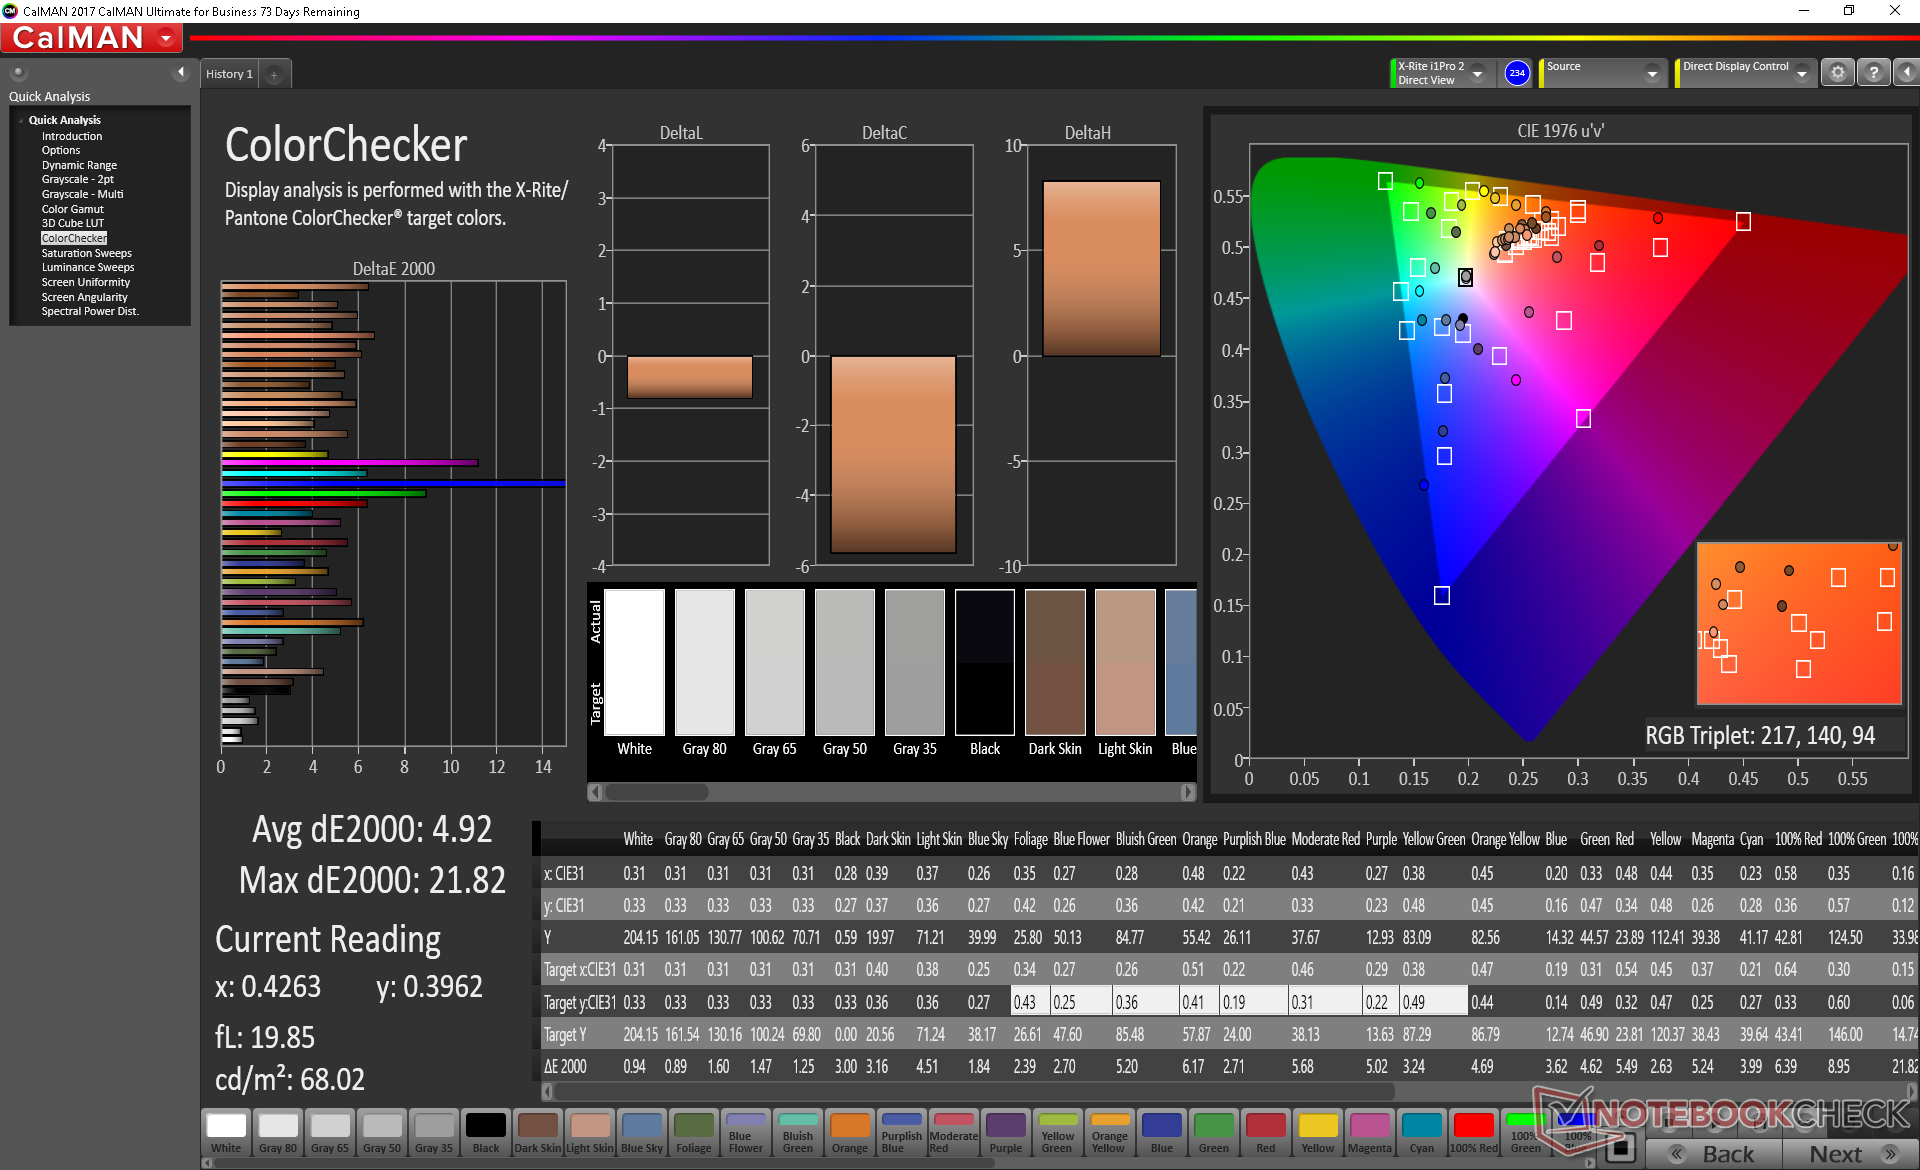
ΔE ColorChecker Calman: 8.75 | ∀{0.5-29.43 Ø4.71}
calibrated: 4.92
ΔE Greyscale Calman: 10.1 | ∀{0.09-98 Ø4.96}
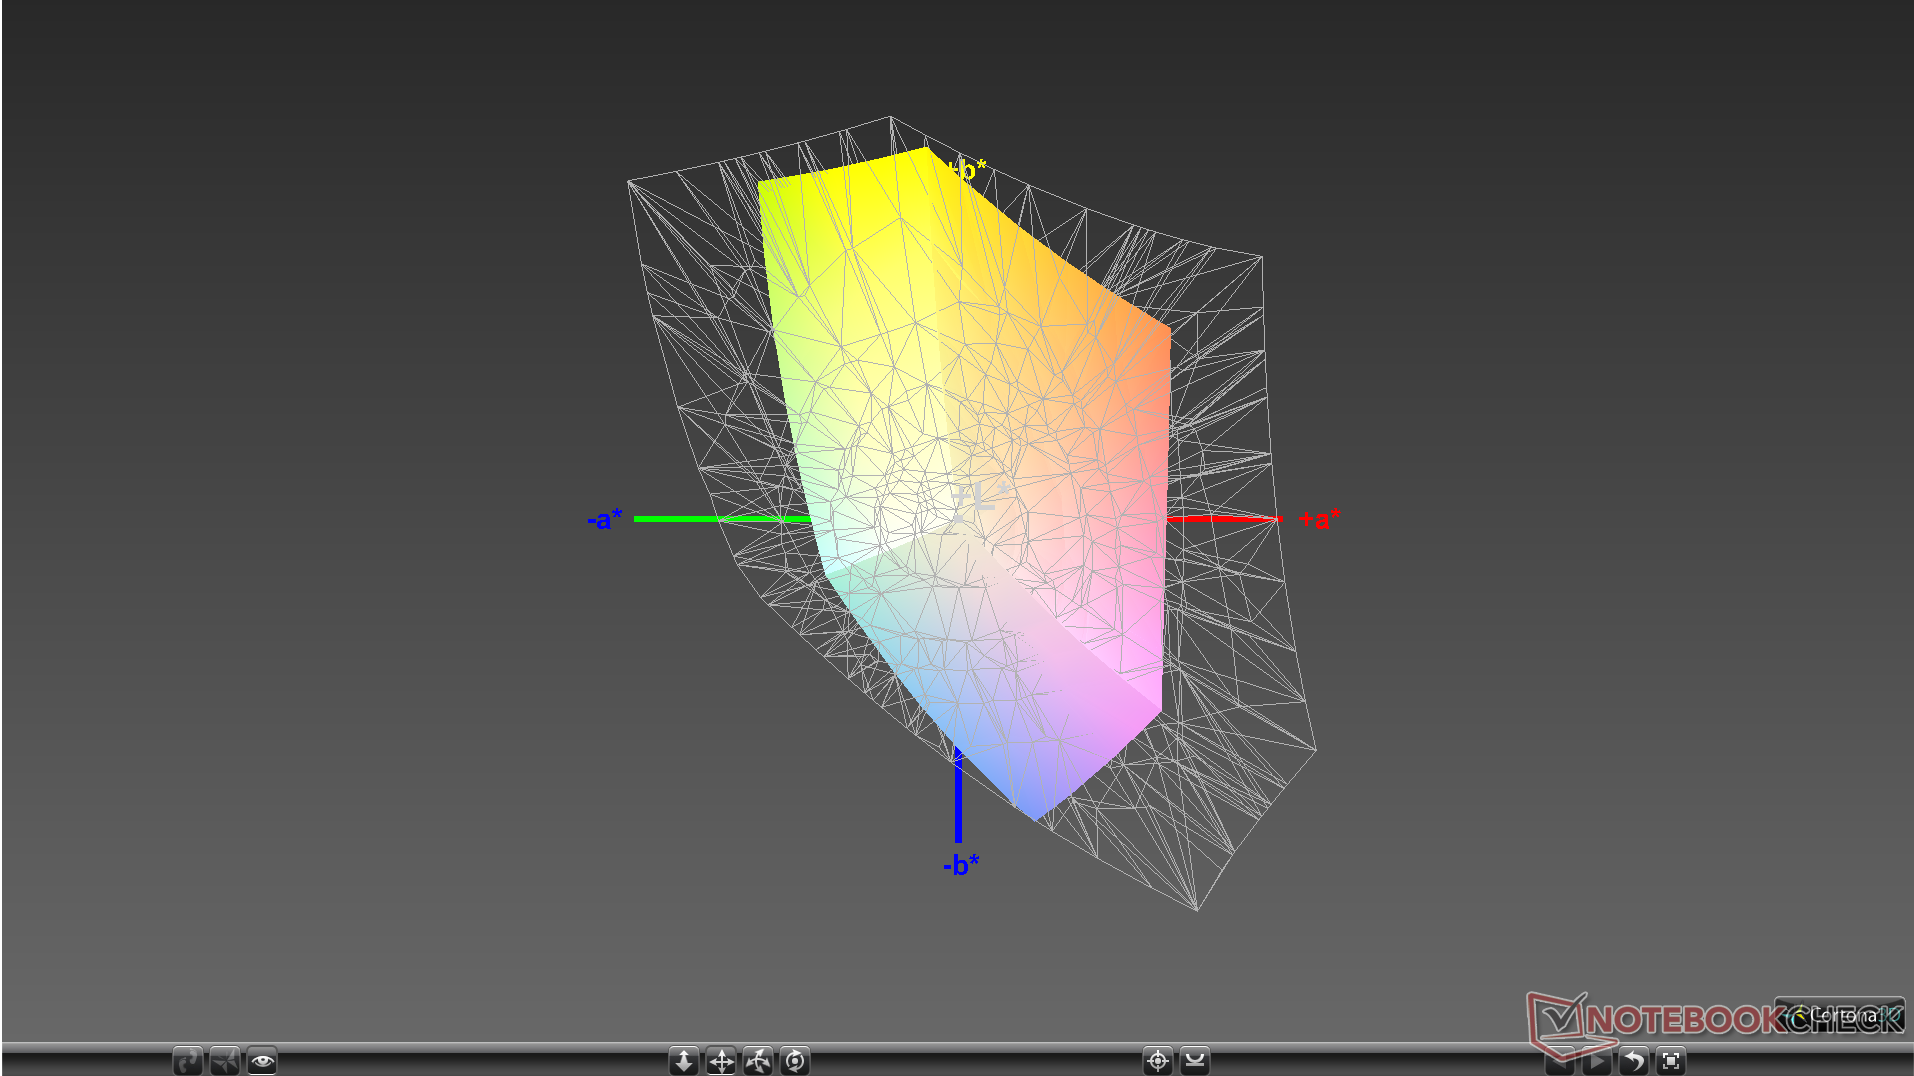
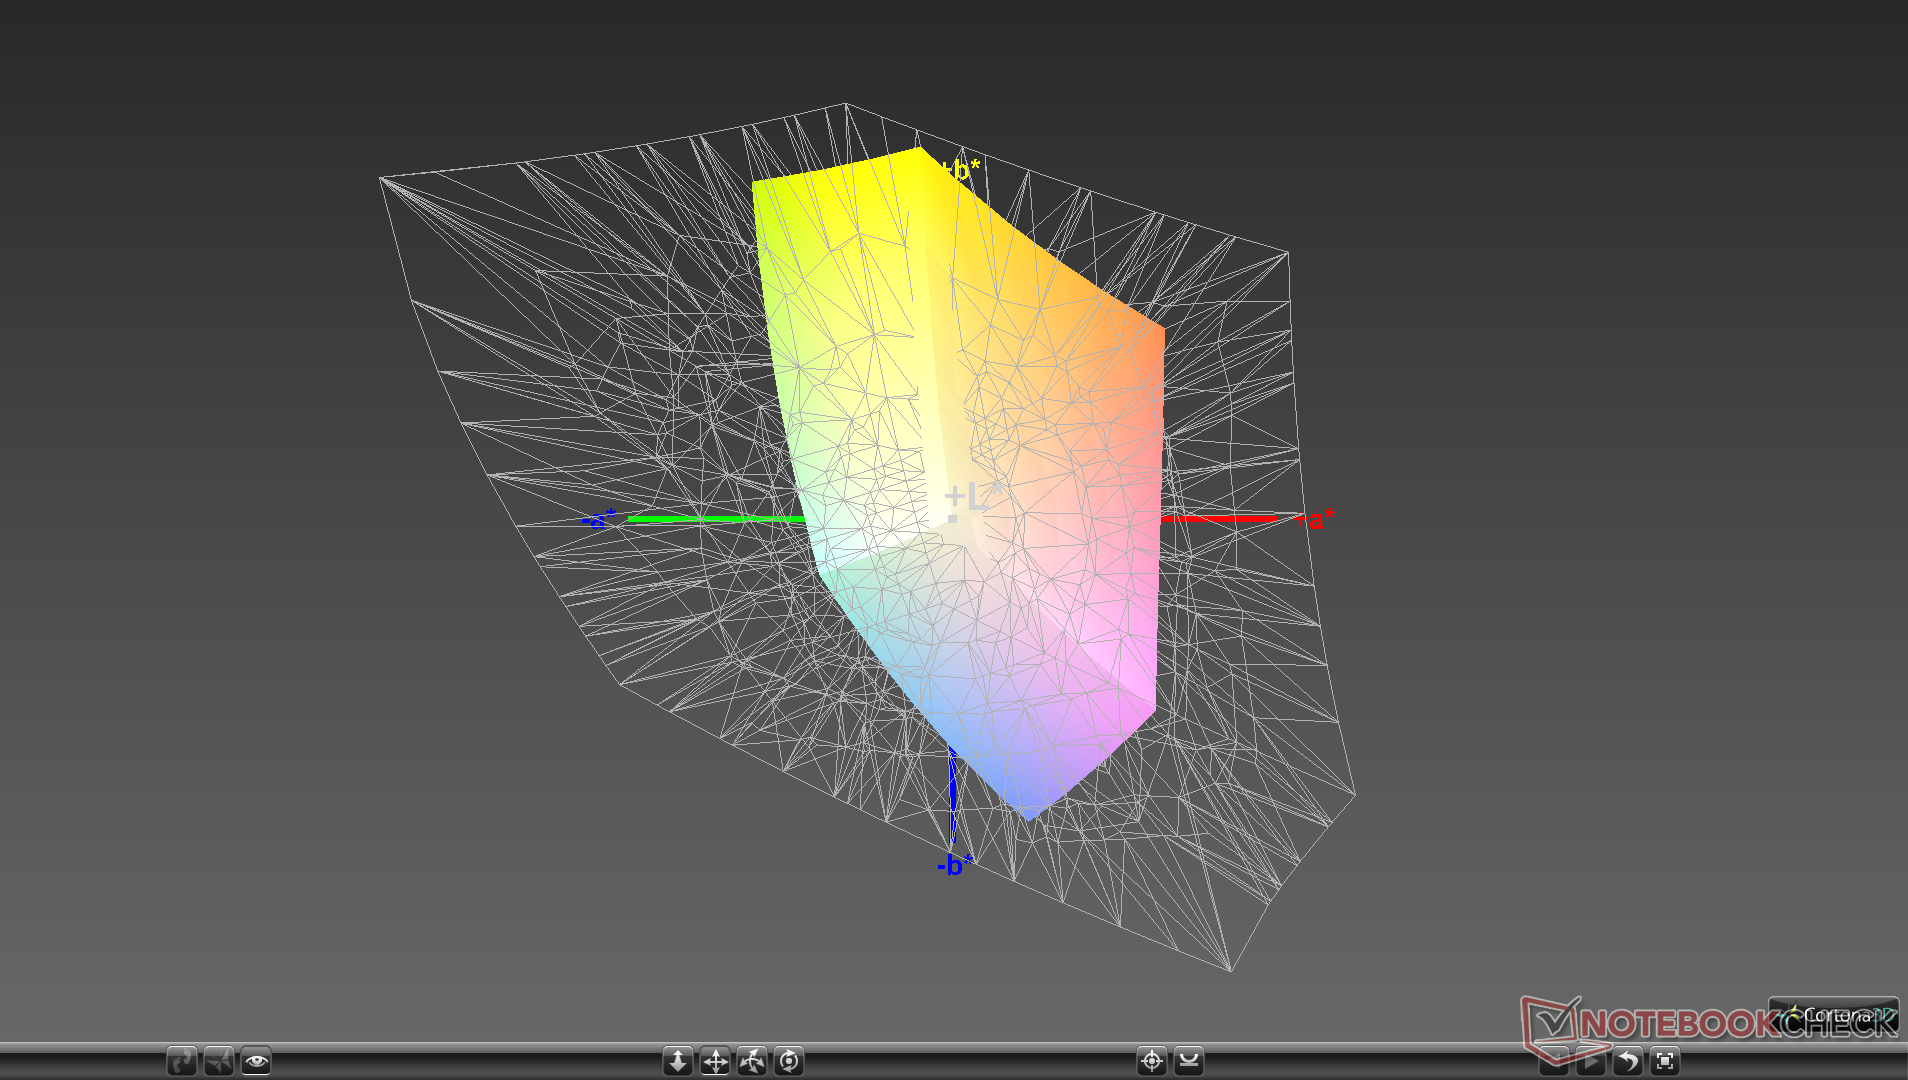
53.6% sRGB (Argyll 1.6.3 3D)
34.1% AdobeRGB 1998 (Argyll 1.6.3 3D)
37.14% AdobeRGB 1998 (Argyll 3D)
53.9% sRGB (Argyll 3D)
35.95% Display P3 (Argyll 3D)
Gamma: 2.14
CCT: 10452 K
| Lenovo IdeaPad 330-15IGM NT156WHM-N42, TN LED, 15.6", 1366x768 | Acer Extensa 2519-P35U AU Optronics AUO71EC, TN LED, 15.6", 1366x768 | HP Pavilion 15-cs0053cl AU Optronics B156XW02 V0, TN LED, 15.6", 1366x768 | Asus VivoBook 15 F510UF-ES71 LG Philips LP156WF9-SPK2, IPS, 15.6", 1920x1080 | Huawei MateBook D 15-53010BAJ AU Optronics B156HW02, IPS, 15.6", 1920x1080 | Lenovo IdeaPad 330-15ARR 81D2005CUS AUO B156HTN03.8, TN LED, 15.6", 1920x1080 | |
|---|---|---|---|---|---|---|
| Display | 5% | 7% | 9% | 14% | 1% | |
| Display P3 Coverage (%) | 35.95 | 37.77 5% | 38.37 7% | 39.35 9% | 40.96 14% | 36.36 1% |
| sRGB Coverage (%) | 53.9 | 56.9 6% | 57.7 7% | 59.2 10% | 60.9 13% | 54.7 1% |
| AdobeRGB 1998 Coverage (%) | 37.14 | 39.02 5% | 39.65 7% | 40.65 9% | 42.24 14% | 37.57 1% |
| Response Times | -7% | -13% | -27% | -48% | -23% | |
| Response Time Grey 50% / Grey 80% * (ms) | 38.4 ? | 45 ? -17% | 43.6 ? -14% | 27.2 ? 29% | 36.4 ? 5% | 38.8 ? -1% |
| Response Time Black / White * (ms) | 13.6 ? | 13 ? 4% | 15.2 ? -12% | 24.8 ? -82% | 27.2 ? -100% | 19.6 ? -44% |
| PWM Frequency (Hz) | 893 ? | |||||
| Screen | -7% | 11% | 32% | 34% | 0% | |
| Brightness middle (cd/m²) | 212.7 | 202 -5% | 220.1 3% | 257 21% | 265.7 25% | 252.2 19% |
| Brightness (cd/m²) | 203 | 194 -4% | 210 3% | 246 21% | 258 27% | 251 24% |
| Brightness Distribution (%) | 82 | 77 -6% | 93 13% | 89 9% | 91 11% | 84 2% |
| Black Level * (cd/m²) | 0.52 | 0.49 6% | 0.29 44% | 0.34 35% | 0.31 40% | 0.54 -4% |
| Contrast (:1) | 409 | 412 1% | 759 86% | 756 85% | 857 110% | 467 14% |
| Colorchecker dE 2000 * | 8.75 | 14.24 -63% | 11.4 -30% | 4.54 48% | 6.01 31% | 12.36 -41% |
| Colorchecker dE 2000 max. * | 23.6 | 23.76 -1% | 25.96 -10% | 16 32% | 18.87 20% | 24.75 -5% |
| Colorchecker dE 2000 calibrated * | 4.92 | 2.95 40% | 4.09 17% | 3.61 27% | 3.94 20% | 4.43 10% |
| Greyscale dE 2000 * | 10.1 | 15.46 -53% | 12 -19% | 4.6 54% | 5 50% | 12.2 -21% |
| Gamma | 2.14 103% | 2.55 86% | 2.09 105% | 2.44 90% | 2.7 81% | 1.83 120% |
| CCT | 10452 62% | 20358 32% | 12625 51% | 7096 92% | 6569 99% | 13028 50% |
| Color Space (Percent of AdobeRGB 1998) (%) | 34.1 | 36 6% | 36.5 7% | 37.5 10% | 42.24 24% | 34.6 1% |
| Color Space (Percent of sRGB) (%) | 53.6 | 57 6% | 57.5 7% | 59.2 10% | 60.92 14% | 54.5 2% |
| Total Average (Program / Settings) | -3% /
-4% | 2% /
7% | 5% /
20% | 0% /
20% | -7% /
-3% |
* ... smaller is better
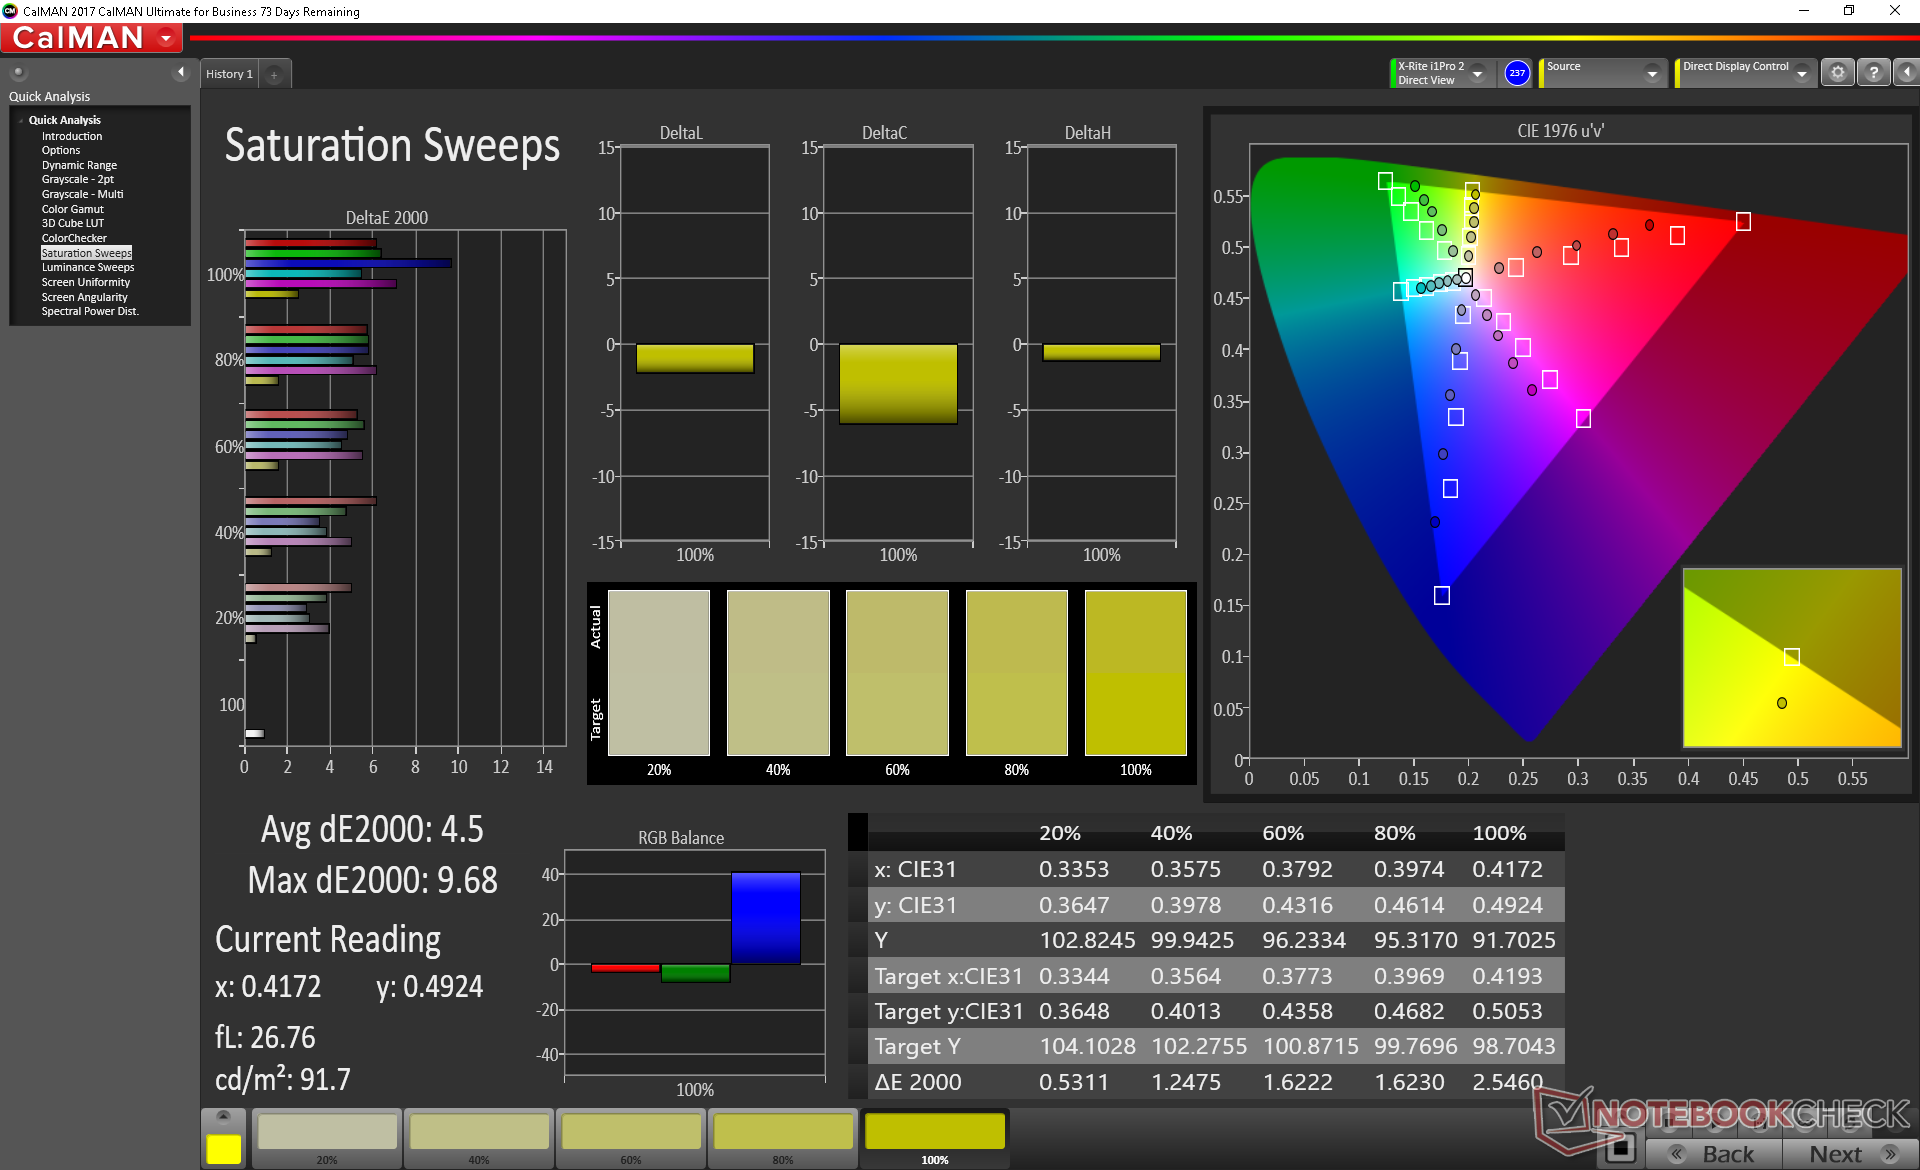
Color space is only 54 percent and 34 percent of the sRGB and AdobeRGB standards, respectively. While disappointing, the results are in line with other budget laptops including the Acer Extensa 2519 and HP Pavilion 15. Flagship Ultrabooks often cover over 90 percent of sRGB for more vivid colors.
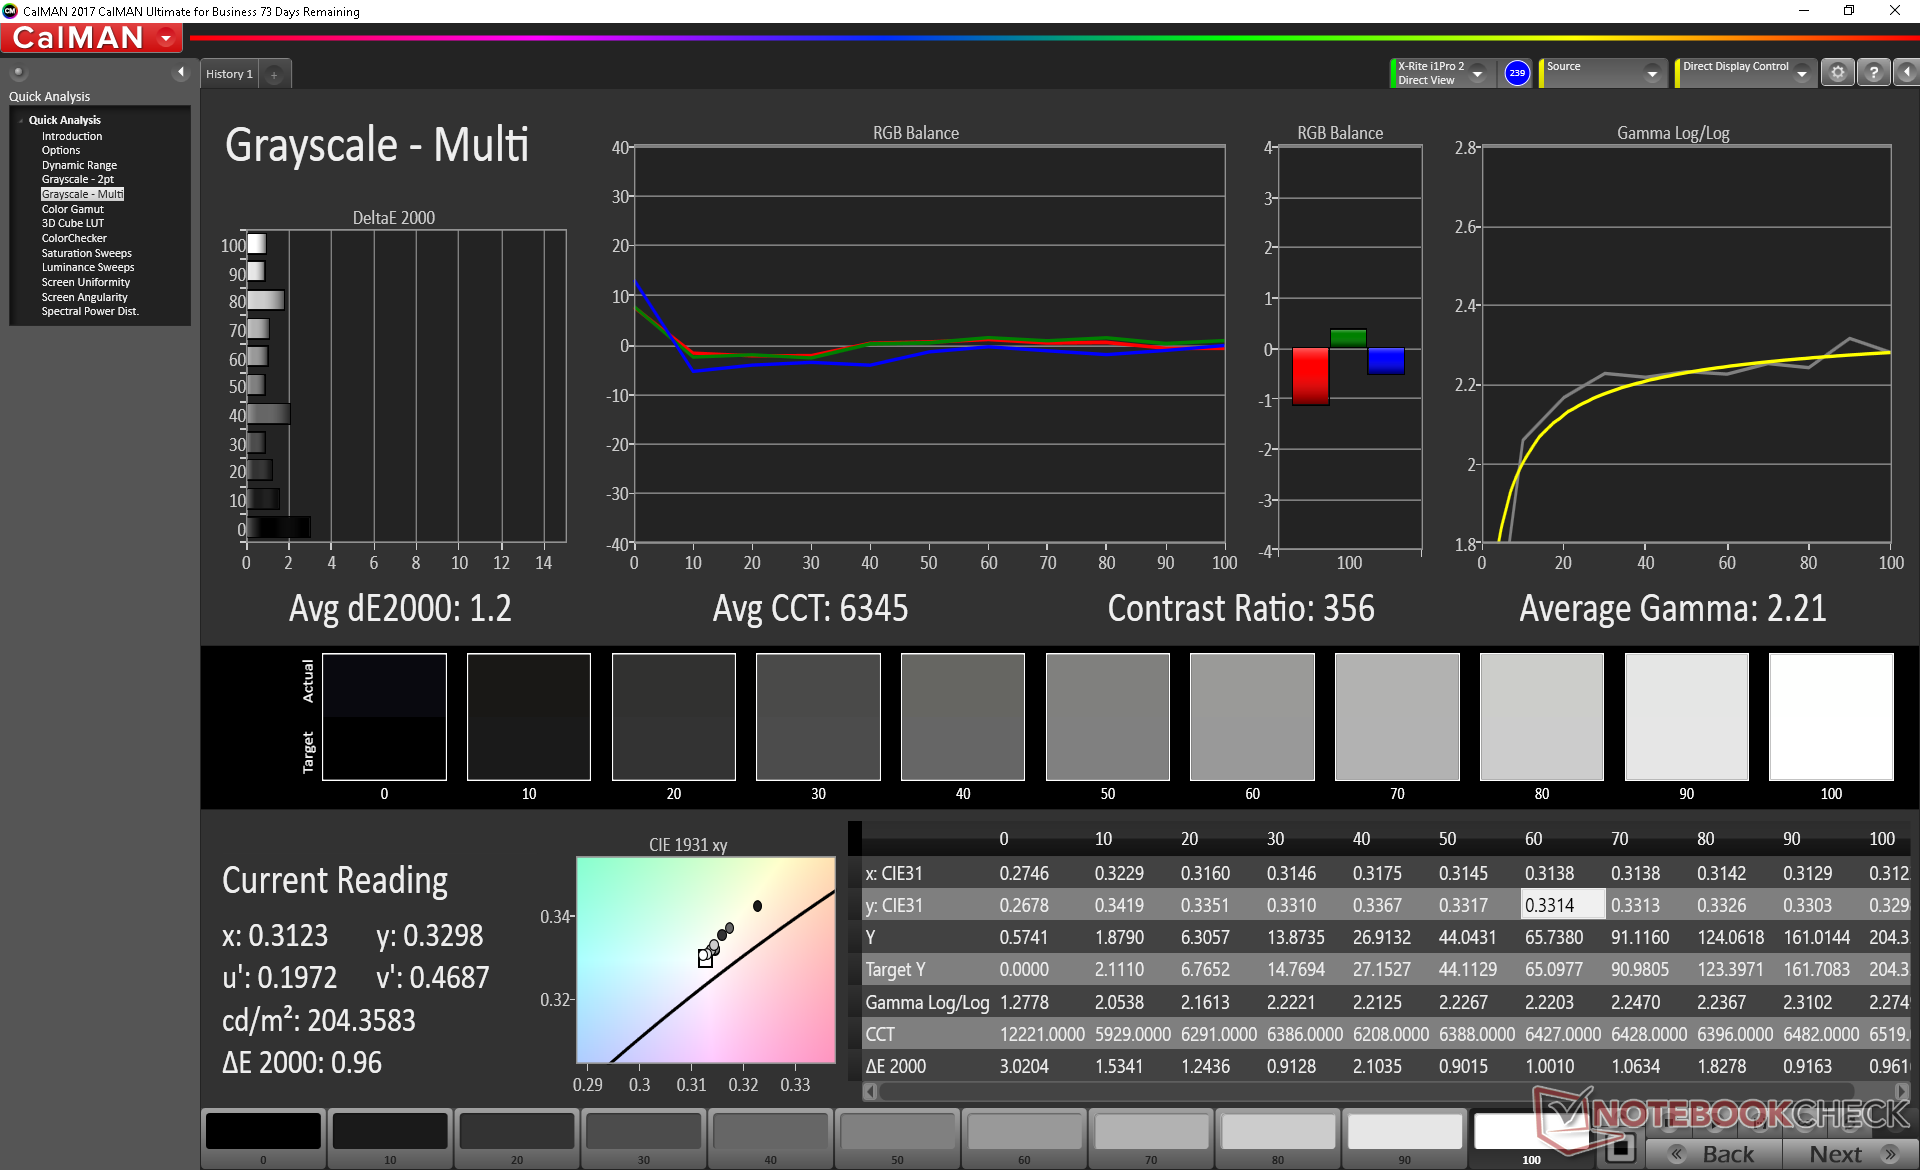
Further display measurements reveal all the common tropes of a budget panel. Grayscale is poor, color temperature is far too cool, and colors are not very deep or accurate at all. Our calibration attempts improve both grayscale and RGB balance dramatically and we recommend applying our ICC file above to get the most out of the display. Colors remain inaccurate since the panel covers so little of the sRGB standard.

Display Response Times
| ↔ Response Time Black to White | ||
|---|---|---|
| 13.6 ms ... rise ↗ and fall ↘ combined | ↗ 8.4 ms rise | 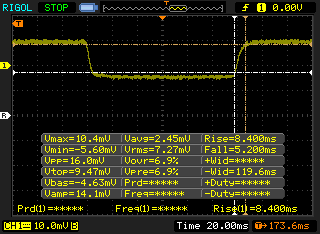 |
| ↘ 5.2 ms fall | ||
| The screen shows good response rates in our tests, but may be too slow for competitive gamers. In comparison, all tested devices range from 0.1 (minimum) to 240 (maximum) ms. » 34 % of all devices are better. This means that the measured response time is better than the average of all tested devices (19.8 ms). | ||
| ↔ Response Time 50% Grey to 80% Grey | ||
| 38.4 ms ... rise ↗ and fall ↘ combined | ↗ 18.8 ms rise | 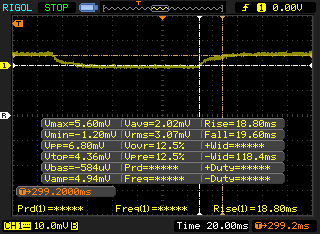 |
| ↘ 19.6 ms fall | ||
| The screen shows slow response rates in our tests and will be unsatisfactory for gamers. In comparison, all tested devices range from 0.165 (minimum) to 636 (maximum) ms. » 58 % of all devices are better. This means that the measured response time is worse than the average of all tested devices (31 ms). | ||
Screen Flickering / PWM (Pulse-Width Modulation)
| Screen flickering / PWM detected | 893 Hz | ≤ 99 % brightness setting | 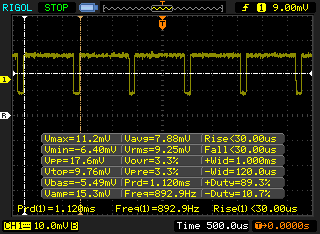 |
The display backlight flickers at 893 Hz (worst case, e.g., utilizing PWM) Flickering detected at a brightness setting of 99 % and below. There should be no flickering or PWM above this brightness setting. The frequency of 893 Hz is quite high, so most users sensitive to PWM should not notice any flickering. In comparison: 52 % of all tested devices do not use PWM to dim the display. If PWM was detected, an average of 7747 (minimum: 5 - maximum: 343500) Hz was measured. | |||
Outdoor visibility is poor as the backlight is too dim to overcome the ambient light. The 180-degree hinge doesn't help very much either because of the narrow TN viewing angles.
Performance
Processor
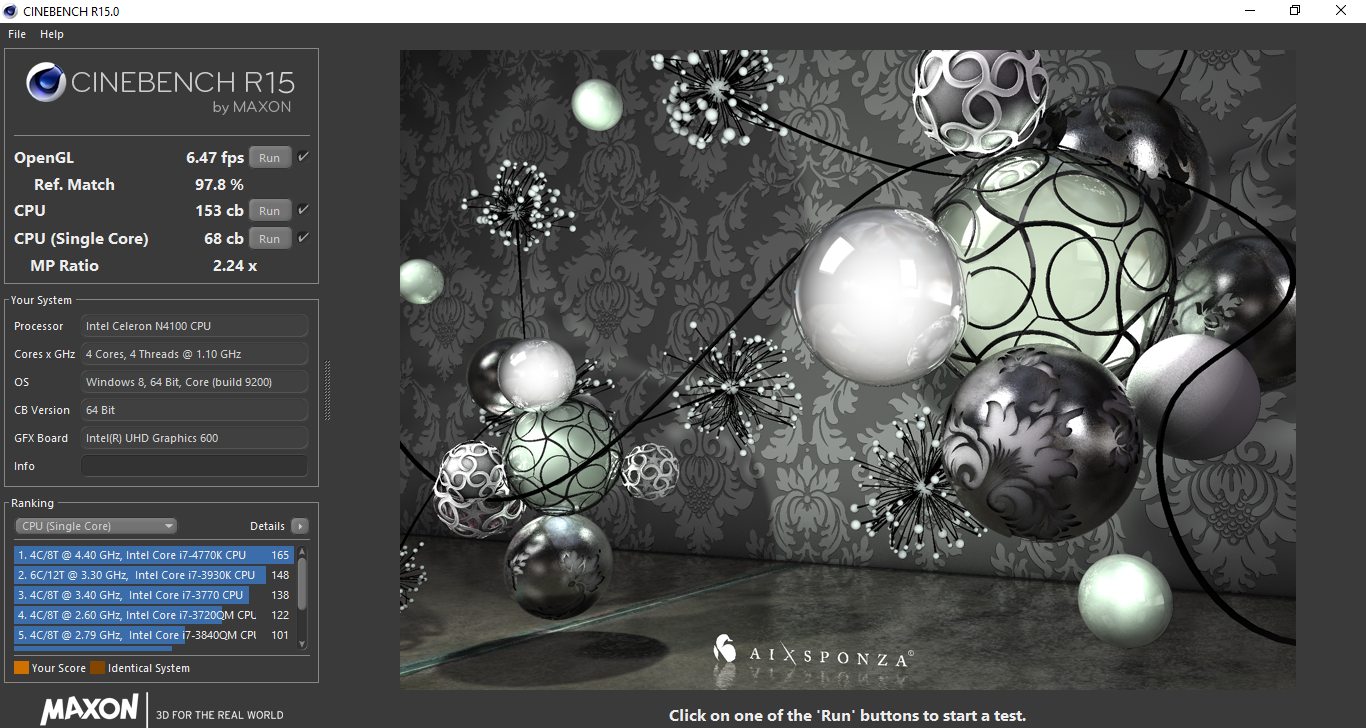
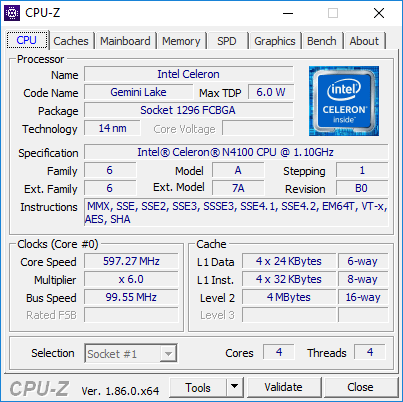
CPU performance is very similar to the Pentium Gold 4415Y as found on the Surface Go. Even so, a slow-performing Core i3 CPU like the Core i3-7130U will outperform our Celeron N4100 by almost 75 percent in multi-threaded workloads. The Lenovo Flex 6 with the Celeron N4000 is behind our Ideapad 330 by about 15 percent. The Celeron N4100 walks a comfortable line between the slower Atom and faster Core ix families.
Running CineBench R15 Multi-Thread in a loop shows consistent performance throughout with no major throttling issues. This is in contrast to the Ideapad 330 SKU with the Ryzen 5 SoC where we discovered extreme performance throttling when subjected to the same loop test.
See our dedicated page on the quad-core Celeron N4100 for more technical information and benchmarks.
System Performance
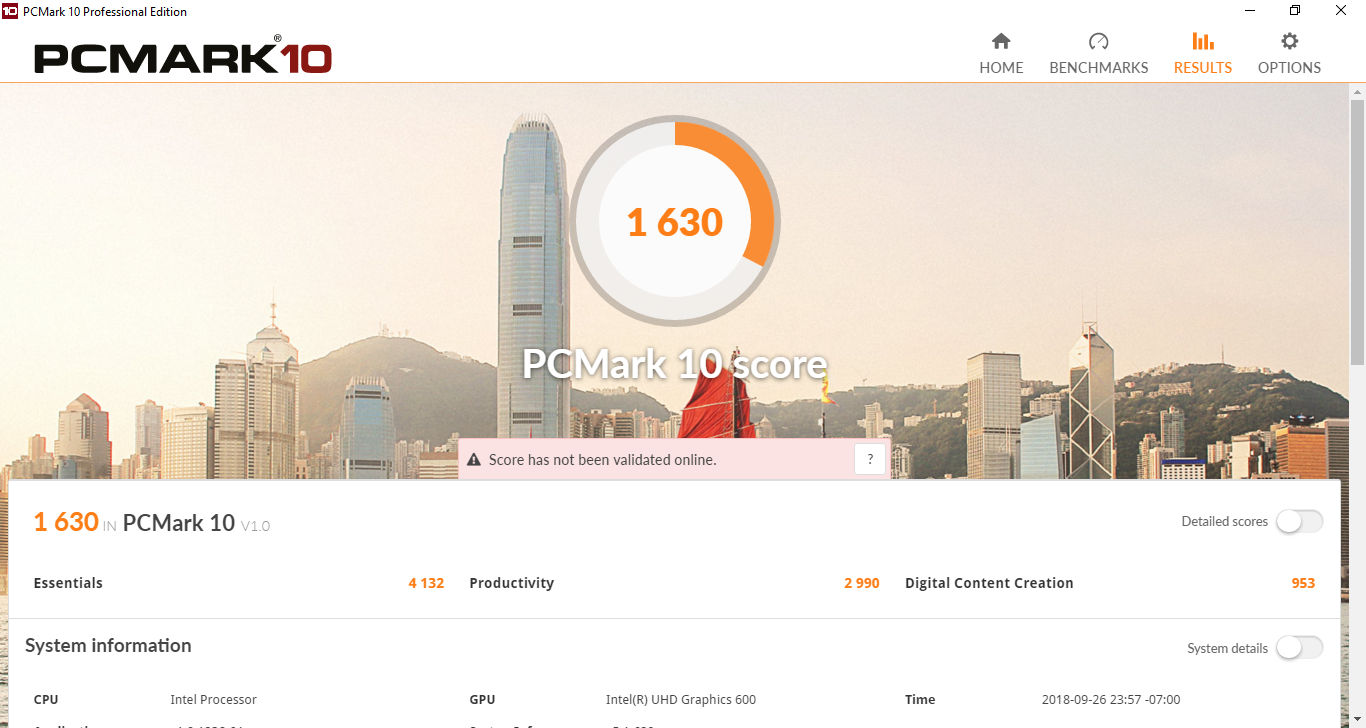
PCMark benchmarks are just slightly above the Chuwi LapBook SE since they both share the same processor. Unsurprisingly, systems with more popular Core i5 or i7 Kaby Lake CPUs significantly outscore our Lenovo. Navigating through Windows and launching applications are noticeably slower than on a typical Ultrabook. Expect a performance level just slightly higher than an Atom-powered laptop.
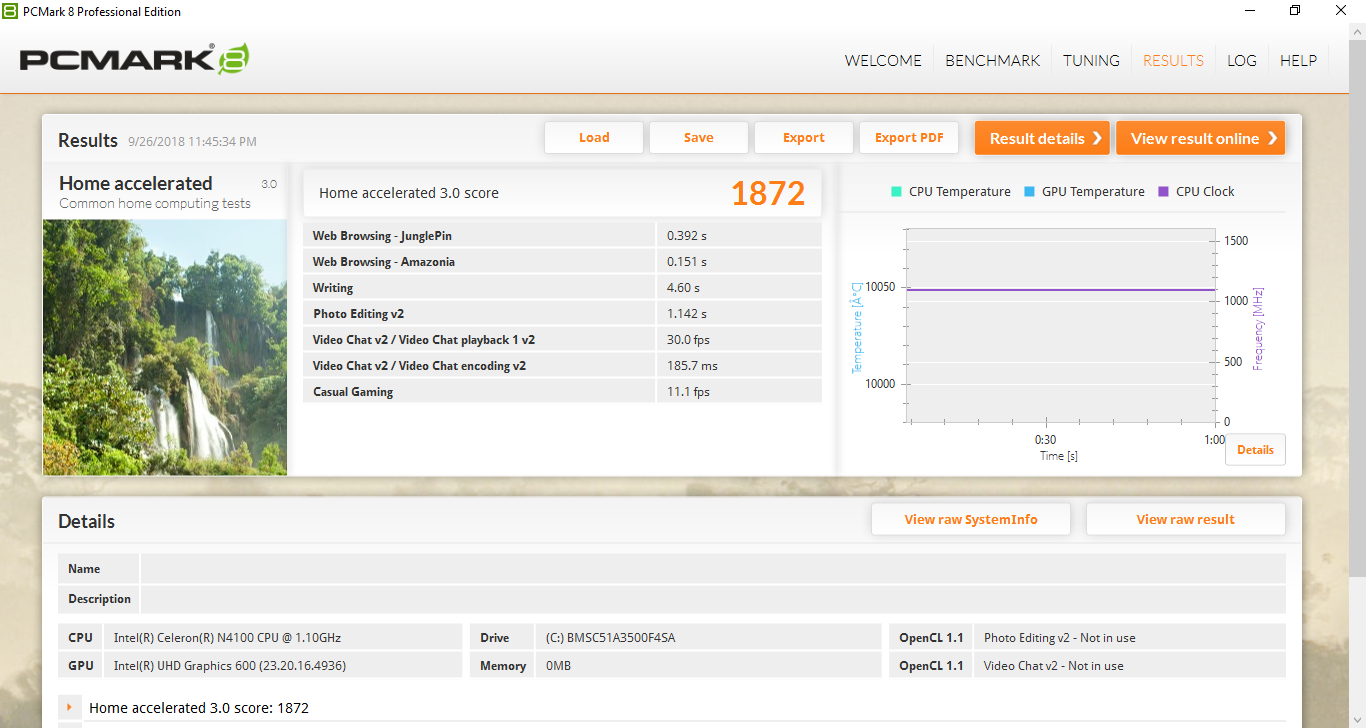
| PCMark 8 Home Score Accelerated v2 | 1872 points | |
| PCMark 10 Score | 1630 points | |
Help | ||
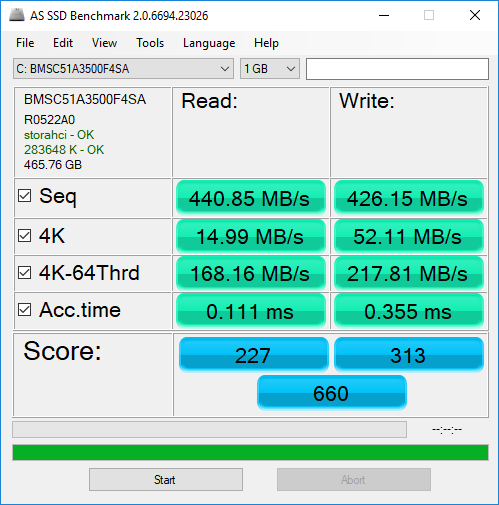
Storage Devices
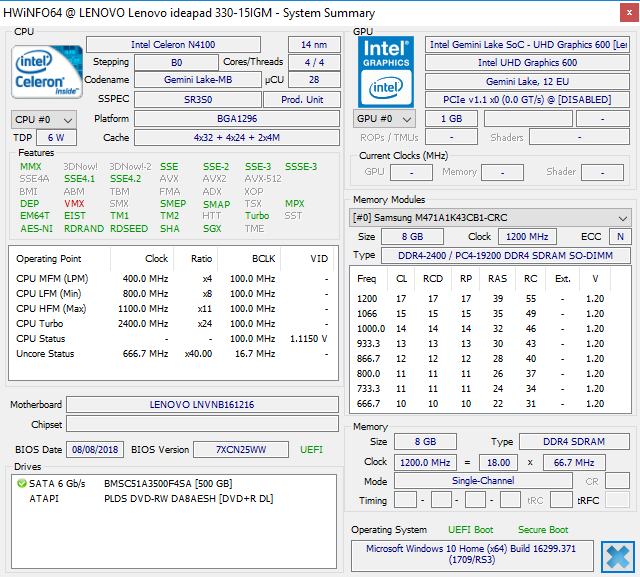
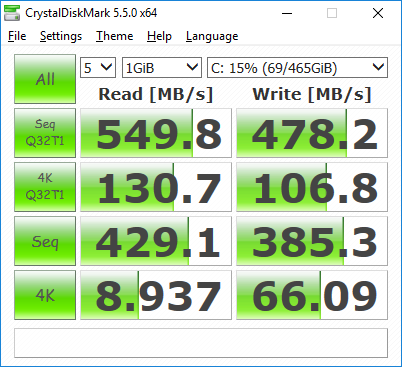
Two internal storage bays are available: 2.5-inch SATA III and M.2 PCIe. Our unit is equipped with a single 500 GB SSD that HWiNFO recognizes as BMSC51A3500F4SA. An online search reveals no details about this drive, but benchmarks show transfer rates that are typical of a SATA III SSD.
See our table of HDDs and SSDs for more benchmark comparisons.
| Lenovo IdeaPad 330-15IGM BMSC51A3500F4SA | Huawei MateBook D 15-53010BAJ Samsung SSD PM981 MZVLB512HAJQ | Lenovo IdeaPad 330-15ARR 81D2005CUS SK Hynix Canvas SC311 256GB HFS256G32TNF | Lenovo V330-15IKB Samsung PM961 MZVLW256HEHP | Microsoft Surface Go MHN-00003 64 GB eMMC Flash | |
|---|---|---|---|---|---|
| AS SSD | 314% | 19% | 127% | -50% | |
| Copy Game MB/s (MB/s) | 410.2 | 1047 155% | 262.4 -36% | 465.5 13% | 76.5 -81% |
| Copy Program MB/s (MB/s) | 168.2 | 438.1 160% | 334 99% | 201.9 20% | 44.34 -74% |
| Copy ISO MB/s (MB/s) | 441.2 | 1287 192% | 434.5 -2% | 789 79% | 99.1 -78% |
| Score Total (Points) | 660 | 4225 540% | 752 14% | 1623 146% | 225 -66% |
| Score Write (Points) | 313 | 1709 446% | 295 -6% | 581 86% | 92 -71% |
| Score Read (Points) | 227 | 1665 633% | 296 30% | 704 210% | 88 -61% |
| Access Time Write * (ms) | 0.355 | 0.143 60% | 0.08 77% | 0.045 87% | 0.233 34% |
| Access Time Read * (ms) | 0.111 | 0.043 61% | 0.102 8% | 0.069 38% | 0.151 -36% |
| 4K-64 Write (MB/s) | 217.8 | 1486 582% | 203.6 -7% | 359.7 65% | 44.48 -80% |
| 4K-64 Read (MB/s) | 168.2 | 1455 765% | 228.5 36% | 448.4 167% | 40.27 -76% |
| 4K Write (MB/s) | 52.1 | 81.9 57% | 45.41 -13% | 83.9 61% | 35.07 -33% |
| 4K Read (MB/s) | 14.99 | 53 254% | 23.4 56% | 45.31 202% | 18.29 22% |
| Seq Write (MB/s) | 426.1 | 1411 231% | 459.6 8% | 1373 222% | 126.7 -70% |
| Seq Read (MB/s) | 440.9 | 1567 255% | 441.6 0% | 2104 377% | 289.8 -34% |
* ... smaller is better

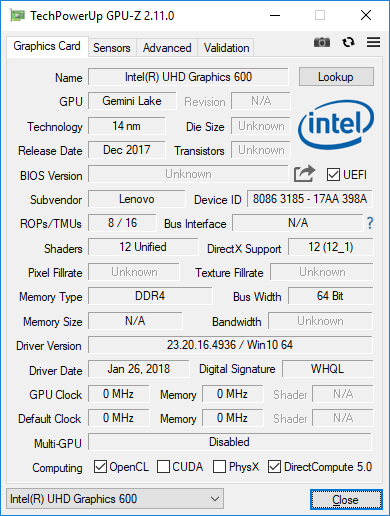
GPU Performance
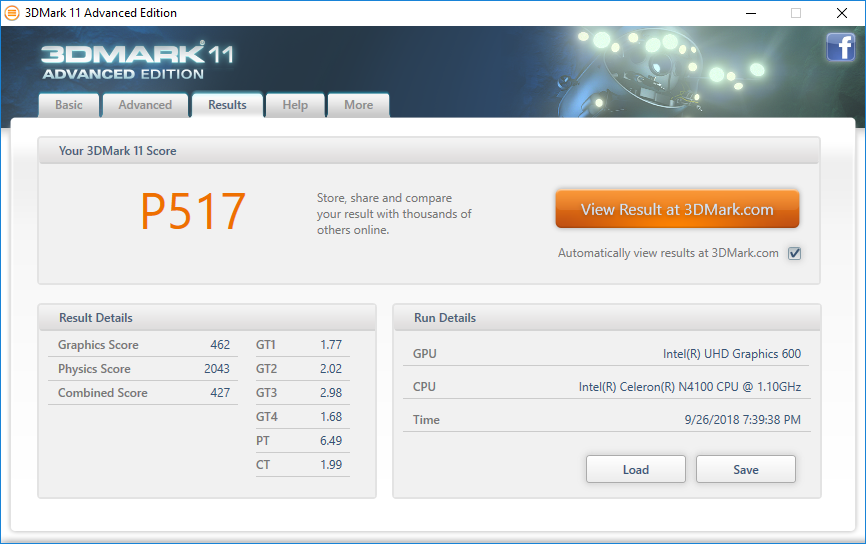
Graphics performance is about 13 percent slower than the average laptop in our database with the same UHD Graphics 600 GPU. In fact, raw performance is not any faster than the last generation HD Graphics 500. The results shouldn't be an issue for users who simply want a system for streaming or browsing. If more graphics power is needed, then the Lenovo V330 with the UHD Graphics 620 can be an alternative option.
See our dedicated page on the UHD Graphics 600 for more information.
| 3DMark 11 Performance | 517 points | |
Help | ||
Stress Test
We stress the system with synthetic loads to identify for any potential throttling issues. When subjected to Prime95 load, the CPU can be observed running at 2.3 GHz for the first few seconds before dropping to a steady 1.4 GHz to 1.5 GHz range. Since the base clock rate of the N4100 CPU is 1.1 GHz, the Ideapad 330 is able to maintain a Turbo Boost clock rate of about +300 MHz at a steady core temperature of 54 C. Running both Prime95 and FurMark simultaneously will raise the core temperature to a steady 59 C.
Running on batteries will not throttle performance. A 3DMark 11 run on battery power returns Physics and Graphics scores that are within just 1 percent of the scores when running on mains.
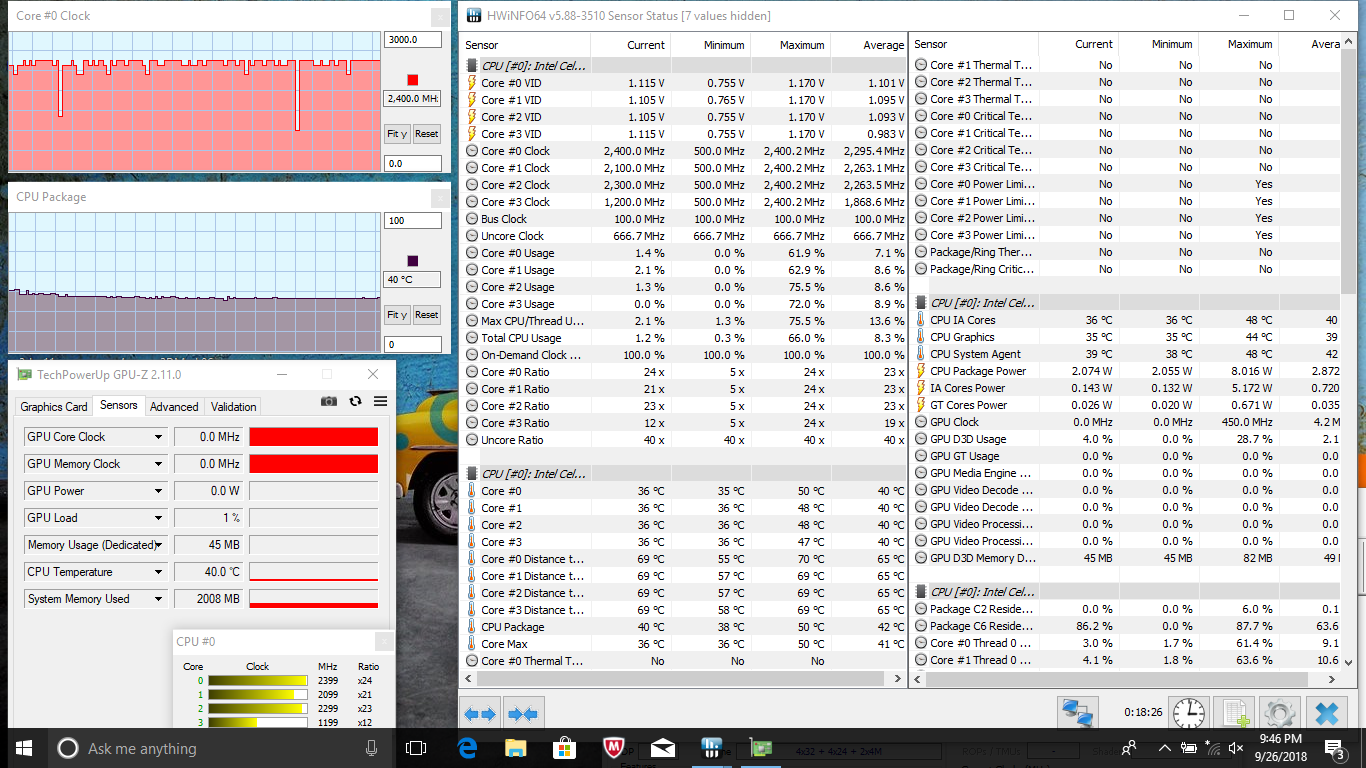
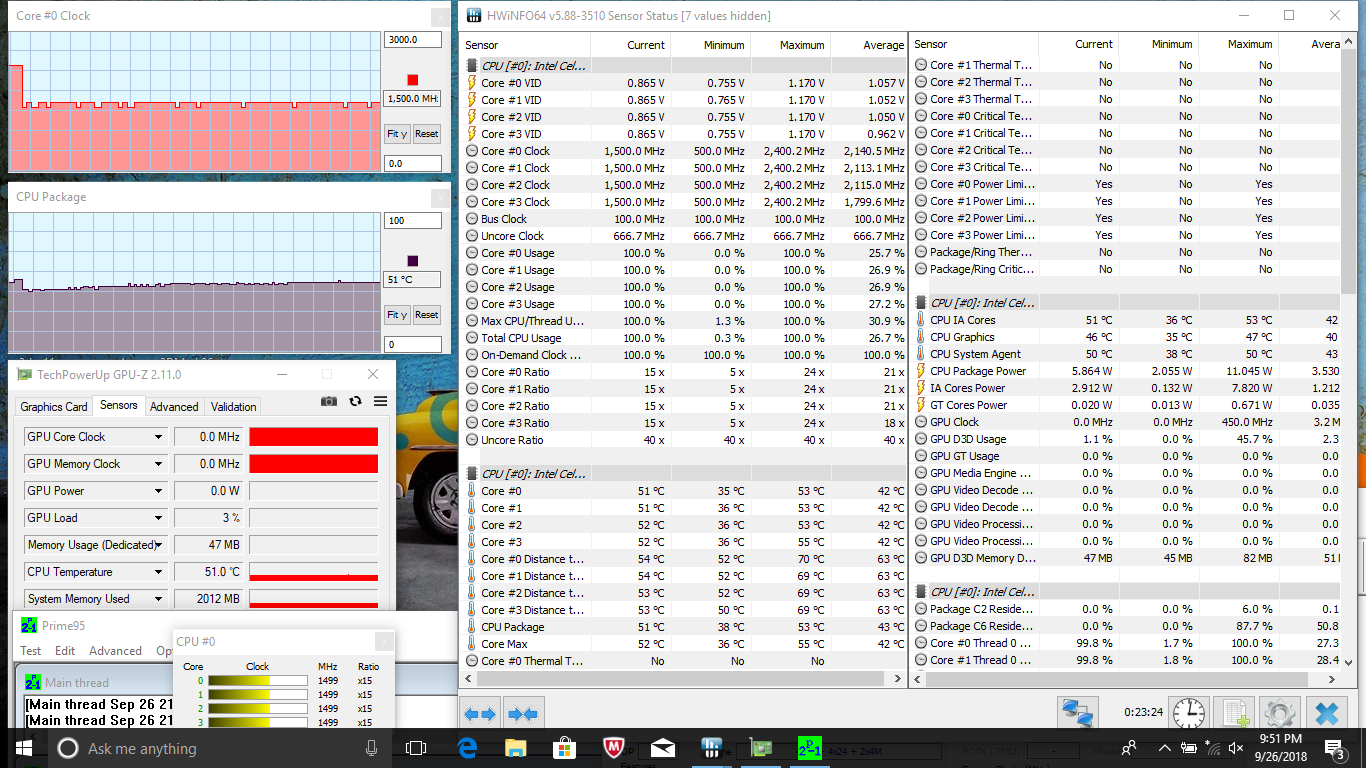
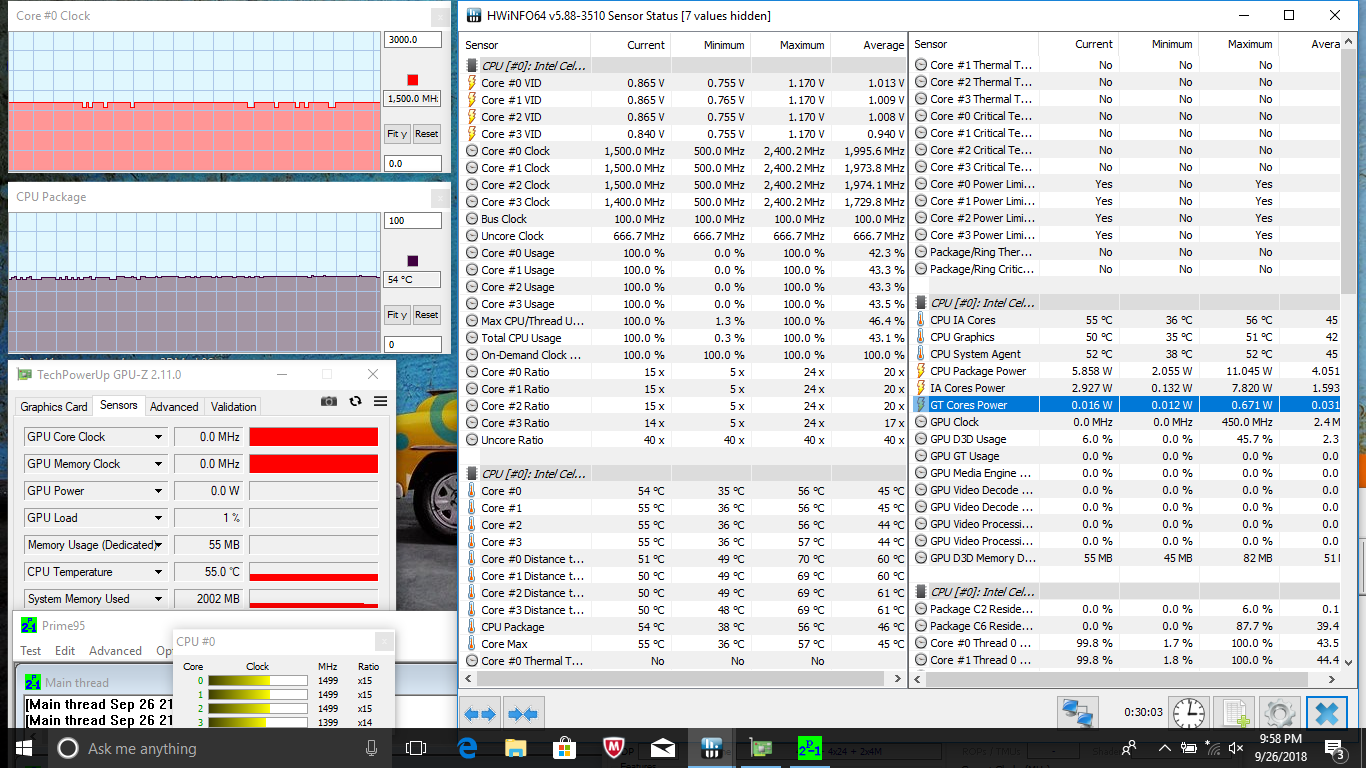
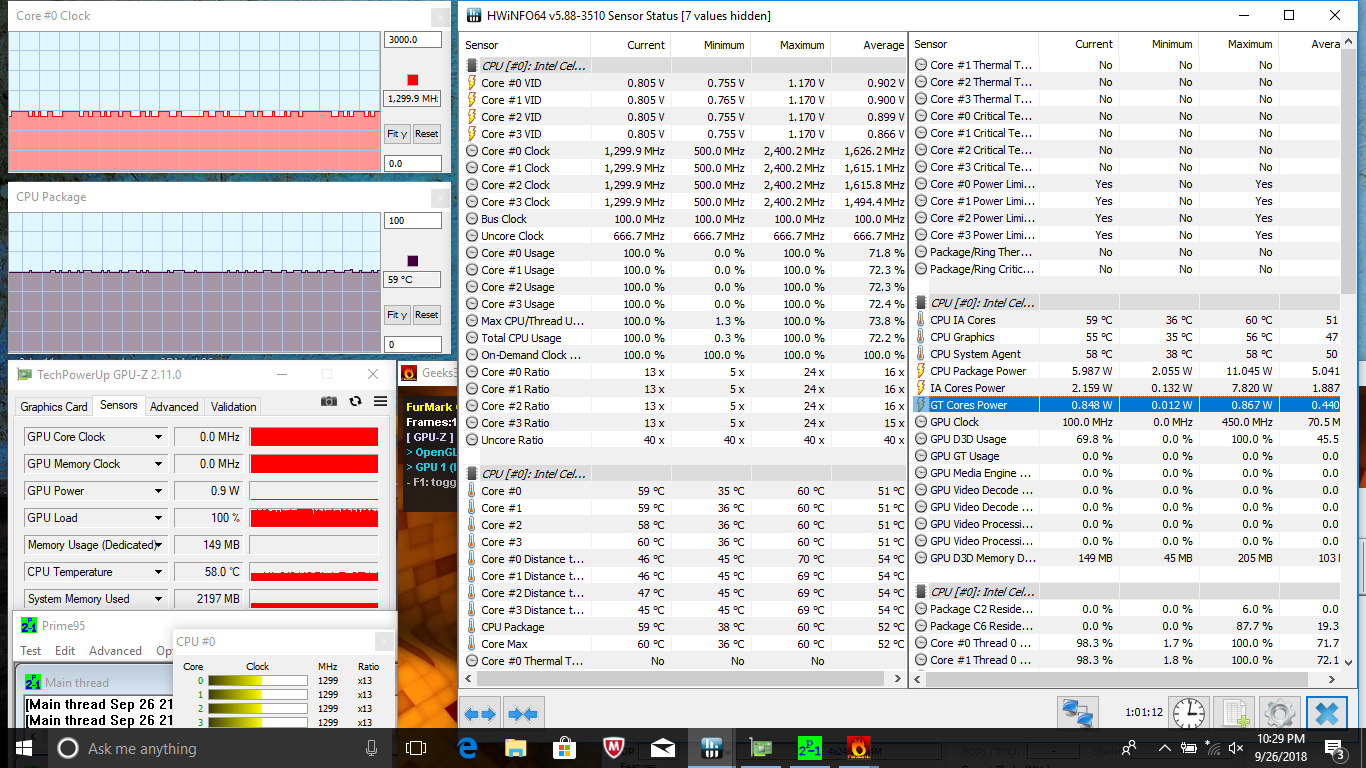
| CPU Clock (GHz) | GPU Clock (MHz) | Average CPU Temperature (°C) | |
| System Idle | -- | -- | 40 |
| Prime95 Stress | 1.5 | -- | 54 |
| Prime95 + FurMark Stress | 1.3 | 100 | 59 |
Emissions
System Noise
Unlike the other Ideapad 330 SKUs with Ryzen SoCs, this Gemini Lake configuration omits the system fan for a completely silent experience. We can notice some very slight electronic noise that is essentially inaudible when sitting at a normal distance.
Temperature
Surface temperatures are always warmer on the left half of the notebook compared to the right half due to the positioning of the CPU and heat pipes underneath. When under very high loads, one side of the keyboard can be up to 8 degrees warmer than the other. This is thankfully not a huge issue with low-power systems and we never found it uncomfortable to use. Overall temperatures are very similar to the Ideapad 330 SKU with the faster Ryzen 5 SoC.
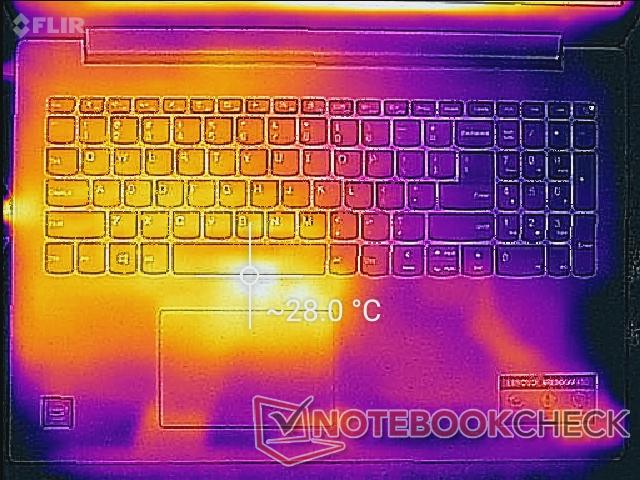

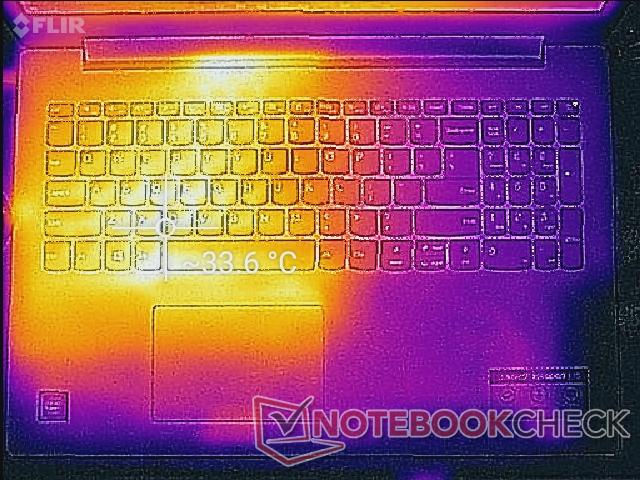
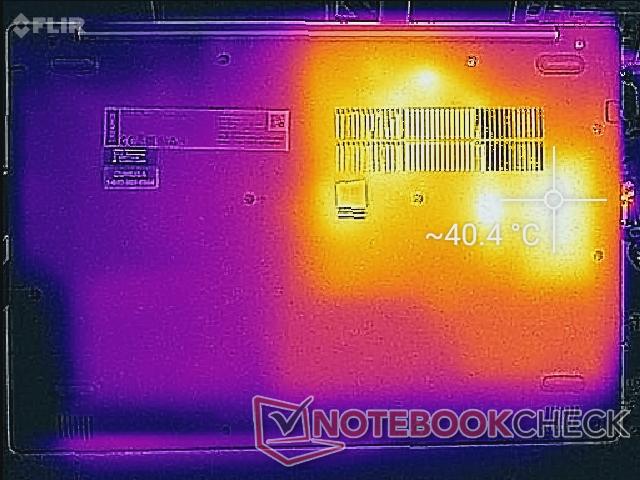
(+) The maximum temperature on the upper side is 33.8 °C / 93 F, compared to the average of 34.3 °C / 94 F, ranging from 21.2 to 62.5 °C for the class Office.
(±) The bottom heats up to a maximum of 40.2 °C / 104 F, compared to the average of 36.8 °C / 98 F
(+) In idle usage, the average temperature for the upper side is 24.9 °C / 77 F, compared to the device average of 29.5 °C / 85 F.
(+) The palmrests and touchpad are cooler than skin temperature with a maximum of 30 °C / 86 F and are therefore cool to the touch.
(-) The average temperature of the palmrest area of similar devices was 27.5 °C / 81.5 F (-2.5 °C / -4.5 F).
Speakers
Lenovo IdeaPad 330-15IGM audio analysis
(-) | not very loud speakers (69.9 dB)
Bass 100 - 315 Hz
(-) | nearly no bass - on average 21.4% lower than median
(±) | linearity of bass is average (14% delta to prev. frequency)
Mids 400 - 2000 Hz
(+) | balanced mids - only 4.8% away from median
(±) | linearity of mids is average (9.6% delta to prev. frequency)
Highs 2 - 16 kHz
(+) | balanced highs - only 3.8% away from median
(±) | linearity of highs is average (9.7% delta to prev. frequency)
Overall 100 - 16.000 Hz
(±) | linearity of overall sound is average (24.6% difference to median)
Compared to same class
» 73% of all tested devices in this class were better, 7% similar, 21% worse
» The best had a delta of 7%, average was 21%, worst was 53%
Compared to all devices tested
» 75% of all tested devices were better, 5% similar, 20% worse
» The best had a delta of 4%, average was 23%, worst was 134%
Apple MacBook 12 (Early 2016) 1.1 GHz audio analysis
(+) | speakers can play relatively loud (83.6 dB)
Bass 100 - 315 Hz
(±) | reduced bass - on average 11.3% lower than median
(±) | linearity of bass is average (14.2% delta to prev. frequency)
Mids 400 - 2000 Hz
(+) | balanced mids - only 2.4% away from median
(+) | mids are linear (5.5% delta to prev. frequency)
Highs 2 - 16 kHz
(+) | balanced highs - only 2% away from median
(+) | highs are linear (4.5% delta to prev. frequency)
Overall 100 - 16.000 Hz
(+) | overall sound is linear (10.2% difference to median)
Compared to same class
» 7% of all tested devices in this class were better, 2% similar, 90% worse
» The best had a delta of 5%, average was 18%, worst was 53%
Compared to all devices tested
» 5% of all tested devices were better, 1% similar, 94% worse
» The best had a delta of 4%, average was 23%, worst was 134%
Energy Management
Power Consumption
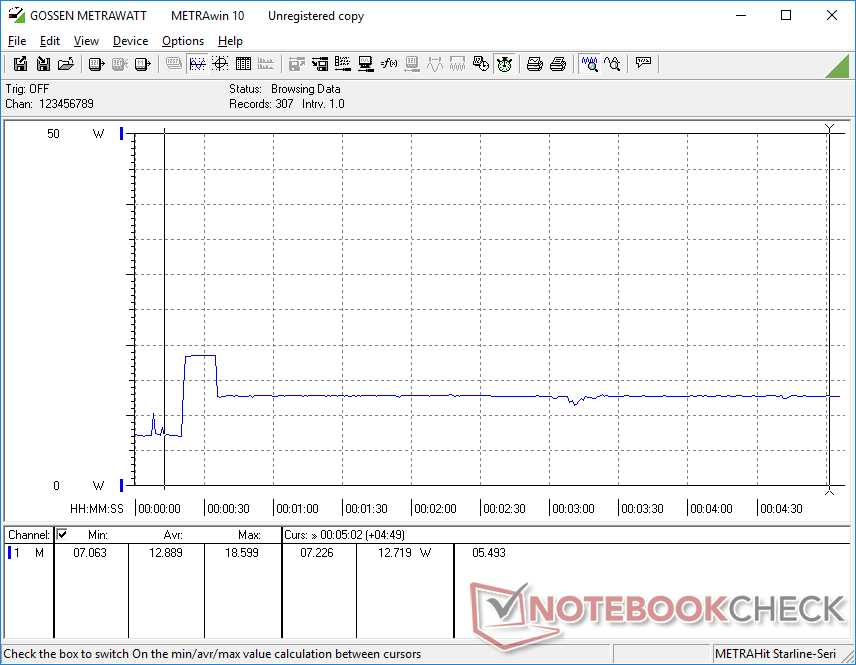
The system consumes an average of just over 13 W when under maximum load. At its peak, we are able to record 18 W for very short periods when Turbo Boost is at its highest potential. In comparison, the Ideapad 330 equipped with the Ryzen 2500U can consume over 39 W when subjected to similar loads. The Gemini Lake platform is proving to be very power efficient even when up against tablets like the Microsoft Surface Go.
The included 45 W power adapter is small at just ~6.3 x 6.3 x 2.8 cm.
| Off / Standby | |
| Idle | |
| Load |
|
Key:
min: | |
| Lenovo IdeaPad 330-15IGM Celeron N4100, UHD Graphics 600, BMSC51A3500F4SA, TN LED, 1366x768, 15.6" | Acer Extensa 2519-P35U N3710, HD Graphics 405 (Braswell), Western Digital Scorpio Blue WD5000LPCX-24C6HT0, TN LED, 1366x768, 15.6" | HP Pavilion 15-cs0053cl i5-8250U, UHD Graphics 620, Toshiba MQ04ABF100, TN LED, 1366x768, 15.6" | Microsoft Surface Go MHN-00003 Pentium 4415Y, UHD Graphics 615, 64 GB eMMC Flash, IPS, 1800x1200, 10" | Lenovo V330-15IKB i3-7130U, UHD Graphics 620, Samsung PM961 MZVLW256HEHP, TN LED, 1920x1080, 15.6" | Lenovo IdeaPad 330-15ARR 81D2005CUS R5 2500U, Vega 8, SK Hynix Canvas SC311 256GB HFS256G32TNF, TN LED, 1920x1080, 15.6" | |
|---|---|---|---|---|---|---|
| Power Consumption | -30% | -82% | -19% | -59% | -118% | |
| Idle Minimum * (Watt) | 3 | 5 -67% | 5.6 -87% | 2.88 4% | 3.2 -7% | 7.6 -153% |
| Idle Average * (Watt) | 5.7 | 6.9 -21% | 7.1 -25% | 4.8 16% | 6.7 -18% | 10.6 -86% |
| Idle Maximum * (Watt) | 7.5 | 7.8 -4% | 7.9 -5% | 7.5 -0% | 7.1 5% | 11.8 -57% |
| Load Average * (Watt) | 12.6 | 14.4 -14% | 32.8 -160% | 16.9 -34% | 29.6 -135% | 24.1 -91% |
| Load Maximum * (Watt) | 13.1 | 18.7 -43% | 30.5 -133% | 23.8 -82% | 31.5 -140% | 39.4 -201% |
| Witcher 3 ultra * (Watt) | 30.3 |
* ... smaller is better
Battery Life
Internal battery capacity is actually slightly smaller than on the AMD Ideapad 330 (30 Wh vs. 35 Wh). Despite this, runtimes are still longer since the N4100 requires just a fraction of the power of a Ryzen SoC. Expect about 5.5 hours of constant WLAN use from the system.
Charging from near empty to full capacity takes just over 2 hours.
| Lenovo IdeaPad 330-15IGM Celeron N4100, UHD Graphics 600, 30 Wh | Acer Extensa 2519-P35U N3710, HD Graphics 405 (Braswell), Wh | HP Pavilion 15-cs0053cl i5-8250U, UHD Graphics 620, 41 Wh | Lenovo IdeaPad 330-15ARR 81D2005CUS R5 2500U, Vega 8, 35 Wh | Microsoft Surface Go MHN-00003 Pentium 4415Y, UHD Graphics 615, 28 Wh | Lenovo V330-15IKB i3-7130U, UHD Graphics 620, 30 Wh | |
|---|---|---|---|---|---|---|
| Battery runtime | -51% | 27% | -27% | 36% | -16% | |
| WiFi v1.3 (h) | 5.5 | 2.7 -51% | 7 27% | 4 -27% | 7.5 36% | 4.6 -16% |
| Reader / Idle (h) | 12 | 12.9 | ||||
| Load (h) | 2.2 | 3 |
Pros
Cons
Verdict

The Celeron Ideapad 330 is a bit more than just a processor swap when compared to the Ryzen Ideapad 330. USB Type-C is missing, there is no system fan, and the battery is smaller. Our Celeron configuration is about 70 percent and 80 percent slower in raw CPU and GPU power, respectively, than the Ryzen 5 configuration.
The very low-power Intel CPU brings a couple of noteworthy advantages over the Ryzen option. Namely, the system is completely silent and can run for almost two hours longer. For streaming, browsing, and word processing, the Intel Ideapad 330 is adequate if not just on the fence. We recommend upgrading to the 1080p display if possible as the 768p panel is not pleasant to look at it for video or work.
Acceptable for silent browsing, word processing, and outputting 4K 30 FPS video. There are numerous cut corners that we hope future iterations will address such as USB Type-C charging, a very poor 768p panel, and the lack of a convenient USB port along the right edge.
Lenovo IdeaPad 330-15IGM
- 09/28/2018 v6 (old)
Allen Ngo
Price comparison
