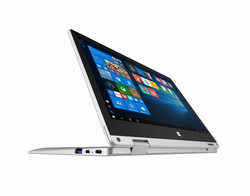
Trekstor Primebook C11 (N3350, HD500) Convertible Review
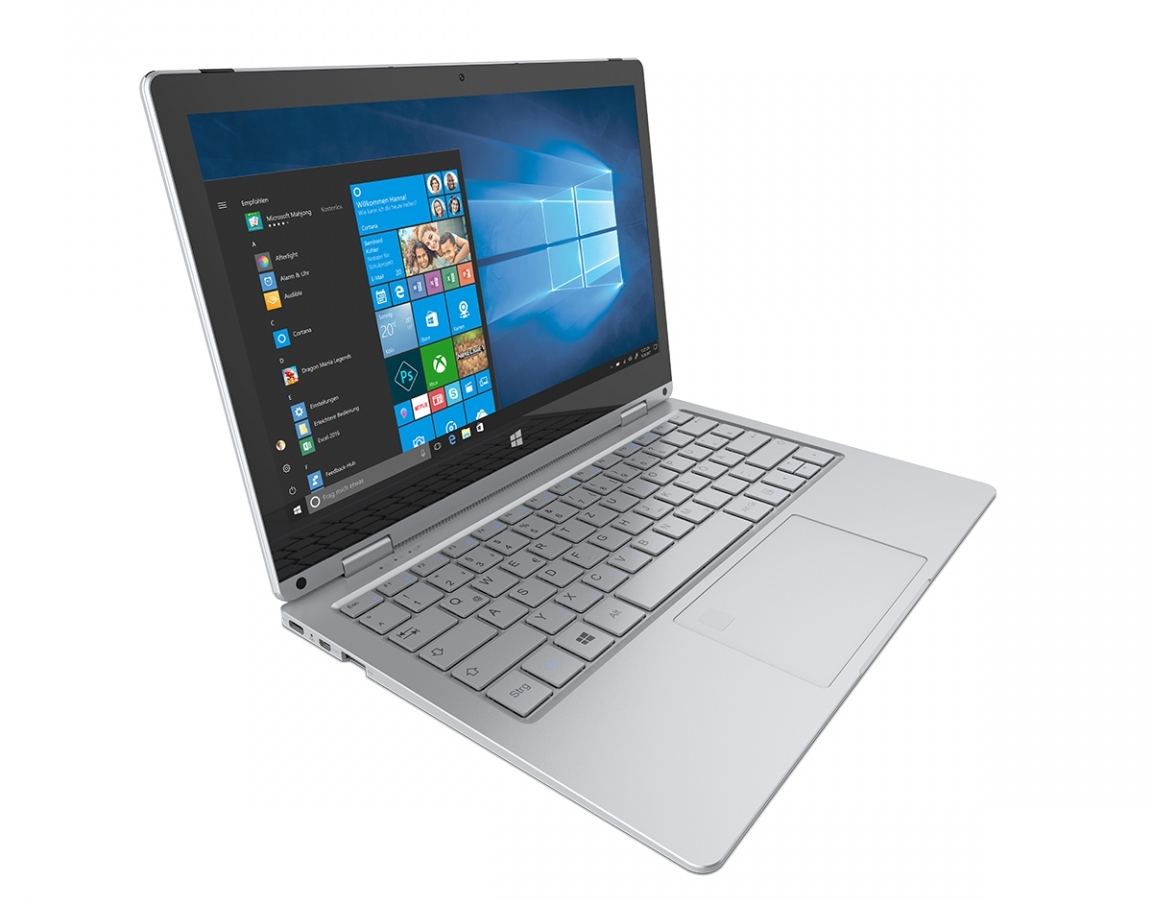
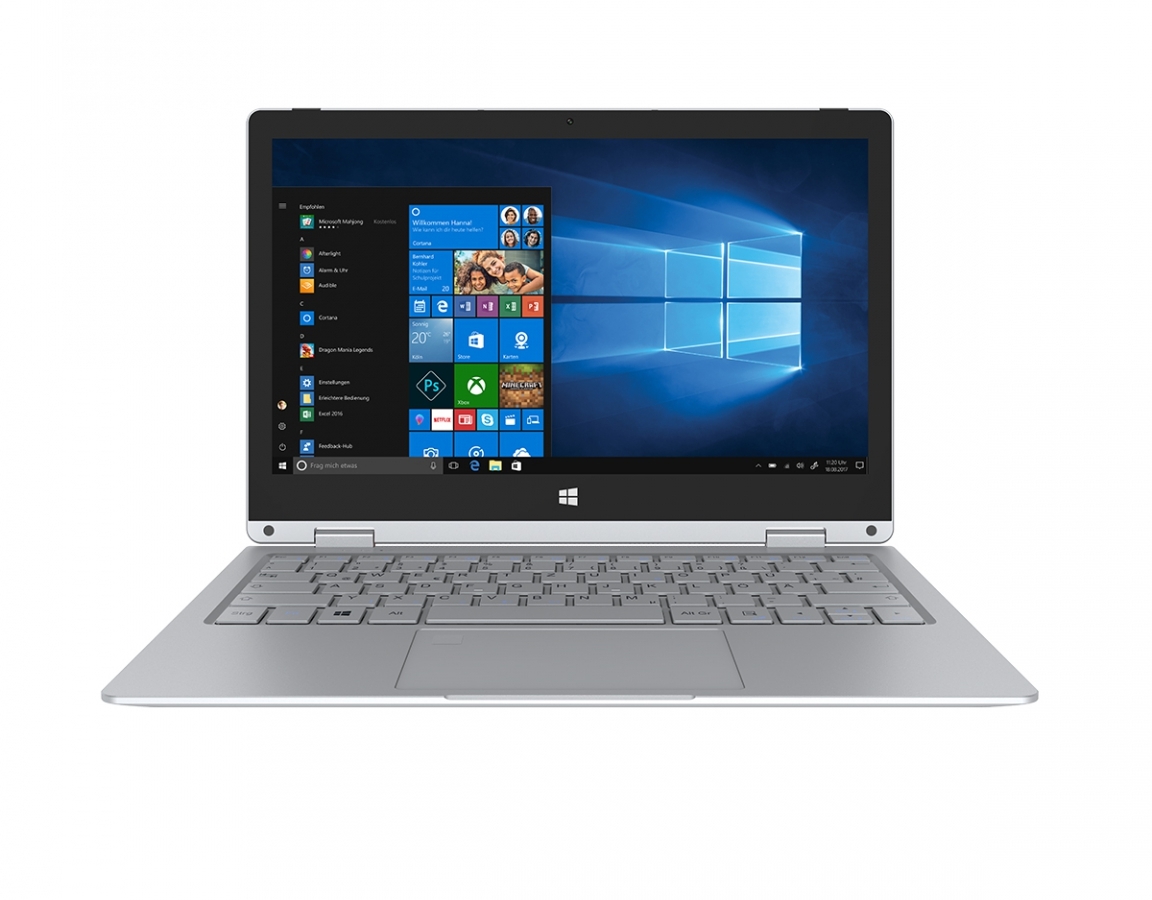
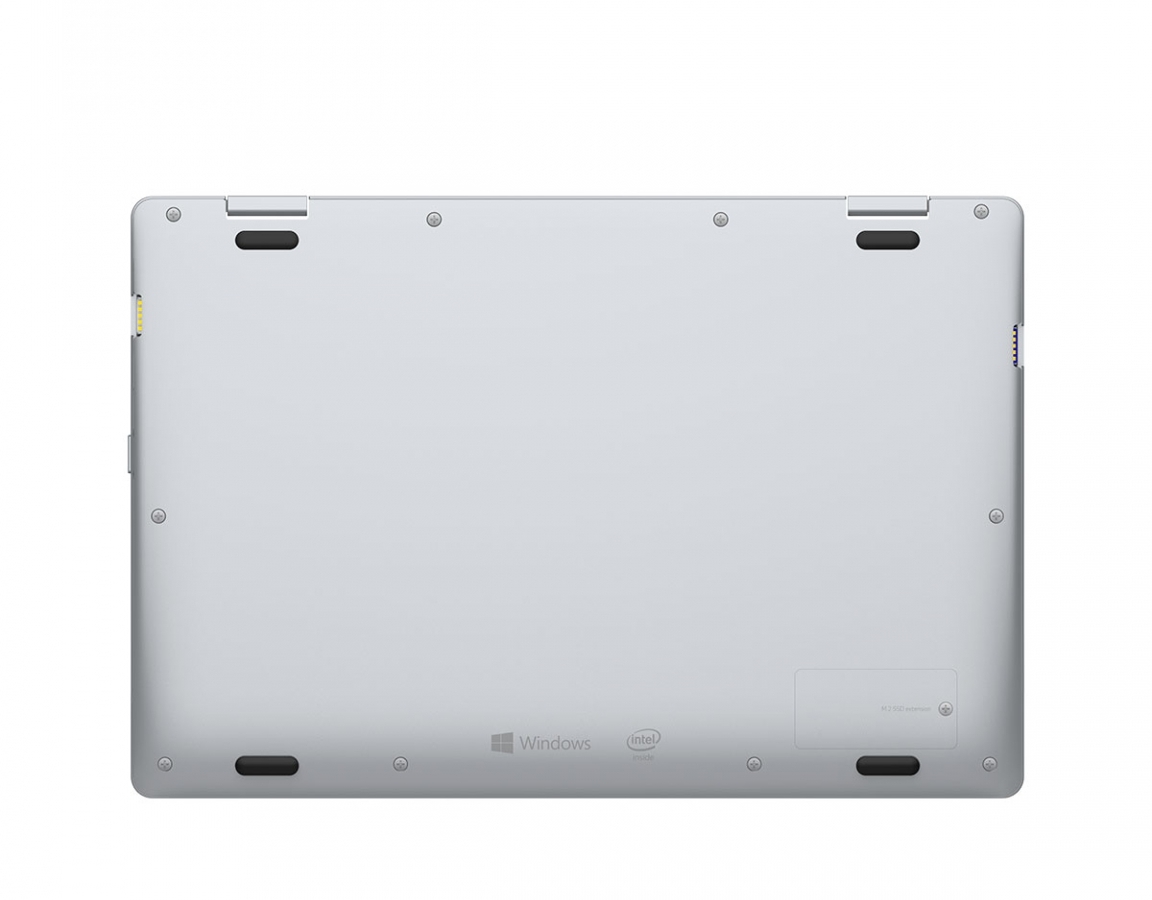
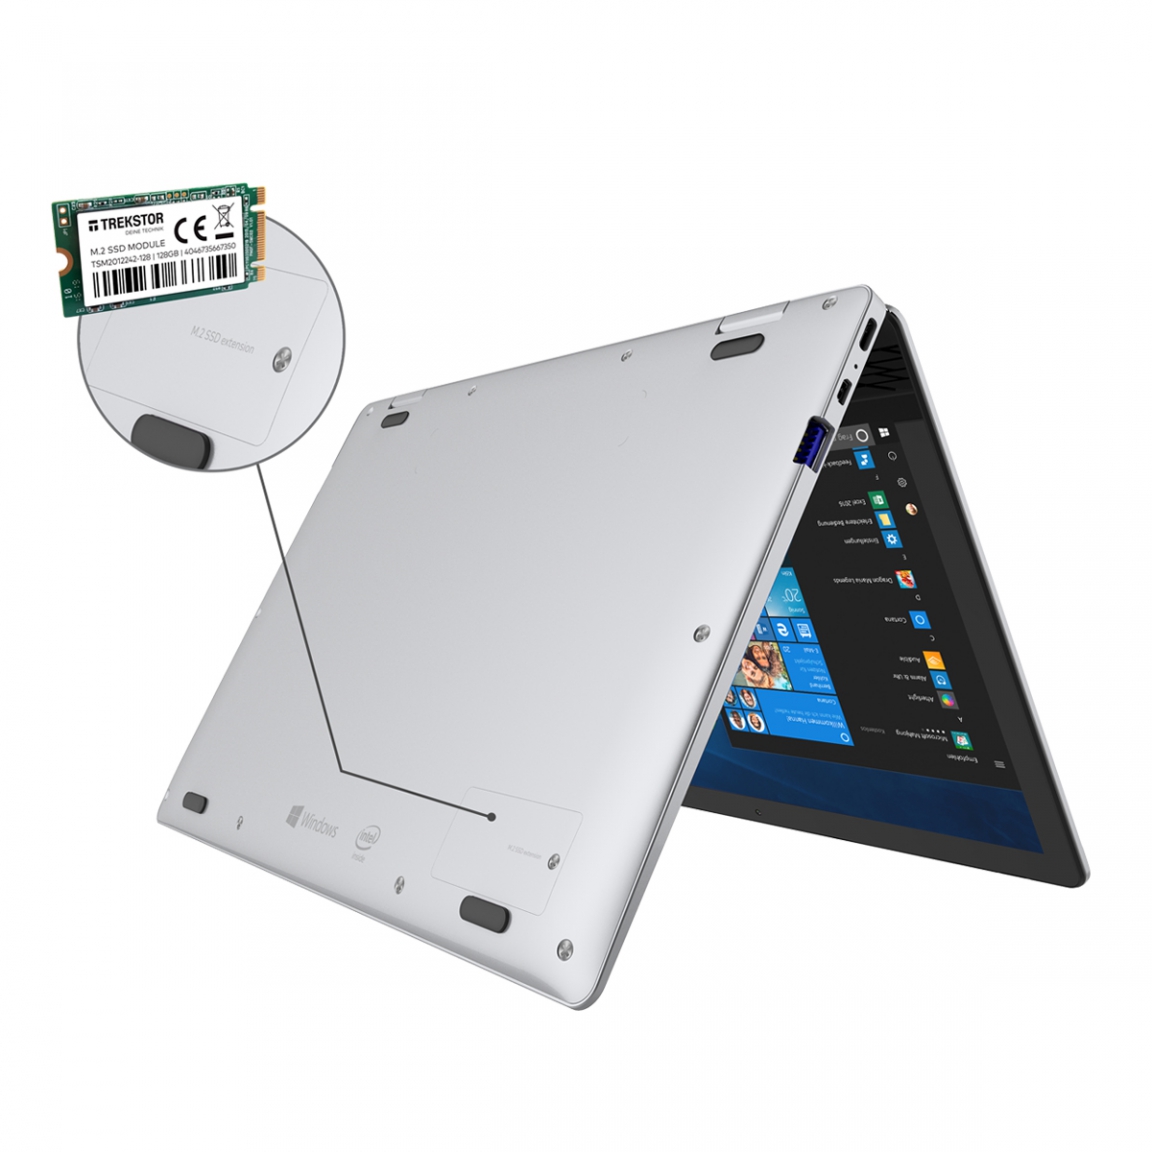
Not long ago we reviewed the Primebook C13 from Trekstor. The device offered enough performance to be able to run most simple applications. Now the Primebook C11 hits the market. It comes with identical hardware, but in a smaller form-factor. Just like the bigger brother, it features a slot for an M.2 SSD, which is hidden behind a maintenance hatch, and is powered by an Intel Celeron N3350 with Intel’s integrated HD Graphics 500.
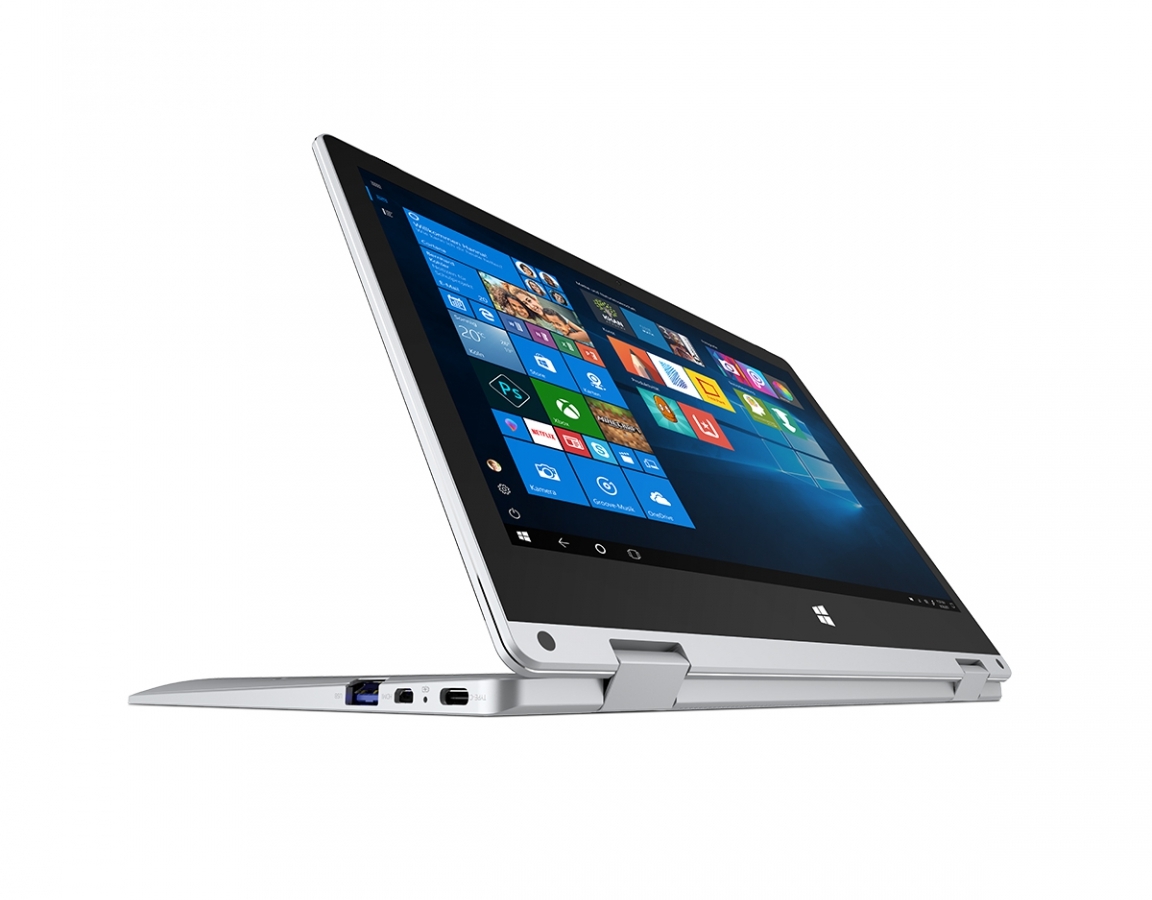
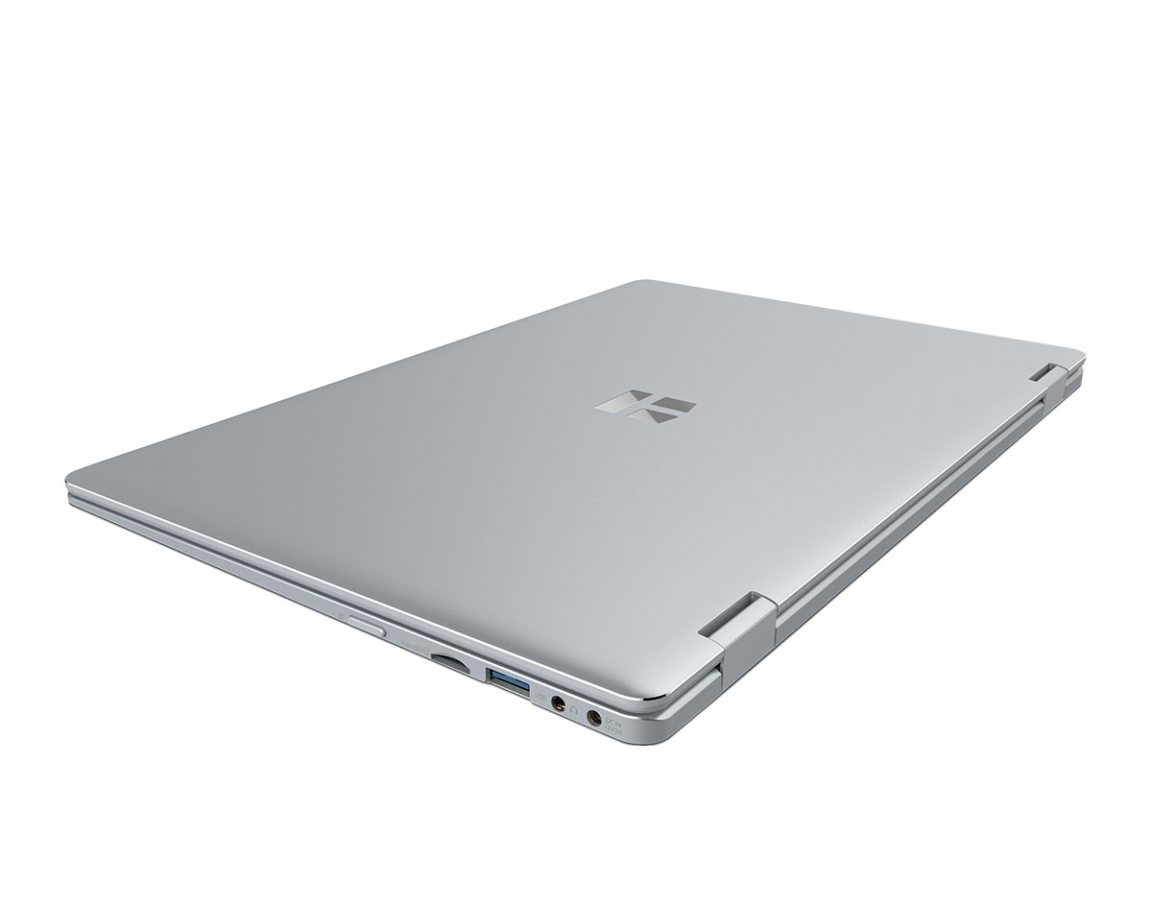
The 11-inch device is somewhat easier to handle than the 13-inch model, which is most noticeable in tablet mode. The glossy Full HD IPS display has a native resolution of 1920x1080 and offers great color space coverage. The touchscreen also works well. This is why there is no need to connect any conventional input devices to the convertible. The keyboard could have been more sturdy, but it fulfills its purpose, anyway.
When making comparisons with other cheap notebooks, we focus, above all, on the price and the size of the competing devices. This is why we compare the Primebook C11 with other 11-inch convertibles that cost less 500 Euros. The competing devices include: The Acer Spin 1 SP111-31-C79E, Lenovo’s Ideapad 120s, the VivoBook E12 E203NA-FD026T from Asus and the Medion Akoya E2228T. We will go into more detail about the benchmark and test results in the “Verdict” section of this short review.
| SD Card Reader | |
| average JPG Copy Test (av. of 3 runs) | |
| Lenovo Ideapad 120s-11IAP (Toshiba Exceria Pro M401) | |
| Average of class Subnotebook (18.4 - 86.7, n=9, last 2 years) | |
| Asus VivoBook E12 E203NA-FD026T (Toshiba Exceria Pro M501 microSDXC 64GB) | |
| Trekstor Primebook C13 (Toshiba Exceria Pro M501 microSDXC 64GB) | |
| Trekstor Primebook C11 (Toshiba Exceria Pro M501 microSDXC 64GB) | |
| Medion Akoya E2228T-MD61250 (Toshiba Exceria Pro M501 microSDXC 64GB) | |
| maximum AS SSD Seq Read Test (1GB) | |
| Lenovo Ideapad 120s-11IAP (Toshiba Exceria Pro M401) | |
| Average of class Subnotebook (22.5 - 181.1, n=8, last 2 years) | |
| Asus VivoBook E12 E203NA-FD026T (Toshiba Exceria Pro M501 microSDXC 64GB) | |
| Trekstor Primebook C13 (Toshiba Exceria Pro M501 microSDXC 64GB) | |
| Medion Akoya E2228T-MD61250 (Toshiba Exceria Pro M501 microSDXC 64GB) | |
| Trekstor Primebook C11 (Toshiba Exceria Pro M501 microSDXC 64GB) | |
| Networking | |
| iperf3 transmit AX12 | |
| Trekstor Primebook C13 | |
| Asus VivoBook E12 E203NA-FD026T | |
| Lenovo Ideapad 120s-11IAP | |
| Medion Akoya E2228T-MD61250 | |
| Acer Spin 1 SP111-31-C79E | |
| Trekstor Primebook C11 | |
| iperf3 receive AX12 | |
| Lenovo Ideapad 120s-11IAP | |
| Acer Spin 1 SP111-31-C79E | |
| Asus VivoBook E12 E203NA-FD026T | |
| Trekstor Primebook C13 | |
| Trekstor Primebook C11 | |
| Medion Akoya E2228T-MD61250 | |
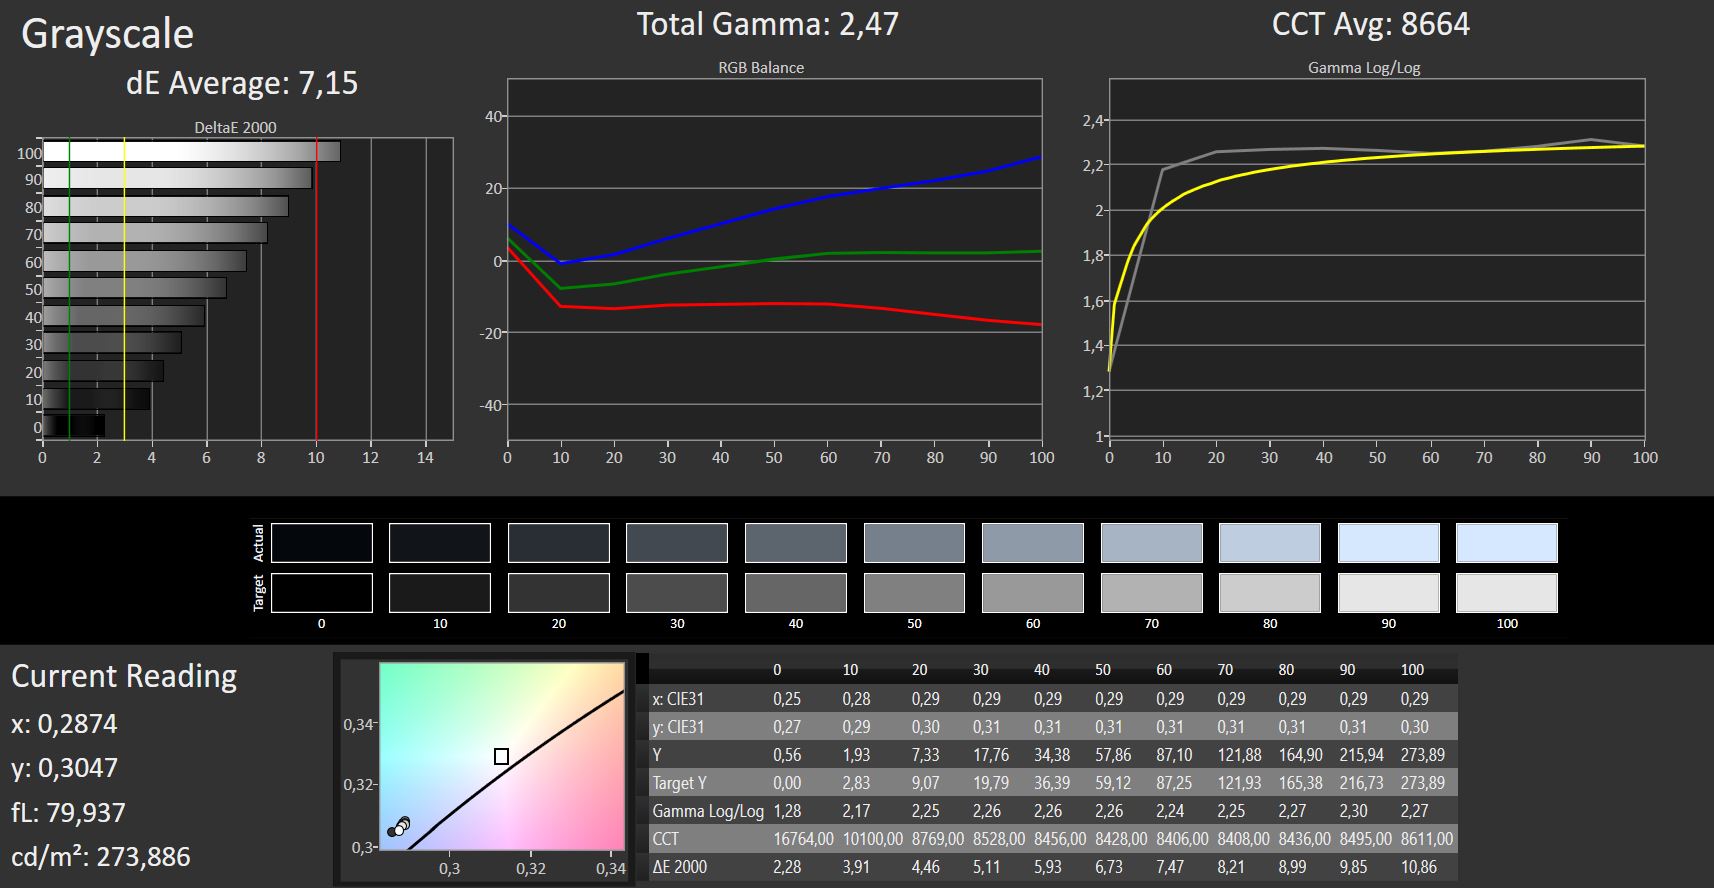
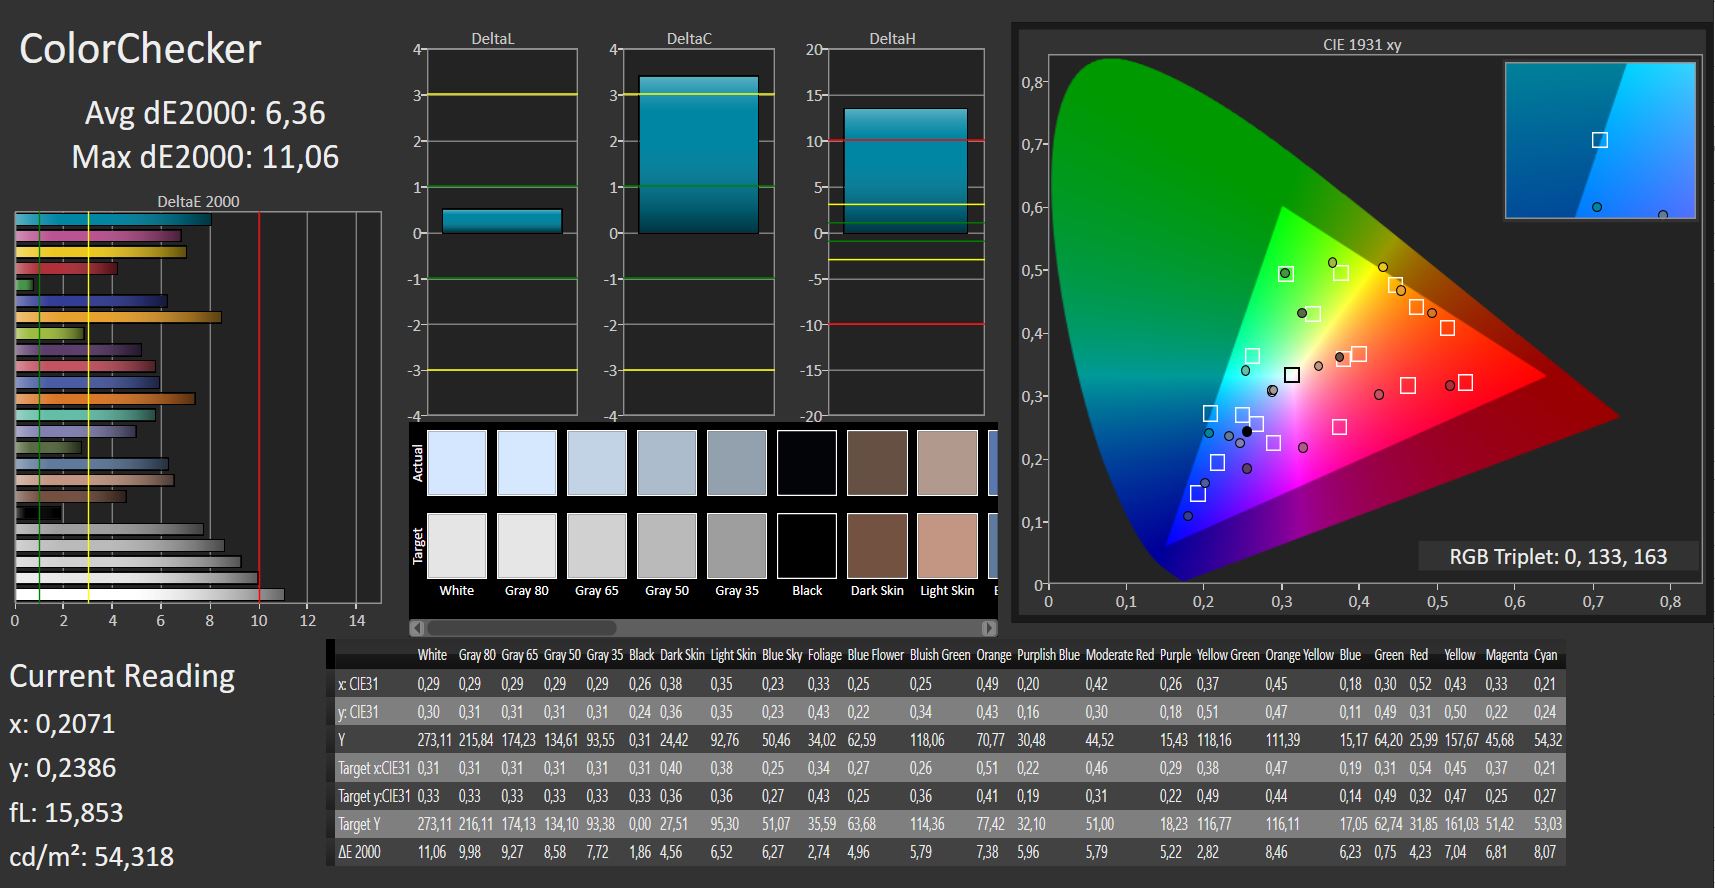
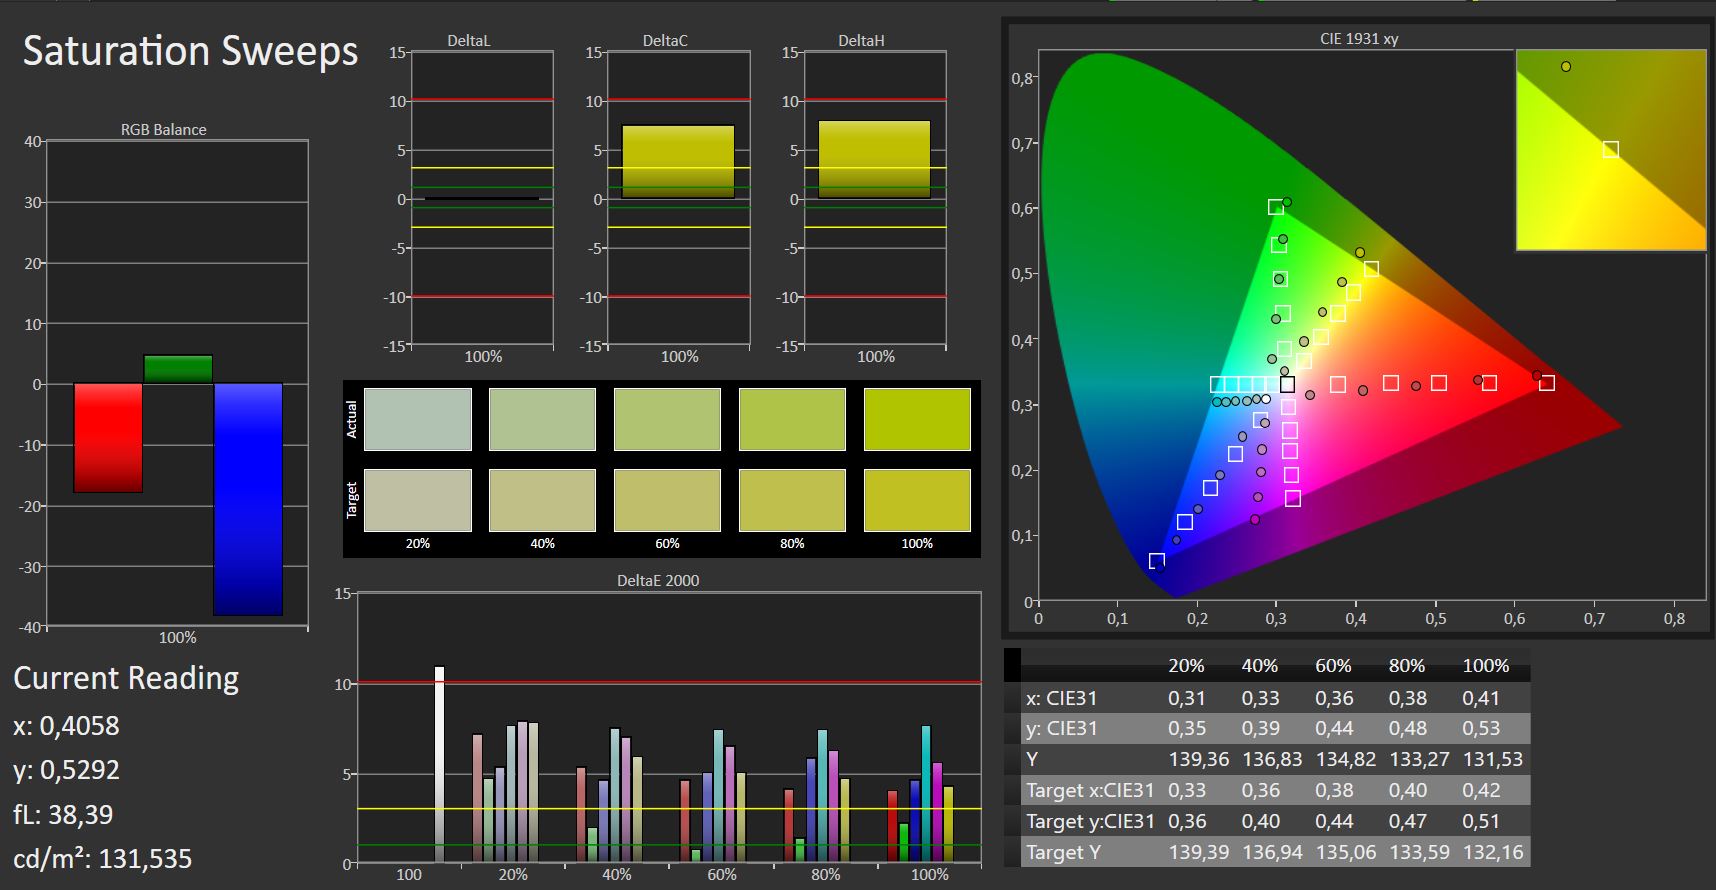
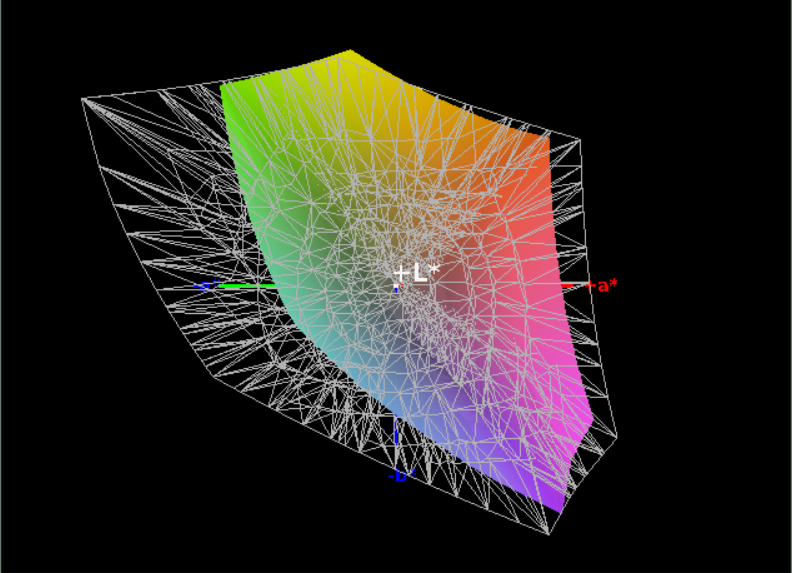
Display - a lot of colors flicker on the Primebook C11
| |||||||||||||||||||||||||
Brightness Distribution: 81 %
Center on Battery: 284 cd/m²
Contrast: 618:1 (Black: 0.44 cd/m²)
ΔE ColorChecker Calman: 6.36 | ∀{0.5-29.43 Ø4.74}
ΔE Greyscale Calman: 7.15 | ∀{0.09-98 Ø4.98}
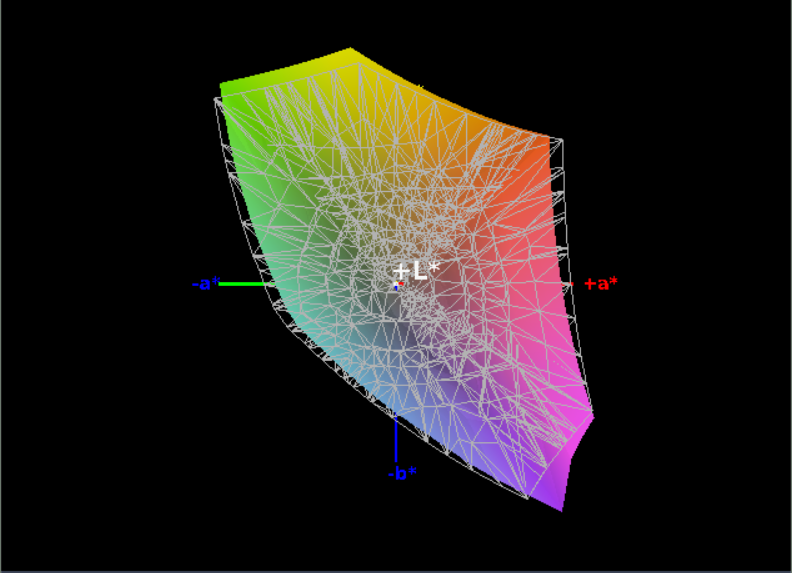
93% sRGB (Argyll 1.6.3 3D)
60% AdobeRGB 1998 (Argyll 1.6.3 3D)
66.2% AdobeRGB 1998 (Argyll 3D)
92.8% sRGB (Argyll 3D)
64.9% Display P3 (Argyll 3D)
Gamma: 2.47
CCT: 8664 K
| Trekstor Primebook C11 MS_9003, IPS, 1920x1080, 11.6" | Trekstor Primebook C13 PBTB133F006-A, IPS, 1920x1080, 13.3" | Lenovo Ideapad 120s-11IAP AU Optronics AUO-B116XTN02.5 , TN LED, 1366x768, 11.6" | Acer Spin 1 SP111-31-C79E AU Optronics B116HAN05.0, IPS, 1920x1080, 11.6" | Asus VivoBook E12 E203NA-FD026T AU Optronics B116XTN02.2, TN LED, 1366x768, 11.6" | Medion Akoya E2228T-MD61250 Chi Mei N116HSE-EJ1, IPS, 1920x1080, 11.6" | Average of class Subnotebook | |
|---|---|---|---|---|---|---|---|
| Screen | 4% | -47% | 18% | -23% | 32% | 60% | |
| Brightness middle (cd/m²) | 272 | 201 -26% | 266.2 -2% | 251 -8% | 253 -7% | 504 85% | 434 ? 60% |
| Brightness (cd/m²) | 249 | 207 -17% | 251 1% | 247 -1% | 234 -6% | 497 100% | |
| Brightness Distribution (%) | 81 | 88 9% | 90 11% | 86 6% | 87 7% | 86 6% | |
| Black Level * (cd/m²) | 0.44 | 0.22 50% | 0.67 -52% | 0.21 52% | 0.33 25% | 0.52 -18% | 0.1534 ? 65% |
| Contrast (:1) | 618 | 914 48% | 397 -36% | 1195 93% | 767 24% | 969 57% | |
| Colorchecker dE 2000 * | 6.36 | 6.6 -4% | 12.4 -95% | 4.27 33% | 10.84 -70% | 4.48 30% | 2.49 ? 61% |
| Colorchecker dE 2000 max. * | 11.06 | 12.39 -12% | 24.5 -122% | 11 1% | 17.48 -58% | 9.38 15% | 5.43 ? 51% |
| Greyscale dE 2000 * | 7.15 | 7.73 -8% | 14.4 -101% | 3.77 47% | 11.86 -66% | 1.63 77% | 2.51 ? 65% |
| Gamma | 2.47 89% | 2.46 89% | 2.16 102% | 2.26 97% | 2.72 81% | 2.41 91% | 2.21 100% ? |
| CCT | 8664 75% | 7864 83% | 19436 33% | 6524 100% | 12882 50% | 6715 97% | 6592 99% ? |
| Color Space (Percent of AdobeRGB 1998) (%) | 60 | 61 2% | 37 -38% | 47 -22% | 36 -40% | 51 -15% | |
| Color Space (Percent of sRGB) (%) | 93 | 93 0% | 59 -37% | 72 -23% | 57 -39% | 77 -17% |
* ... smaller is better
Display Response Times
| ↔ Response Time Black to White | ||
|---|---|---|
| 32 ms ... rise ↗ and fall ↘ combined | ↗ 18 ms rise | 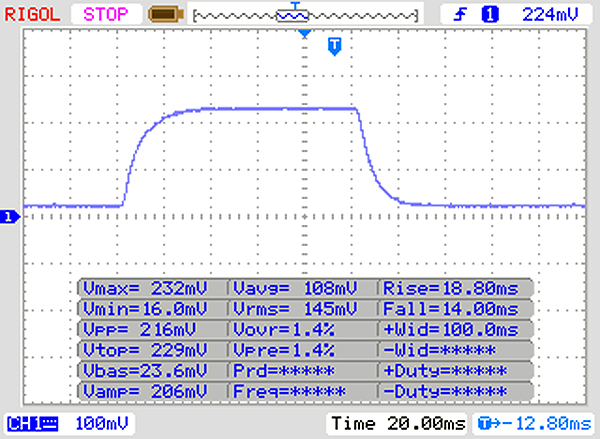 |
| ↘ 14 ms fall | ||
| The screen shows slow response rates in our tests and will be unsatisfactory for gamers. In comparison, all tested devices range from 0.1 (minimum) to 240 (maximum) ms. » 86 % of all devices are better. This means that the measured response time is worse than the average of all tested devices (19.9 ms). | ||
| ↔ Response Time 50% Grey to 80% Grey | ||
| 41 ms ... rise ↗ and fall ↘ combined | ↗ 20 ms rise | 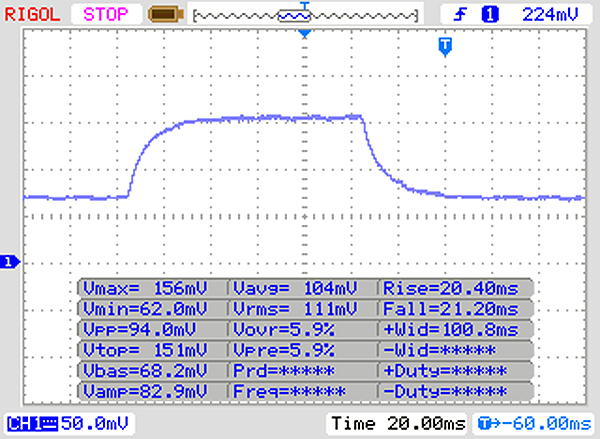 |
| ↘ 21 ms fall | ||
| The screen shows slow response rates in our tests and will be unsatisfactory for gamers. In comparison, all tested devices range from 0.165 (minimum) to 636 (maximum) ms. » 64 % of all devices are better. This means that the measured response time is worse than the average of all tested devices (31.2 ms). | ||
Screen Flickering / PWM (Pulse-Width Modulation)
| Screen flickering / PWM detected | 200 Hz | ≤ 20 % brightness setting | 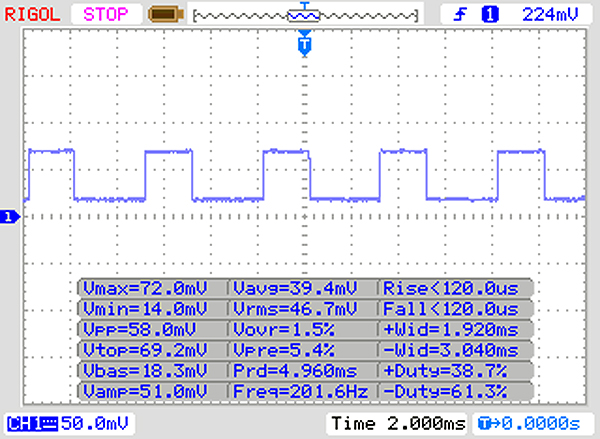 |
The display backlight flickers at 200 Hz (worst case, e.g., utilizing PWM) Flickering detected at a brightness setting of 20 % and below. There should be no flickering or PWM above this brightness setting. The frequency of 200 Hz is relatively low, so sensitive users will likely notice flickering and experience eyestrain at the stated brightness setting and below. In comparison: 52 % of all tested devices do not use PWM to dim the display. If PWM was detected, an average of 7867 (minimum: 5 - maximum: 343500) Hz was measured. | |||
Performance - Trekstor does not live up to the expectations
Processor
System Performance
| PCMark 8 - Home Score Accelerated v2 | |
| Asus VivoBook E12 E203NA-FD026T | |
| Lenovo Ideapad 120s-11IAP | |
| Average of class Subnotebook (1739 - 1828, n=2, last 2 years) | |
| Average Intel Celeron N3350, Intel HD Graphics 500 (1462 - 1816, n=8) | |
| Trekstor Primebook C13 | |
| Trekstor Primebook C11 | |
| Acer Spin 1 SP111-31-C79E | |
| Medion Akoya E2228T-MD61250 | |
| PCMark 8 Home Score Accelerated v2 | 1564 points | |
Help | ||
Storage Devices
| Trekstor Primebook C11 HD Graphics 500, Celeron N3350, SanDisk DF4064 | Trekstor Primebook C13 HD Graphics 500, Celeron N3350, SanDisk DF4064 | Acer Spin 1 SP111-31-C79E HD Graphics 500, Celeron N3450, Toshiba MQ01ABF050 | Asus VivoBook E12 E203NA-FD026T HD Graphics 500, Celeron N3350, 32 GB eMMC Flash | Medion Akoya E2228T-MD61250 HD Graphics 400 (Braswell), Z8350, 64 GB eMMC Flash | Average SanDisk DF4064 | |
|---|---|---|---|---|---|---|
| CrystalDiskMark 3.0 | -4% | -71% | 3% | -29% | -2% | |
| Read Seq (MB/s) | 265.4 | 265.4 0% | 109.1 -59% | 276.6 4% | 119.3 -55% | 265 ? 0% |
| Write Seq (MB/s) | 111.2 | 113.8 2% | 107.3 -4% | 78.3 -30% | 41.38 -63% | 112.5 ? 1% |
| Read 512 (MB/s) | 205.4 | 207.2 1% | 35.89 -83% | 238.1 16% | 101.3 -51% | 206 ? 0% |
| Write 512 (MB/s) | 85.3 | 85.9 1% | 45.28 -47% | 43.83 -49% | 34.28 -60% | 85.6 ? 0% |
| Read 4k (MB/s) | 9.175 | 5.212 -43% | 0.482 -95% | 8.963 -2% | 10.74 17% | 7.19 ? -22% |
| Write 4k (MB/s) | 8.721 | 9.903 14% | 1.037 -88% | 10.17 17% | 11.3 30% | 9.31 ? 7% |
| Read 4k QD32 (MB/s) | 32.66 | 32.26 -1% | 1.003 -97% | 29.66 -9% | 14.76 -55% | 32.5 ? 0% |
| Write 4k QD32 (MB/s) | 14.19 | 13.83 -3% | 1.043 -93% | 24.63 74% | 14.57 3% | 14 ? -1% |

Graphics Card
| 3DMark 11 - 1280x720 Performance GPU | |
| Average of class Subnotebook (995 - 16296, n=59, last 2 years) | |
| Trekstor Primebook C13 | |
| Trekstor Primebook C11 | |
| Asus VivoBook E12 E203NA-FD026T | |
| Lenovo Ideapad 120s-11IAP | |
| Average Intel HD Graphics 500 (368 - 584, n=11) | |
| Acer Spin 1 SP111-31-C79E | |
| Medion Akoya E2228T-MD61250 | |
| 3DMark 11 Performance | 589 points | |
Help | ||
Emissions & Energy Management - battery: Primetime with Primebook
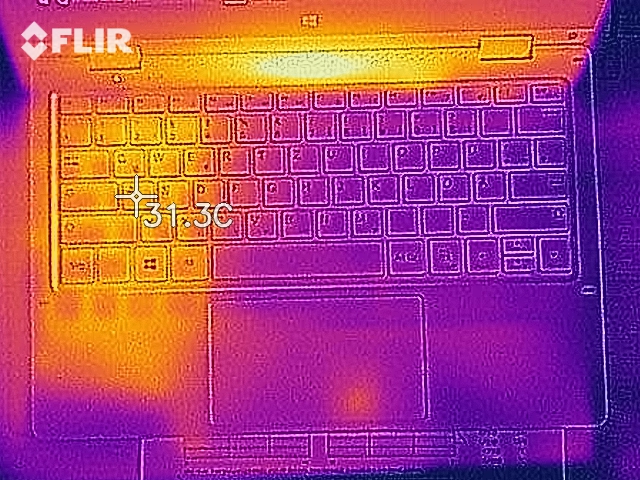
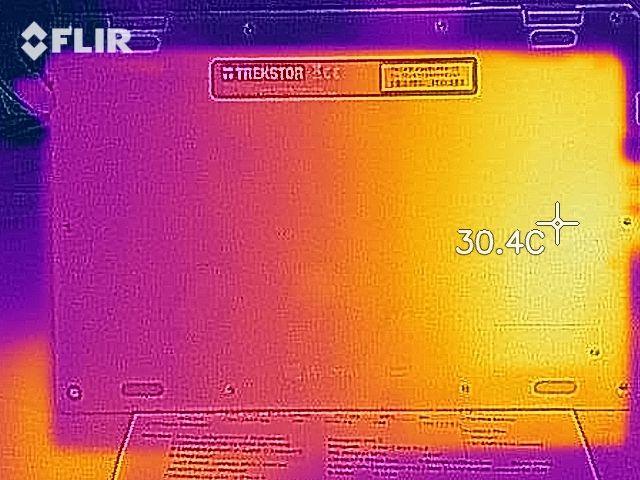
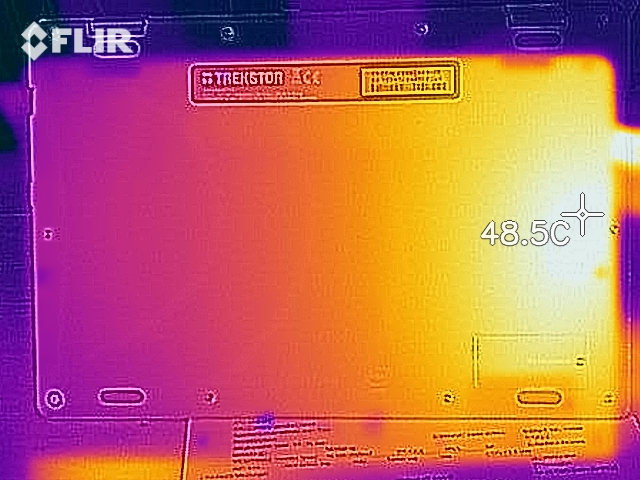
Temperature
(+) The maximum temperature on the upper side is 33.4 °C / 92 F, compared to the average of 35.9 °C / 97 F, ranging from 21.4 to 59 °C for the class Subnotebook.
(+) The bottom heats up to a maximum of 33.7 °C / 93 F, compared to the average of 39.2 °C / 103 F
(+) In idle usage, the average temperature for the upper side is 26.3 °C / 79 F, compared to the device average of 30.8 °C / 87 F.
(+) The palmrests and touchpad are cooler than skin temperature with a maximum of 30.7 °C / 87.3 F and are therefore cool to the touch.
(-) The average temperature of the palmrest area of similar devices was 28.2 °C / 82.8 F (-2.5 °C / -4.5 F).

Speakers
Trekstor Primebook C11 audio analysis
(±) | speaker loudness is average but good (73.7 dB)
Bass 100 - 315 Hz
(-) | nearly no bass - on average 30% lower than median
(±) | linearity of bass is average (7.2% delta to prev. frequency)
Mids 400 - 2000 Hz
(±) | higher mids - on average 5.7% higher than median
(±) | linearity of mids is average (10.5% delta to prev. frequency)
Highs 2 - 16 kHz
(±) | higher highs - on average 8.7% higher than median
(+) | highs are linear (5.4% delta to prev. frequency)
Overall 100 - 16.000 Hz
(-) | overall sound is not linear (32.1% difference to median)
Compared to same class
» 93% of all tested devices in this class were better, 2% similar, 4% worse
» The best had a delta of 5%, average was 18%, worst was 53%
Compared to all devices tested
» 91% of all tested devices were better, 2% similar, 7% worse
» The best had a delta of 4%, average was 24%, worst was 134%
Apple MacBook 12 (Early 2016) 1.1 GHz audio analysis
(+) | speakers can play relatively loud (83.6 dB)
Bass 100 - 315 Hz
(±) | reduced bass - on average 11.3% lower than median
(±) | linearity of bass is average (14.2% delta to prev. frequency)
Mids 400 - 2000 Hz
(+) | balanced mids - only 2.4% away from median
(+) | mids are linear (5.5% delta to prev. frequency)
Highs 2 - 16 kHz
(+) | balanced highs - only 2% away from median
(+) | highs are linear (4.5% delta to prev. frequency)
Overall 100 - 16.000 Hz
(+) | overall sound is linear (10.2% difference to median)
Compared to same class
» 7% of all tested devices in this class were better, 2% similar, 91% worse
» The best had a delta of 5%, average was 18%, worst was 53%
Compared to all devices tested
» 5% of all tested devices were better, 1% similar, 94% worse
» The best had a delta of 4%, average was 24%, worst was 134%
Frequency diagram in comparison (checkboxes can be checked and unchecked!)
Energy Consumption
| Off / Standby | |
| Idle | |
| Load |
|
Key:
min: | |
Pros
Cons
Verdict - Trekstor shrinks the C13 down to C11
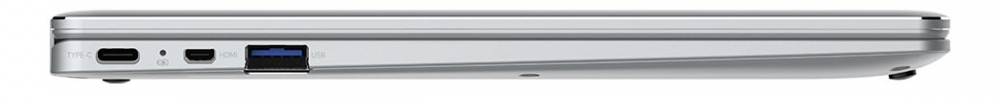
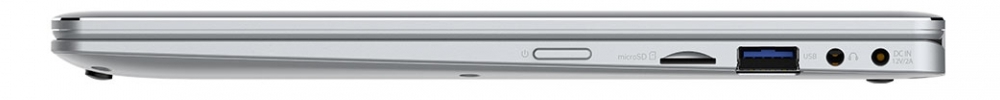
In our review, the Primebook C11 always remains close to the bigger brother Primebook C13. However, the performance does not entirely live up to our expectations. Here, the system performance is comparable to other similarly-equipped devices. However, other manufacturers can offer even more performance for 280 Euros. In terms of the ports, the Primebook C11 is limited to the bare minimum, which should not be understood as criticism by any means. Besides a separate DC power socket, our review device also features a USB Type-C port, which can be used to charge the laptop with the 40-watt AC adapter.
The display of the Primebook C11 is really worth a look for photo enthusiasts. Because the screen manages to cover over 90 % of the sRGB color space, the images should be rendered accurately. Our review device offers enough performance for simple image editing. However, it is not going to be able to handle any more demanding applications. Our review device uses PWM for brightness control. Because, it comes with a comparatively low frequency of 300 Hz (20 % brightness), it can cause problems for users with susceptible eyes.
In terms of battery life, the Primebook C11 beats the bigger model and takes a spot in the middle of our comparison chart. While the Primebook C11 does not feature a user-replaceable battery, it does offer a slot for an M.2 SSD. This slot is located behind a maintenance hatch. It is easy to open and it takes SSDs with a length of 52 mm.
Buyers of the Primebook C11 get a convertible that cannot realize its full potential, but which still offers a solid system performance. The good display and easily upgradable internal storage constitute a good reason to buy. However, prospective buyers should not forget that the Primebook C11 cannot run demanding applications and that it is only fit for office work and Internet browsing.
Trekstor Primebook C11
- 03/24/2018 v6 (old)
Mike Wobker
Price comparison
