Notebook reviews with Intel HD Graphics 500 graphics card
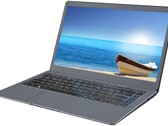
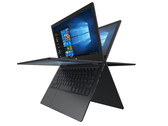
Jumper EZbook X3 Review: Ancient technology meets wobbly chassis
Naturally, a small amount of money only gets you a small amount of notebook. Jumper's creation, which they are selling for well under $300, cannot shine in any area. The weak workmanship, bad input devices and slow hardware are some of the things we wouldn't wish on anybody.
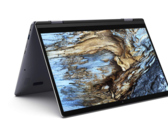
Intel Celeron N3350, HD Graphics 500, 13.3", 1.3 kgReview XIDU PhilBook Max Convertible: Dark touch screen and little performance
The PhilBook Max is a 14.1 inch convertible for just over 400 euros. The equipment is fine, but the manufacturer XIDU unfortunately relies on a dark display and a slow Celeron processor.
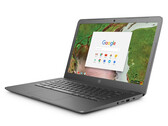
Intel Celeron J3355, HD Graphics 500, 14.1", 1.5 kgHP Chromebook 14 G5 (Celeron N3350, 32 GB eMMC, 4 GB RAM, FHD) Laptop Review
The HP Chromebook 14 G5 runs silently and has excellent battery life. The device has Google Play Store integration too, but how does it shape up against other Chromebooks? Read on to find out in this short review.
Intel Celeron N3350, HD Graphics 500, 14", 1.5 kgNuVision Encite Book 12 Plus (N3350, QHD) Laptop Review
The NuVision looks good, but that's about it. This super-portable and super-cheap subnotebook is dragged down by subpar processor performance, spongy keyboard, a very slow SSD, and the most limited selection of ports we've seen on any laptop.
Intel Celeron N3350, HD Graphics 500, 12.5", 1 kgTrekstor Yourbook C11B (N3350, eMMC, FHD) Convertible Review
The Trekstor Yourbook C11B is an 11.6-inch convertible that has an IPS touchscreen display, a fanless design and good battery life. The device even comes with a year’s MS Office 365 Personal and a one-year premium Sofatutor.com license.
Intel Celeron N3350, HD Graphics 500, 11.6", 1.2 kgTrekstor Primebook C11: Intel Celeron N3350, 11.60", 1.2 kg
Review » Trekstor Primebook C11 (N3350, HD500) Convertible Review
Trekstor Primebook C13: Intel Celeron N3350, 13.30", 1.4 kg
Review » Trekstor Primebook C13 (N3350, HD500) Laptop Review
Asus VivoBook E12 E203NA-FD026T: Intel Celeron N3350, 11.60", 1 kg
Review » Asus VivoBook E12 E203NA (N3350, HD) Laptop Review
Lenovo Ideapad 120s-11IAP: Intel Celeron N3350, 11.60", 1.3 kg
Review » Lenovo Ideapad 120s (11-inch) Notebook Review
Lenovo Ideapad 120S-14IAP: Intel Celeron N3350, 14.00", 1.4 kg
Review » Lenovo Ideapad 120s (14-inch, HD) Laptop Review
Chuwi LapBook 14 inch 2017: Intel Celeron N3450, 14.10", 1.4 kg
Review » Chuwi LapBook Air 14.1 (N3450, FHD) Laptop Review
Chuwi Lapbook 12.3: Intel Celeron N3450, 12.30", 1.4 kg
Review » Chuwi LapBook 12.3 (Celeron, 2K IPS) Laptop Review
Acer Spin 1 SP111-31-C79E: Intel Celeron N3450, 11.60", 1.5 kg
Review » Acer Spin 1 (N3450, FHD) Convertible Review
Jumper EZbook 3: Intel Celeron N3350, 14.10", 1.2 kg
Review » Jumper EZBook 3 (N3350, FHD) Laptop Review
Medion Akoya E11201: Intel Celeron N3450, 11.60", 1.2 kg
External Review » Medion Akoya E11201
Asus Chromebook CX1 CX1500CNA-EJ0040: Intel Celeron N3350, 15.60", 1.8 kg
External Review » Asus Chromebook CX1 CX1500CNA-EJ0040
Asus Chromebook Z1400CN-EB0420: Intel Celeron N3350, 14.00", 1.2 kg
External Review » Asus Chromebook Z1400CN-EB0420
Asus Chromebook CX1100CNA-GJ0035: Intel Celeron N3350, 11.60", 1.2 kg
External Review » Asus Chromebook CX1100CNA-GJ0035
Teclast F15S: Intel Celeron N3350, 15.60", 1.9 kg
External Review » Teclast F15S
Asus Chromebook C423NA-DH02: Intel Celeron N3350, 14.00", 1.3 kg
External Review » Asus Chromebook C423NA-DH02
Asus Chromebook C233NA-GJ0014: Intel Celeron N3350, 11.60", 1 kg
External Review » Asus Chromebook C233NA-GJ0014
Asus VivoBook L203NA: Intel Celeron N3350, 11.60", 1 kg
External Review » Asus VivoBook L203NA
Chuwi HeroLook Pro+: Intel Celeron J3455, 13.30", 1.8 kg
External Review » Chuwi HeroLook Pro+
Acer Chromebook 514 CB514-1HT-C0SJ: Intel Celeron N3350, 14.00", 1.4 kg
External Review » Acer Chromebook 514 CB514-1HT-C0SJ
Acer Chromebook 514 CB514-1HT-C7AZ: Intel Celeron N3450, 14.00", 1.4 kg
External Review » Acer Chromebook 514 CB514-1HT-C7AZ
HP Chromebook 11a-nb0210ng: Intel Celeron N3350, 11.60", 1.4 kg
External Review » HP Chromebook 11a-nb0210ng
HP Chromebook 11a-nb0000ns: Intel Celeron N3350, 11.60", 1.4 kg
External Review » HP Chromebook 11a-nb0000ns
Asus Chromebook Z1400CN-BV0306: Intel Celeron N3350, 14.00", 1.2 kg
External Review » Asus Chromebook Z1400CN-BV0306
Asus VivoBook Flip 12 TP202NA-EH008TS: Intel Celeron N3350, 11.60", 1.3 kg
External Review » Asus VivoBook Flip 12 TP202NA-EH008TS
Lenovo 300e 81FY0007MH: Intel Celeron N3450, 11.60", 1.5 kg
External Review » Lenovo 300e 81FY0007MH
Trekstor PrimeTab S11B: Intel Celeron N3350, 11.60", 0.8 kg
External Review » Trekstor PrimeTab S11B
Asus VivoBook Flip 12 TP202NA-EH001T: Intel Celeron N3350, 11.60", 1.3 kg
External Review » Asus VivoBook Flip 12 TP202NA-EH001T
Acer Aspire ES1-533-C8WC: Intel Celeron N3350, 15.60", 2 kg
External Review » Acer Aspire ES1-533-C8WC
Asus Chromebook 12 C223NA-GJ006: Intel Celeron N3350, 11.60", 1 kg
External Review » Asus Chromebook 12 C223NA-GJ006
Lenovo Ideapad 120S-11IAP-81A400EBSP: Intel Celeron N3350, 11.60", 1.2 kg
External Review » Lenovo Ideapad 120S-11IAP-81A400EBSP
Lenovo Ideapad 120S-11IAP-81A400E9SP: Intel Celeron N3350, 11.60", 1.3 kg
External Review » Lenovo Ideapad 120S-11IAP-81A400E9SP
Lenovo Ideapad 320-15IAP-80XR017XSP: Intel Celeron N3350, 15.60", 2.2 kg
External Review » Lenovo Ideapad 320-15IAP-80XR017XSP
Asus VivoBook D540NA-GQ059T: Intel Celeron N3350, 15.60", 2 kg
External Review » Asus VivoBook D540NA-GQ059T
HP Chromebook x360 11 G1-2XZ59EA: Intel Celeron N3350, 11.60", 1.4 kg
External Review » HP Chromebook x360 11 G1-2XZ59EA
Prestigio Smartbook 141 C2: Intel Celeron N3350, 14.10", 1.4 kg
External Review » Prestigio Smartbook 141 C2
Lenovo Ideapad 120S-14IAP-81A500FCSP: Intel Celeron N3350, 14.00", 1.4 kg
External Review » Lenovo Ideapad 120S-14IAP-81A500FCSP
Asus VivoBook E12 E203NAH-FD013T: Intel Celeron N3350, 15.60", 1.2 kg
External Review » Asus VivoBook E12 E203NAH-FD013T
Acer Aspire 1 A114-31-C50S: Intel Celeron N3350, 14.00", 1.7 kg
External Review » Acer Aspire 1 A114-31-C50S
Asus D540NA-GQ059: Intel Celeron N3350, 15.60", 2 kg
External Review » Asus D540NA-GQ059
Lenovo Ideapad 320-15IAP-80XR019HSP: Intel Celeron N3350, 15.60", 2.2 kg
External Review » Lenovo Ideapad 320-15IAP-80XR019HSP
Xoro Note 140: Intel Celeron N3350, 14.00", 1.8 kg
External Review » Xoro Note 140
Asus Chromebook C223: Intel Celeron N3350, 11.60", 1 kg
External Review » Asus Chromebook C223
Lenovo Ideapad 120S-11IAP-81A400EASP: Intel Celeron N3350, 11.60", 1.2 kg
External Review » Lenovo Ideapad 120S-11IAP-81A400EASP
Lenovo Ideapad 120S-14IAP-81A500ABSP: Intel Celeron N3350, 14.00", 1.5 kg
External Review » Lenovo Ideapad 120S-14IAP-81A500ABSP
HP Chromebook 11 x360 G1: Intel Celeron N3350, 11.60", 1.3 kg
External Review » HP Chromebook 11 x360 G1
Lenovo Ideapad 120S-14IAP-81A500FDSP: Intel Celeron N3350, 14.00", 1.4 kg
External Review » Lenovo Ideapad 120S-14IAP-81A500FDSP
Acer Swift 1 SF113-31-C5CE: Intel Celeron N3350, 13.30", 1.3 kg
External Review » Acer Swift 1 SF113-31-C5CE
Acer Chromebook Spin 11 R751TN-C0CG: Intel Celeron N3350, 11.60", 1.4 kg
External Review » Acer Chromebook Spin 11 R751TN-C0CG
Lenovo 500e Chromebook-81ES0005UK: Intel Celeron N3450, 11.60", 1.4 kg
External Review » Lenovo 500e Chromebook-81ES0005UK
Lenovo Ideapad 120S-14IAP-81A5008BSP: Intel Celeron N3350, 14.00", 1.4 kg
External Review » Lenovo Ideapad 120S-14IAP-81A5008BSP
Acer Aspire ES1-132-C1NP: Intel Celeron N3350, 11.60", 1.3 kg
External Review » Acer Aspire ES1-132-C1NP
Asus VivoBook E12 E203NAH-FD023T: Intel Celeron N3350, 11.60", 1.2 kg
External Review » Asus VivoBook E12 E203NAH-FD023T
Acer Switch 3 SW312-31-C4P6: Intel Celeron N3350, 12.20", 0.9 kg
External Review » Acer Switch 3 SW312-31-C4P6
Acer Aspire 1 A114-31-C3MM: Intel Celeron N3350, 14.00", 1.7 kg
External Review » Acer Aspire 1 A114-31-C3MM
Lenovo YOGA 310-11IAP-80U2006HSP: Intel Celeron N3350, 11.60", 1.4 kg
External Review » Lenovo YOGA 310-11IAP-80U2006HSP
Acer Chromebook 11 CB311-8H-C5DV: Intel Celeron N3350, 11.60", 1.1 kg
External Review » Acer Chromebook 11 CB311-8H-C5DV
Dell Chromebook 5190-11us: Intel Celeron N3450, 11.60", 1.3 kg
External Review » Dell Chromebook 5190-11us
Lenovo IdeaPad 120S-14IAP-81A50093MH: Intel Celeron N3350, 14.00", 1.5 kg
External Review » Lenovo IdeaPad 120S-14IAP-81A50093MH
Trekstor Primetab T13B: Intel Celeron N3350, 13.30", 1.5 kg
External Review » Trekstor Primetab T13B
Teclast TBook F7: Intel Celeron N3450, 14.00", 1.2 kg
External Review » Teclast TBook F7
Trekstor Primebook C11: Intel Celeron N3350, 11.60", 1.2 kg
External Review » Trekstor Primebook C11
Asus VivoBook E12 X207NA-FD068T: Intel Celeron N3350, 11.60", 1 kg
External Review » Asus VivoBook E12 X207NA-FD068T
Lenovo Ideapad 320-15IAP-80XR019ESP: Intel Celeron N3350, 15.60", 2.2 kg
External Review » Lenovo Ideapad 320-15IAP-80XR019ESP
Asus VivoBook Flip 12 TP203NAH-BP073T: Intel Celeron N3350, 11.60", 1.3 kg
External Review » Asus VivoBook Flip 12 TP203NAH-BP073T
HP Chromebook 14 G5-3PD87UT: Intel Celeron N3350, 14.00", 1.5 kg
External Review » HP Chromebook 14 G5-3PD87UT
Asus Chromebook Flip C213NA-BU0033: Intel Celeron N3350, 11.60", 1.3 kg
External Review » Asus Chromebook Flip C213NA-BU0033
Asus VivoBook L402NA-GA042TS: Intel Celeron N3350, 14.00", 1.7 kg
External Review » Asus VivoBook L402NA-GA042TS
Acer Chromebook 11 CB311-8HT: Intel Celeron N3450, 11.60", 1.1 kg
External Review » Acer Chromebook 11 CB311-8HT
Acer Aspire 3 A315-31-C873 : Intel Celeron N3350, 15.60", 2.1 kg
External Review » Acer Aspire 3 A315-31-C873
Acer Switch 3 SW312-31-C8ZK: Intel Celeron N3350, 12.20", 0.9 kg
External Review » Acer Switch 3 SW312-31-C8ZK
Acer Spin 1 SP111-32N-C2GU: Intel Celeron N3350, 11.60", 1.2 kg
External Review » Acer Spin 1 SP111-32N-C2GU
Acer Spin 1 SP111-32N-C2X3: Intel Celeron N3350, 11.60", 1.3 kg
External Review » Acer Spin 1 SP111-32N-C2X3
Acer Spin 1 SP111-32N-C9Q9: Intel Celeron N3350, 11.60", 1.3 kg
External Review » Acer Spin 1 SP111-32N-C9Q9
Trekstor Primebook C13: Intel Celeron N3350, 13.30", 1.4 kg
External Review » Trekstor Primebook C13
Asus Vivobook E12 X207NA-FD053T: Intel Celeron N3350, 11.60", 1 kg
External Review » Asus Vivobook E12 X207NA-FD053T
Trekstor Primebook P14: Intel Celeron N3350, 14.10", 1.4 kg
External Review » Trekstor Primebook P14
Jumper EZBook 3S: Intel Celeron N3450, 14.10", 1.3 kg
External Review » Jumper EZBook 3S
Acer Spin 1 SP111-31-C1TK: Intel Celeron N3450, 11.60", 1.5 kg
External Review » Acer Spin 1 SP111-31-C1TK
Acer Spin 1 SP111-31-C79E: Intel Celeron N3450, 11.60", 1.5 kg
External Review » Acer Spin 1 SP111-31-C79E
Asus D541NA-GQ263: Intel Celeron N3350, 15.60", 1.5 kg
External Review » Asus D541NA-GQ263
Acer Chromebook 15 CB515-1H-C1VS: Intel Celeron N3350, 15.60", 1.8 kg
External Review » Acer Chromebook 15 CB515-1H-C1VS
Acer Chromebook 15 CB515-1HT-C1W7: Intel Celeron N3450, 15.60", 1.8 kg
External Review » Acer Chromebook 15 CB515-1HT-C1W7
Chuwi Lapbook Air: Intel Celeron N3450, 14.10", 1.7 kg
External Review » Chuwi Lapbook Air
Asus VivoBook E12 E203NA-FD020T: Intel Celeron N3350, 11.60", 1 kg
External Review » Asus VivoBook E12 E203NA-FD020T
Lenovo Ideapad 120s-11IAP: Intel Celeron N3350, 11.60", 1.3 kg
External Review » Lenovo Ideapad 120s-11IAP
Chuwi SurBook Mini: Intel Celeron N3450, 10.80", 0.8 kg
External Review » Chuwi SurBook Mini
Lenovo Ideapad 120S-14IAP: Intel Celeron N3350, 14.00", 1.4 kg
External Review » Lenovo Ideapad 120S-14IAP
Acer Chromebook Spin 11 R751T-C4XP: Intel Celeron N3350, 11.60", 1.4 kg
External Review » Acer Chromebook Spin 11 R751T-C4XP
Acer Aspire ES1-533-C3PZ: Intel Celeron N3350, 15.60", 2.4 kg
External Review » Acer Aspire ES1-533-C3PZ
Medion Akoya E3213: Intel Celeron N3350, 13.30", 1.5 kg
External Review » Medion Akoya E3213
Acer Spin 1 SP111-32N-C9FE: Intel Celeron N3350, 11.60", 1.6 kg
External Review » Acer Spin 1 SP111-32N-C9FE
Asus VivoBook Max F541NA-GQ050T: Intel Celeron N3350, 15.60", 2 kg
External Review » Asus VivoBook Max F541NA-GQ050T
Medion Akoya E3213T-30023176: Intel Celeron N3350, 13.30", 1.1 kg
External Review » Medion Akoya E3213T-30023176
Acer Aspire ES1-533-C4GG: Intel Celeron N3350, 15.60", 2.4 kg
External Review » Acer Aspire ES1-533-C4GG
Chuwi Surbook: Intel Celeron N3450, 12.30", 1 kg
External Review » Chuwi Surbook
Asus Chromebook Flip C213SA-YS02: Intel Celeron N3350, 11.60", 1.2 kg
External Review » Asus Chromebook Flip C213SA-YS02
Asus VivoBook W202NA-YS02: Intel Celeron N3350, 11.60", 1.2 kg
External Review » Asus VivoBook W202NA-YS02
Prestigio Smartbook 133S: Intel Celeron N3350, 13.30", 1.4 kg
External Review » Prestigio Smartbook 133S
Acer TravelMate Spin B1 B118-RN-C6WX: Intel Celeron N3450, 11.60", 1.5 kg
External Review » Acer TravelMate Spin B1 B118-RN-C6WX
Asus VivoBook Max X541NA-GQ028T: Intel Celeron N3350, 15.60", 2 kg
External Review » Asus VivoBook Max X541NA-GQ028T
Acer Aspire ES1-132-C9NX: Intel Celeron N3350, 11.60", 1.3 kg
External Review » Acer Aspire ES1-132-C9NX
Teclast X3 Plus: Intel Celeron N3450, 11.60", 0.9 kg
External Review » Teclast X3 Plus
Chuwi Lapbook 12.3: Intel Celeron N3450, 12.30", 1.4 kg
External Review » Chuwi Lapbook 12.3
Acer Aspire ES1-132-C8J0: Intel Celeron N3350, 11.60", 1.3 kg
External Review » Acer Aspire ES1-132-C8J0
Chuwi Hi13: Intel Celeron N3450, 13.50", 1.1 kg
External Review » Chuwi Hi13
Jumper EZbook 3: Intel Celeron N3350, 14.10", 1.2 kg
External Review » Jumper EZbook 3
Chuwi LapBook 14 inch 2017: Intel Celeron N3450, 14.10", 1.4 kg
External Review » Chuwi LapBook 14 inch 2017
Alcatel Plus 12: Intel Celeron N3350, 11.60", 0.6 kg
External Review » Alcatel Plus 12
HP ProBook x360 11 Education Edition: Intel Celeron N3350, 11.60", 1.4 kg
External Review » HP ProBook x360 11 Education Edition
Jumper EZbook X3: Intel Celeron N3350, 13.30", 1.3 kg
» Jumper EZbook X3 reviewed: Ancient chip in jelly-like chassis