Notebook reviews with NVIDIA GeForce GTX 1650 Ti Max-Q graphics card
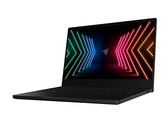
Razer Blade Stealth 13 2021 in review: Mobile gamer with OLED panel
Razer offers its compact Blade Stealth 13 with an OLED screen in addition to the familiar IPS display. This offers advantages like the extremely fast response times and the great picture, but there are also disadvantages like the PWM flickering as well as the significantly shortened battery life.
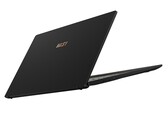
Intel Core i7-1165G7, NVIDIA GeForce GTX 1650 Ti Max-Q, 13.3", 1.5 kgMSI Summit E14 laptop review: GeForce GTX graphics without the GeForce GTX weight
The Summit E14 may look like an ordinary Ultrabook, but it manages to house a full-fledged GeForce GTX 1650 Ti Max-Q to offer significantly faster graphics performance than the best that Intel Iris Xe and AMD Vega can currently do. There are some costs to be aware of, however.
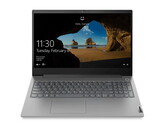
Intel Core i7-1185G7, NVIDIA GeForce GTX 1650 Ti Max-Q, 14", 1.3 kgLenovo ThinkBook 15p 4K laptop review: Multimedia allrounder with a great 4K display but weak connections
Lenovo has equipped its entry-level business series again with a Comet Lake processor, combining the CPU with a GTX 1650 Ti Max-Q, and thus turning the device into a multimedia allrounder. With this, it now offers the same specs as the ThinkPad X1 Extreme Gen3, but at a lower price. Our detailed test reveals any advantages the ThinkPad might still have or not have, compared to the ThinkBook.
Intel Core i7-10750H, NVIDIA GeForce GTX 1650 Ti Max-Q, 15.6", 2 kgAcer ConceptD 3 Ezel CC314 laptop review: Powerful convertible is slowed down by Intel Comet Lake
Acer sells laptops for creative professionals and engineers under the "ConceptD" label. In order to reach this target group, they have specialized in convertibles with powerful components - which is also the case with the Acer ConceptD 3 Ezel CC314. Unfortunately, our test left us somewhat disappointed due to the rather inefficient CPU.
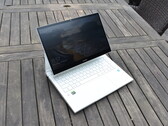
Intel Core i7-10750H, NVIDIA GeForce GTX 1650 Ti Max-Q, 14", 1.8 kg2021 HP Envy 14 Laptop Review: Tiger Lake, 16:10 and GeForce GTX 1650 Ti Max-Q All-In-One
Unveiled at CES 2021, the latest Envy 14 incorporates almost everything great about last year's 15.6-inch Envy 15 but in a more portable 14-inch form factor. It's one of HP's fastest laptops in this screen size to make it a solid option for those who want to maximize performance without settling for larger alternatives.
Intel Core i5-1135G7, NVIDIA GeForce GTX 1650 Ti Max-Q, 14", 1.6 kgMSI Summit E15 A11SCST: Intel Core i7-1185G7, 15.60", 1.8 kg
Review » MSI Summit E15 laptop review: Advance into the premium business segment
Lenovo ThinkPad X1 Extreme Gen3-20TLS0UV00: Intel Core i7-10750H, 15.60", 1.7 kg
Review » ThinkPad X1 Extreme Gen3 2020: Lenovo's Premium Multimedia Laptop with GTX 1650 Ti Max-Q in Review
Asus ZenBook UX535-M01440: Intel Core i7-10750H, 15.60", 2 kg
Review » Asus ZenBook Pro 15 UX535 laptop review: It could still be a little more Zen
Razer Blade Stealth i7-1165G7 GTX 1650 Ti Max-Q: Intel Core i7-1165G7, 13.30", 1.4 kg
Review » Razer Blade Stealth Tiger Lake GTX 1650 Ti Max-Q Laptop Review: A Small Step Forward
Razer Blade Stealth Core i7 GTX 1650 Ti Max-Q 4K: Intel Core i7-1065G7, 13.30", 1.5 kg
Review » 2020 Razer Blade Stealth GTX 1650 Ti Max-Q Laptop Review: Like the 2019 Version, But Done Right
HP Envy 14-eb0021tx: Intel Core i7-1165G7, 14.00", 1.5 kg
External Review » HP Envy 14-eb0021tx
Razer Blade Stealth 13 2021 OLED: Intel Core i7-1165G7, 13.30", 1.5 kg
External Review » Razer Blade Stealth 13 2021 OLED
MSI Summit E14 A11SCS: Intel Core i7-1185G7, 14.00", 1.3 kg
External Review » MSI Summit E14 A11SCS
MSI Prestige 14 A11SCS-036DC: Intel Core i7-1185G7, 14.00", 1.3 kg
External Review » MSI Prestige 14 A11SCS-036DC
MSI GF63 Thin 10SCSR-1051XES: Intel Core i7-10750H, 15.60", 1.9 kg
External Review » MSI GF63 Thin 10SCSR-1051XES
Asus ROG Flow X13 GV301QH-K6200T: AMD Ryzen 9 5900HS, 13.40", 1.3 kg
External Review » Asus ROG Flow X13 GV301QH-K6200T
HP Envy 14-eb0003ns: Intel Core i7-1165G7, 14.00", 1.5 kg
External Review » HP Envy 14-eb0003ns
MSI Summit E15 A11SCS-091AU: Intel Core i7-1185G7, 15.60", 1.7 kg
External Review » MSI Summit E15 A11SCS-091AU
MSI GF63 Thin 10SCSR-876XES: Intel Core i7-10750H, 15.60", 1.9 kg
External Review » MSI GF63 Thin 10SCSR-876XES
MSI Prestige 15 A11SCS-033XES: Intel Core i7-1185G7, 15.60", 1.7 kg
External Review » MSI Prestige 15 A11SCS-033XES
HP Envy 14-eb0775ng: Intel Core i7-1165G7, 14.00", 1.5 kg
External Review » HP Envy 14-eb0775ng
Razer Blade Stealth i7-1165G7 GTX 1650 Ti Max-Q: Intel Core i7-1165G7, 13.30", 1.4 kg
External Review » Razer Blade Stealth i7-1165G7 GTX 1650 Ti Max-Q
MSI Summit E15 A11SCST-067RU: Intel Core i7-1185G7, 15.60", 1.8 kg
External Review » MSI Summit E15 A11SCST-067RU
Acer ConceptD 3 Ezel CC314-72G-7513: Intel Core i7-10750H, 14.00", 1.8 kg
External Review » Acer ConceptD 3 Ezel CC314-72G-7513
MSI Summit E15 A11SCST-227ID: Intel Core i7-1185G7, 15.60"
External Review » MSI Summit E15 A11SCST-227ID
Lenovo ThinkBook 15p IMH-20V30009GE: Intel Core i7-10750H, 15.60", 1.9 kg
External Review » Lenovo ThinkBook 15p IMH-20V30009GE
MSI Summit E15 A11SCST: Intel Core i7-1185G7, 15.60", 1.8 kg
External Review » MSI Summit E15 A11SCST
HP Envy 14-eb0010nr: Intel Core i5-1135G7, 14.00", 1.6 kg
External Review » HP Envy 14-eb0010nr
Lenovo ThinkPad X1 Extreme G3, i7-10850H, 1650 Ti Max-Q: Intel Core i7-10850H, 15.60", 1.7 kg
External Review » Lenovo ThinkPad X1 Extreme G3, i7-1850H, 1650 Ti Max-Q
Lenovo ThinkPad X1 Extreme G3-20TK000NGE: Intel Core i9-10885H, 15.60", 1.7 kg
External Review » Lenovo ThinkPad X1 Extreme G3-20TK000NGE
Asus ZenBook Pro 15 UX535LI-E3089T: Intel Core i7-10750H, 15.60", 1.8 kg
External Review » Asus ZenBook Pro 15 UX535LI-E3089T
HP Spectre x360 15-eb0036ng: Intel Core i7-10750H, 15.60", 1.9 kg
External Review » HP Spectre x360 15-eb0036ng
Acer ConceptD 3 Ezel: Intel Core i7-10750H, 15.60", 2 kg
External Review » Acer ConceptD 3 Ezel
MSI GF63 10SCSR-243: Intel Core i7-10750H, 15.60", 1.9 kg
External Review » MSI GF63 10SCSR-243
Dell XPS 15 9500 i7-10750H, 1650 Ti Max-Q: Intel Core i7-10750H, 15.60", 2.1 kg
External Review » Dell XPS 15 9500 i7-10750H, 1650 Ti Max-Q
Razer Blade Stealth 2020, i7-1065G7, GTX 1650 Ti Max-Q: Intel Core i7-1065G7, 13.30", 1.4 kg
External Review » Razer Blade Stealth 2020, i7-1065G7, GTX 1650 Ti Max-Q
MSI Summit E14 A11SCS: Intel Core i7-1185G7, 14.00", 1.3 kg
» MSI Summit E14 vs. MSI Prestige 14: What's the difference?
Lenovo ThinkBook 15p Gen1 4K: Intel Core i7-10750H, 15.60", 2 kg
» The Lenovo ThinkBook 15p has a great display but bad connections for a business allrounder
Acer ConceptD 3 Ezel CC314-72G-7513: Intel Core i7-10750H, 14.00", 1.8 kg
» Acer ConceptD 3 Ezel shows wasted potential in our test
HP Envy 14-eb0010nr: Intel Core i5-1135G7, 14.00", 1.6 kg
» HP Envy 14 Core i5-1135G7 runs at faster clock rates than most Core i7-1165G7 laptops
MSI Summit E15 A11SCST: Intel Core i7-1185G7, 15.60", 1.8 kg
» MSI Summit E15 - A challenger for the Dell XPS 15 and the Lenovo ThinkPad X1 Extreme
Lenovo ThinkPad X1 Extreme Gen3-20TLS0UV00: Intel Core i7-10750H, 15.60", 1.7 kg
» Lenovo improves the performance of the ThinkPad X1 Extreme Gen3, but we would like to see a bigger update with AMD Ryzen
Asus ZenBook UX535-M01440: Intel Core i7-10750H, 15.60", 2 kg
» Asus ZenBook Pro 15 UX535: Rather with more Zen the next time
Razer Blade Stealth Core i7 GTX 1650 Ti Max-Q 4K: Intel Core i7-1065G7, 13.30", 1.5 kg
» The 2019 Razer Blade Stealth series was a huge mess. The 2020 series puts it back on track